CAPITAL SOUTHWEST CORP
10-Ks and 10-Qs
|
|
|
|
|
|
|
|
|
|
|
|
|
|
|
|
|
|
|
|
|
|
|
|
|
|
|
|
|
|
|
|
|
|
|
|
|
|
|
|
|
|
|
|
|
|
|
|
|
|
|
|
|
|
|
|
|
|
|
|
|
|
|
|
|
UNITED STATES
SECURITIES AND EXCHANGE COMMISSION
Washington, D.C. 20549
ANNUAL REPORT PURSUANT TO SECTIONS 13 OR 15(d) OF THE SECURITIES EXCHANGE ACT OF 1934
FORM 10-K
(Mark One)
| x | ANNUAL REPORT PURSUANT TO SECTION 13 OR 15(d) OF THE SECURITIES EXCHANGE ACT OF 1934 |
For the fiscal year ended
March 31, 2014
OR
| o | TRANSITION REPORT PURSUANT TO SECTION 13 OR 15(d) OF THE SECURITIES EXCHANGE ACT OF 1934 |
For the transition period from to
Commission File Number:
814-61
CAPITAL SOUTHWEST CORPORATION
(Exact name of registrant as specified in its charter)
|
Texas
|
|
75-1072796
|
|
(State or other jurisdiction of incorporation or organization)
|
|
(I.R.S. Employer Identification No.)
|
|
12900 Preston Road, Suite 700, Dallas, Texas
|
75230
|
|
|
(Address of principal executive offices)
|
(Zip Code)
|
Registrant's telephone number, including area code
: (972) 233-8242
Securities registered pursuant to section 12(b) of the Act:
None
Securities registered pursuant to section 12(g) of the Act:
Common Stock, $0.25 par value
Indicate by check mark if the registrant is a well-known seasoned issuer, as defined in Rule 405 of the Securities Act. YES
o
NO
x
Indicate by check mark if the registrant is not required to file reports pursuant to Section 13 or Section 15(d) of the Act. YES
o
NO
x
Indicate by check mark whether the registrant (1) has filed all reports required to be filed by Section 13 or 15(d) of the Securities Exchange Act of 1934 during the preceding 12 months (or for such shorter period that the registrant was required to file such reports), and (2) has been subject to such filing requirements for the past 90 days. YES
x
NO
o
Indicate by check mark whether the registrant has submitted electronically and posted on its corporate Web site, if any, every Interactive Data File required to be submitted and posted pursuant to Rule 405 of Regulation S-T (§232.405 of this chapter) during the preceding 12 months (or for such shorter period that the registrant was required to submit and post such files). YES
x
NO
o
Indicate by check mark if disclosure of delinquent filers pursuant to Item 405 of Regulation S-K is not contained herein, and will not be contained, to the best of registrant's knowledge, in definitive proxy or information statements incorporated by reference in Part III of this Form 10-K or any amendment to this Form 10-K.
x
Indicate by check mark whether the registrant is a large accelerated filer, an accelerated filer, or a non-accelerated filer. See definition of “accelerated filer and large accelerated filer” in Rule 12b-2 of the Exchange Act. (Check One):
Large accelerated filer
o
Accelerated filer
x
Non-accelerated filer
o
Smaller reporting company
Indicate by check mark whether the registrant is a shell company (as defined in Rule 12b-2 of the Act).
YES
o
NO
x
.
The aggregate market value of the voting stock held by non-affiliates of the registrant as of September 30, 2013 was $462,894,073 based on the last sale price of such stock as quoted by The Nasdaq Stock Market on such date.
The number of shares of common stock outstanding as of May 30, 2014 was 15,413,532.
Documents Incorporated by Reference
Proxy Statement for Annual Meeting of Shareholders to be held July 21, 2014 is incorporated by reference in this Annual Report on Form 10-K in response to Part III.
|
PART I
|
|
Page
|
|
Item 1.
|
1
|
|
|
Item 1A.
|
11
|
|
|
Item 1B.
|
18
|
|
|
Item 2.
|
18
|
|
|
Item 3.
|
18
|
|
|
Item 4.
|
18
|
|
|
|
|
|
|
PART II
|
|
|
|
Item 5.
|
18
|
|
|
Item 6.
|
20
|
|
|
Item 7.
|
21
|
|
|
Item 7A.
|
30
|
|
|
Item 8.
|
31
|
|
|
Item 9.
|
73
|
|
|
Item 9A.
|
73
|
|
|
Item 9B.
|
74
|
|
|
|
|
|
|
PART III
|
|
|
|
Item 10.
|
74
|
|
|
Item 11.
|
74
|
|
|
Item 12.
|
74
|
|
|
Item 13.
|
75
|
|
|
Item 14.
|
75
|
|
|
|
|
|
|
PART IV
|
|
|
|
Item 15.
|
76
|
|
|
|
|
|
|
|
78
|
CAUTIONARY STATEMENT CONCERNING FORWARD-LOOKING STATEMENTS
This Annual Report on Form 10-K contains forward-looking statements regarding the plans and objectives of management for future operations. Any such forward-looking statements may involve known and unknown risks, uncertainties and other factors which may cause our actual results, performance or achievements to be materially different from future results, performance or achievements expressed or implied by any forward looking statements. Forward-looking statements which involve assumptions and describe our future plans, strategies and expectations are generally identifiable by use of the words “may,” “will,” “should,” “expect,” “anticipate,” “estimate,” “believe,” “intend” or “project” or the negative of these words or other variations on these words or comparable terminology. These forward-looking statements are based on assumptions that may be incorrect, and we cannot assure you that the projections included in these forward-looking statements will come to pass. Our actual results could differ materially from those expressed or implied by the forward-looking statements as a result of various factors, including the factors discussed in Item 1A entitled “Risk Factors” in Part I of this Annual Report on Form 10-K and elsewhere in this Annual Report on Form 10-K. Other factors that could cause actual results to differ materially include changes in the economy, in laws or regulations as well as in conditions in our operating areas.
We have based the forward-looking statements included in this Annual Report on Form 10-K on information available to us on the date of this Annual Report on Form 10-K, and we assume no obligation to update any such forward-looking statements, unless we are required to do so by applicable law. However, you are advised to consult any additional disclosures that we may make directly to you or through reports that we in the future may file with the SEC, including subsequent annual reports on Form 10-K, quarterly reports on Form 10-Q and current reports on Form 8-K.
PART I
Overview
Capital Southwest Corporation (“CSWC”) is a publicly traded investment company whose objective is to achieve capital appreciation through long-term investments in privately held businesses. Our investment interests are focused on acquisitions and investments in a broad range of industry segments. We were organized as a Texas corporation on April 19, 1961. Until September 1969, we operated as a licensee under the Small Business Investment Act of 1958. At that time, CSWC transferred to our wholly-owned subsidiary, Capital Southwest Venture Corporation ("CSVC"), certain assets and our license as a small business investment company ("SBIC"). CSVC is a closed-end, non-diversified investment company registered under the Investment Company Act of 1940, as amended (the "1940 Act"). Prior to March 30, 1988, CSWC was registered as a closed-end, non-diversified investment company under the 1940 Act. On that date, we elected to be treated as a business development company ("BDC") subject to the provisions of the 1940 Act, as amended by the Small Business Incentive Act of 1980.
In order to remain a BDC, we must meet certain specified requirements under the 1940 Act, including investing at least 70% of our assets in eligible portfolio companies and limiting the amount of leverage we incur. We are also a regulated investment company (“RIC”) under Subchapter M of the U.S. Internal Revenue Code of 1986. As such, we are not required to pay corporate-level income tax on our investment income. We intend to maintain our RIC status, which requires that we qualify annually as a RIC by meeting certain specified requirements.
Because CSWC wholly owns CSVC, the portfolios of CSWC and CSVC are referred to collectively as "our," "we" and "us." Capital Southwest Management Company ("CSMC"), a wholly-owned subsidiary of CSWC, is the management company for CSWC and CSVC. CSMC generally incurs all normal operating and administrative expenses, including, but not limited to, salaries and related benefits, rent, equipment and other administrative costs required for its day-to-day operations.
Portfolio
Our portfolio consists of private companies in which we have controlling interests, private companies in which we have minority interests and marketable securities of publicly traded companies. We make available significant managerial assistance to certain companies in which we invest and believe that providing material assistance to such investee companies is critical to their success.
Our 7 largest holdings had a combined cost of $31,458,537 and a value of $634,615,154, representing 93.6% of the value of our consolidated investment portfolio at March 31, 2014. The following table illustrates our 7 largest investments at March 31, 2014. A full description of these investments is set forth under the heading “Consolidated Schedule of Investments” in Item 8.
|
|
CSWC
|
|||||||
|
|
Cost
|
Value
|
||||||
|
|
|
|
||||||
|
The RectorSeal Corporation
|
$
|
52,600
|
$
|
275,800,000
|
||||
|
Alamo Group Inc.
|
2,190,937
|
153,824,529
|
||||||
|
The Whitmore Manufacturing Company
|
1,600,000
|
88,500,000
|
||||||
|
Encore Wire Corporation
|
5,200,000
|
63,590,625
|
||||||
|
Media Recovery, Inc.
|
5,415,000
|
23,900,000
|
||||||
|
Trax Holdings, Inc.
|
9,000,000
|
21,000,000
|
||||||
|
Deepwater Corrosion Services, Inc.
|
8,000,000
|
8,000,000
|
||||||
|
|
$
|
31,458,537
|
$
|
634,615,154
|
||||
Investment Criteria and Objectives
Our investment team has identified the following investment criteria that we believe are important in evaluating prospective portfolio companies:
| · | Companies with Positive and Sustainable Cash Flow : We generally seek to invest in established companies with sound historical financial performance, focusing on companies that have historically generated $5-$25 million of EBITDA (earnings before interest, taxes, depreciation and amortization) annually. Acquisition candidates for our existing portfolio companies can be smaller in size. |
| · | Excellent Management : Management teams with a proven record of achievement, exceptional ability, unyielding determination and unquestionable integrity. We believe management teams with these attributes are more likely to manage the companies in a manner that protects and enhances value. |
| · | Industry: We primarily focus on companies having competitive advantages in their respective markets and/or operating in industries with barriers to entry, which may help protect their market position. Our key sectors are specialty chemicals, industrial products and technologies and energy services and products. |
| · | Investment Size : Between $10-50 million of equity or debt investments. |
| · | Location: We focus on companies located in the United States. Acquisition candidates for our existing portfolio companies may be located worldwide. |
We partner with successful operators to build businesses through:
| · | Long-term patient capital. Our public ownership structure eliminates the pressure to exit our investments in the five to seven year timeframe typical of most private equity funds. A significant portion of our active investments have been held continuously for over 20 years. |
| · | Efficient allocation and management of capital. We find that our ability to effectively allocate and manage our capital is essential to achieving our investment objectives. In addition to monitoring the performance of our existing investments, members of our investment and operations team are always available to provide managerial assistance and leverage our extensive network of sources to our portfolio companies. The expertise of our management team in analyzing, valuing, structuring, negotiating and closing transactions provides us with competitive advantages by allowing us to pursue and consummate highly accretive, strategic add-on acquisitions for our portfolio companies. |
| · | Alignment of interests with management. We find that a committed management team whose interests are aligned with ownership provides the highest likelihood of success. When management’s interests are aligned with ours, management is focused on our core objective of producing attractive risk adjusted returns for our shareholders. |
Investment Process
Our investment strategy involves a "team" approach, whereby our investment team screens potential transactions before they are presented to senior management and ultimately the Board of Directors for approval. Our investment team generally categorizes the investment process into seven distinctive stages:
| · | Deal Generation/Origination : Deal generation and origination is maximized through long-standing and extensive relationships with industry contacts, brokers, commercial and investment bankers, entrepreneurs, service providers such as lawyers and accountants, as well as current and former portfolio companies and investors. |
| · | Screening : Once it is determined that a potential investment has met our investment criteria, we will screen the investment by performing preliminary due diligence. It is during this stage that we will take into consideration potential investment structures and price terms, as well as regulatory compliance. Upon successful screening of the proposed investment, the investment team makes a recommendation to move forward. We then issue a non-binding term sheet. |
| · | Term Sheet : The non-binding term sheet will include the key economic terms based upon our analysis performed during the screening process as well as a proposed timeline and our qualitative expectation for the transaction. Upon execution of the term sheet, we begin our formal due diligence process. |
| · | Due Diligence : Due diligence is performed under the direction of our Chief Investment Officer, investment team and certain external resources, who together perform due diligence to understand the relationships among the prospective portfolio company’s business plan, operations and financial performance. Additional procedures may include (i) conducting site visits with management and key personnel; (ii) performing a detailed review of historical and projected financial statements; (iii) interviewing key customers and suppliers; (iv) evaluating company management with a background check; (v) reviewing material contracts; (vi) conducting an in-depth industry, market and strategy analysis; and (vii) obtaining a review by legal, environmental or other consultants. |
| · | Document and Close : Upon completion of a satisfactory due diligence review, our investment team presents its written findings to our Board of Directors for approval. If the Board of Directors proposes any adjustments to the investment terms or structure, we update our analysis. Upon Board approval for the investment, we re-confirm our regulatory company compliance, process and finalize all required legal documents and fund the investment. |
| · | Post-Investment : We continuously monitor the status and progress of our portfolio companies, as well as our investment thesis developed at the time of investment. We offer managerial assistance to our portfolio companies, and provide them access to our investment experience, direct industry expertise and contacts. The same investment team leader that was involved in the investment process will continue involvement in the portfolio company post-investment. This approach provides continuity of knowledge and allows the investment team to maintain a strong business relationship with key management of our portfolio companies for post-investment assistance and monitoring. As part of the monitoring process, members of our investment team will analyze monthly/quarterly/annual financial statements versus the previous periods, review financial projections, meet with management, attend board meetings and review all compliance certificates and covenants. While we maintain limited involvement in the ordinary course of operations of our portfolio companies, we maintain greater involvement in non-ordinary financings, potential acquisitions and other strategic activities. |
| · | Exit Strategies : While our approach is primarily focused on providing long-term capital for sustained growth, we assist our portfolio companies in developing and planning exit opportunities, including any sale or merger of our portfolio companies,. We assist in the structure, timing, execution and transition of the exit strategy. |
Determination of Net Asset Value and Portfolio Valuation Process
We determine our net asset value (“NAV”) per share on a quarterly basis. The net asset value per share is equal to our total assets minus liabilities divided by the total number of shares of common stock outstanding.
We determine in good faith the fair value of our portfolio investments pursuant to a valuation policy in accordance with Accounting Standards Codification ("ASC") Topic 820,
Fair Value Measurements and Disclosures
(“ASC 820”) and a valuation process approved by our Board of Directors and in accordance with the 1940 Act. Our valuation policy is intended to provide a consistent basis for determining the fair value of the portfolio.
We undertake a multi-step valuation process each quarter in connection with determining the fair value of our investments. Our Board of Directors is ultimately responsible for overseeing, reviewing and approving, in good faith, our estimate of the fair value of each individual investment. Our quarterly valuation process begins with the investment team leader responsible for the portfolio investment valuing each portfolio company or investment. Our investment team then reviews and discusses this preliminary valuation, and our Board of Directors assesses the valuations and ultimately approves the fair value of each investment in our portfolio.
Our Board of Directors is responsible for determining the fair value of portfolio investments on an annual and quarterly basis. Annually, Duff & Phelps, LLC ("Duff & Phelps") provides third party valuation consulting services to our Board of Directors in response to the limited procedures that our Board of Directors identifies and requests. For the year ended March 31, 2014, the Board of Directors asked Duff & Phelps to perform limited valuations for The RectorSeal Corporation, The Whitmore Manufacturing Company and Media Recovery, Inc. comprising approximately 57.3% of the total investments at fair value as of March 31, 2014. Upon completion of the limited valuation assessment, Duff & Phelps concluded that the fair value of those investments, subject to the limited procedures as specified by our Board, appeared reasonable.
Competition
We compete for attractive investment opportunities with private equity funds, family offices, and strategic buyers. We believe we are able to be competitive with these entities primarily on the basis of the experience and contacts of our management team and our responsive and efficient investment analysis and decision-making processes. However, many of our competitors are substantially larger and have considerably greater financial, technical and marketing resources than we do. Our competitors may have a lower cost of funds and many have access to funding sources that are not available to us. In addition, certain of our competitors may have higher risk tolerances or different risk assessments, which could allow them to consider a wider variety of investments and establish more relationships and build their market shares. In addition, many of our competitors are not subject to the regulatory restrictions that the 1940 Act imposes
on
us as a BDC.
We cannot assure you that the competitive
pressures we face will not
have a material adverse effect on our
business, financial condition and results of operations. In addition, because of this competition, we may not be able to take advantage of attractive investment opportunities and may not be able to identify and make investments that satisfy our investment objectives or meet our investment goals
.
Regulation
Regulation as a Business Development Company
We have elected to be regulated as a BDC under the 1940 Act. The 1940 Act contains prohibitions and restrictions relating to transactions between BDCs and their affiliates, principal underwriters and affiliates of those affiliates or underwriters. The 1940 Act requires that a majority of the members of the board of directors of a BDC be persons other than “interested persons,” as defined in the 1940 Act. In addition, the 1940 Act provides that we may not change the nature of our business so as to cease to be, or to withdraw our election as, a BDC unless approved by a majority of our outstanding voting securities.
The 1940 Act defines “a majority of the outstanding voting securities” as the lesser of (i) 67% or more of the voting securities present at a meeting if the holders of more than 50% of our outstanding voting securities are present or represented by proxy or (ii) more than 50% of our voting securities.
The following is a brief description of the 1940 Act provisions applicable to BDCs, which is qualified in its entirety by reference to the full text of the 1940 Act and rules issued thereunder by the SEC.
| · | Generally, to be eligible to elect BDC status, a company must primarily engage in the business of furnishing capital and making significant managerial assistance available to companies that do not have ready access to conventional financial channels. Such companies that satisfy certain additional criteria are defined as "eligible portfolio companies." In general, in order to qualify as a BDC, a company must: (i) be a domestic company; (ii) have registered a class of its securities pursuant to Section 12 of the Securities Exchange Act of 1934; (iii) operate for the purpose of investing in the securities of certain types of eligible portfolio companies, including early stage or emerging companies and businesses suffering or just recovering from financial distress (see following paragraph); (iv) make available significant managerial assistance to such portfolio companies; and (v) file a proper notice of election with the SEC. |
| · | An eligible portfolio company generally is a domestic company that is not an investment company or a company excluded from investment company status pursuant to exclusions for certain types of financial companies (such as brokerage firms, banks, insurance companies and investment banking firms) and that: (i) does not have a class of securities listed on a national securities exchange; (ii) has a class of equity securities listed on a national securities exchange with a market capitalization of less than $250 million; or (iii) is controlled by the BDC itself or together with others and has a representative on the Board of Directors of such company. The 1940 Act presumes that a person has “control” of a portfolio company where a person owns at least 25% of its outstanding voting securities. |
| · | We are required to provide and maintain a bond issued by a reputable fidelity insurance company to protect the BDC. Furthermore, as a BDC, we are prohibited from protecting any director or officer against any liability to us or our shareholders arising from willful malfeasance, bad faith, gross negligence or reckless disregard of the duties involved in the conduct of such person’s office. |
| · | We are required to adopt and implement written policies and procedures reasonably designed to prevent violation of the federal securities laws, review these policies and procedures annually for their adequacy and the effectiveness of their implementation and designate a chief compliance officer to be responsible for administering these policies and procedures. |
Qualifying Assets
The 1940 Act provides that we may not make an investment in non-qualifying assets unless at the time at least 70% of the value of our total assets (measured as of the date of our most recently filed financial statements) consists of qualifying assets. Qualifying assets include: (i) securities of eligible portfolio companies; (ii) securities of certain companies that were eligible portfolio companies at the time we initially acquired their securities and in which we retain a substantial interest; (iii) securities of certain controlled companies; (iv) securities of certain bankrupt, insolvent or distressed companies; (v) securities received in exchange for or distributed in or with respect to any of the foregoing; and (vi) cash items, U.S. government securities and high-quality short-term debt. The SEC has adopted a rule permitting a BDC to invest its funds in certain money market funds. The 1940 Act also places restrictions on the nature of the transactions in which, and the persons from whom, securities can be purchased in some instances in order for the securities to be considered qualifying assets.
Managerial Assistance to Portfolio Companies
In order to count portfolio securities as qualifying assets for the purpose of the 70% test, we must either control the issuer of the securities or must offer to make available to the issuer of the securities (other than small and solvent companies described above) significant managerial assistance. However, where we purchase such securities in conjunction with one or more other persons acting together, one of the other persons in the group may make available such managerial assistance. Making available managerial assistance means, among other things, any arrangement whereby the BDC, through its directors, officers or employees, offers to provide, and, if accepted, does so provide, significant guidance and counsel concerning the management, operations or business objectives and policies of a portfolio company.
Idle Funds Investments
For funds that may soon be invested in “qualifying assets,” we hold those assets in cash, cash equivalents, U.S. government securities, short-term investments in secured debt investments, independently rated debt investments and diversified bond funds. We refer to these investments as idle funds investments.
Senior Securities
We are permitted by the 1940 Act, under specific conditions, to issue multiple classes of debt and a single class of preferred stock if our asset coverage, as defined by the 1940 Act, is at least 200% after the issuance of the debt or the preferred stock (i.e. such senior securities may not be in excess of our net assets). Under specific conditions, we are also permitted by the 1940 Act to issue warrants.
Common Stock
As a BDC, the 1940 Act generally limits our ability to issue and sell our common stock at a price below our NAV per share, exclusive of any distributing commission or discount, without shareholder approval. Shares of our common stock have traded below our NAV per share. While our common stock continues to trade at a price below our NAV per share, there are no assurances that we can issue or sell shares of our common stock if needed to fund our business. In addition, even in certain instances where we could issue or sell shares of our common stock at a price below our NAV per share, such issuance could result in dilution in our NAV per share, which could result in a decline of our stock price.
Code of Ethics
We adopted a code of ethics pursuant to Rule 17j-1 under the 1940 Act that establishes procedures for personal investments and restricts certain personal securities transactions. Personnel subject to the code may invest in securities for their personal investment accounts including securities that may be purchased or held by us, so long as such investments are made in accordance with the code’s requirements. Certain transactions involving certain persons closely related to us, including our directors, officers and employees, may require approval of the SEC. However, the 1940 Act ordinarily does not restrict transactions between us and our portfolio companies.
Small Business Investment Company Regulations
CSVC is licensed by the Small Business Administration ("SBA") to operate as an SBIC under Section 301(c) of the Small Business Investment Act of 1958.
SBICs are designed to stimulate the flow of private equity capital to eligible small businesses. Under SBIC regulations, an SBIC may make loans to eligible small businesses, invest in equity securities of such businesses and provide them with consulting and advisory services.
Under current SBIC regulations, eligible small businesses generally include businesses that (together with their affiliates) have a tangible net worth not exceeding $18 million and have average annual net income after federal income taxes not exceeding $6 million (average net income to be computed without benefit of any carryover loss) for the two most recent fiscal years. In addition, an SBIC must devote 20% of its investment activity to "smaller" concerns as defined by the SBA. A smaller concern generally includes businesses that have a tangible net worth not exceeding $6 million and have average annual net income after federal income taxes not exceeding $2 million (average net income to be computed without benefit of any net carryover loss) for the two most recent fiscal years. SBIC regulations also provide alternative size standard criteria to determine eligibility for designation as an eligible small business or smaller concern, which criteria depend on the primary industry in which the business is engaged and are based on such factors as the number of employees and gross revenue. However, once an SBIC has invested in a company, it may continue to make follow on investments in the company, regardless of the size of the portfolio company at the time of the follow on investment, up to the time of the portfolio company’s initial public offering.
The SBA prohibits an SBIC from providing funds to small businesses for certain purposes, such as relending and investment outside the United States, to businesses engaged in a few prohibited industries, and to certain "passive" (non-operating) companies. In addition, without prior SBA approval, an SBIC may not invest an amount equal to more than approximately 30% of the SBIC’s regulatory capital in any one portfolio company and its affiliates.
The SBA places certain limitations on the financing terms of investments by SBICs in portfolio companies (such as limiting the permissible interest rate on debt securities held by an SBIC in a portfolio company). Although prior regulations prohibited an SBIC from controlling a small business concern except in limited circumstances, regulations adopted by the SBA in 2002 now allow an SBIC to exercise control over a small business for a period of seven years from the date on which the SBIC initially acquires its control position. This control period may be extended for an additional period of time with the SBA’s prior written approval.
The SBA restricts the ability of an SBIC to lend money to any of its officers, directors and employees or to invest in affiliates thereof. The SBA also prohibits, without prior SBA approval, a "change of control" of an SBIC or transfers that would result in any person (or a group of persons acting in concert) owning 10% or more of a class of capital stock of a licensed SBIC. A "change of control" is any event which would result in the transfer of the power, direct or indirect, to direct the management and policies of an SBIC, whether through ownership, contractual arrangements or otherwise.
An SBIC (or group of SBICs under common control) may generally have outstanding debentures guaranteed by the SBA in amounts up to twice the amount of the privately-raised funds of the SBIC(s). Debentures guaranteed by the SBA have a maturity of 10 years, require semi-annual payments of interest, and do not require any principal payments prior to maturity. As of March 31, 2014 and 2013, we had no SBA-guaranteed debentures.
SBICs must invest idle funds that are not being used to make loans in investments permitted under SBIC regulations in the following limited types of securities: (i) direct obligations of, or obligations guaranteed as to principal and interest by, the United States government, which mature within 15 months from the date of the investment; (ii) repurchase agreements with federally insured institutions with a maturity of seven days or less (and the securities underlying the repurchase obligations must be direct obligations of or guaranteed by the federal government); (iii) certificates of deposit with a maturity of one year or less, issued by a federally insured institution; (iv) deposit accounts in a federally insured institution that is subject to a withdrawal restriction of one year or less; (v) checking accounts in a federally insured institution; or (vi) a reasonable petty cash fund.
SBICs are periodically examined and audited by the SBA’s staff to determine their compliance with SBIC regulations and are periodically required to file forms with the SBA.
Taxation as a Regulated Investment Company
CSWC and CSVC elected to be treated as a regulated investment company (a "RIC"), taxable under Subchapter M of the Internal Revenue Code of 1986, as amended (the "Code"), for federal income tax purposes. In general, a RIC is not taxed on its income or gains to the extent it distributes such income or gains to its shareholders. In order to qualify as a RIC, we must, in general, (1) annually derive at least 90% of our gross income from dividends, interest and gains from the sale of securities and similar sources (the "Income Source Rule"); (2) quarterly meet certain investment asset diversification requirements; and (3) annually distribute at least 90% of our investment company taxable income as a dividend (the "Income Distribution Rule"). Any taxable investment company income not distributed is subject to corporate level tax. Any taxable investment company income distributed generally is taxable to shareholders as dividend income.
In addition to the requirement that we must annually distribute at least 90% of our investment company taxable income, we may either distribute or retain our realized net capital gains from investments, but any realized net capital gains not distributed may be subject to corporate level tax. During the twelve months ended March 31, 2014, we did not make any capital gain distributions. Any realized net capital gains distributed generally will be taxable to shareholders as long-term capital gains.
In lieu of actually distributing our realized net capital gains, we as a RIC may retain all or part of our net capital gains and elect to be deemed to have made a distribution of the retained portion to our shareholders under the "designated undistributed capital gain" rules of the Code. Although we pay tax at the corporate rate on the amount deemed to have been distributed, our shareholders receive a tax credit equal to their proportionate share of the tax paid and an increase in the tax basis of their shares by the amount per share retained by us.
To the extent that we retain capital gains and have a Deemed Distribution, each shareholder will receive an IRS Form 2439 that will reflect each shareholder's receipt of the income from a Deemed Distribution and a tax credit equal to each shareholder's proportionate share of the tax paid by us. This tax credit, which is paid at the corporate rate, is often credited at a higher rate than the actual tax due by a shareholder on the income from the Deemed Distribution. The credit can be used by the shareholder to offset other taxes due in that year or to generate a tax refund to the shareholder. Tax exempt investors may file for a refund.
Although we may retain income and gains subject to the limitations described above (including paying corporate level tax on such amounts), we could be subject to an additional 4% excise tax if we fail to distribute 98% of our aggregate annual taxable income.
The NASDAQ Global Select Market Corporate Governance Regulations
The NASDAQ Global Select Market (“NASDAQ”) has adopted corporate governance regulations with which listed companies must comply in order to remain listed. We believe that we are in compliance with such corporate governance listing standards. We intend to monitor our compliance with future listing standards and to take all necessary actions to ensure that we remain in compliance.
Securities Act of 1934 and Sarbanes-Oxley Act Compliance
We are subject to the reporting and disclosure requirements of the Securities Exchange Act of 1934, as amended (the “Exchange Act”), including the filing of quarterly, annual and current reports, proxy statements and other required items. In addition, we are subject to the Sarbanes-Oxley Act of 2002, which imposes a wide variety of regulatory requirements on publicly-held companies and their insiders. For example:
| · | pursuant to Rule 13a-14 of the Exchange Act, our Chief Executive Officer and Chief Financial Officer are required to certify the accuracy of the financial statements contained in our periodic reports; |
| · | pursuant to Item 307 of Regulation S-K, our periodic reports are required to disclose our conclusions about the effectiveness of our disclosure controls and procedures; |
| · | pursuant to Rule 13a-15 of the Exchange Act, our management is required to prepare a report regarding its assessment of our internal control over financial reporting, and our independent registered public accounting firm separately audits our internal control over financial reporting; and |
| · | pursuant to Item 308 of Regulation S-K and Rule 13a-15 of the Exchange Act, our periodic reports must disclose whether there were significant changes in our internal control over financial reporting or in other factors that could significantly affect these controls subsequent to the date of their evaluation, including any corrective actions with regard to significant deficiencies and material weaknesses. |
Corporate information
Our principal executive offices are located at 12900 Preston Road, Suite 700, Dallas, Texas 75230. We maintain a Website at www.capitalsouthwest.com. You can review the filings we have made with the SEC by linking directly from our website to NASDAQ, a database that links to EDGAR, the Electronic Data Gathering, Analysis, and Retrieval System of the SEC. You may also use the site to access our Annual Reports on Form 10-K, quarterly reports on Form 10-Q, current reports on Form 8-K and amendments to those reports filed or furnished pursuant to Section 13(a) or 15(d) of the Securities Exchange Act of 1934.
The public may read and copy materials that we file with the SEC at the SEC’s Public Reference Room at 100 F Street, NE, Washington, DC 20549. Information on the operation of the Public Reference Room may be obtained by calling the SEC at 1-800-SEC-0330. The SEC also maintains a website that contains the reports, proxy and information statements and other information regarding issuers that file electronically with the SEC at http://www.sec.gov.
The charters adopted by the committees of our Board of Directors are also available on our website. Information contained on our Web site is not incorporated by reference into this Annual Report on Form 10-K, and you should not consider that information to be part of this Annual Report on Form 10-K.
Employees
As of March 31, 2014, we had fourteen employees, each of whom was employed by our management company, CSMC. These employees include our corporate officers, investment and portfolio management professionals and administrative staff. All of our employees are located in our Dallas office.
Investing in our common stock involves a number of significant risks. In addition to other information contained in this Annual Report on Form 10-K, investors should consider the following information before making an investment in our common stock. The risks and uncertainties described below could adversely affect the material risks we face. Risks and uncertainties not presently known to us, or not presently deemed material by us, may also impair our operations and performance. If any of the following risks actually occur, our business, financial condition or results of operations could be materially adversely affected. If that happens, the trading price of our common stock could decline, and you may lose all or part of your investment.
RISKS RELATED TO ECONOMIC CONDITIONS
Future adverse market and economic conditions could cause harm to our operating results.
Past recessions have had a significant negative impact on the operating performance and fair value of our portfolio investments. Many of our portfolio companies could be adversely impacted again by any future economic downturn or recession and may be unable to be sold at a price that would allow us to recover our investment, or may be unable to operate during such recession. Such portfolio company performance could have a material adverse effect on our business, financial condition and results of operations.
RISKS RELATED TO OUR BUSINESS AND STRUCTURE
Our investment portfolio is and will continue to be recorded at fair value. Our Board of Directors has final responsibility for overseeing, reviewing and approving, in good faith, our estimate of fair value. As a result of recording our investments at fair value, there is and will continue to be subjectivity as to the value of our portfolio investments.
Under the 1940 Act, we are required to carry our portfolio investments at market value or, if there is no readily available market value, at fair value as determined by us, with our Board of Directors having final responsibility for overseeing, reviewing and approving, in good faith, our estimate of fair value. Typically, there is not a public market for the securities of the privately held companies in which we have invested and generally will continue to invest. As a result, we value these securities quarterly at fair value based on inputs from management and our investment team, along with the oversight, review and approval of our Board of Directors.
The determination of fair value and consequently, the amount of unrealized gains and losses in our portfolio, are to a certain degree, subjective and dependent on a valuation process approved by our Board of Directors. Certain factors that may be considered in determining the fair value of our investments include external events, such as private mergers, sales and acquisitions involving comparable companies. Because of the inherent uncertainty of the valuation of portfolio securities which do not have readily ascertainable market values, our fair value determinations may differ materially from the values a third party would be willing to pay for such securities or the values which would be applicable to unrestricted securities having a public market. Due to this uncertainty, our fair value determinations may cause our net asset value on a given date to materially understate or overstate the value that we may ultimately realize on one or more of our investments. As a result, investors purchasing our common stock based on an overstated net asset value may pay a higher price than the value of our investments might warrant. Conversely, investors selling shares during a period in which the net asset value understates the value of our investments may receive a lower price for their shares than the value of our investments might warrant.
Our financial condition and results of operations will depend on our ability to effectively allocate and manage capital.
Our ability to achieve our investment objective of maximizing our portfolio’s total return by generating appreciation from our investments depends on our ability to effectively allocate and manage capital. Capital allocation depends, in part, upon our investment team’s ability to identify, evaluate, invest in and monitor companies that meet our investment criteria.
Accomplishing our investment objectives is largely a function of our investment team’s management of the investment process and our access to investments offering attractive risk adjusted returns. In addition, members of our investment team are called upon, from time to time, to provide managerial assistance to some of our portfolio companies.
The results of our operations depend on many factors, including the availability of opportunities for investment, readily accessible short and long-term funding alternatives in the financial markets and economic conditions. Our ability to make new investments at attractive relative valuations is also a function of our marketing and management of the investment process. If we fail to invest our capital effectively, our return on equity may be negatively impacted, which could have an adverse effect on the price of the shares of our common stock.
We operate in a highly competitive market for investment opportunities
.
We compete for attractive investment opportunities with private equity funds, family offices, and strategic buyers. Some of these competitors are substantially larger and have greater financial, technical and marketing resources, and some are subject to different and frequently less stringent regulations. As a result of this competition, we may not be able to take advantage of attractive investment opportunities from time to time and there can be no assurance that we will be able to identify and make investments that satisfy our objectives. A significant increase in the number and/or size of our competitors in our target market could force us to accept less attractive investment terms. Furthermore, many of our competitors are not subject to the regulatory restrictions that the 1940 Act imposes on us as a BDC.
Our success depends on attracting and retaining qualified personnel in a competitive environment.
Sourcing, selection, structuring and closing our investments depends upon the diligence and skill of our management. Our management’s capabilities may significantly impact our results of operations. Our success requires that we retain investment and operations personnel in a competitive environment. Our ability to attract and retain personnel with the requisite credentials, experience and skills depends on several factors, including but not limited to, our ability to offer competitive wages, benefits and professional growth opportunities.
The competitive environment for qualified personnel may require us to take certain measures to ensure that we are able to attract and retain experienced personnel. Such measures may include increasing the attractiveness of our overall compensation packages, altering the structure of our compensation packages through the use of additional forms of compensation or other steps. The inability to attract and retain experienced personnel could potentially have an adverse effect on our business.
Our business model depends to a significant extent upon strong referral relationships. Our inability to maintain or develop these relationships, as well as the failure of these relationships to generate investment opportunities, could adversely affect our business.
We expect that members of our management team will maintain their relationships with intermediaries, financial institutions, investment bankers, commercial bankers, financial advisors, attorneys, accountants, consultants and other individuals within our network, and we will rely to a significant extent upon these relationships to provide us with potential investment opportunities. If our management team fails to maintain its existing relationships or develop new relationships with sources of investment opportunities, we will not be able to effectively allocate capital. In addition, individuals with whom members of our management team have relationships are not obligated to provide us with investment opportunities, and therefore, there is no assurance that such relationships will generate investment opportunities for us.
We will be subject to corporate-level income tax if we are unable to qualify as a RIC under Subchapter M of the Code
.
To maintain RIC tax treatment under the Code, we must meet the following annual distribution, income source and asset diversification requirements:
| · | The annual distribution requirement for a RIC will be satisfied if we distribute to our stockholders on an annual basis at least 90% of our net ordinary income and realized short-term capital gains in excess of realized net long-term capital losses. Depending on the level of taxable income earned in a tax year, we may choose to carry forward taxable income in excess of current year distributions into the next year and pay a 4% excise tax on such income. Any such carryover taxable income must be distributed through a dividend declared prior to filing the final tax return related to the year which generated such taxable income. |
| · | The source of income requirement will be satisfied if we obtain 90% of our income for each year from distributions, interest, gains from the sale of stock or securities or similar sources. |
| · | The asset diversification requirement will be satisfied if we meet certain asset diversification requirements at the end of each quarter of our taxable year. To satisfy this requirement, at least 50% of the value of our assets must consist of cash, cash equivalents, U.S Government securities, securities of other RICs, and other acceptable securities. In addition, no more than 25% of the value of our assets can be invested in the securities, other than U.S Government securities or securities of other RICs, of two or more issuers that are controlled, as determined under applicable Code rules, by us and that are engaged in the same or similar or related trades or businesses or of certain “qualified publicly traded partnerships.” |
Failure to meet these requirements may result in us having to dispose of certain unqualified investments quickly in order to prevent the loss of RIC status. If we fail to maintain RIC tax treatment for any reason and are subject to corporate income tax, the resulting corporate taxes could substantially reduce our net assets, the amount of income available for distribution and the amount of our distributions. In addition, to the extent we had unrealized gains, we would have to establish deferred tax liabilities for taxes, which would reduce our net asset value accordingly. In addition, our shareholders would lose the tax credit realized when we, as a RIC, decide to retain the net realized capital gain and make deemed distributions of net realized capital gains, and pay taxes on behalf of our shareholders at the end of the tax year. The loss of this pass-through tax treatment could have a material adverse effect on the total return of an investment in our common stock.
We may in the future choose to pay dividends in our own stock, in which case you may be required to pay tax in excess of the cash received.
We may distribute taxable dividends that are payable in part in our stock as well as stock in any of our other public holdings. Under an IRS revenue procedure, up to 90% of any such taxable dividend declared on or before December 31, 2013 with respect to taxable years ended on or before December 31, 2013 could be payable in our stock. Where the IRS revenue procedure is not currently applicable, the IRS has also issued private letter rulings on cash and stock dividends paid by RICs and real estate investment trusts using a 20% cash standard (and, more recently, the 10% cash standard of the above-referenced IRS revenue procedure) if certain requirements are satisfied. Taxable shareholders receiving such dividends will be required to include the full amount of the dividend as ordinary income (or as long-term capital gain to the extent such distributions is properly designated as a capital gain dividend) to the extent of our current and accumulated earnings and profits for United States federal income tax purposes. As a result, a U.S. shareholder may be required to pay tax with respect to such dividends in excess of any cash received. If a U.S. shareholder sells the stock it receives as a dividend in order to pay this tax, the sales proceeds may be less than the amount included in income with respect to the dividend, depending on the market price of our stock at the time of the sale. Furthermore, with respect to non-U.S. shareholders, we may be required to withhold U.S. tax with respect to such dividends, including in respect of all or a portion of such dividend that is payable in stock. In addition, if a significant number of our shareholders determine to sell shares of our stock in order to pay taxes owed on dividends, it may put downward pressure on the trading price of our stock.
Changes in laws or regulations governing our operations or our failure to comply with those laws or regulations may adversely affect our business
.
We and our portfolio companies are subject to regulation by laws at the local, state and federal level. These laws and regulations, as well as their interpretation, may be changed from time to time. Accordingly, any changes in these laws and regulations or failure to comply with them could have a material adverse effect on our business. Certain of these laws and regulations pertain specifically to BDCs such as us.
Terrorist attacks, act of war or natural disasters may affect any market for our common stock, impact the businesses in which we invest and harm our business, operating results and financial condition.
Terrorist attacks, acts of war or natural disasters may disrupt our operations, as well as the operations of the businesses in which we invest. Such acts have created, and continue to create, economic and political uncertainties and have contributed to global economic instability. Future terrorist activities, military or security operations, or natural disasters could further weaken the domestic or global economy. These events could create additional uncertainties, which may negatively impact the businesses in which we invest directly or indirectly and, in turn, could have a material adverse impact on our business, operating results and financial condition. Losses from terrorist attacks and natural disasters are generally uninsurable.
RISKS RELATED TO OUR INVESTMENTS
Our investments in portfolio companies involve a number of significant risks
:
| · | Portfolio companies are more likely to depend on the management talents and efforts of a small group of key employees. Therefore, the death, disability, resignation, termination, or significant under-performance of one or more of these persons could have a material adverse impact on our portfolio company and, in turn, on us. |
| · | Portfolio companies may have unpredictable operating results, could become parties to litigation, may be engaged in rapidly changing businesses with products subject to a substantial risk of obsolescence and may require substantial additional capital to support their operations, finance expansion or maintain their competitive position. |
| · | Most of our acquisition targets are private companies. Private companies may not have readily publicly available information about their businesses, operations and financial condition. Consequently, we rely on the ability of our management team and investment professionals to obtain adequate information to evaluate the potential returns from making acquisitions for both CSWC and our existing portfolio companies. If we are unable to uncover all material information about these acquisition targets, we may not make a fully informed investment decision and may lose all or part of our investment. |
In addition, in the course of providing significant managerial assistance to certain of our portfolio companies, certain of our officers and directors may serve as directors on the boards of such companies. To the extent that litigation arises out of our investments in these companies, our officers and directors may be named as defendants in such litigation, which could result in an expenditure of funds for claims in excess of our directors’ and officers’ insurance coverage (through our indemnification of such officers and directors) and the diversion of management’s time and resources.
As a Regulated Investment Company, we may have certain regulatory restrictions that could preclude us from making additional investments in our portfolio companies.
We may not have the ability to make additional investments in our portfolio companies. After our initial investment in a portfolio company, we may be called upon from time to time to provide additional funds to such company or have the opportunity to increase our investment or make follow-on investments. Any decisions not to make a follow-on investment or any inability on our part to make such an investment may have a negative impact on a portfolio company in need of such an investment, may result in a missed opportunity for us to increase our participation in a successful operation or may reduce the expected return on the investment.
Certain of our portfolio companies are leveraged.
Some of our portfolio companies have incurred some indebtedness in relation to their overall capital base. Such indebtedness often has terms that will require the balance of the loan to be refinanced when it matures. If portfolio companies cannot generate adequate cash flow to meet the principal and interest payments on their indebtedness, the value of our investments could be reduced or eliminated through foreclosure on the portfolio company’s assets or by the portfolio company’s reorganization or bankruptcy.
RISKS RELATING TO OUR COMMON STOCK
Investment in shares of our common stock should not be considered a complete investment program.
Our stock is intended for investors seeking long-term capital appreciation. Our investments in portfolio securities generally require many years to reach maturity, and such investments generally are illiquid. An investment in our shares should not be considered a complete investment program. Each prospective purchaser should take into account his or her investment objectives as well as his or her other investments when considering the purchase of our shares.
Our common stock often trades at a discount from net asset value
.
Our common stock is listed on NASDAQ. Shareholders desiring liquidity may sell their shares on NASDAQ at current market value, which has often been below net asset value. Shares of closed-end investment companies frequently trade at discounts from net asset value, which is a risk separate and distinct from the risk that a fund’s performance will cause its net asset value to decrease.
The market price of our common stock may fluctuate significantly
.
The market price and marketability of shares of our common stock may from time to time be significantly affected by numerous factors, including:
| · | market conditions; |
| · | our investment results; |
| · | trading volume of our stock; |
| · | our investment results; |
| · | departure of our key personnel; |
| · | changes in regulatory policies, accounting pronouncements or tax guidelines, particularly with respect to RICs, BDCs or SBICs; and |
| · | Other influences and events over which we have no control and that may not be directly related to us. |
We may not pay any dividends.
While we intend to pay dividends to our shareholders out of assets legally available for distribution, there can be no assurance that we will do so. Any dividends that we do pay may be payable in cash, in our stock, or in stock in any of our holdings or a combination of all three. All dividends will be paid at the discretion of our Board of Directors and will depend upon our financial condition, maintenance of our RIC status, and compliance with applicable BDC compliance.
Our net asset value is heavily concentrated on certain companies.
More than 50% of our portfolio is comprised of The RectorSeal Corporation and The Whitmore Corporation. Changes in key customers, major suppliers and product lines of these companies could adversely impact the operating results of these companies and thus could negatively impact our net asset value and stock price. In addition, more than 30% of our portfolio value derives from Alamo Group Inc. and Encore Wire Corporation. The price fluctuations of these publicly traded holdings could impact our net asset value and stock price.
We are prohibited under the 1940 Act from participating in certain transactions with certain of our affiliates without the prior approval of our independent directors and, in some cases, the SEC. Any person that owns, directly or indirectly, 5% or more of our outstanding voting securities is our affiliate for purposes of the 1940 Act, and we generally are prohibited from buying or selling any security from or to such affiliate, absent the prior approval of our independent directors. The 1940 Act also prohibits certain "joint" transactions with certain of our affiliates, which could include investments in the same portfolio company (whether at the same or different times), without prior approval of our independent directors and, in some cases, the SEC. If a person acquires more than 25% of our voting securities, we are prohibited from buying or selling any security from or to such person or certain of that person's affiliates, or entering into prohibited joint transactions with such persons, absent the prior approval of the SEC. Similar restrictions limit our ability to transact business with our officers or directors or their
affiliates. Regulations governing our operation as a BDC affect our ability to, and the way in which we, raise additional capital.
Changes in the laws or regulations governing our business, or changes in the interpretations thereof, and any failure by us to comply with these laws or regulations, could negatively affect the profitability of our operations.
Changes in the laws or regulations or the interpretations of the laws and regulations that govern BDCs, RICs or non-depository commercial lenders could significantly affect our operations and our cost of doing business. We are subject to federal, state and local laws and regulations and are subject to judicial and administrative decisions that affect our operations, including our loan originations, maximum interest rates, fees and other charges, disclosures to portfolio companies, the terms of secured transactions, collection and foreclosure procedures and other trade practices. If these laws, regulations or decisions change, or if we expand our business into jurisdictions that have adopted more stringent requirements than those in which we currently conduct business, we may have to incur significant expenses in order to comply or we might have to restrict our operations. In addition, if we do not comply with applicable laws, regulations and decisions, we may lose licenses needed for the conduct of our business and be subject to civil fines and criminal penalties, any of which could have a material adverse effect upon our business, results of operations or financial condition.
We have no unresolved comments from the staff of the SEC.
We do not own any real estate or other physical properties. We maintain our offices at 12900 Preston Road, Suite 700, Dallas, Texas 75230, where we lease approximately 7,250 square feet of office space pursuant to a lease agreement expiring in September 2014. Beginning September 2014, we will re-locate to 5400 LBJ Freeway, Suite 1300, Dallas, TX 75240. We believe that our offices are adequate to meet our current and expected future needs.
We may, from time to time, be involved in litigation arising out of our operations in the normal course of business or otherwise. Furthermore, third parties may try to seek to impose liability on us in connection with the activities of our portfolio companies. We have no current pending legal proceedings to which we are a party or to which any of our assets is subject.
Not Applicable.
PART II
| Item 5. | Market for Registrant's Common Equity, Related Stockholder Matters and Issuer Purchases of Equity Securities |
PRICE RANGE OF COMMMON STOCK AND HOLDERS
Market information
. Our common stock is traded on NASDAQ under the symbol “CSWC.” The following high and low selling prices for shares during each quarter of the last two fiscal years were taken from quotations provided to the Company by NASDAQ on a post-split basis:
|
Quarter Ended
|
High
|
Low
|
||||||
|
March 31, 2014
|
$
|
36.63
|
$
|
33.23
|
||||
|
December 31, 2013
|
35.00
|
31.11
|
||||||
|
September 30, 2013
|
37.11
|
32.97
|
||||||
|
June 30, 2013
|
35.55
|
28.37
|
||||||
|
|
||||||||
|
March 31, 2013
|
$
|
32.88
|
$
|
24.76
|
||||
|
December 31, 2012
|
29.16
|
24.28
|
||||||
|
September 30, 2012
|
29.63
|
23.91
|
||||||
|
June 30, 2012
|
28.95
|
20.62
|
||||||
DIVIDENDS
The payment dates and amounts of cash dividends per share on a post-split basis for the past five years are as follows:
|
Payment Date
|
Cash Dividend
|
|||||||
|
May 29, 2009
|
$
|
0.10
|
||||||
|
November 30, 2009
|
0.10
|
|||||||
|
May 28, 2010
|
0.10
|
|||||||
|
November 30, 2010
|
0.10
|
|||||||
|
May 31, 2011
|
0.10
|
|||||||
|
November 30, 2011
|
0.10
|
|||||||
|
May 31, 2012
|
0.10
|
|||||||
|
June 8, 2012
|
4.40
|
|||||||
|
November 30, 2012
|
0.10
|
|||||||
|
March 28, 2013
|
0.69
|
|||||||
|
May 31, 2013
|
0.10
|
|||||||
|
November 29, 2013
|
0.10
|
|||||||
The amounts and timing of cash dividend payments have generally been dictated by requirements of the Internal Revenue Code (“IRC”) regarding the distribution of taxable net investment income (ordinary income) of regulated investment companies. Instead of distributing realized long-term capital gains to shareholders, the Company has ordinarily elected to retain such gains to fund future investments.
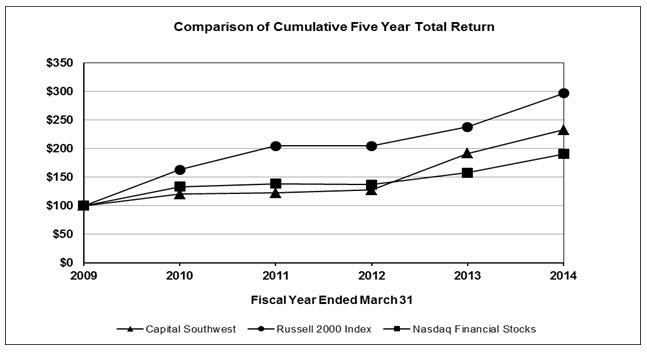
Performance Graph
The following graph compares our cumulative total shareholder return during the last five years (based on the market price of our common stock and assuming reinvestment of all dividends and tax credits on retained long-term capital gains) with the Total Return Index for NASDAQ (U.S. companies) and with the Total Return Index for Nasdaq Financial Stocks. Both indices were provided by NASDAQ.
The following table provides selected financial data relating to our historical financial condition and results of operations as of and for each of the years ended March 31, 2010 through 2014. This data should be read in conjunction with Item 7, “Management’s Discussion and Analysis of Financial Condition and Results of Operations” and the consolidated financial statements and related notes.
Selected Consolidated Financial Data
(In thousands except per share data)
|
Financial Position
(as of March 31)
|
2014
|
2013
|
2012
|
2011
|
2010
|
|||||||||||||||
|
Investments at cost
|
$
|
98,967
|
$
|
88,266
|
$
|
88,993
|
$
|
98,355
|
$
|
100,023
|
||||||||||
|
Unrealized appreciation
|
578,953
|
485,921
|
469,553
|
390,918
|
377,920
|
|||||||||||||||
|
Investments at market or fair value
|
677,920
|
574,187
|
558,546
|
489,273
|
477,943
|
|||||||||||||||
|
Total assets
|
778,694
|
667,672
|
632,989
|
543,214
|
491,175
|
|||||||||||||||
|
Net assets
|
770,388
|
659,777
|
628,706
|
539,233
|
486,926
|
|||||||||||||||
|
Shares outstanding
|
15,414
|
15,236
|
15,020
|
15,012
|
14,964
|
|||||||||||||||
|
|
||||||||||||||||||||
|
Changes in Net Assets
(years ended March 31)
|
||||||||||||||||||||
|
Net investment income
|
$
|
4,894
|
$
|
1,907
|
$
|
2,544
|
$
|
1,804
|
$
|
2,091
|
||||||||||
|
Net realized gain on investments
|
14,084
|
89,558
|
11,827
|
63,463
|
1,640
|
|||||||||||||||
|
Net increase in unrealized appreciation before distributions*
|
93,032
|
16,367
|
78,635
|
12,999
|
70,624
|
|||||||||||||||
|
Increase in net assets from operations before distributions
|
112,010
|
107,832
|
93,006
|
78,266
|
74,355
|
|||||||||||||||
|
Cash dividends paid
|
(3,050
|
)
|
(80,326
|
)
|
(3,003
|
)
|
(2,994
|
)
|
(2,993
|
)
|
||||||||||
|
Taxes incurred on deemed capital gain distributions
|
(3,787
|
)
|
(1,125
|
)
|
(1,249
|
)
|
(24,578
|
)
|
(814
|
)
|
||||||||||
|
Employee stock options exercised
|
4,820
|
3,981
|
99
|
745
|
–
|
|||||||||||||||
|
Stock option expense (benefit)
|
(632
|
)
|
515
|
1,050
|
957
|
675
|
||||||||||||||
|
Change in pension plan funded status
|
1,250
|
193
|
(430
|
)
|
(88
|
)
|
440
|
|||||||||||||
|
Treasury stock
|
–
|
–
|
–
|
–
|
–
|
|||||||||||||||
|
Increase in net assets
|
$
|
110,611
|
$
|
31,070
|
$
|
89,473
|
$
|
52,308
|
$
|
71,663
|
||||||||||
|
Per share data
(as of March 31)
|
||||||||||||||||||||
|
Net assets
|
$
|
49.98
|
$
|
43.30
|
$
|
41.86
|
$
|
35.92
|
$
|
32.54
|
||||||||||
|
Closing market price
|
34.72
|
28.75
|
23.64
|
22.88
|
22.72
|
|||||||||||||||
|
Cash dividends paid
|
.20
|
5.29
|
.20
|
.20
|
.20
|
|||||||||||||||
*See
Note 3
Investments.
The following discussion should be read in conjunction with our financial statements and the notes thereto included elsewhere in this Annual Report on Form 10-K.
Statements we make in the following discussion which express a belief, expectation or intention, as well as those that are not historical fact, are forward-looking statements that are subject to risks, uncertainties and assumptions. Our actual results, performance or achievements, or industry results, could differ materially from those we express in the following discussion as a result of a variety of factors, including the risks and uncertainties we have referred to under the headings “Cautionary Statement Concerning Forward-Looking Statements” and “Risk Factors” in Part I of this report.
General
On June 17, 2013, Joseph B. Armes joined our Company as President and Chief Executive Officer as well as a director of the Corporation. Mr. Armes has served as president and chief executive officer of JBA Investment Partners, a family investment vehicle, since 2010. From 2005 to 2010, Mr. Armes served as chief operating officer of Hicks Holdings LLC. Mr. Armes earned a BBA in Finance and a MBA from Baylor University, and a JD from Southern Methodist University.
On July 15, 2013, our shareholders approved a four-for-one split. The stock split was payable on August 15, 2013 to shareholders of record at the close of business July 31, 2013. Our common stock began trading at the split-adjusted price on August 16, 2013. All share numbers and per share amounts presented herein reflect the stock split.
On November 20, 2013, Kelly Tacke was appointed as the Company’s Senior Vice President, Chief Financial Officer, Chief Compliance Officer, Secretary and Treasurer, effective November 18, 2013. Ms. Tacke was with Palm Harbor Homes, Inc., a publicly traded manufacturer and marketer of factory-built homes for 18 years, where she served as Executive Vice President, Chief Financial Officer and Corporate Secretary. The Company was a long-time investor in Palm Harbor Homes. Ms. Tacke began her career with PricewaterhouseCoopers, where she was a Senior Audit Manager. She holds a Bachelors of Business Administration degree from the University of Texas at Austin and is a Certified Public Accountant. Ms. Tacke replaced Tracy Morris, who resigned as the Company's Chief Financial Officer, Chief Operating Officer and Secretary, effective November 15, 2013, to pursue other opportunities.
On January 20, 2014, the Board of Directors of the Company elected Joseph B. Armes as Chairman of the Board and appointed David R. Brooks and William R. Thomas, III to the Board. The Board increased its size from six to seven members and appointed Messrs. Brooks and Thomas to fill the vacancies created by the resignation of Richard F. Strup in November 2013 and the increase in the size of the Board.
Mr. Brooks has been the Chairman of the Board and Chief Executive Officer of Independent Bank Group, Inc., a publicly-traded bank holding company with approximately $3.0 billion in assets, since its founding in 2002. Mr. Thomas is a private investor and has served as the President of the Thomas Heritage Foundation, a non-profit grant-making corporation, since 2008. Mr. Thomas worked for the Company from July 2006 to September 2012, most recently as a Vice President. In addition, Mr. Thomas along with Thomas Heritage Partners, Ltd., is one of the largest shareholders of our Company, representing 4.79% voting power at March 31, 2014. Mr. Thomas currently serves as a director of Encore Wire Corporation.
On March 17, 2014, Bowen S. Diehl joined our Company as Senior Vice President and Chief Investment Officer. Mr. Diehl brings almost 20 years of experience in sourcing, structuring, and managing investments in a variety of industries. Prior to Capital Southwest, Mr. Diehl was a Managing Director at American Capital, Ltd. During his tenure at American Capital, he has closed investments in 15 platform companies and numerous add-on acquisitions, representing over $1.1 billion of invested capital. Mr. Diehl's investments have been in a variety of industries including industrial manufacturing, healthcare, business services, and consumer finance. Prior to American Capital, Mr. Diehl was a Vice President in Investment Banking at Merrill Lynch where he gained experience working with companies in the exploration and production, oilfield services, natural gas pipeline, natural gas gathering and processing, homebuilding and semiconductor sectors. Prior to joining Merrill Lynch, Mr. Diehl was a Vice President in the Global Oil and Gas Group at Chase Securities Inc., in New York, NY and then in Houston, TX, completing numerous transactions in the upstream and midstream oil and gas sectors.
Controlled Affiliates
Three of our controlled affiliates represent 57.3% of our total investment value and consist mainly of The RectorSeal Corporation, along with its subsidiaries Jet-Lube, Inc. and Smoke Guard, Inc., The Whitmore Manufacturing Company, and Media Recovery, Inc.
The RectorSeal Corporation
The RectorSeal Corporation (“RectorSeal”) currently consists of RectorSeal, separately; its wholly-owned subsidiaries Jet-Lube, Inc., and Smoke Guard, Inc.; and its 20% equity interest in The Whitmore Manufacturing Company. RectorSeal manufactures specialty chemical products and control devices for plumbing, HVAC, electrical and industrial applications. Jet-Lube, Inc. manufactures specialty lubricants and other products used in oil field and industrial applications. Smoke Guard, Inc. produces systems for containing smoke from building fires. During the fiscal year ended March 31, 2014, RectorSeal completed the acquisition of Resource Conservation, Inc., a company that manufactures condensate cutoff switches and overflow pans, to expand its development of HVAC products and market penetration. At March, 31, 2014, RectorSeal was valued at $275,800,000, which includes RectorSeal, Jet-Lube Inc., Smoke Guard, Inc. and RectorSeal’s 20% interest in Whitmore Manufacturing Company. Below are certain key financial data for RectorSeal (including Smoke Guard, Inc. and excluding Jet Lube, Inc.) as well as our valuation at March 31, 2014, 2013 and 2012. Our valuation is based primarily on adjusted EBITDA, which may reflect certain adjustments to the reported EBITDA for non-recurring, unusual or infrequent items or other items to normalize current earnings.
|
|
For the Fiscal Year Ended March 31,(in thousands)
|
|||||||||||
|
|
2014
|
2013
|
2012
|
|||||||||
|
Cash & Temporary
Investments
|
$
|
3,660
|
$
|
4,586
|
$
|
2,843
|
||||||
|
Total Assets
|
133,229
|
107,475
|
98,501
|
|||||||||
|
Capital Expenditures
|
2,196
|
1,219
|
809
|
|||||||||
|
Total Debt
|
20,600
|
7,500
|
6,100
|
|||||||||
|
Revenues
|
109,311
|
90,339
|
91,685
|
|||||||||
|
Net Income
|
12,101
|
8,777
|
7,255
|
|||||||||
|
EBITDA
|
24,579
|
19,183
|
14,581
|
|||||||||
|
CSWC Valuation
|
$
|
171,500
|
$
|
150,100
|
$
|
89,900
|
||||||
Jet-Lube, Inc.
Jet-Lube, Inc. is RectorSeal’s largest subsidiary. During the fiscal year ended March 31, 2014, Jet-Lube Inc. completed the acquisition of Design Water Technologies, a chemical company that solves water well contamination problems, to expand its water well division product line. Below are certain key financial data for Jet-Lube, Inc. as well as our valuation at March 31, 2014, 2013 and 2012. Our valuation is based primarily on adjusted EBITDA, which may reflect certain adjustments to the reported EBITDA for non-recurring, unusual or infrequent items or other items to normalize current earnings.
|
|
For the Fiscal Year Ended March 31, (in thousands)
|
|||||||||||
|
|
2014
|
2013
|
2012
|
|||||||||
|
Cash & Temporary Investments
|
$
|
20,949
|
$
|
21,177
|
$
|
20,351
|
||||||
|
Total Assets
|
53,682
|
50,395
|
47,495
|
|||||||||
|
Capital Expenditures
|
2,162
|
1,451
|
938
|
|||||||||
|
Total Debt
|
−
|
−
|
−
|
|||||||||
|
Revenues
|
51,060
|
48,048
|
45,867
|
|||||||||
|
Net Income
|
6,344
|
5,146
|
4,742
|
|||||||||
|
EBITDA
|
9,592
|
7,438
|
7,050
|
|||||||||
|
CSWC Valuation
|
$
|
82,200
|
$
|
68,700
|
$
|
59,600
|
||||||
The Whitmore Manufacturing Company
The Whitmore Manufacturing Company (“Whitmore”) manufactures high performance, specialty lubricants for heavy equipment used in surface mining, railroads and other industries, lubrication equipment specifically for rail applications and lubrication-centric reliability solutions for a wide variety of industries. Whitmore also produces water-based coatings for the automotive and primary metals industries. During the fiscal year ended March 31, 2014, Whitmore completed the acquisition of Fluid Defense, a manufacturer of lubricant storage, filtration and handling products, to expand its presence in the reliability market. Below are certain key financial data for Whitmore as well as our valuation at March 31, 2014, 2013 and 2012. Our valuation is based primarily on adjusted EBITDA, which may reflect certain adjustments to the reported EBITDA for non-recurring, unusual or infrequent items or other items to normalize current earnings. In addition, our valuation for Whitmore also includes the fair market value of non-operating real estate assets held for investment purposes.
|
|
For the Fiscal Year Ended March 31, (in thousands)
|
|||||||||||
|
|
2014
|
2013
|
2012
|
|||||||||
|
Cash & Temporary Investments
|
$
|
2,661
|
$
|
7,102
|
$
|
2,498
|
||||||
|
Total Assets
|
84,163
|
69,665
|
42,928
|
|||||||||
|
Capital Expenditures
|
10,334
|
12,681
|
2,561
|
|||||||||
|
Total Debt
|
24,497
|
15,848
|
−
|
|||||||||
|
Revenues
|
57,784
|
48,481
|
43,620
|
|||||||||
|
Net Income
|
6,132
|
7,273
|
6,281
|
|||||||||
|
EBITDA
|
13,000
|
11,814
|
10,181
|
|||||||||
|
Total CSWC Valuation
|
110,600
|
100,600
|
84,000
|
|||||||||
|
RectorSeal’s 20% Interest
|
22,100
|
20,100
|
16,800
|
|||||||||
|
CSWC’s 80% Interest
|
$
|
88,500
|
$
|
80,500
|
$
|
67,200
|
||||||
Media Recovery, Inc.
Media Recovery, Inc. (MRI) is the holding company of DataSpan, ShockWatch and Damage Prevention Company (“DPC”). DataSpan provides datacenter supplies and services to corporate customers through a direct sales force. ShockWatch manufactures and distributes devices used to prevent damage and manage inventory in transit. DPC manufactures dunnage products used to secure loads during long-haul transport. The assets of DPC were sold in November 2013. In addition, MRI also acquired Shocklog, a company that manufactures impact and environmental recording devices on December 31, 2013. Below are certain key financial data for MRI for the fiscal years ended September 30, 2013, 2012 and 2011 and our valuation at March 31, 2014, 2013 and 2012. Our valuation is based primarily on adjusted EBITDA, which may reflect certain adjustments to the reported EBITDA of for non-recurring, unusual or infrequent items or other items to normalize current earnings.
|
|
For the Fiscal Year Ended September 30, (in thousands)
|
|||||||||||
|
|
2013
|
2012
|
2011
|
|||||||||
|
Cash
|
$
|
5
|
$
|
185
|
$
|
361
|
||||||
|
Total Assets
|
43,284
|
46,624
|
44,584
|
|||||||||
|
Capital Expenditures
|
538
|
726
|
593
|
|||||||||
|
Total Debt
|
−
|
2,556
|
−
|
|||||||||
|
Revenues
|
92,926
|
104,632
|
111,254
|
|||||||||
|
Net Income
|
1,405
|
842
|
614
|
|||||||||
|
EBITDA
|
3,248
|
3,062
|
5,253
|
|||||||||
|
CSWC Valuation*
|
$
|
23,900
|
$
|
11,900
|
$
|
18,700
|
||||||
*Reflects our valuation at March 31, 2014, 2013 and 2012.
Results of Operations
The composite measure of our financial performance in the Consolidated Statements of Operations is captioned “Increase in net assets from operations” and consists of three elements. The first is “Net investment income,” which is the difference between income from interest, dividends and fees and our combined operating and interest expenses, net of applicable income taxes. The second element is “Net realized gain on investments,” which is the difference between the proceeds received from the disposition of portfolio securities and their stated cost, net of applicable income tax expense based on our tax year. The third element is the “Net increase in unrealized appreciation of investments,” which is the net change in the market or fair value of our investment portfolio, compared with stated cost. It should be noted that the “Net realized gain on investments” and “Net increase in unrealized appreciation of investments” are directly related in that when an appreciated portfolio security is sold to realize a gain, a corresponding decrease in net unrealized appreciation occurs by transferring the gain associated with the transaction from being “unrealized” to being “realized.” Conversely, when a loss is realized on a depreciated portfolio security, an increase in net unrealized appreciation occurs.
Net Investment Income
For the year ended March 31, 2014, total investment income was $12,606,546, a $1,771,285, or 16.3%, increase over total investment income of $10,835,261 for the year ended March 31, 2013.
This increase was primarily attributable to a $3,312,075, or 40.9%, increase in dividend income from The Rectorseal Corporation, Whitmore Manufacturing Company and Wellogix, Inc. and offset by a $1,496,562 or 74.6%, decrease in interest income (due to a reserve against Cinatra Clean Technologies Inc.’s interest income).
For the year ended March 31, 2013, total investment income was $10,835,261, a $1,501,025, or 16.08%, increase over total investment income of $9,334,236 for the year ended March 31, 2012. This increase was primarily attributable to a $1,372,250, or 20.4%, increase in dividend income and a $79,047, or 4.1%, increase in interest income.
Our principal objective is to achieve capital appreciation. Therefore, a significant portion of the investment portfolio is structured to maximize the potential return from equity participation and, therefore, provides minimal current yield in the form of interest or dividends. We also earn interest income from the short-term investment of cash funds, and the annual amount of such income varies based upon the average level of funds invested during the year and fluctuations in short-term interest rates. During the three years ended March 31, 2014, we had interest income from temporary cash investments of $66,949 in 2014, $71,136 in 2013 and $52,477 in 2012.
We also receive management fees primarily from our controlled affiliated investments which aggregated $559,800 in 2014, $591,300 in 2013 and $564,050 in 2012. As compared to the fiscal year ended March 31, 2013, management fees for the year ended March 31, 2014 decreased by $31,500 or 5.3% as Trax Holdings, Inc. management fees ceased pursuant to the terms of its Series B financing. As compared to the fiscal year ended March 31, 2012, management fees for the year ended March 31, 2013 increased by $27,250, or 4.8%, primarily due to management fees received from TitanLiner, Inc.
During the three years ended March 31 2014, the Company recorded dividend income from the following sources:
|
|
Year Ended March 31,
|
|||||||||||
|
|
2014
|
2013
|
2012
|
|||||||||
|
Alamo Group, Inc.
|
$
|
793,192
|
$
|
708,075
|
$
|
679,632
|
||||||
|
Capital South Partners Fund III
|
–
|
198,647
|
79,459
|
|||||||||
|
CapStar Holdings Corporation
|
350,000
|
–
|
–
|
|||||||||
|
Capitala Finance Corporation
|
101,619
|
–
|
–
|
|||||||||
|
Encore Wire Corporation
|
131,250
|
160,485
|
326,940
|
|||||||||
|
The RectorSeal Corporation
|
6,920,000
|
5,555,372
|
4,442,512
|
|||||||||
|
TCI Holdings, Inc.
|
78,110
|
81,270
|
81,270
|
|||||||||
|
Wellogix. Inc.
|
1,650,596
|
–
|
–
|
|||||||||
|
The Whitmore Manufacturing Company
|
1,380,000
|
1,388,842
|
1,110,628
|
|||||||||
|
|
$
|
11,404,767
|
$
|
8,092,691
|
$
|
6,720,441
|
||||||
Due to the nature of our business, the majority of our operating expenses are related to employees’ and directors’ compensation, office expenses, legal, professional and accounting fees and pension expense. Total operating expenses increased by $113,206, or 1.36% during the year ended March 31, 2014 as compared to the year ended March 31, 2013. The increase in 2014 is due to an increase of approximately $1 million in compensation expense associated with certain staffing changes incurred during the year as well as a slight increase in employee compensation and an increase of approximately $200,000 in pension expense. This increase was offset by a decrease in stock option expense of $1.1 million caused by stock option forfeitures during the year. Total operating expenses increased by $1,666,280 or 24.97%, during the year ended March 31, 2013 as compared to the year ended March 31, 2012. The increase in 2013 is due primarily to compensation, accrued phantom stock liabilities, increase in advertising and promotion fees, other professional fees, rent increase and insurance expenses.
Net Realized Gain on Investments
During the fiscal year ended March 31, 2014, we had realized gains of $12,604,987 from the sale of Hologic, Inc.’s common stock, $677,250 from the redemption of TCI Holdings Inc.’s preferred stock, and $746,850 from the sale of PalletOne. Our total realized gain on investments for fiscal year 2014 was $14,084,087 as compared to a gain of $12,257,100(net of capital gain distribution) during fiscal 2013 and a gain of $11,826,876 during fiscal 2012.
During the fiscal year ended March 31, 2013, we sold 2,774,250 shares of common stock in Encore Wire Corporation, which generated a capital gain of $66,037,485. We also sold 50,000 shares of common stock of Hologic, Inc., which resulted in a capital gain of $850,548. In addition, we sold our ownership in Extreme International, Inc. for cash proceeds of $10,926,000 and a realized gain of $7,600,125. We also sold our ownership in Heelys, Inc., which generated cash proceeds of $20,963,948 and a capital gain of $20,861,458. These gains were offset by a $4,926,289 realized loss from the sale of VIA Holdings, Inc., a $760,742 realized loss related to liquidation of Sterling Group Partners, L.P., and a $150,594 realized loss related to liquidation of StarTech Seed Fund I, L.P.
During the fiscal year ended March 31, 2012, we sold Phi Health, Inc. on June 29, 2011 for $38,959, resulting in a realized loss of $5,910,655. On September 9, 2011, All Components was sold for $18,000,000, resulting in a realized gain of $17,850,000. We also sold all of our shares of common stock of Texas Capital Bancshares, Inc. in November 2011, resulting in a realized gain of $9,866,335. On December 5, 2011, Palm Harbor Homes Inc. filed Chapter 11 bankruptcy in state of Delaware; therefore, we subsequently wrote off our investment in this portfolio company of $10,931,955.
Management does not attempt to maintain a consistent level of realized gains from year to year, but instead focuses on maximizing total investment portfolio appreciation. This strategy often results in the long-term holding of portfolio securities in pursuit of increased values and increased unrealized appreciation, but may at opportune times, result in realizing gains or losses through the disposition of certain portfolio investments.
Net Increase/(Decrease) in Unrealized Appreciation of Investments
For the fiscal year ended March 31, 2014, we had an increase in unrealized appreciation of investments of $93,032,228. Our increase in unrealized appreciation of investments in fiscal year 2013 was $16,367,413.
As explained in the first paragraph of “Results of Operations”, the realization of gains or losses results in a corresponding decrease or increase in unrealized appreciation of investments. Set forth in the following table are the significant increases and decreases in unrealized appreciation.
|
|
Years Ended March 31
|
|||||||||||
|
|
2014
|
2013
|
2012
|
|||||||||
|
Alamo Group, Inc.
|
$
|
45,546,429
|
$
|
23,139,162
|
$
|
22,872,338
|
||||||
|
Encore Wire Corporation
|
17,640,000
|
(74,907,585
|
)*
|
39,723,210
|
||||||||
|
Hologic, Inc.
|
(12,963,375
|
)*
|
(453,896
|
)
|
(405,005
|
)
|
||||||
|
Media Recovery
|
12,000,000
|
(6,800,000
|
)
|
600,000
|
||||||||
|
The Whitmore Manufacturing Company
|
8,000,000
|
13,300,000
|
11,600,000
|
|||||||||
|
The RectorSeal Corporation
|
36,900,000
|
72,600,000
|
21,600,000
|
|||||||||
*These investments were sold during each respective year.
A description of the investments listed above and other material components of the investment portfolio are included elsewhere in this report under the caption “Consolidated Schedule of Investments – March 31, 2014 and 2013” in Item 8 “Financial Statements and Supplemental Data.”
During the fiscal year ended March 31, 2014, we recognized a $93,032,228 increase in net change in unrealized appreciation of investments. The increases in unrealized appreciation are attributable to Alamo Group, Inc. and Encore Wire Corporation, which increased by $45,546,429 and $17,640,000, respectively, due to increases in their stock price, while The Rectorseal Corporation increased by $36,900,000; The Whitmore Manufacturing Company increased by $8,000,000; and Media Recovery, Inc. increased by $12,000,000 due to increases in each entity’s respective earnings, several add-on acquisitions and increases in valuation multiples based on market changes. Offsetting these increases were Cinatra Clean Technologies, Inc., TitanLiner Inc., and iMemories, Inc., which decreased by $4,060,293, $4,430,999, and $4,084,477, respectively, due to each entity’s under performance in their respective markets. In addition, CapitalSouth Partners Fund III, L.P. decreased by $2,833,201; during the fiscal year ended March 31, 2014 due to a distribution of 108,105 shares of Capitala Finance Corporation (CPTA) valued at $2,083,183 at March 31, 2014, which represented 71% of our interest in Capital South Partners Fund III, L.P.
During the fiscal year ended March 31, 2013, we recognized significant increases and decreases in several of our large investments. The largest increases in unrealized appreciation were attributable to The Rectorseal Corporation, which increased by $72,600,000 due to multiple acquisitions during the year and improved earnings; Alamo Group, Inc., a publicly traded company, which increased $23,139,162 due to an increase in the stock price; Whitmore Manufacturing Company, which increased by $13,300,000 due to an acquisition in May 2012, facility expansion in Rockwall and increased value in its real estate investment; Trax Holdings, which increased by $8,800,000 due to its recent series B equity financing. Offsetting these decreases were Encore Wire Corporation, which decreased $74,907,585 primarily due to our recent sale of CSVC’s interest in Encore Wire Corporation; Heelys, Inc. decreased $20,395,592 due to the sale of all shares of its common stock; Media Recovery, Inc. decreased $6,800,000; and Cinatra Clean Technologies, Inc. decreased $5,590,390 due to decreases in the entities’ respective earnings during FY 2013. Excluding the sales of all shares of common stock of Heelys, Inc. and partial sale of 2,774,250 shares of Encore Wire Corporation, net unrealized appreciation of investments for the year ended March 31, 2013 increased by $118,613,715.
The largest increases in unrealized appreciation for the fiscal year ended March 31, 2012 are attributable to Encore Wire Corporation, which increased $39,723,210 and Alamo Group, which increased $22,872,338. In March 2012, Form S-3 registration statements of Alamo Group, Inc. (NYSE: ALG), Encore Wire Corporation (NASDAQ: WIRE), and Heelys Inc. (NASDAQ: HLYS) were filed with the Securities and Exchange Commission (“SEC”). As a result of these registrations, restrictions of the common stock of these companies imposed by Rule 144 of the Securities Exchange Act of 1933 were lifted, and discounts on these common stocks were subsequently removed. As a result, Encore Wire Corporation, Alamo Group Inc. and Heelys Inc. common stock were transferred from Level 3 to Level 1 under the fair value hierarchy of ASC 820. On March 13, 2012, Encore’s registration statement became effective. As a result, Encore’s fair value is equivalent to the company’s closing bid price of $29.72 per share on March 31, 2012. Alamo’s registration statement became effective March 28, 2012. As a result, Alamo’s fair value is equivalent to the company’s closing bid price of $30.06 per share on March 31, 2012. In addition, unrealized appreciation in RectorSeal Corporation and Whitmore Manufacturing Company increased $21,600,000 and $11,600,000, respectively, due to improved earnings; Heelys, Inc. increased $1,304,723 due to recent Form S-3 registration statement filed with the SEC. On April 17, 2012, Heelys’ registration statement became effective. As a result, Heelys’ fair value is equivalent to the company’s closing bid price of $2.20 per share.
Portfolio Investments
During fiscal years ended March 31, 2014, March 31, 2013 and March 31, 2012, we invested a total of $12,607,024, $9,780,849 and $13,377,408, respectively.
Financial Liquidity and Capital Resources
At March 31, 2014, we had cash and cash equivalents of approximately $88.2 million.
With the exception of two capital gain distributions made in the form of cash dividend during fiscal year ended March 31, 2013 and a capital gain distribution made in the form of a distribution of the stock of a portfolio company in the fiscal year ended March 31, 1996, we have historically elected to retain all gains realized during our more than 50 years of operation. Retention of future gains is viewed as an important source of funds to sustain our investment activity. At March 31, 2014, approximately $220 million of our investment portfolio is represented by unrestricted publicly traded securities and represents a source of liquidity.
Funds for operating or investment purposes may be transferred in the form of dividends or management fees from The Rectorseal Corporation and The Whitmore Manufacturing Company, controlled affiliates of the Company, to the extent of their available cash reserves and borrowing capacities.
Management believes that our cash and cash equivalents and funds available from other sources described above are adequate to meet our expected cash requirements. The disposition of investments from time to time may also be a source of funds for future investment activities
.
Contractual Obligations
As shown below, we had the following contractual obligations as of March 31, 2014. For information on our capital commitments, see Note 9 of the Notes to Consolidated Financial Statements.
|
|
Payments Due By Period
(In thousands)
|
|||||||||||||||
|
Contractual Obligations
|
Total
|
1 Year
|
2-3 Years
|
More Than 3 Years
|
||||||||||||
|
Operating lease obligations
|
$
|
1,792
|
$
|
85
|
$
|
449
|
$
|
1,258
|
||||||||
Critical Accounting Policies
Valuation of Investments
In accordance with the Investment Company Act of 1940, investments in unrestricted securities (freely marketable securities having readily available market quotations) are valued at market, and investments in restricted securities (securities subject to one or more resale restrictions) are valued at fair value determined in good faith by our Board of Directors. Under our valuation policy, unrestricted securities are valued at the closing sale price for NYSE listed securities and at the lower of the closing bid price or the last sale price for NASDAQ securities on the valuation date.
Among the factors considered by our Board of Directors in determining the fair value of restricted securities are the financial condition and operating results of the issuer, the long-term potential of the business of the issuer, the market for and recent sales prices of the issuer’s securities, the values of similar securities issued by companies in similar businesses, the proportion of the issuer’s securities owned by us. Valuations as of any particular date, however, are not necessarily indicative of amounts which may ultimately be realized as a result of future sales or other dispositions of securities.
Impact of Inflation
We do not believe that our business is materially affected by inflation, other than the impact which inflation may have on the securities markets, the valuations of business enterprises and the relationship of such valuations to underlying earnings.
Portfolio Changes during the Year Ended March 31, 2014
New Investment and Additions to Previous Investments
|
New Investment
|
Purchase Amount
|
|||
|
Deepwater Corrosion Services, Inc.
|
$
|
8,000,000
|
||
|
Additions to Previous Investments
|
Purchase Amount
|
|||
|
Ballast Point Ventures II, L.P.
|
$
|
675,000
|
||
|
BankCap Partners Fund I, L.P.
|
102,724
|
|||
|
Capital South Partners
|
500,000
|
|||
|
Cinatra Clean Technologies, Inc.
|
2,889,300
|
*
|
||
|
iMemories, Inc.
|
440,000
|
|||
|
|
$
|
12,607,024
|
||
*During the fiscal year ended March 31, 2014, the $5,279,112 investment in debt securities of Cinatra Clean Technologies, Inc. and $1,579,056 accrued interest were converted into Convertible Preferred Stock.
Dispositions
|
|
Proceeds
|
Cost
|
Realized gain/(loss)
|
|||||||||
|
Hologic, Inc.
|
$
|
12,807,516
|
$
|
202,529
|
$
|
12,604,987
|
||||||
|
PalletOne, Inc.
|
2,450,000
|
1,703,150
|
746,850
|
|||||||||
|
TCI Holdings, Inc.
|
677,250
|
−
|
677,250
|
|||||||||
|
Diamond State Ventures
|
55,000
|
−
|
55,000
|
|||||||||
|
|
$
|
15,989,766
|
$
|
1,905,679
|
$
|
14,084,087
|
||||||
|
Cash distributions from net realized gain
|
−
|
|||||||||||
|
Undistributed realized gain before income taxes
|
$
|
14,084,087
|
||||||||||
We are subject to financial market risks, including changes in marketable equity security prices. We do not use derivative financial instruments to mitigate any of these risks.
Our investment performance is a function of our portfolio companies’ profitability, which may be affected by economic cycles, competitive forces, foreign currency fluctuations and production costs including labor rates, raw material prices and certain basic commodity prices. Most of the companies in our investment portfolio do not hedge their exposure to raw material and commodity price fluctuations. All of these factors may have an adverse effect on the value of our investments and on our net asset value.
A portion of our investment portfolio consists of debt and equity securities of private companies. We anticipate little to no impact on the values of these investments from modest changes in public market equity valuations. Should significant changes in market valuations of comparable publicly traded companies occur, there may be a corresponding effect on valuations of private companies, which would affect the value and the amount and timing of proceeds eventually realized from these investments. A significant portion of our investment portfolio also consists of unrestricted, freely marketable common stocks of publicly traded companies. These freely marketable investments, which are valued at the public market price, are directly exposed to equity market price risks. A change in an issuer’s public market equity price would result in an identical change in the value of our investment in such security.
Index to Financial Statements
|
|
Page
|
|
Reports of Independent Registered Public Accounting Firm
|
32
|
|
Consolidated Statements of Assets and Liabilities as of March 31, 2014 and 2013
|
34
|
|
Consolidated Statements of Operations for Years Ended March 31, 2014, 2013 and 2012
|
35
|
|
Consolidated Statements of Changes in Net Assets for Years Ended March 31, 2014, 2013 and 2012
|
36
|
|
Consolidated Statements of Cash Flows for Years Ended March 31, 2014, 2013 and 2012
|
37
|
|
Consolidated Schedules of Investments as of March 31, 2014 and 2013
|
38
|
|
Notes to Consolidated Financial Statements
|
49
|
Report of Independent Registered Public Accounting Firm
Board of Directors and Shareholders
Capital Southwest Corporation
We have audited the accompanying consolidated statements of assets and liabilities of Capital Southwest Corporation (a Texas Corporation) and subsidiaries (the “Company”), including the consolidated schedules of investments, as of March 31, 2014 and 2013, and the related consolidated statements of operations, changes in net assets, and cash flows for each of the three years in the period ended March 31, 2014 and the selected per share data and ratios for each of the five years in the period ended March 31, 2014. Our audits of the basic consolidated financial statements included the Schedule of Investments In and Advances to Affiliates listed in the index appearing under Item 15(2). These financial statements, per share data and ratios and financial statement schedule are the responsibility of the Company’s management. Our responsibility is to express an opinion on these financial statements, per share data and ratios, and financial statement schedule based on our audits.
We conducted our audits in accordance with the standards of the Public Company Accounting Oversight Board (United States). Those standards require that we plan and perform the audit to obtain reasonable assurance about whether the financial statements are free of material misstatement. An audit includes examining, on a test basis, evidence supporting the amounts and disclosures in the financial statements. An audit also includes assessing the accounting principles used and significant estimates made by management, as well as evaluating the overall financial statement presentation. Our procedures included verification by confirmation of securities as of March 31, 2014 and 2013, by correspondence with the portfolio companies and custodians, or by other appropriate auditing procedures where replies were not received. We believe that our audits provide a reasonable basis for our opinion.
In our opinion, the consolidated financial statements and the selected per share data and ratios referred to above present fairly, in all material respects, the financial position of Capital Southwest Corporation and subsidiaries as of March 31, 2014 and 2013, and the results of their operations, changes in their net assets, and their cash flows for each of the three years in the period ended March 31, 2014, and the selected per share data and ratios for each of the five years in the period ended March 31, 2014, in conformity with accounting principles generally accepted in the United States of America. Also, in our opinion, the related financial statement schedule, when considered in relation to the basic financial statements taken as a whole, presents fairly, in all material respects, the information set forth therein.
We also have audited, in accordance with the standards of the Public Company Accounting Oversight Board (United States), the Company’s internal control over financial reporting as of March 31, 2014, based on criteria established in the 1992 Internal Control—Integrated Framework issued by the Committee of Sponsoring Organizations of the Treadway Commission (COSO), and our report dated June 3, 2014 expressed an unqualified opinion thereon.
/s/ Grant Thornton LLP
Dallas, Texas
June 3, 2014
Report of Independent Registered Public Accounting Firm
Board of Directors and Shareholders
Capital Southwest Corporation
We have audited the internal control over financial reporting of Capital Southwest Corporation (a Texas Corporation) and subsidiaries (the “Company”) as of March 31, 2014, based on criteria established in the 1992 Internal Control—Integrated Framework issued by the Committee of Sponsoring Organizations of the Treadway Commission (COSO). The Company’s management is responsible for maintaining effective internal control over financial reporting and for its assessment of the effectiveness of internal control over financial reporting, included in the accompanying Management’s Report on Internal Control Over Financial Reporting. Our responsibility is to express an opinion on the Company’s internal control over financial reporting based on our audit.
We conducted our audit in accordance with the standards of the Public Company Accounting Oversight Board (United States). Those standards require that we plan and perform the audit to obtain reasonable assurance about whether effective internal control over financial reporting was maintained in all material respects. Our audit included obtaining an understanding of internal control over financial reporting, assessing the risk that a material weakness exists, testing and evaluating the design and operating effectiveness of internal control based on the assessed risk, and performing such other procedures as we considered necessary in the circumstances. We believe that our audit provides a reasonable basis for our opinion.
A company’s internal control over financial reporting is a process designed to provide reasonable assurance regarding the reliability of financial reporting and the preparation of financial statements for external purposes in accordance with generally accepted accounting principles. A company’s internal control over financial reporting includes those policies and procedures that (1) pertain to the maintenance of records that, in reasonable detail, accurately and fairly reflect the transactions and dispositions of the assets of the company; (2) provide reasonable assurance that transactions are recorded as necessary to permit preparation of financial statements in accordance with generally accepted accounting principles, and that receipts and expenditures of the company are being made only in accordance with authorizations of management and directors of the company; and (3) provide reasonable assurance regarding prevention or timely detection of unauthorized acquisition, use, or disposition of the company’s assets that could have a material effect on the financial statements.
Because of its inherent limitations, internal control over financial reporting may not prevent or detect misstatements. Also, projections of any evaluation of effectiveness to future periods are subject to the risk that controls may become inadequate because of changes in conditions, or that the degree of compliance with the policies or procedures may deteriorate.
In our opinion, the Company maintained, in all material respects, effective internal control over financial reporting as of March 31, 2014, based on criteria established in the 1992 Internal Control—Integrated Framework issued by COSO.
We also have audited, in accordance with the standards of the Public Company Accounting Oversight Board (United States), the consolidated financial statements of the Company as of and for the year ended March 31, 2014, and our report dated June 3, 2014 expressed an unqualified opinion on those financial statements.
/s/ Grant Thornton LLP
Dallas, Texas
June 3, 2014
CAPITAL SOUTHWEST CORPORATION AND SUBSIDIARIES
CONSOLIDATED STATEMENTS OF ASSETS AND LIABILITIES
(In thousands except per share data)
|
March 31
|
March 31
|
|||||||
|
|
2014
|
2013
|
||||||
|
Assets
|
|
|
||||||
|
Investments at market or fair value
|
|
|
||||||
|
Companies more than 25% owned (Cost: March 31, 2014 - $13,711, March 31, 2013 - $13,711)
|
$
|
400,824
|
$
|
344,790
|
||||
|
Companies 5% to 25% owned (Cost: March 31, 2014 - $13,891, March 31, 2013 - $15,594)
|
218,480
|
157,394
|
||||||
|
Companies less than 5% owned (Cost: March 31, 2014 - $71,365, March 31, 2013 - $58,961)
|
58,616
|
72,003
|
||||||
|
Total investments (Cost: March 31, 2014 - $98,967, March 31, 2013 - $88,266)
|
677,920
|
574,187
|
||||||
|
Cash and cash equivalents
|
88,163
|
81,767
|
||||||
|
Receivables
|
||||||||
|
Dividends and interest
|
782
|
2,465
|
||||||
|
Affiliates
|
422
|
291
|
||||||
|
Income tax receivable
|
167
|
-
|
||||||
|
Net pension assets
|
10,962
|
8,762
|
||||||
|
Other assets
|
278
|
200
|
||||||
|
Total assets
|
$
|
778,694
|
$
|
667,672
|
||||
|
Liabilities
|
||||||||
|
Other liabilities
|
$
|
3,263
|
$
|
3,102
|
||||
|
Accrued restoration plan liability
|
3,103
|
2,650
|
||||||
|
Deferred income taxes
|
1,940
|
2,143
|
||||||
|
Total liabilities
|
8,306
|
7,895
|
||||||
|
Net Assets
|
||||||||
|
Common stock, $0.25 par value: authorized, 25,000,000 shares; issued, 17,753,044 shares at March 31, 2014 and 17,576,776 shares at March 31, 2013
|
4,438
|
4,394
|
||||||
|
Additional capital
|
195,767
|
183,668
|
||||||
|
Accumulated net investment income (loss)
|
1,138
|
(706
|
)
|
|||||
|
Accumulated net realized gain
|
14,029
|
10,437
|
||||||
|
Unrealized appreciation of investments
|
578,953
|
485,921
|
||||||
|
Treasury stock - at cost, 2,339,512 shares
|
(23,937
|
)
|
(23,937
|
)
|
||||
|
Total net assets
|
770,388
|
659,777
|
||||||
|
Total liabilities and net assets
|
$
|
778,694
|
$
|
667,672
|
||||
|
Net asset value per share (15,413,532 shares outstanding at March 31, 2014 and 15,237,264 shares outstanding at March 31, 2013)
|
$
|
49.98
|
$
|
43.30
|
||||
The accompanying Notes are an integral part of these Consolidated Financial Statements.
CAPITAL SOUTHWEST CORPORATION AND SUBSIDIARIES
CONSOLIDATED STATEMENTS OF OPERATIONS
(In thousands)
|
|
Years Ended March 31,
|
|||||||||||
|
|
2014
|
2013
|
2012
|
|||||||||
|
Investment income:
|
|
|
|
|||||||||
|
Interest
|
$
|
577
|
$
|
2,078
|
$
|
1,980
|
||||||
|
Dividends
|
11,405
|
8,093
|
6,720
|
|||||||||
|
Management fees and other income
|
625
|
664
|
634
|
|||||||||
|
|
12,607
|
10,835
|
9,334
|
|||||||||
|
Operating expenses:
|
||||||||||||
|
Salaries
|
6,121
|
5,113
|
3,653
|
|||||||||
|
Stock option (benefit) expense
|
(632
|
)
|
515
|
1,050
|
||||||||
|
Net pension expense (benefit)
|
176
|
(34
|
)
|
(300
|
)
|
|||||||
|
Professional fees
|
990
|
1,133
|
990
|
|||||||||
|
Other operating expenses
|
1,797
|
1,611
|
1,279
|
|||||||||
|
|
8,452
|
8,338
|
6,672
|
|||||||||
|
Income before income taxes
|
4,155
|
2,497
|
2,662
|
|||||||||
|
Income tax (benefit) expense
|
(739
|
)
|
590
|
118
|
||||||||
|
|
||||||||||||
|
Net investment income
|
$
|
4,894
|
$
|
1,907
|
$
|
2,544
|
||||||
|
|
||||||||||||
|
Proceeds from disposition of investments
|
15,990
|
99,542
|
32,454
|
|||||||||
|
Cost of investments sold
|
1,906
|
9,984
|
20,627
|
|||||||||
|
Realized gain on investments
before income tax
|
14,084
|
89,558
|
11,827
|
|||||||||
|
|
||||||||||||
|
Net increase in unrealized appreciation of investments
|
93,032
|
16,367
|
78,635
|
|||||||||
|
|
||||||||||||
|
Net realized and unrealized gain on investments
|
$
|
107,116
|
$
|
105,925
|
$
|
90,462
|
||||||
|
Increase in net assets from operations
|
$
|
112,010
|
$
|
107,832
|
$
|
93,006
|
||||||
The accompanying Notes are an integral part of these Consolidated Financial Statements.
CAPITAL SOUTHWEST CORPORATION AND SUBSIDIARIES
CONSOLIDATED STATEMENTS OF CHANGES IN NET ASSETS
(In thousands)
|
|
Years Ended March 31
|
|||||||||||
|
|
2014
|
2013
|
2012
|
|||||||||
|
Operations:
|
|
|
|
|||||||||
|
Net investment income
|
$
|
4,894
|
$
|
1,907
|
$
|
2,544
|
||||||
|
Net realized gain on investments
|
14,084
|
89,558
|
11,827
|
|||||||||
|
Net increase in unrealized appreciation of investments
|
93,032
|
16,367
|
78,635
|
|||||||||
|
Increase in net assets from operations
|
112,010
|
107,832
|
93,006
|
|||||||||
|
Distributions from:
|
||||||||||||
|
Undistributed net investment income
|
(3,050
|
)
|
(3,025
|
)
|
(3,003
|
)
|
||||||
|
Net realized gains
|
-
|
(77,301
|
)
|
-
|
||||||||
|
Taxes incurred in deemed capital gain distributions
|
(3,787
|
)
|
(1,125
|
)
|
(1,249
|
)
|
||||||
|
Capital share transactions:
|
||||||||||||
|
Change in pension plan funded status
|
1,250
|
194
|
(430
|
)
|
||||||||
|
Exercise of employee stock options
|
4,820
|
3,981
|
99
|
|||||||||
|
Stock option and restricted awards(benefit)expense
|
(632
|
)
|
515
|
1,050
|
||||||||
|
Increase in net assets
|
110,611
|
31,071
|
89,473
|
|||||||||
|
Net assets, beginning of period
|
659,777
|
628,706
|
539,233
|
|||||||||
|
Net assets, end of period
|
$
|
770,388
|
$
|
659,777
|
$
|
628,706
|
||||||
The accompanying Notes are an integral part of these Consolidated Financial Statements.
CAPITAL SOUTHWEST CORPORATION AND SUBSIDIARIES
CONSOLIDATED STATEMENTS OF CASH FLOWS
(In thousands)
|
|
Years Ended March 31
|
|||||||||||
|
|
2014
|
2013
|
2012
|
|||||||||
|
Cash flows from operating activities
|
|
|
|
|||||||||
|
Increase in net assets from operations
|
$
|
112,010
|
$
|
107,832
|
$
|
93,006
|
||||||
|
Adjustments to reconcile increase in net assets from operations to net cash provided by operating activities:
|
||||||||||||
|
Net proceeds from disposition of investments
|
15,990
|
99,535
|
32,454
|
|||||||||
|
Return of capital on investment
|
-
|
767
|
-
|
|||||||||
|
Proceeds from repayment of loans
|
-
|
-
|
2,111
|
|||||||||
|
Purchases of securities
|
(12,607
|
)
|
(10,018
|
)
|
(13,377
|
)
|
||||||
|
Depreciation and amortization
|
23
|
30
|
25
|
|||||||||
|
Net pension expense (benefit)
|
176
|
(34
|
)
|
(300
|
)
|
|||||||
|
Realized gains on investments before income tax
|
(14,084
|
)
|
(89,558
|
)
|
(11,827
|
)
|
||||||
|
Taxes incurred on deemed capital gain distribution
|
(3,787
|
)
|
(1,125
|
)
|
(1,249
|
)
|
||||||
|
Net increase in unrealized appreciation of investments
|
(93,032
|
)
|
(16,367
|
)
|
(78,635
|
)
|
||||||
|
Stock option and restricted awards (benefit)expense
|
(632
|
)
|
515
|
1,050
|
||||||||
|
Decrease (increase) in dividend and interest receivable
|
1,683
|
(724
|
)
|
(1,218
|
)
|
|||||||
|
(Increase) decrease in receivables from affiliates
|
(131
|
)
|
(70
|
)
|
120
|
|||||||
|
Increase in tax receivable
|
(167
|
)
|
-
|
-
|
||||||||
|
(Increase) decrease in other assets
|
(100
|
)
|
6
|
(81
|
)
|
|||||||
|
(Decrease) increase in other liabilities
|
(513
|
)
|
2,520
|
344
|
||||||||
|
Decrease in deferred income taxes
|
(203
|
)
|
(92
|
)
|
(123
|
)
|
||||||
|
Net cash provided by operating activities
|
4,626
|
93,217
|
22,300
|
|||||||||
|
Cash flows from financing activities
|
||||||||||||
|
Distributions from undistributed net investment income
|
(3,050
|
)
|
(3,025
|
)
|
(3,003
|
)
|
||||||
|
Dividends paid from capital gains
|
-
|
(77,301
|
)
|
-
|
||||||||
|
Proceeds from exercise of employee stock options
|
4,820
|
3,981
|
99
|
|||||||||
|
Net cash provided by (used in) financing activities
|
1,770
|
(76,345
|
)
|
(2,904
|
)
|
|||||||
|
Net increase in cash and cash equivalents
|
6,396
|
16,872
|
19,396
|
|||||||||
|
Cash and cash equivalents at beginning of period
|
81,767
|
64,895
|
45,499
|
|||||||||
|
Cash and cash equivalents at end of period
|
$
|
88,163
|
$
|
81,767
|
$
|
64,895
|
||||||
|
Supplemental disclosure of cash flow information:
|
||||||||||||
|
Income taxes paid
|
$
|
350
|
$
|
590
|
$
|
–
|
||||||
Non-cash transactions:
| a. | In July 2011, the $1,000,000 investment in iMemories, Inc. debt security was converted into Series C Convertible Preferred Stock. |
| b. | In December 2012, the $3,200,000 investment in Trax Holdings, Inc. debt security and $800,000 accrued interest were converted into Series B Convertible Preferred Stock. |
| c. | In March 2014, the $5,279,112 investment in Cinatra Clean Technologies, Inc. debt security and $1,579,056 accrued interest were converted into Preferred Stock. |
These transactions had the following non-cash effect on our Consolidated Statements of Assets and Liabilities:
|
|
2014
|
2013
|
2012
|
|||||||||
|
Total Investments
|
$
|
6,858
|
$
|
4,000
|
$
|
1,000
|
||||||
The accompanying Notes are an integral part of these Consolidated Financial Statements.
CAPITAL SOUTHWEST CORPORATION AND SUBSIDIARIES
CONSOLIDATED SCHEDULE OF INVESTMENTS
March 31, 2014
|
Company
|
Equity (a)
|
Investment (b)
|
Cost
|
Value (c)
|
|||||||||
|
*†
ALAMO GROUP INC.
Seguin, Texas
Tractor-mounted mowing and mobile excavation equipment for governmental, industrial and agricultural markets; street-sweeping and snow removal equipment for municipalities.
|
22.0
|
%
|
‡2,831,300 shares of common stock (acquired 4-1-73 thru 5-09-13)
|
$
|
2,190,937
|
$
|
153,824,529
|
||||||
|
ATLANTIC CAPITAL BANCSHARES, INC
Atlanta, Georgia
Holding company of Atlantic Capital Bank, a full service commercial bank.
|
1.9
|
%
|
300,000 shares of common stock (acquired 4-10-07)
|
3,000,000
|
3,817,000
|
||||||||
|
¥
BALCO, INC.
Wichita, Kansas
Specialty architectural products used in the construction and remodeling of commercial and institutional buildings.
|
95.7
|
%
|
445,000 shares of common stock and 60,920 shares Class B non-voting common stock (acquired 10-25-83 and 5-30-02)
|
624,920
|
4,500,000
|
||||||||
|
*BOXX TECHNOLOGIES, INC.
Austin, Texas
Workstations for computer graphic imaging and design.
|
14.9
|
%
|
3,125,354 shares of Series B Convertible Preferred Stock, convertible into 3,125,354 shares of common stock at $0.50 per share (acquired 8-20-99 thru 8-8-01)
|
1,500,000
|
1,040,000
|
||||||||
|
¥ CAPSTAR HOLDINGS CORPORATION
Dallas, Texas
Acquires holds and manages real estate for potential development and sale.
|
100
|
%
|
500 shares of common stock (acquired 6-10-10) and 1,000,000 shares of preferred stock (acquired 12-17-12)
|
4,703,619
|
7,514,000
|
||||||||
|
CINATRA CLEAN TECHNOLOGIES, INC.
Houston, Texas
Cleans above ground oil storage tanks with a patented, automated system.
|
76.2
|
%
|
12% subordinated secured promissory note, due 5-9-16 (acquired 5-19-10 thru 10-20-10)
|
779,278
|
1
|
||||||||
|
12% subordinated secured promissory note, due 5-9-17 (acquired 5-9-11 thru 10-26-11)
|
2,285,700
|
1
|
|||||||||||
|
|
12% subordinated secured promissory note, due 3-31-17 (acquired 9-9-11 and 10-26-11)
|
1,523,800
|
1
|
||||||||||
|
|
10% subordinated secured promissory note, due 5-9-17 (acquired 7-14-08 thru 4-28-10)
|
921,588
|
1
|
||||||||||
|
|
12% subordinated secured promissory note, due 10-31-17 (acquired 10-19-12)
|
499,997
|
1
|
||||||||||
|
|
12% subordinated secured promissory note, due 9-30-14 (acquired 7-25-13)
|
1,157,850
|
1
|
||||||||||
|
|
12% subordinated secured promissory note, due 9-30-14 (acquired 2-19-14)
|
152,394
|
1
|
||||||||||
|
|
9,891,578 shares of Series A Convertible Preferred Stock, convertible into 9,891,578 shares of common stock at $1.00 per share (acquired 7-14-08 thru 3-15-14)
|
9,891,578
|
1
|
||||||||||
|
|
Warrants to purchase 1,436,499 shares of common stock at $1.00 per share, expiring 10-31-2027 (acquired 5-9-11 thru 10-19-12)
|
–
|
–
|
||||||||||
|
|
|
17,212,185
|
8
|
||||||||||
†
Publicly-owned company
¥ Control investment * Affiliated investment
‡
Unrestricted securities as defined in Note (a)
The accompanying Notes are an integral part of these Consolidated Financial Statements.
CAPITAL SOUTHWEST CORPORATION AND SUBSIDIARIES
CONSOLIDATED SCHEDULE OF INVESTMENTS
March 31, 2014
|
Company
|
Equity (a)
|
Investment (b)
|
Cost |
Value (c)
|
|||||||||
|
DEEPWATER CORROSION SERVICES, INC.
Houston, Texas
Full-service corrosion control company providing the oil and gas industry with expertise in cathodic protection and asset integrity management.
|
31.3
|
%
|
127,004 shares of Series A convertible preferred stock, convertible into 127,004 shares of common stock at $1.00 per shares (acquired 4-9-13)
|
8,000,000
|
8,000,000
|
||||||||
|
¥DISCOVERY ALLIANCE, LLC
Dallas, Texas
Provides services related to intellectual property protection and development.
|
90
|
%
|
90.0% limited liability company interest (acquired 9-12-08 thru 10-15-12)
|
1,315,000
|
400,000
|
||||||||
|
*†ENCORE WIRE CORPORATION
McKinney, Texas
Electric wire and cable for residential, commercial and industrial construction use.
|
6.2
|
%
|
‡1,312,500 shares of common stock (acquired 9-10-92 thru 10-15-98)
|
5,200,000
|
63,590,625
|
||||||||
|
iMEMORIES, INC.
Scottsdale, Arizona
Enables online video and photo sharing and DVD creation for home movies and photos recorded in analog and digital formats.
|
23.3
|
%
|
17,391,304 shares of Series B Convertible Preferred Stock, convertible into 19,891,304 shares of common stock at $0.23 per share (acquired 7-10-09)
|
4,000,000
|
2
|
||||||||
|
|
4,684,967 shares of Series C Convertible Preferred Stock, convertible into 4,684,967 shares of common stock at $0.23 per share (acquired 7-20-11)
|
1,078,479
|
994,000
|
||||||||||
|
|
Warrants to purchase 8,396,000 shares of common stock at $0.12 per share, expiring 7-31-14 (acquired 9-13-10 thru 3-15-13)
|
–
|
–
|
||||||||||
|
|
10% convertible notes, $308,000 principal due 7-31-14 (acquired 9-7-12)
|
308,000
|
308,000
|
||||||||||
|
|
10% convertible notes, $880,000 principal due 7-31-14 (acquired from 3-15-13 to 9-26-13)
|
880,000
|
880,000
|
||||||||||
|
|
|
6,266,479
|
2,182,002
|
||||||||||
|
INSTAWARES HOLDING COMPANY, LLC
Atlanta, Georgia
Provides services and distributes equipment and supplies to the restaurant industry via its five subsidiary companies.
|
4.3
|
%
|
3,846,154 Class D Convertible Preferred Stock (acquired 5-20-11)
|
5,000,000
|
3,354,000
|
||||||||
|
KBI BIOPHARMA, INC.
Durham, North Carolina
Provides fully-integrated, outsourced drug development and bio-manufacturing services.
|
17.1
|
%
|
10,204,082 shares of Series B-2 Convertible Preferred Stock, convertible into 10,204,802 shares of common stock at $0.49 per share (acquired 9-08-09)
|
5,000,000
|
7,000,000
|
||||||||
|
|
Warrants to purchase 94,510 shares of Series B preferred stock at $ 0.70 per share, acquired 1-26-12
|
-
|
-
|
||||||||||
|
|
|
5,000,000
|
7,000,000
|
†Publicly-owned company
¥ Control investment * Affiliated investment
‡
Unrestricted securities as defined in Note (a)
The accompanying Notes are an integral part of these Consolidated Financial Statements.
CAPITAL SOUTHWEST CORPORATION AND SUBSIDIARIES
CONSOLIDATED SCHEDULE OF INVESTMENTS
March 31, 2014
|
Company
|
Equity (a)
|
Investment (b)
|
Cost |
Value (c)
|
|||||||||
|
¥
MEDIA RECOVERY, INC.
Dallas, Texas
Distributor of computer datacenter and office automation supplies and accessories; manufactures and distributes devices used to monitor and manage intransit inventory and dunnage products for protecting shipments.
|
97.9
|
%
|
800,000 shares of Series A Convertible Preferred Stock, convertible into 800,000 shares of common stock at $1.00 per share (acquired 11-4-97)
|
800,000
|
4,000,000
|
||||||||
|
4,000,002 shares of common stock (acquired 11-4-97)
|
4,615,000
|
19,900,000
|
|||||||||||
|
|
|
5,415,000
|
23,900,000
|
||||||||||
|
¥
THE RECTORSEAL CORPORATION
Houston, Texas
Specialty chemicals, tools and products for plumbing, HVAC, electrical, construction, industrial, and oil field; smoke containment systems for building fires; also owns 20% of The Whitmore Manufacturing Company.
|
100.0
|
%
|
27,907 shares of common stock (acquired 1-5-73 and 3-31-73)
|
52,600
|
275,800,000
|
||||||||
|
TITANLINER, INC.
Midland, Texas
Manufactures, installs and rents spill containment system for oilfield applications.
|
31.2
|
%
|
217,038 shares of Series A Convertible Preferred Stock convertible into 217,038 shares of Series A Preferred Stock at $14.76 per share (acquired 6-29-12)
|
3,203,000
|
1
|
||||||||
|
|
7% senior subordinated secured promissory note, due 6-30-17 (acquired 6-29-12)
|
2,747,000
|
1,519,000
|
||||||||||
|
|
Warrants to purchase 122,239 shares of Series A Preferred Stock at $ 0.01 per share, expiring 12-31-22
|
-
|
-
|
||||||||||
|
|
|
5,950,000
|
1,519,001
|
||||||||||
|
TRAX HOLDINGS, INC.
Scottsdale, Arizona
Provides a comprehensive set of solutions to improve the validation, accounting and payment of transportation-related invoices.
|
28.4
|
%
|
475,430 shares of Series B convertible Preferred Stock convertible into 475,430 shares of common stock at $8.41 per share(acquired 12-5-12)
|
4,000,000
|
7,700,000
|
||||||||
|
|
1,061,279
shares of Series A Convertible Preferred Stock, convertible into 1,061,279 shares of common stock at $4.71 per share (acquired 12-8-08 and 2-17-09)
|
5,000,000
|
13,300,000
|
||||||||||
|
|
|
9,000,000
|
21,000,000
|
||||||||||
|
*WELLOGIX, INC.
Houston, Texas
Formerly a developer and supporter of business process software used by the oil and gas industry.
|
19.0
|
%
|
4,788,371 shares of Series A-1 Convertible Participating Preferred Stock, convertible into 4,788,371 shares of common stock at $1.04 per share (acquired 8-19-05 thru 6-15-08)
|
5,000,000
|
25,000
|
†Publicly-owned company
¥ Control investment * Affiliated investment
‡
Unrestricted securities as defined in Note (a)
The accompanying Notes are an integral part of these Consolidated Financial Statements.
CAPITAL SOUTHWEST CORPORATION AND SUBSIDIARIES
CONSOLIDATED SCHEDULE OF INVESTMENTS
March 31, 2014
|
Company
|
Equity (a)
|
Investment (b)
|
Cost |
Value (c)
|
|||||||||
|
¥
THE WHITMORE MANUFACTURING COMPANY
Rockwall, Texas
Specialized surface mining, railroad and industrial lubricants; coatings for automobiles and primary metals; fluid contamination control devices.
|
80.0
|
%
|
80 shares of common stock (acquired 8-31-79)
|
1,600,000
|
88,500,000
|
||||||||
|
MISCELLANEOUS
|
–
|
Ballast Point Ventures II, L.P.
2.2% limited partnership interest (acquired 8-4-08 thru 2-15-13)
|
2,334,790
|
3,167,000
|
|||||||||
|
|
–
|
BankCap Partners Fund I, L.P.
5.5% limited partnership interest (acquired 7-14-06 thru 11-16-12)
|
6,000,000
|
5,385,000
|
|||||||||
|
|
–
|
†Capitala Finance Corporation
108,105 shares of common stock (acquired 9-25-13)
|
1,363,799
|
2,083,183
|
|||||||||
|
|
–
|
CapitalSouth Partners Fund III, L.P.
1.9% limited partnership interest (acquired 1-22-08 and 11-16-11)
|
467,457
|
237,000
|
|||||||||
|
|
–
|
Diamond State Ventures, L.P.
1.4% limited partnership interest (acquired 10-12-99 thru 8-26-05)
|
-
|
16,000
|
|||||||||
|
|
–
|
First Capital Group of Texas III, L.P.
3.0% limited partnership interest (acquired 12-26-00 thru 8-12-05)
|
778,895
|
117,000
|
|||||||||
|
|
100
|
%
|
¥Humac Company
1,041,000 shares of common stock (acquired 1-31-75 and 12-31-75)
|
–
|
210,000
|
||||||||
|
|
–
|
†North American Energy Partners, Inc.
77,194 shares of common stock (acquired 8-20-12)
|
236,986
|
555,797
|
|||||||||
|
|
|
||||||||||||
|
|
–
|
STARTech Seed Fund II
3.2% limited partnership interest (acquired 4-28-00 thru 2-23-05)
|
754,327
|
183,000
|
|||||||||
|
TOTAL INVESTMENTS
|
|
$
|
98,966,994
|
$
|
677,920,145
|
†
Publicly-owned company
¥ Control investment * Affiliated investment
‡
Unrestricted securities as defined in Note (a)
The accompanying Notes are an integral part of these Consolidated Financial Statements.
CAPITAL SOUTHWEST CORPORATION AND SUBSIDIARIES
CONSOLIDATED SCHEDULE OF INVESTMENTS
March 31, 2013
|
Company
|
Equity (a)
|
Investment (b)
|
Cost
|
Value (c)
|
|||||||||
|
*†
ALAMO GROUP INC.
Seguin, Texas
Tractor-mounted mowing and mobile excavation equipment for governmental, industrial and agricultural markets; street-sweeping equipment for municipalities.
|
22.0
|
%
|
‡2,832,300 shares of common stock (acquired 4-1-73 thru 5-09-11)
|
$
|
2,190,937
|
$
|
108,278,100
|
||||||
|
ATLANTIC CAPITAL BANCSHARES, INC
Atlanta, Georgia
Holding company of Atlantic Capital Bank, a full service commercial bank.
|
1.9
|
%
|
300,000 shares of common stock (acquired 4-10-07)
|
3,000,000
|
2,950,000
|
||||||||
|
¥
BALCO, INC.
Wichita, Kansas
Specialty architectural products used in the construction and remodeling of commercial and institutional buildings.
|
95.7
|
%
|
445,000 shares of common stock and 60,920 shares Class B non-voting common stock (acquired 10-25-83 and 5-30-02)
|
624,920
|
4,500,000
|
||||||||
|
*BOXX TECHNOLOGIES, INC.
Austin, Texas
Workstations for computer graphic imaging and design.
|
14.9
|
%
|
3,125,354 shares of Series B Convertible Preferred Stock, convertible into 3,125,354 shares of common stock at $0.50 per share (acquired 8-20-99 thru 8-8-01)
|
1,500,000
|
1,240,000
|
||||||||
|
CINATRA CLEAN TECHNOLOGIES, INC.
Houston, Texas
Cleans above ground oil
storage tanks with a patented, automated system.
|
73.4
|
%
|
12% subordinated secured promissory note, due 5-9-16 (acquired 5-19-10 thru 10-20-10)
|
779,278
|
81,000
|
||||||||
|
12% subordinated secured promissory note, due 5-9-17 (acquired 5-9-11 thru 10-26-11)
|
2,285,700
|
237,000
|
|||||||||||
|
|
12% subordinated secured promissory note, due 3-31-17 (acquired 9-9-11 and 10-26-11)
|
1,523,800
|
158,000
|
||||||||||
|
|
10% subordinated secured promissory note, due 5-9-17 (acquired 7-14-08 thru 4-28-10)
|
6,200,700
|
643,000
|
||||||||||
|
|
12% subordinated secured promissory note, due 10-31-17 (acquired 10-19-12)
|
499,997
|
52,000
|
||||||||||
|
|
3,033,410 shares Series A Convertible Preferred Stock, convertible into 3,033,410 shares common stock at $1.00 per share (acquired 7-14-08 thru 11-18-10)
|
3,033,410
|
1
|
||||||||||
|
|
Warrants to purchase 1,436,499 shares of common stock at $1.00 per share, expiring 10-31-2027 (acquired 5-9-11 thru 10-19-12)
|
–
|
–
|
||||||||||
|
|
|
14,322,885
|
1,171,001
|
†
Publicly-owned company
¥ Control investment * Affiliated investment
‡
Unrestricted securities as defined in Note (a)
The accompanying Notes are an integral part of these Consolidated Financial Statements.
CAPITAL SOUTHWEST CORPORATION AND SUBSIDIARIES
CONSOLIDATED SCHEDULE OF INVESTMENTS
March 31, 2013
|
Company
|
Equity (a)
|
Investment (b)
|
Cost
|
Value (c)
|
|||||||||
|
*†ENCORE WIRE
CORPORATION
McKinney, Texas
Electric wire and cable for residential, commercial and industrial construction use.
|
6.2
|
%
|
‡1,312,500 shares of common stock (acquired 9-10-92 thru 10-15-98)
|
5,200,000
|
45,950,625
|
||||||||
|
†
HOLOGIC, INC.
Bedford, Massachusetts
Medical instruments including bone densitometers, mammography devices and digital radiography systems.
|
< 1
|
% |
‡582,820 shares of common stock (acquired 8-27-99)
|
202,529
|
13,165,904
|
||||||||
|
iMEMORIES, INC.
Scottsdale, Arizona
Enables online video and photo sharing and DVD creation for home movies recorded in analog and new digital format.
|
23
|
%
|
17,391,304 shares of Series B Convertible Preferred Stock, convertible into 19,891,304 shares of common stock at $0.23 per share (acquired 7-10-09)
|
4,000,000
|
4,000,000
|
||||||||
|
|
4,684,967 shares of Series C Convertible Preferred Stock, convertible into 4,684,967 shares of common stock at $0.23 per share (acquired 7-20-11)
|
1,078,479
|
1,078,479
|
||||||||||
|
|
Warrants to purchase 2,500,000 shares of common stock at $0.12 per share, expiring 1-21-21(acquired 9-13-10 thru 1-21-11)
|
–
|
–
|
||||||||||
|
|
10% convertible notes, $308,000 principal due 7-31-14 (acquired 9-7-12)
|
308,000
|
308,000
|
||||||||||
|
|
10% convertible notes, $400,000 principal due 7-31-14 (acquired 3-15-13
|
440,000
|
440,000
|
||||||||||
|
|
|
5,826,479
|
5,826,479
|
||||||||||
|
INSTAWARES HOLDING COMPANY, LLC
Atlanta, Georgia
Provides services to the restaurant industry via its five subsidiary companies.
|
4.5
|
%
|
3,846,154 shares of Class D Convertible Preferred Stock (acquired 5-20-11)
|
5,000,000
|
5,975,000
|
||||||||
|
KBI BIOPHARMA, INC.
Durham, North Carolina
Provides fully-integrated, outsourced drug development and bio-manufacturing services.
|
17.1
|
%
|
10,204,082 shares of Series B-2 Convertible Preferred Stock, convertible into 10,204,802 shares of common stock at $0.49 per share (acquired 9-08-09)
|
5,000,000
|
5,200,000
|
||||||||
|
|
Warrants to purchase 94,510 shares of Series B Preferred stock at $ 0.70 per share, acquired 1-26-12
|
-
|
-
|
||||||||||
|
|
|
5,000,000
|
5,200,000
|
||||||||||
Publicly-owned company
¥ Control investment * Affiliated investment
‡
Unrestricted securities as defined in Note (a)
The accompanying Notes are an integral part of these Consolidated Financial Statements.
CAPITAL SOUTHWEST CORPORATION AND SUBSIDIARIES
CONSOLIDATED SCHEDULE OF INVESTMENTS
March 31, 2013
|
Company
|
Equity (a)
|
Investment (b)
|
Cost
|
Value (c)
|
|||||||||
|
¥
MEDIA RECOVERY, INC.
Dallas, Texas
Computer datacenter and office automation supplies and accessories; impact, tilt monitoring and temperature sensing devices to detect mishandling shipments; dunnage for protecting shipments.
|
97.9
|
%
|
800,000 shares of Series A Convertible Preferred Stock, convertible into 800,000 shares of common stock at $1.00 per share (acquired 11-4-97)
|
800,000
|
2,000,000
|
||||||||
|
4,000,002 shares of common stock (acquired 11-4-97)
|
4,615,000
|
9,900,000
|
|||||||||||
|
|
|
5,415,000
|
11,900,000
|
||||||||||
|
*PALLETONE, INC.
Bartow, Florida
Manufacturer of wooden pallets and pressure-treated lumber.
|
7.7
|
%
|
12.3% senior subordinated notes, $2,000,000 principal due 12-18-15 (acquired 9-25-06)
|
1,553,150
|
1,900,000
|
||||||||
|
|
150,000 shares of common stock (acquired 10-18-01)
|
150,000
|
2
|
||||||||||
|
|
|
1,703,150
|
1,900,002
|
||||||||||
|
¥
THE RECTORSEAL CORPORATION
Houston, Texas
Specialty chemicals for plumbing, HVAC, electrical, construction, industrial, oil field and automotive applications; smoke containment systems for building fires; also owns 20% of The Whitmore Manufacturing Company.
|
100.0
|
%
|
27,907 shares of common stock (acquired 1-5-73 and 3-31-73)
|
52,600
|
238,900,000
|
||||||||
|
TCI HOLDINGS, INC.
Denver, Colorado
Cable television systems and microwave relay systems.
|
–
|
21 shares of 12% Series C Cumulative Compounding Preferred Stock (acquired 1-30-90)
|
–
|
763,000
|
|||||||||
|
TITANLINER, INC.
Midland, Texas
Manufactures, installs and rents spill containment system for oilfield applications.
|
29.9
|
%
|
217,038 shares of Series A Convertible Preferred Stock convertible into 217,038 shares of Series A Preferred Stock at $14.76 per share (acquired 6-29-12)
|
3,203,000
|
3,203,000
|
||||||||
|
|
7% senior subordinated secured promissory note, due 6-30-17 (acquired 6-29-12)
|
2,747,000
|
2,747,000
|
||||||||||
|
|
Warrants to purchase 122,239 shares of Series A preferred stock at $ 0.01 per share, expiring 12-31-22
|
-
|
-
|
||||||||||
|
|
|
5,950,000
|
5,950,000
|
Publicly-owned company
¥ Control investment * Affiliated investment
‡
Unrestricted securities as defined in Note (a)
The accompanying Notes are an integral part of these Consolidated Financial Statements.
CAPITAL SOUTHWEST CORPORATION AND SUBSIDIARIES
CONSOLIDATED SCHEDULE OF INVESTMENTS
March 31, 2013
|
Company
|
Equity (a)
|
Investment (b)
|
Cost
|
Value (c)
|
|||||||||
|
TRAX HOLDINGS, INC.
Scottsdale, Arizona
Provides a comprehensive set of solutions to improve the transportation validation, accounting, payment and information management process.
|
25.4
|
%
|
475,430 shares of Series B convertible Preferred Stock convertible into 475,430 shares of common stock at $8.41 per share(acquired 12-5-12)
|
4,000,000
|
7,000,000
|
||||||||
|
|
1,061,279
shares of Series A Convertible Preferred Stock, convertible into 1,061,279 shares of common stock at $4.71 per share (acquired 12-8-08 and 2-17-09)
|
5,000,000
|
12,400,000
|
||||||||||
|
|
|
9,000,000
|
19,400,000
|
||||||||||
|
*WELLOGIX, INC.
Houston, Texas
Developer and supporter of software used by the oil and gas industry.
|
19.1
|
%
|
4,788,371 shares of Series A-1 Convertible Participating Preferred Stock, convertible into 4,788,371 shares of common stock at $1.04 per share (acquired 8-19-05 thru 6-15-08)
|
5,000,000
|
25,000
|
||||||||
|
¥
THE WHITMORE MANUFACTURING COMPANY
Rockwall, Texas
Specialized surface mining, railroad and industrial lubricants; coatings for automobiles and primary metals; fluid contamination control devices.
|
80.0
|
%
|
80 shares of common stock (acquired 8-31-79)
|
1,600,000
|
80,500,000
|
||||||||
|
MISCELLANEOUS
|
–
|
Ballast Point Ventures II, L.P.
2.2% limited partnership interest (acquired 8-4-08 thru 2-15-13)
|
1,659,790
|
1,843,000
|
|||||||||
|
|
–
|
BankCap Partners Fund I, L.P.
5.5% limited partnership interest (acquired 7-14-06 thru 11-16-12)
|
5,897,276
|
5,013,000
|
|||||||||
|
|
–
|
CapitalSouth Partners Fund III, L.P.
1.9% limited partnership interest (acquired 1-22-08 and 11-16-11)
|
1,331,256
|
3,934,000
|
|||||||||
|
|
100.0
|
%
|
¥CapStar Holdings Corporation
500 shares common stock (acquired 6-10-10); 1,000,000 shares of preferred stock (acquired 12-17-12)
|
4,703,619
|
7,846,000
|
Publicly-owned company
¥ Control investment * Affiliated investment
‡
Unrestricted securities as defined in Note (a)
The accompanying Notes are an integral part of these Consolidated Financial Statements.
CAPITAL SOUTHWEST CORPORATION AND SUBSIDIARIES
CONSOLIDATED SCHEDULE OF INVESTMENTS
March 31, 2013
|
Company
|
Equity (a)
|
Investment (b)
|
Cost
|
Value (c)
|
|||||||||
|
Miscellaneous (continued)
|
–
|
Diamond State Ventures, L.P.
1.4% limited partnership interest (acquired 10-12-99 thru 8-26-05)
|
-
|
120,000
|
|||||||||
|
|
–
|
¥Discovery Alliance, LLC
90.0% limited liability company interest (acquired 9-12-08 thru 10-15-12)
|
1,315,000
|
956,000
|
|||||||||
|
|
–
|
First Capital Group of Texas III, L.P.
3.0% limited partnership interest (acquired 12-26-00 thru 8-12-05)
|
778,895
|
190,000
|
|||||||||
|
|
100
|
%
|
¥Humac Company
1,041,000 shares common stock (acquired 1-31-75 and 12-31-75)
|
–
|
188,000
|
||||||||
|
|
–
|
†North American Energy Partners, Inc.
77,194 shares of common stock (acquired 8-20-12)
|
236,986
|
350,461
|
|||||||||
|
|
–
|
STARTech Seed Fund II
3.2% limited partnership interest (acquired 4-28-00 thru 2-23-05)
|
754,327
|
151,000
|
|||||||||
|
TOTAL INVESTMENTS
|
|
$
|
88,265,649
|
$
|
574,186,572
|
†
Publicly-owned company
¥ Control investment * Affiliated investment
‡
Unrestricted securities as defined in Note (a)
The accompanying Notes are an integral part of these Consolidated Financial Statements.
Notes to Consolidated Schedule of Investments
|
a)
|
Equity
|
The percentages in the “Equity” column express equity interests held by Capital Southwest Corporation and Capital Southwest Venture Corporation (together, the “Company”) in each issuer. Each percentage represents the amount of the issuer’s common stock the Company owns or can acquire as a percentage of the issuer’s total outstanding common stock, plus stock reserved for all warrants, convertible securities and employee stock options.
|
(b)
|
Investments
|
Unrestricted securities (indicated by
‡
) are freely marketable securities having readily available market quotations. All other securities are restricted securities, which are subject to one or more restrictions on resale and are not freely marketable. At March 31, 2014, restricted securities represented approximately 67.5% of the value of the consolidated investment portfolio.
Our investments are carried at fair value in accordance with the Investment Company Act of 1940 (the “1940 Act”) and FASB Accounting Standards Codification (ASC) 820, Fair Value Measurements and Disclosures. In accordance with the 1940 Act, unrestricted minority-owned publicly traded securities, for which the market quotations are readily available, are valued at the closing sale price for the NYSE listed securities and the lower of the closing bid price or the last sale price for NASDAQ securities on the valuation date; other privately held securities are valued as determined in good faith by our Board of Directors.
ASC 820 defines fair value in terms of the price that would be received upon the sale of an asset or paid to transfer a liability in an orderly transaction between market participants at the measurement date (the “exit price”) and excludes transaction costs. Under ASC 820, the fair value measurement also assumes that the transaction to sell an asset occurs in the principal market for the asset or, in the absence of a principal market, the most advantageous market for the asset. The principal market is the market in which the reporting entity would sell or transfer the asset with the greatest volume and level of activity for the asset. In determining the principal market for an asset or liability under ASC 820, it is assumed that the reporting entity has access to the market as of the measurement date.
|
(c)
|
Value
|
Debt securities are generally valued on the basis of the price the security would command in order to provide a yield-to-maturity equivalent to the present yield of comparable debt instruments of similar quality. Issuers whose debt securities are judged to be of poor quality and doubtful collectability may instead be valued by assigning percentage discounts commensurate with the quality of such debt securities. Debt securities may also be valued based on the resulting value from the sale of the business at the estimated fair market value.
Partnership interests, preferred equity and common equity,
including unrestricted marketable securities, are valued at the closing sale price for the NYSE listed securities and the lower of the closing bid price or the last sale price for NASDAQ securities on the valuation date. For those without a principal market, our Board of Directors considers the financial condition and operating results of the issuer; the long-term potential of the business of the issuer; the market for and recent sales prices of the issuer’s securities; the values of similar securities issued by companies in similar businesses; and the proportion of the issuer’s securities owned by the Company. Investments in certain entities that calculate net asset value per share (or its equivalent) and for which fair market value is not readily determinable are valued using the net asset value per share (or its equivalent, such as member units or ownership interest in partners’ capital to which a proportionate share of net assets is attributed) of the investment.
Equity warrants are valued on the basis of the Black-Scholes model which defines the market value of a warrant in relation to the market price of its common stock, share price volatility, and time to maturity.
|
(d)
|
Agreements between certain issuers and the Company
|
Agreements between certain issuers and the Company provide that the issuer will bear substantially all costs in connection with the Company disposing such common stock, including those costs involved in registration under the Securities Act of 1933, but excluding underwriting discounts and commissions. These agreements cover common stock owned at March 31, 2014 and common stock which may be acquired thereafter through the exercise of warrants and conversion of debentures and preferred stock. They apply to restricted securities of all issuers in the investment portfolio of the Company except securities of the following issuers which are not obligated to bear registration costs: Humac Company and The Whitmore Manufacturing Company.
|
(e)
|
Descriptions and ownership percentages
|
The descriptions of the companies and ownership percentages shown in the Consolidated Schedule of Investments were obtained from published reports and other sources believed to be reliable. Acquisition dates indicated are the dates specific securities were acquired, which may differ from the original investment dates. Certain securities were received in exchange for or upon conversion or exercise of other securities previously acquired.
Notes to Consolidated Financial Statements
| 1. | ORGANIZATION AND BASIS OF PRESENTATION |
Organization
Capital Southwest Corporation (“CSWC”) is a publicly traded investment company whose objective is to achieve capital appreciation through long-term investments in privately held businesses. Our investment interests are focused on acquisitions and investments in a broad range of industry segments. We were organized as a Texas corporation on April 19, 1961. Until September 1969, CSWC operated as a licensee under the Small Business Investment Act of 1958. At that time, we transferred to our wholly-owned subsidiary, Capital Southwest Venture Corporation ("CSVC"), certain assets and our license as a small business investment company ("SBIC"). CSVC is a closed-end, non-diversified investment company registered under the Investment Company Act of 1940, as amended (the “1940 Act”). Prior to March 30, 1988, CSWC was registered as a closed-end, non-diversified investment company under the 1940 Act. On that date, CSWC elected to become a Business Development Company (“BDC”) subject to the provisions of the 1940 Act, as amended by the Small Business Incentive Act of 1980. Because CSWC wholly owns CSVC, the portfolios of both CSWC and CSVC are referred to collectively as “our,” “we” and “us.” Capital Southwest Management Company (“CSMC”), a wholly-owned subsidiary of CSWC, is the management company for CSWC and CSVC. CSMC generally incurs all normal operating and administrative expenses, including, but not limited to, salaries and related benefits, rent, equipment and other administrative costs required for its day-to-day operations.
Our portfolio consists of private companies in which we have controlling interests, private companies in which we have minority interests and marketable securities of publicly traded companies. We make available significant managerial assistance to the companies in which we invest and believe that providing managerial assistance to such investee companies is critical to their business development activities. CSMC receives a monthly fixed fee for management services provided to certain of its control portfolio companies.
Basis of Presentation
The consolidated financial statements have been prepared in accordance with accounting principles generally accepted in the United States of America (GAAP). Under rules and regulations applicable to investment companies, we are precluded from consolidating any entity other than another investment company. An exception to this general principle occurs if the investment company has an investment in an operating company that provides services to the investment company. Accordingly, consolidated financial statements include CSMC, our management company.
On July 15, 2013, a four-for-one split of our common stock was approved by our shareholders. The stock split was payable on August 15, 2013 to shareholders of record at the close of business on July 31, 2013. Our common stock began trading at the split-adjusted price on August 16, 2013. All share numbers and per share amounts presented herein reflect the stock split.
Portfolio Investment Classification
We classify our investments in accordance with the requirements of the 1940 Act. Under the 1940 Act, “Control Investments” are defined as investments in which we own more than 25% of the voting securities or have rights to maintain greater than 50% of the board representation; “Affiliated Investments” are defined as investments in which we own between 5% and 25% of the voting securities; and “Non-Control/Non-Affiliated Investments” are defined as investments that are neither “Control Investments” nor “Affiliated Investments.”
|
2.
|
SUMMARY OF SIGNIFICANT ACCOUNTING POLICIES
|
The following is a summary of significant accounting policies followed in the preparation of the consolidated financial statements of CSWC.
Fair Value Measurements
We adopted FASB ASC Topic 820 on April 1, 2008. ASC Topic 820 (1) creates a single definition of fair value, (2) establishes a framework for measuring fair value, and (3) expands disclosure requirements about items measured at fair value. The Statement applies to both items recognized and reported at fair value in the financial statements and items disclosed at fair value in the notes to the financial statements. The Statement does not change existing accounting rules governing what can or what must be recognized and reported at fair value in our financial statements, or disclosed at fair value in our notes to financial statements. Additionally, ASC Topic 820 does not eliminate practicability exceptions that exist in accounting pronouncements amended by this Statement when measuring fair value.
Fair value is generally determined based on quoted market prices in the active markets for identical assets or liabilities. If quoted market prices are not available, we use valuation techniques that place greater reliance on observable inputs and less reliance on unobservable inputs. Due to the inherent uncertainty in the valuation process, our estimate of fair value may differ materially from the values that would have been used had a ready market for the securities existed. In addition, changes in the market environment, portfolio company performance and other events may occur over the lives of the investments that may cause the gains or losses ultimately realized on these investments to be materially different than the valuations currently assigned. We determine the fair value of each individual investment and record changes in fair value as unrealized appreciation or depreciation.
Pursuant to our internal valuation process, each portfolio company is valued once a quarter. In addition to our internal valuation process, our Board of Directors retains a nationally recognized firm to provide limited scope third party valuation services on certain portfolio investments. Our Board of Directors retained Duff & Phelps to provide limited scope third party valuation services on three investments comprising 57.3% of our net asset value at March 31, 2014.
We believe our investments at March 31, 2014 and March 31, 2013 approximate fair value as of those dates based on the market in which we operate and other conditions in existence at those reporting periods.
Investments
Investments are stated at fair value determined by our Board of Directors as described in Notes to the Consolidated Schedule of Investments and Note 3 below. The average cost method is used in determining cost of investments sold. Investments are recorded on a trade date basis.
Cash and Cash Equivalents
Cash and cash equivalents consist of highly liquid investments with an original maturity of three months or less at the date of purchase. Cash and cash equivalents are carried at cost, which approximates fair value.
Segment Information
We operate and manage our business in a singular segment. As an investment company, we invest in portfolio companies in various industries and geographic areas as presented in the Consolidated Schedule of Investments.
Use of Estimates
The preparation of financial statements in conformity with GAAP requires management to make estimates and assumptions that affect amounts reported in the financial statements and accompanying notes. Actual results could differ from those estimates.
Interest and Dividend Income
Interest and dividend income is recorded on an accrual basis to the extent amounts are expected to be collected. Dividend income is recorded at the ex-dividend date for marketable securities and restricted securities. In accordance with our valuation policy, accrued interest and dividend income is evaluated periodically for collectability. When we do not expect the debtor to be able to service all of its debt or other obligations, we will generally establish a reserve against interest income, thereby placing the loan or debt security’s status on non-accrual basis, and cease to recognize interest income on that loan or debt security until the borrower has demonstrated the ability and intent to pay contractual amounts due. If a loan or debt security’s status significantly improves regarding ability to service debt or other obligations, it will be restored to accrual basis.
Federal Income Taxes
CSWC and CSVC have elected and intend to comply with the requirements of the Internal Revenue Code (“IRC”) necessary to qualify as regulated investment companies (“RICs”). By meeting these requirements, they will not be subject to corporate federal income taxes on ordinary income distributed to shareholders. In order to comply as a RIC, each company is required to timely distribute to its shareholders at least 90% of investment company taxable income, as defined by the IRC, each year. Investment company taxable income generally differs from net income for financial reporting purposes due to temporary and permanent differences in the recognition of income and expenses. Investment company taxable income generally excludes net unrealized appreciation or depreciation, as investment gains and losses are not included in investment company taxable income until they are realized.
In addition to the requirement that we must annually distribute at least 90% of our investment company taxable income, we may either distribute or retain our realized net capital gains from investments, but any net capital gains not distributed may be subject to corporate level tax. During the twelve months ended March 31, 2014, we did not distribute any capital gain dividends to our shareholders. When we retain the capital gains, they are classified as a “deemed distribution” to our shareholders and are subject to our corporate tax rate of 35%. During the twelve months ended March 31, 2013, we distributed capital gains dividends in the amount of $5.09 per share to our shareholders. As an investment company that qualifies as a RIC under the IRC, federal income taxes payable on security gains that we elect to retain are accrued only on the last day of our tax year, December 31. Any capital gains actually distributed to shareholders are generally taxable to the shareholders as long-term capital gains. See Note 4 for further discussion.
CSMC, a wholly owned subsidiary of CSWC, is not a RIC and is required to pay taxes at the current corporate rate of 35%.
We account for interest and penalties as part of operating expenses. There were no interest or penalties incurred during the years ended March 31, 2014, 2013 and 2012.
Deferred Taxes
CSMC sponsors a qualified defined benefit pension plan which covers its employees and employees of certain wholly owned portfolio companies. In addition, CSMC records phantom stock options and bonus accruals on a quarterly basis. Deferred taxes related to the qualified defined pension plan, phantom stock options and bonus accruals are recorded as incurred.
Stock-Based Compensation
We account for our stock-based compensation using the fair value method, as prescribed by ASC 718,
Compensation – Stock Compensation
. Accordingly, we recognize stock-based compensation cost over the straight-line method for all share-based payments awards granted to employees. The fair value of stock options are determined on the date of grant using the Black-Scholes pricing model and are expensed over the vesting period of the related stock options. For restricted stock awards, we measured the grant date fair value based upon the market price of our common stock on the date of the grant and will amortize this fair value to shared-based compensation expense over the vesting term. For phantom stock options, the option value of phantom stock awards is calculated based on the net asset value of our Corporation. We value the plan each quarter and either increase or decrease the liability based on the phantom option value. See Note 6 for further discussion.
Defined Pension Benefits and Other Postretirement Plans
We record annual amounts relating to the defined benefit pension plan based on calculations, which include various actuarial assumptions such as discount rates and assumed rates of return depending on the pension plan. Material changes in pension costs could occur due to changes in the discount rate, changes in the expected long-term rate of return, changes in mortality table, changes in level of contributions to the plans and other factors. The funded status is the difference between the fair value of plan assets and the benefit obligation. We recognize changes in the funded status of the defined benefit plan in the Statement of Assets and Liabilities in the year in which the changes occur and measure defined benefit plan assets and obligations as of the date of the employer’s fiscal year-end. We presently use March 31 as the measurement date for our defined benefit plan.
Concentration of Risk
We place our idle cash in financial institutions, and at times, such balances may be in excess of the federally insured limits.
|
3.
|
INVESTMENTS
|
We record our investments at fair value as determined in good faith by our Board of Directors in accordance with GAAP. When available, we base the fair value of our investments on directly observable market prices or on market data derived for comparable assets. For all other investments, inputs used to measure fair value reflect management’s best estimate of assumptions that would be used by market participants in pricing the investments in a hypothetical transaction.
The levels of fair value inputs used to measure our investments are characterized in accordance with the fair value hierarchy established by ASC. We use judgment and consider factors specific to the investment in determining the significance of an input to a fair value measurement. While management believes our valuation methodologies are appropriate and consistent with market participants, the use of different methodologies or assumptions to determine the fair value of certain financial instruments could result in a different estimate of fair value at the reporting date. The three levels of the fair value hierarchy and investments that fall into each of the levels are described below:
| · | Level 1: Investments whose values are based on unadjusted quoted prices in active markets for identical assets or liabilities that we have the ability to access. We use Level 1 inputs for publicly traded unrestricted securities. Such investments are valued at the closing price for NYSE listed securities and at the lower of the closing bid price or the closing sale price for NASDAQ securities on the valuation date. |
| · | Level 2: Investments whose values are based on observable inputs other than quoted prices included in Level 1 that are observable for the asset or liability, either directly or indirectly. These inputs may include quoted prices for the identical instrument in non-active markets, quoted prices for similar instruments in active markets and similar data. We did not value any of our investments using Level 2 inputs as of March 31, 2014 and 2013. |
| · | Level 3: Investments whose values are based on prices or valuation techniques that require inputs that are both unobservable and significant to the overall fair value measurement. These inputs reflect management’s own assumptions about the assumptions a market participant would use in pricing the investment. We used Level 3 inputs for measuring the fair value of approximately 67.5% of our investments as of March 31, 2014. See “Notes to Consolidated Schedule of Investments” (c) on page 47 for the investment policy used to determine the fair value of these investments. |
As required by ASC 820, when the inputs used to measure fair value fall within different levels of the hierarchy, the level within the fair value measurement is categorized based on the lowest level input that is significant to the fair value measurement which may include inputs that are observable (Levels 1 and 2) and unobservable (Level 3). Therefore, gains and losses for such investments categorized within the Level 3 table below may include changes in fair value that are attributable to both observable inputs (Levels 1 and 2) and unobservable (Level 3). We conduct reviews of fair value hierarchy classifications on a quarterly basis. Changes in the observability of valuation inputs may result in a reclassification of certain investments.
Unobservable inputs are those inputs for which little or no market data exists and, therefore, require an entity to develop its own assumptions. The fair value determination of each portfolio company requires one or more of the following unobservable inputs:
| · | Financial information obtained from each portfolio company, including audited and unaudited statements of operations and balance sheets for the most recent period available as compared to budgeted numbers; |
| · | Current and projected financial condition of the portfolio company; |
| · | Current and projected ability of the portfolio company to service its debt obligations; |
| · | Projected operating results of the portfolio company; |
| · | Current information regarding any offers to purchase the investment or recent private sales transactions; |
| · | Current ability of the portfolio company to raise any additional financing as needed; |
| · | Change in the economic environment which may have a material impact on the operating results of the portfolio company; |
| · | Qualitative assessment of key management; |
| · | Contractual rights, obligations or restrictions associated with the investment; and |
| · | Other factors deemed relevant. |
Preferred Stock and Common Stock
The significant unobservable inputs used in the fair value measurement of our equity securities are EBITDA multiples, revenue multiples, net book values, tangible book value multiples, and the weighted average costs of capital (“WACC”). Generally, increases or decreases in EBITDA or revenue multiple inputs result in a higher or lower fair value measurement, respectively. Generally, increases or decreases in WACC result in a lower or higher fair value measurement, respectively. However, due to the nature of certain investments, fair value measurements may be based on other criteria, such as third party-appraisals. For recent investments, we generally rely on our cost basis to determine the fair value unless fair value is deemed to have departed from this level.
Debt Securities
The significant unobservable inputs used in the fair value measurement of our debt securities are risk adjusted discount factors used in the yield valuation technique and probability of principal recovery. A significant increase or decrease in any of these valuation inputs in isolation would result in a significantly lower or higher fair value measurement. However, due to the nature of certain investments, fair value measurements may be based on other criteria, such as third party inputs.
Limited Partnership or Limited Liability Company Interests
For recent investments, we generally evaluate limited partnership or limited liability company interests at cost, which is deemed to represent market value, unless or until there is substantive evidence that cost does not correspond to fair value. Thereafter, these securities are generally valued at our percentage interest of the fund or company’s calculated net asset value, unless there is substantive evidence that the net asset value does not correspond to fair value. All investments of each fund are valued by each fund in accordance with ASC 820.
The table below presents the valuation technique and quantitative information about the significant unobservable inputs utilized by the Company to value our Level 3 investments as of March 31, 2014 and March 31, 2013. Unobservable inputs are those inputs for which little or no market data exists and therefore require an entity to develop its own assumptions. The table is not intended to be all inclusive, but instead captures the significant unobservable inputs relevant to our determination of fair value
|
Type
|
Valuation Technique
|
Fair Value at 3/31/2014 (in millions)
|
Unobservable Input
|
Range
|
Weighted Average
|
|||||||||
|
Preferred & Common Equity
|
Market Approach
|
$
|
404.1
|
EBITDA Multiple
|
3.50x – 7.78
|
x
|
7.00
|
x
|
||||||
|
|
Market Approach
|
$
|
22.0
|
Revenue Multiple
|
1.53x – 2.50
|
x
|
2.46
|
x
|
||||||
|
|
Market Approach
|
$
|
8.0
|
Recent Transaction Price
|
NA
|
NA
|
||||||||
|
|
Market Approach
|
$
|
7.6
|
Cash and Asset Value
|
NA
|
NA
|
||||||||
|
Market Approach
|
$
|
3.8
|
Multiple of Tangible Book Value
|
1.54
|
x
|
1.54
|
x
|
|||||||
|
|
Market Approach
|
$
|
0.2
|
Market Value of Held Securities
|
NA
|
NA
|
||||||||
|
|
|
$
|
445.7
|
|
||||||||||
|
Debt
|
Discounted Cash Flow
|
$
|
1.5
|
Discount Rate
|
11.69
|
%
|
11.69
|
%
|
||||||
|
|
Recent Transaction Price
|
$
|
1.2
|
Recent Transaction Price
|
NA
|
NA
|
||||||||
|
Partnership Interests
|
|
$
|
2.7
|
|
||||||||||
|
|
Net Asset Value
|
$
|
9.5
|
Fund Value
|
NA
|
NA
|
||||||||
|
|
Total
|
$
|
457.9
|
|
||||||||||
|
Type
|
Valuation Technique
|
Fair Value at 3/31/2013 (in millions)
|
Unobservable Input
|
Range
|
Weighted Average
|
|||||||||
|
Preferred & Common Equity
|
Market Approach
|
$
|
342.2
|
EBITDA Multiple
|
3.25x – 7.00
|
x
|
6.45
|
x
|
||||||
|
|
Market Approach
|
$
|
11.1
|
Revenue Multiple
|
0.25x – 1.82
|
x
|
0.97
|
x
|
||||||
|
|
Market Approach
|
$
|
7.9
|
Cash and Asset Value
|
NA
|
NA
|
||||||||
|
|
Discounted Cash Flow
|
$
|
0.7
|
Discount Rate
|
1.75
|
%
|
1.75
|
%
|
||||||
|
|
Market Approach
|
$
|
3.0
|
Multiple of Tangible Book Value
|
1.22
|
x
|
1.22
|
x
|
||||||
|
|
Market Approach
|
$
|
22.6
|
Recent Transaction Price
|
NA
|
NA
|
||||||||
|
|
Market Approach
|
$
|
0.2
|
Market Value of Held Securities
|
NA
|
NA
|
||||||||
|
|
|
$
|
387.7
|
|
||||||||||
|
Debt
|
Discounted Cash Flow
|
$
|
3.1
|
Discount Rate
|
10.02% -12.00
|
%
|
10.77
|
%
|
||||||
|
|
Recent Transaction Price
|
$
|
3.5
|
Recent Transaction Price
|
NA
|
NA
|
||||||||
|
|
|
$
|
6.6
|
|
||||||||||
|
Partnership Interests
|
Net Asset Value
|
$
|
12.2
|
Fund Value
|
NA
|
NA
|
||||||||
|
|
Total
|
$
|
406.5
|
|
6.45
|
x
|
||||||||
As of March 31, 2014 and 2013, 67.5% and 70.8%, respectively, of our portfolio investments were categorized as Level 3.
The following fair value hierarchy tables set forth our investment portfolio by level as of March 31, 2014 and March 31, 2013 (in millions):
|
|
|
Fair Value Measurements
at 3/31/14 Using
|
||||||||||||||
|
Asset Category
|
Total
|
Quoted Prices in Active Markets for Identical Assets
(Level 1)
|
Significant Other Observable Inputs
(Level 2)
|
Significant Unobservable Inputs
(Level 3)
|
||||||||||||
|
Debt
|
$
|
2.7
|
$
|
−
|
$
|
−
|
$
|
2.7
|
||||||||
|
Partnership Interests
|
9.5
|
−
|
−
|
9.5
|
||||||||||||
|
Preferred Equity
|
47.0
|
−
|
−
|
47.0
|
||||||||||||
|
Common Equity
|
618.7
|
220.0
|
−
|
398.7
|
||||||||||||
|
Total Investments
|
$
|
677.9
|
$
|
220.0
|
$
|
−
|
$
|
457.9
|
||||||||
|
|
|
Fair Value Measurements
at 3/31/13 Using
|
||||||||||||||
|
Asset Category
|
Total
|
Quoted Prices in Active Markets for Identical Assets
(Level 1)
|
Significant Other Observable Inputs
(Level 2)
|
Significant Unobservable Inputs
(Level 3)
|
||||||||||||
|
Debt
|
$
|
6.6
|
$
|
−
|
$
|
−
|
$
|
6.6
|
||||||||
|
Partnership Interests
|
12.2
|
−
|
−
|
12.2
|
||||||||||||
|
Preferred Equity
|
44.6
|
−
|
−
|
44.6
|
||||||||||||
|
Common Equity
|
510.8
|
167.7
|
−
|
343.1
|
||||||||||||
|
Total Investments
|
$
|
574.2
|
$
|
167.7
|
$
|
−
|
$
|
406.5
|
||||||||
Changes in Fair Value Levels
We monitor the availability of observable market data to assess the appropriate classification of financial instruments within the fair value hierarchy. Changes in economic conditions or model based valuation techniques may require the transfer of financial instruments from one fair value to another.
During the fiscal year ended 2014, we received a distribution of 108,105 shares of Capitala Finance Corporation (CPTA), a publicly traded NASDAQ stock, which represented 71% of our interest in Capital South Partners Fund III, L.P. As a result of this distribution, we transferred $1.4 million in securities from Level 3 to Level 1 under the fair value hierarchy of ASC 820.
The following table provides a summary of changes in the fair value of investments measured using Level 3 inputs during the years ended March 31, 2014 and 2013 (in millions):
|
|
Fair Value 3/31/13
|
Net Unrealized Appreciation (Depreciation)
|
New Investments
|
Divestitures
|
Conversion of Security from Debt to Equity
|
Transfer out of Level 3
|
Fair Value at 3/31/14
|
|||||||||||||||||||||
|
Debt
|
$
|
6.6
|
$
|
(5.3
|
)
|
$
|
1.7
|
$
|
( 1.9
|
)
|
$
|
1.6
|
$
|
−
|
$
|
2.7
|
||||||||||||
|
Partnership Interests
|
12.2
|
(2.6
|
)
|
1.3
|
−
|
−
|
(1.4
|
)
|
9.5
|
|||||||||||||||||||
|
Preferred Equity
|
44.6
|
(4.8
|
)
|
8.0
|
(0.8
|
)
|
−
|
−
|
47.0
|
|||||||||||||||||||
|
Common Equity
|
343.1
|
55.6
|
−
|
−
|
−
|
−
|
398.7
|
|||||||||||||||||||||
|
Total Investments
|
$
|
406.5
|
$
|
42.9
|
$
|
11.0
|
$
|
(2.7
|
)
|
$
|
1.6
|
$
|
(1.4
|
)
|
$
|
457.9
|
||||||||||||
|
|
Fair Value 3/31/12
|
Net Unrealized Appreciation (Depreciation)
|
New Investments
|
Divestitures
|
Net Changes from Unrealized to Realized
|
Conversion of Security from Debt to Equity
|
Transfer out of Level 3
|
Fair Value at 3/31/13
|
||||||||||||||||||||||||
|
Debt
|
$
|
11.2
|
$
|
(5.4
|
)
|
$
|
4.0
|
$
|
−
|
$
|
−
|
$
|
(3.2
|
)
|
$
|
−
|
$
|
6.6
|
||||||||||||||
|
Partnership Interests
|
11.0
|
1.5
|
0.5
|
−
|
(0.8
|
)
|
−
|
−
|
12.2
|
|||||||||||||||||||||||
|
Preferred Equity
|
33.9
|
12.3
|
−
|
(9.8
|
)
|
5
|
3.2
|
−
|
44.6
|
|||||||||||||||||||||||
|
Common Equity
|
261.7
|
82.1
|
−
|
−
|
(0.7
|
)
|
−
|
−
|
343.1
|
|||||||||||||||||||||||
|
Total Investments
|
$
|
317.8
|
$
|
90.5
|
$
|
4.5
|
$
|
(9.8
|
)
|
$
|
3.5
|
$
|
−
|
$
|
−
|
$
|
406.5
|
|||||||||||||||
|
4.
|
INCOME TAXES
|
We operate to qualify as a RIC under Subchapter M of the IRC and have a calendar tax year end of December 31. In order to qualify as a RIC, we must annually distribute at least 90% of our investment company taxable ordinary income, based on our tax year, to our shareholders in a timely manner. Investment company ordinary income includes net short-term capital gains but excludes net long-term capital gains. A RIC is not subject to federal income tax on the portion of its ordinary income and long-term capital gains that are distributed to its shareholders, including “deemed distributions” discussed below. As permitted by the Code, a RIC can designate dividends paid in the subsequent tax year as dividends of current year ordinary income and net long-term gains if those dividends are both declared by the extended due date of the RIC’s federal income tax return and paid to shareholders by the last day of the subsequent tax year.
We have distributed or intend to distribute sufficient dividends to eliminate taxable income for our completed tax years. If we fail to satisfy the 90% distribution requirement or otherwise fail to qualify as a RIC in any tax year, we would be subject to tax in such year on all of our taxable income, regardless of whether we made any distributions to our shareholders. For the tax years ended December 31, 2013 and 2012, we declared and paid ordinary dividends in the amounts of $3,049,614 and $3,025,032, respectively.
Additionally, we are subject to a nondeductible federal excise tax of 4% if we do not distribute at least 98% of our investment company ordinary taxable income before the end of our tax year. For the tax years ended December 31, 2013 and 2012, we distributed 100% of our investment company ordinary taxable income. As a result, we have made no tax provisions for income taxes on ordinary taxable income for the tax years ended December 31, 2013 and 2012.
A RIC may elect to retain its long-term capital gains by designating them as “deemed distribution” to its shareholders and paying a federal tax rate of 35% on the long-term capital gains for the benefit of its shareholders. Shareholders then report their share of the retained capital gains on their income tax returns as if it had been received and report a tax credit for tax paid on their behalf by the RIC. Shareholders then add the amount of the “deemed distribution” net of such tax, to the basis of their shares.
During our tax year ended December 31, 2013, we sold 9,317,310 shares of common stock of Heelys, Inc. to Sequential Brands Group, Inc. and generated cash proceeds of $20,963,948 and a capital gain of $20,861,458. Subsequently, we distributed and paid $0.69 per share or $10,474,932 of Heely’s gain to our shareholders on March 28, 2013. For the tax year ended December 31, 2013, we had net long-term capital gains of $10,819,079 for tax purposes and $10,491,526 for book purposes, which we elected to retain and treat as deemed distributions to our shareholders.
During the tax year ended December 31, 2012, we distributed capital gains dividends in the amount of $4.40 per share or $66,825,782 to our shareholders; we also had net long-term capital gains of $3,214,547 for tax purposes and $2,319,012 for book purposes, which we elected to retain and treat as deemed distributions to our shareholders.
In order to make the election to retain capital gains, we incurred federal taxes on behalf of our shareholders in the amount of $3,786,678 for the tax year ended December 31, 2013. For the tax year ended December 31, 2012, we incurred federal taxes on behalf of our shareholders in the amount of $1,125,092.
The following table sets forth a summary of our net realized gains on transactions by category:
|
For the Tax Year Ended December 31
|
||||||||
|
Net Realized Gains on Transactions In Investment Securities of
|
2013
|
2012
|
||||||
|
Control Investments
|
$
|
20,861,458
|
$
|
−
|
||||
|
Affiliated Investments
|
−
|
66,037,485
|
||||||
|
Non-Control/Non-Affiliated Investments
|
105,000
|
3,107,309
|
||||||
|
Net realized gain on investments
|
$
|
20,966,458
|
$
|
69,144,794
|
||||
|
Capital gain distribution
|
(10,474,932
|
)
|
(66,825,782
|
)
|
||||
|
Taxes incurred on deemed capital gain distribution
|
3,786,678
|
1,125,092
|
||||||
|
Net realized gains on investments(after tax)
|
$
|
6,704,848
|
$
|
1,193,920
|
||||
|
Net realized gains on investment (for tax purposes; after tax)
|
$
|
7,032,401
|
$
|
3,214,547
|
||||
For the years ended March 31, 2014, 2013 and 2012, CSWC and CSVC qualified to be taxed as RICs. We intend to continue meet the applicable qualifications to be taxed as a RIC. However, either company’s ability to meet certain portfolio diversification requirements of RICs in future years may not be controllable by such company.
CSMC, a wholly owned subsidiary of CSWC, is not a RIC and is required to pay taxes at the current corporate rate. CSMC sponsors a qualified defined benefit pension plan which covers its employees and employees of certain wholly owned portfolio companies. In addition, CSMC records phantom stock option and bonus accruals on a quarterly basis. Deferred taxes related to the qualified defined benefit pension plan and phantom stock option and bonus accruals are recorded as incurred. As of March 31, 2014, CSMC has a net deferred tax liability of $1,940,009.
|
5.
|
ACCUMULATED NET REALIZED GAINS (LOSSES) ON INVESTMENTS
|
Distributions made by RICs often differ from aggregate GAAP-basis undistributed net investment income and accumulated net realized gains (total GAAP-basis net realized gains). The principal cause is that required minimum fund distributions are based on income and gain amounts determined in accordance with federal income tax regulations, rather than GAAP. The differences created can be temporary, meaning that they will reverse in the future, or they can be permanent. In subsequent periods, when all or a portion of a temporary difference becomes a permanent difference, the amount of the permanent difference will be reclassified to “additional capital.”
We incur federal taxes on behalf of our shareholders as a result of our election to retain long-term capital gains. During the twelve months ended March 31, 2014, we did not make any capital gain distributions. During the twelve months ended March 31, 2013, we distributed capital gains dividends in the amount of $5.09 per share to our shareholders. As of March 31, 2014 we had accumulated long-term capital gains of $14,084,087. As of March 31, 2013 we had accumulated long-term capital gains of $10,436,526.
|
6.
|
EMPLOYEE STOCK BASED COMPENSATION PLANS
|
On July 15, 2013, a four-for-one split of our common stock was approved by our shareholders. The stock split was payable on August 15, 2013 to shareholders of record at the close of business on July 31, 2013. Our common stock began trading at the split-adjusted price on August 16, 2013. All share numbers and per share amounts presented herein reflect the stock split.
Stock Options
On July 20, 2009, shareholders approved our 2009 Stock Incentive Plan (the “2009 Plan”), which provides for the granting of stock options to employees and officers and authorizes the issuance of common stock upon exercise of such options for up to 560,000 shares. All options are granted at or above market price, generally expire up to 10 years from the date of grant and are generally exercisable on or after the first anniversary of the date of grant in five annual installments. Options to purchase 155,000 shares at a price of $19.19 per share (market price at the time of grant) were granted on October 19, 2009. Additionally, options to purchase 80,000 shares at a price of $23.95 per share (market price at time of grant) were granted on March 22, 2010, options to purchase 60,000 shares at a price of $22.05 per share were granted on July 19, 2010 and options to purchase 40,000 shares at a price of $24.23 per share were granted on July 18, 2011. During the twelve months ended March 31, 2014, options to purchase 30,000 shares at a price of $37.02 per share (market price at the time of grant) were granted on July 15, 2013. Also, options to purchase 25,000 share at a price of $33.52 and 30,000 shares at a price of $34.91 were granted on January 20, 2014 and March 17, 2014, respectively. Additionally, 69,108 options were exercised and 63,000 options were forfeited during the twelve months ended March 31, 2014 and thus leaving 123,800 options outstanding and 259,000 options available to grant under the 2009 Plan as of March 31, 2014.
We previously granted stock options under our 1999 Stock Option Plan (the “1999 Plan”), as approved by shareholders on July 19, 1999. The 1999 Plan expired on April 19, 2009. Options previously made under our 1999 Stock Option Plan and outstanding on July 20, 2009 continue in effect governed by provisions of the 1999 Plan. All options granted under the 1999 Plan were granted at or above market price, generally expire up to 10 years from the date of grant and are generally exercisable on or after the first anniversary of the date of grant in five to ten annual installments. During the twelve months ended March 31, 2014, 108,000 options were exercised and 100,000 options were forfeited, thus leaving 38,000 options outstanding under the 1999 Plan.
We recognize compensation cost over the straight-line method for all share-based payments granted on or after that date and for all awards granted to employees prior to April 1, 2006 that remain unvested on that date. The fair value of stock options are determined on the date of grant using the Black-Scholes pricing model and are expensed over the vesting period of the related stock options. Share-based compensation cost for stock options is measured based on the closing fair market value of our Company’s common stock on the date of the grant. Accordingly, for the years ended March 31, 2014, 2013 and 2012, we recognized stock option compensation (benefit)/expense of $(732,530), $405,945 and $1,009,922 respectively. Changes in stock option compensation expense for 2014 versus 2013 is due to forfeitures of unexercised stock options that occurred with the departures of employees during the year ended March 31, 2014.
As of March 31, 2014, the total remaining unrecognized compensation cost related to non-vested stock options was $879,967, which will be amortized over the weighted-average service period of approximately 2.9 years.
The following table summarizes the 2009 Plan and the 1999 Plan price per option at grant date using the Black-Scholes pricing model:
|
|
|
Black-Scholes Pricing Model Assumptions
|
|
|||||||||||||||||
|
Date of Issuance
|
Weighted Average Fair Value
|
Expected Dividend Yield
|
Risk-Free Interest Rate
|
Expected Volatility
|
Expected Life (in years)
|
|||||||||||||||
|
2009 Plan
|
|
|
|
|
|
|||||||||||||||
|
July 18, 2011
|
$
|
8.27
|
0.83
|
%
|
1.45
|
%
|
40.0
|
%
|
5
|
|||||||||||
|
July 19, 2010
|
$
|
7.15
|
0.91
|
%
|
1.73
|
%
|
37.5
|
%
|
5
|
|||||||||||
|
March 22, 2010
|
$
|
8.14
|
0.84
|
%
|
2.43
|
%
|
37.8
|
%
|
5
|
|||||||||||
|
October 19, 2009
|
$
|
6.34
|
1.04
|
%
|
2.36
|
%
|
37.6
|
%
|
5
|
|||||||||||
|
July 15, 2013
|
$
|
11.82
|
0.54
|
%
|
1.40
|
%
|
36.1
|
%
|
5
|
|||||||||||
|
January 20, 2014
|
$
|
8.37
|
0.60
|
%
|
1.64
|
%
|
27.0
|
%
|
5
|
|||||||||||
|
March 17, 2014
|
$
|
7.04
|
0.57
|
%
|
1.58
|
%
|
21.1
|
%
|
5
|
|||||||||||
|
|
||||||||||||||||||||
|
1999 Plan
|
||||||||||||||||||||
|
July 30, 2008
|
$
|
7.48
|
0.62
|
%
|
3.36
|
%
|
20.2
|
%
|
5
|
|||||||||||
|
July 21, 2008
|
$
|
6.84
|
0.67
|
%
|
3.41
|
%
|
20.2
|
%
|
5
|
|||||||||||
|
July 16, 2007
|
$
|
10.44
|
0.39
|
%
|
4.95
|
%
|
19.9
|
%
|
5
|
|||||||||||
|
July 17, 2006
|
$
|
8.26
|
0.61
|
%
|
5.04
|
%
|
21.2
|
%
|
7
|
|||||||||||
|
May 15, 2006
|
$
|
7.82
|
0.64
|
%
|
5.08
|
%
|
21.1
|
%
|
7
|
|||||||||||
The following table summarizes activity in the 2009 Plan and the 1999 Plan as of March 31, 2014:
|
|
Number of Shares
|
Weighted Average Exercise Price
|
||||||
|
2009 Plan
|
|
|
||||||
|
Balance at March 31, 2012
|
335,000
|
21.44
|
||||||
|
Granted
|
–
|
–
|
||||||
|
Exercised
|
(108,092
|
)
|
19.96
|
|||||
|
Canceled/Forfeited
|
(56,000
|
)
|
21.44
|
|||||
|
Balance at March 31, 2013
|
170,908
|
22.37
|
||||||
|
Granted
|
85,000
|
35.25
|
||||||
|
Exercised
|
(69,108
|
)
|
22.27
|
|||||
|
Canceled/Forfeited
|
(63,000
|
)
|
22.08
|
|||||
|
Balance at March 31, 2014
|
123,800
|
$
|
31.40
|
|||||
|
|
||||||||
|
1999 Plan
|
||||||||
|
Balance at March 31, 2012
|
380,000
|
28.41
|
||||||
|
Granted
|
–
|
–
|
||||||
|
Exercised
|
(76,420
|
)
|
23.83
|
|||||
|
Canceled/Forfeited
|
(57,580
|
)
|
27.79
|
|||||
|
Balance at March 31, 2013
|
246,000
|
33.00
|
||||||
|
Granted
|
–
|
–
|
||||||
|
Exercised
|
(108,000
|
)
|
30.37
|
|||||
|
Canceled/Forfeited
|
(100,000
|
)
|
38.25
|
|||||
|
Balance at March 31, 2014
|
38,000
|
$
|
26.68
|
|||||
|
Combined Balance at March 31, 2014
|
161,800
|
$
|
30.29
|
|||||
|
March 31, 2014
|
Weighted Average
Aggregate Intrinsic
Remaining Contractual Term
|
Value | |||
|
Outstanding
|
2.9 years
|
$
|
1,307,329
|
||
|
Exercisable
|
0.5 years
|
$
|
347,711
|
||
At March 31, 2014, the range of exercise prices was $19.19 to $37.02 and the weighted-average remaining contractual life of outstanding options was 2.9 years. The total number of options exercisable under both the 2009 Plan and the 1999 Plan at March 31, 2014, was 46,800 shares with a weighted-average exercise price of $26.00. During the year ended March 31, 2014, 177,108 options were exercised with an average exercise price of $27.21.
At March 31, 2013, the range of exercise prices and weighted-average remaining contractual life of outstanding options was $19.19 to $38.25 and 1.2 years, respectively. The total number of options exercisable under both the 2009 Plan and the 1999 Plan at March 31, 2013, was 252,908 shares with a weighted-average exercise price of $32.12. During the year ended March 31, 2013, 184,512 options were exercised with exercise price at $21.57 per share.
At March 31, 2012, the range of exercise prices and weighted-average remaining contractual life of outstanding options was $19.19 to $38.25 and 2.5 years, respectively. The number of options exercisable under the 2009 Plan and the 1999 Plan, at March 31, 2012, was 350,360 with a weighted-average exercise price of $28.06. During the year ended March 31, 2012, 6,000 options were exercised with exercise price at $16.45 per share.
At March 31, 2014, 2013 and 2012, the number of options exercisable was 46,800, 252,908 and 350,360, respectively, and the weighted average price of those options was $26.00, $32.12 and $28.06, respectively.
Stock Awards
Pursuant to the Capital Southwest Corporation 2010 Restricted Stock Award Plan, our Board of Directors reserved for issuance 188,000 shares of restricted stock to certain key employees. A restricted stock award is an award of shares of our common stock (which have full voting and dividend rights but are restricted with regard to sale or transfer), the restrictions on which lapse ratably over a specified period of time (generally five years). Restricted stock awards are independent of stock grants and are subject to forfeiture if employment terminates prior to these restrictions lapsing. These shares vest over a five-year period from the grant date and are expensed over the five-year service period starting on the grant date. On January 16, 2012, the Board of Directors granted 38,600 shares of restricted stock to key employees of the Company. On January 22, 2013, the Board of Directors granted 8,000 shares of restricted stock to officers of the Company. On July 15, 2013, The Board of Directors granted 5,000 shares of restricted stock to a key officer of the Company. On January 20, 2014, the Board of Directors granted 4,800 shares of restricted stock to key employees of the Company. On March 17, 2014, the Board of Directors granted 5,000 shares of restricted stock to a key employee of the Company. During the twelve months ended March 31, 2014, 15,640 shares of restricted stock were forfeited. The following table summarizes the restricted stock available for issuance as of March 31, 2014:
|
Restricted stock available for issuance as of March 31, 2013
|
153,400
|
|||
|
Restricted stock granted during the twelve Months ended March 31, 2014
|
(14,800
|
)
|
||
|
Restricted stock forfeited during the twelve Months ended March 31, 2014
|
15,640
|
|||
|
Restricted stock available for issuance as of
March 31, 2014
|
154,240
|
We expense the cost of the restricted stock awards, which is determined to equal the fair value of the restricted stock award at the date of grant on a straight-line basis over the vesting period. For these purposes, the fair value of the restricted stock award is determined based upon the closing price of our common stock on the date of the grant. For the fiscal years ended March 31, 2014, 2013, and 2012 we recognized total share based compensation expense of $101,022, $109,083 and $40,377, respectively related to the restricted stock issued to our employees and officers.
As of March 31, 2014, the total remaining unrecognized compensation expense related to non-vested restricted stock awards was $692,293, which will be amortized over the weighted-average service period of approximately 4.1 years.
The following table represents a summary of the activity for our restricted stock awards for the twelve months ended March 31, 2014:
|
Restricted Stock Awards
|
Number of Shares
|
Weighted Average Fair Value Per Share
|
Weighted Average Remaining Vesting Term (in Years)
|
|||||||||
|
Unvested at March 31, 2013
|
29,280
|
$
|
22.32
|
4.1
|
||||||||
|
Granted
|
14,800
|
35.17
|
4.7
|
|||||||||
|
Vested
|
(3,760
|
)
|
22.28
|
3.1
|
||||||||
|
Forfeited
|
(15,640
|
)
|
21.90
|
−
|
||||||||
|
Unvested at March 31, 2014
|
24,680
|
$
|
30.30
|
4.1
|
||||||||
Phantom Stock Plan
On January 16, 2012, our Board of Directors approved the issuance of 104,000 phantom stock options at an exercise price of $36.74 (Net Asset Value at December 31, 2011) pursuant to the Capital Southwest Corporation Phantom Stock Option Plan to provide deferred compensation to certain key employees. On January 22, 2013, the Board of Directors granted 16,200 shares of phantom stock options at an exercise price of $41.34 per share (Net Asset Value at December 31, 2012) to officers of the Company. On July 15, 2013, the Board of Directors granted 24,000 shares of phantom stock options at an exercise price of $43.80 per share (Net Asset Value at June 30, 2013) to a key officer of the Company. Additionally, the Board of Directors granted 38,000 shares of phantom stock options at an exercise price of $50.25 per share (Net Asset Value at December 31, 2013) to several key employees of the Company in January 2014 and March 2014. Under the plan, awards vest on the fifth anniversary of the award date. Upon exercise of the phantom option, a cash payment in an amount for each phantom share equal to estimated fair market value minus the phantom option exercise price, adjusted for capital gain dividends declared, will be distributed to plan participants. During the twelve months ended March 31, 2014, a payment in the amount of $520,730 was paid out to a vested employee. At March 31, 2014, our estimated liability for phantom stock options was $673,268. The estimated liability for phantom stock awards was $693,401 as of March 31, 2013.
The following table represents a summary of the activity for our phantom stock plan for the fiscal year ended March 31, 2014:
|
Phantom Stock Awards
|
Number of Shares
|
Weighted Average Grant Price Per Share
|
Weighted Average Remaining Vesting Term (in Years)
|
|||||||||
|
Unvested at March 31, 2013
|
90,200
|
$
|
37.26
|
4.0
|
||||||||
|
Granted
|
62,000
|
47.75
|
4.7
|
|||||||||
|
Vested
|
(28,000
|
)
|
36.74
|
−
|
||||||||
|
Forfeited or expired
|
(29,200
|
)
|
37.87
|
−
|
||||||||
|
Unvested at March 31, 2014
|
95,000
|
$
|
43.59
|
4.1
|
||||||||
|
7.
|
EMPLOYEE STOCK OWNERSHIP PLAN
|
CSWC and certain controlled affiliates sponsor a qualified employee stock ownership plan (“ESOP”) in which certain employees participate. Contributions to the plan, which are invested in our stock, are made at the discretion of our Board of Directors. A participant’s interest in contributions to the ESOP fully vests after three years of active service.
During the 3 years ended March 31, 2014, we made contributions to the ESOP, which were included in operating expenses, of $178,890 in 2014, $190,337 in 2013, and $222,179 in 2012.
| 8. | RETIREMENT PLANS |
CSWC sponsors a qualified defined benefit pension plan which covers its employees and employees of certain of its controlled affiliates. The following information about the plan represents amounts and information related to CSWC’s participation in the plan and is presented as though CSWC sponsored a single-employer plan. Benefits are based on years of service and an average of the highest five consecutive years of compensation during the last 10 years of employment. The funding policy of the plan is to contribute annual amounts that are currently deductible for tax reporting purposes. No contribution was made to the plan during the three years ended March 31, 2014.
Additionally, CSWC sponsors an unfunded Retirement Restoration Plan, which is a nonqualified plan that provides for the payment, upon retirement, of the difference between the maximum annual payment permissible under the qualified retirement plan pursuant to Federal limitations and the amount which would otherwise have been payable under the qualified plan.
The following tables set forth the qualified plan’s net pension benefit, benefit obligation, fair value of plan assets, and amounts recognized in our consolidated statements of operations at March 31, 2014, 2013 and 2012, as well as amounts recognized in our consolidated statements of assets and liabilities at March 31, 2014 and 2013:
|
|
Years Ended March 31,
|
|||||||||||
|
|
2014
|
2013
|
2012
|
|||||||||
|
Net pension benefit
|
|
|
|
|||||||||
|
Service cost-benefits earned during the year
|
$
|
253,837
|
$
|
259,672
|
$
|
133,729
|
||||||
|
Interest cost on projected benefit obligation
|
291,699
|
286,639
|
256,558
|
|||||||||
|
Expected return on assets
|
(906,816
|
)
|
(784,194
|
)
|
(781,299
|
)
|
||||||
|
Net amortization
|
68,813
|
49,803
|
9,377
|
|||||||||
|
Net pension benefit from qualified plan
|
$
|
(292,467
|
)
|
$
|
(188,080
|
)
|
$
|
(381,635
|
)
|
|||
|
|
Years Ended March 31,
|
|||||||||||
|
|
2014
|
2013
|
2012
|
|||||||||
|
Change in benefit obligation
|
|
|
|
|||||||||
|
Benefit obligation at beginning of year
|
$
|
6,421,611
|
$
|
5,136,555
|
$
|
4,213,349
|
||||||
|
Service cost
|
253,837
|
259,672
|
133,729
|
|||||||||
|
Interest cost
|
291,699
|
286,639
|
256,558
|
|||||||||
|
Actuarial gain
|
306,173
|
818,784
|
601,402
|
|||||||||
|
Benefits paid
|
(123,940
|
)
|
(80,039
|
)
|
(68,483
|
)
|
||||||
|
Benefit obligation at end of year
|
$
|
7,149,380
|
$
|
6,421,611
|
$
|
5,136,555
|
||||||
|
|
Years Ended March 31,
|
|||||||||||
|
|
2014
|
2013
|
2012
|
|||||||||
|
Change in plan assets
|
|
|
|
|||||||||
|
Fair value of plan assets at beginning of year
|
$
|
15,183,833
|
$
|
12,485,876
|
$
|
11,610,994
|
||||||
|
Actual return on plan assets
|
3,052,180
|
2,777,996
|
943,365
|
|||||||||
|
Benefits paid
|
(123,940
|
)
|
(80,039
|
)
|
(68,483
|
)
|
||||||
|
Fair value of plan assets at end of year
|
$
|
18,112,073
|
$
|
15,183,833
|
$
|
12,485,876
|
||||||
|
|
Years Ended March 31,
|
|||||||
|
|
2014
|
2013
|
||||||
|
Funded status and amounts recognized in consolidated statements of assets and liabilities
|
|
|
||||||
|
Actuarial present value of benefit obligations: Accumulated benefit obligation
|
$
|
(6,664,221
|
)
|
$
|
(5,636,366
|
)
|
||
|
Projected benefit obligation for service rendered to date
|
(7,149,380
|
)
|
(6,421,611
|
)
|
||||
|
Plan assets at fair value*
|
18,112,073
|
15,183,833
|
||||||
|
Funded status
|
10,962,693
|
8,762,222
|
||||||
|
Unrecognized net (gain)loss
|
(1,296,029
|
)
|
602,598
|
|||||
|
Unrecognized prior service costs
|
113,202
|
122,579
|
||||||
|
ASC 715 adjustment
|
1,182,827
|
(725,177
|
)
|
|||||
|
Prepaid pension cost included in pension assets
|
$
|
10,962,693
|
$
|
8,762,222
|
||||
*I
ncludes approximately 105,773 shares of CSWC Common Stock.
The following tables set forth the retirement restoration plan’s net pension benefit and benefit obligation amounts at March 31, 2014, 2013 and 2012, as well as amounts recognized in our consolidated statements of assets and liabilities at March 31, 2014, 2013:
|
|
Years Ended March 31,
|
|||||||||||
|
|
2014
|
2013
|
2012
|
|||||||||
|
Net pension cost
|
|
|
|
|||||||||
|
Service cost-benefits earned during the year
|
$
|
106,199
|
$
|
37,052
|
$
|
18,163
|
||||||
|
Interest cost on projected benefit obligation
|
197,366
|
106,939
|
79,056
|
|||||||||
|
Net amortization
|
164,649
|
9,731
|
(15,428
|
)
|
||||||||
|
Net pension cost from restoration plan
|
$
|
468,214
|
$
|
153,722
|
$
|
81,791
|
||||||
|
|
Years Ended March 31,
|
|||||||||||
|
|
2014
|
2013
|
2012
|
|||||||||
|
Change in benefit obligation
|
|
|
|
|||||||||
|
Benefit obligation at beginning of year
|
$
|
2,649,966
|
$
|
1,568,392
|
$
|
1,256,895
|
||||||
|
Service cost
|
106,199
|
37,052
|
18,163
|
|||||||||
|
Interest cost
|
197,366
|
106,939
|
79,056
|
|||||||||
|
Actuarial gain
|
149,777
|
810,303
|
214,278
|
|||||||||
|
Other adjustments
|
–
|
127,280
|
–
|
|||||||||
|
Benefit obligation at end of year
|
$
|
3,103,308
|
$
|
2,649,966
|
$
|
1,568,392
|
||||||
|
|
Years Ended March 31
|
|||||||
|
|
2014
|
2013
|
||||||
|
Amounts recognized in our consolidated statements of assets and liabilities
|
|
|
||||||
|
Projected benefit obligation
|
$
|
(3,103,308
|
)
|
$
|
(2,649,966
|
)
|
||
|
Unrecognized net gain
|
805,004
|
836,122
|
||||||
|
Unrecognized prior service costs
|
(106,050
|
)
|
(122,296
|
)
|
||||
|
ASC 715 adjustment
|
(698,954
|
)
|
(713,826
|
)
|
||||
|
Accrued pension cost included in pension liabilities
|
$
|
(3,103,308
|
)
|
$
|
(2,649,966
|
)
|
||
The following assumptions were used in estimating the actuarial present value of the projected benefit obligations:
|
|
Years Ended March 31
|
|||||||||||
|
|
2014
|
2013
|
2012
|
|||||||||
|
Discount rate
|
5.00
|
%
|
4.50
|
%
|
5.25
|
%
|
||||||
|
Rate of compensation increases
|
5.00
|
%
|
5.00
|
%
|
5.00
|
%
|
||||||
The following assumptions were used in estimating the net periodic (income)/expense:
|
|
Years Ended March 31
|
|||||||||||
|
|
2014
|
2013
|
2012
|
|||||||||
|
Discount rate
|
4.50
|
%
|
5.25
|
%
|
5.25
|
%
|
||||||
|
Expected return on plan assets
|
7.00
|
%
|
6.50
|
%
|
6.50
|
%
|
||||||
|
Rate of compensation increases
|
5.00
|
%
|
5.00
|
%
|
5.00
|
%
|
||||||
Following are the expected benefit payments for the next five years and in the aggregate for the years 2020-2024:
|
(In thousands)
|
2015
|
2016
|
2017
|
2018
|
2019
|
2020-2024
|
||||||||||||||||||
|
Qualified Plan
|
$
|
313
|
$
|
317
|
$
|
367
|
$
|
372
|
$
|
379
|
$
|
2,271
|
||||||||||||
|
Restoration Plan
|
$
|
200
|
$
|
199
|
$
|
199
|
$
|
204
|
$
|
207
|
$
|
1,155
|
||||||||||||
During the plan year ended March 31, 2014, the discount rate was changed from 4.50% to 5.00%. In addition, the mortality tables utilized for pension calculation was changed from
RP-2000 Mortality Table to the RP-2014 Employee Mortality Table.
The expected rate of return on assets assumption was determined based on the anticipated performance of the various asset classes in the plan’s portfolio and the allocation of assets to each class. The anticipated asset class return is developed using historical and predicted asset return performance, considering the investments underlying each asset class and expected investment performance based on forecasts of inflation, interest rates and market indices for fixed income and equity securities.
Plan Assets
Our pension plan is administered and managed by the trustees of the plan that has fiduciary responsibility for the plan’s management. All assets are held in the custody of JPMorgan Asset Management. Currently, approximately 20.4% of the assets are selected and managed by JPMorgan Asset Management and the remainder of the assets are managed by the trustees, invested mostly in equity securities, including our stock. The plan assets are invested using a total return approach whereby a mix of equity securities, debt securities and other investments are used to preserve asset values, diversify risk and achieve our targeted investment return benchmark. Investment performance and asset allocation are measured and monitored on an ongoing basis.
Plan assets are managed in a balanced portfolio comprised of two major components: an equity portion and a fixed income portion. The expected role of plan equity investments is to maximize the long-term real growth of the plan’s assets, while the role of fixed income investments is to generate current income, provide for more stable periodic returns and provide some protection against prolonged decline in the market value of the plan’s equity investments.
The current target allocations for plan assets are 60-80% equity, 15-40% for fixed income, and 0-15% for cash and cash equivalents. Equity investments include U.S. and foreign equities, as well as publicly traded and non-publicly traded mutual funds. Fixed income securities include long-duration government obligations, government agency obligations and corporate obligations.
CSWC’s pension plan asset allocations are as follows:
|
|
Percentage of Plan Assets at
March 31
|
|||||||
|
Asset Category
|
2014
|
2013
|
||||||
|
Equity securities
|
83.5
|
%
|
78.8
|
%
|
||||
|
Fixed income securities
|
11.9
|
%
|
14.5
|
%
|
||||
|
Cash and cash equivalents
|
4.6
|
%
|
6.7
|
%
|
||||
|
|
100.0
|
%
|
100.0
|
%
|
||||
Below are the details of the pension plan asset for Capital Southwest Corporation and its affiliates, of which Capital Southwest assets were $18,112,073 and $15,183,833 as of March 31, 2014 and 2013, respectively. The following fair value hierarchy table sets forth our pension plan investment portfolio by level as of March 31, 2014 (in millions):
|
|
|
Fair Value Measurements at Reporting Date Using
|
||||||||||||||
|
Asset Category
|
Total
|
Quoted Prices in Active Markets for Identical Assets Level I
|
Significant Other Observable Inputs Level 2
|
Significant Observable Inputs Level 3
|
||||||||||||
|
Equity securities (a)
|
$
|
50.2
|
$
|
32.7
|
$
|
17.5
|
$
|
–
|
||||||||
|
Fixed income securities (b)
|
7.2
|
–
|
7.2
|
–
|
||||||||||||
|
Cash and cash equivalents
|
2.8
|
2.8
|
–
|
–
|
||||||||||||
|
Total
|
$
|
60.2
|
$
|
35.5
|
$
|
24.7
|
$
|
–
|
||||||||
The following fair value hierarchy table sets forth our pension plan investment portfolio by level as of March 31, 2013 (in millions):
|
|
|
Fair Value Measurements at Reporting Date Using
|
||||||||||||||
|
Asset Category
|
Total
|
Quoted Prices in Active Markets for Identical Assets Level I
|
Significant Other Observable Inputs Level 2
|
Significant Observable Inputs Level 3
|
||||||||||||
|
Equity securities (a)
|
$
|
40.1
|
$
|
26.7
|
$
|
13.4
|
$
|
–
|
||||||||
|
Fixed income securities (b)
|
7.4
|
–
|
7.4
|
–
|
||||||||||||
|
Cash and cash equivalents
|
3.4
|
3.4
|
–
|
–
|
||||||||||||
|
Total
|
$
|
50.9
|
$
|
30.1
|
$
|
20.8
|
$
|
–
|
||||||||
There were no plan assets valued using significant unobservable inputs (level 3) as of March 31, 2014 or 2013.
| (a) | This category includes investment in equity securities of large, medium and small companies and equity investments in foreign companies. Mutual funds included in this category are valued using the net asset value per unit as of the valuation date. These investments include shares of our common stock. At March 31, 2014 and 2013, our common stock represented 20.3% and 19.9% respectively, of the plan assets. |
| (b) | This category includes investments in investment grade fixed income instruments, primarily U.S. government obligations. |
|
9.
|
COMMITMENTS
|
As of March 31, 2014, we had agreed, subject to certain conditions, to invest up to $2,018,774 in five portfolio companies.
We lease office space under an operating lease which requires annual base rentals of approximately $250,000. For the three years ended March 31, 2014, total rental expense was $142,521 in 2014, $141,155 in 2013, and $117,199 in 2012.
|
10.
|
SOURCES OF INCOME
|
|
|
Investment Income
|
Realized Gain (Loss)
on Investments
before Income Taxes
|
||||||||||||||
|
Year Ended
March 31, 2014
|
Interest
|
Dividends
|
Other Income
|
|
||||||||||||
|
Companies more than 25% owned
|
$
|
−
|
$
|
8,650,000
|
$
|
485,267
|
$
|
−
|
||||||||
|
Companies 5% to 25% owned
|
250,811
|
2,575,038
|
48,800
|
−
|
||||||||||||
|
Companies less than 5% owned
|
259,377
|
179,728
|
89,189
|
14,084,087
|
||||||||||||
|
Other sources, including temporary investments
|
66,949
|
−
|
1,386
|
−
|
||||||||||||
|
|
$
|
577,137
|
$
|
11,404,766
|
$
|
624,642
|
$
|
14,084,087
|
||||||||
|
Distribution from Realized Gain
|
−
|
−
|
−
|
−
|
||||||||||||
|
|
$
|
577,137
|
$
|
11,404,766
|
$
|
624,642
|
$
|
14,084,087
|
||||||||
|
|
Investment Income
|
Realized Gain (Loss)
on Investments
before Income Taxes
|
||||||||||||||
|
Year Ended
March 31, 2013
|
Interest
|
Dividends
|
Other Income
|
|
||||||||||||
|
Companies more than 25% owned
|
$
|
−
|
$
|
6,944,214
|
$
|
484,800
|
$
|
20,861,458
|
||||||||
|
Companies 5% to 25% owned
|
250,298
|
868,560
|
66,950
|
66,037,485
|
||||||||||||
|
Companies less than 5% owned
|
1,756,452
|
279,917
|
111,963
|
2,658,871
|
||||||||||||
|
Other sources, including temporary investments
|
71,136
|
−
|
971
|
−
|
||||||||||||
|
|
$
|
2,077,886
|
$
|
8,092,691
|
$
|
664,684
|
$
|
89,557,814
|
||||||||
|
Distribution from Realized Gain
|
−
|
−
|
−
|
(77,300,714
|
)*
|
|||||||||||
|
|
$
|
2,077,886
|
$
|
8,092,691
|
$
|
664,684
|
$
|
12,257,100
|
||||||||
|
|
Investment Income
|
Realized Gain (Loss)
on Investments
before Income Taxes
|
||||||||||||||
|
Year Ended
March 31, 2012
|
Interest
|
Dividends
|
Other Income
|
|
||||||||||||
|
Companies more than 25% owned
|
$
|
−
|
$
|
5,553,140
|
$
|
493,967
|
$
|
(10,933,517
|
)
|
|||||||
|
Companies 5% to 25% owned
|
253,652
|
1,006,572
|
59,700
|
(45,287
|
)
|
|||||||||||
|
Companies less than 5% owned
|
1,674,051
|
160,729
|
79,250
|
22,805,680
|
||||||||||||
|
Other sources, including temporary investments
|
52,477
|
−
|
699
|
−
|
||||||||||||
|
|
$
|
1,980,180
|
$
|
6,720,441
|
$
|
633,616
|
$
|
11,826,876
|
||||||||
*
During the twelve months ended March 31, 2013, we distributed $77,300,714 or $5.09 per share of capital gains dividends.
|
11.
|
SELECTED QUARTERLY FINANCIAL DATA
|
On July 15, 2013, a four-for-one split of our common stock was approved by our shareholders. The stock split was payable on August 15, 2013 to shareholders of record at the close of business on July 31, 2013. Our common stock began trading at the split-adjusted price on August 16, 2013. All share numbers and per share amounts presented herein reflect the stock split.
The following presents a summary of the unaudited quarterly consolidated financial information for the years ended March 31, 2014 and 2013 (in thousands except per share amounts):
|
2014
|
First
Quarter
|
Second
Quarter
|
Third
Quarter
|
Fourth
Quarter
|
Total
|
|||||||||||||||
|
Net investment income (loss)
|
$
|
(1,202
|
)
|
$
|
(1,191
|
)
|
$
|
6,260
|
$
|
1,027
|
$
|
4,894
|
||||||||
|
Net realized gain on investments
|
55
|
-
|
-
|
14,029
|
14,084
|
|||||||||||||||
|
Net increase (decrease) in unrealized appreciation of investments
|
10,392
|
45,615
|
53,308
|
(16,283
|
)
|
93,032
|
||||||||||||||
|
Net increase (decrease) in net assets from operations
|
9,245
|
44,424
|
59,569
|
(1,228
|
)
|
112,010
|
||||||||||||||
|
Net increase (decrease) in net operations per share
|
.60
|
2.88
|
3.86
|
(.07
|
)
|
7.27
|
||||||||||||||
|
2013
|
First
Quarter
|
Second
Quarter
|
Third
Quarter
|
Fourth
Quarter
|
Total
|
|||||||||||||||
|
Net investment income (loss)
|
$
|
18
|
$
|
(120
|
)
|
$
|
4,142
|
$
|
(2,133
|
)
|
$
|
1,907
|
||||||||
|
Net realized gain (loss) on investments
|
66,888
|
(7
|
)
|
640
|
20,912
|
88,433
|
||||||||||||||
|
Net increase (decrease) in unrealized appreciation of investments
|
(78,521
|
)
|
50,321
|
22,296
|
22,271
|
16,367
|
||||||||||||||
|
Net increase (decrease) in net assets from operations
|
(11,615
|
)
|
50,194
|
27,078
|
41,050
|
106,707
|
||||||||||||||
|
Net increase (decrease) in net operations per share
|
(.76
|
)
|
3.3
|
1.78
|
2.69
|
7.01
|
||||||||||||||
|
12.
|
SELECTED PER SHARE DATA AND RATIOS
|
The following presents a summary of the selected per share data for the years ended March 31, 2010 through 2014 (in thousands except per share amounts):
|
|
Years Ended March 31
|
|||||||||||||||||||
|
Per Share Data
|
2014
|
2013
|
2012
|
2011
|
2010
|
|||||||||||||||
|
Investment income
|
$
|
.82
|
$
|
.71
|
$
|
.62
|
$
|
.50
|
$
|
.41
|
||||||||||
|
Operating expenses
|
(.55
|
)
|
(.55
|
)
|
(.44
|
)
|
(.37
|
)
|
(.26
|
)
|
||||||||||
|
Income taxes
|
.05
|
(.04
|
)
|
(.01
|
)
|
(.01
|
)
|
(.01
|
)
|
|||||||||||
|
Net investment income
|
.32
|
.12
|
.17
|
.12
|
.14
|
|||||||||||||||
|
Distributions from undistributed net investment income
|
(.20
|
)
|
(.20
|
)
|
(.20
|
)
|
(.20
|
)
|
(.20
|
)
|
||||||||||
|
Net realized gain, net of tax incurred on deemed capital gain distributions
|
.66
|
5.81
|
.70
|
2.59
|
.05
|
|||||||||||||||
|
Dividends from capital gains
|
–
|
(5.07
|
)
|
–
|
–
|
–
|
||||||||||||||
|
Net increase (decrease) in unrealized appreciation of investments
|
6.04
|
1.08
|
5.23
|
.86
|
4.72
|
|||||||||||||||
|
Exercise of employee stock options**
|
(.18
|
)
|
(.24
|
)
|
–
|
|
(.05
|
)
|
–
|
|||||||||||
|
Forfeiture/ (Issuance) of restricted stock***
|
–
|
(.10
|
)
|
–
|
–
|
–
|
||||||||||||||
|
Share based compensation expense
|
(.04
|
)
|
.03
|
.07
|
.07
|
.05
|
||||||||||||||
|
Net change in pension plan funded status
|
.08
|
.01
|
(.03
|
)
|
(.01
|
)
|
.03
|
|||||||||||||
|
Treasury stock*
|
–
|
–
|
–
|
–
|
–
|
|||||||||||||||
|
Increase (decrease) in net asset value
|
6.68
|
1.44
|
5.94
|
3.38
|
4.79
|
|||||||||||||||
|
Net asset value
|
||||||||||||||||||||
|
Beginning of year
|
43.30
|
41.86
|
35.92
|
32.54
|
27.75
|
|||||||||||||||
|
End of year
|
$
|
49.98
|
$
|
43.30
|
$
|
41.86
|
$
|
35.92
|
$
|
32.54
|
||||||||||
|
|
||||||||||||||||||||
|
Ratios and Supplemental Data
|
||||||||||||||||||||
|
Ratio of operating expenses to average net assets
|
1.18
|
%
|
1.36
|
%
|
1.07
|
%
|
1.10
|
%
|
.87
|
%
|
||||||||||
|
Ratio of net investment income to average net assets
|
.68
|
%
|
.31
|
%
|
.41
|
%
|
.35
|
%
|
.47
|
%
|
||||||||||
|
Portfolio turnover rate
|
1.76
|
%
|
2.22
|
%
|
2.15
|
%
|
2.78
|
%
|
1.16
|
%
|
||||||||||
|
Net asset total return
|
16.9
|
%
|
27.00
|
%
|
18.07
|
%
|
18.40
|
%
|
18.50
|
%
|
||||||||||
|
|
||||||||||||||||||||
|
Shares outstanding at end of period (000s) omitted
|
15,414
|
15,236
|
15,020
|
15,012
|
14,964
|
|||||||||||||||
*
Net increase is due to purchases of common stock at prices less than beginning period net asset value.
| ** | Net decrease is due to the exercise of employee stock options at prices less than beginning of period net asset value. |
***Reflects impact of the different share amounts as a result of issuance or forfeiture of restricted stock during the period.
SCHEDULE 12-14
Schedule of Investments in and Advances to Affiliates
(In thousands)
|
Portfolio Company / Type of Investment (1)
|
Amount of Interest, Fees or Dividends Credited in Income (2)
|
Fair Value at March 31, 2013
|
Gross Additions (3)
|
Gross Reductions (4)
|
Fair Value at March 31, 2014
|
|||||||||||||||
|
Control Investments
|
|
|
|
|
|
|||||||||||||||
|
The RectorSeal Corporation
27,907 shares common stock
|
$
|
7,280
|
$
|
238,900
|
$
|
36,900
|
−
|
$
|
275,800
|
|||||||||||
|
The Whitmore Manufacturing Company
80 shares common stock
|
1,500
|
80,500
|
8,000
|
−
|
88,500
|
|||||||||||||||
|
Media Recovery, Inc.
800,000 shares Series A Convertible Preferred Stock, convertible into 800,000 shares common stock
4,000,002 shares common stock
|
−
−
|
2,000
9,900
|
2,000
10,000
|
4,000
19,900
|
||||||||||||||||
|
Balco, Inc.
445,000 shares common stock; 60,920 shares Class B non-voting common
|
−
|
4,500
|
−
|
−
|
4,500
|
|||||||||||||||
|
CapStar Holdings Corporation
500 shares common stock;
|
6,178
|
−
|
(262
|
)
|
5,916
|
|||||||||||||||
|
1,000,000 shares preferred stock
|
350
|
1,668
|
−
|
(70
|
)
|
1,598
|
||||||||||||||
|
Discovery Alliance, LLC
90.0% limited liability company
|
−
|
956
|
(556
|
)
|
400
|
|||||||||||||||
|
Humac Company
1,041,000 shares of common stock
|
5
|
188
|
22
|
-
|
210
|
|||||||||||||||
|
Total Control Investments
|
$
|
9,135
|
$
|
344,790
|
$
|
56,922
|
$
|
(888
|
)
|
$
|
400,824
|
|||||||||
|
Portfolio Company / Type of Investment (1)
|
Amount of Interest, Fees or Dividends Credited in Income (2)
|
Fair Value at March 31, 2013
|
Gross Additions (3)
|
Gross Reductions (4)
|
Fair Value at March 31, 2014
|
|||||||||||||||
|
Affiliated Investments
|
||||||||||||||||||||
|
Alamo Group, Inc.
2,830,300 shares common stock
|
$
|
793
|
108,278
|
45,546
|
|
153,824
|
||||||||||||||
|
Encore Wire Corporation
1,312,500 shares of common stock
|
131
|
45,951
|
17,640
|
|
63,591
|
|||||||||||||||
|
PalletOne, Inc.
12.3% Senior Subordinated Notes, $2,000,000 due 2015
|
250
|
1,900
|
−
|
(1,900
|
)
|
−
|
||||||||||||||
|
150,000 shares of common stock
|
−
|
−
|
−
|
−
|
||||||||||||||||
|
Warrant to purchase 15,294 shares of common stock at $1,00 per share, expiring 2011
|
−
|
−
|
−
|
−
|
−
|
|||||||||||||||
|
Boxx Technologies, Inc.
3,125,354 shares Series B Convertible Preferred Stock, convertible into 3,125,354 shares of common stock at $0.50 per share
|
−
|
1,240
|
-
|
(200
|
)
|
1,040
|
||||||||||||||
|
Wellogix, Inc.
4,788,371 shares Series A-1 Convertible Preferred Stock, convertible into 4,788,371 shares of common stock at $1.0441 per share
|
1,651
|
25
|
−
|
−
|
25
|
|||||||||||||||
|
Total Affiliated Investments
|
$
|
2,825
|
$
|
157,394
|
$
|
63,186
|
$
|
(2,100
|
)
|
$
|
218,480
|
|||||||||
|
Total Control & Affiliated Investments
|
$
|
11,960
|
$
|
502,184
|
$
|
120,108
|
$
|
(2,988
|
) |
$
|
619,304
|
|||||||||
This schedule should be read in conjunction with our Consolidated Financial Statements, including the Consolidated Schedules of Investments and Notes to Consolidated Financial Statements.
| (1) | The principal amount and ownership detail as shown in the Consolidated Schedules of Investments. |
| (2) | Represents the total amount of interest, fees and dividends, credited to income for the portion of the year an investment was included in the Control or Non-Control/Non-Affiliate categories, respectively. |
| (3) | Gross additions include increases in the cost basis of investments resulting from new portfolio investments, follow-on investments and accrued PIK interest, and the exchange of one or more existing securities for one or more new securities. Gross additions also include net increases in unrealized appreciation or net decreases in unrealized depreciation as well as movement of an existing portfolio company into this category and out of a different category. |
| (4) | Gross reductions included in decreases in the cost basis of investment resulting from principal payments or sales and exchanges of one or more existing securities for one or more new securities. Gross reductions also include net increases in unrealized depreciation or net decreases in unrealized appreciation as well as the movement of an existing portfolio company out of this category and into a different category. |
None.
|
(a)
|
Evaluation of Disclosure Controls and Procedures
|
As of the end of the period covered by this annual report on Form 10-K, our Chairman of the Board and President and Chief Financial Officer conducted an evaluation of our disclosure controls and procedures (as defined in Rules 13a-15(e) and 15d-15(e) of the Securities Exchange Act of 1934, as amended (Exchange Act). Based upon this evaluation, our Chairman of the Board, President and Chief Executive Officer, and Chief Financial Officer concluded that our disclosure controls and procedures were effective to allow timely decisions regarding disclosure of any material information relating to us that is required to be disclosed by us in the reports we file or submit under the Exchange Act.
|
(b)
|
Management’s report on internal control over financial reporting
|
The management of Capital Southwest Corporation and its subsidiaries (the Company) is responsible for establishing and maintaining adequate internal control over financial reporting, as such term is defined in Exchange Act Rules 13a-15(f). Under the supervision and with the participation of management, including the Chief Executive Officer and Chief Financial Officer, the Company conducted an evaluation of the effectiveness of the Company's internal control over financial reporting based on the criteria established in the 1992 Internal Control — Integrated Framework issued by the Committee of Sponsoring Organizations of the Treadway Commission (COSO). Based on the Company's evaluation under the framework in Internal Control — Integrated Framework, management concluded that the Company's internal control over financial reporting was effective as of March 31, 2014. Grant Thornton LLP, the Company's independent registered public accounting firm, has issued an attestation report on the effectiveness of the Company's internal control over financial reporting as of March 31, 2014, as stated in its report which is included herein.
|
(c)
|
Attestation report of the registered public accounting firm
|
Our independent registered public accounting firm, Grant Thornton LLP, has issued an attestation report on the effectiveness of our internal control over financial reporting as of March 31, 2014, which is set forth above under the heading “Report of Independent Registered Public Accounting Firm” in Item 8 of this Annual Report.
|
(d)
|
Changes in internal control over financial reporting
|
There have been no changes in our internal control over financial reporting (as defined in Rule 13a-15(f) of the Exchange Act) that occurred during our most recently completed fiscal quarter, that have materially affected, or are reasonably likely to materially affect our internal control over financial reporting.
None.
PART III
The information required by this Item 10 will be contained in the definitive proxy statement relating to our 2014 annual meeting of shareholders under the headings of "Election of Directors," “Corporate Governance,” “Executive Officers” and "Section 16(a) Beneficial Ownership Reporting Compliance" to be filed with the Securities and Exchange Commission on or before June 18, 2014, and is incorporated herein by reference.
We have adopted a code of ethics pursuant to Rule 17j-1 under the 1940 Act that applies to all our directors, officers and employees. We have made the Code of Conduct and of Ethics available on our website at http://www.capitalsouthwest.com/investor-relations/governace.htm. Shareholders may request a free copy of the Code of Conduct and Code of Ethics from: Kelly Tacke, Corporate Secretary and Chief Compliance Officer, at our principal executive office.
The information required by this Item 11 will be contained in the definitive proxy statement relating to our 2013 annual meeting of shareholders under the headings of "Compensation of Executive Officers," “Compensation of Directors,” “Compensation Discussion and Analysis” and "Compensation Committee Report" to be filed with the Securities and Exchange Commission on or before June 18, 2014, and is incorporated herein by reference.
| Item 12. | Security Ownership of Certain Beneficial Owners and Management and Related Stockholder Matters |
The information in the sections of our 2014 Proxy Statement captioned "Stock Ownership of Certain Beneficial Owners" is incorporated in this Item 12 by reference.
The table below sets forth certain information as of March 31, 2014 regarding the shares of our common stock available for grant or granted under stock option plans that (1) were approved by our shareholders, and (2) were not approved by our shareholders.
|
Plan Category
|
Number of Securities to be Issued Upon Exercise of Outstanding Options, Warrants and Rights
|
Weighted-Average Exercise Price of Outstanding Options, Warrants and Rights
|
Number of Securities Remaining Available for Future Issuance Under Equity Compensation Plans
|
|||||||||
|
Equity compensation plans approved by security holders (1)
|
161,800
|
$
|
30.29
|
259,000
|
||||||||
|
|
||||||||||||
|
Equity compensation plans not approved by security holders (2)
|
−
|
−
|
−
|
|||||||||
|
Total
|
161,800
|
$
|
30.29
|
259,000
|
||||||||
| 1) | Includes the 1999 Stock Option Plan and the 2009 Stock Incentive Plan and excludes restricted shares under 2010 Restricted Stock Award Plan. For a description of both plans, please refer to Footnote 5 contained in our consolidated financial statements. |
| 2) | We have no equity compensation plans that were not approved by security holders. |
Other information required by this Item 12 will be contained in the definitive proxy statement relating to our 2014 annual meeting of shareholders under the heading of "Security Ownership of Certain Beneficial Owners and Management" to be filed with the Securities and Exchange Commission on or before June 18, 2014, and is incorporated herein by reference.
The information required by this Item 13 will be contained in the definitive proxy statement relating to our 2014 annual meeting of shareholders under the headings of "Certain Relationships and Related Transactions” and "Corporate Governance" to be filed with the Securities and Exchange Commission on or before June 18, 2014, and is incorporated herein by reference.
The information required by this Item 14 will be contained in the definitive proxy statement relating to our 2014 annual meeting of shareholders under the heading of "Ratification and Appointment of Independent Registered Public Accounting Firm for the Year ended March 31, 2015" to be filed with the Securities and Exchange Commission on or before June 18, 2014, and is incorporated herein by reference.
PART IV
The following documents are filed or incorporated by reference as part of this Annual Report:
| 1. | Consolidated Financial Statements |
|
|
Page
|
|
Reports of Independent Registered Public Accounting Firm
|
32
|
|
Consolidated Statements of Assets and Liabilities as of March 31, 2014 and 2013
|
34
|
|
Consolidated Statements of Operations for Years Ended March 31, 2014, 2013 and 2012
|
35
|
|
Consolidated Statements of Changes in Net Assets for Years Ended March 31, 2014, 2013 and 2012
|
36
|
|
Consolidated Statements of Cash Flows for Years Ended March 31, 2014, 2013 and 2012
|
37
|
|
Consolidated Schedules of Investments as of March 31, 2014 and 2013
|
38
|
|
Notes to Consolidated Financial Statements
|
49
|
|
2.
|
Schedule of Investments In and Advances To Affiliates
Reports of Independent Registered Public Accounting Firm
|
|
3.
|
Exhibits
|
The following exhibits are filed as part of this report or hereby incorporated by reference to exhibits previously filed with the SEC. Asterisk denotes exhibits filed with this report. Double asterisk denotes exhibits furnished with this report.
|
Exhibit No.
|
Description
|
|
|
3.1(a)
|
Articles of Incorporation and Articles of Amendment to Articles of Incorporation, dated June 25, 1969 (filed as Exhibit 1(a) and 1(b) to Amendment No. 3 to Form N-2 for the fiscal year ended March 31, 1979).
|
|
|
3.1(b)
|
Articles of Amendment to Articles of Incorporation, dated July 20, 1987 (filed as an exhibit to Form N-SAR for the six month period ended September 30, 1987).
|
|
|
3.2
|
By-Laws of the Company, as amended (filed as Exhibit 3.2 to Form 10-K for the fiscal year ended March 31, 2007).
|
|
|
4.1
|
Specimen of Common Stock certificate (filed as Exhibit 4.1 to Form 10-K for the fiscal year ended March 31, 2002).
|
|
|
10.1
|
The RectorSeal Corporation and Jet-Lube, Inc. Employee Stock Ownership Plan as revised and restated effective April 1, 2007 (filed as Exhibit 10.1 to form 10-K for the fiscal year ended March 31, 2007).
|
|
|
10.2
|
Retirement Plan for Employees of Capital Southwest Corporation and Its Affiliates as amended and restated effective April 1, 2006 (filed as Exhibit 10.2 to form 10-K for the fiscal year ended March 31, 2007).
|
|
|
10.3
|
Capital Southwest Corporation and Its Affiliates Restoration of Retirement Income Plan as amended and restated effective January 1, 2008 (filed as Exhibit 10.3 to form 10-K for the fiscal year ended March 31, 2009).
|
|
Exhibit No.
|
Description
|
|
|
10.6
|
Form of Indemnification Agreement which has been established with all directors and executive officers of the Company (filed as Exhibit 10.9 to Form 8-K dated February 10, 1994).
|
|
|
10.7
|
Capital Southwest Corporation 1999 Stock Option Plan (filed as Exhibit 10.10 to Form 10-K for the fiscal year ended March 31, 2000).
|
|
|
10.8
|
Severance Pay Agreement with William M. Ashbaugh (filed as Exhibit 10.1 to Form 8-K dated July 18, 2005).
|
|
|
10.15
|
Retirement Plan for Employees of Capital Southwest Corporation and its Affiliates as amended and restated effective April 1, 2011
|
|
|
10.16
|
Amendment One to Retirement Plan for employees of Capital Southwest Corporation and its affiliates as amended and restated effective April 1, 2011 (filed as Exhibit 10.16 to Form 10-K for the fiscal year ended March 31, 2013).
|
|
|
10.17
|
Joseph B. Armes Revised Offer Letter (filed as Exhibit 99.2 to Form 8-K dated May 17, 2013).
|
|
|
13.1 *
|
Selected Consolidated Financial Data.
|
|
|
21.1 *
|
List of subsidiaries of the Company.
|
|
|
23.1 *
|
Consent of Independent Registered Public Accounting Firm – Grant Thornton LLP.
|
|
|
31.1 *
|
Certification of Chairman of the Board and President required by Rule 13a-14(a) or Rule 15d-14(a) of the Securities Exchange Act of 1934, as amended (the “Exchange Act”), filed herewith.
|
|
|
31.2 *
|
Certification of Chief Financial Officer required by Rule 13a-14(a) or Rule 15d-14(a) of the Exchange Act, filed herewith.
|
|
|
32.1 **
|
Certification of Chairman of the Board and President required by Rule 13a-14(b) or Rule 15d-14(b) of the Exchange Act and Section 1350 of Chapter 63 of Title 18 of the United States Code, furnished herewith.
|
|
|
32.2 **
|
Certification of Chief Financial Officer required by Rule 13a-14(b) or Rule 15d-14(b) of the Exchange Act and Section 1350 of Chapter 63 of Title 18 of the United States Code, furnished herewith.
|
Pursuant to the requirements of Section 13 or 15(d) of the Securities Exchange Act of 1934, the Registrant has duly caused this report to be signed on its behalf by the undersigned, thereunto duly authorized.
|
|
CAPITAL SOUTHWEST CORPORATION
|
|
|
|
By:
|
/s/ Joseph B. Armes
|
|
|
|
Joseph B. Armes
Chairman of the Board
President and Chief Executive Officer
|
Date: June 3, 2014
POWER OF ATTORNEY
KNOW ALL MEN BY THESE PRESENTS that each of Capital Southwest Corporation and its Subsidiaries undersigned directors hereby constitutes and appoints Joseph B. Armes, it’s or his true and lawful attorney-in-fact and agent, for it or him and in its or his name, place and stead, in any and all capacities, with full power to act alone, to sign any and all amendments to this Report, and to file each such amendment to the Report, with all exhibits thereto, and any and all other documents in connection therewith, with the Securities and Exchange Commission, hereby granting unto said attorney-in-fact and agent full power and authority to do and perform any and all acts and things requisite and necessary to be done in and about the premises as fully to all intents and purposes as it or he might or could do in person, hereby ratifying and confirming all that said attorney-in-fact and agent may lawfully do or cause to be done by virtue hereof.
Pursuant to the requirement of the Securities and Exchange Act of 1934, this report has been signed below by the following persons on behalf of the Registrant and in the capacities and on the dates indicated:
|
Signature
|
Title
|
Date
|
|
/s/ Joseph B. Armes
|
Chairman of the Board and President
|
June 3, 2014
|
|
Joseph B. Armes
|
(Chief Executive Officer)
|
|
|
/s/ David R. Brooks
|
Director
|
June 3, 2014
|
|
David R. Brooks
|
|
|
|
/s/ Gary L. Martin
|
Director
|
June 3, 2014
|
|
Gary L. Martin
|
|
|
|
/s/ Samuel B. Ligon
|
Director
|
June 3, 2014
|
|
Samuel B. Ligon
|
|
|
|
/s/ T. Duane Morgan
|
Director
|
June 3, 2014
|
|
T. Duane Morgan
|
|
|
|
/s/ William Thomas III
|
Director
|
June 3, 2014
|
|
William Thomas III
|
|
|
|
/s/ John H. Wilson
|
Director
|
June 3, 2014
|
|
John H. Wilson
|
|
|
|
/s/ Kelly Tacke
|
Chief Financial Officer
|
June 3, 2014
|
|
Kelly Tacke
|
(Chief Financial/Accounting Officer)
|
|
EXHIBIT INDEX
|
Exhibit
Number
|
Description
|
|
|
|
|
List of Subsidiaries
|
|
|
Consent of Grant Thornton LLP, independent registered public accounting firm
|
|
|
Rule 13a-15(e) and 15d-15(e) an 13a-15(f) and 15d-15(f) Certification of Chief Executive Officer
|
|
|
Rule 13a-15(e) and 15d-15(e) an 13a-15(f) and 15d-15(f) Certification of Chief Financial Officer
|
|
|
Section 13(a) or 15(d) Certification of Chief Executive Officer
|
|
|
Section 13(a) or 15(d) Certification of Chief Financial Officer
|
79
TABLE OF CONTENTS
Part IItem 1. BusinessItem 1A. Risk FactorsItem 1B. Unresolved Staff CommentsItem 2. PropertiesItem 3. Legal ProceedingsItem 4. Mine Safety DisclosuresPart IIItem 5. Market For Registrant's Common Equity, Related Stockholder Matters and Issuer Purchases Of Equity SecuritiesItem 6. Selected Financial DataItem 7. Management's Discussion and Analysis Of Financial Condition and Results Of OperationsItem 7A. Quantitative and Qualitative Disclosures About Market RiskItem 8. Financial Statements and Supplementary DataItem 9. Changes in and Disagreements with Accountants on Accounting and Financial DisclosureItem 9A. Controls and ProceduresItem 9B. Other InformationPart IIIItem 10. Directors, Executive Officers and Corporate GovernanceItem 11. Executive CompensationItem 12. Security Ownership Of Certain Beneficial Owners and Management and Related Stockholder MattersItem 13. Certain Relationships and Related Transactions, and Director IndependenceItem 14. Principal Accountant Fees and ServicesPart IVItem 15. Exhibits and Financial Statement Schedules