CAPITAL SOUTHWEST CORP
10-Ks and 10-Qs
|
|
|
|
|
|
|
|
|
|
|
|
|
|
|
|
|
|
|
|
|
|
|
|
|
|
|
|
|
|
|
|
|
|
|
|
|
|
|
|
|
|
|
|
|
|
|
|
|
|
|
|
|
|
|
|
|
|
|
|
|
|
|
|
|
UNITED STATES
SECURITIES AND EXCHANGE COMMISSION
Washington, D.C. 20549
ANNUAL REPORT PURSUANT TO SECTIONS 13 OR 15(d) OF THE SECURITIES EXCHANGE ACT OF 1934
FORM 10-K
(Mark One)
|
☒
|
ANNUAL REPORT PURSUANT TO SECTION 13 OR 15(d) OF THE SECURITIES EXCHANGE ACT OF 1934
|
For the fiscal year ended
March 31, 2016
OR
|
☐
|
TRANSITION REPORT PURSUANT TO SECTION 13 OR 15(d) OF THE SECURITIES EXCHANGE ACT OF 1934
|
For the transition period from to
Commission File Number:
814-00061
CAPITAL SOUTHWEST CORPORATION
(Exact name of registrant as specified in its charter)
|
Texas
|
75-1072796
|
|
|
(State or other jurisdiction of incorporation or organization)
|
(I.R.S. Employer Identification No.)
|
|
5400 Lyndon B Johnson Freeway, Suite 1300, Dallas, Texas
|
75240
|
|
|
(Address of principal executive offices)
|
(Zip Code)
|
Registrant's telephone number, including area code
: (972) 233-8242
|
Securities registered pursuant to Section 12(g) of the Act:
|
|
|
Title of Each Class
|
Name of Each Exchange on Which Registered
|
|
Common Stock, $0.25 par value per share
|
The Nasdaq Global Select Market
|
|
Securities registered pursuant to Section 12(g) of the Act:
None
|
|
Indicate by check mark if the registrant is a well-known seasoned issuer, as defined in Rule 405 of the Securities Act. YES
☐
NO ☒
Indicate by check mark if the registrant is not required to file reports pursuant to Section 13 or Section 15(d) of the Act. YES
☐
NO ☒
Indicate by check mark whether the registrant (1) has filed all reports required to be filed by Section 13 or 15(d) of the Securities Exchange Act of 1934 during the preceding 12 months (or for such shorter period that the registrant was required to file such reports), and (2) has been subject to such filing requirements for the past 90 days. YES
☒
NO ☐.
Indicate by check mark whether the registrant has submitted electronically and posted on its corporate Web site, if any, every Interactive Data File required to be submitted and posted pursuant to Rule 405 of Regulation S-T (§232.405 of this chapter) during the preceding 12 months (or for such shorter period that the registrant was required to submit and post such files). YES ☒ NO ☐
Indicate by check mark if disclosure of delinquent filers pursuant to Item 405 of Regulation S-K is not contained herein, and will not be contained, to the best of registrant's knowledge, in definitive proxy or information statements incorporated by reference in Part III of this Form 10-K or any amendment to this Form 10-K. ☐
Indicate by check mark whether the registrant is a large accelerated filer, an accelerated filer, or a non-accelerated filer. See definition of “accelerated filer and large accelerated filer” in Rule 12b-2 of the Exchange Act. (Check One):
Large accelerated filer ☐Accelerated filer ☒ Non-accelerated filer ☐Smaller reporting company ☐
Indicate by check mark whether the registrant is a shell company (as defined in Rule 12b-2 of the Act).
YES ☐ NO ☒.
The aggregate market value of the voting stock held by non-affiliates of the registrant as of September 30, 2015 was $645,722,948 based on the last sale price of such stock as quoted by The Nasdaq Global Select Market on such date.
The number of shares of common stock, $0.25 par value per share, outstanding as of June 10, 2016 was 15,726,006.
Documents Incorporated by Reference
Portions of the Proxy Statement for Annual Meeting of Shareholders to be held July 20, 2016 are incorporated by reference in this Annual Report on Form 10-K in response to Part III.
|
PART I
|
Page
|
|
|
Item 1.
|
2
|
|
|
Item 1A.
|
22
|
|
|
Item 1B.
|
34
|
|
|
Item 2.
|
34
|
|
|
Item 3.
|
34
|
|
|
Item 4.
|
34
|
|
|
PART II
|
||
|
Item 5.
|
35
|
|
|
Item 6.
|
38
|
|
|
Item 7.
|
40
|
|
|
Item 7A.
|
49
|
|
|
Item 8.
|
50
|
|
|
Item 9.
|
98
|
|
|
Item 9A.
|
98
|
|
|
Item 9B.
|
98
|
|
|
PART III
|
||
|
Item 10.
|
99
|
|
|
Item 11.
|
99
|
|
|
Item 12.
|
99
|
|
|
Item 13.
|
100
|
|
|
Item 14.
|
100
|
|
|
PART IV
|
||
|
Item 15.
|
101
|
|
|
102
|
CAUTIONARY STATEMENT CONCERNING FORWARD-LOOKING STATEMENTS
This Annual Report on Form 10-K contains forward-looking statements regarding the plans and objectives of management for future operations. Any such forward-looking statements may involve known and unknown risks, uncertainties and other factors which may cause our actual results, performance or achievements to be materially different from future results, performance or achievements expressed or implied by any forward-looking statements. Forward-looking statements which involve assumptions and describe our future plans, strategies and expectations are generally identifiable by use of the words “may,” “will,” “should,” “expect,” “anticipate,” “estimate,” “believe,” “intend” or “project” or the negative of these words or other variations on these words or comparable terminology. These forward-looking statements are based on assumptions that may be incorrect, and we cannot assure you that the projections included in these forward-looking statements will come to pass. Our actual results could differ materially from those expressed or implied by the forward-looking statements. The forward-looking statements contained in this Annual Report include statements as to:
| · | our future operating results; |
| · | the valuation of our investments in portfolio companies, particularly those having no liquid trading market; |
| · | the dependence of our future success on the general economy and its impact on the industries in which we invest; |
| · | our transition to a debt focused investment strategy; |
| · | our expected financings and investments; |
| · | the adequacy of our cash resources and working capital; |
| · | the timing of cash flows, if any, from the operations of our portfolio companies; |
| · | our business prospects and the prospects of our existing and prospective portfolio companies; |
| · | our contractual arrangements and other relationships with third parties; |
| · | our ability to recover unrealized losses; |
| · | our regulatory structure and tax treatment; |
| · | our ability to operate as a business development company and a regulated investment company, including the impact of changes in laws or regulations governing our operations or the operations of our portfolio companies; |
| · | the financial condition and ability of our existing and prospective portfolio companies to achieve their objectives; |
| · | the return or impact of current and future investments; |
| · | the impact of a protracted decline in the liquidity of credit markets on our business; |
| · | the impact of fluctuations in interest rates on our business; |
| · | market conditions and our ability to access additional capital; and |
| · | the timing, form and amount of any dividend distributions; |
For a discussion of factors that could cause our actual results to differ from forward-looking statements contained in this Annual Report, please see the discussion under “Risk Factors” in Item 1A.
We have based the forward-looking statements included in this Annual Report on Form 10-K on information available to us on the date of this Annual Report on Form 10-K, and we assume no obligation to update any such forward-looking statements, unless we are required to do so by applicable law.
PART I
ORGANIZATION
Capital Southwest Corporation (“CSWC”) is an investment company that specializes in providing customized financing to middle market companies in a broad range of industry segments located primarily in the United States. Our common stock currently trades on The Nasdaq Global Select Market under the ticker symbol “CSWC.”
CSWC was organized as a Texas corporation on April 19, 1961. Until September 1969, we operated as a small business investment company (“SBIC”) licensed under the Small Business Investment Act of 1958. At that time, CSWC transferred to our wholly-owned subsidiary, Capital Southwest Venture Corporation (“CSVC”), certain assets including our license as a "SBIC”. CSVC is a closed-end, non-diversified investment company registered under the Investment Company Act of 1940, as amended (the “1940 Act”). Prior to March 30, 1988, CSWC was registered as a closed-end, non-diversified investment company under the 1940 Act. On that date, we elected to be treated as a business development company (“BDC”) subject to the provisions of the 1940 Act, as amended by the Small Business Incentive Act of 1980. In order to remain a BDC, we must meet certain specified requirements under the 1940 Act, including investing at least 70% of our assets in eligible portfolio companies and limiting the amount of leverage we incur.
We are also a regulated investment company (“RIC”) under Subchapter M of the U.S. Internal Revenue Code of 1986 (the “Code”). As such, we are not required to pay corporate-level income tax on our investment income. We intend to maintain our RIC status, which requires that we qualify annually as a RIC by meeting certain specified requirements. Because CSWC wholly owns CSVC, the portfolios of CSWC and CSVC are referred to collectively as "our," "we" and "us."
On September 30, 2015, we completed the spin-off of CSW Industrials, Inc. (“CSWI”). CSWI is now an independent publicly traded company. CSWI’s common stock trades on The Nasdaq Global Select Market under the symbol “CSWI.” CSWI’s assets and businesses consist of the Company’s former industrial products, coatings, sealants & adhesives and specialty chemicals businesses and also include all the equity interest of The RectorSeal Corporation, The Whitmore Manufacturing Company, Balco, Inc., and CapStar Holdings Corporation.
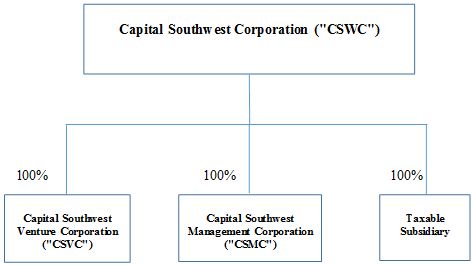
Capital Southwest Management Corporation (“CSMC”), a wholly-owned subsidiary of CSWC, is the management company for CSWC and CSVC. CSMC generally incurs all normal operating and administrative expenses, including, but not limited to, salaries and related benefits, rent, equipment and other administrative costs required for day-to-day operations.
CSWC also has a direct wholly owned subsidiary that has been elected to be a taxable entity (the “Taxable Subsidiary”). The primary purpose of the Taxable Subsidiary is to permit CSWC to hold equity investments in portfolio companies which are “pass-through” entities for tax purposes. The Taxable Subsidiary is taxed at normal corporate tax rates based on its taxable income.
The following diagram depicts CSWC’s organizational structure:
Employees
As of March 31, 2016, we had fifteen employees, each of whom was employed by our management company, CSMC. These employees include our corporate officers, investment and portfolio management professionals and administrative staff. All of our employees are located in our principal executive offices in Dallas, Texas.
Corporate Information
Our principal executive offices are located at 5400 Lyndon B. Johnson Freeway, Suite 1300, Dallas, Texas 75240. We maintain a website at
www.capitalsouthwest.com
. You can review the filings we have made with the Securities Exchange Commission, the SEC, free of charge on EDGAR, the Electronic Data Gathering, Analysis, and Retrieval System of the SEC, accessible at sec.gov. We also make available free of charge on our website our Annual Reports on Form 10-K, Quarterly Reports on Form 10-Q, Current Reports on Form 8-K, any amendments to those reports and any other reports filed or furnished pursuant to Section 13(a), 15(d) or 16(a) of the Securities Exchange Act of 1934 (the “Exchange Act”) as soon as reasonably practicable after filing these reports with the SEC. Information on our website is not incorporated by reference into this Annual Report on Form 10-K and you should not consider that information to be part of this Annual Report on Form 10-K.
The public may read and copy materials that we file with the SEC at the SEC’s Public Reference Room at 100 F Street, NE, Washington, DC 20549. Information on the operation of the Public Reference Room may be obtained by calling the SEC at 1-800-732-0330. The SEC also maintains a website that contains the reports, proxy and information statements and other information regarding issuers that file electronically with the SEC at
http://www.sec.gov
.
The charters adopted by the committees of our Board of Directors are also available on our website. Information contained on our website is not incorporated by reference into this Annual Report on Form 10-K, and you should not consider that information to be part of this Annual Report on Form 10-K.
OVERVIEW OF OUR BUSINESS
We are a specialty lending company that provides customized financing to middle market companies located primarily in the United States. Our principal investment objective is to produce attractive risk-adjusted returns by generating current income from our debt investments and capital appreciation from our equity and equity related investments. Our investment strategy is to partner with business owners, management teams and financial sponsors to provide flexible financing solutions to fund growth, changes of control, or other corporate events. In allocating future investments, we plan to continue investing primarily in senior and subordinated debt securities secured by security interests in portfolio company assets, coupled with equity interests.
We focus on investing in companies with histories of generating revenues and positive cash flow, established market positions and proven management teams with strong operating discipline. We target senior and subordinated investments in the lower middle market and private loan transactions (club deals), as well as first and second lien syndicated loans in larger middle market companies. Our target lower middle market companies typically have annual earnings before interest, taxes, depreciation and amortization (“EBITDA”) between $3.0 million and $15.0 million. Our target club deal companies typically have annual EBITDA between $15.0 million and $50.0 million. We believe that these middle market companies have less access to capital and that the market for such capital is underserved relative to larger companies. Companies of this size are generally privately held and are less well known to traditional capital sources such as commercial and investment banks. Our target companies for syndicated first and second lien loan investments are in large middle market companies that typically have annual EBITDA that is greater than $50 million. We make available significant managerial assistance to the companies in which we invest when we believe that providing managerial assistance to an investee company is critical to its business development activities.
Because we are internally managed, we do not pay external investment advisory fees, but instead directly incur the operating costs associated with employing investment and portfolio management professionals. We believe that our internally managed structure provides us with a beneficial operating expense structure when compared to other publicly traded and privately held investment firms which are externally managed, and our internally managed structure allows us the opportunity to leverage our non-interest operating expenses as we grow our investment portfolio.
Recent Developments
In April 2016, we exited our investment in Freedom Truck Finance and received principal and accrued interest payments totaling $6.0 million. On June 7, 2016, we announced our Board of Directors had declared a $0.06 dividend per share for the quarter ended June 30, 2016. The record date for the dividend is June 20, 2016. The payment date for the dividend is July 1, 2016.
Our Business Strategy
Our principal investment objective is to produce attractive risk-adjusted returns by generating current income from our debt investments and realizing capital appreciation from our equity and equity-related investments. We have adopted the following business strategies to achieve our investment objective:
| · | Leveraging the Experience of Our Management Team . Our senior management team has extensive experience advising, investing in and lending to middle market companies across changing market cycles. The members of our management team have diverse investment backgrounds, with prior experience at investment banks, commercial banks, and business development companies in the capacity of senior officers. We believe this diverse experience provides us with an in-depth understanding of the strategic, financial and operational challenges and opportunities of the middle market companies in which we invest. We believe this understanding allows us to select and structure better investments and to efficiently monitor and provide managerial assistance to our portfolio companies. |
| · | Applying Rigorous Underwriting Policies and Active Portfolio Management . Our senior management team has implemented rigorous underwriting policies that are followed in each transaction. These policies include a thorough analysis of each potential portfolio company’s competitive position, financial performance, management team operating discipline, growth potential and industry attractiveness, which we believe allows us to better assess the company’s prospects. After investing in a company, we monitor the investment closely, typically receiving monthly, quarterly and annual financial statements. As a team, we analyze and discuss in detail the company’s financial performance and industry trends monthly. We believe that our initial and ongoing portfolio review process allows us to monitor effectively the performance and prospects of our portfolio companies. |
| · | Invest Across Multiple Companies, Industries, Regions and End Markets . We seek to maintain a portfolio of investments that is appropriately diverse among various companies, industries, geographic regions and end markets. This portfolio balance is intended to mitigate the potential effects of negative economic events for particular companies, regions, industries and end markets. However, we may from time to time hold securities of a single portfolio company that comprise more than 5% of our total assets and/or more than 10% of the outstanding voting securities of the portfolio company. For that reason, we are classified as a non-diversified management investment company under the 1940 Act. |
| · | Utilizing Long-Standing Relationships to Source Deals . Our senior management team and investment professionals maintain extensive relationships with entrepreneurs, financial sponsors, attorneys, accountants, investment bankers, commercial bankers and other non-bank providers of capital who refer prospective portfolio companies to us. These relationships historically have generated significant investment opportunities. We believe that our network of relationships will continue to produce attractive investment opportunities. |
| · | Focusing on Underserved Markets . The middle market has traditionally been underserved. We believe that operating margin and growth pressures, as well as regulatory concerns, have caused many financial institutions to de-emphasize services to middle market companies in favor of larger corporate clients and more liquid capital market transactions. We also invest in securities that would be rated below investment grade if they were rated. We believe these dynamics have resulted in the financing market for middle market companies being underserved, providing us with greater investment opportunities. |
| · | Focus on Established Companies . We generally invest in companies with established market positions, experienced management teams and recurring cash flow streams. We believe that those companies generally possess better risk adjusted return profiles than earlier stage companies that are building their management teams and establishing their revenue base. We also believe that established companies in our target size range generally provide opportunities for capital appreciation. |
| · | Providing Customized Financing Solutions . We offer a variety of financing structures and have the flexibility to structure our investments to meet the needs of our portfolio companies. Often we invest in senior and subordinated debt securities, coupled with equity interests. We believe our ability to customize financing structures makes us an attractive partner to middle market companies. |
INVESTMENT CRITERIA AND OBJECTIVES
Our investment team has identified the following investment criteria that we believe are important in evaluating prospective investment opportunities. However, not all of these criteria have been or will be met in connection with each of our investments:
| · | Companies with Positive and Sustainable Cash Flow : We generally seek to invest in established companies with sound historical financial performance. |
| · | Excellent Management : Management teams with a proven record of achievement, exceptional ability, unyielding determination and unquestionable integrity. We believe management teams with these attributes are more likely to manage the companies in a manner that protects and enhances value. |
| · | Industry : We primarily focus on companies having competitive advantages in their respective markets and/or operating in industries with barriers to entry, which may help protect their market position. |
| · | Strong Private Equity Sponsors: We focus on developing relationships with leading private equity firms in order to partner with these firms and provide them capital to support the acquisition and growth of their portfolio companies. |
| · | Appropriate Risk-Adjusted Returns: We focus on and price opportunities to generate returns that are attractive on a risk-adjusted basis, taking into consideration factors, in addition to the ones depicted above, including credit structure, leverage levels and the general volatility of cash flows. |
| · | Location: We primarily focus on companies located in the United States. Each new investment is evaluated for its appropriateness within our existing portfolio. Acquisition candidates for our existing portfolio companies may be located worldwide. |
Investment Process
We have an investment committee that is responsible for all aspects of our investment process relating to investments made by CSWC. The members of the investment committee are Bowen Diehl, Michael Sarner, Douglas Kelley and Joseph Armes.
Our investment strategy involves a team approach, whereby our investment team screens potential transactions before they are presented to the investment committee for approval. Transactions that are either over a certain hold size or outside our general investment policy will also be reviewed and approved by the board of directors of CSWC (the “Board of Directors”). Our investment team generally categorizes the investment process into six distinctive stages:
| · | Deal Generation/Origination : Deal generation and origination is maximized through long-standing and extensive relationships with private equity firms, leveraged loan syndication desks, brokers, commercial and investment bankers, entrepreneurs, service providers such as lawyers and accountants, and current and former portfolio companies and investors. |
| · | Screening : Once it is determined that a potential investment has met our investment criteria, we will screen the investment by performing preliminary due diligence, which could include discussions with the private equity firm, management team, loan syndication desk, etc. Upon successful screening of the proposed investment, the investment team makes a recommendation to move forward and prepares an initial screening memo for the CSWC investment committee. We then issue either a non-binding term sheet (in the case of a directly originated transaction), or submit an order to the loan syndication desk (in the case of a large-market syndicated loan transaction). |
| · | Term Sheet : In a directly originated transaction, the non-binding term sheet will typically include the key economic terms of our investment proposal, along with exclusivity, confidentiality, and expense reimbursement provisions, among other terms relevant to the particular investment. Upon acceptance of the term sheet, we will begin our formal due diligence process. In a syndicated loan transaction, rather than a formal term sheet, we will submit an order for an allocation to the syndicated loan desk. |
| · | Due Diligence : Due diligence is performed under the direction of our senior investment professionals, involving the entire investment team as well as certain external resources, who together perform due diligence to understand the relationships among the prospective portfolio company’s business plan, operations, financial performance, and legal risks. On our directly originated transactions, our due diligence will often include (1) conducting site visits with management and key personnel; (2) performing a detailed review of historical and projected financial statements, often with a third-party accounting firm, to evaluate the target company’s normalized cash flow; (3) interviewing key customers and suppliers; (4) evaluating company management, including a formal background check; (5) reviewing material contracts; (6) conducting an industry, market and strategy analysis; and (7) obtaining a review by legal, environmental or other consultants. In instances where a financial sponsor is investing in the equity in a transaction, we will leverage work done by the financial sponsor for purposes of our due diligence. In syndicated loan transactions, our due diligence may exclude direct customer and supplier interviews, and be limited to review of reports from the financial sponsor or syndication agent for industry and market analysis, and legal and environmental diligence. |
| · | Document and Close : Upon completion of a satisfactory due diligence review, our investment team presents its written findings to the investment committee. For transactions that are either over a certain hold size, or outside our general investment policy, the investment team will present the transaction to our Board of Directors for approval. Upon approval for the investment, we re-confirm our regulatory company compliance, process and finalize all required legal documents and fund the investment. |
| · | Post-Investment : We continuously monitor the status and progress of our portfolio companies, as well as our investment thesis developed at the time of investment. We offer managerial assistance to our portfolio companies and provide them access to our investment experience, direct industry expertise and contacts. The same investment team leader that was involved in the investment process will continue to be involved in the portfolio company post-investment. This approach provides continuity of knowledge and allows the investment team to maintain a strong business relationship with the financial sponsor and key management of our portfolio companies. As part of the monitoring process, members of our investment team will analyze monthly, quarterly and annual financial statements against previous periods, review financial projections, meet with the financial sponsor and management (when necessary), attend board meetings (where appropriate) and review all compliance certificates and covenants. |
During the quarter ended December 31, 2015, we established an internally developed investment rating system to rate the performance and monitor the expected level of returns for each debt investment in our portfolio. The investment rating system takes into account both quantitative and qualitative factors of the portfolio company and the investments held therein, including each investment’s expected level of returns and the collectability of our debt investments, comparisons to competitors and other industry participants and the portfolio company's future outlook. The ratings are not intended to reflect the performance or expected level of returns of our equity investments.
| · | Investment Rating 1 represents the least amount of risk in our portfolio. The investment is performing above underwriting expectations and the trends and risk factors are favorable. |
| · | Investment Rating 2 indicates the investment is performing as expected at the time of underwriting and the risk factors are neutral to favorable. |
| · | Investment Rating 3 involves an investment performing below underwriting expectations and indicates that the investment requires closer monitoring. The portfolio company or investment may be out of compliance with financial covenants and interest payments may be impaired, however principal payments are generally not past due. |
| · | Investment Rating 4 indicates that the investment is performing materially below underwriting expectations and the risk of the investment has increased substantially. Interest and principal payments on our investment are likely to be impaired. |
Determination of Net Asset Value and Portfolio Valuation Process
We determine our net asset value (“NAV”) per share on a quarterly basis. The NAV per share is equal to our total assets minus liabilities divided by the total number of shares of common stock outstanding.
We determine in good faith the fair value of our portfolio investments pursuant to a valuation policy in accordance with Accounting Standards Codification (“ASC”) Topic 820,
Fair Value Measurements and Disclosures
(“ASC 820”) and a valuation process approved by our Board of Directors and in accordance with the 1940 Act. Our valuation policy is intended to provide a consistent basis for determining the fair value of the portfolio.
We undertake a multi-step valuation process each quarter in connection with determining the fair value of our investments. Our Board of Directors is ultimately responsible for overseeing, reviewing and approving, in good faith, our determination of the fair value of each investment in our portfolio. The valuation process is led by the finance department in conjunction with the investment teams. Valuations of each portfolio security are prepared quarterly by the finance department using updated portfolio company financial and operational information. Each investment valuation is also subject to review by the executive officers and investment teams.
In conjunction with the internal valuation process, we have engaged an independent consulting firm that specializes in financial due diligence, valuation, asset-backed lending services, and business advisory services, to provide a third-party valuation review of certain of our investments. Our Board of Directors is ultimately responsible for determining the fair value of our investments in good faith.
COMPETITION
We compete for attractive investment opportunities with other financial institutions, including business development companies, junior capital lenders, and banks. We believe we are able to be competitive with these entities primarily on the basis of the experience and contacts of our management team and our responsive and efficient investment analysis and decision-making processes. However, many of our competitors are substantially larger and have considerably greater financial, technical and marketing resources than we do. Furthermore, our competitors may have a lower cost of funds and many have access to funding sources that are not available to us. In addition, certain of our competitors may have higher risk tolerances or different risk assessments, which could allow them to consider a wider variety of investments, establish more relationships and build their market shares. In addition, many of our competitors are not subject to the regulatory restrictions that the 1940 Act imposes on us as a BDC. See “Risk Factors—Risks Related to Our Business and Structure—We Operate in a Highly Competitive Market for Investment Opportunities.”
We cannot assure you that the competitive pressures we face will not have a material adverse effect on our business, financial condition and results of operations. In addition, because of this competition, we may be unable to take advantage of attractive investment opportunities and may be unable to identify and make investments that satisfy our investment objectives or meet our investment goals.
DIVIDEND REINVESTMENT PLAN
We have adopted a dividend reinvestment plan ("DRIP") that provides for the reinvestment of dividends on behalf of our shareholders. Under the DRIP, if we declare a dividend, registered shareholders who have opted into the DRIP as of the dividend record date will have their dividend automatically reinvested into additional shares of our common stock. The share requirements of the DRIP may be satisfied through the issuance of new shares of common stock or through open market purchases of common stock by the DRIP plan administrator. Newly-issued shares will be valued based upon the final closing price of CSWC’s common stock on a valuation date determined for each dividend by our Board of Directors. Shares purchased in the open market to satisfy the DRIP requirements will be valued based upon the average price of the applicable shares purchased by the DRIP plan administrator, before any associated brokerage or other costs.
ELECTION TO BE REGULATED AS A BUSINESS DEVELOPMENT COMPANY AND REGULATED INVESTMENT COMPANY
Both CSWC and CSVC individually are closed-end, non-diversified management investment companies. CSWC has elected to be treated as a BDC under the 1940 Act. In addition, we have elected for both CSWC and CSVC to be treated as RICs under Subchapter M of the Code. Our election to be regulated as a BDC and our election to be treated as a RIC for federal income tax purposes have a significant impact on our operations. Some of the most important effects on our operations of our election to be regulated as a BDC and our election to be treated as a RIC are outlined below.
| · | We report our investments at market value or fair value with changes in value reported through our consolidated statements of operations. |
In accordance with the requirements of Article 6 of Regulation S-X, we report all of our investments, including debt investments, at market value or, for investments that do not have a readily available market value, at their “fair value” as determined in good faith by our Board of Directors. Changes in these values are reported through our statements of operations under the caption of “net unrealized appreciation (depreciation) of investments.” See “Determination of Net Asset Value and Portfolio Valuation Process” above.
| · | We intend to distribute substantially all of our income to our shareholders. We generally will be required to pay income taxes only on the portion of our taxable income we do not distribute to shareholders (actually or constructively). |
As a RIC, so long as we meet certain minimum distribution, source of income and asset diversification requirements, we generally are required to pay U.S. federal income taxes only on the portion of our taxable income and gains we do not distribute (actually or constructively) and certain built-in gains. We intend to distribute to our shareholders substantially all of our income. We may, however, make deemed distributions to our shareholders of any retained net long-term capital gains. If this happens, our shareholders will be treated as if they received an actual distribution of the net capital gains and reinvested the net after-tax proceeds in us. Our shareholders also may be eligible to claim a tax credit (or, in certain circumstances, a tax refund) equal to their allocable share of the corporate-level U.S. federal income tax we pay on the deemed distribution. See “Material U.S. Federal Income Tax Considerations.” We met the minimum distribution requirements for tax years 2013, 2014 and 2015 and continually monitor our distribution requirements with the goal of ensuring compliance with the Code.
In addition, we have a wholly-owned taxable subsidiary, or the Taxable Subsidiary, which holds a portion of one or more of our portfolio investments that are listed on the Consolidated Schedule of Investments. The Taxable Subsidiary is consolidated for financial reporting purposes in accordance with U.S. Generally Accepted Accounting Principles (“GAAP”), so that our consolidated financial statements reflect our investments in the portfolio companies owned by the Taxable Subsidiary. The purpose of the Taxable Subsidiary is to permit us to hold certain interests in portfolio companies that are organized as limited liability companies, or LLCs (or other forms of pass-through entities) and still satisfy the RIC tax requirement that at least 90.0% of our gross income for federal income tax purposes must consist of qualifying investment income. Absent the Taxable Subsidiary, a proportionate amount of any gross income of a partnership or LLC (or other pass-through entity) portfolio investment would flow through directly to us. To the extent that such income did not consist of investment income, it could jeopardize our ability to qualify as a RIC and therefore cause us to incur significant amounts of corporate-level U.S. federal income taxes. Where interests in LLCs (or other pass-through entities) are owned by the Taxable Subsidiary, however, the income from those interests is taxed to the Taxable Subsidiary and does not flow through to us, thereby helping us preserve our RIC status and resultant tax advantages. The Taxable Subsidiary is not consolidated for U.S. federal income tax purposes and may generate income tax expense as a result of their ownership of the portfolio companies. This income tax expense, if any, is reflected in our Statement of Operations.
| · | Our ability to use leverage as a means of financing our portfolio of investments is limited. |
As a BDC, we are required to meet a coverage ratio of total assets to total senior securities of at least 200.0%. For this purpose, senior securities include all borrowings and any preferred stock we may issue in the future. Additionally, our ability to utilize leverage as a means of financing our portfolio of investments may be limited by this asset coverage test. While the use of leverage may enhance returns if we meet our investment objective, our returns may be reduced or eliminated if our returns on investments are less than the costs of borrowing.
| · | We are required to comply with the provisions of the 1940 Act applicable to business development companies. |
As a BDC, we are required to have a majority of directors who are not “interested” persons under the 1940 Act. In addition, we are required to comply with other applicable provisions of the 1940 Act, including those requiring the adoption of a code of ethics, fidelity bonding and investment custody arrangements. See “Regulation as a Business Development Company” below.
Regulation as a Business Development Company
We have elected to be regulated as a BDC under the 1940 Act. The 1940 Act contains prohibitions and restrictions relating to transactions between BDCs and their affiliates and principal underwriters as well as their respective affiliates. The 1940 Act requires that a majority of the members of the board of directors of a BDC be persons other than “interested persons,” as defined in the 1940 Act. In addition, the 1940 Act provides that we may not change the nature of our business so as to cease to be, or to withdraw our election as, a BDC unless approved by holders of a majority of our outstanding voting securities.
The 1940 Act defines “a majority of the outstanding voting securities” as the lesser of (1) 67% or more of the voting securities of holders present or represented by proxy at a meeting if the holders of more than 50% of our outstanding voting securities are present or represented by proxy or (2) more than 50% of our voting securities.
The following is a brief description of the 1940 Act provisions applicable to BDCs, which is qualified in its entirety by reference to the full text of the 1940 Act and rules issued thereunder by the Securities and Exchange Commission (the “SEC”).
| · | Generally, to be eligible to elect BDC status, a company must primarily engage in the business of furnishing capital and making significant managerial assistance available to companies that do not have ready access to conventional financial channels. Companies that satisfy certain additional criteria are defined as "eligible portfolio companies." In general, in order to qualify as a BDC, a company must: (1) be a domestic company; (2) have registered a class of its securities pursuant to Section 12 of the Exchange Act; (3) operate for the purpose of investing in the securities of certain types of eligible portfolio companies, including early stage or emerging companies and businesses suffering or just recovering from financial distress (see following paragraph); (4) make available significant managerial assistance to such portfolio companies; and (5) file a proper notice of election with the SEC. |
| · | An eligible portfolio company generally is a domestic company that is not an investment company or is excluded from investment company status pursuant to exclusions for certain types of financial companies (such as brokerage firms, banks, insurance companies and investment banking firms) and that: (1) does not have a class of securities listed on a national securities exchange; (2) has a class of equity securities listed on a national securities exchange with a market capitalization of less than $250 million; or (3) is controlled by the BDC itself or together with others and has a representative on the board of directors of the company controlled by the BDC. The 1940 Act presumes that a person has “control” of a portfolio company if that person owns at least 25% of its outstanding voting securities. |
| · | As a BDC, we are required to provide and maintain a bond issued by a reputable fidelity insurance company. Furthermore, as a BDC, we are prohibited from protecting any director or officer against any liability to us or our shareholders arising from willful malfeasance, bad faith, gross negligence or reckless disregard of the duties involved in the conduct of that person’s office. |
| · | We are required to adopt and implement written policies and procedures reasonably designed to prevent violation of the federal securities laws, review these policies and procedures annually for their adequacy and the effectiveness of their implementation and designate a chief compliance officer to be responsible for administering these policies and procedures. |
Qualifying Assets
The 1940 Act provides that we may not make an investment in non-qualifying assets unless at the time of the investment at least 70% of the value of our total assets (measured as of the date of our most recently filed financial statements) consists of qualifying assets (the “70% test”). Qualifying assets include: (1) securities of eligible portfolio companies; (2) securities of certain companies that were eligible portfolio companies at the time we initially acquired their securities and in which we retain a substantial interest; (3) securities of certain controlled companies; (4) securities of certain bankrupt, insolvent or distressed companies; (5) securities received in exchange for or distributed in or with respect to any of the foregoing; and (6) cash items, U.S. government securities and high-quality short-term debt. The SEC has adopted a rule permitting a BDC to invest its funds in certain money market funds. The 1940 Act also places certain restrictions on the nature of the transactions in which, and the persons from whom, securities can be purchased and be considered qualifying assets.
Managerial Assistance to Portfolio Companies
In order to count portfolio securities as qualifying assets for the purpose of the 70% test, we must either control the issuer of the securities or must offer to make available to the issuer of the securities significant managerial assistance. However, where we purchase securities in conjunction with one or more other persons acting together, one of the other persons in the group may make available such managerial assistance. Making available managerial assistance means, among other things, any arrangement whereby the BDC, through its directors, officers or employees, offers to provide, and, if accepted, provides, significant guidance and counsel concerning the management, operations or business objectives and policies of a portfolio company.
Idle Fund Investments
We hold funds that may soon be invested in “qualifying assets.” We may hold these funds in cash, cash equivalents, U.S. government securities, short-term investments in secured debt investments, independently rated debt investments and diversified bond funds. We refer to these investments as idle fund investments.
Senior Securities
We are permitted by the 1940 Act, under specific conditions, to issue multiple classes of debt and a single class of preferred stock if our asset coverage, as defined by the 1940 Act, is at least 200% after such issuance of debt or preferred stock (i.e. senior securities may not be in excess of our net assets). Under specific conditions, we are also permitted by the 1940 Act to issue warrants.
Common Stock
As a BDC, the 1940 Act generally limits our ability to issue and sell our common stock at a price below our NAV per share, exclusive of any distributing commission or discount, without shareholder approval. Shares of our common stock have traded below our NAV per share. While our common stock continues to trade at a price below our NAV per share, there are no assurances that we can issue or sell shares of our common stock if needed to fund our business. In addition, even in certain instances where we could issue or sell shares of our common stock at a price below our NAV per share, such issuance could result in dilution in our NAV per share, which could result in a decline of our stock price.
Code of Ethics
We adopted a code of ethics pursuant to Rule 17j-1 under the 1940 Act that establishes procedures for personal investments and restricts certain personal securities transactions. Personnel subject to the code may invest in securities for their personal investment accounts including securities that may be purchased or held by us, so long as those investments are made in accordance with the code’s requirements. Certain transactions involving certain persons closely related to us, including our directors, officers and employees, may require approval of the SEC. However, the 1940 Act ordinarily does not restrict transactions between us and our portfolio companies.
Compliance Policies and Procedures
We have adopted and implemented written policies and procedures reasonably designed to prevent violation of the U.S. federal securities laws, and are required to review these compliance policies and procedures annually for their adequacy and the effectiveness of their implementation, and to designate a Chief Compliance Officer to be responsible for administering these policies and procedures. Michael S. Sarner serves as our Chief Compliance Officer.
Proxy Voting Policies and Procedures
We vote proxies relating to our portfolio securities in a manner which we believe will be in the best interest of our shareholders. We review on a case-by-case basis each proposal submitted to a shareholder vote to determine its impact on the portfolio securities held by us. Although we generally vote against proposals that may have a negative impact on our portfolio securities, we may vote for such a proposal if there exists compelling long-term reasons to do so.
Our proxy voting decisions are made by the investment professionals who are responsible for monitoring each of our investments. To ensure that our vote is not the product of a conflict of interest, we require that: (1) anyone involved in the decision making process disclose to our Chief Compliance Officer any potential conflict that he or she is aware of and any contact that he or she has had with any interested party regarding a proxy vote; and (2) employees involved in the decision making process or vote administration are prohibited from revealing how we intend to vote on a proposal in order to reduce any attempted influence from interested parties.
Shareholders may, without charge, obtain information regarding how we voted proxies with respect to our portfolio securities by making a written request for proxy voting information to: Chief Compliance Officer, 5400 Lyndon B. Johnson Freeway, Suite 1300, Dallas, Texas 75240.
Regulation as a Regulated Investment Company
Election to be Taxed as a RIC
We have qualified and elected to be treated as a RIC under Subchapter M of the Code. As a RIC, we generally are not subject to corporate-level U.S. federal income taxes on any income that we distribute to our shareholders from our tax earnings and profits. To qualify as a RIC, we must, among other things, meet certain source-of-income and asset diversification requirements (as described below). In addition, in order to obtain RIC tax treatment, we must distribute to our shareholders, for each taxable year, at least 90% of our “investment company taxable income,” which is generally our net ordinary income plus the excess, if any, of realized net short-term capital gain over realized net long-term capital loss, or the Annual Distribution Requirement. Even if we qualify as a RIC, we generally will be subject to corporate-level U.S. federal income tax on our undistributed taxable income and could be subject to U.S. federal excise, state, local and foreign taxes.
Taxation as a RIC
Provided that we qualify as a RIC, we will not be subject to U.S. federal income tax on the portion of our investment company taxable income and net capital gain (which we define as net long-term capital gain in excess of net short-term capital loss) that we timely distribute to shareholders. We will be subject to U.S. federal income tax at the regular corporate rates on any income or capital gain not distributed (or deemed distributed) to our shareholders.
We will be subject to a 4.0% nondeductible U.S. federal excise tax on certain undistributed income unless we distribute in a timely manner an amount at least equal to the sum of (1) 98.0% of our ordinary income for each calendar year, (2) 98.2% of our capital gain net income for the one year period ended October 31 and (3) any income recognized, but not distributed, in preceding years and on which we paid no U.S. federal income tax.
In order to qualify as a RIC for U.S. federal income tax purposes, we must, among other things:
| · | Meet the Annual Distribution Requirement; |
| · | Qualify to be treated as a BDC or be registered as a management investment company under the 1940 Act at all times during each taxable year; |
| · | Derive in each taxable year at least 90% of our gross income from dividends, interest, payments with respect to certain securities loans, gains from the sale or other disposition of stock or other securities or foreign currencies or other income derived with respect to our business of investing in such stock, securities or currencies and net income derived from an interest in a “qualified publicly traded partnership” (as defined in the Code), or the 90% Income Test; and |
| · | Diversify our holdings so that at the end of each quarter of the taxable year: |
| o | at least 50% of the value of our assets consists of cash, cash equivalents, U.S. Government securities, securities of other RICs, and other securities if such other securities of any one issuer do not represent more than 5% of the value of our assets or more than 10% of the outstanding voting securities of the issuer (which for these purposes includes the equity securities of a “qualified publicly traded partnership”); and |
| o | no more than 25% of the value of our assets is invested in the securities, other than U.S. Government securities or securities of other RICs, (1) of one issuer (2) of two or more issuers that are controlled, as determined under applicable tax rules, by us and that are engaged in the same or similar or related trades or businesses or (3) of one or more “qualified publicly traded partnerships,” or the Diversification Tests. |
To the extent that we invest in entities treated as partnerships for U.S. federal income tax purposes (other than a “qualified publicly traded partnership”), we generally must include the items of gross income derived by the partnerships for purposes of the 90% Income Test, and the income that is derived from a partnership (other than a “qualified publicly traded partnership”) will be treated as qualifying income for purposes of the 90% Income Test only to the extent that such income is attributable to items of income of the partnership which would be qualifying income if realized by us directly. In addition, we generally must take into account our proportionate share of the assets held by partnerships (other than a “qualified publicly traded partnership”) in which we are a partner for purposes of the Diversification Tests.
In order to meet the 90% Income Test, we have established a special purpose entity, and in the future may establish additional such entities, to hold assets from which we do not anticipate earning dividend, interest or other income under the 90% Income Test (the “Taxable Subsidiary”). Any investments held through a Taxable Subsidiary generally are subject to U.S. federal income and other taxes, and therefore we can expect to achieve a reduced after-tax yield on such investments.
We may be required to recognize taxable income in circumstances in which we do not receive a corresponding payment in cash. For example, if we hold debt obligations that are treated under applicable tax rules as having original issue discount (such as debt instruments with payment-in-kind interest or, in certain cases, increasing interest rates or issued with warrants), we must include in income each year a portion of the original issue discount that accrues over the life of the obligation, regardless of whether cash representing such income is received by us in the same taxable year. We anticipate that a portion of our income may constitute original issue discount or other income required to be included in taxable income prior to receipt of cash.
Because any original issue discount or other amounts accrued will be included in our investment company taxable income for the year of the accrual, we may be required to make a distribution to our shareholders in order to satisfy the Annual Distribution Requirement, even though we will not have received any corresponding cash amount. As a result, we may have difficulty meeting the annual distribution requirement necessary to obtain and maintain RIC tax treatment under the Code. We may have to sell some of our investments at times and/or at prices we would not consider advantageous, raise additional debt or equity capital or forgo new investment opportunities for this purpose. If we are not able to obtain cash from other sources, we may fail to qualify for RIC tax treatment and thus become subject to corporate-level income tax.
Furthermore, a portfolio company in which we invest may face financial difficulty that requires us to work-out, modify or otherwise restructure our investment in the portfolio company. Any such restructuring may result in unusable capital losses and future non-cash income. Any restructuring may also result in our recognition of a substantial amount of non-qualifying income for purposes of the 90% Income Test, such as cancellation of indebtedness income in connection with the work-out of a leveraged investment (which, while not free from doubt, may be treated as non-qualifying income) or the receipt of other non-qualifying income.
Gain or loss realized by us from warrants acquired by us as well as any loss attributable to the lapse of such warrants generally will be treated as capital gain or loss. Such gain or loss generally will be long-term or short-term, depending on how long we held a particular warrant.
Investments by us in non-U.S. securities may be subject to non-U.S. income, withholding and other taxes, and therefore, our yield on any such securities may be reduced by such non-U.S. taxes. Shareholders will generally not be entitled to claim a credit or deduction with respect to non-U.S. taxes paid by us.
We are authorized to borrow funds and to sell assets in order to satisfy distribution requirements. Under the 1940 Act, we are not permitted to make distributions to our shareholders while our debt obligations and other senior securities are outstanding unless certain “asset coverage” tests are met. See “Regulation as a Business Development Company” above. Moreover, our ability to dispose of assets to meet our distribution requirements may be limited by (1) the illiquid nature of our portfolio and/or (2) other requirements relating to our status as a RIC, including the Diversification Tests. If we dispose of assets in order to meet the Annual Distribution Requirement or to avoid the excise tax, we may make such dispositions at times that, from an investment standpoint, are not advantageous.
If we fail to satisfy the Annual Distribution Requirement or otherwise fail to qualify as a RIC in any taxable year, we will be subject to tax in that year on all of our taxable income, regardless of whether we make any distributions to our shareholders. In that case, all of such income will be subject to corporate-level U.S. federal income tax, reducing the amount available to be distributed to our shareholders. See “Failure To Obtain RIC Tax Treatment” below.
As a RIC, we are not allowed to carry forward or carry back a net operating loss for purposes of computing our investment company taxable income in other taxable years. U.S. federal income tax law generally permits a RIC to carry forward (1) the excess of its net short-term capital loss over its net long-term capital gain for a given year as a short-term capital loss arising on the first day of the following year and (2) the excess of its net long-term capital loss over its net short-term capital gain for a given year as a long-term capital loss arising on the first day of the following year. Future transactions we engage in may cause our ability to use any capital loss carryforwards, and unrealized losses once realized, to be limited under Section 382 of the Code. Certain of our investment practices may be subject to special and complex U.S. federal income tax provisions that may, among other things, (1) disallow, suspend or otherwise limit the allowance of certain losses or deductions, (2) convert lower taxed long-term capital gain and qualified dividend income into higher taxed short-term capital gain or ordinary income, (3) convert an ordinary loss or a deduction into a capital loss (the deductibility of which is more limited), (4) cause us to recognize income or gain without a corresponding receipt of cash, (5) adversely affect the time as to when a purchase or sale of stock or securities is deemed to occur, (6) adversely alter the characterization of certain complex financial transactions and (7) produce income that will not be qualifying income for purposes of the 90% Income Test. We will monitor our transactions and may make certain tax elections in order to mitigate the effect of these provisions.
As described above, to the extent that we invest in equity securities of entities that are treated as partnerships for U.S. federal income tax purposes, the effect of such investments for purposes of the 90% Income Test and the Diversification Tests will depend on whether or not the partnership is a “qualified publicly traded partnership” (as defined in the Code). If the entity is a “qualified publicly traded partnership,” the net income derived from such investments will be qualifying income for purposes of the 90% Income Test and will be “securities” for purposes of the Diversification Tests. If the entity is not treated as a “qualified publicly traded partnership,” however, the consequences of an investment in the partnership will depend upon the amount and type of income and assets of the partnership allocable to us. The income derived from such investments may not be qualifying income for purposes of the 90% Income Test and, therefore, could adversely affect our qualification as a RIC. We intend to monitor our investments in equity securities of entities that are treated as partnerships for U.S. federal income tax purposes to prevent our disqualification as a RIC.
We may invest in preferred securities or other securities the U.S. federal income tax treatment of which may not be clear or may be subject to recharacterization by the IRS. To the extent the tax treatment of such securities or the income from such securities differs from the expected tax treatment, it could affect the timing or character of income recognized, requiring us to purchase or sell securities, or otherwise change our portfolio, in order to comply with the tax rules applicable to RICs under the Code.
We may distribute taxable dividends that are payable in cash or shares of our common stock at the election of each shareholder. Under certain applicable provisions of the Code and the Treasury regulations, distributions payable in cash or in shares of stock at the election of shareholders are treated as taxable dividends. The Internal Revenue Service has issued private rulings indicating that this rule will apply even where the total amount of cash that may be distributed is limited to no more than 20% of the total distribution. Under these rulings, if too many shareholders elect to receive their distributions in cash, each such shareholder would receive a pro rata share of the total cash to be distributed and would receive the remainder of their distribution in shares of stock. If we decide to make any distributions consistent with these rulings that are payable in part in our stock, taxable shareholders receiving such dividends will be required to include the full amount of the dividend (whether received in cash, our stock, or a combination thereof) as ordinary income (or as long-term capital gain to the extent such distribution is properly reported as a capital gain dividend) to the extent of our current and accumulated earnings and profits for United States federal income tax purposes. As a result, a U.S. shareholder may be required to pay tax with respect to such dividends in excess of any cash received. If a U.S. shareholder sells the stock it receives in order to pay this tax, the sales proceeds may be less than the amount included in income with respect to the dividend, depending on the market price of our stock at the time of the sale. Furthermore, with respect to non-U.S. shareholders, we may be required to withhold U.S. tax with respect to such dividends, including in respect of all or a portion of such dividend that is payable in stock. In addition, if a significant number of our shareholders determine to sell shares of our stock in order to pay taxes owed on dividends, it may put downward pressure on the trading price of our stock.
Failure to Obtain RIC Tax Treatment
If we fail to satisfy the 90% Income Test or the Diversification Tests for any taxable year, we may nevertheless continue to qualify as a RIC for that year if certain relief provisions are applicable (which may, among other things, require us to pay certain corporate-level federal taxes or to dispose of certain assets).
If we were unable to obtain tax treatment as a RIC, we would be subject to tax on all of our taxable income at regular corporate rates. We would not be able to deduct distributions to shareholders, nor would they be required to be made. Distributions would generally be taxable to our shareholders as dividend income to the extent of our current and accumulated earnings and profits (in the case of non-corporate U.S. shareholders, generally at a maximum federal income tax rate applicable to qualified dividend income of 20.0%). Subject to certain limitations under the Code, corporate distributees would be eligible for the dividends-received deduction. Distributions in excess of our current and accumulated earnings and profits would be treated first as a return of capital to the extent of the shareholder’s tax basis, and any remaining distributions would be treated as a capital gain.
If we fail to meet the RIC requirements for more than two consecutive years and then, seek to re-qualify as a RIC, we would be subject to corporate-level taxation on any built-in gain recognized during the succeeding 5-year period unless we made a special election to recognize all that built-in gain upon our re-qualification as a RIC and to pay the corporate-level tax on that built-in gain.
SMALL BUSINESS INVESTMENT COMPANY REGULATIONS
CSVC is licensed by the Small Business Administration (“SBA”) to operate as an SBIC under Section 301(c) of the Small Business Investment Act of 1958.
SBICs are designed to stimulate the flow of private equity capital to eligible small businesses. Under SBIC regulations, an SBIC may make loans to eligible small businesses, invest in equity securities of those businesses and provide them with consulting and advisory services.
Under current SBIC regulations, eligible small businesses generally include businesses that (together with their affiliates) have a tangible net worth not exceeding $19.5 million and have average annual net income after federal income taxes not exceeding $6.5 million (average net income to be computed without benefit of any carryover loss) for the two most recent fiscal years. In addition, an SBIC must devote at least 25% of its investment activity to “smaller” enterprises as defined by the SBA. A smaller enterprise generally includes businesses that have a tangible net worth not exceeding $6 million and have average annual net income after federal income taxes not exceeding $2 million (average net income to be computed without benefit of any net carryover loss) for the two most recent fiscal years. SBIC regulations also provide alternative size standard criteria to determine eligibility for designation as an eligible small business or smaller concern, which criteria depend on the primary industry in which the business is engaged and are based on factors such as the number of employees and gross revenue. However, once an SBIC has invested in a company, it may continue to make follow-on investments in the company, regardless of the size of the portfolio company at the time of the follow-on investment, up to the time of the portfolio company’s initial public offering.
The SBA prohibits an SBIC from providing funds (1) to small businesses for certain purposes, such as relending and investment outside the United States, (2) to businesses engaged in certain prohibited industries, and (3) to certain “passive” (non-operating) companies. In addition, without prior SBA approval, an SBIC may not invest an amount equal to more than approximately 30% of the SBIC’s regulatory capital in any one portfolio company and its affiliates.
The SBA places certain limitations on the financing terms of investments by SBICs in portfolio companies (such as limiting the permissible interest rate on debt securities held by an SBIC in a portfolio company). Although prior regulations prohibited an SBIC from controlling a small business concern except in limited circumstances, regulations adopted by the SBA in 2002 now allow an SBIC to exercise control over a small business for a period of seven years from the date on which the SBIC initially acquires its control position. This control period may be extended for an additional period of time with the SBA’s prior written approval.
The SBA restricts the ability of an SBIC to lend money to any of its officers, directors and employees or to invest in affiliates thereof. The SBA also prohibits, without prior SBA approval, a “change of control” of an SBIC or transfers that would result in any person (or a group of persons acting in concert) owning 10% or more of any class of capital stock of a licensed SBIC. A “change of control” is any event which would result in the transfer of the power, direct or indirect, to direct the management and policies of an SBIC, whether through ownership, contractual arrangements or otherwise.
An SBIC (or group of SBICs under common control) may generally have outstanding debentures guaranteed by the SBA in amounts up to twice the amount of the privately-raised funds of the SBIC(s). Debentures guaranteed by the SBA have a maturity of 10 years, require semi-annual payments of interest, and do not require any principal payments prior to maturity. As of March 31, 2016 and 2015, we had no SBA-guaranteed debentures.
SBICs must invest idle funds that are not being used to make loans in investments permitted under SBIC regulations in the following limited types of securities: (1) direct obligations of, or obligations guaranteed as to principal and interest by, the United States government, which mature within 15 months from the date of the investment; (2) repurchase agreements with federally insured institutions with a maturity of seven days or less (and the securities underlying the repurchase obligations must be direct obligations of or guaranteed by the federal government); (3) certificates of deposit with a maturity of one year or less, issued by a federally insured institution; (4) deposit accounts in a federally insured institution that is subject to a withdrawal restriction of one year or less; (5) checking accounts in a federally insured institution; or (6) a reasonable petty cash fund.
SBICs are periodically examined and audited by the SBA’s staff to determine their compliance with SBIC regulations and are periodically required to file forms with the SBA.
MATERIAL U.S. FEDERAL INCOME TAX CONSIDERATIONS
The following discussion is a general summary of the material U.S. federal income tax considerations applicable to us and to an investment in our shares. This summary does not purport to be a complete description of the income tax considerations applicable to us or to investors in such an investment. For example, we have not described tax consequences that we assume to be generally known by investors or certain considerations that may be relevant to certain types of holders subject to special treatment under U.S. federal income tax laws, including shareholders subject to the alternative minimum tax, tax-exempt organizations, insurance companies, dealers in securities, pension plans and trusts, financial institutions, U.S. shareholders (as defined below) whose functional currency is not the U.S. dollar, persons who mark-to-market our shares and persons who hold our shares as part of a “straddle,” “hedge” or “conversion” transaction. This summary assumes that investors hold shares of our common stock as capital assets (within the meaning of the Code). The discussion is based upon the Code, Treasury regulations, and administrative and judicial interpretations, each as of the date of this Annual Report on Form 10-K and all of which are subject to change, possibly retroactively, which could affect the continuing validity of this discussion. This summary does not discuss any aspects of U.S. estate or gift tax or foreign, state or local tax. It does not discuss the special treatment under U.S. federal income tax laws that could result if we invested in tax-exempt securities or certain other investment assets.
For purposes of our discussion, a “U.S. shareholder” means a beneficial owner of shares of our common stock that is for U.S. federal income tax purposes:
| · | A citizen or individual resident of the United States; |
| · | A corporation, or other entity treated as a corporation for U.S. federal income tax purposes, created or organized in or under the laws of the United States or any state thereof of the District of Columbia; |
| · | An estate, the income of which is subject to U.S. federal income taxation regardless of its source; or |
| · | A trust if (1) a U.S. court is able to exercise primary supervision over the administration of the trust and one of more U.S. persons have the authority to control all substantial decisions of the trust or (2) it has a valid election in place to be treated as a U.S. person. |
For purposes of our discussion, a “Non-U.S. shareholder” means a beneficial owner of shares of our common stock that is neither a U.S. shareholder nor a partnership (including an entity treated as a partnership for U.S. federal income tax purposes).
If an entity treated as a partnership for U.S. federal income tax purposes (a “partnership”) holds shares of our common stock, the tax treatment of a partner or member of the partnership will generally depend upon the status of the partner or member and the activities of the partnership. A prospective shareholder that is a partner or member in a partnership holding shares of our common stock should consult his, her or its tax advisors with respect to the purchase, ownership and disposition of shares of our common stock.
Tax matters are very complicated and the tax consequences to an investor of an investment in our shares will depend on the facts of his, her or its particular situation. We encourage investors to consult their own tax advisors regarding the specific consequences of such an investment, including tax reporting requirements, the applicability of U.S. federal, state, local and foreign tax laws, eligibility for the benefits of any applicable tax treaty and the effect of any possible changes in the tax laws.
Taxation of U.S. Shareholders
Whether an investment in shares of our common stock is appropriate for a U.S. shareholder will depend upon that person’s particular circumstances. An investment in shares of our common stock by a U.S. shareholder may have adverse tax consequences. The following summary generally describes certain U.S. federal income tax consequences of an investment in shares of our common stock by taxable U.S. shareholders and not by U.S. shareholders that are generally exempt from U.S. federal income taxation. U.S. shareholders should consult their own tax advisors before making an investment in our common stock.
Distributions by us generally are taxable to U.S. shareholders as ordinary income or capital gain. Distributions of our “investment company taxable income” (which generally is our ordinary income excluding net capital gain) will be taxable as ordinary income to U.S. shareholders to the extent of our current or accumulated earnings and profits, whether paid in cash or reinvested in additional common stock. To the extent such distributions paid by us to non-corporate U.S. shareholders (including individuals) are attributable to dividends from U.S. corporations and certain qualified foreign corporations, such distributions generally will be eligible for taxation at rates applicable to “qualifying dividends” at a maximum federal income tax rate of 20% provided that we properly report such distribution as “qualified dividend income” in a written statement furnished to our shareholders and certain holding period and other requirements are satisfied. In this regard, it is not anticipated that a significant portion of distributions paid by us will be attributable to qualifying dividends; therefore, our distributions generally will not qualify for the preferential rates applicable to qualified dividend income. Distributions of our net capital gain (which generally is our net long-term capital gain in excess of net short-term capital loss) properly designated by us as “capital gain dividends” will be taxable to a U.S. shareholder as long-term capital gain (at a maximum federal income tax rate of 20% in the case of individuals, trusts or estates), regardless of the U.S. shareholder’s holding period for his, her or its common stock and regardless of whether paid in cash or reinvested in additional common stock. Distributions in excess of our current and accumulated earnings and profits first will reduce a U.S. shareholder’s adjusted tax basis in such shareholder’s common stock and, after the adjusted basis is reduced to zero, will constitute capital gain to such U.S. shareholder.
In lieu of actually distributing our realized net capital gains, we may retain some or all of our long-term capital gain and elect to be deemed to have made a distribution of the retained portion to our shareholders (a “deemed distribution”) under the “designated undistributed capital gains” rule of the Code. In that case, among other consequences, we will pay tax on the retained amount, each U.S. shareholder will be required to include his, her or its proportionate share of the deemed distribution in income as if it had been actually distributed to the U.S. shareholder, and the U.S. shareholder will be entitled to claim a credit equal to his, her or its allocable share of the tax paid thereon by us. The amount of the deemed distribution net of such tax will be added to the U.S. shareholder’s tax basis for his, her or its common stock. Since we expect to pay tax on any retained capital gain at our regular corporate tax rate, and since that rate is in excess of the maximum rate currently payable by individuals on net capital gain, the amount of tax that individual shareholders will be treated as having paid and for which they will receive a credit will exceed the tax they owe on the retained net capital gain. Such excess generally may be claimed as a credit against the U.S. shareholder’s other U.S. federal income tax obligations or may be refunded to the extent it exceeds a shareholder’s liability for U.S. federal income tax. A shareholder that is not subject to U.S. federal income tax or otherwise required to file a U.S. federal income tax return would be required to file a U.S. federal income tax return on the appropriate form in order to claim a refund for the taxes we paid. In order to utilize the deemed distribution approach, we must provide written notice to our shareholders prior to the expiration of 60 days after the close of the relevant taxable year. We cannot treat any of our investment company taxable income as a “deemed distribution.”
We could be subject to the alternative minimum tax, or the AMT, but any items that are treated differently for AMT purposes must be apportioned between us and our shareholders and this may affect U.S. shareholders’ AMT liabilities. Although regulations explaining the precise method of apportionment have not yet been issued, such items will generally be apportioned in the same proportion that distributions paid to each shareholder bear to our taxable income (determined without regard to the dividends paid deduction), unless a different method for a particular item is warranted under the circumstances.
For purposes of determining (1) whether the Annual Distribution Requirement is satisfied for any year and (2) the amount of capital gain dividends paid for that year, we may, under certain circumstances, elect to treat a dividend that is paid during the following taxable year as if it had been paid during the taxable year in question. If we make such an election, the U.S. shareholder will still be treated as receiving the dividend in the taxable year in which the distribution is made. However, any dividend declared by us in October, November or December of any calendar year, payable to shareholders of record on a specified date in any such month and actually paid during January of the following year, will be treated as if it had been received by our U.S. shareholders on December 31 of the year in which the dividend was declared.
If an investor purchases shares of our common stock shortly before the record date of a distribution, the price of the shares will include the value of the distribution, and the investor will be subject to tax on the distribution even though it represents a return of his, her or its investment.
A U.S. shareholder generally will recognize taxable gain or loss if the shareholder sells or otherwise disposes of his, her or its shares of our common stock. The amount of gain or loss will be measured by the difference between such shareholder’s adjusted tax basis in the common stock sold and the amount of the proceeds received in exchange. Any gain arising from such sale or disposition generally will be treated as long-term capital gain or loss if the shareholder has held his, her or its shares for more than one year. Otherwise, it will be classified as short-term capital gain or loss. However, any capital loss arising from the sale or disposition of shares of our common stock held for six months or less will be treated as long-term capital loss to the extent of the amount of capital gain dividends received, or undistributed capital gain deemed received, with respect to such shares. In addition, all or a portion of any loss recognized upon a disposition of shares of our common stock may be disallowed if other substantially identical shares are purchased (whether through reinvestment of distributions or otherwise) within 30 days before or after the disposition. The ability to otherwise deduct capital loss may be subject to other limitations under the Code.
In general, non-corporate U.S. shareholders, including individuals, trusts and estates, are subject to U.S. federal income tax at a maximum rate of 15% on their net capital gain, or the excess of realized net long-term capital gain over realized net short-term capital loss for a taxable year, including a long-term capital gain derived from an investment in our shares. Such rate is lower than the maximum rate on ordinary income currently payable by individuals. Corporate U.S. shareholders currently are subject to U.S. federal income tax on net capital gain at the maximum 35% rate also applied to ordinary income. Non-corporate shareholders with net capital loss for a year (which we define as capital loss in excess of capital gain) generally may deduct up to $3,000 of such losses against their ordinary income each year; any net capital loss of a noncorporate shareholder in excess of $3,000 generally may be carried forward and used in subsequent years as provided in the Code. Corporate shareholders generally may not deduct any net capital loss for a year, but may carry back such losses for three years or carry forward such losses for five years.
Certain U.S. shareholders who are individuals, estates or trusts generally are subject to a 3.8% Medicare tax on, among other things, dividends on, and capital gain from the sale or other disposition of, shares of our common stock.
A “publicly offered” RIC is a RIC whose shares are either (1) continuously offered pursuant to a public offering, (2) regularly traded on an established securities market or (3) held by at least 500 persons at all times during the taxable year. If we are not a publicly offered RIC for any period, a non-corporate shareholder’s pro rata portion of our affected expenses, including our management fees, will be treated as an additional dividend to the shareholder and will be deductible by such shareholder only to the extent permitted under the limitations described below. For non-corporate shareholders, including individuals, trusts, and estates, significant limitations generally apply to the deductibility of certain expenses of a non-publicly offered RIC, including advisory fees. In particular, these expenses, referred to as miscellaneous itemized deductions, are deductible only to individuals to the extent they exceed 2% of such a shareholder’s adjusted gross income, and are not deductible for AMT purposes. Because we anticipate that shares of our common stock will continue to be regularly traded on an established securities market, we believe that we will continue to qualify as a “publicly offered regulated investment company.”
We will send to each of our U.S. shareholders, as promptly as possible after the end of each calendar year, a written statement detailing, on a per share and per distribution basis, the amounts includible in such U.S. shareholder’s taxable income for such year as ordinary income and as long-term capital gain. In addition, the U.S. federal tax status of each year’s distributions generally will be reported to the IRS. Distributions paid by us generally will not be eligible for the dividends-received deduction or the preferential tax rate applicable to qualifying dividends. Distributions may also be subject to additional state, local and foreign taxes depending on a U.S. shareholder’s particular situation.
We may be required to withhold U.S. federal income tax, or backup withholding at a rate of 28.0%, from all taxable distributions to any non-corporate U.S. shareholder (1) who fails to furnish us with a correct taxpayer identification number or a certificate that such shareholder is exempt from backup withholding or (2) with respect to whom the IRS notifies us that such shareholder has failed to properly report certain interest and dividend income to the IRS and to respond to notices to that effect. An individual’s taxpayer identification number is his or her social security number. Backup withholding tax is not an additional tax, and any amount withheld may be refunded or credited against the U.S. shareholder’s U.S. federal income tax liability, provided that proper information is timely provided to the IRS.
For taxable years beginning after December 31, 2013, if certain disclosure requirements related to U.S. accounts or ownership are not satisfied, a U.S. federal withholding tax at a 30.0% rate will be imposed on dividends received by U.S. shareholders that own their stock through foreign accounts or foreign intermediaries. In addition, for taxable years beginning after December 31, 2016, if certain disclosure requirements related to U.S. accounts or ownership are not satisfied, a U.S. federal withholding tax at a 30.0% rate will be imposed on proceeds of sale in respect of our stock received by U.S. shareholders that own their stock through foreign accounts or foreign intermediaries. We will not pay any additional amounts in respect of any amounts withheld.
Under U.S. Treasury regulations, if a shareholder recognizes a loss with respect to shares of our stock of $2 million or more for an individual, S corporation, trust or a partnership with at least one non-corporate partner or $10 million or more for a shareholder that is either a corporation or a partnership with only corporate partners in any single taxable year (or a greater loss over a combination of years), the shareholder must file with the IRS a disclosure statement on IRS Form 8886 (or successor form). Direct shareholders of portfolio securities in many cases are exempted from this reporting requirement, but under current guidance, shareholders of a RIC are not exempted. Future guidance may extend the current exception from this reporting requirement to shareholders of most or all RICs. The fact that a loss is reportable under these regulations does not affect the legal determination of whether the taxpayer’s treatment of the loss is proper. Significant monetary penalties apply to a failure to comply with this reporting requirement. States may also have a similar reporting requirement. Shareholders should consult their own tax advisors to determine the applicability of these regulations in light of their individual circumstances.
Taxation of Non-U.S. Shareholders
Whether an investment in the shares is appropriate for a Non-U.S. shareholder will depend upon that person’s particular circumstances. An investment in the shares by a Non-U.S. shareholder may have adverse tax consequences. Non-U.S. shareholders should consult their tax advisers before investing in our common stock.
Distributions of our “investment company taxable income” to Non-U.S. shareholders that are not “effectively connected” with a U.S. trade or business carried on by the Non-U.S. shareholder, will generally be subject to withholding of U.S. federal income tax at a rate of 30% (or lower rate provided by an applicable treaty) to the extent of our current and accumulated earnings and profits, unless an applicable exception applies.
Actual or deemed distributions of our net capital gain to a Non-U.S. shareholder, and gains realized by a Non-U.S. shareholder upon the sale of our common stock, that are not effectively connected with a U.S. trade or business carried on by the Non-U.S. shareholder, will generally not be subject to U.S. federal withholding tax and generally will not be subject to U.S. federal income tax unless the Non-U.S. shareholder is a nonresident alien individual and is physically present in the United States for more than 182 days during the taxable year and meets certain other requirements. However, withholding of U.S. federal income tax at a rate of 30.0% on capital gain of nonresident alien individuals who are physically present in the United States for more than the 182 day period only applies in exceptional cases because any individual present in the United States for more than 182 days during the taxable year is generally treated as a resident for U.S. income tax purposes; in that case, he or she would be subject to U.S. income tax on his or her worldwide income at the graduated rates applicable to U.S. citizens, rather than the 30% U.S. federal withholding tax.
If we distribute our net capital gain in the form of deemed rather than actual distributions (which we may do in the future), a Non-U.S. shareholder will be entitled to a U.S. federal income tax credit or tax refund equal to the shareholder’s allocable share of the tax we pay on the capital gain deemed to have been distributed. In order to obtain the refund, the Non-U.S. shareholder must obtain a U.S. taxpayer identification number and file a U.S. federal income tax return even if the Non-U.S. shareholder would not otherwise be required to obtain a U.S. taxpayer identification number or file a U.S. federal income tax return. Accordingly, investment in the shares may not be appropriate for a Non-U.S. shareholder.
Distributions of our “investment company taxable income” and net capital gain (including deemed distributions) to Non-U.S. shareholders, and gain realized by Non-U.S. shareholders upon the sale of our common stock that is “effectively connected” with a U.S. trade or business carried on by the Non-U.S. shareholder (or if an income tax treaty applies, attributable to a “permanent establishment” in the United States), will be subject to U.S. federal income tax at the graduated rates applicable to U.S. citizens, residents and domestic corporations. Corporate Non-U.S. shareholders may also be subject to an additional branch profits tax at a rate of 30% imposed by the Code (or lower rate provided by an applicable treaty). In the case of a non-corporate Non-U.S. shareholder, we may be required to withhold U.S. federal income tax from distributions that are otherwise exempt from withholding tax (or taxable at a reduced rate) unless the Non-U.S. shareholder certifies his or her foreign status under penalties of perjury or otherwise establishes an exemption.
The tax consequences to a Non-U.S. shareholder entitled to claim the benefits of an applicable tax treaty may differ from those described herein. Non-U.S. shareholders are advised to consult their own tax advisers with respect to the particular tax consequences to them of an investment in our shares.
Dividends distributed by CSWC as a regulated investment company may constitute interest-related dividends under Sections 871(k) and 881(e) of the Code to the extent paid out of U.S. source earnings that would have qualified for an exemption from U.S. nonresident withholding tax if a non-U.S. resident received such earnings directly. This provision of the Code had expired for tax years beginning after December 31, 2014. This provision was extended retroactively for the 2015 tax year and made permanent prospectively. As a result, ordinary dividends paid in the future by CSWC may be considered interest-related dividends and as such are not subject to U.S. nonresident withholding tax for non-U.S. residents.
A Non-U.S. shareholder who is a nonresident alien individual may be subject to information reporting and backup withholding of U.S. federal income tax on dividends unless the Non-U.S. shareholder provides us or the dividend paying agent with an IRS Form W-8BEN (or an acceptable substitute form) or otherwise meets documentary evidence requirements for establishing that it is a Non-U.S. shareholder or otherwise establishes an exemption from backup withholding.
Generally, for taxable years beginning after December 31, 2013, if certain disclosure requirements related to U.S. accounts or ownership are not satisfied, a U.S. federal withholding tax of 30.0% may be imposed on dividends received by foreign shareholders, or U.S. shareholders that own their stock through foreign accounts or foreign intermediaries. For certain investors that held their stock prior to July 1, 2014, transition rules may apply to defer applicable of these rules until July 1, 2016. In addition, for taxable years beginning after December 31, 2016, if certain disclosure requirements related to U.S. accounts or ownership are not satisfied, a U.S. federal withholding tax at a 30% rate may also be imposed on gross proceeds of sale in respect of stock received by foreign shareholders and U.S. shareholders that own their stock through foreign accounts or foreign intermediaries. Any such withholding would be subtracted from amounts otherwise due to shareholders and are not reimbursable by the Company.
Non-U.S. persons should consult their own tax advisors with respect to the U.S. federal income tax and withholding tax, and state, local and foreign tax consequences of an investment in the shares.
Possible Legislative or Other Actions Affecting Tax Considerations
Prospective investors should recognize that the present U.S. federal income tax treatment of an investment in our stock may be modified by legislative, judicial or administrative action at any time, and that any such action may affect investments and commitments previously made. The rules dealing with U.S. federal income taxation are constantly under review by persons involved in the legislative process any by the IRS and the U.S. Treasury Department, resulting in revisions of regulations and revised interpretations of established concepts as well as statutory changes. Revisions in U.S. federal tax laws and interpretations thereof could affect the tax consequences of an investment in our stock.
State and Local Tax Treatment
The state and local tax treatment may differ from federal income tax treatment.
The discussion set forth herein does not constitute tax advice, and potential investors should consult their own tax advisors concerning the tax considerations relevant to their particular situation.
THE NASDAQ GLOBAL SELECT MARKET CORPORATE GOVERNANCE REGULATIONS
The NASDAQ Global Select Market (“NASDAQ”) has adopted corporate governance listing standards with which listed companies must comply in order to remain listed. We believe that we are in compliance with these corporate governance listing standards. We intend to monitor our compliance with future listing standards and to take all necessary actions to ensure that we remain in compliance.
SECURITIES ACT OF 1934 AND SARBANES-OXLEY ACT COMPLIANCE
We are subject to the reporting and disclosure requirements of the Exchange Act, including the filing of quarterly, annual and current reports, proxy statements and other required items. In addition, we are subject to the Sarbanes-Oxley Act of 2002 and regulations promulgated thereunder, which imposes a wide variety of regulatory requirements on publicly-held companies and their insiders. For example:
| · | Pursuant to Rule 13a-14 of the Exchange Act, our Chief Executive Officer and Chief Financial Officer are required to certify the accuracy of the financial statements contained in our periodic reports; |
| · | Pursuant to Item 307 of Regulation S-K, our periodic reports are required to disclose our conclusions about the effectiveness of our disclosure controls and procedures; |
| · | Pursuant to Rule 13a-15 of the Exchange Act, our management is required to prepare a report on its assessment of our internal control over financial reporting, and we engage an independent registered public accounting firm to separately audit our internal control over financial reporting; and |
| · | Pursuant to Item 308 of Regulation S-K and Rule 13a-15 of the Exchange Act, our periodic reports must disclose whether there were significant changes in our internal control over financial reporting or in other factors that could significantly affect these controls subsequent to the date of their evaluation, including any corrective actions with regard to significant deficiencies and material weaknesses. |
Investing in our common stock involves a number of significant risks. In addition to other information contained in this Annual Report on Form 10-K, investors should consider the following information before making an investment in our common stock. The risks and uncertainties described below could adversely affect the material risks we face. Risks and uncertainties not presently known to us, or not presently deemed material by us, may also impair our operations and performance. If any of the following risks actually occur, our business, financial condition or results of operations could be materially adversely affected. If that happens, the trading price of our common stock could decline, and you may lose all or part of your investment.
RISKS RELATED TO OUR BUSINESS AND STRUCTURE
Our investment portfolio is and will continue to be recorded at fair value. Our Board of Directors has final responsibility for overseeing, reviewing and approving, in good faith, our fair value determination. As a result of recording our investments at fair value, there is and will continue to be subjectivity as to the value of our portfolio investments.
Under the 1940 Act, we are required to carry our portfolio investments at market value or, if there is no readily available market value, at fair value as determined by us, with our Board of Directors having final responsibility for overseeing, reviewing and approving, in good faith, our fair value determination. Typically, there is not a public market for the securities of the privately held companies in which we have invested and will continue to invest. As a result, we value these securities quarterly at fair value based on inputs from management and our investment team, along with the oversight, review and approval of our Board of Directors.
The determination of fair value and consequently, the amount of unrealized gains and losses in our portfolio, are to a certain degree, subjective and dependent on a valuation process approved by our Board of Directors. Certain factors that may be considered in determining the fair value of our investments include external events, such as private mergers, sales and acquisitions involving comparable companies. Because of the inherent uncertainty of the valuation of portfolio securities which do not have readily ascertainable market values, our fair value determinations may differ materially from the values a third party would be willing to pay for our securities or the values which would be applicable to unrestricted securities having a public market. Due to this uncertainty, our fair value determinations may cause our net asset value on a given date to materially understate or overstate the value that we may ultimately realize on one or more of our investments. As a result, investors purchasing our common stock based on an overstated net asset value may pay a higher price than the value of our investments might warrant. Conversely, investors selling shares during a period in which the net asset value understates the value of our investments may receive a lower price for their shares than the value of our investments might warrant.
Our financial condition and results of operations will depend on our ability to effectively allocate and manage capital.
Our ability to achieve our investment objective of maximizing risk-adjusted returns to shareholders depends on our ability to effectively allocate and manage capital. Capital allocation depends, in part, upon our investment team’s ability to identify, evaluate, invest in and monitor companies that meet our investment criteria.
Accomplishing our investment objectives is largely a function of our investment team’s management of the investment process and our access to investments offering attractive risk adjusted returns. In addition, members of our investment team are called upon, from time to time, to provide managerial assistance to some of our portfolio companies.
The results of our operations depend on many factors, including the availability of opportunities for investment, readily accessible short and long-term funding alternatives in the financial markets and economic conditions. Our ability to make new investments at attractive relative valuations is also a function of our marketing and our management of the investment process. If we fail to invest our capital effectively, our return on equity may be negatively impacted, which could have a material adverse effect on the price of the shares of our common stock.
We operate in a highly competitive market for investment opportunities
.
We compete for attractive investment opportunities with other financial institutions, including business development companies, junior capital lenders, and banks. Some of these competitors are substantially larger and have greater financial, technical and marketing resources, and some are subject to different, and frequently less stringent, regulations. Our spin-off of 63.5% of our total net asset value increased any size advantages our competitors may enjoy. Our competitors may have a lower cost of funds and may have access to funding sources that are not available to us. Furthermore, many of our competitors are not subject to the regulatory restrictions that the 1940 Act imposes on us as a BDC. As a result of this competition, we may not be able to take advantage of attractive investment opportunities from time to time, and there can be no assurance that we will be able to identify and make investments that satisfy our objectives. A significant increase in the number and/or size of our competitors in our target market could force us to accept less attractive investment terms. We cannot assure you that the competitive pressures we face will not have a materially adverse effect on our business, financial condition and results of operation.
The capital markets may experience periods of disruption and instability. Such market conditions may materially and adversely affect debt and equity capital markets in the United States, which may have a negative impact on our business and operations.
The U.S. capital markets experienced increased volatility and disruption over the past several years, leading to increased investor uncertainty and depressed levels of consumer and commercial spending. Disruptions in the capital markets increased the spread between the yields realized on risk-free and higher risk securities, resulting in illiquidity in parts of the capital markets. We cannot provide any assurance that these conditions will not worsen. If these conditions continue or worsen, the prolonged period of market illiquidity may have an adverse effect on our business, financial condition, and results of operations. Unfavorable economic conditions also could increase our funding costs, limit our access to the capital markets or result in a decision by lenders not to extend credit to us. These events could limit our investment originations, limit our ability to grow and negatively impact our operating results.
In addition, significant changes or volatility in the capital markets may also have a negative effect on the valuations of our investments. While most of our investments are not publicly traded, applicable accounting standards require us to assume as part of our valuation process that our investments are sold in a principal market to market participants (even if we plan on holding an investment through its maturity). Significant changes in the capital markets may also affect the pace of our investment activity and the potential for liquidity events involving our investments. Thus, the illiquidity of our investments may make it difficult for us to sell our investments to access capital if required, and as a result, we could realize significantly less than the value at which we have recorded our investments if we were required to sell them for liquidity purposes. An inability to raise or access capital could have a material adverse effect on our business, financial condition or results of operations.
If the Share Distribution is ultimately determined to be taxable for U.S. federal income tax purposes, our shareholders could incur significant U.S. federal income tax liabilities.
A condition to the Share Distribution was CSWC’s receipt of an opinion from the accounting firm of KPMG substantially to the effect that the Share Distribution should qualify as tax free under Sections 355, 368(a)(1)(D) and related provisions of the Code. An opinion of an accounting firm is not binding on the Internal Revenue Service (“IRS”). Accordingly, the IRS may reach conclusions with respect to the Share Distribution that are different from the conclusions reached in the opinion. The opinion relied on certain facts, assumptions, representations and undertakings from CSWC and CSWI regarding the past and future conduct of the companies’ respective businesses and other matters, which, if incomplete, incorrect or not satisfied, could alter KPMG’s conclusions.
If the Share Distribution ultimately is determined to be taxable, it could be treated as a taxable dividend to you for U.S. federal income tax purposes and you could incur significant U.S. federal income tax liabilities. In addition, CSWC would recognize a taxable gain to the extent that the fair market value of CSWI common stock exceeds CSWC’s tax basis in that stock on the date of the Share Distribution.
Any unrealized losses we experience may be an indication of future realized losses, which could reduce our income available to make distributions.
As a BDC, we are required to carry our investments at market value or, if no market value is ascertainable, at the fair value as determined in good faith by our Board of Directors pursuant to a valuation methodology approved by our Board of Directors. Decreases in the market values or fair values of our investments will be recorded as unrealized losses. An unrealized loss could be an indication of a portfolio company’s inability to meet its repayment obligations or generate cash flow. This could result in realized losses in the future and ultimately in reductions of our income available to pay dividends or interest and principal on our securities and could have a material adverse effect on your investment.
Our historical financial statements are not necessarily representative of the results we would have achieved as a stand-alone publicly-traded company and therefore may not be indicative of our future performance.
Capital Southwest spun off 63.5% of our net asset value to shareholders and divested other major investments during the past three years. We emerged from these divestitures and the spin-off with a significantly different company profile. Our historical financial statements included in this Form 10-K for the periods are not necessarily representative of the results we would have achieved as a stand-alone publicly traded company with a smaller market footprint. Accordingly, this data may not be indicative of our future performance, or necessarily reflect what our financial position and results of operations or cash flows would have been, had we operated as a separate, stand-alone publicly-traded entity during all of the periods presented.
Prior to the spin-off, we had not previously operated with a primary focus on debt investments.
Prior to the spin-off, we had not previously operated with a primary focus on debt investments, and our management has limited experience, as a group, in operating our business as a stand-alone entity. Following the spin-off, we are now responsible for arranging our own funding, managing all of our own administrative and employee arrangements and supervising all of our legal and financial affairs, including publicly reported financial statements. We anticipate that our success in these endeavors will depend substantially upon the ability of our Board of Directors, senior management and other key employees to work together to implement our focused debt investment strategy.
Accordingly, there is no assurance that as an independent company, our aggregate results of operations will continue at the same level as in the past or we will fully implement our business strategy, which could have a material adverse effect on our business, results of operations, financial condition and cash flows.
Adverse market and economic conditions could cause harm to our operating results.
Past recessions have had a significant negative impact on the operating performance and fair value of our portfolio investments. Many of our portfolio companies could be adversely impacted again by any future economic downturn or recession and may be unable to be sold at a price that would allow us to recover our investment, or may be unable to operate during a recession. Such portfolio company performance could have a material adverse effect on our business, financial condition and results of operations.
Our success depends on attracting and retaining qualified personnel in a competitive environment.
Sourcing, selection, structuring and closing our investments depends upon the diligence and skill of our management. Our management’s capabilities may significantly impact our results of operations. Our success requires that we retain investment and operations personnel in a competitive environment. Our ability to attract and retain personnel with the requisite credentials, experience and skills depends on several factors, including but not limited to, our ability to offer competitive wages, benefits and professional growth opportunities.
The competitive environment for qualified personnel may require us to take certain measures to ensure that we are able to attract and retain experienced personnel. Such measures may include increasing the attractiveness of our overall compensation packages, altering the structure of our compensation packages through the use of additional forms of compensation or other steps. The inability to attract and retain experienced personnel could potentially have an adverse effect on our business.
Our business model depends to a significant extent upon strong referral relationships. Our inability to maintain or develop these relationships, as well as the failure of these relationships to generate investment opportunities, could adversely affect our business.
We expect that members of our management team will maintain their relationships with intermediaries, financial institutions, investment bankers, commercial bankers, financial advisors, attorneys, accountants, consultants and other individuals within our network, and we will rely to a significant extent upon these relationships to provide us with potential investment opportunities. If our management team fails to maintain its existing relationships or develop new relationships with sources of investment opportunities, we will not be able to effectively allocate capital. Individuals with whom members of our management team have relationships are not obligated to provide us with investment opportunities, and therefore, there is no assurance that these relationships will generate investment opportunities for us. In addition, following the spin-off, we may face new challenges in maintaining or cultivating these relationships and investment opportunities due to our smaller size.
In connection with CSWI’s separation from CSWC, CSWI has indemnified us for certain liabilities. However, there can be no assurance that these indemnities will be sufficient to insure us against the full amount of such liabilities or that CSWI’s ability to satisfy its indemnification obligation will not be impaired in the future.
CSWI agreed to indemnify us for certain liabilities, including certain tax liabilities. However, third parties could seek to hold us responsible for any of the liabilities that CSWI will agree to retain, and there can be no assurance that CSWI will be able to fully satisfy its indemnification obligations. Moreover, even if we ultimately succeed in recovering from CSWI any amounts for which we are held liable, we may be temporarily required to bear these losses while seeking recovery from CSWI.
Potential indemnification liabilities of CSWC to CSWI could materially adversely affect us.
Future agreements between CSWC and CSWI may provide for indemnification obligations designed to make CSWC financially responsible for liabilities that may exist relating to or arising out of its business activities, whether incurred prior to or after the Share Distribution. If CSWC is required to indemnify CSWI for any reason, CSWC may be subject to substantial liabilities.
We may not be able to engage in certain corporate transactions due to the Share Distribution.
Our ability to engage in significant equity transactions is limited due to the Share Distribution in order to preserve the tax-free status of the Share Distribution to CSWC for U.S. federal income tax purposes. Even if the Share Distribution otherwise qualifies for tax-free treatment to CSWC's shareholders under Section 355 of the Code, it may be taxable to CSWC under section 355(e) of the Code if 50% or more, by vote or value, of shares of our common stock or CSWC’s common stock are acquired or issued as part of a plan or series of related transactions that includes the Share Distribution. For this purpose, any acquisitions or issuances of CSWC’s common stock within two years before the Share Distribution, and any acquisitions or issuances of our common stock or CSWI’s common stock within two years after the Share Distribution, generally are presumed to be part of such a plan, although we or CSWI may be able to rebut that presumption. If an acquisition or issuance of shares of our common stock or CSWI’s common stock triggers the application of Section 355(e) of the Code, CSWC would recognize a taxable gain to the extent the fair market value of CSWI’s common stock exceeds our tax basis in CSWI’s common stock at the time of the Share Distribution.
Potential liabilities may arise due to fraudulent transfer considerations, which would adversely affect our financial condition and our results of operations.
In connection with the Share Distribution, we undertook several corporate restructuring transactions which, along with the Share Distribution, may be subject to federal and state fraudulent conveyance and transfer laws. If, under these laws, a court were to determine that, at the time of the Share Distribution, any entity involved in these restructuring transactions or the Share Distribution: (1) was insolvent; (2) was rendered insolvent by reason of the Share Distribution; (3) had remaining assets constituting unreasonably small capital; or (4) intended to incur, or believed it would incur, debts beyond its ability to pay these debts as they matured, then the court could void the Share Distribution, in whole or in part, as a fraudulent conveyance or transfer. The court could require us to fund liabilities of the other company for the benefit of creditors.
We will be subject to corporate-level income tax if we are unable to qualify as a Regulated Investment Company under Subchapter M of the Code
.
To maintain RIC tax treatment under the Code, we must meet the following annual distribution, income source and asset diversification requirements:
| · | The annual distribution requirement for a RIC will be satisfied if we distribute to our shareholders on an annual basis at least 90% of our net ordinary income and realized short-term capital gains in excess of realized net long-term capital losses. Depending on the level of taxable income earned in a tax year, we may choose to carry forward taxable income in excess of current year distributions into the next year and pay a 4.0% excise tax on such income. Any such carryover taxable income must be distributed through a dividend declared prior to filing the final tax return related to the year that generated such taxable income. |
| · | The source of income requirement will be satisfied if we obtain at least 90% of our gross income for each taxable year from dividends, interest, payments with respect to certain securities loans, gains from the sale or other disposition of stock or other securities or foreign currencies or other income derived with respect to our business of investing in such stock, securities or currencies and net income derived from an interest in a “qualified publicly traded partnership” (as defined in the Code), or the 90% Income Test. |
| · | The asset diversification requirement will be satisfied if we meet certain asset diversification requirements at the end of each quarter of our taxable year. To satisfy this requirement, at least 50% of the value of our assets must consist of cash, cash equivalents, U.S Government securities, securities of other RICs, and other securities if such other securities of any one issuer do not represent more than 5% of the value of our assets or more than 10% of the outstanding voting securities of the issuer (which for these purposes includes the equity securities of a “qualified publicly traded partnership”). In addition, no more than 25% of the value of our assets can be invested in the securities, other than U.S Government securities or securities of other RICs, (1) of one issuer (2) of two or more issuers that are controlled, as determined under applicable tax rules, by us and that are engaged in the same or similar or related trades or businesses or (3) of one or more “qualified publicly traded partnerships,” or the Diversification Tests. |
Failure to meet these requirements may result in us having to dispose of certain unqualified investments quickly in order to prevent the loss of RIC status. If we fail to maintain RIC tax treatment for any reason and are subject to corporate income tax, the resulting corporate taxes could substantially reduce our net assets, the amount of income available for distribution and the amount of our distributions. In addition, to the extent we had unrealized gains, we would have to establish deferred tax liabilities for taxes, which would reduce our net asset value accordingly. In addition, our shareholders would lose the tax credit realized when we, as a RIC, decide to retain the net realized capital gain and make deemed distributions of net realized capital gains, and pay taxes on behalf of our shareholders at the end of the tax year. The loss of this pass-through tax treatment could have a material adverse effect on the total return of an investment in our common stock.
Even if the Company qualifies as a Regulated Investment Company, it may face tax liabilities that reduce its cash flow.
Even if the Company qualifies for taxation as a RIC, it may be subject to certain U.S. federal, state and local taxes on its income and assets. In addition, we may hold some of our assets through our Taxable Subsidiary, which is not consolidated for U.S. federal income tax purposes, or any other taxable subsidiary we may form. Any taxes paid by such subsidiary corporations would decrease the cash available for distribution to the Company’s stockholders.
Previously proposed legislation may allow us to incur additional leverage.
As a BDC, under the 1940 Act we generally are not permitted to incur indebtedness unless immediately after any borrowing we have an asset coverage for total borrowings of at least 200% (i.e., the amount of debt may not exceed 50% of the value of our assets). Legislation introduced in the U.S. House of Representatives during the 114th Congress, which will meet from January 3, 2015 through January 3, 2017, proposed to modify this section of the 1940 Act and increase the amount of debt that BDCs may incur by modifying the asset coverage percentage from 200% to 150%. If this legislation is passed, we may be able to incur additional indebtedness in the future and, therefore, your risk of an investment in our securities may increase.
In addition, in December 2015, the 2016 omnibus spending bill approved by Congress and signed into law by the President increased the amount of SBA-guaranteed debentures that affiliated SBIC funds can have outstanding from $225.0 million to $350.0 million. If we incur any SBA-guaranteed indebtedness in the future, your risk of an investment in our securities may increase.
Efforts to comply with the Sarbanes-Oxley Act involve significant expenditures, and non-compliance with the Sarbanes-Oxley Act may adversely affect us.
We are subject to the Sarbanes-Oxley Act of 2002, or the Sarbanes-Oxley Act, and the related rules and regulations promulgated by the SEC. Among other requirements, under Section 404 of the Sarbanes-Oxley Act and rules and regulations of the SEC thereunder, our management is required to report on our internal controls over financial reporting. We are required to review on an annual basis our internal controls over financial reporting, and on a quarterly and annual basis to evaluate and disclose significant changes in our internal controls over financial reporting. We have and expect to continue to incur significant expenses related to compliance with the Sarbanes-Oxley Act, which will negatively impact our financial performance and our ability to make distributions. In addition, this process results in a diversion of management’s time and attention. In the event that we are unable to maintain compliance with the Sarbanes-Oxley Act and related rules, we may be adversely affected.
Our investments could be concentrated in relatively few portfolio companies.
From time to time our investment could be concentrated in relatively few portfolio companies for a number of reasons, including performance, our growth plans and different investment timelines. The concentration of our total assets in certain investments may fluctuate as the relative net asset values of these investments change relative to the net asset values of other investments in our portfolio and as we continue to make investments. Financial disruption, decreased revenues or changes in the business of any investment in which our assets are concentrated may have a material adverse effect on our financial condition, operating results and cash flows.
Our ability to enter into transactions with our affiliates is restricted.
We are prohibited under the 1940 Act from participating in certain transactions with certain of our affiliates without the prior approval of our independent directors and, in some cases, the SEC. Any person that owns, directly or indirectly, 5% or more of our outstanding voting securities is our affiliate for purposes of the 1940 Act, and we generally are prohibited from buying or selling any security from or to an affiliate, absent the prior approval of our independent directors. The 1940 Act also prohibits certain “joint” transactions with certain of our affiliates, which could include investments in the same portfolio company (whether at the same or different times), without prior approval of our independent directors and, in some cases, the SEC. If a person acquires more than 25% of our voting securities, we are prohibited from buying or selling any security from or to that person or certain of that person's affiliates, or entering into prohibited joint transactions with that person, absent the prior approval of the SEC. Similar restrictions limit our ability to transact business with our officers or directors or their affiliates. Regulations governing our operation as a BDC affect our ability to, and the way in which we raise additional capital.
Changes in the laws or regulations governing our business, or changes in the interpretations thereof, and any failure by us to comply with these laws or regulations, could negatively affect the profitability of our operations.
Changes in the laws or regulations or the interpretations of the laws and regulations that govern BDCs, RICs or non-depository commercial lenders could significantly affect our operations and our cost of doing business. We are subject to federal, state and local laws and regulations and are subject to judicial and administrative decisions that affect our operations, including our loan originations, maximum interest rates, fees and other charges, disclosures to portfolio companies, the terms of secured transactions, collection and foreclosure procedures and other trade practices. If these laws, regulations or decisions change, or if we expand our business into jurisdictions that have adopted more stringent requirements than those in which we currently conduct business, we may have to incur significant expenses in order to comply or we might have to restrict our operations. In addition, if we do not comply with applicable laws, regulations and decisions, we may lose licenses needed for the conduct of our business and be subject to civil fines and criminal penalties, any of which could have a material adverse effect upon our business, results of operations or financial condition.
If we do not invest a sufficient portion of our assets in qualifying assets, we could fail to qualify as a business development company or be precluded from investing according to our current business strategy.
As a BDC, we may not acquire any assets other than “qualifying assets” unless, at the time of and after giving effect to such acquisition, at least 70% of our total assets are qualifying assets.
We currently have more than 70% of qualifying assets. However, we may be precluded from investing in what we believe are attractive investments if those investments are not qualifying assets for purposes of the 1940 Act. If we do not invest a sufficient portion of our assets in qualifying assets, we could lose our status as a BDC, which would have a material adverse effect on our business, financial condition and results of operations. Similarly, these rules could prevent us from making follow-on investments in existing portfolio companies (which could result in the dilution of our position).
A failure on our part to maintain our status as a BDC would significantly reduce our operating flexibility.
If we fail to maintain our status as a BDC, we might be regulated as a closed-end investment company that is required to register under the Investment Company Act, which would subject us to additional regulatory restrictions and significantly decrease our operating flexibility. In addition, any such failure could cause an event of default under our outstanding indebtedness, which could have a material adverse effect on our business, financial condition or results of operations.
Changes in laws or regulations governing our operations or our failure to comply with those laws or regulations may adversely affect our business
.
We and our portfolio companies are subject to laws and regulations at the local, state and federal level. These laws and regulations, as well as their interpretation, may be changed from time to time. Accordingly, any changes in these laws and regulations or failure to comply with them could have a material adverse effect on our business. Certain of these laws and regulations pertain specifically to BDCs such as us.
We are highly dependent on information systems and systems failures could significantly disrupt our business, which may, in turn, negatively affect the market price of our common stock and our ability to pay dividends.
Our business is highly dependent on our and third parties’ communications and information systems. Any failure or interruption of those systems, including as a result of the termination of an agreement with any third-party service providers, could cause delays or other problems in our activities. Our financial, accounting, data processing, backup or other operating systems and facilities may fail to operate properly or become disabled or damaged as a result of a number of factors including events that are wholly or partially beyond our control and adversely affect our business. There could be:
| · | Sudden electrical or telecommunications outages; |
| · | Natural disasters such as earthquakes, tornadoes and hurricanes; |
| · | Disease pandemics; |
| · | Events arising from local or larger scale political or social matters, including terrorist acts; and |
| · | Cyber attacks. |
If we are unable to maintain the availability of our electronic data systems and safeguard the security of our data, our ability to conduct business may be compromised, which could impair our liquidity, disrupt our business, damage our reputation and cause losses.
Cybersecurity refers to the combination of technologies, processes, and procedures established to protect information technology systems and data from unauthorized access, attack, or damage. We are subject to cybersecurity risks. Information cybersecurity risks have significantly increased in recent years and, while we have not experienced any material losses relating to cyber attacks or other information security breaches, we could suffer such losses in the future. Our computer systems, software and networks may be vulnerable to unauthorized access, computer viruses or other malicious code and other events that could have a security impact. If one or more of such events occur, this potentially could jeopardize confidential and other information, including nonpublic personal information and sensitive business data, processed and stored in, and transmitted through, our computer systems and networks, or otherwise cause interruptions or malfunctions in our operations or the operations of our customers or counterparties. This could result in significant losses, reputational damage, litigation, regulatory fines or penalties, or otherwise adversely affect our business, financial condition or results of operations. Privacy and information security laws and regulation changes, and compliance with those changes, may result in cost increases due to system changes and the development of new administrative processes. In addition, we may be required to expend significant additional resources to modify our protective measures and to investigate and remediate vulnerabilities or other exposures arising from operational and security risks. We currently do not maintain insurance coverage relating to cybersecurity risks, and we may be required to expend significant additional resources to modify our protective measures or to investigate and remediate vulnerabilities or other exposures, and we may be subject to litigation and financial losses that are not fully insured.
Third parties with which we do business may also be sources of cybersecurity or other technological risks. We outsource certain functions, and these relationships allow for the storage and processing of our information, as well as customer, counterparty, employee and borrower information. While we engage in actions to reduce our exposure resulting from outsourcing, ongoing threats may result in unauthorized access, loss, exposure or destruction of data, or other cybersecurity incidents, with increased costs and other consequences, including those described above.
Terrorist attacks, acts of war or natural disasters may affect any market for our common stock, impact the businesses in which we invest and harm our business, operating results and financial condition.
Terrorist attacks, acts of war or natural disasters may disrupt our operations, as well as the operations of the businesses in which we invest. These events have created, and continue to create, economic and political uncertainties and have contributed to global economic instability. Future terrorist activities, military or security operations, or natural disasters could further weaken the domestic or global economy. These events could create additional uncertainties, which may negatively impact the businesses in which we invest directly or indirectly and, in turn, could have a material adverse impact on our business, operating results and financial condition. Losses from terrorist attacks and natural disasters are generally uninsurable.
RISKS RELATED TO OUR INVESTMENTS
Our investments in portfolio companies involve a number of significant risks
:
| · | Portfolio companies are more likely to depend on the management talents and efforts of a small group of key employees. Therefore, the death, disability, resignation, termination, or significant under-performance of one or more of these persons could have a material adverse impact on our portfolio company and, in turn, on us. |
| · | Portfolio companies may have unpredictable operating results, could become parties to litigation, may be engaged in rapidly changing businesses with products subject to a substantial risk of obsolescence and may require substantial additional capital to support their operations, finance expansion or maintain their competitive position. |
| · | Most of our acquisition targets are private companies. Private companies may not have readily publicly available information about their businesses, operations and financial condition. Consequently, we rely on the ability of our management team and investment professionals to obtain adequate information to evaluate the potential returns from making acquisitions for both CSWC and our existing portfolio companies. If we are unable to uncover all material information about these acquisition targets, we may not make a fully informed investment decision and may lose all or part of our investment. |
| · | Portfolio companies may have shorter operating histories, narrower product lines, smaller market shares and/or more significant customer concentration than larger businesses, which tend to render them more vulnerable to competitors’ actions and market conditions, as well as general economic downturns. |
| · | Portfolio companies may have limited financial resources and may be unable to meet their obligations under their debt instruments that we hold, which may be accompanied by a deterioration in the value of any collateral and a reduction in the likelihood of us realizing any guarantees from subsidiaries or affiliates of our portfolio companies that we may have obtained in connection with our investment, as well as a corresponding decrease in the value of the equity components of our investments. |
In addition, in the course of providing significant managerial assistance to certain of our portfolio companies, certain of our officers and directors may serve as directors on the boards of these companies. To the extent that litigation arises out of our investments in these companies, our officers and directors may be named as defendants in such litigation, which could result in an expenditure of funds for claims in excess of our directors’ and officers’ insurance coverage (through our indemnification of our officers and directors) and the diversion of management’s time and resources.
There may be circumstances in which our debt investments could be subordinated to claims of other creditors or we could be subject to lender liability claims.
Even though we may have structured certain of our investments as secured loans, if one of our portfolio companies were to go bankrupt, depending on the facts and circumstances, and based upon principles of equitable subordination as defined by existing case law, a bankruptcy court could subordinate all or a portion of our claim to that of other creditors and transfer any lien securing our subordinated claim to the bankruptcy estate. The principles of equitable subordination defined by case law have generally indicated that a claim may be subordinated only if its holder is guilty of misconduct or where the senior loan is re-characterized as an equity investment and the senior lender has actually provided significant managerial assistance to the bankrupt debtor. We may also be subject to lender liability claims for actions taken by us with respect to a borrower's business or instances where we exercise control over the borrower. It is possible that we could become subject to a lender's liability claim, including as a result of actions taken in rendering significant managerial assistance or actions to compel and collect payments from the borrower outside the ordinary course of business.
The lack of liquidity in our investments may adversely affect our business.
We invest, and will continue to invest, in portfolio companies whose securities are not publicly traded. These securities are generally subject to legal and other restrictions on resale or will otherwise be less liquid than publicly traded securities. As a result, we do not expect to achieve liquidity in our investments in the near-term. The illiquidity of these investments may make it difficult for us to sell these investments when desired. In addition, if we are required to liquidate all or a portion of our portfolio quickly, we may realize significantly less than the value at which we had previously recorded these investments and, as a result, we may suffer losses.
Our investments in equity securities involve a substantial degree of risk
.
We may purchase common stock and other equity securities, including warrants. Although equity securities have historically generated higher average total returns than fixed-income securities over the long term, equity securities have also experienced significantly more volatility in those returns. The equity securities we acquire may fail to appreciate and may decline in value or become worthless, and our ability to recover our investment depends on our portfolio company’s success. Investments in equity securities involve a number of significant risks, including the risk of further dilution as a result of additional issuances, inability to access additional capital and failure to pay current distributions. Investments in preferred securities involve special risks, such as the risk of deferred distributions, credit risk, illiquidity and limited voting rights.
As a Regulated Investment Company, we may have certain regulatory restrictions that could preclude us from making additional investments in our portfolio companies.
We may not have the ability to make additional investments in our portfolio companies. After our initial investment in a portfolio company, we may be called upon from time to time to provide additional funds to that company or have the opportunity to increase our investment or make follow-on investments. Any decisions not to make a follow-on investment or any inability on our part to make such an investment may have a negative impact on a portfolio company in need of such an investment, may result in a missed opportunity for us to increase our participation in a successful operation or may reduce the expected return on the investment.
Certain of our portfolio companies are leveraged.
Some of our portfolio companies have incurred some indebtedness in relation to their overall capital base. Such indebtedness often has terms that will require the balance of the loan to be refinanced when it matures. If portfolio companies cannot generate adequate cash flow to meet the principal and interest payments on their indebtedness, the value of our investments could be reduced or eliminated through foreclosure on the portfolio company’s assets or by the portfolio company’s reorganization or bankruptcy.
Changes in interest rates may affect our cost of capital, the value of investments and net investment income.
Some of our debt investments will bear interest at variable rates and the interest income from these investments could be negatively affected by decreases in market interest rates. In addition, an increase in interest rates would make it more expensive for us to use debt to finance our investments. As a result, a significant increase in market interest rates could increase our cost of capital, which would reduce our net investment income. Also, an increase in interest rates available to investors could make an investment in our securities less attractive than alternative investments, a situation which could reduce the value of our securities. Conversely, a decrease in interest rates may have an adverse impact on our returns by requiring us to seek lower yields on our debt investments and by increasing the risk that our portfolio companies will prepay our debt investments, resulting in the need to redeploy capital at potentially lower rates. A decrease in market interest rates may also adversely impact our returns on idle funds, which would reduce our net investment income. In addition, certain of our debt investments and debt liabilities may bear interest at fixed rates. To the extent that our fixed rate assets and liabilities are not perfectly hedged, our net investment income may decrease based on changes in market interest rates. An increase in market interest rates may also decrease the fair value of our fixed rate investments, as these may be less attractive securities in a rising rate environment.
Prepayments of our debt investments by our portfolio companies could adversely impact our results of operations and reduce our return on equity.
We are subject to the risk that the investments we make in our portfolio companies may be repaid prior to maturity. When this occurs, we will generally reinvest these proceeds in temporary investments, pending their future investment in new portfolio companies. These temporary investments will typically have substantially lower yields than the debt being prepaid and we could experience significant delays in reinvesting these amounts. Any future investment in a new portfolio company may also be at lower yields than the debt that was repaid. As a result, our results of operations could be materially adversely affected if one or more of our portfolio companies elect to prepay amounts owed to us. Additionally, prepayments could negatively impact our return on equity, which could result in a decline in the market price of our securities.
Defaults by our portfolio companies could harm our operating results.
Portfolio companies may fail to satisfy financial, operating or other covenants imposed by us or other lenders, which could lead to a default and, potentially, termination of its loans and foreclosure on its secured assets. These events could trigger cross-defaults under other agreements and jeopardize the portfolio company’s ability to meet its obligations, including under the debt or equity securities we hold. We may also incur expenses to the extent necessary to recover upon a default or to negotiate new terms with the defaulting portfolio company.
Second priority liens on collateral securing loans that we make to our portfolio companies may be subject to control by senior creditors with first priority liens. If there is a default, the value of the collateral may not be sufficient to repay in full both the first priority creditors and us.
Certain loans that we make are secured by a second priority security interest in the same collateral pledged by a portfolio company to secure senior debt owed by the portfolio company to commercial banks or other traditional lenders. Often the senior lender has procured covenants from the portfolio company prohibiting the incurrence of additional secured debt without the senior lender’s consent. Prior to and as a condition of permitting the portfolio company to borrow money from us secured by the same collateral pledged to the senior lender, the senior lender will require assurances that it will control the disposition of any collateral in the event of bankruptcy or other default. In many cases, the senior lender will require us to enter into an “intercreditor agreement” prior to permitting the portfolio company to borrow from us. Typically the intercreditor agreements we are requested to execute expressly subordinate our debt instruments to those held by the senior lender and further provide that the senior lender shall control: (1) the commencement of foreclosure or other proceedings to liquidate and collect on the collateral; (2) the nature, timing and conduct of foreclosure or other collection proceedings; (3) the amendment of any collateral document; (4) the release of the security interests in respect of any collateral; and (5) the waiver of defaults under any security agreement. Because of the control we may cede to senior lenders under intercreditor agreements we may enter, we may be unable to realize the proceeds of any collateral securing some of our loans.
Our portfolio companies may incur debt that ranks equally with, or senior to, our investments in those companies.
We invest primarily in the secured term debt of middle market companies and equity issued by middle market companies. Our portfolio companies may have, or may be permitted to incur, other debt that ranks equally with, or senior to, the debt in which we invest. By their terms, these debt instruments may entitle the holders to receive payment of interest or principal on or before the dates on which we are entitled to receive payments with respect to the debt instruments in which we invest. Also, in the event of insolvency, liquidation, dissolution, reorganization or bankruptcy of a portfolio company, holders of debt instruments ranking senior to our investment in that portfolio company would typically be entitled to receive payment in full before we receive any distribution. After repaying its senior creditors, the portfolio company may not have any remaining assets to use for repaying its obligation to us. In the case of debt ranking equally with debt instruments in which we invest, we would have to share on an equal basis any distributions with other creditors holding such debt in the event of an insolvency, liquidation, dissolution, reorganization or bankruptcy of the relevant portfolio company.
We may not realize gains from our equity investments
.
Certain investments that we have made in the past and may make in the future include warrants or other equity securities. Investments in equity securities involve a number of significant risks, including the risk of further dilution as a result of additional issuances, inability to access additional capital and failure to pay current distributions. Investments in preferred securities involve special risks, such as the risk of deferred distributions, credit risk, illiquidity and limited voting rights. In addition, we may from time to time make non-control, equity investments in portfolio companies. Our goal is ultimately to realize gains upon our disposition of these equity interests. However, the equity interests we receive may not appreciate in value and, in fact, may decline in value. Accordingly, we may not be able to realize gains from our equity interests, and any gains that we do realize on the disposition of any equity interests may not be sufficient to offset any other losses we experience. We also may be unable to realize any value if a portfolio company does not have a liquidity event, such as a sale of the business, recapitalization or public offering, which would allow us to sell the underlying equity interests. We often seek puts or similar rights to give us the right to sell our equity securities back to the portfolio company issuer; however, we may be unable to exercise these put rights for the consideration provided in our investment documents if the issuer is in financial distress.
RISKS RELATED TO OUR COMMON STOCK
Investing in shares of our common stock may involve an above average degree of risk.
The investments we make in accordance with our investment objectives may result in a higher amount of risk, volatility or loss of principal than alternative investment options. Our investments in portfolio companies may be highly speculative, and therefore, an investment in our common stock may not be suitable for investors with lower risk tolerance.
Our common stock often trades at a discount from net asset value
.
Our common stock is listed on NASDAQ. Shareholders desiring liquidity may sell their shares on NASDAQ at current market value, which has often been below net asset value. Shares of closed-end investment companies frequently trade at discounts from net asset value, which is a risk separate and distinct from the risk that a fund’s performance will cause its net asset value to decrease.
The market price of our common stock may fluctuate significantly
.
The market price and marketability of shares of our common stock may from time to time be significantly affected by numerous factors, including:
| · | Market conditions; |
| · | Our investment results; |
| · | Trading volume of our stock; |
| · | Our investment results; |
| · | Departure of our key personnel; |
| · | Changes in regulatory policies, accounting pronouncements or tax guidelines, particularly with respect to RICs, BDCs or SBICs; and |
| · | Other influences and events over which we have no control and that may not be directly related to us. |
We may not pay any dividends.
While we intend to pay dividends to our shareholders out of taxable income available for distribution, there can be no assurance that we will do so. Any dividends that we do pay may be payable in cash, in our stock, or in stock in any of our holdings or in a combination of all three. All dividends will be paid at the discretion of our Board of Directors and will depend upon our financial condition, maintenance of our RIC status, and compliance with applicable BDC regulations.
We may in the future choose to pay dividends in our own stock, in which case you may be required to pay tax in excess of the cash you receive.
We may distribute taxable dividends that are payable in part in our stock. Under certain applicable provisions of the Code and the Treasury regulations, distributions payable by us in cash or in shares of stock (at the shareholders election) would satisfy the Annual Distribution Requirement. The IRS has issued private letter rulings providing that a dividend payable in stock or in cash at the election of the shareholders will be treated as a taxable dividend eligible for the dividends paid deduction provided that at least 20% of the total dividend is payable in cash and certain other requirements are satisfied. Taxable shareholders receiving such dividends will be required to include the full amount of the dividend as ordinary income (or as long-term capital gain to the extent such dividend is properly reported as a capital gain dividend) to the extent of our current and accumulated earnings and profits for U.S. federal income tax purposes. As a result, a U.S. shareholder may be required to pay tax with respect to such dividends in excess of any cash received. If a U.S. shareholder sells the stock it receives as a dividend in order to pay this tax, the sales proceeds may be less than the amount included in income with respect to the dividend, depending on the market price of our stock at the time of the sale. Furthermore, with respect to non-U.S. shareholders, we may be required to withhold U.S. tax with respect to such dividends, including in respect of all or a portion of such dividends payable in stock. In addition, if a significant number of our shareholders determine to sell shares of our stock in order to pay taxes owed on dividends, it may put downward pressure on the trading price of our stock.
We have no unresolved comments from the staff of the SEC.
We do not own any real estate or other physical properties. We maintain our offices at 5400 Lyndon B. Johnson Freeway, Suite 1300, Dallas, Texas 75240, where we lease approximately 9,261 square feet of office space pursuant to a lease agreement expiring in January 2022. We believe that our offices are adequate to meet our current and expected future needs.
We may, from time to time, be involved in litigation arising out of our operations in the normal course of business or otherwise. Furthermore, third parties may try to seek to impose liability on us in connection with the activities of our portfolio companies. As of the date hereof, we are not a party to, and none of our assets are subject to, any material pending legal proceedings and are not aware of any claims that could have a materially adverse effect on our financial position, results of operations or cash flows.
Not applicable.
PART II
| Item 5. | Market for Registrant’s Common Equity, Related Shareholder Matters and Issuer Purchases of Equity Securities |
PRICE RANGE OF COMMON STOCK AND HOLDERS
Market Information
Our common stock is traded on NASDAQ under the symbol “CSWC.” The following high and low selling prices for shares during each quarter of the last two fiscal years were taken from quotations provided to the Company by NASDAQ. The prices on and before September 30, 2015 have not been adjusted to reflect the Share Distribution.
|
Quarter Ended
|
High
|
Low
|
||||||
|
March 31, 2016
|
$
|
15.25
|
$
|
13.19
|
||||
|
December 31, 2015
|
17.45
|
13.43
|
||||||
|
September 30, 2015
|
50.49
|
42.76
|
||||||
|
June 30, 2015
|
51.95
|
46.26
|
||||||
|
March 31, 2015
|
$
|
50.44
|
$
|
37.79
|
||||
|
December 31, 2014
|
41.12
|
33.91
|
||||||
|
September 30, 2014
|
41.87
|
34.35
|
||||||
|
June 30, 2014
|
36.57
|
32.01
|
||||||
On June 10, 2016, the last sale price of our common stock on the NASDAQ was $13.81 per share, and there were approximately 500 holders of record of the common stock which did not include shareholders for whom shares are held in “nominee” or “street name.”
Shares of BDCs may trade at a market price that is less than the value of the net assets attributable to those shares. The possibility that our shares of common stock will trade at a discount from net asset value per share or at premiums that are unsustainable over the long term are separate and distinct from the risk that our net asset value per share will decrease. It is not possible to predict whether our common stock will trade at, above, or below net asset value per share.
DISTRIBUTIONS
We intend to make distributions on a quarterly basis to our shareholders of substantially all of our taxable income. In lieu of cash, we may make deemed distributions of certain net capital gains to our shareholders.
The payment dates (including the dividend declared on June 7, 2016 to be paid on July 1, 2016) and amounts of cash dividends per share on a post-split basis for the past five years are as follows:
|
Payment Date
|
Cash Dividend
|
|||
|
May 31, 2011
|
$
|
0.10
|
||
|
November 30, 2011
|
0.10
|
|||
|
May 31, 2012
|
0.10
|
|||
|
June 8, 2012
|
4.40
|
|||
|
November 30, 2012
|
0.10
|
|||
|
March 28, 2013
|
0.69
|
|||
|
May 31, 2013
|
0.10
|
|||
|
November 29, 2013
|
0.10
|
|||
|
May 30, 2014
|
0.10
|
|||
|
November 28, 2014
|
0.10
|
|||
|
June 10, 2015
|
0.10
|
|||
|
April 1, 2016
|
0.04
|
|||
|
July 1, 2016
|
0.06
|
|||
The amounts and timing of cash dividend payments have generally been dictated by requirements of the Code regarding the distribution of taxable net investment income (ordinary income) of regulated investment companies. Instead of distributing realized long-term capital gains to shareholders, the Company has ordinarily elected to retain these gains to fund future investments.
On March 1, 2016, we entered into a share repurchase agreement with Cantor Fitzgerald & Co. This agreement established a plan in compliance with the requirements of Rules 10b5-1(c)(1)(i)(B) and 10b-18 under the Securities Exchange Act of 1934. The plan was established pursuant to a $10 million share repurchase program that the Board approved on January 20, 2016. This agreement became effective immediately and shall terminate on the earliest of (1) the date on which a total of $10 million worth of common shares have been purchased under the plan; (2) the date on which the terms set forth in the purchase instructions have been met; or (3) the date that is one trading day after the date on which insider notifies broker in writing that this agreement shall terminate.
Distribution Policy
We generally intend to make distributions on a quarterly basis to our shareholders of substantially all of our taxable income. In order to avoid certain excise taxes imposed on RICs, we must distribute during each calendar year an amount at least equal to the sum of (1) 98.0% of our ordinary income for the calendar year, (2) 98.2% of our capital gains in excess of capital losses for the one year period ended October 31, and (3) any ordinary income and net capital gains for the preceding year that were not distributed during that year. We will not be subject to excise taxes on amounts on which we are required to pay corporate income tax (such as retained net capital gains). In order to obtain the tax benefits applicable to RICs, we will be required to distribute to our shareholders with respect to each taxable year at least 90.0% of our ordinary income and realized net short-term capital gains in excess of realized net long-term capital losses. We may retain for investment realized net long-term capital gains in excess of realized net short-term capital losses. We may make deemed distributions to our shareholders of any retained net capital gains. If this happens, our shareholders will be treated as if they received an actual distribution of the capital gains we retain and then reinvested the net after-tax proceeds in our common stock. Our shareholders also may be eligible to claim a tax credit (or, in certain circumstances, a tax refund) equal to their allocable share of the tax we paid on the capital gains deemed distributed to them. Please refer to “Business — Material U.S. Federal Income Tax Considerations” included in Item 1 of Part I of this Annual Report for further information regarding the consequences of our retention of net capital gains. We may, in the future, make actual distributions to our shareholders of some or all realized net long-term capital gains in excess of realized net short-term capital losses. We can offer no assurance that we will achieve results that will permit the payment of any cash distributions and, if we issue senior securities, we will be prohibited from making distributions if doing so causes us to fail to maintain the asset coverage ratios stipulated by the 1940 Act or if distributions are limited by the terms of any of our borrowings. See “Business — Regulation of
Business Development Companies” included in Item 1 of Part I of this Annual Report.
We have adopted a dividend reinvestment plan, or DRIP, which provides for reinvestment of our distributions on behalf of our common shareholders if opted into by a common shareholder. See “Business — Dividend Reinvestment Plan” included in Item I of Part I of this Annual Report on Form 10-K.
Shareholders who receive dividends in the form of stock generally are subject to the same federal, state and local tax consequences as are shareholders who elect to receive their dividends in cash. A shareholder’s basis for determining gain or loss upon the sale of stock received in a dividend from us will be equal to the total dollar amount of the dividend payable to the shareholder. Any stock received in a dividend will have a holding period for tax purposes commencing on the day following the day on which the shares are credited to the U.S. shareholder’s account.
Our ability to make distributions will be limited by the asset coverage requirements under the 1940 Act. For a more detailed discussion, see “Regulation of Business Development Companies” included in Item 1 of Part I of this Annual Report on Form 10-K.
Securities Authorized for Issuance Under our Equity Incentive Plan
The following table provides information regarding the number of shares of restricted stock authorized and available under the 2009 Stock Incentive Plan, 2010 Restricted Stock Award Plan and Spin-Off Compensation Plan.
|
Plan Category
|
Number of
securities to be
issued upon exercise
of outstanding
options, warrants
and rights
|
Weighted average
exercise price of
outstanding options,
warrants and rights
|
Number of securities
remaining available for
future issuance under
equity compensation plans
(excluding securities
reflected in column (a))
|
|||||||||
|
(a)
|
(b)
|
(c)
|
||||||||||
|
Equity compensation plans approved by security holders
|
362,513
|
$
|
11.21
|
348,540
|
||||||||
|
Equity compensation plans not approved by security holders
|
-
|
-
|
-
|
|||||||||
|
Total
|
362,513
|
$
|
11.21
|
348,540
|
||||||||
Performance Graph
The following graph compares our cumulative total shareholder return during the last five years (based on the market price of our common stock and assuming reinvestment of all dividends and tax credits on retained long-term capital gains) with the NASDAQ Total Return Index, the Russell 2000 Total Return Index and the KBW Regional Bank Total Return Index.
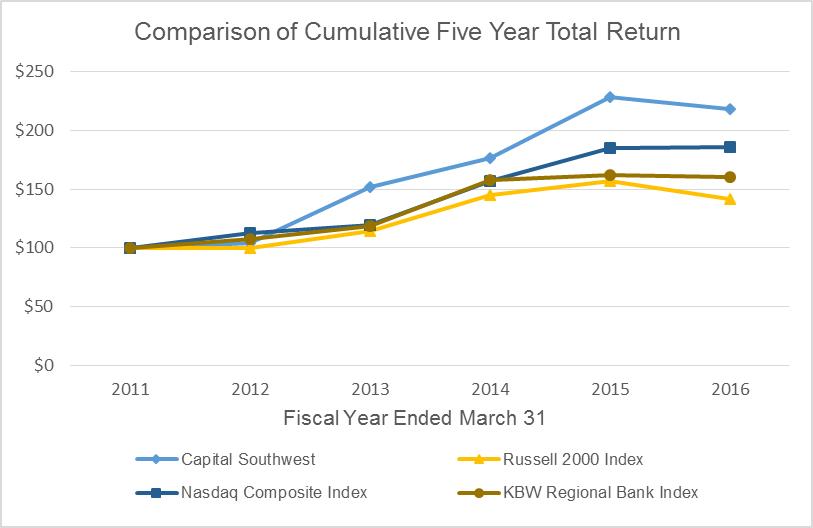
The following table provides selected financial data relating to our historical financial condition and results of operations as of and for each of the years ended March 31, 2012 through 2016. This data should be read in conjunction with Item 7, “Management’s Discussion and Analysis of Financial Condition and Results of Operations” and the consolidated financial statements and related notes.
Selected Consolidated Financial Data
(In thousands except per share data)
|
Year Ended March 31,
|
||||||||||||||||||||
|
2016
|
2015
|
2014
|
2013
|
2012
|
||||||||||||||||
|
Income statement data:
|
||||||||||||||||||||
|
Investment income:
|
||||||||||||||||||||
|
Total interest, fee and dividend income
|
$
|
8,689
|
$
|
9,791
|
$
|
12,475
|
$
|
10,691
|
$
|
9,212
|
||||||||||
|
Interest income from cash and cash equivalents
|
386
|
122
|
67
|
71
|
52
|
|||||||||||||||
|
Other income
|
85
|
35
|
65
|
73
|
70
|
|||||||||||||||
|
Total investment income
|
9,160
|
9,948
|
12,607
|
10,835
|
9,334
|
|||||||||||||||
|
Operating expenses:
|
||||||||||||||||||||
|
Compensation-related expenses
|
9,515
|
6,440
|
5,489
|
5,628
|
4,703
|
|||||||||||||||
|
General, administrative and other
|
11,610
|
5,683
|
2,963
|
2,710
|
1,969
|
|||||||||||||||
|
Total operating expenses
|
21,125
|
12,123
|
8,452
|
8,338
|
6,672
|
|||||||||||||||
|
(Loss) income before income taxes
|
(11,965
|
)
|
(2,175
|
)
|
4,155
|
2,497
|
2,662
|
|||||||||||||
|
Income tax (benefit) expense
|
(1,278
|
)
|
270
|
(739
|
)
|
590
|
118
|
|||||||||||||
|
Net investment (loss) income
|
(10,687
|
)
|
(2,445
|
)
|
4,894
|
1,907
|
2,544
|
|||||||||||||
|
Net realized gains (losses):
|
||||||||||||||||||||
|
Non-control/Non-affiliate investments
|
(9,575
|
)
|
8,226 |
14,048
|
2,660
|
22,806
|
||||||||||||||
|
Affiliate investments
|
(1,458
|
)
|
157,213
|
-
|
66,037
|
(45
|
)
|
|||||||||||||
|
Control investments
|
231
|
(1,175
|
)
|
-
|
20,861
|
(10,934
|
)
|
|||||||||||||
|
Net realized (losses) gains on investments
|
(10,802
|
)
|
164,264
|
14,084
|
89,558
|
11,827
|
||||||||||||||
|
Net unrealized appreciation (depreciation) on investments
|
16,089
|
(108,377
|
)
|
93,032
|
16,367
|
78,635
|
||||||||||||||
|
Net realized and unrealized gains (losses) on investments
|
5,287
|
55,887
|
107,116
|
105,925
|
90,462
|
|||||||||||||||
|
Net (decrease) increase in net assets resulting from operations
|
$
|
(5,400
|
)
|
$
|
53,442
|
$
|
112,010
|
$
|
107,832
|
$
|
93,006
|
|||||||||
|
Net investment (loss) income per share - basic and diluted
|
$
|
(0.68
|
)
|
$
|
(0.16
|
)
|
$
|
0.32
|
$
|
0.13
|
$
|
0.17
|
||||||||
|
Net earnings per share
|
$
|
(0.35
|
)
|
$
|
3.44
|
$
|
7.32
|
$
|
7.09
|
$
|
6.18
|
|||||||||
|
Net asset value per common share
|
$
|
17.34
|
$
|
49.30
|
$
|
49.98
|
$
|
43.30
|
$
|
41.86
|
||||||||||
|
Total dividends/distributions declared per common share
|
$
|
0.14
|
$
|
0.20
|
$
|
0.20
|
$
|
5.29
|
$
|
0.20
|
||||||||||
|
Weighted average number of shares outstanding - basic
|
15,636 |
15,492
|
15,278
|
15,177
|
15,016
|
|||||||||||||||
|
Weighted average number of shares outstanding - diluted
|
15,724
|
15,531
|
15,298
|
15,207
|
15,038
|
|||||||||||||||
|
Year Ended March 31,
|
||||||||||||||||||||
|
2016
|
2015
|
2014
|
2013
|
2012
|
||||||||||||||||
|
Balance sheet data:
|
||||||||||||||||||||
|
Assets:
|
||||||||||||||||||||
|
Investments at fair value
|
$
|
178,436
|
$
|
535,536
|
$
|
677,920
|
$
|
574,187
|
$
|
558,546
|
||||||||||
|
Cash and cash equivalents
|
95,969
|
225,797
|
88,163
|
81,767
|
64,895
|
|||||||||||||||
|
Interest, escrow and other receivables
|
6,405
|
4,418
|
1,371
|
2,756
|
1,961
|
|||||||||||||||
|
Net pension assets
|
-
|
10,294
|
10,962
|
8,762
|
7,349
|
|||||||||||||||
|
Deferred tax asset
|
2,342
|
-
|
-
|
-
|
-
|
|||||||||||||||
|
Other assets
|
1,341
|
827
|
278
|
200
|
238
|
|||||||||||||||
|
Total assets
|
$
|
284,493
|
$
|
776,872
|
$
|
778,694
|
$
|
667,672
|
$
|
632,989
|
||||||||||
|
Liabilities:
|
||||||||||||||||||||
|
Accounts payable and other liabilities
|
$
|
9,653
|
$
|
4,923
|
$
|
3,263
|
$
|
3,102
|
$
|
688
|
||||||||||
|
Accrued restoration plan liability
|
2,205
|
3,119
|
3,103
|
2,650
|
1,568
|
|||||||||||||||
|
Deferred income taxes
|
-
|
1,412
|
1,940
|
2,143
|
2,027
|
|||||||||||||||
|
Total liabilities
|
11,858
|
9,454
|
8,306
|
7,895
|
4,283
|
|||||||||||||||
|
Net assets
|
272,635
|
767,418
|
770,388
|
659,777
|
628,706
|
|||||||||||||||
|
Total liabilities and net assets
|
$
|
284,493
|
$
|
776,872
|
$
|
778,694
|
$
|
667,672
|
$
|
632,989
|
||||||||||
|
Other data:
|
||||||||||||||||||||
|
Number of portfolio companies
|
23
|
22
|
27
|
28
|
30
|
|||||||||||||||
|
Expense ratios (as percentage of average net assets):
|
||||||||||||||||||||
|
Total expenses
|
4.48
|
%
|
1.59
|
%
|
1.18
|
%
|
1.36
|
%
|
1.07
|
%
|
||||||||||
The following discussion should be read in conjunction with our financial statements and the notes thereto included elsewhere in this Annual Report on Form 10-K. Statements we make in the following discussion which express a belief, expectation or intention, as well as those that are not historical fact, are forward-looking statements that are subject to risks, uncertainties and assumptions. Our actual results, performance or achievements, or industry results, could differ materially from those we express in the following discussion as a result of a variety of factors, including the risks and uncertainties we have referred to under the headings “Cautionary Statement Concerning Forward-Looking Statements” and “Risk Factors” in Part I of this report.
OVERVIEW
Capital Southwest Corporation (“CSWC”) is an investment company that specializes in providing customized financing to middle market companies in a broad range of investment segments located primarily in the United States. Our principal investment objective is to produce attractive risk-adjusted returns by generating current income from our debt investments and capital appreciation from our equity and equity related investments. Our investment strategy is to partner with business owners, management teams and financial sponsors to provide flexible financing solutions to fund growth, changes of control, or other corporate events. We invest primarily in senior and subordinated debt securities secured by security interests in portfolio company assets, coupled with equity interests.
We focus on investing in companies with histories of generating revenues and positive cash flow, established market positions and proven management teams with strong operating discipline. We target senior and subordinated investments in the lower middle market and private loan transactions (club deals), as well as first and second lien syndicated loans in larger middle market companies. Our target lower middle market companies typically have annual earnings before interest, taxes, depreciation and amortization (“EBITDA”) between $3.0 million and $15.0 million. Our target club deal companies typically have annual EBITDA between $15.0 million and $50.0 million. We believe that these companies have less access to capital and that the market for such capital is underserved relative to larger companies. Companies of this size are generally privately held and are less well known to traditional capital sources such as commercial and investment banks. Our target investment in syndicated first and second lien loan investments are in large middle market companies that typically have annual EBITDA that is greater than $50 million. We make available significant managerial assistance to the companies in which we invest when we believe that providing managerial assistance to an investee company is critical to its business development activities.
SPIN-OFF OF CSW INDUSTRIALS, INC.
On September 30, 2015, we completed the spin-off (the “Share Distribution”) of CSW Industrials, Inc. (“CSWI”). CSWI is now an independent publicly traded company. CSWI’s common stock trades on the Nasdaq Global Select Market under the symbol “CSWI.” The Share Distribution was effected through a tax-free, pro-rata distribution of 100.0% of CSWI’s common stock to shareholders of the Company. Each Company shareholder received one share of CSWI common stock for every one share of Company common stock on the record date, September 18, 2015. Cash was paid in lieu of any fractional shares of CSWI common stock.
CSWI’s assets and businesses consist of the Company’s former industrial products, coatings, sealants & adhesives and specialty chemicals businesses and include all the equity interests of The RectorSeal Corporation, The Whitmore Manufacturing Company, Balco, Inc., and CapStar Holdings Corporation.
Effective October 1, 2015 with the completion of the Share Distribution, Bowen S. Diehl was appointed President and Chief Executive Officer of our Company, and Michael S. Sarner was appointed Chief Financial Officer, Chief Compliance Officer, Secretary and Treasurer.
Following the Share Distribution, we have maintained operations as an internally-managed BDC and pursue a credit-focused investing strategy akin to similarly structured organizations. We intend to continue to provide capital to middle-market companies. In the future, we intend to invest primarily in debt securities, including senior debt, second lien and subordinated debt, and may also invest in preferred stock and common stock alongside our debt investments or through warrants.
FORMATION AND LAUNCH OF A SENIOR LOAN FUND WITH MAIN STREET CAPITAL CORPORATION
On September 9, 2015, we entered into an agreement to form and co-manage I-45 SLF LLC (“I-45”), a senior loan fund that invests primarily in syndicated senior secured loans in the upper middle market, with Main Street Capital Corporation (“Main Street”). The initial equity capital commitment to I-45 SLF totaled $85.0 million, consisting of $68.0 million from us and $17.0 million from Main Street. We own 80.0% of I-45 SLF and have a profits interest of 75.6%, while Main Street owns 20.0% and has a profits interest of 24.4%. I-45 SLF's Board of Managers makes all investment and operational decisions for the fund, and consists of equal representation from our Company and Main Street.
PORTFOLIO COMPOSITION
The total value of our investment portfolio was $178.4 million as of March 31, 2016, as compared to $535.5 million as of March 31, 2015. As of March 31, 2016, we had investments in 23 portfolio companies with an aggregate cost of $150.1 million. As of March 31, 2015, we had investments in 22 portfolio companies with an aggregate cost of $64.9 million.
As of March 31, 2016 and March 31, 2015, our investment portfolio consisted of the following investments:
|
Cost
|
Percentage of
Total Portfolio
|
Fair Value
|
Percentage of
Total Portfolio
|
|||||||||||||
|
(dollars in millions)
|
||||||||||||||||
|
March 31, 2016:
|
||||||||||||||||
|
1st lien notes
|
$
|
39.3
|
26.2
|
%
|
$
|
39.5
|
22.1
|
%
|
||||||||
|
2nd lien notes
|
39.0
|
26.0
|
38.2
|
21.4
|
||||||||||||
|
Subordinated debt
|
15.1
|
10.1
|
15.1
|
8.5
|
||||||||||||
|
Preferred equity, common equity & warrants
|
19.9
|
13.2
|
49.3
|
27.6
|
||||||||||||
|
I-45 SLF, LLC
|
36.8
|
24.5
|
36.3
|
20.4
|
||||||||||||
|
$
|
150.1
|
100.0
|
%
|
$
|
178.4
|
100.0
|
%
|
|||||||||
|
March 31, 2015:
|
||||||||||||||||
|
2nd lien notes
|
$
|
6.9
|
10.6
|
%
|
$
|
6.9
|
1.3
|
%
|
||||||||
|
Subordinated debt
|
4.1
|
6.3
|
2.9
|
0.5
|
||||||||||||
|
Preferred & common equity
|
44.4
|
68.4
|
517.3
|
96.6
|
||||||||||||
|
Partnership interest
|
9.5
|
14.7
|
8.4
|
1.6
|
||||||||||||
|
$
|
64.9
|
100.0
|
%
|
$
|
535.5
|
100.0
|
%
|
|||||||||
During the quarter ended December 31, 2015, we established an internally developed investment rating system to rate the performance and monitor the expected level of returns for each debt investment in our portfolio. The investment rating system takes into account both quantitative and qualitative factors of the portfolio company and the investments held therein, including each investment’s expected level of returns and the collectability of our debt investments, comparisons to competitors and other industry participants and the portfolio company's future outlook. The ratings are not intended to reflect the performance or expected level of returns of our equity investments.
| · | Investment Rating 1 represents the least amount of risk in our portfolio. The investment is performing above underwriting expectations and the trends and risk factors are favorable. |
| · | Investment Rating 2 indicates the investment is performing as expected at the time of underwriting and the risk factors are neutral to favorable. |
| · | Investment Rating 3 involves an investment performing below underwriting expectations and indicates that the investment requires closer monitoring. The portfolio company or investment may be out of compliance with financial covenants and interest payments may be impaired, however principal payments are generally not past due. |
| · | Investment Rating 4 indicates that the investment is performing materially below underwriting expectations and the risk of the investment has increased substantially. Interest and principal payments on our investment are likely to be impaired. |
The following table shows the distribution of our debt portfolio investments on the 1 to 4 investment rating scale at fair value as of March 31, 2016:
|
As of March 31, 2016
|
||||||||
|
Investment Rating
|
Debt
Investments at
Fair Value
|
Percentage of
Total Portfolio
|
||||||
|
(dollars in thousands)
|
||||||||
|
1
|
$
|
4,626
|
2.6
|
%
|
||||
|
2
|
88,205
|
49.4
|
|
|||||
|
3
|
-
|
-
|
||||||
|
4
|
-
|
-
|
||||||
|
Total
|
$
|
92,831
|
52.0
|
%
|
||||
Interest and dividend income is recorded on an accrual basis to the extent amounts are expected to be collected. When we do not expect the debtor to be able to service all of its debt or other obligations, we will generally establish a reserve against interest income receivable, thereby placing the loan or debt security on non-accrual status, and cease to recognize interest income on that loan or debt security until the borrower has demonstrated the ability and intent to pay contractual amounts due.
As of March 31, 2016, we did not have any investments on non-accrual status. As of March 31, 2015, we had one investment on non-accrual status.
Investment Activity
During the year ended March 31, 2016, we made seventeen new investments totaling $123.0 million. We received contractual principal repayments totaling approximately $0.5 million. We received proceeds related to a debt investment in one portfolio company of $0.2 million and wrote off the remainder, resulting in a realized loss of $1.2 million. We received proceeds related to the sales of certain partnership interests totaling $5.2 million and recognized net realized losses on those sales totaling $4.3 million. In addition, we received proceeds related to the sales of certain equity securities of our portfolio companies totaling $14.2 million and recognized net realized losses on those sales totaling $5.3 million in the year ended March 31, 2016.
During the year ended March 31, 2015, we made one new investment totaling $6.9 million, an additional debt investment in one existing portfolio company of $0.1 million and additional equity investments in three existing portfolio companies totaling approximately $0.4 million. We wrote off a debt investment in one portfolio and recognized a realized loss on the write-off of $7.4 million. We received proceeds related to the sales of partnership interests totaling $1.0 million and recognized net realized losses on those sales totaling $1.4 million. In addition, we received proceeds related to the sales of certain equity securities of our portfolio companies totaling $204.7 million and recognized net realized gains on those sales totaling $173.1 million in the year ended March 31, 2015.
Total portfolio investment activity for the years ended March 31, 2016 and 2015 was as follows (in thousands):
|
March 31, 2016
|
1st Lien
Notes
|
2nd Lien
Notes
|
Subordinated
Debt
|
Preferred
equity,
common
equity &
warrants
|
I-45 SLF,
LLC
|
Partnership
Interest
|
Total
|
|||||||||||||||||||||
|
Fair value, beginning of period
|
$
|
-
|
$
|
6,895
|
$
|
2,906
|
$
|
517,306
|
$
|
-
|
$
|
8,429
|
$
|
535,536
|
||||||||||||||
|
New investments
|
39,795
|
32,025
|
12,348
|
2,046
|
36,800
|
-
|
123,014
|
|||||||||||||||||||||
|
Proceeds from sales of investments
|
(12
|
)
|
(5
|
)
|
(150
|
)
|
(14,267
|
)
|
-
|
(5,221
|
)
|
(19,655
|
)
|
|||||||||||||||
|
Cost of investments spun off
|
-
|
-
|
-
|
(6,981
|
)
|
-
|
-
|
(6,981
|
)
|
|||||||||||||||||||
|
Principal repayments received
|
(523
|
)
|
-
|
-
|
-
|
-
|
-
|
(523
|
)
|
|||||||||||||||||||
|
Accretion of loan discounts
|
20
|
57
|
19
|
-
|
-
|
-
|
96
|
|||||||||||||||||||||
|
Realized gain (loss)
|
12
|
5
|
(1,187
|
)
|
(5,312
|
)
|
-
|
(4,320
|
)
|
(10,802
|
)
|
|||||||||||||||||
|
Unrealized gain (loss)
|
199
|
(750
|
)
|
1,178
|
14,813
|
(463
|
)
|
1,112
|
16,089
|
|||||||||||||||||||
|
Decrease in unrealized appreciation related to spin-off investments
|
-
|
-
|
-
|
(458,338
|
)
|
-
|
-
|
(458,338
|
)
|
|||||||||||||||||||
|
Fair value, end of period
|
$
|
39,491
|
$
|
38,227
|
$
|
15,114
|
$
|
49,267
|
$
|
36,337
|
$
|
-
|
$
|
178,436
|
||||||||||||||
|
Weighted average yield on debt investments at end of period
|
10.67
|
%
|
||||||||||||||||||||||||||
|
Weighted average yield on total investments at end of period
|
9.46
|
%
|
||||||||||||||||||||||||||
|
March 31, 2015
|
1st Lien
Notes
|
2nd Lien
Notes
|
Subordinated
Debt
|
Preferred &
Common Equity
|
I-45 SLF,
LLC
|
Partnership
Interest
|
Total
|
|||||||||||||||||||||
|
Fair value, beginning of period
|
$
|
-
|
$
|
-
|
$
|
2,707
|
$
|
665,708
|
$
|
-
|
$
|
9,505
|
$
|
677,920
|
||||||||||||||
|
New investments
|
-
|
6,895
|
225
|
1
|
-
|
300
|
7,421
|
|||||||||||||||||||||
|
Proceeds from sales of investments
|
-
|
-
|
-
|
(204,680
|
)
|
-
|
(1,012
|
)
|
(205,692
|
)
|
||||||||||||||||||
|
Accretion of loan discounts
|
-
|
-
|
-
|
-
|
-
|
-
|
-
|
|||||||||||||||||||||
|
Realized gain (loss)
|
-
|
-
|
(7,397
|
)
|
173,058
|
-
|
(1,397
|
)
|
164,264
|
|||||||||||||||||||
|
Unrealized gain (loss)
|
-
|
-
|
7,371
|
(116,781
|
)
|
-
|
1,033
|
(108,377
|
)
|
|||||||||||||||||||
|
Fair value, end of period
|
$
|
-
|
$
|
6,895
|
$
|
2,906
|
$
|
517,306
|
$
|
-
|
$
|
8,429
|
$
|
535,536
|
||||||||||||||
|
Weighted average yield on debt investments at end of period
|
3.14
|
%
|
||||||||||||||||||||||||||
|
Weighted average yield on total investments at end of period
|
0.46
|
%
|
||||||||||||||||||||||||||
RESULTS OF OPERATIONS
The composite measure of our financial performance in the Consolidated Statements of Operations is captioned “(Decrease) increase in net assets from operations” and consists of three elements. The first is “Net investment (loss) income,” which is the difference between income from interest, dividends and fees and our combined operating and interest expenses, net of applicable income taxes. The second element is “Net realized (loss) gain on investments,” which is the difference between the proceeds received from the disposition of portfolio securities and their stated cost, net of applicable income tax expense based on our tax year. The third element is the “Net increase (decrease) in unrealized appreciation of investments,” which is the net change in the market or fair value of our investment portfolio, compared with stated cost. It should be noted that the “Net realized (loss) gain on investments” and “Net increase (decrease) in unrealized appreciation of investments” are directly related in that when an appreciated portfolio security is sold to realize a gain, a corresponding decrease in net unrealized appreciation occurs by transferring the gain associated with the transaction from being “unrealized” to being “realized.” Conversely, when a loss is realized on a depreciated portfolio security, an increase in net unrealized appreciation occurs.
Comparison of years ended March 31, 2016 and March 31, 2015
|
Year Ended March 31,
|
Net Change
|
|||||||||||||||
|
2016
|
2015
|
Amount
|
%
|
|||||||||||||
|
(in thousands)
|
||||||||||||||||
|
Total investment income
|
$
|
9,160
|
$
|
9,948
|
$
|
(788
|
)
|
(7.9
|
%)
|
|||||||
|
Total operating expenses
|
(21,125
|
)
|
(12,123
|
)
|
(9,002
|
)
|
74.3
|
%
|
||||||||
|
Income tax (benefit) expense
|
(1,278
|
)
|
270
|
(1,548
|
)
|
|||||||||||
|
Net investment loss
|
(10,687
|
)
|
(2,445
|
)
|
(8,242
|
)
|
337.1
|
%
|
||||||||
|
Net realized (loss) gain on investments before income tax
|
(10,802
|
)
|
164,264
|
(175,066
|
)
|
|||||||||||
|
Net increase (decrease) in net unrealized appreciation on investments
|
16,089
|
(108,377
|
)
|
124,466
|
||||||||||||
|
Net (decrease) increase in net assets from operations
|
$
|
(5,400
|
)
|
$
|
53,442
|
$
|
(58,842
|
)
|
(110.1
|
%)
|
||||||
Investment Income
Total investment income consisted of interest income, management fees, dividend income and other income for each applicable period. For the year ended March 31, 2016, total investment income was $9.2 million, a $0.8 million, or 7.9%, decrease over total investment income of $9.9 million for the year ended March 31, 2015. This decrease was primarily attributable to a $5.5 million or 61.0%, decrease in dividend income principally due to the elimination of dividend income from The RectorSeal Corporation as a result of the spin-off of CSWI. This decrease was offset by dividend income of $1.8 million from Media Recovery, Inc. and approximately $4.5 million of interest income generated from our debt investments. Total investment income also includes interest income we earn from the short-term investment of cash funds, and the annual amount of such income varies based upon the average level of funds invested during the year and fluctuations in short-term interest rates. During the three years ended March 31, 2016, we had interest income from cash and cash equivalents of $385,752 in 2016, $122,225 in 2015 and $66,949 in 2014.
We receive management fees primarily from our controlled affiliated investments which aggregated $656,200 in 2016, $559,800 in 2015, and $559,800 in 2014. We also received other miscellaneous income of approximately $84,000, $35,000, and $65,000 during the years ended March 31, 2016, 2015 and 2014, respectively, related primarily to other portfolio company activity.
Operating Expenses
Total operating expenses increased $9.0 million, or 74.3%, during the year ended March 31, 2016, as compared to the year ended March 31, 2015. Due to the nature of our business as an investment company, the majority of our operating expenses are related to employee and director compensation, office expenses, legal, professional and accounting fees and pension expenses. The increase in 2016 is primarily due to expenses of $7.0 million related to the spin-off of CSWI, as well as expenses of $1.3 million related to the spin-off compensation plan. Additionally, total compensation expenses of $7.0 million include approximately $1.6 million of compensation expense for employees who transferred to CSWI following the spin-off transaction.
Net Investment Income/Loss
Primarily as a result of the $0.8 million decrease in total investment income and the $9.0 million increase in expenses, net investment loss for the fiscal year ended March 31, 2016 was $10.7 million compared to net investment loss of $2.4 million during the fiscal year ended March 31, 2015.
Increase/Decrease in Net Assets from Operations
During the fiscal year ended March 31, 2016, we recognized a total net realized loss of $10.8 million consisting of the difference between $19.7 million of proceeds from disposition of investments and $30.5 million of cost from investments derived from the following sources:
|
Year Ended March 31, 2016
|
||||||||||||
|
Proceeds
|
Cost
|
Realized gain (loss)
|
||||||||||
|
360 Holdings III Corp.
|
$
|
1,374
|
$
|
-
|
$
|
1,374
|
||||||
|
Alamo Group, Inc.
|
36,872
|
-
|
36,872
|
|||||||||
|
Atlantic Capital Bancshares, Inc
|
3,956,401
|
3,000,000
|
956,401
|
|||||||||
|
Ballast Point Ventures II, LP
|
3,507,598
|
2,634,790
|
872,808
|
|||||||||
|
BankCap Partners GP, L.P.
|
1,596,999
|
5,071,514
|
(3,474,515
|
)
|
||||||||
|
Boxx Technologies, Inc.
|
2,184,184
|
1,500,000
|
684,184
|
|||||||||
|
CapitalSouth Partners Fund
|
50,000
|
433,403
|
(383,403
|
)
|
||||||||
|
Diamond State Ventures, LP
|
32,150
|
-
|
32,150
|
|||||||||
|
First Capital Group of Texas
|
20,000
|
778,894
|
(758,894
|
)
|
||||||||
|
Humac Company
|
231,000
|
-
|
231,000
|
|||||||||
|
iMemories, Inc.
|
150,030
|
6,414,986
|
(6,264,956
|
)
|
||||||||
|
Instawares Holding Company, LLC
|
5,000,000
|
5,000,000
|
-
|
|||||||||
|
StarTech Seed Fund II
|
14,000
|
622,783
|
(608,783
|
)
|
||||||||
|
TaxAct
|
10,555
|
-
|
10,555
|
|||||||||
|
Water Pik, Inc.
|
5,482
|
-
|
5,482
|
|||||||||
|
Wellogix, Inc.
|
2,858,105
|
5,000,000
|
(2,141,895
|
)
|
||||||||
|
Total realized loss
|
$
|
19,654,750
|
$
|
30,456,370
|
$
|
(10,801,620
|
)
|
|||||
|
Income taxes paid
|
(2,947,944
|
)
|
||||||||||
|
Total realized loss, net of taxes
|
$
|
(13,749,564
|
)
|
|||||||||
In addition, for the fiscal year ended March 31, 2016, we recorded a net increase in unrealized appreciation of investments of $16.1 million, consisting of net unrealized appreciation on our current portfolio of $7.6 million and net unrealized appreciation reclassification adjustments of $8.5 million related to the realized gains and losses noted above.
During the fiscal year ended March 31, 2015, we sold our interests in Alamo Group, Inc., which generated a realized gain of $112.9 million. We also sold our interests in Encore Wire Corporation, which resulted in a realized gain of $44.3 million. We also sold our ownership in KBI Biopharma, Inc., for cash proceeds of $18.9 million and a realized gain of $14.4 million. In addition, we sold our interests in Trax Holdings, Inc. for cash proceeds of $16.1 million, resulting in a realized gain of $7.9 million. These gains were offset by a $14.8 million realized loss from the sale of Cinatra Clean Technologies, Inc., a $1.2 million realized loss related to the liquidation of Discovery Alliance, LLC, and a realized loss of $0.2 million from the liquidation of Tristate Capital Holdings, Inc. In addition, for the fiscal year ended March 31, 2015, we recorded net unrealized depreciation of $108.4 million, consisting of net unrealized appreciation on our current portfolio of $98.6 million and net unrealized depreciation reclassification adjustments of $207.0 million related to the realized gains and losses noted above.
As a result of these events, our net decrease in net assets from operations during the year ended March 31, 2016 was $5.4 million as compared to an increase in net assets from operations of $53.4 million for the year ended March 31, 2015.
Comparison of years ended March 31, 2015 and March 31, 2014
|
Year Ended March 31,
|
Net Change
|
|||||||||||||||
|
2015
|
2014
|
Amount
|
%
|
|||||||||||||
|
(in thousands)
|
||||||||||||||||
|
Total investment income
|
$
|
9,948
|
$
|
12,607
|
$
|
(2,659
|
)
|
(21.1
|
%)
|
|||||||
|
Total operating expenses
|
(12,123
|
)
|
(8,452
|
)
|
(3,671
|
)
|
43.4
|
%
|
||||||||
|
Income tax expense (benefit)
|
270
|
(739
|
)
|
1,009
|
||||||||||||
|
Net investment (loss) income
|
(2,445
|
)
|
4,894
|
(7,339
|
)
|
(150.0
|
%)
|
|||||||||
|
Net realized gain on investments before income tax
|
164,264
|
14,084
|
150,180
|
|||||||||||||
|
Net (decrease) increase in unrealized appreciation of investments
|
(108,377
|
)
|
93,032
|
(201,409
|
)
|
|||||||||||
|
Net increase in net assets from operations
|
$
|
53,442
|
$
|
112,010
|
$
|
(58,568
|
)
|
(52.3
|
%)
|
|||||||
Investment Income
For the year ended March 31, 2015, total investment income was $9.9 million, a $2.6 million, or 21.1%, decrease over total investment income of $12.6 million for the year ended March 31, 2014. This decrease was primarily attributable to a $2.5 million, or 21.5%, decrease in dividend income principally due to a one-time dividend of $1.7 million received from Wellogix during the year ended March 31, 2014 and a reduction of $0.4 million in dividend income from publicly traded securities due to our divestures of these securities during the year ended March 31, 2015.
As compared to the fiscal year ended March 31, 2014, management fees for the year ended March 31, 2015 decreased by $31,500 or 5.3% as Trax Holdings, Inc. management fees ceased pursuant to the terms of its Series B financing.
Operating Expenses
Total operating expenses increased by $3.7 million, or 43.4% during the year ended March 31, 2015 as compared to the year ended March 31, 2014. The increase in 2015 was primarily due to an increase of $2.4 million in professional fees, of which $1.8 million was related to the spin-off of CSWI, and the remaining $0.6 million was related to legal fees incurred in conjunction with Alamo Group’s secondary offering and our review of strategic alternatives. The increase in total operating expenses was also due to an additional $1.7 million stock option expense in connection with the executive compensation plan. These increases were offset by a decrease of $0.7 million in salaries due to certain staffing changes in fiscal year 2014.
Net Investment Income/Loss
As a result of the $2.6 million decrease in total investment income and the $3.7 million increase in expenses, net investment loss for the fiscal year ended March 31, 2015 was $2.4 million compared to net investment income of $4.9 million during the fiscal year ended March 31, 2014.
Increase/Decrease in Net Assets from Operations
During the fiscal year ended March 31, 2015, we recognized a total realized gain of $164.2 million. We sold our interests in Alamo Group, Inc., which generated a realized gain of $112.9 million. We also sold our interests in Encore Wire Corporation, which resulted in a realized gain of $44.3 million, and in KBI Biopharma, Inc., which produced a realized gain of $14.4 million. In addition, we sold our interests in Trax Holdings, Inc. for cash proceeds of $16.1 million, resulting in a realized gain of $7.9 million. These gains were offset by a $14.8 million realized loss from the sale of Cinatra Clean Technologies, Inc., a $1.2 million realized loss related to the liquidation of Discovery Alliance, LLC, and a realized loss of $0.2 million from the liquidation of Tristate Capital Holdings, Inc. In addition, for the fiscal year ended March 31, 2015, we recorded net unrealized depreciation of $108.4 million, consisting of net unrealized appreciation on our current portfolio of $98.6 million and net unrealized depreciation reclassification adjustments of $207.0 million related to the realized gains and losses noted above.
During the fiscal year ended March 31, 2014, we recognized total realized gains of $14.1 million. We had realized gains of $12.6 million from the sale of Hologic, Inc.’s common stock, $0.7 million from the redemption of TCI Holdings Inc.’s preferred stock, and $0.7 million from the sale of our interest in PalletOne. In addition, for the fiscal year ended March 31, 2014, we recorded net unrealized appreciation of $93.0 million, consisting of net unrealized appreciation on our current portfolio of $107.0 million and net unrealized depreciation reclassification adjustments of $13.9 million related to realized gains noted above.
FINANCIAL LIQUIDITY AND CAPITAL RESOURCES
At March 31, 2016, we had cash and cash equivalents of approximately $96.0 million.
With the exception of one capital gain distribution made in the form of cash dividends during the fiscal year ended March 31, 2016, two capital gain distributions made in the form of cash dividends during fiscal year ended March 31, 2013 and a capital gain distribution made in the form of a distribution of the stock of a portfolio company in the fiscal year ended March 31, 1996, we have historically elected to retain all gains realized during our more than 50 years of operation. Retention of future gains is viewed as an important source of funds to sustain our investment activity.
Management believes that our cash and cash equivalents and funds available from other sources described above are adequate to meet our expected cash requirements. The disposition of investments from time to time may also be a source of funds for future investment activities
.
CRITICAL ACCOUNTING POLICIES AND USE OF ESTIMATES
The preparation of our financial statements in accordance with U.S. GAAP requires management to make certain estimates and assumptions that affect the reported amounts of assets and liabilities at the date of the financial statements and the reported amounts of revenues and expenses for the periods covered by the financial statements. We have identified investment valuation and revenue recognition as our most critical accounting estimates. On an on-going basis, we evaluate our estimates, including those related to the matters below. These estimates are based on the information that is currently available to us and on various other assumptions that we believe to be reasonable under the circumstances. Actual results could differ materially from those estimates under different assumptions or conditions. A discussion of our critical accounting policies follows.
Valuation of Investments
The most significant determination inherent in the preparation of our consolidated financial statements is the valuation of our investment portfolio and the related amounts of unrealized appreciation and depreciation. As of March 31, 2016 and 2015, our investment portfolio at fair value represented approximately 63% and 69% of our total assets, respectively. We are required to report our investments at fair value. We follow the provisions of FASB ASC 820,
Fair Value Measurements and Disclosures
("ASC 820"). ASC 820 defines fair value, establishes a framework for measuring fair value, establishes a fair value hierarchy based on the quality of inputs used to measure fair value, and enhances disclosure requirements for fair value measurements. ASC 820 requires us to assume that the portfolio investment is to be sold in the principal market to independent market participants, which may be a hypothetical market. See Note 5 — “Fair Value Measurements” in the notes to consolidated financial statements for a detailed discussion of our investment portfolio valuation process and procedures.
Due to the inherent uncertainty in the valuation process, our determination of fair value for our investment portfolio may differ materially from the values that would have been determined had a ready market for the securities actually existed. In addition, changes in the market environment, portfolio company performance, and other events may occur over the lives of the investments that may cause the gains or losses ultimately realized on these investments to be materially different than the valuations currently assigned. We determine the fair value of each individual investment and record changes in fair value as unrealized appreciation or depreciation.
Our Board of Directors has the final responsibility for reviewing and approving, in good faith, our determination of the fair value for our investment portfolio and our valuation procedures, consistent with 1940 Act requirements. We believe our investment portfolio as of March 31, 2016 and 2015 approximates fair value as of those dates based on the markets in which we operate and other conditions in existence on those reporting dates.
Revenue Recognition
Interest and Dividend Income
Interest and dividend income is recorded on an accrual basis to the extent amounts are expected to be collected. Dividend income is recognized on the date dividends are declared. Discounts/premiums received to par on loans purchased are capitalized and accreted or amortized into income over the life of the loan. Any remaining discount/premium is accreted or amortized into income upon prepayment of the loan. In accordance with our valuation policy, accrued interest and dividend income is evaluated periodically for collectability. When we do not expect the debtor to be able to service all of its debt or other obligations, we will generally establish a reserve against interest income receivable, thereby placing the loan or debt security on non-accrual status, and cease to recognize interest income on that loan or debt security until the borrower has demonstrated the ability and intent to pay contractual amounts due. If a loan or debt security’s status significantly improves regarding ability to service debt or other obligations, it will be restored to accrual basis.
Recently Issued Accounting Standards
In February 2015, the FASB issued Accounting Standards Update 2015-02,
Consolidation (ASC Topic 810): Amendments to the Consolidation Analysis
(“ASU 2015-02”)
.
ASU 2015-02 significantly changes the consolidation analysis required under GAAP and ends the deferral of the amendments to the VIE guidance in ASU 2009-17 (FAS 166) for investments in certain investment companies. Now all legal entities that are VIEs are evaluated for consolidation under the same criteria. Under this update, limited partnerships (or similar entities) that provide the limited partners with substantive kick-out or participating rights will be considered voting interest entities. For these entities, the investor that holds the majority of the substantive kick-out or participating rights will consolidate the VIE. This has the effect of reducing the likelihood that a general partner will consolidate a limited partnership or similar entity. ASU 2015-02 is effective for interim and annual reporting periods in fiscal years that begin after December 15, 2015 and early adoption is permitted. In accordance with this new guidance, we did not consolidate I-45 SLF, LLC based on the voting model as we only control 50% of the voting rights of this entity and, accordingly, share power over the entity equally in all respects with our joint venture partner. We adopted this guidance during the quarter ended December 31, 2015.
In May 2015, the FASB issued ASU 2015-07,
Fair Value Measurements – Disclosures for Certain Entities that Calculate Net Asset Value per Share.
This amendment updates guidance intended to eliminate the diversity in practice surrounding how investments measured at net asset value under the practical expedient with future redemption dates have been categorized in the fair value hierarchy. Under the updated guidance, investments for which fair value is measured at net asset value per share using the practical expedient should no longer be categorized in the fair value hierarchy, while investments for which fair value is measured at net asset value per share but the practical expedient is not applied should continue to be categorized in the fair value hierarchy. The updated guidance requires retrospective adoption for all periods presented and is effective for interim and annual reporting periods beginning after December 15, 2015, with early adoption permitted. We elected to adopt this guidance during the quarter ended December 31, 2015. As a result, investments measured at net asset value per share using the practical expedient are no longer categorized in the fair value hierarchy. In addition, our fair value hierarchy table as of March 31, 2015 has been adjusted to reflect the adoption of ASU 2015-07 on a retrospective basis.
CONTRACTUAL OBLIGATIONS
As shown below, we had the following contractual obligations as of March 31, 2016. For information on our capital commitments, see Note
12
of the Notes to Consolidated Financial Statements.
|
Payments Due By Period
(In thousands)
|
||||||||||||||||
|
Contractual Obligations
|
Total
|
1 Year
|
2-3 Years
|
More Than
3 Years
|
||||||||||||
|
Operating lease obligations
|
$
|
1,468
|
$
|
230
|
$
|
488
|
$
|
750
|
||||||||
RECENT DEVELOPMENTS
In April 2016, we exited our investment in Freedom Truck Finance and received principal and accrued interest payments totaling $6.0 million. On June 7, 2016, we announced our board of directors had declared a $0.06 dividend per share for the quarter ended for June 30, 2016. The record date for the dividend is June 20, 2016. The payment date for the dividend is July 1, 2016.
Our investment portfolio consists of debt and equity securities of private companies. We are subject to financial market risks, including changes in interest rates for debt securities of private companies. Changes in interest rates may affect our interest income from portfolio investments and idle fund investments. Our risk management systems and procedures are designed to identify and analyze our risk, to set appropriate policies and limits and to continually monitor these risks. Our investment income will be affected by changes in various interest rates, including LIBOR and prime rates, to the extent of any debt investments that include floating interest rates. The majority of our debt investments are made with either fixed interest rates or floating rates that are subject to contractual minimum interest rates for the term of the investment. As of March 31, 2016, approximately 82.6% of our debt investment portfolio (at fair value) bore interest at floating rates, 92.1% of which were subject to contractual minimum interest rates. The performance of our equity securities is also a function of our portfolio companies’ profitability, which may be affected by economic cycles, competitive forces, and production costs including labor rates, raw material prices and certain basic commodity prices. All of these factors may have an adverse effect on the value of our investments and on our net asset value. As of March 31, 2016, none of our idle fund investments bore interest at floating rates.
Index to Financial Statements
|
Page
|
|
|
Reports of Independent Registered Public Accounting Firm
|
51
|
|
Consolidated Statements of Assets and Liabilities as of March 31, 2016 and 2015
|
53
|
|
Consolidated Statements of Operations for Years Ended March 31, 2016, 2015 and 2014
|
54
|
|
Consolidated Statements of Changes in Net Assets for Years Ended March 31, 2016, 2015 and 2014
|
55
|
|
Consolidated Statements of Cash Flows for Years Ended March 31, 2016, 2015 and 2014
|
56
|
|
Consolidated Schedules of Investments as of March 31, 2016 and 2015
|
58
|
|
Notes to Consolidated Financial Statements
|
64
|
REPORT OF INDEPENDENT REGISTERED PUBLIC ACCOUNTING FIRM
Board of Directors and Shareholders
Capital Southwest Corporation
We have audited the accompanying consolidated statements of assets and liabilities of Capital Southwest Corporation (a Texas Corporation) and subsidiaries (the “Company”), including the consolidated schedules of investments, as of March 31, 2016 and 2015, and the related consolidated statements of operations, changes in net assets, and cash flows for each of the three years in the period ended March 31, 2016 and the selected per share data and ratios for each of the five years in the period ended March 31, 2016. Our audits of the basic consolidated financial statements included the Schedule of Investments In and Advances to Affiliates listed in the index appearing under Item 15(2). These financial statements, per share data and ratios, and financial statement schedule are the responsibility of the Company’s management. Our responsibility is to express an opinion on these financial statements, per share data and ratios, and financial statement schedule based on our audits.
We conducted our audits in accordance with the standards of the Public Company Accounting Oversight Board (United States). Those standards require that we plan and perform the audit to obtain reasonable assurance about whether the financial statements are free of material misstatement. An audit includes examining, on a test basis, evidence supporting the amounts and disclosures in the financial statements. An audit also includes assessing the accounting principles used and significant estimates made by management, as well as evaluating the overall financial statement presentation. Our procedures included verification by confirmation of securities as of March 31, 2016 and 2015, by correspondence with the portfolio companies and custodians, or by other appropriate auditing procedures where replies were not received. We believe that our audits provide a reasonable basis for our opinion.
In our opinion, the consolidated financial statements, including the consolidated schedule of investments referred to above present fairly, in all material respects, the financial position of Capital Southwest Corporation and subsidiaries as of March 31, 2016 and 2015, and the results of their operations, changes in their net assets, and their cash flows for each of the three years in the period ended March 31, 2016, and the selected per share data and ratios for each of the five years in the period ended March 31, 2016, in conformity with accounting principles generally accepted in the United States of America. Also in our opinion, the related financial statement schedule, when considered in relation to the basic consolidated financial statements taken as a whole, presents fairly, in all material respects, the information set forth therein.
We also have audited, in accordance with the standards of the Public Company Accounting Oversight Board (United States), the Company’s internal control over financial reporting as of March 31, 2016, based on criteria established in the 2013
Internal Control—Integrated Framework
issued by the Committee of Sponsoring Organizations of the Treadway Commission (COSO), and our report dated June 14, 2016 expressed an unqualified opinion thereon.
/s/ Grant Thornton LLP
Dallas, Texas
June 14, 2016
REPORT OF INDEPENDENT REGISTERED PUBLIC ACCOUNTING FIRM
Board of Directors and Shareholders
Capital Southwest Corporation
We have audited the internal control over financial reporting of Capital Southwest Corporation (a Texas Corporation) and subsidiaries (the “Company”) as of March 31, 2016, based on criteria established in the 2013
Internal Control—Integrated Framework
issued by the Committee of Sponsoring Organizations of the Treadway Commission (COSO). The Company’s management is responsible for maintaining effective internal control over financial reporting and for its assessment of the effectiveness of internal control over financial reporting, included in the accompanying Management’s Report on Internal Control over Financial Reporting. Our responsibility is to express an opinion on the Company’s internal control over financial reporting based on our audit.
We conducted our audit in accordance with the standards of the Public Company Accounting Oversight Board (United States). Those standards require that we plan and perform the audit to obtain reasonable assurance about whether effective internal control over financial reporting was maintained in all material respects. Our audit included obtaining an understanding of internal control over financial reporting, assessing the risk that a material weakness exists, testing and evaluating the design and operating effectiveness of internal control based on the assessed risk, and performing such other procedures as we considered necessary in the circumstances. We believe that our audit provides a reasonable basis for our opinion.
A company’s internal control over financial reporting is a process designed to provide reasonable assurance regarding the reliability of financial reporting and the preparation of financial statements for external purposes in accordance with generally accepted accounting principles. A company’s internal control over financial reporting includes those policies and procedures that (1) pertain to the maintenance of records that, in reasonable detail, accurately and fairly reflect the transactions and dispositions of the assets of the company; (2) provide reasonable assurance that transactions are recorded as necessary to permit preparation of financial statements in accordance with generally accepted accounting principles, and that receipts and expenditures of the company are being made only in accordance with authorizations of management and directors of the company; and (3) provide reasonable assurance regarding prevention or timely detection of unauthorized acquisition, use, or disposition of the company’s assets that could have a material effect on the financial statements.
Because of its inherent limitations, internal control over financial reporting may not prevent or detect misstatements. Also, projections of any evaluation of effectiveness to future periods are subject to the risk that controls may become inadequate because of changes in conditions, or that the degree of compliance with the policies or procedures may deteriorate.
In our opinion, the Company maintained, in all material respects, effective internal control over financial reporting as of March 31, 2016, based on criteria established in the 2013
Internal Control—Integrated Framework
issued by COSO.
We also have audited, in accordance with the standards of the Public Company Accounting Oversight Board (United States), the consolidated statements of assets and liabilities, including the consolidated schedules of investments as of March 31, 2016 and 2015 and the related consolidated statements of operations, changes in net assets, and cash flows for each of the three years in the period ended March 31, 2016 and the selected per share data and ratios for each of the five years in the period ended March 31, 2015, and our report dated June 14, 2016 expressed an unqualified opinion on those financial statements.
/s/ Grant Thornton LLP
Dallas, Texas
June 14, 2016
CAPITAL SOUTHWEST CORPORATION AND SUBSIDIARIES
CONSOLIDATED STATEMENTS OF ASSETS AND LIABILITIES
(In thousands except shares and per share data)
|
March 31,
2016
|
March 31,
2015
|
|||||||
|
Assets
|
||||||||
|
Investments at fair value:
|
||||||||
|
Non-control/Non-affiliate investments (Cost: March 31, 2016 - $101,538, March 31, 2015 - $12,396)
|
$
|
99,279
|
$
|
37,776
|
||||
|
Affiliate investments (Cost: March 31, 2016 - $6,356, March 31, 2015 - $6,944)
|
10,618
|
8,345
|
||||||
|
Control investments (Cost: March 31, 2016 - $42,215, March 31, 2015 - $45,620)
|
68,539
|
489,415
|
||||||
|
Total investments (Cost: March 31, 2016 - $150,110, March 31, 2015 - $64,960)
|
178,436
|
535,536
|
||||||
|
Cash and cash equivalents
|
95,969
|
225,797
|
||||||
|
Receivables
|
||||||||
|
Dividends and interest
|
1,752
|
77
|
||||||
|
Escrow
|
3,424
|
2,854
|
||||||
|
Other
|
219
|
1,392
|
||||||
|
Income tax receivable
|
1,010
|
95
|
||||||
|
Net pension assets
|
-
|
10,294
|
||||||
|
Deferred tax asset
|
2,342
|
-
|
||||||
|
Other assets
|
1,341
|
827
|
||||||
|
Total assets
|
$
|
284,493
|
$
|
776,872
|
||||
|
Liabilities
|
||||||||
|
Other liabilities
|
$
|
5,713
|
$
|
4,923
|
||||
|
Payable for unsettled transaction
|
3,940
|
-
|
||||||
|
Accrued restoration plan liability
|
2,205
|
3,119
|
||||||
|
Deferred income taxes
|
-
|
1,412
|
||||||
|
Total liabilities
|
11,858
|
9,454
|
||||||
|
Net Assets
|
||||||||
|
Common stock, $0.25 par value: authorized, 25,000,000 shares; issued, 18,065,518 shares at March 31, 2016 and 17,904,844 shares at March 31, 2015
|
4,516
|
4,476
|
||||||
|
Additional capital
|
262,539
|
298,338
|
||||||
|
Accumulated net investment (loss) income
|
(307
|
)
|
(4,390
|
)
|
||||
|
Accumulated net realized gain
|
1,498
|
22,355
|
||||||
|
Unrealized appreciation of investments
|
28,326
|
470,576
|
||||||
|
Treasury stock - at cost, 2,339,512 shares
|
(23,937
|
)
|
(23,937
|
)
|
||||
|
Total net assets
|
272,635
|
767,418
|
||||||
|
Total liabilities and net assets
|
$
|
284,493
|
$
|
776,872
|
||||
|
Net asset value per share (15,726,006 shares outstanding at March 31, 2016 and 15,565,332 shares outstanding at March 31, 2015)
|
$
|
17.34
|
$
|
49.30
|
||||
The accompanying Notes are an integral part of these Consolidated Financial Statements.
CAPITAL SOUTHWEST CORPORATION AND SUBSIDIARIES
CONSOLIDATED STATEMENTS OF OPERATIONS
(In thousands except shares and per share data)
|
Years Ended March 31,
|
||||||||||||
|
2016
|
2015
|
2014
|
||||||||||
|
Investment income:
|
||||||||||||
|
Interest and dividends
|
||||||||||||
|
Non-control/Non-affiliate investments
|
$
|
4,409
|
$
|
356
|
$
|
439
|
||||||
|
Affiliate investments
|
135
|
581
|
2,826
|
|||||||||
|
Control investments
|
3,489
|
8,294
|
8,650
|
|||||||||
|
Interest income from cash and cash equivalents
|
386
|
122
|
67
|
|||||||||
|
Fees and other income
|
741
|
595
|
625
|
|||||||||
|
Total investment income
|
9,160
|
9,948
|
12,607
|
|||||||||
|
Operating expenses:
|
||||||||||||
|
Compensation
|
7,031
|
5,413
|
6,121
|
|||||||||
|
Spin-off compensation plan
|
1,303
|
-
|
-
|
|||||||||
|
Share-based compensation (benefit)
|
1,181
|
1,027
|
(632
|
)
|
||||||||
|
Net pension (benefit) expense
|
(99
|
)
|
(280
|
)
|
176
|
|||||||
|
Spin-off professional fees
|
7,040
|
1,819
|
-
|
|||||||||
|
General and administrative
|
4,669
|
4,144
|
2,787
|
|||||||||
|
Total operating expenses
|
21,125
|
12,123
|
8,452
|
|||||||||
|
(Loss) income before income taxes
|
(11,965
|
)
|
(2,175
|
)
|
4,155
|
|||||||
|
Income tax (benefit) expense
|
(1,278
|
)
|
270
|
(739
|
)
|
|||||||
|
Net investment (loss) income
|
$
|
(10,687
|
)
|
$
|
(2,445
|
)
|
$
|
4,894
|
||||
|
Realized (loss) gain:
|
||||||||||||
|
Non-control/Non-affiliate investments
|
(9,575
|
)
|
8,226
|
14,084
|
||||||||
|
Affiliate investments
|
(1,458
|
)
|
157,213
|
-
|
||||||||
|
Control investments
|
231
|
(1,175
|
)
|
-
|
||||||||
|
Total net realized (loss) gain on investments before income tax
|
(10,802
|
)
|
164,264
|
14,084
|
||||||||
|
Net increase (decrease) in unrealized appreciation of investments
|
16,089
|
(108,377
|
)
|
93,032
|
||||||||
|
Net realized and unrealized gain on investments
|
$
|
5,287
|
$
|
55,887
|
$
|
107,116
|
||||||
|
Net (decrease) increase in net assets from operations
|
$
|
(5,400
|
)
|
$
|
53,442
|
$
|
112,010
|
|||||
|
Net investment (loss) income per share – basic and diluted
|
$
|
(.68
|
)
|
$
|
(.16
|
)
|
$
|
.32
|
||||
|
Net (decrease) increase in net assets from operations – basic and diluted
|
$
|
(.35
|
)
|
$
|
3.44
|
$
|
7.32
|
|||||
|
Weighted average shares outstanding - basic
|
15,635,597
|
15,491,870
|
15,227,581
|
|||||||||
|
Weighted average shares outstanding – diluted
|
15,723,617
|
15,530,974
|
15,298,343
|
|||||||||
The accompanying Notes are an integral part of these Consolidated Financial Statements.
CAPITAL SOUTHWEST CORPORATION AND SUBSIDIARIES
CONSOLIDATED STATEMENTS OF CHANGES IN NET ASSETS
(In thousands)
|
Years Ended March 31,
|
||||||||||||
|
2016
|
2015
|
2014
|
||||||||||
|
Operations:
|
||||||||||||
|
Net investment (loss) income
|
$
|
(10,687
|
)
|
$
|
(2,445
|
)
|
$
|
4,894
|
||||
|
Net realized (loss) gain on investments
|
(10,802
|
)
|
164,264
|
14,084
|
||||||||
|
Net increase (decrease) in unrealized appreciation of investments
|
16,089
|
(108,377
|
)
|
93,032
|
||||||||
|
Net (decrease) increase in net assets from operations
|
(5,400
|
)
|
53,442
|
112,010
|
||||||||
|
Distributions from:
|
||||||||||||
|
Undistributed net investment income
|
(625
|
)
|
(3,083
|
)
|
(3,050
|
)
|
||||||
|
Net realized gains
|
(1,544
|
)
|
-
|
-
|
||||||||
|
Taxes incurred on deemed capital gain distributions
|
(2,948
|
)
|
(54,370
|
)
|
(3,787
|
)
|
||||||
|
Distributions of CSW Industrials, Inc.
|
||||||||||||
|
Decrease in unrealized appreciation related to spin-off investments
|
(458,338
|
)
|
-
|
-
|
||||||||
|
Distribution from additional capital
|
(27,540
|
)
|
-
|
-
|
||||||||
|
Capital share transactions:
|
||||||||||||
|
Change in pension plan funded status
|
-
|
(789
|
)
|
1,250
|
||||||||
|
Exercise of employee stock options
|
431
|
803
|
4,820
|
|||||||||
|
Share-based compensation expense (benefit)
|
1,181
|
1,027
|
(632
|
)
|
||||||||
|
(Decrease) increase in net assets
|
(494,783
|
)
|
(2,970
|
)
|
110,611
|
|||||||
|
Net assets, beginning of period
|
767,418
|
770,388
|
659,777
|
|||||||||
|
Net assets, end of period
|
$
|
272,635
|
$
|
767,418
|
$
|
770,388
|
||||||
The accompanying Notes are an integral part of these Consolidated Financial Statements.
CAPITAL SOUTHWEST CORPORATION AND SUBSIDIARIES
CONSOLIDATED STATEMENTS OF CASH FLOWS
(In thousands)
|
Years Ended March 31,
|
||||||||||||
|
2016
|
2015
|
2014
|
||||||||||
|
Cash flows from operating activities
|
||||||||||||
|
Net (decrease) increase in net assets from operations
|
$
|
(5,400
|
)
|
$
|
53,442
|
$
|
112,010
|
|||||
|
Adjustments to reconcile net (decrease) increase in net assets from operations to net cash provided by operating activities:
|
||||||||||||
|
Purchases and originations of investments
|
(123,014
|
)
|
(7,421
|
)
|
(12,607
|
)
|
||||||
|
Net proceeds from disposition of and return of capital on investments
|
19,643
|
205,692
|
15,990
|
|||||||||
|
Principal repayments on debt investments
|
523
|
-
|
-
|
|||||||||
|
Payment of accreted original issue discounts
|
12
|
-
|
-
|
|||||||||
|
Depreciation and amortization
|
86
|
55
|
23
|
|||||||||
|
Net pension (benefit) expense
|
(308
|
)
|
(530
|
)
|
176
|
|||||||
|
Realized loss (gain) on investments before income tax
|
10,802
|
(164,264
|
)
|
(14,084
|
)
|
|||||||
|
Net (increase) decrease in unrealized appreciation of investments
|
(16,089
|
)
|
108,377
|
(93,032
|
)
|
|||||||
|
Accretion of discounts on investments
|
(96
|
)
|
-
|
-
|
||||||||
|
Stock option and restricted awards expense (benefit)
|
1,181
|
1,027
|
(632
|
)
|
||||||||
|
Deferred income tax benefit
|
(1,278
|
)
|
-
|
-
|
||||||||
|
(Increase) decrease in dividend and interest receivable
|
(1,675
|
)
|
705
|
1,683
|
||||||||
|
(Increase) decrease in escrow receivables
|
(570
|
)
|
(3,687
|
)
|
-
|
|||||||
|
Decrease (increase) in other receivables
|
1,173
|
(137
|
)
|
(131
|
)
|
|||||||
|
(Increase) decrease in tax receivable
|
(915
|
)
|
72
|
(167
|
)
|
|||||||
|
Increase in other assets
|
(601
|
)
|
(604
|
)
|
(100
|
)
|
||||||
|
(Decrease) increase in other liabilities
|
165
|
2,085
|
(513
|
)
|
||||||||
|
Increase in payable for unsettled transaction
|
3,940
|
-
|
-
|
|||||||||
|
Decrease in deferred income taxes
|
915
|
(528
|
)
|
(203
|
)
|
|||||||
|
Net cash (used in) provided by operating activities
|
(111,506
|
)
|
194,284
|
8,413
|
||||||||
|
Cash flows from financing activities
|
||||||||||||
|
Taxes incurred on deemed capital gain distribution
|
(2,948
|
)
|
(54,370
|
)
|
(3,787
|
)
|
||||||
|
Distributions from undistributed net investment income
|
-
|
(3,083
|
)
|
(3,050
|
)
|
|||||||
|
Distributions from undistributed net realized gain
|
(1,544
|
)
|
-
|
-
|
||||||||
|
Proceeds from exercise of employee stock options
|
431
|
803
|
4,820
|
|||||||||
|
Spin-off Compensation Plan distribution
|
(1,261
|
)
|
-
|
-
|
||||||||
|
Cash distribution to CSW Industrials
|
(13,000
|
)
|
-
|
-
|
||||||||
|
Net cash (used in) provided by financing activities
|
(18,322
|
)
|
(56,650
|
)
|
(2,017
|
)
|
||||||
|
Net (decrease) increase in cash and cash equivalents
|
(129,828
|
)
|
137,634
|
6,396
|
||||||||
|
Cash and cash equivalents at beginning of period
|
225,797
|
88,163
|
81,767
|
|||||||||
|
Cash and cash equivalents at end of period
|
$
|
95,969
|
$
|
225,797
|
$
|
88,163
|
||||||
|
Supplemental disclosure of cash flow information:
|
||||||||||||
|
Income taxes paid
|
$
|
-
|
$
|
362
|
$
|
350
|
||||||
56
|
Summary of Non-Cash Financing Activities
|
||||||||||||
|
Cost of Investments spun-off
1
|
$
|
6,981
|
$
|
-
|
$
|
-
|
||||||
|
Decrease in unrealized appreciation due to spin-off of CSWI
1
|
(458,338
|
) |
-
|
-
|
||||||||
|
Net pension assets
1
|
9,687
|
-
|
-
|
|||||||||
|
Change in deferred tax liabilities
1
|
3,391
|
-
|
-
|
|||||||||
|
Dividend declared, not yet paid
|
625
|
|||||||||||
1
These non-cash items are related to the spin-off of CSW Industrials, Inc. at September 30, 2015.
Other non-cash transactions:
|
a.
|
In March 2014, the $5,279,112 investment in Cinatra Clean Technologies, Inc. debt security and $1,579,056 accrued interest were converted into Preferred Stock.
|
|
b.
|
In March 2015, we received net proceeds of $18,922,619 and 861,561 shares of common stock in kSep, Inc. from the sale of our preferred shares of KBI Biopharma, Inc.
|
|
c.
|
In March 2015, we received net proceeds of $16,085,826 and 211,368 shares of common stock in Trax Data Refinery, Inc. from the sale of our preferred shares of Trax Holdings, Inc.
|
These transactions had the following non-cash effect on our Consolidated Statements of Assets and Liabilities:
|
2016
|
2015
|
2014
|
||||||||||
|
Total Investments
|
$
|
-
|
$
|
1,261
|
$
|
6,858
|
||||||
The accompanying Notes are an integral part of these Consolidated Financial Statements.
CAPITAL SOUTHWEST CORPORATION AND SUBSIDIARIES
CONSOLIDATED SCHEDULE OF INVESTMENTS
March 31, 2016
|
Portfolio Company
1
|
Type of
Investment
|
Industry
|
Current
Interest
Rate
2
|
Maturity
|
Principal
|
Cost
|
Fair
Value
3
|
||||||||||||||
|
Non-control/Non-affiliate Investments
4
|
|||||||||||||||||||||
|
360 HOLDINGS III CORP.
|
Senior secured debt
|
Consumer products & retail
|
L+9.00%
(Floor 1.00%)
|
10/1/2021
|
$
|
6,965,000
|
$
|
6,695,926
|
$
|
6,721,225
|
|||||||||||
|
ARGON MEDICAL DEVICES
|
Senior secured debt
|
Healthcare products
|
L+9.50%
(Floor 1.00%)
|
12/23/2021
|
5,000,000
|
4,854,244
|
4,962,500
|
||||||||||||||
|
BDF ACQUISITION CORP.
|
Senior secured debt
|
Consumer products & retail
|
L+8.00%
(Floor 1.00%)
|
2/12/2022
|
5,000,000
|
4,803,167
|
4,825,000
|
||||||||||||||
|
CAST AND CREW PAYROLL, LLC
|
Senior secured debt
|
Media, marketing & entertainment
|
L+7.75%
(Floor 1.00%)
|
8/12/2023
|
5,000,000
|
4,970,378
|
4,725,000
|
||||||||||||||
|
DEEPWATER CORROSION SERVICES, INC.
|
127,004 shares of Series A convertible preferred stock
|
Energy services (upstream)
|
-
|
-
|
-
|
8,000,000
|
5,046,000
|
||||||||||||||
|
DIGITAL RIVER, INC.
|
Senior secured debt
|
Software & IT services
|
L+6.50%
(Floor 1.00%)
|
2/12/2021
|
4,632,285
|
4,598,218
|
4,626,495
|
||||||||||||||
|
FREEDOM TRUCK FINANCE, LLC
5,6
|
Senior secured debt
|
Financial services
|
Prime plus 9.75%
(Floor 3.25%)
|
4/15/2016
|
5,839,504
|
5,839,504
|
5,839,504
|
||||||||||||||
|
HYGEA HOLDINGS
|
Senior secured debt
|
Healthcare services
|
L+9.25%
|
2/22/2016
|
8,000,000
|
7,298,715
|
7,298,715
|
||||||||||||||
|
|
Warrants
|
-
|
-
|
-
|
546,000
|
546,000
|
|||||||||||||||
|
7,844,715
|
7,844,715
|
||||||||||||||||||||
|
IMAGINE! PRINT SOLUTIONS, INC.
|
Senior secured debt
|
Media, marketing & entertainment
|
L+6.00%
(Floor 1.00%)
|
3/30/2022
|
4,000,000
|
3,940,000
|
3,940,000
|
||||||||||||||
|
LTI HOLDINGS, INC.
|
Senior secured debt
|
Industrial products
|
L+9.25%
(Floor 1.00%)
|
4/30/2023
|
7,000,000
|
6,837,644
|
6,298,099
|
||||||||||||||
|
PREPAID LEGAL SERVICES. INC.
|
Senior secured debt
|
Consumer services
|
L+9.00%
(Floor 1.25%)
|
7/1/2020
|
5,000,000
|
4,944,630
|
4,950,000
|
||||||||||||||
|
RESEARCH NOW GROUP, INC.
|
Senior secured debt
|
Business services
|
L+8.75%
(Floor 1.00%)
|
3/18/2022
|
7,000,000
|
6,906,072
|
6,790,000
|
||||||||||||||
|
ROYAL HOLDINGS, INC.
|
Senior secured debt
|
Specialty chemicals
|
L+7.50%
(Floor 1.00%)
|
6/19/2023
|
1,000,000
|
992,994
|
955,000
|
||||||||||||||
|
TAXACT, INC.
|
Senior secured debt
|
Financial services
|
L+6.00%
(Floor 1.00%)
|
3/1/2022
|
4,500,000
|
4,405,601
|
4,432,500
|
||||||||||||||
|
TITANLINER, INC.
|
Senior subordinated debt
|
8.50%
|
|
6/30/2017
|
2,747,000
|
2,747,000
|
2,747,000
|
||||||||||||||
|
|
339,277 shares of Series A convertible preferred stock |
Energy services (upstream)
|
-
|
-
|
-
|
3,204,222
|
3,352,000
|
||||||||||||||
|
5,951,222
|
6,099,000
|
||||||||||||||||||||
The accompanying Notes are an integral part of these Consolidated Financial Statements.
CAPITAL SOUTHWEST CORPORATION AND SUBSIDIARIES
CONSOLIDATED SCHEDULE OF INVESTMENTS
March 31, 2016
|
TRAX DATA REFINERY, INC.
|
Common stock
|
Software & IT services
|
-
|
-
|
-
|
817,781
|
1,916,000
|
||||||||||||||
|
VIVID SEATS
|
Senior secured debt
|
Media, marketing & entertainment
|
L+6.00%
(Floor 1.00%)
|
3/1/2022
|
7,000,000
|
6,514,058
|
6,632,500
|
||||||||||||||
|
WATER PIK, INC.
|
Senior secured debt
|
Consumer products & retail
|
L+8.75%
(Floor 1.00%)
|
1/8/2021
|
4,780,702
|
4,667,815
|
4,720,943
|
||||||||||||||
|
WINZER CORPORATION
|
Senior subordinated debt
|
Distribution
|
11.00%
|
5/31/2021
|
8,100,000
|
7,954,440
|
7,954,440
|
||||||||||||||
|
Total Non-control/Non-affiliate Investments
|
$
|
101,538,409
|
$
|
99,278,921
|
|||||||||||||||||
|
Affiliate Investments
7
|
|||||||||||||||||||||
|
CHANDLER SIGNS, LP
|
Senior subordinated debt
|
Business services
|
12.00%
|
7/4/2021
|
4,500,000
|
$
|
4,412,800
|
$
|
4,412,800
|
||||||||||||
|
|
1,500,000 units of Class A-1 common stock
|
-
|
-
|
-
|
1,500,000
|
2,529,000
|
|||||||||||||||
|
5,912,800
|
6,941,800
|
||||||||||||||||||||
|
kSEP HOLDINGS, INC.
|
861,591 shares of common stock
|
Healthcare products
|
-
|
-
|
-
|
|
443,518
|
|
3,676,000
|
||||||||||||
|
Total Affiliate Investments
|
$
|
6,356,318
|
$
|
10,617,800
|
|||||||||||||||||
|
Control Investments
8
|
|||||||||||||||||||||
|
I-45 SLF, LLC
6, 9, 10
|
80% LLC equity interest
|
Multi-sector holdings
|
-
|
-
|
-
|
$
|
36,800,000
|
$
|
36,337,174
|
||||||||||||
|
MEDIA RECOVERY, INC.
10
|
800,000 shares of Series A convertible preferred stock
|
Industrial products
|
-
|
-
|
-
|
800,000
|
4,757,452
|
||||||||||||||
|
|
4,000,002 shares of common stock
|
-
|
-
|
-
|
4,615,000
|
27,444,548
|
|||||||||||||||
|
5,415,000
|
32,202,000
|
||||||||||||||||||||
|
Total Control Investments
|
$
|
42,215,000
|
$
|
68,539,174
|
|||||||||||||||||
|
TOTAL INVESTMENTS
11
|
$
|
150,109,727
|
$
|
178,435,895
|
The accompanying Notes are an integral part of these Consolidated Financial Statements.
59
CAPITAL SOUTHWEST CORPORATION AND SUBSIDIARIES
CONSOLIDATED SCHEDULE OF INVESTMENTS
March 31, 2016
| 1 | All debt investments are income-producing, unless otherwise noted. Equity investments are non-income producing, unless otherwise noted. |
| 2 | Some investments bear interest at a rate that may be determined by reference to London Interbank Offered Rate (“LIBOR” or “L”) or Prime (“Prime”) which reset daily, monthly, quarterly, or semiannually. For each investment, the Company has provided the spread over LIBOR or Prime and the current contractual interest rate in effect at March 31, 2016. Certain investments are subject to a LIBOR or Prime interest rate floor. |
| 3 | Investments are carried at fair value in accordance with the Investment Company Act of 1940 (the “1940 Act”) and Financial Accounting Standards Board (“FASB”) Accounting Standard Codification (“ASC”) 820, Fair Value Measurements and Disclosures . We determine in good faith the fair value of our Investment portfolio pursuant to a valuation policy in accordance with ASC 820 and a valuation process approved by our Board of Directors . See Note 5 to the consolidated financial statements. |
| 4 | Non-Control/Non-Affiliate investments are defined by the 1940 Act as investments that are neither Control investments nor Affiliate investments. At March 31, 2016, approximately 55.6% of the Company’s investment assets were non-control investments. |
| 5 | The investment has $1.7 million unfunded commitment. |
| 6 | Indicates assets that are considered “non-qualifying assets” under section 55(a) of the 1940 Act. Qualifying assets must represent at least 70% of total assets at the time of acquisition of any additional non-qualifying assets. |
| 7 | Affiliate investments are defined by the 1940 Act as investments in which between 5% and 25% of the voting securities are owned and the investments are not classified as control investments. At March 31, 2016, approximately 6.0% of the Company’s investment assets were affiliate investments. |
| 8 | Control investments are defined by the 1940 Act as investments in which more than 25% of the voting securities are owned or where greater than 50% of the board representation is maintained. At March 31, 2016, approximately 38.4% of the Company’s investment assets were control investments. |
| 9 | The investment has approximately $31.2 million unfunded commitment. |
| 10 | Income producing through dividends on distributions. |
| 11 | The cumulative gross unrealized appreciation for federal income tax purposes is approximately $28.4 million; cumulative gross unrealized depreciation for federal income tax purposes is $4.3 million. Cumulative net unrealized appreciation is $32.7 million, based on a tax cost of $150.1 million. |
The accompanying Notes are an integral part of these Consolidated Financial Statements.
CAPITAL SOUTHWEST CORPORATION AND SUBSIDIARIES
CONSOLIDATED SCHEDULE OF INVESTMENTS
11
March 31, 2015
|
Portfolio Company
1
|
Type of
Investment
|
Industry
|
Current
Interest Rate
2
|
Maturity
|
Principal
|
Cost
|
Fair
Value
3
|
|||||||||||||||||
|
Non-control/Non-affiliate Investments
4
|
||||||||||||||||||||||||
|
ATLANTIC CAPITAL BANCSHARES, INC.
5
|
300,000 shares of common stock
|
Financial services
|
-
|
-
|
-
|
$
|
3,000,000
|
$
|
3,779,000
|
|||||||||||||||
|
BALLAST POINT VENTURES II, L.P.
5
|
2.1% Limited partnership interest
|
Multi-sector holdings
|
-
|
-
|
-
|
2,634,790
|
3,288,000
|
|||||||||||||||||
|
BANKCAP PARTNERS FUND I, L.P.
5
|
5.5% Limited partnership interest
|
Multi-sector holdings
|
-
|
-
|
-
|
5,071,514
|
4,771,000
|
|||||||||||||||||
|
CAPITALSOUTH PARTNERS FUND III, L.P.
5
|
1.9% Limited partnership interest
|
Multi-sector holdings
|
-
|
-
|
-
|
433,403
|
232,000
|
|||||||||||||||||
|
DEEPWATER CORROSION SERVICES, INC.
|
127,004 shares of Series A Convertible Preferred Stock
|
Energy services (upstream)
|
-
|
-
|
-
|
8,000,000
|
2,532,000
|
|||||||||||||||||
|
DIAMOND STATE VENTURES, L.P.
5
|
1.4% Limited partnership interest
|
Multi-sector holdings
|
-
|
-
|
-
|
–
|
16,000
|
|||||||||||||||||
|
FIRST CAPITAL GROUP OF TEXAS III, L.P.
5
|
3.0% Limited partnership interest
|
Multi-sector holdings
|
-
|
-
|
-
|
778,895
|
108,000
|
|||||||||||||||||
|
iMEMORIES, INC.
6
|
17,391,304 shares of Series B convertible preferred stock
|
Software & IT services
|
-
|
-
|
-
|
4,000,000
|
–
|
|||||||||||||||||
|
4,684,967 shares of Series C convertible preferred stock
|
-
|
-
|
-
|
1,078,479
|
–
|
|||||||||||||||||||
|
Convertible
debt
6
|
10.00%
|
7/31/2016
|
1,188,000
|
1,188,000
|
–
|
|||||||||||||||||||
|
Senior secured debt
6
|
18.00%
|
|
7/31/2016
|
148,507
|
148,507
|
159,000
|
||||||||||||||||||
|
6,414,986
|
159,000
|
|||||||||||||||||||||||
|
INSTAWARES HOLDING COMPANY, LLC
|
3,846,154 shares of Class D convertible preferred stock
|
Software & IT services
|
-
|
-
|
-
|
5,000,000
|
5,000,000
|
|||||||||||||||||
|
RESEARCH NOW GROUP, INC.
|
Senior secured debt
|
Business services
|
L+8.75%
(Floor 1.00%)
|
3/18/2022
|
7,000,000
|
6,895,231
|
6,895,231
|
|||||||||||||||||
The accompanying Notes are an integral part of these Consolidated Financial Statements.
CAPITAL SOUTHWEST CORPORATION AND SUBSIDIARIES
CONSOLIDATED SCHEDULE OF INVESTMENTS
11
March 31, 2015
|
STARTECH SEED FUND II
5
|
3.2% Limited partnership interest
|
Multi-sector holdings
|
-
|
-
|
-
|
622,783
|
14,000
|
|||||||||||||||||
|
TITANLINER, INC.
|
339,277 shares of Series A convertible preferred stock
|
Energy services (upstream)
|
-
|
-
|
-
|
3,204,222
|
5,939,000
|
|||||||||||||||||
|
|
Senior subordinated debt
|
8.50%
|
|
6/30/2017
|
2,747,000
|
2,747,000
|
2,747,000
|
|||||||||||||||||
|
5,951,222
|
8,686,000
|
|||||||||||||||||||||||
|
TRAX DATA REFINERY, INC.
|
211,368 shares of common stock
|
Software & IT services
|
-
|
-
|
-
|
817,781
|
2,296,000
|
|||||||||||||||||
|
Total Non-Control/Non-Affiliate Investments
|
$
|
45,620,605
|
$
|
37,776,231
|
||||||||||||||||||||
|
Affiliate Investments
7
|
||||||||||||||||||||||||
|
BOXX TECHNOLOGIES, INC.
|
3,125,354 shares of Series B convertible preferred stock
|
Technology products & components
|
-
|
-
|
-
|
$
|
1,500,000
|
$
|
2,362,000
|
|||||||||||||||
|
kSEP HOLDINGS, INC.
|
861,591 shares of common stock
|
Healthcare products
|
-
|
-
|
-
|
443,518
|
1,863,000
|
|||||||||||||||||
|
WELLOGIX, INC.
|
4,788,371 shares of Series A-1 convertible participating preferred stock
|
Software & IT services
|
-
|
-
|
-
|
5,000,000
|
4,120,000
|
|||||||||||||||||
|
Total Affiliate Investments
|
$
|
6,943,518
|
$
|
8,345,000
|
||||||||||||||||||||
|
Control Investments
8
|
||||||||||||||||||||||||
|
BALCO, INC.
|
445,000 shares of common stock and 60,920 shares Class B non-voting common stock
|
Building & infrastructure products
|
-
|
-
|
-
|
$
|
624,920
|
$
|
5,100,000
|
|||||||||||||||
|
CAPSTAR HOLDINGS CORPORATION
|
500 shares of common stock and 1,000,000 shares of preferred stock
|
Real estate
|
-
|
-
|
-
|
4,703,619
|
10,871,000
|
The accompanying Notes are an integral part of these Consolidated Financial Statements.
CAPITAL SOUTHWEST CORPORATION AND SUBSIDIARIES
CONSOLIDATED SCHEDULE OF INVESTMENTS
11
March 31, 2015
|
HUMAC COMPANY
5
|
1,041,000 shares of common stock
|
Financial services
|
-
|
-
|
-
|
–
|
244,000
|
|||||||||||||||||
|
MEDIA RECOVERY, INC.
9
|
800,000 shares of Series A convertible preferred stock
|
Industrial products
|
-
|
-
|
-
|
800,000
|
4,300,000
|
|||||||||||||||||
|
|
4,000,002 shares of common stock
|
-
|
-
|
-
|
4,615,000
|
21,700,000
|
||||||||||||||||||
|
5,415,000
|
26,000,000
|
|||||||||||||||||||||||
|
THE RECTORSEAL CORPORATION
|
27,907 shares of common stock
|
Specialty chemicals
|
-
|
-
|
-
|
52,600
|
358,200,000
|
|||||||||||||||||
|
THE WHITMORE MANUFACTURING COMPANY
|
80 shares of common stock
|
Specialty chemicals
|
-
|
-
|
-
|
1,600,000
|
89,000,000
|
|||||||||||||||||
|
Total Control Investments
|
$
|
12,396,139
|
$
|
489,415,000
|
||||||||||||||||||||
|
TOTAL INVESTMENTS
10
|
$
|
64,960,262
|
$
|
535,536,231
|
| 1 | All debt investments are income-producing, unless otherwise noted. Equity investments are non-income producing, unless otherwise noted. |
| 2 | Some investments bear interest at a rate that may be determined by reference to London Interbank Offered Rate (“LIBOR” or “L”) or Prime (“Prime”) which reset daily, monthly, quarterly, or semiannually. For each investment, the Company has provided the spread over LIBOR or Prime and the current contractual interest rate in effect at March 31, 2015. Certain investments are subject to a LIBOR or Prime interest rate floor. |
| 3 | Investments are carried at fair value in accordance with the Investment Company Act of 1940 (the “1940 Act”) and Financial Accounting Standards Board (“FASB”) Accounting Standard Codification (“ASC”) 820, Fair Value Measurements and Disclosures . We determine in good faith the fair value of our Investment portfolio pursuant to a valuation policy in accordance with ASC 820 and a valuation process approved by our Board of Directors . See Note 5 to the consolidated financial statements. |
| 4 | Non-Control/Non-Affiliate investments are defined by the 1940 Act as investments that are neither Control investments nor Affiliate investments. At March 31, 2015, approximately 7.1% of the Company’s investment assets are non-control investments. |
| 5 | Indicates assets that the Company believes do not represent “qualifying assets” under section 55(a) of the 1940 Act. Qualifying assets must represent at least 70% of total assets at the time of acquisition of any additional non-qualifying assets. |
| 6 | Investment was on non-accrual status as of March 31, 2015, meaning the Company has ceased recognizing interest income on the investment. |
| 7 | Affiliate investments are defined by the 1940 Act as investments in which between 5% and 25% of the voting securities are owned and the investments are not classified as control investments. At March 31, 2015, approximately 1.5% of the Company’s investment assets are affiliate investments. |
| 8 | Control investments are defined by the 1940 Act as investments in which more than 25% of the voting securities are owned or maintains greater than 50% of the board representation. At March 31, 2015, approximately 91.4% of the Company’s investment assets are control investments. |
| 9 | Income producing through dividends on distributions. |
| 10 | The cumulative gross unrealized appreciation for federal income tax purposes is approximately $487.0 million; cumulative gross unrealized depreciation for federal income tax purposes is $13.5 million. Cumulative net unrealized appreciation is $473.5 million, based on a tax cost of $62.0 million. |
| 11 | Changes to the Consolidated Schedule of Investments at March 31, 2015 are presentation changes only to conform to current period presentation. |
The accompanying Notes are an integral part of these Consolidated Financial Statements.
Notes to Consolidated Financial Statements
| 1. | ORGANIZATION AND BASIS OF PRESENTATION |
Organization
Capital Southwest Corporation (“CSWC”) is an investment company that specializes in providing customized financing to middle market companies in a broad range of industry segments located primarily in the United States. Our common stock current trades on The Nasdaq Global Select Market under the ticker symbol “CSWC.”
CSWC was organized as a Texas corporation on April 19, 1961. Until September 1969, we operated as a small business investment company (“SBIC”) licensed under the Small Business Investment Act of 1958. At that time, CSWC transferred to our wholly-owned subsidiary, Capital Southwest Venture Corporation (“CSVC”), certain assets including our license as a “SBIC”. CSVC is a closed-end, non-diversified investment company registered under the Investment Company Act of 1940, as amended (the “1940 Act”). Prior to March 30, 1988, CSWC was registered as a closed-end, non-diversified investment company under the 1940 Act. On that date, we elected to be treated as a business development company (“BDC”) subject to the provisions of the 1940 Act, as amended by the Small Business Incentive Act of 1980. In order to remain a BDC, we must meet certain specified requirements under the 1940 Act, including investing at least 70% of our assets in eligible portfolio companies and limiting the amount of leverage we incur.
We are also a regulated investment company (“RIC”) under Subchapter M of the U.S. Internal Revenue Code of 1986 (the “Code”). As such, we are not required to pay corporate-level income tax on our investment income. We intend to maintain our RIC status, which requires that we qualify annually as a RIC by meeting certain specified requirements. Because CSWC wholly owns CSVC, the portfolios of CSWC and CSVC are referred to collectively as “our,” “we” and “us.”
Capital Southwest Management Corporation (“CSMC”), a wholly-owned subsidiary of CSWC, is the management company for CSWC and CSVC. CSMC generally incurs all normal operating and administrative expenses, including, but not limited to, salaries and related benefits, rent, equipment and other administrative costs required for day-to-day operations.
CSWC also has a newly formed direct wholly owned subsidiary that has been elected to be a taxable entity (the “Taxable Subsidiary”). The primary purpose of the Taxable Subsidiary is to permit CSWC to hold equity investments in portfolio companies which are “pass-through” entities for tax purposes. The Taxable Subsidiary is taxed at normal corporate tax rates based on its taxable income.
We focus on investing in companies with track records of generating revenues and positive cash flow, established market positions and proven management teams with strong operating discipline. We target senior and subordinated investments in the lower middle market and private loan transactions (club deals), as well as first and second lien syndicated loans in larger middle market companies. Our target lower middle market companies typically have annual earnings before interest, taxes, depreciation and amortization (“EBITDA”) between $3 million and $15 million. Our target club deal companies typically have annual EBITDA between $15 million and $50 million. Our target companies for syndicated first and second lien loan investments are in large middle market companies that typically have annual EBITDA that is greater than $50 million. We make available significant managerial assistance to the companies in which we invest when we believe that providing managerial assistance to an investee company is critical to its business development activities.
On December 2, 2014, Capital Southwest Corporation (“CSWC” or the “Company”) announced that its board of directors (the “Board of Directors”) had unanimously approved a plan to spin off certain of its controlled assets into a standalone publicly traded industrial growth company through a distribution to our shareholders of all of the shares of common stock of the new spin-off company that would hold, directly or indirectly, the controlled assets (the “Share Distribution”). On September 30, 2015, we completed the spin-off of CSW Industrials, Inc. (“CSWI”).
CSWI is now an independent publicly traded company. CSWI’s common stock trades on the Nasdaq Global Select Market under the ticker symbol “CSWI.” The Share Distribution was effected through a tax-free, pro-rata distribution of 100% of CSWI’s common stock to shareholders of the Company. Each Company shareholder received one share of CSWI common stock for every one share of Company common stock on the record date, September 18, 2015. Cash was paid in lieu of any fractional shares of CSWI common stock.
CSWI’s assets and businesses consist of the Company’s former industrial products, coatings, sealants & adhesives and specialty chemicals businesses and include all the equity interests of The RectorSeal Corporation, The Whitmore Manufacturing Company, Balco, Inc., and CapStar Holdings Corporation.
Effective October 1, 2015 with the completion of the Share Distribution, Bowen S. Diehl was appointed President and Chief Executive Officer of our Company, and Michael S. Sarner was appointed Chief Financial Officer, Chief Compliance Officer, Secretary and Treasurer.
Following the Share Distribution, we have maintained operations as an internally-managed BDC and pursue a credit-focused investing strategy akin to similarly structured organizations. We intend to continue to provide capital to middle-market companies. In the future, we intend to invest primarily in debt securities, including senior secured debt and subordinated debt, and may also invest in preferred stock and common stock alongside our debt investments or through warrants. We also invest in broadly syndicated first and second lien loans in large middle market companies.
We remain a RIC under Subchapter M of the U.S. Internal Revenue Code of 1986. See Note 6 below for a discussion of CSWC’s status as an RIC.
Basis of Presentation
The consolidated financial statements have been prepared in accordance with accounting principles generally accepted in the United States of America (“GAAP”). We meet the definition of an investment company and follow the accounting and reporting guidance in the Financial Accounting Standards Board (“FASB”) Accounting Standards Codification (“ASC”) Topic 946 –
Financial Services – Investment Companies
(“ASC Topic 946”)
.
Under rules and regulations applicable to investment companies, we are precluded from consolidating any entity other than another investment company. One of the exceptions to this general principle occurs if the investment company has an investment in an operating company that provides services to the investment company. Accordingly, the consolidated financial statements include CSMC, our management company, and the Taxable Subsidiary.
Portfolio Investment Classification
We classify our investments in accordance with the requirements of the 1940 Act. Under the 1940 Act, “Control investments” are defined as investments in which we own more than 25% of the voting securities or have rights to maintain greater than 50% of the board representation; “Affiliate investments” are defined as investments in which we own between 5% and 25% of the voting securities; and “Non-control/Non-affiliate investments” are defined as investments that are neither “Control Investments” nor “Affiliate Investments.”
Under the 1940 Act, a BDC must meet certain requirements, including investing at least 70% of our assets in qualifying assets. The principal categories of qualifying assets relevant to our business are any of the following:
(1) Securities purchased in transactions not involving any public offering from the issuer of those securities, which issuer (subject to certain limited exceptions) is an eligible portfolio company, or from any person who is, or has been during the preceding 13 months, an affiliated person of an eligible portfolio company, or from any other person, subject to any rules that may be prescribed by the SEC.
(2) Securities of any eligible portfolio company that we control.
(3) Securities purchased in a private transaction from a U.S. issuer that is not an investment company or from an affiliated person of the issuer, or in transactions incident thereto, if the issuer is in bankruptcy and subject to reorganization or if the issuer, immediately prior to the purchase of its securities was unable to meet its obligations as they came due without material assistance other than conventional lending or financing arrangements.
(4) Securities of an eligible portfolio company purchased from any person in a private transaction if there is no ready market for the securities and we already own 60% of the outstanding equity of the eligible portfolio company.
(5) Securities received in exchange for or distributed on or with respect to securities described in (1) through (4) above, or pursuant to the exercise of warrants or rights relating to those securities.
(6) Cash, cash equivalents, U.S. government securities or high-quality debt securities maturing in one year or less from the time of investment.
|
2.
|
CORRECTION OF IMMATERIAL ERROR
|
In the fourth quarter of 2016, the Company discovered and corrected immaterial errors relating to the classification of taxes incurred on deemed capital gain distribution reported on the Consolidated Statements of Cash Flows for the years ended March 31, 2015 and 2014. Previously, taxes incurred on deemed capital gain distributions were classified as cash outflows from operating activities, but should have been classified as cash outflows from financing activities. These reclassifications had no effect on total net assets, net asset value per share, the Consolidated Statements of Operations or the Statements of Changes in Net Assets. The change had no effect on (1) overall net increase in cash and cash equivalents, (2) cash and cash equivalents at the beginning of the period, or (3) cash and cash equivalents at the end of the period in the Consolidated Statements of Cash Flows. Accordingly, the Company has corrected its Consolidated Statements of Cash Flows for the years ended March 31, 2015 and 2014. The effect of recording the adjustments to the accompanying Consolidated Statements of Cash Flows is as follows (amounts in thousands):
|
As Previously
Reported
March 31, 2015
|
Adjustment
|
As Adjusted
March 31,
2015
|
As Previously
Reported
March 31, 2014
|
Adjustment
|
As Adjusted
March 31,
2014
|
|||||||||||||||||||
|
Net cash (used in) provided by operating activities
|
$
|
139,914
|
$
|
54,370
|
$
|
194,284
|
$
|
4,626
|
$
|
3,787
|
$
|
8,413
|
||||||||||||
|
Net cash (used in) provided by financing activities
|
$
|
(2,280
|
)
|
$
|
(54,370
|
)
|
$
|
(56,650
|
)
|
$
|
1,770
|
$
|
(3,787
|
)
|
$
|
(2,017
|
)
|
|||||||
| 3. | SUMMARY OF SIGNIFICANT ACCOUNTING POLICIES |
The following is a summary of significant accounting policies followed in the preparation of the consolidated financial statements of CSWC.
Fair Value Measurements
We apply fair value to substantially all of our financial instruments in accordance with ASC Topic 820 –
Fair Value Measurements and Disclosures
(“ASC Topic 820”). ASC Topic 820 defines fair value, establishes a framework used to measure fair value, and requires disclosures for fair value measurements, including the categorization of financial instruments into a three-level hierarchy based on the transparency of valuation inputs. See Note 5 to the consolidated financial statements for further discussion regarding the fair value measurements and hierarchy.
ASC Topic 820 requires disclosure of the fair value of financial instruments for which it is practical to estimate such value. We believe that the carrying amounts of its financial instruments such as cash, receivables and payables approximate the fair value of these items due to the short maturity of these instruments.
Investments
Investments are stated at fair value and are reviewed and approved by our Board of Directors as described in Notes 4 and 5 below. Investments are recorded on a trade date basis.
Net Realized Gains or Losses and Net Change in Unrealized Appreciation or Depreciation
Realized gains or losses are measured by the difference between the net proceeds from the sale or redemption of an investment or a financial instrument and the cost basis of the investment or financial investment, without regard to unrealized appreciation or depreciation previously recognized, and includes investments written-off during the period net of recoveries and realized gains or losses from in-kind redemptions. Net change in unrealized appreciation or depreciation reflects the net change in the fair value of the investment portfolio and financial instruments and the reclassification of any prior period unrealized appreciation or depreciation on exited investments and financial instruments to realized gains or losses.
Cash and Cash Equivalents
Cash and cash equivalents consist of deposits at financial institutions. We deposit our cash balances in financial institutions and, at times, such balances may be in excess of the Federal Deposit Insurance Corporation (“FDIC”) insurance limits. Cash and cash equivalents are carried at cost, which approximates fair value. At March 31, 2016, cash balances totaling $93.7 million exceeded FDIC insurance limits, subjecting us to risk related to the uninsured balance. All of our cash deposits are held at large established high credit quality financial institutions and management believes that the risk of loss associated with any uninsured balances is remote.
Segment Information
We operate and manage our business in a singular segment. As an investment company, we invest in portfolio companies in various industries and geographic areas as discussed in Note 4.
Consolidation
As permitted under Regulation S-X and ASC Topic 946, we generally do not consolidate our investment in a portfolio company other than an investment company subsidiary or a controlled operating company whose business consists of providing services to CSWC. Accordingly, we consolidated the results of CSWC’s wholly-owned subsidiaries, CSVC, the Taxable Subsidiary and CSWC’s wholly-owned management company, CSMC. All intercompany balances have been eliminated upon consolidation.
Use of Estimates
The preparation of financial statements in conformity with GAAP requires management to make estimates and assumptions that affect amounts reported in the financial statements and accompanying notes. Actual results could differ from those estimates.
We have identified investment valuation and revenue recognition as our most critical accounting estimates.
Interest and Dividend Income
Interest and dividend income is recorded on an accrual basis to the extent amounts are expected to be collected. Dividend income is recognized on the date dividends are declared. Discounts/premiums received to par on loans purchased are capitalized and accreted or amortized into income over the life of the loan. Any remaining discount/premium is accreted or amortized into income upon prepayment of the loan. In accordance with our valuation policy, accrued interest and dividend income is evaluated periodically for collectability. When we do not expect the debtor to be able to service all of its debt or other obligations, we will generally establish a reserve against interest income receivable, thereby placing the loan or debt security on non-accrual status, and cease to recognize interest income on that loan or debt security until the borrower has demonstrated the ability and intent to pay contractual amounts due. If a loan or debt security’s status significantly improves regarding its ability to service debt or other obligations, it will be restored to accrual basis. As of March 31, 2016, we do not have any investments on non-accrual status. As of March 31, 2015, we had one investment on non-accrual status.
To maintain RIC tax treatment, non-cash sources of income such as accretion of interest income may need to be paid out to shareholders in the form of distributions, even though CSWC may not have collected the interest income. For the year ended March 31, 2016, approximately 1.0% of CSWC’s total investment income was attributable to non-cash interest income for the accretion of discounts associated with debt investments, net of any premium reduction. For the year ended March 31, 2015, CSWC has no investment income attributable to interest income for the accretion of discounts associated with debt investments.
Federal Income Taxes
CSWC and CSVC have elected and intend to comply with the requirements of the Code necessary to qualify as RICs. By meeting these requirements, they will not be subject to corporate federal income taxes on ordinary income distributed to shareholders. In order to qualify as a RIC, each company is required to timely distribute to its shareholders at least 90% of investment company taxable income, as defined by the IRC, each year. Investment company taxable income generally differs from net income for financial reporting purposes due to temporary and permanent differences in the recognition of income and expenses. Investment company taxable income generally excludes net unrealized appreciation or depreciation, as investment gains and losses are not included in investment company taxable income until they are realized.
In addition to the requirement that we must annually distribute at least 90% of our investment company taxable income, we may either distribute or retain our realized net capital gains from investments, but any net capital gains not distributed may be subject to corporate level tax. During the twelve months ended March 31, 2016, we distributed capital gains in the amount of $1,543,833 and retained capital gains of $8,422,697. During the twelve months ended March 31, 2015, we did not distribute any capital gains to our shareholders. When we retain the capital gains, they are classified as a “deemed distribution” to our shareholders and are subject to our corporate tax rate of 35%. As an investment company that qualifies as a RIC under the IRC, federal income taxes payable on security gains that we elect to retain are accrued only on the last day of our tax year, December 31. Any capital gains actually distributed to shareholders are generally taxable to the shareholders as long-term capital gains. For the tax year ended December 31, 2015, we elected to retain capital gains of $8,422,697, on which we incurred federal taxes on behalf of our shareholders in the amount of $2,947,944. For the tax year ended December 31, 2014, we elected to retain capital gains of $155,342,875, on which we incurred federal taxes on behalf of our shareholders in the amount of $54,370,006. See Note 6 for further discussion.
CSMC, a wholly owned subsidiary of CSWC, and the Taxable Subsidiary are not RICs and are required to pay taxes at the current corporate rate of 34%. For tax purposes, CSMC has elected to be treated as a taxable entity, and therefore is not consolidated for tax purposes and is taxed at normal corporate tax rates based on its taxable income and, as a result of its activities, may generate income tax expense or benefit. The taxable income, or loss, of CSMC may differ from its book income, or loss, due to temporary book and tax timing differences and permanent differences. This income tax expense, or benefit, if any, and the related tax assets and liabilities, are reflected in our consolidated financial statements.
Management evaluates tax positions taken or expected to be taken in the course of preparing the Company’s financial statements to determine whether the tax positions are “more-likely-than-not” of being sustained by the applicable tax authority. Tax positions with respect to tax at the Company level not deemed to meet the “more-likely-than-not” threshold would be recorded as an expense in the current year. Management’s conclusions regarding tax positions will be subject to review and may be adjusted at a later date based on factors including, but not limited to, on-going analyses of tax laws, regulations and interpretations thereof. The Company has concluded that it does not have any uncertain tax positions that meet the recognition of measurement criteria of ASC 740 for the current period. Also, we account for interest and, if applicable, penalties for any uncertain tax positions as a component of income tax expense. No interest or penalty expense was recorded during the years ended March 31, 2016, 2015 and 2014.
Deferred Taxes
Deferred tax assets and liabilities are recorded for losses or income at our taxable subsidiaries using statutory tax rates. A valuation allowance is provided against deferred tax assets when it is more likely than not that some portion or all of the deferred tax asset will not be realized. See Note 6 for further discussion.
Stock-Based Compensation
We account for our stock-based compensation using the fair value method, as prescribed by FASB ASC Topic 718,
Compensation – Stock Compensation
. Accordingly, we recognize stock-based compensation cost on a straight-line basis for all share-based payments awards granted to employees. The fair value of stock options are determined on the date of grant using the Black-Scholes pricing model and are expensed over the vesting period of the related stock options. For restricted stock awards, we measured the grant date fair value based upon the market price of our common stock on the date of the grant. We utilized Monte Carlo simulation to develop grant date fair value for any restricted awards that are affected by market condition. For both restricted stock awards and market condition affected restricted awards, we will amortize this fair value to shared-based compensation expense over the vesting term. For individual incentive awards, the option value of individual cash incentive awards is calculated based on the changes in net asset value of our company. In connection with the spin-off of CSWI, we entered into an Employee Matters Agreement with CSWI. Under this agreement, the value of individual incentive cash awards shall be determined based upon the net asset value of CSWC as of June 30, 2015. See Note 9 for further discussion.
Earnings per Share
Earnings per share calculations are computed utilizing the weighted-average number of shares of common stock and fully diluted shares outstanding for the period. In accordance with FASB ASC Topic 260,
Earnings per Share
, the unvested shares of restricted stock awarded pursuant to CSWC’s equity compensation plans are participating securities and are included in the basic and diluted earnings per share calculation. At the years ended March 31, 2016, 2015 and 2014, weighted-average basic shares were adjusted for the diluted effect of stock-based awards of 88,020, 39,104 and 20,762, respectively.
Shareholder Distributions
Distributions to common shareholders are recorded on the ex-dividend date. The amount of distributions, if any, is determined by the Board of Directors each quarter.
Presentation
Presentation of certain amounts on the Consolidated Statements of Operations for the prior year comparative financial statements is updated to conform to the current period presentation. This mainly includes disclosure of amounts at a more disaggregated level.
Recently Issued or Adopted Accounting Standards
In February 2015, the FASB issued Accounting Standards Update 2015-02,
Consolidation (ASC Topic 810): Amendments to the Consolidation Analysis
(“ASU 2015-02”)
.
ASU 2015-02 significantly changes the consolidation analysis required under GAAP and ends the deferral of the amendments to the VIE guidance in ASU 2009-17 (FAS 166) for investments in certain investment companies. Now all legal entities that are VIEs are evaluated for consolidation under the same criteria. Under this update, limited partnerships (or similar entities) that provide the limited partners with substantive kick-out or participating rights will be considered voting interest entities. For these entities, the investor that holds the majority of the substantive kick-out or participating rights will consolidate the VIE. This has the effect of reducing the likelihood that a general partner will consolidate a limited partnership or similar entity. ASU 2015-02 is effective for interim and annual reporting periods in fiscal years that begin after December 15, 2015 and early adoption is permitted. In accordance with this new guidance, we did not consolidate I-45 SLF, LLC based on the voting model as we only control 50% of the voting rights of this entity and, accordingly, share power over the entity equally in all respects with our joint venture partner. We adopted this guidance during the quarter ended December 31, 2015.
In May 2015, the FASB issued ASU 2015-07,
Fair Value Measurements – Disclosures for Certain Entities that Calculate Net Asset Value per Share.
This amendment updates guidance intended to eliminate the diversity in practice surrounding how investments measured at net asset value under the practical expedient with future redemption dates have been categorized in the fair value hierarchy. Under the updated guidance, investments for which fair value is measured at net asset value per share using the practical expedient should no longer be categorized in the fair value hierarchy, while investments for which fair value is measured at net asset value per share but the practical expedient is not applied should continue to be categorized in the fair value hierarchy. The updated guidance requires retrospective adoption for all periods presented and is effective for interim and annual reporting periods beginning after December 15, 2015, with early adoption permitted. We elected to adopt this guidance during the quarter ended December 31, 2015. As a result, investments measured at net asset value per share using the practical expedient are no longer categorized in the fair value hierarchy. In addition, our fair value hierarchy table as of March 31, 2015 has been adjusted to reflect the adoption of ASU 2015-07 on a retrospective basis.
| 4. | INVESTMENTS |
The following tables show the composition of the investment portfolio, at cost and fair value (with corresponding percentage of total portfolio investments), as of March 31, 2016 and 2015:
|
Cost
|
Percentage of
Total Portfolio
|
Fair Value
|
Percentage of
Total Portfolio
|
|||||||||||||
|
(dollars in millions)
|
||||||||||||||||
|
March 31, 2016:
|
||||||||||||||||
|
1st lien notes
|
$
|
39.3
|
26.2
|
%
|
$
|
39.5
|
22.1
|
%
|
||||||||
|
2nd lien notes
|
39.0
|
26.0
|
38.2
|
21.4
|
||||||||||||
|
Subordinated debt
|
15.1
|
10.1
|
15.1
|
8.5
|
||||||||||||
|
Preferred equity, common equity & warrants
|
19.9
|
13.2
|
49.3
|
27.6
|
||||||||||||
|
I-45 SLF, LLC
|
36.8
|
24.5
|
36.3
|
20.4
|
||||||||||||
|
$
|
150.1
|
100.0
|
%
|
$
|
178.4
|
100.0
|
%
|
|||||||||
|
March 31, 2015:
|
||||||||||||||||
|
2nd lien notes
|
$
|
6.9
|
10.6
|
%
|
$
|
6.9
|
1.3
|
%
|
||||||||
|
Subordinated debt
|
4.1
|
6.3
|
2.9
|
0.5
|
||||||||||||
|
Preferred & common equity
|
44.4
|
68.4
|
517.3
|
96.6
|
||||||||||||
|
Partnership interests
|
9.5
|
14.7
|
8.4
|
1.6
|
||||||||||||
|
$
|
64.9
|
100.0
|
%
|
$
|
535.5
|
100.0
|
%
|
|||||||||
The following tables show the composition of the investment portfolio by industry, at cost and fair value (with corresponding percentage of total portfolio investments), as of March 31, 2016 and 2015:
|
Cost
|
Percentage of
Total Portfolio
|
Fair Value
|
Percentage of
Total Portfolio
|
|||||||||||||
|
March 31, 2016:
|
||||||||||||||||
|
I-45 SLF, LLC
1
|
$
|
36.8
|
24.5
|
%
|
$
|
36.3
|
20.4
|
%
|
||||||||
|
Consumer Products and Retail
|
16.2
|
10.8
|
16.3
|
9.1
|
||||||||||||
|
Media, Marketing, & Entertainment
|
15.4
|
10.3
|
15.3
|
8.6
|
||||||||||||
|
Energy Services (Upstream)
|
14.0
|
9.3
|
11.1
|
6.2
|
||||||||||||
|
Business Services
|
12.8
|
8.5
|
13.7
|
7.7
|
||||||||||||
|
Industrial Products
|
12.3
|
8.2
|
38.5
|
21.5
|
||||||||||||
|
Financial Services
|
10.2
|
6.8
|
10.3
|
5.8
|
||||||||||||
|
Distribution
|
8.0
|
5.3
|
8.0
|
4.5
|
||||||||||||
|
Healthcare Services
|
7.8
|
5.2
|
7.8
|
4.4
|
||||||||||||
|
Software & IT Services
|
5.4
|
3.6
|
6.5
|
3.7
|
||||||||||||
|
Healthcare Products
|
5.3
|
3.5
|
8.6
|
4.8
|
||||||||||||
|
Consumer Services
|
4.9
|
3.3
|
5.0
|
2.8
|
||||||||||||
|
Specialty Chemicals
|
1.0
|
0.7
|
1.0
|
0.5
|
||||||||||||
|
$
|
150.1
|
100.0
|
%
|
$
|
178.4
|
100.0
|
%
|
|||||||||
|
March 31, 2015:
|
||||||||||||||||
|
Software & IT Services
|
$
|
17.2
|
26.5
|
%
|
$
|
11.5
|
2.1
|
%
|
||||||||
|
Energy Services (Upstream)
|
14.0
|
21.6
|
11.2
|
2.1
|
||||||||||||
|
Multi-sector Holdings
|
9.5
|
14.6
|
8.6
|
1.6
|
||||||||||||
|
Business Services
|
6.9
|
10.7
|
6.9
|
1.3
|
||||||||||||
|
Industrial Products
|
5.4
|
8.3
|
26.0
|
4.9
|
||||||||||||
|
Real Estate
|
4.7
|
7.3
|
10.9
|
2.0
|
||||||||||||
|
Financial Services
|
3.0
|
4.6
|
3.8
|
0.7
|
||||||||||||
|
Specialty Chemicals
|
1.7
|
2.6
|
447.2
|
83.5
|
||||||||||||
|
Technology Products & Components
|
1.5
|
2.3
|
2.4
|
0.4
|
||||||||||||
|
Building & Infrastructure Products
|
0.6
|
0.9
|
5.1
|
1.0
|
||||||||||||
|
Healthcare Products
|
0.4
|
0.6
|
1.9
|
0.4
|
||||||||||||
|
$
|
64.9
|
100.0
|
%
|
$
|
535.5
|
100.0
|
%
|
|||||||||
1
I-45 SLF, LLC is a joint venture between CSWC and Main Street Capital. This entity primarily invests in syndicated senior secured loans in the upper middle market. The portfolio companies in I-45 include multi-sector holdings, which are similar to those in which CSWC invests directly. See Note 16 for further discussion.
The following tables summarize the composition of the investment portfolio by geographic region of the United States, at cost and fair value (with corresponding percentage of total portfolio investments), as of March 31, 2016 and 2015:
|
Cost
|
Percentage of
Total Portfolio
|
Fair Value
|
Percentage of
Total Portfolio
|
|||||||||||||
|
(dollars in millions)
|
||||||||||||||||
|
March 31, 2016:
|
||||||||||||||||
|
Southwest
|
$
|
55.8
|
37.2
|
%
|
$
|
80.8
|
45.3
|
%
|
||||||||
|
I-45 SLF, LLC
1
|
36.8
|
24.5
|
36.3
|
20.4
|
||||||||||||
|
West
|
24.0
|
16.0
|
24.4
|
13.7
|
||||||||||||
|
Midwest
|
20.4
|
13.6
|
20.6
|
11.4
|
||||||||||||
|
South
|
8.3
|
5.5
|
11.5
|
6.5
|
||||||||||||
|
Northeast
|
4.8
|
3.2
|
4.8
|
2.7
|
||||||||||||
|
$
|
150.1
|
100.0
|
%
|
$
|
178.4
|
100.0
|
%
|
|||||||||
|
March 31, 2015:
|
||||||||||||||||
|
Southwest
|
$
|
45.7
|
70.3
|
%
|
$
|
503.9
|
94.1
|
%
|
||||||||
|
South
|
8.4
|
13.0
|
10.6
|
2.0
|
||||||||||||
|
Northeast
|
5.5
|
8.5
|
5.0
|
0.9
|
||||||||||||
|
West
|
4.7
|
7.2
|
10.9
|
2.0
|
||||||||||||
|
Midwest
|
0.6
|
1.0
|
5.1
|
1.0
|
||||||||||||
|
$
|
64.9
|
100.0
|
%
|
$
|
535.5
|
100.0
|
%
|
|||||||||
1
I-45 SLF, LLC is a joint venture between CSWC and Main Street Capital. This entity primarily invests in syndicated senior secured loans in the upper middle market. The portfolio companies in I-45 are located within the geographic regions listed above. See Note 16 for further discussion.
| 5. | FAIR VALUE MEASUREMENTS |
Investment Valuation Process
The valuation process is led by the finance department in conjunction with the investment team. The process includes a monthly review of each investment by the executive officers of CSWC. Valuations of each portfolio security are prepared quarterly by the finance department using updated financial and other operational information collected by the investment teams. Each investment valuation is then subject to review by the executive officers and investment teams. In conjunction with the internal valuation process, we have also engaged an independent consulting firm specializing in financial due diligence, valuation, ABL services, and business advisory services to provide a third-party valuation review of certain investments. The third-party valuation firm provides a range of values for selected investments which is presented to CSWC’s executive officers and Board of Directors.
CSWC also uses a standard internal investment rating system in connection with its investment oversight, portfolio management, and investment valuation procedures for its debt portfolio. This system takes into account both quantitative and qualitative factors of the portfolio company and the investments held therein.
There is no single standard for determining fair value in good faith, as fair value depends upon the specific circumstances of each individual investment. While management believes our valuation methodologies and assumptions are appropriate and consistent with those of market participants, the recorded fair values of our investments may differ significantly from fair values that would have been used had an active market for the securities existed. In addition, changes in the market environment and other events that may occur over the life of the investments may cause the gains or losses ultimately realized on these investments to be different than the valuations currently assigned. The Board of Directors has the ultimate responsibility for reviewing and approving, in good faith, the fair value of CSWC’s investments in accordance with the 1940 Act.
Fair Value Hierarchy
CSWC has established and documented processes for determining the fair values of portfolio company investments on a recurring basis in accordance with the 1940 Act and ASC Topic 820.
As
required by ASC Topic 820, when the inputs used to measure fair value fall within different levels of the hierarchy, the level within which the fair value measurement is categorized is based on the lowest level input that is significant to the fair value measurement in its entirety. For example, a Level 3 fair value measurement may include inputs that are observable (Levels 1 and 2) and unobservable (Level 3). Therefore, unrealized appreciation and depreciation related to such investments categorized within the Level 3 tables below may include changes in fair value that are attributable to both observable inputs (Levels 1 and 2) and unobservable inputs (Level 3). CSWC conducts reviews of fair value hierarchy classifications on a quarterly basis. We also use judgment and consider factors specific to the investment in determining the significance of an input to a fair value measurement.
The three levels of valuation inputs established by ASC Topic 820 are as follows:
| · | Level 1: Investments whose values are based on unadjusted quoted prices in active markets for identical assets or liabilities. |
| · | Level 2: Investments whose values are based on quoted prices for similar assets and liabilities in active markets, and inputs that are observable for the asset or liability, either directly or indirectly, for substantially the full term of the financial instrument. |
| · | Level 3: Investments whose values are based on unobservable inputs that are significant to the overall fair value measurement. |
As of March 31, 2016 and 2015, 100% of the CSWC investment portfolio consisted of debt and equity instruments of privately held companies for which quoted prices or other inputs falling within the categories of Level 1 and Level 2 are generally not available. Therefore, CSWC determines the fair value its investments (excluding investments for which fair value is measured at net asset value) in good faith using Level 3 inputs, pursuant to a valuation policy and process that is established by the management of CSWC with the assistance of third-party valuation advisors and subsequently approved by our Board of Directors.
Investment Valuation Inputs
ASC Topic 820 defines fair value in terms of the price that would be received upon the sale of an asset or paid to transfer a liability in an orderly transaction between market participants at the measurement date and excludes transaction costs. Under ASC Topic 820, the fair value measurement also assumes that the transaction to sell an asset occurs in the principal market for the asset or, in the absence of a principal market, the most advantageous market for the asset. The principal market is the market in which the reporting entity would sell or transfer the asset with the greatest volume and level of activity for the asset. In determining the principal market for an asset or liability under ASC Topic 820, it is assumed that the reporting entity has access to the market as of the measurement date.
The Level 3 inputs to CSWC’s valuation process reflect our best estimate of the assumptions that would be used by market participants in pricing the investment in a transaction in the principal or most advantageous market for the asset.
The fair value determination of each portfolio investment categorized as Level 3 required one or more of the following unobservable inputs:
| • | Financial information obtained from each portfolio company, including unaudited statements of operations and balance sheets for the most recent period available as compared to budgeted numbers; |
| • | Current and projected financial condition of the portfolio company; |
| • | Current and projected ability of the portfolio company to service its debt obligations; |
| • | Type and amount of collateral, if any, underlying the investment; |
| • | Current financial ratios (e.g., fixed charge coverage ratio, interest coverage ratio and net debt/EBITDA ratio) applicable to the investment; |
| • | Current liquidity of the investment and related financial ratios (e.g., current ratio and quick ratio); |
| • | Indicative dealer quotations from brokers, banks, and other market participants; |
| • | Market yields on other securities of similar risk; |
| • | Pending debt or capital restructuring of the portfolio company; |
| • | Projected operating results of the portfolio company; |
| • | Current information regarding any offers to purchase the investment; |
| • | Current ability of the portfolio company to raise any additional financing as needed; |
| • | Changes in the economic environment which may have a material impact on the operating results of the portfolio company; |
| • | Internal occurrences that may have an impact (both positive and negative) on the operating performance of the portfolio company; |
| • | Qualitative assessment of key management; |
| • | Contractual rights, obligations or restrictions associated with the investment; and |
| • | Other factors deemed relevant. |
CSWC uses several different valuation approaches depending on the security type including the Market Approach, the Income Approach, the Enterprise Value Waterfall Approach, and the NAV Valuation Method.
Market Approach
Market Approach is a qualitative and quantitative analysis of the aforementioned unobservable inputs. It is a combination of the Enterprise Value Approach and Income Approach as described in detail below. For debt investments recently originated or where the value has not departed significantly from its cost, we generally rely on our cost basis or recent transaction price to determine the fair value, unless a material event has occurred since origination.
Income Approach
In valuing debt securities, we use an Income Approach model, which considers some or all of the factors listed above to develop an expectation of the yield that a hypothetical market participant would require when purchasing each debt investment (the “Required Market Yield”). The Required Market Yield is calculated in a multi-step process. First, using quarterly market data from our third-party valuation provider we estimate the current market yield of similar debt securities. Next, based on the factors described above we modify the current market yield for each security to come up with a unique Required Market Yield for each of our investments. The resulting Required Market Yield is a significant Level 3 input to the Income Approach model. For investments where the factors listed above have not fluctuated significantly from the date the investment was made or have not fluctuated significantly from CSWC’s expectations as of the date the investment was made, and where there have been no significant fluctuations in the market pricing for such investments, we may conclude that the Required Market Yield is equal to the stated rate on the investment and therefore, the debt security is appropriately priced. In instances where CSWC determines that the Required Market Yield is different from the stated rate on the investment, we discount the contractual cash flows on the debt instrument using the Required Market Yield in order to estimate the fair value of the debt security.
Under the income approach, CSWC also determines the appropriateness of the use of third-party broker quotes, if any, as a significant Level 3 input in determining fair value. CSWC may validate the estimated Required Market Yield based on its understanding of the level of actual transactions used by the broker to develop the quote, whether the quote was an indicative price or binding offer, the depth and consistency of broker quotes, and the correlation of changes in broker quotes with underlying performance of the portfolio company and other market indices.
Fair value measurements using the Income Approach model can be sensitive to significant changes in one or more of the inputs. A significant increase (decrease) in the Required Market Yield for a particular debt security may result in a lower (higher) fair value for that security.
Enterprise Value Waterfall Approach
In valuing equity securities (including warrants), CSWC estimates fair value using an Enterprise Value Waterfall valuation model. CSWC estimates the enterprise value of a portfolio company and then allocates the enterprise value to the portfolio company’s securities in order of their relative liquidation preference. In addition, CSWC assumes that any outstanding debt or other securities that are senior to CSWC’s equity securities are required to be repaid at par. Additionally, we estimate the fair value of a limited number of our debt securities using the Enterprise Value Waterfall approach, primarily when we own both debt and equity investments in the same portfolio company.
To estimate the enterprise value of the portfolio company, CSWC uses a weighted valuation model based on public comparable companies, observable transactions and discounted cash flow analyses. A main input into the valuation model is a measure of the portfolio company’s financial performance, which generally is either earnings before interest, taxes, depreciation and amortization, as adjusted (“Adjusted EBITDA”) or revenues. In addition, we consider other factors, including but not limited to (1) offers from third parties to purchase the portfolio company, and (2) the implied value of recent investments in the equity securities of the portfolio company. For certain non-performing assets, we may utilize the liquidation or collateral value of the portfolio company's assets in its estimation of enterprise value.
The significant Level 3 inputs to the Enterprise Value Waterfall model are (1) an appropriate multiple derived from the comparable public companies and transactions, (2) discount rate assumptions used in the discounted cash flow model and (3) a measure of the portfolio company’s financial performance, which generally is either Adjusted EBITDA or revenues. Inputs can be based on historical operating results, projections of future operating results or a combination thereof. The operating results of a portfolio company may be unaudited, projected or pro forma financial information and may require adjustments for certain non-recurring items. CSWC also may consult with the portfolio company’s senior management to obtain updates on the portfolio company’s performance, including information such as industry trends, new product development, loss of customers and other operational issues. Fair value measurements using the Enterprise Value Waterfall model can be sensitive to significant changes in one or more of the inputs. A significant increase (decrease) in either the multiple, Adjusted EBITDA or revenues for a particular equity security would result in a higher (lower) fair value for that security.
NAV Valuation Method
Under the NAV valuation method, for an investment in an investment fund that does not have a readily determinable fair value, CSWC measures the fair value of the investment predominately based on the NAV of the investment fund as of the measurement date. However, in determining the fair value of the investment, we may consider whether adjustments to the NAV are necessary in certain circumstances, based on the analysis of any restrictions on redemption of our investment as of the measurement date, recent actual sales or redemptions of interests in the investment fund, expected future cash flows available to equity holders, or other uncertainties surrounding CSWC’s ability to realize the full NAV of its interests in the investment fund.
The table below presents the Valuation Techniques and Significant Level 3 Inputs (ranges and weighted averages) used in the valuation of CSWC’s debt and equity securities at March 31, 2016 and March 31, 2015. The table is not intended to be all inclusive, but instead captures the significant unobservable inputs relevant to our determination of fair value.
|
Type
|
Valuation
Technique
|
Fair Value at
3/31/2016 (in
millions)
|
Significant
Unobservable
Inputs
|
Range
|
Weighted
Average
|
|||||||||
|
Equity Investments
|
Enterprise Value Waterfall Approach
|
$
|
49.3
|
EBITDA Multiple
|
3.50x - 7.60x
|
6.78x
|
||||||||
|
Revenue Multiple
|
3.70x
|
|
3.70x
|
|||||||||||
|
Discount Rate
|
12.92% - 18.62%
|
14.0%
|
|
|||||||||||
|
Debt Investments
|
Income Approach
|
68.6
|
Discount Rate
|
6.00% - 11.50%
|
|
N/A
|
|
|||||||
|
Third Party Broker Quote
|
N/A
|
|
N/A
|
|
||||||||||
|
Market Approach
|
24.2
|
Cost
|
N/A
|
|
N/A
|
|
||||||||
|
92.8
|
||||||||||||||
|
Total Level 3 Investments
|
$
|
142.1
|
||||||||||||
|
Type
|
Valuation
Technique
|
Fair Value at
3/31/2015 (in
millions)
|
Significant
Unobservable
Inputs
|
Range
|
Weighted Average
|
|||||||||
|
Equity Investments
|
Market Approach
|
$
|
494.1
|
EBITDA Multiple
|
3.00x - 7.75x
|
7.15x
|
|
|||||||
|
Market Approach
|
4.2
|
Recent Transaction Price
|
N/A
|
|
N/A
|
|
||||||||
|
Market Approach
|
15.0
|
Cash and Asset Value
|
N/A
|
|
N/A
|
|
||||||||
|
Market Approach
|
3.8
|
Multiple of Tangible Book Value
|
1.43x
|
|
1.43x
|
|
||||||||
|
Market Approach
|
0.2
|
Market Value of Held for Securities
|
N/A
|
|
N/A
|
|
||||||||
|
517.3
|
||||||||||||||
|
Debt Investments
|
Face Value
|
6.9
|
Recent Transaction Price
|
N/A
|
|
N/A
|
|
|||||||
|
Market Approach
|
2.7
|
Expected Cash Flow
|
N/A
|
|
N/A
|
|
||||||||
|
Liquidation Value
|
0.2
|
|||||||||||||
|
9.8
|
||||||||||||||
|
Total Level 3 Investments
|
$
|
527.1
|
||||||||||||
The following fair value hierarchy tables set forth our investment portfolio by level as of March 31, 2016 and March 31, 2015 (in millions):
|
Fair Value Measurements
at March 31, 2016 Using
|
||||||||||||||||
|
Asset Category
|
Total
|
Quoted Prices in
Active Markets
for Identical
Assets
(Level 1)
|
Significant
Other
Observable
Inputs
(Level 2)
|
Significant
Unobservable Inputs
(Level 3)
|
||||||||||||
|
1
st
lien notes
|
$
|
39.5
|
$
|
−
|
$
|
−
|
$
|
39.5
|
||||||||
|
2
nd
lien notes
|
38.2
|
−
|
−
|
38.2
|
||||||||||||
|
Subordinated debt
|
15.1
|
−
|
−
|
15.1
|
||||||||||||
|
Preferred equity, common equity & warrants
|
49.3
|
−
|
−
|
49.3
|
||||||||||||
|
Investments measured at net asset value
1
|
36.3
|
−
|
−
|
−
|
||||||||||||
|
Total Investments
|
$
|
178.4
|
$
|
−
|
$
|
−
|
$
|
142.1
|
||||||||
|
Fair Value Measurements
at March 31, 2015 Using
|
||||||||||||||||
|
Asset Category
|
Total
|
Quoted Prices in
Active Markets
for Identical
Assets
(Level 1)
|
Significant Other
Observable
Inputs
(Level 2)
|
Significant
Unobservable
Inputs
(Level 3)
|
||||||||||||
|
2
nd
lien notes
|
$
|
6.9
|
$
|
−
|
$
|
−
|
$
|
6.9
|
||||||||
|
Subordinated debt
|
2.9
|
−
|
−
|
2.9
|
||||||||||||
|
Preferred & common equity
|
517.3
|
−
|
−
|
517.3
|
||||||||||||
|
Partnership interests
1
|
8.4
|
−
|
−
|
−
|
||||||||||||
|
Total Investments
|
$
|
535.5
|
$
|
−
|
$
|
−
|
$
|
527.1
|
||||||||
1
Certain investments that are measured at fair value using the net asset value per share (or its equivalent) practical expedient have not been categorized in the fair value hierarchy. The fair value amounts presented in this table are intended to permit reconciliation of the fair value hierarchy to the amounts presented in Consolidated Statements of Assets and Liabilities.
Changes in Fair Value Levels
We monitor the availability of observable market data to assess the appropriate classification of financial instruments within the fair value hierarchy. Changes in economic conditions or model based valuation techniques may require the transfer of financial instruments from one fair value to another. We recognize transfer of financial instruments between levels at the end of each quarterly reporting period. During the years ended March 31, 2016 and 2015, we had no transfers between levels.
The following table provides a summary of changes in the fair value of investments measured using Level 3 inputs during the years ended March 31, 2016 and 2015 (in millions):
|
Fair Value
3/31/15
|
Net Unrealized
Appreciation
(Depreciation)
|
Unrealized
Depreciation
due to spin-off
of CSWI
|
Purchases of
Investments
1
|
Divestitures
|
Distributions
|
Fair Value at
3/31/16
|
||||||||||||||||||||||
|
1
st
lien notes
|
$
|
−
|
$
|
0.2
|
$
|
−
|
$
|
39.3
|
$
|
−
|
$
|
−
|
$
|
39.5
|
||||||||||||||
|
2
nd
lien notes
|
6.9
|
(0.7
|
)
|
−
|
32.0
|
−
|
−
|
38.2
|
||||||||||||||||||||
|
Subordinated debt
|
2.9
|
1.1
|
−
|
12.4
|
(1.3
|
)
|
−
|
15.1
|
||||||||||||||||||||
|
Preferred equity, common equity & warrants
|
517.3
|
14.8
|
(458.3
|
)
|
2.0
|
(19.5
|
)
|
(7.0
|
)*
|
49.3
|
||||||||||||||||||
|
Total Investments
|
$
|
527.1
|
$
|
15.4
|
$
|
(458.3
|
)
|
$
|
85.7
|
$
|
(20.8
|
)
|
$
|
(7.0
|
)
|
$
|
142.1
|
|||||||||||
*Represents the costs basis of the The RectorSeal, Corporation, The Whitmore Manufacturing Company, Balco, Inc. and CapStar Holdings Corporation that were spun off to CSW Industrials, Inc. at September 30, 2015.
1
Includes purchases of new investments, as well as discount accretion on existing investments.
|
Fair Value
3/31/14
|
Net Unrealized
Appreciation
(Depreciation)
|
Purchases of
Investments
|
Divestitures
|
Distributions
|
Fair Value at
3/31/15
|
|||||||||||||||||||
|
2
nd
lien notes
|
$
|
−
|
$
|
−
|
$
|
6.9
|
$
|
−
|
$
|
−
|
$
|
6.9
|
||||||||||||
|
Subordinated debt
|
2.7
|
0.1
|
0.1
|
−
|
−
|
2.9
|
||||||||||||||||||
|
Preferred & common equity
|
445.7
|
98.3
|
1.3
|
(28.0
|
)
|
−
|
517.3
|
|||||||||||||||||
|
Total Investments
|
$
|
448.4
|
$
|
98.4
|
$
|
8.3
|
$
|
(28.0
|
)
|
$
|
−
|
$
|
527.1
|
|||||||||||
The total unrealized gains included in earnings that related to assets still held at the report date for the years ended March 31, 2016 and 2015 were $7,576,689 and $98,553,053, respectively.
| 6. | INCOME TAXES |
We have elected to be treated as a RIC under Subchapter M of the IRC and have a tax year end of December 31. In order to qualify as a RIC, we must annually distribute at least 90% of our investment company taxable income, as defined by the IRC, to our shareholders in a timely manner. Investment company income generally includes net short-term capital gains but excludes net long-term capital gains. A RIC is not subject to federal income tax on the portion of its ordinary income and long-term capital gains that is distributed to its shareholders, including “deemed distributions” discussed below. As permitted by the IRC, a RIC can designate dividends paid in the subsequent tax year as dividends of current year ordinary income and net long-term gains if those dividends are both declared by the extended due date of the RIC’s federal income tax return and paid to shareholders by the last day of the subsequent tax year.
We have distributed or intend to distribute sufficient dividends to eliminate taxable income for our completed tax years. If we fail to satisfy the 90% distribution requirement or otherwise fail to qualify as a RIC in any tax year, we would be subject to tax in that year on all of our taxable income, regardless of whether we made any distributions to our shareholders. During the tax year ended December 31, 2015, we did not pay ordinary dividends. For the tax year ended December 31, 2014, we declared and paid ordinary dividends in the amount of $3,082,911.
Additionally, we are subject to a nondeductible federal excise tax of 4% if we do not distribute at least 98% of our investment company ordinary taxable income before the end of our tax year. For the tax year ended December 31, 2015, we incurred a net investment loss on a tax basis. For the tax year ended December 31, 2014, we distributed 100% of our investment company ordinary taxable income. As a result, we have no tax provision for income taxes on ordinary taxable income for the tax years ended December 31, 2015 and 2014.
A RIC may elect to retain its long-term capital gains by designating them as a “deemed distribution” to its shareholders and paying a federal tax rate of 35% on the long-term capital gains for the benefit of its shareholders. Shareholders then report their share of the retained capital gains on their income tax returns as if it had been received and report a tax credit for tax paid on their behalf by the RIC. Shareholders then add the amount of the “deemed distribution” net of such tax to the basis of their shares.
During our tax year ended December 31, 2015, we had long-term capital gains of $9,966,530 for tax purposes, of which $1,543,833 was distributed to shareholders as a capital gain dividend. The total undistributed capital gain totaled $8,422,697, which we elected to retain and treat as deemed distributions to our shareholders. In order to make the election to retain capital gains, we incurred federal taxes on behalf of our shareholders in the amount of $2,947,944 for the tax year ended December 31, 2015.
During our tax year ended December 31, 2014, we had net long-term capital gains of $155,342,875 for tax purposes, which we elected to retain and treat as deemed distributions to our shareholders. For the tax year ended December 31, 2014, we incurred federal taxes on behalf of our shareholders in the amount of $54,370,006.
The following table sets forth a summary of our net realized gains for book purposes on transactions by category:
| Net Realized Gains on Transactions In |
For the Tax Year Ended December 31
|
|||||||
|
Investment Securities of
|
2015
|
2014
|
||||||
|
Control investments
|
$
|
231,000
|
$
|
−
|
||||
|
Affiliate investments
|
(1,457,711
|
)
|
157,128,306
|
|||||
|
Non-control/Non-affiliate investments
|
12,758,384
|
(1,189,983
|
)
|
|||||
|
Net realized gain on investments
|
$
|
11,531,673
|
$
|
155,938,323
|
||||
|
Capital gain distribution
|
(1,543,833
|
)
|
−
|
|||||
|
Taxes incurred on deemed capital gain distribution
|
2,947,944
|
54,370,006
|
||||||
|
Net realized gains on investments (for book purposes; after tax)
|
$
|
7,039,896
|
$
|
101,568,317
|
||||
|
Net realized gains on investments (for tax purposes; after tax)
|
$
|
5,474,753
|
$
|
100,972,869
|
||||
For the tax years ended December 31, 2015 and 2014, CSWC and CSVC qualified to be taxed as RICs. However, either company’s ability to meet certain portfolio diversification requirements of RICs in future years may not be controllable by the company.
CSMC, a wholly-owned subsidiary of CSWC, is not a RIC and is required to pay taxes at the current corporate rate. For tax purposes, CSMC has elected to be treated as a taxable entity, and therefore is not consolidated for tax purposes and is taxed at normal corporate tax rates based on its taxable income and, as a result of its activities, may generate income tax expense or benefit. The taxable income, or loss, of CSMC may differ from its book income, or loss, due to temporary book and tax timing differences and permanent differences. This income tax expense, or benefit, if any, and the related tax assets and liabilities, are reflected in our consolidated financial statements. CSMC records individual incentive award and bonus accruals on a quarterly basis. Deferred taxes related to the changes in the qualified defined pension plan, Restoration Plan, individual incentive award and bonus accruals are also recorded on a quarterly basis. A valuation allowance is provided against deferred tax assets when it is more likely than not that some portion or all of the deferred tax asset will not be realized. Establishing a valuation allowance of a deferred tax asset requires management to make estimates related to expectations of future taxable income. Estimates of future taxable income are based on forecasted cash flows from the management company’s operations. As of March 31, 2016, CSMC had a deferred tax asset of $3.2 million, our valuation allowance was $0.9 million and our net deferred tax asset was $2.3 million. We believe that it is more likely than not that we will be able to utilize $2.3 million of our deferred tax assets as of March 31, 2016. We will continue to assess our ability to realize our existing deferred tax assets. As of March 31, 2016 and March 31, 2015, CSMC has a deferred tax asset (liability) of $2,341,895 and ($1,411,920), respectively.
The following table sets forth the significant components of the deferred tax assets and liabilities as of March 31, 2016 and 2015 (amounts in thousands):
|
Years ended
|
||||||||
|
2016
|
2015
|
|||||||
|
Deferred tax asset:
|
||||||||
|
Net operating loss carryforwards
|
$
|
1,381
|
$
|
-
|
||||
|
Compensation
|
874
|
741
|
||||||
|
Pension liability
|
750
|
1,092
|
||||||
|
Other
|
203
|
370
|
||||||
|
Total deferred tax asset
|
3,208
|
2,203
|
||||||
|
Less valuation allowance
|
(866
|
)
|
-
|
|||||
|
Total net deferred tax asset
|
2,342
|
2,203
|
||||||
|
Deferred tax liabilities:
|
||||||||
|
Pension benefit
|
-
|
(3,603
|
)
|
|||||
|
Other
|
-
|
(12
|
)
|
|||||
|
Total deferred tax liabilities
|
-
|
(3,615
|
)
|
|||||
|
Total net deferred tax assets (liabilities)
|
$
|
2,342
|
$
|
(1,412
|
)
|
|||
In addition, we have a wholly-owned taxable subsidiary, or the Taxable Subsidiary, which holds a portion of one or more of our portfolio investments that are listed on the Consolidated Schedule of Investments. The Taxable Subsidiary is consolidated for financial reporting purposes in accordance with GAAP, so that our consolidated financial statements reflect our investments in the portfolio companies owned by the Taxable Subsidiary. The purpose of the Taxable Subsidiary is to permit us to hold certain interests in portfolio companies that are organized as limited liability companies, or LLCs (or other forms of pass-through entities) and still satisfy the RIC tax requirement that at least 90.0% of our gross income for federal income tax purposes must consist of qualifying investment income. Absent the Taxable Subsidiary, a proportionate amount of any gross income of a partnership or LLC (or other pass-through entity) portfolio investment would flow through directly to us. To the extent that our income did not consist of investment income, it could jeopardize our ability to qualify as a RIC and therefore cause us to incur significant amounts of corporate-level U.S. federal income taxes. Where interests in LLCs (or other pass-through entities) are owned by the Taxable Subsidiary, however, the income from those interests is taxed to the Taxable Subsidiary and does not flow through to us, thereby helping us preserve our RIC status and resultant tax advantages. The Taxable Subsidiary is not consolidated for U.S. federal income tax purposes and may generate income tax expense as a result of their ownership of the portfolio companies. This income tax expense, if any, is reflected in our Statement of Operations.
| 7. | ACCUMULATED NET REALIZED GAINS (LOSSES) ON INVESTMENTS |
Distributions made by RICs often differ from aggregate GAAP-basis undistributed net investment income and accumulated net realized gains (total GAAP-basis net realized gains). The principal cause is that required minimum fund distributions are based on income and gain amounts determined in accordance with federal income tax regulations, rather than GAAP. The differences created can be temporary, meaning that they will reverse in the future, or they can be permanent. In subsequent periods, when all or a portion of a temporary difference becomes a permanent difference, the amount of the permanent difference will be reclassified to “additional capital.” During the year ended March 31, 2016, we reclassified for book purposes amounts arising from permanent book/tax differences as follows (amounts in thousands):
|
Year Ended
March 31, 2016
|
||||
|
Additional capital
|
$
|
(16,877
|
)
|
|
|
Accumulated net investment loss
|
$
|
15,395
|
||
|
Accumulated net realized gains
|
$
|
1,482
|
||
We incur federal taxes on behalf of our shareholders as a result of our election to retain long-term capital gains. We had $1,498,184 and $22,355,353 of accumulated long term capital gains, as of March 31, 2016 and March 31, 2015, respectively. In accordance with the RIC rules, we elected to retain our long-term capital gains for the tax year ended December 31, 2015, incur the applicable income taxes of $2,947,944, and designate the after-tax gain as “deemed distributions” to shareholders. “Deemed distributions” are reclassified from accumulated net realized gains in additional paid in capital at the end of December.
| 8. | SPIN-OFF COMPENSATION PLAN |
On August 28, 2014, our Board of Directors adopted a compensation plan consisting of grants of nonqualified stock options, restricted stock and cash incentive awards to certain officers of the Company at the time. The plan was intended to align the compensation of the Company’s key officers with the Company’s strategic objective of increasing the market value of the Company’s shares through a transformative transaction for the benefit of the Company’s shareholders. Under the plan, Joseph B. Armes, former CEO of the Company, Kelly Tacke, former CFO of the Company, and Bowen S. Diehl, former CIO and current CEO of the company, were eligible to receive an amount equal to six percent of the aggregate appreciation in the Company’s share price from August 28, 2014 (using a base price of $36.16 per share) to 90 days after the completion of a transformative transaction (the “Trigger Event Date”). The first plan component consists of nonqualified options awarded to purchase 259,000 shares of common stock at an exercise price of $36.60 per share. The second plan component consists of awards of 127,000 shares of restricted stock, which have voting rights but do not have cash dividend rights. See Employee stock based compensation plans under footnote 9 for further discussion on the first two components of the Executive Compensation Plan. The final plan component consists of cash incentive payments awarded to each participant in an amount equal to the excess of each awardee’s allocable portion of the total payment amount over the aggregate value as of the Trigger Event Date of the awardee’s restricted common stock and nonqualified option awards under the plan.
On September 8, 2015, the Board designated the share distribution of CSWI as a transformative transaction for purposes of the spin-off compensation plan and amended the award agreements granted under the plan to provide for accelerated vesting of the awards held by a participant in the event of a termination of that participant’s service effected by the participant for good reason, by the employer without cause, or as a result of the disability or death of the participant. On September 30, 2015, we completed the tax-free spin-off of CSWI through a pro-rata share distribution of CSWI's common stock to CSWC shareholders of record on September 18, 2015.
Effective immediately with the spin-off of CSWI, both Joseph B. Armes and Kelly Tacke became employees of CSWI and Bowen Diehl, our President and Chief Executive Officer, continued to be an employee of our Company. The Company entered into an Employee Matters Agreement with CSWI. Under this agreement, we retained the cash incentive awards granted under the Spin-off Compensation Plan, and all liabilities with respect to the cash incentive awards remained liabilities of CSWC. The equity based awards vesting terms are as follows: (1) 1/3 on December 29, 2015; (2) 1/3 on December 29, 2016; and (3) 1/3 on December 29, 2017.
The total value accretion was six percent of the aggregate appreciation in the Company’s share price from $36.16 to the combined volume-weighted average prices of both CSWC and CSWI stock as of December 29, 2015. The cash component of the spin-off compensation plan was the difference between the total value accretion and the aggregate value of the awardee’s restricted common stock and non-qualified option awards under the plan. The total cash liabilities for three participants under the plan totaled $6,115,093, of which $2,051,698 was fully vested as of December 29, 2015, and it was subsequently paid out in January 2016. The remaining two payments will be fully vested on December 29, 2016 and December 29, 2017. During the twelve months ended March 31, 2016, we recognized the cash component of spin-off compensation expense of $1,303,478, which represented the cash component of spin-off compensation for Mr. Diehl and two transferred employees to CSWI prior to the spin-off of CSWI. During the twelve months ended March 31, 2016, we also recorded $1,261,144 directly to additional paid in capital for the cash component of spin-off compensation related to the two transferred employees to CSWI.
| 9. | EMPLOYEE STOCK BASED COMPENSATION PLANS |
Stock Options
On July 20, 2009, shareholders approved our 2009 Stock Incentive Plan (the “2009 Plan”), which provides for the granting of stock options to employees and officers and authorizes the issuance of common stock upon exercise of stock options for up to 560,000 shares. All options are granted at or above market price, generally expire up to 10 years from the date of grant and are generally exercisable on or after the first anniversary of the date of grant in five annual installments. Options to purchase 155,000 shares at $19.19 per share were granted on October 19, 2009. Additionally, options to purchase 80,000 shares at $23.95 per share were granted on March 22, 2010, options to purchase 60,000 shares at $22.05 per share were granted on July 19, 2010 and options to purchase 40,000 shares at $24.23 per share were granted on July 18, 2011. Options to purchase 30,000 shares at $37.02 per share, 25,000 shares at $33.52 and 30,000 shares at $34.91 were granted on July 15, 2013, January 20, 2014 and March 17, 2014, respectively.
On August 28, 2014, our Board of Directors amended the 2009 Plan, as permitted pursuant to Section 18 of the 2009 Plan (the “First Amendment to the 2009 Plan”). The First Amendment to the 2009 Plan provides that an award agreement may allow an award to remain outstanding after a spin-off or change in control of one or more wholly-owned subsidiaries of the Company. In addition, on August 28, 2014, options to purchase 259,000 shares at $36.60 per share were granted under the 2009 Plan, as amended. On September 8, 2015, the Board designated the Share Distribution as a transformative transaction for purposes of the 2009 Plan and amended the award agreements granted under the 2009 Plan to provide for accelerated vesting of the awards held by a participant in the event of a termination of that participant’s service effected by the executive for good reason, by the employer without cause, or as a result of the disability or death of the participant. A third of these options were vested on December 29, 2015, and the rest of the options will vest on December 29, 2016 and December 29, 2017, respectively.
We previously granted stock options under our 1999 Stock Option Plan (the “1999 Plan”), as approved by shareholders on July 19, 1999. The 1999 Plan expired on April 19, 2009. Options previously granted under our 1999 Plan and outstanding on July 20, 2009 continue in effect and are governed by the provisions of the 1999 Plan. All options granted under the 1999 Plan were granted at market price on the date of grant, generally expire up to 10 years from the date of grant and are generally exercisable on or after the first anniversary of the date of grant in five to ten annual installments. At March 31, 2016, there are no options to acquire shares of common stock outstanding under the 1999 Plan.
At September 30, 2015, in connection with the spin-off of CSWI, we entered into an Employee Matters Agreement with CSWI, which provided that each CSWC option that is outstanding immediately prior to September 30, 2015, shall be converted into both a Post-Separation CSWC Option and a CSWI Option and shall be subject to substantially the same terms and conditions (including with respect to vesting and expiration) after September 30, 2015. Certain adjustments, using volumetric weighted-average prices for the 10-day period immediately prior to and immediately following the distribution, were made to the exercise price and number of shares of CSWC subject to the awards, with the intention of preserving the economic value of the awards immediately prior to the distribution for all CSWC employees. We compared the fair market value of our stock options on the day of the spin-off with the combined fair value of our stock options and CSWI stock options the day after the completion of the spin-off transaction. The distribution-related adjustments did not have a material impact on compensation expense for the year ended March 31, 2016.
At March 31, 2016, there are options to acquire 362,513 shares of common stock outstanding. The Compensation Committee does not intend to grant additional options under the 2009 Stock Incentive Plan or request shareholders’ approval of additional stock options to be added under the 2009 Stock Incentive Plan.
The following table summarizes activity in the 2009 Plan and the 1999 Plan as of March 31, 2016:
|
Number of Shares
|
Weighted
Average
Exercise
Price
|
|||||||
|
2009 Plan
|
||||||||
|
Balance at March 31, 2013
|
170,908
|
$
|
22.37
|
|||||
|
Granted
|
85,000
|
35.25
|
||||||
|
Exercised
|
(69,108
|
)
|
22.27
|
|||||
|
Canceled/Forfeited
|
(63,000
|
)
|
22.08
|
|||||
|
Balance at March 31, 2014
|
123,800
|
31.40
|
||||||
|
Granted
|
259,000
|
36.60
|
||||||
|
Exercised
|
(6,800
|
)
|
23.95
|
|||||
|
Canceled/Forfeited
|
(4,000
|
)
|
23.95
|
|||||
|
Balance at March 31, 2015
|
372,000
|
35.24
|
||||||
|
Granted
|
–
|
–
|
||||||
|
Exercised
|
(8,000
|
)
|
23.37
|
|||||
|
Canceled/Forfeited
|
–
|
–
|
||||||
|
Spin-off adjustments
|
(1,487
|
)*
|
NA
|
|||||
|
Balance at March 31, 2016
|
362,513
|
$
|
11.21
|
*
|
||||
|
1999 Plan
|
||||||||
|
Balance at March 31, 2013
|
246,000
|
$
|
33.00
|
|||||
|
Granted
|
–
|
–
|
||||||
|
Exercised
|
(108,000
|
)
|
30.37
|
|||||
|
Canceled/Forfeited
|
(100,000
|
)
|
38.25
|
|||||
|
Balance at March 31, 2014
|
38,000
|
26.68
|
||||||
|
Granted
|
–
|
–
|
||||||
|
Exercised
|
(22,000
|
)
|
29.10
|
|||||
|
Canceled/Forfeited
|
–
|
–
|
||||||
|
Balance at March 31, 2015
|
16,000
|
23.37
|
||||||
|
Granted
|
–
|
–
|
||||||
|
Exercised
|
(15,974
|
)
|
17.38
|
|||||
|
Canceled/Forfeited
|
–
|
–
|
||||||
|
Spin-off adjustments
|
(26
|
)*
|
||||||
|
Balance at March 31, 2016
|
–
|
–
|
||||||
|
Combined Balance at March 31, 2016
|
362,513
|
$
|
11.21
|
*
|
||||
|
March 31, 2016
|
Weighted Average
Remaining Contractual Term
|
Aggregate
Intrinsic
Value
|
|||
|
Outstanding
|
2.1 years
|
$
|
2,426,559
|
||
|
Exercisable
|
1.9 years
|
$
|
968,416
|
||
*
Certain adjustments were made to the exercise price and number of shares of Capital Southwest awards using volumetric weighted-average prices for the 10-day period immediately prior to and immediately following the distribution with the intention of preserving the economic value of the awards immediately prior to the distribution for all Capital Southwest employees.
We recognize compensation cost using the straight-line method for all share-based payments. The fair value of stock options is determined on the date of grant using the Black-Scholes pricing model and is expensed over the requisite service period of the related stock options. Accordingly, for the years ended March 31, 2016, 2015 and 2014, we recognized stock option compensation expense (benefit) of $423,971, $525,235, and ($732,530) respectively.
As of March 31, 2016, the total remaining unrecognized compensation expense related to non-vested stock options was $391,290, which will be amortized over the weighted-average vesting period of approximately 2.1 years.
At March 31, 2016, the range of exercise prices was $7.55 to $11.53 and the weighted-average remaining contractual life of outstanding options was 2.1 years. The total number of shares of common stock exercisable under both the 2009 Plan and the 1999 Plan at March 31, 2016 was 139,759 shares with a weighted-average exercise price of $10.86. During the year ended March 31, 2016, no options were granted and 23,974 options were exercised with an average exercise price of $19.38.
At March 31, 2015, the range of exercise prices was $19.19 to $37.02 and the weighted-average remaining contractual life of outstanding options was 2.5 years. The total number of options exercisable under both the 2009 Plan and the 1999 Plan at March 31, 2015, was 49,000 shares with a weighted-average exercise price of $27.04. During the year ended March 31, 2015, 259,000 options were granted and 28,800 options were exercised with an average exercise price of $27.89.
At March 31, 2016, 2015 and 2014, the number of options exercisable was 139,759, 49,000 and 46,800, respectively, and the weighted average price of those options was $10.86, $27.04 and $26.00, respectively.
Stock Awards
Pursuant to the Capital Southwest Corporation 2010 Restricted Stock Award Plan (“2010 Plan”), our Board of Directors originally reserved 188,000 shares of restricted stock for issuance to certain of our employees. At our annual shareholder meeting in August 2015, our shareholders approved an increase of an additional 450,000 shares to our 2010 Plan. A restricted stock award is an award of shares of our common stock, which generally have full voting and dividend rights but are restricted with regard to sale or transfer. Restricted stock awards are independent of stock grants and are generally subject to forfeiture if employment terminates prior to these restrictions lapsing. Unless otherwise specified in the award agreement, these shares vest in equal annual installments over a four to five-year period from the grant date and are expensed over the vesting period starting on the grant date. On January 16, 2012, the Board of Directors granted 38,600 shares of restricted stock to key employees of the Company. On January 22, 2013, the Board of Directors granted 8,000 shares of restricted stock to officers of the Company. On July 15, 2013, The Board of Directors granted 5,000 shares of restricted stock to a key officer of the Company. On January 20, 2014, the Board of Directors granted 4,800 shares of restricted stock to key employees of the Company. On March 17, 2014, the Board of Directors granted 5,000 shares of restricted stock to a key employee of the Company.
On August 28, 2014, our Board of Directors amended the 2010 Plan, as permitted pursuant to Section 14 of the 2010 Plan (the “First Amendment to the 2010 Plan”). The First Amendment to the 2010 Plan provides that an award agreement may allow an award to remain outstanding after a spin-off or change in control of one or more wholly-owned subsidiaries of the Company. In addition, on August 28, 2014, the Board of Directors granted 127,000 shares of restricted stock under the Spin-Off Compensation Plan.
On September 30, 2015, we completed the spin-off of CSWI. CSWI is now an independent publicly traded company. CSWI’s common stock trades on the Nasdaq Global Select Market under the ticker symbol “CSWI.” The Share Distribution was effected through a tax-free, pro-rata distribution of 100% of CSWI’s common stock to shareholders of our Company. Each holder of an outstanding Capital Southwest Restricted Stock Award immediately prior to the Distribution Date received, as of the Distribution Date, a CSWI Restricted Stock Award for the number of CSWI Shares as if the outstanding Capital Southwest Restricted Stock Award comprised fully vested Capital Southwest Shares as of the Distribution Date.
Restricted stock awards previously granted under the Spin-Off Compensation Plan vest and become exercisable as follows: (1) 1/3 on December 29, 2015; (2) 1/3 on December 29, 2016; and (3) 1/3 on December 29, 2017.
In November 2015 and January 2016, our Board granted an additional 143,000 and 500 shares, respectively, of restricted stock to employees. These shares vest in equal annual installments over a four-year period.
The following table summarizes the restricted stock available for issuance for the year ended March 31, 2016:
|
Restricted stock available for issuance as of March 31, 2015
|
31,240
|
|||
|
Additional restricted stock approved under the plan
|
450,000
|
|||
|
Restricted stock granted during the twelve months ended March 31, 2016
|
(143,500
|
)
|
||
|
Restricted stock forfeited during the twelve months ended March 31, 2016
|
6,800
|
|||
|
Restricted stock available for issuance as of March 31, 2016
|
344,540
|
We expense the cost of the restricted stock awards, which is determined to equal the fair value of the restricted stock award at the date of grant, on a straight-line basis over the requisite service period. For these purposes, the fair value of the restricted stock award is determined based upon the closing price of our common stock on the date of the grant. Due to the spin-off transaction, the Company evaluated the value of the CSWC stock awards pre spin-off and the combined value of CSWC and CSWI stock awards post spin-off and recorded additional incremental stock based compensation expenses.
For the fiscal years ended March 31, 2016, 2015, and 2014 we recognized total share based compensation expense of $756,630, $502,185 and $101,022, respectively related to the restricted stock issued to our employees and officers.
As of March 31, 2016, the total remaining unrecognized compensation expense related to non-vested restricted stock awards was $2,381,716, which will be amortized over the weighted-average vesting period of approximately 3.0 years.
The following table summarizes the restricted stock outstanding as of March 31, 2016:
|
Restricted Stock Awards
|
Number of Shares
|
Weighted
Average Fair
Value Per Share
at grant date
|
Weighted
Average
Remaining
Vesting Term
(in Years)
|
|||||||||
|
Unvested at March 31, 2014
|
24,680
|
$
|
30.30
|
4.1
|
||||||||
|
Granted
|
127,000¹
|
15.19²
|
2.0
|
|||||||||
|
Vested
|
(4,720
|
)
|
30.51
|
−
|
||||||||
|
Forfeited
|
(4,000
|
)
|
22.98
|
−
|
||||||||
|
Unvested at March 31, 2015
|
142,960
|
$
|
17.07
|
2.6
|
||||||||
|
Granted
|
143,500
|
14.87
|
3.6
|
|||||||||
|
Vested
|
(46,453
|
)
|
17.93
|
−
|
||||||||
|
Forfeited
|
(6,800
|
)
|
17.84
|
−
|
||||||||
|
Unvested at March 31, 2016
|
233,207
|
$
|
15.79
|
3.0
|
||||||||
|
¹
|
See Note 8.
|
|
²
|
Monte Carlo simulation was utilized to develop the grant date fair value for the restricted stock awards under the executive compensation plan.
|
Individual Incentive Awards
On January 16, 2012, our Board of Directors approved the issuance of 104,000 individual cash incentive awards with a baseline for measuring increases in net asset value per share of $36.74 (Net Asset Value at December 31, 2011) to provide deferred compensation to certain key employees. On January 22, 2013, the Board of Directors granted 16,200 individual cash incentive awards with a baseline net asset value per share of $41.34 (Net Asset Value at December 31, 2012) to officers of the Company. On July 15, 2013, the Board of Directors granted 24,000 shares of individual cash incentive awards with a baseline net asset value per share of $43.80 (Net Asset Value at June 30, 2013) to a key officer of the Company. Additionally, the Board of Directors granted 38,000 individual cash incentive awards with a baseline net asset value per share of $50.25 (Net Asset Value at December 31, 2013) to several key employees of the Company in January 2014 and March 2014. Under the individual cash incentive award agreements, awards vest on the fifth anniversary of the award date. Upon exercise of an individual cash incentive award, the Company pays the recipient a cash payment in an amount equal to the net asset value per share minus the baseline net asset value per share, adjusted for capital gain dividends declared.
In connection with the spin-off of CSWI,
we entered into an Employee Matters Agreement with CSWI. Under this agreement, the individual cash incentive award agreements were amended to provide that the value of each individual cash incentive award is determined based upon the net asset value of CSWC as of June 30, 2015. The remaining terms of each individual incentive award agreement, including the vesting and payment terms, will remain unchanged. After the Distribution Date, CSWC retains all liabilities associated with all individual cash incentive awards granted by CSWC.
There are currently 74,000 individual cash incentive awards outstanding as of March 31, 2016 and the estimated liability for individual cash incentive awards was $618,856 at March 31, 2016.
During the twelve months ended March 31, 2015, a payment in the amount of $193,708 was paid out to a vested employee. The estimated liability for individual cash incentive awards was $671,758 at March 31, 2015. During the twelve months ended March 31, 2014, a payment in the amount of $520,730 was paid out to a vested employee. At March 31, 2014, our estimated liability for individual cash incentive awards was $673,268.
There were no
individual cash incentive awards vested or
granted during the twelve months ended March 31, 2016.
|
Individual Cash Incentive Awards
|
Number of
Shares
|
Weighted
Average Grant
Price Per Share
|
Weighted
Average
Remaining
Vesting Term
(in Years)
|
|||||||||
|
Unvested at March 31, 2015
|
82,000
|
$
|
45.40
|
3.3
|
||||||||
|
Granted
|
−
|
−
|
−
|
|||||||||
|
Vested
|
−
|
−
|
−
|
|||||||||
|
Forfeited or expired
|
(8,000
|
)
|
43.57
|
−
|
||||||||
|
Unvested at March 31, 2016
|
74,000
|
$
|
45.60
|
2.3
|
||||||||
| 10. | OTHER EMPLOYEE COMPENSATION |
We established a 401(k) plan (“401K Plan”) effective October 1, 2015. All full-time employees are eligible to participate in the 401K Plan. The 401K Plan permits employees to defer a portion of their total annual compensation up to the Internal Revenue Service annual maximum based on age and eligibility. During the quarter ended December 31, 2015, we made contributions to the 401K Plan of up to 3% of the Internal Revenue Service’s annual maximum eligible compensation, which vests in equal installments over four years. Effective January 1, 2016, the 401K Plan was converted to a safe harbor plan. We made contributions of up to 4.5% of the Internal Revenue Service’s annual maximum eligible compensation, all of which is fully vested immediately. During the year ended March 31, 2016, we made matching contributions of approximately $49,000.
| 11. | RETIREMENT PLANS |
Until the spin-off of CSWI, CSWC sponsored a qualified defined benefit pension plan which covers its employees and employees of certain of its controlled affiliates. The following information about the plan represents amounts and information related to CSWC’s participation in the plan and is presented as though CSWC sponsored a single-employer plan. Benefits are based on years of service and an average of the highest five consecutive years of compensation during the last 10 years of employment. The funding policy of the plan is to contribute annual amounts that are currently deductible for tax reporting purposes. No contribution was made to the plan during the three years ended March 31, 2016. The qualified defined benefit pension plan is closed to any employees hired or rehired on or after January 1, 2015. In connection with the spin-off of CSWI, we entered into an Employee Matters Agreement with CSWI on September 8, 2015. The Employee Matters Agreement was amended and restated on September 14, 2015. Under the Employee Matters Agreement, Capital Southwest Corporation and Capital Southwest Management Corporation withdrew as participating employers in the Plan and CSWI became the Sponsoring Employer of the Qualified Retirement Plan and assumed all the liabilities, assets, and future funding obligations for providing benefits for the covered Participants under the Qualified Retirement Plan.
Additionally, CSWC sponsors an unfunded Retirement Restoration Plan, which is a nonqualified plan that provides for the payment, upon retirement, of the difference between the maximum annual payment permissible under the qualified retirement plan pursuant to federal limitations and the amount which would otherwise have been payable under the qualified plan. Effective September 30, 2015, the benefits accrued under the Restoration Plan on behalf of CSWI employees, including employees who transferred from the Company to CSWI, were transferred to a non-qualified deferred compensation plan established by CSWI. The Company retained all liabilities associated with benefits accrued under the Restoration Plan on behalf of individuals who remain employees of the Company or Capital Southwest Management Corporation following September 30, 2015 or who terminated employment prior to September 30, 2015 with vested benefits under the Restoration Plan. Unvested accrued benefits under the Restoration Plan were forfeited as of September 30, 2015.
The following tables set forth the qualified plan’s net pension benefit, benefit obligation, fair value of plan assets, and amounts recognized in our consolidated statements of operations at March 31, 2016, 2015 and 2014, as well as amounts recognized in our consolidated statements of assets and liabilities at March 31, 2016 and 2015:
|
Years ended March 31,
|
||||||||||||
|
2016
|
2015
|
2014
|
||||||||||
|
Net pension benefit
|
||||||||||||
|
Service cost-benefits earned during the year
|
$
|
189,886
|
$
|
199,097
|
$
|
253,837
|
||||||
|
Interest cost on projected benefit obligation
|
173,120
|
347,933
|
291,699
|
|||||||||
|
Expected return on assets
|
(578,273
|
)
|
(1,043,584
|
)
|
(906,816
|
)
|
||||||
|
Net amortization
|
4,689
|
25,284
|
68,813
|
|||||||||
|
Immediate recognition of benefit cost due to Plan Freeze at 9/30/2015
|
(71,946
|
)
|
–
|
–
|
||||||||
|
Net pension benefit from qualified plan
|
$
|
(282,524
|
)
|
$
|
(471,270
|
)
|
$
|
(292,467
|
)
|
|||
|
Years ended March 31,
|
||||||||||||
|
2016
|
2015
|
2014
|
||||||||||
|
Change in benefit obligation
|
||||||||||||
|
Benefit obligation at beginning of year
|
$
|
8,328,554
|
$
|
7,149,380
|
$
|
6,421,611
|
||||||
|
Service cost
|
189,886
|
199,097
|
253,837
|
|||||||||
|
Interest cost
|
173,120
|
347,933
|
291,699
|
|||||||||
|
Actuarial gain
|
(507,703
|
)
|
930,588
|
306,173
|
||||||||
|
Benefits paid
|
(171,791
|
)
|
(298,444
|
)
|
(123,940
|
)
|
||||||
|
Curtailment recognition
|
(409,285
|
)
|
–
|
–
|
||||||||
|
Transferred to CSWI at 9/30/2015
|
(7,602,781
|
)
|
–
|
–
|
||||||||
|
Benefit obligation at end of year
|
$
|
–
|
$
|
8,328,554
|
$
|
7,149,380
|
||||||
|
Years ended March 31,
|
||||||||||||
|
2016
|
2015
|
2014
|
||||||||||
|
Change in plan assets
|
||||||||||||
|
Fair value of plan assets at beginning of year
|
$
|
18,622,781
|
$
|
18,112,073
|
$
|
15,183,833
|
||||||
|
Actual return on plan assets
|
(314,549
|
)
|
809,152
|
3,052,180
|
||||||||
|
Benefits paid
|
(171,791
|
)
|
(298,444
|
)
|
(123,940
|
)
|
||||||
|
Transferred to CSWI at 9/30/2015
|
(18,136,441
|
)
|
–
|
–
|
||||||||
|
Fair value of plan assets at end of year
|
$
|
–
|
$
|
18,622,781
|
$
|
18,112,073
|
||||||
|
Years ended March 31,
|
||||||||
|
2016
|
2015
|
|||||||
|
Funded status and amounts recognized in consolidated statements of assets and liabilities
|
||||||||
|
Actuarial present value of benefit obligations:
|
||||||||
|
Accumulated benefit obligation
|
$
|
–
|
|
$
|
(7,149,380
|
)
|
||
|
Projected benefit obligation for service rendered to date
|
–
|
(8,328,554
|
)
|
|||||
|
Plan assets at fair value*
|
–
|
18,622,781
|
||||||
|
Funded status
|
–
|
10,294,227
|
||||||
|
Unrecognized net (gain)loss
|
–
|
(146,916
|
)
|
|||||
|
Unrecognized prior service costs
|
–
|
103,825
|
||||||
|
ASC 715 adjustment
|
–
|
43,091
|
||||||
|
Prepaid pension cost included in pension assets
|
$
|
–
|
$
|
10,294,227
|
||||
|
*
|
Includes approximately 238,252 shares of CSWC Common Stock at 3/31/2015.
|
The following tables set forth the retirement restoration plan’s net pension benefit and benefit obligation amounts at March 31, 2016, 2015 and 2014, as well as amounts recognized in our consolidated statements of assets and liabilities at March 31, 2016 and 2015:
|
Years ended March 31,
|
||||||||||||
|
2016
|
2015
|
2014
|
||||||||||
|
Net pension cost
|
||||||||||||
|
Service cost-benefits earned during the year
|
$
|
82,152
|
$
|
17,795
|
$
|
106,199
|
||||||
|
Interest cost on projected benefit obligation
|
138,344
|
142,579
|
197,366
|
|||||||||
|
Net amortization
|
44,485
|
31,154
|
164,649
|
|||||||||
|
Immediate recognition of benefit cost due to Plan Freeze at 9/30/2015
|
(81,697
|
)
|
–
|
–
|
||||||||
|
Net pension cost from restoration plan
|
$
|
183,284
|
$
|
191,528
|
$
|
468,214
|
||||||
|
Years ended March 31,
|
||||||||||||
|
2016
|
2015
|
2014
|
||||||||||
|
Change in benefit obligation
|
||||||||||||
|
Benefit obligation at beginning of year
|
$
|
3,119,234
|
$
|
3,103,308
|
$
|
2,649,966
|
||||||
|
Service cost
|
82,152
|
17,795
|
106,199
|
|||||||||
|
Interest cost
|
138,344
|
142,579
|
197,366
|
|||||||||
|
Actuarial gain
|
427,370
|
105,475
|
149,777
|
|||||||||
|
Benefits paid
|
(199,938
|
)
|
(249,923
|
)
|
–
|
|||||||
|
Curtailment recognition
|
(329,449
|
)
|
–
|
–
|
||||||||
|
Other adjustments
|
(177,051
|
)
|
–
|
–
|
||||||||
|
Benefit obligation at end of year
|
$
|
3,060,662
|
$
|
3,119,234
|
$
|
3,103,308
|
||||||
|
Years ended March 31,
|
||||||||
|
2016
|
2015
|
|||||||
|
Amounts recognized in our consolidated statements of assets and liabilities
|
||||||||
|
Projected benefit obligation
|
$
|
(3,060,662
|
)
|
$
|
(3,119,234
|
)
|
||
|
Unrecognized net gain
|
855,822
|
863,079
|
||||||
|
Unrecognized prior service costs
|
–
|
(89,804
|
)
|
|||||
|
ASC 715 adjustment
|
–
|
(773,275
|
)
|
|||||
|
Accrued pension cost included in pension liabilities
|
$
|
(2,204,840
|
)
|
$
|
(3,119,234
|
)
|
||
The following assumptions were used in estimating the actuarial present value of the projected benefit obligations:
|
Years ended March 31,
|
||||||||||||
|
2016
|
2015
|
2014
|
||||||||||
|
Discount rate
|
4.25
|
%
|
4.25
|
%
|
5.00
|
%
|
||||||
|
Rate of compensation increases
|
5.00
|
%
|
5.00
|
%
|
5.00
|
%
|
||||||
The following assumptions were used in estimating the net periodic (income)/expense:
|
Years ended March 31,
|
||||||||||||
|
2016
|
2015
|
2014
|
||||||||||
|
Discount rate
|
4.25
|
%
|
5.00
|
%
|
4.50
|
%
|
||||||
|
Expected return on plan assets
|
N/A
|
7.00
|
%
|
7.00
|
%
|
|||||||
|
Rate of compensation increases
|
N/A
|
5.00
|
%
|
5.00
|
%
|
|||||||
Following are the expected benefit payments for the next five years and in the aggregate for the years 2022-2026:
|
(In thousands)
|
2017
|
2018
|
2019
|
2020
|
2021
|
2022-2026
|
||||||||||||||||||
|
Restoration Plan
|
$
|
212
|
$
|
214
|
$
|
215
|
$
|
214
|
$
|
214
|
$
|
1,122
|
||||||||||||
During the plan year ended March 31, 2016, the discount rate was changed from 5.00% to 4.25%. The expected rate of return on assets assumption was determined based on the anticipated performance of the various asset classes in the plan’s portfolio and the allocation of assets to each class. The anticipated asset class return is developed using historical and predicted asset return performance, considering the investments underlying each asset class and expected investment performance based on forecasts of inflation, interest rates and market indices for fixed income and equity securities.
Plan Assets
In connection with the spin-off of CSWI, CSWI became the Sponsoring Employer of the Qualified Retirement Plan and assumed all of the Plan Assets and future funding obligations for providing benefits for the covered Participants under the Qualified Retirement Plan. The pension plan is administered and managed by the trustees of the plan that has fiduciary responsibility for the plan’s management. All assets are held in the custody of Northern Trust. The plan assets are invested using a total return approach whereby a mix of equity securities, debt securities and other investments are used to preserve asset values, diversify risk and achieve our targeted investment return benchmark. Investment performance and asset allocation are measured and monitored on an ongoing basis.
Plan assets are managed in a balanced portfolio comprised of two major components: an equity portion and a fixed income portion. The expected role of plan equity investments is to maximize the long-term real growth of the plan’s assets, while the role of fixed income investments is to generate current income, provide for more stable periodic returns and provide some protection against prolonged decline in the market value of the plan’s equity investments.
The current target allocations for managed plan assets are 25%-43% equity, 40%-66% for fixed income, and 5%-15% for alternatives. Equity investments include U.S. and foreign equities, as well as publicly traded and non-publicly traded mutual funds. Fixed income securities include long-duration government obligations, government agency obligations and corporate obligations. Alternatives includes real estate and infrastructure, natural resources and commodities, hedge funds and private equity.
CSWC’s pension plan asset allocation at March 31, 2015 are as follows:
|
Percentage of Plan
Assets at
March 31, 2015
|
||||
|
Asset Category
|
||||
|
Equity securities
|
57.9
|
%
|
||
|
Fixed income securities
|
35.7
|
%
|
||
|
Other
|
2.9
|
%
|
||
|
Cash and cash equivalents
|
3.5
|
%
|
||
|
100.0
|
%
|
|||
Below are the details of the pension plan asset for Capital Southwest Corporation and its affiliates, of which Capital Southwest Corporation assets were $0 and $18,622,781 as of March 31, 2016 and 2015, respectively. As of September 30, 2015, the Qualified Pension Plan was assumed by CSWI, and the Company’s net pension assets were transferred to CSWI. The following fair value hierarchy table sets forth our pension plan investment portfolio by level as of March 31, 2015 (in millions):
|
Fair Value Measurements at Reporting Date Using
|
||||||||||||||||
|
Asset Category
|
Total
|
Quoted Prices
in Active
Markets for
Identical Assets
Level I
|
Significant
Other
Observable
Inputs Level 2
|
Significant
Observable
Inputs Level 3
|
||||||||||||
|
Equity securities (a)
|
$
|
35.7
|
$
|
19.5
|
$
|
16.2
|
$
|
–
|
||||||||
|
Fixed income securities (b)
|
22.0
|
2.1
|
19.9
|
–
|
||||||||||||
|
Cash and cash equivalents
|
2.2
|
2.2
|
–
|
–
|
||||||||||||
|
Other
|
1.8
|
1.1
|
0.7
|
–
|
||||||||||||
|
Total
|
$
|
61.7
|
$
|
24.9
|
$
|
36.8
|
$
|
–
|
||||||||
There were no plan assets valued using significant unobservable inputs (level 3) as of March 31, 2015.
| (a) | This category includes investment in equity securities of large, medium and small companies and equity investments in foreign companies. Mutual funds included in this category are valued using the net asset value per unit as of the valuation date. These investments include shares of our common stock. At March 31, 2015, our common stock represented 17.7% of the plan assets. |
| (b) | This category includes investments in investment grade fixed income instruments, primarily U.S. government obligations. |
| 12. | COMMITMENTS AND CONTINGENCIES |
On September 9, 2015, we entered into an agreement to co-manage I-45 SLF LLC (the “Joint Venture” or “I-45 SLF”) with Main Street Capital Corporation (“Main Street”). Both companies have equal voting rights on the Joint Venture’s Board of Managers. We have committed to provide $68,000,000 of equity to the Joint Venture, with Main Street providing $17,000,000. The Joint Venture invests primarily in syndicated senior secured loans in the upper middle market. We contributed $36,800,000 and currently have commitments outstanding of $31,200,000 as of March 31, 2016.
We also committed $7,500,000 to lead the last-out portion of a unitranche asset-based credit facility for Freedom Truck Finance, LLC (“Freedom Truck Finance”), a Dallas-based secondary truck finance company specializing in the acquisition and management of sub-prime commercial truck loans to independent owner operators. Triumph Commercial Finance, a division of TBK Bank, SSB (member of Triumph Bancorp, Inc. (Nasdaq:TBK) led the first-out tranche of the facility and serves as administrative agent. We funded $5,839,504 and had $1,660,496 commitment outstanding as of March 31, 2016.
As of March 31, 2016, we had $32,860,496 of aggregate commitments outstanding in Freedom Truck Finance and the joint venture with Main Street.
We lease office space under an operating lease which requires annual base rentals of approximately $250,000. For the three years ended March 31, 2016, total rental expense was $185,778 in 2016, $207,162 in 2015, and $142,521 in 2014, and the rent commitments for the next five years as of March 31, 2016 are as follows:
|
Year ending March 31,
|
Rent Commitment
|
|||
|
2017
|
229,982
|
|||
|
2018
|
239,242
|
|||
|
2019
|
248,503
|
|||
|
2020
|
257,765
|
|||
|
2021
|
267,026
|
|||
|
Thereafter
|
225,737
|
|||
|
Total
|
$
|
1,468,255
|
||
| 13. | SOURCES OF INCOME |
|
Investment Income
|
Realized Gain
(Loss) on
Investments before
Income Taxes
|
|||||||||||||||
|
Year ended
March 31, 2016
|
Interest
|
Dividends
|
Other
Income
|
|||||||||||||
|
Non-control/Non-affiliate investments
|
$
|
4,408,912
|
$
|
110
|
$
|
130,586
|
$
|
(9,574,909
|
)
|
|||||||
|
Affiliate investments
|
134,800
|
−
|
−
|
(1,457,711
|
)
|
|||||||||||
|
Control investments
|
−
|
3,489,205
|
530,000
|
231,000
|
||||||||||||
|
Other sources, including temporary investments
|
385,752
|
−
|
80,576
|
−
|
||||||||||||
|
$
|
4,929,464
|
$
|
3,489,315
|
$
|
741,162
|
$
|
(10,801,620
|
)
|
||||||||
|
Investment Income
|
Realized Gain
(Loss) on
Investments before
Income Taxes
|
|||||||||||||||
|
Year ended
March 31, 2015
|
Interest
|
Dividends
|
Other
Income
|
|||||||||||||
|
Non-control/Non-affiliate investments
|
$
|
288,292
|
$
|
67,309
|
$
|
75,000
|
$
|
8,225,962
|
||||||||
|
Affiliate investments
|
−
|
581,021
|
−
|
157,213,916
|
||||||||||||
|
Control investments
|
−
|
8,294,500
|
484,800
|
(1,175,287
|
)
|
|||||||||||
|
Other sources, including temporary investments
|
122,225
|
−
|
35,185
|
−
|
||||||||||||
|
$
|
410,517
|
$
|
8,942,830
|
$
|
594,985
|
$
|
164,264,591
|
|||||||||
|
Investment Income
|
Realized Gain
(Loss) on
Investments before
Income Taxes
|
|||||||||||||||
|
Year ended
March 31, 2014
|
Interest
|
Dividends
|
Other
Income
|
|||||||||||||
|
Non-control/Non-affiliate investments
|
$
|
259,377
|
$
|
179,728
|
$
|
89,189
|
$
|
14,084,087
|
||||||||
|
Affiliate investments
|
250,811
|
2,575,038
|
48,800
|
−
|
||||||||||||
|
Control investments
|
−
|
8,650,000
|
485,267
|
−
|
||||||||||||
|
Other sources, including temporary investments
|
66,949
|
−
|
1,386
|
−
|
||||||||||||
|
$
|
577,137
|
$
|
11,404,766
|
$
|
624,642
|
$
|
14,084,087
|
|||||||||
| 14. | SELECTED QUARTERLY FINANCIAL DATA |
The following presents a summary of the unaudited quarterly consolidated financial information for the years ended March 31, 2016 and 2015 (in thousands except per share amounts):
|
2016
|
First
Quarter
|
Second
Quarter
|
Third
Quarter
|
Fourth
Quarter
|
Total
|
|||||||||||||||
|
Net investment income (loss)
|
$
|
(2,830
|
)
|
$
|
(9,335
|
)
|
$
|
(20
|
)
|
$
|
1,498
|
$
|
(10,687
|
)
|
||||||
|
Net realized gain (loss) on investments
|
749
|
(3,396
|
)
|
(8,170
|
)
|
15
|
(10,802
|
)
|
||||||||||||
|
Net increase (decrease) in unrealized appreciation of investments
|
4,245
|
3,783
|
7,060
|
1,001
|
|
16,089
|
||||||||||||||
|
Net increase (decrease) in net assets from operations
|
2,164
|
(8,948
|
)
|
(1,130
|
)
|
2,514
|
(5,400
|
)
|
||||||||||||
|
Net investment (loss) income per share
|
(0.18
|
)
|
(0.60
|
)
|
(0.00
|
)
|
0.10
|
(0.68
|
)
|
|||||||||||
|
Net increase (decrease) in net assets from operations per share
|
0.14
|
(0.58
|
)
|
(0.07
|
)
|
0.16
|
(0.35
|
)
|
||||||||||||
|
2015
|
First
Quarter
|
Second
Quarter
|
Third
Quarter
|
Fourth
Quarter
|
Total
|
|||||||||||||||
|
Net investment income (loss)
|
$
|
(1,483
|
)
|
$
|
(1,239
|
)
|
$
|
4,429
|
$
|
(4,152
|
)
|
$
|
(2,445
|
)
|
||||||
|
Net realized gain (loss) on investments
|
(15,713
|
)
|
46,393
|
111,229
|
22,356
|
164,265
|
||||||||||||||
|
Net increase (decrease) in unrealized appreciation of investments
|
36,917
|
(75,744
|
)
|
(84,964
|
)
|
15,414
|
(108,377
|
)
|
||||||||||||
|
Net increase (decrease) in net assets from operations
|
19,721
|
(30,590
|
)
|
30,694
|
33,617
|
53,442
|
||||||||||||||
|
Net investment (loss) income per share
|
(0.10
|
)
|
(0.08
|
)
|
0.28
|
(0.26
|
)
|
(0.16
|
)
|
|||||||||||
|
Net increase (decrease) in net assets from operations per share
|
1.19
|
(2.38
|
)
|
(1.62
|
)
|
2.13
|
(0.68
|
)
|
||||||||||||
| 15. | SELECTED PER SHARE DATA AND RATIOS |
The following presents a summary of the selected per share data for the years ended March 31, 2012 through 2016 (in thousands except per share amounts):
|
Years Ended March 31
|
||||||||||||||||||||
|
Per Share Data
|
2016
|
2015
|
2014
|
2013
|
2012
|
|||||||||||||||
|
Investment income
|
$
|
.58
|
$
|
.64
|
$
|
.82
|
$
|
.71
|
$
|
.62
|
||||||||||
|
Operating expenses
|
(1.34
|
)
|
(.78
|
)
|
(.55
|
)
|
(.55
|
)
|
(.44
|
)
|
||||||||||
|
Income taxes
|
.08
|
(.02
|
)
|
.05
|
(.04
|
)
|
(.01
|
)
|
||||||||||||
|
Net investment (loss) income
|
(.68
|
)
|
(.16
|
)
|
.32
|
.12
|
.17
|
|||||||||||||
|
Distributions from undistributed net investment income
|
(.04
|
)
|
(.20
|
)
|
(.20
|
)
|
(.20
|
)
|
(.20
|
)
|
||||||||||
|
Net realized (loss) gain, net of tax incurred on deemed capital gain distributions
|
(.88
|
)
|
7.06
|
.66
|
5.81
|
.70
|
||||||||||||||
|
Dividends from capital gains
|
(.10
|
)
|
–
|
–
|
(5.07
|
)
|
–
|
|||||||||||||
|
Net increase (decrease) in unrealized appreciation of investments
|
1.02
|
(6.96
|
)
|
6.04
|
1.08
|
5.23
|
||||||||||||||
|
Distribution to CSWI
|
(1.75
|
)
|
–
|
–
|
–
|
–
|
||||||||||||||
|
Decrease in unrealized appreciation due to distributions to CSWI
|
(29.15
|
)
|
–
|
–
|
–
|
–
|
||||||||||||||
|
Exercise of employee stock options
1
|
.03
|
(.04
|
)
|
(.18
|
)
|
(.24
|
)
|
–
|
||||||||||||
|
Forfeiture/ (Issuance) of restricted stock
2
|
(.49
|
)
|
(.40
|
)
|
–
|
(.10
|
)
|
–
|
||||||||||||
|
Share based compensation expense
|
.08
|
.07
|
(.04
|
)
|
.03
|
.07
|
||||||||||||||
|
Net change in pension plan funded status
|
–
|
(.05
|
)
|
.08
|
.01
|
(.03
|
)
|
|||||||||||||
|
Increase (decrease) in net asset value
|
(31.96
|
)
|
(.68
|
)
|
6.68
|
1.44
|
5.94
|
|||||||||||||
|
Net asset value
|
||||||||||||||||||||
|
Beginning of year
|
49.30
|
49.98
|
43.30
|
41.86
|
35.92
|
|||||||||||||||
|
End of year
|
$
|
17.34
|
$
|
49.30
|
$
|
49.98
|
$
|
43.30
|
$
|
41.86
|
||||||||||
|
Ratios and Supplemental Data
|
||||||||||||||||||||
|
Ratio of operating expenses to average net assets
|
4.48
|
%
|
1.59
|
%
|
1.18
|
%
|
1.36
|
%
|
1.07
|
%
|
||||||||||
|
Ratio of net investment income to average net assets
|
(2.27
|
%)
|
(.32
|
%)
|
.68
|
%
|
.31
|
%
|
.41
|
%
|
||||||||||
|
Total investment return
3
|
(20.7
|
%)
|
8.4
|
%
|
16.9
|
%
|
27.0
|
%
|
18.1
|
%
|
||||||||||
|
Total return based on change in NAV
4
|
(2.2
|
%)
|
(1.0
|
%)
|
15.9
|
%
|
16.0
|
%
|
17.1
|
%
|
||||||||||
|
Weighted-average fully diluted shares outstanding
|
15,724
|
15,531
|
15,298
|
15,207
|
15,038
|
|||||||||||||||
|
Common shares outstanding at end of period
|
15,726
|
15,565
|
15,414
|
15,236
|
15,020
|
|||||||||||||||
|
1
|
Net decrease is due to the exercise of employee stock options at prices less than beginning of period net asset value.
|
|
2
|
Reflects impact of the different share amounts as a result of issuance or forfeiture of restricted stock during the period.
|
|
3
|
Total investment return based on purchase of stock at the current market price on the first day and a sale at the current market price on the last day of each period reported on the table and assumes reinvestment of dividends at prices obtained by CSWC’s dividend reinvestment plan during the period. The return does not reflect any sales load that may be paid by an investor.
|
|
4
|
Total return based on change in net asset value was calculated using the sum of ending net asset value plus dividends to shareholders and other non-operating changes during the period, as divided by the beginning net asset value.
|
| 16. | SIGNIFICANT SUBSIDIARY |
Media Recovery, Inc.
Media Recovery, Inc. (MRI), through its subsidiary ShockWatch, provides solutions that currently enable over 3,000 customers and some 200 partners in 62 countries to detect mishandling that causes product damage and spoilage during transport and storage. The ShockWatch product portfolio includes impact, tilt, temperature, vibration, and humidity detection systems and is widely used in the energy, transportation, aerospace, defense, food, pharmaceutical, medical device, consumer goods and manufacturing sectors. MRI completed the divestiture of DataSpan, Inc., a leading data storage, products, and management provider, to DataSpan Holdings in September 2014, and continued to provide post-closing services to DataSpan Holdings under a transition services agreement (“TSA”) through June 27, 2015. Our valuation is based primarily on adjusted EBITDA, which reflects certain adjustments to the reported EBITDA, including nonrecurring expenses associated with fulfilling the obligations under the TSA, write off of obsolete inventory, executive severance and recruiting costs.
At March 31, 2016, the fair value of Media Recovery, Inc. represented 11.3% of our total assets. Below is certain selected key financial data from its Balance Sheet at March 31, 2016 and the twelve months ended March 31, 2016 Income Statement.
|
March 31, 2016
|
||||
|
Current Assets
|
$
|
11,242,247
|
||
|
Non-Current Assets
|
23,643,815
|
|||
|
Current Liabilities
|
1,996,523
|
|||
|
Non-Current Liabilities
|
$
|
2,239,678
|
||
|
Twelve months ended 3/31/2016
|
||||
|
Revenue
|
$
|
20,764,570
|
||
|
Income from continuing operations
|
591,072
|
|
||
|
Net Income
|
471,762
|
|
||
I-45 SLF, LLC
In September 2015, we entered into an LLC agreement with Main Street to form I-45 SLF LLC (“I-45 SLF”). I-45 SLF began investing in syndicated senior secured loans in the upper middle market during the quarter ended December 31, 2015. The initial equity capital commitment to I-45 SLF totaled $85 million, consisting of $68 million from us and $17 million from Main Street. We own 80.0% of I-45 SLF and have a profits interest of 75.6%, while Main Street owns 20.0% and has a profits interest of 24.4%. I-45 SLF’s Board of Managers make all investment and operational decisions for the fund, and consist of equal representation from CSWC and Main Street.
As of March 31, 2016, I-45 SLF had total assets of $102.9 million. I-45 SLF currently has approximately $99.2 million of credit investments at fair value as of March 31, 2016. The portfolio companies in I-45 SLF are in industries similar to those in which we may invest directly. As of March 31, 2016, approximately $8.0 million were unsettled trades. For the year ended March 31, 2016, I-45 SLF declared total dividends of $1,775,474 million $264,600 was paid out to CSWC in January 2016 and $1,077,658 was paid out in April 2016.
Additionally, I-45 SLF closed on a $75 million 5-year senior secured credit facility with Deutsche Bank AG (“Deutsche Bank facility”). This facility includes an accordion feature which will allow I-45 to achieve leverage of up to 2x debt-to-equity. Borrowings under the facility are secured by all of the assets of I-45 SLF and bear interest at a rate equal to plus 2.5% per annum. Under the Deutsche Bank facility, $48 million has been drawn as of March 31, 2016. In April 2016, I-45 SLF increased debt commitments outstanding by $25 million within the credit facility by adding another lender to the syndicate, bringing total debt commitments to $100 million.
As of March 31, 2016, I-45 SLF had total equity commitments of $85 million, $68 million of which was from us and the remaining $17 million from Main Street. Approximately $46 million was funded as of March 31, 2016, relating to these commitments, of which $36.8 million was from CSWC.
Below is a summary of I-45 SLF’s portfolio, followed by a listing of the individual loans in I-45 SLF’s portfolio as of March 31, 2016:
|
Portfolio
Company
|
Industry
|
Investment
Type
|
Maturity
Date
|
Current
Interest
Rate
1,3
|
Principal
|
Cost
|
Fair Value
2
|
|
Ahead, LLC
|
Business services
|
First Lien
|
11/2/2020
|
L+ 6.50%
|
$4,937,500
|
4,800,794
|
4,814,063
|
|
ATX Networks
Corp.
|
Technology products & components
|
First Lien
|
6/12/2021
|
L+6.00%
(Floor 1.00%)
|
4,974,937
|
4,915,874
|
4,925,188
|
|
BDF Acquisition
Corp.
|
Consumer products & retail
|
Second Lien
|
2/12/2022
|
L+8.00%
(Floor 1.00%)
|
3,000,000
|
2,859,650
|
2,895,000
|
|
Compuware
Corporation
|
Software & IT services
|
First Lien
|
12/15/2019
|
L+5.25%
(Floor 1.00%)
|
2,922,078
|
2,854,681
|
2,829,857
|
|
CRGT
|
Aerospace & defense
|
First Lien
|
12/19/2020
|
L+6.50%
(Floor 1.00%)
|
3,923,567
|
3,918,804
|
3,913,758
|
|
Digital River
|
Software & IT services
|
First Lien
|
2/12/2021
|
L+6.50%
(Floor 1.00%)
|
5,415,452
|
5,383,375
|
5,408,683
|
|
Hunter Defense
Technologies
|
Aerospace & Defense
|
First Lien
|
8/5/2019
|
L+5.50%
(Floor 1.00%)
|
2,960,526
|
2,950,002
|
2,442,434
|
|
ICSH, Inc.
|
Containers & packaging
|
First Lien
|
12/31/2018
|
L+5.75%
(Floor 1.00%)
|
4,974,243
|
4,953,875
|
4,941,503
|
|
Imagine!
Print Solutions
|
Media, marketing & entertainment
|
First Lien
|
3/30/2022
|
L+6.00%
(Floor 1.00%)
|
3,000,000
|
2,947,500
|
3,011,250
|
|
Integro Parent Inc.
|
Business services
|
First Lien
|
11/2/2022
|
L+5.75%
(Floor 1.00%)
|
4,988,287
|
4,821,625
|
4,813,697
|
|
iPayment, Inc.
|
Financial services
|
First Lien
|
5/8/2017
|
L+5.25%
(Floor 1.50%)
|
5,000,000
|
4,904,057
|
4,778,150
|
|
Jet Support Services,
Inc.
|
Aerospace & Defense
|
First Lien
|
8/31/2021
|
L+6.50%
(Floor 1.00%)
|
4,875,000
|
4,768,698
|
4,631,250
|
|
Kendra Scott
|
Consumer products & retail
|
First Lien
|
7/17/2020
|
L+6.00%
(Floor 1.00%)
|
4,899,684
|
4,892,037
|
4,887,434
|
|
LTI Holdings, Inc.
|
Industrial products
|
First Lien
|
4/17/2022
|
L+4.25%
(Floor 1.00%)
|
1,994,975
|
1,760,565
|
1,890,239
|
|
MediMedia USA
|
Healthcare services
|
First Lien
|
11/20/2018
|
L+6.75%
(Floor 1.25%)
|
5,000,000
|
4,876,157
|
4,887,500
|
|
Milk Specialties
|
Food, agriculture & beverage
|
First Lien
|
11/9/2018
|
L+7.00%
(Floor 1.25%)
|
3,686,288
|
3,681,983
|
3,693,200
|
|
Mood Media Corporation
|
Media, marketing & entertainment
|
First Lien
|
5/1/2019
|
L+6.00%
(Floor 1.00%)
|
4,549,714
|
4,435,393
|
4,260,375
|
|
New Media Holdings II LLC
|
Media, marketing & entertainment
|
First Lien
|
6/4/2020
|
L+6.25%
(Floor 1.00%)
|
4,962,311
|
4,951,057
|
4,853,785
|
|
Prepaid Legal Services, Inc.
|
Consumer services
|
First Lien
|
7/1/2019
|
L+5.25%
(Floor 1.25%)
|
4,824,760
|
4,819,070
|
4,812,698
|
|
Second Lien
|
7/1/2020
|
L+9.00%
(Floor 1.25%)
|
405,000
|
392,850
|
400,950
|
||
|
Stardust Finance Holdings, Inc.
|
Buildings & infrastructure products
|
First Lien
|
3/13/2022
|
L+5.50%
(Floor 1.00%)
|
4,974,874
|
4,928,459
|
4,937,563
|
|
TaxACT
|
Financial services
|
First Lien
|
12/31/2022
|
L+6.00%
(Floor 1.00%)
|
4,500,000
|
4,369,102
|
4,432,500
|
|
US Joiner (IMECO and RAACI)
|
Transportation & logistics
|
First Lien
|
4/16/2020
|
L+6.00%
(Floor 1.00%)
|
2,992,366
|
2,940,000
|
2,947,481
|
|
Vivid Seats
|
Media, marketing & entertainment
|
First Lien
|
3/1/2022
|
L+6.00%
(Floor 1.00%)
|
5,000,000
|
4,653,688
|
4,737,500
|
|
Water Pik, Inc.
|
Consumer products & retail
|
First Lien
|
7/9/2020
|
L+4.75%
(Floor 1.00%)
|
1,191,287
|
1,188,560
|
1,179,868
|
|
Second Lien
|
1/9/2021
|
L+8.75%
(Floor 1.00%)
|
1,912,281
|
1,867,957
|
1,888,377
|
||
|
Total Investments
|
$99,835,813
|
$99,214,303
|
| 1 | Represents the interest rate as of March 31, 2016. All interest rates are payable in cash, unless otherwise noted. |
| 2 | Represents the fair value determined utilizing a similar process as the Company in accordance with ASC 820. However, the fair value is determined by the Board of Managers of the Joint Venture. It is not included in the Company’s Board of Directors’ valuation process described elsewhere herein. |
| 3 | The majority of investments bear interest at a rate that may be determined by reference to London Interbank Offered Rate (“LIBOR” or “L”) or Prime (“Prime”) which reset daily, monthly, quarterly, or semiannually. For each the Company has provided the spread over LIBOR or Prime and the current contractual interest rate in effect at March 31, 2016. Certain investments are subject to a LIBOR or Prime interest rate floor. |
Below is certain summarized financial information for I-45 SLF, LLC as of March 31, 2016 and for the period from Inception through March 31, 2016 (amounts in thousands):
|
As of March 31,
2016
|
||||
|
Selected Balance Sheet Information:
|
||||
|
Investments, at fair value (cost $99,836)
|
$
|
99,214
|
||
|
Cash and cash equivalents
|
2,181
|
|||
|
Deferred financing costs
|
1,060
|
|||
|
Interest receivable
|
436
|
|||
|
Total assets
|
$
|
102,891
|
||
|
Senior credit facility payable
|
$
|
48,000
|
||
|
Payable for unsettled transactions
|
8,040
|
|||
|
Other liabilities
|
1,494
|
|||
|
Total liabilities
|
$
|
57,534
|
||
|
Members’ equity
|
45,357
|
|||
|
Total liabilities and net assets
|
$
|
102,891
|
||
|
Period from
Inception through
March 31, 2016
|
||||
|
Selected Statement of Operations Information:
|
||||
|
Total revenues
|
$
|
2,401
|
||
|
Total expenses
|
(689
|
)
|
||
|
Net investment income
|
1,712
|
|||
|
Net unrealized depreciation
|
(621
|
)
|
||
|
Net realized gains
|
42
|
|||
|
Net increase in members’ equity resulting from operations
|
$
|
1,133
|
||
|
17.
|
RELATED PARTY TRANSACTIONS
|
As a BDC, we are obligated under the 1940 Act to make available to certain of our portfolio companies significant managerial assistance. “Making available significant managerial assistance” refers to any arrangement whereby we provide significant guidance and counsel concerning the management, operations, or business objectives and policies of a portfolio company. We are also deemed to be providing managerial assistance to all portfolio companies that we control, either by ourselves or in conjunction with others. The nature and extent of significant managerial assistance provided by us will vary according to the particular needs of each portfolio company. During the years ended March 31, 2016 and 2015, we received management and others fees from certain of our portfolio companies totaling $0.7 million and $0.6 million, respectively, which were recognized as fees and others income on the Consolidated Statements of Operations.
| 18. | SUBSEQUENT EVENTS |
On April 1, 2016, CSWC paid dividends declared on March 1, 2016 in the amount of $625,415, or $0.04 per share.
In April 2016, we exited our investment in Freedom Truck Finance. We received principal and accrued interest payments totaling $6,030,357.
On June 7, 2016, we announced our Board of Directors had declared a
$0.06 dividend per share for the quarter ended for June 30, 2016. The record date for the dividend is June 20, 2016. The payment date for the dividend is July 1, 2016.
SCHEDULE 12-14
Schedule of Investments in and Advances to Affiliates
(In thousands)
|
Portfolio Company/
Type of Investment (1)
|
Amount of
Interest, Fees
or Dividends
Credited in
Income (2)
|
Fair Value
at March
31, 2015
|
Gross
Additions
(3)
|
Gross
Reductions (4)
|
Fair Value
at March 31,
2016
|
|||||||||||||||
|
Control Investments
|
||||||||||||||||||||
|
The RectorSeal Corporation
27,907 shares common stock
|
$
|
420
|
$
|
358,200
|
$
|
−
|
$
|
(358,200
|
)
|
$
|
−
|
|||||||||
|
The Whitmore Manufacturing Company
80 shares common stock
|
60
|
89,000
|
−
|
(89,000
|
)
|
−
|
||||||||||||||
|
I-45 SLF LLC
80% LLC equity interest
|
1,342
|
-
|
36,800
|
(463
|
)
|
36,337
|
||||||||||||||
|
Media Recovery, Inc.
800,000 shares Series A Convertible Preferred Stock, convertible into 800,000 shares common stock
|
641
|
4,300
|
457
|
−
|
4,757
|
|||||||||||||||
|
4,000,002 shares common stock
|
1,331
|
21,700
|
5,745
|
−
|
27,445
|
|||||||||||||||
|
Balco, Inc.
445,000 shares common stock; 60,920 shares Class B non-voting common
|
−
|
5,100
|
−
|
(5,100
|
)
|
−
|
||||||||||||||
|
CapStar Holdings Corporation
500 shares common stock
|
8,560
|
−
|
(8,560
|
)
|
−
|
|||||||||||||||
|
1,000,000 shares preferred stock
|
−
|
2,311
|
−
|
(2,311
|
)
|
−
|
||||||||||||||
|
Humac Company
1,041,000 shares of common stock
|
1
|
244
|
−
|
(244
|
)
|
−
|
||||||||||||||
|
Total Control Investments
|
$
|
3,795
|
$
|
489,415
|
$
|
43,002
|
$
|
(463,878
|
)
|
$
|
68,539
|
|||||||||
|
Portfolio Company /
Type of Investment (1)
|
Amount of
Interest, Fees
or Dividends
Credited in
Income (2)
|
Fair Value
at March 31, 2015
|
Gross
Additions (3)
|
Gross
Reductions (4)
|
Fair Value at
March 31,
2016
|
|||||||||||||||
|
Affiliated Investments
|
||||||||||||||||||||
|
Boxx Technologies, Inc.
3,125,354 shares Series B Convertible Preferred Stock, convertible into 3,125,354 shares of common stock at $0.50 per share
|
−
|
2,362
|
−
|
(2,362
|
)
|
−
|
||||||||||||||
|
Chandler Signs, LP
Senior secured debt
|
135
|
−
|
4,413
|
4,413
|
||||||||||||||||
|
1,500,000 units of Class A-1 common stock
|
−
|
−
|
2,529
|
−
|
2,529
|
|||||||||||||||
|
kSEP Holdings, Inc.
861,591 shares of common stock
|
−
|
1,863
|
1,813
|
3,676
|
||||||||||||||||
|
Wellogix, Inc.
4,788,371 shares Series A-1 Convertible Preferred Stock, convertible into 4,788,371 shares of common stock at $1.0441 per share
|
-
|
4,120
|
−
|
(4,120
|
)
|
−
|
||||||||||||||
|
Total Affiliated Investments
|
$
|
135
|
$
|
8,345
|
$
|
8,755
|
$
|
(6,482
|
)
|
$
|
10,618
|
|||||||||
|
Total Control & Affiliated Investments
|
$
|
3,930
|
$
|
497,760
|
$
|
51,757
|
$
|
(470,360
|
)
|
$
|
79,157
|
|||||||||
This schedule should be read in conjunction with our Consolidated Financial Statements, including the Consolidated Schedules of Investments and Notes to Consolidated Financial Statements.
| (1) | The principal amount and ownership detail as shown in the Consolidated Schedules of Investments. |
| (2) | Represents the total amount of interest, fees and dividends, credited to income for the portion of the year an investment was included in the Control or Affiliate categories, respectively. |
| (3) | Gross additions include increases in the cost basis of investments resulting from new portfolio investments, follow-on investments and accrued PIK interest, and the exchange of one or more existing securities for one or more new securities. Gross additions also include net increases in unrealized appreciation or net decreases in unrealized depreciation as well as movement of an existing portfolio company into this category and out of a different category. |
| (4) | Gross reductions include in decreases in the cost basis of investments resulting from principal repayments or sales and exchanges of one or more existing securities for one or more new securities. Gross reductions also include net increases in unrealized depreciation or net decreases in unrealized appreciation as well as the movement of an existing portfolio company out of this category and into a different category. |
None.
| Item 9A. | Controls and Procedures |
| (a) | Evaluation of Disclosure Controls and Procedures |
Capital Southwest Corporation (the “Company”) maintains disclosure controls and procedures, as defined in Rules 13a-15(e) and 15d-15(e) of the Securities Exchange Act of 1934, as amended (the “Exchange Act”), that are designed to provide reasonable assurance that information required to be disclosed in the Company’s filings and submissions under the Exchange Act is recorded, processed, summarized and reported within the periods specified in the rules and forms of the Securities and Exchange Commission (“SEC”) and that such information is accumulated and communicated to the Company’s management, including the Chief Executive Officer and Chief Financial Officer of the Company, as appropriate, to allow timely discussions regarding the required disclosure.
We completed an evaluation under the supervision and with participation of the Company’s management, including the Chief Executive Officer and Chief Financial Officer of the Company, of the effectiveness of the design and operation of the Company’s disclosure controls and procedures as of March 31, 2016. Based upon this evaluation, the Chief Executive Officer and Chief Financial Officer of the Company have concluded that as of March 31, 2016, our disclosure controls and procedures were effective to provide the reasonable assurance described above. The Company notes that the design of any system of controls is based in part upon certain assumptions about the likelihood of future events, and there can be no assurance that any design will succeed in achieving the stated goals under all potential future conditions.
| (b) | Management’s Report on Internal Control over Financial Reporting |
Management of the Company is responsible for establishing and maintaining adequate internal control over financial reporting, as defined in Exchange Act Rules 13a-15(f). Under the supervision and with the participation of management, including the Chief Executive Officer and Chief Financial Officer, the Company conducted an evaluation of the effectiveness of the Company's internal control over financial reporting based on the criteria established in the 2013 Internal Control — Integrated Framework issued by the Committee of Sponsoring Organizations of the Treadway Commission (COSO). Based on the Company’s evaluation under the framework in the 2013 Internal Control — Integrated Framework, management concluded that the Company’s internal control over financial reporting was effective as of March 31, 2016. Grant Thornton, LLP, the Company’s independent registered public accounting firm, has audited the effectiveness of the Company’s internal control over financial reporting as of March 31, 2016, as stated in its report which is included herein.
| (c) | Changes in Internal Control over Financial Reporting |
The Company underwent changes in key personnel beginning in the second quarter of its 2016 fiscal year. More specifically, the Company hired a new Chief Financial Officer, Treasurer and Assistant Controller. The Company underwent changes in controls beginning in the third quarter of its 2016 fiscal year. These personnel additions and changes in controls (1) enhanced the review process of the cash flow statement based on the technical expertise of the new employees, including enhancements to the Chief Financial Officer’s review, (2) allowed the Company to incorporate additional segregation of duties into the review process, and (3) added a new and incremental control including the Treasurer’s review of the internal recording and public filing of the cash flow statement for accuracy and for reasonableness. All of these internal control modifications began in the third quarter of fiscal year 2016. Through execution of these controls in the third and fourth quarters of fiscal year 2016, management identified that the cash flows for taxes incurred on deemed capital gain distributions were incorrectly included as operating cash flows in our previously issued financial statements. Based on the determination that the Company had not properly classified cash outflows for taxes incurred on deemed capital gain distributions for fiscal years 2014 and 2015 in the statement of cash flows, management determined that a material weakness in internal control existed through September 30, 2015 related to the preparation and review of the statement of cash flows, specifically relating to determining the proper classification of cash receipts and cash payments in the statement of cash flows. As a result of the enhanced controls implemented in the third and fourth fiscal quarters, management believes that the material weakness was remediated as of March 31, 2016. As described above, the Company concluded that its internal control over financial reporting was effective as of March 31, 2016 based, in part, on the effectiveness of the changed and new controls.
Other than changes that have been described above, there have been no changes in the Company’s internal control over financial reporting (as defined in Rule 13(a)-15(f) of the Exchange Act) during the three months ended March 31, 2016 that have materially affected, or are reasonably likely to materially affect, our internal controls over financial reporting.
| (d) | Limitations on Controls |
Because of its inherent limitations, management does not expect that our disclosure controls and our internal controls over financial reporting will prevent or detect all misstatements. Also, projections of any evaluation of effectiveness to future periods are subject to the risk that controls may become inadequate because of changes in conditions or that the degree of compliance with policies and procedures may deteriorate. Any control system, no matter how well designed and operated, is based upon certain assumptions and can only provide reasonable, not absolute, assurance that its objectives will be met. Further, no evaluation of controls can provide absolute assurance that misstatements due to errors or fraud will not occur or that all control issues and instances of fraud, if any within the Company, have been detected.
None.
PART III
The information required by this Item 10 will be contained in the definitive proxy statement relating to our 2016 annual meeting of shareholders under the headings of “Election of Directors,” “Corporate Governance,” “Executive Officers” and “Section 16(a) Beneficial Ownership Reporting Compliance” to be filed with the Securities and Exchange Commission on or before July 29, 2016, and is incorporated herein by reference.
We have adopted a code of ethics pursuant to Rule 17j-1 under the 1940 Act that applies to all our directors, officers and employees. We have made the Code of Conduct and of Ethics available on our website at http://www.capitalsouthwest.com/governance. Shareholders may request a free copy of the Code of Conduct and Code of Ethics from: Michael Sarner, Corporate Secretary and Chief Compliance Officer, at our principal executive office.
The information required by this Item 11 will be contained in the definitive proxy statement relating to our 2016 annual meeting of shareholders under the headings of “Compensation of Executive Officers,” “Director Compensation,” “Compensation Discussion and Analysis” and “Compensation Committee Report” to be filed with the Securities and Exchange Commission on or before July 29, 2016, and is incorporated herein by reference.
| Item 12. | Security Ownership of Certain Beneficial Owners and Management and Related Shareholder Matters |
The information in the sections of our 2016 Proxy Statement captioned “Stock Ownership of Certain Beneficial Owners” is incorporated in this Item 12 by reference.
The table below sets forth certain information as of March 31, 2016 regarding the shares of our common stock available for grant or granted under stock option plans that (1) were approved by our shareholders, and (2) were not approved by our shareholders.
|
Plan Category
|
Number of
Securities to be
Issued Upon
Exercise of
Outstanding
Options, Warrants
and Rights
|
Weighted-
Average Exercise
Price of
Outstanding
Options, Warrants
and Rights
|
Number of
Securities
Remaining
Available for
Future Issuance
Under Equity
Compensation
Plans
|
|||||||||
|
Equity compensation plans approved by shareholders (1)
|
362,513
|
$
|
11.21
|
348,540
|
||||||||
|
Equity compensation plans not approved by shareholders (2)
|
−
|
−
|
−
|
|||||||||
|
Total
|
362,513
|
$
|
11.21
|
348,540
|
||||||||
| 1) | Includes the 1999 Stock Option Plan, 2009 Stock Incentive Plan and 2010 Restricted Stock Award Plan. For a description of all plans, please refer to Footnotes 8 and 9 contained in our consolidated financial statements. |
| 2) | We have no equity compensation plans that were not approved by shareholders. |
Other information required by this Item 12 will be contained in the definitive proxy statement relating to our 2016 annual meeting of shareholders under the heading of “Security Ownership of Certain Beneficial Owners and Management” to be filed with the Securities and Exchange Commission on or before July 29, 2016, and is incorporated herein by reference.
The information required by this Item 13 will be contained in the definitive proxy statement relating to our 2016 annual meeting of shareholders under the headings of “Certain Relationships and Related Transactions” and “Corporate Governance” to be filed with the Securities and Exchange Commission on or before July 29, 2016, and is incorporated herein by reference.
The information required by this Item 14 will be contained in the definitive proxy statement relating to our 2016 annual meeting of shareholders under the heading of “Ratification and Appointment of Independent Registered Public Accounting Firm for the Year Ended March 31, 2016” to be filed with the Securities and Exchange Commission on or before July 29, 2016, and is incorporated herein by reference.
PART IV
The following documents are filed or incorporated by reference as part of this Annual Report:
| 1. | Consolidated Financial Statements |
|
Page
|
|
|
Reports of Independent Registered Public Accounting Firm
|
51
|
|
Consolidated Statements of Assets and Liabilities as of March 31, 2016 and 2015
|
53
|
|
Consolidated Statements of Operations for Years Ended March 31, 2016, 2015 and 2014
|
54
|
|
Consolidated Statements of Changes in Net Assets for Years Ended March 31, 2016, 2015 and 2014
|
55
|
|
Consolidated Statements of Cash Flows for Years Ended March 31, 2016, 2015 and 2014
|
56
|
|
Consolidated Schedules of Investments as of March 31, 2016 and 2015
|
58
|
|
Notes to Consolidated Financial Statements
|
64
|
|
2.
|
Schedule of Investments in and Advances To Affiliates
|
Reports of Independent Registered Public Accounting Firm
|
3.
|
Exhibits
|
A list of the exhibits required to be filed or furnished as part of this Annual Report on Form 10-K is set forth in the Exhibit Index, which immediately precedes such exhibits, and is incorporated herein by reference.
Pursuant to the requirements of Section 13 or 15(d) of the Securities Exchange Act of 1934, the Registrant has duly caused this report to be signed on its behalf by the undersigned, thereunto duly authorized.
|
CAPITAL SOUTHWEST CORPORATION
|
|||
|
By:
|
/s/ Bowen S. Diehl
|
||
|
Bowen S. Diehl
|
|||
|
President and Chief Executive Officer
|
|||
|
Date: June 14, 2016
|
|||
POWER OF ATTORNEY
KNOW ALL MEN BY THESE PRESENTS that each of Capital Southwest Corporation and its Subsidiaries undersigned directors hereby constitutes and appoints Bowen S. Diehl, its or his true and lawful attorney-in-fact and agent, for it or him and in its or his name, place and stead, in any and all capacities, with full power to act alone, to sign any and all amendments to this Report, and to file each such amendment to the Report, with all exhibits thereto, and any and all other documents in connection therewith, with the Securities and Exchange Commission, hereby granting unto said attorney-in-fact and agent full power and authority to do and perform any and all acts and things requisite and necessary to be done in and about the premises as fully to all intents and purposes as it or he might or could do in person, hereby ratifying and confirming all that said attorney-in-fact and agent may lawfully do or cause to be done by virtue hereof.
Pursuant to the requirement of the Securities and Exchange Act of 1934, this report has been signed below by the following persons on behalf of the Registrant and in the capacities and on the dates indicated:
|
Signature
|
Title
|
Date
|
|
/s/ Joseph B. Armes
|
Chairman of the Board
|
June 14, 2016
|
|
Joseph B. Armes
|
||
|
/s/ David R. Brooks
|
Director
|
June 14, 2016
|
|
David R. Brooks
|
||
|
/s/ Jack D. Furst
|
Director
|
June 14, 2016
|
|
Jack D. Furst
|
||
|
/s/ T. Duane Morgan
|
Director
|
June 14, 2016
|
|
T. Duane Morgan
|
||
|
/s/ William Thomas III
|
Director
|
June 14, 2016
|
|
William Thomas III
|
||
|
/s/ John H. Wilson
|
Director
|
June 14, 2016
|
|
John H. Wilson
|
||
|
/s/ Bowen S. Diehl
|
President and Chief Executive Officer
|
June 14, 2016
|
|
Bowen S. Diehl
|
||
|
/s/ Michael S. Sarner
|
Chief Financial Officer
|
June 14, 2016
|
|
Michael S. Sarner
|
(Chief Financial/Accounting Officer)
|
EXHIBIT INDEX
The following exhibits are filed as part of this report or hereby incorporated by reference to exhibits previously filed with the SEC. Asterisk denotes exhibits filed with this report. Double asterisk denotes exhibits furnished with this report.
|
Exhibit No.
|
Description
|
|
2.1
|
Distribution Agreement, dated September 8, 2015, between the Company and CSW Industrials, Inc. (filed as Exhibit 2.1 to Form 8-K dated September 14, 2015).
|
|
3.1(a)
|
Articles of Incorporation and Articles of Amendment to Articles of Incorporation, dated June 25, 1969 (filed as Exhibit 1(a) and 1(b) to Amendment No. 3 to Form N-2 for the fiscal year ended March 31, 1979).
|
|
3.1(b)
|
Articles of Amendment to Articles of Incorporation, dated July 20, 1987 (filed as an exhibit to Form N-SAR for the six month period ended September 30, 1987).
|
|
3.2
|
By-Laws of the Company, as amended (filed as Exhibit 3.2 to Form 10-K for the fiscal year ended March 31, 2007).
|
|
4.1
|
Specimen of Common Stock certificate (filed as Exhibit 4.1 to Form 10-K for the fiscal year ended March 31, 2002).
|
|
10.3
|
Capital Southwest Corporation and Its Affiliates Restoration of Retirement Income Plan as amended and restated effective January 1, 2008 (filed as Exhibit 10.3 to form 10-K for the fiscal year ended March 31, 2009).
|
|
10.6
|
Form of Indemnification Agreement which has been established with all directors and executive officers of the Company (filed as Exhibit 10.9 to Form 8-K dated February 10, 1994).
|
|
10.7
|
Capital Southwest Corporation 1999 Stock Option Plan (filed as Exhibit 10.10 to Form 10-K for the fiscal year ended March 31, 2000).
|
|
10.8
|
Severance Pay Agreement with William M. Ashbaugh (filed as Exhibit 10.1 to Form 8-K dated July 18, 2005).
|
|
10.15
|
Retirement Plan for Employees of Capital Southwest Corporation and its Affiliates as amended and restated effective April 1, 2011 (filed as Exhibit 10.15 to Form 10-K for the fiscal year ended March 31, 2012)
|
|
10.16
|
Amendment One to Retirement Plan for employees of Capital Southwest Corporation and its affiliates as amended and restated effective April 1, 2011(filed as Exhibit 10.16 to Form 10-K for the fiscal year ended March 31, 2013)
|
|
10.17
|
Amendment Four to Retirement Plan for employees of Capital Southwest Corporation and its Affiliates as amended and restated effective April 1, 2011 (filed as Exhibit 10.1 to Form 8-K dated August 6, 2015).
|
|
10.18
|
Joseph B. Armes Revised Offer Letter (filed as Exhibit 99.2 to Form 8-K dated May 17, 2013).
|
|
10.19
|
Capital Southwest Corporation 2009 Stock Incentive Plan (filed as Exhibit 10.1 to Form 10-Q for the quarterly period ended June 30, 2011)
|
|
10.20
|
Capital Southwest Corporation 2010 Restricted Stock Award Plan (filed as Exhibit 10.1 to Form 10-Q for the quarterly period ended June 30, 2011)
|
|
Exhibit No.
|
Description
|
|
10.21
|
First Amendment to the Capital Southwest Corporation 2009 Stock Incentive Plan (filed as Exhibit 10.1 to Form 10-Q for the quarterly period ended September 30, 2014)
|
|
10.22
|
Second Amendment to the Capital Southwest Corporation 2009 Stock Incentive Plan (filed as Exhibit 10.1 to Form 8-K dated August 12, 2015).
|
|
10.23
|
First Amendment to the Capital Southwest Corporation 2010 Restricted Stock Award Plan (filed as Exhibit 10.1 to Form 10-Q for the quarterly period ended September 30, 2014)
|
|
10.24
|
Second Amendment to the Capital Southwest Corporation 2010 Restricted Stock Award Plan (filed as Exhibit 10.2 to Form 8-K dated August 12, 2015).
|
|
10.25
|
Form of Restricted Stock Award Agreement under the 2010 Restricted Stock Award Plan, as amended (filed as Exhibit 10.1 to Form 10-Q for the quarterly period ended September 30, 2014)
|
|
10.26
|
Form of Non-Qualified Stock Option Agreement under the 2009 Stock Incentive Plan, as amended (filed as Exhibit 10.1 to Form 10-Q for the quarterly period ended September 30, 2014)
|
|
10.27
|
Form of Cash Incentive Award Agreement (filed as Exhibit 10.1 to Form 10-Q for the quarterly period ended September 30, 2014)
|
|
10.28
|
Tax Matters Agreement, dated September 8, 2015, between the Company and CSW Industrials, Inc. (filed as Exhibit 10.1 to Form 8-K dated September 14, 2015).
|
|
10.29
|
Amended and Restated Employee Matters Agreement, dated September 4, 2015, between the Company and CSW Industrials, Inc. (filed as Exhibit 10.2 to Form 8-K dated September 14, 2015).
|
|
10.30
|
Form of Amended and Restated Non-Qualified Stock Option Agreement under the 2009 Stock Incentive Plan (CSWC Employee Form) (filed as Exhibit 10.3 to Form 10-Q for the quarterly period ended September 30, 2015).
|
|
10.31
|
Form of Amended and Restated Non-Qualified Stock Option Agreement under the 2009 Stock Incentive Plan (CSWI Employee Form) (filed as Exhibit 10.4 to Form 10-Q for the quarterly period ended September 30, 2015).
|
|
10.32
|
Form of Amended and Restated Incentive Stock Option Agreement under the 2009 Stock Incentive Plan (CSWC Employee Form) (filed as Exhibit 10.5 to Form 10-Q for the quarterly period ended September 30, 2015).
|
|
10.33
|
Form of Amended and Restated Incentive Stock Option Agreement under the 2009 Stock Incentive Plan (CSWI Employee Form) (filed as Exhibit 10.6 to Form 10-Q for the quarterly period ended September 30, 2015).
|
|
10.34
|
Form of Amended and Restated Non-Qualified Stock Option Agreement (Executive Compensation Plan – CSWC Employee Form) (filed as Exhibit 10.7 to Form 10-Q for the quarterly period ended September 30, 2015).
|
|
10.35
|
Form of Amended and Restated Non-Qualified Stock Option Agreement (Executive Compensation Plan – CSWI Employee Form) (filed as Exhibit 10.8 to Form 10-Q for the quarterly period ended September 30, 2015).
|
|
10.36
|
Form of Restricted Stock Agreement under the 2010 Restricted Stock Award Plan (CSWC Employee Form) (filed as Exhibit 10.9 to Form 10-Q for the quarterly period ended September 30, 2015).
|
|
Exhibit No.
|
Description
|
|
10.37
|
Form of Amended and Restated Restricted Stock Agreement under the 2010 Restricted Stock Award Plan (CSWI Employee Form) (filed as Exhibit 10.10 to Form 10-Q for the quarterly period ended September 30, 2015).
|
|
10.38
|
Form of Amended and Restated Restricted Stock Award (Executive Compensation Plan – CSWC Employee Form) (filed as Exhibit 10.11 to Form 10-Q for the quarterly period ended September 30, 2015).
|
|
10.39
|
Form of Amended and Restated Restricted Stock Award (Executive Compensation Plan – CSWI Employee Form)
(filed as Exhibit 10.12 to Form 10-Q for the quarterly period ended September 30, 2015).
|
|
10.40
|
Form of Amended and Restated Cash Incentive Award Agreement (Executive Compensation Plan)
(filed as Exhibit 10.13 to Form 10-Q for the quarterly period ended September 30, 2015).
|
|
10.41
|
I-45 SLF LLC Agreement dated September 9, 2015
(filed as Exhibit 10.14 to Form 10-Q for the quarterly period ended September 30, 2015).
|
|
List of subsidiaries of the Company.
|
|
|
Consent of Independent Registered Public Accounting Firm – Grant Thornton LLP.
|
|
|
Certification of Chairman of the Board and President required by Rule 13a-14(a) or Rule 15d-14(a) of the Securities Exchange Act of 1934, as amended (the “Exchange Act”), filed herewith.
|
|
|
Certification of Chief Financial Officer required by Rule 13a-14(a) or Rule 15d-14(a) of the Exchange Act, filed herewith.
|
|
|
Certification of Chairman of the Board and President required by Rule 13a-14(b) or Rule 15d-14(b) of the Exchange Act and Section 1350 of Chapter 63 of Title 18 of the United States Code, furnished herewith.
|
|
|
Certification of Chief Financial Officer required by Rule 13a-14(b) or Rule 15d-14(b) of the Exchange Act and Section 1350 of Chapter 63 of Title 18 of the United States Code, furnished herewith.
|
|
|
99.1
|
Audited Consolidated Financial Statements of Media Recovery, Inc. as of and for the years ended September 30, 2016 and 2015.
1
|
|
1
|
Media Recover, Inc. has a 2016 fiscal year to be ended September 30, 2016. These financial statements will be filed by amendment within 90 days of September 30, 2016.
|
105
TABLE OF CONTENTS
Part IItem 1. BusinessItem 1A. Risk FactorsItem 1B. Unresolved Staff CommentsItem 2. PropertiesItem 3. Legal ProceedingsItem 4. Mine Safety DisclosuresPart IIItem 5. Market For Registrant S Common Equity, Related Shareholder Matters and Issuer Purchases Of Equity SecuritiesItem 6. Selected Financial DataItem 7. Management S Discussion and Analysis Of Financial Condition and Results Of OperationsItem 7A. Quantitative and Qualitative Disclosures About Market RiskItem 8. Financial Statements and Supplementary DataItem 9. Changes in and Disagreements with Accountants on Accounting and Financial DisclosureItem 9A. Controls and ProceduresItem 9B. Other InformationPart IIIItem 10. Directors, Executive Officers and Corporate GovernanceItem 11. Executive CompensationItem 12. Security Ownership Of Certain Beneficial Owners and Management and Related Shareholder MattersItem 13. Certain Relationships and Related Transactions, and Director IndependenceItem 14. Principal Accountant Fees and ServicesPart IVItem 15. Exhibits and Financial Statement Schedules