CSX CORP
10-Ks and 10-Qs
|
|
|
|
|
|
|
|
|
|
|
|
|
|
|
|
|
|
|
|
|
|
|
|
|
|
|
|
|
|
|
|
|
|
|
|
|
|
|
|
|
|
|
|
|
|
|
|
|
|
|
|
|
|
|
|
UNITED STATES
SECURITIES AND EXCHANGE COMMISSION
WASHINGTON, D.C. 20549
FORM 10-K
(X) ANNUAL REPORT PURSUANT TO SECTION 13 OR 15(d) OF THE SECURITIES EXCHANGE ACT OF 1934
For the fiscal year ended
December 30, 2011
OR
( ) TRANSITION REPORT PURSUANT TO SECTION 13 OR 15(d) OF THE SECURITIES EXCHANGE ACT OF 1934
For the transition period from __________ to __________
|
Commission File Number 1-8022
|
||||
|
CSX CORPORATION
|
||||
|
(
Exact name of registrant as specified in its charter
)
|
||||
|
Virginia
|
|
62-1051971
|
||
|
(State or other jurisdiction of incorporation or organization)
|
|
(I.R.S. Employer Identification No.)
|
||
|
500 Water Street, 15th Floor, Jacksonville, FL
|
32202
|
(904) 359-3200
|
||
|
(Address of principal executive offices)
|
(Zip Code)
|
(Telephone number, including area code)
|
||
|
Securities registered pursuant to Section 12(b) of the Act:
|
||||
|
Title of each class
|
Name of exchange on which registered
|
|||
|
Common Stock, $1 Par Value
|
New York Stock Exchange
|
|||
Securities registered pursuant to Section 12(g) of the Act: None
Indicate by check mark if the registrant is a well-known seasoned issuer, as defined in Rule 405 of the Securities Act.
Yes (X) No ( )
Indicate by check mark if the registrant is not required to file reports pursuant to Section 13 or Section 15(d) of the Act.
Yes ( ) No (X)
Indicate by check mark whether the registrant (1) has filed all reports required to be filed by Section 13 or 15(d) of the Securities Exchange Act of 1934 during the preceding 12 months (or for such shorter period that the registrant was required to file such reports), and (2) has been subject to such filing requirements for the past 90 days.
Yes (X) No ( )
Indicate by check mark whether the registrant has submitted electronically and posted on its corporate Web site, if any, every Interactive Data File required to be submitted and posted pursuant to Rule 405 of Regulation S-T (§ 232.405 of this chapter) during the preceding 12 months (or for such shorter period that the registrant was required to submit and post such files).
Yes (X) No ( )
Indicate by check mark if disclosure of delinquent filers pursuant to Item 405 of Regulation S-K is not contained herein, and will not be contained, to the best of the registrant’s knowledge, in definitive proxy or information statements incorporated by reference in Part III of this Form 10-K or any amendment to this Form 10-K. (X)
Indicate by check mark whether the registrant is a large accelerated filer, an accelerated filer, a non-accelerated filer, or a smaller reporting company. (as defined in Exchange Act Rule 12b-2).
Large Accelerated Filer (X) Accelerated Filer ( ) Non-accelerated Filer ( ) Smaller reporting company ( )
Indicate by check mark whether the registrant is a shell company (as defined in Exchange Act Rule 12b-2).
Yes ( ) No (X)
On
July 1, 2011
(which is the last day of the second quarter and the required date to use), the aggregate market value of the Registrant’s voting stock held by non-affiliates was approximately
$26 billion
(based on the New York Stock Exchange closing price on such date).
There were
1,052,267,692
shares of Common Stock outstanding on
January 27, 2012
(the latest practicable date that is closest to the filing date).
DOCUMENTS INCORPORATED BY REFERENCE
Portions of the Registrant’s Definitive Proxy Statement (the “Proxy Statement”) to be filed no later than 120 days after the end of the fiscal year with respect to its annual meeting of shareholders scheduled to be held on
May 9, 2012
.
1
|
CSX CORPORATION
|
||||
|
FORM 10-K
|
||||
|
TABLE OF CONTENTS
|
||||
|
|
|
|
|
|
|
Item No.
|
|
Page
|
||
|
|
|
|
|
|
|
PART I
|
||||
|
1.
|
||||
|
|
||||
|
|
||||
|
2.
|
||||
|
3.
|
||||
|
4.
|
||||
|
|
||||
|
|
|
|
|
|
|
PART II
|
||||
|
5.
|
||||
|
6.
|
||||
|
7.
|
||||
|
|
|
|
||
|
|
|
|
||
|
|
|
|
||
|
|
|
|
||
|
|
|
|
||
|
|
|
|
||
|
|
|
|
||
|
|
|
|
||
|
7A.
|
||||
|
8.
|
||||
|
9.
|
||||
|
9A.
|
||||
|
9B.
|
||||
|
|
||||
|
PART III
|
||||
|
10.
|
||||
|
11.
|
||||
|
12.
|
||||
|
13.
|
||||
|
14.
|
||||
|
|
||||
|
PART IV
|
||||
|
15.
|
||||
|
|
|
|
|
|
2
Item 1. Business
CSX Corporation (“CSX”), and together with its subsidiaries (the “Company”), based in Jacksonville, Florida, is one of the nation's leading transportation suppliers. The Company provides rail-based transportation services including traditional rail service and the transport of intermodal containers and trailers.
CSX Transportation, Inc.
CSX’s principal operating subsidiary, CSX Transportation, Inc. (“CSXT”), provides an important link to the transportation supply chain through its approximately
21,000
route mile rail network, which serves major population centers in
23
states east of the Mississippi River, the District of Columbia and the Canadian provinces of Ontario and Quebec. It has access to over
70
ocean, river and lake port terminals along the Atlantic and Gulf Coasts, the Mississippi River, the Great Lakes and the St. Lawrence Seaway. The Company’s intermodal business links customers to railroads via trucks and terminals. CSXT also serves thousands of production and distribution facilities through track connections to approximately
240
short-line and regional railroads.
Lines of Business
During
2011
, CSXT’s transportation services generated
$11.7 billion
of revenue and served three primary lines of business:
|
•
|
The merchandise business shipped nearly
2.7 million
carloads and generated approximately
54%
of revenue and
41%
of volume in
2011
. The Company’s merchandise business is the most diverse market and transports aggregates (which includes crushed stone, sand and gravel), metal, phosphate, fertilizer, food, consumer (manufactured goods and appliances), agricultural, automotive, paper and chemical products.
|
|
•
|
The coal business shipped
1.5 million
carloads and accounted for nearly
32%
of revenue and
24%
of volume in
2011
. The Company transports utility, industrial and export coal to electricity-generating power plants, steel manufacturers, industrial plants and deep-water port facilities. Roughly
one of every three
tons of export coal and
nearly all
of the domestic coal that the Company transports is used for generating electricity.
|
|
•
|
The intermodal business accounted for approximately
12%
of revenue and
35%
of volume in
2011
. The intermodal line of business combines the superior economics of rail transportation with the short-haul flexibility of trucks and offers a competitive cost advantage over long-haul trucking. Through a network of more than
50
terminals, the intermodal business serves all major markets east of the Mississippi and transports mainly manufactured consumer goods in containers, providing customers with truck-like service for longer shipments.
|
Other revenue accounted for approximately
2%
of the Company’s total revenue in
2011
. This revenue category includes revenue from regional subsidiary railroads, demurrage, revenue for customer volume commitments not met, switching and other incidental charges. Revenue from regional railroads includes shipments by railroads that the Company does not directly operate. Demurrage represents charges assessed when freight cars are held beyond a specified period of time. Switching revenue is primarily generated when CSXT switches cars for a customer or another railroad.
3
Other Entities
In addition to CSXT, the Company’s subsidiaries include CSX Intermodal Terminals, Inc. (“CSX Intermodal Terminals”), Total Distribution Services, Inc. (“TDSI”), Transflo Terminal Services, Inc. (“Transflo”), CSX Technology, Inc. (“CSX Technology”) and other subsidiaries. CSX Intermodal Terminals owns and operates a system of intermodal terminals, predominantly in the eastern United States and also performs drayage services (the pickup and delivery of intermodal shipments) for certain CSXT customers and trucking dispatch operations. TDSI serves the automotive industry with distribution centers and storage locations. Transflo connects non-rail served customers to the many benefits of rail by transferring products from rail to trucks. Today, the biggest Transflo markets are chemicals and agriculture, for example minerals and ethanol. CSX Technology and other subsidiaries provide support services for the Company.
CSX’s other holdings include CSX Real Property, Inc., a subsidiary responsible for the Company’s real estate sales, leasing, acquisition and management and development activities. These activities are classified in other income because they are not considered by the Company to be operating activities. Results of these activities fluctuate with the timing of non-operating real estate sales.
Financial Information
See Item 7. Management’s Discussion and Analysis of Financial Condition and Results of Operations for operating revenue, operating income and total assets for each of the last three fiscal years.
Company History
A leader in freight rail transportation for more than 180 years, the Company’s heritage dates back to the early nineteenth century when The Baltimore and Ohio Railroad Company (“B&O”) – the nation’s first common carrier – was chartered in 1827. Since that time, the Company has built on this foundation to create a railroad that could safely and reliably service the ever-increasing demands of a growing nation.
Since its founding, numerous railroads have combined with the former B&O through merger and consolidation to create what has become CSX. Each of the railroads that combined into the CSX family brought new geographical reach to valuable markets, gateways, cities, ports and transportation corridors.
CSX was incorporated in 1978 under Virginia law. In 1980, the Company completed the merger of the Chessie System and Seaboard Coast Line Industries into CSX. The merger allowed the Company to connect northern population centers and Appalachian coal fields to growing southeastern markets. Later, the Company’s acquisition of key portions of Conrail, Inc. allowed CSXT to link the northeast, including New England and the New York metropolitan area, with Chicago and midwestern markets as well as the growing areas in the southeast already served by CSXT. This current rail network allows the Company to directly serve every major market in the eastern United States with safe, dependable, environmentally responsible and fuel efficient freight transportation and intermodal service.
Competition
The business environment in which the Company operates is highly competitive. Shippers typically select transportation providers that offer the most compelling combination of service and price. Service requirements, both in terms of transit time and reliability, vary by shipper and commodity. As a result, the Company’s primary competition varies by commodity, geographic location and mode of available transportation.
4
CSXT’s primary rail competitor is Norfolk Southern Railway, which operates throughout much of the Company’s territory. Other railroads also operate in parts of the Company’s territory. Depending on the specific market, competing railroads and deregulated motor carriers may exert pressure on price and service levels. For further discussion on the risk of competition to the Company, see Item 1A. Risk Factors.
Regulatory Environment
The Company's operations are subject to various federal, state and local laws and regulations generally applicable to businesses in the United States. The railroad operations conducted by the Company's subsidiaries, which includes CSXT, are subject to the regulatory jurisdiction of the Surface Transportation Board (“STB”), the Federal Railroad Administration (“FRA”), and its sister agency within the U.S. Department of Transportation, the Pipeline and Hazardous Materials Safety Administration (“PHMSA”). Together, FRA and PHMSA have broad jurisdiction over railroad operating standards and practices, including track, freight cars, locomotives and hazardous materials requirements. Additionally, the Transportation Security Administration (“TSA”), a component of the Department of Homeland Security, has broad authority over railroad operating practices that may have homeland security implications.
Although the Staggers Act of 1980 significantly deregulated rail rates and much of the rail traffic of the Company's subsidiaries is currently exempt from rate regulation by agency decision, the STB has broad jurisdiction over railroad commercial practices, including some railroad rates, routes, fuel surcharges, conditions of services and the extension or abandonment of rail lines. This includes jurisdiction over freight car charges, the transfer, extension or abandonment of rail lines, rates charged on certain regulated rail traffic, conditions of service and any acquisition of control over rail common carriers.
In 2008, Congress enacted the Rail Safety Improvement Act (the “RSIA”). The legislation includes a mandate that all Class I freight railroads implement a positive train control system (“PTC”) by December 31, 2015. The AAR recently advised the FRA on behalf of the industry that a nationwide interoperable PTC network cannot be completed by the December 31, 2015 deadline. Federal legislation introduced in both the House of Representatives and the Senate would, if approved, delay the final implementation of PTC from three to five years.
PTC must be installed on all main lines with passenger and commuter operations as well as most of those over which toxic-by-inhalation hazardous materials are transported. Implementation of a PTC system is designed to prevent train-to-train collisions, over-speed derailments, incursions into established work-zone limits, and train diversions onto another set of tracks caused by switches left in wrong positions. The Company expects to incur significant capital costs in connection with the implementation of PTC as well as related ongoing operating expenses. CSX previously estimated that the total multi-year cost of PTC implementation would be at least
$1.2 billion
for the Company. This estimate is currently being re-evaluated due to upward pressure on these costs.
In December 2009, a proposed bill called the “Surface Transportation Board Reauthorization Act of 2009” was introduced in the Senate but not advanced. In January 2011, the bill, now referred to as the Surface Transportation Board Reauthorization Act of 2011 (“STB Reauthorization Bill”) was reintroduced. The STB Reauthorization Bill, if adopted, could increase government involvement in railroad pricing, service and operations. The proposed legislation also includes provisions that would reduce a railroad's ability to price at market levels and open a carrier's privately-owned and maintained rail network to competitors under certain conditions. Though unlikely, portions of the STB Reauthorization bill may be considered as part of the Moving Ahead for Progress in the 21st Century Act, a bill to reauthorize Federal-aid highway and highway safety construction programs, and for other purposes.
5
If adopted as proposed, this bill could have a material adverse effect on the Company's revenue and operations, as well as its ability to invest in enhancing and maintaining vital infrastructure. Prior to the reintroduction of the STB Reauthorization Bill, the STB had already announced two new hearings; one held in February 2011 to review the utility of boxcar, intermodal, automotive and other exemptions, and the other held in June 2011 to explore the current state of competition in the railroad industry. The STB has not yet announced what actions, if any, it will take in response to the records developed in these hearings.
For further discussion on regulatory risks to the Company, see Item 1A. Risk Factors.
Other Information
CSX makes available on its website
www.csx.com
, free of charge, its annual reports on Form 10-K, quarterly reports on Form 10-Q, current reports on Form 8-K and all amendments to those reports as soon as reasonably practicable after such reports are filed with or furnished to the Securities and Exchange Commission (“SEC”). The information on the CSX website is not part of this annual report on Form 10-K. Additionally, the Company has posted its code of ethics on its website, which is also available to any shareholder who requests it. This Form 10-K and other SEC filings made by CSX are also accessible through the SEC’s website at
www.sec.gov
.
CSX has included the certifications of its Chief Executive Officer (“CEO”) and the Chief Financial Officer (“CFO”) required by Section 302 of the Sarbanes-Oxley Act of 2002 (“the Act”) as Exhibit 31, as well as Section 906 of the Act as Exhibit 32 to this Form 10-K report. Additionally, on
May 25, 2011
, CSX filed its annual CEO certification with the New York Stock Exchange (“NYSE”) confirming CSX’s compliance with the NYSE Corporate Governance Listing Standards. The CEO was not aware of any violations of these standards by CSX as of
February 17, 2012
(the latest practicable date that is closest to the filing of this Form 10-K). This certification is also included as Exhibit 99 to this Form 10-K.
The Company’s annual average number of employees was approximately
31,000
in
2011
, which includes approximately
26,000
union employees. Most of the Company’s employees provide or support transportation services. The information set forth in Item 6. Selected Financial Data is incorporated herein by reference.
For additional information concerning business conducted by the Company during
2011
, see Item 7. Management's Discussion and Analysis of Financial Condition and Results of Operations.
Item 1A. Risk Factors
The following risk factors could have a materially adverse effect on the Company's financial condition, results of operations or liquidity, and could cause those results to differ materially from those expressed or implied in the Company's forward-looking statements. Additional risks and uncertainties not currently known to the Company or that the Company currently does not deem to be material also may materially impact the Company's financial condition, results of operations or liquidity.
6
New legislation or regulatory changes could impact the Company's earnings or restrict its ability to independently negotiate prices.
Legislation passed by Congress or new regulations issued by federal agencies can significantly affect the revenues, costs and profitability of the Company's business. For instance, legislation proposed in the Senate in December 2009, and reintroduced in January 2011 (see Regulatory Environment in Part I for further details), if adopted, could significantly change the federal regulatory framework of the railroad industry. Several of the changes under consideration could have a significant negative impact on the Company's ability to determine prices for rail services and meet service standards, which could force a reduction in capital spending. In addition, statutes imposing price constraints or affecting rail-to-rail competition could adversely affect the Company's profitability.
Government regulation and compliance risks may adversely affect the Company's operations and financial results.
The Company is subject to the jurisdiction of various regulatory agencies, including the STB, the FRA and other state and federal regulatory agencies for a variety of economic, health, safety, labor, environmental, tax, legal and other matters. New rules or regulations by these agencies could increase the Company's operating costs or reduce operating efficiencies. For example, the RSIA mandated that the installation of PTC be completed by December 31, 2015 on main lines that carry certain hazardous materials and on lines that have commuter or passenger operations. In January 2010, the FRA issued its final rule on the design, operational requirements and implementation of the new PTC technology. The FRA is now re-examining certain aspects of the rule in response to rail industry concerns. The AAR recently advised the FRA on behalf of the industry that a nationwide interoperable PTC network cannot be completed by the December 31, 2015 deadline. Federal legislation introduced in both the House of Representatives and the Senate would, if approved, delay the final implementation of PTC from three to five years. Even if revised, the rule will continue to impose significant new costs on the Company and the rail industry. Noncompliance with these and other applicable laws or regulations could erode public confidence in the Company and can subject the Company to fines, penalties and other legal or regulatory sanctions.
Climate change legislation and regulation could adversely affect the Company's operations and financial results.
Climate change legislation or regulation has been proposed and, in some cases adopted, on the federal, state, provincial (Canada) and local levels. These final and proposed laws and regulations take the form of restrictions, caps, taxes or other controls on greenhouse gas (“GHG”) emissions. In particular, the U.S. Environmental Protection Agency (“EPA”) has issued various regulations targeting GHG emissions, including rules and standards governing GHG emissions from certain stationary sources and from vehicles.
Any of these pending or proposed laws or regulations could adversely affect CSX operations and financial results by, among other things: (1) increasing energy costs generally, making it difficult for the Company's customers in the U.S. and Canada to produce products in a cost competitive manner (particularly in the absence of similar regulations in countries like India and China); (2) increasing the Company's fuel, capital and other operating costs and negatively affecting operating and fuel efficiencies; (3) reducing coal-fired electricity generation due to mandated emission standards which CSX considers to be unachievable within the time frames ordered by the U.S. EPA, and (4) reducing the consumption of coal as a viable energy resource in the United States. Any of these factors could reduce the amount of traffic the Company handles and have a material adverse effect on the Company's financial condition, results of operations or liquidity.
7
Capacity constraints could have a negative impact on service and operating efficiency.
CSXT may experience rail network difficulties related to: (i) increased passenger activities, including high-speed rail, in capacity-constrained areas, or (ii) regulatory changes impacting when
CSXT can transport freight or service routes that could have a negative effect on CSXT's operational fluidity, leading to deterioration of service, asset utilization and overall efficiency.
General economic conditions could negatively affect demand for commodities and other freight.
The economic recession in late 2008 and 2009 adversely affected demand for rail and intermodal services. Although overall traffic improved in 2010 and 2011, a decline in general domestic and global economic conditions that affect demand for the commodities the Company carries could reduce revenues or have other adverse effects. In addition, if the rate of economic growth in China slows or if European economies contract, U.S. export coal volume could be adversely impacted resulting in lower revenue for CSX. Furthermore, sustained low natural gas prices are having a negative impact on domestic coal volume, as coal-fired electricity generation is being displaced by natural gas-fired generation, which could adversely impact the Company's financial condition, results of operations or liquidity.
CSXT, as a common carrier by rail, is required by law to transport hazardous materials, which could expose the Company to significant costs and claims.
Under federal regulations, CSXT is required to transport hazardous materials under its common carrier obligation. A train accident involving the transport of hazardous materials could result in significant claims arising from personal injury, property or natural resource damage, environmental penalties and remediation obligations. Such claims, if insured, could exceed existing insurance coverage or insurance may not continue to be available at commercially reasonable rates.
CSXT is also required to comply with regulations regarding the handling of hazardous materials. In November 2008, the TSA issued final rules placing significant new security and safety requirements on passenger and freight railroad carriers, rail transit systems, and facilities that ship hazardous materials by rail. Noncompliance with these rules can subject the Company to significant penalties and could be a factor in litigation arising out of a train accident. Finally, legislation preventing the transport of hazardous materials through certain cities could result in network congestion and increase the length of haul for hazardous substances, which could increase operating costs, reduce operating efficiency or increase the risk of an accident involving the transport of hazardous materials.
The Company is subject to environmental laws and regulations that may result in significant costs.
The Company is subject to wide-ranging federal, state, provincial (Canada) and local environmental laws and regulations concerning, among other things, emissions into the air, ground and water, the handling, storage, use, generation, transportation and disposal of waste and other materials, the clean-up of hazardous material and petroleum releases, and the health and safety of our employees. If we violate or fail to comply with these laws and regulations, we could be fined or otherwise sanctioned by regulators. We can also be held liable for consequences arising out of human exposure to any hazardous substances for which we are responsible. In certain circumstances, environmental liability can extend to formerly owned or operated properties, leased properties, adjacent properties and properties owned by third parties or Company predecessors, as well as to properties currently owned, leased or used by the Company.
8
The Company has been, and may in the future, be subject to allegations or findings to the effect that it has violated, or is strictly liable under, environmental laws or regulations, and such violations can result in the Company's incurring fines, penalties or costs relating to the clean-up of environmental contamination. Although the Company believes it has appropriately recorded current and long-term liabilities for known and estimable future environmental costs, it could incur significant costs that exceed reserves or require unanticipated cash expenditures as a result of any of the foregoing. The Company also may be required to incur significant expenses to investigate and remediate known, unknown or future environmental contamination.
The Company relies on the stability and availability of its technology systems to operate its business.
The Company relies on information technology in all aspects of its business. The performance and reliability of the Company's technology systems are critical to its ability to operate and compete safely and effectively.
A cybersecurity attack, which is a deliberate theft of data or impairment of information technology systems, or other significant disruption or failure could result in a service interruption, train accident, misappropriation of confidential information, process failure, security breach or other operational difficulties. Such an event could result in increased capital, insurance or operating costs, including increased security costs to protect the Company's infrastructure. Disruption of the Company's information technology systems, even for short periods of time, could have a material adverse effect on the Company.
Disruption of the supply chain could negatively affect operating efficiency and increase costs.
The capital intensive nature and sophistication of core rail equipment (including rolling stock equipment, locomotives, rail, and ties) limits the number of railroad equipment suppliers. If any of the current manufacturers stops production or experiences a supply shortage, CSXT could experience a significant cost increase or material shortage. In addition, a few critical railroad suppliers are foreign and, as such, adverse developments in international relations, new trade regulations, disruptions in international shipping or increases in global demand could make procurement of these supplies more difficult or increase CSXT's operating costs.
Additionally, if a fuel supply shortage were to arise, whether due to the Organization of the Petroleum Exporting Countries (OPEC), other production restrictions, lower refinery outputs, a disruption of oil imports, adverse political developments or otherwise, the Company would be negatively impacted.
Failure to complete negotiations on collective bargaining agreements could result in strikes and/or work stoppages.
Most of CSX's employees are represented by labor unions and are covered by collective bargaining agreements. The majority of these agreements are bargained nationally by the National Carriers Conference Committee and negotiated over the course of several years and previously have not resulted in any extended work stoppages. Under the Railway Labor Act's procedures (which include mediation, cooling-off periods and the possibility of Presidential intervention), during negotiations neither party may take action until the procedures are exhausted. If, however, CSX is unable to negotiate acceptable agreements, or if terms of existing agreements are disputed, the employees covered by the Railway Labor Act could strike, which could result in loss of business and increased operating costs as a result of higher wages or benefits paid to union members.
9
The Company faces competition from other transportation providers.
The Company experiences competition in the form of pricing, service, reliability and other factors from various transportation providers including railroads and motor carriers that operate similar routes across its service area and, to a less significant extent, barges, ships and pipelines. Transportation providers such as motor carriers and barges utilize public rights-of-way that are built and maintained by governmental entities while CSXT and other railroads must build and maintain rail networks largely using internal resources. Any future improvements or expenditures materially increasing the quality or reducing the cost of alternative modes of transportation, or legislation providing for less stringent size or weight restrictions on trucks, could negatively impact the Company's competitive position.
Future acts of terrorism, war or regulatory changes to combat the risk of terrorism may cause significant disruptions in the Company's operations.
Terrorist attacks, along with any government response to those attacks, may adversely affect the Company's financial condition, results of operations or liquidity. CSXT's rail lines or other key infrastructure may be direct targets or indirect casualties of acts of terror or war. This risk could cause significant business interruption and result in increased costs and liabilities and decreased revenues. In addition, premiums charged for some or all of the insurance coverage currently maintained by the Company could increase dramatically or the coverage may no longer be available.
Furthermore, in response to the heightened risk of terrorism, federal, state and local governmental bodies are proposing and, in some cases, have adopted legislation and regulations relating to security issues that impact the transportation industry. For example, the Department of Homeland Security adopted regulations that require freight railroads to implement additional security protocols when transporting hazardous materials. Complying with these regulations could continue to increase the Company's operating costs and reduce operating efficiencies.
Severe weather or other natural occurrences could result in significant business interruptions and expenditures in excess of available insurance coverage.
The Company's operations may be affected by external factors such as severe weather and other natural occurrences, including floods, fires, hurricanes and earthquakes. As a result, the Company's rail network may be damaged, its workforce may be unavailable, fuel costs may rise and significant business interruptions could occur. In addition, the performance of locomotives and railcars could be adversely affected by extreme weather conditions. Insurance maintained by the Company to protect against loss of business and other related consequences resulting from these natural occurrences is subject to coverage limitations, depending on the nature of the risk insured. This insurance may not be sufficient to cover all of the Company's damages or damages to others and this insurance may not continue to be available at commercially reasonable rates. Even with insurance, if any natural occurrence leads to a catastrophic interruption of service, the Company may not be able to restore service without a significant interruption in operations.
The Company may be subject to lawsuits that could result in significant expenditures.
The Company is subject to various claims and lawsuits, including putative class action litigation alleging violations of antitrust laws. The Company may experience material judgments or incur significant costs to defend existing and future lawsuits. Additionally, existing litigation may suffer adverse developments not currently reflected in the Company's reserve estimates as the ultimate outcome of existing litigation is subject to numerous factors outside of the Company's control. Final judgments or settlement amounts may differ materially from the recorded reserves.
10
Increases in the number and magnitude of property damage and personal injury claims could adversely affect the Company's operating results.
The Company faces inherent business risk from exposure to occupational and personal injury claims, property damage, including storm damage, and claims related to train accidents. The Company may incur significant costs to defend such claims.
Existing claims may suffer adverse developments not currently reflected in reserve estimates, as the ultimate outcome of existing claims is subject to numerous factors outside of the Company's control. Although the Company establishes reserves and maintains insurance to cover these types of claims, final amounts determined to be due on any outstanding matters may differ materially from the recorded reserves and exceed the Company's insurance coverage.
Item 1B. Unresolved Staff Comments
None.
Item 2. Properties
The Company’s properties primarily consist of track and its related infrastructure, locomotives and freight cars and equipment. These categories and the geography of the network are described below.
Track and Infrastructure
Serving
23
states, the District of Columbia, and the Canadian provinces of Ontario and Quebec, the CSXT rail network serves, among other markets, New York, Philadelphia and Boston in the northeast and mid-Atlantic, the southeast markets of Atlanta, Miami and New Orleans, and the midwestern cities of St. Louis, Memphis and Chicago.
11
CSXT’s track structure includes main thoroughfares, connecting terminals and yards (known as mainline track), track within terminals and switching yards, track adjacent to the mainlines used for passing trains, track connecting the mainline track to customer locations and track that diverts trains from one track to another known as turnouts. Total track miles are greater than CSXT’s approximately
21,000
route miles, which reflect the size of CSXT’s network that connects markets, customers and western railroads. At December
2011
, the breakdown of track miles was as follows:
|
|
Track
|
|
|
|
Miles
|
|
|
Mainline track
|
26,546
|
|
|
Terminals and switching yards
|
9,556
|
|
|
Passing sidings and turnouts
|
910
|
|
|
Total
|
37,012
|
|
In addition to its physical track structure, CSXT operates numerous yards and terminals. These serve as the hubs between CSXT and its local customers and as sorting facilities where rail cars often are received, re-sorted and placed onto new outbound trains.
The Company’s ten largest yards and terminals based on annual volume (number of rail cars or intermodal containers processed) are listed below:
|
Yards and Terminals
|
Annual
Volume
(number of units processed)
|
|
|
Chicago, IL
|
922,893
|
|
|
Waycross, GA
|
663,821
|
|
|
Selkirk, NY
|
584,746
|
|
|
Willard, OH
|
500,612
|
|
|
Nashville, TN
|
493,106
|
|
|
Indianapolis, IN
|
491,728
|
|
|
Cincinnati, OH
|
486,242
|
|
|
Hamlet, NC
|
462,247
|
|
|
Toledo, OH
|
361,871
|
|
|
Birmingham, AL
|
357,353
|
|
12
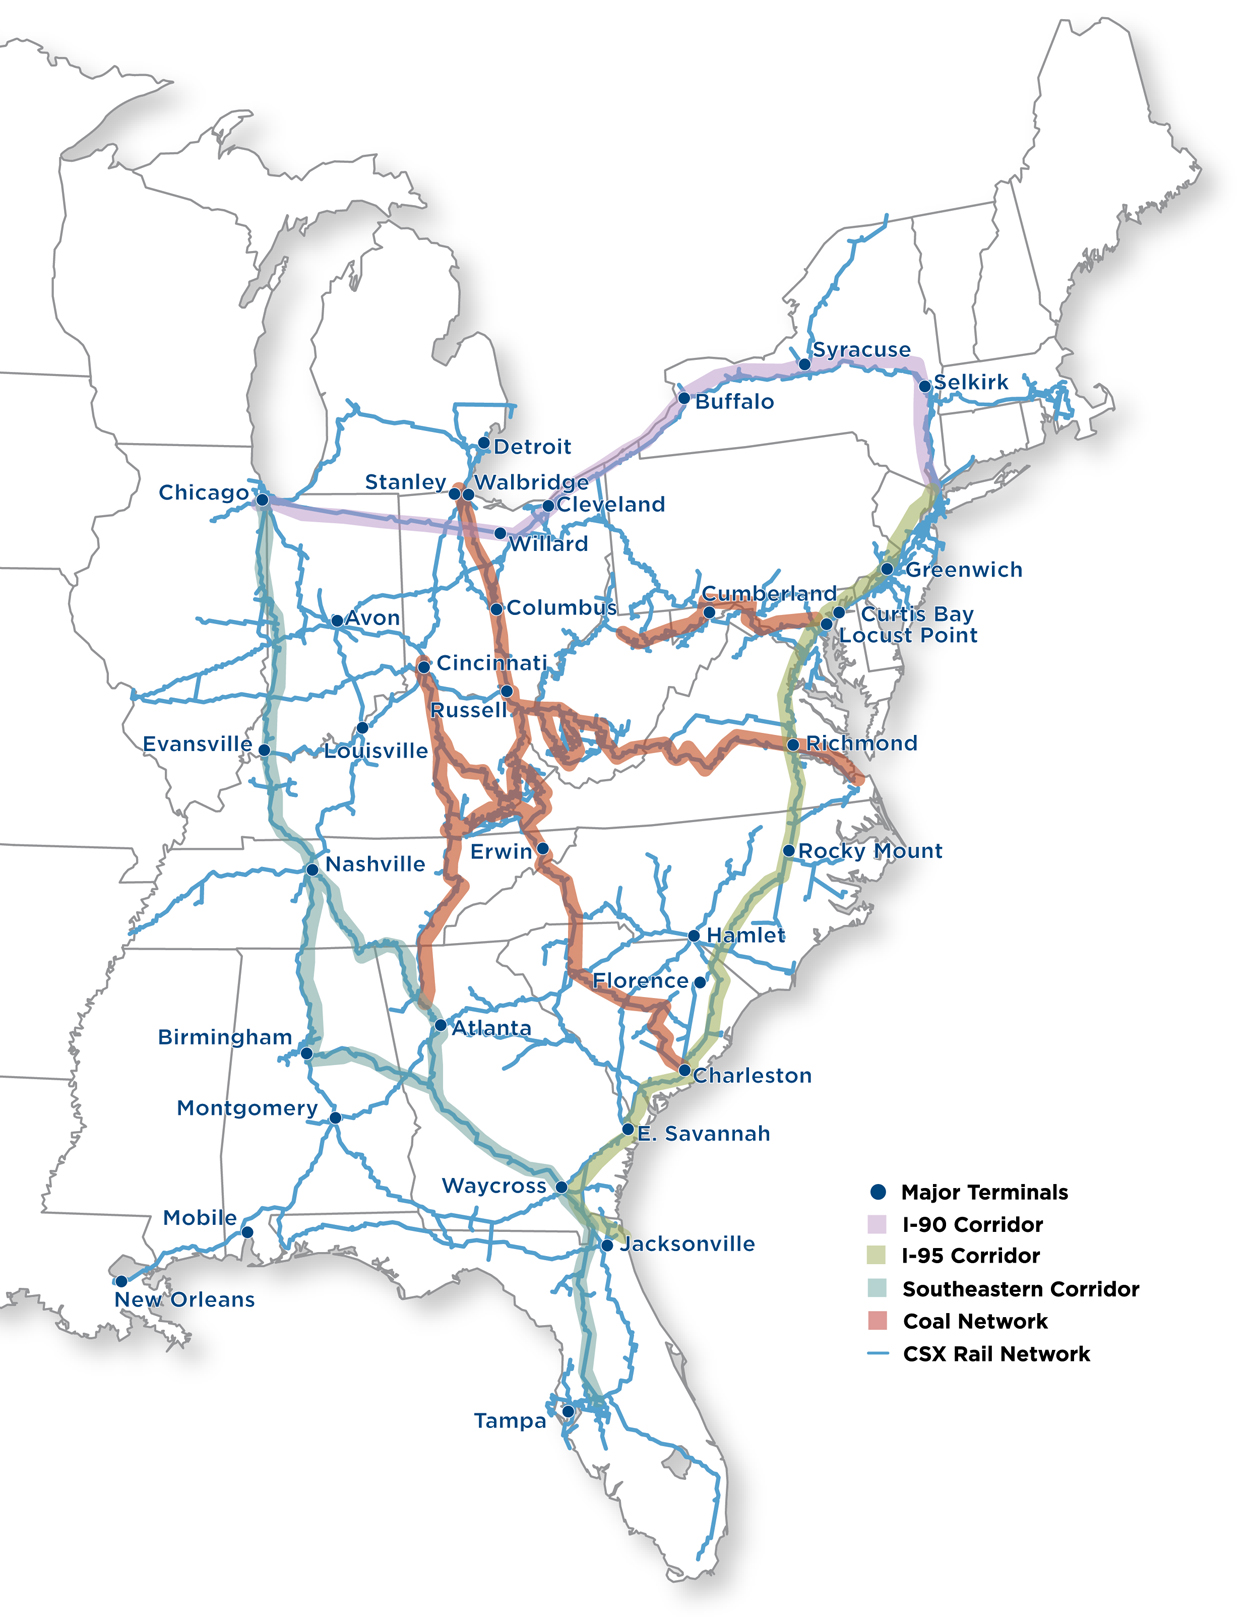
Network Geography
CSXT’s operations are primarily focused on four major transportation networks and corridors which are defined geographically and by commodity flows below.
Interstate 90 (I-90) Corridor
– This CSXT corridor links Chicago and the Midwest to metropolitan areas in New York and New England. This route, also known as the “waterlevel route,” has minimal hills and grades and nearly all of it has two main tracks (referred to as double track). These superior engineering attributes permit the corridor to support consistent, high-speed intermodal, automotive and merchandise service. This corridor is a primary route for import traffic coming from the far east through western ports moving eastward across the country, through Chicago and into the population centers in the Northeast. The I-90 Corridor is also a critical link between ports in New York, New Jersey, and Pennsylvania and consumption markets in the Midwest. This route carries consumer goods from all three of the Company’s major markets – merchandise, coal and intermodal.
Interstate 95 (I-95) Corridor
– The CSXT I-95 Corridor connects Charleston, Jacksonville, Miami and many other cities throughout the Southeast with the heavily populated northeastern cities of Baltimore, Philadelphia and New York. CSXT primarily transports food and consumer products, as well as metals and chemicals along this line. It is the only rail corridor along the eastern seaboard south of the District of Columbia, and provides access to major eastern ports.
Southeastern Corridor
– This critical part of the network runs between CSXT’s western gateways of Chicago, St. Louis and Memphis through the cities of Nashville, Birmingham, and Atlanta and markets in the Southeast. The Southeastern Corridor is the premier rail route connecting these key cities, gateways, and markets and positions CSXT to efficiently handle projected traffic volumes of intermodal, automotive and general merchandise traffic. The corridor also provides direct rail service between the coal reserves of the southern Illinois basin and the demand for coal in the Southeast.
Coal Network
– The CSXT coal network connects the coal mining operations in the Appalachian mountain region and Illinois Basin with industrial areas in the Northeast and Mid-Atlantic, as well as many river, lake, and deep water port facilities. CSXT’s coal network is well positioned to supply utility markets in both the Northeast and Southeast and to transport coal shipments for exports outside of the U.S. Roughly
one of every three
tons of export coal and
nearly all
of the domestic coal that the Company transports is used for generating electricity.
See the following page for a map of the CSX Rail Network.
13
CSX Rail Network
14
Locomotives
CSXT operates more than
4,000
locomotives, of which over
95%
are owned by CSXT. Freight locomotives are the power source used primarily to pull trains. Switching locomotives are used in yards to sort railcars so that the right railcar is attached to the right train in order to deliver it to its final destination. Auxiliary units are typically used to provide extra traction for heavy trains in hilly terrain. At December
2011
, CSXT’s fleet of owned and long-term leased locomotives consisted of the following types of locomotives:
|
|
Locomotives
|
%
|
Average Age
(years)
|
||||||
|
Freight
|
3,579
|
|
87
|
%
|
20
|
|
|||
|
Switching
|
322
|
|
8
|
%
|
32
|
|
|||
|
Auxiliary Units
|
215
|
|
5
|
%
|
19
|
|
|||
|
Total
|
4,116
|
|
100
|
%
|
20
|
|
|||
Equipment
In
2011
, the average daily fleet of cars on line consisted of approximately
206,000
. At any time over half of the railcars on the CSXT system are not owned or leased by the Company. Examples of these are as follows: railcars owned by other railroads (which are utilized by CSXT), shipper-furnished or private cars (which are generally used only in that shipper’s service) and multi-level railcars used to transport automobiles (which are shared among railroads).
15
The Company’s equipment consists of freight cars, containers and chassis.
Gondolas
– Support CSXT’s metals markets and provide transport for woodchips and other bulk commodities. Some gondolas are equipped with special hoods for protecting products like coil and sheet steel.
Open-top hoppers
– Transport heavy dry bulk commodities such as coal, coke, stone, sand, ores and gravel that are resistant to weather conditions.
Box cars
– Include a variety of tonnages, sizes, door configurations and heights to accommodate a wide range of finished products, including paper, auto parts, appliances and building materials. Insulated box cars deliver food products, canned goods, beer and wine.
Covered hoppers
– Have a permanent roof and are segregated based upon commodity density. Lighter bulk commodities such as grain, fertilizer, flour, salt, sugar, clay and lime are shipped in large cars called jumbo covered hoppers. Heavier commodities like cement, ground limestone and glass sand are shipped in small cube covered hoppers.
Multi-level flat cars
– Transport finished automobiles and are differentiated by the number of levels: bi-levels for large vehicles such as pickup trucks and SUVs and tri-levels for sedans and smaller automobiles.
Flat cars
– Used for shipping intermodal containers and trailers or bulk and finished goods, such as lumber, pipe, plywood, drywall and pulpwood.
Containers
- Weather-proof boxes used for bulk shipment of freight.
Chassis
- Wheeled support framework for a container that allows it to be attached to a tractor. All of the Company’s chassis are leased.
Other cars owned or leased on the network include, but are not limited to, center beam cars for transporting lumber and building products. The Company also has other types of equipment such as doublestack railcars, which allow for two containers to be mounted one above the other.
16
At December
2011
, the Company’s owned and long-term leased equipment consisted of the following:
|
Equipment
|
Number of Units
|
%
|
||||
|
Gondolas
|
25,337
|
|
37
|
%
|
||
|
Open-top hoppers
|
12,354
|
|
18
|
%
|
||
|
Box cars
|
8,659
|
|
13
|
%
|
||
|
Covered hoppers
|
10,987
|
|
16
|
%
|
||
|
Multi-level flat cars
|
9,845
|
|
14
|
%
|
||
|
Flat cars
|
1,106
|
|
2
|
%
|
||
|
Other cars
|
371
|
|
1
|
%
|
||
|
Subtotal freight cars
|
68,659
|
|
100
|
%
|
||
|
Containers
|
16,403
|
|
61
|
%
|
||
|
Chassis
|
10,360
|
|
39
|
%
|
||
|
Subtotal equipment
|
26,763
|
|
100
|
%
|
||
|
Total equipment
|
95,422
|
|
|
|||
Item 3. Legal Proceedings
Fuel Surcharge Antitrust Litigation
Class action lawsuits first filed in May 2007 have been consolidated and are pending in federal court in the District of Columbia against CSXT and three other U.S.-based Class I railroads. The court has not yet ruled on whether it is appropriate to certify the case as a class action.
The lawsuits contain substantially similar allegations to the effect that the defendants' fuel surcharge practices relating to contract and unregulated traffic resulted from an illegal conspiracy in violation of antitrust laws. The suits seek unquantified treble damages (three times the amount of actual damages) allegedly sustained by purported class members, attorneys' fees and other relief.
All but three of the lawsuits purport to be filed on behalf of a class of shippers that allegedly purchased rail freight transportation services from the defendants through the use of contracts or through other means exempt from rate regulation during defined periods commencing as early as June 2003 and that were assessed fuel surcharges. Three of the lawsuits purport to be on behalf of indirect purchasers of rail services. The court denied the defendants' motion to dismiss the direct purchasers' claims. The court dismissed all of the indirect purchasers' causes of action seeking money damages, but did not dismiss their request for injunctive relief. The dismissal was upheld on appeal. Plaintiffs then petitioned the United States Supreme Court to hear the case. The Supreme Court denied the petition in December 2010.
One additional lawsuit was filed, but not served, by an individual shipper. CSXT entered into a tolling agreement with this shipper whereby the shipper agreed to dismiss the lawsuit against CSXT without prejudice and CSXT agreed to extend the statute of limitations for the claims asserted until the end of 2010. That agreement has been extended to the end of 2012.
17
CSXT believes that its fuel surcharge practices are lawful. Accordingly, CSXT intends to vigorously defend itself against the purported class actions, which it believes are without merit. While CSXT cannot predict the outcome of the private lawsuits, or of any government investigations, charges or additional litigation that may be filed in the future, we currently believe that these matters will not have a material adverse effect on any of our results of operations, financial condition and liquidity. Penalties for violating antitrust laws can be severe, involving both potential criminal and civil liability. If a material adverse outcome were to occur and be sustained, it could have a material adverse impact on the Company's financial condition, results of operations or liquidity.
Other Legal Proceedings
In addition to the matters described above, the Company is involved in litigation incidental to its business and is a party to a number of legal actions and claims, various governmental proceedings and private civil lawsuits, including, but not limited to, those related to environmental and hazardous material exposure matters, FELA claims by employees, other personal injury claims and disputes and complaints involving certain transportation rates and charges. Some of the legal proceedings include claims for compensatory as well as punitive damages and others are, or are purported to be, class actions. While the final outcome of these matters cannot be predicted with certainty, considering, among other things, the legal defenses available and liabilities that have been recorded along with applicable insurance, it is currently the opinion of CSX management that none of these pending items will have a material adverse effect on the Company's financial condition, results of operations or liquidity. An unexpected adverse resolution of one or more of these items, however, could have a material adverse effect on the Company's financial condition, results of operations or liquidity in that particular period.
Item 4. Mine Safety Disclosure
Not Applicable
18
Executive Officers of the Registrant
Executive officers of the Company are elected by the CSX Board of Directors and generally hold office until the next annual election of officers. There are no family relationships or any arrangement or understanding between any officer and any other person pursuant to which such officer was elected. As of the date of this filing, the executive officers’ names, ages and business experience are:
|
Name and Age
|
Business Experience During Past Five Years
|
|
Michael J. Ward, 61
Chairman, President and Chief Executive Officer
|
A 34-year veteran of the Company, Ward has served as Chairman, President and Chief Executive Officer of CSX since January 2003.
Ward’s distinguished railroad career has included key executive positions in nearly all aspects of the Company’s business, including sales and marketing, operations and finance.
|
|
Fredrik J. Eliasson, 41
Executive Vice President and Chief Financial Officer
|
Eliasson was named Executive Vice President and Chief Financial Officer of CSX and CSXT in January 2012 and is responsible for the management and oversight of strategic planning and finance activities, including accounting, financial planning, tax, treasury and investor relations.
Eliasson brings more than 16 years of management and finance experience to his new role. He previously served as Vice President of Sales and Marketing for CSX's chemicals and fertilizer business, Vice President of Emerging Markets, Vice President of Commercial Finance, and Vice President of Financial Planning and Analysis.
|
19
|
Name and Age
|
Business Experience During Past Five Years
|
|
Oscar Munoz, 53
Executive Vice President and Chief Operating Officer
|
Munoz was named Executive Vice President and Chief Operating Officer of CSXT in January 2012. He manages all aspects of the Company's operations across its 21,000-mile network, including transportation, service design, customer service, engineering, mechanical and technology. Prior to his current role, Munoz spent eight years as CSX’s Executive Vice President and Chief Financial Officer from 2003 to 2012.
Munoz brings to the Company more than 25 years of experience from a variety of industries. Before joining CSX in 2003, Munoz served as Chief Financial Officer and Vice President of AT&T Consumer Services. He also has held key executive positions with other consumer products companies, including the Coca-Cola Company and Pepsico Corporation.
|
|
Clarence W. Gooden, 60
Executive Vice President of Sales and Marketing and Chief Commercial Officer
|
Gooden has been the Executive Vice President and Chief Commercial Officer of CSX and CSXT since April 2004. He is responsible for generating customer revenue, forecasting business trends and developing CSX’s model for future revenue growth.
A member of the Company for more than 40 years, Gooden has held key executive positions in both operations and sales and marketing.
|
|
Ellen M. Fitzsimmons, 51
Senior Vice President of Law and Public Affairs, General Counsel and Corporate Secretary
|
Fitzsimmons has been the Senior Vice President of Law and Public Affairs, General Counsel, and Corporate Secretary since December 2003. She serves as the Company’s chief legal officer and oversees all government relations and public affairs activities.
During her 20-year tenure with the Company, her broad responsibilities have included key roles in major risk and corporate governance-related areas.
|
20
|
Name and Age
|
Business Experience During Past Five Years
|
|
Lisa A. Mancini, 52
Senior Vice President and Chief Administrative Officer
|
Mancini has been Senior Vice President and Chief Administrative Officer since January 2009. She is responsible for employee compensation and benefits, labor relations, all employee staffing and development activitites, purchasing, real estate, aviation and facilities. She previously served as Vice President-Strategic Infrastructure Initiatives from 2007 to 2009 and, prior to that, Vice President – Labor Relations.
Prior to joining CSX in 2003, Mancini served as Chief Operating Officer of the San Francisco Municipal Railway.
|
|
Carolyn T. Sizemore, 49
Vice President and Controller
|
Sizemore has served as Vice President and Controller of CSX and CSXT since April 2002. She is responsible for financial and regulatory reporting, freight billing and collections, payroll for the Company’s 31,000 employees, accounts payable and various other accounting processes.
Sizemore’s responsibilities during her 22-year tenure with the Company have included roles in finance and audit-related areas including a variety of positions in accounting, finance strategies, budgets and performance analysis.
|
21
Market Information
CSX’s common stock is listed on the NYSE, which is its principal trading market, and is traded over-the-counter and on exchanges nationwide. The official trading symbol is “CSX.”
Description of Common and Preferred Stock
A total of
1.8 billion
shares of common stock are authorized, of which
1,049,157,179
shares were outstanding as of December
2011
. Each share is entitled to one vote in all matters requiring a vote of shareholders. There are no pre-emptive rights, which are privileges extended to select shareholders that allow them to purchase additional shares before other members of the general public in the event of an offering. At
January 27, 2012
, the latest practicable date, there were
36,697
common stock shareholders of record. The weighted average of common shares outstanding, which was used in the calculation of diluted earnings per share, was approximately
1.1 billion
as of
December 30, 2011
. (See Note 2, Earnings Per Share.)
A total of
25 million
shares of preferred stock is authorized, none of which is currently outstanding.
The following table sets forth, for the quarters indicated, the dividends declared and the high and low share prices of CSX common stock as required by SEC Regulation S-K. All dividends and common stock prices were adjusted to reflect the three-for-one stock split effective May 31, 2011
.
|
|
Quarter
|
|
||||||||||||||||||
|
|
1st
|
2nd
|
3rd
|
4th
|
Year
|
|||||||||||||||
|
2011
|
||||||||||||||||||||
|
Dividends
|
$
|
0.09
|
|
$
|
0.12
|
|
$
|
0.12
|
|
$
|
0.12
|
|
$
|
0.45
|
|
|||||
|
Common Stock Price
|
|
|||||||||||||||||||
|
High
|
$
|
26.81
|
|
$
|
26.50
|
|
$
|
27.06
|
|
$
|
23.14
|
|
$
|
27.06
|
|
|||||
|
Low
|
$
|
21.37
|
|
$
|
24.08
|
|
$
|
17.69
|
|
$
|
17.83
|
|
$
|
17.69
|
|
|||||
|
2010
|
||||||||||||||||||||
|
Dividends
|
$
|
0.08
|
|
$
|
0.08
|
|
$
|
0.08
|
|
$
|
0.09
|
|
$
|
0.33
|
|
|||||
|
Common Stock Price
|
|
|||||||||||||||||||
|
High
|
$
|
17.61
|
|
$
|
20.67
|
|
$
|
18.93
|
|
$
|
21.60
|
|
$
|
21.60
|
|
|||||
|
Low
|
$
|
14.02
|
|
$
|
16.00
|
|
$
|
15.50
|
|
$
|
17.98
|
|
$
|
14.02
|
|
|||||
22
Stock Performance Graph
The cumulative shareholder returns, assuming reinvestment of dividends, on $100 invested at December 31, 2006 are illustrated on the graph below. The Company references the Standard & Poor 500 Stock Index (“S&P 500”) and the Dow Jones U.S. Transportation Average Index, which provide comparisons to a broad-based market index and other companies in the transportation industry. As shown in the graph, CSX’s five-year stock returns significantly outpaced those of the S&P 500.
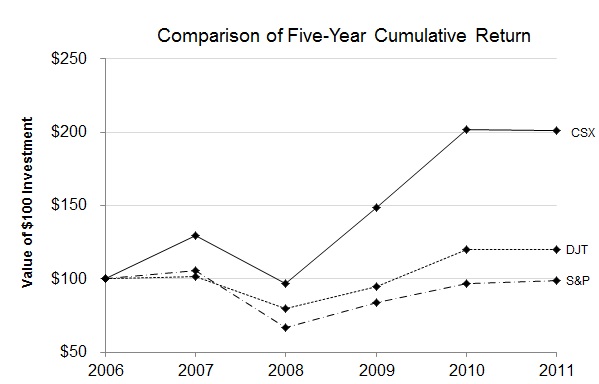
* The S&P 500 is a registered trademark of the McGraw-Hill Companies, Inc.
CSX Purchases of Equity Securities
CSX is required to disclose any purchases of its own common stock for the most recent quarter. CSX purchases its own shares for two primary reasons: to further its goals under its share repurchase program and to fund the Company’s contribution required to be paid in CSX common stock under a 401(k) plan which covers certain union employees.
In 2011, CSX repurchased a total of
$1.6 billion
of common stock, which includes
$1.3 billion
from the new share repurchase program announced in May 2011. As of
December 30, 2011
, the Company had remaining authority of
$734 million
under this new
$2 billion
program. The Company may purchase shares from time to time on the open market, through block trades or otherwise. CSX did not repurchase any shares in the fourth quarter of 2011, and as such, no table showing shares repurchased in the quarter is required. CSX expects to complete the remaining repurchase amount by the end of 2012 based on market and business conditions. Since year end, the Company has completed
$178 million
of additional share repurchases through a trade date of
February 15, 2012
.
23
Selected financial data related to the Company’s financial results for the last five fiscal years are listed below.
|
|
|
Fiscal Years
|
||||||||||||||||||||
|
(Dollars and Shares in Millions, Except Per Share Amounts)
|
2011
|
2010
|
2009
|
2008
|
2007
|
|||||||||||||||||
|
Financial Performance
|
|
|
|
|
|
|||||||||||||||||
|
|
Revenue
|
$
|
11,743
|
|
$
|
10,636
|
|
$
|
9,041
|
|
$
|
11,255
|
|
$
|
10,030
|
|
||||||
|
|
Expense
|
8,325
|
|
7,565
|
|
6,771
|
|
8,504
|
|
7,784
|
|
|||||||||||
|
|
Operating Income
|
$
|
3,418
|
|
$
|
3,071
|
|
$
|
2,270
|
|
$
|
2,751
|
|
$
|
2,246
|
|
||||||
|
Net Earnings from Continuing Operations
|
$
|
1,822
|
|
$
|
1,563
|
|
$
|
1,128
|
|
$
|
1,485
|
|
$
|
1,227
|
|
|||||||
|
|
Operating Ratio
|
70.9
|
%
|
71.1
|
%
|
74.9
|
%
|
75.6
|
%
|
77.6
|
%
|
|||||||||||
|
Earnings Per Share:
(a)
|
|
|
|
|
|
|||||||||||||||||
|
|
From Continuing Operations, Basic
|
$
|
1.68
|
|
$
|
1.37
|
|
$
|
0.96
|
|
$
|
1.23
|
|
$
|
0.95
|
|
||||||
|
|
From Continuing Operations, Assuming Dilution
|
1.67
|
|
1.35
|
|
0.95
|
|
1.21
|
|
0.91
|
|
|||||||||||
|
|
Average Common Shares Outstanding
|
1,083
|
|
1,143
|
|
1,176
|
|
1,204
|
|
1,293
|
|
|||||||||||
|
|
Average Common Shares Outstanding, Assuming Dilution
|
1,089
|
|
1,154
|
|
1,187
|
|
1,228
|
|
1,347
|
|
|||||||||||
|
Financial Position
|
|
|
|
|
|
|||||||||||||||||
|
|
Cash, Cash Equivalents and Short-term Investments
|
$
|
1,306
|
|
$
|
1,346
|
|
$
|
1,090
|
|
$
|
745
|
|
$
|
714
|
|
||||||
|
|
Total Assets
|
29,473
|
|
28,141
|
|
26,887
|
|
26,154
|
|
25,417
|
|
|||||||||||
|
|
Long-term Debt
|
8,734
|
|
8,051
|
|
7,895
|
|
7,512
|
|
6,470
|
|
|||||||||||
|
|
Shareholders' Equity
|
8,468
|
|
8,700
|
|
8,768
|
|
7,985
|
|
8,612
|
|
|||||||||||
|
|
Dividend Per Share
(a)
|
$
|
0.45
|
|
$
|
0.33
|
|
$
|
0.29
|
|
$
|
0.26
|
|
$
|
0.18
|
|
||||||
|
Additional Data
|
|
|
|
|
|
|||||||||||||||||
|
|
Capital Expenditures
(b)
|
$
|
2,297
|
|
$
|
1,840
|
|
$
|
1,586
|
|
$
|
1,784
|
|
$
|
1,806
|
|
||||||
|
|
Employees -- Annual Averages
|
31,344
|
|
30,066
|
|
30,202
|
|
33,348
|
|
33,977
|
|
|||||||||||
|
(a)
|
Earnings per share and dividends per share data were retroactively restated to reflect the three-for-one stock split effective May 31, 2011.
|
|
(b)
|
Capital Expenditures include investments related to reimbursable public-private partnerships. These investments of approximately $100 million in 2011 are projects that are partially or wholly reimbursed to CSX through either government grants or other funding sources such as cash received from a property sale. These reimbursements may not be fully received in a given year; therefore the timing of receipts may differ from the timing of the investment. See the capital expenditures table on page 43 for additional information.
|
24
STRATEGIC OVERVIEW
CSX provides rail-based freight transportation services including traditional rail service and the transport of intermodal containers and trailers. The Company and the rail industry provide customers with access to an expansive and interconnected transportation network that plays a key role in North American commerce and is critical to the economic success and global competitiveness of the United States. America is once again poised for a period of growth in manufacturing, as the economy continues to recover. The U.S. demand to move more goods by rail is expected to rise along with the need to reduce highway congestion and greenhouse gas emissions. CSX and freight railroads are the best way to meet this demand while reducing environmental impacts. CSX can move a ton of freight almost 500 miles on one gallon of fuel and, on average, over three times more fuel efficiently than trucks.
CSX's network is positioned to reach nearly two-thirds of Americans, who account for the majority of the nation's consumption of goods. Through this network, the Company transports a diverse portfolio of products and commodities to meet the country's needs. These products range from energy sources like coal and ethanol, to automobiles, chemicals, building materials, paper, metals, grains and consumer products.
The Company categorizes these products into three primary lines of business: merchandise, coal and intermodal. CSX's transportation solutions connect industries across the United States with each other and with global markets to meet the transportation needs of port facilities, energy producers, manufacturers, industrial producers, construction companies, farmers and feed mills, wholesalers and retailers and the United States armed forces.
CSX services are delivered by dedicated employees whose jobs cannot be exported overseas. Railroad jobs are among some of the nation's highest paying. In 2011, CSX continued its job creation efforts by hiring more than 4,000 new employees that will carry forward with this legacy.
Strategic Growth Initiatives
As CSX continues to strengthen its core business, the Company is focusing on three key strategic growth initiatives related to intermodal, export coal and total service integration. The Company believes these initiatives will allow it to capture additional domestic and international volume, while improving service offerings to its customers in a cost-effective manner.
The Company's intermodal business is an economical, environmentally-friendly alternative to transporting freight on highways via truck. CSX is capitalizing on this opportunity by building new terminals and increasing network capacity. Construction of a new intermodal terminal in Louisville, Kentucky and major terminal expansion projects such as the Worcester, Massachusetts and Columbus, Ohio terminals are currently underway. These investments are in addition to the Company's new Northwest Ohio intermodal terminal that became operational during first quarter 2011. This high-capacity terminal, which is part of CSX's National Gateway initiative discussed below, expands service offerings to customers as well as improves market access to and from east coast ports.
Rapid economic growth in developing countries such as India, China and Brazil has generated a long term growth cycle in export coal demand. As a result of the increase in global steel production, demand for U.S. coal is expected to remain strong. Demand for coal used in electric power generation is also expected to remain high due to rising consumption as developing countries become more urbanized. These increases in global coal demand are expected to largely be met by export shipments with a considerable portion originating from the U.S. The Company is well-positioned to capitalize on this market growth through its network access to large U.S. coal suppliers and multiple port facilities.
25
CSX's Total Service Integration (“TSI”) initiative, which was launched in 2006, supports growth by improving service, optimizing train size, and increasing asset utilization for unit train shipments from origin to destination. CSX is now advancing this initiative to enhance service quality for customers who ship by the carload. This program, TSI Carload, focuses where the customer is impacted most - during the first and last mile of service. These enhancements aim to improve service levels and reliability of rail transportation over other modes of transportation. These improvements to operational processes, customer communication and service will better align the Company's operating capabilities with customers' needs.
Balanced Approach to Capital Deployment
CSX remains highly committed to delivering value to shareholders through a balanced approach to deploying capital that includes investments in infrastructure, dividend growth and share repurchases. In 2011, the Company invested $2.3 billion to further enhance the capacity, quality, safety and flexibility of its network. Included in this amount is approximately $100 million of investments related to reimbursable public-private partnerships where reimbursements may not be fully received in a given year. In addition, CSX continues to return value to its shareholders in the form of dividends and share repurchases. The Company has increased its quarterly cash dividend nine times over the last six year period which represents a 36 percent compounded annual growth rate. Also during 2011, CSX announced a new $2 billion share repurchase authority expected to be completed by the end of 2012 based on market and business conditions.
Public-Private Partnerships
Expanding capacity on U.S. rail networks will provide substantial public benefits including job creation, increased business activity at U.S. ports, reduced highway congestion and lower air emissions. Therefore, CSX and its government partners are working jointly to invest in multi-year rail infrastructure projects such as the National Gateway. This initiative is a public-private partnership which will increase intermodal capacity on key corridors between Mid-Atlantic ports and the Midwest. Current projects related to the National Gateway include the expansion of the Virginia Avenue Tunnel in Washington, D.C. and construction for double-stack train clearances in Ohio, West Virginia, Pennsylvania, Maryland and the District of Columbia.
CSX is engaged in another major partnership initiative with the Commonwealth of Massachusetts to expand freight and commuter rail service. Currently, CSX provides service to and from New England. To further improve that service offering to customers, CSX is expanding its intermodal terminal footprint in Worcester, Massachusetts and, with the Commonwealth, is clearing the route from Worcester to the New York state line for double-stack intermodal service.
Additionally, CSX has entered into a transaction with the state of Florida to help alleviate highway congestion through a new commuter rail operation known as SunRail. CSX sold the state a portion of its track for its new commuter rail and will invest the proceeds in additional freight rail capacity and infrastructure within the state. This includes a new automotive and intermodal facility in central Florida.
In summary, these long-term investments discussed above provide a foundation for volume growth and productivity improvement, enhanced customer service and continued advancements in the safety and reliability of operations. To continue these types of investments, the Company must be able to operate in an environment in which it can generate adequate returns and drive shareholder value. CSX will continue to advocate for a fair and balanced regulatory environment to ensure that the value of the Company's rail service would be reflected in any potential new legislation or policies.
26
2011
HIGHLIGHTS
|
•
|
Revenue
increased
$1.1 billion
or
10%
to
$11.7 billion
primarily driven by pricing above inflation and higher fuel recoveries.
|
|
•
|
Expenses
increased
$760 million
or
10%
to
$8.3 billion
driven primarily by higher fuel prices and inflation.
|
|
•
|
Operating income
increased
$347 million
or
11%
to an all-time annual record of
$3.4 billion
and operating ratio
improved
to
70.9%
, also an all-time annual record.
|
|
|
Fiscal Years
|
|||||||||||
|
(in Thousands)
|
2011
|
2010
|
2009
|
|||||||||
|
Volume
|
6,476
|
|
6,384
|
|
5,793
|
|
||||||
|
(in Millions)
|
||||||||||||
|
Revenue
|
$
|
11,743
|
|
$
|
10,636
|
|
$
|
9,041
|
|
|||
|
Expense
|
8,325
|
|
7,565
|
|
6,771
|
|
||||||
|
Operating Income
|
$
|
3,418
|
|
$
|
3,071
|
|
$
|
2,270
|
|
|||
|
Operating Ratio
|
70.9
|
%
|
71.1
|
%
|
74.9
|
%
|
||||||
In
2011
, the Company achieved positive year-over-year volume and revenue results as demand for rail service in the markets CSX serves continued to support profitable growth. Revenue
increased
10%
from prior year, to
$11.7 billion
, with growth in all three major markets - merchandise, coal and intermodal. Ongoing emphasis on pricing above rail inflation, along with higher fuel recovery associated with the increase in fuel prices, drove revenue-per-unit increases in all markets.
Expenses
increased
by
$760 million
, or
10%
, from prior year. This increase was driven primarily by higher fuel prices, inflation and other labor-related costs associated with increased resource levels and training costs focused on service improvements. Although expenses increased year-over-year, CSX was able to achieve a record operating ratio of
70.9%
due to the Company's continued focus on cost control and strong top line growth. Fiscal year 2010 results include an extra week of activity as compared to fiscal year 2011. This activity did not have a material impact on the Company's full year 2010 results of operations.
For additional information, refer to Results of Operations discussed on pages 34 through 37.
27
In addition to the financial highlights described above, the Company measures and reports safety and service performance. The Company strives for continuous improvement in these measures through training, initiatives and investment. For example, the Company's safety and train accident prevention programs rely on broad employee involvement. The programs utilize operating rules training, compliance measurement, root cause analysis and communication that are intended to create a safer environment for employees and the public. Continued capital investment in the Company's assets, including track, bridges, signals, equipment and detection technology also supports safety performance.
The Company routinely collaborates with the FRA and industry organizations as well as federal, state and local governments on the development and implementation of safety programs and initiatives. For example, CSX, Operation Lifesaver, Inc., the U.S. Department of Transportation and other major railroads from across the country have partnered in the Common Sense campaign to reduce the number of injuries and deaths around tracks and trains. In addition to these initiatives, CSXT also has an ongoing public safety program to clear-cut trees and vegetation at public passive highway-rail intersections (crossings with no flashing lights or gates) to improve the public's ability to discern rail hazards.
During 2011, the Company's safety metrics improved. For 2011, the Federal Railroad Administration (“FRA”) personal injury rate improved 10% to 0.91, compared to 1.01 in 2010. This is a record full year personal injury performance for CSX. The 2011 reported FRA train accident frequency rate improved 14% to 2.32, compared to 2.69 in 2010. These improvements were achieved through a sustained commitment to safety.
Key service measures in 2011 slightly declined as the impact of severe weather on first half 2011 operations were partially offset by improvements gained from additional resources added in the second half of 2011. On-time train originations declined to 72% from 75% in 2010 while on-time arrivals declined to 62% from 69% in 2010. Dwell time increased to 25.9 hours from 25.0 hours in 2010. Average train velocity declined 2% to 20.6 miles per hour. While these key measures declined on a year-over-year basis, fourth quarter 2011 measures were markedly improved, and continue to support efficient and reliable train operations for CSX's customers.
28
Operating Statistics
(Estimated)
|
|
Fiscal Years
|
Improvement/
|
||||||||
|
|
2011
|
2010
|
(Decline)
|
|||||||
|
Safety and
|
FRA Personal Injury Frequency Index
|
0.91
|
|
1.01
|
|
10
|
%
|
|||
|
Service
|
||||||||||
|
Measurements
|
FRA Train Accident Rate
|
2.32
|
|
2.69
|
|
14
|
%
|
|||
|
|
On-Time Train Originations
|
72
|
%
|
75
|
%
|
(4
|
)%
|
|||
|
|
On-Time Destination Arrivals
|
62
|
%
|
69
|
%
|
(10
|
)%
|
|||
|
|
Dwell
|
25.9
|
|
25.0
|
|
(4
|
)%
|
|||
|
|
Cars-On-Line
|
206,432
|
|
210,984
|
|
2
|
%
|
|||
|
|
Train Velocity
|
20.6
|
|
21.0
|
|
(2
|
)%
|
|||
|
|
Increase/
|
|||||||||
|
|
(Decrease)
|
|||||||||
|
Resources
|
Route Miles
|
20,998
|
|
21,084
|
|
—
|
%
|
|||
|
|
Locomotives (owned and long-term leased)
|
4,116
|
|
4,072
|
|
1
|
%
|
|||
|
|
Freight Cars (owned and long-term leased)
|
68,659
|
|
70,318
|
|
(2
|
)%
|
|||
Definitions
FRA Personal Injury Frequency Index
– Number of FRA-reportable injuries per 200,000 man-hours.
FRA Train Accident Rate
– Number of FRA-reportable train accidents per million train-miles.
On-Time Train Originations
– Percent of scheduled road trains that depart the origin yard on-time or ahead of schedule.
On-Time Destination Arrivals
– Percent of scheduled road trains that arrive at the destination yard on-time to two hours late (30 minutes for intermodal trains).
Dwell
– Average amount of time in hours between car arrival at and departure from the yard. It does not include cars moving through the yard on the same train.
Cars-On-Line
– An average count of all cars on the network (does not include locomotives, cabooses, trailers, containers or maintenance equipment).
Train Velocity
– Average train speed between terminals in miles per hour (does not include locals, yard jobs, work trains or passenger trains).
29
Free Cash Flow (Non-GAAP Measure)
Free cash flow is considered a non-GAAP financial measure under SEC Regulation G,
Disclosure of Non-GAAP Measures.
Management believes that free cash flow is important in evaluating the Company’s financial performance. Free cash flow should be considered in addition to, rather than a substitute for, cash provided by operating activities. Free cash flow is calculated by using net cash from operations and adjusting for property additions and certain other investing activities. As described below, free cash flow before dividends decreased $94 million to $1.4 billion.
The following table reconciles cash provided by operating activities (GAAP measure) to free cash flow (non-GAAP measure).
|
|
Fiscal Years
|
|||||||||||
|
|
2011
|
2010
|
2009
|
|||||||||
|
(Dollars in Millions)
|
||||||||||||
|
Net cash provided by operating activities
|
$
|
3,491
|
|
$
|
3,261
|
|
$
|
2,039
|
|
|||
|
Property additions
(a)
|
(2,297
|
)
|
(1,840
|
)
|
(1,426
|
)
|
||||||
|
Proceeds from property dispositions
|
240
|
|
108
|
|
45
|
|
||||||
|
Other investing activities
|
(38
|
)
|
(39
|
)
|
9
|
|
||||||
|
Free Cash Flow (before payment of dividends)
|
$
|
1,396
|
|
|
$
|
1,490
|
|
|
$
|
667
|
|
|
|
(a)
|
Property additions include investments related to reimbursable public-private partnerships. These investments of approximately $100 million in 2011 are projects that are partially or wholly reimbursed to CSX through either government grants or other funding sources such as cash received from a property sale. These reimbursements may not be fully received in a given year; therefore the timing of receipts may differ from the timing of the investment. Also, property additions for 2009 above do not include cash payments of new assets using seller financing of approximately
$160 million
. These payments are shown in "other financing activities" on the consolidated cash flow statement.
|
30
FORWARD-LOOKING STATEMENTS
Certain statements in this report and in other materials filed with the SEC, as well as information included in oral statements or other written statements made by the Company, are forward-looking statements. The Company intends for all such forward-looking statements to be covered by the safe harbor provisions for forward-looking statements within the meaning of the Private Securities Litigation Reform Act of 1995 and the provisions of Section 27A of the Securities Act of 1933 and Section 21E of the Securities Exchange Act of 1934. These forward-looking statements within the meaning of the Private Securities Litigation Reform Act may contain, among others, statements regarding:
|
•
|
projections and estimates of earnings, revenues, volumes, rates, cost-savings, expenses, taxes or other financial items;
|
|
•
|
expectations as to results of operations and operational initiatives;
|
|
•
|
expectations as to the effect of claims, lawsuits, environmental costs, commitments, contingent liabilities, labor negotiations or agreements on the Company's financial condition, results of operations or liquidity;
|
|
•
|
management's plans, strategies and objectives for future operations, capital expenditures, dividends, share repurchases, safety and service performance, proposed new services and other matters that are not historical facts, and management's expectations as to future performance and operations and the time by which objectives will be achieved; and
|
|
•
|
future economic, industry or market conditions or performance and their effect on the Company's financial condition, results of operations or liquidity.
|
Forward-looking statements are typically identified by words or phrases such as "will," "should," “believe,” “expect,” “anticipate,” “project,” “estimate,” “preliminary” and similar expressions. The Company cautions against placing undue reliance on forward-looking statements, which reflect its good faith beliefs with respect to future events and are based on information currently available to it as of the date the forward-looking statement is made. Forward-looking statements should not be read as a guarantee of future performance or results and will not necessarily be accurate indications of the timing when, or by which, such performance or results will be achieved.
31
Forward-looking statements are subject to a number of risks and uncertainties and actual performance or results could differ materially from those anticipated by any forward-looking statements. The Company undertakes no obligation to update or revise any forward-looking statement. If the Company does update any forward-looking statement, no inference should be drawn that the Company will make additional updates with respect to that statement or any other forward-looking statements. The following important factors, in addition to those discussed in Part II, Item 1A (Risk Factors) of CSX's most recent annual report on Form 10-K and elsewhere in this report, may cause actual results to differ materially from those contemplated by any forward-looking statements:
|
•
|
legislative, regulatory or legal developments involving transportation, including rail or intermodal transportation, the environment, hazardous materials, taxation, and the potential enactment of initiatives to further regulate the rail industry;
|
|
•
|
the outcome of litigation and claims, including, but not limited to, those related to fuel surcharge, environmental matters, taxes, shipper and rate claims subject to adjudication, personal injuries and occupational illnesses;
|
|
•
|
changes in domestic or international economic, political or business conditions, including those affecting the transportation industry (such as the impact of industry competition, conditions, performance and consolidation) and the level of demand for products carried by CSXT;
|
|
•
|
natural events such as severe weather conditions, including floods, fire, hurricanes and earthquakes, a pandemic crisis affecting the health of the Company's employees, its shippers or the consumers of goods, or other unforeseen disruptions of the Company's operations, systems, property or equipment;
|
|
•
|
competition from other modes of freight transportation, such as trucking and competition and consolidation within the transportation industry generally;
|
|
•
|
the cost of compliance with laws and regulations that differ from expectations (including those associated with Positive Train Control implementation) and costs, penalties and operational impacts associated with noncompliance with applicable laws or regulations;
|
|
•
|
the impact of increased passenger activities in capacity-constrained areas, including potential effects of high speed rail initiatives, or regulatory changes affecting when CSXT can transport freight or service routes;
|
|
•
|
unanticipated conditions in the financial markets that may affect timely access to capital markets and the cost of capital, as well as management's decisions regarding share repurchases;
|
|
•
|
changes in fuel prices, surcharges for fuel and the availability of fuel;
|
|
•
|
the impact of natural gas prices on coal-fired electricity generation;
|
|
•
|
availability of insurance coverage at commercially reasonable rates or insufficient insurance coverage to cover claims or damages;
|
32
|
•
|
the inherent business risks associated with safety and security, including the availability and vulnerability of information technology, adverse economic or operational effects from actual or threatened war or terrorist activities and any governmental response;
|
|
•
|
labor and benefit costs and labor difficulties, including stoppages affecting either the Company's operations or customers' ability to deliver goods to the Company for shipment;
|
|
•
|
the Company's success in implementing its strategic, financial and operational initiatives;
|
|
•
|
changes in operating conditions and costs or commodity concentrations; and
|
|
•
|
the inherent uncertainty associated with projecting economic and business conditions.
|
Other important assumptions and factors that could cause actual results to differ materially from those in the forward-looking statements are specified elsewhere in this report and in CSX's other SEC reports, which are accessible on the SEC's website at
www.sec.gov
and the Company's website at
www.csx.com
. The information on the CSX website is not part of this annual report on Form 10-K.
33
FINANCIAL RESULTS OF OPERATIONS
2011
vs.
2010
Results of Operations
|
|
Fiscal Years
|
|
|
||||||||||||
|
|
2011
|
2010
|
$ Change
|
% Change
|
|||||||||||
|
(Dollars in Millions)
|
|
|
|
||||||||||||
|
Revenue
|
$
|
11,743
|
|
$
|
10,636
|
|
$
|
1,107
|
|
10
|
%
|
||||
|
Expense
|
|||||||||||||||
|
Labor and Fringe
|
3,073
|
|
2,957
|
|
(116
|
)
|
(4
|
)
|
|||||||
|
Materials, Supplies and Other
|
2,229
|
|
2,075
|
|
(154
|
)
|
(7
|
)
|
|||||||
|
Fuel
|
1,668
|
|
1,212
|
|
(456
|
)
|
(38
|
)
|
|||||||
|
Depreciation
|
976
|
|
947
|
|
(29
|
)
|
(3
|
)
|
|||||||
|
Equipment and Other Rents
|
379
|
|
374
|
|
(5
|
)
|
(1
|
)
|
|||||||
|
Total Expense
|
8,325
|
|
7,565
|
|
(760
|
)
|
(10
|
)
|
|||||||
|
Operating Income
|
$
|
3,418
|
|
$
|
3,071
|
|
$
|
347
|
|
11
|
|
||||
|
Interest Expense
|
(552
|
)
|
(557
|
)
|
5
|
|
1
|
|
|||||||
|
Other Income - Net
|
22
|
|
32
|
|
(10
|
)
|
(31
|
)
|
|||||||
|
Income Tax Expense
|
(1,066
|
)
|
(983
|
)
|
(83
|
)
|
(8
|
)
|
|||||||
|
Net Earnings
|
$
|
1,822
|
|
$
|
1,563
|
|
$
|
259
|
|
17
|
|
||||
|
Earnings Per Diluted Share:
|
|||||||||||||||
|
Net Earnings
|
$
|
1.67
|
|
$
|
1.35
|
|
$
|
0.32
|
|
24
|
%
|
||||
|
Operating Ratio
|
70.9
|
%
|
71.1
|
%
|
20 bps
|
|
|||||||||
|
Volume and Revenue
(Unaudited)
|
|||||||||||||||||||||||||||||||
|
Volume (Thousands of units); Revenue (Dollars in Millions); Revenue Per Unit (Dollars)
|
|||||||||||||||||||||||||||||||
|
Fiscal Years
(a)
|
|||||||||||||||||||||||||||||||
|
|
Volume
|
Revenue
|
Revenue Per Unit
|
||||||||||||||||||||||||||||
|
|
2011
|
2010
|
% Change
|
2011
|
2010
|
% Change
|
2011
|
2010
|
% Change
|
||||||||||||||||||||||
|
Agricultural
|
|
|
|
|
|
|
|||||||||||||||||||||||||
|
Agricultural Products
|
424
|
|
446
|
|
(5
|
)%
|
$
|
1,048
|
|
$
|
1,056
|
|
(1
|
)%
|
$
|
2,472
|
|
$
|
2,368
|
|
4
|
%
|
|||||||||
|
Phosphates and Fertilizers
|
321
|
|
313
|
|
3
|
|
490
|
|
465
|
|
5
|
|
1,526
|
|
1,486
|
|
3
|
|
|||||||||||||
|
Food and Consumer
|
101
|
|
102
|
|
(1
|
)
|
263
|
|
245
|
|
7
|
|
2,604
|
|
2,402
|
|
8
|
|
|||||||||||||
|
Industrial
|
|||||||||||||||||||||||||||||||
|
Chemicals
|
462
|
|
461
|
|
—
|
|
1,596
|
|
1,485
|
|
7
|
|
3,455
|
|
3,221
|
|
7
|
|
|||||||||||||
|
Automotive
|
361
|
|
340
|
|
6
|
|
936
|
|
800
|
|
17
|
|
2,593
|
|
2,353
|
|
10
|
|
|||||||||||||
|
Metals
|
265
|
|
243
|
|
9
|
|
613
|
|
520
|
|
18
|
|
2,313
|
|
2,140
|
|
8
|
|
|||||||||||||
|
Housing and Construction
|
|||||||||||||||||||||||||||||||
|
Emerging Markets
|
439
|
|
418
|
|
5
|
|
672
|
|
615
|
|
9
|
|
1,531
|
|
1,471
|
|
4
|
|
|||||||||||||
|
Forest Products
|
281
|
|
265
|
|
6
|
|
684
|
|
600
|
|
14
|
|
2,434
|
|
2,264
|
|
7
|
|
|||||||||||||
|
Total Merchandise
|
2,654
|
|
2,588
|
|
3
|
|
6,302
|
|
5,786
|
|
9
|
|
2,375
|
|
2,236
|
|
6
|
|
|||||||||||||
|
Coal
|
1,533
|
|
1,573
|
|
(3
|
)
|
3,709
|
|
3,267
|
|
14
|
|
2,419
|
|
2,077
|
|
17
|
|
|||||||||||||
|
Intermodal
(b)
|
2,289
|
|
2,223
|
|
3
|
|
1,434
|
|
1,291
|
|
11
|
|
626
|
|
581
|
|
8
|
|
|||||||||||||
|
Other
|
—
|
|
—
|
|
—
|
|
298
|
|
292
|
|
2
|
|
—
|
|
—
|
|
—
|
|
|||||||||||||
|
Total
|
6,476
|
|
6,384
|
|
1
|
%
|
$
|
11,743
|
|
$
|
10,636
|
|
10
|
%
|
$
|
1,813
|
|
$
|
1,666
|
|
9
|
%
|
|||||||||
(a) CSX follows a 52/53 week fiscal reporting calendar and 2010 included 53 weeks. The revenue impact for the extra week was $171 million.
(b) In fourth quarter 2011
, CSX reduced revenue by $18 million correcting the first nine months of 2011 intermodal revenue on certain interline business. This adjustment is presented in intermodal revenue above and is considered immaterial to the consolidated financial statements.
34
2011
vs.
2010
Results of Operations
CSX full year results reflect positive year-over-year volume and revenue growth as demand for rail service in the markets CSX serves continued to support profitable growth. Ongoing emphasis on pricing above rail inflation, along with higher fuel recovery associated with the increase in fuel prices, drove revenue-per-unit increases in all markets. Fiscal year 2010 results include an extra week of activity as compared to fiscal year 2011.
Volume and Revenue
Merchandise
Agricultural
Agricultural Products
– Volume declined as the amount of feed shipments declined as a result of higher corn prices and decreased production from producers of poultry and pork. These reductions were slightly offset by growth in ethanol and increased shipments of soybeans into the Southeast due to low inventories.
Phosphates and Fertilizers
– Shipments of domestic fertilizers grew as farmers replenished inventories to improve crop yields as a result of higher anticipated crop prices. Export demand was also strong with recovery in exports to Central and South America after last year's drought. Shipments of phosphate rock, which is used to make fertilizer, grew as suppliers are stocking up in anticipation of a strong spring season.
Food and Consumer
– Volume decreased as lower appliance shipments resulting from continued weakness in the housing sector was partially offset by strength in truckload conversions of refrigerated products and manufactured goods.
Industrial
Chemicals
– Volume was flat as strength in frac sand (used in the extraction of gas and petroleum) resulted from the increase in natural gas drilling. This increase was offset by a reduction in basic chemical markets, like plastics, which experienced weak consumer demand and inventory destocking.
Automotive
- Automotive volume grew as North American automotive production increased to meet pent up demand from delayed purchases during the slowed economy over the last few years.
Metals
– Volume growth was driven by strong export demand for scrap shipments and higher domestic steel production resulting from strong demand in the automotive and oil and gas sectors for products such as sheet steel and pipe.
Housing and Construction
Emerging Markets
– Volume increased primarily driven by improved shipments of aggregates (which include crushed stone, sand and gravel), cement and waste (such as construction and demolition debris) as a result of new distribution facilities and overall market growth related to the improving economy.
Forest Products
– Volume increased, despite the weakness in housing-related markets, primarily related to strength in shipments of pulp board and paper used in packaging for consumer products and increased shipments of building products resulting from inventory replenishments.
35
Coal
Shipments of utility coal declined as electrical generation declined in the eastern U.S., natural gas prices remained low and utility stockpiles were above target levels. This decrease was partially offset by higher export shipments driven by greater demand for U.S. coal in Europe, South America and Asia. During 2011, CSX shipped 40.2 million tons of export coal.
The increase in revenue per unit was driven by improved yield, positive mix and fuel recovery.
Intermodal
International and domestic shipment growth resulted from expanded service offerings, over-the-road conversions, and service and network enhancements. The increase in revenue per unit was driven by increased fuel recovery, improved yields and favorable traffic mix. This revenue-per-unit increase was partially offset by the impact of switching from a purchased transportation arrangement to a domestic interline program in the prior year. This program, known as UMAX, provides customers with containers for local shipments or transcontinental service provided jointly by CSX and Union Pacific Corporation.
Other
Other revenue increased due to stronger affiliate revenue and higher incidental charges mostly offset by lower benefits for contract volume commitments as compared to the prior year.
Expense
In
2011
, total expenses increased $760 million or 10% to $8.3 billion compared to prior year. Descriptions of each expense category as well as significant year-over-year changes are described below.
Labor and Fringe
expenses include employee wages and related payroll taxes, health and welfare costs, pension, other post-retirement benefits and incentive compensation. These expenses increased $116 million primarily driven by inflation, increased resource levels and other labor-related costs associated with training focused on service improvements partially offset by lower incentive compensation expense.
Materials, Supplies and Other
expenses consist primarily of materials and contracted services to maintain infrastructure and equipment and for terminal services at automotive facilities. This category also includes costs related to casualty claims, environmental remediation, train accidents, utilities, property and sales taxes and professional services. In addition, this category includes amounts paid to other transportation companies. Total materials, supplies and other expense increased by $154 million in
2011
. The increase was primarily driven by the following:
|
•
|
Volume-related expenses and inflation increased as a result of higher operating and maintenance costs at automotive facilities, coal piers and intermodal terminals. Additionally, maintenance expense increased due to a higher active count of locomotives in service as compared to prior year. Higher travel costs for train crews and other volume-related expenses also contributed to this increase.
|
|
•
|
Casualty expenses increased year-over-year primarily due to the prior year benefit of $49 million not repeated in the current year. This benefit was a result of improvements in safety and occupational claim trends.
|
36
|
•
|
Expense increases were partially offset by approximately $37 million of reduced transportation costs as a result of switching from a purchased transportation agreement to the UMAX domestic interline program in 2010. Additionally, an operating property transaction with the Commonwealth of Massachusetts closed during 2010 and resulted in a $30 million net book loss on a pre-tax basis.
|
Fuel
expense includes locomotive diesel fuel as well as non-locomotive fuel. This expense is driven by the market price and locomotive consumption of diesel fuel. Fuel expense increased $456 million primarily due to a 26% increase in average price per gallon for locomotive fuel. Average fuel price per gallon increased $0.80 from $2.26 in 2010 to $3.06 in 2011.
Depreciation
expense primarily relates to recognizing the costs of a capital asset, such as locomotives, railcars and track structure, over its useful life. This expense is impacted primarily by the capital expenditures made each year. Depreciation expense increased $29 million due to a larger asset base related to higher capital spending partially offset by a multi-year adjustment related to retirements as well as the impact of prior year's additional expense related to the extra week.
Equipment and Other
includes rent paid for freight cars owned by other railroads or private companies, net of rents received by CSXT for use of its equipment. This category of expenses also includes lease expenses for locomotives, railcars, containers and trailers, office and other rentals. These expenses increased $5 million primarily due to volume-related expenses partially offset by cost savings associated with improved asset utilization.
Other
Interest Expense
Interest expense decreased $5 million to $552 million primarily due to lower average interest rates offset by higher average debt balances during 2011.
Other Income – Net
Other income - net decreased $10 million to $22 million related to lower real estate sales and increased non-operating expenses.
Income Tax Expense
Income tax expense increased $83 million to $1.1 billion due to higher earnings during 2011 offset by certain state income tax related adjustments compared to a year ago.
Net Earnings
Net earnings increased $259 million to $1.8 billion and earnings per diluted share increased $0.32 to $1.67 in 2011. This increase was primarily due to higher operating income net of income taxes in 2011.
37
2010
vs.
2009
Results of Operations
|
|
Fiscal Years
|
|
|
||||||||||||
|
|
2010
|
2009
|
$ Change
|
% Change
|
|||||||||||
|
(Dollars in Millions)
|
|
|
|||||||||||||
|
Revenue
|
$
|
10,636
|
|
$
|
9,041
|
|
$
|
1,595
|
|
18
|
%
|
||||
|
Expense
|
|||||||||||||||
|
Labor and Fringe
|
2,957
|
|
2,629
|
|
(328
|
)
|
(12
|
)
|
|||||||
|
Materials, Supplies and Other
|
2,075
|
|
1,999
|
|
(76
|
)
|
(4
|
)
|
|||||||
|
Fuel
|
1,212
|
|
849
|
|
(363
|
)
|
(43
|
)
|
|||||||
|
Depreciation
|
947
|
|
903
|
|
(44
|
)
|
(5
|
)
|
|||||||
|
Equipment and Other Rents
|
374
|
|
391
|
|
17
|
|
4
|
|
|||||||
|
Total Expense
|
7,565
|
|
6,771
|
|
(794
|
)
|
(12
|
)
|
|||||||
|
Operating Income
|
$
|
3,071
|
|
$
|
2,270
|
|
$
|
801
|
|
35
|
|
||||
|
Interest Expense
|
(557
|
)
|
(558
|
)
|
1
|
|
—
|
|
|||||||
|
Other Income - Net
|
32
|
|
34
|
|
2
|
|
6
|
|
|||||||
|
Income Tax Expense
|
(983
|
)
|
(618
|
)
|
(365
|
)
|
(59
|
)
|
|||||||
|
Earnings From Continuing Operations
|
1,563
|
|
1,128
|
|
435
|
|
39
|
|
|||||||
|
Discontinued Operations
|
—
|
|
15
|
|
(15
|
)
|
(100
|
)
|
|||||||
|
Net Earnings
|
$
|
1,563
|
|
$
|
1,143
|
|
$
|
420
|
|
37
|
|
||||
|
Earnings Per Diluted Share:
|
|||||||||||||||
|
Continuing Operations
|
$
|
1.35
|
|
$
|
0.95
|
|
$
|
0.40
|
|
42
|
|
||||
|
Discontinued Operations
|
—
|
|
0.01
|
|
(0.01
|
)
|
(100
|
)
|
|||||||
|
Net Earnings
|
$
|
1.35
|
|
$
|
0.96
|
|
$
|
0.39
|
|
41
|
%
|
||||
|
Operating Ratio
|
71.1
|
%
|
74.9
|
%
|
380 bps
|
|
|||||||||
|
Volume and Revenue
(Unaudited)
|
|||||||||||||||||||||||||||||||
|
Volume (Thousands of units); Revenue (Dollars in Millions); Revenue Per Unit (Dollars)
|
|||||||||||||||||||||||||||||||
|
Fiscal Years
(a)
|
|||||||||||||||||||||||||||||||
|
|
Volume
|
Revenue
|
Revenue Per Unit
|
||||||||||||||||||||||||||||
|
|
2010
|
2009
|
% Change
|
2010
|
2009
|
% Change
|
2010
|
2009
|
% Change
|
||||||||||||||||||||||
|
Agricultural
|
|
|
|
|
|
|
|||||||||||||||||||||||||
|
Agricultural Products
|
446
|
|
428
|
|
4
|
%
|
$
|
1,056
|
|
$
|
960
|
|
10
|
%
|
$
|
2,368
|
|
$
|
2,243
|
|
6
|
%
|
|||||||||
|
Phosphates and Fertilizers
|
313
|
|
289
|
|
8
|
|
465
|
|
373
|
|
25
|
|
1,486
|
|
1,291
|
|
15
|
|
|||||||||||||
|
Food and Consumer
|
102
|
|
100
|
|
2
|
|
245
|
|
233
|
|
5
|
|
2,402
|
|
2,330
|
|
3
|
|
|||||||||||||
|
Industrial
|
|
||||||||||||||||||||||||||||||
|
Chemicals
|
461
|
|
424
|
|
9
|
|
1,485
|
|
1,267
|
|
17
|
|
3,221
|
|
2,988
|
|
8
|
|
|||||||||||||
|
Automotive
|
340
|
|
234
|
|
45
|
|
800
|
|
511
|
|
57
|
|
2,353
|
|
2,184
|
|
8
|
|
|||||||||||||
|
Metals
|
243
|
|
200
|
|
22
|
|
520
|
|
399
|
|
30
|
|
2,140
|
|
1,995
|
|
7
|
|
|||||||||||||
|
Housing and Construction
|
|
||||||||||||||||||||||||||||||
|
Emerging Markets
|
418
|
|
405
|
|
3
|
|
615
|
|
585
|
|
5
|
|
1,471
|
|
1,444
|
|
2
|
|
|||||||||||||
|
Forest Products
|
265
|
|
258
|
|
3
|
|
600
|
|
547
|
|
10
|
|
2,264
|
|
2,120
|
|
7
|
|
|||||||||||||
|
Total Merchandise
|
2,588
|
|
2,338
|
|
11
|
|
5,786
|
|
4,875
|
|
19
|
|
2,236
|
|
2,085
|
|
7
|
|
|||||||||||||
|
Coal
|
1,573
|
|
1,553
|
|
1
|
|
3,267
|
|
2,727
|
|
20
|
|
2,077
|
|
1,756
|
|
18
|
|
|||||||||||||
|
Intermodal
(b)
|
2,223
|
|
1,902
|
|
17
|
|
1,291
|
|
1,184
|
|
9
|
|
581
|
|
623
|
|
(7
|
)
|
|||||||||||||
|
Other
|
—
|
|
—
|
|
—
|
|
292
|
|
255
|
|
15
|
|
—
|
|
—
|
|
—
|
|
|||||||||||||
|
Total
|
6,384
|
|
5,793
|
|
10
|
%
|
$
|
10,636
|
|
$
|
9,041
|
|
18
|
%
|
$
|
1,666
|
|
$
|
1,561
|
|
7
|
%
|
|||||||||
(a) CSX follows a 52/53 week fiscal reporting calendar and 2010 included 53 weeks. The revenue impact for the extra week was $171 million.
(b) The revenue-per-unit decline was primarily driven by the continued impact of terminating the prior purchased transportation agreement. See the explanation for intermodal variances for further information.
38
2010
vs.
2009
Results of Operations
CSX full year results reflect continued strong year-over-year volume and revenue growth as a result of the improving economy. Ongoing emphasis on pricing above rail inflation, along with higher fuel recovery associated with the increase in fuel prices, drove revenue-per-unit increases in most markets. Fiscal year 2010 results include an extra week of activity as compared to fiscal year 2009.
Volume and Revenue
Merchandise
Agricultural
Agricultural Products
– Volume grew with increased shipments of feed grains and ethanol. Shipments of feed grains improved with expanded meat production and lower wheat imports. Ethanol shipments grew as the amount of ethanol in fuel continued to increase.
Phosphates and Fertilizers
– Volume increased as a result of strength in demand for domestic fertilizers due to a strong planting season and due to replenishment of low inventories.
Food and Consumer
– Volume increased slightly as strength in refrigerated products, primarily fruits and vegetables, and alcoholic beverages were partially offset by weakness in demand for appliances.
Industrial
Chemicals
– Growth occurred across most markets reflecting improvement in demand for intermediate products used in manufacturing automobiles and consumer goods. Many plastics and chemicals are key inputs in the production of both durable and nondurable goods, as well as packaging.
Automotive
– Strong growth was driven by an increase in North American light-vehicle production in response to increased demand in the improving economy.
Metals
– Volume growth was driven by increased shipments of sheet steel for auto production, increases in scrap steel resulting from higher steel production and increases in energy-related products.
Housing and Construction
Emerging Markets
– Shipments increased in limestone, transportation equipment and aggregates (which include crushed stone, sand and gravel) as a result of overall market growth due to the improving economy.
Forest Products
– Volume increased with strength in shipments of pulp board and paper used in packaging for consumer products. Volume also increased slightly in construction-related markets.
39
Coal
Volume was basically flat as increased export shipments were offset by weakness in utility shipments. Higher export shipments were due to greater demand for U.S. metallurgical coal in Asia and steam coal in Europe. Shipments to utility customers were down as high utility stockpiles were reduced throughout the year and are approaching targeted levels. The increase in revenue per unit was driven by improved yield, higher fuel recovery and longer length of haul.
Intermodal
International and domestic shipment growth resulted from U.S. inventory replenishment, improved U.S. exports, new business, truckload conversions, and new UMAX and door-to-door service offerings.
The revenue-per-unit decline was driven by the impact of switching from a purchased transportation arrangement to a domestic interline program at the start of second quarter. This program, known as UMAX, provides customers with containers for local shipments or transcontinental service provided jointly by CSX and Union Pacific Corporation. This revenue-per-unit decline was partly offset by increased fuel recovery and an improved pricing environment.
Other
Revenue gains were primarily driven by benefits for contract volume commitments not met.
Expense
Total expenses for 2010 increased 12% or $794 million to $7.6 billion compared to the prior year. Descriptions of each expense category as well as significant year-over-year changes are described below.
Labor and
Fringe
expenses include employee wages and related payroll taxes, health and welfare costs, pension, other post-retirement benefits and incentive compensation. These expenses increased $328 million primarily driven by inflation and higher incentive compensation.
Materials, Supplies and Other
expenses consist primarily of materials and contracted services to maintain infrastructure and equipment and for terminal services at automotive facilities. This category also includes costs related to casualty claims, environmental remediation, train accidents, utilities, property and sales taxes and professional services. In addition, this category includes amounts paid to other transportation companies. Total materials, supplies and other expense increased by $76 million in 2010. This increase was primarily driven by the following:
|
•
|
Volume increases drove higher operating and maintenance costs at automotive facilities, coal piers and intermodal terminals. In addition, maintenance expenses increased as locomotives previously held in storage during 2009 due to lower volume were placed back into service during 2010. Higher travel costs for train crews and other volume-related expenses also contributed to this increase.
|
|
•
|
As safety and occupational claim trends have continued to improve, changes in estimate were recorded in both years - $49 million in 2010 and $105 million in 2009. This resulted in a year-over-year increase in casualty expense of $56 million.
|
|
•
|
An operating property transaction with the Commonwealth of Massachusetts closed during 2010 and resulted in a $30 million net book loss on a pre-tax basis. This property is a former Conrail-acquired property. The Company received $50 million of cash related to this transaction.
|
40
|
•
|
The above increases to expense were offset by $126 million of reduced purchased transportation costs as a result of switching from a purchased transportation agreement to the UMAX domestic interline program during 2010 in the intermodal business.
|
Fuel
expense
includes locomotive diesel fuel as well as non-locomotive fuel. This expense is driven by the market price and locomotive consumption of diesel fuel. Fuel expense increased $363 million primarily due to higher fuel prices and higher volume. Average fuel price per gallon increased $0.55 or 32% from $1.71 in 2009 to $2.26 in 2010.
Depreciation
expense primarily relates to recognizing the cost of a capital asset, such as locomotives, railcars and track structure, over its useful life. This expense is impacted primarily by the capital expenditures made each year. Depreciation expense increased $44 million in 2010 primarily due to a larger asset base.
Equipment and Other
includes rent paid for freight cars owned by other railroads or private companies, net of rents received by CSXT for use of its equipment. This category of expenses also includes lease expenses for locomotives, railcars, containers and trailers, office and other rentals. These expenses decreased $17 million primarily due to cost savings associated with improved asset utilization and lower lease expense, partially offset by volume-related increases.
Other
Interest Expense
Interest expense decreased $1 million to $557 million primarily due to lower average debt balances during 2010.
Other Income – Net
Other income decreased $2 million to $32 million primarily related to lower interest income caused by lower cash and investment balances and lower interest rates in 2010.
Income Tax Expense
Income tax expense increased $365 million to $983 million primarily due to higher earnings during 2010.
Net Earnings
Net earnings increased $420 million to $1.6 billion and earnings per diluted share increased $0.39 to $1.35 in 2010. This increase was primarily due to higher operating income net of income taxes in 2010.
41
LIQUIDITY AND CAPITAL RESOURCES
Liquidity is a company’s ability to generate adequate amounts of cash to meet both current and future needs for obligations as they mature and to provide for planned capital expenditures, including those to implement regulatory and legislative initiatives. In order to have a complete picture of a company’s liquidity, its balance sheet, sources and uses of cash flow and external factors should be reviewed.
Material Changes in the Consolidated Balance Sheets and Significant Cash Flows
Consolidated Balance Sheets
CSX's balance sheet reflects its strong capital base and the impact of CSX's balanced approach in deploying its capital for the benefit of its shareholders, which includes investments in infrastructure, dividend improvement and share repurchases.
Total assets increased $1.3 billion from prior year. Assets increased primarily due to the increase in net properties of $1.2 billion from planned capital spending as well as short-term investments grew $469 million. These increases were partially offset by the decrease in cash of $509 million.
Total liabilities and shareholders' equity combined increased $1.3 billion primarily due to the net increase in total debt of $577 million mostly due to additional borrowings. Deferred income tax liability also increased by $548 million primarily related to the net impact of bonus depreciation on tax accruals. Shareholders' equity decreased by $232 million as a result of $1.6 billion of share repurchases since December 2010 partially offset by increased earnings during 2011.
Sources of Cash
The Company has multiple sources of cash. First, the Company generates cash from operations. In
2011
, the Company generated
$3.5 billion
of cash from operating activities which represented a
$230 million
increase
from prior year. This
increase
was primarily driven by higher earnings in
2011
. Second, CSX has access to numerous financing sources including a $1 billion five-year unsecured revolving credit facility that expires in September 2016. As of the date of this filing, the Company has no outstanding balances under this facility. See Note 9, Debt and Credit Agreements for more information.
CSX filed its shelf registration statement with the SEC in February 2010. This shelf registration statement is unlimited as to amount and may be used, subject to market conditions and CSX Board authorization, to issue debt or equity securities at CSX’s discretion. While CSX seeks to give itself flexibility with respect to cash requirements, there can be no assurance that market conditions would permit CSX to sell such debt securities on acceptable terms at any given time, or at all.
42
Uses of Cash
CSX continued to invest in its business to create long-term value for shareholders. In
2011
, net cash used in investing activities was driven by
$2.3 billion
of property additions which
increased
$457 million
from prior year. The Company is committed to maintaining and improving its existing infrastructure and to positioning itself for long-term growth through expanding network and terminal capacity. Funds used for property additions are further described below.
|
|
Fiscal Years
|
||||||||||||
|
Capital Expenditures
(Dollars in Millions)
|
2011
|
2010
|
2009
|
||||||||||
|
Track
|
$
|
785
|
|
$
|
777
|
|
$
|
748
|
|
||||
|
Bridges, Signals and Other
|
421
|
|
475
|
|
363
|
|
|||||||
|
Total Infrastructure
|
1,206
|
|
1,252
|
|
1,111
|
|
|||||||
|
Freight Cars
|
373
|
|
157
|
|
71
|
|
|||||||
|
Capacity and Commercial Facilities
|
264
|
|
258
|
|
169
|
|
|||||||
|
Regulatory (including PTC)
|
210
|
|
133
|
|
57
|
|
|||||||
|
Locomotives
|
142
|
|
25
|
|
19
|
|
|||||||
|
Public-Private Partnerships - net
(a)
|
102
|
|
15
|
|
(1
|
)
|
|||||||
|
Total Property Additions
|
2,297
|
|
1,840
|
|
1,426
|
|
|||||||
|
Cash paid for new assets using seller financing
(b)
|
—
|
|
—
|
|
160
|
|
|||||||
|
Total Capital Expenditures
(a)
|
$
|
2,297
|
|
$
|
1,840
|
|
$
|
1,586
|
|
||||
|
(a)
|
Total capital expenditures shown above include investments related to reimbursable public-private partnerships. These investments of approximately $100 million in 2011 are projects that are partially or wholly reimbursed to CSX through either government grants or other funding sources such as cash received from a property sale. These reimbursements may not be fully received in a given year; therefore the timing of receipts may differ from the timing of the investment.
|
|
(b)
|
Cash paid for new assets purchased using seller financing shown above in 2009 was for locomotives and freight cars and are included in “other financing activities” on the consolidated cash flow statement.
|
In addition to capital investments, the Company uses cash for scheduled payments of debt and leases and to pay dividends to shareholders. CSX paid dividends of
$480 million
in
2011
, which was
$108 million
more than prior year. This increase was due to an increase in the quarterly dividend to $0.09 per share at the beginning of
2011
and then to $0.12 in second quarter
2011
. Net cash used in financing activities was
$1.4 billion
which increased
$186 million
primarily as a result of $1.6 billion of share repurchases partially offset by net debt in
2011
.
CSX is continually evaluating market and regulatory conditions that could affect the Company’s ability to generate sufficient returns on capital investments. CSX may revise its future estimates for capital spending as a result of changes in business conditions, tax legislation or the enactment of new laws or regulations. Although new legislation or regulations, such as the STB Reauthorization Bill or climate change legislation, could have a material adverse effect on the Company’s operations and financial performance in the future (see Risk Factors under Item 1A of this Form 10-K), it is too early to predict the manner or severity of such impact.
43
Liquidity and Working Capital
Currently, CSX is well positioned from a liquidity standpoint. The Company ended the year with over
$1.3 billion
of cash, cash equivalents and short-term investments. CSX also replaced its existing credit facility that was set to expire in May 2012 with a new $1 billion unsecured revolving credit facility backed by a diverse syndicate of banks. This facility expires in September 2016. The Company has no outstanding balances under this facility as of the date of this filing. Additionally in 2011, CSX issued a total of $1.2 billion of new long-term debt. CSX uses current cash balances for general corporate purposes, which may include capital expenditures, working capital requirements, improvements in productivity, dividends to shareholders, debt repayments and repurchases of CSX common stock. See Note 9, Debt and Credit Agreements.
The Company's $250 million receivables securitization facility has a 364-day term and expires in
December 2012
. The Company plans to renew this facility prior to its expiration. The purpose of this facility is to provide an alternative to commercial paper and a low cost source of short-term liquidity. As of the date of this filing, the Company has no outstanding balances under this facility. Under the terms of this facility, CSXT transfers eligible third-party receivables to CSX Trade Receivables, a bankruptcy-remote special purpose subsidiary. A separate subsidiary of CSX services the receivables. Upon transfer, the receivables become assets of CSX Trade Receivables and are not available to the creditors of CSX or any of its other subsidiaries. In the event CSX Trade Receivables draws under this facility, the Company will record an equivalent amount of debt on its consolidated financial statements.
Working capital can also be considered a measure of a company’s ability to meet its short-term needs. CSX had a working capital
surplus
of
$248 million
and
$318 million
at December
2011
and
2010
, respectively. This lower surplus since the prior year is primarily due to a deferred gain included in current liabilities. See sources and uses of cash description above.
The Company’s working capital balance varies due to factors such as the timing of scheduled debt payments and changes in cash and cash equivalent balances as discussed above. Although the Company currently has a surplus, a working capital deficit is not unusual for CSX or other companies in the industry and does not indicate a lack of liquidity. The Company continues to maintain adequate current assets to satisfy current liabilities and maturing obligations when they come due. Furthermore, CSX has sufficient financial capacity, including its revolving credit facility, trade receivable facility and shelf registration statement to manage its day-to-day cash requirements and any anticipated obligations. The Company from time to time accesses the credit markets for additional liquidity.
Credit Ratings
Credit ratings reflect an independent agency’s judgment on the likelihood that a borrower will repay a debt obligation at maturity. The ratings reflect many considerations, such as the nature of the borrower’s industry and its competitive position, the size of the company, its liquidity and access to capital and the sensitivity of a company’s cash flows to changes in the economy. The two largest rating agencies, Standard & Poor’s Ratings Services (“S&P”) and Moody’s Investors Service (“Moody’s”), use alphanumeric codes to designate their ratings. The highest quality rating for long-term credit obligations is AAA and Aaa for S&P and Moody’s, respectively. A credit rating is not a recommendation to buy, sell or hold securities and may be subject to revision or withdrawal at any time by the assigning rating agency.
Currently, CSX is rated BBB with a stable outlook by S&P and Baa3 with a positive outlook by Moody's. Ratings of BBB- and Baa3 or better by S&P and Moody’s, respectively, reflect ratings on debt obligations that fall within a band of credit quality considered to be investment grade. If CSX's credit ratings were to decline to lower levels, the Company could experience significant increases in its interest cost for new debt. In addition, a decline in CSX’s credit ratings could adversely affect the market’s demand, and thus the Company’s ability to readily issue new debt.
44
SCHEDULE OF CONTRACTUAL OBLIGATIONS AND COMMERCIAL COMMITMENTS
The following tables set forth maturities of the Company's contractual obligations and other commitments:
|
Type of Obligation
|
2012
|
2013
|
2014
|
2015
|
2016
|
Thereafter
|
Total
|
||||||||||||||
|
(Dollars in Millions) (Unaudited)
|
|
|
|
|
|
|
|
||||||||||||||
|
Contractual Obligations
|
|
|
|
|
|
|
|
||||||||||||||
|
Total Debt (See Note 9)
|
$
|
507
|
|
$
|
780
|
|
$
|
527
|
|
$
|
628
|
|
$
|
23
|
|
$
|
6,776
|
|
$
|
9,241
|
|
|
Interest on Debt
|
552
|
|
519
|
|
482
|
|
433
|
|
412
|
|
5,040
|
|
7,438
|
|
|||||||
|
Purchase Obligations (See Note 7)
|
828
|
|
357
|
|
336
|
|
322
|
|
297
|
|
2,488
|
|
4,628
|
|
|||||||
|
Operating Leases - Net (See Note 7)
(a)
|
65
|
|
41
|
|
58
|
|
25
|
|
23
|
|
155
|
|
367
|
|
|||||||
|
Agreements with Conrail
(a)
|
1
|
|
2
|
|
2
|
|
1
|
|
1
|
|
—
|
|
7
|
|
|||||||
|
Total Contractual Obligations
|
$
|
1,953
|
|
$
|
1,699
|
|
$
|
1,405
|
|
$
|
1,409
|
|
$
|
756
|
|
$
|
14,459
|
|
$
|
21,681
|
|
|
Other Commitments
(b)
|
$
|
170
|
|
—
|
|
—
|
|
—
|
|
—
|
|
—
|
|
$
|
170
|
|
|||||
|
(a)
|
Agreements with Conrail represent minimum future lease payments of
$7 million
for freight cars and locomotives (see Note 13, Related Party Transactions). This amount plus total operating leases-net of
$367 million
above equals total net lease commitments of
$374 million
disclosed in Note 7, Commitments and Contingencies.
|
|
(b)
|
Other commitments of
$170 million
consisted of surety bonds, letters of credit and uncertain tax positions. Surety bonds of
$108 million
and letters of credit of
$40 million
arise from assurances issued by a third-party that CSX will fulfill certain obligations and are typically a contract, state, federal or court requirement. Uncertain tax positions of
$22 million
which include interest and penalties are all included in year 2012. The year of settlement can not be reasonably estimated, however, the Company believes at least $4 million of these unrecognized tax benefits will be resolved in the next 12 months.
|
OFF-BALANCE SHEET ARRANGEMENTS
For detailed information about the Company’s guarantees, operating leases and purchase obligations, see Note 7, Commitments and Contingencies.
There are no off-balance sheet arrangements that are reasonably likely to have a material effect on the Company’s financial condition, results of operations or liquidity.
45
CRITICAL ACCOUNTING ESTIMATES
The preparation of financial statements in conformity with accounting principles generally accepted in the United States requires that management make estimates in reporting the amounts of certain assets and liabilities, the disclosure of contingent assets and liabilities at the date of the financial statements and certain revenues and expenses during the reporting period. Actual results may differ from those estimates. These estimates and assumptions are discussed with the Audit Committee of the Board of Directors on a regular basis. Consistent with the prior year, significant estimates using management judgment are made for the following areas:
|
•
|
casualty, environmental and legal reserves;
|
|
•
|
pension and post-retirement medical plan accounting;
|
|
•
|
depreciation policies for assets under the group-life method; and
|
|
•
|
income taxes
|
Casualty, Environmental and Legal Reserves
Casualty
Casualty reserves represent accruals for personal injury, occupational injury and asbestos claims. During 2010 the Company increased its self-insured retention amount for these claims from
$25 million
to
$50 million
per injury for claims occurring on or after June 1, 2010. Currently, no individual claim is expected to exceed the Company's self-insured retention amount. In accordance with the
Contingencies Topic
in the Financial Accounting Standards Board's ("FASB") Accounting Standards Codification ("ASC"), to the extent the value of an individual claim exceeds the self-insured retention amount, the Company would present the liability on a gross basis with a corresponding receivable for insurance recoveries. These reserves fluctuate based upon the timing of payments as well as changes in independent third-party estimates, which are reviewed by management. Actual results may vary from estimates due to the number, type and severity of the injury, costs of medical treatments and uncertainties in litigation.
Most of the claims relate to CSXT unless otherwise noted below. Defense and processing costs, which historically have been insignificant and are anticipated to be insignificant in the future, are not included in the recorded liabilities.
As of December
2011
, the Company had
$372 million
in casualty reserves. See below for details regarding changes in estimate for casualty reserves.
Personal Injury
Personal injury reserves represent liabilities for employee work-related and third-party injuries. Work-related injuries for CSXT employees are primarily subject to the Federal Employers’ Liability Act (“FELA”). In addition to FELA liabilities, employees of other CSX subsidiaries are covered by various state workers’ compensation laws, the Federal Longshore and Harbor Workers’ Compensation Program or the Maritime Jones Act.
46
Critical Accounting Estimates,
continued
CSXT retains an independent actuarial firm to assist management in assessing the value of personal injury claims. An analysis is performed by the independent actuarial firm quarterly and is reviewed by management. The methodology used by the actuary includes a development factor to reflect growth or reduction in the value of these personal injury claims. It is based largely on CSXT's historical claims and settlement experience.
During 2011, there were no significant changes in estimates in personal injury reserves. During 2010, the Company reduced personal injury reserves by $24 million due to a downward trend in the number of injuries. This downward trend was measured by the reduction of the CSXT's Federal Railroad Administration (“FRA”) personal injury rate. Adjustments to the reserves are included in materials, supplies and other in the consolidated income statements.
Occupational & Asbestos
Occupational claims arise from allegations of exposures to certain materials in the workplace, such as solvents, soaps, chemicals (collectively referred to as “irritants”) and diesel fuels (from exhaust fumes) or allegations of chronic physical injuries resulting from work conditions, such as repetitive stress injuries, carpal tunnel syndrome and hearing loss.
The Company is also party to a number of asbestos claims by employees alleging exposure to asbestos in the workplace. The heaviest possible exposure for employees resulted from work conducted in and around steam locomotive engines that were largely phased out beginning around the 1950s. Other types of exposures, however, including exposure from locomotive component parts and building materials, continued until these exposures were substantially eliminated by 1985. Additionally, the Company has retained liability for asbestos claims filed against its previously owned international container shipping business. Diseases associated with asbestos typically have long latency periods (amount of time between exposure to a disease and the onset of the disease) which can range from
10 to 40 years
after exposure.
Occupational and asbestos claims are analyzed by a third-party actuary or specialist (the "third-party specialist"), respectively, in order to determine the number of unasserted or incurred but not reported (“IBNR”) claims. Analyses of both types of claims are performed by the third-party specialist and reviewed by management. This review is quarterly for occupational claims and annually for asbestos claims. Since exposure to asbestos has been substantially eliminated, this review is completed annually. For asserted occupational and asbestos claims, management reviews quarterly. With the exception of carpal tunnel, management has determined that seven years is the most probable time period in which unasserted claim filings and claim values can be estimated. Carpal tunnel claims use a three-year period to estimate the reserve due to the shorter latency period for these types of injuries.
The third-party specialists analyze CSXT’s historical claim filings, settlement amounts, and dismissal rates to determine future anticipated claim filing rates and average settlement values for occupational and asbestos claims reserves. The potentially exposed population is estimated by using CSX employment records and industry data From this analysis, the third-party specialists provide an estimate of the IBNR claims liability.
The estimated future filing rates and estimated average claim values are the most sensitive assumptions for these reserves. A
1%
increase or decrease in either the forecasted number of occupational and asbestos IBNR claims or the average claim values would result in approximately a
$1 million
increase or decrease in the liability recorded for unasserted occupational and asbestos claims.
47
Critical Accounting Estimates,
continued
During 2011, there were
no
significant changes in estimate recorded to adjust occupational or asbestos reserves. During 2010, the Company reduced occupational reserves by
$12 million
primarily attributable to a decrease in the number of repetitive stress injury claims and lower settlement values for irritant claims. Also during
2010
, the Company reduced its reserves for asbestos claims by
$13 million
, primarily related to a significant number of claims that were determined to have no value due to lack of sufficient medical evidence. Adjustments in reserves are included in materials, supplies and other in the consolidated income statements.
Environmental
The Company is a party to various proceedings related to environmental issues, including administrative and judicial proceedings involving private parties and regulatory agencies. The Company has been identified as a potentially responsible party at approximately
246
environmentally impaired sites. Many of these are, or may be, subject to remedial action under the federal Comprehensive Environmental Response, Compensation and Liability Act of 1980, or CERCLA, also known as the Superfund Law, or similar state statutes. Most of these proceedings arose from environmental conditions on properties used for ongoing or discontinued railroad operations. A number of these proceedings, however, are based on allegations that the Company, or its predecessors, sent hazardous substances to facilities owned or operated by others for treatment, recycling or disposal. In addition, some of the Company’s land holdings were leased to others for commercial or industrial uses that may have resulted in releases of hazardous substances or other regulated materials onto the property and could give rise to proceedings against the Company.
In any such proceedings, the Company is subject to environmental clean-up and enforcement actions under the Superfund Law, as well as similar state laws that may impose joint and several liability for clean-up and enforcement costs on current and former owners and operators of a site without regard to fault or the legality of the original conduct. These costs could be substantial.
In accordance with the
Asset Retirement and Environmental Obligations Topic
in the ASC, the Company reviews its role with respect to each site identified at least quarterly, giving consideration to a number of factors such as:
|
•
|
type of clean-up required;
|
|
•
|
nature of the Company’s alleged connection to the location (e.g., generator of waste sent to the site or owner or operator of the site);
|
|
•
|
extent of the Company’s alleged connection (e.g., volume of waste sent to the location and other relevant factors); and
|
|
•
|
number, connection and financial viability of other named and unnamed potentially responsible parties at the location.
|
48
Critical Accounting Estimates,
continued
As of December
2011
, the Company had
$83 million
in environmental reserves. These recorded liabilities for estimated future environmental costs are undiscounted and include future costs for remediation and restoration of sites as well as any significant ongoing monitoring costs, but exclude any anticipated insurance recoveries. Based on the review process, the Company has recorded amounts to cover contingent anticipated future environmental remediation costs with respect to each site to the extent such costs are estimable and probable. Payments related to these liabilities are expected to be made over the next several years. Environmental remediation costs are included in materials, supplies and other on the consolidated income statement.
Currently, the Company does not possess sufficient information to reasonably estimate the amounts of additional liabilities, if any, on some sites until completion of future environmental studies. In addition, conditions that are currently unknown could, at any given location, result in additional exposure, the amount and materiality of which cannot presently be reliably estimated. Based upon information currently available, however, the Company believes its environmental reserves are adequate to fund remedial actions to comply with present laws and regulations.
Legal
In accordance with the Contingencies Topic in the ASC, an accrual for a loss contingency is established if information available prior to issuance of the financial statements indicates that it is probable that an asset has been impaired or a liability has been incurred at the date of the financial statements, and the amount of loss can be reasonably estimated. If no accrual is made for a loss contingency because one or both of these conditions are not met, or if an exposure to loss exists in excess of the amount accrued, disclosure of the contingency is made when there is at least a reasonable possibility that a loss or an additional loss may have been incurred.
The Company evaluates all exposures relating to legal liabilities at least quarterly and adjusts reserves when appropriate under the guidance noted above. The amount of a particular reserve may be influenced by factors that include official rulings, newly discovered or developed evidence, or changes in laws, regulations and evidentiary standards.
See Item 3. Legal Proceedings for further discussion of these items.
Pension and Post-retirement Medical Plan Accounting
The Company sponsors defined benefit pension plans principally for salaried, management personnel. The plans provide eligible employees with retirement benefits based predominantly on years of service and compensation rates near retirement. For employees hired in 2003 or thereafter, benefits are determined based on a cash balance formula, which provides benefits by utilizing interest and pay credits based upon age, service and compensation.
As of December
2011
, the projected benefit obligation for the Company’s pension plans was
$2.7 billion
. CSX did not make contributions to its qualified defined benefit pension plans in
2011
or
2010
.
49
Critical Accounting Estimates,
continued
In addition to these plans, the Company sponsors a self-insured post-retirement medical plan and a life insurance plan that provide benefits to full-time, salaried, management employees, hired prior to January 1, 2003, upon their retirement if certain eligibility requirements are met. Prior to 2011, the post-retirement medical plan was partially funded by all participating retirees, with retiree contributions adjusted annually. Beginning in 2011, Medicare-eligible retirees are covered by a health reimbursement arrangement, which is an employer-funded account that can be used for reimbursement of eligible medical expenses. Non-Medicare eligible retirees continue to be covered by the existing self-insured program. The life insurance plan is non-contributory.
For information related to the funded status of the Company's pension and other post-retirement benefit plans, see Note 8, Employee Benefit Plans.
The accounting for these plans is subject to the guidance provided in the
Compensation-Retirement Benefits Topic
in the ASC. This rule requires that management make certain assumptions relating to the following:
|
•
|
discount rates used to measure future obligations and interest expense;
|
|
•
|
long-term rate of return on plan assets;
|
|
•
|
salary scale inflation rates;
|
|
•
|
health care cost trend rates; and
|
|
•
|
other assumptions.
|
The Company engages independent, external actuaries to compute the amounts of liabilities and expenses relating to these plans subject to the assumptions that the Company selects. The Company reviews the discount rates, long-term rate of return on plan assets, salary scale inflation rates and health care cost trend rates on an annual basis and makes modifications to the assumptions based on current rates and trends as appropriate.
Discount Rates
Discount rates affect the amount of liability recorded and the interest expense component of pension and post-retirement expense. Discount rates reflect the rates at which pension and other post-retirement benefits could be effectively settled, or in other words, how much it would cost the Company to buy enough high quality bonds to generate cash flow equal to the Company's expected future benefit payments. The Company determines the discount rate based on the market yield as of year end for high quality corporate bonds whose maturities match the plans' expected benefit payments.
The discount rates used by the Company to value its
2011
pension and post-retirement obligations are
4.75%
and
4.25%
, respectively. For
2010
, the discount rate used by the company to value its pension and post-retirement obligations was
5.0%
and
4.5%
, respectively. Discount rates may differ for pension and post-retirement benefits due to varying duration of the liabilities for projected payments for each plan. As of December
2011
, the estimated duration of pensions and post retirement benefits is approximately
11
years and
7
years, respectively.
Each year, these discount rates are reevaluated and adjusted using the current market interest rates for high quality corporate bonds to reflect the best estimate of the current effective settlement rates. In general, if interest rates decline or rise, the assumed discount rates will change.
50
Critical Accounting Estimates,
continued
Long-term Rate of Return on Plan Assets
The expected long-term average rate of return on plan assets reflects the average rate of earnings expected on the funds invested, or to be invested, to provide for benefits included in the projected benefit obligation. In estimating that rate, the Company gives appropriate consideration to the returns being earned by the plan assets in the funds and the rates of return expected to be available for reinvestment as well as the current and projected asset mix of the funds. Management balances market expectations obtained from various investment managers and economists with both market and actual plan historical returns to develop a reasonable estimate of the expected long-term rate of return on assets. As this assumption is long-term, it is adjusted less frequently than other assumptions used in pension accounting. The long-term rate of return on plan assets used by the Company to value its pension obligation was
8%
and
8.25%
in
2011
and
2010
, respectively.
Salary Scale Inflation Rates
Salary scale inflation rates are based on current trends and historical data accumulated by the Company. The Company reviews recent wage increases and management incentive compensation payments over the past five years in its assessment of salary scale inflation rates. The Company used a salary scale rate of
4%
to value its
2011
and
2010
pension obligations.
Health Care Cost Trend Rates
Health care cost trend rates are based on recent plan experience and industry trends. The Company uses actuarial data to substantiate the inflation assumption for health care costs, representing increases in total plan costs (which include claims and administrative fee cost components). The
2011
and
2010
assumed health care cost trend rate for benefit obligations was
8.5%
for non-Medicare-eligible participants and
8%
for Medicare-eligible participants which is expected to decrease gradually until reaching
5%
in 2018, based upon current actuarial projections. However, the year-to-year comparisons may fluctuate.
Other Assumptions
The calculations made by the actuaries also include assumptions relating to mortality rates, turnover and retirement age. These assumptions are based upon historical data and are selected by management.
2012
Estimated Pension and Post-retirement Expense
Net pension and post-retirement benefits expense for
2012
is expected to be approximately
$85 million
and
$28 million
, respectively, compared to
$73 million
and
$19 million
, respectively, in
2011
. The increase in the pension expense is primarily related to additional amortization of the losses incurred by the pension plan assets during
2011
and the decrease in the discount rate (which causes expense to increase), partially offset by the return on anticipated discretionary contributions.
51
Critical Accounting Estimates,
continued
The following sensitivity analysis illustrates the effect of changes in certain assumptions like discount rates, salaries and health care costs on the
2011
estimated pension and post-retirement expense:
|
(Dollars in Millions)
|
Pension
|
OPEB
|
||||||
|
Discount Rate 1% change
|
$
|
22
|
|
$
|
1
|
|
||
|
Long-term Rate of Return 1% change
|
$
|
18
|
|
N/A
|
|
|||
|
Salary Inflation 1% change
|
$
|
9
|
|
N/A
|
|
|||
|
Health Care Cost 1% change
|
N/A
|
|
$
|
—
|
|
|||
Depreciation Policies for Assets Utilizing the Group-Life Method
The Company depreciates its rail assets, including main-line track, locomotives and freight cars, using the group-life method of accounting. Assets depreciated under the group-life method comprise over
85%
of total fixed assets of
$34 billion
on a gross basis at December
2011
. All other assets of the Company are depreciated on a straight-line basis. The group-life method aggregates assets with similar lives and characteristics into groups and depreciates each of these groups as a whole. When using the group-life method, an underlying assumption is that each group of assets, as a whole, is used and depreciated to the end of its recoverable life.
The Company currently utilizes more than
130
different depreciable asset categories to account for depreciation expense for the railroad assets that are depreciated under the group-life method of accounting. Examples of depreciable asset categories include
18
different categories for crossties due to the different combinations of density classifications and asset types. By utilizing various depreciable categories, the Company can more accurately account for the use of its assets.
The Company believes the group-life method of depreciation closely approximates the straight-line method of depreciation. Additionally, due to the nature of most of its assets (e.g., track is one contiguous, connected asset), the Company believes that this is the most effective way to properly depreciate its assets.
Under the group-life method of accounting, the service lives and salvage values for each group of assets are determined by completing periodic life studies and applying management's assumptions regarding the service lives of its properties. A life study is the periodic review of asset lives for group assets conducted by a third-party specialist, analyzed by the Company’s management and approved by the Surface Transportation Board (“STB”), the regulatory board that has broad jurisdiction over railroad practices. The STB requires life studies be performed for equipment assets every
three
years and for road (e.g. bridges and signals) and track (e.g., rail, ties and ballast) assets every
six
years. The Company believes the frequency currently required by the STB provides adequate review of asset lives and that a more frequent review would not result in a material change due to the long-lived nature of most of the assets.
52
Critical Accounting Estimates,
continued
Changes in asset lives due to the results of the life studies are applied on a prospective basis and could significantly impact future periods’ depreciation expense, and thus, the Company's results of operations.
There are several factors taken into account during the life study and they include:
|
•
|
statistical analysis of historical life and salvage data for each group of property;
|
|
•
|
statistical analysis of historical retirements for each group of property;
|
|
•
|
evaluation of current operations;
|
|
•
|
evaluation of technological advances and maintenance schedules;
|
|
•
|
previous assessment of the condition of the assets and outlook for their continued use;
|
|
•
|
expected net salvage to be received upon retirement; and
|
|
•
|
comparison of assets to the same asset groups with other companies.
|
For retirements or disposals of depreciable rail assets that occur in the ordinary course of business, the asset cost (net of salvage value or sales proceeds) is charged to accumulated depreciation and no gain or loss is recognized. As individual assets within a specific group are retired, resulting gains and losses are recorded in accumulated depreciation. As part of the life study, an assessment of the recorded amount of accumulated depreciation is made to determine if it is deficient (or in excess) of the appropriate amount indicated by the study. Any such deficiency (or excess), including any deferred gains or losses, is amortized as a component of depreciation expense over the remaining useful life of the asset group until the next required life study. Since the overall assumption with group-life is that the assets within the group on average have the same life and characteristics, it is therefore concluded that the deferred gains and losses offset over time.
In the event that large groups of assets are removed from service as a result of unusual acts or sales, resulting gains and losses are recognized immediately. These acts are not considered to be in the normal course of business and are therefore recognized when incurred. Examples of such acts would be the major destruction of assets due to significant storm damage (e.g., major hurricanes), the sale of a rail line segment to another railroad or the disposal of an entire class of assets (e.g., disposal of all refrigerated freight cars).
Recent experience with life studies has resulted in depreciation rate changes which did not materially affect the Company’s annual depreciation expense of
$976 million
and
$947 million
for
2011
and
2010
, respectively. A
1%
change in the average life of all group-life assets would result in an approximate
$10 million
change to the Company’s annual depreciation expense. The Company completed life studies for its equipment assets in 2009 and concluded life studies for its road, track and equipment assets in 2008 resulting in a reduction in depreciation expense of
$11 million
in 2010 and
$18 million
in 2009.
53
Critical Accounting Estimates,
continued
Income Taxes
CSX accounts for income taxes in accordance with the
Income Taxes Topic
in the ASC that addresses how tax benefits claimed or expected to be claimed on a tax return should be recorded in the financial statements. Under this topic, the Company recognizes the tax benefit from an uncertain tax position only if it is more likely than not that the tax position will be sustained on examination by the taxing authorities based on the technical merits of the position. The tax benefits recognized in the financial statements from such a position are measured based on the largest benefit that has a greater than
50 percent
likelihood of being realized upon ultimate resolution.
CSX files a consolidated federal income tax return, which includes its principal domestic subsidiaries. Examinations of the federal income tax returns of CSX have been completed through
2009
. The federal income tax return for
2010
currently is under review. During
2011
, the Company participated in a contemporaneous Internal Revenue Service (“IRS”) audit of tax year
2011
. Management believes an adequate provision has been made for any adjustments that might be assessed. While the final outcome of these matters cannot be predicted with certainty, it is the opinion of CSX management that none of these items will have a material adverse effect on the financial condition, results of operations or liquidity of CSX. An unexpected adverse resolution of one or more of these items, however, could have a material adverse effect on the results of operations in a particular fiscal quarter or fiscal year. As of December
2011
, the Company’s uncertain tax positions were
$22 million
.
New Accounting Pronouncements and Change in Accounting Policy
See Note 1, Nature of Operations and Significant Accounting Policies under the caption, “New Accounting Pronouncements and Changes in Accounting Policy.”
CSX does not hold or issue derivative financial instruments for trading purposes. Historically, the Company has used derivative financial instruments to address market risk exposure to fluctuations in interest rates and the risk of volatility in its fuel costs.
At December
2011
, CSX had
$44 million
of outstanding floating rate debt obligations outstanding. A
1%
fluctuation in interest rates on these notes would cause a
$1 million
change in interest expense. This amount was determined by considering the impact of an interest rate fluctuation on the balances of our floating rate debt at December 30, 2011.
54
|
INDEX TO CONSOLIDATED FINANCIAL STATEMENTS
|
||
|
|
||
|
|
Page
|
|
|
Report of Independent Registered Public Accounting Firm
|
||
|
|
||
|
CSX Corporation
|
|
|
|
|
|
|
|
Consolidated Financial Statements and Notes to Consolidated Financial Statements
|
|
|
|
|
Herewith:
|
|
|
|
|
|
|
Consolidated Income Statements for the Fiscal Years Ended:
|
||
|
|
December 30, 2011
|
|
|
|
December 31, 2010
|
|
|
|
December 25, 2009
|
|
|
|
|
|
|
Consolidated Balance Sheets as of:
|
||
|
|
December 30, 2011
|
|
|
|
December 31, 2010
|
|
|
|
|
|
|
Consolidated Cash Flow Statements for Fiscal Years Ended:
|
||
|
|
December 30, 2011
|
|
|
|
December 31, 2010
|
|
|
|
December 25, 2009
|
|
|
|
|
|
|
Consolidated Statements of Changes in Shareholders' Equity:.
|
||
|
|
December 30, 2011
|
|
|
|
December 31, 2010
|
|
|
|
December 25, 2009
|
|
|
|
|
|
|
Notes to Consolidated Financial Statements
|
||
55
REPORT OF INDEPENDENT REGISTERED PUBLIC ACCOUNTING FIRM
To the Shareholders and Board of Directors of CSX Corporation
We have audited the accompanying consolidated balance sheets of CSX Corporation as of
December 30, 2011
and
December 31, 2010
, and the related consolidated statements of income, cash flows, and changes in shareholders’ equity for each of the three fiscal years in the period ended
December 30, 2011
. These financial statements are the responsibility of the Company's management. Our responsibility is to express an opinion on these financial statements based on our audits.
We conducted our audits in accordance with the standards of the Public Company Accounting Oversight Board (United States). Those standards require that we plan and perform the audit to obtain reasonable assurance about whether the financial statements are free of material misstatement. An audit includes examining, on a test basis, evidence supporting the amounts and disclosures in the financial statements. An audit also includes assessing the accounting principles used and significant estimates made by management, as well as evaluating the overall financial statement presentation. We believe that our audits provide a reasonable basis for our opinion.
In our opinion, the financial statements referred to above present fairly, in all material respects, the consolidated financial position of CSX Corporation at
December 30, 2011
and
December 31, 2010
, and the consolidated results of its operations and its cash flows for each of the three fiscal years in the period ended
December 30, 2011
, in conformity with U.S. generally accepted accounting principles.
We also have audited, in accordance with the standards of the Public Company Accounting Oversight Board (United States), CSX Corporation's internal control over financial reporting as of
December 30, 2011
, based on criteria established in Internal Control-Integrated Framework issued by the Committee of Sponsoring Organizations of the Treadway Commission and our report dated February 21, 2012 expressed an unqualified opinion thereon.
|
/s/ Ernst & Young LLP
|
|
Certified Public Accountants
|
Jacksonville, Florida
February 21, 2012
56
CONSOLIDATED INCOME STATEMENTS
(Dollars in Millions, Except Per Share Amounts)
|
|
Fiscal Years
|
|||||||||||
|
|
2011
|
2010
|
2009
|
|||||||||
|
|
|
|||||||||||
|
Revenue
|
$
|
11,743
|
|
$
|
10,636
|
|
$
|
9,041
|
|
|||
|
Expense
|
|
|
|
|||||||||
|
Labor and Fringe
|
3,073
|
|
2,957
|
|
2,629
|
|
||||||
|
Materials, Supplies and Other
|
2,229
|
|
2,075
|
|
1,999
|
|
||||||
|
Fuel
|
1,668
|
|
1,212
|
|
849
|
|
||||||
|
Depreciation
|
976
|
|
947
|
|
903
|
|
||||||
|
Equipment and Other Rents
|
379
|
|
374
|
|
391
|
|
||||||
|
Total Expense
|
8,325
|
|
7,565
|
|
6,771
|
|
||||||
|
Operating Income
|
3,418
|
|
3,071
|
|
2,270
|
|
||||||
|
Interest Expense
|
(552
|
)
|
(557
|
)
|
(558
|
)
|
||||||
|
Other Income - Net (Note 10)
|
22
|
|
32
|
|
34
|
|
||||||
|
Earnings From Continuing Operations
|
||||||||||||
|
Before Income Taxes
|
2,888
|
|
2,546
|
|
1,746
|
|
||||||
|
Income Tax Expense (Note 12)
|
(1,066
|
)
|
(983
|
)
|
(618
|
)
|
||||||
|
Earnings From Continuing Operations
|
1,822
|
|
1,563
|
|
1,128
|
|
||||||
|
Discontinued Operations (Note 14)
|
—
|
|
—
|
|
15
|
|
||||||
|
Net Earnings
|
$
|
1,822
|
|
$
|
1,563
|
|
$
|
1,143
|
|
|||
|
Per Common Share (Note 2)
|
|
|
|
|||||||||
|
Net Earnings Per Share, Basic
|
|
|
|
|||||||||
|
Continuing Operations
|
$
|
1.68
|
|
$
|
1.37
|
|
$
|
0.96
|
|
|||
|
Discontinued Operations
|
—
|
|
—
|
|
0.01
|
|
||||||
|
Net Earnings
|
$
|
1.68
|
|
$
|
1.37
|
|
$
|
0.97
|
|
|||
|
Net Earnings Per Common Share, Assuming Dilution
|
|
|
|
|||||||||
|
Continuing Operations
|
$
|
1.67
|
|
$
|
1.35
|
|
$
|
0.95
|
|
|||
|
Discontinued Operations
|
—
|
|
—
|
|
0.01
|
|
||||||
|
Net Earnings
|
$
|
1.67
|
|
$
|
1.35
|
|
$
|
0.96
|
|
|||
|
Average Common Shares Outstanding
(Millions)
|
1,083
|
|
1,143
|
|
1,176
|
|
||||||
|
Average Common Shares Outstanding,
|
||||||||||||
|
Assuming Dilution
(Millions)
|
1,089
|
|
1,154
|
|
1,187
|
|
||||||
|
Cash Dividends Paid Per Common Share
|
$
|
0.45
|
|
$
|
0.33
|
|
$
|
0.29
|
|
|||
All share and per share data were retroactively restated to reflect the three-for-one stock split effective May 31, 2011
.
See accompanying Notes to Consolidated Financial Statements
57
(Dollars in Millions)
|
December
|
December
|
|||||||
|
2011
|
2010
|
|||||||
|
|
|
|||||||
|
ASSETS
|
||||||||
|
Current Assets:
|
|
|
||||||
|
Cash and Cash Equivalents (Note 1)
|
$
|
783
|
|
$
|
1,292
|
|
||
|
Short-term Investments
|
523
|
|
54
|
|
||||
|
Accounts Receivable - Net (Note 1)
|
1,129
|
|
993
|
|
||||
|
Materials and Supplies
|
240
|
|
218
|
|
||||
|
Deferred Income Taxes
|
182
|
|
192
|
|
||||
|
Other Current Assets
|
78
|
|
106
|
|
||||
|
Total Current Assets
|
2,935
|
|
2,855
|
|
||||
|
Properties
|
33,704
|
|
32,065
|
|
||||
|
Accumulated Depreciation
|
(8,730
|
)
|
(8,266
|
)
|
||||
|
Properties - Net (Note 6)
|
24,974
|
|
23,799
|
|
||||
|
Investment in Conrail (Note 13)
|
678
|
|
673
|
|
||||
|
Affiliates and Other Companies
|
493
|
|
461
|
|
||||
|
Other Long-term Assets (Note 11)
|
393
|
|
353
|
|
||||
|
Total Assets
|
$
|
29,473
|
|
$
|
28,141
|
|
||
|
LIABILITIES AND SHAREHOLDERS' EQUITY
|
||||||||
|
Current Liabilities:
|
|
|
||||||
|
Accounts Payable
|
$
|
1,147
|
|
$
|
1,046
|
|
||
|
Labor and Fringe Benefits Payable
|
541
|
|
520
|
|
||||
|
Casualty, Environmental and Other Reserves (Note 5)
|
183
|
|
176
|
|
||||
|
Current Maturities of Long-term Debt (Note 9)
|
507
|
|
613
|
|
||||
|
Income and Other Taxes Payable
|
129
|
|
85
|
|
||||
|
Other Current Liabilities
|
180
|
|
97
|
|
||||
|
Total Current Liabilities
|
2,687
|
|
2,537
|
|
||||
|
Casualty, Environmental and Other Reserves (Note 5)
|
458
|
|
502
|
|
||||
|
Long-term Debt (Note 9)
|
8,734
|
|
8,051
|
|
||||
|
Deferred Income Taxes (Note 12)
|
7,601
|
|
7,053
|
|
||||
|
Other Long-term Liabilities (Note 11)
|
1,525
|
|
1,298
|
|
||||
|
Total Liabilities
|
21,005
|
|
19,441
|
|
||||
|
Shareholders' Equity:
|
|
|
|
|
||||
|
Common Stock, $1 Par Value (Note 3)
|
1,049
|
|
370
|
|
||||
|
Other Capital
|
6
|
|
—
|
|
||||
|
Retained Earnings (Note 1)
|
8,275
|
|
9,087
|
|
||||
|
Accumulated Other Comprehensive Loss (Note 1)
|
(875
|
)
|
(771
|
)
|
||||
|
Noncontrolling Minority Interest
|
13
|
|
14
|
|
||||
|
Total Shareholders' Equity
|
8,468
|
|
8,700
|
|
||||
|
Total Liabilities and Shareholders' Equity
|
$
|
29,473
|
|
$
|
28,141
|
|
||
See accompanying Notes to Consolidated Financial Statements
58
CONSOLIDATED CASH FLOW STATEMENTS
(Dollars in Millions)
|
|
Fiscal Years
|
|||||||||||
|
|
2011
|
2010
|
2009
|
|||||||||
|
|
|
|||||||||||
|
OPERATING ACTIVITIES
|
||||||||||||
|
Net Earnings
|
$
|
1,822
|
|
$
|
1,563
|
|
$
|
1,143
|
|
|||
|
Adjustments to Reconcile Net Earnings to Net Cash
|
|
|
||||||||||
|
Provided by Operating Activities:
|
||||||||||||
|
Depreciation
|
976
|
|
947
|
|
903
|
|
||||||
|
Deferred Income Taxes
|
609
|
|
474
|
|
430
|
|
||||||
|
Contributions to Qualified Pension Plans (Note 8)
|
—
|
|
—
|
|
(250
|
)
|
||||||
|
Other Operating Activities
|
(35
|
)
|
52
|
|
(182
|
)
|
||||||
|
Changes in Operating Assets and Liabilities:
|
|
|
|
|||||||||
|
Accounts Receivable
|
(73
|
)
|
17
|
|
91
|
|
||||||
|
Other Current Assets
|
(23
|
)
|
(22
|
)
|
28
|
|
||||||
|
Accounts Payable
|
84
|
|
79
|
|
(4
|
)
|
||||||
|
Income and Other Taxes Payable
|
96
|
|
28
|
|
(9
|
)
|
||||||
|
Other Current Liabilities
|
35
|
|
123
|
|
(111
|
)
|
||||||
|
Net Cash Provided by Operating Activities
|
3,491
|
|
3,261
|
|
2,039
|
|
||||||
|
INVESTING ACTIVITIES
|
||||||||||||
|
Property Additions
|
(2,297
|
)
|
(1,840
|
)
|
(1,426
|
)
|
||||||
|
Purchase of Short-term Investments
|
(492
|
)
|
—
|
|
—
|
|
||||||
|
Proceeds from Property Dispositions
|
240
|
|
108
|
|
45
|
|
||||||
|
Other Investing Activities
|
(38
|
)
|
(39
|
)
|
9
|
|
||||||
|
Net Cash Used in Investing Activities
|
(2,587
|
)
|
(1,771
|
)
|
(1,372
|
)
|
||||||
|
FINANCING ACTIVITIES
|
||||||||||||
|
Long-term Debt Issued (Note 9)
|
1,200
|
|
800
|
|
500
|
|
||||||
|
Long-term Debt Repaid (Note 9)
|
(605
|
)
|
(113
|
)
|
(323
|
)
|
||||||
|
Dividends Paid
|
(480
|
)
|
(372
|
)
|
(345
|
)
|
||||||
|
Stock Options Exercised (Note 4)
|
29
|
|
42
|
|
34
|
|
||||||
|
Shares Repurchased
|
(1,564
|
)
|
(1,452
|
)
|
—
|
|
||||||
|
Other Financing Activities
|
7
|
|
(132
|
)
|
(173
|
)
|
||||||
|
Net Cash Used in Financing Activities
|
(1,413
|
)
|
(1,227
|
)
|
(307
|
)
|
||||||
|
Net Increase (Decrease) in Cash and Cash Equivalents
|
(509
|
)
|
263
|
|
360
|
|
||||||
|
CASH AND CASH EQUIVALENTS
|
|
|
|
|||||||||
|
Cash and Cash Equivalents at Beginning of Period
|
1,292
|
|
1,029
|
|
669
|
|
||||||
|
Cash and Cash Equivalents at End of Period
|
$
|
783
|
|
$
|
1,292
|
|
$
|
1,029
|
|
|||
|
SUPPLEMENTAL CASH FLOW INFORMATION
|
|
|
|
|||||||||
|
Interest Paid - Net of Amounts Capitalized
|
$
|
574
|
|
$
|
564
|
|
$
|
560
|
|
|||
|
Income Taxes Paid
|
$
|
359
|
|
$
|
421
|
|
$
|
201
|
|
|||
See accompanying Notes to Consolidated Financial Statements
59
CONSOLIDATED STATEMENTS OF CHANGES
IN SHAREHOLDERS’ EQUITY
(Dollars in Millions)
|
Common Shares Outstanding
(Thousands)
|
Common Stock and Paid-in Capital
|
Retained Earnings
|
Accumulated
Other
Comprehensive
Income
(Loss)
(a)
|
Noncontrolling Interest
|
Total Shareholders' Equity
|
||||||||||||
|
Balance December 26, 2008
|
1,171,578
|
|
$
|
391
|
|
$
|
8,315
|
|
$
|
(741
|
)
|
$
|
20
|
|
$
|
7,985
|
|
|
Comprehensive Earnings:
|
|
|
|
|
|
|
|||||||||||
|
Net Earnings
|
—
|
|
—
|
|
1,143
|
|
—
|
|
—
|
|
1,143
|
|
|||||
|
Other Comprehensive Loss
|
—
|
|
—
|
|
—
|
|
(68
|
)
|
—
|
|
(68
|
)
|
|||||
|
Total Comprehensive Earnings
|
|
|
|
|
|
1,075
|
|
||||||||||
|
Common stock dividends, $0.29 per share
|
—
|
|
—
|
|
(345
|
)
|
—
|
|
(1
|
)
|
(346
|
)
|
|||||
|
Bond Conversions (Notes 2 and 9)
|
66
|
|
1
|
|
—
|
|
—
|
|
—
|
|
1
|
|
|||||
|
Stock Option Exercises and Other
|
8,736
|
|
81
|
|
(23
|
)
|
—
|
|
(5
|
)
|
53
|
|
|||||
|
Balance December 25, 2009
|
1,180,380
|
|
473
|
|
9,090
|
|
(809
|
)
|
14
|
|
8,768
|
|
|||||
|
Comprehensive Earnings:
|
|
|
|
|
|
||||||||||||
|
Net Earnings
|
—
|
|
—
|
|
1,563
|
|
—
|
|
—
|
|
1,563
|
|
|||||
|
Other Comprehensive Income
|
—
|
|
—
|
|
—
|
|
39
|
|
—
|
|
39
|
|
|||||
|
Total Comprehensive Earnings
|
|
|
|
|
|
1,602
|
|
||||||||||
|
Common stock dividends, $0.33 per share
|
—
|
|
—
|
|
(372
|
)
|
—
|
|
—
|
|
(372
|
)
|
|||||
|
Share Repurchases
|
(80,031
|
)
|
(255
|
)
|
(1,197
|
)
|
|
|
|
|
(1,452
|
)
|
|||||
|
Bond Conversions (Notes 2 and 9)
|
2,211
|
|
19
|
|
—
|
|
—
|
|
—
|
|
19
|
|
|||||
|
Stock Option Exercises and Other
|
8,466
|
|
133
|
|
3
|
|
(1
|
)
|
—
|
|
135
|
|
|||||
|
Balance December 31, 2010
|
1,111,026
|
|
370
|
|
9,087
|
|
(771
|
)
|
14
|
|
8,700
|
|
|||||
|
Comprehensive Earnings:
|
|
|
|
|
|
||||||||||||
|
Net Earnings
|
—
|
|
—
|
|
1,822
|
|
—
|
|
—
|
|
1,822
|
|
|||||
|
Other Comprehensive Loss
|
—
|
|
—
|
|
—
|
|
(104
|
)
|
—
|
|
(104
|
)
|
|||||
|
Total Comprehensive Earnings
|
|
|
|
|
|
1,718
|
|
||||||||||
|
Common stock dividends, $0.45 per share
|
—
|
|
—
|
|
(480
|
)
|
—
|
|
(1
|
)
|
(481
|
)
|
|||||
|
Share Repurchases
|
(67,406
|
)
|
590
|
|
(2,154
|
)
|
—
|
|
—
|
|
(1,564
|
)
|
|||||
|
Bond Conversions (Notes 2 and 9)
|
675
|
|
5
|
|
—
|
|
—
|
|
—
|
|
5
|
|
|||||
|
Stock Option Exercises and Other
|
4,862
|
|
90
|
|
—
|
|
—
|
|
—
|
|
90
|
|
|||||
|
Balance December 30, 2011
|
1,049,157
|
|
$
|
1,055
|
|
$
|
8,275
|
|
$
|
(875
|
)
|
$
|
13
|
|
$
|
8,468
|
|
(a) Accumulated Other Comprehensive Loss primarily includes changes in pension and other postretirement benefit adjustments. These year-end balances shown above are net of tax. The associated taxes were
$426 million
,
$413 million
and
$466 million
for
2009
,
2010
and
2011
, respectively.
See accompanying Notes to Consolidated Financial Statements
60
NOTES TO CONSOLIDATED FINANCIAL STATEMENTS
Business
CSX Corporation (“CSX”), and together with its subsidiaries (the “Company”), based in Jacksonville, Florida, is one of the nation's leading transportation suppliers. The Company provides rail-based transportation services including traditional rail service and the transport of intermodal containers and trailers.
CSX Transportation, Inc.
CSX’s principal operating subsidiary, CSX Transportation, Inc. (“CSXT”), provides an important link to the transportation supply chain through its approximately
21,000
route mile rail network, which serves major population centers in
23
states east of the Mississippi River, the District of Columbia and the Canadian provinces of Ontario and Quebec. It has access to over
70
ocean, river and lake port terminals along the Atlantic and Gulf Coasts, the Mississippi River, the Great Lakes and the St. Lawrence Seaway. The Company’s intermodal business, also part of CSXT, links customers to railroads via trucks and terminals. CSXT also serves thousands of production and distribution facilities through track connections to approximately
240
short-line and regional railroads.
Lines of Business
During
2011
, CSXT’s transportation services generated
$11.7 billion
of revenue and served three primary lines of business:
|
•
|
The merchandise business shipped nearly
2.7 million
carloads and generated approximately
54%
of revenue and
41%
of volume in
2011
. The Company’s merchandise business is the most diverse market and transports aggregates (which includes crushed stone, sand and gravel), metal, phosphate, fertilizer, food, consumer (manufactured goods and appliances), agricultural, automotive, paper and chemical products.
|
|
•
|
The coal business shipped
1.5 million
carloads and accounted for
32%
of revenue and
24%
of volume in
2011
. The Company transports utility, industrial and export coal to electricity-generating power plants, steel manufacturers, industrial plants and deep-water port facilities. Roughly
one of every three
tons of export coal and
nearly all
of the domestic coal that the Company transports is used for generating electricity.
|
|
•
|
The intermodal business accounted for approximately
12%
of revenue and
35%
of volume in
2011
. The intermodal line of business combines the superior economics of rail transportation with the short-haul flexibility of trucks and offers a competitive cost advantage over long-haul trucking. Through a network of more than
50
terminals, the intermodal business serves all major markets east of the Mississippi and transports mainly manufactured consumer goods in containers, providing customers with truck-like service for longer shipments.
|
Other revenue accounted for approximately
2%
of the Company’s total revenue in
2011
. This revenue category includes revenue from regional subsidiary railroads, demurrage, revenue for customer volume commitments not met, switching and other incidental charges. Revenue from regional railroads includes shipments by railroads that the Company does not directly operate. Demurrage represents charges assessed when freight cars are held beyond a specified period of time. Switching revenue is primarily generated when CSXT switches cars for a customer or another railroad.
61
NOTE 1. Nature of Operations and Significant Accounting Policies,
continued
Other Entities
In addition to CSXT, the Company’s subsidiaries include CSX Intermodal Terminals, Inc. (“CSX Intermodal Terminals”), Total Distribution Services, Inc. (“TDSI”), Transflo Terminal Services, Inc. (“Transflo”), CSX Technology, Inc. (“CSX Technology”) and other subsidiaries. CSX Intermodal Terminals owns and operates a system of intermodal terminals, predominantly in the eastern United States and also performs drayage services (the pickup and delivery of intermodal shipments) for certain CSXT customers and trucking dispatch operations. TDSI serves the automotive industry with distribution centers and storage locations. Transflo connects non-rail served customers to the many benefits of rail by transferring products from rail to trucks. Today, the biggest Transflo markets are chemicals and agriculture, such as minerals and ethanol. CSX Technology and other subsidiaries provide support services for the Company.
CSX’s other holdings include CSX Real Property, Inc., a subsidiary responsible for the Company’s real estate sales, leasing, acquisition and management and development activities. These activities are classified in other income - net because they are not considered to be operating activities by the Company. Results of these activities fluctuate with the timing of non-operating real estate transactions.
Basis of Presentation
In the opinion of management, the accompanying consolidated financial statements contain all normal, recurring adjustments necessary to present fairly the financial position of CSX and its subsidiaries at December 30,
2011
and December 31,
2010
, and the consolidated statements of income, cash flows and changes in shareholders’ equity for fiscal years
2011
,
2010
and
2009
.
In addition, management has evaluated and disclosed all material events occurring subsequent to the date of the financial statements up to the date this annual report is filed on Form 10-K.
Fiscal Year
CSX follows a
52
/
53
week fiscal reporting calendar. This fiscal calendar allows every quarter to consistently end on a Friday and typically, to be of equal duration (
13
weeks), resulting in a
52
week fiscal year. To maintain this type of reporting calendar every fifth or sixth year (depending on the Gregorian calendar and when leap year falls), an extra week will be included in the fourth quarter (a
14
-week fiscal quarter) and, therefore, that full fiscal year will have
53
weeks. This extra week was added to fourth quarter
2010
. Therefore, the fiscal fourth quarter
2010
consisted of
14
weeks and fiscal year
2010
consisted of
53
weeks ending on
December 31, 2010
.
Fiscal years
2011
and
2009
each consisted of
52
weeks ending on
December 30, 2011
and
December 25, 2009
respectively. Except as otherwise specified, references to full year indicate CSX’s fiscal periods ended on these dates.
Principles of Consolidation
The consolidated financial statements include results of operations of CSX and subsidiaries over which CSX has majority ownership or financial control. All significant intercompany accounts and transactions have been eliminated. Most investments in companies that were not majority-owned were carried at cost (if less than
20%
owned and the Company has no significant influence) or equity (if the Company has significant influence).
62
NOTE 1. Nature of Operations and Significant Accounting Policies,
continued
Cash, Cash Equivalents and Short-term Investments
On a daily basis, cash in excess of current operating requirements is invested in various highly liquid investments having a typical maturity date of
three
months or less at the date of acquisition. These investments were carried at cost, which approximated market value, and were classified as cash equivalents. Investments in instruments with maturities greater than
three
months but less than
one
year were classified as short-term investments.
Allowance for Doubtful Accounts
The Company maintains an allowance for doubtful accounts on uncollectible amounts related to freight receivables, government reimbursement receivables, claims for damages and other various receivables. The allowance is based upon the credit worthiness of customers, historical experience, the age of the receivable and current market and economic conditions. Uncollectible amounts are charged against the allowance account. Allowance for doubtful accounts of
$43 million
and
$38 million
is included in the consolidated balance sheets as of December
2011
and December
2010
, respectively.
Materials and Supplies
Materials and supplies in the consolidated balance sheets are carried at average costs and consist primarily of fuel and parts used in the repair and maintenance of CSXT’s freight car and locomotive fleets, equipment and track structure.
Revenue and Expense Recognition
The Company recognizes freight revenue using Free-On-Board (“FOB”) Origin pursuant to the
Revenue Recognition Topic
in the ASC. Accounting guidance in this topic provides for the allocation of revenue between reporting periods based on relative transit time in each reporting period. Expenses are recognized as incurred.
The certain key estimates included in the recognition and measurement of revenue and related accounts receivable under the policies described above are as follows:
|
•
|
revenue associated with shipments in transit, which are based on historical freight car movement data as well as average cycle times to move commodities from their origin to their final destination or interchange;
|
|
•
|
adjustments to revenue for billing corrections, billing discounts and bad debts or to accounts receivable for allowances for doubtful accounts;
|
|
•
|
adjustments to revenue for overcharge claims filed by customers, which are based on historical cash paid to customers for rate overcharges as a percentage of total billing;
|
|
•
|
incentive-based refunds to customers, which are primarily based on customers achieving certain volume thresholds and are recorded as a reduction to revenue on the basis of management’s best estimate of the projected liability (this estimate is based on historical activity, current volume levels and a forecast of future volume); and
|
|
•
|
revenue for customer volume commitments not met.
|
63
NOTE 1. Nature of Operations and Significant Accounting Policies,
continued
The Company regularly updates the estimates described above based on historical experience and current conditions. All other revenue, such as demurrage, switching and other incidental charges are recorded upon completion of the service.
Comprehensive Earnings
CSX reports comprehensive earnings or loss in accordance with the
Comprehensive Income Topic
in the ASC in the Consolidated Statement of Changes in Shareholders' Equity. Total comprehensive earnings are defined as all changes in shareholders' equity during a period, other than those resulting from investments by and distributions to shareholders (e.g. issuance of equity securities and dividends). Generally, for CSX, total comprehensive earnings equals net earnings plus or minus adjustments for pension and other post-retirement liabilities. Total comprehensive earnings represent the activity for a period net of tax and were
$1.7 billion
,
$1.6 billion
and
$1.1 billion
for
2011
,
2010
and
2009
, respectively.
While total comprehensive earnings is the activity in a period and is largely driven by net earnings in that period, accumulated other comprehensive income or loss (“AOCI”) represents the cumulative balance of other comprehensive income, net of tax, as of the balance sheet date. For CSX, AOCI is primarily the cumulative balance related to pension and other post-retirement adjustments and reduced overall equity by
$875 million
,
$771 million
and
$809 million
as of December
2011
,
2010
and
2009
, respectively. (See Note 8, Employee Benefit Plans).
See the New Accounting Pronouncements section below for information related to the change in presentation requirements.
New Accounting Pronouncements
In 2011, the FASB issued an Accounting Standards Update to the
Intangibles—Goodwill and Other Topic
in the ASC which permits an entity to first use qualitative factors to determine if there is a potential impairment in goodwill. This new approach eliminates the requirement to calculate fair value at least annually and replaces it with an optional qualitative assessment. This will likely reduce the cost and complexity of the annual goodwill impairment test for companies with reporting units that have fair values in excess of the carrying amount. Although this rule is effective for annual and interim goodwill impairment tests performed in fiscal years beginning after December 15, 2011, CSX elected to adopt this standard early.
Also, in 2011, the FASB issued an Accounting Standards Update to the
Comprehensive Income Topic
in the ASC aimed at increasing the prominence of items reported in other comprehensive income in the financial statements. This update requires companies to present comprehensive income in a single statement below net income or in a separate statement of comprehensive income immediately following the income statement. Companies will no longer be allowed to present comprehensive income on the statement of changes in shareholders' equity. In both options, companies must present the components of net income, total net income, the components of other comprehensive income, total other comprehensive income and total comprehensive income. This update does not change which items are reported in other comprehensive income or the requirement to report reclassifications of items from other comprehensive income to net income. This requirement will become effective for CSX beginning with the first quarter 2012 10-Q filing. CSX will present comprehensive income in two separate statements. This update will require retrospective application for all periods presented.
64
Use of Estimates
The preparation of financial statements in conformity with accounting principles generally accepted in the United States requires that management make estimates in reporting the amounts of certain assets and liabilities, the disclosure of contingent assets and liabilities at the date of the financial statements and the reported amount of certain revenues and expenses during the reporting period. Actual results may differ from those estimates. Critical accounting estimates using management judgment are made for the following areas:
|
•
|
casualty, environmental and legal reserves (see Note 5, Casualty, Environmental and Other Reserves);
|
|
•
|
pension and post-retirement medical plan accounting (see Note 8, Employee Benefit Plans);
|
|
•
|
depreciation policies for assets under the group-life method (see Note 6, Properties); and
|
|
•
|
income taxes (see Note 12, Income Taxes).
|
Other Items - Share Repurchases
In 2011, CSX repurchased a total of
$1.6 billion
of common stock, which includes
$1.3 billion
from the new share repurchase program announced in May 2011. As of
December 30, 2011
, the Company had remaining authority of
$734 million
under this new
$2 billion
program. The Company may purchase shares from time to time on the open market, through block trades or otherwise. CSX expects to complete the remaining repurchase amount by the end of 2012 based on market and business conditions. Since year end, the Company has completed
$178 million
of additional share repurchases through a trade date of
February 15, 2012
.
65
Effective May 31, 2011, CSX completed a
three
-for-one stock split. All shareholders of record received
two
additional shares of CSX common stock which were distributed on June 15, 2011. Pursuant to the
Earnings Per Share Topic
in the ASC, all share and per share disclosures have been retroactively restated to reflect the stock split.
The following table sets forth the computation of basic earnings per share and earnings per share, assuming dilution:
|
|
Fiscal Years
|
|||||||||||
|
|
2011
|
2010
|
2009
|
|||||||||
|
Numerator
(Dollars in Millions)
:
|
|
|||||||||||
|
Earnings from Continuing Operations
|
$
|
1,822
|
|
$
|
1,563
|
|
$
|
1,128
|
|
|||
|
Dividend Equivalents on Restricted Stock
|
1
|
|
—
|
|
—
|
|
||||||
|
Earnings from Continuing Operations, Attributable to Common Shareholders
|
$
|
1,823
|
|
$
|
1,563
|
|
$
|
1,128
|
|
|||
|
Denominator
(Units in Millions)
:
|
||||||||||||
|
Average Common Shares Outstanding
|
1,083
|
|
1,143
|
|
1,176
|
|
||||||
|
Other Potentially Dilutive Common Shares
(a)
|
6
|
|
11
|
|
11
|
|
||||||
|
Average Common Shares Outstanding, Assuming Dilution
|
1,089
|
|
1,154
|
|
1,187
|
|
||||||
|
Earnings Per Share, Continuing Operations, Basic
|
$
|
1.68
|
|
$
|
1.37
|
|
$
|
0.96
|
|
|||
|
Earnings Per Share, Continuing Operations, Assuming Dilution
|
$
|
1.67
|
|
$
|
1.35
|
|
$
|
0.95
|
|
|||
|
(a)
|
Other potentially dilutive common shares include convertible debt, stock options, common stock equivalents and performance units granted under a long-term management incentive compensation plan.
|
Basic earnings per share is based on the weighted-average number of shares of common stock outstanding. Earnings per share, assuming dilution, is based on the weighted-average number of shares of common stock outstanding adjusted for the effects of common stock that may be issued as a result of the following types of potentially dilutive instruments:
|
•
|
convertible debt;
|
|
•
|
employee stock options; and
|
|
•
|
other equity awards, which include long-term incentive awards.
|
The
Earnings Per Share Topic
in the ASC requires CSX to include additional shares in the computation of earnings per share, assuming dilution. The additional shares included in diluted earnings per share represent the number of shares that would be issued if all of the above potentially dilutive instruments were converted into CSX common stock.
66
When calculating diluted earnings per share, the
Earnings Per Share
Topic in the ASC requires CSX to include the potential shares that would be outstanding if all outstanding stock options were exercised. This is offset by shares CSX could repurchase using the proceeds from these hypothetical exercises to obtain the common stock equivalent. This number is different from outstanding stock options, which is included in Note 4, Stock Plans and Share-Based Compensation. All stock options were dilutive for the periods presented; therefore,
no
stock options were excluded from the diluted earnings per share calculation.
Diluted shares outstanding are not impacted when debentures are converted into CSX common stock because those shares were already included in the diluted shares calculation. Shares outstanding for basic earnings per share, however, are impacted on a weighted-average basis when conversions occur. During
2011
and
2010
,
$6 million
and
$21 million
, respectively, of face value convertible debentures were converted into approximately
675 thousand
shares and
2.2 million
shares of CSX common stock, respectively. As of December
2011
, approximately
$4 million
of convertible debentures at face value remained outstanding, which are convertible into
401 thousand
shares of CSX common stock.
Common and preferred stock consists of the following:
|
|
|||
|
Common Stock, $1 Par Value
|
|
December 30,
2011 |
|
|
|
|
(Units in Millions)
|
|
|
Common Shares Authorized
|
|
1,800
|
|
|
Common Shares Issued and Outstanding
|
|
1,049
|
|
|
|
|||
|
Preferred Stock
|
|
||
|
Preferred Shares Authorized
|
|
25
|
|
|
Preferred Shares Issued and Outstanding
|
—
|
|
|
Holders of common stock are entitled to
one
vote on all matters requiring a vote for each share held. Preferred stock is senior to common stock with respect to dividends and upon liquidation of CSX.
67
Under CSX's share-based compensation plans, awards primarily consist of performance grants, restricted stock awards, restricted stock units, stock options and stock grants for directors. Awards granted under the various programs are determined and approved by the Compensation Committee of the Board of Directors or, in certain circumstances, by the Chief Executive Officer for awards to management employees other than senior executives. The Board of Directors approves awards granted to the Company’s non-management directors upon recommendation of the Governance Committee.
The
Compensation-Stock Compensation Topic
in the ASC requires the cash flows resulting from income tax deductions in excess of compensation costs to be classified as financing cash flows. This requirement resulted in reduced net operating cash flows and increased net financing cash flows of approximately
$35 million
,
$38 million
and
$12 million
for fiscal years
2011
,
2010
and
2009
, respectively.
The
Compensation-Stock Compensation Topic
also requires the disclosure of total compensation costs for share-based payment arrangements and the related tax benefits recognized in income. Share-based compensation expense is measured at the fair market value of the Company’s stock on the grant date and is recognized on a straight-line basis over the service period of the respective award. Total pre-tax expense associated with share-based compensation and its related income tax benefit is as follows:
|
|
Fiscal Years
|
|||||||||||
|
(Dollars in Millions)
|
2011
|
2010
|
2009
|
|||||||||
|
Share-Based Compensation Expense
|
$
|
30
|
|
$
|
62
|
|
$
|
17
|
|
|||
|
Income Tax Benefit
|
$
|
11
|
|
$
|
24
|
|
$
|
6
|
|
|||
Stock Options
Stock options have not been granted since 2003. As of December
2011
, there were
413
current or former employees with stock options outstanding under the CSX Omnibus Incentive Plan (the “Omnibus Plan”). Outstanding stock options were granted with
10
-year terms and all are fully vested and exercisable; therefore, there is
no
current or future expense related to these options. The exercise price for options granted equals the market price of the underlying stock on the grant date. A summary of CSX's stock option activity and related information for the fiscal years
2011
,
2010
and
2009
is as follows:
|
|
Fiscal Years
|
||||||||||||||||||||
|
|
2011
|
2010
|
2009
|
||||||||||||||||||
|
Options
Outstanding
(Thousands)
|
Weighted-
Average
Exercise
Price
|
Options
Outstanding
(Thousands)
|
Weighted-
Average
Exercise
Price
|
Options
Outstanding
(Thousands)
|
Weighted-
Average
Exercise
Price
|
||||||||||||||||
|
Outstanding & Exercisable at Beginning of Year
|
9,111
|
|
$
|
5.82
|
|
16,233
|
|
$
|
5.87
|
|
21,975
|
|
$
|
5.98
|
|
||||||
|
Expired or Cancelled
|
(27
|
)
|
$
|
6.44
|
|
(6
|
)
|
$
|
6.10
|
|
(282
|
)
|
$
|
7.42
|
|
||||||
|
Exercised
|
(4,939
|
)
|
$
|
5.96
|
|
(7,116
|
)
|
$
|
5.93
|
|
(5,460
|
)
|
$
|
6.23
|
|
||||||
|
Outstanding & Exercisable at End of Year
|
4,145
|
|
$
|
5.64
|
|
9,111
|
|
$
|
5.82
|
|
16,233
|
|
$
|
5.87
|
|
||||||
68
NOTE 4. Stock Plans and Share-Based Compensation,
continued
The following table summarizes information about stock options outstanding at December
2011
:
|
Number
Outstanding
|
Weighted-
Average
Remaining
Contractual
|
Weighted-
Average
Exercise
|
Aggregate
Intrinsic
Value
|
|||||||||||||||||
|
Exercise Price
|
(Thousands)
|
Life (Years)
|
Price
|
(Millions)
|
||||||||||||||||
|
$
|
5
|
|
to
|
$
|
10
|
|
4,145
|
|
1.0
|
|
$
|
5.64
|
|
$
|
64
|
|
||||
The aggregate intrinsic value represents the amount employees would have received if the options were exercised as of
December 30, 2011
at a closing market price of
$21.06
. The total intrinsic value of options exercised for fiscal years ended
2011
,
2010
, and
2009
was
$84 million
,
$88 million
, and
$41 million
, respectively. This value represents the value realized by current and former employees who exercised options.
Restricted Stock Awards
Restricted stock awards, excluding restricted stock units, generally vest over an employment period of up to five years. The following table provides information about outstanding restricted stock awards. As of December
2011
, unrecognized compensation expense for these awards was approximately
$14 million
, which will be expensed over an average remaining period of
two
years.
|
|
Fiscal Years
|
|||||||||||
|
|
2011
|
2010
|
2009
|
|||||||||
|
Number of Restricted Stock Awards Outstanding
(Thousands)
(a)
|
1,572
|
|
1,173
|
|
807
|
|
||||||
|
Weighted-Average Fair Value at Grant Date
|
$
|
16.91
|
|
$
|
13.67
|
|
$
|
11.06
|
|
|||
|
Restricted Stock Award Expense
(Millions)
(a)
|
7
|
|
4
|
|
2
|
|
||||||
|
Number of Unvested Restricted Stock Awards Outstanding
(Thousands)
|
678
|
|
702
|
|
612
|
|
||||||
|
Weighted-Average Fair Value of Unvested Awards Outstanding
|
$
|
20.93
|
|
$
|
14.69
|
|
$
|
11.19
|
|
|||
(a) Time-based restricted stock units were granted to key members of management under the respective Long-term Incentive Plans in the amount of
361,000
,
402,000
, and
658,000
in
2011
,
2010
, and
2009
, respectively, as described below. These units vest over three years, therefore only a partial amount of expense was recognized in
2011
,
2010
, and
2009
, respectively.
Long-term Incentive Plans
The CSX Long-term Incentive Plans (“LTIP”) were adopted under either the Omnibus Plan or the
2011
CSX Stock and Incentive Award Plan. The Omnibus Plan expired pursuant to its terms in April
2010
, and as such no new awards will be granted under this plan. The objective of these long-term incentive plans is to motivate and reward key members of management and executives for achieving and exceeding certain financial and strategic initiatives.
69
NOTE 4. Stock Plans and Share-Based Compensation,
continued
In May of
2009
,
2010
and
2011
, target performance units were granted to key members of management under three separate LTIP plans covering three-year cycles: the
2009-2011 (“2011 LTIP”)
,
2010-2012 (“2012 LTIP”)
and
2011-2013 (“2013 LTIP”)
plans (collectively, the “Plans”). The key financial target for all three plans is consolidated operating ratio, which is defined as annual operating expenses divided by revenue, and excludes certain non-recurring items. The target grants were made in performance units, with each unit being equivalent to
one
share of CSX stock, and payouts will be made in CSX common stock. Payouts to certain senior executive officers are subject to a reduction of up to
30%
at the discretion of the Compensation Committee of the Board of Directors based upon Company performance against certain CSX strategic initiatives. Total expense incurred due to long-term incentive plans was
$21 million
,
$56 million
and
$13 million
for fiscal years
2011
,
2010
and
2009
, respectively.
The
2011
plan ended on
December 30, 2011
, and CSX issued
2.7 million
net shares in January
2012
as a result of the achievement of applicable performance targets for the three preceding fiscal years.
As part of the
2012
and
2013
plans,
402 thousand
and
361 thousand
time-based restricted stock units, respectively, were granted. The restricted stock units vest three years after the date of grant and participants receive cash dividend equivalents on the unvested shares during the restriction period. These awards are not based upon CSX’s attainment of operational targets. The restricted stock units and expenses are included in the information as shown in the table above.
|
|
LTIP Plan (Plan Ended In)
|
|||||||||||
|
|
2011
|
2012
|
2013
|
|||||||||
|
Number of target units outstanding
(Thousands)
(a)
|
1,966
|
|
1,224
|
|
1,097
|
|
||||||
|
Weighted-average fair value at grant date
(a)
|
$
|
11.09
|
|
$
|
18.14
|
|
$
|
25.92
|
|
|||
|
Payout Range
|
0% - 233%
|
0% - 200%
|
0% - 200%
|
|||||||||
(a) Number of target units granted and weighted-average fair value calculations above include the value of both initial grants and subsequent, smaller grants issued at different prices based on grant date fair value to new or promoted employees not previously included.
As of December
2011
, there was
$17 million
of total unrecognized compensation cost related to these plans that is expected to be recognized over a weighted-average period of approximately
1.5
years. The activity related to each of the outstanding long-term incentive plans is summarized as follows:
|
|
LTIP Plan (Plan Ended In)
|
||||||||||
|
2011
|
2012
|
2013
|
|||||||||
|
(Units in Thousands)
|
Units Outstanding
|
Weighted-Average Fair Value at Grant Date
|
|||||||||
|
Unvested at December 25, 2009
|
1,788
|
|
—
|
|
—
|
|
$
|
10.50
|
|
||
|
Granted in 2010
|
158
|
|
1,235
|
|
—
|
|
16.89
|
|
|||
|
Forfeited in 2010
|
(4
|
)
|
(52
|
)
|
—
|
|
17.31
|
|
|||
|
Unvested at December 31, 2010
|
1,942
|
|
1,183
|
|
—
|
|
14.43
|
|
|||
|
|
|
|
|
|
|
|
|
||||
|
Granted in 2011
|
25
|
|
41
|
|
1,111
|
|
24.69
|
|
|||
|
Forfeited in 2011
|
—
|
|
—
|
|
(14
|
)
|
23.93
|
|
|||
|
Vested at December 30, 2011
|
1,966
|
|
—
|
|
—
|
|
11.09
|
|
|||
|
Unvested at December 30, 2011
|
—
|
|
1,224
|
|
1,097
|
|
$
|
22.03
|
|
||
70
Stock Awards for Directors
CSX’s non-management directors receive an annual retainer of
$75,000
to be paid quarterly in cash, unless the director chooses to receive the retainer in the form of CSX common stock. Additionally, non-management directors receive an annual grant of common stock in the amount of
$150,000
, with the number of shares to be granted based on the average closing price of CSX stock in the months of November, December and January. The following table provides information about shares issued to directors.
|
|
Fiscal Years
|
|||||||||||
|
|
2011
|
2010
|
2009
|
|||||||||
|
Shares Issued to Directors
(Thousands)
|
93
|
|
114
|
|
222
|
|
||||||
|
Expense
(Millions)
|
$
|
2
|
|
$
|
2
|
|
$
|
2
|
|
|||
|
Weighted Average Grant Date Stock Price
|
$
|
23.46
|
|
$
|
15.16
|
|
$
|
10.30
|
|
|||
The directors may elect to defer receipt of their fees, in accordance with Internal Revenue Code Section 409A. Deferred cash amounts were credited to an account and invested in a choice of eight investment selections, including a CSX common stock equivalent fund. Distributions were made in accordance with elections made by the directors, consistent with the terms of the Plan. At December
2011
, there were approximately
3 million
shares of common stock reserved for issuance under this Plan.
Shareholder Dividend Reinvestment Plan
CSX maintains the Shareholder Dividend Reinvestment Plan under which shareholders may use dividends paid on CSX common stock held in the plan to purchase additional shares of stock. The following table provides information about shares available for issuance under this plan at the end of fiscal years
2011
,
2010
and
2009
.
|
|
Fiscal Years
|
||||||||
|
|
2011
|
2010
|
2009
|
||||||
|
Number of Shares Available for Issuance
(Thousands)
|
38,548
|
|
39,250
|
|
39,804
|
|
|||
71
Activity related to casualty, environmental and other reserves is as follows:
|
|
Casualty
|
Separation
|
Environmental
|
Other
|
|
|||||||||||||||
|
(Dollars in Millions)
|
Reserves
|
Liabilities
|
Reserves
|
Reserves
(b)
|
Total
|
|||||||||||||||
|
Balance December 26, 2008
|
$
|
566
|
|
$
|
87
|
|
$
|
100
|
|
$
|
126
|
|
$
|
879
|
|
|||||
|
Charged to Expense
|
111
|
|
—
|
|
26
|
|
26
|
|
163
|
|
||||||||||
|
Change in Estimate
(a)
|
(127
|
)
|
—
|
|
—
|
|
—
|
|
(127
|
)
|
||||||||||
|
Payments
|
(91
|
)
|
(14
|
)
|
(29
|
)
|
(44
|
)
|
(178
|
)
|
||||||||||
|
Balance December 25, 2009
|
$
|
459
|
|
$
|
73
|
|
$
|
97
|
|
$
|
108
|
|
$
|
737
|
|
|||||
|
Charged to Expense
|
70
|
|
—
|
|
36
|
|
77
|
|
183
|
|
||||||||||
|
Change in Estimate
(a)
|
(49
|
)
|
—
|
|
—
|
|
—
|
|
(49
|
)
|
||||||||||
|
Payments
|
(105
|
)
|
(13
|
)
|
(26
|
)
|
(49
|
)
|
(193
|
)
|
||||||||||
|
Balance December 31, 2010
|
$
|
375
|
|
$
|
60
|
|
$
|
107
|
|
$
|
136
|
|
$
|
678
|
|
|||||
|
Charged to Expense
|
68
|
|
—
|
|
23
|
|
46
|
|
137
|
|
||||||||||
|
Payments
|
(71
|
)
|
(12
|
)
|
(47
|
)
|
(44
|
)
|
(174
|
)
|
||||||||||
|
Balance December 30, 2011
|
$
|
372
|
|
$
|
48
|
|
$
|
83
|
|
$
|
138
|
|
$
|
641
|
|
|||||
|
(a)
|
Changes in estimates in 2010 and 2009 are the result of continued safety improvements and decreasing claim trends for both personal injury and occupational injuries. See below for more detailed discussion regarding these changes in estimates.
|
|
(b)
|
Other reserve accruals were higher in 2010 due to an increase in freight rate reserves related to various rate disputes. These accruals were lower in 2009 primarily due to a reduction in freight loss and damage claims as a result of volume declines. These amounts are recorded as a reduction in revenue rather than expense because they represent liabilities for customer claims regarding the rates charged by the Company for its transportation services.
|
These reserves are considered critical accounting estimates due to the need for significant management judgments. They are provided for in the consolidated balance sheets as follows:
|
|
December 30, 2011
|
December 31, 2010
|
||||||||||||||||||||||
|
(Dollars in Millions)
|
Current
|
Long-term
|
Total
|
Current
|
Long-term
|
Total
|
||||||||||||||||||
|
Casualty:
|
|
|
|
|
|
|
||||||||||||||||||
|
Personal Injury
|
$
|
93
|
|
$
|
168
|
|
$
|
261
|
|
$
|
78
|
|
$
|
176
|
|
$
|
254
|
|
||||||
|
Occupational
|
6
|
|
37
|
|
43
|
|
10
|
|
30
|
|
40
|
|
||||||||||||
|
Asbestos
|
11
|
|
57
|
|
68
|
|
9
|
|
72
|
|
81
|
|
||||||||||||
|
Total Casualty
|
$
|
110
|
|
$
|
262
|
|
$
|
372
|
|
$
|
97
|
|
$
|
278
|
|
$
|
375
|
|
||||||
|
Separation
|
10
|
|
38
|
|
48
|
|
16
|
|
44
|
|
60
|
|
||||||||||||
|
Environmental
|
31
|
|
52
|
|
83
|
|
37
|
|
70
|
|
107
|
|
||||||||||||
|
Other
|
32
|
|
106
|
|
138
|
|
|
26
|
|
110
|
|
136
|
|
|||||||||||
|
Total
|
$
|
183
|
|
$
|
458
|
|
$
|
641
|
|
$
|
176
|
|
$
|
502
|
|
$
|
678
|
|
||||||
These liabilities are accrued when estimable and probable in accordance with the
Contingencies Topic
in the ASC. Actual settlements and claims received could differ. The final outcome of these matters cannot be predicted with certainty. Considering the legal defenses currently available, the liabilities that have been recorded and other factors, it is the opinion of management that none of these items, when finally resolved, will have a material effect on the Company's financial condition, results of operations or liquidity. Should a number of these items occur in the same period, however, they could have a material effect on the Company's financial condition, results of operations or liquidity in that particular period.
72
NOTE 5. Casualty, Environmental and Other Reserves,
continued
Casualty
Casualty reserves represent accruals for personal injury, occupational injury and asbestos claims. During
2010
, the Company increased its self-insured retention amount for these claims from
$25 million
to
$50 million
per injury for claims occurring on or after June 1, 2010. Currently,
no
individual claim is expected to exceed the self-insured retention amount. In accordance with the
Contingencies Topic
in the ASC, to the extent the value of an individual claim exceeds the self-insured retention amount, the Company would present the liability on a gross basis with a corresponding receivable for insurance recoveries. These reserves fluctuate based upon the timing of payments as well as changes in independent third-party estimates, which are reviewed by management. Actual results may vary from estimates due to the number, type and severity of the injury, costs of medical treatments and uncertainties in litigation. Most of the claims relate to CSXT unless otherwise noted below. Defense and processing costs, which historically have been insignificant and are anticipated to be insignificant in the future, are not included in the recorded liabilities.
During 2011, there were
no
significant changes in estimate recorded to adjust casualty reserves. During 2010, the Company reduced casualty reserves by
$49 million
, resulting in an after-tax effect on earnings from continuing operations and net earnings of
$30 million
and an after-tax effect on earnings per share of
$0.03
.
Personal Injury
Personal injury reserves represent liabilities for employee work-related and third-party injuries. Work-related injuries for CSXT employees are primarily subject to the Federal Employers’ Liability Act (“FELA”). In addition to FELA liabilities, employees of other CSX subsidiaries are covered by various state workers’ compensation laws, the Federal Longshore and Harbor Workers’ Compensation Program or the Maritime Jones Act.
CSXT retains an independent actuarial firm to assist management in assessing the value of personal injury claims. An analysis is performed by the independent actuarial firm quarterly and is reviewed by management. The methodology used by the actuary includes a development factor to reflect growth or reduction in the value of these personal injury claims. It is based largely on CSXT's historical claims and settlement experience.
During 2011, there were
no
significant changes in estimate of personal injury reserves. During 2010, the Company reduced personal injury reserves by
$24 million
due to a downward trend in the number of injuries. This downward trend was measured by the reduction of the CSXT's Federal Railroad Administration (“FRA”) personal injury rate. Adjustments in reserves are included in materials, supplies and other in the consolidated income statements.
Occupational & Asbestos
Occupational claims arise from allegations of exposures to certain materials in the workplace, such as solvents, soaps, chemicals (collectively referred to as “irritants”) and diesel fuels (like exhaust fumes) or allegations of chronic physical injuries resulting from work conditions, such as repetitive stress injuries, carpal tunnel syndrome and hearing loss.
73
NOTE 5. Casualty, Environmental and Other Reserves,
continued
The Company is also party to a number of asbestos claims by employees alleging exposure to asbestos in the workplace. The heaviest possible exposure for employees resulted from work conducted in and around steam locomotive engines that were largely phased out beginning around the 1950s. Other types of exposures, however, including exposure from locomotive component parts and building materials, continued until these exposures were substantially eliminated by 1985. Additionally, the Company has retained liability for asbestos claims filed against its previously owned international container shipping business. Diseases associated with asbestos typically have long latency periods (amount of time between exposure to a disease and the onset of the disease) which can range from
10 to 40 years
after exposure.
An analysis of occupational claims is performed quarterly by an independent third-party actuarial firm and reviewed by management. Management performs a quarterly review of asserted asbestos claims, and an analysis is performed annually by an independent third-party specialist and reviewed by management. The objective of the occupational and asbestos claims analyses performed by the third-party actuarial firm and specialist (the "third-party specialists") is to determine the number of incurred but not reported (“IBNR”) claims. With the exception of carpal tunnel, management has determined that
seven
years is the most probable time period in which unasserted claim filings and claim values can be estimated. Carpal tunnel claims use a
three
-year period to estimate the reserve due to the shorter latency period for these types of injuries.
The third party specialists analyze CSXT’s historical claim filings, settlement amounts, and dismissal rates to determine future anticipated claim filing rates and average settlement values for occupational and asbestos claims reserves. The potentially exposed population is estimated by using CSX’s employment records and industry data.From this analysis, the third-party specialists provide an estimate of the IBNR claims liability.
Undiscounted liabilities recorded related to occupational and asbestos claims were as follows:
|
|
December
|
December
|
||||||
|
(Dollars in Millions)
|
2011
|
2010
|
||||||
|
Occupational:
|
|
|
||||||
|
Incurred but not reported claims
|
$
|
26
|
|
$
|
25
|
|
||
|
Asserted claims
|
17
|
|
15
|
|
||||
|
Total liability
|
$
|
43
|
|
$
|
40
|
|
||
|
Asbestos:
|
|
|
||||||
|
Incurred but not reported claims
|
$
|
42
|
|
$
|
40
|
|
||
|
Asserted claims
|
26
|
|
41
|
|
||||
|
Total liability
|
$
|
68
|
|
$
|
81
|
|
||
74
NOTE 5. Casualty, Environmental and Other Reserves,
continued
A summary of occupational and asbestos claims activity is as follows:
|
|
Fiscal Years
|
|||||
|
|
2011
|
2010
|
||||
|
Asserted Claims
|
|
|
||||
|
Open Claims - Beginning of Year
|
1,376
|
|
3,782
|
|
||
|
New Claims Filed
|
224
|
|
250
|
|
||
|
Claims Settled
|
(370
|
)
|
(287
|
)
|
||
|
Claims Dismissed
|
(484
|
)
|
(2,369
|
)
|
||
|
Open Claims - End of Year
|
746
|
|
1,376
|
|
||
During 2011, there were
no
significant changes in estimate of occupational or asbestos reserves. During 2010, the Company reduced occupational reserves by
$12 million
primarily attributable to a decrease in the number of repetitive stress injury claims and lower settlement values for irritant claims. Also during 2010, the Company reduced its reserves for asbestos claims by
$13 million
, primarily related to claims that were determined to have no value due to lack of sufficient medical evidence. Adjustments in reserves are included in materials, supplies and other in the consolidated income statements.
Separation
Separation liabilities represent the estimated benefits provided to certain union employees as a result of implementing workforce reductions, improvements in productivity and certain other cost reductions at the Company's major transportation units since 1991. The majority of this liability is expected to be paid out over the next
5 to 10 years
from general corporate funds and may fluctuate depending on the timing of payments and associated taxes.
Environmental
The Company is a party to various proceedings related to environmental issues, including administrative and judicial proceedings involving private parties and regulatory agencies. The Company has been identified as a potentially responsible party at approximately
246
environmentally impaired sites. Many of these are, or may be, subject to remedial action under the federal Comprehensive Environmental Response, Compensation and Liability Act of 1980, or CERCLA, also known as the Superfund Law, or similar state statutes. Most of these proceedings arose from environmental conditions on properties used for ongoing or discontinued railroad operations. A number of these proceedings, however, are based on allegations that the Company, or its predecessors, sent hazardous substances to facilities owned or operated by others for treatment, recycling or disposal. In addition, some of the Company’s land holdings were leased to others for commercial or industrial uses that may have resulted in releases of hazardous substances or other regulated materials onto the property and could give rise to proceedings against the Company.
In any such proceedings, the Company is subject to environmental clean-up and enforcement actions under the Superfund Law, as well as similar state laws that may impose joint and several liability for clean-up and enforcement costs on current and former owners and operators of a site without regard to fault or the legality of the original conduct. These costs could be substantial.
75
In accordance with the
Asset Retirement and Environmental Obligations Topic
in the ASC, the Company reviews its role with respect to each site identified at least quarterly, giving consideration to a number of factors such as:
|
•
|
type of clean-up required;
|
|
•
|
nature of the Company’s alleged connection to the location (e.g., generator of waste sent to the site or owner or operator of the site);
|
|
•
|
extent of the Company’s alleged connection (e.g., volume of waste sent to the location and other relevant factors); and
|
|
•
|
number, connection and financial viability of other named and unnamed potentially responsible parties at the location.
|
Based on the review process, the Company has recorded amounts to cover contingent anticipated future environmental remediation costs with respect to each site to the extent such costs are estimable and probable. The recorded liabilities for estimated future environmental costs are undiscounted. The liability includes future costs for remediation and restoration of sites as well as any significant ongoing monitoring costs, but excludes any anticipated insurance recoveries. Payments related to these liabilities are expected to be made over the next several years. Environmental remediation costs are included in materials, supplies and other on the consolidated income statement.
Currently, the Company does not possess sufficient information to reasonably estimate the amounts of additional liabilities, if any, on some sites until completion of future environmental studies. In addition, conditions that are currently unknown could, at any given location, result in additional exposure, the amount and materiality of which cannot presently be reliably estimated. Based upon information currently available, however, the Company believes its environmental reserves are adequate to fund remedial actions to comply with present laws and regulations.
Other
Other reserves of
$138 million
and
$136 million
for
2011
and
2010
, respectively, include liabilities for various claims, such as longshoremen disability claims, freight claims and claims for property, automobile and general liability. Freight claims represent claims for both freight loss and damage and freight rate disputes. Liabilities for freight rate disputes are recorded as a reduction of revenue.
76
A detail of the Company’s net properties are as follows:
|
(Dollars in Millions)
|
|
Accumulated
|
Net Book
|
Annual Depreciation
|
Depreciation
|
Estimated Useful
|
||||||||||||||
|
As of December 30, 2011
|
Cost
|
Depreciation
|
Value
|
Rate
(a)
|
Method
|
Life
|
||||||||||||||
|
Road
|
|
|||||||||||||||||||
|
|
Rail and Other Track Material
|
$
|
5,949
|
|
$
|
(1,021
|
)
|
$
|
4,928
|
|
2.7%
|
Group Life
|
|
|||||||
|
|
Ties
|
4,126
|
|
(868
|
)
|
3,258
|
|
3.7%
|
Group Life
|
|
||||||||||
|
|
Grading
|
2,379
|
|
(382
|
)
|
1,997
|
|
1.3%
|
Group Life
|
|
||||||||||
|
|
Ballast
|
2,446
|
|
(610
|
)
|
1,836
|
|
2.5%
|
Group Life
|
|
||||||||||
|
|
Bridges, Trestles, and Culverts
|
1,887
|
|
(195
|
)
|
1,692
|
|
1.4%
|
Group Life
|
|
||||||||||
|
|
Signals and Interlockers
|
1,680
|
|
(198
|
)
|
1,482
|
|
3.3%
|
Group Life
|
|
||||||||||
|
|
Buildings
|
874
|
|
(342
|
)
|
532
|
|
2.5%
|
Group Life
|
|
||||||||||
|
|
Other
|
3,038
|
|
(1,273
|
)
|
1,765
|
|
3.0%
|
Group Life
|
|
||||||||||
|
Total Road
|
$
|
22,379
|
|
$
|
(4,889
|
)
|
$
|
17,490
|
|
|
|
6-80 Years
|
||||||||
|
Equipment
|
|
|
|
|
|
|
|
|||||||||||||
|
|
Locomotive
|
$
|
4,455
|
|
$
|
(1,960
|
)
|
$
|
2,495
|
|
3.5%
|
Group Life
|
|
|||||||
|
|
Freight Cars
|
2,821
|
|
(1,095
|
)
|
1,726
|
|
3.5%
|
Group Life
|
|
||||||||||
|
|
Work Equipment and Other
|
1,345
|
|
(746
|
)
|
599
|
|
7.3%
|
Group Life
|
|
||||||||||
|
Total Equipment
|
$
|
8,621
|
|
$
|
(3,801
|
)
|
$
|
4,820
|
|
|
|
5-35 Years
|
||||||||
|
Land
|
|
1,832
|
|
—
|
|
1,832
|
|
N/A
|
N/A
|
N/A
|
||||||||||
|
Construction In Progress
|
728
|
|
—
|
|
728
|
|
N/A
|
N/A
|
N/A
|
|||||||||||
|
Other
|
|
144
|
|
(40
|
)
|
104
|
|
N/A
|
Straight Line
|
4-30 Years
|
||||||||||
|
Total Properties
|
$
|
33,704
|
|
$
|
(8,730
|
)
|
$
|
24,974
|
|
|
|
|
||||||||
|
(a)
|
Composite depreciation rates, which are used in group life depreciation, apply to railroad assets which account for more than
85%
of total properties. All other property is depreciated on a straight line basis over the asset’s useful life.
|
77
NOTE 6. Properties,
continued
|
(Dollars in Millions)
|
|
Accumulated
|
Net Book
|
Annual Depreciation
|
Depreciation
|
Estimated Useful
|
||||||||||||||
|
As of December 31, 2010
|
Cost
|
Depreciation
|
Value
|
Rate
(a)
|
Method
|
Life
|
||||||||||||||
|
Road
|
|
|||||||||||||||||||
|
|
Rail and Other Track Material
|
$
|
5,568
|
|
$
|
(937
|
)
|
$
|
4,631
|
|
2.7%
|
Group Life
|
|
|||||||
|
|
Ties
|
3,896
|
|
(807
|
)
|
3,089
|
|
3.7%
|
Group Life
|
|
||||||||||
|
|
Grading
|
2,368
|
|
(348
|
)
|
2,020
|
|
1.3%
|
Group Life
|
|
||||||||||
|
|
Ballast
|
2,372
|
|
(605
|
)
|
1,767
|
|
2.5%
|
Group Life
|
|
||||||||||
|
|
Bridges, Trestles, and Culverts
|
1,815
|
|
(170
|
)
|
1,645
|
|
1.4%
|
Group Life
|
|
||||||||||
|
|
Signals and Interlockers
|
1,610
|
|
(183
|
)
|
1,427
|
|
3.3%
|
Group Life
|
|
||||||||||
|
|
Buildings
|
750
|
|
(253
|
)
|
497
|
|
2.5%
|
Group Life
|
|
||||||||||
|
|
Other
|
2,527
|
|
(1,014
|
)
|
1,513
|
|
3.0%
|
Group Life
|
|
||||||||||
|
Total Road
|
$
|
20,906
|
|
$
|
(4,317
|
)
|
$
|
16,589
|
|
|
|
6 - 80 years
|
||||||||
|
Equipment
|
|
|
|
|
|
|
||||||||||||||
|
|
Locomotive
|
4,354
|
|
(1,852
|
)
|
2,502
|
|
3.5%
|
Group Life
|
|
||||||||||
|
|
Freight Cars
|
2,653
|
|
(1,096
|
)
|
1,557
|
|
3.5%
|
Group Life
|
|
||||||||||
|
|
Work Equipment and Other
|
436
|
|
(199
|
)
|
237
|
|
7.3%
|
Group Life
|
|
||||||||||
|
Total Equipment
|
$
|
7,443
|
|
$
|
(3,147
|
)
|
$
|
4,296
|
|
|
|
5 - 35 years
|
||||||||
|
Land
|
|
1,875
|
|
N/A
|
|
1,875
|
|
N/A
|
N/A
|
N/A
|
||||||||||
|
Construction In Progress
|
529
|
|
N/A
|
|
529
|
|
N/A
|
N/A
|
N/A
|
|||||||||||
|
Other
|
|
1,312
|
|
(802
|
)
|
510
|
|
N/A
|
Straight Line
|
4 - 30 years
|
||||||||||
|
Total Properties
|
$
|
32,065
|
|
$
|
(8,266
|
)
|
$
|
23,799
|
|
|
|
|
||||||||
|
(a)
|
Composite depreciation rates, which are used in group life depreciation, apply to railroad assets which account for more than
85%
of total properties. All other property is depreciated on a straight line basis over the asset’s useful life.
|
Railroad Assets
The Company depreciates its rail assets, including main-line track, locomotives and freight cars, using the group-life method of accounting. Assets depreciated under the group-life method of accounting comprise over
85%
of total fixed assets of
$34 billion
on a gross basis as of
December 2011
. All other assets of the Company are depreciated on a straight line basis. The group-life method aggregates assets with similar lives and characteristics into groups and depreciates each of these groups as a whole. When using the group-life method, an underlying assumption is that each group of assets, as a whole, is used and depreciated to the end of its recoverable life.
The Company currently utilizes more than
130
different depreciable asset categories to account for depreciation expense for the railroad assets that are depreciated under the group-life method of accounting. Examples of depreciable asset categories include
18
different categories for crossties due to the different combinations of density classifications and asset types. By utilizing various depreciable categories, the Company can more accurately account for the use of its assets. All assets of the Company are depreciated on a time or life basis.
78
NOTE 6. Properties,
continued
The Company believes the group-life method of depreciation closely approximates the straight-line method of depreciation. Additionally, due to the nature of most of its assets (e.g. track is one contiguous, connected asset) the Company believes that this is the most effective way to properly depreciate its assets.
Under the group-life method of accounting, the service lives and salvage values for each group of assets are determined by completing periodic life studies and applying management’s assumptions regarding the service lives of its properties. A life study is the periodic review of asset lives for group assets conducted by a third-party specialist, analyzed by the Company’s management and approved by the Surface Transportation Board (“STB”), the regulatory board that has broad jurisdiction over railroad practices. The STB requires life studies be performed for equipment assets every
three
years and for road (e.g. bridges and signals) and track (e.g. rail, ties and ballast) assets every
six
years. The Company believes the frequency currently required by the STB provides adequate review of asset lives and that a more frequent review would not result in a material change due to the long-lived nature of most of the assets.
The results of the life study process determine the service lives for each asset group under the group-life method. Road assets, including main-line track, have estimated service lives ranging from
six
years for system roadway machinery to
80
years for grading (construction of protection for the roadway, tracks and embankments). Equipment assets, including locomotives and freight cars, have estimated service lives ranging from
six
years for technology assets to
35
years for work equipment.
Changes in asset lives due to the results of the life studies are applied on a prospective basis and could significantly impact future periods’ depreciation expense, and thus, the Company's results of operations.
There are several factors taken into account during the life study and they include:
|
•
|
statistical analysis of historical life and salvage data for each group of property;
|
|
•
|
statistical analysis of historical retirements for each group of property;
|
|
•
|
evaluation of current operations;
|
|
•
|
evaluation of technological advances and maintenance schedules;
|
|
•
|
previous assessment of the condition of the assets and outlook for their continued use;
|
|
•
|
expected net salvage to be received upon retirement; and
|
|
•
|
comparison of assets to the same asset groups with other companies.
|
For retirements or disposals of depreciable rail assets that occur in the ordinary course of business, the asset cost (net of salvage value or sales proceeds) is charged to accumulated depreciation and no gain or loss is recognized. As individual assets within a specific group are retired or disposed of, resulting gains and losses are recorded in accumulated depreciation. As part of the life study, an assessment of the recorded amount of accumulated depreciation is made to determine if it is deficient (or in excess) of the appropriate amount indicated by the study. Any such deficiency (or excess), including any deferred gains or losses, is amortized as a component of depreciation expense over the remaining useful life of the asset group until the next required life study. Since the overall assumption with the group-life method of accounting is that the assets within the group on average have the same life and characteristics, it is therefore concluded that the deferred gains and losses offset over time.
79
NOTE 6. Properties,
continued
Since the rail network is one contiguous, connected network it is impractical to maintain specific identification records for these assets. For road assets (such as rail and track related items), CSX utilizes a first-in, first-out approach to asset retirements. The historical cost of these replaced assets is estimated using inflation indices published by the Bureau of Labor Statistics applied to the replacement value based on the age of the retired asset. The indices are used because they closely correlate with the major cost of the materials comprising the applicable road assets.
Equipment assets (such as locomotives and freight cars) are specifically identified. When an equipment asset is retired that has been depreciated using group life method, the cost is reduced from the cost base and classified into accumulated depreciation.
In the event that large groups of assets are removed from service as a result of unusual acts or sales, resulting gains and losses are recognized immediately. These acts are not considered to be in the normal course of business and are therefore recognized when incurred. Examples of such acts would be the major destruction of assets due to significant storm damage (e.g. major hurricanes), the sale of a rail line segment or the disposal of an entire class of assets (e.g. disposal of all refrigerated freight cars). Abnormal gains and losses were
$14 million
gain in
2011
,
$30 million
loss in
2010
and
zero
for
2009
.
Recent experience with life studies has resulted in depreciation rate changes, which did not materially affect the Company’s annual depreciation expense of
$976 million
,
$947 million
, and
$903 million
for
2011
,
2010
, and
2009
respectively. The Company completed life studies for its equipment assets in
2009
and for its road, track and equipment assets in
2008
resulting in a reduction in depreciation expense of
$11 million
in
2010
, and
$18 million
in
2009
.
Non-Railroad Assets
The majority of non-railroad property is depreciated using the straight-line method on a per asset basis. The depreciable lives of this property are periodically reviewed by the Company and any changes are applied on a prospective basis. Amortization expense recorded under capital leases is included in depreciation expense on the consolidated income statements. For retirements or disposals of non-railroad depreciable assets and all dispositions of land, the resulting gains or losses are recognized in earnings at the time of disposal. These gains and losses were not material for any period presented.
Impairment Review
Properties and other long-lived assets are reviewed for impairment whenever events or business conditions indicate the carrying amount of such assets may not be fully recoverable. Initial assessments of recoverability are based on estimates of undiscounted future net cash flows associated with an asset or a group of assets in accordance with the
Property, Plant, and Equipment Topic
in the ASC. Where impairment is indicated, the assets are evaluated and their carrying amount is reduced to fair value based on discounted net cash flows or other estimates of fair value.
80
NOTE 6. Properties,
continued
Capital Expenditures
The Company’s capital spending includes purchased or self-constructed assets and property additions that substantially extend the service life or increase the utility of those assets. Indirect costs that can be specifically traced to capital projects are also capitalized. The Company is committed to maintaining and improving its existing infrastructure and expanding its network for long-term growth. Rail operations are capital intensive and CSX accounts for these costs in accordance with GAAP and the Company’s capitalization policy. All properties are stated at historical cost less an allowance for accumulated depreciation.
The Company’s largest category of capital spending is the replacement of track assets and the acquisition or construction of new assets that enable CSX to enhance its operations or provide new capacity offerings to its customers. These construction projects are typically completed by CSXT employees. Costs for track asset replacement and capacity projects that are capitalized include:
|
•
|
labor costs, because many of the assets are self-constructed;
|
|
•
|
costs to purchase or construct new track or to prepare ground for the laying of track;
|
|
•
|
welding (rail, field and plant) which are processes used to connect segments of rail;
|
|
•
|
new ballast, which is gravel and crushed stone that holds track in line;
|
|
•
|
fuels and lubricants associated with tie, rail and surfacing work which is the process of raising track to a designated elevation over an extended distance;
|
|
•
|
cross, switch and bridge ties which are the braces that support the rails on a track;
|
|
•
|
gauging which is the process of standardizing the distance between rails;
|
|
•
|
handling costs associated with installing ties or ballast; and
|
|
•
|
other track materials.
|
The primary cost in self-constructed track replacement work is labor. CSXT engineering employees directly charge their labor to the track replacement project (the capitalized depreciable property). These employees concurrently perform deconstruction and installation of rail. Because of this concurrent process, CSX must estimate the amount of labor that is related to deconstruction versus installation.
Through analysis of CSXT’s track replacement process, CSX determined that approximately
20%
of labor costs associated with rail installation is related to the deconstruction of old track and
80%
is associated with the installation of new track.
Capital spending related to locomotives and freight cars comprises the second largest category of the Company’s capital assets. This category includes purchase costs of locomotives and freight cars as well as certain equipment leases that are considered to be capital leases in accordance with the
Leases Topic
in the ASC. In addition, costs to modify or rebuild these assets are capitalized if the spending incurred extends the asset’s useful life or improves utilization. Improvement projects must meet specified dollar thresholds to be capitalized and are reviewed by management to determine proper accounting treatment.
Routine repairs and maintenance costs, for all asset categories, are expensed as incurred.
81
Significant Property Disposition
In November
2011
, the Company sold approximately
61
miles of operating rail corridor to the Florida Department of Transportation. This corridor will be used by the state of Florida for its new commuter rail operation known as SunRail, which is expected to alleviate highway congestion. The Company intends to divert a portion of the corridor's existing rail traffic and relocate terminal operations to an adjacent rail corridor in Florida. As part of the transaction, the Company received
$173 million
in proceeds (
$148 million
in cash and a
$25 million
receivable, held in escrow and payable no later than
April 2014
) and up to
$259 million
in government grants. These grants are related to reimbursable capital expenditure projects in Florida and are recorded as a reduction of the carrying value of the related asset as received. This agreement also obligated the Company to invest in routine capital expenditures and maintenance related to transportation capacity, facilities or equipment in Florida, including diversion and relocation costs related to this transaction.
This transaction contains multiple elements with separate accounting recognition for the sale of real estate and receipt of the grants. The proceeds related to the sale of real estate approximate fair value. Fair value was determined by management in accordance with the
Fair Value Measurement Topic
in the ASC using level 3 measurements and with the assistance of an independent third-party appraiser.
In accordance with the
Real Estate Sales Topic
in the ASC, the sale of real estate resulted in a deferred gain of
$146 million
upon conveyance. The deferred gain is recognized into income ratably as the investment obligation is fulfilled.
The Company satisfied approximately
9%
of the investment obligation and therefore recognized a gain of 9% of the deferred gain, or
$14 million
, in 2011. This gain is included in materials, supplies and other in the consolidated income statements. The deferred gain balance included in the consolidated balance sheets is in the table below.
|
(Dollars in Millions)
|
Deferred gain as of December 2011
|
|||
|
Current portion, included in Other Current Liabilities
|
$
|
95
|
|
|
|
Long term portion, included in Other Long-Term Liabilities
|
37
|
|
||
|
Total
|
$
|
132
|
|
|
82
Lease Commitments
The Company has various lease agreements with other parties with terms up to
30
years. Net daily rental charges on railroad equipment are not long-term commitments. Non-cancelable, long-term leases generally include provisions for maintenance, options to purchase and options to extend the terms. The Company uses the straight-line method to recognize rent expense associated with operating leases that include escalations over their terms.
|
|
Fiscal Years
|
|||||||||||
|
(Dollars in Millions)
|
2011
|
2010
|
2009
|
|||||||||
|
Net Daily Rental Charges
|
$
|
311
|
|
$
|
307
|
|
$
|
307
|
|
|||
|
Rent Expense on Operating Leases
|
68
|
|
67
|
|
84
|
|
||||||
|
Equipment and Other Rents
|
$
|
379
|
|
$
|
374
|
|
$
|
391
|
|
|||
At December
2011
, minimum building and equipment rentals and commitments for vessels (utilized in a shipping business formerly owned by CSX) under operating leases are disclosed in the table below. Also included in these amounts are agreements covering equipment leased from Conrail, Inc. (“Conrail”).
|
(Dollars in Millions)
|
||||||||||||
|
|
Operating
|
|
Sublease
|
|
Net Lease
|
|
||||||
|
Years
|
Leases
|
|
Income
|
|
Commitments
|
|
||||||
|
2012
|
$
|
102
|
|
$
|
(36
|
)
|
$
|
66
|
|
|||
|
2013
|
74
|
|
(31
|
)
|
43
|
|
||||||
|
2014
|
78
|
|
(18
|
)
|
60
|
|
||||||
|
2015
|
26
|
|
—
|
|
26
|
|
||||||
|
2016
|
24
|
|
—
|
|
24
|
|
||||||
|
Thereafter
|
155
|
|
—
|
|
155
|
|
||||||
|
Total
|
$
|
459
|
|
$
|
(85
|
)
|
$
|
374
|
|
|||
Operating leases and sublease income include approximately
$86 million
and
$77 million
, respectively, relating to ongoing operating lease commitments for vessels and other, which have been subleased to Horizon Lines, Inc. (“Horizon”), a former subsidiary previously named CSX Lines. If Horizon were to experience operational or financial difficulties and default on its obligations, CSX would be liable for all remaining payments. CSX does not believe such an event would have a material adverse effect on the Company’s financial condition, results of operations or liquidity in a fiscal year; however, it could have a material adverse effect on the results of operations in a particular fiscal quarter. CSX continues to monitor Horizon’s financial condition.
83
NOTE 7. Commitments and Contingencies,
continued
Purchase Commitments
CSXT has a commitment under a long-term maintenance program that currently covers
46%
of CSXT’s fleet of locomotives. The agreement is based on the maintenance cycle for each locomotive. Under CSXT’s current obligations, the agreement will expire no earlier than
2031
. The costs expected to be incurred throughout the duration of the agreement fluctuate as locomotives are placed into or removed from service, or as required maintenance schedules are revised. The table below includes both active and inactive locomotives covered under this agreement. The increase in costs is due to more active locomotives in response to higher volume levels in
2011
.
The following table summarizes the number of locomotives covered and CSXT’s payments under the long-term maintenance program.
|
|
Fiscal Years
|
|||||||||||
|
(Dollars in Millions)
|
2011
|
|
2010
|
|
2009
|
|
||||||
|
Amounts Paid
|
$
|
281
|
|
$
|
252
|
|
$
|
237
|
|
|||
|
Number of Locomotives
|
1,943
|
|
1,869
|
|
1,891
|
|
||||||
As a result of agreements executed in 2011, CSXT has remaining purchase obligations to acquire
65
additional locomotives by year-end 2012. The amount of the ultimate purchase commitment depends upon the model of locomotive acquired and the timing of delivery. Annual payments related to the locomotive purchase obligations, including amounts that would be payable under the long-term maintenance program, are estimated in the table below.
Additionally, the Company has various other commitments to purchase technology, communications, railcar maintenance and other services from various suppliers. Total annual payments under all of these purchase commitments are also estimated in the table below.
|
(Dollars in Millions)
|
Locomotive & Maintenance Payments
|
Other
Commitments
|
Total
|
||||||||
|
2012
|
$
|
475
|
|
$
|
353
|
|
$
|
828
|
|
||
|
2013
|
301
|
|
56
|
|
357
|
|
|||||
|
2014
|
300
|
|
36
|
|
336
|
|
|||||
|
2015
|
288
|
|
34
|
|
322
|
|
|||||
|
2016
|
285
|
|
12
|
|
297
|
|
|||||
|
Thereafter
|
2,429
|
|
59
|
|
2,488
|
|
|||||
|
Total
|
$
|
4,078
|
|
$
|
550
|
|
$
|
4,628
|
|
||
84
Insurance
The Company maintains numerous insurance programs with substantial limits for property damage (which includes business interruption) and third-party liability. A certain amount of risk is retained by the Company on each of the liability and property programs. The Company has a
$25 million
retention per occurrence for the non-catastrophic property program (such as a derailment) and a
$50 million
retention per occurrence for the liability and catastrophic property programs (such as hurricanes and floods).
While the Company’s current insurance coverage is adequate to cover its damages, future claims could exceed existing insurance coverage or insurance may not continue to be available at commercially reasonable rates.
Legal
The Company is involved in litigation incidental to its business and is a party to a number of legal actions and claims, various governmental proceedings and private civil lawsuits, including, but not limited to, those related to environmental and hazardous material exposure matters, FELA claims by employees, other personal injury claims and disputes and complaints involving certain transportation rates and charges. Some of the legal proceedings include claims for compensatory as well as punitive damages and others are, or are purported to be, class actions. While the final outcome of these matters cannot be predicted with certainty, considering, among other things, the legal defenses available and liabilities that have been recorded along with applicable insurance, it is currently the opinion of CSX management that none of these pending items will have a material adverse effect on the Company's financial condition, results of operations or liquidity. An unexpected adverse resolution of one or more of these items, however, could have a material adverse effect on the Company's financial condition, results of operations or liquidity in that particular period.
The Company is able to estimate a range of possible loss for certain legal proceedings for which a loss is reasonably possible in excess of reserves established. The Company has estimated this range to be
$2 million
to approximately
$65 million
in aggregate at
December 30, 2011
. This estimated aggregate range is based upon currently available information and is subject to significant judgment and a variety of assumptions. Accordingly, the Company's estimate will change from time to time, and actual losses may vary significantly from the current estimate.
For additional information on legal proceedings, see Item 3. Legal Proceedings.
85
NOTE 8.
Employee Benefit Plans
The Company sponsors defined benefit pension plans principally for salaried, management personnel. For employees hired on or before
December 31, 2002
, the plans provide eligible employees with retirement benefits based predominantly on years of service and compensation rates near retirement. For employees hired in
2003
or thereafter, benefits are determined based on a cash balance formula, which provides benefits by utilizing interest and pay credits based upon age, service and compensation. In addition to these plans, the Company sponsors a self-insured, post-retirement medical plan and a life insurance plan that provide benefits to full-time, salaried, management employees, hired prior to
January 1, 2003
, upon their retirement if certain eligibility requirements are met. Prior to
2011
, the post-retirement medical plan was partially funded by all participating retirees, with retiree contributions adjusted annually. Beginning in
2011
, Medicare-eligible retirees are covered by a health reimbursement arrangement, which is an employer-funded account that can be used for reimbursement of eligible medical expenses. Non-Medicare eligible retirees continue to be covered by the existing self-insured program. The life insurance plan is non-contributory.
The Company engages independent, external actuaries to compute the amounts of liabilities and expenses related to these plans subject to the assumptions that the Company selects. In order to perform this valuation, the actuaries are provided with the details of the population covered at the beginning of the year, summarized in the table below, and projects that population forward to the end of the year.
|
Summary of Participants as of
|
||||||
|
January 1, 2011
|
||||||
|
|
Pension Plans
|
Post-retirement Medical Plan
|
||||
|
Active Employees
|
4,879
|
|
2,827
|
|
||
|
Retirees and Beneficiaries
|
11,360
|
|
12,234
|
|
||
|
Other
(a)
|
6,340
|
|
62
|
|
||
|
Total
|
22,579
|
|
15,123
|
|
||
(a) For pension plans, the other category consists mostly of terminated but vested former employees. For post-retirement plans, the other category consists of employees on long-term disability that have not yet retired.
The benefit obligation for these plans represents the liability of the Company for current and retired employees and is affected primarily by the following:
|
•
|
service cost (benefits attributed to employee service during the period);
|
|
•
|
interest cost (interest on the liability due to the passage of time);
|
|
•
|
actuarial gains/losses (experience during the year different from that assumed and changes in plan assumptions); and
|
|
•
|
benefits paid to participants.
|
86
NOTE 8.
Employee Benefit Plans,
continued
Cash Flows
Plan assets are amounts that have been segregated and restricted to provide qualified pension plan benefits and include amounts contributed by the Company and amounts earned from invested contributions, net of benefits paid. Qualified pension plan obligations are funded in accordance with prescribed regulatory requirements and with an objective of meeting minimum funding requirements necessary to avoid restrictions on flexibility of plan operation and benefit payments. At the current time, the Company estimates making a required minimum contribution of approximately
$25 million
and expects to make an additional discretionary contribution to its qualified pension plans in
2012
. The Company funds the cost of the post-retirement medical and life insurance benefits as well as nonqualified pension benefits on a pay-as-you go basis.
Future expected benefit payments are as follows:
|
|
Expected Cash Flows
|
|||||||
|
(Dollars in Millions)
|
Pension Benefits
|
Post-retirement Benefits
|
||||||
|
2012
|
$
|
170
|
|
$
|
42
|
|
||
|
2013
|
174
|
|
40
|
|
||||
|
2014
|
175
|
|
38
|
|
||||
|
2015
|
177
|
|
36
|
|
||||
|
2016
|
181
|
|
35
|
|
||||
|
2017-2020
|
917
|
|
146
|
|
||||
|
Total
|
$
|
1,794
|
|
$
|
337
|
|
||
Plan Assets
The CSX Investment Committee (the “Investment Committee”), whose members were selected by the Chief Financial Officer and approved by the Chief Executive Officer, is responsible for oversight and investment of plan assets. The Investment Committee utilizes an investment asset allocation strategy that is monitored on an ongoing basis and that is updated periodically in consideration of plan or employee changes, or changing market conditions. These studies provide an extensive modeling of asset investment return in conjunction with projected plan liabilities and seek to evaluate how to maximize return within the constraints of acceptable risk. The current asset allocation targets
60%
equity investments and
40%
fixed income investments. Within equity, a further target is currently established for
40%
of total plan assets in domestic equity and
20%
in international equity. These allocations are managed to be within
3%
of the planned allocation, with reallocations occurring quarterly.
At December
2011
, both the accumulated benefit obligation and the projected benefit obligation exceeded the plan assets of each pension plan. The distribution of pension plan assets as of the measurement date is shown in the table below, and these assets are netted against the pension liabilities on the balance sheet. The funded status, or amount by which the benefit obligation exceeds the fair value of plan assets, represents a liability.
87
NOTE 8.
Employee Benefit Plans,
continued
|
|
December 2011
|
December 2010
|
||||||||||||
|
|
|
Percent of
|
|
Percent of
|
||||||||||
|
(Dollars in Millions)
|
Amount
|
Total Assets
|
Amount
|
Total Assets
|
||||||||||
|
Equity
|
$
|
1,064
|
|
57
|
%
|
$
|
1,126
|
|
61
|
%
|
||||
|
Fixed Income
|
755
|
|
41
|
|
717
|
|
39
|
|
||||||
|
Cash and Cash Equivalents
|
31
|
|
2
|
|
8
|
|
—
|
|
||||||
|
Total
|
$
|
1,850
|
|
100
|
%
|
$
|
1,851
|
|
100
|
%
|
||||
Under the supervision of the Investment Committee, individual investments or fund managers are selected in accordance with standards of prudence applicable to asset diversification and investment suitability. The Company also selects fund managers with differing investment styles and benchmarks their investment returns against appropriate indices. Fund investment performance is continuously monitored. Acceptable performance is determined in the context of the long-term return objectives of the fund and appropriate asset class benchmarks.
Within the Company's equity funds, the U.S. stock segment includes diversification among large and small capitalization stocks. Guidelines established with individual managers limit investment by industry sectors, individual stock issuer concentration and the use of derivatives and CSX securities.
Fixed income securities guidelines established with individual managers specify the types of allowable investments, such as government, corporate and asset-backed bonds, and limit diversification between domestic and foreign investments and the use of derivatives. Additionally, guidelines stipulate minimum credit quality constraints and any prohibited securities.
For detailed information regarding the fair value of pension assets, see Note 15, Fair Value Measurements.
88
NOTE 8.
Employee Benefit Plans,
continued
Benefit Obligation, Plan Assets and Funded Status
Changes in benefit obligation and the fair value of plan assets for the
2011
and
2010
calendar plan years are as follows:
|
|
Pension Benefits
|
Post-retirement Benefits
|
||||||||||||||
|
|
Plan Year
|
Plan Year
|
Plan Year
|
Plan Year
|
||||||||||||
|
(Dollars in Millions)
|
2011
|
2010
|
2011
|
2010
|
||||||||||||
|
Actuarial Present Value of Benefit Obligation
|
|
|
|
|
||||||||||||
|
Accumulated Benefit Obligation
|
$
|
2,516
|
|
$
|
2,354
|
|
N/A
|
|
N/A
|
|
||||||
|
Projected Benefit Obligation
|
2,668
|
|
2,487
|
|
$
|
388
|
|
$
|
383
|
|
||||||
|
Change in Projected Benefit Obligation:
|
|
|
|
|
|
|
|
|
||||||||
|
Projected Benefit Obligation at
Beginning of Plan Year
|
$
|
2,487
|
|
$
|
2,395
|
|
$
|
383
|
|
$
|
406
|
|
||||
|
Service Cost
|
40
|
|
41
|
|
2
|
|
5
|
|
||||||||
|
Interest Cost
|
121
|
|
122
|
|
11
|
|
20
|
|
||||||||
|
Plan Participants' Contributions
|
—
|
|
—
|
|
7
|
|
16
|
|
||||||||
|
Plan Amendments
|
—
|
|
(9
|
)
|
—
|
|
(6
|
)
|
||||||||
|
Actuarial (Gain)/Loss
|
175
|
|
91
|
|
32
|
|
(11
|
)
|
||||||||
|
Benefits Paid
|
(155
|
)
|
(153
|
)
|
(47
|
)
|
(47
|
)
|
||||||||
|
Benefit Obligation at End of Plan Year
|
$
|
2,668
|
|
$
|
2,487
|
|
$
|
388
|
|
$
|
383
|
|
||||
|
Change in Plan Assets:
|
|
|
|
|
|
|
|
|
||||||||
|
Fair Value of Plan Assets at Beginning of Plan Year
|
$
|
1,851
|
|
$
|
1,781
|
|
$
|
—
|
|
$
|
—
|
|
||||
|
Actual Return on Plan Assets
|
141
|
|
210
|
|
—
|
|
—
|
|
||||||||
|
Non-qualified Employer Contributions
|
13
|
|
13
|
|
40
|
|
31
|
|
||||||||
|
Plan Participants' Contributions
|
—
|
|
—
|
|
7
|
|
16
|
|
||||||||
|
Benefits Paid
|
(155
|
)
|
(153
|
)
|
(47
|
)
|
(47
|
)
|
||||||||
|
Fair Value of Plan Assets at End of Plan Year
|
$
|
1,850
|
|
$
|
1,851
|
|
—
|
|
—
|
|
||||||
|
Funded Status at End of Plan Year
|
$
|
(818
|
)
|
$
|
(636
|
)
|
$
|
(388
|
)
|
$
|
(383
|
)
|
||||
89
NOTE 8.
Employee Benefit Plans,
continued
For qualified plan funding purposes, assets and discounted liabilities are measured in accordance with ERISA, as well as other related provisions of the Internal Revenue Code and related regulations. Under these funding provisions and the alternative measurements available thereunder, the Company estimates its unfunded obligation for qualified plans on an annual basis.
In accordance with
Compensation-Retirement Benefits Topic
in the ASC, an employer must recognize the funded status of a pension or other post-retirement benefit plan by recording a liability (underfunded plan) or asset (overfunded plan) for the difference between the projected benefit obligation (or the accumulated post-retirement benefit obligation for a postretirement benefit plan) and the fair value of plan assets at the plan measurement date. Amounts related to pension and post-retirement benefits recorded in labor and fringe benefits payable and other long-term liabilities on the balance sheet are as follows:
|
|
Pension Benefits
|
Post-retirement Benefits
|
||||||||||||||
|
|
December
|
December
|
December
|
December
|
||||||||||||
|
(Dollars in Millions)
|
2011
|
2010
|
2011
|
2010
|
||||||||||||
|
Amounts Recorded in Consolidated
|
|
|
|
|||||||||||||
|
Balance Sheets:
|
|
|
|
|
||||||||||||
|
Current Liabilities
|
$
|
(15
|
)
|
$
|
(13
|
)
|
$
|
(42
|
)
|
$
|
(41
|
)
|
||||
|
Long-term Liabilities
|
(803
|
)
|
(623
|
)
|
(346
|
)
|
(342
|
)
|
||||||||
|
Net Amount Recognized in
|
|
|
|
|
|
|
|
|
||||||||
|
Consolidated Balance Sheet
|
$
|
(818
|
)
|
$
|
(636
|
)
|
$
|
(388
|
)
|
$
|
(383
|
)
|
||||
CSX has a liability for the amount by which the benefit obligation exceeds the fair value of plan assets. As of
December 30, 2011
, both the accumulated benefit obligation and the projected benefit obligation exceeded the plan assets of each pension plan.
Net Benefit Expense
The following table describes the components of expense/(income) related to net benefit expense recorded in labor and fringe on the income statement.
|
Pension Benefits
Fiscal Years
|
Post-retirement Benefits
Fiscal Years
|
|||||||||||||||||||||||
|
(Dollars in Millions)
|
2011
|
2010
|
2009
|
2011
|
2010
|
2009
|
||||||||||||||||||
|
Service Cost
|
$
|
40
|
|
$
|
41
|
|
$
|
32
|
|
$
|
2
|
|
$
|
5
|
|
$
|
5
|
|
||||||
|
Interest Cost
|
121
|
|
122
|
|
129
|
|
11
|
|
20
|
|
25
|
|
||||||||||||
|
Expected Return on Plan Assets
|
(157
|
)
|
(165
|
)
|
(154
|
)
|
—
|
|
—
|
|
—
|
|
||||||||||||
|
Amortization of Net Loss
|
71
|
|
58
|
|
26
|
|
7
|
|
7
|
|
4
|
|
||||||||||||
|
Amortization of Prior Service Cost
|
—
|
|
—
|
|
2
|
|
(1
|
)
|
—
|
|
—
|
|
||||||||||||
|
Net Periodic Benefit Expense
|
$
|
75
|
|
$
|
56
|
|
$
|
35
|
|
$
|
19
|
|
$
|
32
|
|
$
|
34
|
|
||||||
|
Settlement Gain
(a)
|
(2
|
)
|
(2
|
)
|
—
|
|
—
|
|
—
|
|
—
|
|
||||||||||||
|
Total Expense
|
$
|
73
|
|
$
|
54
|
|
$
|
35
|
|
$
|
19
|
|
$
|
32
|
|
$
|
34
|
|
||||||
|
(a)
|
In
2011
and
2010
, in one of the company's pension plans, the lump-sum payments exceeded the sum of the service cost and interest cost recognized. As such, the company was required to recognize a portion of its accumulated other comprehensive income related to that plan into earnings.
|
90
NOTE 8.
Employee Benefit Plans,
continued
Pension and Other Post-Employment Benefits Adjustments
The following table shows the pre-tax change in other comprehensive loss (income) attributable to the components of net expense and the change in benefit obligation for CSX for pension and other post-employment benefits.
|
(Dollars in Millions)
|
Pension Benefits
|
Post-retirement Benefits
|
||||||||||||||
|
Components of Other Comprehensive
|
December
|
December
|
December
|
December
|
||||||||||||
|
Loss (Income)
|
2011
|
2010
|
2011
|
2010
|
||||||||||||
|
Recognized in the balance sheet
|
|
|
|
|
||||||||||||
|
Losses (Gains)
|
$
|
191
|
|
$
|
48
|
|
$
|
25
|
|
$
|
(9
|
)
|
||||
|
Prior service credits
|
$
|
—
|
|
$
|
(9
|
)
|
$
|
—
|
|
$
|
(6
|
)
|
||||
|
Expense (Income) recognized in the income statement
|
|
|
|
|
|
|
|
|
||||||||
|
Amortization of net losses
(a)
|
$
|
71
|
|
$
|
58
|
|
$
|
7
|
|
$
|
7
|
|
||||
|
Settlement gain
|
$
|
(2
|
)
|
$
|
(2
|
)
|
$
|
—
|
|
$
|
—
|
|
||||
|
Amortization of prior service costs
(b)
|
$
|
—
|
|
$
|
—
|
|
$
|
(1
|
)
|
$
|
—
|
|
||||
|
(a)
|
The estimated amount to be expensed for
2012
is
$82 million
and
$9 million
for pension benefits and post-retirement benefits, respectively. The increase in the pension expense is largely related to additional amortization of the losses incurred by the pension plan assets during 2011.
|
|
(b)
|
Remaining prior service costs to be expensed in
2012
are less than
$1 million
. The estimated post-retirement benefits amount to be credited to expense for
2012
is
$1 million
.
|
As of December 30, 2011, the balances of pre-tax amounts to be amortized that are included in accumulated other comprehensive loss (a component of shareholders’ equity) are as follows:
|
Pension
Benefits
|
Post-retirement
Benefits
|
|||||||
|
Losses
|
$
|
1,169
|
|
$
|
102
|
|
||
|
Prior Service Costs (Credits)
|
1
|
|
(5
|
)
|
||||
|
Total
|
$
|
1,170
|
|
$
|
97
|
|
||
Assumptions
Weighted-average assumptions used in accounting for the plans were as follows:
|
|
Pension Benefits
|
Post-retirement Benefits
|
||||||||||
|
|
2011
|
2010
|
2011
|
2010
|
||||||||
|
Expected Long-term Return on Plan Assets:
|
|
|
|
|
||||||||
|
Benefit Cost for Plan Year
|
8.25
|
%
|
8.50
|
%
|
N/A
|
|
N/A
|
|
||||
|
Benefit Obligation at End of Plan Year
|
8.00
|
%
|
8.25
|
%
|
N/A
|
|
N/A
|
|
||||
|
Discount Rates:
|
|
|
|
|
||||||||
|
Benefit Cost for Plan Year
|
5.00
|
%
|
5.25
|
%
|
4.50
|
%
|
4.75
|
%
|
||||
|
Benefit Obligation at End of Plan Year
|
4.75
|
%
|
5.00
|
%
|
4.25
|
%
|
4.50
|
%
|
||||
|
Salary Scale Inflation
|
4.00
|
%
|
4.00
|
%
|
N/A
|
|
N/A
|
|
||||
91
NOTE 8.
Employee Benefit Plans,
continued
The net post-retirement benefit obligation for salaried, management personnel was determined using the following assumptions for the health care cost trend rate for medical plans. While it is expected that rates will decrease to
5%
by
2018
, there may be yearly fluctuations. Additionally, there are cost differentials between Medicare and Non-Medicare eligible individuals which are reflected below.
|
|
Post-retirement Benefits
|
|||
|
|
2011
|
2010
|
||
|
Health Care Cost Trend Rate:
|
|
|
||
|
Components of Benefit Cost: Non-Medicare Eligible
|
8.5%
|
8.5%
|
||
|
Components of Benefit Cost: Medicare Eligible
|
8.0%
|
8.0%
|
||
|
Benefit Obligations: Non-Medicare Eligible
|
8.5%
|
8.5%
|
||
|
Benefit Obligations: Medicare Eligible
|
8.0%
|
8.0%
|
||
For every
1%
change in the assumed health care cost trend rate, service and interest cost will change by less than
$1 million
on a pre-tax basis on the consolidated income statements. For every
1%
change in the health care cost trend rate, the Company’s benefit obligation will change by
$1 million
on the consolidated balance sheets.
Medicare Prescription Drug, Improvement and Modernization Act of 2003
As required by the Medicare Prescription Drug, Improvement and Modernization Act of 2003 (the “Act”), the Company previously determined that its medical plan’s prescription drug benefit qualified for tax free federal reimbursements that would be paid under the Act. In 2011, the Company implemented a health reimbursement arrangement in lieu of the prescription drug plan. As a result, the Company is no longer eligible for tax free federal reimbursement benefits for prescription drug claims. However, in
2011
, the Company received
$2 million
in tax free federal reimbursements for prescription drug claims primarily related to the 2010 plan year, as well as
$5 million
and
$3 million
in
2010
and
2009
, respectively.
Other Plans
Under collective bargaining agreements, the Company participates in a multi-employer benefit plan, which provides certain post-retirement health care and life insurance benefits to eligible contract employees. Premiums under this plan are expensed as incurred and amounted to
$48 million
,
$45 million
and
$35 million
in
2011
,
2010
and
2009
, respectively.
The Company maintains savings plans for virtually all full-time salaried employees and certain employees covered by collective bargaining agreements. Expense associated with these plans was
$28 million
,
$28 million
and
$24 million
for
2011
,
2010
and
2009
, respectively.
92
Debt was as follows:
|
Maturity at
December
|
Average
Interest
Rates at
December
|
December
|
December
|
|||||||||
|
(Dollars in Millions)
|
2011
|
2011
|
2011
|
2010
|
||||||||
|
Notes
|
2012-2043
|
6.1%
|
$
|
8,486
|
|
$
|
7,817
|
|
||||
|
Equipment Obligations
|
2012-2023
|
7.1%
|
741
|
|
823
|
|
||||||
|
Capital Leases
|
2012-2017
|
6.3%
|
10
|
|
15
|
|
||||||
|
Convertible Debentures
(a)
|
2021
|
1.0%
|
4
|
|
9
|
|
||||||
|
Total Long-term Debt (including current portion)
|
|
$
|
9,241
|
|
$
|
8,664
|
|
|||||
|
Less Debt Due within One Year
|
|
|
(507
|
)
|
(613
|
)
|
||||||
|
Long-term Debt (excluding current portion)
|
|
|
$
|
8,734
|
|
$
|
8,051
|
|
||||
(a) Convertible debentures are net of
$1 million
discount in
2010
.
For information regarding the fair value of debt, see Note 14, Fair Value Measurements.
Debt Issuance
In
2011
, CSX issued
$600 million
of
4.75%
notes due
2042
,
$350 million
of
4.25%
notes due
2021
, and
$250 million
of
5.5%
notes due
2041
. These notes were included in the consolidated balance sheets under long-term debt and may be redeemed by the Company at any time. The net proceeds from the sale of the notes will be used for general corporate purposes, which may include debt repayments from time to time, repurchases of CSX's common stock, capital expenditures, working capital requirements, improvements in productivity and other cost reductions.
Convertible Debentures
In
2001
, CSX issued
$564 million
aggregate principal amount at maturity in unsubordinated
zero
coupon convertible debentures (the "debentures") due in
2021
for an initial offering price of approximately
$462 million
. The carrying value of outstanding debentures was
$4 million
and
$9 million
, at December
2011
and December
2010
, respectively. Previously, these debentures had accreted (increased) in value at a rate of
2.1%
per year. In
2011
, the accretion rate was reset to
1.0%
. The accretion rate may be reset again in
October 2016
to a rate based on
five
-year United States Treasury Notes minus
2.8%
. In no event will the yield to maturity be reset below
1.0%
or above
3.0%
per annum. Accretion in value on the debentures is recorded in each month but will not be paid prior to maturity.
The debentures allow holders to require CSX to purchase their debentures in
October 2016
, at a purchase price equal to the accreted value of the debentures at the time. CSX may redeem the debentures for cash at any time at a redemption price equal to the accreted value of the debentures.
93
NOTE 9. Debt and Credit Agreements,
continued
Holders currently may convert their debentures into shares of CSX common stock at a conversion rate of
106.48
common shares per
$1,000
principal amount at maturity of debentures. During
2011
and
2010
,
$6 million
and
$21 million
face value of debentures was converted into
1 million
and
2 million
shares of CSX common stock, respectively. At December
2011
,
$4 million
face value debentures remained outstanding, convertible into
401 thousand
shares of CSX common stock.
Debt Exchange
In March
2010
, CSX exchanged
$660 million
of notes of multiple series (the “Existing Notes”), bearing interest at an average annual rate of
7.74%
with maturities ranging from
2017 to 2038
. These Existing Notes were exchanged for
$660 million
of debt securities (the “New Notes”) bearing interest at
6.22%
and due
April 30, 2040
. In addition, CSX paid approximately
$141 million
to the debtholders as cash consideration. CSX also paid the debtholders any accrued and unpaid interest on the Existing Notes. In accordance with the
Debt Topic
in the ASC, this transaction has been accounted for as a debt exchange. As such, the
$141 million
of cash consideration paid to the debtholders was recorded in other long-term assets. This cash consideration and the unamortized discount and issue costs from the Existing Notes are being amortized as an adjustment of interest expense over the term of the New Notes. There was no gain or loss recognized as a result of this exchange. However, all costs related to the debt exchange and due to parties other than the debtholders were included in interest expense during first quarter
2010
. These costs totaled approximately
$3 million
.
In July
2010
, CSX exchanged the New Notes for substantially identical notes registered under the Securities Act of 1933, as amended, pursuant to a registration rights agreement entered into in connection with the exchange offer.
|
(Dollars in Millions)
|
Maturities as of
|
|||
|
Fiscal Years Ending
|
December 2011
|
|||
|
2012
|
|
$
|
507
|
|
|
2013
|
|
780
|
|
|
|
2014
|
|
527
|
|
|
|
2015
|
|
628
|
|
|
|
2016
|
|
23
|
|
|
|
2017 and Thereafter
|
6,776
|
|
||
|
Total Long-term Debt Maturities (including current portion)
|
$
|
9,241
|
|
|
94
Credit Facilities
During 2011, CSX replaced its existing
$1.25 billion
credit facility that was set to expire in
May 2012
with a new
$1 billion
unsecured, revolving credit facility backed by a diverse syndicate of banks. This new facility expires in
September 2016
, and as of the date of this filing, the Company has no outstanding balances under this facility. The facility allows borrowings at floating (LIBOR-based) interest rates, plus a spread, depending upon CSX's senior unsecured debt ratings. LIBOR is the London Interbank Offered Rate which is a daily reference rate based on the interest rates at which banks offer to lend unsecured funds.
Commitment fees and interest rates payable under the facility were similar to fees and rates available to comparably rated investment-grade borrowers. At December
2011
, CSX was in compliance with all covenant requirements under the facilities.
Receivables Securitization Facility
The Company's
$250 million
receivables securitization facility has a 364-day term and expires in
December 2012
. The Company plans to renew this facility prior to its expiration. The purpose of this facility is to provide an alternative to commercial paper and a low cost source of short-term liquidity. Under the terms of this facility, CSX Transportation transfers eligible third-party receivables to CSX Trade Receivables, LLC ("CSX Trade Receivables"), a bankruptcy-remote special purpose subsidiary. A separate subsidiary of CSX services the receivables. Upon transfer, the receivables become assets of CSX Trade Receivables and are not available to the creditors of CSX or any of its other subsidiaries. In the event CSX Trade Receivables draws under this facility, the Company will record an equivalent amount of debt on its consolidated financial statements. As of the date of this filing, the Company has
no
outstanding balances under this facility.
The Company derives income from items that are not considered operating activities. Income from these items is reported net of related expense. Income from real estate includes the results of operations of the Company’s non-operating real estate sales, leasing, acquisition and management and development activities and may fluctuate as a function of timing of real estate sales. Miscellaneous income (expense) includes equity earnings or losses, investment gains and losses and other non-operating activities and may fluctuate due to timing. Other income – net consisted of the following:
|
|
Fiscal Years
|
|||||||||||
|
(Dollars in Millions)
|
2011
|
2010
|
2009
|
|||||||||
|
Interest Income
|
$
|
5
|
|
$
|
6
|
|
$
|
11
|
|
|||
|
Income from Real Estate Operations
|
25
|
|
30
|
|
31
|
|
||||||
|
Miscellaneous Expense
|
(8
|
)
|
(4
|
)
|
(8
|
)
|
||||||
|
Total Other Income - Net
|
$
|
22
|
|
$
|
32
|
|
$
|
34
|
|
|||
|
Gross Revenue from Real Estate
|
|
|
|
|||||||||
|
Operations included above
|
$
|
51
|
|
$
|
54
|
|
$
|
60
|
|
|||
95
Other Long-term Assets
Other Long-term Assets consisted of the following:
|
|
December
|
|||||||
|
(Dollars in Millions)
|
2011
|
2010
|
||||||
|
Debt Issuance Costs
(a)
|
$
|
169
|
|
$
|
170
|
|
||
|
Available for Sale Securities
|
105
|
|
69
|
|
||||
|
Goodwill
(b)
|
64
|
|
64
|
|
||||
|
Other
|
55
|
|
50
|
|
||||
|
Total Other Long-term Assets
|
$
|
393
|
|
$
|
353
|
|
||
|
(a)
|
Majority of debt issuance costs relate to premium paid in March 2010 for exchange of debt.
|
|
(b)
|
Goodwill related to subsidiaries of CSXT, primarily P&L Transportation, Inc., represents purchase price in excess of fair value.
|
Other Long-term Liabilities
Other Long-term Liabilities consisted of the following:
|
|
December
|
|||||||
|
(Dollars in Millions)
|
2011
|
2010
|
||||||
|
Pension Plan Liabilities (Note 8)
|
$
|
803
|
|
$
|
623
|
|
||
|
Post-retirement Benefit Liabilities (Note 8)
|
346
|
|
342
|
|
||||
|
Deferred Gains
|
189
|
|
160
|
|
||||
|
Other
|
88
|
|
61
|
|
||||
|
Accrued Deferred Compensation
|
71
|
|
78
|
|
||||
|
Deferred Lease Payments
|
15
|
|
17
|
|
||||
|
Accrued Sick Leave
|
13
|
|
17
|
|
||||
|
Total Other Long-term Liabilities
|
$
|
1,525
|
|
$
|
1,298
|
|
||
96
Earnings from continuing operations before income taxes of
$2.9 billion
,
$2.5 billion
and
$1.7 billion
for fiscal years
2011
,
2010
and
2009
, respectively, represent earnings from domestic operations.
The breakdown of income tax expense between current and deferred is as follows:
|
(Dollars in Millions)
|
Fiscal Years
|
|||||||||||
|
Current:
|
2011
|
2010
|
2009
|
|||||||||
|
Federal
|
$
|
353
|
|
$
|
451
|
|
$
|
151
|
|
|||
|
State
|
104
|
|
58
|
|
37
|
|
||||||
|
Total Current
|
$
|
457
|
|
$
|
509
|
|
$
|
188
|
|
|||
|
Deferred:
|
|
|
|
|||||||||
|
Federal
|
614
|
|
372
|
|
407
|
|
||||||
|
State
(a)
|
(5
|
)
|
102
|
|
23
|
|
||||||
|
Total Deferred
|
$
|
609
|
|
$
|
474
|
|
$
|
430
|
|
|||
|
Total
|
$
|
1,066
|
|
$
|
983
|
|
$
|
618
|
|
|||
(a) The decrease in 2011 deferred state income tax expense is a result of several state legislative changes and the favorable impact of changes in state apportionment factors. The increase in 2010 deferred state income tax expenses is attributable to the unfavorable impact of changes in state apportionment factors and the unfavorable impact of the reorganization of intermodal operations.
Income tax expense reconciled to the tax computed at statutory rates is presented in the table below. The change in the
2011
effective income tax rate compared to the prior year is primarily attributed to several state legislative changes resulting in the recognition of a
$14 million
net benefit included in the state income tax line in the table below. The change in the
2010
effective income tax rate compared to the prior year is primarily attributed to an income tax charge of
$16 million
related to the merger of the Company’s former Intermodal subsidiary with CSXT.
|
|
Fiscal Years
|
||||||||||||||||||||
|
(Dollars In Millions)
|
2011
|
2010
|
2009
|
||||||||||||||||||
|
Federal Income Taxes
|
$
|
1,011
|
|
35.0
|
%
|
$
|
891
|
|
35.0
|
%
|
$
|
610
|
|
35.0
|
%
|
||||||
|
State Income Taxes
|
63
|
|
2.2
|
%
|
85
|
|
3.4
|
%
|
37
|
|
2.1
|
%
|
|||||||||
|
Corporate Reorganization
|
—
|
|
—
|
%
|
16
|
|
0.6
|
%
|
—
|
|
—
|
%
|
|||||||||
|
Other Items
(a)
|
(8
|
)
|
(0.3
|
)%
|
(9
|
)
|
(0.4
|
)%
|
(29
|
)
|
(1.6
|
)%
|
|||||||||
|
Income Tax Expense/Rate
|
$
|
1,066
|
|
36.9
|
%
|
$
|
983
|
|
38.6
|
%
|
$
|
618
|
|
35.5
|
%
|
||||||
(a) Other items primarily include tax impacts from equity in Conrail and other partially owned subsidiaries’ earnings.
The significant components of deferred income tax assets and liabilities include:
|
|
2011
|
2010
|
||||||||||||||
|
(Dollars in Millions)
|
Assets
|
Liabilities
|
Assets
|
Liabilities
|
||||||||||||
|
Pension Plans
|
$
|
300
|
|
$
|
—
|
|
$
|
243
|
|
$
|
—
|
|
||||
|
Other Employee Benefit Plans
|
309
|
|
—
|
|
311
|
|
—
|
|
||||||||
|
Accelerated Depreciation
|
—
|
|
8,148
|
|
—
|
|
7,557
|
|
||||||||
|
Other
|
354
|
|
234
|
|
353
|
|
211
|
|
||||||||
|
Total
|
$
|
963
|
|
$
|
8,382
|
|
$
|
907
|
|
$
|
7,768
|
|
||||
|
Net Deferred Income Tax Liabilities
|
|
|
$
|
7,419
|
|
|
|
$
|
6,861
|
|
||||||
97
The primary factors in the change in year-end net deferred income tax liability balances include:
|
•
|
Annual provision for deferred income tax expense; and
|
|
•
|
Accumulated other comprehensive loss and other capital adjustments.
|
The Company files a consolidated federal income tax return, which includes its principal domestic subsidiaries. CSX and its subsidiaries are subject to U.S. federal income tax as well as income tax of multiple state jurisdictions. CSX participated in a contemporaneous Internal Revenue Service (“IRS”) audit of tax years
2010
and
2011
. During 2010, the Company resolved the final issue on the 2008 IRS Audit Appeal. This settlement had no material impact on the financial statements. Federal examinations of original federal income tax returns for all years through
2009
are resolved.
As of December
2011
and
2010
, the Company had approximately
$22 million
and
$20 million
, respectively, of total net unrecognized tax benefits. After consideration of the impact of federal tax benefits,
$15 million
in
2011
and
2010
could favorably affect the effective income tax rate in each year. The Company estimates that approximately
$4 million
of the unrecognized tax benefits as of December
2011
for various state and federal income tax matters will be resolved over the next
12
months upon the expiration of statutes of limitations. The final outcome of these uncertain tax positions, however, is not yet determinable. The change to the total gross unrecognized tax benefits and prior year audit resolutions of the Company during the fiscal year ended December
2011
is reconciled as follows:
|
Uncertain Tax Positions:
|
Fiscal Year
|
|||||||
|
(Dollars in Millions)
|
2011
|
2010
|
||||||
|
Balance at beginning of the year
|
$
|
20
|
|
$
|
50
|
|
||
|
Additions based on tax positions related to current year
|
1
|
|
3
|
|
||||
|
Additions based on tax positions related to prior years
|
10
|
|
17
|
|
||||
|
Reductions based on tax positions related to prior years
|
(3
|
)
|
(41
|
)
|
||||
|
Settlements with taxing authorities
|
(5
|
)
|
—
|
|
||||
|
Lapse of statute of limitations
|
(1
|
)
|
(9
|
)
|
||||
|
Balance at end of the year
|
$
|
22
|
|
$
|
20
|
|
||
CSX’s continuing practice is to recognize net interest and penalties related to income tax matters in income tax expense. Included in the consolidated income statements are expense or (benefits) of
$1 million
,
$7 million
and
$(6) million
for fiscal years
2011
,
2010
and
2009
, respectively, for the reduction to reserves for interest and penalties for all prior year tax positions. Prior year benefits for interest and penalties are due to favorable tax settlements of prior period tax audits where the Company had previously accrued a liability for interest and penalties. The Company had
$11 million
and
$6 million
accrued for interest and penalties at
2011
and
2010
, respectively, for all prior year tax positions.
98
Through a limited liability company, CSX and Norfolk Southern Corporation (“NS”) jointly own Conrail. CSX has a
42%
economic interest and
50%
voting interest in the jointly-owned entity, and NS has the remainder of the economic and voting interests. Pursuant to the
Investments-Equity Method and Joint Venture Topic
in the ASC, CSX applies the equity method of accounting to its investment in Conrail.
Conrail owns rail infrastructure and operates for the joint benefit of CSX and NS. This is known as the shared asset area. Conrail charges fees for right-of-way usage, equipment rentals and transportation, switching and terminal service charges in the shared asset area. These expenses are included in materials, supplies and other on the consolidated income statements.
Also included in materials, supplies and other are CSX’s
42%
share of Conrail’s income and its amortization of the fair value write-up arising from the acquisition of Conrail and certain other adjustments. The amortization primarily represents the additional after-tax depreciation expense related to the write-up of Conrail’s fixed assets when the original purchase price, from the
1997
acquisition of Conrail, was allocated based on fair value.
The following table details the related Conrail amounts included in materials, supplies and other in the Company’s consolidated income statements:
|
|
Fiscal Years
|
|||||||||||
|
(Dollars in Millions)
|
2011
|
2010
|
2009
|
|||||||||
|
Rents, Fees and Services
|
$
|
111
|
|
$
|
112
|
|
$
|
104
|
|
|||
|
Purchase Price Amortization and Other
|
4
|
|
4
|
|
4
|
|
||||||
|
Equity in Income of Conrail
|
(24
|
)
|
(21
|
)
|
(27
|
)
|
||||||
|
Total Conrail Rents, Fees and Services
|
$
|
91
|
|
$
|
95
|
|
$
|
81
|
|
|||
As required by the
Related Party Disclosures Topic
in the ASC, the Company has identified amounts below owed to Conrail, or its subsidiaries, representing liabilities under the operating, equipment and shared area agreements with Conrail. The Company also executed two promissory notes with a subsidiary of Conrail which were included in long-term debt on the consolidated balance sheets.
|
|
December
|
December
|
||||||
|
(Dollars in Millions)
|
2011
|
2010
|
||||||
|
Balance Sheet Information:
|
|
|
||||||
|
CSX Payable to Conrail
(a)
|
$
|
143
|
|
$
|
119
|
|
||
|
Promissory Notes Payable to Conrail Subsidiary
|
|
|
||||||
|
4.40% CSX Promissory Note due October 2035
(b)
|
$
|
73
|
|
$
|
73
|
|
||
|
4.52% CSXT Promissory Note due March 2035
(b)
|
$
|
23
|
|
$
|
23
|
|
||
(a) Included on the consolidated balance sheet of CSX as accounts payable because it is short term in nature.
(b) Included on the consolidated balance sheet of CSX as long-term debt.
Interest expense from the promissory notes payable to a Conrail subsidiary was
$4 million
for
2011
,
2010
and
2009
, respectively.
99
In
2009
, CSX sold the stock of a subsidiary that indirectly owned Greenbrier Hotel Corporation (“GHC” or “The Greenbrier”) to Justice Family Group, LLC (“JFG”) for approximately
$21 million
in cash. CSX recognized a gain on the sale of
$25 million
which included a tax benefit of
$3 million
in
2009
. The gain was calculated using cash proceeds, net book value, deal-related costs incurred and tax benefits. CSX has retained responsibility for certain pre-closing Greenbrier pension obligations. Additionally in
2009
, The
Greenbrier recognized a pre-tax operating loss of
$17 million
or
$10 million
after tax.
The
2009
transaction is reported as discontinued operations under the subsection
Impairment or Disposal of Long-Lived Assets
in the ASC. Therefore, the gain on sale as well as loss from operations is reported as discontinued operations.
Income statement information:
|
|
Fiscal Year
|
||||
|
(Dollars in Millions)
|
2009
|
||||
|
Revenue
|
$
|
33
|
|
||
|
Pre-Tax Income
|
$
|
5
|
|
||
|
Net Loss, After Tax
|
$
|
(10
|
)
|
||
|
Gain on Sale, After Tax
|
25
|
|
|||
|
Net Income From Discontinued Operations
|
$
|
15
|
|
||
|
Earnings Per Share
|
|
|
|||
|
From Discontinued Operations, Assuming Dilution
|
$
|
0.01
|
|
||
The
Financial Instruments Topic
in the ASC requires disclosures about fair value of financial instruments in annual reports as well as in quarterly reports. For CSX, this statement applies to certain investments, pension plan assets and long-term debt. Also, the
Fair Value Measurements and Disclosures Topic
in the ASC clarifies the definition of fair value for financial reporting, establishes a framework for measuring fair value and requires additional disclosures about the use of fair value measurements.
Various inputs are considered when determining the value of the Company's investments, pension plan assets and long-term debt. The inputs or methodologies used for valuing securities are not necessarily an indication of the risk associated with investing in these securities. These inputs are summarized in the three broad levels listed below.
|
•
|
Level 1 – observable market inputs that are unadjusted quoted prices for identical assets or liabilities in active markets
|
|
•
|
Level 2 – other significant observable inputs (including quoted prices for similar securities, interest rates, credit risk, etc.)
|
|
•
|
Level 3 – significant unobservable inputs (including the Company’s own assumptions in determining the fair value of investments)
|
The valuation methods described below may produce a fair value calculation that may not be indicative of net realizable value or reflective of future fair values. Furthermore, while the Company believes its valuation methods are appropriate and consistent with other market participants, the use of different methodologies or assumptions to determine the fair value of certain financial instruments could result in a different fair value measurement at the reporting date.
100
NOTE 15. Fair Value Measurements,
continued
Investments
The Company's investment assets, valued by a third-party trustee, consist of certificates of deposits, corporate bonds, U.S. government securities and auction rate securities and are carried at fair value on the consolidated balance sheet per the
Fair Value Measurements and Disclosures Topic
in the ASC. There are several valuation methodologies used for those assets as described below.
|
•
|
Certificates of Deposit (Level 2):
Valued by discounting the related cash flows based on current yields of similar instruments with comparable durations.
|
|
•
|
Corporate Bonds and U.S. Treasury Obligations (Level 2):
Valued using price evaluations reflecting the bid and/or ask sides of the market for a similar investment as of the last day of the calendar plan year.
|
|
•
|
Auction Rate Securities (Level 3):
Valued using a discounted cash flow model, because there is currently no active market for trading.
|
The amortized cost basis of investments was
$643 million
and
$136 million
as of
December 30, 2011
and
December 31, 2010
, respectively. The following is a summary of the fair value of the Company's investment assets:
|
Fiscal Years
|
|||||||||||||||||||||||||
|
2011
|
2010
|
||||||||||||||||||||||||
|
(Dollars in Millions)
|
Level 1
|
Level 2
|
Level 3
|
Total
|
Level 1
|
Level 2
|
Level 3
|
Total
|
|||||||||||||||||
|
Certificates of Deposit
|
$
|
—
|
|
$
|
477
|
|
$
|
—
|
|
$
|
477
|
|
$
|
—
|
|
$
|
—
|
|
$
|
—
|
|
$
|
—
|
|
|
|
Corporate Bonds
|
—
|
|
98
|
|
—
|
|
98
|
|
—
|
|
89
|
|
—
|
|
89
|
|
|||||||||
|
U.S. Treasury Obligations
|
—
|
|
53
|
|
—
|
|
53
|
|
—
|
|
34
|
|
—
|
|
34
|
|
|||||||||
|
Auction Rate Securities
|
—
|
|
—
|
|
15
|
|
15
|
|
—
|
|
—
|
|
15
|
|
15
|
|
|||||||||
|
Total investments at fair value
|
$
|
—
|
|
$
|
628
|
|
$
|
15
|
|
$
|
643
|
|
$
|
—
|
|
$
|
123
|
|
$
|
15
|
|
$
|
138
|
|
|
These investments have the following maturities:
|
(Dollars in Millions)
|
December 2011
|
December 2010
|
||||||
|
Less than 1 year
|
$
|
523
|
|
$
|
54
|
|
||
|
1 - 2 years
|
32
|
|
40
|
|
||||
|
2 - 5 years
|
73
|
|
26
|
|
||||
|
Greater than 5 years
|
15
|
|
18
|
|
||||
|
Total investments at fair value
|
$
|
643
|
|
$
|
138
|
|
||
101
NOTE 15. Fair Value Measurements,
continued
Long-term Debt
Long-term debt is reported at carrying amount on the consolidated balance sheet and is the Company's only financial instrument with fair values significantly different from their carrying amounts. The majority of the Company's long-term debt is valued by an independent third party. For those instruments not valued by the third party, the fair value has been estimated by applying market rates of similar instruments to the scheduled contractual debt payments and maturities. These market rates are provided by the same third party. All of the inputs used to determine the fair value of the Company's long-term debt are Level 2 inputs.
The fair value of outstanding debt fluctuates with changes in a number of factors. Such factors include, but are not limited to, interest rates, market conditions, values of similar financial instruments, size of the transaction, cash flow projections and comparable trades. Fair value will exceed carrying value when the current market interest rate is lower than the interest rate at which the debt was originally issued. The fair value of a company's debt is a measure of its current value under present market conditions. It does not impact the financial statements under current accounting rules. The fair value and carrying value of the Company's long-term debt is as follows:
|
(Dollars in Millions)
|
December 2011
|
December 2010
|
||||||
|
Long-term Debt Including Current Maturities:
|
|
|
||||||
|
Fair Value
|
$
|
10,708
|
|
$
|
9,624
|
|
||
|
Carrying Value
|
$
|
9,241
|
|
$
|
8,664
|
|
||
Pension Plan Assets
Pension plan assets are reported at fair value on the consolidated balance sheet. The Investment Committee targets an allocation of pension assets to be generally
60%
equity and
40%
fixed income. There are several valuation methodologies used for those assets as described below.
|
•
|
Common stock (Level 1):
Valued at the closing price reported on the active market on which the individual securities are traded on the last day of the plan year and classified in level 1 of the fair value hierarchy.
|
|
•
|
Common trust funds (Level 2):
The net asset value of the common trusts is determined by reference to the fair value of the underlying securities of the trust, which are valued primarily through the use of directly or indirectly observable inputs. These assets are classified in level 2 of the fair value hierarchy.
|
|
•
|
Corporate bonds, derivatives, government securities, and asset-backed securities (Level 2):
Valued using price evaluations reflecting the bid and/or ask sides of the market for a similar investment as of the last day of the calendar plan year. Asset-backed securities include commercial mortgage-backed securities and collateralized mortgage obligations. These assets are classified in level 2 of the fair value hierarchy.
|
|
•
|
Partnerships (Level 3):
Private equity valued using the fair market values associated with the underlying investments at year end using net asset per share and is classified in level 3 of the fair value hierarchy.
|
102
The pension plan assets at fair value by level, within the fair value hierarchy, as of calendar plan years
2011
and
2010
:
|
|
Fiscal Years
|
|||||||||||||||||||||||||||||||
|
|
2011
|
2010
|
||||||||||||||||||||||||||||||
|
(Dollars in Millions)
|
Level 1
|
Level 2
|
Level 3
|
Total
|
Level 1
|
Level 2
|
Level 3
|
Total
|
||||||||||||||||||||||||
|
Common Stock:
|
|
|
|
|
|
|
|
|
|
|
|
|
|
|
|
|
||||||||||||||||
|
Information technology
|
$
|
137
|
|
$
|
—
|
|
$
|
—
|
|
$
|
137
|
|
$
|
161
|
|
$
|
—
|
|
$
|
—
|
|
$
|
161
|
|
||||||||
|
Consumer discretionary
|
88
|
|
—
|
|
—
|
|
88
|
|
109
|
|
—
|
|
—
|
|
109
|
|
||||||||||||||||
|
Health care
|
70
|
|
—
|
|
—
|
|
70
|
|
68
|
|
—
|
|
—
|
|
68
|
|
||||||||||||||||
|
Industrials
|
65
|
|
—
|
|
—
|
|
65
|
|
70
|
|
—
|
|
—
|
|
70
|
|
||||||||||||||||
|
Energy
|
61
|
|
—
|
|
—
|
|
61
|
|
63
|
|
—
|
|
—
|
|
63
|
|
||||||||||||||||
|
Financials
|
53
|
|
—
|
|
—
|
|
53
|
|
65
|
|
—
|
|
—
|
|
65
|
|
||||||||||||||||
|
Consumer staples
|
42
|
|
—
|
|
—
|
|
42
|
|
33
|
|
—
|
|
—
|
|
33
|
|
||||||||||||||||
|
Materials
|
24
|
|
—
|
|
—
|
|
24
|
|
25
|
|
—
|
|
—
|
|
25
|
|
||||||||||||||||
|
Other
|
18
|
|
—
|
|
—
|
|
18
|
|
20
|
|
—
|
|
—
|
|
20
|
|
||||||||||||||||
|
Corporate securities
|
—
|
|
605
|
|
—
|
|
605
|
|
—
|
|
613
|
|
—
|
|
613
|
|
||||||||||||||||
|
Common trust funds
|
—
|
|
380
|
|
—
|
|
380
|
|
—
|
|
419
|
|
—
|
|
419
|
|
||||||||||||||||
|
Derivatives liabilities
|
—
|
|
(247
|
)
|
—
|
|
(247
|
)
|
—
|
|
(211
|
)
|
—
|
|
(211
|
)
|
||||||||||||||||
|
Derivatives assets
|
—
|
|
245
|
|
—
|
|
245
|
|
—
|
|
211
|
|
—
|
|
211
|
|
||||||||||||||||
|
Partnerships
|
—
|
|
—
|
|
175
|
|
175
|
|
—
|
|
—
|
|
101
|
|
101
|
|
||||||||||||||||
|
Government securities
|
—
|
|
124
|
|
—
|
|
124
|
|
—
|
|
88
|
|
—
|
|
88
|
|
||||||||||||||||
|
Asset-backed securities
|
—
|
|
10
|
|
—
|
|
10
|
|
—
|
|
16
|
|
—
|
|
16
|
|
||||||||||||||||
|
Total investments at
fair value
|
$
|
558
|
|
$
|
1,117
|
|
$
|
175
|
|
$
|
1,850
|
|
$
|
614
|
|
$
|
1,136
|
|
$
|
101
|
|
$
|
1,851
|
|
||||||||
For additional information related to pension assets, see Note 8, Employee Benefit Plans.
The summary of changes in the fair value of the Company’s level 3 pension plan assets for the calendar plan year
2011
is shown below.
|
(Dollars in Millions)
|
2011
|
2010
|
|||||
|
Balance, Beginning of Year
|
$
|
101
|
|
$
|
95
|
|
|
|
Purchases
|
71
|
|
—
|
|
|||
|
Unrealized Gains
|
3
|
|
6
|
|
|||
|
Balance, End of Year
|
$
|
175
|
|
$
|
101
|
|
|
103
Pursuant to Article 3 of the SEC’s Regulation S-X, the following are selected quarterly financial data:
|
|
2011
|
|||||||||||||||||||
|
Quarters
|
||||||||||||||||||||
|
(Dollars in Millions, Except Per Share Amounts)
|
1st
|
2nd
|
3rd
|
4th
|
Full Year
|
|||||||||||||||
|
Revenue
|
$
|
2,810
|
|
$
|
3,019
|
|
$
|
2,963
|
|
$
|
2,951
|
|
$
|
11,743
|
|
|||||
|
Operating Income
|
773
|
|
926
|
|
878
|
|
841
|
|
3,418
|
|
||||||||||
|
Net Earnings
|
395
|
|
506
|
|
464
|
|
457
|
|
1,822
|
|
||||||||||
|
Earnings Per Share, Basic
|
$
|
0.36
|
|
$
|
0.46
|
|
$
|
0.43
|
|
$
|
0.44
|
|
$
|
1.68
|
|
|||||
|
Earnings Per Share, Assuming Dilution
|
0.35
|
|
0.46
|
|
0.43
|
|
0.43
|
|
1.67
|
|
||||||||||
|
Dividend Per Share
|
0.09
|
|
0.12
|
|
0.12
|
|
0.12
|
|
0.45
|
|
||||||||||
|
|
2010
|
|||||||||||||||||||
|
Quarters
|
||||||||||||||||||||
|
(Dollars in Millions, Except Per Share Amounts)
|
1st
|
2nd
|
3rd
|
4th
|
Full Year
|
|||||||||||||||
|
Revenue
|
$
|
2,491
|
|
$
|
2,663
|
|
$
|
2,666
|
|
$
|
2,816
|
|
$
|
10,636
|
|
|||||
|
Operating Income
|
632
|
|
768
|
|
825
|
|
846
|
|
3,071
|
|
||||||||||
|
Net Earnings
|
305
|
|
414
|
|
414
|
|
430
|
|
1,563
|
|
||||||||||
|
Earnings Per Share, Basic
|
$
|
0.26
|
|
$
|
0.36
|
|
$
|
0.36
|
|
$
|
0.38
|
|
$
|
1.37
|
|
|||||
|
Earnings Per Share, Assuming Dilution
|
0.26
|
|
0.36
|
|
0.36
|
|
0.38
|
|
1.35
|
|
||||||||||
|
Dividend Per Share
|
0.08
|
|
0.08
|
|
0.08
|
|
0.09
|
|
0.33
|
|
||||||||||
All per share data were retroactively restated to reflect the three-for-one stock split effective May 31, 2011.
104
In 2007, CSXT sold secured equipment notes maturing in 2023, and in 2008, CSXT sold additional secured equipment notes maturing in 2014 in registered public offerings. CSX has fully and unconditionally guaranteed the notes. In connection with the notes, the Company is providing the following condensed consolidating financial information in accordance with SEC disclosure requirements. Each entity in the consolidating financial information follows the same accounting policies as described in the consolidated financial statements, except for the use of the equity method of accounting to reflect ownership interests in subsidiaries which are eliminated upon consolidation and the allocation of certain expenses of CSX incurred for the benefit of its subsidiaries.
Condensed consolidating financial information for the obligor, CSXT, and parent guarantor, CSX, is as follows:
105
Consolidating Income Statements
(Dollars in Millions)
NOTE 17. Summarized Consolidating Financial Data,
continued
|
Fiscal Year Ended December 2011
|
CSX
Corporation
|
CSX
Transportation
|
Eliminations and Other
|
Consolidated
|
||||||||||||
|
Revenue
|
$
|
—
|
|
$
|
11,676
|
|
$
|
67
|
|
$
|
11,743
|
|
||||
|
Expense
|
(278
|
)
|
8,679
|
|
(76
|
)
|
8,325
|
|
||||||||
|
Operating Income
|
278
|
|
2,997
|
|
143
|
|
3,418
|
|
||||||||
|
Equity in Earnings of Subsidiaries
|
1,947
|
|
3
|
|
(1,950
|
)
|
—
|
|
||||||||
|
Interest Expense
|
(496
|
)
|
(83
|
)
|
27
|
|
(552
|
)
|
||||||||
|
Other Income - Net
|
13
|
|
19
|
|
(10
|
)
|
22
|
|
||||||||
|
Earnings from Continuing Operations
|
|
|
||||||||||||||
|
Before Income Taxes
|
1,742
|
|
2,936
|
|
(1,790
|
)
|
2,888
|
|
||||||||
|
Income Tax Benefit (Expense)
|
80
|
|
(1,081
|
)
|
(65
|
)
|
(1,066
|
)
|
||||||||
|
Net Earnings
|
$
|
1,822
|
|
$
|
1,855
|
|
$
|
(1,855
|
)
|
$
|
1,822
|
|
||||
|
Fiscal Year Ended December 2010
|
CSX
Corporation
|
CSX
Transportation
|
Eliminations and Other
|
Consolidated
|
||||||||||||
|
Revenue
|
$
|
—
|
|
$
|
9,939
|
|
$
|
697
|
|
$
|
10,636
|
|
||||
|
Expense
|
(166
|
)
|
7,110
|
|
621
|
|
7,565
|
|
||||||||
|
Operating Income
|
166
|
|
2,829
|
|
76
|
|
3,071
|
|
||||||||
|
Equity in Earnings of Subsidiaries
|
1,779
|
|
3
|
|
(1,782
|
)
|
—
|
|
||||||||
|
Interest Expense
|
(499
|
)
|
(101
|
)
|
43
|
|
(557
|
)
|
||||||||
|
Other Income - Net
|
21
|
|
22
|
|
(11
|
)
|
32
|
|
||||||||
|
Earnings from Continuing Operations
|
||||||||||||||||
|
Before Income Taxes
|
1,467
|
|
2,753
|
|
(1,674
|
)
|
2,546
|
|
||||||||
|
Income Tax Benefit (Expense)
|
96
|
|
(1,064
|
)
|
(15
|
)
|
(983
|
)
|
||||||||
|
Net Earnings
|
$
|
1,563
|
|
$
|
1,689
|
|
$
|
(1,689
|
)
|
$
|
1,563
|
|
||||
|
Fiscal Year Ended December 2009
|
CSX
Corporation
|
CSX
Transportation
|
Eliminations and Other
|
Consolidated
|
||||||||||||
|
Revenue
|
$
|
—
|
|
$
|
7,776
|
|
$
|
1,265
|
|
$
|
9,041
|
|
||||
|
Expense
|
(279
|
)
|
5,983
|
|
1,067
|
|
6,771
|
|
||||||||
|
Operating Income
|
279
|
|
1,793
|
|
198
|
|
2,270
|
|
||||||||
|
Equity in Earnings of Subsidiaries
|
1,239
|
|
10
|
|
(1,249
|
)
|
—
|
|
||||||||
|
Interest Expense
|
(500
|
)
|
(116
|
)
|
58
|
|
(558
|
)
|
||||||||
|
Other Income - Net
|
70
|
|
18
|
|
(54
|
)
|
34
|
|
||||||||
|
Earnings from Continuing Operations
|
||||||||||||||||
|
Before Income Taxes
|
1,088
|
|
1,705
|
|
(1,047
|
)
|
1,746
|
|
||||||||
|
Income Tax Benefit (Expense)
|
23
|
|
(624
|
)
|
(17
|
)
|
(618
|
)
|
||||||||
|
Earnings from Continuing Operations
|
1,111
|
|
1,081
|
|
(1,064
|
)
|
1,128
|
|
||||||||
|
Discontinued Operations
|
32
|
|
—
|
|
(17
|
)
|
15
|
|
||||||||
|
Net Earnings
|
$
|
1,143
|
|
$
|
1,081
|
|
$
|
(1,081
|
)
|
$
|
1,143
|
|
||||
106
Consolidating Balance Sheets
(Dollars in Millions)
NOTE 17. Summarized Consolidating Financial Data,
continued
|
As of December 30, 2011
|
CSX
Corporation
|
CSX
Transportation
|
Eliminations and Other
|
Consolidated
|
||||||||||||
|
ASSETS
|
||||||||||||||||
|
Current Assets
|
|
|
|
|
||||||||||||
|
Cash and Cash Equivalents
|
$
|
549
|
|
$
|
154
|
|
$
|
80
|
|
$
|
783
|
|
||||
|
Short-term Investments
|
475
|
|
—
|
|
48
|
|
523
|
|
||||||||
|
Accounts Receivable - Net
|
4
|
|
468
|
|
657
|
|
1,129
|
|
||||||||
|
Receivable from Affiliates
|
1,025
|
|
1,772
|
|
(2,797
|
)
|
—
|
|
||||||||
|
Materials and Supplies
|
—
|
|
240
|
|
—
|
|
240
|
|
||||||||
|
Deferred Income Taxes
|
10
|
|
173
|
|
(1
|
)
|
182
|
|
||||||||
|
Other Current Assets
|
17
|
|
64
|
|
(3
|
)
|
78
|
|
||||||||
|
Total Current Assets
|
2,080
|
|
2,871
|
|
(2,016
|
)
|
2,935
|
|
||||||||
|
Properties
|
8
|
|
31,958
|
|
1,738
|
|
33,704
|
|
||||||||
|
Accumulated Depreciation
|
(8
|
)
|
(7,795
|
)
|
(927
|
)
|
(8,730
|
)
|
||||||||
|
Properties - Net
|
—
|
|
24,163
|
|
811
|
|
24,974
|
|
||||||||
|
Investments in Conrail
|
—
|
|
—
|
|
678
|
|
678
|
|
||||||||
|
Affiliates and Other Companies
|
(39
|
)
|
574
|
|
(42
|
)
|
493
|
|
||||||||
|
Investment in Consolidated Subsidiaries
|
17,519
|
|
—
|
|
(17,519
|
)
|
—
|
|
||||||||
|
Other Long-term Assets
|
176
|
|
109
|
|
108
|
|
393
|
|
||||||||
|
Total Assets
|
$
|
19,736
|
|
$
|
27,717
|
|
$
|
(17,980
|
)
|
$
|
29,473
|
|
||||
|
LIABILITIES AND SHAREHOLDERS' EQUITY
|
||||||||||||||||
|
Current Liabilities
|
||||||||||||||||
|
Accounts Payable
|
$
|
114
|
|
$
|
978
|
|
$
|
55
|
|
$
|
1,147
|
|
||||
|
Labor and Fringe Benefits Payable
|
41
|
|
458
|
|
42
|
|
541
|
|
||||||||
|
Payable to Affiliates
|
2,566
|
|
374
|
|
(2,940
|
)
|
—
|
|
||||||||
|
Casualty, Environmental and Other Reserves
|
—
|
|
167
|
|
16
|
|
183
|
|
||||||||
|
Current Maturities of Long-term Debt
|
400
|
|
105
|
|
2
|
|
507
|
|
||||||||
|
Income and Other Taxes Payable
|
(60
|
)
|
189
|
|
—
|
|
129
|
|
||||||||
|
Other Current Liabilities
|
(1
|
)
|
178
|
|
3
|
|
180
|
|
||||||||
|
Total Current Liabilities
|
3,060
|
|
2,449
|
|
(2,822
|
)
|
2,687
|
|
||||||||
|
Casualty, Environmental and Other Reserves
|
—
|
|
369
|
|
89
|
|
458
|
|
||||||||
|
Long-term Debt
|
7,609
|
|
1,124
|
|
1
|
|
8,734
|
|
||||||||
|
Deferred Income Taxes
|
(246
|
)
|
7,800
|
|
47
|
|
7,601
|
|
||||||||
|
Other Long-term Liabilities
|
858
|
|
582
|
|
85
|
|
1,525
|
|
||||||||
|
Total Liabilities
|
11,281
|
|
12,324
|
|
(2,600
|
)
|
21,005
|
|
||||||||
|
Shareholders' Equity
|
||||||||||||||||
|
Common Stock, $1 Par Value
|
1,049
|
|
181
|
|
(181
|
)
|
1,049
|
|
||||||||
|
Other Capital
|
6
|
|
5,652
|
|
(5,652
|
)
|
6
|
|
||||||||
|
Retained Earnings
|
8,275
|
|
9,618
|
|
(9,618
|
)
|
8,275
|
|
||||||||
|
Accumulated Other Comprehensive Loss
|
(875
|
)
|
(79
|
)
|
79
|
|
(875
|
)
|
||||||||
|
Noncontrolling Minority Interest
|
—
|
|
21
|
|
(8
|
)
|
13
|
|
||||||||
|
Total Shareholders' Equity
|
8,455
|
|
15,393
|
|
(15,380
|
)
|
8,468
|
|
||||||||
|
Total Liabilities and Shareholders' Equity
|
$
|
19,736
|
|
$
|
27,717
|
|
$
|
(17,980
|
)
|
$
|
29,473
|
|
||||
107
Consolidating Balance Sheets
(Dollars in Millions)
NOTE 17. Summarized Consolidating Financial Data,
continued
|
As of December 31, 2010
|
CSX Corporation
|
CSX Transportation
|
Eliminations and Other
|
Consolidated
|
||||||||||||
|
ASSETS
|
||||||||||||||||
|
Current Assets
|
|
|
|
|
|
|
|
|
||||||||
|
Cash and Cash Equivalents
|
$
|
1,100
|
|
$
|
118
|
|
$
|
74
|
|
$
|
1,292
|
|
||||
|
Short-term Investments
|
—
|
|
—
|
|
54
|
|
54
|
|
||||||||
|
Accounts Receivable - Net
|
5
|
|
447
|
|
541
|
|
993
|
|
||||||||
|
Receivable from Affiliates
|
1,048
|
|
943
|
|
(1,991
|
)
|
—
|
|
||||||||
|
Materials and Supplies
|
—
|
|
218
|
|
—
|
|
218
|
|
||||||||
|
Deferred Income Taxes
|
15
|
|
171
|
|
6
|
|
192
|
|
||||||||
|
Other Current Assets
|
46
|
|
56
|
|
4
|
|
106
|
|
||||||||
|
Total Current Assets
|
2,214
|
|
1,953
|
|
(1,312
|
)
|
2,855
|
|
||||||||
|
Properties
|
8
|
|
30,557
|
|
1,500
|
|
32,065
|
|
||||||||
|
Accumulated Depreciation
|
(8
|
)
|
(7,405
|
)
|
(853
|
)
|
(8,266
|
)
|
||||||||
|
Properties - Net
|
—
|
|
23,152
|
|
647
|
|
23,799
|
|
||||||||
|
Investments in Conrail
|
—
|
|
—
|
|
673
|
|
673
|
|
||||||||
|
Affiliates and Other Companies
|
—
|
|
595
|
|
(134
|
)
|
461
|
|
||||||||
|
Investment in Consolidated Subsidiaries
|
16,278
|
|
—
|
|
(16,278
|
)
|
—
|
|
||||||||
|
Other Long-term Assets
|
174
|
|
110
|
|
69
|
|
353
|
|
||||||||
|
Total Assets
|
$
|
18,666
|
|
$
|
25,810
|
|
$
|
(16,335
|
)
|
$
|
28,141
|
|
||||
|
LIABILITIES AND SHAREHOLDERS' EQUITY
|
||||||||||||||||
|
Current Liabilities
|
||||||||||||||||
|
Accounts Payable
|
$
|
116
|
|
$
|
904
|
|
$
|
26
|
|
$
|
1,046
|
|
||||
|
Labor and Fringe Benefits Payable
|
42
|
|
431
|
|
47
|
|
520
|
|
||||||||
|
Payable to Affiliates
|
1,942
|
|
401
|
|
(2,343
|
)
|
—
|
|
||||||||
|
Casualty, Environmental and Other Reserves
|
—
|
|
161
|
|
15
|
|
176
|
|
||||||||
|
Current Maturities of Long-term Debt
|
517
|
|
94
|
|
2
|
|
613
|
|
||||||||
|
Income and Other Taxes Payable
|
378
|
|
109
|
|
(402
|
)
|
85
|
|
||||||||
|
Other Current Liabilities
|
—
|
|
96
|
|
1
|
|
97
|
|
||||||||
|
Total Current Liabilities
|
2,995
|
|
2,196
|
|
(2,654
|
)
|
2,537
|
|
||||||||
|
Casualty, Environmental and Other Reserves
|
—
|
|
411
|
|
91
|
|
502
|
|
||||||||
|
Long-term Debt
|
6,815
|
|
1,235
|
|
1
|
|
8,051
|
|
||||||||
|
Deferred Income Taxes
|
(526
|
)
|
7,228
|
|
351
|
|
7,053
|
|
||||||||
|
Other Long-term Liabilities
|
696
|
|
525
|
|
77
|
|
1,298
|
|
||||||||
|
Total Liabilities
|
9,980
|
|
11,595
|
|
(2,134
|
)
|
19,441
|
|
||||||||
|
Shareholders' Equity
|
||||||||||||||||
|
Common Stock, $1 Par Value
|
370
|
|
181
|
|
(181
|
)
|
370
|
|
||||||||
|
Other Capital
|
—
|
|
5,634
|
|
(5,634
|
)
|
—
|
|
||||||||
|
Retained Earnings
|
9,087
|
|
8,443
|
|
(8,443
|
)
|
9,087
|
|
||||||||
|
Accumulated Other Comprehensive Loss
|
(771
|
)
|
(65
|
)
|
65
|
|
(771
|
)
|
||||||||
|
Noncontrolling Minority Interest
|
—
|
|
22
|
|
(8
|
)
|
14
|
|
||||||||
|
Total Shareholders' Equity
|
8,686
|
|
14,215
|
|
(14,201
|
)
|
8,700
|
|
||||||||
|
Total Liabilities and Shareholders' Equity
|
$
|
18,666
|
|
$
|
25,810
|
|
$
|
(16,335
|
)
|
$
|
28,141
|
|
||||
108
Consolidating Cash Flow Statements
(Dollars in Millions)
NOTE 17. Summarized Consolidating Financial Data,
continued
|
Fiscal Year Ended December 2011
|
CSX Corporation
|
CSX Transportation
|
Eliminations and Other
|
Consolidated
|
||||||||||||
|
Operating Activities
|
|
|
|
|
|
|
|
|
||||||||
|
Net Cash Provided by (Used in) Operating Activities
|
$
|
1,231
|
|
$
|
2,746
|
|
$
|
(486
|
)
|
$
|
3,491
|
|
||||
|
Investing Activities
|
||||||||||||||||
|
Property Additions
|
—
|
|
(2,034
|
)
|
(263
|
)
|
(2,297
|
)
|
||||||||
|
Purchases of Short-term Investments
|
(475
|
)
|
—
|
|
(17
|
)
|
(492
|
)
|
||||||||
|
Proceeds from Property Dispositions
|
—
|
|
239
|
|
1
|
|
240
|
|
||||||||
|
Other Investing Activities
|
(20
|
)
|
(133
|
)
|
115
|
|
(38
|
)
|
||||||||
|
Net Cash Provided by (Used in) Investing Activities
|
(495
|
)
|
(1,928
|
)
|
(164
|
)
|
(2,587
|
)
|
||||||||
|
Financing Activities
|
||||||||||||||||
|
Long-term Debt Issued
|
1,200
|
|
—
|
|
—
|
|
1,200
|
|
||||||||
|
Long-term Debt Repaid
|
(507
|
)
|
(95
|
)
|
(3
|
)
|
(605
|
)
|
||||||||
|
Dividends Paid
|
(480
|
)
|
(680
|
)
|
680
|
|
(480
|
)
|
||||||||
|
Stock Options Exercised
|
29
|
|
—
|
|
—
|
|
29
|
|
||||||||
|
Shares Repurchased
|
(1,564
|
)
|
—
|
|
—
|
|
(1,564
|
)
|
||||||||
|
Other Financing Activities
|
35
|
|
(7
|
)
|
(21
|
)
|
7
|
|
||||||||
|
Net Cash Provided by (Used in) Financing Activities
|
(1,287
|
)
|
(782
|
)
|
656
|
|
(1,413
|
)
|
||||||||
|
Net Increase (Decrease) in
Cash and Cash Equivalents
|
(551
|
)
|
36
|
|
6
|
|
(509
|
)
|
||||||||
|
Cash and Cash Equivalents at Beginning of Period
|
1,100
|
|
118
|
|
74
|
|
1,292
|
|
||||||||
|
Cash and Cash Equivalents at End of Period
|
$
|
549
|
|
$
|
154
|
|
$
|
80
|
|
$
|
783
|
|
||||
109
Consolidating Cash Flow Statements
(Dollars in Millions)
NOTE 17. Summarized Consolidating Financial Data,
continued
|
Fiscal Year Ended December 2010
|
CSX Corporation
|
CSX Transportation
|
Eliminations and Other
|
Consolidated
|
||||||||||||
|
Operating Activities
|
|
|
|
|
|
|
|
|
||||||||
|
Net Cash Provided by (Used in) Operating Activities
|
$
|
944
|
|
$
|
2,393
|
|
$
|
(76
|
)
|
$
|
3,261
|
|
||||
|
Investing Activities
|
||||||||||||||||
|
Property Additions
|
—
|
|
(1,587
|
)
|
(253
|
)
|
(1,840
|
)
|
||||||||
|
Proceeds from Property Dispositions
|
—
|
|
107
|
|
1
|
|
108
|
|
||||||||
|
Other Investing Activities
|
301
|
|
(110
|
)
|
(230
|
)
|
(39
|
)
|
||||||||
|
Net Cash Provided by (Used in) Investing Activities
|
301
|
|
(1,590
|
)
|
(482
|
)
|
(1,771
|
)
|
||||||||
|
Financing Activities
|
||||||||||||||||
|
Long-term Debt Issued
|
800
|
|
—
|
|
—
|
|
800
|
|
||||||||
|
Long-term Debt Repaid
|
—
|
|
(111
|
)
|
(2
|
)
|
(113
|
)
|
||||||||
|
Dividends Paid
|
(372
|
)
|
(590
|
)
|
590
|
|
(372
|
)
|
||||||||
|
Stock Options Exercised
|
42
|
|
—
|
|
—
|
|
42
|
|
||||||||
|
Shares Repurchased
|
(1,452
|
)
|
—
|
|
—
|
|
(1,452
|
)
|
||||||||
|
Other Financing Activities
|
(81
|
)
|
(14
|
)
|
(37
|
)
|
(132
|
)
|
||||||||
|
Net Cash Provided by (Used in) Financing Activities
|
(1,063
|
)
|
(715
|
)
|
551
|
|
(1,227
|
)
|
||||||||
|
Net Increase (Decrease) in
Cash and Cash Equivalents
|
182
|
|
88
|
|
(7
|
)
|
263
|
|
||||||||
|
Cash and Cash Equivalents at Beginning of Period
|
918
|
|
30
|
|
81
|
|
1,029
|
|
||||||||
|
Cash and Cash Equivalents at End of Period
|
$
|
1,100
|
|
$
|
118
|
|
$
|
74
|
|
$
|
1,292
|
|
||||
110
Consolidating Cash Flow Statements
(Dollars in Millions)
|
Fiscal Year Ended December 2009
|
CSX Corporation
|
CSX Transportation
|
Eliminations and Other
|
Consolidated
|
||||||||||||
|
Operating Activities
|
|
|
|
|
||||||||||||
|
Net Cash Provided by (Used in) Operating Activities
|
$
|
436
|
|
$
|
2,920
|
|
$
|
(1,317
|
)
|
$
|
2,039
|
|
||||
|
Investing Activities
|
|
|
||||||||||||||
|
Property Additions
|
—
|
|
(1,331
|
)
|
(95
|
)
|
(1,426
|
)
|
||||||||
|
Proceeds from Property Dispositions
|
2
|
|
42
|
|
1
|
|
45
|
|
||||||||
|
Other Investing Activities
|
(89
|
)
|
(402
|
)
|
500
|
|
9
|
|
||||||||
|
Net Cash Provided by (Used in) Investing Activities
|
(87
|
)
|
(1,691
|
)
|
406
|
|
(1,372
|
)
|
||||||||
|
Financing Activities
|
|
|
||||||||||||||
|
Long-term Debt Issued
|
500
|
|
—
|
|
—
|
|
500
|
|
||||||||
|
Long-term Debt Repaid
|
(200
|
)
|
(120
|
)
|
(3
|
)
|
(323
|
)
|
||||||||
|
Dividends Paid
|
(345
|
)
|
(475
|
)
|
475
|
|
(345
|
)
|
||||||||
|
Stock Options Exercised
|
34
|
|
—
|
|
—
|
|
34
|
|
||||||||
|
Other Financing Activities
|
21
|
|
(667
|
)
|
473
|
|
(173
|
)
|
||||||||
|
Net Cash Provided by (Used in) Financing Activities
|
10
|
|
(1,262
|
)
|
945
|
|
(307
|
)
|
||||||||
|
Net Increase (Decrease) in
Cash and Cash Equivalents
|
359
|
|
(33
|
)
|
34
|
|
360
|
|
||||||||
|
Cash and Cash Equivalents at Beginning of Period
|
559
|
|
63
|
|
47
|
|
669
|
|
||||||||
|
Cash and Cash Equivalents at End of Period
|
$
|
918
|
|
$
|
30
|
|
$
|
81
|
|
$
|
1,029
|
|
||||
111
None.
Evaluation of Disclosure Controls and Procedures
As of
December 30, 2011
, under the supervision and with the participation of CSX's Chief Executive Officer (“CEO”) and Chief Financial Officer (“CFO”), management has evaluated the effectiveness of the design and operation of the Company's disclosure controls and procedures. Based on that evaluation, the CEO and CFO concluded that, as of
December 30, 2011
, the Company's disclosure controls and procedures were effective at the reasonable assurance level in timely alerting them to material information required to be included in CSX’s periodic SEC reports. There were no changes in the Company's internal controls over financial reporting during the fourth quarter of
2011
that have materially affected or are reasonably likely to materially affect the Company's internal control over financial reporting.
Management's Report on Internal Control over Financial Reporting
CSX’s management is responsible for establishing and maintaining adequate internal control over financial reporting, as such term is defined in Exchange Act Rules 13a-15(f) and 15d-15(f). Under the supervision and with the participation of the management of CSX, including CSX’s CEO and CFO, CSX conducted an evaluation of the effectiveness of the Company’s internal control over financial reporting as of
December 30, 2011
based on the framework in Internal Control – Integrated Framework issued by the Committee of Sponsoring Organizations of the Treadway Commission which is also referred to as COSO. Based on that evaluation, management of CSX concluded that the Company’s internal control over financial reporting was effective as of
December 30, 2011
. Management's assessment of the effectiveness of internal control over financial reporting is expressed at the level of reasonable assurance because a control system, no matter how well designed and operated, can provide only reasonable, but not absolute, assurance that the control system's objectives will be met.
The Company’s internal control over financial reporting as of
December 30, 2011
has been audited by Ernst & Young LLP, an independent registered public accounting firm, as stated in their report which is included elsewhere herein.
112
Report of Independent Registered Public Accounting Firm
The Board of Directors and Shareholders of CSX Corporation
We have audited CSX Corporation’s internal control over financial reporting as of
December 30, 2011
, based on criteria established in Internal Control—Integrated Framework issued by the Committee of Sponsoring Organizations of the Treadway Commission (the COSO criteria). CSX Corporation’s management is responsible for maintaining effective internal control over financial reporting, and for its assessment of the effectiveness of internal control over financial reporting included in the accompanying Management’s Report on Internal Control over Financial Reporting. Our responsibility is to express an opinion on the company’s internal control over financial reporting based on our audit.
We conducted our audit in accordance with the standards of the Public Company Accounting Oversight Board (United States). Those standards require that we plan and perform the audit to obtain reasonable assurance about whether effective internal control over financial reporting was maintained in all material respects. Our audit included obtaining an understanding of internal control over financial reporting, assessing the risk that a material weakness exists, testing and evaluating the design and operating effectiveness of internal control based on the assessed risk, and performing such other procedures as we considered necessary in the circumstances. We believe that our audit provides a reasonable basis for our opinion.
A company’s internal control over financial reporting is a process designed to provide reasonable assurance regarding the reliability of financial reporting and the preparation of financial statements for external purposes in accordance with generally accepted accounting principles. A company’s internal control over financial reporting includes those policies and procedures that (1) pertain to the maintenance of records that, in reasonable detail, accurately and fairly reflect the transactions and dispositions of the assets of the company; (2) provide reasonable assurance that transactions are recorded as necessary to permit preparation of financial statements in accordance with generally accepted accounting principles, and that receipts and expenditures of the company are being made only in accordance with authorizations of management and directors of the company; and (3) provide reasonable assurance regarding prevention or timely detection of unauthorized acquisition, use, or disposition of the company’s assets that could have a material effect on the financial statements.
Because of its inherent limitations, internal control over financial reporting may not prevent or detect misstatements. Also, projections of any evaluation of effectiveness to future periods are subject to the risk that controls may become inadequate because of changes in conditions, or that the degree of compliance with the policies or procedures may deteriorate.
In our opinion, CSX Corporation maintained, in all material respects, effective internal control over financial reporting as of
December 30, 2011
, based on the COSO criteria.
We also have audited, in accordance with the standards of the Public Company Accounting Oversight Board (United States), the
2011
consolidated financial statements of CSX Corporation and our report dated Februar
y 21, 2012 expressed an unqualified opinion thereon.
/s/ Ernst & Young LLP
Certified Public Accountants
Jacksonville, Florida
February 21, 2012
113
Changes in Internal Control over Financial Reporting
There were no material changes in the Company’s internal control over financial reporting.
None
114
In accordance with Instruction G(3) of Form 10-K, the information required by this item is incorporated herein by reference to the Proxy Statement. The Proxy Statement will be filed not later than April 27, 2012 with respect to its
2012
annual meeting of shareholders, except for the information regarding the executive officers of the Company. Information regarding executive officers is included in Part I of this report under the caption "Executive Officers of the Registrant."
In accordance with Instruction G(3) of Form 10-K, the information required by this Item is incorporated herein by reference to the Proxy Statement (see Item 10 above).
In accordance with Instruction G(3) of Form 10-K, the information required by this Item is incorporated herein by reference to the Proxy Statement (see Item 10 above).
In accordance with Instruction G(3) of Form 10-K, the information required by this Item is incorporated herein by reference to the Proxy Statement (see Item 10 above).
In accordance with Instruction G(3) of Form 10-K, the information required by this Item is incorporated herein by reference to the Proxy Statement (see Item 10 above).
115
(a)(1) Financial Statements
See Index to Consolidated Financial Statements on page 55.
(2) Financial Statement Schedules
The information required by Schedule II,
Valuation and Qualifying Accounts
, is included in Note 5 to the Consolidated Financial Statements, Casualty, Environmental and Other Reserves. All other financial statement schedules are not applicable.
(3) Exhibits
116
|
2.1
|
Distribution Agreement, dated as of July 26, 2004, by and among CSX Corporation, CSX Transportation, Inc., CSX Rail Holding Corporation, CSX Northeast Holding Corporation, Norfolk Southern Corporation, Norfolk Southern Railway Company, CRR Holdings LLC, Green Acquisition Corp., Conrail Inc., Consolidated Rail Corporation, New York Central Lines LLC, Pennsylvania Lines LLC, NYC Newco, Inc. and PRR Newco, Inc. (incorporated herein by reference to Exhibit 2.1 to the Registrant’s Current Report on Form 8-K filed with the Commission on September 2, 2004)
|
|
3.1
|
Amended and Restated Articles of Incorporation of the Registrant (incorporated herein by reference to Exhibit 3.1 to the Registrant's Current Report on Form 8-K filed with the Commission on December 14, 2004)
|
|
3.1(a)
|
Articles of Amendment to CSX Corporation’s Amended and Restated Articles of Incorporation of the Registrant (incorporated herein by reference to Exhibit 3.1 to the Registrant's Current Report on Form 8-K filed with the Commission on July 18, 2006)
|
|
3.1(b)
|
Articles of Amendment to CSX Corporation's Amended and Restated Articles of Incorporation of the Registrant (incorporated herein by reference to Exhibit 3.1 to the Registrant's Current Report on Form 8-K filed with the Commission on May 4, 2011)
|
|
3.2
|
Bylaws of the Registrant, amended effective as of September 24, 2008 (incorporated herein by reference to Exhibit 3.2 of the Registrant's Current Report on Form 8-K filed with the Commission on September 25, 2008)
|
|
Instruments Defining the Rights of Security Holders, Including Debentures:
|
|
|
4.1(a)
|
Indenture, dated August 1, 1990, between the Registrant and The Chase Manhattan Bank, as Trustee (incorporated herein by reference to the Registrant's Form SE, dated September 7, 1990, filed with the Commission)
|
|
4.1(b)
|
First Supplemental Indenture, dated as of June 15, 1991, between the Registrant and The Chase Manhattan Bank, as Trustee (incorporated herein by reference to Exhibit 4(c) to the Registrant's Form SE, dated May 28, 1992, filed with the Commission)
|
|
4.1(c)
|
Second Supplemental Indenture, dated as of May 6, 1997, between the Registrant and The Chase Manhattan Bank, as Trustee (incorporated herein by reference to Exhibit 4.3 to the Registrant's Registration Statement on Form S-4 (Registration No. 333-28523) filed with the Commission on June 5, 1997)
|
|
4.1(d)
|
Third Supplemental Indenture, dated as of April 22, 1998, between the Registrant and The Chase Manhattan Bank, as Trustee (incorporated herein by reference to Exhibit 4.2 to the Registrant's Current Report on Form 8-K filed with the Commission on May 12, 1998)
|
|
4.1(e)
|
Fourth Supplemental Indenture, dated as of October 30, 2001, between the Registrant and The Chase Manhattan Bank, as Trustee (incorporated herein by reference to Exhibit 4.1 to the Registrant's Report on Form 10-Q filed with the Commission on November 7, 2001)
|
|
4.1(f)
|
Fifth Supplemental Indenture, dated as of October 27, 2003 between the Registrant and The Chase Manhattan Bank, as Trustee (incorporated herein by reference to Exhibit 4.1 to the Registrant's Report on Form 8-K filed with the Commission on October 27, 2003)
|
|
4.1(g)
|
Sixth Supplemental Indenture, dated as of September 23, 2004 between the Registrant and JP Morgan Chase Bank, formerly The Chase Manhattan Bank, as Trustee (incorporated herein by reference to Exhibit 4.1 to the Registrant’s Report on Form 10-Q filed with the Commission on November 3, 2004)
|
|
4.1(h)
|
Seventh Supplemental Indenture, dated as of April 25, 2007, between the Registrant and The Bank of New York (as successor to JP Morgan Chase Bank), as Trustee (incorporated herein by reference to Exhibit 4.4 to the Registrant's Report on Form 8-K filed with the Commission on April 26, 2007).
|
|
4.1(i)
|
Eighth Supplemental Indenture, dated as of March 24, 2010, between the Registrant and The Bank of New York Mellon(as successor to JP Morgan Chase Bank), as Trustee (incorporated herein by reference to Exhibit 4.1 to the Registrant's Report on Form 10-Q filed with the Commission on April 19, 2010).
|
117
Pursuant to Regulation S-K, Item 601(b)(4)(iii), instruments that define the rights of holders of the Registrant's long-term debt securities, where the long-term debt securities authorized under each such instrument do not exceed 10% of the Registrant's total assets, have been omitted and will be furnished to the Commission upon request.
|
Material Contracts
:
|
|
|
10.2**
|
CSX Directors’ Pre-2005 Deferred Compensation Plan (as amended through January 8, 2008) (incorporated herein by reference to Exhibit 10.2 to the Registrant’s Annual Report on Form 10-K filed with the Commission on February 22, 2008)
|
|
10.3**
|
CSX Directors’ Deferred Compensation Plan effective January 1, 2005 (incorporated herein by reference to Exhibit 10.3 to the Registrant’s Annual Report on Form 10-K filed with the Commission on February 22, 2008)
|
|
10.4**
|
CSX Directors' Charitable Gift Plan, as amended (incorporated herein by reference to Exhibit 10.4 to the Registrant's Annual Report on Form 10-K filed with the Commission on March 4, 1994)
|
|
10.5**
|
CSX Directors' Matching Gift Plan (as amended through February 9, 2011)
|
|
10.6**
|
Railroad Retirement Benefits Agreement with M. J. Ward (incorporated herein by reference to Exhibit 10.13 to the Registrant's Report on Form 10-K filed with the Commission on February 26, 2003)
|
|
10.7**
|
Employment Agreement with O. Munoz (incorporated herein by reference to Exhibit 10.1 to the Registrant's Report on Form 10-Q filed with the Commission on July 30, 2003)
|
|
10.8**
|
Form of Stock Option Agreement (incorporated herein by reference to Exhibit 10.17 of the Registrant's Report on Form 10-K filed with the Commission on March 4, 2002)
|
|
10.9**
|
Deferred Compensation Program for Executives of CSX Corporation and Affiliated Companies (as amended through January 1, 1998) (incorporated herein by reference to Exhibit 10.25 to the Registrant's Annual Report on Form 10-K filed with the Commission on March 10, 2004)
|
|
10.10**
|
2002 Deferred Compensation Plan of CSX Corporation and Affiliated Corporations (as amended through February 7, 2003) (incorporated herein by reference to Exhibit 10.26 to the Registrant's Annual Report on Form 10-K filed with the Commission on March 10, 2004)
|
|
10.11**
|
Supplementary Savings Plan and Incentive Award Deferral Plan for Eligible Executives of CSX Corporation and Affiliated Companies (as Amended through February 7, 2003) (incorporated herein by reference to Exhibit 10.27 to the Registrant's Annual Report on Form 10-K filed with the Commission on March 10, 2004)
|
|
10.12**
|
Special Retirement Plan of CSX Corporation and Affiliated Companies (as amended through February 14, 2001) (incorporated herein by reference to Exhibit 10.23 to the Registrant's Report on Form 10-K filed with the Commission on March 4, 2002)
|
|
10.13**
|
Supplemental Retirement Benefit Plan of CSX Corporation and Affiliated Companies (as amended through February 14, 2001) (incorporated herein by reference to Exhibit 10.24 of the Registrant's Report on Form 10-K filed with the Commission on March 4, 2002)
|
|
10.14**
|
Senior Executive Incentive Compensation Plan (incorporated herein by reference to Appendix B to the Registrant's Definitive Proxy Statement filed with the Commission on March 17, 2000)
|
|
10.15**
|
CSX Omnibus Incentive Plan (as Amended through December 12, 2007)(incorporated herein by reference to Exhibit 10.17 to the Registrant’s Annual Report on Form 10-K filed with the Commission on February 22, 2008)
|
118
|
10.16
|
Transaction Agreement, dated as of June 10, 1997, by and among CSX Corporation, CSX Transportation, Inc., Norfolk Southern Corporation, Norfolk Southern Railway Company, Conrail Inc., Consolidated Rail Corporation and CRR Holdings LLC, with certain schedules thereto (incorporated herein by reference to Exhibit 10 to the Registrant’s Current Report on Form 8-K filed with the Commission on July 8, 1997)
|
|
10.17
|
Amendment No. 1, dated as of August 22, 1998, to the Transaction Agreement, dated as of June 10, 1997, by and among CSX Corporation, CSX Transportation, Inc., Norfolk Southern Corporation, Norfolk Southern Railway Company, Conrail Inc., Consolidated Rail Corporation and CRR Holdings, LLC (incorporated herein by reference to Exhibit 10.1 to the Registrant's Current Report on Form 8-K filed with the Commission on June 11, 1999)
|
|
10.18
|
Amendment No. 2, dated as of June 1, 1999, to the Transaction Agreement, dated as of June 10, 1997, by and among CSX Corporation, CSX Transportation, Inc., Norfolk Southern Corporation, Norfolk Southern Railway Company, Conrail Inc., Consolidated Rail Corporation and CRR Holdings, LLC (incorporated herein by reference to Exhibit 10.2 to the Registrant's Current Report on Form 8-K filed with the Commission on June 11, 1999)
|
|
10.19
|
Amendment No. 3, dated as of August 1, 2000, to the Transaction Agreement by and among CSX Corporation, CSX Transportation, Inc., Norfolk Southern Corporation, Norfolk Southern Railway Company, Conrail Inc., Consolidated Rail Corporation, and CRR Holdings, LLC. (incorporated herein by reference to Exhibit 10.34 to the Registrant’s Annual Report on Form 10-K dated March 1, 2001)
|
|
10.20
|
Amendment No. 4, dated and effective as of June 1, 1999, and executed in April 2004, to the Transaction Agreement, dated as of June 10, 1997, by and among CSX Corporation, CSX Transportation, Inc., Norfolk Southern Corporation, Norfolk Southern Railway Company, Conrail Inc., Consolidated Rail Corporation and CRR Holdings, LLC (incorporated herein by reference to Exhibit 99.1 to the Registrant’s Current Report on Form 8-K filed with the Commission on August 6, 2004)
|
|
10.21
|
Amendment No. 5, dated as of August 27, 2004, to the Transaction Agreement, dated as of June 10, 1997, by and among CSX Corporation, CSX Transportation, Inc., Norfolk Southern Corporation, Norfolk Southern Railway Company, Conrail Inc., Consolidated Rail Corporation and CRR Holdings LLC (incorporated herein by reference to Exhibit 10.1 to the Registrant’s Current Report on Form 8-K filed with the Commission on September 2, 2004)
|
|
10.22
|
Shared Assets Area Operating Agreement for Detroit, dated as of June 1, 1999, by and among Consolidated Rail Corporation, CSX Transportation, Inc. and Norfolk Southern Railway Corporation, with exhibit thereto (incorporated herein by reference to Exhibit 10.6 to the Registrant's Current Report on Form 8-K filed with the Commission on June 11, 1999)
|
|
10.23
|
Shared Assets Area Operating Agreement for North Jersey, dated as of June 1, 1999, by and among Consolidated Rail Corporation, CSX Transportation, Inc. and Norfolk Southern Railway Company, with exhibit thereto (incorporated herein by reference to Exhibit 10.4 to the Registrant's Current Report on Form 8-K filed with the Commission on June 11, 1999)
|
|
10.24
|
Shared Assets Area Operating Agreement for southern Jersey/Philadelphia, dated as of June 1, 1999, by and among Consolidated Rail Corporation, CSX Transportation, Inc. and Norfolk Southern Railway Company, with exhibit thereto (incorporated herein by reference to Exhibit 10.5 to the Registrant's Current Report on Form 8-K filed with the Commission on June 11, 1999)
|
|
10.25
|
Monongahela Usage Agreement, dated as of June 1, 1999, by and among CSX Transportation, Inc., Norfolk Southern Railway Company, Pennsylvania Lines LLC and New York Central Lines LLC, with exhibit thereto (incorporated herein by reference to Exhibit 10.7 to the Registrant's Current Report on Form 8-K filed with the Commission on June 11, 1999)
|
|
10.26
|
Tax Allocation Agreement, dated as of August 27, 2004, by and among CSX Corporation, Norfolk Southern Corporation, Green Acquisition Corp., Conrail Inc., Consolidated Rail Corporation, New York Central Lines LLC and Pennsylvania Lines LLC (incorporated herein by reference to Exhibit 10.2 to the Registrant's Current Report on Form 8-K filed with the Commission on September 2, 2004)
|
119
|
10.27**
|
Restricted Stock Award Agreement with Oscar Munoz (incorporated herein by reference to Exhibit 10.1 to the Registrant's Current Report on Form 8-K filed with the Commission on February 10, 2012)
|
|
10.30**
|
Restricted Stock Award Agreement with Lisa A. Mancini (incorporated herein by reference to Exhibit 10.31 to the Registrant's Annual Report on Form 10-K filed with the Commission on February 19, 2010)
|
|
10.31
|
Revolving Credit Agreement, dated September 30, 2011 (incorporated herein by reference to Exhibit 10.1 to the Registrant's Current Report on Form 8-K filed with the Commission on October 4, 2011)
|
|
10.32**
|
Long-term Incentive Plan, dated May 5, 2009 (incorporated herein by reference to Exhibit 10.1 to the Registrant's Current Report on Form 8-K filed with the Commission on May 11, 2009)
|
|
10.33**
|
Long-term Incentive Plan effective May 5, 2010 (incorporated herein by reference to Exhibit 10.1 to the Registrant’s Current Report on Form 8-K filed with the Commission on May 7, 2010)
|
|
10.34**
|
Long-term Incentive Plan, dated May 3, 2011 (incorporated herein by reference to Exhibit 10.1 to the Registrant's Current Report on Form 8-K filed with the Commission on May 5, 2011)
|
|
10.35**
|
CSX Stock and Incentive Award Plan (incorporated herein by reference to Exhibit 10.1 to the Registrant’s Current Report on Form 8-K filed with the Commission on May 7, 2010)
|
|
10.36*
|
2010 Form of Change-in-Control Agreement with executive officers
|
|
21*
|
Subsidiaries of the Registrant
|
|
23*
|
Consent of Independent Registered Public Accounting Firm
|
|
24*
|
Powers of Attorney
|
|
31*
|
Rule 13a-14(a) Certifications
|
|
32*
|
Section 1350 Certifications
|
|
99*
|
Annual CEO Certification pursuant to NYSE Rule 303A.12(a)
|
|
101*
|
The following financial information from CSX Corporation’s Annual Report on Form 10-K for the year ended December 30, 2011 filed with the SEC on February 21, 2012, formatted in XBRL includes: (i) Consolidated Income Statements for the fiscal periods ended December 30, 2011, December 31, 2010 and December 25, 2009, (ii) Consolidated Balance Sheets at December 30, 2011 and December 31, 2010, (iii) Consolidated Cash Flow Statements for the fiscal periods ended December 30, 2011, December 31, 2010 and December 25, 2009 and (iv) the Notes to Consolidated Financial Statements.
|
|
|
* Filed herewith
|
|
|
** Management Contract or Compensatory Plan or Arrangement
|
|
|
Note: Items not filed herewith have been submitted in previous SEC filings.
|
120
Pursuant to the requirements of Section 13 or 15(d) of the Securities Exchange Act of 1934, the Registrant has duly caused this report to be signed on its behalf by the undersigned, thereunto duly authorized.
CSX CORPORATION
(Registrant)
By:
/s/ CAROLYN T. SIZEMORE
Carolyn T. Sizemore
Vice President and Controller
(Principal Accounting Officer)
Dated:
February 21, 2012
Pursuant to the requirements of the Securities Exchange Act of 1934, this report has been signed below by the following persons on behalf of the Registrant and in the capacities indicated on
February 21, 2012
.
|
Signature
|
|
Title
|
|
|
|
Chairman of the Board, President, Chief
|
|
/s/ MICHAEL J. WARD
|
|
Executive Officer and Director
|
|
Michael J. Ward
|
|
(Principal Executive Officer)
|
|
|
|
|
|
/s/ FREDRIK J. ELIASSON
|
|
Executive Vice President and Chief Financial
|
|
Fredrik J. Eliasson
|
|
Officer (Principal Financial Officer)
|
|
|
|
|
|
/s/ CAROLYN T. SIZEMORE
|
|
Vice President and Controller
|
|
Carolyn T. Sizemore
|
|
(Principal Accounting Officer)
|
|
|
|
|
|
/s/ ELLEN M. FITZSIMMONS
|
|
Senior Vice President of Law and Public Affairs, General Counsel and Corporate Secretary
|
|
Ellen M. Fitzsimmons
|
|
*Attorney-in-Fact
|
121
|
Signature
|
|
Title
|
|
|
|
|
|
*
|
|
Director
|
|
Donna M. Alvarado
|
|
|
|
|
|
|
|
*
|
|
Director
|
|
John B. Breaux
|
|
|
|
|
|
|
|
*
|
|
Director
|
|
Pamela L. Carter
|
|
|
|
|
|
|
|
*
|
|
Director
|
|
Steven T. Halverson
|
|
|
|
|
|
|
|
*
|
|
Director
|
|
Edward J. Kelly, III
|
|
|
|
|
|
|
|
*
|
|
Director
|
|
Gilbert H. Lamphere
|
|
|
|
|
|
|
|
*
|
|
Director
|
|
John D. McPherson
|
|
|
|
|
|
|
|
*
|
|
Director
|
|
Timothy T. O'Toole
|
|
|
|
|
|
|
|
*
|
|
Director
|
|
David M. Ratcliffe
|
|
|
|
|
|
|
|
*
|
|
Director
|
|
Donald J. Shepard
|
|
|
|
|
|
|
|
*
|
|
Director
|
|
J.C. Watts, Jr.
|
||
|
*
|
Director
|
|
|
J. Steven Whisler
|
||
122
TABLE OF CONTENTS
Part IPart IIItem 5. Market For Registrant S Common Equity, Related Stockholder Matters and Issuer Purchases Of Equity SecuritiesItem 6. Selected Financial DataItem 7. Management's Discussion and Analysis Of Financial Condition and Results Of OperationsItem 7A. Quantitative and Qualitative Disclosures About Market RiskItem 8. Financial Statements and Supplementary DataNote 1. Nature Of Operations and Significant Accounting PoliciesNote 1. Nature Of Operations and Significant Accounting Policies, ContinuedNote 1. Nature Of Operations and Significant Accounting Policies,Note 2. Earnings Per ShareNote 2. Earnings Per Share, ContinuedNote 2. Earnings Per Share,Note 3. Shareholders EquityNote 4. Stock Plans and Share-based CompensationNote 4. Stock Plans and Share-based Compensation, ContinuedNote 4. Stock Plans and Share-based Compensation,Note 5. Casualty, Environmental and Other ReservesNote 5. Casualty, Environmental and Other Reserves, ContinuedNote 5. Casualty, Environmental and Other Reserves,Note 6. PropertiesNote 6. Properties, ContinuedNote 6. Properties,Note 7. Commitments and ContingenciesNote 7. Commitments and Contingencies, ContinuedNote 7. Commitments and Contingencies,Note 8. Employee Benefit PlansNote 8. Employee Benefit Plans, ContinuedNote 9. Debt and Credit AgreementsNote 9. Debt and Credit Agreements, ContinuedNote 9. Debt and Credit Agreements,Note 10. Other Income - NetNote 11. Other Long-term Assets and Other Long-term LiabilitiesNote 12. Income TaxesNote 12. Income Taxes, ContinuedNote 12. Income Taxes,Note 13. Related Party TransactionsNote 14. Discontinued OperationsNote 15. Fair Value MeasurementsNote 15. Fair Value Measurements, ContinuedNote 15. Fair Value Measurements,Note 16. Quarterly Financial Data (unaudited)Note 17. Summarized Consolidating Financial DataNote 17. Summarized Consolidating Financial Data, ContinuedNote 17. Summarized Consolidating Financial Data,Item 9. Changes in and Disagreements with Accountants on Accounting and Financial DisclosureItem 9A. Controls and ProceduresItem 9B. Other InformationPart IIIItem 10. Directors, Executive Officers Of The Registrant and Corporate GovernanceItem 11. Executive CompensationItem 12. Security Ownership Of Certain Beneficial Owners and Management and Related Stockholder MattersItem 13. Certain Relationships and Related Transactions, and Director IndependenceItem 14. Principal Accounting Fees and ServicesPart IVItem 15. Exhibits, Financial Statement Schedules