CINTAS CORP
10-Ks and 10-Qs
|
|
|
|
|
|
|
|
|
|
|
|
|
|
|
|
|
|
|
|
|
|
|
|
|
|
|
|
|
|
|
|
|
|
|
|
|
|
|
|
|
|
|
|
|
|
|
|
|
|
|
|
|
|
|
|
|
|
|
UNITED STATES
SECURITIES AND EXCHANGE COMMISSION
WASHINGTON, D.C. 20549
FORM 10-K
|
X
|
ANNUAL REPORT PURSUANT TO SECTION 13 OR 15(d) OF THE SECURITIES EXCHANGE ACT OF 1934
|
|
|
|
|
|
For the Fiscal Year Ended May 31, 2016
|
|
|
TRANSITION REPORT PURSUANT TO SECTION 13 OR 15(d) OF THE SECURITIES EXCHANGE ACT OF 1934
|
|
|
|
|
Commission File No. 0-11399
|
|
CINTAS CORPORATION
(Exact Name of Registrant as Specified in Its Charter)
|
WASHINGTON
|
|
|
|
31-1188630
|
|
(State or Other Jurisdiction of
Incorporation or Organization)
|
|
|
|
(I.R.S. Employer
Identification No.)
|
|
|
|
6800 Cintas Boulevard
P.O. Box 625737
Cincinnati, Ohio 45262-5737
(Address of Principal Executive Offices)
|
||
|
|
|
(513) 459-1200
(Registrant's telephone number, including area code)
|
||
Securities registered pursuant to Section 12(b) of the Act:
|
Title of each class
|
Name of each exchange on which registered
|
|
Common Stock, no par value
|
The NASDAQ Stock Market LLC (NASDAQ Global Select Market)
|
Securities registered pursuant to Section 12(g) of the Act:
None
Indicate by check mark if the Registrant is a well-known seasoned issuer, as defined in Rule 405 of the Securities Act.
|
|
YES
|
ü
|
|
NO
|
|
|
|
Indicate by check mark if the Registrant is not required to file reports pursuant to Section 13 or Section 15(d) of the Act.
|
|
YES
|
|
|
NO
|
|
ü
|
|
Indicate by check mark whether the Registrant (1) has filed all reports required to be filed by Section 13 or 15(d) of the Securities Exchange Act of 1934 during the preceding 12 months (or for such shorter period that the Registrant was required to file such reports) and (2) has been subject to such filing requirements for the past 90 days.
|
|
YES
|
ü
|
|
NO
|
|
|
|
Indicate by a check mark whether the Registrant has submitted electronically and posted on its corporate website, if any, every Interactive Data File required to be submitted and posted pursuant to Rule 405 of Regulation S-T (§232.405 of this chapter) during the preceding 12 months (or for such shorter period that the Registrant was required to submit and post such files).
|
|
YES
|
ü
|
|
NO
|
|
|
|
Indicate by check mark if disclosure of delinquent filers pursuant to Item 405 of Regulation S-K (§229.405) is not contained herein, and will not be contained, to the best of the Registrant's knowledge, in definitive proxy or information statements incorporated by reference in Part III of this Form 10-K or any amendment to the Form 10-K.
Indicate by check mark whether the Registrant is a large accelerated filer, an accelerated filer, a non-accelerated filer, or a smaller reporting company. See the definitions of "large accelerated filer," "accelerated filer," and "smaller reporting company" in Rule 12b-2 of the Exchange Act. (Check one):
|
Large Accelerated Filer
|
ü
|
Accelerated Filer
|
Smaller Reporting Company
|
Non-Accelerated Filer
|
(Do not check if a smaller reporting company.)
|
|||
Indicate by check mark whether the Registrant is a shell company (as defined in Rule 12b-2 of the Exchange Act).
|
|
YES
|
|
|
NO
|
|
ü
|
|
The aggregate market value of the Registrant's Common Stock held by non-affiliates as of November 30, 2015, was $9,901,161,464 based on a closing sale price of $91.59 per share. As of June 30, 2016, 179,592,528 shares of the Registrant's Common Stock were issued and 104,207,491 shares were outstanding.
Documents Incorporated by Reference
Portions of the Registrant's Proxy Statement to be filed with the Commission for its
2016
Annual Meeting of Shareholders are incorporated by reference in Part III of this Form 10-K.
1
Cintas Corporation
Index to Annual Report on Form 10-K
|
|
|
Page
|
|
|
|
|
|
|
||
|
|
||
|
|
||
2
Cintas Corporation (Cintas, Company, we, us or our), a Washington corporation, helps more than 900,000 businesses of all types and sizes, primarily in North America, as well as Latin America, Europe and Asia, get
Ready™
to open their doors with confidence every day by providing a wide range of products and services that enhance our customers’ image and help keep their facilities and employees clean, safe and looking their best. With products and services including uniforms, floor care, restroom supplies, first aid and safety products, fire extinguishers and testing, and safety and compliance training, Cintas helps customers get
Ready for the Workday™.
Cintas was founded in 1968 by Richard T. Farmer, currently the Chairman Emeritus of the Board of Directors, when he left his family's industrial laundry business in order to develop uniform programs using an exclusive new fabric. In the early 1970's, Cintas acquired the family industrial laundry business. Over the years, Cintas developed additional products and services that complemented its core uniform business and broadened the scope of products and services available to its customers.
U.S. Generally Accepted Accounting Principles (GAAP) requires companies to evaluate their reportable operating segments periodically and when certain events occur. As a result of a recent evaluation, effective June 1, 2015, Cintas realigned its organizational structure and updated its reportable operating segments in light of certain changes in its business including the acquisition of ZEE Medical Inc. (ZEE) in the first quarter of fiscal 2016. Cintas’ updated reportable operating segments are Uniform Rental and Facility Services and First Aid and Safety Services. The Uniform Rental and Facility Services reportable operating segment consists of the rental and servicing of uniforms and other garments including flame resistant clothing, mats, mops and shop towels and other ancillary items. In addition to these rental items, restroom cleaning services and supplies, carpet and tile cleaning services and the sale of items from our catalogs to our customers on route are included within this reportable operating segment. The First Aid and Safety Services reportable operating segment consists of first aid and safety products and services. The remainder of Cintas’ business, which consists primarily of Fire Protection Services and its Direct Sale business, is included in All Other.
Prior to June 1, 2015, Cintas classified its business into the following three reportable operating segments: the Rental Uniforms and Ancillary Products operating segment consisted of the rental and servicing of uniforms and other garments including flame resistant clothing, mats, mops and shop towels and other ancillary items. In addition to these rental items, restroom cleaning services and supplies and carpet and tile cleaning services were also provided within this operating segment. The Uniform Direct Sales operating segment consisted of the direct sale of uniforms and related items. The First Aid and Safety and Fire Protection Services operating segment consisted of first aid and safety products and services, and fire protection products and services.
In fiscal 2014, Cintas completed its partnership transaction with the shareholders of Shred-it International Inc. to combine Cintas' shredding business (Shredding) with the shredding business of Shred-it International Inc. (the Shredding Transaction). Pursuant to the Shredding Transaction, the newly formed partnership (the Shred-it Partnership) was owned
42%
by Cintas and
58%
by the shareholders of Shred-it International Inc. Cintas' investment in the Shred-it Partnership (Shred-it) and the results of Shredding are classified as discontinued operations for all periods presented as a result of selling the investment during fiscal 2016. During fiscal 2015, Cintas sold the storage business (Storage) and, as a result, its operations are also classified as discontinued operations for all periods presented. Shredding and Storage were previously included in the former Document Management Services reportable operating segment. In accordance with the applicable accounting guidance for the disposal of long-lived assets and discontinued operations, the results of Shredding and Storage have been excluded from both continuing operations and operating segment results for all periods presented. Please see Note 16 entitled Discontinued Operations of "Notes to Consolidated Financial Statements" for additional information.
We provide our products and services to over 900,000 businesses of all types — from small service and manufacturing companies to major corporations that employ thousands of people. This diversity in customer base results in no individual customer accounting for greater than one percent of Cintas' total revenue. As a result, the loss of one account would not have a significant financial impact on Cintas.
3
The following table sets forth Cintas' total revenue and the revenue derived from each reportable operating segment and All Other:
|
Fiscal Year Ended May 31, (in thousands)
|
2016
|
2015
(1)(2)
|
2014
(1)(2)
|
||||||||
|
Uniform Rental and Facility Services
|
$
|
3,777,801
|
|
$
|
3,539,843
|
|
$
|
3,304,635
|
|
||
|
First Aid and Safety Services
|
461,783
|
|
326,593
|
|
294,966
|
|
|||||
|
All Other
|
665,874
|
|
610,450
|
|
594,243
|
|
|||||
|
Total Revenue
|
$
|
4,905,458
|
|
$
|
4,476,886
|
|
$
|
4,193,844
|
|
||
|
(1)
|
The figures for fiscal 2015 and 2014 presented reflect the change in classification of Shredding and Storage to discontinued operations within the Consolidated Statements of Income. See Note 16 entitled Discontinued Operations of "Notes to Consolidated Financial Statements."
|
|
(2)
|
Cintas' reportable operating segments changed effective June 1, 2015. All prior fiscal periods have been recast to reflect that change.
|
Additional information regarding each reportable operating segment and All Other is also included in Note 14 entitled Operating Segment Information of "Notes to Consolidated Financial Statements."
The primary markets served by all Cintas businesses are local in nature and highly fragmented. Cintas competes with national, regional and local providers, and the level of competition varies at each of Cintas' local operations. Product, design, price, quality, service and convenience to the customer are the competitive elements in each of our businesses.
Within the Uniform Rental and Facility Services reportable operating segment, Cintas provides its products and services to customers via local delivery routes originating from rental processing plants and branches. Within the First Aid and Safety Services reportable operating segment and All Other, Cintas provides its products and services via its distribution network and local delivery routes or local representatives. In total, Cintas has approximately 9,000 local delivery routes, 377 operational facilities and
eight
distribution centers. At
May 31, 2016
, Cintas employed approximately 35,000 employees, of which approximately 200 were represented by labor unions.
Cintas sources finished products from many outside suppliers. In addition, Cintas operates
five
manufacturing facilities that provide for standard uniform needs. Cintas purchases fabric, used in its manufacturing process, from several suppliers. Cintas is not aware of any circumstances that would hinder its ability to continue obtaining these materials.
Cintas is subject to various environmental laws and regulations, as are other companies in the uniform rental industry. While environmental compliance is not a material component of its costs, Cintas must incur capital expenditures and associated operating costs, primarily for water treatment and waste removal, on a regular basis. Environmental spending related to water treatment and waste removal was approximately $13 million in fiscal
2016
and approximately $12 million in fiscal
2015
. Capital expenditures to limit or monitor hazardous substances totaled approximately $3 million in fiscal
2016
and approximately $4 million in fiscal
2015
. Cintas does not expect a material change in the cost of environmental compliance and is not aware of any material non-compliance with environmental laws.
Cintas uses its corporate website, www.cintas.com, as a channel for routine distribution of important information, including news releases, analyst presentations and financial information. Cintas files with or furnishes to the SEC Annual Reports on Form 10-K, Quarterly Reports on Form 10-Q, Current Reports on Form 8-K and any amendments to those reports, as well as proxy statements and annual reports to shareholders, and, from time to time, other documents. The reports and other documents filed with or furnished to the SEC are available to investors on or through our corporate website free of charge as soon as reasonably practicable after we electronically file them with or furnish them to the SEC. In addition, the public may read and copy any of the materials we file with the SEC at the SEC's Public Reference Room at 100 F Street, NE, Washington D.C. 20549. The public may obtain information on the operation of the facilities by calling the SEC at 1-800-SEC-0330. The SEC maintains an internet site located at www.sec.gov that contains reports, proxy and information statements and other information regarding issuers, such as Cintas, that file electronically with the SEC. Cintas' SEC filings and its Code of Business Conduct can be found on the Investor Information page of its website at www.cintas-corp.com/company/investor_information/highlights.aspx. These documents are available in print to any shareholder who requests a copy by writing or calling Cintas as set forth on the Investor Information page. The content on any website referred to in this Annual Report on Form 10-K is not incorporated by reference into this Form 10-K unless expressly noted.
4
The statements in this section describe the most significant risks that could materially and adversely affect our business, consolidated financial condition and consolidated results of operation and the trading price of our debt or equity securities.
In addition, this section sets forth statements which constitute our cautionary statements under the Private Securities Litigation Reform Act of 1995.
This Annual Report on Form 10-K contains forward-looking statements. The Private Securities Litigation Reform Act of 1995 provides a safe harbor from civil litigation for forward-looking statements. Forward-looking statements may be identified by words such as "estimates," "anticipates," "predicts," "projects," "plans," "expects," "intends," "target," "forecast," "believes," "seeks," "could," "should," "may" and "will" or the negative versions thereof and similar words, terms and expressions and by the context in which they are used. Such statements are based upon current expectations of Cintas and speak only as of the date made. You should not place undue reliance on any forward-looking statement. We cannot guarantee that any forward-looking statement will be realized. These statements are subject to various risks, uncertainties, potentially inaccurate assumptions and other factors that could cause actual results to differ from those set forth in or implied by this Annual Report. Factors that might cause such a difference include, but are not limited to, our ability to promptly and effectively integrate acquisitions, including ZEE; our ability to realize any synergies from acquisitions, including ZEE; the possibility of greater than anticipated operating costs including energy and fuel costs; lower sales volumes; loss of customers due to outsourcing trends; the performance and costs of integration of acquisitions; fluctuations in costs of materials and labor including increased medical costs costs; costs and possible effects of union organizing activities; failure to comply with government regulations concerning employment discrimination, employee pay and benefits and employee health and safety; the effect on operations of exchange fluctuations, tariffs and other political, economic and regulatory risks; uncertainties regarding any existing or newly-discovered expenses and liabilities related to environmental compliance and remediation; the cost, results and ongoing assessment of internal controls for financial reporting required by the Sarbanes-Oxley Act of 2002; costs of our SAP system implementation; disruptions caused by the inaccessibility of computer systems data, including cybersercurity risks; the initiation or outcome of litigation, investigations or other proceedings; higher assumed sourcing or distribution costs of products, the disruption of operations from catastrophic or extraordinary events; the amount and timing of repurchases of our common stock, if any; changes in federal and state tax and labor laws; the reactions of competitors in terms of price and service. Cintas undertakes no obligation to publicly release any revisions to any forward-looking statements or to otherwise update any forward-looking statements whether as a result of new information or to reflect events, circumstances or any other unanticipated developments arising after the date on which such statements are made, except otherwise as required by law.
The risks and uncertainties described herein are not the only ones we may face. Additional risks and uncertainties presently not known to us or that we currently believe to be immaterial may also harm our business.
Negative global economic factors may adversely affect our financial performance.
Negative economic conditions, in North America and our other markets, may adversely affect our financial performance. Higher levels of unemployment, inflation, tax rates and other changes in tax laws and other economic factors could adversely affect the demand for Cintas’ products and services. Increases in labor costs, including the cost to provide employee-partner related healthcare benefits, minimum wages, labor shortages or shortages of skilled labor, regulations regarding the classification of employees and/or their eligibility for overtime wages, higher material costs for items such as fabrics and textiles, the inability to obtain insurance coverage at cost-effective rates, higher interest rates, inflation, higher tax rates and other changes in tax laws and other economic factors could increase our costs of rental uniforms and facility services, cost of other services and selling and administrative expenses. As a result, these factors could adversely affect our sales and consolidated results of operations.
Increased competition could adversely affect our financial performance.
We operate in highly competitive industries and compete with national, regional and local providers. Product, design, price, quality, service and convenience to the customer are the competitive elements in these industries. If existing or future competitors seek to gain or retain market share by reducing prices, Cintas may be required to lower prices, which would hurt its results of operations. Cintas' competitors also generally compete with Cintas for acquisition candidates, which can increase the price for acquisitions and reduce the number of available acquisition candidates. In addition, our customers and prospects may decide to perform certain services in-house instead of outsourcing these services to us. These competitive pressures could adversely affect our sales and consolidated results of operations.
5
An inability to open new, cost effective operating facilities may adversely affect our expansion efforts.
We plan to expand our presence in existing markets and enter new markets. The opening of new operating facilities is necessary to gain the capacity required for this expansion. Our ability to open new operating facilities depends on our ability to identify attractive locations, negotiate leases or real estate purchase agreements on acceptable terms, identify and obtain adequate utility and water sources and comply with environmental regulations, zoning laws and other similar factors. Any inability to effectively identify and manage these items may adversely affect our expansion efforts, and, consequently, adversely affect our financial performance.
Risks associated with our acquisition practice could adversely affect our results of operations.
Historically, a portion of our growth has come from acquisitions. We continue to evaluate opportunities for acquiring businesses that may supplement our internal growth. However, there can be no assurance that we will be able to locate and purchase suitable acquisitions. In addition, the success of any acquisition depends in part on our ability to integrate the acquired company. The process of integrating acquired businesses may involve unforeseen difficulties and may require a disproportionate amount of our management's attention and our financial and other resources. Although we conduct due diligence investigations prior to each acquisition, there can be no assurance that we will discover or adequately protect against all material liabilities of an acquired business for which we may be responsible as a successor owner or operator. The failure to successfully integrate these acquired businesses or to discover such liabilities could adversely affect our consolidated results of operations.
Changes in the fuel and energy industry could adversely affect our financial condition and results of operations.
The price of fuel and energy needed to run our vehicles and equipment is unpredictable and fluctuates based on events outside our control, including geopolitical developments, supply and demand for fuel and other energy related products, actions by energy producers, war and unrest in oil producing countries, regional production patterns, limits on refining capacities, natural disasters and environmental concerns. Increases in fuel and energy costs could adversely affect our consolidated financial condition and consolidated results of operations.
As a result of falling oil prices, the financial performance of the fuel and energy industry has deteriorated and negatively impacted our business. Further decline and cutbacks within this industry could continue to adversely affect the demand for our products and services.
Unionization campaigns could adversely affect our results of operations.
Cintas has been and could continue to be the target of a unionization campaign by several unions. These unions have attempted to pressure Cintas into surrendering its employees' rights to a government-supervised election by unilaterally accepting union representation. We will continue to vigorously oppose any unionization campaign and defend our employees' rights to a government-supervised election. Unionization campaigns could be materially disruptive to our business and could adversely affect our consolidated results of operations.
Risks associated with the suppliers from whom our products are sourced could adversely affect our results of operations.
The products we sell are sourced from a wide variety of domestic and international suppliers. Global sourcing of many of the products we sell is an important factor in our financial performance. We require all of our suppliers to comply with applicable laws, including labor and environmental laws, and otherwise be certified as meeting our required supplier standards of conduct. Our ability to find qualified suppliers who meet our standards, and to access products in a timely and efficient manner is a significant challenge, especially with respect to suppliers located and goods sourced outside the United States. Political and economic stability in the countries in which foreign suppliers are located, the financial stability of suppliers, suppliers' failure to meet our supplier standards, labor problems experienced by our suppliers, the availability of raw materials to suppliers, currency exchange rates, transport availability and cost, inflation and other factors relating to the suppliers and the countries in which they are located are beyond our control. In addition, U.S. and foreign trade policies, tariffs and other impositions on imported goods, trade sanctions imposed on certain countries, the limitation on the importation of certain types of goods or of goods containing certain materials from other countries and other factors relating to foreign trade are beyond our control. These and other factors affecting our suppliers and our access to products could adversely affect our consolidated results of operations.
Fluctuations in foreign currency exchange could adversely affect our financial condition and results of operations.
We earn revenue, pay expenses, own assets and incur liabilities in countries using currencies other than the U.S. dollar, including the Canadian dollar, British pound, and the euro. In fiscal years
2016
,
2015
and
2014
, revenue denominated in currencies other than the U.S. dollar represented less than 10% of our consolidated revenue. Because our consolidated financial statements are presented in U.S. dollars, we must translate revenue, income and expenses, as well as assets and liabilities, into U.S. dollars at exchange rates in effect during or at the end of each reporting period. Therefore, fluctuations in the value of the U.S. dollar against other major currencies, particularly in the event of significant increases in foreign currency revenue, will impact our revenue and operating income and the value of
6
balance sheet items denominated in foreign currencies. This impact could adversely affect our consolidated financial condition and consolidated results of operations.
Failure to comply with federal and state regulations to which we are subject could result in penalties or costs that could adversely affect our results of operations.
Our business is subject to complex and stringent state and federal regulations, including employment laws and regulations, minimum wage requirements, overtime requirements, working condition requirements, citizenship requirements, transportation and other laws and regulations. In particular, we are subject to the regulations promulgated by the U.S. Department of Transportation, or USDOT, and under the Occupational Safety and Health Act of 1970, as amended, or OSHA. We have incurred, and will continue to incur, capital and operating expenditures and other costs in the ordinary course of our business in complying with the USDOT, OSHA and other laws and regulations to which we are subject. Changes in laws, regulations and the related interpretations may alter the landscape in which we do business and may affect our costs of doing business. The impact of new laws and regulations cannot be predicted. Compliance with new laws and regulations may increase our operating costs or require significant capital expenditures. Any failure to comply with applicable laws or regulations could result in substantial fines by government authorities, payment of damages to private litigants, or possible revocation of our authority to conduct our operations, which could adversely affect our ability to service customers and our consolidated results of operations.
We are subject to legal proceedings that may adversely affect our financial condition and results of operations.
We are subject to various litigation claims and legal proceeding arising from the ordinary course of our business, including personal injury, customer contract, environmental and employment claims. Certain of these lawsuits or potential future lawsuits, if decided adversely to us or settled by us, may result in liability and expense material to our consolidated financial condition and consolidated results of operations.
Compliance with environmental laws and regulations could result in significant costs that adversely affect our results of operations.
Our operating locations are subject to environmental laws and regulations relating to the protection of the environment and health and safety matters, including those governing discharges of pollutants to the air and water, the management and disposal of hazardous substances and wastes and the clean-up of contaminated sites. The operation of our businesses entails risks under environmental laws and regulations. We could incur significant costs, including clean-up costs, fines and sanctions and claims by third parties for property damage and personal injury, as a result of violations of or liabilities under these laws and regulations. We are currently involved in a limited number of remedial investigations and actions at various locations. While based on information currently known to us, we believe that we maintain adequate reserves with respect to these matters, our liability could exceed forecasted amounts, and the imposition of additional clean-up obligations or the discovery of additional contamination at these or other sites could result in significant additional costs which could adversely affect our results of operations. In addition, potentially significant expenditures could be required to comply with environmental laws and regulations, including requirements that may be adopted or imposed in the future.
Under applicable environmental laws, an owner or operator of real estate may be required to pay the costs of removing or remediating hazardous materials located on or emanating from property, whether or not the owner or operator knew of or was responsible for the presence of such hazardous materials. While we regularly engage in environmental due diligence in connection with acquisitions, we can give no assurance that locations that have been acquired or leased have been operated in compliance with environmental laws and regulations during prior periods or that future uses or conditions will not make us liable under these laws or expose us to third-party actions, including tort suits.
We rely extensively on computer systems to process transactions, maintain information and manage our businesses. Disruptions in the availability of computer systems due to implementation of a new system or otherwise, or privacy breaches involving computer systems, could impact our ability to service our customers and adversely affect our sales, results of operations and reputation and expose us to litigation risk.
Our businesses rely on our computer systems to provide customer information, process customer transactions and provide other general information necessary to manage our businesses. We have an active disaster recovery plan in place that is frequently reviewed and tested. However, our computer systems are subject to damage or interruption due to system conversions,such as our current conversion to SAP enterprise system, power outages, computer or telecommunication failures, catastrophic events such as fires, tornadoes and hurricanes and usage errors by our employees. Although we believe that we have adopted appropriate measures to mitigate potential risks to our technology and our operations from these information technology-related and other potential disruptions, given the unpredictability of the timing, nature and scope of such disruptions, we could potentially be subject to production downtimes, operational delays and interruptions in our ability to provide products and services to our customers. Any disruption caused by the unavailability of our computer systems could adversely affect our sales, could require us to
7
make a significant investment to fix or replace them and, therefore, could adversely affect our consolidated results of operations. In addition, cyber-security attacks are evolving and include, but are not limited to, malicious software, attempts to gain unauthorized access to data and other electronic security breaches that could lead to disruptions in systems, unauthorized release of confidential or otherwise protected information and corruption of data. If the network of security controls, policy enforcement mechanisms and monitoring systems to address these threats to our technology fails, the compromising of confidential or otherwise protected Company, customer, or employee information, destruction or corruption of data, security breaches, or other manipulation or improper use of our systems and networks could result in financial losses from remedial actions, loss of business or potential liability and damage to our reputation.
Failure to achieve and maintain effective internal controls could adversely affect our business and stock price.
Effective internal controls are necessary for us to provide reliable financial reports. All internal control systems, no matter how well designed, have inherent limitations. Therefore, even those systems determined to be effective can provide only reasonable assurance with respect to the consolidated financial statement preparation and presentation. While we continue to evaluate our internal controls, we cannot be certain that these measures will ensure that we implement and maintain adequate controls over our financial processes and reporting in the future. If we fail to maintain the adequacy of our internal controls or if we or our independent registered public accounting firm were to discover material weaknesses in our internal controls, as such standards are modified, supplemented or amended, we may not be able to ensure that we can conclude on an ongoing basis that we have effective internal control over financial reporting in accordance with Section 404 of the Sarbanes-Oxley Act of 2002. Failure to achieve and maintain an effective internal control environment could cause us to be unable to produce reliable financial reports or prevent fraud. This may cause investors to lose confidence in our reported financial information, which could have a material adverse effect on our stock price.
We may experience difficulties in attracting and retaining competent personnel in key positions.
We believe that a key component of our success is our corporate culture, which has been imparted by management throughout our corporate organization. This factor, along with our entire operation, depends on our ability to attract and retain key employees. Competitive pressures within and outside our industry may make it more difficult and expensive for us to attract and retain key employees which could adversely affect our businesses.
Unexpected events could disrupt our operations and adversely affect our results of operations.
Unexpected events, including fires or explosions at facilities, natural disasters such as hurricanes and tornadoes, war or terrorist activities, unplanned outages, supply disruptions, failure of equipment or systems or changes in laws and/or regulations impacting our businesses, could adversely affect our consolidated results of operations. These events could result in customer disruption, physical damage to one or more key operating facilities, the temporary closure of one or more key operating facilities or the temporary disruption of information systems.
We may recognize impairment charges, which could adversely affect our financial condition and results of operations.
We assess our goodwill and other intangible assets and our long-lived assets for impairment when required by U.S. GAAP. These accounting principles require that we record an impairment charge if circumstances indicate that the asset carrying values exceed their estimated fair values. The estimated fair value of these assets is impacted by general economic conditions in the locations in which we operate. Deterioration in these general economic conditions may result in: declining revenue, which can lead to excess capacity and declining operating cash flow; reductions in management's estimates for future revenue and operating cash flow growth; increases in borrowing rates and other deterioration in factors that impact our weighted average cost of capital; and deteriorating real estate values. If our assessment of goodwill, other intangible assets or long-lived assets indicates an impairment of the carrying value for which we recognize an impairment charge, this may adversely affect our consolidated financial condition and consolidated results of operations.
The effects of credit market volatility and changes in our credit ratings could adversely affect our liquidity and results of operations.
Our operating cash flows, combined with access to the credit markets, provide us with significant discretionary funding capacity. However, deterioration in the global credit markets may limit our ability to access credit markets, which could adversely affect our liquidity and/or increase our cost of borrowing. In addition, credit market deterioration and its actual or perceived effects on our results of operations and financial condition, along with deterioration in general economic conditions, may increase the likelihood that the major independent credit agencies will downgrade our credit ratings, which could increase our cost of borrowing. Increases in our cost of borrowing could adversely affect our consolidated results of operations.
8
None.
Cintas occupies
385
facilities located in 288 cities. Cintas leases 199 of these facilities for various terms ranging from monthly to the year 2028. Cintas expects that it will be able to renew or replace its leases on satisfactory terms. Of the five manufacturing facilities noted below, Cintas controls the operations of one manufacturing facility, but does not own or lease the real estate related to the operation. All other facilities are owned. The principal executive office in Cincinnati, Ohio, provides centrally located administrative functions including accounting, finance, marketing and computer system development and support. Cintas operates rental processing plants that house administrative, sales and service personnel and the necessary equipment involved in the cleaning of uniforms and bulk items, such as entrance mats and shop towels. Branch operations provide administrative, sales and service functions. Cintas operates
eight
distribution centers and
five
manufacturing facilities. Cintas also operates first aid and safety and fire protection facilities and direct sales offices. Cintas considers the facilities it operates to be adequate for their intended use. Cintas owns or leases approximately 13,800 vehicles which are used for the route-based services and by the sales and management employee-partners.
The following chart provides additional information concerning Cintas' facilities:
|
Type of Facility
|
# of Facilities
|
||
|
Rental Processing Plants
|
165
|
|
|
|
Rental Branches
|
117
|
|
|
|
First Aid and Safety Facilities
|
41
|
|
|
|
All Other Facilities
|
49
|
|
|
|
Distribution Centers
|
8
|
|
*
|
|
Manufacturing Facilities
|
5
|
|
|
|
Total
|
385
|
|
|
Rental processing plants, rental branches, distribution centers and manufacturing facilities are used in Cintas' Uniform Rental and Facility Services reportable operating segment. First aid and safety facilities, rental processing plants and distribution centers are used in the First Aid and Safety Services reportable operating segment. Rental processing plants, rental branches, first aid and safety facilities, fire protection facilities, direct sales offices, distribution centers and manufacturing facilities are all utilized by the businesses included in All Other.
* Includes the principal executive office, which is attached to the distribution center in Cincinnati, Ohio.
Cintas is subject to legal proceedings, insurance receipts, legal settlements and claims arising from the ordinary course of its business, including personal injury, customer contract, environmental and employment claims. In the opinion of management, the aggregate liability, if any, with respect to such ordinary course of business actions will not have a material adverse effect on the consolidated financial position, consolidated results of operations or consolidated cash flows of Cintas.
Not applicable.
9
Related Stockholder Matters and Issuer Purchases of Equity Securities
Market Information
Cintas' common stock is traded on the NASDAQ Global Select Market under the symbol "CTAS." The following table provides the high and low sales prices of shares of Cintas' common stock by quarter during the last two fiscal years:
|
Fiscal 2016
|
|
|
|||||
|
Quarter Ended
|
High
|
Low
|
|||||
|
May 2016
|
$
|
95.49
|
|
$
|
84.32
|
|
|
|
February 2016
|
93.64
|
|
80.00
|
|
|||
|
November 2015
|
94.35
|
|
82.71
|
|
|||
|
August 2015
|
89.74
|
|
78.00
|
|
|||
|
Fiscal 2015
|
|
|
|||||
|
Quarter Ended
|
High
|
Low
|
|||||
|
May 2015
|
$
|
88.23
|
|
$
|
79.51
|
|
|
|
February 2015
|
84.18
|
|
70.61
|
|
|||
|
November 2014
|
73.95
|
|
65.79
|
|
|||
|
August 2014
|
66.50
|
|
61.70
|
|
|||
Holders
At
May 31, 2016
, there were approximately 2,000 shareholders on record of Cintas' common stock. Cintas believes that this represents approximately 50,000 beneficial owners.
Dividends
Dividends on Cintas' outstanding common stock have been paid annually and amounted to $1.05 per share, $1.70 per share and $0.77 per share in fiscal
2016
,
2015
and
2014
, respectively. The fiscal 2015 dividend was comprised of an annual cash dividend of $0.85 per share, and an additional $0.85 per share special dividend related to the cash proceeds received from the Shred-it Transaction.
10
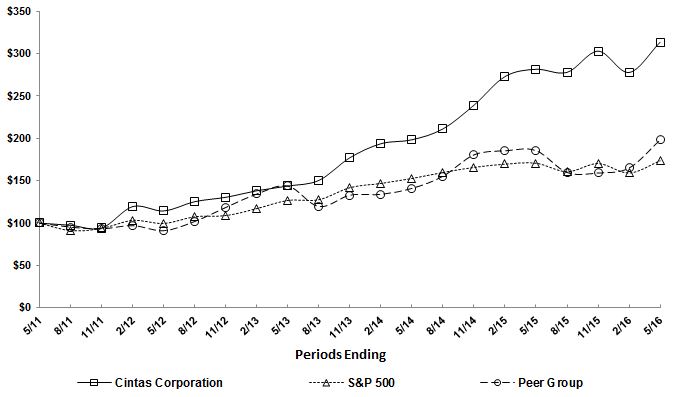
Stock Performance Graph
The following graph summarizes the cumulative return on $100 invested in Cintas' common stock, the S&P 500 Stock Index and the common stocks of a selected peer group of companies. Because our products and services are diverse, Cintas does not believe that any single published industry index is appropriate for comparing shareholder return. Therefore, the peer group used in the performance graph combines four publicly traded companies in the business services industry that have similar characteristics as Cintas, such as route based delivery of products and services. The companies included in the Peer Group are G & K Services, Inc., UniFirst Corporation, ABM Industries, Inc., and Iron Mountain, Inc.
Total shareholder return was based on the increase in the price of the common stock and assumed reinvestment of all dividends. Further, total return was weighted according to market capitalization of each company. The companies in the Peer Group are not the same as those considered by the Compensation Committee of the Board of Directors.
Total Shareholder Returns
Comparison of Five-Year Cumulative Total Return
11
Purchases of Equity Securities by the Issuer and Affiliated Purchases
|
Period
(In millions, except share and per share data)
|
Total number
of shares
purchased
|
Average
price paid
per share
|
Total number of
shares purchased
as part of the
publicly announced
plan
(1)
|
Maximum
approximate dollar
value of shares that
may yet be
purchased under
the plan
(1)
|
|||||||||
|
March 1 - 31, 2016
(2)
|
141,271
|
|
$
|
87.88
|
|
135,000
|
|
$
|
268.2
|
|
|||
|
April 1 - 30, 2016
(3)
|
966,066
|
|
89.13
|
|
965,451
|
|
182.1
|
|
|||||
|
May 1 - 31, 2016
(4)
|
1,973,131
|
|
90.83
|
|
1,964,771
|
|
3.7
|
|
|||||
|
Total
|
3,080,468
|
|
$
|
90.16
|
|
3,065,222
|
|
$
|
3.7
|
|
|||
(1)
On August 4, 2015, Cintas announced that the Board of Directors authorized a new $500.0 million share buyback program, which does not have an expiration date. From the inception of the August 4, 2015 share buyback program through
May 31, 2016
, Cintas has purchased a total of 5.6 million shares of Cintas common stock at an average price of $87.85 per share for a total purchase price of $496.3 million.
(2)
During March 2016, Cintas acquired 6,271 shares of Cintas common stock in satisfaction of employee payroll taxes due on restricted stock awards that vested during the fiscal year. These shares were purchased at an average price of $90.21 per share for a total purchase price of $0.6 million.
(3)
During April 2016, Cintas acquired 615 shares of Cintas common stock in satisfaction of employee payroll taxes due on restricted stock awards that vested during the fiscal year. These shares were purchased at an average price of $89.83 per share for a total purchase price of less than $0.1 million.
(4)
During May 2016, Cintas acquired 8,360 shares of Cintas common stock in satisfaction of employee payroll taxes due on restricted stock awards that vested during the fiscal year. These shares were purchased at an average price of $94.80 per share for a total purchase price of $0.8 million.
12
Five-Year Financial Summary
|
(In thousands except per share and percentage data)
|
|||||||||||||||||
|
Fiscal Years Ended May 31,
|
2012
(1)
|
2013
(1)
|
2014
(1)
|
2015
(1)
|
2016
(1)
|
Compound
Annual
Growth
(2012-2016)
|
|||||||||||
|
Revenue
|
3,761,958
|
|
3,966,507
|
|
4,193,844
|
|
4,476,886
|
|
4,905,458
|
|
6.9
|
%
|
|||||
|
Net Income, Continuing Operations
|
281,230
|
|
306,336
|
|
337,772
|
|
410,521
|
|
456,941
|
|
12.9
|
%
|
|||||
|
Net Income, Discontinued Operations
|
16,407
|
|
9,106
|
|
36,670
|
|
20,097
|
|
236,579
|
|
92.8
|
%
|
|||||
|
Net Income
|
297,637
|
|
|
315,442
|
|
|
374,442
|
|
430,618
|
|
693,520
|
|
23.1
|
%
|
|||
|
Basic Earnings Per Share:
|
|||||||||||||||||
|
Continuing Operations
|
2.15
|
|
2.46
|
|
2.78
|
|
3.51
|
|
4.15
|
|
18.0
|
%
|
|||||
|
Discontinued Operations
|
0.12
|
|
0.07
|
|
0.30
|
|
0.17
|
|
2.15
|
|
99.5
|
%
|
|||||
|
Basic Earnings per Share
|
2.27
|
|
2.53
|
|
3.08
|
|
3.68
|
|
6.30
|
|
28.6
|
%
|
|||||
|
Diluted Earnings Per Share:
|
|||||||||||||||||
|
Continuing Operations
|
2.15
|
|
2.45
|
|
2.75
|
|
3.46
|
|
4.09
|
|
17.6
|
%
|
|||||
|
Discontinued Operations
|
0.12
|
|
0.07
|
|
0.30
|
|
0.17
|
|
2.12
|
|
98.8
|
%
|
|||||
|
Diluted Earnings Per Share
|
2.27
|
|
2.52
|
|
3.05
|
|
3.63
|
|
6.21
|
|
28.1
|
%
|
|||||
|
Dividends Per Share
|
0.54
|
|
0.64
|
|
0.77
|
|
1.70
|
|
1.05
|
|
18.1
|
%
|
|||||
|
Total Assets
|
4,165,706
|
|
4,345,632
|
|
4,462,452
|
|
4,192,460
|
|
4,104,393
|
|
(0.4
|
)%
|
|||||
|
Shareholders' Equity
|
2,139,135
|
|
2,201,492
|
|
2,192,858
|
|
1,932,455
|
|
1,842,659
|
|
(3.8
|
)%
|
|||||
|
Return on Average Equity
(2)
|
12.7
|
%
|
14.1
|
%
|
15.4
|
%
|
19.9
|
%
|
24.3
|
%
|
|
|
|||||
|
Long-Term Debt
|
1,059,166
|
|
1,300,979
|
|
1,300,477
|
|
1,300,000
|
|
1,300,000
|
|
|
|
|||||
|
(1)
|
In accordance with the applicable accounting guidance for the disposal of long-lived assets and discontinued operations, the results of Shred-it, Shredding and Storage have been excluded from continuing operations for all periods presented. Please see Note 16 entitled Discontinued Operations of "Notes to Consolidated Financial Statements" for additional information.
|
|
(2)
|
Return on average equity is computed as net income from continuing operations divided by the average of shareholders' equity. We believe that disclosure of this non-GAAP financial measure gives management and shareholders a good indication of Cintas' historical performance.
|
13
of Financial Condition and Results of Operations
Business Strategy
Cintas helps more than 900,000 businesses of all types and sizes, primarily in North America, as well as Latin America, Europe and Asia, get
Ready™
to open their doors with confidence every day by providing a wide range of products and services that enhance our customers’ image and help keep their facilities and employees clean, safe and looking their best. With products and services including uniforms, floor care, restroom supplies, first aid and safety products, fire extinguishers and testing, and safety and compliance training, Cintas helps customers get
Ready for the Workday™.
We are North America's leading provider of corporate identity uniforms through rental and sales programs, as well as a significant provider of related business services, including entrance mats, restroom cleaning services and supplies, carpet and tile cleaning services, first aid and safety services and fire protection products and services.
Cintas' principal objective is "to exceed customers' expectations in order to maximize the long-term value of Cintas for shareholders and working partners," and it provides the framework and focus for Cintas' business strategy. This strategy is to achieve revenue growth for all of our products and services by increasing our penetration at existing customers and by broadening our customer base to include business segments to which we have not historically served. We will also continue to identify additional product and service opportunities for our current and future customers.
To pursue the strategy of increasing penetration, we have a highly talented and diverse team of service professionals visiting our customers on a regular basis. This frequent contact with our customers enables us to develop close personal relationships. The combination of our distribution system and these strong customer relationships provides a platform from which we launch additional products and services.
We pursue the strategy of broadening our customer base in several ways. Cintas has a national sales organization introducing all of our products and services to prospects in all business segments. Our broad range of products and services allows our sales organization to consider any type of business a prospect. We also broaden our customer base through geographic expansion, especially in our first aid and safety and fire protection businesses. Finally, we evaluate strategic acquisitions as opportunities arise.
Results of Operations
GAAP requires companies to evaluate their reportable operating segments periodically and when certain events occur. As a result of a recent evaluation, effective June 1, 2015, Cintas realigned its organizational structure and updated its reportable operating segments in light of certain changes in its business including the acquisition of ZEE in the first quarter of fiscal 2016. Cintas’ updated reportable operating segments are Uniform Rental and Facility Services and First Aid and Safety Services. The Uniform Rental and Facility Services reportable operating segment consists of the rental and servicing of uniforms and other garments including flame resistant clothing, mats, mops and shop towels and other ancillary items. In addition to these rental items, restroom cleaning services and supplies, carpet and tile cleaning services and the sale of items from our catalogs to our customers on route are included within this reportable operating segment. The First Aid and Safety Services reportable operating segment consists of first aid and safety products and services. The remainder of Cintas’ business, which consists primarily of Fire Protection Services and its Direct Sale business, is included in All Other. All prior fiscal year results presented in the table on page 15 have been recast to reflect these new reportable operating segments. Cintas evaluates operating segment performance based on revenue and income before income taxes. Revenue and income before income taxes for each of these reportable operating segments for the years ended May 31, 2016, 2015, and 2014 are presented in Note 14 entitled Operating Segment Information of "Notes to Consolidated Financial Statements." The Company regularly reviews its operating segments for reporting purposes based on the information its chief operating decision maker regularly reviews for purposes of allocating resources and assessing performance and makes changes when appropriate.
Prior to June 1, 2015, Cintas classified its business into the following three reportable operating segments: the Rental Uniforms and Ancillary Products operating segment consisted of the rental and servicing of uniforms and other garments including flame resistant clothing, mats, mops and shop towels and other ancillary items. In addition to these rental items, restroom cleaning services and supplies and carpet and tile cleaning services were also provided within this operating segment. The Uniform Direct Sales operating segment consisted of the direct sale of uniforms and related items. The First Aid and Safety and Fire Protection Services operating segment consisted of first aid and safety products and services, and fire protection products and services.
14
Shred-it and the results of Shredding are classified as discontinued operations for all periods presented as a result of selling the investment during fiscal 2016. During fiscal 2015, Cintas sold Storage and, as a result, its operations are also classified as discontinued operations for all periods presented. Shredding and Storage were previously included in the former Document Management Services reportable operating segment. In accordance with the applicable accounting guidance for the disposal of long-lived assets and discontinued operations, the results of Shredding and Storage have been excluded from both continuing operations and operating segment results for all periods presented. Please see Note 16 entitled Discontinued Operations of "Notes to Consolidated Financial Statements" for additional information.
The following table sets forth certain consolidated statements of income data as a percent of revenue by reportable operating segment, All Other and in total for the fiscal years ended May 31:
|
2016
(1)
|
2015
(1)(2)
|
2014
(1)(2)
|
||||||
|
Revenue:
|
|
|
|
|||||
|
Uniform Rental and Facility Services
|
77.0
|
%
|
79.1
|
%
|
78.8
|
%
|
||
|
First Aid and Safety Services
|
9.4
|
%
|
7.3
|
%
|
7.0
|
%
|
||
|
All Other
|
13.6
|
%
|
13.6
|
%
|
14.2
|
%
|
||
|
Total revenue
|
100.0
|
%
|
100.0
|
%
|
100.0
|
%
|
||
|
Cost of sales:
|
|
|
|
|||||
|
Uniform Rental and Facility Services
|
55.8
|
%
|
56.7
|
%
|
58.2
|
%
|
||
|
First Aid and Safety Services
|
57.3
|
%
|
53.4
|
%
|
53.8
|
%
|
||
|
All Other
|
60.7
|
%
|
61.2
|
%
|
61.1
|
%
|
||
|
Total cost of sales
|
56.6
|
%
|
57.1
|
%
|
58.3
|
%
|
||
|
Gross margin:
|
|
|
|
|||||
|
Uniform Rental and Facility Services
|
44.2
|
%
|
43.3
|
%
|
41.8
|
%
|
||
|
First Aid and Safety Services
|
42.7
|
%
|
46.6
|
%
|
46.2
|
%
|
||
|
All Other
|
39.3
|
%
|
38.8
|
%
|
38.9
|
%
|
||
|
Total gross margin
|
43.4
|
%
|
42.9
|
%
|
41.7
|
%
|
||
|
Selling and administrative expenses:
|
||||||||
|
Uniform Rental and Facility Services
|
26.4
|
%
|
26.2
|
%
|
26.0
|
%
|
||
|
First Aid and Safety Services
|
31.9
|
%
|
32.8
|
%
|
32.6
|
%
|
||
|
All Other
|
30.4
|
%
|
31.4
|
%
|
32.1
|
%
|
||
|
Total selling and administrative expenses
|
27.5
|
%
|
27.4
|
%
|
27.4
|
%
|
||
|
Gain on sale of stock of an equity method investment
|
—
|
%
|
0.5
|
%
|
—
|
%
|
||
|
Interest expense, net
|
1.3
|
%
|
1.4
|
%
|
1.5
|
%
|
||
|
Income from continuing operations before income taxes
|
14.6
|
%
|
14.6
|
%
|
12.8
|
%
|
||
|
(1)
|
The figures for all years presented reflect the change in classification of Shred-it, Shredding and Storage to discontinued operations within the Consolidated Statements of Income. See Note 16 entitled Discontinued Operations of "Notes to Consolidated Financial Statements."
|
|
(2)
|
Cintas' reportable operating segments changed effective June 1, 2015. All prior fiscal periods have been recast to reflect that change.
|
15
Fiscal
2016
Compared to Fiscal
2015
Fiscal
2016
total revenue was
$4.9 billion
, an increase of
9.6%
over the prior fiscal year. Revenue increased organically by 6.7% as a result of increased sales volume. Organic growth adjusts for the impact of acquisitions, divestitures, workday differences and foreign currency exchange rate fluctuations. Total revenue was positively impacted by 2.7% due to acquisitions and 0.9% due to two more workdays in fiscal
2016
compared to fiscal
2015
. Revenue growth was also negatively impacted by 0.7% due to foreign currency exchange rate fluctuations.
Organic growth by quarter is shown in the table below.
|
Organic Growth
|
|
|
|
|
|
First Quarter Ending August 31, 2015
|
6.8%
|
|
Second Quarter Ending November 30, 2015
|
6.5%
|
|
Third Quarter Ending February 29, 2016
|
6.8%
|
|
Fourth Quarter Ending May 31, 2016
|
6.7%
|
|
For the Fiscal Year Ending May 31, 2016
|
6.7%
|
Uniform Rental and Facility Services reportable operating segment revenue consists predominantly of revenue derived from the rental of corporate identity uniforms and other garments, including flame resistant clothing, and the rental and/or sale of mats, mops, shop towels, restroom supplies and other rental services. Revenue from the Uniform Rental and Facility Services reportable operating segment increased
6.7%
compared to fiscal
2015
. The increase resulted from an organic growth increase in revenue of 6.4%. The amount of new business grew, resulting from an increase in the number and productivity of sales representatives. Generally, sales productivity improvements are the result of increased tenure and improved training, which result in a higher number of products and services sold. Revenue growth was negatively impacted 0.8% due to foreign currency exchange rate fluctuations. Revenue was positively impacted by 0.3% due to acquisitions and 0.8% due to two more workdays in fiscal 2016 compared to the same period in the prior fiscal year.
Other revenue, consisting of revenue from the First Aid and Safety Services reportable operating segment and All Other, increased
20.3%
compared to fiscal
2015
. Revenue increased organically by 8.0% due primarily to improved sales representative productivity. Revenue growth was negatively impacted by 0.4% due to foreign currency exchange rate fluctuations. Acquisitions positively impacted the growth rate by 11.8%, and two more workdays in fiscal 2016 positively impacted growth by 1.0% compared to fiscal 2015.
Cost of uniform rental and facility services increased
4.9%
compared to fiscal
2015
. Cost of uniform rental and facility services consists primarily of production expenses, delivery expenses and the amortization of in service inventory, including uniforms, mats, shop towels and other ancillary items. The cost of uniform rental and facility services increase compared to fiscal
2015
was due to increased Uniform Rental and Facility Services reportable operating segment sales volume.
Cost of other consists primarily of cost of goods sold (predominantly first aid and safety products, uniforms and fire protection products), delivery expenses and distribution expenses in the First Aid and Safety Services reportable operating segment and All Other. Cost of other services increased
22.1%
in fiscal
2016
compared to fiscal
2015
. The increase was primarily related to the increased sales volumes in the First Aid and Safety Services segment and All Other.
Selling and administrative expenses increased
$123.2 million
, or
10.1%
, compared to fiscal
2015
due primarily to increases in labor and other employee-partner related expenses.
During fiscal 2015, Cintas sold stock in an equity method investment. In conjunction with the sale of the equity method investment, the Company received a cash dividend. The sale resulted in the recording of a gain of $21.7 million in fiscal 2015.
Net interest expense (interest expense less interest income) was
$63.6 million
in fiscal
2016
compared to
$64.8 million
in fiscal
2015
. The decrease in net interest expense is primarily due to the capitalization of $1.1 million of interest in fiscal year
2016
versus $0.6 million of interest in fiscal
2015
.
16
Income before income taxes was
$718.1 million
, an increase of
$64.8 million
, or
9.9%
, compared to fiscal
2015
. The increase in income before income taxes was due primarily to revenue growing at a faster rate than expenses.
Cintas' effective tax rate on continuing operations was
36.4%
for fiscal
2016
compared to
37.2%
in fiscal
2015
. The decrease in fiscal 2016 was primarily the result of the benefit derived from the closing of a prior-year Federal tax audit. See Note 8 entitled Income Taxes of "Notes to Consolidated Financial Statements" for more information.
Net income from continuing operations for fiscal
2016
of
$456.9 million
was an
11.3%
increase compared to fiscal
2015
. Diluted earnings per share from continuing operations of
$4.09
was an
18.2%
increase compared to fiscal
2015
. Diluted earnings per share from continuing operations increased due to an increase in earnings from continuing operations combined with a decrease in weighted average common shares outstanding. The decrease in weighted average common shares outstanding resulted from purchasing 8.7 million shares of common stock under the January 13, 2015 and August 4, 2015 share buyback programs since the beginning of the fiscal 2016.
Uniform Rental and Facility Services Reportable Operating Segment
Uniform Rental and Facility Services reportable operating segment revenue increased
$238.0 million
, or
6.7%
, and the cost of uniform rental and facility services increased
$99.2 million
, or
4.9%
. The reportable operating segment's fiscal
2016
gross margin was
44.2%
of revenue compared to
43.3%
in fiscal
2015
. The 90 basis point improvement was driven by many factors, including new business sold by sales representatives, penetration of additional products and services into existing customers, and continuously improving the efficiency of internal processes. In addition, lower energy-related expenses increased gross margin 50 basis points.
Selling and administrative expenses for the Uniform Rental and Facility Services reportable operating segment increased
$71.9 million
in fiscal
2016
compared to fiscal
2015
primarily due to increases in labor and other employee-partner related expenses. Selling and administrative expense as a percent of revenue for fiscal
2016
was
26.4%
compared to
26.2%
in fiscal
2015
.
Income before income taxes increased
$66.9 million
to
$672.9 million
for fiscal
2016
compared to fiscal
2015
. Income before income taxes as a percent of revenue, at
17.8%
, increased 70 basis points from
17.1%
in fiscal
2015
. This increase is primarily due to the increase in gross margin discussed above.
First Aid and Safety Services Reportable Operating Segment
First Aid and Safety Services reportable operating segment revenue increased $
135.2 million
in fiscal
2016
, a
41.4%
increase compared to fiscal
2015
. Revenue increased organically by 9.7% as a result of increased sales volume. Revenue growth was positively impacted by 1.1% due to two more workdays in fiscal 2016 compared to fiscal 2015. The remaining 30.6% increase in growth represents growth derived through acquisitions, primarily the ZEE acquisition.
Cost of first aid and safety services increased $90.5 million, or 51.9%, in fiscal
2016
, due primarily to increased First Aid and Safety Services reportable operating segment volume. Gross margin for the First Aid and Safety Services reportable operating segment is defined as revenue less cost of goods, warehouse expenses, service expenses and training expenses. The gross margin as a percent of revenue was
42.7%
for fiscal
2016
compared to
46.6%
in fiscal
2015
. ZEE integration costs and the lower efficiency of the acquired ZEE routes were primarily responsible for the decrease in gross margin.
Selling and administrative expenses increased by
$40.3 million
, or
37.6%
, in fiscal
2016
compared to fiscal
2015
primarily due to an increase in labor, other employee-partner related expenses and costs associated with the integration of ZEE. Selling and administrative expenses as a percent of revenue, at
31.9%
, decreased from
32.8%
in fiscal
2015
, as revenue growth outpaced the increase in expenses.
Income before income taxes was
$49.5 million
in fiscal
2016
, an increase of
$4.4 million
, or
9.7%
, compared to fiscal
2015
. Income before income taxes as a percent of revenue, at
10.7%
, decreased from
13.8%
in fiscal
2015
, due to the decrease in gross margin discussed above.
17
Fiscal 2015 Compared to Fiscal 2014
Fiscal 2015 total revenue was
$4.5 billion
, an increase of
6.7%
over the prior fiscal year. Revenue increased organically by 7.1% as a result of increased sales volume. Organic growth excludes the impact of acquisitions, divestitures and foreign currency exchange rate fluctuations. Revenue growth was negatively impacted by 0.5% due to foreign currency exchange rate fluctuations. Acquisitions positively impacted the growth rate by 0.1%.
Organic growth by quarter is shown in the table below.
|
Organic Growth
|
|
|
|
|
|
First Quarter Ending August 31, 2014
|
7.3%
|
|
Second Quarter Ending November 30, 2014
|
7.2%
|
|
Third Quarter Ending February 28, 2015
|
7.5%
|
|
Fourth Quarter Ending May 31, 2015
|
6.0%
|
|
For the Fiscal Year Ending May 31, 2015
|
7.1%
|
Uniform Rental and Facility Services reportable operating segment revenue consists predominantly of revenue derived from the rental of corporate identity uniforms and other garments, including flame resistant clothing, and the rental and/or sale of mats, mops, shop towels, restroom supplies and other rental services. Revenue from the Uniform Rental and Facility Services reportable operating segment increased
7.1%
compared to fiscal 2014. The increase resulted from an organic growth increase in revenue of 7.6%. The amount of new business grew, resulting from an increase in the number and productivity of sales representatives. Generally, sales productivity improvements are the result of increased tenure and improved training, which result in a higher number of products and services sold. Revenue in fiscal 2015 was positively impacted by 1.0% due to acquisitions and negatively impacted by 0.5% due to foreign currency exchange rate fluctuations.
Other revenue, consisting of revenue from the First Aid and Safety Services reportable operating segment and All Other, increased
5.4%
compared to fiscal 2014. The increase primarily resulted from an organic growth increase of 4.9%, which was due largely to improved sales representative productivity. Revenue in fiscal 2015 was negatively impacted by 0.3% due to foreign currency exchange rate fluctuations. Acquisitions positively impacted the growth rate by 0.8%
Cost of uniform rental and facility services increased
4.4%
compared to fiscal 2014. Cost of uniform rental and facility services consists primarily of production expenses, delivery expenses and the amortization of in service inventory, including uniforms, mats, shop towels and other ancillary items. The increase in the cost of uniform rental and facility services compared to fiscal 2014 was due to increased Uniform Rental and Facility Services reportable operating segment sales volume.
Cost of other services increased
5.0%
compared to fiscal 2014. Cost of other consists primarily of cost of goods sold (predominantly first aid and safety products, uniforms and fire protection products), delivery expenses and distribution expenses in the First Aid and Safety Services reportable operating segment and All Other. The increase from fiscal 2014 was primarily due to increased First Aid and Safety Services reportable operating segment sales volume.
Selling and administrative expenses increased
$77.9 million
, or
6.8%
, compared to fiscal 2014 due primarily to increases in labor and other employee-partner related expenses.
Operating income of
$696.4 million
in fiscal 2015 increased
$93.7 million
, or
15.5%
, compared to fiscal 2014.
Net interest expense (interest expense less interest income) was
$64.8 million
in fiscal 2015 compared to
$65.6 million
in fiscal 2014. The decrease in net interest expense is primarily due to the capitalization of $0.6 million of interest in fiscal year 2015 versus no capitalization of interest in fiscal 2014.
Income before income taxes was
$653.3 million
, an increase of
$116.2 million
, or
21.6%
, compared to fiscal 2014. The increase in income before income taxes was primarily due to revenue growing at a faster rate than expenses.
Cintas' effective tax rate in fiscal 2015 was
37.2%
, which was comparable to the effective tax rate of
37.1%
in fiscal 2014. See Note 8 entitled Income Taxes of "Notes to Consolidated Financial Statements" for more information on income taxes.
18
Net income from continuing operations for fiscal 2015 of
$410.5 million
was a
21.5%
increase compared to fiscal 2014. Diluted earnings per share from continuing operations of
$3.46
was a
25.8%
increase compared to fiscal 2014. The increase in diluted earnings per share is higher than the increase in net income due to a decrease in weighted average common stock outstanding as a result of Cintas purchasing 10.3 million shares of common stock under the October 18, 2011, July 30, 2013 and January 13, 2015 share buyback programs during fiscal 2015 and the fourth quarter of fiscal 2014.
Uniform Rental and Facility Services Reportable Operating Segment
Uniform Rental and Facility Services reportable operating segment revenue increased
$235.2 million
, or
7.1%
, and the cost of uniform rental and facility services increased
$85.2 million
, or
4.4%
. Revenue in fiscal 2015 was negatively affected by 0.5% due to foreign currency exchange rate changes compared to fiscal 2014. The reportable operating segment's fiscal 2015 gross margin was
43.3%
of revenue compared to
41.8%
in fiscal 2014. The increase in gross margin as a percent of revenue over fiscal 2014 was due to new business sold by sales representatives, penetration of additional products and services into existing customers, and continuously improving the efficiency of internal processes. In addition, lower energy-related expenses increased gross margin 40 basis points.
Selling and administrative expenses for the Uniform Rental and Facility Services reportable operating segment increased
$65.9 million
in fiscal 2015 compared to fiscal 2014 primarily due to increases in labor and other employee-partner related expenses. Selling and administrative expense as a percent of revenue for fiscal 2015 was
26.2%
compared to
26.0%
in fiscal 2014.
Income before income taxes increased
$84.2 million
to
$606.0 million
for fiscal 2015 compared to fiscal 2014. Income before income taxes as a percent of revenue, at
17.1%
, increased from
15.8%
in fiscal 2014. This increase is primarily due to the increase in gross margin.
First Aid and Safety Services Reportable Operating Segment
First Aid and Safety Services reportable operating segment revenue increased
$31.6 million
in fiscal 2015, a
10.7%
increase compared to fiscal 2014. Revenue increased organically by 10.6% due to improvements in sales representative productivity. Acquisitions resulted in revenue growth of 0.1%.
Cost of first aid and safety services increased $15.4 million, or 9.7%, in fiscal 2015, due primarily to increased First Aid and Safety Services reportable operating segment volume. Gross margin for the First Aid and Safety Services reportable operating segment is defined as revenue less cost of goods, warehouse expenses, service expenses and training expenses. The gross margin as a percent of revenue was 46.6% for fiscal 2015 compared to 46.2% in fiscal 2014. Energy-related expenses decreased 40 basis points from fiscal 2014 and were the primary driver of gross margin improvement in fiscal 2015.
Selling and administrative expenses increased by
$11.0 million
, or
11.4%
, in fiscal 2015 compared to fiscal 2014 primarily due to an increase in labor and other employee-partner related expenses. Selling and administrative expenses as a percent of revenue, at
32.8%
, increased slightly from
32.6%
in fiscal 2014.
Income before income taxes was
$45.1 million
in fiscal 2015, an increase of
$5.2 million
, or
13.1%
, compared to fiscal 2014. Income before income taxes as a percent of revenue, at
13.8%
, increased from
13.5%
in fiscal 2014.
19
Liquidity and Capital Resources
The following is a summary of our cash flows and cash, cash equivalents and marketable securities as of and for the fiscal years ending May 31:
|
(In thousands)
|
2016
|
2015
|
|||||
|
Net cash provided by operating activities
|
$
|
465,845
|
|
$
|
580,276
|
|
|
|
Net cash provided by investing activities
|
$
|
128,381
|
|
$
|
44,987
|
|
|
|
Net cash used in financing activities
|
$
|
(866,724
|
)
|
$
|
(712,560
|
)
|
|
|
Cash and cash equivalents at the end of the period
|
$
|
139,357
|
|
$
|
417,073
|
|
|
|
Marketable securities at the end of the period
|
$
|
70,405
|
|
$
|
16,081
|
|
|
Cash, cash equivalents and marketable securities as of
May 31, 2016
and
2015
include $96.5 million and $109.8 million, respectively, that is located outside of the United States. We expect to use these amounts to fund our international operations and international expansion activities.
Cash flows provided by operating activities have historically supplied us with a significant source of liquidity. We generally use these cash flows to fund most, if not all, of our operations, expansion activities and dividends on our common stock. We may also use cash flows provided by operating activities, as well as proceeds from long-term debt and short-term borrowings, to fund growth and expansion opportunities, as well as other cash requirements such as the repurchase of our common stock.
Net cash provided by operating activities was
$465.8 million
for fiscal
2016
, which was a decrease of
$114.4 million
compared to fiscal
2015
. Net cash provided by operating activities was negatively impacted by the $229.5 million payment of taxes due on the gain on the sale of Shred-it. Excluding the impact of this tax payment, net cash provided by operations increased $115.0 million as a result of increased net income, partially offset by changes in working capital.
Net cash of
$128.4 million
was provided by investing activities in fiscal
2016
, compared to
$45.0 million
in fiscal
2015
. Capital expenditures were
$275.4 million
and
$217.7 million
for fiscal
2016
and fiscal
2015
, respectively. Capital expenditures for fiscal
2016
included
$237.9 million
for the Uniform Rental and Facility Services reportable operating segment and
$22.4 million
for the First Aid and Safety Services reportable operating segment. Cash paid for acquisitions of businesses was
$156.6 million
and
$15.5 million
for fiscal
2016
and fiscal
2015
, respectively. The acquisitions in both fiscal
2016
and 2015 occurred in our Uniform Rental and Facility Services reportable operating segment, our First Aid and Safety Services reportable operating segment and our Fire Protection business, which is included in All Other. In fiscal 2016, net cash provided by investing activities included $580.8 million of proceeds related to the sale of Shred-it. In addition, there was $35.3 million of cash received from the sale of the Storage real estate assets classified as held for sale at May 31, 2015 and additional consideration received from the sale of Storage in fiscal 2015. In fiscal 2015, net cash provided by investing activities include $35.2 million cash received from the sale of stock of an equity method investment plus receipt of dividends on the same investment. The Company sold Storage during fiscal 2015, receiving proceeds, net of cash contributed, of $158.4 million. Also, during fiscal 2015, net cash provided by investing activities include a dividend received from Shred-it of $113.4 million. Net cash provided by investing activities for fiscal
2016
and
2015
include net purchases of marketable securities and investments of
$60.0 million
and
$33.5 million
, respectively.
Net cash used in financing activities was
$866.7 million
and
$712.6 million
for fiscal
2016
and
2015
, respectively. On July 30, 2013, Cintas announced that the Board of Directors approved a $500.0 million share buyback program. From April 2014 through February 2015, Cintas purchased a total of 7.3 million shares of Cintas common stock at an average price of $68.29 per share for a total purchase price of $500.0 million. These purchases completed the July 30, 2013 share buyback program. On January 13, 2015, we announced that the Board of Directors authorized a $500.0 million share buyback program. From the inception of the January 13, 2015 share buyback program through September 2015, Cintas purchased a total of 5.9 million shares of Cintas common stock at an average price of $84.07 per share for a total purchase price of $500.0 million. On August 4, 2015, we announced that the Board of Directors authorized a new $500.0 million share buyback program, which does not have an expiration date. From the inception of the August 4, 2015 share buyback program, through
May 31, 2016
, Cintas has purchased a total of 5.6 million shares of Cintas common stock at an average price of $87.85 per share for a total purchase price of $496.3 million. The August 4, 2015 plan was completed in June 2016. From the inception of the August 4, 2015 program through June 1, 2016, Cintas purchased a total of 5.7 million shares of Cintas common stock at an average price of $87.89 per share for a total p
20
urchase price of $500.0 million. For the fiscal year ended
May 31, 2016
, Cintas acquired 0.2 million shares of Cintas common stock in satisfaction of employee payroll taxes due on restricted stock awards that vested during the fiscal year. These shares were acquired at an average price of $86.07 per share for a total purchase price of $20.9 million.
On October 14, 2015, Cintas declared an annual cash dividend of $1.05 per share on outstanding common stock, a 23.5% increase over the annual dividend paid in the prior year. The total dividend of $1.05 per share was paid on December 4, 2015, to shareholders of record as of November 6, 2015. This marked the 33
rd
consecutive year that Cintas has increased its annual dividend, every year since going public in 1983.
As of
May 31, 2016
, we had $1,300.0 million aggregate principal amount in fixed rate senior notes outstanding with maturities ranging from 2016 to 2036. These senior notes are comprised of $250.0 million of 30-year senior notes issued in fiscal 2007 at a rate of 6.15%, $300.0 million of 10-year senior notes issued in fiscal 2008 at a rate of 6.125%, $250.0 million of 5-year senior notes issued in fiscal 2011 at a rate of 2.85%, $250.0 million of 10-year senior notes issued in 2011 at a rate of 4.30% and $250.0 million of 10-year senior notes issued in fiscal 2012 at a rate of 3.25%. On June 1, 2016, Cintas paid the $250.0 million 5-year senior notes issued in fiscal 2011 with cash and $218.5 million proceeds from the issuance of commercial paper.
Cintas' commercial paper program has a capacity of $300.0 million that is fully supported by a backup revolving credit facility through a credit agreement with its banking group. This revolving credit facility has an accordion feature that allows for a maximum borrowing capacity of $450.0 million. The revolving credit facility was amended on May 29, 2014 to extend that maturity date from October 6, 2016 to May 28, 2019, to adjust the applicable margin used to calculate the interest payable on any outstanding loans, and to adjust the facility fee payable under the agreement. In June 2016, the revolving credit facility was amended to extend the maturity date from May 28, 2019 to June 22, 2021, increase the capacity to
$450.0 million
, and add an accordion feature that allows for a maximum borrowing capacity of
$600.0 million
. We believe that this program, along with cash generated from operations, will be adequate to provide necessary funding for our future cash requirements. No commercial paper or borrowings on our revolving credit facility were outstanding at
May 31, 2016
or
2015
.
Cintas has certain covenants related to debt agreements. These covenants limit our ability to incur certain liens, to engage in sale-leaseback transactions and to merge, consolidate or sell all or substantially all of Cintas' assets. These covenants also require Cintas to maintain certain debt to earnings before interest, taxes, depreciation and amortization (EBITDA) and interest coverage ratios. Cross-default provisions exist between certain debt instruments. If a default of a significant covenant were to occur, the default could result in an acceleration of the maturity of the indebtedness, impair liquidity and limit the ability to raise future capital. As of
May 31, 2016
, Cintas was in compliance with all debt covenants.
Our access to the commercial paper and long-term debt markets has historically provided us with sources of liquidity. We do not anticipate having difficulty in obtaining financing from those markets in the future in view of our favorable experiences in the debt markets in the recent past. Our ability to continue to access the commercial paper and long-term debt markets on favorable interest rate and other terms will depend, to a significant degree, on the ratings assigned by the credit rating agencies to our indebtedness. As of
May 31, 2016
, our ratings were as follows:
|
Rating Agency
|
|
Outlook
|
|
Commercial Paper
|
|
Long-term Debt
|
|
|
||||||
|
Standard & Poor's
|
|
Stable
|
|
A-2
|
|
A-
|
|
Moody's Investors Service
|
|
Stable
|
|
P-1
|
|
A2
|
In the event that the ratings of our commercial paper or our outstanding long-term debt issues were substantially lowered or withdrawn for any reason, or if the ratings assigned to any new issue of long-term debt securities were significantly lower than those noted above, particularly if we no longer had investment grade ratings, our ability to access the debt markets may be adversely affected. In addition, in such a case, our cost of funds for new issues of commercial paper and long-term debt would be higher than our cost of funds would have been had the ratings of those new issues been at or above the level of the ratings noted above. The rating agency ratings are not recommendations to buy, sell or hold our commercial paper or debt securities. Each rating may be subject to revision or withdrawal at any time by the assigning rating organization and should be evaluated independently of any other rating. Moreover, each credit rating is specific to the security to which it applies.
To monitor our credit rating and our capacity for long-term financing, we consider various qualitative and quantitative factors. One such factor is the ratio of our total debt to EBITDA. For the purpose of this calculation, debt is defined as the sum of short-term borrowings, long-term debt due within one year, obligations under capital leases due in one year, long-term debt and long-term obligations under capital leases.
21
Long-Term Contractual Obligations
|
Payments Due by Period
|
|||||||||||||||||||
|
(In thousands)
|
Total
|
One year
or less
|
Two to
three years
|
Four to
five years
|
After five
years
|
||||||||||||||
|
Long-term debt
(1)
|
$
|
1,300,000
|
|
$
|
250,000
|
|
$
|
300,000
|
|
$
|
—
|
|
$
|
750,000
|
|
||||
|
Operating leases
(2)
|
134,044
|
|
30,540
|
|
47,592
|
|
29,015
|
|
26,897
|
|
|||||||||
|
Interest payments
(3)
|
467,438
|
|
56,188
|
|
86,875
|
|
68,500
|
|
255,875
|
|
|||||||||
|
Unconditional purchase obligations
|
—
|
|
—
|
|
—
|
|
—
|
|
—
|
|
|||||||||
|
Total long-term contractual cash obligations
|
$
|
1,901,482
|
|
$
|
336,728
|
|
$
|
434,467
|
|
$
|
97,515
|
|
$
|
1,032,772
|
|
||||
Cintas also makes payments to defined contribution plans. The amount of contributions made to the defined contribution plans are at the discretion of the Board of Directors of Cintas. Future contributions are expected to be $46.9 million in the next year, $100.9 million in the next two to three years, and $111.2 million in the next four to five years.
|
(1)
|
Long-term debt consists of $1,300.0 million in senior notes (reference Note 6 entitled Long-Term Debt and Derivatives of "Notes to Consolidated Financial Statements" for a detailed discussion of long-term debt).
|
|
(2)
|
Operating leases consist primarily of operational facility leases.
|
|
(3)
|
Interest payments could include interest on both fixed and variable rate debt. As of May 31, 2016, Cintas did not have commercial paper outstanding, and therefore did not have any variable rate debt.
|
Other Commitments
|
Amount of Commitment Expiration per Period
|
|||||||||||||||||||
|
(In thousands)
|
Total
|
One year
or less
|
Two to
three years
|
Four to
five years
|
After five
Years
|
||||||||||||||
|
Lines of credit
(1)
|
$
|
299,899
|
|
$
|
—
|
|
$
|
299,899
|
|
$
|
—
|
|
$
|
—
|
|
||||
|
Standby letters of credit
(2)
|
83,396
|
|
83,396
|
|
—
|
|
—
|
|
—
|
|
|||||||||
|
Total other commitments
|
$
|
383,295
|
|
$
|
83,396
|
|
$
|
299,899
|
|
$
|
—
|
|
$
|
—
|
|
||||
|
(1)
|
Back-up facility for the commercial paper program (reference Note 6 entitled Long-Term Debt and Derivatives of "Notes to Consolidated Financial Statements" for further discussion).
|
|
(2)
|
Support certain outstanding debt (reference Note 6 entitled Long-Term Debt and Derivatives of "Notes to Consolidated Financial Statements"), self-insured workers' compensation and general liability insurance programs.
|
Inflation and Changing Prices
Changes in wages, benefits and energy costs have the potential to materially impact Cintas' consolidated financial results. Management believes inflation has not had a material impact on Cintas' consolidated financial condition or a negative impact on consolidated results of operations.
Litigation and Other Contingencies
Cintas is subject to legal proceedings, insurance receipts, legal settlements and claims arising from the ordinary course of its business, including personal injury, customer contract, environmental and employment claims. In the opinion of management, the aggregate liability, if any, with respect to such ordinary course of business actions will not have a material adverse effect on the consolidated financial position, consolidated results of operations or consolidated cash flows of Cintas.
New Accounting Standards
In February 2013, the Financial Accounting Standards Board (FASB) issued Accounting Standards Update (ASU) 2013-02, "Comprehensive Income (Topic 220): Reporting of Amounts Reclassified Out of Accumulated Other Comprehensive Income." ASU 2013-02 requires an entity to present (either on the face of the statement where net income is presented or in the notes) the effects on the line items of net income of significant amounts reclassified out of accumulated other comprehensive income if the item reclassified is required under GAAP to be reclassified to net income in its entirety in the same reporting period. For reclassification items not required under GAAP to be reclassified directly to net income in their entirety in the same reporting period, an entity is required to cross-reference to other disclosures currently required under GAAP that provide additional detail about those amounts. The Company adopted
22
ASU 2013-02 effective June 1, 2013. See Note 13 entitled Accumulated Other Comprehensive Income (Loss) of "Notes to Consolidated Financial Statements" for details of the required disclosure.
In April 2014, the FASB issued ASU 2014-08, “Reporting Discontinued Operations and Disclosures of Disposals of Components of an Entity,” which amended accounting guidance related to the reporting of discontinued operations and disclosures of disposals of components of an entity. The amended guidance changes the thresholds for disposals to qualify as discontinued operations and requires additional disclosures. This guidance is effective for reporting periods beginning after December 15, 2014 and is required to be applied prospectively. Cintas adopted ASU 2014-08 during the quarter ended August 31, 2015 and applied the amended accounting guidance to Shred-it and will apply it to future transactions, as appropriate.
In May 2014, the FASB issued ASU 2014-09, "Revenue from Contracts with Customers (Topic 606)," to clarify revenue recognition principles. This guidance is intended to improve disclosure requirements and enhance the comparability of revenue recognition practices. Improved disclosures under the amended guidance relate to the nature, amount, timing and uncertainty of revenue that is recognized from contracts with customers. This guidance will be effective for reporting periods beginning after December 15, 2017 and will be required to be applied retrospectively. Early application of the amendments in this update is not permitted. Cintas is currently evaluating the impact that ASU 2014-09 will have on its consolidated financial statements.
In April 2015, the FASB issued ASU 2015-17, “Balance Sheet Classifications of Deferred Taxes,” which amended accounting guidance related to the presentation of deferred tax liabilities and assets. The amended guidance requires that all deferred tax liabilities and assets be classified as noncurrent on the balance sheet. This guidance is effective for reporting periods beginning after December 15, 2016; however, early adoption is permitted. This guidance can also be applied either prospectively to all deferred tax liabilities and assets or retrospectively to all periods presented. Cintas adopted ASU 2015-17 during the quarter ended November 30, 2015 and has applied this amended accounting guidance to its deferred tax liabilities and assets for all periods presented. The impact of this change in accounting principle on balances previously reported as of May 31, 2015 was a reclassification of $112.4 million from current liabilities to long term liabilities.
In February 2016, the FASB issued ASU 2016-02, “Leases (Topic 842),” which sets out the principles for the recognition, measurement, presentation and disclosure of leases for both parties to a contract (i.e. lessees and lessors). The new standard requires lessees to apply a dual approach, classifying leases as either finance or operating leases based on the principle of whether or not the lease is effectively a financed purchase by the lessee. This classification will determine whether lease expense is recognized based on an effective interest method or on a straight line basis over the term of the lease, respectively. A lessee is also required to record a right-of-use asset and a lease liability for all leases with a term of greater than 12 months regardless of their classification. Leases with a term of 12 months or less will be accounted for similar to existing guidance for operating leases today. Topic 842 supersedes the previous leases standard, ASC 840, "Leases". This guidance is effective for reporting periods beginning after December 15, 2018. However, early adoption is permitted. Entities are required to use a modified retrospective approach for leases that exist or are entered into after the beginning of the earliest comparative period in the financial statements. Cintas is currently evaluating the impact that ASU 2016-02 will have on its consolidated financial statements.
In March 2016, the FASB issued ASU 2016-09, "Improvements to Employee Share-Based Payment Accounting." ASU 2016-09 is intended to simplify accounting for share-based payments. Upon adoption, ASU 2016-09 will require that excess tax benefits for share-based payments be recorded as a reduction of income tax expense and reflected within operating cash flows rather than being recorded within equity and reflected within financing cash flows. The standard also permits the repurchase of more of an employee’s shares for tax withholding purposes without triggering liability accounting, clarifies that all cash payments made on an employee’s behalf for withheld shares should be presented as a financing activity on our cash flows statement, and provides an accounting policy election to account for forfeitures as they occur. This update is effective for interim and annual periods beginning after December 15, 2016; however, early adoption is permitted. The Company is currently assessing the effect that adoption of ASU 2016-09 will have on its consolidated financial statements.
No other new accounting pronouncement recently issued or newly effective had or is expected to have a material impact on the Consolidated Financial Statements.
23
Critical Accounting Policies and Estimates
The preparation of Cintas' consolidated financial statements in conformity with GAAP requires management to make estimates and judgments that have a significant effect on the amounts reported in the consolidated financial statements and accompanying notes. These critical accounting policies should be read in conjunction with Note 1 entitled Significant Accounting Policies of "Notes to Consolidated Financial Statements." Significant changes, estimates or assumptions related to any of the following critical accounting policies could possibly have a material impact on the consolidated financial statements.
Revenue recognition
Rental revenue, which is recorded in the Uniform Rental and Facility Services reportable operating segment, is recognized when services are performed. Other revenue, which is recorded in the First Aid and Safety Services reportable operating segments and All Other, is recognized when either services are performed or when products are shipped and the title and risks of ownership pass to the customer.
Allowance for doubtful accounts
Cintas establishes an allowance for doubtful accounts. This allowance includes an estimate based on historical rates of collections and allowances for specific accounts identified as uncollectible. The allowance that is an estimate based on the Company's historical rates of collections is recorded for overdue amounts, beginning with a nominal percentage and increasing substantially as the account ages. The amount provided as the account ages will differ slightly between the Uniform Rental and Facility Services reportable operating segment, the First Aid and Safety Services reportable operating segment and All Other because of differences in customers served and the nature of each business. When an account is considered uncollectible, it is written off against the allowance for doubtful accounts.
Inventories
Inventories are valued at the lower of cost (first-in, first-out) or market. Cintas applies a commonly accepted practice of using inventory turns to apply variances between actual and standard costs to the inventory balances. The judgments and estimates used to calculate inventory turns will have an impact on the valuation of inventories at the lower of cost or market. An inventory obsolescence reserve is determined by specific identification, as well as an estimate based on the Company's historical rates of obsolescence.
Uniforms and other rental items in service
Uniforms and other rental items in service are valued at cost less amortization, calculated using the straight-line method. Uniforms in service (other than cleanroom and flame resistant clothing) are amortized over their useful life of 18 months. Other rental items, including shop towels, mats, mops, cleanroom garments, flame resistant clothing, linens and restroom dispensers, are amortized over their useful lives, which range from 8 to 60 months. The amortization rates used are based on industry experience, Cintas' specific experience and wear tests performed by Cintas. These factors are critical to determining the amount of in service inventory and related cost of uniforms and ancillary products that are presented in the consolidated financial statements.
Property and equipment
Depreciation is calculated using the straight-line method over the estimated useful lives of the assets based on industry and Company specific experience, which is typically 30 to 40 years for buildings, 5 to 20 years for building improvements, 3 to 10 years for equipment and 2 to 15 years for leasehold improvements. When events or circumstances indicate that the carrying amount of long-lived assets may not be recoverable, the estimated undiscounted future cash flows are compared to the carrying amount of the assets. If the estimated undiscounted future cash flows are less than the carrying amount of the assets, an impairment loss is recorded based on the excess of the carrying amount of the assets over their respective fair values. Fair value is generally determined by discounted cash flows or based on prices of similar assets, as appropriate.
Investments
Investments consists primarily of the cash surrender value of life insurance policies and equity method investments. The equity method is used to account for an investment if our investment gives us the ability to exercise significant influence over the operating and financial policies of the investee. In general, equity method investments are initially measured at cost. However, an equity method investment resulting from a transaction in which a controlled group of assets that constitutes a business is deconsolidated is initially measured at fair value. Cintas recognizes its share of the investee’s earnings or losses in income. Cintas also adjusts its share of the investee's earnings for intra-entity
24
transactions, basis differences, investee capital transactions and other comprehensive income through income or other comprehensive income as appropriate. Equity method investments are reviewed for impairment whenever events or changes in circumstances indicate that the carrying amount of the investment might not be recoverable.
Goodwill
Goodwill, obtained through acquisitions of businesses, is valued at cost less any impairment. Cintas completes an annual impairment test, which may include an assessment of qualitative factors including, but not limited to, macroeconomic conditions, industry and market conditions, and entity specific factors such as strategies and financial performance. The test may also include the determination of the estimated fair value of Cintas' reporting units via comparisons to current market values, where available, and discounted cash flow analyses. Significant assumptions may include growth rates based on historical trends and margin improvement leveraged from such growth, as well as discount rates. We determine discount rates separately for each reporting unit using the weighted average cost of capital, which includes a calculation of cost of equity, which is developed using the capital asset pricing model and comparable company betas (a measure of systemic risk), and cost of debt. We also use comparable market earnings multiple data and our market capitalization to corroborate our reporting unit valuations. We test for goodwill impairment at the reporting unit level. As a result of Cintas’ operating segment realignment, the composition of Cintas’ reporting units for the evaluation of goodwill impairment has changed. Historically, Cintas’ reporting units were the same as the reportable operating segments, Rental Uniforms and Ancillary Products, Uniform Direct Sales and First Aid, Safety and Fire Protection Services. Effective June 1, 2015, Cintas identified
five
reporting units for purposes of evaluating goodwill impairment, Uniform Rental and Facility Services, First Aid and Safety Services, and
three
reporting units within All Other. As a result of the change in reporting units, Cintas was required to perform an interim impairment test on Goodwill at June 1, 2015. There was no impairment recorded as a result of the interim impairment test. Based on the results of the annual impairment tests, Cintas was not required to recognize an impairment of goodwill for the fiscal years ended
May 31, 2016
,
2015
or
2014
. Cintas will continue to perform impairment tests as of March 1 in future years or when indicators of impairment exist.
Service contracts and other assets
Service contracts and other assets, which consist primarily of noncompete and consulting agreements obtained through acquisitions of businesses, are amortized by use of the straight-line method over the estimated lives of the agreements, which are generally 5 to 10 years. Certain noncompete agreements, as well as all service contracts, require that a valuation be determined using a discounted cash flow model. The assumptions and judgments used in these models involve estimates of cash flows and discount rates, among other factors. Because of the assumptions used to value these intangible assets, actual results over time could vary from original estimates. Impairment of service contracts and other assets is accomplished through specific identification. No impairment has been recognized by Cintas for the fiscal years ended
May 31, 2016
,
2015
or
2014
.
General insurance liabilities
General insurance liabilities represent the estimated ultimate cost of all asserted and unasserted claims incurred, primarily related to worker's compensation, auto liability and other general liability exposure through the consolidated balance sheet dates. Our reserves are estimated through actuarial procedures of the insurance industry and by using industry assumptions, adjusted for specific expectations based on our claims history. Cintas records an increase or decrease in selling and administrative expenses related to development of prior claims, higher claims activity and other environmental factors in the period in which it becomes known. These changes in estimates may be material to the consolidated financial statements.
Stock-based compensation
Compensation expense is recognized for all share-based payments to employees, including stock options and restricted stock awards, in the consolidated statements of income based on the fair value of the awards that are granted. The fair value of stock options is estimated at the date of grant using the Black-Scholes option-pricing model. Measured compensation cost, net of estimated forfeitures, is recognized on a straight-line basis over the vesting period of the related share-based compensation award. See Note 12 entitled Stock-Based Compensation of "Notes to Consolidated Financial Statements" for further information.
Litigation and other contingencies
Cintas is subject to legal proceedings and claims arising from the ordinary course of its business, including personal injury, customer contract, environmental and employment claims. GAAP requires that a liability for contingencies be recorded when it is probable that a liability has occurred and the amount of the liability can be reasonably estimated.
25
Significant judgment is required to determine the existence of a liability, as well as the amount to be recorded. While a significant change in assumptions and judgments could have a material impact on the amounts recorded for contingent liabilities, Cintas does not believe that they will result in a material adverse effect on the consolidated financial statements.
Income taxes
Deferred tax assets and liabilities are determined by the differences between the consolidated financial statement carrying amounts and the tax basis of assets and liabilities. See Note 8 entitled Income Taxes of "Notes to Consolidated Financial Statements" for the types of items that give rise to significant deferred income tax assets and liabilities. Deferred income taxes are classified as assets or liabilities based on the classification of the related asset or liability for financial reporting purposes. Cintas regularly reviews deferred tax assets for recoverability based upon projected future taxable income and the expected timing of the reversals of existing temporary differences. Although realization is not assured, management believes it is more likely than not that the recorded deferred tax assets, as adjusted for valuation allowances, will be realized.
Accounting for uncertain tax positions requires the determination of whether tax benefits claimed or expected to be claimed on a tax return should be recorded in the consolidated financial statements. Companies may recognize the tax benefit from an uncertain tax position only if it is more likely than not that the tax position will be sustained on examination by the taxing authorities, based on the technical merits of the position. The tax benefits recognized in the consolidated financial statements from such a position should be measured based on the largest benefit that has a greater than fifty percent likelihood of being realized upon ultimate settlement.
Cintas is periodically reviewed by domestic and foreign tax authorities regarding the amount of taxes due. These reviews include questions regarding the timing and amount of deductions and the allocation of income among various tax jurisdictions. In evaluating the exposure associated with various filing positions, Cintas records reserves as deemed appropriate. Based on Cintas' evaluation of current tax positions, Cintas believes its tax related accruals are appropriate.
Earnings are affected by changes in short-term interest rates due to investments in marketable securities and money market accounts and periodic issuances of commercial paper. If short-term rates changed by one-half percent (or 50 basis points), Cintas' income before income taxes would change by approximately $0.3 million. This estimated exposure considers the effects on investments. This analysis does not consider the effects of a change in economic activity or a change in Cintas' capital structure.
Through its foreign operations, Cintas is exposed to foreign currency risk. Foreign currency exposures arise from transactions denominated in a currency other than the functional currency and from foreign denominated revenue and profit translated into U.S. dollars. Foreign denominated revenue and profit represents less than 10% of Cintas' consolidated revenue and profit. Cintas periodically uses foreign currency hedges such as average rate options and forward contracts to mitigate the risk of foreign currency exchange rate movements resulting from foreign currency revenue and from international cash flows. The primary foreign currency to which Cintas is exposed is the Canadian dollar.
26
Index to Consolidated Financial Statements
Audited Consolidated Financial Statements for the Fiscal Years Ended
May 31, 2016
,
2015
and
2014
27
Management's Report on
Internal Control over Financial Reporting
To the Shareholders of Cintas Corporation:
Our management is responsible for establishing and maintaining adequate internal control over financial reporting (as defined in Rule 13a-15(f) and 15(d)-15(f) under the Securities Exchange Act of 1934) to provide reasonable assurance regarding the reliability of our financial reporting and the preparation of financial statements for external purposes in accordance with accounting principles generally accepted in the United States. Internal control over financial reporting includes those policies and procedures that: (1) pertain to the maintenance of records that in reasonable detail accurately and fairly reflect the transactions and dispositions of the assets of the company; (2) provide reasonable assurance that transactions are recorded as necessary to permit preparation of financial statements in accordance with generally accepted accounting principles and that receipts and expenditures of the company are being made only in accordance with authorizations of management and directors of the company; and (3) provide reasonable assurance regarding prevention or timely detection of unauthorized acquisition, use or disposition of the company's assets that could have a material effect on the financial statements.
Because of its inherent limitations, internal control over financial reporting may not prevent or detect misstatements. Also, projections of any evaluation of effectiveness to future periods are subject to the risk that controls may become inadequate because of changes in conditions, or that the degree of compliance with the policies or procedures may deteriorate. Accordingly, even an effective system of internal control over financial reporting will provide only reasonable assurance with respect to financial statement preparation.
With the supervision of our Chief Executive Officer and our Chief Financial Officer, management assessed our internal control over financial reporting as of
May 31, 2016
. Management based its assessment on criteria established in
Internal Control — Integrated Framework
(2013)
issued by the Committee of Sponsoring Organizations of the Treadway Commission (COSO). Management's assessment included evaluation of such elements as the design and operating effectiveness of key financial reporting controls, process documentation, accounting policies and our overall control environment. This assessment is supported by testing and monitoring performed by our internal audit function.
Based on our assessment, management has concluded that our internal control over financial reporting was effective as of
May 31, 2016
, to provide reasonable assurance regarding the reliability of financial reporting and the preparation of financial statements for external reporting purposes in accordance with accounting principles generally accepted in the United States.
We reviewed the results of management's assessment with the Audit Committee of our Board of Directors. Additionally, our independent registered public accounting firm, Ernst & Young LLP, independently assessed the effectiveness of Cintas Corporation's internal control over financial reporting. Ernst & Young LLP has issued an attestation report, which is included in this Annual Report on Form 10-K.
|
Scott D. Farmer
Chief Executive Officer
|
||
|
J. Michael Hansen
Vice President and Chief Financial Officer
|
||
28
Report of Independent Registered Public Accounting Firm
The Board of Directors and Shareholders of Cintas Corporation
We have audited Cintas Corporation’s internal control over financial reporting as of May 31, 2016, based on criteria established in Internal Control-Integrated Framework issued by the Committee of Sponsoring Organizations of the Treadway Commission (2013 framework) (the COSO criteria). Cintas Corporation’s management is responsible for maintaining effective internal control over financial reporting, and for its assessment of the effectiveness of internal control over financial reporting included in the accompanying Management’s Report on Internal Control over Financial Reporting. Our responsibility is to express an opinion on the company’s internal control over financial reporting based on our audit.
We conducted our audit in accordance with the standards of the Public Company Accounting Oversight Board (United States). Those standards require that we plan and perform the audit to obtain reasonable assurance about whether effective internal control over financial reporting was maintained in all material respects. Our audit included obtaining an understanding of internal control over financial reporting, assessing the risk that a material weakness exists, testing and evaluating the design and operating effectiveness of internal control based on the assessed risk, and performing such other procedures as we considered necessary in the circumstances. We believe that our audit provides a reasonable basis for our opinion.
A company’s internal control over financial reporting is a process designed to provide reasonable assurance regarding the reliability of financial reporting and the preparation of financial statements for external purposes in accordance with generally accepted accounting principles. A company’s internal control over financial reporting includes those policies and procedures that (1) pertain to the maintenance of records that, in reasonable detail, accurately and fairly reflect the transactions and dispositions of the assets of the company; (2) provide reasonable assurance that transactions are recorded as necessary to permit preparation of financial statements in accordance with generally accepted accounting principles, and that receipts and expenditures of the company are being made only in accordance with authorizations of management and directors of the company; and (3) provide reasonable assurance regarding prevention or timely detection of unauthorized acquisition, use or disposition of the company’s assets that could have a material effect on the financial statements.
Because of its inherent limitations, internal control over financial reporting may not prevent or detect misstatements. Also, projections of any evaluation of effectiveness to future periods are subject to the risk that controls may become inadequate because of changes in conditions, or that the degree of compliance with the policies or procedures may deteriorate.
In our opinion, Cintas Corporation maintained, in all material respects, effective internal control over financial reporting as of May 31, 2016, based on
the COSO criteria
.
We also have audited, in accordance with the standards of the Public Company Accounting Oversight Board (United States), the consolidated balance sheets of Cintas Corporation as of May 31, 2016 and 2015 and the related consolidated statements of income, comprehensive income, shareholders’ equity and cash flows for each of the three years in the period ended May 31, 2016 and our report dated July 29, 2016 expressed an unqualified opinion thereon.
|
|
|
/s/ ERNST & YOUNG LLP
|
Cincinnati, Ohio
July 29, 2016
29
Report of Independent Registered Public Accounting Firm
The Board of Directors and Shareholders of Cintas Corporation
We have audited the accompanying consolidated balance sheets of Cintas Corporation as of May 31, 2016 and 2015, and the related consolidated statements of income, comprehensive income, shareholders' equity and cash flows for each of the three years in the period ended May 31, 2016. Our audits also included the consolidated financial statement schedule listed in the Index at Item 15(a)(2). These consolidated financial statements and schedule are the responsibility of Cintas Corporation’s management. Our responsibility is to express an opinion on these financial statements and schedule based on our audits.
We conducted our audits in accordance with the standards of the Public Company Accounting Oversight Board (United States). Those standards require that we plan and perform the audit to obtain reasonable assurance about whether the financial statements are free of material misstatement. An audit includes examining, on a test basis, evidence supporting the amounts and disclosures in the financial statements. An audit also includes assessing the accounting principles used and significant estimates made by management, as well as evaluating the overall financial statement presentation. We believe that our audits provide a reasonable basis for our opinion.
In our opinion, the financial statements referred to above present fairly, in all material respects, the consolidated financial position of Cintas Corporation at May 31, 2016 and 2015, and the consolidated results of their operations and their cash flows for each of the three years in the period ended May 31, 2016, in conformity with U.S. generally accepted accounting principles. Also, in our opinion, the related financial statement schedule, when considered in relation to the basic consolidated financial statements taken as a whole, presents fairly in all material respects the information set forth therein.
We also have audited, in accordance with the standards of the Public Company Accounting Oversight Board (United States), Cintas Corporation’s internal control over financial reporting as of May 31, 2016, based on criteria established in Internal Control-Integrated Framework issued by the Committee of Sponsoring Organizations of the Treadway Commission (2013 framework), and our report dated July 29, 2016 expressed an unqualified opinion thereon.
|
|
|
/s/ ERNST & YOUNG LLP
|
Cincinnati, Ohio
July 29, 2016
30
|
Consolidated
|
|||||||||||
|
Fiscal Years Ended May 31,
|
|||||||||||
|
(In thousands except per share data)
|
2016
|
2015
|
2014
|
||||||||
|
Revenue:
|
|
|
|
||||||||
|
Uniform rental and facility services
|
$
|
3,777,801
|
|
$
|
3,539,843
|
|
$
|
3,304,635
|
|
||
|
Other
|
1,127,657
|
|
937,043
|
|
889,209
|
|
|||||
|
4,905,458
|
|
4,476,886
|
|
4,193,844
|
|
||||||
|
Costs and expenses:
|
|
|
|
||||||||
|
Cost of uniform rental and facility services
|
2,106,793
|
|
2,007,632
|
|
1,922,477
|
|
|||||
|
Cost of other
|
668,795
|
|
547,917
|
|
521,608
|
|
|||||
|
Selling and administrative expenses
|
1,348,122
|
|
1,224,930
|
|
1,147,039
|
|
|||||
|
Operating income
|
781,748
|
|
696,407
|
|
602,720
|
|
|||||
|
Gain on sale of stock of an equity method investment
|
—
|
|
21,739
|
|
—
|
|
|||||
|
Interest income
|
(896
|
)
|
(339
|
)
|
(229
|
)
|
|||||
|
Interest expense
|
64,522
|
|
65,161
|
|
65,822
|
|
|||||
|
Income before income taxes
|
718,122
|
|
653,324
|
|
537,127
|
|
|||||
|
Income taxes
|
261,181
|
|
242,803
|
|
199,355
|
|
|||||
|
Income from continuing operations
|
456,941
|
|
410,521
|
|
337,772
|
|
|||||
|
Income from discontinued operations, net of tax of $133,712,
$11,110 and $34,060, respectively
|
236,579
|
|
20,097
|
|
36,670
|
|
|||||
|
Net income
|
$
|
693,520
|
|
$
|
430,618
|
|
$
|
374,442
|
|
||
|
Basic earnings per share
|
|||||||||||
|
Continuing operations
|
$
|
4.15
|
|
$
|
3.51
|
|
$
|
2.78
|
|
||
|
Discontinued operations
|
2.15
|
|
0.17
|
|
0.30
|
|
|||||
|
Basic earnings per share
|
$
|
6.30
|
|
$
|
3.68
|
|
$
|
3.08
|
|
||
|
Diluted earnings per share
|
|||||||||||
|
Continuing operations
|
$
|
4.09
|
|
$
|
3.46
|
|
$
|
2.75
|
|
||
|
Discontinued operations
|
2.12
|
|
0.17
|
|
0.30
|
|
|||||
|
Diluted earnings per share
|
$
|
6.21
|
|
$
|
3.63
|
|
$
|
3.05
|
|
||
|
Dividends declared and paid per share
|
$
|
1.05
|
|
$
|
1.70
|
|
$
|
0.77
|
|
||
See accompanying notes.
31
|
Consolidated Statements of Comprehensive Income
|
|||||||||||
|
Fiscal Years Ended May 31,
|
|||||||||||
|
(In thousands)
|
2016
|
2015
|
2014
|
||||||||
|
Net income
|
$
|
693,520
|
|
$
|
430,618
|
|
$
|
374,442
|
|
||
|
Other comprehensive (loss) income, net of tax:
|
|||||||||||
|
Foreign currency translation adjustments
|
(11,933
|
)
|
(38,538
|
)
|
(9,787
|
)
|
|||||
|
Cumulative translation adjustment on Shred-it
|
6,472
|
|
—
|
|
—
|
|
|||||
|
Change in fair value of derivatives
|
(12,156
|
)
|
37
|
|
(228
|
)
|
|||||
|
Amortization of interest rate lock agreements
|
1,952
|
|
1,952
|
|
1,952
|
|
|||||
|
Other
|
(738
|
)
|
(350
|
)
|
(1,632
|
)
|
|||||
|
Other comprehensive loss
|
(16,403
|
)
|
(36,899
|
)
|
(9,695
|
)
|
|||||
|
Comprehensive income
|
$
|
677,117
|
|
$
|
393,719
|
|
$
|
364,747
|
|
||
See accompanying notes.
32
|
Consolidated
|
|||||||
|
As of May 31,
|
|||||||
|
(In thousands except share data)
|
2016
|
2015
|
|||||
|
Assets
|
|
|
|||||
|
Current assets:
|
|
|
|||||
|
Cash and cash equivalents
|
$
|
139,357
|
|
$
|
417,073
|
|
|
|
Marketable securities
|
70,405
|
|
16,081
|
|
|||
|
Accounts receivable, principally trade, less allowance of $19,604 and $15,674, respectively
|
563,178
|
|
496,130
|
|
|||
|
Inventories, net
|
249,362
|
|
226,211
|
|
|||
|
Uniforms and other rental items in service
|
539,956
|
|
534,005
|
|
|||
|
Income taxes, current
|
1,712
|
|
936
|
|
|||
|
Assets held for sale
|
—
|
|
21,341
|
|
|||
|
Prepaid expenses and other current assets
|
26,065
|
|
24,030
|
|
|||
|
Total current assets
|
1,590,035
|
|
1,735,807
|
|
|||
|
Property and equipment, at cost, net
|
994,237
|
|
871,421
|
|
|||
|
Investments
|
124,952
|
|
329,692
|
|
|||
|
Goodwill
|
1,291,593
|
|
1,195,612
|
|
|||
|
Service contracts, net
|
83,715
|
|
42,434
|
|
|||
|
Other assets, net
|
19,861
|
|
17,494
|
|
|||
|
$
|
4,104,393
|
|
$
|
4,192,460
|
|
||
|
Liabilities and Shareholders' Equity
|
|
|
|||||
|
Current liabilities:
|
|
|
|||||
|
Accounts payable
|
$
|
114,514
|
|
$
|
109,607
|
|
|
|
Accrued compensation and related liabilities
|
101,976
|
|
88,423
|
|
|||
|
Accrued liabilities
|
349,065
|
|
309,935
|
|
|||
|
Liabilities held for sale
|
—
|
|
704
|
|
|||
|
Long-term debt due within one year
|
250,000
|
|
—
|
|
|||
|
Total current liabilities
|
815,555
|
|
508,669
|
|
|||
|
Long-term liabilities:
|
|
|
|||||
|
Long-term debt due after one year
|
1,050,000
|
|
1,300,000
|
|
|||
|
Deferred income taxes
|
259,475
|
|
339,327
|
|
|||
|
Accrued liabilities
|
136,704
|
|
112,009
|
|
|||
|
Total long-term liabilities
|
1,446,179
|
|
1,751,336
|
|
|||
|
Shareholders' equity:
|
|
|
|||||
|
Preferred stock, no par value:
|
|
|
|||||
|
100,000 shares authorized, none outstanding
|
—
|
|
—
|
|
|||
|
Common stock, no par value:
|
|
|
|||||
|
425,000,000 shares authorized
|
|
|
|||||
|
2016: 179,598,516 shares issued and 104,213,479 shares outstanding
|
|
|
|
|
|||
|
2015: 178,117,334 shares issued and 111,702,949 shares outstanding
|
409,682
|
|
329,248
|
|
|||
|
Paid-in capital
|
205,260
|
|
157,183
|
|
|||
|
Retained earnings
|
4,805,867
|
|
4,227,620
|
|
|||
|
Treasury stock:
|
|
|
|
|
|||
|
2016: 75,385,037 shares
|
|
|
|||||
|
2015: 66,414,385 shares
|
(3,553,276
|
)
|
(2,773,125
|
)
|
|||
|
Accumulated other comprehensive loss
|
(24,874
|
)
|
(8,471
|
)
|
|||
|
Total shareholders' equity
|
1,842,659
|
|
1,932,455
|
|
|||
|
$
|
4,104,393
|
|
$
|
4,192,460
|
|
||
See accompanying notes.
33
Consolidated
Statements of Shareholders' Equity
|
Common Stock
|
Paid-In
Capital
|
Retained
Earnings
|
Other
Accumulated
Comprehensive
Income (Loss)
|
Treasury Stock
|
Total
Shareholders'
Equity
|
||||||||||||||||||||||||
|
(In thousands)
|
Shares
|
Amount
|
Shares
|
Amount
|
|||||||||||||||||||||||||
|
Balance at June 1, 2013
|
174,786
|
|
$
|
186,332
|
|
$
|
109,822
|
|
$
|
3,717,771
|
|
$
|
38,123
|
|
(52,505
|
)
|
$
|
(1,850,556
|
)
|
$
|
2,201,492
|
|
|||||||
|
Net income
|
—
|
|
—
|
|
—
|
|
374,442
|
|
—
|
|
—
|
|
—
|
|
374,442
|
|
|||||||||||||
|
Comprehensive loss, net of tax
|
—
|
|
—
|
|
—
|
|
—
|
|
(9,695
|
)
|
—
|
|
—
|
|
(9,695
|
)
|
|||||||||||||
|
Dividends
|
—
|
|
—
|
|
—
|
|
(93,320
|
)
|
—
|
|
—
|
|
—
|
|
(93,320
|
)
|
|||||||||||||
|
Stock-based compensation
|
—
|
|
—
|
|
44,746
|
|
—
|
|
—
|
|
—
|
|
—
|
|
44,746
|
|
|||||||||||||
|
Vesting of stock-based compensation awards
|
465
|
|
23,519
|
|
(23,519
|
)
|
—
|
|
—
|
|
—
|
|
—
|
|
—
|
|
|||||||||||||
|
Stock options exercised, net of shares surrendered
|
1,127
|
|
41,902
|
|
—
|
|
—
|
|
—
|
|
—
|
|
—
|
|
41,902
|
|
|||||||||||||
|
Repurchase of common stock
|
—
|
|
—
|
|
—
|
|
—
|
|
—
|
|
(6,836
|
)
|
(370,599
|
)
|
(370,599
|
)
|
|||||||||||||
|
Other
|
—
|
|
—
|
|
3,890
|
|
—
|
|
—
|
|
—
|
|
—
|
|
3,890
|
|
|||||||||||||
|
Balance at May 31, 2014
|
176,378
|
|
251,753
|
|
134,939
|
|
3,998,893
|
|
28,428
|
|
(59,341
|
)
|
(2,221,155
|
)
|
2,192,858
|
|
|||||||||||||
|
Net income
|
—
|
|
—
|
|
—
|
|
430,618
|
|
—
|
|
—
|
|
—
|
|
430,618
|
|
|||||||||||||
|
Comprehensive loss, net of tax
|
—
|
|
—
|
|
—
|
|
—
|
|
(36,899
|
)
|
—
|
|
—
|
|
(36,899
|
)
|
|||||||||||||
|
Dividends
|
—
|
|
—
|
|
—
|
|
(201,891
|
)
|
—
|
|
—
|
|
—
|
|
(201,891
|
)
|
|||||||||||||
|
Stock-based compensation
|
—
|
|
—
|
|
47,002
|
|
—
|
|
—
|
|
—
|
|
—
|
|
47,002
|
|
|||||||||||||
|
Vesting of stock-based compensation awards
|
575
|
|
37,265
|
|
(37,265
|
)
|
—
|
|
—
|
|
—
|
|
—
|
|
—
|
|
|||||||||||||
|
Stock options exercised, net of shares surrendered
|
1,164
|
|
40,230
|
|
—
|
|
—
|
|
—
|
|
—
|
|
—
|
|
40,230
|
|
|||||||||||||
|
Repurchase of common stock
|
—
|
|
—
|
|
—
|
|
—
|
|
—
|
|
(7,073
|
)
|
(551,970
|
)
|
(551,970
|
)
|
|||||||||||||
|
Other
|
—
|
|
—
|
|
12,507
|
|
—
|
|
—
|
|
—
|
|
—
|
|
12,507
|
|
|||||||||||||
|
Balance at May 31, 2015
|
178,117
|
|
329,248
|
|
157,183
|
|
4,227,620
|
|
(8,471
|
)
|
(66,414
|
)
|
(2,773,125
|
)
|
1,932,455
|
|
|||||||||||||
|
Net income
|
—
|
|
—
|
|
—
|
|
693,520
|
|
—
|
|
—
|
|
—
|
|
693,520
|
|
|||||||||||||
|
Comprehensive loss, net of tax
|
—
|
|
—
|
|
—
|
|
—
|
|
(16,403
|
)
|
—
|
|
—
|
|
(16,403
|
)
|
|||||||||||||
|
Dividends
|
—
|
|
—
|
|
—
|
|
(115,273
|
)
|
—
|
|
—
|
|
—
|
|
(115,273
|
)
|
|||||||||||||
|
Stock-based compensation
|
—
|
|
—
|
|
79,293
|
|
—
|
|
—
|
|
—
|
|
—
|
|
79,293
|
|
|||||||||||||
|
Vesting of stock-based compensation awards
|
605
|
|
52,208
|
|
(52,208
|
)
|
—
|
|
—
|
|
—
|
|
—
|
|
—
|
|
|||||||||||||
|
Stock options exercised, net of shares surrendered
|
876
|
|
28,226
|
|
—
|
|
—
|
|
—
|
|
—
|
|
—
|
|
28,226
|
|
|||||||||||||
|
Repurchase of common stock
|
—
|
|
—
|
|
—
|
|
—
|
|
—
|
|
(8,971
|
)
|
(780,151
|
)
|
(780,151
|
)
|
|||||||||||||
|
Other
|
—
|
|
—
|
|
20,992
|
|
—
|
|
—
|
|
—
|
|
—
|
|
20,992
|
|
|||||||||||||
|
Balance at May 31, 2016
|
179,598
|
|
$
|
409,682
|
|
$
|
205,260
|
|
$
|
4,805,867
|
|
$
|
(24,874
|
)
|
(75,385
|
)
|
$
|
(3,553,276
|
)
|
$
|
1,842,659
|
|
|||||||
See accompanying notes.
34
|
Consolidated
|
|||||||||||
|
Fiscal Years Ended May 31,
|
|||||||||||
|
(In thousands)
|
2016
|
2015
|
2014
|
||||||||
|
Cash flows from operating activities:
|
|
|
|
||||||||
|
Net income
|
$
|
693,520
|
|
$
|
430,618
|
|
$
|
374,442
|
|
||
|
Adjustments to reconcile net income to net cash provided by operating activities:
|
|
|
|
||||||||
|
Depreciation
|
149,691
|
|
140,624
|
|
168,220
|
|
|||||
|
Amortization of intangible assets
|
15,588
|
|
14,458
|
|
22,642
|
|
|||||
|
Stock-based compensation
|
79,293
|
|
47,002
|
|
29,875
|
|
|||||
|
Gain on Storage transactions
|
(15,786
|
)
|
(38,573
|
)
|
—
|
|
|||||
|
Loss (gain) on Shred-it
|
24,288
|
|
3,851
|
|
(108,441
|
)
|
|||||
|
Gain on sale of Shred-it
|
(378,359
|
)
|
—
|
|
—
|
|
|||||
|
Gain on sale of stock of an equity method investment
|
—
|
|
(21,739
|
)
|
—
|
|
|||||
|
Shredding Transaction asset impairment charge
|
—
|
|
—
|
|
16,143
|
|
|||||
|
Shredding Transaction costs
|
—
|
|
—
|
|
26,057
|
|
|||||
|
Deferred income taxes
|
(59,302
|
)
|
20,866
|
|
47,109
|
|
|||||
|
Change in current assets and liabilities, net of acquisitions of businesses:
|
|
|
|
|
|
|
|||||
|
Accounts receivable, net
|
(52,762
|
)
|
(1,443
|
)
|
(56,231
|
)
|
|||||
|
Inventories, net
|
(17,917
|
)
|
23,785
|
|
(11,062
|
)
|
|||||
|
Uniforms and other rental items in service
|
(6,306
|
)
|
(31,994
|
)
|
(11,435
|
)
|
|||||
|
Prepaid expenses and other current assets
|
(965
|
)
|
(3,202
|
)
|
(2,177
|
)
|
|||||
|
Accounts payable
|
(564
|
)
|
(33,445
|
)
|
30,446
|
|
|||||
|
Accrued compensation and related liabilities
|
13,512
|
|
3,234
|
|
10,931
|
|
|||||
|
Accrued liabilities and other
|
22,714
|
|
33,066
|
|
54,237
|
|
|||||
|
Income taxes, current
|
(800
|
)
|
(6,832
|
)
|
15,213
|
|
|||||
|
Net cash provided by operating activities
|
465,845
|
|
580,276
|
|
605,969
|
|
|||||
|
Cash flows from investing activities:
|
|
|
|
||||||||
|
Capital expenditures
|
(275,385
|
)
|
(217,720
|
)
|
(145,580
|
)
|
|||||
|
Proceeds from redemption of marketable securities
|
434,179
|
|
161,938
|
|
54,196
|
|
|||||
|
Purchase of marketable securities and investments
|
(494,146
|
)
|
(195,471
|
)
|
(63,858
|
)
|
|||||
|
Proceeds from Storage transactions, net of cash contributed
|
35,338
|
|
158,428
|
|
—
|
|
|||||
|
Proceeds from Shredding transactions, net of cash contributed
|
580,837
|
|
3,344
|
|
179,359
|
|
|||||
|
Proceeds from sale of stock of an equity method investment
|
—
|
|
29,933
|
|
—
|
|
|||||
|
Dividends received on equity method investment
|
—
|
|
5,247
|
|
—
|
|
|||||
|
Dividends received on Shred-it
|
—
|
|
113,400
|
|
—
|
|
|||||
|
Acquisitions of businesses, net of cash acquired
|
(156,579
|
)
|
(15,495
|
)
|
(33,441
|
)
|
|||||
|
Other
|
4,137
|
|
1,383
|
|
(5,219
|
)
|
|||||
|
Net cash provided by (used in) investing activities
|
128,381
|
|
44,987
|
|
(14,543
|
)
|
|||||
|
Cash flows from financing activities:
|
|
|
|
||||||||
|
Repayment of debt
|
(16
|
)
|
(518
|
)
|
(8,187
|
)
|
|||||
|
Proceeds from exercise of stock-based compensation awards
|
28,226
|
|
40,230
|
|
41,902
|
|
|||||
|
Dividends paid
|
(115,273
|
)
|
(201,891
|
)
|
(93,320
|
)
|
|||||
|
Repurchase of common stock
|
(780,151
|
)
|
(551,970
|
)
|
(370,599
|
)
|
|||||
|
Other
|
490
|
|
1,589
|
|
469
|
|
|||||
|
Net cash used in financing activities
|
(866,724
|
)
|
(712,560
|
)
|
(429,735
|
)
|
|||||
|
Effect of exchange rate changes on cash and cash equivalents
|
(5,218
|
)
|
(8,918
|
)
|
(676
|
)
|
|||||
|
Net (decrease) increase in cash and cash equivalents
|
(277,716
|
)
|
(96,215
|
)
|
161,015
|
|
|||||
|
Cash and cash equivalents at beginning of year
|
417,073
|
|
513,288
|
|
352,273
|
|
|||||
|
Cash and cash equivalents at end of year
|
$
|
139,357
|
|
$
|
417,073
|
|
$
|
513,288
|
|
||
See accompanying notes.
35
Notes to Consolidated Financial Statements
1. Significant Accounting Policies
Business description.
Cintas Corporation (collectively with its majority-owned subsidiaries and any entities over which it has control, Cintas) helps more than
900,000
businesses of all types and sizes, primarily in North America, as well as Latin America, Europe and Asia, get
Ready™
to open their doors with confidence every day by providing a wide range of products and services that enhance our customers’ image and help keep their facilities and employees clean, safe and looking their best. With products and services including uniforms, floor care, restroom supplies, first aid and safety products, fire extinguishers and testing, and safety and compliance training, Cintas helps customers get
Ready for the Workday™.
U.S. Generally Accepted Accounting Principles (GAAP) requires companies to evaluate their reportable operating segments periodically and when certain events occur. As a result of a recent evaluation, effective June 1, 2015, Cintas realigned its organizational structure and updated its reportable operating segments in light of certain changes in its business, including the acquisition of ZEE Medical Inc. (ZEE) in the first quarter of fiscal 2016. Cintas’ updated reportable operating segments are Uniform Rental and Facility Services and First Aid and Safety Services. The Uniform Rental and Facility Services reportable operating segment consists of the rental and servicing of uniforms and other garments including flame resistant clothing, mats, mops and shop towels and other ancillary items. In addition to these rental items, restroom cleaning services and supplies, carpet and tile cleaning services and the sale of items from our catalogs to our customers on route are included within this reportable operating segment. The First Aid and Safety Services reportable operating segment consists of first aid and safety products and services. The remainder of Cintas’ business, which consists primarily of Fire Protection Services and its Direct Sale business, is included in All Other. All prior fiscal year results presented in the table below have been recast to reflect these new operating segments. Cintas evaluates operating segment performance based on revenue and income before income taxes. Revenue and income before income taxes for each of these reportable operating segments for the years ended May 31, 2016, 2015 and 2014 are presented in Note 14 entitled Operating Segment Information. The Company regularly reviews its operating segments for reporting purposes based on the information its chief operating decision maker regularly reviews for purposes of allocating resources and assessing performance and makes changes when appropriate.
Prior to June 1, 2015, Cintas classified its business into the following
three
reportable operating segments: the Rental Uniforms and Ancillary Products operating segment consisted of the rental and servicing of uniforms and other garments including flame resistant clothing, mats, mops and shop towels and other ancillary items. In addition to these rental items, restroom cleaning services and supplies and carpet and tile cleaning services were also provided within this operating segment. The Uniform Direct Sales operating segment consisted of the direct sale of uniforms and related items. The First Aid and Safety and Fire Protection Services operating segment consisted of first aid and safety products and services, and fire protection products and services.
In fiscal 2014, Cintas completed its partnership transaction with the shareholders of Shred-it International Inc. to combine Cintas' shredding business (Shredding) with the shredding business of Shred-it International Inc. (the Shredding Transaction). Pursuant to the Shredding Transaction, the newly formed partnership (the Shred-it Partnership) was owned
42%
by Cintas and
58%
by the shareholders of Shred-it International Inc. Cintas' investment in the Shred-it Partnership (Shred-it) and the results of Shredding are classified as discontinued operations for all periods presented as a result of selling the investment during fiscal 2016. During fiscal 2015, Cintas sold the storage business (Storage) and, as a result, its operations are also classified as discontinued operations for all periods presented. Shredding and Storage were previously included in the former Document Management Services reportable operating segment. In accordance with the applicable accounting guidance for the disposal of long-lived assets and discontinued operations, the results of Shredding and Storage have been excluded from both continuing operations and operating segment results for all periods presented. Please see Note 16 entitled Discontinued Operations for additional information.
Principles of consolidation.
The consolidated financial statements include the accounts of Cintas controlled majority-owned subsidiaries and any entities over which Cintas has control. Intercompany balances and transactions have been eliminated as appropriate.
Financial statement presentation.
We have reclassified certain prior-year amounts to conform to the current year’s presentation.
Use of estimates.
The preparation of consolidated financial statements in conformity with U.S. GAAP requires management to make estimates and assumptions that affect the amounts reported in the consolidated financial statements and accompanying notes. Actual results could differ from those estimates.
36
Revenue recognition.
Rental revenue, which is recorded in the Uniform Rental and Facility Services reportable operating segment, is recognized when services are performed. Other revenue, which is recorded in the First Aid and Safety Services reportable operating segment and All Other, is recognized when either services are performed or when products are shipped and the title and risks of ownership pass to the customer.
Cost of uniform rental and facility services.
Cost of uniform rental and facility services consists primarily of production expenses, delivery expenses and the amortization of in service inventory, including uniforms, mats, shop towels and other ancillary items. The Uniform Rental and Facility Services reportable operating segment inbound freight charges, purchasing and receiving costs, inspection costs, warehousing costs and other costs of distribution are included in the cost of uniform rental and facility services.
Cost of other.
Cost of other consists primarily of cost of goods sold (predominantly first aid and safety products, uniforms and fire protection products), delivery expenses and distribution expenses in the First Aid and Safety Services reportable operating segment and All Other. Cost of other includes inbound freight charges, purchasing and receiving costs, inspection costs, warehousing costs and other costs of distribution.
Selling and administrative expenses.
Selling and administrative expenses consist primarily of sales labor and commissions, management and administrative labor, payroll taxes, medical expense, insurance expense, legal and professional costs and amortization of finite-lived intangible assets.
Cash and cash equivalents.
Cintas considers all highly liquid domestic investments with a maturity of three months or less, at date of purchase, to be cash equivalents. At May 31,
2016
and
2015
, cash and cash equivalents includes
$50.6 million
and
$43.0 million
, respectively, of restricted cash used as collateral associated with the general insurance program.
Marketable securities.
Marketable securities are typically comprised of fixed income securities and are classified as available-for-sale.
Accounts receivable.
Accounts receivable is comprised of amounts owed through product shipments and services provided and is presented net of an allowance for doubtful accounts. The allowance is an estimate based on historical rates of collections and allowances for specific accounts identified as uncollectible. The allowance that is an estimate based on Cintas' historical rates of collections is recorded for overdue amounts, beginning with a nominal percentage and increasing substantially as the account ages. The amount provided as the account ages will differ slightly between the Uniform Rental and Facility Services reportable operating segment, the First Aid and Safety Services reportable operating segment and All Other because of differences in customers served and the nature of each business. When an account is considered uncollectible, it is written off against the allowance for doubtful accounts.
Inventories.
Inventories are valued at the lower of cost (first-in, first-out) or market. Cintas applies a commonly accepted practice of using inventory turns to apply variances between actual and standard costs to the inventory balances. The judgments and estimates used to calculate inventory turns will have an impact on the valuation of inventories at the lower of cost or market. Inventory is comprised of the following amounts:
|
(In thousands)
|
2016
|
2015
|
|||||
|
Raw materials
|
$
|
17,794
|
|
$
|
16,935
|
|
|
|
Work in process
|
14,731
|
|
17,079
|
|
|||
|
Finished goods
|
216,837
|
|
192,197
|
|
|||
|
$
|
249,362
|
|
$
|
226,211
|
|
||
Inventories are recorded net of reserves for obsolete inventory of $
32.9 million
and $
30.7 million
at
May 31, 2016
and
2015
, respectively. The inventory obsolescence reserve is determined by specific identification, as well as an estimate based on Cintas' historical rates of obsolescence.
Uniforms and other rental items in service.
These items are valued at cost less amortization, calculated using the straight-line method. Uniforms in service (other than cleanroom and flame resistant clothing) are amortized over their useful life of
18
months. Other rental items, including shop towels, mats, mops, cleanroom garments, flame resistant clothing, linens and restroom dispensers, are amortized over their useful lives, which range from
8
to
60
months. The amortization rates used are based on industry experience, Cintas' specific experience and wear tests performed by Cintas. These factors are critical to determining the amount of in service inventory and related cost of uniforms and ancillary products that are presented in the consolidated financial statements.
37
Property and equipment.
Property and equipment is stated at cost, less accumulated depreciation. Depreciation is calculated using the straight-line method primarily over the following estimated useful lives of the assets based on industry and Cintas specific experience, in years:
|
Buildings
|
30 to 40
|
|
Building improvements
|
5 to 20
|
|
Equipment
|
3 to 10
|
|
Leasehold improvements
|
2 to 15
|
Investments.
Investments consists primarily of the cash surrender value of life insurance policies and equity method investments. The equity method is used to account for an investment if our investment gives us the ability to exercise significant influence over the operating and financial policies of the investee. In general, equity method investments are initially measured at cost. However, an equity method investment resulting from a transaction in which a controlled group of assets that constitutes a business is deconsolidated is initially measured at fair value. Cintas recognizes its share of the investee’s earnings or losses in income. Cintas also adjusts its share of the investee's earnings for intra-entity transactions, basis differences, investee capital transactions and other comprehensive income through income or other comprehensive income as appropriate. Equity method investments are reviewed for impairment whenever events or changes in circumstances indicate that the carrying amount of the investment might not be recoverable.
Long-lived assets.
When events or circumstances indicate that the carrying amount of long-lived assets may not be recoverable, the estimated undiscounted future cash flows are compared to the carrying amount of the assets. If the estimated undiscounted future cash flows are less than the carrying amount of the assets, an impairment loss is recorded based on the excess of the carrying amount of the assets over their respective fair values. Fair value is generally determined by discounted cash flows or based on prices of similar assets, as appropriate. Cintas did not identify any indicators of impairment for the years ended May 21, 2016, 2015 and 2014.
Goodwill.
Goodwill, obtained through acquisitions of businesses, is valued at cost less any impairment. Cintas completes an annual impairment test, which may include an assessment of qualitative factors including, but not limited to, macroeconomic conditions, industry and market conditions, and entity specific factors such as strategies and financial performance. The test may also include the determination of the estimated fair value of Cintas' reporting units via comparisons to current market values, where available, and discounted cash flow analyses. Significant assumptions may include growth rates based on historical trends and margin improvement leveraged from such growth, as well as discount rates. We determine discount rates separately for each reporting unit using the weighted average cost of capital, which includes a calculation of cost of equity, which is developed using the capital asset pricing model and comparable company betas (a measure of systemic risk), and cost of debt. We also use comparable market earnings multiple data and our market capitalization to corroborate our reporting unit valuations. We test for goodwill impairment at the reporting unit level. As a result of Cintas’ operating segment realignment, the composition of Cintas’ reporting units for the evaluation of goodwill impairment has changed. Historically, Cintas’ reporting units were the same as the reportable operating segments, Rental Uniforms and Ancillary Products, Uniform Direct Sales and First Aid, Safety and Fire Protection Services. Effective June 1, 2015, Cintas identified
five
reporting units for purposes of evaluating goodwill impairment, Uniform Rental and Facility Services, First Aid and Safety Services, and
three
reporting units within All Other. As a result of the change in reporting units, Cintas was required to perform an interim impairment test on goodwill at June 1, 2015. Based on the results of this test and the annual impairment tests, Cintas was not required to recognize an impairment of goodwill for the fiscal years ended
May 31, 2016
,
2015
or
2014
. Cintas will continue to perform impairment tests as of March 1 in future years and when indicators of impairment exist.
Service contracts and other assets.
Service contracts and other assets, which consist primarily of noncompete and consulting agreements obtained through acquisitions of businesses, are amortized by use of the straight-line method over the estimated lives of the agreements, which are generally
5
to
10
years. Certain noncompete agreements, as well as all service contracts, require that a valuation be determined using a discounted cash flow model. The assumptions and judgments used in these models involve estimates of cash flows and discount rates, among other factors. Because of the assumptions used to value these intangible assets, actual results over time could vary from original estimates. Impairment of service contracts and other assets is accomplished through specific identification. No impairment has been recognized by Cintas for the fiscal years ended
May 31, 2016
,
2015
or
2014
.
Accrued liabilities.
Current accrued liabilities are recorded when it is probable that a liability has occurred and the amount of the liability can be reasonably estimated. Current accrued liabilities include the following amounts:
38
|
(In thousands)
|
2016
|
2015
|
|||||
|
General insurance liabilities
|
$
|
128,759
|
|
$
|
113,714
|
|
|
|
Employee benefit related liabilities
|
75,587
|
|
68,907
|
|
|||
|
Taxes and related liabilities
|
5,783
|
|
6,064
|
|
|||
|
Accrued interest
|
26,682
|
|
26,628
|
|
|||
|
Other
|
112,254
|
|
94,622
|
|
|||
|
$
|
349,065
|
|
$
|
309,935
|
|
||
General insurance liabilities represent the estimated ultimate cost of all asserted and unasserted claims incurred, primarily related to worker's compensation, auto liability and other general liability exposure through the consolidated balance sheet dates. Our reserves are estimated through actuarial procedures of the insurance industry and by using industry assumptions, adjusted for specific expectations based on our claims history. Cintas records an increase or decrease in selling and administrative expenses related to development of prior claims, higher claims activity and other environmental factors in the period in which it becomes known. These changes in estimates may be material to the consolidated financial statements.
Long-term accrued liabilities consists primarily of reserves associated with unrecognized tax benefits, which are described in more detail in Note 8 entitled Income Taxes, and retirement obligations, which are described in more detail in Note 10 entitled Defined Contribution Plans.
Stock-based compensation.
Compensation expense is recognized for all share-based payments to employees, including stock options and restricted stock awards, in the consolidated statements of income based on the fair value of the awards that are granted. The fair value of stock options is estimated at the date of grant using the Black-Scholes option-pricing model. Measured compensation cost, net of estimated forfeitures, is recognized on a straight-line basis over the vesting period of the related share-based compensation award.
Derivatives and hedging activities.
Cintas formally documents all relationships between hedging instruments and hedged items, as well as its risk management objective and strategy for undertaking various hedge transactions. Derivatives are recorded at fair value on the consolidated balance sheet, and gains and losses are recorded as adjustments to income or other comprehensive income, as appropriate.
Income taxes.
Deferred tax assets and liabilities are determined by the differences between the consolidated financial statement carrying amounts and the tax basis of assets and liabilities. See Note 8 entitled Income Taxes for the types of items that give rise to significant deferred income tax assets and liabilities. Deferred income taxes are classified as assets or liabilities based on the classification of the related asset or liability for financial reporting purposes. Cintas regularly reviews deferred tax assets for recoverability based upon projected future taxable income and the expected timing of the reversals of existing temporary differences. Although realization is not assured, management believes it is more likely than not that the recorded deferred tax assets, as adjusted for valuation allowances, will be realized.
Accounting for uncertain tax positions requires the determination of whether tax benefits claimed or expected to be claimed on a tax return should be recorded in the consolidated financial statements. Companies may recognize the tax benefit from an uncertain tax position only if it is more likely than not that the tax position will be sustained on examination by the taxing authorities, based on the technical merits of the position. The tax benefits recognized in the consolidated financial statements from such a position should be measured based on the largest benefit that has a greater than fifty percent likelihood of being realized upon ultimate settlement.
Cintas is periodically reviewed by domestic and foreign tax authorities regarding the amount of taxes due. These reviews include questions regarding the timing and amount of deductions and the allocation of income among various tax jurisdictions. In evaluating the exposure associated with various filing positions, Cintas records reserves as deemed appropriate. Based on Cintas' evaluation of current tax positions, Cintas believes its tax related accruals are appropriate.
Litigation and other contingencies.
Cintas is subject to legal proceedings and claims arising from the ordinary course of its business, including personal injury, customer contract, environmental and employment claims. GAAP requires that a liability for contingencies be recorded when it is probable that a liability has occurred and the amount of the liability can be reasonably estimated. In the opinion of management, the aggregate liability, if any, with respect to such ordinary course of business actions will not have a material adverse effect on the consolidated financial position or consolidated results of operations of Cintas.
39
Fair value measurements.
Financial Accounting Standards Board (FASB) Accounting Standard Codification (ASC) Topic 820 defines fair value as the exchange price that would be received for an asset or paid to transfer a liability (an exit price) in the principal or most advantageous market for the asset or liability in an orderly transaction between market participants at the measurement date. When determining the fair value measurements for assets and liabilities, the Company considers the principal or most advantageous market in which the Company would transact and the market-based risk measurements or assumptions that market participants would use in pricing the asset or liability, such as inherent risk, transfer restrictions and credit risk. It also establishes a three-level fair value hierarchy that prioritizes the inputs used to measure fair value. This hierarchy requires entities to maximize the use of observable inputs and minimize the use of unobservable inputs. The three levels of inputs used to measure fair value are as follows:
|
|
Level 1 —
|
Quoted prices in active markets for identical assets or liabilities.
|
|
|
Level 2 —
|
Observable inputs other than quoted prices included in Level 1, such as quoted prices for similar assets and liabilities in active markets; quoted prices for identical or similar assets and liabilities in markets that are not active; or other inputs that are observable or can be corroborated by observable market data.
|
|
|
Level 3 —
|
Unobservable inputs that are supported by little or no market activity and that are significant to the fair value of the assets or liabilities. This includes certain pricing models, discounted cash flow methodologies and similar techniques that use significant unobservable inputs.
|
In instances where the determination of the fair value measurement is based on inputs from different levels of the fair value hierarchy, the level in the fair value hierarchy within which the entire fair value measurement falls is based on the lowest level input that is significant to the fair value measurement in its entirety. Cintas' assessment of the significance of a particular input to the fair value measurement in its entirety requires judgment and considers factors specific to the asset or liability.
In order to meet the requirements of ASC 820, Cintas utilizes two basic valuation approaches to determine the fair value of its assets and liabilities required to be recorded on a recurring basis at fair value. The first approach is the cost approach. The cost approach is generally the value a market participant would expect to replace the respective asset or liability. The second approach is the market approach. The market approach looks at what a market participant would consider valuing an exact or similar asset or liability to that of Cintas, including those traded on exchanges.
Cintas' non-financial assets and liabilities not permitted or required to be measured at fair value on a recurring basis primarily relate to assets and liabilities acquired in a business acquisition unless otherwise noted in Note 2 entitled Fair Value Disclosures. Cintas is required to provide additional disclosures about fair value measurements as part of the consolidated financial statements for each major category of assets and liabilities measured at fair value on a non-recurring basis (including business acquisitions). Based on the nature of Cintas' business acquisitions, which occur regularly throughout the fiscal year, the majority of the assets acquired and liabilities assumed consist of working capital, primarily valued using Level 2 inputs, property and equipment, also primarily valued using Level 2 inputs and goodwill and other identified intangible assets valued using Level 3 inputs. In general, non-recurring fair values determined by Level 1 inputs utilize quoted prices (unadjusted) in active markets for identical assets or liabilities, which generally are not applicable to non-financial assets and liabilities. Fair values determined by Level 2 inputs utilize data points that are observable, such as definitive sales agreements, appraisals or established market values of comparable assets. Fair values determined by Level 3 inputs are unobservable data points for the asset or liability and include situations where there is little, if any, market activity for the asset or liability, such as internal estimates of future cash flows and company specific discount rates.
New accounting pronouncements.
In February 2013, the FASB issued Accounting Standards Update (ASU) 2013-02, "Comprehensive Income (Topic 220): Reporting of Amounts Reclassified Out of Accumulated Other Comprehensive Income." ASU 2013-02 requires an entity to present (either on the face of the statement where net income is presented or in the notes) the effects on the line items of net income of significant amounts reclassified out of accumulated other comprehensive income if the item reclassified is required under GAAP to be reclassified to net income in its entirety in the same reporting period. For reclassification items not required under GAAP to be reclassified directly to net income in their entirety in the same reporting period, an entity is required to cross-reference to other disclosures currently required under GAAP that provide additional detail about those amounts. The Company adopted ASU 2013-02 effective June 1, 2013. See Note 13 entitled Accumulated Other Comprehensive Income (Loss) for details of required disclosure.
40
In April 2014, the FASB issued ASU 2014-08, “Reporting Discontinued Operations and Disclosures of Disposals of Components of an Entity,” which amended accounting guidance related to the reporting of discontinued operations and disclosures of disposals of components of an entity. The amended guidance changes the thresholds for disposals to qualify as discontinued operations and requires additional disclosures. This guidance is effective for reporting periods beginning after December 15, 2014 and is required to be applied prospectively. Cintas adopted ASU 2014-08 during the quarter ended August 31, 2015 and applied the amended accounting guidance to Shred-it and will apply it to future transactions, as appropriate.
In May 2014, the FASB issued ASU 2014-09, "Revenue from Contracts with Customers (Topic 606)," to clarify revenue recognition principles. This guidance is intended to improve disclosure requirements and enhance the comparability of revenue recognition practices. Improved disclosures under the amended guidance relate to the nature, amount, timing and uncertainty of revenue that is recognized from contracts with customers. This guidance will be effective for reporting periods beginning after December 15, 2017 and will be required to be applied retrospectively. Early application of the amendments in this update is not permitted. Cintas is currently evaluating the impact that ASU 2014-09 will have on its consolidated financial statements.
In April 2015, the FASB issued ASU 2015-17, “Balance Sheet Classifications of Deferred Taxes,” which amended accounting guidance related to the presentation of deferred tax liabilities and assets. The amended guidance requires that all deferred tax liabilities and assets be classified as noncurrent on the balance sheet. This guidance is effective for reporting periods beginning after December 15, 2016; however, early adoption is permitted. This guidance can also be applied either prospectively to all deferred tax liabilities and assets or retrospectively to all periods presented. Cintas adopted ASU 2015-17 during the quarter ended November 30, 2015 and has applied this amended accounting guidance to its deferred tax liabilities and assets for all periods presented. The impact of this change in accounting principle on balances previously reported as of May 31, 2015 was a reclassification of
$112.4 million
from current liabilities to long term liabilities.
In February 2016, the FASB issued ASU 2016-02, “Leases (Topic 842),” which sets out the principles for the recognition, measurement, presentation and disclosure of leases for both parties to a contract (i.e. lessees and lessors). The new standard requires lessees to apply a dual approach, classifying leases as either finance or operating leases based on the principle of whether or not the lease is effectively a financed purchase by the lessee. This classification will determine whether lease expense is recognized based on an effective interest method or on a straight line basis over the term of the lease, respectively. A lessee is also required to record a right-of-use asset and a lease liability for all leases with a term of greater than 12 months regardless of their classification. Leases with a term of 12 months or less will be accounted for similar to existing guidance for operating leases today. Topic 842 supersedes the previous leases standard, ASC 840, Leases.This guidance is effective for reporting periods beginning after December 15, 2018; however, early adoption is permitted. Entities are required to use a modified retrospective approach for leases that exist or are entered into after the beginning of the earliest comparative period in the financial statements. Cintas is currently evaluating the impact that ASU 2016-02 will have on its consolidated financial statements.
In March 2016, the FASB issued ASU 2016-09, "Improvements to Employee Share-Based Payment Accounting." ASU 2016-09 is intended to simplify accounting for share-based payments. Upon adoption, ASU 2016-09 will require that excess tax benefits for share-based payments be recorded as a reduction of income tax expense and reflected within operating cash flows rather than being recorded within equity and reflected within financing cash flows. The standard also permits the repurchase of more of an employee’s shares for tax withholding purposes without triggering liability accounting, clarifies that all cash payments made on an employee’s behalf for withheld shares should be presented as a financing activity on our cash flows statement, and provides an accounting policy election to account for forfeitures as they occur. This update is effective for interim and annual periods beginning after December 15, 2016; however, early adoption is permitted. The Company is currently assessing the effect that adoption of ASU 2016-09 will have on its consolidated financial statements.
No other new accounting pronouncement recently issued or newly effective had or is expected to have a material impact on the Consolidated Financial Statements.
41
2. Fair Value Disclosures
All financial instruments that are measured at fair value on a recurring basis (at least annually) have been segregated into the most appropriate level within the fair value hierarchy based on the inputs used to determine the fair value at the consolidated balance sheet date. These financial instruments measured at fair value on a recurring basis are summarized below:
|
As of May 31, 2016
|
|||||||||||||||
|
(In thousands)
|
Level 1
|
Level 2
|
Level 3
|
Fair Value
|
|||||||||||
|
Cash and cash equivalents
|
$
|
139,357
|
|
$
|
—
|
|
$
|
—
|
|
$
|
139,357
|
|
|||
|
Marketable securities:
|
|||||||||||||||
|
Canadian treasury securities
|
—
|
|
70,405
|
|
—
|
|
70,405
|
|
|||||||
|
Total assets at fair value
|
$
|
139,357
|
|
$
|
70,405
|
|
$
|
—
|
|
$
|
209,762
|
|
|||
|
Long term accrued liabilities:
|
|||||||||||||||
|
Interest rate lock agreement
|
$
|
—
|
|
$
|
19,628
|
|
$
|
—
|
|
$
|
19,628
|
|
|||
|
Total liabilities at fair value
|
$
|
—
|
|
$
|
19,628
|
|
$
|
—
|
|
$
|
19,628
|
|
|||
|
As of May 31, 2015
|
|||||||||||||||
|
(In thousands)
|
Level 1
|
Level 2
|
Level 3
|
Fair Value
|
|||||||||||
|
Cash and cash equivalents
|
$
|
417,073
|
|
$
|
—
|
|
$
|
—
|
|
$
|
417,073
|
|
|||
|
Marketable securities:
|
|||||||||||||||
|
Canadian treasury securities
|
—
|
|
16,081
|
|
—
|
|
16,081
|
|
|||||||
|
Total assets at fair value
|
$
|
417,073
|
|
$
|
16,081
|
|
$
|
—
|
|
$
|
433,154
|
|
|||
Cintas' cash and cash equivalents and marketable securities are generally classified within Level 1 or Level 2 of the fair value hierarchy. Financial instruments classified as Level 1 are based on quoted market prices in active markets, and financial instruments classified as Level 2 are based on quoted market prices, broker or dealer quotations or alternative pricing sources with reasonable levels of price transparency. The types of financial instruments Cintas classifies within Level 1 include most bank deposits and money market securities. Cintas does not adjust the quoted market price for such financial instruments.
The types of financial instruments Cintas classifies within Level 2 are primarily high grade domestic commercial paper and Canadian treasury securities (federal). The valuation technique used for Cintas’ marketable securities classified within Level 2 of the fair value hierarchy is primarily the market approach. The primary inputs to value Cintas’ marketable securities is the respective instrument's future cash flows based on its stated yield and the amount a market participant would pay for a similar instrument. Primarily all of Cintas’ marketable securities are actively traded and the recorded fair value reflects current market conditions. However, due to the inherent volatility in the investment market, there is at least a possibility that recorded investment values may change in the near term.
The funds invested in Canadian treasury securities are not presently expected to be repatriated, but instead are expected to be invested indefinitely in foreign subsidiaries. Interest, realized gains and losses and declines in value determined to be other than temporary on available-for-sale securities are included in interest income or expense. The cost of the securities sold is based on the specific identification method. The amortized cost basis of marketable securities as of
May 31, 2016
and
2015
was
$70.4 million
and
$16.1 million
, respectively. Purchases of marketable securities were $
488.8 million
, $
179.2 million
and $
48.5 million
for the fiscal years ended
May 31, 2016
,
2015
and
2014
, respectively. All outstanding marketable securities as of
May 31, 2016
and
2015
had contractual maturities due within
one
year.
As of May 31, 2016, long-term accrued liabilities include interest rate lock agreements. The fair value of Cintas' interest rate lock agreements are based on similar exchange traded derivatives (market approach) and are, therefore, included within Level 2 of the fair value hierarchy. All other amounts included in long-term liabilities are not recorded at fair value.
The methods described above may produce a fair value that may not be indicative of net realizable value or reflective of future fair values. Furthermore, while Cintas believes its valuation methods are appropriate and consistent with
42
other market participants, the use of different methodologies or assumptions to determine the fair value of certain financial instruments could result in a different estimate of fair value at the consolidated balance sheet date.
In addition to assets and liabilities that are recorded at fair value on a recurring basis, the Company records assets and liabilities at fair value on a nonrecurring basis as required under GAAP. The Company's acquisition of ZEE was recorded at fair value. See Note 9 entitled Acquisitions and Divestitures for additional information on the measurement of the ZEE assets acquired and liabilities assumed.
3. Property and Equipment
|
(In thousands)
|
2016
|
2015
|
|||||
|
Land
|
$
|
117,881
|
|
$
|
116,172
|
|
|
|
Buildings and improvements
|
509,316
|
|
501,742
|
|
|||
|
Equipment
|
1,584,478
|
|
1,446,041
|
|
|||
|
Leasehold improvements
|
28,530
|
|
26,023
|
|
|||
|
Construction in progress
|
173,367
|
|
104,300
|
|
|||
|
2,413,572
|
|
2,194,278
|
|
||||
|
Less: accumulated depreciation
|
1,419,335
|
|
1,322,857
|
|
|||
|
$
|
994,237
|
|
$
|
871,421
|
|
||
Interest expense is net of capitalized interest of
$1.1 million
and
$0.6 million
for the fiscal years ended
May 31, 2016
and
2015
, respectively. Interest was not capitalized during the fiscal year ended May 31, 2014.
4. Investments
Investments at
May 31, 2016
of
$125.0 million
include the cash surrender value of insurance policies of
$108.1 million
, equity method investments of
$14.5 million
and cost method investments of
$2.4 million
. Investments at
May 31, 2015
of
$329.7 million
include the cash surrender value of insurance policies of
$101.8 million
, equity method investments of
$225.7 million
and cost method investments of
$2.2 million
.
Shred-it is classified as discontinued operations for all periods presented as a result of selling the investment during fiscal 2016. As allowed under applicable accounting guidance, the May 31, 2015 consolidated balance sheet amounts for these assets and liabilities remain in their natural classifications. See Note 16 entitled Discontinued Operations for additional information.
During fiscal 2015, Cintas sold stock in an equity method investment. In conjunction with the sale of the equity method investment, Cintas also received a cash dividend of
$5.2 million
. Total cash received from the transaction was
$35.2 million
. The sale resulted in the recording of a gain, net of tax, of approximately
$13.6 million
in the fiscal year ended May 31, 2015. As a result, the Company no longer has the ability to exercise significant influence over the investee. Therefore, effective July 1, 2014, the remaining investment retained by Cintas is accounted for under the cost method.
Investments are evaluated for impairment on an annual basis or when indicators of impairment exist. For fiscal years
2016
,
2015
and
2014
,
no
losses due to impairment were recorded.
43
5. Goodwill, Service Contracts and Other Assets
In fiscal 2014, Storage was classified as discontinued operations. As a result, goodwill and service contracts related to this business, which were previously included in the former Document Management Services operating segment, are included within Corporate. Storage was sold in
three
separate transactions during fiscal 2014. See Note 16 entitled Discontinued Operations for more information.
Changes in the carrying amount of goodwill and service contracts for the fiscal year ended May 31,
2015
, by historical reportable operating segment, are as follows:
|
Goodwill
(in thousands)
|
Rental
Uniforms &
Ancillary
Products
|
Uniform
Direct
Sales
|
First Aid,
Safety &
Fire
Protection
|
Corporate
|
Total
|
||||||||||||||
|
Balance as of June 1, 2014
|
$
|
943,516
|
|
$
|
23,905
|
|
$
|
221,911
|
|
$
|
78,079
|
|
$
|
1,267,411
|
|
||||
|
Goodwill acquired
|
70
|
|
—
|
|
8,578
|
|
—
|
|
8,648
|
|
|||||||||
|
Goodwill divested in Storage Transactions
|
—
|
|
—
|
|
—
|
|
(75,660
|
)
|
(75,660
|
)
|
|||||||||
|
Foreign currency translation
|
(2,141
|
)
|
(227
|
)
|
—
|
|
(2,419
|
)
|
(4,787
|
)
|
|||||||||
|
Balance as of May 31, 2015
|
$
|
941,445
|
|
$
|
23,678
|
|
$
|
230,489
|
|
$
|
—
|
|
$
|
1,195,612
|
|
||||
|
Service Contracts
(in thousands)
|
Rental
Uniforms &
Ancillary
Products
|
Uniform
Direct
Sales
|
First Aid,
Safety &
Fire
Protection
|
Corporate
|
Total
|
||||||||||||||
|
Balance as of June 1, 2014
|
$
|
17,171
|
|
$
|
—
|
|
$
|
28,034
|
|
$
|
10,470
|
|
$
|
55,675
|
|
||||
|
Service contracts acquired
|
313
|
|
—
|
|
9,543
|
|
265
|
|
10,121
|
|
|||||||||
|
Service contracts divested in Storage Transactions
|
—
|
|
—
|
|
—
|
|
(9,570
|
)
|
(9,570
|
)
|
|||||||||
|
Service contracts amortization
|
(5,619
|
)
|
—
|
|
(7,005
|
)
|
(597
|
)
|
(13,221
|
)
|
|||||||||
|
Foreign currency translation
|
(3
|
)
|
—
|
|
—
|
|
(568
|
)
|
(571
|
)
|
|||||||||
|
Balance as of May 31, 2015
|
$
|
11,862
|
|
$
|
—
|
|
$
|
30,572
|
|
$
|
—
|
|
$
|
42,434
|
|
||||
Effective June 1, 2015, Cintas realigned its organizational structure and updated its reportable operating segments in light of certain changes in its business, including the acquisition of ZEE. Cintas’ updated reportable operating segments are Uniform Rental and Facility Services and First Aid and Safety Services. The remainder of Cintas’ business, which consists primarily of Fire Protection Services and its Direct Sale business, are included in All Other. For additional information regarding Cintas’ realignment and reportable operating segment determination, see Note 14 entitled Operating Segment Information.
As a result of Cintas’ operating segment realignment, the composition of Cintas’ reporting units for the evaluation of goodwill impairment also changed. Historically, Cintas’ reporting units were the same as the reportable operating segments, Rental Uniforms and Ancillary Products, Uniform Direct Sales and First Aid, Safety and Fire Protection Services. Effective June 1, 2015, Cintas identified
five
reporting units for purposes of evaluating goodwill impairment, which were Uniform Rental and Facility Services, First Aid and Safety Services, and
three
reporting units within All Other.
As the composition of the reporting units changed, the Company allocated historical goodwill to the new reporting units based on a relative fair value allocation approach. Fair value of each reporting unit was determined using a combination of the market approach and the income approach. Under the market approach, fair value is based on revenue and earnings multiples for guideline public companies in the reporting unit's peer group. Under the income approach, value is dependent on the present value of net cash flows to be derived from the ownership. The relative fair value allocation approach yielded the following allocation of total goodwill as of June 1, 2015: Uniform Rental and Facility Services reportable operating segment goodwill of
$943.9 million
, First Aid and Safety Services reportable operating segment goodwill of
$155.0 million
and All Other goodwill of
$96.7 million
.
44
The following table illustrates the changes in Goodwill as a result of the segment realignment:
|
Goodwill Allocation as of June 1, 2015
(in thousands)
|
Total
|
||
|
Uniform Rental and Facility Services
|
|||
|
Rental Uniforms and Ancillary Products segment goodwill reassigned
|
$
|
929.4
|
|
|
Uniform Direct Sales segment goodwill reassigned
|
14.5
|
|
|
|
$
|
943.9
|
|
|
|
First Aid and Safety Services
|
|||
|
First Aid, Safety and Fire Protection segment goodwill reassigned
|
$
|
155.0
|
|
|
All Other
|
|||
|
First Aid, Safety and Fire Protection segment goodwill reassigned
|
$
|
75.5
|
|
|
Rental Uniforms and Ancillary Products segment goodwill reassigned
|
12.0
|
|
|
|
Uniform Direct Sales segment goodwill reassigned
|
9.2
|
|
|
|
$
|
96.7
|
|
|
As a result of the change in reporting units, Cintas was required to perform an interim impairment test on goodwill at June 1, 2015. There was no impairment recorded as a result of the interim impairment test.
Changes in the carrying amount of goodwill and service contracts for the fiscal year ended May 31, 2016, by reportable operating segment and All Other, are as follows:
|
Goodwill
(in thousands)
|
Uniform
Rental and
Facility
Services
|
First Aid
and
Safety
Services
|
All
Other
|
Total
|
|||||||||||
|
Balance at June 1, 2015
|
$
|
943,909
|
|
$
|
154,954
|
|
$
|
96,749
|
|
1,195,612
|
|
||||
|
Goodwill acquired
|
10,020
|
|
86,874
|
|
203
|
|
97,097
|
|
|||||||
|
Foreign currency translation
|
(713
|
)
|
(380
|
)
|
(23
|
)
|
(1,116
|
)
|
|||||||
|
Balance as of May 31, 2016
|
$
|
953,216
|
|
$
|
241,448
|
|
$
|
96,929
|
|
$
|
1,291,593
|
|
|||
|
Service Contracts
(in thousands)
|
Uniform
Rental and
Facility
Services
|
First Aid
and
Safety
Services
|
All
Other
|
Total
|
|||||||||||
|
Balance at June 1, 2015
|
$
|
6,677
|
|
$
|
1,576
|
|
$
|
34,181
|
|
$
|
42,434
|
|
|||
|
Service contracts acquired
|
18,912
|
|
34,052
|
|
2,730
|
|
55,694
|
|
|||||||
|
Service contracts amortization
|
(4,398
|
)
|
(3,355
|
)
|
(6,639
|
)
|
(14,392
|
)
|
|||||||
|
Foreign currency translation
|
—
|
|
(21
|
)
|
—
|
|
(21
|
)
|
|||||||
|
Balance as of May 31, 2016
|
$
|
21,191
|
|
$
|
32,252
|
|
$
|
30,272
|
|
$
|
83,715
|
|
|||
Information regarding Cintas' service contracts and other assets is as follows:
|
As of May 31, 2016
|
|||||||||||
|
(In thousands)
|
Carrying
Amount
|
Accumulated
Amortization
|
Net
|
||||||||
|
Service contracts
|
$
|
395,482
|
|
$
|
311,767
|
|
$
|
83,715
|
|
||
|
Noncompete and consulting agreements
|
$
|
42,378
|
|
$
|
40,928
|
|
$
|
1,450
|
|
||
|
Other
|
27,943
|
|
9,532
|
|
18,411
|
|
|||||
|
Total
|
$
|
70,321
|
|
$
|
50,460
|
|
$
|
19,861
|
|
||
45
|
As of May 31, 2015
|
|||||||||||
|
(In thousands)
|
Carrying
Amount
|
Accumulated
Amortization
|
Net
|
||||||||
|
Service contracts
|
$
|
340,816
|
|
$
|
298,382
|
|
$
|
42,434
|
|
||
|
Noncompete and consulting agreements
|
$
|
41,828
|
|
$
|
40,379
|
|
$
|
1,449
|
|
||
|
Other
|
23,595
|
|
7,550
|
|
16,045
|
|
|||||
|
Total
|
$
|
65,423
|
|
$
|
47,929
|
|
$
|
17,494
|
|
||
Amortization expense for continuing operations was $
15.6 million
, $
13.7 million
and $
15.2 million
for the fiscal years ended
May 31, 2016
,
2015
and
2014
, respectively. Estimated amortization expense for continuing operations, excluding any future acquisitions, for each of the next five years is $
13.8
million, $
12.3
million, $
11.7
million, $
11.3
million and $
9.4
million, respectively.
|
(In thousands)
|
2016
|
2015
|
|||||
|
Unsecured term notes due through 2036 at an average rate of 4.6%
|
$
|
1,300,000
|
|
$
|
1,300,000
|
|
|
|
Less: amounts due within one year
|
250,000
|
|
—
|
|
|||
|
$
|
1,050,000
|
|
$
|
1,300,000
|
|
||
Cintas' senior notes are recorded at cost. The fair value of the senior notes is estimated using Level 2 inputs based on general market prices. The carrying value and fair value of Cintas' long-term debt as of
May 31, 2016
were $
1,300.0 million
and $
1,416.6 million
, respectively, and as of
May 31, 2015
were $
1,300.0 million
and $
1,418.6 million
, respectively.
Letters of credit outstanding were $
83.4 million
and $
82.7 million
at
May 31, 2016
and
2015
, respectively. Maturities of long-term debt during each of the next five years are
$250.0 million
, $
300.0 million
,
$0
,
$0
and
$0
, respectively.
Interest paid was $
64.5 million
, $
65.3 million
and $
65.9 million
for the fiscal years ended
May 31, 2016
,
2015
and
2014
, respectively.
Cintas' commercial paper program has a capacity of
$300.0 million
at May 31, 2016, that is fully supported by a backup revolving credit facility through a credit agreement with its banking group. This revolving credit facility has an accordion feature that allows for a maximum borrowing capacity of
$450.0 million
. The revolving credit facility was amended on May 29, 2014, to extend the maturity date from October 6, 2016 to May 28, 2019, and to adjust the applicable margin used to calculate the interest payable on any outstanding loans and the facility fee payable under the agreement. On June 23, 2016, the revolving credit facility was amended to extend the maturity date from May 28, 2019 to June 22, 2021, increase the capacity to
$450.0 million
, and add an accordion feature that allows for a maximum borrowing capacity of
$600.0 million
.
No
commercial paper or borrowings on our revolving credit facility were outstanding at
May 31, 2016
or
2015
. On June 1, 2016, Cintas paid the
$250.0 million
5
-year senior notes that matured on that date with cash and
$218.5 million
proceeds from the issuance of commercial paper.
Cintas used interest rate lock agreements to hedge against movements in the treasury rates at the time Cintas issued its senior notes in fiscal 2007, fiscal 2008, fiscal 2011 and fiscal 2013. The amortization of the cash flow hedges resulted in an increase to other comprehensive income of $
2.0 million
in each of the fiscal years ended
May 31, 2016
,
2015
and
2014
. During the third quarter of fiscal 2016, Cintas entered into an interest rate lock agreement with a notional value of
$550.0 million
for a forecasted debt issuance. As of
May 31, 2016
, the fair value of this treasury lock was
$19.6 million
and is recorded in long-term liabilities and other comprehensive income, net of tax. The interest rate lock had no impact on net income or cash flows from continuing operations for fiscal 2016.
To hedge the exposure of movements in the foreign currency rates, Cintas may use foreign currency hedges. These hedges reduce the impact on cash flows from movements in the foreign currency exchange rates. Examples of foreign currency hedge instruments that Cintas may use are average rate options and forward contracts. These instruments did not impact foreign currency exchange during fiscal
2016
,
2015
or
2014
. Cintas had no foreign currency forward contracts as of
May 31, 2016
or
2015
.
Cintas has certain covenants related to debt agreements. These covenants limit Cintas' ability to incur certain liens, to engage in sale-leaseback transactions and to merge, consolidate or sell all or substantially all of Cintas' assets.
46
These covenants also require Cintas to maintain certain debt to consolidated earnings before interest, taxes, depreciation and amortization (EBITDA) and interest coverage ratios. Cross-default provisions exist between certain debt instruments. Cintas was in compliance with all of the debt covenants for all periods presented. If a default of a significant covenant were to occur, the default could result in an acceleration of the maturity of the indebtedness, impair liquidity and limit the ability to raise future capital.
7. Leases
Cintas conducts certain operations from leased facilities and leases certain equipment. Most leases contain renewal options for periods from
1
to
10
years. The lease agreements provide for increases in rent expense if the options are exercised based on increases in certain price level factors or other prearranged factors. Step rent provisions, escalation clauses, capital improvements funding and other lease concessions are taken into account in computing minimum lease payments. Minimum lease payments are recognized on a straight-line basis over the minimum lease term. Lease payments are not dependent on an existing index or rate and are not included in minimum lease payments. It is anticipated that expiring leases will be renewed or replaced.
The minimum rental payments under noncancelable lease arrangements for each of the next five years and thereafter are $
30.5 million
, $
26.8 million
, $
20.8 million
, $
16.5 million
, $
12.5 million
and $
26.9 million
, respectively.
Rent expense for continuing operations under operating leases during the fiscal years ended
May 31, 2016
,
2015
and
2014
, was $
41.5 million
, $
34.9 million
and $
32.3 million
, respectively.
8. Income Taxes
|
(In thousands)
|
2016
|
2015
|
2014
|
||||||||
|
Income before income taxes for continuing operations consists of the following components:
|
|
|
|
||||||||
|
U.S. operations
|
$
|
697,974
|
|
$
|
635,270
|
|
$
|
519,386
|
|
||
|
Foreign operations
|
20,148
|
|
18,054
|
|
17,741
|
|
|||||
|
$
|
718,122
|
|
$
|
653,324
|
|
$
|
537,127
|
|
|||
|
(In thousands)
|
2016
|
2015
|
2014
|
||||||||
|
Income tax expense for continuing operations consists of the following components:
|
|
|
|
||||||||
|
Current:
|
|
|
|
||||||||
|
Federal
|
$
|
284,046
|
|
$
|
203,202
|
|
$
|
139,102
|
|
||
|
State and local
|
25,926
|
|
25,346
|
|
18,286
|
|
|||||
|
309,972
|
|
228,548
|
|
157,388
|
|
||||||
|
Deferred
|
(48,791
|
)
|
14,255
|
|
41,967
|
|
|||||
|
$
|
261,181
|
|
$
|
242,803
|
|
$
|
199,355
|
|
|||
|
(In thousands)
|
2016
|
2015
|
2014
|
||||||||
|
Reconciliation of income tax expense for continuing operations using the statutory rate and actual income tax expense is as follows:
|
|
|
|
||||||||
|
Income taxes at the U.S. federal statutory rate
|
$
|
251,352
|
|
$
|
228,727
|
|
$
|
187,375
|
|
||
|
State and local income taxes, net of federal benefit
|
16,672
|
|
16,705
|
|
17,934
|
|
|||||
|
Other
|
(6,843
|
)
|
(2,629
|
)
|
(5,954
|
)
|
|||||
|
$
|
261,181
|
|
$
|
242,803
|
|
$
|
199,355
|
|
|||
47
The components of deferred income taxes included on the consolidated balance sheets are as follows:
|
(In thousands)
|
2016
|
2015
|
|||||
|
Deferred tax assets:
|
|
|
|||||
|
Allowance for doubtful accounts
|
$
|
7,416
|
|
$
|
4,857
|
|
|
|
Inventory obsolescence
|
13,702
|
|
12,266
|
|
|||
|
Insurance and contingencies
|
42,717
|
|
38,522
|
|
|||
|
Stock-based compensation
|
45,720
|
|
29,910
|
|
|||
|
Foreign related carry-forwards
|
17,883
|
|
16,862
|
|
|||
|
Treasury locks
|
12,055
|
|
5,829
|
|
|||
|
Other
|
8,100
|
|
9,461
|
|
|||
|
147,593
|
|
117,707
|
|
||||
|
Valuation allowance
|
(17,047
|
)
|
(14,690
|
)
|
|||
|
130,546
|
|
103,017
|
|
||||
|
Deferred tax liabilities:
|
|
|
|||||
|
In service inventory
|
172,704
|
|
169,629
|
|
|||
|
Property
|
93,784
|
|
77,871
|
|
|||
|
Intangibles
|
104,585
|
|
84,218
|
|
|||
|
Investment in partnerships
|
2,563
|
|
86,098
|
|
|||
|
State taxes and other
|
16,385
|
|
24,528
|
|
|||
|
390,021
|
|
442,344
|
|
||||
|
Net deferred tax liability
|
$
|
259,475
|
|
$
|
339,327
|
|
|
Due to differences in accounting for the book and tax basis in Shred-it and other partnerships, a deferred tax liability was recorded. After the sale of Shred-it in fiscal 2016, the related deferred tax liability was reclassified to current taxes payable. See Note 16 entitled Discontinued Operations for additional information.
Although realization is not assured, management believes it is more likely than not that the recorded deferred tax assets, net of valuation allowances, will be realized.
The progression of the valuation allowance is as follows:
|
(In thousands)
|
2016
|
2015
|
|||||
|
Balance at beginning of year
|
$
|
(14,690
|
)
|
$
|
(13,358
|
)
|
|
|
Additions
|
(3,437
|
)
|
(2,433
|
)
|
|||
|
Subtractions
|
1,080
|
|
1,101
|
|
|||
|
Balance at end of year
|
$
|
(17,047
|
)
|
|
$
|
(14,690
|
)
|
Income taxes paid were $
452.6 million
, $
236.7 million
and $
172.5 million
for the fiscal years ended
May 31, 2016
,
2015
and
2014
, respectively.
Undistributed earnings of foreign subsidiaries were approximately $
117.2 million
, $
147.1 million
and $
172.7 million
as of
May 31, 2016
,
2015
and
2014
, respectively, for which deferred taxes have not been provided. Such earnings are considered to be permanently reinvested in Cintas' foreign subsidiaries. If such earnings were repatriated, additional tax expense may result. The current calculation of such additional taxes is not practicable.
As of
May 31, 2016
and
2015
, there was $
12.9 million
and $
11.9 million
, respectively, in total unrecognized tax benefits, which, if recognized, would favorably impact Cintas' effective tax rate. Cintas recognizes interest accrued related to unrecognized tax benefits and penalties in income tax expense in the consolidated statements of income, which is consistent with the recognition of these items in prior reporting periods. The total amount accrued for interest and penalties as of
May 31, 2016
and
2015
, was $
1.1 million
and $
0.9 million
, respectively. Cintas records this tax liability as current and long-term accrued liabilities on the consolidated balance sheets, as appropriate.
48
In the normal course of business, Cintas provides for uncertain tax positions and the related interest, and adjusts its unrecognized tax benefits and accrued interest accordingly. Unrecognized tax benefits increased
in fiscal
2016
and
2015
by
$
0.8 million
and $
1.4 million
, respectively, and decreased in fiscal
2014
by $
0.2 million
. Accrued interest increased
by
$0.2 million
in both fiscal
2016
and
2015
, and decreased by
$0.4 million
in fiscal
2014
.
A reconciliation of the beginning and ending amount of the gross unrecognized tax benefits (exclusive of interest and penalties) is as follows:
|
(In thousands)
|
|
||
|
|
|||
|
Balance at June 1, 2013
|
$
|
13,709
|
|
|
Additions for tax positions of prior years
|
2,586
|
|
|
|
Settlements
|
(1,270
|
)
|
|
|
Statute expirations
|
(1,963
|
)
|
|
|
Balance at May 31, 2014
|
$
|
13,062
|
|
|
Additions for tax positions of prior years
|
4,001
|
|
|
|
Settlements
|
(48
|
)
|
|
|
Statute expirations
|
(1,603
|
)
|
|
|
Balance at May 31, 2015
|
$
|
15,412
|
|
|
Additions for tax positions of prior years
|
3,259
|
|
|
|
Settlements
|
(48
|
)
|
|
|
Statute expirations
|
(2,092
|
)
|
|
|
Balance at May 31, 2016
|
$
|
16,531
|
|
On September 13, 2013, the U.S. Department of the Treasury and the Internal Revenue Service released final tangible property regulations under Sections 162(a) and 263(a) of the Internal Revenue Code regarding amounts paid to improve tangible property and acquire or produce tangible property, as well as proposed regulations regarding the disposition of property. The effective date of the final regulations was for Cintas' fiscal year ending May 31, 2015, and there was not a material impact on the consolidated financial statements for any period presented.
The majority of Cintas' operations are in North America. Cintas is required to file federal income tax returns, as well as state income tax returns in a majority of the domestic states and also in certain Canadian provinces. At times, Cintas is subject to audits in these jurisdictions. The audits, by nature, are sometimes complex and can require several years to resolve. The final resolution of any such tax audit could result in either a reduction in Cintas' accruals or an increase in its income tax provision, either of which could have an impact on the consolidated results of operation in any given period.
All U.S. federal income tax returns are closed to audit through fiscal 2011. Cintas is currently in advanced stages of various audits in certain foreign jurisdictions and certain domestic states. The years under foreign and domestic state audits cover fiscal years back to 2009. Based on the resolution of the various audits and other potential regulatory developments, it is reasonably possible that the balance of unrecognized tax benefits will decrease by
$3.1 million
for the fiscal year ending
May 31, 2017
.
49
9. Acquisitions and Divestitures
Acquisitions
The purchase price paid for each acquisition has been allocated to the fair value of the assets acquired and liabilities assumed. During fiscal
2016
, Cintas acquired
two
businesses included in the Uniform Rental and Facility Services reportable operating segment,
two
businesses included in the First Aid and Safety Services reportable operating segment and
six
businesses included in All Other. During fiscal
2015
, Cintas acquired
one
business included in the Uniform Rental and Facility Services reportable operating segment,
three
businesses included in the First Aid and Safety Services reportable operating segment and
eight
businesses included in All Other.
The following summarizes the aggregate purchase price and fair value allocations for all businesses acquired:
|
(In thousands)
|
2016
|
2015
|
|||||
|
Fair value of tangible assets acquired
|
$
|
26,759
|
|
$
|
177
|
|
|
|
Fair value of service contracts acquired
|
55,694
|
|
9,856
|
|
|||
|
Fair value of other intangibles acquired
|
4,639
|
|
945
|
|
|||
|
Net goodwill recognized
|
97,097
|
|
8,648
|
|
|||
|
Total fair value of assets acquired
|
184,189
|
|
19,626
|
|
|||
|
Fair value of liabilities assumed and incurred
|
27,610
|
|
4,131
|
|
|||
|
Total cash paid for acquisitions
|
$
|
156,579
|
|
$
|
15,495
|
|
|
On August 1, 2015, the Company acquired all of the shares of ZEE for acquisition-date fair value consideration of
$134.0 million
, consisting of cash of
$120.6 million
and contingent consideration, subject to certain holdback provisions of
$13.4 million
. ZEE operates within the First Aid and Safety Services reportable operating segment. This acquisition has expanded our footprint in van delivered first aid, safety, training and emergency products and will allow us to serve an even greater number of customers in North America.
The table below summarizes the preliminary purchase price allocation of ZEE as determined by management with the assistance of third-party valuation specialists. Goodwill is calculated as the excess of the consideration transferred over the net assets recognized and represents the estimated future economic benefits arising from other assets acquired that could not be individually identified and separately recognized. None of the goodwill is deductible for income tax purposes. The assets acquired and liabilities assumed are valued at the estimated fair value at the acquisition date as required by GAAP.
|
Assets:
|
|||
|
Cash and cash equivalents
|
$
|
333
|
|
|
Accounts receivable
|
16,705
|
|
|
|
Inventory
|
5,987
|
|
|
|
Other current assets
|
1,443
|
|
|
|
Property, plant and equipment
|
849
|
|
|
|
Goodwill
|
86,392
|
|
|
|
Service contracts
|
34,000
|
|
|
|
Other intagibles
|
4,500
|
|
|
|
Liabilities:
|
|||
|
Accounts payable
|
(7,195
|
)
|
|
|
Accrued liabilities
|
(4,428
|
)
|
|
|
Deferred income taxes
|
(4,586
|
)
|
|
|
Total consideration
|
$
|
134,000
|
|
The estimated useful life of the acquired service contracts is
10
years.
Cintas is required to provide additional disclosures about fair value measurements as part of the consolidated financial statements for each major category of assets and liabilities measured at fair value on a nonrecurring basis (including business acquisitions). The working capital assets and liabilities, as well as the property and equipment acquired, were
50
valued using Level 2 inputs which included data points that are observable, such as definitive sales agreements, appraisals or established market values of comparable assets (market approach). Goodwill, service contracts and other intangibles were valued using Level 3 inputs, which are unobservable by nature, and included internal estimates of future cash flow using a discount rate of
11%
(income approach). The results of operations of ZEE are not material to the consolidated financial statements.
The results of operations for the acquired businesses are included in the consolidated statements of income from the dates of acquisition. The proforma revenue, net income and earnings per share information relating to acquired businesses are not presented because they are not significant to Cintas.
Divestitures
In fiscal 2014, Cintas completed the Shredding Transaction with Shred-it International, Inc. to combine Cintas’ Shredding with Shred-it International Inc.’s shredding business and created the Shred-it Partnership. In fiscal 2016, Cintas sold Shred-it. In fiscal 2015, Cintas sold Storage. Storage, excluding related real estate owned by Cintas, was sold in
three
separate transactions to
three
separate buyers. In fiscal 2016, Cintas sold the remaining Storage assets classified as held for sale. Both Shredding and Storage were previously included in the former Document Management Services operating segment. As a result of the transactions noted above, the results from Shredding, Shred-it and Storage are reported under discontinued operations for all periods presented and are excluded from continuing operations and from operating segment results for all periods presented. See Note 16 entitled Discontinued Operations for additional information.
10. Defined Contribution Plans
Cintas' Partners' Plan (the Plan) is a non-contributory profit sharing plan and Employee Stock Ownership Plan (ESOP) for the benefit of substantially all U.S. Cintas employee-partners who have completed
one
year of service. The Plan also includes a 401(k) savings feature covering substantially all U.S. employee-partners. The amounts of contributions to the Plan and ESOP, as well as the matching contribution to the 401(k), are made at the discretion of the Board of Directors. Total contributions, including Cintas' matching contributions, which approximate cost, were $
43.1 million
, $
38.4 million
and $
33.7 million
for the fiscal years ended
May 31, 2016
,
2015
and
2014
, respectively.
Cintas has a non-contributory deferred profit sharing plan (DPSP), which covers substantially all Canadian employee-partners. In addition, a registered retirement savings plan (RRSP) is offered to those employees. The amounts of contributions to the DPSP, as well as the matching contribution to the RRSP, are made at the discretion of the Board of Directors. Total contributions, which approximate cost, were $
1.6 million
, $
1.5 million
and $
1.6 million
for the fiscal years ended
May 31, 2016
,
2015
and
2014
, respectively.
Cintas has a supplemental executive retirement plan (SERP) subject to Section 409A of the Internal Revenue Code for the benefit of certain highly compensated Cintas employee-partners. The SERP allows participants to defer the receipt of compensation which would otherwise become payable to them. Matching contributions are made at the discretion of the Board of Directors. Total matching contributions were $
6.6 million
, $
6.1 million
and $
6.0 million
for the fiscal years ended
May 31, 2016
,
2015
and
2014
, respectively.
51
11. Earnings per Share
The following table sets forth the computation of basic and diluted earnings per share from continuing operations using the two-class method for amounts attributable to Cintas' common shares:
|
(In thousands except per share data)
|
2016
|
2015
|
2014
|
||||||||
|
Basic Earnings per Share from Continuing Operations
|
|
|
|
||||||||
|
Income from continuing operations
|
$
|
456,941
|
|
$
|
410,521
|
|
$
|
337,772
|
|
||
|
Less: income from continuing operations allocated to
participating securities
|
7,405
|
|
3,900
|
|
3,082
|
|
|||||
|
Income from continuing operations available to common shareholders
|
$
|
449,536
|
|
$
|
406,621
|
|
$
|
334,690
|
|
||
|
Basic weighted average common shares outstanding
|
108,221
|
|
115,900
|
|
120,377
|
|
|||||
|
Basic earnings per share from continuing operations
|
$
|
4.15
|
|
$
|
3.51
|
|
$
|
2.78
|
|
||
|
(In thousands except per share data)
|
2016
|
2015
|
2014
|
||||||||
|
Diluted Earnings per Share from Continuing Operations
|
|
|
|
||||||||
|
Income from continuing operations
|
$
|
456,941
|
|
$
|
410,521
|
|
$
|
337,772
|
|
||
|
Less: income from continuing operations allocated to
participating securities
|
7,405
|
|
3,900
|
|
3,082
|
|
|||||
|
Income from continuing operations available to common shareholders
|
$
|
449,536
|
|
$
|
406,621
|
|
$
|
334,690
|
|
||
|
Basic weighted average common shares outstanding
|
108,221
|
|
115,900
|
|
120,377
|
|
|||||
|
Effect of dilutive securities – employee stock options
|
1,735
|
|
1,643
|
|
1,263
|
|
|||||
|
Diluted weighted average common shares outstanding
|
109,956
|
|
117,543
|
|
121,640
|
|
|||||
|
Diluted earnings per share from continuing operations
|
$
|
4.09
|
|
$
|
3.46
|
|
$
|
2.75
|
|
||
Basic and diluted earnings per share from discontinued operations was calculated using the two-class method. Basic earnings per share from discontinued operations were
$2.15
,
$0.17
and
$0.30
for the fiscal years ended
May 31, 2016
,
2015
and
2014
, respectively. Diluted earnings per share from discontinued operations were
$2.12
,
$0.17
and
$0.30
for the fiscal years ended
May 31, 2016
,
2015
and
2014
, respectively.
For the fiscal years ended
May 31, 2016
,
2015
and
2014
, options granted to purchase
0.5 million
,
0.6 million
and
0.7 million
shares of Cintas common stock, respectively, were excluded from the computation of diluted earnings per share. The exercise prices of these options were greater than the average market price of the common shares (anti-dilutive).
On July 30, 2013, Cintas announced that the Board of Directors authorized a
$500.0 million
share buyback program. This program was completed in February 2015. On January 13, 2015, we announced that the Board of Directors authorized a
$500.0 million
share buyback program. This program was completed in September 2015. On August 4, 2015, we announced that the Board of Directors authorized a new
$500.0 million
share buyback program. The following table summarizes the buyback activity by program and fiscal period:
|
(In thousands except per share data)
|
2016
|
2015
|
|||||||||||||||||||
|
Buyback Program
|
Shares
|
Avg. Price per Share
|
Purchase Price
|
Shares
|
Avg. Price per Share
|
Purchase Price
|
|||||||||||||||
|
July 30, 2013
|
—
|
|
$
|
—
|
|
$
|
—
|
|
3,981
|
|
$
|
75.49
|
|
$
|
300,500
|
|
|||||
|
January 13, 2015
|
3,078
|
|
$
|
85.44
|
|
$
|
262,928
|
|
2,870
|
|
$
|
82.60
|
|
$
|
237,072
|
|
|||||
|
August 4, 2015
|
5,649
|
|
$
|
87.85
|
|
$
|
496,309
|
|
—
|
|
$
|
—
|
|
$
|
—
|
|
|||||
|
8,727
|
|
|
$
|
87.00
|
|
|
$
|
759,237
|
|
|
6,851
|
|
|
$
|
78.47
|
|
|
$
|
537,572
|
|
|
52
In June 2016, we purchased
0.1 million
shares at an average price of
$94.09
per share for a total purchase price of
$3.7 million
. This completed the August 4, 2015 program through which Cintas purchased a total of
5.7 million
shares of Cintas common stock at an average price of
$87.89
per share for a total purchase price of
$500.0 million
.
In addition to the buyback program, Cintas acquired shares of Cintas common stock in satisfaction of employee payroll taxes due on restricted stock awards that vested during the fiscal year. For the fiscal year ended
May 31, 2016
, Cintas acquired
0.2 million
shares at an average price of
$86.07
per share for a total purchase price of
$20.9 million
. For the fiscal year ended
May 31, 2015
, Cintas acquired
0.2 million
shares at an average price of
$64.58
per share for a total purchase price of
$14.4 million
.
12. Stock-Based Compensation
Under Cintas' 2005 Equity Compensation Plan, as amended, (the 2005 Equity Compensation Plan) Cintas may grant officers and key employee-partners equity compensation in the form of stock options, stock appreciation rights, restricted and unrestricted stock awards, performance awards and other stock unit awards up to an aggregate of
21,000,000
shares of Cintas' common stock. At
May 31, 2016
,
7,174,600
shares of common stock are reserved for future issuance under the 2005 Equity Compensation Plan. Total compensation cost for stock-based awards for continuing operations was
$79.3 million
,
$44.9 million
and
$27.5 million
for the fiscal years ended
May 31, 2016
,
2015
and
2014
, respectively. The total income tax benefit recognized in the consolidated income statement for share-based compensation arrangements for continuing operations was $
28.9 million
, $
16.7 million
and $
10.2 million
for the fiscal years ended
May 31, 2016
,
2015
and
2014
, respectively.
Stock Options
Stock options are granted at the fair market value of the underlying common stock on the date of grant. The option terms are determined by the Compensation Committee of the Board of Directors, but no stock option may be exercised later than
10
years after the date of the grant. The option awards generally have
10
-year terms with graded vesting in years
3
through
5
based on continuous service during that period. Cintas recognizes compensation expense for these options using the straight-line recognition method over the vesting period.
The fair value of options was estimated at the date of grant using a Black-Scholes option-pricing model with the following assumptions:
|
2016
|
2015
|
2014
|
||||||
|
Risk-free interest rate
|
2.0
|
%
|
2.0
|
%
|
2.0
|
%
|
||
|
Dividend yield
|
1.4
|
%
|
1.6
|
%
|
1.7
|
%
|
||
|
Expected volatility of Cintas' common stock
|
23.3
|
%
|
28.0
|
%
|
28.0
|
%
|
||
|
Expected life of the option in years
|
7.5
|
|
7.5
|
|
7.5
|
|
||
The risk-free interest rate is based on U.S. government issues with a remaining term equal to the expected life of the stock options. The determination of expected volatility is based on historical volatility of Cintas' common stock over the period commensurate with the expected term of stock options, as well as other relevant factors. The weighted average expected term was determined based on the historical employee exercise behavior of the options. The weighted-average fair value of stock options granted during fiscal
2016
,
2015
and
2014
was $
21.60
, $
20.64
and $
16.63
, respectively.
53
The information presented in the following table relates primarily to stock options granted and outstanding under either the 2005 Equity Compensation Plan or under previously adopted plans:
|
Shares
|
Weighted
Average
Exercise
Price
|
|||||
|
Outstanding, June 1, 2013 (1,815,795 shares exercisable)
|
7,885,638
|
|
$
|
37.60
|
|
|
|
Granted
|
2,111,649
|
|
61.04
|
|
||
|
Canceled
|
(699,314
|
)
|
42.42
|
|
||
|
Exercised
|
(1,272,179
|
)
|
39.03
|
|
||
|
Outstanding, May 31, 2014 (1,583,413 shares exercisable)
|
8,025,794
|
|
43.12
|
|
||
|
Granted
|
1,590,185
|
|
84.59
|
|
||
|
Canceled
|
(486,720
|
)
|
55.50
|
|
||
|
Exercised
|
(1,293,689
|
)
|
38.11
|
|
||
|
Outstanding, May 31, 2015 (1,426,550 shares exercisable)
|
7,835,570
|
|
51.59
|
|
||
|
Granted
|
1,739,767
|
|
93.55
|
|
||
|
Canceled
|
(235,455
|
)
|
60.01
|
|
||
|
Exercised
|
(919,975
|
)
|
35.07
|
|
||
|
Outstanding, May 31, 2016 (1,649,236 shares exercisable)
|
8,419,907
|
|
$
|
61.83
|
|
|
The intrinsic value of stock options exercised was
$48.5 million
,
$44.3 million
and
$19.8 million
for the fiscal years ended
May 31, 2016
,
2015
and
2014
, respectively. The total cash received from employees as a result of employee stock option exercises for the fiscal years ended
May 31, 2016
,
2015
and
2014
was $
28.2 million
,
$40.2 million
and
$41.9 million
, respectively.
The fair value of stock options vested was $
11.0 million
, $
10.9 million
and $
17.7 million
for the fiscal years ended
May 31, 2016
,
2015
and
2014
, respectively.
The following table summarizes the information related to stock options outstanding at
May 31, 2016
:
|
|
|
Outstanding Options
|
Exercisable Options
|
|||||||||||
|
Range of
Exercise Prices
|
Number
Outstanding
|
Average
Remaining
Option
Life
|
Weighted
Average
Exercise
Price
|
Number
Exercisable
|
Weighted
Average
Exercise
Price
|
|||||||||
|
$ 20.29 – $ 37.75
|
1,555,054
|
4.44
|
$
|
31.22
|
|
1,122,463
|
|
$
|
29.87
|
|
||||
|
37.76 – 47.22
|
2,105,731
|
6.33
|
42.33
|
|
437,534
|
|
39.91
|
|
||||||
|
47.23 – 86.09
|
1,824,303
|
8.17
|
64.90
|
|
89,239
|
|
62.96
|
|
||||||
|
86.10 – 95.09
|
2,934,819
|
9.58
|
90.54
|
|
—
|
|
—
|
|
||||||
|
$ 20.29 – $ 95.09
|
8,419,907
|
7.51
|
$
|
61.83
|
|
1,649,236
|
|
$
|
34.32
|
|
||||
At
May 31, 2016
, the aggregate intrinsic value of stock options outstanding and exercisable was $
276.5 million
and $
99.7 million
, respectively. The weighted-average remaining contractual term of stock options exercisable is
4.7
years.
54
Restricted Stock Awards
Restricted stock awards consist of Cintas' common stock that is subject to such conditions, restrictions and limitations as the Compensation Committee of the Board of Directors determines to be appropriate. The vesting period is generally
three
years after the grant date. The recipient of restricted stock awards will have all rights of a shareholder of Cintas, including the right to vote and the right to receive cash dividends, during the vesting period. Cintas recognizes compensation expense for these restricted stock awards using the straight-line recognition method over the vesting period.
The information presented in the following table relates to restricted stock awards granted and outstanding under either the 2005 Equity Compensation Plan or under previously adopted plans:
|
Shares
|
Weighted
Average
Grant Price
|
|||||
|
Outstanding, unvested grants at June 1, 2013
|
2,015,023
|
|
$
|
35.97
|
|
|
|
Granted
|
661,514
|
|
60.66
|
|
||
|
Canceled
|
(52,124
|
)
|
37.95
|
|
||
|
Vested
|
(465,635
|
)
|
28.76
|
|
||
|
Outstanding, unvested grants at May 31, 2014
|
2,158,778
|
|
45.04
|
|
||
|
Granted
|
627,033
|
|
80.73
|
|
||
|
Canceled
|
(50,277
|
)
|
49.33
|
|
||
|
Vested
|
(525,421
|
)
|
34.39
|
|
||
|
Outstanding, unvested grants at May 31, 2015
|
2,210,113
|
|
57.60
|
|
||
|
Granted
|
1,069,748
|
|
92.10
|
|
||
|
Canceled
|
(70,998
|
)
|
65.79
|
|
||
|
Vested
|
(605,427
|
)
|
38.76
|
|
||
|
Outstanding, unvested grants at May 31, 2016
|
2,603,436
|
|
$
|
75.94
|
|
|
The remaining unrecognized compensation cost related to unvested stock options and restricted stock at
May 31, 2016
was $
149.4 million
. The weighted-average period of time over which this cost will be recognized is
1.9
years.
55
13. Accumulated Other Comprehensive Income (Loss)
The following table summarizes the changes in the accumulated balances for each component of accumulated other comprehensive income (loss), net of tax:
|
(In thousands)
|
Foreign Currency
|
Unrealized
Loss on
Derivatives
|
Other
|
Total
|
|||||||||||
|
Balance at May 31, 2014
|
$
|
41,525
|
|
$
|
(12,615
|
)
|
$
|
(482
|
)
|
$
|
28,428
|
|
|||
|
Other comprehensive (loss) income before reclassifications
|
(38,538
|
)
|
37
|
|
(350
|
)
|
(38,851
|
)
|
|||||||
|
Amounts reclassified from accumulated other comprehensive income (loss)
|
—
|
|
1,952
|
|
—
|
|
1,952
|
|
|||||||
|
Net current period other comprehensive (loss) income
|
(38,538
|
)
|
1,989
|
|
(350
|
)
|
(36,899
|
)
|
|||||||
|
Balance at May 31, 2015
|
2,987
|
|
(10,626
|
)
|
(832
|
)
|
(8,471
|
)
|
|||||||
|
Other comprehensive loss before reclassifications
|
(11,933
|
)
|
(12,156
|
)
|
(738
|
)
|
(24,827
|
)
|
|||||||
|
Amounts reclassified from accumulated other comprehensive income (loss)
|
6,472
|
|
1,952
|
|
—
|
|
8,424
|
|
|||||||
|
Net current period other comprehensive loss
|
(5,461
|
)
|
(10,204
|
)
|
(738
|
)
|
(16,403
|
)
|
|||||||
|
Balance at May 31, 2016
|
$
|
(2,474
|
)
|
$
|
(20,830
|
)
|
$
|
(1,570
|
)
|
$
|
(24,874
|
)
|
|||
The following table summarizes the reclassifications out of accumulated other comprehensive loss during fiscal years ended May 31,
2016
and
2015
:
|
Reclassifications out of Accumulated Other Comprehensive Income (Loss)
|
||||||||||
|
Details about Accumulated
Other Comprehensive
Loss Components
|
Amount Reclassified from Accumulated Other Comprehensive Loss
|
Affected Line in the
Consolidated
Statements of Income
|
||||||||
|
(in thousands)
|
2016
|
2015
|
||||||||
|
Amortization of interest rate locks
|
$
|
(3,130
|
)
|
$
|
(3,130
|
)
|
Interest expense
|
|||
|
Tax benefit
|
1,178
|
|
1,178
|
|
Income taxes
|
|||||
|
Amortization of interest rate locks, net of tax
|
$
|
(1,952
|
)
|
$
|
(1,952
|
)
|
Net of tax
|
|||
|
(in thousands)
|
2016
|
2015
|
||||||||
|
Cumulative translation adjustment on
Shred-it
(1)
|
$
|
(10,381
|
)
|
$
|
—
|
|
Income from discontinued operations
|
|||
|
Tax benefit
|
3,909
|
|
—
|
|
Income from discontinued operations
|
|||||
|
Cumulative translation adjustment on
Shred-it, net of tax
(1)
|
$
|
(6,472
|
)
|
$
|
—
|
|
Net of tax
|
|||
(1)
The cumulative translation adjustment was reclassified out of accumulated other comprehensive income due to the sale of Shred-it.
56
14. Operating Segment Information
GAAP requires companies to evaluate their reportable operating segments periodically and when certain events occur. As a result of a periodic evaluation, effective June 1, 2015, Cintas realigned its organizational structure and updated its reportable operating segments in light of certain changes in its business including the acquisition of ZEE in the first quarter of fiscal 2016. Cintas’ updated reportable operating segments are Uniform Rental and Facility Services and First Aid and Safety Services. The Uniform Rental and Facility Services reportable operating segment consists of the rental and servicing of uniforms and other garments including flame resistant clothing, mats, mops and shop towels and other ancillary items. In addition to these rental items, restroom cleaning services and supplies, carpet and tile cleaning services and the sale of items from our catalogs to our customers on route are included within this reportable operating segment. The First Aid and Safety Services reportable operating segment consists of first aid and safety products and services. The remainder of Cintas’ business, which consists primarily of Fire Protection Services and its Direct Sale business, is included in All Other. All prior fiscal year results presented in the table below have been recast to reflect these new operating segments.
Prior to June 1, 2015, Cintas classified its businesses into
three
operating segments based on the types of products and services provided. The Rental Uniforms and Ancillary Products operating segment consisted of the rental and servicing of uniforms and other garments including flame resistant clothing, mats, mops and shop towels and other ancillary items. In addition to these rental items, restroom cleaning services and supplies and carpet and tile cleaning services were also provided within this operating segment. The Uniform Direct Sales operating segment consisted of the direct sale of uniforms and related items. The First Aid, Safety and Fire Protection Services operating segment consisted of first aid, safety and fire protection products and services.
Cintas evaluates the performance of each operating segment based on several factors of which the primary financial measures are operating segment revenue and income before income taxes. The accounting policies of the operating segments are the same as those described in Note 1 entitled Significant Accounting Policies. Information related to the operations of Cintas' operating segments is set forth below:
57
|
(In thousands)
|
Uniform Rental and Facility Services
|
First Aid and Safety Services
|
All Other
|
Corporate
(1)
|
Total
|
||||||||||||||
|
May 31, 2016
|
|
|
|
|
|
||||||||||||||
|
Revenue
|
$
|
3,777,801
|
|
$
|
461,783
|
|
$
|
665,874
|
|
$
|
—
|
|
$
|
4,905,458
|
|
||||
|
Gross margin
|
$
|
1,671,008
|
|
$
|
197,010
|
|
$
|
261,852
|
|
$
|
—
|
|
$
|
2,129,870
|
|
||||
|
Selling and administrative expenses
|
998,069
|
|
147,503
|
|
202,550
|
|
—
|
|
1,348,122
|
|
|||||||||
|
Interest expense, net
|
—
|
|
—
|
|
—
|
|
63,626
|
|
63,626
|
|
|||||||||
|
Income before income taxes
|
$
|
672,939
|
|
$
|
49,507
|
|
$
|
59,302
|
|
$
|
(63,626
|
)
|
$
|
718,122
|
|
||||
|
Depreciation and amortization
|
$
|
130,822
|
|
$
|
16,021
|
|
$
|
18,436
|
|
$
|
—
|
|
$
|
165,279
|
|
||||
|
Capital expenditures
|
$
|
237,884
|
|
$
|
22,364
|
|
$
|
15,137
|
|
$
|
—
|
|
$
|
275,385
|
|
||||
|
Total assets
|
$
|
3,114,159
|
|
$
|
421,789
|
|
$
|
358,683
|
|
$
|
209,762
|
|
$
|
4,104,393
|
|
||||
|
May 31, 2015
|
|
||||||||||||||||||
|
Revenue
|
$
|
3,539,843
|
|
$
|
326,593
|
|
$
|
610,450
|
|
$
|
—
|
|
$
|
4,476,886
|
|
||||
|
Gross margin
|
$
|
1,532,211
|
|
$
|
152,339
|
|
$
|
236,787
|
|
$
|
—
|
|
$
|
1,921,337
|
|
||||
|
Selling and administrative expenses
|
926,176
|
|
107,226
|
|
191,528
|
|
—
|
|
1,224,930
|
|
|||||||||
|
Gain on sale of stock of an equity
method investment
|
—
|
|
—
|
|
—
|
|
21,739
|
|
21,739
|
|
|||||||||
|
Interest expense, net
|
—
|
|
—
|
|
—
|
|
64,822
|
|
64,822
|
|
|||||||||
|
Income before income taxes
|
$
|
606,035
|
|
$
|
45,113
|
|
$
|
45,259
|
|
$
|
(43,083
|
)
|
$
|
653,324
|
|
||||
|
Depreciation and amortization
|
$
|
123,577
|
|
$
|
9,774
|
|
$
|
19,244
|
|
$
|
—
|
|
$
|
152,595
|
|
||||
|
Capital expenditures
|
$
|
184,246
|
|
$
|
13,589
|
|
$
|
18,983
|
|
$
|
902
|
|
$
|
217,720
|
|
||||
|
Total assets
|
$
|
2,845,326
|
|
$
|
255,202
|
|
$
|
345,201
|
|
$
|
746,731
|
|
$
|
4,192,460
|
|
||||
|
May 31, 2014
|
|
||||||||||||||||||
|
Revenue
|
$
|
3,304,635
|
|
$
|
294,966
|
|
$
|
594,243
|
|
$
|
—
|
|
$
|
4,193,844
|
|
||||
|
Gross margin
|
$
|
1,382,158
|
|
$
|
136,136
|
|
$
|
231,465
|
|
$
|
—
|
|
$
|
1,749,759
|
|
||||
|
Selling and administrative expenses
|
860,311
|
|
96,246
|
|
190,482
|
|
—
|
|
1,147,039
|
|
|||||||||
|
Interest expense, net
|
—
|
|
—
|
|
—
|
|
65,593
|
|
65,593
|
|
|||||||||
|
Income before income taxes
|
$
|
521,847
|
|
$
|
39,890
|
|
$
|
40,983
|
|
$
|
(65,593
|
)
|
|
$
|
537,127
|
|
|||
|
Depreciation and amortization
|
$
|
118,828
|
|
$
|
8,283
|
|
$
|
20,178
|
|
$
|
—
|
|
$
|
147,289
|
|
||||
|
Capital expenditures
|
$
|
94,619
|
|
$
|
9,195
|
|
$
|
7,370
|
|
$
|
34,396
|
|
$
|
145,580
|
|
||||
|
Total assets
|
$
|
2,840,809
|
|
$
|
257,603
|
|
$
|
340,650
|
|
$
|
1,023,390
|
|
$
|
4,462,452
|
|
||||
(1)
Corporate assets include cash and marketable securities in all periods. Corporate assets as of May 31, 2015 include Shred-it and real estate assets of Storage that were not included in the sale transactions. Corporate assets as of May 31, 2014 include Shred-it and the assets of Storage.
58
15. Quarterly Financial Data (Unaudited)
The following is a summary of the results of operation for each of the quarters within the fiscal years ended
May 31, 2016
and
2015
:
|
May 31, 2016
(in thousands)
|
First
Quarter
|
Second
Quarter
|
Third
Quarter
|
Fourth
Quarter
|
|||||||||||
|
Revenue
|
$
|
1,198,890
|
|
$
|
1,219,080
|
|
$
|
1,216,083
|
|
$
|
1,271,405
|
|
|||
|
Gross margin
|
$
|
524,144
|
|
$
|
527,400
|
|
$
|
524,608
|
|
$
|
553,718
|
|
|||
|
Net income, continuing operations
|
$
|
106,198
|
|
$
|
115,453
|
|
$
|
117,279
|
|
$
|
118,011
|
|
|||
|
Basic earnings per share, continuing operations
|
$
|
0.94
|
|
$
|
1.05
|
|
$
|
1.07
|
|
$
|
1.09
|
|
|||
|
Diluted earnings per share, continuing operations
|
$
|
0.93
|
|
$
|
1.03
|
|
$
|
1.05
|
|
$
|
1.08
|
|
|||
|
Weighted average number of shares outstanding
|
110,597
|
|
108,301
|
|
107,843
|
|
106,136
|
|
|||||||
|
May 31, 2015
(in thousands)
(1) (2)
|
First
Quarter
|
Second
Quarter
|
Third
Quarter
|
Fourth
Quarter
|
|||||||||||
|
Revenue
|
$
|
1,102,077
|
|
$
|
1,123,379
|
|
$
|
1,108,847
|
|
$
|
1,142,583
|
|
|||
|
Gross margin
|
$
|
477,946
|
|
$
|
481,424
|
|
$
|
475,307
|
|
$
|
486,660
|
|
|||
|
Net income, continuing operations
|
$
|
105,905
|
|
$
|
103,701
|
|
$
|
100,331
|
|
$
|
100,584
|
|
|||
|
Basic earnings per share, continuing operations
|
$
|
0.90
|
|
$
|
0.88
|
|
$
|
0.86
|
|
$
|
0.87
|
|
|||
|
Diluted earnings per share, continuing operations
|
$
|
0.89
|
|
$
|
0.86
|
|
$
|
0.85
|
|
$
|
0.86
|
|
|||
|
Weighted average number of shares outstanding
|
116,659
|
|
117,115
|
|
116,178
|
|
113,666
|
|
|||||||
(1)
The figures for fiscal 2015 reflect the change in classification of Shred-it to discontinued operations within the Consolidated Statements of Income. See Note 16 entitled Discontinued Operations for additional information.
(2)
During the fiscal 2015 first quarter, Cintas recognized a gain on the sale of stock in an equity method investment in the net amount of $
13.6 million
.
59
16. Discontinued Operations
The results of Shred-it and Shredding are classified as discontinued operations for all periods presented as a result of entering into a definitive agreement during fiscal 2016 to sell the investment. During fiscal 2015, Cintas sold Storage and, as a result, its operations are also classified as discontinued operations for all periods presented. Shredding and Storage were previously included in the former Document Management Services reportable operating segment. In accordance with the applicable accounting guidance for the disposal of long-lived assets, the results of Shredding and Storage have been excluded from both continuing operations and operating segment results for all periods presented.
In fiscal 2014, Cintas completed the Shredding Transaction and realized a
$106.4 million
gain. The gain was computed as follows: the fair value of consideration received of
$180.0 million
plus the fair value of Cintas' retained non-controlling interest in Shred-it of
$339.4 million
less the carrying amount of Shredding of
$413.0 million
. As a result of the Shredding Transaction, the Company recorded an asset impairment charge of
$16.1 million
and other transaction costs of
$28.5 million
in fiscal 2014. The impairment charge was related to the abandonment of information systems assets that were not contributed to Shred-it and cannot be used by the Company for other purposes. The other transaction costs consisted of the following:
$4.7 million
of professional and legal fees;
$0.7 million
of employee termination benefit costs;
$12.4 million
of stock compensation expense resulting from the immediate vesting of Cintas stock options and awards of employees contributed to Shred-it; a
$4.2 million
charge for information systems contracts for which no future economic benefit exists; and
$6.5 million
of incremental profit sharing and employee compensation resulting from the gain, net of the impairment charge and other transaction costs. All of the impacts from the Shredding Transaction have been included in discontinued operations. For the fiscal year ended May 31, 2014, Cintas recorded a net gain on Shred-it of
$1.2 million
. Also, in conjunction with the partnership agreement, Cintas agreed to provide certain transition services such as information technology and accounting in support of Shred-it. The agreement expired in September 2015.
At May 31, 2015, the carrying value of Shred-it was
$210.1 million
. In May of fiscal 2015, the Company received a dividend on Shred-it of
$113.4 million
, which reduced the carrying value of the investment. As of May 31, 2015, Cintas’ carrying value of Shred-it exceeded its share of the underlying equity in the net assets of the Shred-it Partnership by approximately
$94.0 million
(basis difference). The remaining basis difference was to be amortized over the weighted average estimated useful lives of the underlying assets which generated the basis difference (approximately
9
years) and recorded as a reduction in the income (loss) on Shred-it, net of tax. Cintas recorded its share of the partnership's income on a one month lag. For the fiscal year ended May 31, 2015, Cintas recorded a net loss on Shred-it of
$5.5 million
, which included amortization of basis differences of approximately
$11.0 million
.
Cintas provides the following unaudited summary information regarding the Shred-it Partnership's financial position and results of operations as of and for the twelve months ended April 30, 2015:
|
Summary Balance Sheet Information
|
As of
|
||
|
(in thousands)
|
April 30, 2015
|
||
|
Assets
|
|||
|
Current assets
|
$
|
150,792
|
|
|
Non-current assets
|
$
|
968,956
|
|
|
Liabilities
|
|||
|
Current liabilities
|
$
|
73,971
|
|
|
Non-current liabilities
|
$
|
532,673
|
|
|
Summary Income Statement Information
|
For the 12 Months Ended
|
||
|
(in thousands)
|
April 30, 2015
|
||
|
Net sales
|
$
|
695,628
|
|
|
Gross profit
|
$
|
432,532
|
|
|
Net income
|
$
|
10,385
|
|
60
In fiscal 2015, Cintas received additional proceeds related to the Shred-it Transaction. The Company realized a
$4.1 million
gain, net of tax, as a result of the additional consideration received. During fiscal 2015, we also recorded a loss related to the Shred-it Transaction due to the settlement of an outstanding Shredding-related legal claim. The expense, net of tax, was
$1.0 million
.
In fiscal 2016, we completed the transaction to sell Shred-it. Cintas’ share of the proceeds from the sale were
$578.3 million
. During the fourth quarter of fiscal 2016, Cintas received additional proceeds and consideration related to the sale of Shred-it. The Company realized a pre-tax gain of
$4.3 million
as a result of the additional consideration received. At May 31, 2016, Cintas still has the opportunity to receive up to
$30 million
in additional consideration in the future, subject to certain holdback provisions. Because of the uncertainty surrounding the holdback provisions, this amount represents a gain contingency that has not been recorded. During the fiscal year ended
May 31, 2016
, Cintas recorded a net loss on Shred-it of
$24.3 million
, which included amortization of basis differences of approximately
$4.8 million
. After the sale Shred-it, the basis difference no longer exists and Cintas no longer records income or loss from Shred-it.
In fiscal 2015, Cintas sold Storage, excluding certain real estate owned by Cintas, in
three
separate transactions to
three
separate buyers. Certain real estate assets and related liabilities were not included in the Storage transactions in 2015 and were classified as held for sale as of May 31, 2015. This real estate was leased by a buyer of part of Storage. These lease payments did not represent a material direct cash flow of the disposed Storage business, and therefore, do not impact the classification of the Storage business as a discontinued operation. For the fiscal year ended May 31, 2015, cash proceeds received at the closing of each transaction or upon the settlement of contingencies totaled
$158.4 million
, net of cash contributed. Each transaction involved contingent consideration, and the Company had opportunities to receive additional proceeds if specified future events occurred. Because of the uncertainty surrounding the future events, these amounts represented gain contingencies and were not recorded until realized. During fiscal 2016, Cintas received additional proceeds on the sale of Storage related to the contingent consideration and realized a pre-tax gain of
$10.9 million
. During fiscal 2016, Cintas also sold the remaining Storage assets classified as held for sale. Cintas received proceeds of
$24.4 million
from the sale of these assets and realized a pretax gain of
$4.8 million
.
Following is selected financial information included in net income from discontinued operations for the Shredding and Storage businesses:
|
(In thousands)
|
2016
|
2015
(1)
|
2014
(1)
|
||||||||
|
Revenue
|
$
|
—
|
|
$
|
31,379
|
|
$
|
357,967
|
|
||
|
Income (loss) before income taxes, excluding gains (losses) from sale transactions and investments
|
434
|
|
(3,515
|
)
|
6,913
|
|
|||||
|
Gain on Storage transactions
|
15,786
|
|
38,573
|
|
—
|
|
|||||
|
(Loss) gain on Shred-it
(1)
|
(24,288
|
)
|
(3,851
|
)
|
63,817
|
|
|||||
|
Gain on sale of Shred-it
|
378,359
|
|
—
|
|
—
|
|
|||||
|
Income tax expense
|
(133,712
|
)
|
(11,110
|
)
|
(34,060
|
)
|
|||||
|
Net income from discontinued operations
|
$
|
236,579
|
|
$
|
20,097
|
|
$
|
36,670
|
|
||
(1)
Results for the fiscal years ended May 31, 2015 and 2014 related to Shred-it and Shredding were previously presented in continuing operations and were reclassified to discontinued operations as previously discussed.
61
17. Supplemental Guarantor Information
Cintas Corporation No. 2 (Corp. 2) is the indirectly, wholly-owned principal operating subsidiary of Cintas. Corp. 2 is the issuer of the $
1,300.0 million
of long-term senior notes, which are unconditionally guaranteed, jointly and severally, by Cintas Corporation and its wholly-owned, direct and indirect domestic subsidiaries.
As allowed by SEC rules, the following condensed consolidating financial statements are provided as an alternative to filing separate financial statements of the guarantors. Each of the subsidiaries presented in the following condensed consolidating financial statements has been fully consolidated in Cintas' consolidated financial statements. The following condensed consolidating financial statements should be read in conjunction with the consolidated financial statements of Cintas and notes thereto of which this note is an integral part.
Condensed consolidating financial statements for Cintas, Corp. 2, the subsidiary guarantors and non-guarantors are presented on the following pages:
Condensed Consolidating Income Statement
|
Year Ended May 31, 2016 (in thousands)
|
Cintas
Corporation
|
Corp. 2
|
Subsidiary
Guarantors
|
Non-
Guarantors
|
Eliminations
|
Cintas
Corporation
Consolidated
|
|||||||||||||||||
|
Revenue:
|
|
|
|
|
|
|
|||||||||||||||||
|
Uniform rental and facility
services
|
$
|
—
|
|
$
|
2,913,812
|
|
$
|
805,722
|
|
$
|
213,526
|
|
$
|
(155,259
|
)
|
$
|
3,777,801
|
|
|||||
|
Other
|
—
|
|
1,576,078
|
|
8,542
|
|
66,270
|
|
(523,233
|
)
|
1,127,657
|
|
|||||||||||
|
Equity in net income of
affiliates
|
456,941
|
|
—
|
|
—
|
|
—
|
|
(456,941
|
)
|
—
|
|
|||||||||||
|
456,941
|
|
4,489,890
|
|
814,264
|
|
279,796
|
|
(1,135,433
|
)
|
4,905,458
|
|
||||||||||||
|
Costs and expenses (income):
|
|
|
|
|
|
|
|||||||||||||||||
|
Cost of uniform rental and facility services
|
—
|
|
1,709,912
|
|
490,383
|
|
142,601
|
|
(236,103
|
)
|
2,106,793
|
|
|||||||||||
|
Cost of other
|
—
|
|
1,070,064
|
|
(41,762
|
)
|
48,539
|
|
(408,046
|
)
|
668,795
|
|
|||||||||||
|
Selling and administrative expenses
|
—
|
|
1,427,424
|
|
(121,514
|
)
|
69,257
|
|
(27,045
|
)
|
1,348,122
|
|
|||||||||||
|
Operating income
|
456,941
|
|
282,490
|
|
487,157
|
|
19,399
|
|
(464,239
|
)
|
781,748
|
|
|||||||||||
|
Interest income
|
—
|
|
—
|
|
(666
|
)
|
(232
|
)
|
2
|
|
(896
|
)
|
|||||||||||
|
Interest expense (income)
|
—
|
|
65,534
|
|
(1,027
|
)
|
15
|
|
—
|
|
64,522
|
|
|||||||||||
|
Income before income taxes
|
456,941
|
|
216,956
|
|
488,850
|
|
19,616
|
|
(464,241
|
)
|
718,122
|
|
|||||||||||
|
Income taxes
|
—
|
|
71,323
|
|
180,100
|
|
9,874
|
|
(116
|
)
|
261,181
|
|
|||||||||||
|
Income from continuing
operations
|
456,941
|
|
145,633
|
|
308,750
|
|
9,742
|
|
(464,125
|
)
|
456,941
|
|
|||||||||||
|
Income (loss) from discontinued
operations, net of tax
|
236,579
|
|
242,416
|
|
—
|
|
(5,837
|
)
|
(236,579
|
)
|
236,579
|
|
|||||||||||
|
Net income
|
$
|
693,520
|
|
$
|
388,049
|
|
$
|
308,750
|
|
$
|
3,905
|
|
$
|
(700,704
|
)
|
$
|
693,520
|
|
|||||
62
Condensed Consolidating Income Statement
|
Year Ended May 31, 2015 (in thousands)
|
Cintas
Corporation
|
Corp. 2
|
Subsidiary
Guarantors
|
Non-
Guarantors
|
Eliminations
|
Cintas
Corporation
Consolidated
|
|||||||||||||||||
|
Revenue:
|
|
|
|
|
|
|
|||||||||||||||||
|
Uniform rental and facility
services
|
$
|
—
|
|
$
|
2,699,466
|
|
$
|
748,185
|
|
$
|
229,391
|
|
$
|
(137,199
|
)
|
$
|
3,539,843
|
|
|||||
|
Other
|
—
|
|
1,379,572
|
|
2,159
|
|
57,349
|
|
(502,037
|
)
|
937,043
|
|
|||||||||||
|
Equity in net income of
affiliates
|
410,521
|
|
—
|
|
—
|
|
—
|
|
(410,521
|
)
|
—
|
|
|||||||||||
|
410,521
|
|
4,079,038
|
|
750,344
|
|
286,740
|
|
(1,049,757
|
)
|
4,476,886
|
|
||||||||||||
|
Costs and expenses (income):
|
|
|
|
|
|
|
|||||||||||||||||
|
Cost of uniform rental and facility services
|
—
|
|
1,660,625
|
|
407,505
|
|
154,601
|
|
(215,099
|
)
|
2,007,632
|
|
|||||||||||
|
Cost of other
|
—
|
|
889,524
|
|
16,120
|
|
37,628
|
|
(395,355
|
)
|
547,917
|
|
|||||||||||
|
Selling and administrative expenses
|
—
|
|
1,276,745
|
|
(100,024
|
)
|
74,523
|
|
(26,314
|
)
|
1,224,930
|
|
|||||||||||
|
Operating income
|
410,521
|
|
252,144
|
|
426,743
|
|
19,988
|
|
(412,989
|
)
|
696,407
|
|
|||||||||||
|
Gain on sale of stock of an
equity method investment
|
—
|
|
—
|
|
21,739
|
|
—
|
|
—
|
|
21,739
|
|
|||||||||||
|
Interest income
|
—
|
|
(12
|
)
|
(250
|
)
|
(79
|
)
|
2
|
|
(339
|
)
|
|||||||||||
|
Interest expense (income)
|
—
|
|
66,298
|
|
(1,134
|
)
|
(3
|
)
|
—
|
|
65,161
|
|
|||||||||||
|
Income before income taxes
|
410,521
|
|
185,858
|
|
449,866
|
|
20,070
|
|
(412,991
|
)
|
653,324
|
|
|||||||||||
|
Income taxes
|
—
|
|
66,498
|
|
168,706
|
|
7,665
|
|
(66
|
)
|
242,803
|
|
|||||||||||
|
Income from continuing
operations
|
410,521
|
|
119,360
|
|
281,160
|
|
12,405
|
|
(412,925
|
)
|
410,521
|
|
|||||||||||
|
Income from discontinued
operations, net of tax
|
20,097
|
|
15,501
|
|
—
|
|
4,596
|
|
(20,097
|
)
|
20,097
|
|
|||||||||||
|
Net income
|
$
|
430,618
|
|
$
|
134,861
|
|
$
|
281,160
|
|
$
|
17,001
|
|
$
|
(433,022
|
)
|
$
|
430,618
|
|
|||||
63
Condensed Consolidating Income Statement
|
Year Ended May 31, 2014 (in thousands)
|
Cintas
Corporation
|
Corp. 2
|
Subsidiary Guarantors
|
Non-
Guarantors
|
Eliminations
|
Cintas
Corporation
Consolidated
|
|||||||||||||||||
|
Revenue:
|
|
|
|
|
|
|
|||||||||||||||||
|
Uniform rental and facility
services
|
$
|
—
|
|
$
|
2,500,618
|
|
$
|
690,831
|
|
$
|
235,118
|
|
$
|
(121,932
|
)
|
$
|
3,304,635
|
|
|||||
|
Other
|
—
|
|
1,302,715
|
|
4,192
|
|
53,990
|
|
(471,688
|
)
|
889,209
|
|
|||||||||||
|
Equity in net income of
affiliates
|
337,772
|
|
—
|
|
—
|
|
—
|
|
(337,772
|
)
|
—
|
|
|||||||||||
|
337,772
|
|
3,803,333
|
|
695,023
|
|
289,108
|
|
(931,392
|
)
|
4,193,844
|
|
||||||||||||
|
Costs and expenses (income):
|
|
|
|
|
|
|
|||||||||||||||||
|
Cost of uniform rental and facility services
|
—
|
|
1,576,226
|
|
386,556
|
|
160,795
|
|
(201,100
|
)
|
1,922,477
|
|
|||||||||||
|
Cost of other
|
—
|
|
843,675
|
|
16,570
|
|
37,334
|
|
(375,971
|
)
|
521,608
|
|
|||||||||||
|
Selling and administrative expenses
|
—
|
|
1,172,858
|
|
(83,765
|
)
|
76,049
|
|
(18,103
|
)
|
1,147,039
|
|
|||||||||||
|
Operating income
|
337,772
|
|
210,574
|
|
375,662
|
|
14,930
|
|
(336,218
|
)
|
602,720
|
|
|||||||||||
|
Interest income
|
—
|
|
(43
|
)
|
(178
|
)
|
(15,279
|
)
|
15,271
|
|
(229
|
)
|
|||||||||||
|
Interest expense (income)
|
—
|
|
66,461
|
|
(635
|
)
|
(4
|
)
|
—
|
|
65,822
|
|
|||||||||||
|
Income before income taxes
|
337,772
|
|
144,156
|
|
376,475
|
|
30,213
|
|
(351,489
|
)
|
537,127
|
|
|||||||||||
|
Income taxes
|
—
|
|
43,327
|
|
148,332
|
|
7,774
|
|
(78
|
)
|
199,355
|
|
|||||||||||
|
Income from continuing
operations
|
337,772
|
|
100,829
|
|
228,143
|
|
22,439
|
|
(351,411
|
)
|
337,772
|
|
|||||||||||
|
Income (loss) from discontinued
operations, net of tax
|
36,670
|
|
61,434
|
|
(23,134
|
)
|
(1,630
|
)
|
(36,670
|
)
|
36,670
|
|
|||||||||||
|
Net income
|
$
|
374,442
|
|
$
|
162,263
|
|
$
|
205,009
|
|
$
|
20,809
|
|
$
|
(388,081
|
)
|
$
|
374,442
|
|
|||||
64
Condensed Consolidating Statement of Comprehensive Income
|
Year Ended May 31, 2016
(in thousands)
|
Cintas
Corporation
|
Corp. 2
|
Subsidiary Guarantors
|
Non-
Guarantors
|
Eliminations
|
Cintas
Corporation
Consolidated
|
|||||||||||||||||
|
Net income
|
$
|
693,520
|
|
$
|
388,049
|
|
$
|
308,750
|
|
$
|
3,905
|
|
$
|
(700,704
|
)
|
$
|
693,520
|
|
|||||
|
Other comprehensive (loss) income, net of tax:
|
|
||||||||||||||||||||||
|
Foreign currency translation
adjustments
|
—
|
|
—
|
|
—
|
|
(11,933
|
)
|
—
|
|
(11,933
|
)
|
|||||||||||
|
Cumulative translation
adjustment on Shred-it
|
—
|
|
5,875
|
|
—
|
|
597
|
|
—
|
|
6,472
|
|
|||||||||||
|
Change in fair value of
derivatives
|
—
|
|
(12,156
|
)
|
—
|
|
—
|
|
—
|
|
(12,156
|
)
|
|||||||||||
|
Amortization of interest rate
lock agreements
|
—
|
|
1,952
|
|
—
|
|
—
|
|
—
|
|
1,952
|
|
|||||||||||
|
Other
|
—
|
|
—
|
|
(730
|
)
|
(8
|
)
|
—
|
|
(738
|
)
|
|||||||||||
|
Other comprehensive loss
|
—
|
|
(4,329
|
)
|
(730
|
)
|
(11,344
|
)
|
—
|
|
(16,403
|
)
|
|||||||||||
|
Comprehensive income (loss)
|
$
|
693,520
|
|
$
|
383,720
|
|
$
|
308,020
|
|
$
|
(7,439
|
)
|
$
|
(700,704
|
)
|
$
|
677,117
|
|
|||||
65
Condensed Consolidating Statement of Comprehensive Income
|
Year Ended May 31, 2015
(in thousands)
|
Cintas
Corporation
|
Corp. 2
|
Subsidiary Guarantors
|
Non-
Guarantors
|
Eliminations
|
Cintas
Corporation
Consolidated
|
|||||||||||||||||
|
Net income
|
$
|
430,618
|
|
$
|
134,861
|
|
$
|
281,160
|
|
$
|
17,001
|
|
$
|
(433,022
|
)
|
$
|
430,618
|
|
|||||
|
Other comprehensive (loss) income, net of tax:
|
|||||||||||||||||||||||
|
Foreign currency translation
adjustments
|
—
|
|
—
|
|
—
|
|
(38,538
|
)
|
—
|
|
(38,538
|
)
|
|||||||||||
|
Change in fair value of
derivatives
|
—
|
|
—
|
|
—
|
|
37
|
|
—
|
|
37
|
|
|||||||||||
|
Amortization of interest rate
lock agreements
|
—
|
|
1,952
|
|
—
|
|
—
|
|
—
|
|
1,952
|
|
|||||||||||
|
Other
|
—
|
|
—
|
|
(361
|
)
|
11
|
|
—
|
|
(350
|
)
|
|||||||||||
|
Other comprehensive income (loss)
|
—
|
|
1,952
|
|
(361
|
)
|
(38,490
|
)
|
—
|
|
(36,899
|
)
|
|||||||||||
|
Comprehensive income (loss)
|
$
|
430,618
|
|
$
|
136,813
|
|
$
|
280,799
|
|
$
|
(21,489
|
)
|
$
|
(433,022
|
)
|
$
|
393,719
|
|
|||||
66
Condensed Consolidating Statement of Comprehensive Income
|
Year Ended May 31, 2014
(in thousands)
|
Cintas
Corporation
|
Corp. 2
|
Subsidiary Guarantors
|
Non-
Guarantors
|
Eliminations
|
Cintas
Corporation
Consolidated
|
|||||||||||||||||
|
Net income
|
$
|
374,442
|
|
$
|
162,263
|
|
$
|
205,009
|
|
$
|
20,809
|
|
$
|
(388,081
|
)
|
$
|
374,442
|
|
|||||
|
Other comprehensive (loss) income, net of tax:
|
|||||||||||||||||||||||
|
Foreign currency translation
adjustments
|
—
|
|
—
|
|
—
|
|
(9,787
|
)
|
—
|
|
(9,787
|
)
|
|||||||||||
|
Change in fair value of
derivatives
|
—
|
|
—
|
|
—
|
|
(228
|
)
|
—
|
|
(228
|
)
|
|||||||||||
|
Amortization of interest rate
lock agreements
|
—
|
|
1,952
|
|
—
|
|
—
|
|
—
|
|
1,952
|
|
|||||||||||
|
Other
|
—
|
|
—
|
|
(1,629
|
)
|
(3
|
)
|
—
|
|
(1,632
|
)
|
|||||||||||
|
Other comprehensive income (loss)
|
—
|
|
1,952
|
|
(1,629
|
)
|
(10,018
|
)
|
—
|
|
(9,695
|
)
|
|||||||||||
|
Comprehensive income
|
$
|
374,442
|
|
$
|
164,215
|
|
$
|
203,380
|
|
$
|
10,791
|
|
$
|
(388,081
|
)
|
$
|
364,747
|
|
|||||
67
Condensed Consolidating Balance Sheet
|
As of May 31, 2016 (in thousands)
|
Cintas
Corporation
|
Corp. 2
|
Subsidiary
Guarantors
|
Non-
Guarantors
|
Eliminations
|
Cintas
Corporation
Consolidated
|
|||||||||||||||||
|
Assets
|
|
|
|
|
|
|
|||||||||||||||||
|
Current assets:
|
|
|
|
|
|
|
|||||||||||||||||
|
Cash and cash equivalents
|
$
|
—
|
|
$
|
55,821
|
|
$
|
57,464
|
|
$
|
26,072
|
|
$
|
—
|
|
$
|
139,357
|
|
|||||
|
Marketable securities
|
—
|
|
—
|
|
—
|
|
70,405
|
|
—
|
|
70,405
|
|
|||||||||||
|
Accounts receivable, net
|
—
|
|
402,846
|
|
125,005
|
|
35,327
|
|
—
|
|
563,178
|
|
|||||||||||
|
Inventories, net
|
—
|
|
222,822
|
|
19,150
|
|
11,235
|
|
(3,845
|
)
|
249,362
|
|
|||||||||||
|
Uniforms and other rental items in service
|
—
|
|
410,696
|
|
112,370
|
|
36,612
|
|
(19,722
|
)
|
539,956
|
|
|||||||||||
|
Income taxes, current
|
—
|
|
(151
|
)
|
1,215
|
|
648
|
|
—
|
|
1,712
|
|
|||||||||||
|
Prepaid expenses and other
current assets
|
—
|
|
6,668
|
|
18,435
|
|
962
|
|
—
|
|
26,065
|
|
|||||||||||
|
Total current assets
|
—
|
|
1,098,702
|
|
333,639
|
|
181,261
|
|
(23,567
|
)
|
1,590,035
|
|
|||||||||||
|
Property and equipment, at cost, net
|
—
|
|
577,936
|
|
342,356
|
|
73,945
|
|
—
|
|
994,237
|
|
|||||||||||
|
Investments
|
321,083
|
|
1,770,303
|
|
901,772
|
|
941,396
|
|
(3,809,602
|
)
|
124,952
|
|
|||||||||||
|
Goodwill
|
—
|
|
—
|
|
1,256,662
|
|
35,043
|
|
(112
|
)
|
1,291,593
|
|
|||||||||||
|
Service contracts, net
|
—
|
|
81,462
|
|
13
|
|
2,240
|
|
—
|
|
83,715
|
|
|||||||||||
|
Other assets, net
|
1,081,203
|
|
4,665
|
|
3,526,051
|
|
9,110
|
|
(4,601,168
|
)
|
19,861
|
|
|||||||||||
|
$
|
1,402,286
|
|
$
|
3,533,068
|
|
$
|
6,360,493
|
|
$
|
1,242,995
|
|
$
|
(8,434,449
|
)
|
$
|
4,104,393
|
|
||||||
|
Liabilities and
Shareholders' Equity
|
|
|
|
|
|
|
|||||||||||||||||
|
Current liabilities:
|
|
|
|
|
|
|
|||||||||||||||||
|
Accounts payable
|
$
|
(465,247
|
)
|
$
|
(1,408,002
|
)
|
$
|
1,932,977
|
|
$
|
16,781
|
|
$
|
38,005
|
|
$
|
114,514
|
|
|||||
|
Accrued compensation and related liabilities
|
—
|
|
70,045
|
|
26,551
|
|
5,380
|
|
—
|
|
101,976
|
|
|||||||||||
|
Accrued liabilities
|
—
|
|
82,770
|
|
252,717
|
|
13,578
|
|
—
|
|
349,065
|
|
|||||||||||
|
Long-term debt due within one year
|
—
|
|
250,000
|
|
—
|
|
—
|
|
—
|
|
250,000
|
|
|||||||||||
|
Total current liabilities
|
(465,247
|
)
|
(1,005,187
|
)
|
2,212,245
|
|
35,739
|
|
38,005
|
|
815,555
|
|
|||||||||||
|
Long-term liabilities:
|
|
|
|
|
|
|
|
|
|
|
|
|
|||||||||||
|
Long-term debt due after one year
|
—
|
|
1,049,610
|
|
—
|
|
390
|
|
—
|
|
1,050,000
|
|
|||||||||||
|
Deferred income taxes
|
—
|
|
(427
|
)
|
252,149
|
|
7,753
|
|
—
|
|
259,475
|
|
|||||||||||
|
Accrued liabilities
|
—
|
|
19,628
|
|
116,091
|
|
985
|
|
—
|
|
136,704
|
|
|||||||||||
|
Total long-term liabilities
|
—
|
|
1,068,811
|
|
368,240
|
|
9,128
|
|
—
|
|
1,446,179
|
|
|||||||||||
|
Total shareholders' equity
|
1,867,533
|
|
3,469,444
|
|
3,780,008
|
|
1,198,128
|
|
(8,472,454
|
)
|
1,842,659
|
|
|||||||||||
|
$
|
1,402,286
|
|
$
|
3,533,068
|
|
$
|
6,360,493
|
|
$
|
1,242,995
|
|
$
|
(8,434,449
|
)
|
$
|
4,104,393
|
|
||||||
68
Condensed Consolidating Balance Sheet
|
As of May 31, 2015 (in thousands)
|
Cintas
Corporation
|
Corp. 2
|
Subsidiary
Guarantors
|
Non-
Guarantors
|
Eliminations
|
Cintas
Corporation
Consolidated
|
|||||||||||||||||
|
Assets
|
|
|
|
|
|
|
|||||||||||||||||
|
Current assets:
|
|
|
|
|
|
|
|||||||||||||||||
|
Cash and cash equivalents
|
$
|
—
|
|
$
|
74,145
|
|
$
|
249,203
|
|
$
|
93,725
|
|
$
|
—
|
|
$
|
417,073
|
|
|||||
|
Marketable securities
|
—
|
|
—
|
|
—
|
|
16,081
|
|
—
|
|
16,081
|
|
|||||||||||
|
Accounts receivable, net
|
—
|
|
358,560
|
|
104,964
|
|
32,606
|
|
—
|
|
496,130
|
|
|||||||||||
|
Inventories, net
|
—
|
|
193,594
|
|
21,149
|
|
8,870
|
|
2,598
|
|
226,211
|
|
|||||||||||
|
Uniforms and other rental items in service
|
—
|
|
399,017
|
|
117,473
|
|
36,478
|
|
(18,963
|
)
|
534,005
|
|
|||||||||||
|
Income taxes, current
|
—
|
|
1,191
|
|
(339
|
)
|
84
|
|
—
|
|
936
|
|
|||||||||||
|
Assets held for sale
|
—
|
|
21,341
|
|
—
|
|
—
|
|
—
|
|
21,341
|
|
|||||||||||
|
Prepaid expenses and other
current assets
|
—
|
|
5,514
|
|
17,492
|
|
1,024
|
|
—
|
|
24,030
|
|
|||||||||||
|
Total current assets
|
—
|
|
1,053,362
|
|
509,942
|
|
188,868
|
|
(16,365
|
)
|
1,735,807
|
|
|||||||||||
|
Property and equipment, at cost, net
|
—
|
|
523,690
|
|
275,072
|
|
72,659
|
|
—
|
|
871,421
|
|
|||||||||||
|
Investments
|
321,083
|
|
1,956,320
|
|
895,393
|
|
956,461
|
|
(3,799,565
|
)
|
329,692
|
|
|||||||||||
|
Goodwill
|
—
|
|
—
|
|
1,180,527
|
|
15,197
|
|
(112
|
)
|
1,195,612
|
|
|||||||||||
|
Service contracts, net
|
—
|
|
42,400
|
|
34
|
|
—
|
|
—
|
|
42,434
|
|
|||||||||||
|
Other assets, net
|
1,154,596
|
|
12,373
|
|
2,741,950
|
|
3,572
|
|
(3,894,997
|
)
|
17,494
|
|
|||||||||||
|
$
|
1,475,679
|
|
$
|
3,588,145
|
|
$
|
5,602,918
|
|
$
|
1,236,757
|
|
$
|
(7,711,039
|
)
|
$
|
4,192,460
|
|
||||||
|
Liabilities and
Shareholders' Equity
|
|
|
|
|
|
|
|||||||||||||||||
|
Current liabilities:
|
|
|
|
|
|
|
|||||||||||||||||
|
Accounts payable
|
$
|
(465,247
|
)
|
$
|
(877,042
|
)
|
$
|
1,391,999
|
|
$
|
21,876
|
|
$
|
38,021
|
|
$
|
109,607
|
|
|||||
|
Accrued compensation and related liabilities
|
—
|
|
59,752
|
|
23,989
|
|
4,682
|
|
—
|
|
88,423
|
|
|||||||||||
|
Accrued liabilities
|
—
|
|
65,022
|
|
232,500
|
|
13,137
|
|
(724
|
)
|
309,935
|
|
|||||||||||
|
Liabilities held for sale
|
—
|
|
704
|
|
—
|
|
—
|
|
—
|
|
704
|
|
|||||||||||
|
Long-term debt due within one year
|
—
|
|
293
|
|
(293
|
)
|
—
|
|
—
|
|
—
|
|
|||||||||||
|
Total current liabilities
|
(465,247
|
)
|
(751,271
|
)
|
1,648,195
|
|
39,695
|
|
37,297
|
|
508,669
|
|
|||||||||||
|
Long-term liabilities:
|
|
|
|
|
|
|
|
|
|
|
|
|
|||||||||||
|
Long-term debt due after one year
|
—
|
|
1,308,452
|
|
(9,766
|
)
|
590
|
|
724
|
|
1,300,000
|
|
|||||||||||
|
Deferred income taxes
|
—
|
|
(304
|
)
|
333,929
|
|
5,702
|
|
—
|
|
339,327
|
|
|||||||||||
|
Accrued liabilities
|
—
|
|
—
|
|
111,105
|
|
904
|
|
—
|
|
112,009
|
|
|||||||||||
|
Total long-term liabilities
|
—
|
|
1,308,148
|
|
435,268
|
|
7,196
|
|
724
|
|
1,751,336
|
|
|||||||||||
|
Total shareholders' equity
|
1,940,926
|
|
3,031,268
|
|
3,519,455
|
|
1,189,866
|
|
(7,749,060
|
)
|
1,932,455
|
|
|||||||||||
|
$
|
1,475,679
|
|
$
|
3,588,145
|
|
$
|
5,602,918
|
|
$
|
1,236,757
|
|
$
|
(7,711,039
|
)
|
$
|
4,192,460
|
|
||||||
69
Condensed Consolidating Statement of Cash Flows
|
Year Ended May 31, 2016
(in thousands) |
Cintas
Corporation
|
Corp. 2
|
Subsidiary
Guarantors
|
Non-
Guarantors
|
Eliminations
|
Cintas
Corporation
Consolidated
|
|||||||||||||||||
|
Cash flows from operating activities:
|
|
|
|
|
|
|
|||||||||||||||||
|
Net income
|
$
|
693,520
|
|
$
|
388,049
|
|
$
|
308,750
|
|
$
|
3,905
|
|
$
|
(700,704
|
)
|
$
|
693,520
|
|
|||||
|
Adjustments to reconcile net income to net cash provided by (used in) operating activities:
|
|
|
|
|
|
|
|||||||||||||||||
|
Depreciation
|
—
|
|
96,885
|
|
43,441
|
|
9,365
|
|
—
|
|
149,691
|
|
|||||||||||
|
Amortization of intangible assets
|
—
|
|
14,830
|
|
304
|
|
454
|
|
—
|
|
15,588
|
|
|||||||||||
|
Stock-based compensation
|
79,293
|
|
—
|
|
—
|
|
—
|
|
—
|
|
79,293
|
|
|||||||||||
|
Gain on Storage transactions
|
—
|
|
(12,547
|
)
|
—
|
|
(3,239
|
)
|
—
|
|
(15,786
|
)
|
|||||||||||
|
Loss on Shred-it
|
—
|
|
22,470
|
|
—
|
|
1,818
|
|
—
|
|
24,288
|
|
|||||||||||
|
(Gain) loss on sale of Shred-it
|
—
|
|
(388,930
|
)
|
—
|
|
10,571
|
|
—
|
|
(378,359
|
)
|
|||||||||||
|
Deferred income taxes
|
—
|
|
(83,648
|
)
|
22,025
|
|
2,321
|
|
—
|
|
(59,302
|
)
|
|||||||||||
|
Changes in current assets and liabilities, net of acquisitions of businesses:
|
|
|
|
|
|
|
|||||||||||||||||
|
Accounts receivable, net
|
—
|
|
(30,570
|
)
|
(20,007
|
)
|
(2,185
|
)
|
—
|
|
(52,762
|
)
|
|||||||||||
|
Inventories, net
|
—
|
|
(23,917
|
)
|
2,011
|
|
(2,454
|
)
|
6,443
|
|
(17,917
|
)
|
|||||||||||
|
Uniforms and other rental items in service
|
—
|
|
(10,329
|
)
|
5,104
|
|
(1,840
|
)
|
759
|
|
(6,306
|
)
|
|||||||||||
|
Prepaid expenses and other current assets
|
—
|
|
(142
|
)
|
(939
|
)
|
116
|
|
—
|
|
(965
|
)
|
|||||||||||
|
Accounts payable
|
—
|
|
(461,203
|
)
|
465,539
|
|
(4,884
|
)
|
(16
|
)
|
(564
|
)
|
|||||||||||
|
Accrued compensation and related liabilities
|
—
|
|
9,959
|
|
2,982
|
|
571
|
|
—
|
|
13,512
|
|
|||||||||||
|
Accrued liabilities and other
|
—
|
|
(2,926
|
)
|
24,761
|
|
155
|
|
724
|
|
22,714
|
|
|||||||||||
|
Income taxes, current
|
—
|
|
1,342
|
|
(1,565
|
)
|
(577
|
)
|
—
|
|
(800
|
)
|
|||||||||||
|
Net cash provided by (used in) operating activities
|
772,813
|
|
(480,677
|
)
|
852,406
|
|
14,097
|
|
(692,794
|
)
|
465,845
|
|
|||||||||||
|
Cash flows from investing activities:
|
|
|
|
|
|
|
|||||||||||||||||
|
Capital expenditures
|
—
|
|
(151,063
|
)
|
(111,392
|
)
|
(12,930
|
)
|
—
|
|
(275,385
|
)
|
|||||||||||
|
Proceeds from redemption of marketable securities
|
—
|
|
—
|
|
—
|
|
434,179
|
|
—
|
|
434,179
|
|
|||||||||||
|
Purchase of marketable securities and investments
|
—
|
|
(3,333
|
)
|
(12,085
|
)
|
(488,765
|
)
|
10,037
|
|
(494,146
|
)
|
|||||||||||
|
Proceeds from Storage transactions, net of cash contributed
|
—
|
|
32,099
|
|
—
|
|
3,239
|
|
—
|
|
35,338
|
|
|||||||||||
|
Proceeds from sale of Shred-it
|
—
|
|
568,223
|
|
—
|
|
12,614
|
|
—
|
|
580,837
|
|
|||||||||||
|
Acquisitions of businesses, net of cash acquired
|
—
|
|
(130,786
|
)
|
—
|
|
(25,793
|
)
|
—
|
|
(156,579
|
)
|
|||||||||||
|
Other
|
94,344
|
|
154,412
|
|
(929,997
|
)
|
1,897
|
|
683,481
|
|
4,137
|
|
|||||||||||
|
Net cash provided by (used in) investing activities
|
94,344
|
|
469,552
|
|
(1,053,474
|
)
|
(75,559
|
)
|
693,518
|
|
128,381
|
|
|||||||||||
|
Cash flows from financing activities:
|
|
|
|
|
|
|
|||||||||||||||||
|
Proceeds from the issuances of debt
|
—
|
|
—
|
|
(165
|
)
|
165
|
|
—
|
|
—
|
|
|||||||||||
|
Repayment of debt
|
—
|
|
(9,151
|
)
|
10,224
|
|
(365
|
)
|
(724
|
)
|
(16
|
)
|
|||||||||||
|
Proceeds from exercise of stock-based compensation awards
|
28,226
|
|
—
|
|
—
|
|
—
|
|
—
|
|
28,226
|
|
|||||||||||
|
Dividends paid
|
(115,232
|
)
|
—
|
|
—
|
|
(41
|
)
|
—
|
|
(115,273
|
)
|
|||||||||||
|
Repurchase of common stock
|
(780,151
|
)
|
—
|
|
—
|
|
—
|
|
—
|
|
(780,151
|
)
|
|||||||||||
|
Other
|
—
|
|
1,952
|
|
(730
|
)
|
(732
|
)
|
—
|
|
490
|
|
|||||||||||
|
Net cash (used in) provided by financing activities
|
(867,157
|
)
|
(7,199
|
)
|
9,329
|
|
(973
|
)
|
(724
|
)
|
(866,724
|
)
|
|||||||||||
|
Effect of exchange rate changes on cash and cash equivalents
|
—
|
|
—
|
|
—
|
|
(5,218
|
)
|
—
|
|
(5,218
|
)
|
|||||||||||
|
Net decrease in cash and cash equivalents
|
—
|
|
(18,324
|
)
|
(191,739
|
)
|
(67,653
|
)
|
—
|
|
(277,716
|
)
|
|||||||||||
|
Cash and cash equivalents at beginning of year
|
—
|
|
74,145
|
|
249,203
|
|
93,725
|
|
—
|
|
417,073
|
|
|||||||||||
|
Cash and cash equivalents at end of year
|
$
|
—
|
|
$
|
55,821
|
|
$
|
57,464
|
|
$
|
26,072
|
|
$
|
—
|
|
$
|
139,357
|
|
|||||
70
Condensed Consolidating Statement of Cash Flows
|
Year Ended May 31, 2015
(in thousands) |
Cintas
Corporation
|
Corp. 2
|
Subsidiary
Guarantors
|
Non-
Guarantors
|
Eliminations
|
Cintas
Corporation
Consolidated
|
|||||||||||||||||
|
Cash flows from operating activities:
|
|
|
|
|
|
|
|||||||||||||||||
|
Net income
|
$
|
430,618
|
|
$
|
134,861
|
|
$
|
281,160
|
|
$
|
17,001
|
|
$
|
(433,022
|
)
|
$
|
430,618
|
|
|||||
|
Adjustments to reconcile net income to net cash
provided by (used in) operating activities:
|
|
|
|
|
|
|
|||||||||||||||||
|
Depreciation
|
—
|
|
87,186
|
|
43,013
|
|
10,425
|
|
—
|
|
140,624
|
|
|||||||||||
|
Amortization of intangible assets
|
—
|
|
13,972
|
|
60
|
|
426
|
|
—
|
|
14,458
|
|
|||||||||||
|
Stock-based compensation
|
47,002
|
|
—
|
|
—
|
|
—
|
|
—
|
|
47,002
|
|
|||||||||||
|
Gain on Storage transactions
|
—
|
|
(31,113
|
)
|
—
|
|
(7,460
|
)
|
—
|
|
(38,573
|
)
|
|||||||||||
|
Loss on Shred-it
|
—
|
|
3,190
|
|
—
|
|
661
|
|
—
|
|
3,851
|
|
|||||||||||
|
Gain on sale of stock of an equity method
investment
|
—
|
|
—
|
|
(21,739
|
)
|
—
|
|
—
|
|
(21,739
|
)
|
|||||||||||
|
Deferred income taxes
|
—
|
|
67
|
|
18,565
|
|
2,234
|
|
—
|
|
20,866
|
|
|||||||||||
|
Changes in current assets and liabilities, net of acquisitions of businesses:
|
|
|
|
|
|
|
|||||||||||||||||
|
Accounts receivable, net
|
—
|
|
4,370
|
|
(7,095
|
)
|
1,282
|
|
—
|
|
(1,443
|
)
|
|||||||||||
|
Inventories, net
|
—
|
|
22,405
|
|
(405
|
)
|
(487
|
)
|
2,272
|
|
23,785
|
|
|||||||||||
|
Uniforms and other rental items in service
|
—
|
|
(24,351
|
)
|
(5,006
|
)
|
(2,764
|
)
|
127
|
|
(31,994
|
)
|
|||||||||||
|
Prepaid expenses and other current assets
|
—
|
|
(345
|
)
|
(2,740
|
)
|
(117
|
)
|
—
|
|
(3,202
|
)
|
|||||||||||
|
Accounts payable
|
—
|
|
(322,461
|
)
|
289,110
|
|
(98
|
)
|
4
|
|
(33,445
|
)
|
|||||||||||
|
Accrued compensation and related liabilities
|
—
|
|
3,171
|
|
1,400
|
|
(1,337
|
)
|
—
|
|
3,234
|
|
|||||||||||
|
Accrued liabilities and other
|
—
|
|
(15,829
|
)
|
42,551
|
|
6,322
|
|
22
|
|
33,066
|
|
|||||||||||
|
Income taxes, current
|
—
|
|
358
|
|
(6,155
|
)
|
(1,035
|
)
|
—
|
|
(6,832
|
)
|
|||||||||||
|
Net cash provided by (used in) operating activities
|
477,620
|
|
(124,519
|
)
|
632,719
|
|
25,053
|
|
(430,597
|
)
|
580,276
|
|
|||||||||||
|
Cash flows from investing activities:
|
|
|
|
|
|
|
|||||||||||||||||
|
Capital expenditures
|
—
|
|
(110,658
|
)
|
(92,600
|
)
|
(14,462
|
)
|
—
|
|
(217,720
|
)
|
|||||||||||
|
Proceeds from redemption of marketable securities
|
—
|
|
—
|
|
—
|
|
161,938
|
|
—
|
|
161,938
|
|
|||||||||||
|
Purchase of marketable securities and investments
|
—
|
|
(1,827
|
)
|
38,731
|
|
(179,130
|
)
|
(53,245
|
)
|
(195,471
|
)
|
|||||||||||
|
Proceeds from Storage transactions, net of cash contributed
|
—
|
|
93,387
|
|
—
|
|
65,041
|
|
—
|
|
158,428
|
|
|||||||||||
|
Proceeds from Shredding Transaction
|
—
|
|
3,344
|
|
—
|
|
—
|
|
—
|
|
3,344
|
|
|||||||||||
|
Proceeds from sale of stock of an equity method investment
|
—
|
|
—
|
|
29,933
|
|
—
|
|
—
|
|
29,933
|
|
|||||||||||
|
Dividends received on equity method investment
|
—
|
|
—
|
|
5,247
|
|
—
|
|
—
|
|
5,247
|
|
|||||||||||
|
Dividends received on Shred-it
|
—
|
|
113,400
|
|
—
|
|
—
|
|
—
|
|
113,400
|
|
|||||||||||
|
Acquisitions of businesses, net of cash acquired
|
—
|
|
(15,495
|
)
|
—
|
|
—
|
|
—
|
|
(15,495
|
)
|
|||||||||||
|
Other
|
235,951
|
|
42,199
|
|
(764,336
|
)
|
3,705
|
|
483,864
|
|
1,383
|
|
|||||||||||
|
Net cash provided by (used in) investing activities
|
235,951
|
|
124,350
|
|
(783,025
|
)
|
37,092
|
|
430,619
|
|
44,987
|
|
|||||||||||
|
Cash flows from financing activities:
|
|
|
|
|
|
|
|||||||||||||||||
|
Proceeds from the issuance of debt
|
—
|
|
—
|
|
(2,615
|
)
|
2,615
|
|
—
|
|
—
|
|
|||||||||||
|
Repayment of debt
|
—
|
|
(1,178
|
)
|
2,962
|
|
(2,280
|
)
|
(22
|
)
|
(518
|
)
|
|||||||||||
|
Proceeds from exercise of stock-based compensation awards
|
40,230
|
|
—
|
|
—
|
|
—
|
|
—
|
|
40,230
|
|
|||||||||||
|
Dividends paid
|
(201,831
|
)
|
—
|
|
—
|
|
(60
|
)
|
—
|
|
(201,891
|
)
|
|||||||||||
|
Repurchase of common stock
|
(551,970
|
)
|
—
|
|
—
|
|
—
|
|
—
|
|
(551,970
|
)
|
|||||||||||
|
Other
|
—
|
|
1,952
|
|
(363
|
)
|
—
|
|
—
|
|
1,589
|
|
|||||||||||
|
Net cash (used in) provided by financing activities
|
(713,571
|
)
|
774
|
|
(16
|
)
|
275
|
|
(22
|
)
|
(712,560
|
)
|
|||||||||||
|
Effect of exchange rate changes on cash and cash equivalents
|
—
|
|
—
|
|
—
|
|
(8,918
|
)
|
—
|
|
(8,918
|
)
|
|||||||||||
|
Net increase (decrease) in cash and cash equivalents
|
—
|
|
605
|
|
(150,322
|
)
|
53,502
|
|
—
|
|
(96,215
|
)
|
|||||||||||
|
Cash and cash equivalents at beginning of year
|
—
|
|
73,540
|
|
399,525
|
|
40,223
|
|
—
|
|
513,288
|
|
|||||||||||
|
Cash and cash equivalents at end of year
|
$
|
—
|
|
$
|
74,145
|
|
$
|
249,203
|
|
$
|
93,725
|
|
$
|
—
|
|
$
|
417,073
|
|
|||||
71
Condensed Consolidating Statement of Cash Flows
|
Year Ended May 31, 2014
(in thousands) |
Cintas
Corporation
|
Corp. 2
|
Subsidiary
Guarantors
|
Non-
Guarantors
|
Eliminations
|
Cintas
Corporation
Consolidated
|
|||||||||||||||||
|
Cash flows from operating activities:
|
|
|
|
|
|
|
|||||||||||||||||
|
Net income
|
$
|
374,442
|
|
$
|
162,263
|
|
$
|
205,009
|
|
$
|
20,809
|
|
$
|
(388,081
|
)
|
$
|
374,442
|
|
|||||
|
Adjustments to reconcile net income to net cash provided by operating activities:
|
|
|
|
|
|
|
|||||||||||||||||
|
Depreciation
|
—
|
|
110,100
|
|
44,856
|
|
13,264
|
|
—
|
|
168,220
|
|
|||||||||||
|
Amortization of intangible assets
|
—
|
|
20,547
|
|
153
|
|
1,942
|
|
—
|
|
22,642
|
|
|||||||||||
|
Stock-based compensation
|
29,875
|
|
—
|
|
—
|
|
—
|
|
—
|
|
29,875
|
|
|||||||||||
|
(Gain) loss on Shred-it
|
—
|
|
(113,511
|
)
|
—
|
|
5,070
|
|
—
|
|
(108,441
|
)
|
|||||||||||
|
Shredding Transaction asset impairment charge
|
—
|
|
—
|
|
16,143
|
|
—
|
|
—
|
|
16,143
|
|
|||||||||||
|
Shredding Transaction costs
|
—
|
|
—
|
|
26,057
|
|
—
|
|
—
|
|
26,057
|
|
|||||||||||
|
Deferred income taxes
|
—
|
|
(2
|
)
|
47,373
|
|
(262
|
)
|
—
|
|
47,109
|
|
|||||||||||
|
Changes in current assets and liabilities, net of acquisitions of businesses:
|
|
|
|
|
|
|
|||||||||||||||||
|
Accounts receivable, net
|
—
|
|
(53,053
|
)
|
(1,300
|
)
|
(1,878
|
)
|
—
|
|
(56,231
|
)
|
|||||||||||
|
Inventories, net
|
—
|
|
(14,735
|
)
|
4,839
|
|
450
|
|
(1,616
|
)
|
(11,062
|
)
|
|||||||||||
|
Uniforms and other rental items in service
|
—
|
|
(11,004
|
)
|
557
|
|
(973
|
)
|
(15
|
)
|
(11,435
|
)
|
|||||||||||
|
Prepaid expenses and other current assets
|
—
|
|
(386
|
)
|
(1,844
|
)
|
53
|
|
—
|
|
(2,177
|
)
|
|||||||||||
|
Accounts payable
|
—
|
|
25,573
|
|
23,246
|
|
(18,374
|
)
|
1
|
|
30,446
|
|
|||||||||||
|
Accrued compensation and related liabilities
|
—
|
|
5,778
|
|
4,947
|
|
206
|
|
—
|
|
10,931
|
|
|||||||||||
|
Accrued liabilities and other
|
—
|
|
50,008
|
|
4,897
|
|
(689
|
)
|
21
|
|
54,237
|
|
|||||||||||
|
Income taxes, current
|
—
|
|
2,621
|
|
9,902
|
|
2,690
|
|
—
|
|
15,213
|
|
|||||||||||
|
Net cash provided by operating activities
|
404,317
|
|
184,199
|
|
384,835
|
|
22,308
|
|
(389,690
|
)
|
605,969
|
|
|||||||||||
|
Cash flows from investing activities:
|
|
|
|
|
|
|
|||||||||||||||||
|
Capital expenditures
|
—
|
|
(123,978
|
)
|
(9,591
|
)
|
(12,011
|
)
|
—
|
|
(145,580
|
)
|
|||||||||||
|
Proceeds from redemption of marketable securities
|
—
|
|
—
|
|
5,659
|
|
48,537
|
|
—
|
|
54,196
|
|
|||||||||||
|
Purchase of marketable securities and investments
|
—
|
|
(151,063
|
)
|
(242,956
|
)
|
(48,387
|
)
|
378,548
|
|
(63,858
|
)
|
|||||||||||
|
Proceeds from Shredding Transaction, net of cash contributed
|
—
|
|
180,000
|
|
—
|
|
(641
|
)
|
—
|
|
179,359
|
|
|||||||||||
|
Acquisitions of businesses, net of cash acquired
|
—
|
|
(13,199
|
)
|
—
|
|
(20,242
|
)
|
—
|
|
(33,441
|
)
|
|||||||||||
|
Other
|
13,783
|
|
(50,446
|
)
|
8,108
|
|
12,173
|
|
11,163
|
|
(5,219
|
)
|
|||||||||||
|
Net cash provided by (used in) investing activities
|
13,783
|
|
(158,686
|
)
|
(238,780
|
)
|
(20,571
|
)
|
389,711
|
|
(14,543
|
)
|
|||||||||||
|
Cash flows from financing activities:
|
|
|
|
|
|
|
|||||||||||||||||
|
Proceeds from the issuance of debt
|
—
|
|
—
|
|
(2,445
|
)
|
2,445
|
|
—
|
|
—
|
|
|||||||||||
|
Repayment of debt
|
—
|
|
(8,436
|
)
|
(106
|
)
|
376
|
|
(21
|
)
|
(8,187
|
)
|
|||||||||||
|
Proceeds from exercise of stock-based compensation awards
|
41,902
|
|
—
|
|
—
|
|
—
|
|
—
|
|
41,902
|
|
|||||||||||
|
Dividends paid
|
(93,293
|
)
|
—
|
|
—
|
|
(27
|
)
|
—
|
|
(93,320
|
)
|
|||||||||||
|
Repurchase of common stock
|
(370,599
|
)
|
—
|
|
—
|
|
—
|
|
—
|
|
(370,599
|
)
|
|||||||||||
|
Other
|
3,890
|
|
1,952
|
|
8,951
|
|
(14,324
|
)
|
—
|
|
469
|
|
|||||||||||
|
Net cash (used in) provided by financing activities
|
(418,100
|
)
|
(6,484
|
)
|
6,400
|
|
(11,530
|
)
|
(21
|
)
|
(429,735
|
)
|
|||||||||||
|
Effect of exchange rate changes on cash and cash equivalents
|
—
|
|
—
|
|
—
|
|
(676
|
)
|
—
|
|
(676
|
)
|
|||||||||||
|
Net increase (decrease) in cash and cash equivalents
|
—
|
|
19,029
|
|
152,455
|
|
(10,469
|
)
|
—
|
|
161,015
|
|
|||||||||||
|
Cash and cash equivalents at beginning of year
|
—
|
|
54,511
|
|
247,070
|
|
50,692
|
|
—
|
|
352,273
|
|
|||||||||||
|
Cash and cash equivalents at end of year
|
$
|
—
|
|
$
|
73,540
|
|
$
|
399,525
|
|
$
|
40,223
|
|
$
|
—
|
|
$
|
513,288
|
|
|||||
72
Accountants on Accounting and Financial Disclosure
None.
Disclosure Controls and Procedures
With the participation of Cintas' management, including Cintas' Chief Executive Officer, Chief Financial Officer, General Counsel and Controllers, Cintas has evaluated the effectiveness of the disclosure controls and procedures (as defined in Rules 13a-15(e) and 15d-15(e) under the Exchange Act) as of
May 31, 2016
. Based on such evaluation, Cintas' management, including Cintas' Chief Executive Officer, Chief Financial Officer, General Counsel and Controllers, have concluded that Cintas' disclosure controls and procedures were effective as of
May 31, 2016
, in ensuring (i) information required to be disclosed by Cintas in the reports that it files or submits under the Exchange Act is recorded, processed, summarized and reported, within the time periods specified in the SEC's rules and forms and (ii) information required to be disclosed by Cintas in the reports that it files or submits under the Exchange Act is accumulated and communicated to Cintas' management, including its principal executive and principal financial officers, or persons performing similar functions, as appropriate to allow timely decisions regarding required disclosure.
Internal Control over Financial Reporting
Management's Report on Internal Control over Financial Reporting and the Report of Ernst & Young LLP, Independent Registered Public Accounting Firm thereon are set forth in Part II, Item 8 of this Annual Report on Form 10-K and are incorporated by reference herein.
There were no changes in Cintas' internal control over financial reporting (as defined in Rules 13a-15(f) and 15d-15(f) under the Exchange Act) during the fiscal quarter ended
May 31, 2016
, that have materially affected, or are reasonably likely to materially affect, Cintas' internal control over financial reporting.
None.
73
The information required under this item is incorporated herein by reference to the material contained in Cintas' definitive proxy statement for the
2016
annual meeting of shareholders to be filed with the SEC pursuant to Regulation 14A not later than 120 days after the close of the fiscal year (the Proxy Statement).
The information required under this item is incorporated herein by reference to the material contained in the Proxy Statement.
Owners and Management and Related Stockholder Matters
The information required under this item is incorporated herein by reference to the material contained in the Proxy Statement, except that the information required by Item 201(d) of Regulation S-K can be found below.
The following table provides information about Cintas' common stock that may be issued under Cintas' equity compensation plans as of
May 31, 2016
.
Equity Compensation Plan Information
|
Plan category
|
Number of shares
to be issued
upon exercise of
outstanding options
(1)
|
Weighted average
exercise price of
outstanding options
(1)
|
Number of shares
remaining available
for future issuance
under equity
compensation plans
|
||||||
|
Equity compensation plans approved by shareholders
|
8,419,907
|
|
$
|
61.83
|
|
7,174,600
|
|
||
|
Equity compensation plans not approved by shareholders
|
—
|
|
—
|
|
—
|
|
|||
|
Total
|
8,419,907
|
|
$
|
61.83
|
|
7,174,600
|
|
||
(1)
Excludes
2,603,436
unvested restricted stock units.
Transactions, and Director Independence
The information required under this item is incorporated herein by reference to the material contained in the Proxy Statement.
The information required under this item is incorporated herein by reference to the material contained in the Proxy Statement.
74
|
(a) (1)
|
|
Financial Statements. All financial statements required to be filed by Item 8 of Form 10-K and included in this Annual Report are listed in Item 8. No additional financial statements are filed because the requirements for paragraph (d) under Item 14 are not applicable to Cintas.
|
|
|
(a) (2)
|
|
Financial Statement Schedule:
|
|
|
|
|
For each of the three years in the period ended May 31, 2016.
|
|
|
|
|
Schedule II: Valuation and Qualifying Accounts and Reserves.
|
|
|
|
|
All other schedules are omitted because they are not applicable, or not required, or because the required information is included in the Consolidated Financial Statements or Notes thereto.
|
|
|
(a) (3)
|
|
Exhibits.
|
|
|
|
|
|
All documents referenced below were filed pursuant to the Exchange Act by Cintas Corporation, file number 000-11399, unless otherwise noted.
|
|
Exhibit
Number
|
|
Description of Exhibit
|
|
|
2.1
|
|
***
|
JV Framework Agreement, dated March 18, 2014, by and among Cintas Corporation No.2, CC Shredding Holdco LLC and CC Dutch Shredding Holdco BV, each a wholly owned subsidiary of Cintas, and Shred-It International Inc., Boost JV LP, Boost Holdings LP and Boost GP Corp (Incorporated by reference to Exhibit 2.1 to Cintas' Current Report on Form 8-K dated March 19, 2014)
|
|
2.2
|
|
***
|
Securities Purchase Agreement, dated as of July 15, 2015, by and among Cintas, Shred-it International Inc., Stericycle, Inc. and the other parties thereto (Incorporated by reference to Exhibit 2.1 to Cintas' Current Report on Form 8-K dated October 1, 2015.)
|
|
3.1
|
|
|
Restated Articles of Incorporation, as amended (Incorporated by reference to Exhibit 4.1 to Cintas' Registration Statement No. 333-160926 on Form S-3 filed on December 3, 2007.)
|
|
3.2
|
|
|
Amended and Restated By-laws (Incorporated by reference to Exhibit 3 to Cintas' Current Report on Form 8-K dated October 14, 2008.)
|
|
4.1
|
|
|
Indenture dated as of May 28, 2002, among Cintas Corporation No. 2, as issuer, Cintas Corporation, as parent guarantor, the subsidiary guarantors thereto and Wachovia Bank, National Association, as trustee (Incorporated by reference to Cintas' Annual Report on Form 10-K for the year ended May 31, 2002.)
|
|
4.2
|
|
|
Form of 6.15% Senior Note due 2036 (Incorporated by reference to Cintas' Current Report on Form 8-K dated August 17, 2006.)
|
|
4.3
|
|
|
Form of 6.125% Senior Note due 2017 (Incorporated by reference to Cintas' Current Report on Form 8-K dated December 6, 2007.)
|
|
4.4
|
|
|
Form of 2.85% Senior Note due 2016 (Incorporated by reference to Cintas' Current Report on Form 8-K dated May 23, 2011.)
|
|
4.5
|
|
|
Form of 4.30% Senior Note due 2021 (Incorporated by reference to Cintas' Current report on Form 8-K dated May 23, 2011.)
|
|
4.6
|
|
Form of 3.25% Senior Note due 2022 (Incorporated by reference to Cintas' Current Report on Form 8-K dated June 8, 2012.)
|
|
|
10.1
|
|
|
Credit Agreement dated as of May 28, 2004 by and among Cintas Corporation No. 2, as Borrower, the lenders named in such Credit Agreement and KeyBank National Association, as agent for the lenders (Incorporated by reference to Cintas' Quarterly Report on Form 10-Q for the quarter ended February 28, 2011.)
|
|
10.2
|
|
|
First Amendment Agreement to the Credit Agreement dated as of May 28, 2004, dated as of February 24, 2006 (Incorporated by reference to Cintas' Current Report on Form 8-K dated October 1, 2010.)
|
|
10.3
|
|
|
Second Amendment Agreement to the Credit Agreement dated as of May 28, 2004, dated as of March 16, 2007 (Incorporated by reference to Cintas' Current Report on Form 8-K dated October 1, 2010.)
|
|
10.4
|
|
|
Third Amendment Agreement to the Credit Agreement dated as of May 28, 2004, dated as of May 31, 2007 (Incorporated by reference to Cintas' Current Report on Form 8-K dated October 1, 2010.)
|
|
10.5
|
|
|
Fourth Amendment Agreement to the Credit Agreement dated as of May 28, 2004, dated as of September 27, 2010 (Incorporated by reference to Cintas' Quarterly Report on Form 10-Q for the quarter ended February 28, 2011.)
|
|
10.6
|
|
Fifth Amendment Agreement to the Credit Agreement dated as of May 28, 2004, dated as of October 7, 2011 (Incorporated by reference to Cintas' Current Report on Form 8-K dated October 7, 2011.)
|
|
|
10.7
|
|
Sixth Amendment Agreement to the Credit Agreement dated as of May 28, 2004, dated as of May 29, 2014 (Incorporated by reference to Exhibit 2.1 to Cintas' Current Report on Current Report on Form 8-K dated May 30, 2014.)
|
|
|
10.8
|
|
Seventh Amendment Agreement to the Credit Agreement dated as of May 28, 2004, dated as of June 23, 2016 (Incorporated by reference to Cintas’ Current Report on Form 8-K dated June 28, 2016.)
|
|
|
10.9
|
|
*
|
Incentive Stock Option Plan (Incorporated by reference to Cintas' Registration Statement No. 33-23228 on Form S-8 filed under the Securities Act of 1933.)
|
|
10.10
|
|
*
|
Partners' Plan, as Amended (Incorporated by reference to Cintas' Registration Statement No. 33-56623 on Form S-8 filed under the Securities Act of 1933.)
|
|
10.11
|
|
*
|
1999 Cintas Corporation Stock Option Plan (Incorporated by reference to Cintas' Registration Statement No. 333-44654 on form S-8 filed under the Securities Act of 1933.)
|
|
10.12
|
|
*
|
Directors' Deferred Compensation Plan (Incorporated by reference to Cintas' Quarterly Report on Form 10-Q for the quarter ended November 30, 2000.)
|
|
10.13
|
|
*
|
Amended and Restated 2003 Directors' Stock Option Plan (Incorporated by reference to Cintas' Annual Report Form 10-K for the year ended May 31, 2004.)
|
|
10.14
|
|
*
|
Form of agreement signed by Officers, General/Branch Managers, Professionals and Key Managers, including Executive Officers (Incorporated by reference to Cintas' Quarterly Report on Form 10-Q for the quarter ended February 28, 2005.)
|
|
10.15
|
|
*
|
President and CEO Executive Compensation Plan (Incorporated by reference to Cintas' Annual Report on Form 10-K for the year ended May 31, 2005.)
|
|
10.16
|
|
*
|
2006 Executive Incentive Plan (Incorporated by reference to Cintas' Annual Report on Form 10-K for the year ended May 31, 2005.)
|
|
10.17
|
|
*
|
2005 Equity Compensation Plan (Incorporated by reference to Cintas' Definitive Proxy Statement on Schedule 14A filed on September 1, 2005.)
|
|
10.18
|
|
*
|
Criteria for Performance Evaluation of the President and CEO (Incorporated by reference to Cintas' Annual Report on Form 10-K for the year ended May 31, 2006.)
|
|
10.19
|
|
*
|
2007 Executive Incentive Plan (Incorporated by reference to Cintas' Annual Report on Form 10-K for the year ended May 31, 2006.)
|
|
10.20
|
|
*
|
Amendment No. 1 to 2005 Equity Compensation Plan (Incorporated by reference to Cintas' Annual Report on Form 10-K for the year ended May 31, 2011.)
|
|
10.21
|
|
*
|
Form of Restricted Stock Agreement (Incorporated by reference to Cintas' Annual Report on Form 10-K for the year ended May 31, 2011.)
|
|
10.22
|
|
*
|
Amendment No. 2 to Cintas Corporation 2005 Equity Compensation Plan (Incorporated by reference to Cintas' Current Report on Form 8-K dated July 27, 2012.)
|
|
10.23
|
|
*
|
Form of Restricted Stock Agreement (Incorporated by reference to Cintas' Current Report on Form 8-K dated July 27, 2012.)
|
|
10.24
|
|
*
|
Amendment No. 3 to Cintas Corporation 2005 Equity Compensation Plan (Incorporated by reference to Exhibit 10.4 to Cintas' Current Report on Form 8-K dated October 23, 2013.)
|
|
10.25
|
|
*
|
Amendment No. 4 to Cintas Corporation 2005 Equity Compensation Plan (Incorporated by reference to Exhibit 10.5 to Cintas' Current Report on Form 8-K dated October 22, 2014.)
|
|
10.26
|
|
*
|
Cintas Corporation Management Incentive Plan (Incorporated by reference to Exhibit 10.5 to Cintas' Current Report on Form 8-K dated October 23, 2013.)
|
|
14
|
|
|
Code of Ethics (Incorporated by reference to Cintas' Annual Report on Form 10-K for the year ended May 31, 2004.)
|
|
21
|
|
**
|
Subsidiaries of the Registrant
|
|
23
|
|
**
|
Consent of Independent Registered Public Accounting Firm
|
|
31.1
|
|
**
|
Certification of Principal Executive Officer, Pursuant to Rule 13a-14(a) of the Securities Exchange Act of 1934
|
|
31.2
|
|
**
|
Certification of Principal Financial Officer, Pursuant to Rule 13a-14(a) of the Securities Exchange Act of 1934
|
|
32.1
|
|
**
|
Certification of Chief Executive Officer, Pursuant to 18 U.S.C. § 1350
|
|
32.2
|
|
**
|
Certification of Chief Financial Officer, Pursuant to 18 U.S.C. § 1350
|
|
101.INS
|
|
**
|
XBRL Instance Document
|
|
101.SCH
|
|
**
|
XBRL Taxonomy Extension Schema Document
|
|
101.CAL
|
|
**
|
XBRL Taxonomy Extension Calculation Linkbase Document
|
|
101.DEF
|
|
**
|
XBRL Taxonomy Extension Definition Linkbase Document
|
|
101.LAB
|
|
**
|
XBRL Taxonomy Extension Label Linkbase Document
|
|
101.PRE
|
|
**
|
XBRL Taxonomy Extension Presentation Linkbase Document
|
|
*
|
Management compensatory contracts
|
|
**
|
Filed herewith
|
|
***
|
Certain exhibits and schedules have been omitted and Cintas agrees to furnish supplementally to the Securities and Exchange Commission a copy of any omitted exhibits upon request.
|
75
Signatures
Pursuant to the requirements of Section 13 or 15(d) of the Securities Exchange Act of 1934, the Registrant has duly caused this report to be signed on its behalf by the undersigned, thereunto duly authorized.
|
CINTAS CORPORATION
|
||
|
By:
|
/s/
|
Scott D. Farmer
|
|
Scott D. Farmer
Chief Executive Officer
|
||
DATE SIGNED:
July 29, 2016
Pursuant to the requirements of the Securities Exchange Act of 1934, this report has been signed by the following persons on behalf of the Registrant and in the capacities and on the dates indicated.
|
Signature
|
|
Capacity
|
|
Date
|
|
|
|
|
|
|
|
|
|
/s/
|
Robert J. Kohlhepp
Robert J. Kohlhepp
|
|
Chairman of the Board of Directors
|
|
July 29, 2016
|
|
/s/
|
Scott D. Farmer
Scott D. Farmer
|
|
Chief Executive Officer and Director (Principal Executive Officer)
|
|
July 29, 2016
|
|
/s/
|
Ronald W. Tysoe
Ronald W. Tysoe
|
|
Director
|
|
July 29, 2016
|
|
/s/
|
John F. Barrett
John F. Barrett
|
|
Director
|
|
July 29, 2016
|
|
/s/
|
James J. Johnson
James J. Johnson
|
|
Director
|
|
July 29, 2016
|
|
/s/
|
J. Michael Hansen
J. Michael Hansen
|
|
Vice President and Chief Financial Officer
(Principal Financial and Accounting Officer)
|
|
July 29, 2016
|
76
Cintas Corporation
Schedule II — Valuation and Qualifying Accounts and Reserves
|
|
|
|
|
||||||||||||
|
(In thousands)
|
Balance at
Beginning
of Year
|
(1)
Additions
|
(2)
Deductions
|
Balance at
End
of Year
|
|||||||||||
|
Allowance for Doubtful Accounts
|
|
|
|
|
|||||||||||
|
May 31, 2014
|
$
|
15,855
|
|
$
|
5,607
|
|
$
|
6,556
|
|
$
|
14,906
|
|
|||
|
May 31, 2015
|
$
|
14,906
|
|
$
|
5,718
|
|
$
|
4,950
|
|
$
|
15,674
|
|
|||
|
May 31, 2016
|
$
|
15,674
|
|
$
|
8,646
|
|
$
|
4,716
|
|
$
|
19,604
|
|
|||
|
Reserve for Obsolete Inventory
|
|
|
|
|
|||||||||||
|
May 31, 2014
|
$
|
29,487
|
|
$
|
3,147
|
|
$
|
1,961
|
|
$
|
30,673
|
|
|||
|
May 31, 2015
|
$
|
30,673
|
|
$
|
3,278
|
|
$
|
3,244
|
|
$
|
30,707
|
|
|||
|
May 31, 2016
|
$
|
30,707
|
|
$
|
5,219
|
|
$
|
3,010
|
|
$
|
32,916
|
|
|||
|
(1)
|
Represents amounts charged to expense to increase reserve for estimated future bad debts or to increase reserve for obsolete inventory. Amounts related to inventory are computed by performing a thorough analysis of future marketability by specific inventory item as well as an estimate based on Cintas' historical rates of obsolesence.
|
|
(2)
|
Represents reductions in the balance sheet reserve due to the actual write-off of non-collectible accounts receivable or the physical disposal of obsolete inventory items. These amounts do not impact Cintas' consolidated income statement.
|
77
Exhibit Index
|
2.1
|
|
***
|
JV Framework Agreement, dated March 18, 2014, by and among Cintas Corporation No.2, CC Shredding Holdco LLC and CC Dutch Shredding Holdco BV, each a wholly owned subsidiary of Cintas, and Shred-It International Inc., Boost JV LP, Boost Holdings LP and Boost GP Corp (Incorporated by reference to Exhibit 2.1 to Cintas' Current Report on Form 8-K dated March 19, 2014)
|
|
2.2
|
|
***
|
Securities Purchase Agreement, dated as of July 15, 2015, by and among Cintas, Shred-it International Inc., Stericycle, Inc. and the other parties thereto (Incorporated by reference to Exhibit 2.1 to Cintas' Current Report on Form 8-K dated October 1, 2015.)
|
|
3.1
|
|
|
Restated Articles of Incorporation, as amended (Incorporated by reference to Exhibit 4.1 to Cintas' Registration Statement No. 333-160926 on Form S-3 filed on December 3, 2007.)
|
|
3.2
|
|
|
Amended and Restated By-laws (Incorporated by reference to Exhibit 3 to Cintas' Current Report on Form 8-K dated October 14, 2008.)
|
|
4.1
|
|
|
Indenture dated as of May 28, 2002, among Cintas Corporation No. 2, as issuer, Cintas Corporation, as parent guarantor, the subsidiary guarantors thereto and Wachovia Bank, National Association, as trustee (Incorporated by reference to Cintas' Annual Report on Form 10-K for the year ended May 31, 2002.)
|
|
4.2
|
|
|
Form of 6.15% Senior Note due 2036 (Incorporated by reference to Cintas' Current Report on Form 8-K dated August 17, 2006.)
|
|
4.3
|
|
|
Form of 6.125% Senior Note due 2017 (Incorporated by reference to Cintas' Current Report on Form 8-K dated December 6, 2007.)
|
|
4.4
|
|
|
Form of 2.85% Senior Note due 2016 (Incorporated by reference to Cintas' Current Report on Form 8-K dated May 23, 2011.)
|
|
4.5
|
|
|
Form of 4.30% Senior Note due 2021 (Incorporated by reference to Cintas' Current report on Form 8-K dated May 23, 2011.)
|
|
4.6
|
|
Form of 3.25% Senior Note due 2022 (Incorporated by reference to Cintas' Current Report on Form 8-K dated June 8, 2012.)
|
|
|
10.1
|
|
|
Credit Agreement dated as of May 28, 2004 by and among Cintas Corporation No. 2, as Borrower, the lenders named in such Credit Agreement and KeyBank National Association, as agent for the lenders (Incorporated by reference to Cintas' Quarterly Report on Form 10-Q for the quarter ended February 28, 2011.)
|
|
10.2
|
|
|
First Amendment Agreement to the Credit Agreement dated as of May 28, 2004, dated as of February 24, 2006 (Incorporated by reference to Cintas' Current Report on Form 8-K dated October 1, 2010.)
|
|
10.3
|
|
|
Second Amendment Agreement to the Credit Agreement dated as of May 28, 2004, dated as of March 16, 2007 (Incorporated by reference to Cintas' Current Report on Form 8-K dated October 1, 2010.)
|
|
10.4
|
|
|
Third Amendment Agreement to the Credit Agreement dated as of May 28, 2004, dated as of May 31, 2007 (Incorporated by reference to Cintas' Current Report on Form 8-K dated October 1, 2010.)
|
|
10.5
|
|
|
Fourth Amendment Agreement to the Credit Agreement dated as of May 28, 2004, dated as of September 27, 2010 (Incorporated by reference to Cintas' Quarterly Report on Form 10-Q for the quarter ended February 28, 2011.)
|
|
10.6
|
|
Fifth Amendment Agreement to the Credit Agreement dated as of May 28, 2004, dated as of October 7, 2011 (Incorporated by reference to Cintas' Current Report on Form 8-K dated October 7, 2011.)
|
|
|
10.7
|
|
Sixth Amendment Agreement to the Credit Agreement dated as of May 28, 2004, dated as of May 29, 2014 (Incorporated by reference to Exhibit 2.1 to Cintas' Current Report on Form 8-K dated May 30, 2014.)
|
|
78
|
10.8
|
|
Seventh Amendment Agreement to the Credit Agreement dated as of May 28, 2004, dated as of June 23, 2016 (Incorporated by reference to Cintas’ Current Report on Form 8-K dated June 28, 2016.)
|
|
|
10.9
|
|
*
|
Incentive Stock Option Plan (Incorporated by reference to Cintas' Registration Statement No. 33-23228 on Form S-8 filed under the Securities Act of 1933.)
|
|
10.10
|
|
*
|
Partners' Plan, as Amended (Incorporated by reference to Cintas' Registration Statement No. 33-56623 on Form S-8 filed under the Securities Act of 1933.)
|
|
10.11
|
|
*
|
1999 Cintas Corporation Stock Option Plan (Incorporated by reference to Cintas' Registration Statement No. 333-44654 on form S-8 filed under the Securities Act of 1933.)
|
|
10.12
|
|
*
|
Directors' Deferred Compensation Plan (Incorporated by reference to Cintas' Quarterly Report on Form 10-Q for the quarter ended November 30, 2000.)
|
|
10.13
|
|
*
|
Amended and Restated 2003 Directors' Stock Option Plan (Incorporated by reference to Cintas' Annual Report on Form 10-K for the year ended May 31, 2004.)
|
|
10.14
|
|
*
|
Form of agreement signed by Officers, General/Branch Managers, Professionals and Key Managers, including Executive Officers (Incorporated by reference to Cintas' Quarterly Report on Form 10-Q for the quarter ended February 28, 2005.)
|
|
10.15
|
|
*
|
President and CEO Executive Compensation Plan (Incorporated by reference to Cintas' Annual Report on Form 10-K for the year ended May 31, 2005.)
|
|
10.16
|
|
*
|
2006 Executive Incentive Plan (Incorporated by reference to Cintas' Annual Report on Form 10-K for the year ended May 31, 2005.)
|
|
10.17
|
|
*
|
2005 Equity Compensation Plan (Incorporated by reference to Cintas' Definitive Proxy Statement on Schedule 14A filed on September 1, 2005.)
|
|
10.18
|
|
*
|
Criteria for Performance Evaluation of the President and CEO (Incorporated by reference to Cintas' Annual Report on Form 10-K for the year ended May 31, 2006.)
|
|
10.19
|
|
*
|
2007 Executive Incentive Plan (Incorporated by reference to Cintas' Annual Report on Form 10-K for the year ended May 31, 2006.)
|
|
10.20
|
|
*
|
Amendment No. 1 to 2005 Equity Compensation Plan (Incorporated by reference to Cintas' Annual Report on Form 10-K for the year ended May 31, 2011.)
|
|
10.21
|
|
*
|
Form of Restricted Stock Agreement (Incorporated by reference to Cintas' Annual Report on Form 10-K for the year ended May 31, 2011.)
|
|
10.22
|
|
*
|
Amendment No. 2 to Cintas Corporation 2005 Equity Compensation Plan (Incorporated by reference to Cintas' Current Report on Form 8-K dated July 27, 2012.)
|
|
10.23
|
|
*
|
Form of Restricted Stock Agreement (Incorporated by reference to Cintas' Current Report on Form 8-K dated July 27, 2012.)
|
|
10.24
|
|
*
|
Amendment No. 3 to Cintas Corporation 2005 Equity Compensation Plan (Incorporated by reference to Exhibit 10.4 to Cintas' Current Report on Form 8-K dated October 23, 2013.)
|
|
10.25
|
|
*
|
Amendment No. 4 to Cintas Corporation 2005 Equity Compensation Plan (Incorporated by reference to Exhibit 10.5 to Cintas' Current Report on Form 8-K dated October 22, 2014.)
|
|
10.26
|
|
*
|
Cintas Corporation Management Incentive Plan (Incorporated by reference to Exhibit 10.5 to Cintas' Current Report on Form 8-K dated October 23, 2013.)
|
|
14
|
|
|
Code of Ethics (Incorporated by reference to Cintas' Annual Report on Form 10-K for the year ended May 31, 2004.)
|
|
21
|
|
**
|
Subsidiaries of the Registrant
|
|
23
|
|
**
|
Consent of Independent Registered Public Accounting Firm
|
|
31.1
|
|
**
|
Certification of Principal Executive Officer, Pursuant to Rule 13a-14(a) of the Securities Exchange Act of 1934
|
|
31.2
|
|
**
|
Certification of Principal Financial Officer, Pursuant to Rule 13a-14(a) of the Securities Exchange Act of 1934
|
79
|
32.1
|
|
**
|
Certification of Chief Executive Officer, Pursuant to 18 U.S.C. § 1350
|
|
32.2
|
|
**
|
Certification of Chief Financial Officer, Pursuant to 18 U.S.C. § 1350
|
|
101.INS
|
|
**
|
XBRL Instance Document
|
|
101.SCH
|
|
**
|
XBRL Taxonomy Extension Schema Document
|
|
101.CAL
|
|
**
|
XBRL Taxonomy Extension Calculation Linkbase Document
|
|
101.DEF
|
|
**
|
XBRL Taxonomy Extension Definition Linkbase Document
|
|
101.LAB
|
|
**
|
XBRL Taxonomy Extension Label Linkbase Document
|
|
101.PRE
|
|
**
|
XBRL Taxonomy Extension Presentation Linkbase Document
|
|
*
|
Management compensatory contracts
|
|
**
|
Filed herewith
|
|
***
|
Certain exhibits and schedules have been omitted and Cintas agrees to furnish supplementally to the Securities and Exchange Commission a copy of any omitted exhibits upon request.
|
80
TABLE OF CONTENTS
Part IItem 1. BusinessItem 1A. Risk FactorsItem 1B. Unresolved Staff CommentsItem 2. PropertiesItem 3. Legal ProceedingsItem 4. Mine Safety DisclosuresPart IIItem 5. Market For Registrant's Common Equity,Item 6. Selected Financial DataItem 7. Management's Discussion and AnalysisItem 7A. Quantitative and Qualitative Disclosures About Market RiskItem 8. Financial Statements and Supplementary DataItem 9. Changes in and Disagreements withItem 9A. Controls and ProceduresItem 9B. Other InformationPart IIIItem 10. Directors, Executive Officers and Corporate GovernanceItem 11. Executive CompensationItem 12. Security Ownership Of Certain BeneficialItem 13. Certain Relationships and RelatedItem 14. Principal Accountant Fees and ServicesPart IVItem 15. Exhibits and Financial Statement Schedules