COOPER TIRE & RUBBER CO
10-Ks and 10-Qs
|
|
|
|
|
|
|
|
|
|
|
|
|
|
|
|
|
|
|
|
|
|
|
|
|
|
|
|
|
|
|
|
|
|
|
UNITED STATES SECURITIES AND EXCHANGE COMMISSION
WASHINGTON, DC 20549
FORM
10-K
For Annual and Transition Reports Pursuant to Sections 13 or 15(d) of the Securities Exchange Act of 1934
|
|
Annual Report Pursuant to Section 13 or 15(d) of the Securities Exchange Act of 1934
|
For the fiscal year ended
December 31, 2019
or
|
|
Transition Report Pursuant to Section 13 or 15(d) of the Securities Exchange Act of 1934
|
Commission File Number
001-04329
(Exact name of registrant as specified in its charter)
|
|
|
|
|
(State or Other Jurisdiction of Incorporation or Organization)
|
|
(I.R.S. Employer Identification No.)
|
(Address of principal executive offices)
(Zip code)
(
419
)
423-1321
(Registrant’s telephone number, including area code)
Securities registered pursuant to Section 12(b) of the Act:
|
|
|
|
|
(Title of Each Class)
|
(Trading Symbol)
|
(Name of Each Exchange on which Registered)
|
Securities registered pursuant to Section 12(g) of the Act: None
Indicate by check mark if the registrant is a well-known seasoned issuer, as defined in Rule 405 of the Securities Act.
Yes
☒
No
☐
Indicate by check mark if the registrant is not required to file reports pursuant to Section 13 or Section 15(d) of the Act. Yes
☐
No
☒
Indicate by check mark whether the registrant (1) has filed all reports required to be filed by Section 13 or 15(d) of the Securities Exchange Act of 1934 during the preceding 12 months (or for such shorter period that the registrant was required to file such reports), and (2) has been subject to such filing requirements for the past 90 days.
Yes
☒
No
☐
Indicate by check mark whether the registrant has submitted electronically every Interactive Data File required to be submitted pursuant to Rule 405 of Regulation S-T (§ 232.405 of this chapter) during the preceding 12 months (or for such shorter period that the registrant was required to submit such files).
Yes
☒
No
☐
Indicate by check mark whether the registrant is a large accelerated filer, an accelerated filer, a non-accelerated filer, a smaller reporting company or an emerging growth company. See the definitions of “large accelerated filer,” “accelerated filer,” “smaller reporting company,” and "emerging growth company" in Rule 12b-2 of the Exchange Act. (Check One):
|
|
☒
|
|
Accelerated filer
|
☐
|
|
Non-Accelerated Filer
|
☐
|
(Do not check if a smaller reporting company)
|
Smaller Reporting Company
|
|
|
Emerging growth company
|
|
|||
Indicate by check mark whether the registrant is a shell company (as defined in Rule 12b-2 of the Exchange Act). Yes
☐
No
☒
The aggregate market value of the voting common stock held by non-affiliates of the registrant at
June 28, 2019
was
$
1,516,245,816
.
The number of shares outstanding of the registrant’s common stock as of
February 21, 2020
was
50,249,760
.
DOCUMENTS INCORPORATED BY REFERENCE
Certain information from the registrant’s definitive proxy statement for its
2020
Annual Meeting of Stockholders will be herein incorporated by reference into Part III, Items 10 – 14, of this report.
TABLE OF CONTENTS
COOPER TIRE & RUBBER COMPANY – FORM 10-K
FOR THE FISCAL YEAR ENDED
DECEMBER 31, 2019
|
Page
reference
|
|
-
1
-
Forward-Looking Statements
This report contains what the Company believes are “forward-looking statements,” as that term is defined under the Private Securities Litigation Reform Act of 1995, regarding projections, expectations or matters the Company anticipates may happen with respect to the future performance of the industries in which it operates, the economies of the U.S. and other countries, or the performance of the Company itself, which involve uncertainty and risk. Such forward-looking statements are generally, though not always, preceded by words such as “anticipates,” “expects,” “will,” “should,” “believes,” “projects,” “intends,” “plans,” “estimates,” and similar terms that connote a view to the future and are not merely recitations of historical fact. Such statements are made solely on the basis of the Company’s current views and perceptions of future events, and there can be no assurance that such statements will prove to be true.
It is possible that actual results may differ materially from projections or expectations due to a variety of factors, including, but not limited to:
|
•
|
volatility in raw material and energy prices, including those of rubber, steel, petroleum-based products and natural gas or the unavailability of such raw materials or energy sources;
|
|
•
|
the failure of the Company’s suppliers to timely deliver products or services in accordance with contract specifications;
|
|
•
|
changes to tariffs or trade agreements, or the imposition of new or increased tariffs or trade restrictions, imposed on tires, raw materials or manufacturing equipment which the Company uses, including changes related to tariffs on tires, raw materials and tire manufacturing equipment imported into the U.S. from China or other countries;
|
|
•
|
the impact of labor problems, including labor disruptions at the Company, its joint ventures, or at one or more of its large customers or suppliers;
|
|
•
|
changes in economic and business conditions in the world, including changes related to the United Kingdom’s decision to withdraw from the European Union;
|
|
•
|
the inability to obtain and maintain price increases to offset higher production, tariffs, raw material or energy costs;
|
|
•
|
pandemics, such as a coronavirus, and the related impact on the Company's operations, distribution channels, customers and suppliers;
|
|
•
|
a disruption in, or failure of, the Company’s information technology systems, including those related to cybersecurity, could adversely affect the Company’s business operations and financial performance;
|
|
•
|
increased competitive activity, including actions by larger competitors or lower-cost producers;
|
|
•
|
the failure to achieve expected sales levels;
|
|
•
|
changes in the Company’s customer or supplier relationships or distribution channels, including the write-off of outstanding accounts receivable or loss of particular business for competitive, credit, liquidity, bankruptcy, restructuring or other reasons;
|
|
•
|
the failure to develop technologies, processes or products needed to support consumer demand or changes in consumer behavior, including changes in sales channels;
|
|
•
|
the costs and timing of restructuring actions and impairments or other charges resulting from such actions, including restructuring and related actions in Europe and at the Company's manufacturing facility in Mexico, after the Company's purchase of the remaining noncontrolling interest in such facility in January, or from adverse industry, market or other developments;
|
|
•
|
consolidation or other cooperation by and among the Company’s competitors or customers;
|
|
•
|
inaccurate assumptions used in developing the Company’s strategic plan or operating plans, or the inability or failure to successfully implement such plans or to realize the anticipated savings or benefits from strategic actions;
|
|
•
|
risks relating to investments and acquisitions, including the failure to successfully integrate them into operations or their related financings may impact liquidity and capital resources;
|
|
•
|
the ultimate outcome of litigation brought against the Company, including product liability claims, which could result in commitment of significant resources and time to defend and possible material damages against the Company or other unfavorable outcomes;
|
|
•
|
the failure to successfully ramp up production at the Company's new ACTR joint venture to produce TBR tires according to plans, and the ability to find and develop alternative sources for TBR products;
|
-
2
-
|
•
|
government regulatory and legislative initiatives including environmental, healthcare, privacy and tax matters;
|
|
•
|
volatility in the capital and financial markets or changes to the credit markets and/or access to those markets;
|
|
•
|
changes in interest or foreign exchange rates or the benchmarks used for establishing the rates;
|
|
•
|
an adverse change in the Company’s credit ratings, which could increase borrowing costs and/or hamper access to the credit markets;
|
|
•
|
failure to implement information technologies or related systems, including failure by the Company to successfully implement ERP systems;
|
|
•
|
the risks associated with doing business outside of the U.S.;
|
|
•
|
technology advancements;
|
|
•
|
the inability to recover the costs to refresh existing products or develop and test new products or processes;
|
|
•
|
failure to attract or retain key personnel;
|
|
•
|
changes in pension expense and/or funding resulting from the Company’s pension strategy, investment performance of the Company’s pension plan assets and changes in discount rate or expected return on plan assets assumptions, changes to participant behavior, or changes to related accounting regulations;
|
|
•
|
changes in the Company’s relationship with its joint venture partners or suppliers, including any changes with respect to its former PCT joint venture's production of TBR products;
|
|
•
|
tax-related issues, including the ability to support certain tax positions, the impact of tax reform legislation and the inability to utilize deferred tax assets;
|
|
•
|
a variety of factors, including market conditions, may affect the actual amount expended on stock repurchases; the Company’s ability to consummate stock repurchases; changes in the Company’s results of operations or financial conditions or strategic priorities may lead to a modification, suspension or cancellation of stock repurchases, which may occur at any time;
|
|
•
|
the inability to adequately protect the Company’s intellectual property rights.
|
It is not possible to foresee or identify all such factors. Any forward-looking statements in this report are based on certain assumptions and analyses made by the Company in light of its experience and perception of historical trends, current conditions, expected future developments and other factors it believes are appropriate in the circumstances. Prospective investors are cautioned that any such statements are not a guarantee of future performance and actual results or developments may differ materially from those projected.
The Company makes no commitment to update any forward-looking statement included herein or to disclose any facts, events or circumstances that may affect the accuracy of any forward-looking statement. Further information covering issues that could materially affect financial performance is contained under Risk Factors below and in the Company’s other filings with the U. S. Securities and Exchange Commission (“SEC”).
|
Item 1.
|
BUSINESS
|
Cooper Tire & Rubber Company, with its subsidiaries (“Cooper” or the “Company”), is a leading manufacturer and marketer of replacement tires. It is the
fifth
largest tire manufacturer in North America and, according to a recognized trade source, the Cooper family of companies is the thirteenth largest tire company in the world based on sales. Cooper specializes in the design, manufacture, marketing and sales of passenger car, light truck, truck and bus radial ("TBR"), motorcycle and racing tires.
The Company is organized into four business segments: North America, Latin America, Europe and Asia. Each segment is managed separately. Additional information on the Company’s segments as reported, including their financial results, total assets, products, markets and presence in particular geographic areas, appears in “Management’s Discussion and Analysis of Financial Condition and Results of Operations” and the “Business Segments” note to the consolidated financial statements.
Cooper Tire & Rubber Company was incorporated in the state of Delaware in 1930 as the successor to a business originally founded in 1914. Based in Findlay, Ohio, Cooper and its family of companies currently operate in
15
countries, including
10
manufacturing facilities and
21
distribution centers. As of
December 31, 2019
, it employed
8,720
persons worldwide.
-
3
-
Business Segments
The Company has four segments under Accounting Standards Codification (“ASC”) 280, “Segments”:
|
•
|
North America, composed of the Company’s operations in the United States (“U.S.”) and Canada;
|
|
•
|
Latin America, composed of the Company’s operations in Mexico, Central America and South America;
|
|
•
|
Europe; and
|
|
•
|
Asia.
|
North America and Latin America meet the criteria for aggregation in accordance with ASC 280, as they are similar in their production and distribution processes and exhibit similar economic characteristics. The aggregated North America and Latin America segments are presented as “Americas Tire Operations” in the segment disclosure.
Both the Europe and Asia segments have been determined to be individually immaterial, as they do not meet the quantitative requirements for segment disclosure under ASC 280. In accordance with ASC 280, information about operating segments that are not reportable shall be combined and disclosed in an all other category separate from other reconciling items. As a result, these two segments have been combined in the segment operating results discussion. The results of the combined Europe and Asia segments are presented as “International Tire Operations” in the segment disclosure.
Americas Tire Operations Segment
The Americas Tire Operations segment manufactures and markets passenger car and light truck tires, primarily for sale in the U.S. replacement market. The segment also has a joint venture manufacturing operation in Mexico,
Corporacion de Occidente SA de CV (“COOCSA”),
which supplies passenger car and light truck tires to the Mexican, North American, Central American and South American markets. On January 24, 2020, the Company acquired the remaining 42 percent noncontrolling ownership interest in COOCSA, making COOCSA a wholly-owned subsidiary. The segment also markets and distributes racing, TBR and motorcycle tires. The racing and motorcycle tires are manufactured by the Company’s European segment and by others. TBR tires are sourced from
China-based Qingdao Ge Rui Da Rubber Co., Ltd. ("GRT"), a majority-owned joint venture manufacturing facility,
and through off-take agreements
with Prinx Chengshan (Shandong) Tire Company Ltd. ("PCT")
, the Company's former joint venture, through mid-2021, and
Sailun (Vietnam) Co., Ltd. ("Sailun Vietnam") through December 31, 2020. On April 5, 2019, Cooper Tire & Rubber Company Vietnam Holding, LLC ("Cooper Vietnam"), a wholly owned subsidiary of Cooper,
and Sailun Vietnam established a joint venture in Vietnam, ACTR Company Limited ("ACTR"), which will produce and sell TBR tires. The new joint venture is expected to begin commercially producing tires in 2020.
Major distribution channels and customers include independent tire dealers, wholesale distributors, regional and national retail tire chains, large retail chains that sell tires as well as other automotive products, mass merchandisers and digital channels. The segment does not currently sell its products directly to end users, except through three Company-owned retail stores. The segment sells a limited number of tires to original equipment manufacturers ("OEMs").
The segment operates in a highly competitive industry, which includes Bridgestone Corporation, Goodyear Tire & Rubber Company and Groupe Michelin. These competitors are substantially larger than the Company and serve OEMs as well as the replacement tire market. The segment also faces competition from low-cost producers in Asia, Mexico, South America and Central Europe. Some of those producers are foreign affiliates of the segment’s competitors in North America. The segment had a market share in
2019
of approximately
10
percent of all passenger car and light truck replacement tire sales in the U.S. The segment also participates in the U.S. TBR tire market. A portion of the products manufactured by the segment are exported throughout the world.
Success in competing for the sale of replacement tires is dependent upon many factors, the most important of which are price, quality, performance, brand, line coverage, availability through appropriate distribution channels and relationships with dealers and retailers. Other factors include warranty, credit terms and other value-added programs. The segment has built close working relationships through the years with independent dealers. It believes those relationships have enabled it to obtain a competitive advantage in that channel of the market. As a steadily increasing percentage of replacement tires are sold by large regional and national tire retailers, as well as mass merchandisers, the segment has increased focus on its penetration of those distribution channels, while maintaining its traditionally strong network of independent dealers. The segment is also active in various other sales channels, including digital channels and others in which the Company has been less active in the past.
The segment’s replacement tire business has a broad customer base that includes purchasers of proprietary brand tires that are marketed and distributed by the Company and private label tires which are manufactured by the Company but marketed and distributed by the Company’s customers.
Customers generally place orders on a month-to-month basis and the segment adjusts production and inventory to meet those orders, which results in varying backlogs of orders at different times of the year. Tire sales are subject to a seasonal demand pattern. This usually results in the sales volumes being strongest in the third and fourth quarters and weaker in the first and second quarters.
-
4
-
International Tire Operations Segment
The International Tire Operations segment is the combination of the Europe and Asia operating segments. The European operations include manufacturing operations in the United Kingdom (“U.K.”) and the Republic of Serbia (“Serbia”).
The U.K. entity manufactures and markets motorcycle and racing tires and tire retread material for domestic and global markets. The Serbian entity manufactures passenger car and light truck tires primarily for the European markets and for export to the North American segment.
The Asian operations are located in the People’s Republic of China (“PRC”) and Vietnam.
Cooper Kunshan Tire manufactures passenger car and light truck tires both for the Chinese domestic market and for export to markets outside of the PRC. GRT, a joint venture manufacturing facility located in the PRC, serves as a global source of TBR tire production for the Company. The segment also procures certain TBR tires under off-take agreements with PCT, through mid-2021, and Sailun Vietnam, through December 31, 2020.
On April 5, 2019, Cooper Vietnam and Sailun Vietnam established a joint venture in Vietnam, ACTR, which will produce TBR tires. The new joint venture is expected to begin commercially producing tires in 2020.
The segment sells a majority of its tires in the replacement market, with a portion also sold to OEMs.
On January 17, 2019, Cooper Tire & Rubber Company Europe Ltd. (“Cooper Tire Europe”), a wholly owned subsidiary of the Company, committed to a plan to cease passenger car and light truck tire production ("light vehicle tire production") at its Melksham, U.K. facility. The phasing out of light vehicle tire production was substantially completed in the third quarter of 2019. Approximately 300 roles were eliminated at the site. Cooper Tire Europe now obtains light vehicle tires to meet customer needs from other production sites within the Company’s global production network. Approximately 400 roles remain in Melksham to support the functions that continue there, including motorsports and motorcycle tire production, the materials business, Cooper Tire Europe headquarters, sales and marketing, and the Europe Technical Center.
As in the Americas Tire Operations segment, the International Tire Operations segment operates in a highly competitive industry, which includes Bridgestone Corporation, Goodyear Tire & Rubber Company and Groupe Michelin. These competitors are substantially larger than the Company and serve OEMs as well as the replacement tire market. The segment also faces competition from low-cost producers.
Raw Materials
The Company’s principal raw materials include natural rubber, synthetic rubber, carbon black, chemicals and steel reinforcement components. The Company acquires its raw materials from various sources around the world to assure continuing supplies for its manufacturing operations and to mitigate the risk of potential supply disruptions.
During
2019
, the Company experienced
decreases
in the costs of certain of its principal raw materials in comparison to
2018
. The pricing volatility of natural rubber and certain other raw materials contributes to the difficulty in accurately predicting and managing these costs.
The Company has a purchasing office in Singapore to acquire natural rubber directly from producers in Southeast Asia. This purchasing operation enables the Company to work directly with producers to continually improve consistency and quality, while reducing the costs of materials, transportation and transactions.
The Company’s contractual relationships with its raw material suppliers are generally based on long-term agreements or purchase order arrangements. For natural rubber, natural gas and certain principal materials, procurement is managed through a combination of buying forward production requirements and utilizing the spot market. For other principal materials, procurement arrangements include supply agreements that may contain formula-based pricing based on commodity indices, multi-year agreements or spot purchases. These arrangements only cover quantities needed to satisfy normal manufacturing demands.
Working Capital
The Company’s working capital consists mainly of inventory, accounts receivable and accounts payable. These working capital accounts are closely managed by the Company. Inventory balances are primarily valued at a last-in, first-out (“LIFO”) basis in the U.S. and under the first-in, first-out (“FIFO”) basis in the rest of the world. Inventories turn regularly, but balances typically increase during the first half of the year before declining as a result of increased sales in the second half. The Company’s inventory levels are generally kept within a targeted range to meet projected demand. The mix of inventory is critical to inventory turnover and meeting customer demand. Accounts receivable and accounts payable are also affected by this business cycle, typically requiring the Company to have greater working capital needs during the second and third quarters. The Company engages in a rigorous credit analysis of its customers and monitors their financial positions. The Company offers incentives to certain customers to encourage the payment of account balances prior to their scheduled due dates.
At
December 31, 2019
, the Company held cash and cash equivalents of
$391 million
.
-
5
-
Research, Development and Product Improvement
The Company directs its research activities toward product development, performance and operating efficiency. The Company conducts extensive testing of current tire lines, as well as new concepts in tire design, construction and materials. During
2019
, over
105
million miles of tests were performed on indoor test wheels and in monitored road tests. The Company has a tire and vehicle test track in Texas that assists with the Company’s testing activities. Uniformity equipment is used to physically monitor manufactured tires for high standards of ride quality. The Company continues to design and develop specialized equipment to fit the precise needs of its manufacturing and quality control requirements.
Patents, Intellectual Property and Trademarks
The Company owns or has licenses to use patents and intellectual property covering various aspects in the design and manufacture of its products and processes and equipment for the manufacture of its products. While the Company believes these assets as a group are of material importance, it does not consider any one asset or group of these assets to be of such importance that the loss or expiration thereof would materially affect its business.
The Company owns and uses tradenames and trademarks worldwide. While the Company believes such tradenames and trademarks as a group are of material importance, the trademarks the Company considers most significant to its business are those using the words "Cooper," "Mastercraft," "Roadmaster," "Starfire," “Avon" and "Mickey Thompson.” The Company believes all of these significant trademarks are valid and will have unlimited duration as long as they are adequately protected and appropriately used. Certain other tradenames and trademarks
were fully amortized as of December 31, 2019
.
Seasonal Trends
There is year-round demand for the Company's products, however, light vehicle replacement tire sales are generally strongest during the third and fourth quarters of the year. Winter tires are sold principally during the months of May through November.
Environmental Matters
The Company recognizes the importance of compliance in environmental matters and has programs in place to comply with local, state, federal and foreign requirements and regulations. The Company has an organizational structure which allows it to supervise environmental activities, planning and programs to ensure compliance and improve environmental performance. The Company also participates in activities concerning general industry environmental matters, and the Company is committed to achieving a baseline of key environmental sustainability metrics and targets. A number of the Company’s operations are certified to the ISO 14001 standard and the Company has been recognized with several awards for efforts to improve energy efficiency.
The Company’s manufacturing facilities, like those of the industry generally, are subject to numerous laws and regulations designed to protect the environment. In general, the Company has not experienced difficulty in complying with these requirements and believes they have not had a material adverse effect on its financial condition or the results of its operations. The Company expects additional requirements with respect to environmental matters will be imposed in the future. The Company’s
2019
expense and capital expenditures for environmental matters at its facilities
were not material
, nor is it expected that expenditures in
2020
for such matters will be material.
Global Social Impact
The Company is committed to environmental responsibility and the health and safety of its employees, contractors and the community, as well as the long-term, sustainable health and growth of the Company. The Company's organization structure allows it to supervise and audit, using a combination of internal and external resources, environmental activities, planning and programs to ensure compliance with applicable environmental, health and safety ("EHS") requirements and Company standards. Additionally, the Company has implemented a global EHS management system to predictably and sustainably manage EHS and to hold management accountable for non-compliance. The Company also participates in activities concerning general industry environmental matters, including being a founding member of the Tire Industry Project and the Global Platform for Sustainable Natural Rubber. For an overview of the Company's EHS and sustainability strategy and commitments, please visit http://www.coopertire.com/Corporate-Responsibility/Sustainability.aspx. The information contained on or accessible through the Company's website is not incorporated by reference in this annual report on Form 10-K and should not be considered a part of this report.
-
6
-
Foreign Operations
The Company has a manufacturing facility, a technical center, a distribution center and its European headquarters office located in the U.K. The Company has a manufacturing facility, two distribution centers and an administrative office in Serbia. In total, there are six distribution centers and two sales offices in Europe. The number of foreign operations in Europe was not impacted by the January 17, 2019 decision to cease light vehicle tire production at the Melksham, U.K. manufacturing facility. The Company has a manufacturing facility and a joint venture manufacturing facility, two distribution centers, a technical center, a sales office and an administrative office in the PRC. The Company also has a purchasing office in Singapore. A joint venture manufacturing facility, in Vietnam, is expected to become commercially operational in 2020.
In Latin America, the Company has a manufacturing facility, an administrative office, three sales offices and a distribution center.
Additional information on the Company’s foreign operations can be found in the “Business Segments” note to the consolidated financial statements.
Available Information
The Company makes available free of charge, on or through its website, its annual report on Form 10-K, quarterly reports on Form 10-Q, current reports on Form 8-K and amendments to those reports filed or furnished pursuant to Section 13(a) or 15(d) of the Securities Exchange Act of 1934 as soon as reasonably practicable after it electronically files such material with, or furnishes it to, the U.S. Securities and Exchange Commission (“SEC”) (https://www.sec.gov). The Company’s internet address is http://www.coopertire.com. The Company has adopted charters for each of its Audit, Compensation and Nominating and Governance Committees, corporate governance guidelines and a code of conduct, which are available on the Company’s website and will be available to any stockholder who requests them from the Company’s Investor Relations department. The information contained on or accessible through the Company’s website is not incorporated by reference in this annual report on Form 10-K and should not be considered a part of this report.
INFORMATION ABOUT OUR EXECUTIVE OFFICERS
The names, ages and all positions and offices held by all executive officers of the Company as of December 31, 2019 are as follows:
|
Name
|
Age
|
Executive Office Held
|
Business Experience
|
|
Christopher J. Eperjesy
|
51
|
Senior Vice President and Chief Financial Officer
|
Senior Vice President, Chief Financial Officer since December 2018. Previously Chief Financial Officer of the IMAGINE Group, a provider of marketing products, from August 2017 to December 2018; Chief Financial Officer of Arctic Cat, an all-terrain vehicle manufacturer, from 2015 to 2017; and Vice President - Finance, Chief Financial Officer, Treasurer and Secretary of Twin Disc, an off-highway power transmission equipment manufacturer, from 2002 to 2015.
|
|
Bradley E. Hughes
|
58
|
President, Chief Executive Officer and Director
|
President, Chief Executive Officer and Director since September 2016. Senior Vice President and Chief Operating Officer from January 2015 to September 2016. Senior Vice President and President-International Tire Operations from July 2014 to January 2015. Senior Vice President and Chief Financial Officer from July 2014 to December 2014. Vice President and Chief Financial Officer from November 2009 to July 2014.
|
|
Stephen Zamansky
|
49
|
Senior Vice President, General Counsel and Secretary
(1)
|
Senior Vice President, General Counsel and Secretary since July 2014. Vice President, General Counsel and Secretary from April 2011 to July 2014. Previously Senior Vice President, General Counsel & Secretary of Trinity Coal Corporation, a privately held mining company, from 2008 to March 2011. Trinity was acquired by the Essar Group in 2010 and commenced bankruptcy proceedings in March 2013.
|
(1) As of December 31, 2019, Mr. Zamansky is also overseeing the Company's human resource operations until such time as the vacant Chief Human Resources Officer position is filled.
-
7
-
|
Item 1A.
|
RISK FACTORS
|
Some of the more significant risk factors related to the Company follow:
Pricing volatility for raw materials or commodities or an inadequate supply of key raw materials could result in increased costs and may significantly affect the Company’s profitability.
The pricing volatility for natural rubber, petroleum-based materials and other raw materials contributes to the difficulty in managing the costs of raw materials. Costs for certain raw materials used in the Company’s operations, including natural rubber, chemicals, carbon black, steel reinforcements and synthetic rubber remain highly volatile. Increasing costs for raw material supplies will increase the Company’s production costs and affect its margins if the Company is unable to pass the higher production costs on to its customers in the form of price increases. Even if the Company is able to pass along these higher costs, its profitability may be adversely affected until it is able to do so. Decreasing costs for raw materials could also affect margins if the Company is unable to maintain its pricing structure due to the need to offer price reductions to remain competitive. Further, if the Company is unable to obtain adequate supplies of raw materials in a timely manner for any reason, its operations could be interrupted or otherwise adversely affected.
The Company is facing heightened risks due to the uncertain business environment.
Current global and regional economic conditions may affect demand for the Company’s products, create volatility in raw material costs and affect the availability and cost of credit. These conditions also affect the Company’s customers and suppliers as well as the ultimate consumer.
Deterioration in the global macroeconomic environment or in specific regions could impact the Company and, depending upon the severity and duration of these factors, the Company’s profitability and liquidity position could be negatively impacted.
The Company’s competitors may also change their actions as a result of changes to the business environment, which could result in increased price competition and discounts, resulting in lower margins or reduced sales volumes for the business.
The current economic environment continues to cause increased financial pressures and stresses on the Company's customers, which could impact the timeliness of customer payments and, ultimately, the collectability of accounts receivable. In addition, the bankruptcy, restructuring, financial condition, consolidation or other cooperation of one or more of the Company’s major customers or suppliers, as well as the strategic actions of competitors, could result in the write-off of accounts receivable, a reduction in purchases of the Company’s products or a supply disruption to its facilities, which could harm the Company’s results of operations, financial condition and liquidity.
The Company’s results could be impacted by changes in tariffs, trade agreements or other trade restrictions imposed by the U.S. or other governments on imported tires, raw materials or equipment used in tire manufacturing.
The Company’s ability to competitively source and sell tires can be significantly impacted by changes in tariffs, changes or repeals of trade agreements, including withdrawal from or material modifications to NAFTA, including the implementation of the USMCA, or certain other international trade agreements, or other trade restrictions or retaliatory actions imposed by various governments. Other effects, including impacts on the price of tires, responsive actions from governments and the opportunity for competitors to establish a presence in markets where the Company participates, could also have significant impacts on the Company’s results.
Antidumping and countervailing duty investigations into certain passenger car and light truck tires imported from the PRC into the United States were initiated on July 14, 2014. The determinations announced in both investigations were affirmative and resulted in the imposition of significant additional duties from each. The rates are subject to review annually and a material change in the new rates could have a significant impact on the Company's results.
Antidumping and countervailing duty investigations into certain truck and bus tires imported from the PRC into the U.S. were initiated on January 29, 2016. On February 22, 2017, the International Trade Commission ("ITC") made a final determination that the U.S. market had not suffered material injury because of imports of truck and bus tires from the PRC. However, on November 1, 2018, the Court of International Trade (“CIT”) remanded the case back to the ITC for reconsideration. On January 30, 2019, the ITC reversed its earlier decision and made an affirmative determination of material injury. On February 15, 2019, the determination was published in the Federal Register and significant duties were imposed on Chinese truck and bus tire imports. The ITC’s re-determination, along with comments from the parties regarding the re-determination were filed with the CIT. The CIT affirmed the ITC re-determination on February 18, 2020.
Pursuant to Section 301: China’s Acts, Policies, and Practices Related to Technology Transfer, Intellectual Property, and Innovation, passenger, light truck and truck and bus tires, raw materials and tire-manufacturing equipment from the PRC imported into the U.S. became subject to additional 10 percent duties effective September 24, 2018. These increased to 25
-
8
-
percent effective May 10, 2019. Future changes to duty percentages, if any, are unknown at this time. Retaliatory duties on U.S. products have been implemented in response to these additional duties by China.
The imposition of additional duties or other trade restrictions in the U.S. or elsewhere on raw materials or tire-manufacturing equipment used by the Company or on certain tires imported from the PRC or other countries will result in higher costs and potentially lower margins, or in the case of finished goods, in those tires being diverted to other regions of the world, such as Europe, Latin America or elsewhere in Asia, which could materially harm the Company’s results of operations, financial condition and liquidity.
Any interruption in the Company’s skilled workforce, or that of its suppliers or customers, including labor disruptions, could impair its operations and harm its earnings and results of operations.
The Company’s operations depend on maintaining a skilled workforce, including the use of third party labor outsourcing, and any interruption of its workforce due to shortages of skilled technical, production or professional workers, work disruptions, or other events could interrupt the Company’s operations and affect its operating results. Competition for these employees is intense and the Company could experience difficulty in hiring and retaining the personnel necessary to support its business. Further, a significant number of the Company’s employees are currently represented by unions. If the Company is unable to resolve any labor disputes or if there are work stoppages or other work disruptions at the Company or any of its suppliers or customers, the Company’s business and operating results could suffer. See also related comments under "The Company is facing supply risks related to certain tires it purchases from PCT."
Pandemics, such as a coronavirus, could have an adverse impact on the Company's operations, distribution channel, customers and suppliers
From time to time, various diseases such as the avian flu and the Wuhan coronavirus, have spread across the world. The Company has global manufacturing facilities, suppliers and customers, and if a disease spreads sufficiently to cause a pandemic (or to cause the fear of a pandemic to rise) or governments regulate or restrict the flow of labor or products, the Company's operations, suppliers, customers and distribution channels could be severely impacted. Such a pandemic could also have an adverse impact on consumer demand and commodity prices. Any material changes in the Company's production supply or demand for products could materially and adversely affect the Company's results of operations and liquidity.
If the Company is unable to attract and retain key personnel, its business could be materially adversely affected.
The Company’s business depends on the continued service of key members of its management. The loss of the services of a significant number of members of its management team could have a material adverse effect on its business. The Company’s future success will also depend on its ability to attract, retain and develop highly skilled personnel, such as engineering, marketing, information technology and senior management professionals. Competition for these employees is intense and the Company could experience difficulty in hiring and retaining the personnel necessary to support its business. If the Company does not succeed in retaining its current employees and attracting new high-quality employees, its business could be materially adversely affected.
The Company’s industry is highly competitive, and the Company may not be able to compete effectively with lower-cost producers and larger competitors.
The tire industry is a highly competitive, global industry. Some of the Company’s competitors are larger companies with greater financial resources. Intense competitive activity in the replacement tire industry, including consolidation or other cooperation by and among the Company's competitors, has caused, and will continue to cause, pressures on the Company’s business, as well as pressure on certain of the Company's customers, suppliers or distribution network. As the Company increases its presence in the original equipment market, the demand for products by the OEM's will be impacted by automotive vehicle production. The Company’s ability to compete successfully will depend in part on its ability to balance capacity with demand, leverage global purchasing of raw materials, make required investments to improve productivity, eliminate redundancies and increase production at low-cost, high-quality supply sources. If the Company is unable to offset continued pressures, its sales, margins, operating results and market share would decline and the impact could become material on the Company’s earnings.
The Company has and could in the future incur restructuring charges and other costs as it continues to execute actions in an effort to improve future profitability and competitiveness and may not achieve the anticipated savings and benefits from these actions.
The Company has and may in the future initiate restructuring actions designed to improve future profitability and competitiveness, and enhance the Company’s flexibility, including the outcome of the restructuring in Europe, as well as
-
9
-
restructuring activities at the Company's manufacturing facility in Mexico, after the recent purchase of the remaining noncontrolling interest in the facility, as well other current and potential future outcomes from the Company's ongoing region by region global footprint assessment. The Company may not realize anticipated savings or benefits from the Mexico purchase and restructuring, or other actions, in full or in part or within the time periods it expects. The Company is also subject to the risks of labor unrest, negative publicity and business disruption in connection with these actions. Failure to realize anticipated savings or benefits from the Company’s actions could have an adverse effect on the business and could result in potential unexpected costs or other impacts. Such restructuring actions and impairments or other charges could have a significant negative effect on the Company’s earnings or cash flows in the short-term.
If the price of energy sources increases, the Company’s operating expenses could increase significantly or the demand for the Company’s products could be affected.
The Company’s manufacturing facilities rely principally on natural gas, as well as electrical power and other energy sources. High demand and limited availability of natural gas and other energy sources can result in significant increases in energy costs increasing the Company’s operating expenses and transportation costs. Higher energy costs would increase the Company’s production costs and adversely affect its margins and results of operations. If the Company is unable to obtain adequate sources of energy, its operations could be interrupted.
In addition, if the price of gasoline increases significantly for consumers, it can affect driving and purchasing habits and impact demand for tires.
A disruption in, or failure of, the Company’s information technology systems, including those related to cybersecurity, could adversely affect the Company’s business operations and financial performance.
The Company relies on the accuracy, capacity and security of its information technology systems across all of its major business functions, including its research and development, manufacturing, sales, financial and administrative functions. While the Company maintains some of its critical information technology systems, it is also dependent on third parties to provide important information technology services relating to, among other things, human resources, electronic communications and certain finance functions. Additionally, the Company collects and stores sensitive data, including intellectual property, proprietary business information and the proprietary business information of its customers and suppliers, as well as personally identifiable information of the Company’s customers and employees, in data centers and on information technology networks. In addition, the European Union’s General Data Protection Regulation (“GDPR”), which came into effect in May 2018, creates a range of new compliance obligations for companies that process personal data of European Union residents, and increases financial penalties for non-compliance. As a company that processes personal data of European Union residents, we bear the costs of compliance with the GDPR and are subject to the potential for fines and penalties in the event of a breach of the GDPR. Aside from the European Union, other jurisdictions have enacted, or are considering, regulations regarding data privacy. Despite the security measures that the Company has implemented, including those related to cybersecurity, its systems could be breached or damaged by computer viruses, natural or man-made incidents or disasters or unauthorized physical or electronic access. Furthermore, the Company may have little or no oversight with respect to security measures employed by third-party service providers, which may ultimately prove to be ineffective at countering threats. A system failure, accident or security breach could result in business disruption, theft of its intellectual property, trade secrets or customer information and unauthorized access to personnel information. To the extent that any system failure, accident or security breach results in disruptions to the Company's operations or the theft, loss or disclosure of, or damage to, the Company's data or confidential information, the Company’s reputation, business, results of operations, cash flows and financial condition could be materially adversely affected. In addition, the Company may be required to incur significant costs to protect against and, if required, remediate the damage caused by such disruptions or system failures in the future.
If the Company fails to develop technologies, processes or products needed to keep up with rapidly evolving distribution channels and to support consumer demand or, changes in consumer behavior, it may lose significant market share or be unable to recover associated costs.
The Company’s tire sales, margins and profitability may be significantly impacted if it does not develop or have available technologies, processes, including distribution methods, or products that competitors may be developing and consumers or dealers are demanding. This includes, but is not limited to, changes in the design of and materials used to manufacture tires, changes in the types of tires consumers desire and changes in the vehicles consumers are purchasing. Additionally, the Company is also impacted by changes in the way consumers buy tires and failure to effectively compete in various sales and marketing channels, including digital channels and mass merchandising outlets.
Technologies or processes may also be developed by competitors that better distribute tires to consumers, including through wholly-owned distributors, which could affect the Company’s customers and implementation of its strategic plan.
-
10
-
An increase in consumer preference for car- and ride-sharing services, as opposed to automobile ownership, may result in a long term reduction in the number of vehicles per capita. Additionally, refreshing existing products and developing new products and technologies requires significant investment and capital expenditures, is technologically challenging and requires extensive testing and accurate anticipation of technological and market trends. If the Company fails to develop new products that are appealing to the Company's customers and consumers, or fails to develop products on time and within budgeted amounts, the Company may be unable to recover its product development and testing costs. If the Company cannot successfully use new production or equipment methodologies it invests in, it may also not be able to recover those costs.
If assumptions used in developing the Company’s strategic plan are inaccurate or the Company is unable to execute its strategic plan effectively, its profitability and financial position could be negatively impacted.
The Company faces both general industry and Company-specific challenges. These include volatile raw material costs, increasing product complexity and pressure from competitors with greater resources or manufacturing in lower-cost regions. To address these challenges and position the Company for future success, the Company continues to execute towards its Strategic Plan.
The Company continually reviews and updates its business plans to achieve its goals and imperatives. There can be no assurance that the Company's strategic business plans will be successful. If the assumptions used in developing the Company’s business plans vary significantly from actual conditions, the Company’s sales, margins and profitability could be harmed. If the Company is unsuccessful in implementing the tactics necessary to execute its business plans, it may not be able to achieve or sustain future profitability, which could impair its ability to meet debt and other obligations and could otherwise negatively affect its operating results, financial condition and liquidity.
The Company may not be successful in executing and integrating investments and acquisitions into its operations, which could harm its results of operations and financial condition.
The Company routinely evaluates potential investments and acquisitions and may pursue additional investment and acquisition opportunities, some of which could be material to its business. These investments include the formation of the ACTR joint venture in Vietnam, the purchase of the remaining noncontrolling interest in the Company's Mexican manufacturing facility and investment in the Company's Serbian manufacturing facility. The Company cannot provide assurance whether it will be successful in pursuing, integrating, ramping up and operating any investment or acquisition opportunities or what the consequences of any investment or acquisition would be. The Company may encounter various risks in any investment or acquisition, including:
|
•
|
the possible inability to integrate an acquired business into its operations;
|
|
•
|
the possible failure to successfully ramp up and operate the business;
|
|
•
|
diversion of management’s attention;
|
|
•
|
loss of key management personnel;
|
|
•
|
labor disruption, including as a result of the Company's purchase or restructuring activities;
|
|
•
|
unanticipated problems or liabilities, including delays in completion of required capital expenditures and/or construction;
|
|
•
|
potential asset impairment charges, due to inability to meet operating plans; and
|
|
•
|
increased labor and regulatory compliance costs of acquired businesses.
|
Some or all of those risks could impair the Company’s results of operations and impact its financial condition. The Company may finance any future investments or acquisitions from internally generated funds, bank borrowings, public offerings or private placements of equity or debt securities, or a combination of the foregoing. Investments and acquisitions may involve the expenditure of significant funds and management time.
Investments and acquisitions may also require the Company to increase its borrowings under its bank credit facilities or other debt instruments, or to seek new sources of liquidity. Increased borrowings would correspondingly increase the Company’s financial leverage, and could result in lower credit ratings and increased future borrowing costs. These risks could also reduce the Company’s flexibility to respond to changes in its industry or in general economic conditions.
In addition, the Company’s business plans call for growth. If the Company is unable to identify or execute on appropriate opportunities for acquisition, investment or growth, its business could be materially adversely affected.
The Company may be adversely affected by legal actions, including product liability claims which, if successful, could have a negative impact on its financial position, cash flows and results of operations.
The Company’s operations expose it to legal actions, including potential liability for personal injury or death as an alleged result of the failure of or conditions in the products that it designs, manufactures and sells. Specifically, the Company is a party
-
11
-
to a number of product liability cases in which individuals involved in motor vehicle accidents seek damages resulting from allegedly defective tires that it manufactured. Product liability claims and lawsuits, including possible class action, may result in material losses in the future and cause the Company to incur significant litigation defense costs. The Company is largely self-insured against these claims. These claims and related reserves could have a significant effect on the Company’s financial position, cash flows and results of operations.
From time to time, the Company is also subject to audits, litigation or other commercial disputes and other legal proceedings relating to its business. Due to the inherent uncertainties of any litigation, commercial disputes or other legal proceedings, the Company cannot accurately predict their ultimate outcome, including the outcome of any related appeals. An unfavorable outcome could materially adversely impact the Company’s financial condition, cash flows and results of operations.
The Company is facing supply risks related to certain tires it purchases from PCT.
In 2014, the Company sold its ownership interest in PCT and entered into off-take agreements with PCT to provide the continuous supply of certain TBR and passenger car tires for the Company through mid-2018. The agreements have been extended and now expire in mid-2021. If there are any disruptions in or quality issues with the supply of TBR products from PCT, it could have a material negative impact on the Company’s business. The Company is actively pursuing options to ensure the uninterrupted supply of these tires to meet the demands of the business beyond the terms of the PCT off-take agreements, including sourcing through GRT, an off-take agreement with Sailun Vietnam and the recently announced joint venture between Cooper Vietnam and Sailun Vietnam, which is expected to begin producing tires in 2020, but there can be no assurance that the Company will be able to do so in a timely manner.
The Company conducts its manufacturing, sales and distribution operations on a worldwide basis and is subject to risks associated with doing business outside the U.S.
The Company has affiliate, subsidiary and joint venture operations worldwide, including in the U.S., Europe, Mexico, the PRC and Vietnam. The Company has a wholly-owned manufacturing entity, Cooper Kunshan Tire, and is the majority owner of GRT, both in the PRC. The Company also is the sole owner of COOCSA, a manufacturing entity in Mexico, after purchasing the remaining noncontrolling interest on January 24, 2020, and has established operations in Serbia and the U.K. PCT, located in the PRC, is currently a supplier of TBR tires for the Company and the Company entered into an off-take agreement with Sailun Vietnam, located in Vietnam, for the supply of TBR tires. Additionally, Cooper Vietnam recently formed a joint venture with Sailun Vietnam, which is expected to begin commercially producing tires in 2020. There are a number of risks in doing business abroad, including political and economic uncertainty, social unrest, sudden changes in laws and regulations, ability to enforce existing or future contracts, shortages of trained labor and the uncertainties associated with entering into joint ventures or similar arrangements in foreign countries. These risks may impact the Company’s ability to expand its operations in different regions and otherwise achieve its objectives relating to its foreign operations, including utilizing these locations as suppliers to other markets. In addition, compliance with multiple and potentially conflicting foreign laws and regulations, import and export limitations and exchange controls is burdensome and expensive. For example, the Company could be adversely affected by violations of the Foreign Corrupt Practices Act (“FCPA”) and similar worldwide anti-bribery laws as well as export controls and economic sanction laws. The FCPA and similar anti-bribery laws in other jurisdictions generally prohibit companies and their intermediaries from making improper payments to government officials and, in some cases, other persons, for the purpose of obtaining or retaining business or obtaining another improper benefit. Violations of these laws and regulations could result in civil and criminal fines, penalties and sanctions against the Company, its officers or its employees, prohibitions on the conduct of the Company’s business and on its ability to offer products and services in one or more countries, and could also harm the Company’s reputation, business and results of operations. The Company’s foreign operations also subject it to the risks of international terrorism and hostilities and to foreign currency risks, including exchange rate fluctuations and limits on the repatriation of funds. See also related comments under "The Company’s results could be impacted by changes in tariffs, trade agreements or other trade restrictions imposed by the U.S. or other governments on imported tires or raw materials
", "
There are risks associated with the Company’s global strategy, which includes using joint ventures and partially-owned subsidiaries" and "The results of the United Kingdom’s referendum on withdrawal from the European Union may have a negative effect on global economic conditions, financial markets or the Company’s business."
There are risks associated with the Company’s global strategy, which includes using joint ventures and partially-owned subsidiaries.
The Company’s strategy includes the use of joint ventures, both as the majority and minority shareholder, and other partially-owned subsidiaries, including the recently formed Vietnam joint venture with Sailun Vietnam. These entities operate in countries outside of the U.S., are generally less well capitalized than the Company and bear risks similar to the risks of the Company. In addition, there are specific risks applicable to these subsidiaries and these risks, in turn, add potential risks to the Company. Such risks include greater risk of joint venture partners or other investors failing to meet their obligations under
-
12
-
related stockholders’ agreements; conflicts with joint venture partners; the possibility of a joint venture partner taking valuable knowledge from the Company; and risk of being denied access to the capital markets, which could lead to resource demands on the Company in order to maintain or advance its strategy. The Company’s outstanding notes and primary credit facility contain cross default provisions in the event of certain defaults by the Company under other agreements with third parties. For further discussion of access to the capital markets, see also related comments under “The Company has a risk due to volatility of the capital and financial markets.”
The results of the United Kingdom’s referendum on withdrawal from the European Union may have a negative effect on global economic conditions, financial markets or the Company’s business.
In June 2016, a majority of voters in the United Kingdom elected to withdraw from the European Union in a national referendum. The U.K. is currently negotiating the terms of its exit from the European Union (“Brexit”). In November 2018, the U.K. and the European Union agreed upon a draft Withdrawal Agreement that sets out the terms of the U.K.’s departure, including commitments on citizen rights after Brexit, a financial settlement from the U.K., and a transition period to allow time for a future trade deal to be agreed. After the U.K. Parliament failed to approve the Withdrawal Agreement in October 2019, European Union leaders granted the U.K. a three-month flexible Brexit extension, avoiding a no-deal exit on the previous deadline of October 31, 2019. On January 23, 2020, the Withdrawal Act, after clearing all stages in the U.K. Parliament, received royal assent from the Queen. On January 31, 2020, the U.K. is officially left the European Union. Following its departure, the U.K. will enter a transition period until December 31, 2020 during which period of time the U.K.’s trading relationship with the European Union will remain largely the same while the two parties negotiate a free trade agreement as well as other aspects of the U.K.’s relationship with the European Union. The Withdrawal Agreement allows the extension of the transition period by up to two years. The terms and eventual date of the U.K.’s withdrawal remain highly uncertain.
The ongoing uncertainty on the status of the final Withdrawal Agreement could lead to economic stagnation until an ultimate resolution with respect to Brexit occurs. In the absence of a future trade deal, the U.K.’s trade with the European Union and the rest of the world would be subject to tariffs and duties set by the World Trade Organization. Additionally, the movement of goods and personnel between the U.K. and the remaining member states of the European Union will be subject to additional inspections and documentation checks, leading to possible delays at ports of entry and departure. Even if an agreement setting forth the terms of the U.K.'s withdrawal from the European Union is approved, the withdrawal could result in significant changes to the trading relationship between the U.K. and the European Union. These changes to the trading relationship between the U.K and European Union would likely result in increased cost of goods imported into and exported from the U.K. and may decrease the profitability of the Company's U.K. and other operations. Additional currency volatility could drive a weaker British pound, which increases the cost of goods imported into the U.K. operations and may decrease the profitability of the U.K. operations. A weaker British pound versus the U.S. dollar also causes local currency results of U.K. operations to be translated into fewer U.S. dollars during a reporting period. With a range of outcomes still possible, the impact from Brexit remains uncertain and will depend, in part, on the final outcome of tariff, trade, regulatory and other negotiations.
Compliance with legal and regulatory initiatives could increase the cost of operating the Company’s business.
The Company is subject to federal, state, local and foreign laws and regulations. Compliance with those laws now in effect, or that may be enacted, could require significant capital expenditures, increase the Company’s production costs and affect its earnings and results of operations. Periodic changes as the result of elections in the U.S. and worldwide make it difficult to predict the legislative and regulatory changes that may occur.
Several countries have or may implement labeling requirements for tires. This legislation could cause the Company’s products to be at a disadvantage in the marketplace resulting in a loss of market share or could otherwise impact the Company’s ability to distribute and sell its tires.
In addition, while the Company believes that its tires are free from design and manufacturing defects and comply with all applicable regulations and standards, it is possible that recalls of or other quality issues with the Company’s tires could occur in the future. A recall or other quality issue could harm the Company’s reputation, operating results and financial position.
The Company is also subject to legislation governing labor, environmental, privacy and data protection, occupational safety and health both in the U.S. and other countries. The related legislation can change over time making it more expensive for the Company to produce its products.
The Company could also, despite its best efforts to comply with these laws and regulations, be found liable and be subject to additional costs because of these laws and regulations.
-
13
-
Compliance with and changes in tax laws could materially and adversely impact our financial condition, results of operations and cash flows.
The Company is subject to extensive tax liabilities, including federal and state income taxes and transactional taxes such as excise, sales and use, payroll, franchise, withholding and property taxes. New tax laws and regulations and changes in existing tax laws and regulations could result in increased expenditures by the Company for tax liabilities in the future and could materially and adversely impact the Company's financial condition, results of operations and cash flows.
Additionally, the Company’s income tax returns are subject to examination by federal, state and local tax authorities in the U.S. and tax authorities outside the U.S. Based upon the outcome of tax examinations, judicial proceedings, or expiration of statutes of limitations, it is possible that the ultimate resolution of these unrecognized tax benefits, including those related to tax planning strategies regarding the Company's structure, may result in a payment that is materially different from the current estimate of the tax liabilities. Such factors could have an adverse effect on the Company’s provision for income taxes and the cash outlays required to satisfy income tax obligations.
The Company has a risk due to volatility of the capital and financial markets.
The Company periodically requires access to the capital and financial markets as a significant source of liquidity for maturing debt payments or working capital needs or investments in the business that it cannot satisfy by cash on hand or operating cash flows. Substantial volatility in world capital markets and the banking industry may make it difficult for the Company to access credit markets and to obtain financing or refinancing, as the case may be, on satisfactory terms or at all. In addition, various additional factors, including a deterioration of the Company’s credit ratings or its business or financial condition, could further impair its access to the capital markets and bank financings. Additionally, any inability to access the capital markets or bank financings, could require the Company to defer critical capital expenditures, reduce or not pay dividends, reduce spending in areas of strategic importance, suspend stock repurchases, sell important assets or, in extreme cases, seek protection from creditors. See also related comments under “There are risks associated with the Company’s global strategy, which includes using joint ventures and partially-owned subsidiaries.”
The Company’s operations in Asia have been or will be financed in part using multiple loans from several lenders to finance working capital needs. These loans are generally for terms of one year or less. Therefore, debt maturities occur frequently and access to the capital markets and bank financings is crucial to the Company’s ability to maintain sufficient liquidity to support its operations in Asia.
Increases in interest rates or changes in credit ratings may negatively impact the Company.
Certain of the Company's variable rate debt, including its Credit Facility, currently uses LIBOR as a benchmark for establishing the interest rate. LIBOR is the subject of recent proposals for reform. These reforms and other pressures may cause LIBOR to disappear entirely or to perform differently than in the past. The consequences of these developments with respect to LIBOR cannot be entirely predicted but could result in an increase in the cost of variable rate debt. The interest rates under on the Company's term loans and revolving credit facilities can vary based on the Company's credit ratings. The Company's policy is to manage interest rate risk by entering into both fixed and variable rate debt arrangements. Interest rate swaps are also used to minimize worldwide financing cost and to achieve a desired mix of fixed and variable rate debt. The Company utilizes derivative financial instruments to enhance its ability to manage risk, including interest rate exposures that exist as part of ongoing business operations. The Company does not enter into contracts for trading purposes, nor is it a party to any leveraged derivative instruments. The use of derivative financial instruments is monitored through regular communication with senior management and the utilization of written guidelines. However, the Company's use of these instruments may not effectively limit or eliminate exposure to changes in interest rates. Therefore, the Company cannot provide assurance that future credit rating or interest rate changes will not have a material negative impact on its business, financial position or operating results.
The Company may fail to successfully develop or implement information technologies or related systems, resulting in a significant competitive disadvantage.
Competing in the highly competitive tire industry can be impacted by the successful development of information technology. If the Company fails to successfully develop or implement information technology systems, it may be at a disadvantage to its competitors resulting in lost sales and negative impacts on the Company’s earnings.
The Company has implemented Enterprise Resource Planning systems in the United States and other locations. The Company is evaluating its available options for integrating information technology solutions outside of the United States, which will require significant amounts of capital and human resources to deploy. These requirements may exceed Company projections. Throughout integration of the systems, there are also risks created to the Company’s ability to successfully and efficiently operate.
-
14
-
A failure in the Company's internal financial controls could adversely affect the Company's business operations and financial performance.
The Company's operations are highly dependent on an ability to process and monitor, on a daily basis, a very large number of transactions, across numerous locations and currencies. These transactions must adhere to the Company's internal financial control structure, as well as legal and regulatory standards. Compliance with these legal and reporting requirements can be challenging, and the Company could be subject to regulatory fines and penalties for failing to follow these rules or to report timely, accurate and complete information in accordance with such rules. As such requirements expand, compliance with these rules and regulations has become more challenging. As the Company's customer base and geographical reach expands, the volume, speed, frequency and complexity of transactions, especially electronic transactions, increases. Developing and maintaining the Company's internal financial controls becomes more challenging, and the risk of system or human error in connection with such transactions increases. The Company must continuously monitor these internal financial controls to support the Company's operations and respond to changes in regulations and markets. A failure in such internal financial controls could harm the Company’s reputation, operating results and financial position.
Environmental issues, including climate change, or legal, regulatory or market measures to address environmental issues, may negatively affect the Company's business and operations and cause it to incur significant costs.
The Company’s manufacturing facilities are subject to numerous federal, state, local and foreign laws and regulations designed to protect the environment, including increased government regulations to limit carbon dioxide and other greenhouse gas emissions as a result of concern over climate change, and the Company expects that additional requirements with respect to environmental matters will be imposed on it in the future.
There is also growing concern that carbon dioxide and other greenhouse gases in the atmosphere may have an adverse impact on global temperatures, weather patterns, and the frequency and severity of extreme weather and natural disasters. In the event that issues related to such climate change have a negative effect on the Company's business, it may be subjected to decreased availability or less favorable pricing for certain raw materials, including natural rubber. Natural disasters and extreme weather conditions may also disrupt the productivity of the Company's facilities or the operation of its supply chain.
In addition, the Company has contractual indemnification obligations for environmental remediation costs and liabilities that may arise relating to certain divested operations. Material future expenditures may be necessary if compliance standards change, if material unknown conditions that require remediation are discovered, or if required remediation of known conditions becomes more extensive than expected. If the Company fails to comply with present and future environmental laws and regulations, it could be subject to future liabilities or the suspension of production, which could harm its business or results of operations. Environmental laws could also restrict the Company’s ability to expand its facilities or could require it to acquire costly equipment or to incur other significant expenses in connection with its manufacturing processes.
The Company has been and may continue to be impacted by currency fluctuations, which may reduce reported results for the Company’s international operations and otherwise adversely affect the business.
Because the Company conducts transactions in various non-U.S. currencies, including the Euro, Canadian dollar, British pound sterling, Swiss franc, Swedish kronar, Norwegian krone, Mexican peso, Chinese yuan, Serbian dinar and Brazilian real, fluctuations in foreign currency exchange rates may impact the Company’s financial condition, results of operations and cash flows, despite currency hedging actions by the Company. The Company’s operating results are subject to the effects of fluctuations in the value of these currencies and fluctuations in the related currency exchange rates. As a result, the Company’s sales have historically been affected by, and may continue to be affected by, these fluctuations. Exchange rate movements between currencies in which the Company sells its products have been affected by and may continue to result in exchange losses that could materially affect results. During times of strength of the U.S. dollar, the reported revenues of the Company’s international operations will be reduced because local currencies will translate into fewer dollars. In addition, a strong U.S. dollar may increase the competitiveness of competitors based outside of the United States. As a result, continued strengthening of the U.S. dollar may have a material adverse effect on the Company’s financial condition, results of operations and cash flows. A weak U.S. dollar could increase the cost of goods imported into the Company's U.S. operations and other goods imported in U.S. dollars at other locations and may decrease the profitability of the Company's operations. As a result, continued weakening of the U.S. dollar may have a material adverse effect on the Company’s financial condition, results of operations and cash flows.
The Company may not be able to protect its intellectual property rights adequately.
The Company’s success depends in part upon its ability to use and protect its proprietary technology and other intellectual property, which generally covers various aspects in the design and manufacture of its products and processes. The Company owns and uses tradenames and trademarks worldwide. The Company relies upon a combination of trade secrets, confidentiality
-
15
-
policies, nondisclosure and other contractual arrangements and patent, copyright and trademark laws to protect its intellectual property rights. The steps the Company takes in this regard may not be adequate to protect its intellectual property or to prevent or deter challenges or infringement or other violations of its intellectual property, and the Company may not be able to detect unauthorized use or take appropriate and timely steps to enforce its intellectual property rights.
In addition, the laws of some countries may not protect and enforce the Company’s intellectual property rights to the same extent as the laws of the U.S. Further, while the Company believes it has rights to use all intellectual property in the Company’s use, if the Company is found to infringe on the rights of others it could be adversely impacted.
The Company’s expenditures for pension and other postretirement obligations could be materially higher than it has predicted if its underlying assumptions prove to be incorrect.
The Company provides defined benefit and hybrid pension plan coverage to union and non-union U.S. employees and a contributory defined benefit plan in the U.K. The Company’s pension expense and its required contributions to its pension plans are directly affected by the value of plan assets, the projected and actual rates of return on plan assets and the actuarial assumptions the Company uses to measure its defined benefit pension plan obligations, including the discount rate at which future projected and accumulated pension obligations are discounted to a present value and the inflation rate. The Company could experience increased pension expense due to a combination of factors, including the decreased investment performance of its pension plan assets, decreases in the discount rate, changes in its assumptions relating to the expected return on plan assets, including changes necessitated by movements in the glide path whereby a target return-seeking allocation is followed based upon a given funded ratio level, updates to mortality tables, changes to participant behaviors and the impact of changes to the Company’s pension strategy. The Company could also experience increased other postretirement expense due to decreases in the discount rate, increases in the health care trend rate and changes in the health care environment.
In the event of declines in the market value of the Company’s pension assets or lower discount rates to measure the present value of pension and other postretirement benefit obligations, the Company could experience changes to its Condensed Consolidated Balance Sheet or significant cash requirements.
The realizability of deferred tax assets may affect the Company’s profitability and cash flows.
The Company has significant net deferred tax assets recorded on the balance sheet and determines at each reporting period whether or not a valuation allowance is necessary based upon the expected realizability of such deferred tax assets. In the U.S., the Company has recorded deferred tax assets, the largest of which relate to product liability, pension and other postretirement benefit obligations, partially offset by deferred tax liabilities, the most significant of which relates to accelerated depreciation. The Company’s non-U.S. deferred tax assets relate to pension, accrued expenses and net operating losses, and are partially offset by deferred tax liabilities related to accelerated depreciation. Based upon the Company’s assessment of the realizability of its net deferred tax assets, the Company maintains a valuation allowance in the U.K., as well as a small valuation allowance for the portion of its U.S. deferred tax assets primarily associated with a loss carryforward. In addition, the Company has recorded valuation allowances for deferred tax assets primarily associated with other non-U.S. net operating losses.
The Company’s assessment of the realizability of deferred tax assets is based in part on certain assumptions regarding future profitability, and potentially adverse business conditions could have a negative impact on the future realizability of the deferred tax assets and therefore impact the Company’s future operating results or financial position.
The impact of proposed new accounting standards may have a negative impact on the Company’s financial statements.
The Financial Accounting Standards Board is considering or has issued for future adoption several projects which may result in the modification of accounting standards affecting the Company. Any such changes could have a negative impact on the Company’s financial statements.
The Company is facing risks relating to healthcare legislation.
The Company is facing risks emanating from legislation in the U.S., including the Patient Protection and Affordable Care Act and the related Healthcare and Education Reconciliation Act, which are collectively referred to as healthcare legislation. The future of this major legislation and any replacement is now in question and the ultimate cost and the potentially adverse impact to the Company and its employees cannot be quantified at this time.
|
Item 1B.
|
UNRESOLVED STAFF COMMENTS
|
None.
-
16
-
|
Item 2.
|
PROPERTIES
|
As shown in the following table, at
December 31, 2019
, the Company maintained
54
manufacturing facilities, distribution centers, retail stores, technical centers and office facilities worldwide. A majority of the manufacturing facilities are wholly-owned by the Company. Some manufacturing, distribution and office facilities are leased.
|
|
Americas Tire Operations
|
|
International Tire Operations
|
|
|||||||||||||
|
Type of Facility
|
North America
|
Latin America
|
|
Europe
|
Asia
|
Total
|
|||||||||||
|
Manufacturing
|
4
|
|
1
|
|
*
|
2
|
|
3
|
|
**
|
10
|
|
|||||
|
Distribution centers
|
12
|
|
1
|
|
|
6
|
|
2
|
|
21
|
|
||||||
|
Retail stores
|
3
|
|
—
|
|
|
—
|
|
—
|
|
3
|
|
||||||
|
Technical centers and offices
|
7
|
|
4
|
|
|
5
|
|
4
|
|
20
|
|
||||||
|
Total
|
26
|
|
6
|
|
|
13
|
|
9
|
|
54
|
|
||||||
*Latin America includes a manufacturing facility that is a joint venture, COOCSA. On January 24, 2020, the Company acquired the remaining
42 percent
noncontrolling ownership interest in COOCSA, making COOCSA a wholly-owned subsidiary.
**Asia includes two manufacturing facilities that are joint ventures, GRT, in the PRC, and ACTR, in Vietnam.
The Company believes its properties have been adequately maintained, generally are in good condition and are suitable and adequate to meet the demands of each segment’s business.
|
Item 3
.
|
LEGAL PROCEEDINGS
|
The Company is a defendant in various judicial proceedings arising in the ordinary course of business. A significant portion of these proceedings are product liability cases in which individuals involved in motor vehicle accidents seek damages resulting from allegedly defective tires manufactured by the Company. After reviewing all of these proceedings, and taking into account all relevant factors concerning them, the Company does not believe that any liabilities resulting from these proceedings are reasonably likely to have a material adverse effect on its liquidity, financial condition or results of operations in excess of amounts recorded at
December 31, 2019
. In the future, such costs could have a materially greater impact on the consolidated results of operations and financial position of the Company than in the past.
|
Item 4.
|
MINE SAFETY DISCLOSURES
|
None.
-
17
-
|
Item 5.
|
MARKET FOR REGISTRANT'S COMMON EQUITY, RELATED STOCKHOLDER MATTERS AND ISSUER PURCHASES OF EQUITY SECURITIES
|
|
(a)
|
Market information
|
Cooper Tire & Rubber Company common stock is traded on the New York Stock Exchange under the symbol CTB.
Five-Year Stockholder Return Comparison
The SEC requires that the Company include in its annual report to stockholders a line graph presentation comparing cumulative five-year stockholder returns on an indexed basis with the Standard & Poor’s (“S&P”) Stock Index and either a published industry or line-of-business index or an index of peer companies selected by the Company. In 1993, the Company chose what is now the S&P 500 Auto Parts & Equipment Index as the most appropriate of the nationally recognized industry standards and has used that index for its stockholder return comparisons in all of its annual reports since that time.
The following chart assumes three hypothetical $100 investments on
December 31, 2014
, and shows the cumulative values at the end of each succeeding year resulting from appreciation or depreciation in the stock market price, assuming dividend reinvestment.
Total Return To Shareholders
(Includes reinvestment of dividends)
|
ANNUAL RETURN PERCENTAGE
Year Ended December 31,
|
|||||||||||||||
|
Company / Index
|
2015
|
2016
|
2017
|
2018
|
2019
|
||||||||||
|
Cooper Tire & Rubber Company
|
10.45
|
|
3.86
|
|
(8.00
|
)
|
(7.21
|
)
|
(9.77
|
)
|
|||||
|
S&P 500 Index
|
1.38
|
|
11.96
|
|
21.83
|
|
(4.38
|
)
|
31.49
|
|
|||||
|
S&P 500 Auto Parts & Equipment
|
(7.24
|
)
|
(4.25
|
)
|
45.58
|
|
(28.74
|
)
|
45.16
|
|
|||||
|
Base
Period
|
INDEXED RETURNS
Year Ended December 31,
|
|||||||||||||||||||||||
|
Company / Index
|
2014
|
2015
|
2016
|
2017
|
2018
|
2019
|
||||||||||||||||||
|
Cooper Tire & Rubber Company
|
$
|
100.00
|
|
$
|
110.45
|
|
$
|
114.31
|
|
$
|
106.31
|
|
$
|
99.10
|
|
$
|
89.33
|
|
||||||
|
S&P 500 Index
|
100.00
|
|
101.38
|
|
113.34
|
|
135.17
|
|
130.79
|
|
162.28
|
|
||||||||||||
|
S&P 500 Auto Parts & Equipment
|
100.00
|
|
92.76
|
|
88.52
|
|
134.10
|
|
105.36
|
|
150.52
|
|
||||||||||||
-
18
-
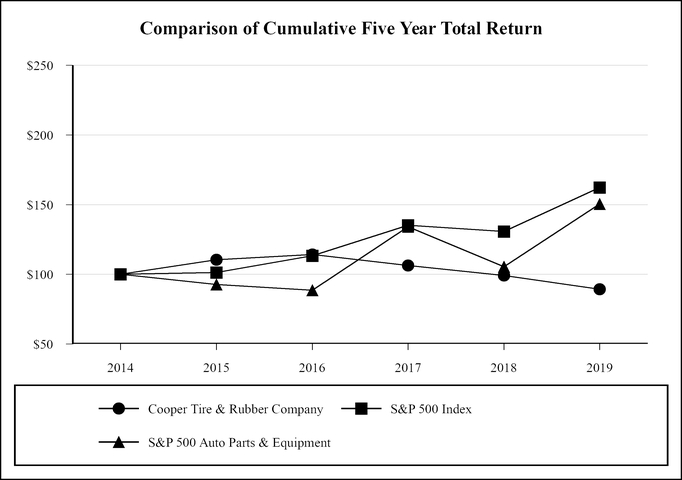
-
19
-
|
(b)
|
Holders
|
The number of holders of record at
December 31, 2019
was
1,570
.
(c) Dividends
The Company has paid consecutive quarterly dividends on its common stock since 1973.
(d) Issuer purchases of equity securities
During the quarter ended
December 31, 2019
, the Company did not purchase any equity securities registered by the Company pursuant to Section 12 of the Securities Exchange Act of 1934.
On
February 16, 2017
, the Board of Directors increased the amount under and expanded the duration of the Company's existing share repurchase program (as amended, the "2017 Repurchase Program"). The 2017 Repurchase Program allowed the Company to repurchase up to
$300,000,000
, excluding commissions, of the Company’s common stock through
December 31, 2019
. The approximately
$95,634,000
remaining authorization under the Company's existing share repurchase program as of
February 16, 2017
was included in the
$300,000,000
maximum amount authorized by the 2017 Repurchase Program. On
December 3, 2019
, the expiration of the 2017 Repurchase Program was extended to
December 31, 2021
. No other changes were made. The 2017 Repurchase Program does
not obligate the Company to acquire any specific number of shares and can be suspended or discontinued at any time without notice. Shares can be repurchased in privately negotiated and/or open market transactions, including under plans complying with Rule 10b5-1 under the Securities Exchange Act of 1934, as amended. All repurchases under the program listed above have been made using cash resources.
-
20
-
|
Item 6.
|
SELECTED FINANCIAL DATA
|
|
(Dollar amounts in thousands except per share amounts)
|
|
|
|
|
|
|||||||||||||||
|
|
2019 (a)
|
2018 (b)
|
2017 (c)
|
2016
|
2015
|
|||||||||||||||
|
Net sales
|
$
|
2,752,639
|
|
$
|
2,808,062
|
|
$
|
2,854,656
|
|
$
|
2,942,869
|
|
$
|
2,972,901
|
|
|||||
|
Operating profit
(d)
|
$
|
174,455
|
|
$
|
165,245
|
|
$
|
309,247
|
|
$
|
437,458
|
|
$
|
399,305
|
|
|||||
|
Income before income taxes
|
$
|
109,672
|
|
$
|
114,058
|
|
$
|
243,925
|
|
$
|
367,093
|
|
$
|
334,028
|
|
|||||
|
Net income attributable to Cooper Tire & Rubber Company
|
$
|
96,404
|
|
$
|
76,586
|
|
$
|
95,400
|
|
$
|
248,381
|
|
$
|
212,766
|
|
|||||
|
Earnings per share:
|
||||||||||||||||||||
|
Basic
|
$
|
1.92
|
|
$
|
1.52
|
|
$
|
1.83
|
|
$
|
4.56
|
|
$
|
3.73
|
|
|||||
|
Diluted
|
$
|
1.91
|
|
$
|
1.51
|
|
$
|
1.81
|
|
$
|
4.51
|
|
$
|
3.69
|
|
|||||
|
Dividends per share
|
$
|
0.42
|
|
$
|
0.42
|
|
$
|
0.42
|
|
$
|
0.42
|
|
$
|
0.42
|
|
|||||
|
Weighted average shares outstanding (000s):
|
||||||||||||||||||||
|
Basic
|
50,159
|
|
50,350
|
|
52,206
|
|
54,480
|
|
57,012
|
|
||||||||||
|
Diluted
|
50,378
|
|
50,597
|
|
52,673
|
|
55,090
|
|
57,623
|
|
||||||||||
|
Property, plant and equipment, net
|
$
|
1,047,242
|
|
$
|
1,001,921
|
|
$
|
966,747
|
|
$
|
864,227
|
|
$
|
795,198
|
|
|||||
|
Total assets
(e), (f)
|
$
|
2,802,338
|
|
$
|
2,634,205
|
|
$
|
2,707,925
|
|
2,731,677
|
|
2,550,203
|
|
|||||||
|
Long-term debt and finance leases
(g)
|
$
|
309,148
|
|
$
|
121,284
|
|
$
|
295,987
|
|
$
|
297,094
|
|
$
|
296,412
|
|
|||||
|
Total equity
|
$
|
1,327,733
|
|
$
|
1,232,443
|
|
$
|
1,185,756
|
|
$
|
1,130,236
|
|
$
|
1,017,611
|
|
|||||
|
Capital expenditures
|
$
|
202,722
|
|
$
|
193,299
|
|
$
|
197,186
|
|
$
|
175,437
|
|
$
|
182,544
|
|
|||||
|
Depreciation and amortization
|
$
|
148,054
|
|
$
|
147,161
|
|
$
|
140,228
|
|
$
|
130,257
|
|
$
|
121,408
|
|
|||||
|
Number of employees
(h)
|
8,720
|
|
9,027
|
|
9,204
|
|
9,149
|
|
8,027
|
|
||||||||||
|
(a)
|
The Company recorded an income tax benefit of
$18,606
as a result of the implementation of a business realignment strategy in Europe.
|
|
(b)
|
The Company recorded a non-cash goodwill impairment charge of $33,827 in 2018.
|
|
(c)
|
The Company recorded $35,378 of deemed repatriation tax and $20,413 for the re-measurement of deferred tax assets in conjunction with U.S. tax reform, as well as a U.K. valuation allowance charge of $18,915, less the reversal of an Asia valuation allowance of $6,671 in 2017.
|
|
(d)
|
The non-service cost components of net periodic benefit cost were reclassified outside of operating profit to Other pension and postretirement benefit expense in the amount of $37,523, $53,071 and $44,825 in 2017, 2016 and 2015, respectively, as a result of the adoption of Accounting Standards Update ("ASU") 2017-07 in 2018.
|
|
(e)
|
The Company has reclassified its volume and customer rebate program reserves from a contra-asset included within Accounts receivable to a liability within Accrued liabilities in the amount of $100,190, $93,783 and $96,927 in 2017, 2016 and 2015, respectively, as a result of the adoption of Accounting Standards Codification ("ASC") 606 in 2018.
|
|
(f)
|
The Company has reclassified its voluntary employee beneficiary association trust from a reduction of accrued benefits within Accrued liabilities to restricted cash included within Other assets of $18,499 and $17,100 in 2016 and 2015, respectively, as a result of the adoption of ASC 2016-18 in 2018.
|
|
(g)
|
In 2018, Long-term debt and finance leases reflect the short-term classification of $173,578 of unsecured notes due in December 2019. This amount was paid in 2019 and replaced with a new long-term borrowing.
|
|
(h)
|
The number of employees has been adjusted downward by 1,391 and 1,092 in 2016 and 2015, respectively, to properly reflect members of the COOCSA joint venture workforce who are employed by an employment services company.
|
-
21
-
|
Item 7
.
|
MANAGEMENT'S DISCUSSION AND ANALYSIS OF FINANCIAL CONDITION AND RESULTS OF OPERATIONS
|
Business of the Company
The Company specializes in the design, manufacture, marketing and sales of passenger car, light truck, TBR, motorcycle and racing tires. The Company’s products are sold globally, primarily in the replacement tire market to independent tire dealers, wholesale distributors, regional and national retail tire chains, large retail chains that sell tires as well as other automotive products, mass merchandisers and digital channels.
The Company faces both general industry and Company-specific challenges. These include volatile raw material costs, increasing product complexity and pressure from competitors who, in some cases, are larger companies with greater financial resources. To address these challenges and position the Company for future success, the Company continues to execute towards strategic imperatives, namely building a sustainable cost competitive position, driving top-line profitable growth and building organizational capabilities and enablers to support strategic goals.
The Company has operations in what are considered lower-cost countries. This includes the Cooper Kunshan Tire manufacturing operation in the PRC, joint venture manufacturing operations in Mexico and the PRC and a manufacturing facility in Serbia. On January 24, 2020, the Company acquired the remaining
42 percent
noncontrolling ownership interest in the Mexican joint venture manufacturing operations, making it a wholly-owned subsidiary. Products from these operations provide a lower-cost source of tires for existing markets and have been used to expand the Company’s market share in Mexico and the PRC. Through a variety of other projects, the Company also has improved the competitiveness of its manufacturing operations in the United States. On April 5, 2019, Cooper Vietnam and Sailun Vietnam established a joint venture in Vietnam which will produce and sell TBR tires. The new joint venture is expected to begin commercially producing tires in 2020.
On January 17, 2019, Cooper Tire Europe committed to a plan to cease light vehicle tire production at its Melksham, U.K facility. The phasing out of light vehicle tire production was substantially completed in the third quarter of 2019. Approximately 300 roles were eliminated at the site. Cooper Tire Europe now obtains light vehicle tires to meet customer needs from other production sites within the Company’s global production network. Approximately 400 roles remain in Melksham to support the functions that continue there, including motorsports and motorcycle tire production, the materials business, Cooper Tire Europe headquarters, sales and marketing, and the Europe Technical Center.
The following discussion of financial condition and results of operations should be read together with “Selected Financial Data,” the Company’s consolidated financial statements and the notes to those statements and other financial information included elsewhere in this report.
This Management’s Discussion and Analysis of Financial Condition and Results of Operations (“MD&A”) presents information related to the consolidated results of the operations of the Company, a discussion of past results of the Company’s segments, future outlook for the Company and information concerning the liquidity, capital resources and critical accounting policies of the Company. The Company's future results may differ materially from those indicated in the forward-looking statements, including for the reasons noted in the Risk Factors in Item 1A.
The MD&A generally discusses 2019 and 2018 items and year-to-year comparisons between 2019 and 2018. Discussion of 2017 items and the results of
December 31, 2018
as compared to December 31,
2017
can be found in Item 7, Management's Discussion and Analysis of Financial Condition and Results of Operations, included in the Company's annual report on Form 10-K for the year ended
December 31, 2018
as filed with the SEC.
-
22
-
Consolidated Results of Operations
|
(Dollar amounts in thousands except per share amounts)
|
|
|
||||||||||||||
|
|
Twelve Months Ended December 31,
|
|||||||||||||||
|
|
2019
|
Change
|
2018
|
Change
|
2017
|
|||||||||||
|
Net Sales
|
||||||||||||||||
|
Americas Tire
|
$
|
2,353,726
|
|
(0.4)%
|
$
|
2,362,646
|
|
(2.2)%
|
$
|
2,416,778
|
|
|||||
|
International Tire
|
534,003
|
|
(16.7)%
|
640,976
|
|
3.6%
|
618,869
|
|
||||||||
|
Eliminations
|
(135,090
|
)
|
30.9%
|
(195,560
|
)
|
(8.0)%
|
(180,991
|
)
|
||||||||
|
Net sales
|
2,752,639
|
|
(2.0)%
|
2,808,062
|
|
(1.6)%
|
2,854,656
|
|
||||||||
|
Operating profit (loss):
|
||||||||||||||||
|
Americas Tire
|
237,753
|
|
3.6%
|
229,500
|
|
(35.4)%
|
355,059
|
|
||||||||
|
International Tire
|
(13,390
|
)
|
4.7%
|
(14,044
|
)
|
n/m
|
15,168
|
|
||||||||
|
Unallocated corporate charges
|
(49,968
|
)
|
3.1%
|
(51,564
|
)
|
12.8%
|
(59,153
|
)
|
||||||||
|
Eliminations
|
60
|
|
(95.6)%
|
1,353
|
|
n/m
|
(1,827
|
)
|
||||||||
|
Operating profit
|
174,455
|
|
5.6%
|
165,245
|
|
(46.6)%
|
309,247
|
|
||||||||
|
Interest expense
|
(31,189
|
)
|
(3.1)%
|
(32,181
|
)
|
0.4%
|
(32,048
|
)
|
||||||||
|
Interest income
|
9,458
|
|
(7.4)%
|
10,216
|
|
38.8%
|
7,362
|
|
||||||||
|
Other pension and postretirement benefit expense
|
(41,567
|
)
|
49.5%
|
(27,806
|
)
|
(25.9)%
|
(37,523
|
)
|
||||||||
|
Other non-operating expense
|
(1,485
|
)
|
4.9%
|
(1,416
|
)
|
(54.5)%
|
(3,113
|
)
|
||||||||
|
Income before income taxes
|
109,672
|
|
(3.8)%
|
114,058
|
|
(53.2)%
|
243,925
|
|
||||||||
|
Provision for income taxes
|
11,355
|
|
(66.1)%
|
33,495
|
|
(77.2)%
|
147,180
|
|
||||||||
|
Net income
|
98,317
|
|
22.0%
|
80,563
|
|
(16.7)%
|
96,745
|
|
||||||||
|
Net income attributable to noncontrolling shareholders’ interests
|
1,913
|
|
(51.9)%
|
3,977
|
|
195.7%
|
1,345
|
|
||||||||
|
Net income attributable to Cooper Tire & Rubber Company
|
$
|
96,404
|
|
25.9%
|
$
|
76,586
|
|
(19.7)%
|
$
|
95,400
|
|
|||||
|
Basic earnings per share
|
$
|
1.92
|
|
26.3%
|
$
|
1.52
|
|
(16.9)%
|
$
|
1.83
|
|
|||||
|
Diluted earnings per share
|
$
|
1.91
|
|
26.5%
|
$
|
1.51
|
|
(16.6)%
|
$
|
1.81
|
|
|||||
n/m - not meaningful
2019
versus
2018
Consolidated net sales for the year ended December 31,
2019
were
$2,753 million
, a decrease of
$55 million
from 2018. In
2019
, the Company experienced favorable price and mix (
$72 million
), offset by lower unit volume (
$112 million
) and unfavorable foreign currency impact (
$15 million
). The negative impact to net sales from lower unit volume was caused by a
3.8 percent
unit volume decline in Americas Tire, coupled with a
14.4 percent
decline in International Tire Operations, compared to 2018.
The Company recorded operating profit of $
174 million
in
2019
, compared to operating profit of
$165 million
in
2018
. The Company's 2019 operating profit included
$64 million
of favorable raw material costs, excluding the antidumping and countervailing TBR duties and Section 301 duties ("new tariffs") described below, and
$52 million
of favorable price and mix, while the 2018 results included a goodwill impairment charge of
$34 million
in the Company's International Tires Operations segment. This favorability was partially offset by
$32 million
of new tariffs net of recovered duties ("duty drawbacks") on imports into the U.S. from China, as well as lower unit volume of
$27 million
, higher manufacturing costs of
$26 million
, higher product liability expense of
$23 million
and additional selling, general and administrative costs of
$6 million
. In 2019, the Company also incurred
$9 million
of restructuring costs related to the decision to cease light vehicle tire production at the Melksham, U.K. facility. Other costs increased
$18 million
in 2019, including higher distribution costs and the nonrecurrence of
$6 million
of insurance recoveries net of direct costs recorded in 2018.
-
23
-
On February 15, 2019, antidumping and countervailing duties of
42.16 percent
were imposed on the Company's TBR tire imports into the U.S. from the PRC. The Company incurred duties of
$34 million
for the year ended
December 31, 2019
related to antidumping and countervailing duties on TBR tire imports. Additionally, pursuant to Section 301: China’s Acts, Policies, and Practices Related to Technology Transfer, Intellectual Property, and Innovation, passenger, light truck and TBR tires, raw materials and tire-manufacturing equipment from the PRC imported into the U.S. became subject to additional
10 percent
duties effective September 24, 2018. These tariffs increased to 25 percent effective May 10, 2019. The Company has incurred duties of
$19 million
in 2019 related to these Section 301 tariffs. In 2019, the Company recovered $20 million of duties through the Trade Facilitation and Trade Enforcement Act of 2015 ("TFTEA"). The Modernized Drawback Final Rule under the TFTEA allows the Company to recover duties paid on goods imported into the US when such goods, or similar items, are subsequently exported.
The principal raw materials for the Company include natural rubber, synthetic rubber, carbon black, chemicals and steel reinforcement components. Approximately
70
percent of the Company’s raw materials are petroleum-based. Substantially all U.S. inventories have been valued using the LIFO method of inventory costing, which accelerates the impact to cost of goods sold from changes to raw material prices.
The Company strives to assure raw material and energy supply and to obtain the most favorable pricing possible. For natural rubber, natural gas and certain principal materials, procurement is managed through a combination of buying forward of production requirements and utilizing the spot market. For other principal materials, procurement arrangements include supply agreements that may contain formula-based pricing based on commodity indices, multi-year agreements or spot purchase contracts. While the Company uses these arrangements to satisfy normal manufacturing demands, the pricing volatility in these commodities contributes to the difficulty in managing the costs of raw materials.
As part of its regular review of product liability reserves, the Company monitors trends that may affect its ultimate liability and analyzes the developments and variables likely to affect pending and anticipated claims against the Company and the reserve for such claims. The Company utilizes claims experience, as well as trends and developments in the litigation climate, in estimating its required accrual. Based on the review completed in 2019, coupled with normal activity, including the addition of another year of self-insured incidents, settlements and changes in the amount of reserves, product liability expense increased $23 million to
$40 million
in
2019
as compared to
2018
. Additional information related to the Company’s accounting for product liability costs appears in the Notes to the Consolidated Financial Statements.
Selling, general, and administrative expenses were $
250 million
in
2019
(
9.1 percent
of net sales) and $
244 million
in
2018
(
8.7 percent
of net sales). The increase in selling, general and administrative expenses in 2019 was driven primarily by an increase in incentive compensation.
During
2019
, the Company recorded restructuring expense associated with the planned cessation of light vehicle tire production at the Melksham, U.K. facility. This initiative was committed to on January 17, 2019 by Cooper Tire Europe, a wholly owned subsidiary of the Company. The Company recorded restructuring expense of $8 million for the year related to the Melksham decision, and an additional $1 million of severance related costs due to an organizational restructuring in the Company's Asian operations in the fourth quarter of 2019. Additional information related to the Company’s accounting for restructuring costs appears in the Notes to the Consolidated Financial Statements.
Interest expense and interest income in
2019
were comparable to
2018
.
For the year ended
December 31, 2019
, other pension and postretirement benefit expense was
$42 million
as compared to
$28 million
in 2018. The increase is primarily the result of lower estimated returns on plan assets compared to
2018
, reflective of an improved pension funded status resulting in the portfolio taking less risk in order to preserve the funded status. Additionally, the Company incurred a non-cash settlement charge of $4 million as a result of the volume of lump-sum distributions out of Cooper Tire Europe's U.K. pension plan in 2019.
Other expense of $1 million in 2019 was comparable to 2018.
For the year ended
December 31, 2019
, the Company recorded income tax expense of
$11 million
(effective tax rate of
10.4 percent
) compared to
$33 million
(effective tax rate of
29.4 percent
) for
2018
. The 2019 effective tax rate included the benefit of $19 million from planning actions involving the Company's European tax structure which were executed in the fourth quarter of 2019. The 2018 effective rate was unfavorably impacted by the non-deductible GRT goodwill impairment charge.
-
24
-
Segment Operating Results
The Company has four segments under ASC 280:
|
•
|
North America, composed of the Company’s operations in the U.S. and Canada;
|
|
•
|
Latin America, composed of the Company’s operations in Mexico, Central America and South America;
|
|
•
|
Europe; and
|
|
•
|
Asia.
|
North America and Latin America meet the criteria for aggregation in accordance with ASC 280, as they are similar in their production and distribution processes and exhibit similar economic characteristics. The aggregated North America and Latin America segments are presented as “Americas Tire Operations” in the segment disclosure.
Both the Europe and Asia segments have been determined to be individually immaterial, as they do not meet the quantitative requirements for segment disclosure under ASC 280. In accordance with ASC 280, information about operating segments that are not reportable shall be combined and disclosed in an all other category separate from other reconciling items. As a result, these two segments have been combined in the segment operating results discussion. The results of the combined Europe and Asia segments are presented as “International Tire Operations” in the segment disclosure.
Americas Tire Operations Segment
|
(Dollar amounts in thousands)
|
Twelve Months Ended December 31,
|
|||||||||||||||
|
2019
|
Change
|
2018
|
Change
|
2017
|
||||||||||||
|
Sales
|
$
|
2,353,726
|
|
(0.4)%
|
$
|
2,362,646
|
|
(2.2)%
|
$
|
2,416,778
|
|
|||||
|
Operating profit
|
$
|
237,753
|
|
3.6%
|
$
|
229,500
|
|
(35.4)%
|
$
|
355,059
|
|
|||||
|
Operating margin
|
10.1%
|
0.4 points
|
9.7%
|
(5.0) points
|
14.7%
|
|||||||||||
|
Total unit sales change
|
(3.8)%
|
(2.2)%
|
||||||||||||||
|
United States replacement market unit shipment changes:
|
||||||||||||||||
|
Passenger tires
|
||||||||||||||||
|
Segment
|
(2.7)%
|
(1.8)%
|
||||||||||||||
|
USTMA members
|
0.1%
|
(0.6)%
|
||||||||||||||
|
Total Industry
|
2.2%
|
3.4%
|
||||||||||||||
|
Light truck tires
|
||||||||||||||||
|
Segment
|
(3.2)%
|
(1.4)%
|
||||||||||||||
|
USTMA members
|
1.4%
|
(1.3)%
|
||||||||||||||
|
Total Industry
|
2.7%
|
0.7%
|
||||||||||||||
|
Total light vehicle tires
|
||||||||||||||||
|
Segment
|
(2.8)%
|
(1.7)%
|
||||||||||||||
|
USTMA members
|
0.3%
|
(0.7)%
|
||||||||||||||
|
Total Industry
|
2.3%
|
3.0%
|
||||||||||||||
The source of this information is the United States Tire Manufactures Association ("USTMA") and internal sources.
Overview
The Americas Tire Operations segment manufactures and markets passenger car and light truck tires, primarily for sale in the U.S. replacement market. The segment also has a joint venture manufacturing operation in Mexico,
COOCSA,
which supplies passenger car and light truck tires to the Mexican, North American, Central American and South American markets. On January 24, 2020, the Company acquired the remaining 42 percent noncontrolling ownership interest in COOCSA, making COOCSA a wholly-owned subsidiary. The segment also markets and distributes racing, TBR and motorcycle tires. The racing and motorcycle tires are manufactured by the Company’s European segment and by others. TBR tires are sourced from
GRT
and through off-take agreements
with PCT, through mid-2021, and Sailun Vietnam through December 31, 2020. On April 5, 2019, Cooper Vietnam and Sailun Vietnam established a joint venture in Vietnam, ACTR, which will produce and sell TBR tires. The new joint venture is expected to begin commercially producing tires in 2020.
Major distribution channels and customers include independent tire dealers, wholesale distributors, regional and national retail tire chains, large retail chains that sell tires as well as other automotive products, mass merchandisers and digital channels. The
-
25
-
segment does not currently sell its products directly to end users, except through three Company-owned retail stores. The segment sells a limited number of tires to OEMs.
Sales
Net sales of the Americas Tire Operations segment decreased from
$2,363 million
in
2018
to
$2,354 million
in
2019
. In 2019, the segment experienced favorable pricing and mix (
$80 million
), offset by unfavorable volume impact (
$89 million
). Unit shipments for the segment decreased
3.8 percent
in
2019
compared with
2018
. In the U.S., the segment’s unit shipments of total light vehicle tires decreased
2.8 percent
in
2019
compared with the same period in
2018
. This decrease compares with a
0.3 percent
increase in total light vehicle tire shipments experienced by USTMA members, and a
2.3 percent
increase in total light vehicle tire shipments experienced for the total industry. Americas Tire Operations volume has been impacted by customer inventory actions in the U.S.
Operating Profit
Operating profit for the segment increased from
$230 million
in 2018 to
$238 million
in
2019
. Operating profit in
2019
included
$63 million
of favorable price and mix and
$50 million
of favorable raw material costs (excluding the new tariffs). These favorable items were partially offset by
$32 million
of new tariffs net of duty drawbacks on imports into the U.S. from China,
$23 million
of higher product liability costs,
$19 million
of lower unit volume,
$11 million
of higher selling, general and administrative costs and
$7 million
of unfavorable manufacturing costs.
2019
also included increased other costs of
$13 million
, including higher distribution costs and the nonrecurrence of
$6 million
of insurance recoveries net of direct costs recorded in 2018.
The segment utilizes an internal raw material index which is calculated based upon the underlying costs of the segment's key raw materials for the period and is utilized in comparing the cost of raw materials from period to period. The segment’s internally calculated raw material index of
149.8
for the quarter ended
December 31, 2019
was a decrease of
9.3 percent
from the
fourth
quarter of
2018
. The raw material index decreased
4.6 percent
from the quarter ended September 30, 2019.
International Tire Operations Segment
|
(Dollar amounts in thousands)
|
Twelve Months Ended December 31,
|
|||||||||||||||
|
|
2019
|
Change
|
2018
|
Change
|
2017
|
|||||||||||
|
Sales
|
$
|
534,003
|
|
(16.7)%
|
$
|
640,976
|
|
3.6%
|
$
|
618,869
|
|
|||||
|
Operating (loss) profit
|
$
|
(13,390
|
)
|
4.7%
|
$
|
(14,044
|
)
|
n/m
|
$
|
15,168
|
|
|||||
|
Operating margin
|
(2.5)%
|
(0.3) points
|
(2.2)%
|
(4.7) points
|
2.5%
|
|||||||||||
|
Total unit sales change
|
(14.4)%
|
(5.4)%
|
||||||||||||||
Overview
The International Tire Operations segment is the combination of the Europe and Asia operating segments. The European operations include manufacturing operations in the U.K. and Serbia.
The U.K. entity manufactures and markets motorcycle and racing tires and tire retread material for domestic and global markets. The Serbian entity manufactures passenger car and light truck tires primarily for the European markets and for export to the North American segment.
The Asian operations are located in the PRC and Vietnam.
Cooper Kunshan Tire manufactures passenger car and light truck tires both for the Chinese domestic market and for export to markets outside of the PRC. GRT, a joint venture manufacturing facility located in the PRC, serves as a global source of TBR tire production for the Company. The segment also procures certain TBR tires under off-take agreements with PCT, through mid-2021, and Sailun Vietnam, through December 31, 2020.
On April 5, 2019, Cooper Vietnam and Sailun Vietnam established a joint venture in Vietnam, ACTR, which will produce and sell TBR tires in addition to the off-take agreement. The new joint venture is expected to begin commercially producing tires in 2020.
The segment sells a majority of its tires in the replacement market, with a portion also sold to OEMs.
On January 17, 2019, Cooper Tire Europe, a wholly owned subsidiary of the Company, committed to a plan to cease light vehicle tire production at its Melksham, U.K. facility. The phasing out of light vehicle tire production was substantially completed in the third quarter of 2019. Approximately
300
roles were eliminated at the site. Cooper Tire Europe now obtains light vehicle tires to meet customer needs from other production sites within the Company’s global production network. Approximately
400
roles remain in Melksham to support the functions that continue there, including motorsports and motorcycle tire production, a materials business, Cooper Tire Europe headquarters, sales and marketing, and the Europe Technical Center.
-
26
-
Sales
Net sales of the International Tire Operations segment were
$534 million
for the year ended December 31, 2019, compared to
$641 million
in 2018. The segment experienced
$93 million
of lower unit volume and
$16 million
of unfavorable foreign currency impact, partially offset by
$2 million
of favorable price and mix. Segment unit volume was down
14.4 percent
, with unit volume decreases in Asia and Europe, primarily due to lower intercompany shipments.
Operating Profit
In 2019, the segment experienced an operating loss of
$13 million
, compared to an operating loss of
$14 million
in 2018. The 2019 results included
$15 million
of decreased raw material costs and
$2 million
of lower selling, general and administrative costs, as well as the absence of the
$34 million
goodwill impairment charge incurred in 2018. This favorability was offset by
$18 million
of higher manufacturing costs,
$11 million
of lower unit volume,
$8 million
of unfavorable price and mix, restructuring charges of
$9 million
and
$4 million
of increased other expenses.
Outlook for the Company
In 2020, the Company expects:
|
•
|
A modest global unit volume increase compared to 2019, including in the U.S.,
|
|
•
|
Operating profit margin that improves during the year, with the second half better than the first half, and the full year exceeding 2019,
|
|
•
|
An effective tax rate, excluding significant discrete items, of approximately 25 percent, and
|
|
•
|
Capital expenditures that will range between $260 and $280 million. This includes investments in Serbia and Mexico.
|
Management anticipates the first half of 2020 operating profit margin will be impacted by typical seasonality and certain unique items which are included in the full year outlook:
|
•
|
Approximately $10 million of restructuring charges related to the transition at the Company's Mexico manufacturing facility, which will occur primarily in the first quarter of 2020,
|
|
•
|
Higher manufacturing costs in Latin America, Europe and Asia related to both market conditions and the Company's footprint actions, and
|
|
•
|
Higher SG&A expenses, including the timing of advertising spend.
|
Expectations do not include tariff rate changes or additional tariffs that continue to be considered, but have not yet been imposed. The Company's guidance for 2020 also does not include the impact of the coronavirus.
Liquidity and Capital Resources
Sources and uses of cash in operating activities
Net cash provided by operating activities was
$291 million
in
2019
compared to
$254 million
of net cash provided by operating activities in
2018
. Net income provided
$98 million
in
2019
as compared to net income of
$81 million
in
2018
. In
2019
, non-cash items contributed
$193 million
, compared to
$249 million
contributed in
2018
, which included the benefit of the $34 million reduction in goodwill due to an impairment charge. In
2019
, changes in working capital used
$1 million
, as compared to the usage of
$75 million
in
2018
. The decreased
2019
usage was driven primarily by reduced growth in inventory, as well as improved accounts and notes receivable collections, which includes the impact of favorable changes to terms in 2019. The 2018 usage was driven primarily by the decrease in the Company's pension and postretirement benefit liabilities and increased accounts and notes receivable, partially offset by benefits provided by decreased inventory in 2018, as a result of the management of inventory levels, and favorable movement in accounts payable due to cash management initiatives.
Sources and uses of cash in investing activities
Net cash used in investing activities reflect capital expenditures of
$203 million
and
$193 million
in
2019
and
2018
, respectively. Additionally, investing activities in
2019
also include the Company's
$49 million
investment in the Vietnam joint venture.
The Company's capital expenditure commitments at
December 31, 2019
were
$27 million
and are included in the "Purchase Obligations" line of the Contractual Obligations table, which appears later in this section.
-
27
-
Sources and uses of cash in financing activities
In
2019
and
2018
, respectively, the Company repaid a net
$3 million
and a net
$20 million
of short-term debt at its Asian operations, respectively. The higher repayment activity in
2018
resulted from increased borrowing in
2017
to meet working capital requirements in Asia.
In 2019, the Company repaid long-term debt of $177 million which had become due, and borrowed $200 million of new long-term debt.
The Company paid
$2 million
and
$1 million
in fees associated with amendments to its domestic credit facilities during
2019
and
2018
, respectively.
The Company repurchased
$30 million
of its common stock in
2018
as part of the Company’s share repurchase program authorized by the Board of Directors. No share repurchases occurred in
2019
.
Dividends paid on the Company’s common shares were
$21 million
in both
2019
and
2018
, respectively.
Available cash, credit facilities and contractual commitments
At
December 31, 2019
, the Company had cash and cash equivalents of
$391
million.
Domestically, the Company's recently amended Credit Facility with a consortium of banks provides up to
$700 million
and is set to expire in
June 2024
. Of this amended borrowing capacity,
$200 million
is allocated to the Term Loan A, while the remaining
$500 million
is allocated to the Revolving Credit Facility. The Term Loan A was drawn in
December 2019
primarily to pay for the maturing unsecured notes of
$174 million
. The Company made its first quarterly payment of
$2.5 million
on the Term Loan A in
December 2019
. The Credit Facility also includes a
$110 million
letter of credit sub-facility.
The Company also has an accounts receivable securitization facility with a borrowing limit of up to
$150 million
, based on available collateral, which expires in
February 2021
.
These revolving credit facilities are undrawn, other than to secure letters of credit, at
December 31, 2019
. The Company’s additional borrowing capacity under these facilities, net of amounts used to back letters of credit and based on available collateral at
December 31, 2019
, was
$602 million
.
The Company’s operations in Asia have annual renewable unsecured credit lines that provide up to
$46 million
of borrowings and do not contain significant financial covenants. The additional borrowing capacity on the Asian credit lines totaled
$34 million
at
December 31, 2019
.
The Company believes that its cash and cash equivalent balances, along with available cash from operating cash flows and credit facilities, will be adequate to fund its typical needs, including working capital requirements, projected capital expenditures, including its portion of capital expenditures in its partially-owned subsidiaries and dividend and share repurchase goals. The Company also believes it has access to additional funds from capital markets to fund potential strategic initiatives. The entire amount of short-term notes payable outstanding at
December 31, 2019
is debt of consolidated subsidiaries. The Company expects its subsidiaries to refinance or pay these amounts within the next twelve months.
-
28
-
The Company’s cash requirements relating to contractual obligations at
December 31, 2019
are summarized in the following table:
|
(Dollar amounts in thousands)
|
Payment Due by Period
|
|||||||||||||||||||||||||||
|
Contractual Obligations
|
Total
|
2020
|
2021
|
2022
|
2023
|
2024
|
After 2024
|
|||||||||||||||||||||
|
Term loan A
|
$
|
197,500
|
|
$
|
10,000
|
|
$
|
12,500
|
|
$
|
15,000
|
|
$
|
17,500
|
|
$
|
142,500
|
|
$
|
—
|
|
|||||||
|
Unsecured notes
|
116,880
|
|
—
|
|
—
|
|
—
|
|
—
|
|
—
|
|
116,880
|
|
||||||||||||||
|
Interest on debt and bond obligations
|
90,011
|
|
15,403
|
|
14,968
|
|
14,458
|
|
13,945
|
|
11,184
|
|
20,053
|
|
||||||||||||||
|
Operating leases, including interest
|
96,830
|
|
31,397
|
|
18,020
|
|
13,691
|
|
9,693
|
|
6,236
|
|
17,793
|
|
||||||||||||||
|
Financing leases and other
|
6,263
|
|
264
|
|
5,341
|
|
279
|
|
258
|
|
121
|
|
—
|
|
||||||||||||||
|
Notes payable (a)
|
12,296
|
|
12,296
|
|
—
|
|
—
|
|
—
|
|
—
|
|
—
|
|
||||||||||||||
|
Purchase obligations (b)
|
189,778
|
|
171,279
|
|
18,499
|
|
—
|
|
—
|
|
—
|
|
—
|
|
||||||||||||||
|
Postretirement benefits other than pensions (c)
|
241,550
|
|
14,334
|
|
14,557
|
|
14,697
|
|
14,748
|
|
14,852
|
|
168,362
|
|
||||||||||||||
|
Pensions (d)
|
127,007
|
|
45,000
|
|
30,000
|
|
20,000
|
|
15,000
|
|
15,000
|
|
2,007
|
|
||||||||||||||
|
Income taxes payable (e)
|
20,434
|
|
—
|
|
—
|
|
3,528
|
|
7,514
|
|
9,392
|
|
—
|
|
||||||||||||||
|
Other obligations (f)
|
33,571
|
|
9,152
|
|
2,592
|
|
2,847
|
|
972
|
|
509
|
|
17,499
|
|
||||||||||||||
|
Total contractual cash obligations
|
$
|
1,132,120
|
|
$
|
309,125
|
|
$
|
116,477
|
|
$
|
84,500
|
|
$
|
79,630
|
|
$
|
199,794
|
|
$
|
342,594
|
|
|||||||
|
(a)
|
Financing obtained from financial institutions in the PRC to support the Company’s operations there.
|
|
(b)
|
Purchase commitments for capital expenditures, TBR tires and raw materials, principally natural rubber, made in the ordinary course of business.
|
|
(c)
|
Represents benefit payments for postretirement benefits other than pension liabilities.
|
|
(d)
|
Represents Company contributions to retirement trusts based on current assumptions.
|
|
(e)
|
Represents income taxes payable related to the deemed repatriation tax on undistributed earnings of foreign subsidiaries under the Tax Act, as based on the Company's most recently filed tax returns.
|
|
(f)
|
Includes stock-based liabilities, warranty reserve, deferred compensation, nonqualified benefit plans and other non-current liabilities.
|
Credit agency ratings
Standard & Poor’s has rated the Company’s long-term corporate credit and senior unsecured debt at BB with a stable outlook. Moody’s Investors Service has assigned a Ba3 corporate family rating and a B1 rating to senior unsecured debt with a stable outlook.
New Accounting Standards
For a discussion of recent accounting pronouncements and their impact on the Company, see the “Significant Accounting Policies - Accounting Pronouncements” note to the consolidated financial statements.
Critical Accounting Policies
“Management’s Discussion and Analysis of Financial Condition and Results of Operations” discusses the Company’s consolidated financial statements, which have been prepared in accordance with accounting principles generally accepted in the U.S. When more than one accounting principle, or the method of its application, is generally accepted, the Company selects the principle or method that is appropriate in its specific circumstances. The Company’s accounting policies are more fully described in the “Significant Accounting Policies” note to the consolidated financial statements. Application of these accounting principles requires management to make estimates and assumptions that affect the reported amounts of assets and liabilities, the disclosure of contingent assets and liabilities, and the reported amounts of revenues and expenses during the reporting period. Management bases its estimates and judgments on historical experience and on other factors that are believed to be reasonable under the circumstances, the results of which form the basis for making judgments about the carrying value of assets and liabilities that are not readily apparent from other sources. Actual results may differ from these estimates under different assumptions or conditions. The Company believes that of its significant accounting policies, the following may involve a higher degree of judgment or estimation than other accounting policies.
-
29
-
Product liability
The Company is a defendant in various product liability claims brought in numerous jurisdictions in which individuals seek damages resulting from motor vehicle accidents allegedly caused by defective tires manufactured by the Company. Each of the product liability claims faced by the Company generally involves different types of tires and circumstances surrounding the accident such as different applications, vehicles, speeds, road conditions, weather conditions, driver error, tire repair and maintenance practices, service life conditions, as well as different jurisdictions and different injuries. In addition, in many of the Company’s product liability lawsuits the plaintiff alleges that his or her harm was caused by one or more co-defendants who acted independently of the Company. Accordingly, both the claims asserted and the resolutions of those claims have an enormous amount of variability. The aggregate amount of damages asserted at any point in time is not determinable since often times when claims are filed, the plaintiffs do not specify the amount of damages. Even when there is an amount alleged, at times the amount is wildly inflated and has no rational basis.
The fact that the Company is a defendant in product liability lawsuits is not surprising given the current litigation climate, which is largely confined to the United States. However, the fact that the Company is subject to claims does not indicate that there is a quality issue with the Company’s tires. The Company sells approximately 30 to 35 million passenger car, light truck, CUV, SUV, TBR and motorcycle tires per year in North America. The Company estimates that approximately 300 million Company-produced tires made up of thousands of different specifications are still on the road in North America. While tire disablements do occur, it is the Company’s and the tire industry’s experience that the vast majority of tire failures relate to service-related conditions, which are entirely out of the Company’s control, such as failure to maintain proper tire pressure, improper maintenance, improper repairs, road hazard and excessive speed.
The Company accrues costs for product liability at the time a loss is probable and the amount of loss can be estimated. The Company believes the probability of loss can be established and the amount of loss can be estimated only after certain minimum information is available, including verification that Company-produced product were involved in the incident giving rise to the claim, the condition of the product purported to be involved in the claim, the nature of the incident giving rise to the claim and the extent of the purported injury or damages. In cases where such information is known, each product liability claim is evaluated based on its specific facts and circumstances. A judgment is then made to determine the requirement for establishment or revision of an accrual for any potential liability. Adjustments to estimated reserves are recorded in the period in which the change in estimate occurs. The liability often cannot be determined with precision until the claim is resolved.
Pursuant to ASC 450 "Contingencies," the Company accrues the minimum liability for each known claim when the estimated outcome is a range of probable loss and no one amount within that range is more likely than another. The Company uses a range of losses because an average cost would not be meaningful since the product liability claims faced by the Company are unique and widely variable, and accordingly, the resolutions of those claims have an enormous amount of variability. The costs have ranged from
zero dollars
to
$33 million
in one case with no “average” that is meaningful. No specific accrual is made for individual unasserted claims or for premature claims, asserted claims where the minimum information needed to evaluate the probability of a liability is not yet known. However, an accrual for such claims based, in part, on management’s expectations for future litigation activity and the settled claims history is maintained. The Company periodically reviews such estimates and any adjustments for changes in reserves are recorded in the period in which the change in estimate occurs. Because of the speculative nature of litigation in the U.S., the Company does not believe a meaningful aggregate range of potential loss for asserted and unasserted claims can be determined. While the Company believes its reserves are reasonably stated, it is possible an individual claim from time to time may result in an aberration from the norm and could have a material impact.
The time frame for the payment of a product liability claim is too variable to be meaningful. From the time a claim is filed to its ultimate disposition depends on the unique nature of the case, how it is resolved - claim dismissed, negotiated settlement, trial verdict or appeals process - and is highly dependent on jurisdiction, specific facts, the plaintiff’s attorney, the court’s docket and other factors. Given that some claims may be resolved in weeks and others may take five years or more, it is impossible to predict with any reasonable reliability the time frame over which the accrued amounts may be paid.
The Company regularly reviews the probable outcome of outstanding legal proceedings and the availability and limits of the insurance coverage, and accrues for such legal proceedings at the time a loss is probable and the amount of the loss can be estimated. As part of its regular review, the Company monitors trends that may affect its ultimate liability and analyzes the developments and variables likely to affect pending and anticipated claims against the Company and the reserves for such claims. The Company utilizes claims experience, as well as trends and developments in the litigation climate, in estimating its required accrual. Based on the Company’s quarterly reviews, coupled with normal activity, including the addition of another year of self-insured incidents, settlements and changes in the amount of reserves, the Company increased its accrual to
$117 million
at
December 31, 2019
from
$112 million
at
December 31, 2018
.
-
30
-
The addition of another year of self-insured incidents accounted for an increase of
$37 million
in the Company's product liability reserve in
2019
. Settlements, changes in the amount of reserves for cases where sufficient information is known to estimate a liability, and changes in assumptions decreased the liability by
$8 million
.
During
2019
, the Company paid
$24 million
and during
2018
, the Company paid
$21 million
to resolve cases and claims, respectively. The Company’s product liability reserve balance at December 31,
2019
totaled
$117 million
(the current portion of
$25 million
is included in Accrued liabilities and the long-term portion is included in Other long-term liabilities on the Consolidated Balance Sheets), and the balance at December 31,
2018
totaled
$112 million
(current portion of
$31 million
).
The product liability expense reported by the Company includes amortization of insurance premium costs, adjustments to settlement reserves and legal costs incurred in defending claims against the Company. Legal costs are expensed as incurred and product liability insurance premiums are amortized over coverage periods.
Product liability expense totaled
$40 million
in
2019
, an increase of $23 million from 2018. Product liability expenses are included in Cost of products sold in the Consolidated Statements of Income.
Income Taxes
The Company is required to make certain estimates and judgments to determine income tax expense for financial statement purposes. The more critical estimates and judgments include assessing uncertain tax positions and measuring unrecognized tax benefits, determining whether deferred tax assets will be realized and whether foreign earnings will be indefinitely reinvested. Changes to these estimates may result in an increase or decrease to tax expense in subsequent periods.
The calculation of tax liabilities involves dealing with uncertainties in the application of complex tax laws and regulations in a multitude of jurisdictions across the Company’s global operations. The Company applies the rules under ASC 740-10 "Accounting for Uncertainty in Income Taxes" for uncertain tax positions using a “more likely than not” recognition threshold. Pursuant to these rules, the Company will initially recognize the financial statement effects of a tax position when it is more likely than not, based on the technical merits of the tax position, that such a position will be sustained upon examination by the relevant tax authorities. If the tax benefit meets the “more likely than not” threshold, the measurement of the tax benefit will be based on the Company’s estimate of the ultimate amount to be sustained if audited by the taxing authority. The Company recognizes tax liabilities in accordance with ASC 740-10 and adjusts these liabilities when judgment changes as a result of the evaluation of new information not previously available. Based upon the outcome of tax examinations, judicial proceedings, or expiration of statutes of limitations, it is reasonably possible that the ultimate resolution of these unrecognized tax benefits may result in a payment that is materially different from the current estimate of the tax liabilities. These differences will be reflected as increases or decreases to income tax expense in the period in which new information is available.
The Company’s liability for unrecognized tax benefits, exclusive of interest, totaled approximately
$10 million
at
December 31, 2019
. The unrecognized tax benefits at
December 31, 2019
relate to uncertain tax positions in tax years 2012 through 2017.
The Company must assess the likelihood that it will be able to recover its deferred tax assets. Deferred income taxes arise from temporary differences between the tax and financial statement recognition of revenue and expense. In evaluating the Company’s ability to recover deferred tax assets within the jurisdiction from which they arise, all available positive and negative evidence is considered, including scheduled reversals of deferred tax liabilities, projected future taxable income, tax-planning strategies and results of recent operations. In projecting future taxable income, the Company begins with historical results adjusted for the results of discontinued operations and changes in accounting policies, and incorporates assumptions including the amount of future state, federal and foreign pretax operating income, the reversal of temporary differences and the implementation of feasible and prudent tax-planning strategies. These assumptions require significant judgment about the forecasts of future taxable income and are consistent with the plans and estimates the Company uses to manage the underlying businesses. In evaluating the objective evidence that historical results provide, the Company considers three years of cumulative operating income (loss).
The Company continues to maintain a valuation allowance against a portion of its U.S. and non-U.S. deferred tax asset position at
December 31, 2019
, as it cannot assure the utilization of these assets before they expire. The Company has recorded valuation allowances of
$27 million
relating primarily to non-U.S. deferred tax assets. In conjunction with the Company’s ongoing review of its actual results and anticipated future earnings, the Company will continue to reassess the possibility of releasing all or part of the valuation allowances currently in place when they are deemed to be realizable.
The Company generally considers the earnings of certain non-U.S. subsidiaries to be indefinitely reinvested outside the U.S. on the basis of estimates that future domestic cash generation will be sufficient to meet future domestic cash needs. Prior to
-
31
-
enactment of the Tax Act, the Company did not recognize a deferred tax liability related to the U.S. federal and state income taxes and foreign withholding taxes on unremitted foreign earnings because it overcame the presumption of the repatriation of those earnings.
Upon enactment of the Tax Act, the Transition Tax was recorded based on approximately $495 million of unremitted foreign earnings. During 2018 and 2019, the Company re-evaluated its position on potential earnings repatriation and has concluded that repatriation implications of the Tax Act had no impact on its indefinite reinvestment assertion.
Impairment of long-lived assets, including goodwill and right-of-use assets
The Company’s long-lived assets include property, plant and equipment, right-of-use assets for operating and finance leases, and other assets that are intangibles, including goodwill. If an indicator of impairment exists for certain groups of property, plant and equipment, right-of-use assets or definite-lived intangible assets, the Company will compare the forecasted undiscounted cash flows attributable to the assets to their carrying values. If the carrying values exceed the undiscounted cash flows, the Company then determines the fair values of the assets. If the carrying values of the assets exceed the fair values of the assets, an impairment charge is recognized for the difference.
The Company assesses the potential impairment of its indefinite-lived assets, including goodwill, at least annually or when events or circumstances indicate impairment may have occurred. The carrying value of these assets is compared to their fair value. If the carrying values exceed the fair values, an impairment charge equal to that excess is recorded.
The Company cannot predict the occurrence of future impairment-triggering events. Such events may include, but are not limited to, significant industry or economic trends and strategic decisions made in response to changes in the economic and competitive conditions impacting the Company’s businesses.
Pension and postretirement benefits
The Company has recorded significant pension liabilities in the U.S. and the U.K. and other postretirement benefit (“OPEB”) liabilities in the U.S. that are developed from actuarial valuations. The determination of the Company’s pension liabilities requires key assumptions regarding discount rates used to determine the present value of future benefit payments and expected returns on plan assets. The discount rate is also significant to the development of OPEB liabilities. The Company determines these assumptions in consultation with its investment advisers and actuaries.
The discount rate reflects the rate used to estimate the value of the Company’s pension and OPEB liabilities for which they could be settled at the end of the year. When determining the discount rate, the Company discounted the expected pension disbursements over the next one hundred years using spot rates from a high quality corporate bond yield curve and computed a single equivalent rate. Based upon this analysis, the Company used a discount rate of
3.09 percent
to measure its U.S. pension liabilities at
December 31, 2019
, which is lower than the
4.05 percent
used at
December 31, 2018
. Similarly, the Company discounted the expected disbursements of its OPEB liabilities and, based upon this analysis, the Company used a discount rate of
3.12 percent
to measure its OPEB liabilities at
December 31, 2019
, which is lower than the
4.05 percent
used at
December 31, 2018
. A similar analysis was completed in the U.K. and the Company decreased the discount rate used to measure its U.K. pension liabilities to
2.00 percent
at
December 31, 2019
from
2.80 percent
at
December 31, 2018
.
The effects of a hypothetical change in discount rate may be nonlinear and asymmetrical for future years as the change in discount rate and the corresponding accounting are applied. Holding all other assumptions constant, an increase or decrease of 25 basis points in the
December 31, 2019
, discount rate assumption would have the following estimated effects on the
December 31, 2019
pension and other post-retirement benefit obligations and
2020
expected pension and other post-retirement expense:
|
$ increase (decrease) in thousands
|
25 Basis Point Decrease in Discount Rate
|
25 Basis Point Increase in Discount Rate
|
||||||
|
Pension expense
|
$
|
2,673
|
|
$
|
(2,568
|
)
|
||
|
Other post-retirement benefit expense
|
115
|
|
(724
|
)
|
||||
|
Pension obligation
|
32,746
|
|
(31,160
|
)
|
||||
|
Other post-retirement benefit obligation
|
7,199
|
|
(6,845
|
)
|
||||
The assumed long-term rate of return on pension plan assets is applied to the market value of plan assets to derive a reduction to pension expense that approximates the expected average rate of asset investment return over ten or more years. A decrease in the expected long-term rate of return will increase pension expense, whereas an increase in the expected long-term rate will reduce pension expense. Decreases in the level of actual plan assets will serve to increase the amount of pension expense, whereas increases in the level of actual plan assets will serve to decrease the amount of pension expense. Any shortfall in the
-
32
-
actual return on plan assets from the expected return will increase pension expense in future years due to the amortization of the shortfall, whereas any excess in the actual return on plan assets from the expected return will reduce pension expense in future periods due to the amortization of the excess.
The Company’s investment strategy is to manage the plans' asset allocation relative to the liability profile and funded status of the plans. It is expected that as the plan’s funded status improves, the portfolio will take less risk as to preserve the funded status of the plan framework. The plans follow a glide path whereby a target return-seeking allocation is followed based upon a given funded ratio level. The plans' position with respect to the glide path is monitored and asset allocation and strategy changes to the plans' portfolio are made as appropriate. The plans' strategy is also monitored in relation to the capital markets, interest rates, and the regulatory environment. The Company’s current asset allocation for U.S. plans’ assets is
65 percent
in fixed income collective trust funds,
30 percent
in equity collective trust funds,
3 percent
in other investment based collective trust funds and
2 percent
in cash. The Company’s current asset allocation for U.K. plan assets is
68 percent
in fixed income securities,
19 percent
in equity securities,
12 percent
in other investments, and
1 percent
in cash. The Company determines the annual rate of return on pension assets by first analyzing the composition of its asset portfolio. Historical rates of return are applied to the portfolio and may be adjusted based on a review by the Company’s investment advisers and actuaries. Industry comparables and other outside guidance are also considered in the annual selection of the expected rates of return on pension assets.
The actual return on U.S. pension plans’ assets was a return of approximately
17.54 percent
in
2019
compared to an asset loss of approximately
3.50 percent
in
2018
. The actual return on U.K. pension plan assets was a return of approximately
10.93 percent
in
2019
compared to an asset loss of
2.23 percent
in
2018
. The Company’s estimate for the expected long-term return on its U.S. plan assets used to derive
2019
and
2018
pension expense was
5.66 percent
and
6.25 percent
, respectively. The expected long-term return on U.K. plan assets used to derive the
2019
and
2018
pension expense was
3.35 percent
and
3.20 percent
, respectively. Holding all other assumptions constant, an increase or decrease of 25 basis points in our December 31,
2019
expected return on assets assumption would increase or decrease the net periodic benefit cost by
$2,579
, respectively.
The Company has accumulated net deferred losses resulting from the shortfalls and excesses in actual returns on pension plan assets from expected returns and, in the measurement of pensions and OPEB liabilities, decreases and increases in the discount rate and differences between actuarial assumptions and actual experience totaling
$414 million
at
December 31, 2019
. These amounts are being amortized in accordance with the corridor amortization requirements of U.S. GAAP over periods ranging from 8 years to 10 years. Amortization of these net deferred losses was
$36 million
in
2019
and
$37 million
in
2018
.
The Company has implemented household caps on the amounts of retiree medical benefits it will provide to certain retirees in the U.S. The caps do not apply to individuals who retired prior to certain specified dates. Costs in excess of these caps will be paid by plan participants. The Company implemented increased cost sharing in 2004 in the retiree medical coverage provided to certain eligible current and future retirees. Since then, cost sharing has expanded such that nearly all covered retirees pay a charge to be enrolled.
In accordance with U.S. GAAP, the Company recognizes the funded status (i.e., the difference between the fair value of plan assets and the projected benefit obligation) of its pension and OPEB plans and the net unrecognized actuarial losses and unrecognized prior service costs in the consolidated balance sheets. The unrecognized actuarial losses and unrecognized prior service costs (components of Accumulated other comprehensive loss in the Equity section of the balance sheet) will be subsequently recognized as net periodic benefit costs pursuant to the Company’s historical accounting policy for amortizing such amounts. Further, actuarial gains and losses that arise in subsequent periods and are not recognized as net periodic benefit costs in the same periods will be recognized as a component of other comprehensive income.
|
Item 7A
.
|
QUANTITATIVE AND QUALITATIVE DISCLOSURES ABOUT MARKET RISK
|
The Company is exposed to fluctuations in interest rates and currency exchange rates from its financial instruments. The Company actively monitors its exposure to risk from changes in foreign currency exchange rates and interest rates. Derivative financial instruments are used to reduce the impact of these risks. See the “Significant Accounting Policies - Derivative financial instruments” and “Fair Value of Financial Instruments” notes to the consolidated financial statements for additional information.
The Company has estimated its market risk exposures using sensitivity analyses. These analyses measure the potential loss in future earnings, cash flows or fair values of market sensitive instruments resulting from a hypothetical
ten
percent change in interest rates or foreign currency exchange rates.
-
33
-
The Company may be exposed to interest rate risk on borrowings that bear interest at floating rates. In certain cases, the Company utilizes derivative instruments to manage some of this risk. The Company does not enter into derivative instruments for trading or speculative purposes. At December 31, 2019, Cooper had
$198
million of long term debt at a floating interest rate, which was effectively hedged. A hypothetical 10 percent change in interest rates would have an immaterial impact on interest expense for the years ended December 31, 2019 and 2018.
To manage the volatility of currency exchange exposures related to future sales and purchases in foreign currencies, the Company first nets the exposures to take advantage of natural offsets. Then, for the residual portion, the Company enters into forward exchange contracts with maturities of less than 12 months pursuant to the Company’s policies and hedging practices. The changes in fair value of these hedging instruments are offset, in part or in whole, by corresponding changes in the fair value of cash flows of the underlying exposures being hedged. The Company’s unprotected exposures to earnings and cash flow fluctuations due to changes in foreign currency exchange rates were
not
significant at
December 31, 2019
and
2018
.
The Company enters into foreign exchange contracts to manage its exposure to foreign currency denominated receivables and payables. The impact from a
ten
percent change in foreign currency exchange rates on the Company’s foreign currency denominated obligations and related foreign exchange contracts would
not
have been material to the Company’s results of operations and cash flows.
-
34
-
|
Item 8
.
|
FINANCIAL STATEMENTS AND SUPPLEMENTARY DATA
|
|
COOPER TIRE & RUBBER COMPANY
|
||||||||||||
|
CONSOLIDATED STATEMENTS OF INCOME
|
||||||||||||
|
(Dollar amounts in thousands except per share amounts)
|
||||||||||||
|
|
Year Ended December 31,
|
|||||||||||
|
|
2019
|
2018
|
2017
|
|||||||||
|
Net sales
|
$
|
|
|
$
|
|
|
$
|
|
|
|||
|
Cost of products sold
|
|
|
|
|
|
|
||||||
|
Gross profit
|
|
|
|
|
|
|
||||||
|
Selling, general and administrative expense
|
|
|
|
|
|
|
||||||
|
Restructuring expense
|
|
|
|
|
|
|
||||||
|
Goodwill impairment charge
|
|
|
|
|
|
|
||||||
|
Operating profit
|
|
|
|
|
|
|
||||||
|
Interest expense
|
(
|
)
|
(
|
)
|
(
|
)
|
||||||
|
Interest income
|
|
|
|
|
|
|
||||||
|
Other pension and postretirement benefit expense
|
(
|
)
|
(
|
)
|
(
|
)
|
||||||
|
Other non-operating expense
|
(
|
)
|
(
|
)
|
(
|
)
|
||||||
|
Income before income taxes
|
|
|
|
|
|
|
||||||
|
Income tax provision
|
|
|
|
|
|
|
||||||
|
Net income
|
|
|
|
|
|
|
||||||
|
Net income attributable to noncontrolling shareholders' interests
|
|
|
|
|
|
|
||||||
|
Net income attributable to Cooper Tire & Rubber Company
|
$
|
|
|
$
|
|
|
$
|
|
|
|||
|
Earnings per share:
|
||||||||||||
|
Basic
|
$
|
|
|
$
|
|
|
$
|
|
|
|||
|
Diluted
|
$
|
|
|
$
|
|
|
$
|
|
|
|||
|
See accompanying Notes to Consolidated Financial Statements.
|
-
35
-
|
COOPER TIRE & RUBBER COMPANY
|
||||||||||||
|
CONSOLIDATED STATEMENTS OF COMPREHENSIVE INCOME
|
||||||||||||
|
(Dollar amounts in thousands except per share amounts)
|
||||||||||||
|
|
Year Ended December 31,
|
|||||||||||
|
|
2019
|
2018
|
2017
|
|||||||||
|
Net income
|
$
|
|
|
$
|
|
|
$
|
|
|
|||
|
Other comprehensive income (loss):
|
||||||||||||
|
Cumulative currency translation adjustments
|
|
|
(
|
)
|
|
|
||||||
|
Financial instruments:
|
||||||||||||
|
Change in the fair value of derivatives
|
(
|
)
|
|
|
(
|
)
|
||||||
|
Income tax benefit (provision) on derivative instruments
|
|
|
(
|
)
|
|
|
||||||
|
Financial instruments, net of tax
|
(
|
)
|
|
|
(
|
)
|
||||||
|
Postretirement benefit plans:
|
||||||||||||
|
Amortization of actuarial loss
|
|
|
|
|
|
|
||||||
|
Amortization of prior service cost (credit)
|
|
|
(
|
)
|
(
|
)
|
||||||
|
Actuarial (loss) gain
|
(
|
)
|
|
|
|
|
||||||
|
Pension settlement charges
|
|
|
|
|
|
|
||||||
|
Prior service effect of plan amendment
|
(
|
)
|
(
|
)
|
|
|
||||||
|
Income tax provision on postretirement benefit plans
|
(
|
)
|
(
|
)
|
(
|
)
|
||||||
|
Foreign currency translation effect
|
(
|
)
|
(
|
)
|
(
|
)
|
||||||
|
Postretirement benefit plans, net of tax
|
|
|
|
|
|
|
||||||
|
Other comprehensive income
|
|
|
|
|
|
|
||||||
|
Comprehensive income
|
|
|
|
|
|
|
||||||
|
Less: Comprehensive income attributable to noncontrolling shareholders' interests
|
|
|
|
|
|
|
||||||
|
Comprehensive income attributable to Cooper Tire & Rubber Company
|
$
|
|
|
$
|
|
|
$
|
|
|
|||
See accompanying Notes to Consolidated Financial Statements.
-
36
-
|
COOPER TIRE & RUBBER COMPANY
|
||||||||
|
CONSOLIDATED BALANCE SHEETS
|
||||||||
|
(Dollar amounts in thousands except per share amounts)
|
||||||||
|
|
December 31,
|
|||||||
|
|
2019
|
2018
|
||||||
|
ASSETS
|
||||||||
|
Current assets:
|
||||||||
|
Cash and cash equivalents
|
$
|
|
|
$
|
|
|
||
|
Notes receivable
|
|
|
|
|
||||
|
Accounts receivable, less allowances of $8,109 at 2019 and $5,836 at 2018
|
|
|
|
|
||||
|
Inventories:
|
||||||||
|
Finished goods
|
|
|
|
|
||||
|
Work in process
|
|
|
|
|
||||
|
Raw materials and supplies
|
|
|
|
|
||||
|
Total inventories
|
|
|
|
|
||||
|
Other current assets
|
|
|
|
|
||||
|
Total current assets
|
|
|
|
|
||||
|
Property, plant and equipment:
|
||||||||
|
Land and land improvements
|
|
|
|
|
||||
|
Buildings
|
|
|
|
|
||||
|
Machinery and equipment
|
|
|
|
|
||||
|
Molds, cores and rings
|
|
|
|
|
||||
|
Total property, plant and equipment
|
|
|
|
|
||||
|
Less: Accumulated depreciation
|
|
|
|
|
||||
|
Property, plant and equipment, net
|
|
|
|
|
||||
|
Operating lease right-of-use assets, net of accumulated amortization of $26,121 at 2019
|
|
|
—
|
|
||||
|
Goodwill
|
|
|
|
|
||||
|
Intangibles, net of accumulated amortization of $123,735 at 2019 and $112,621 at 2018
|
|
|
|
|
||||
|
Deferred income tax assets
|
|
|
|
|
||||
|
Investment in joint venture
|
|
|
|
|
||||
|
Other assets
|
|
|
|
|
||||
|
Total assets
|
$
|
|
|
$
|
|
|
||
See accompanying Notes to Consolidated Financial Statements.
-
37
-
|
COOPER TIRE & RUBBER COMPANY
|
||||||||
|
CONSOLIDATED BALANCE SHEETS
|
||||||||
|
(Dollar amounts in thousands except per share amounts)
|
||||||||
|
December 31,
|
||||||||
|
(Continued)
|
2019
|
2018
|
||||||
|
LIABILITIES AND EQUITY
|
||||||||
|
Current liabilities:
|
||||||||
|
Notes payable
|
$
|
|
|
$
|
|
|
||
|
Accounts payable
|
|
|
|
|
||||
|
Accrued liabilities
|
|
|
|
|
||||
|
Income taxes payable
|
|
|
|
|
||||
|
Current portion of long-term debt and finance leases
|
|
|
|
|
||||
|
Total current liabilities
|
|
|
|
|
||||
|
Long-term debt and finance leases
|
|
|
|
|
||||
|
Noncurrent operating leases
|
|
|
—
|
|
||||
|
Postretirement benefits other than pensions
|
|
|
|
|
||||
|
Pension benefits
|
|
|
|
|
||||
|
Other long-term liabilities
|
|
|
|
|
||||
|
Deferred income tax liabilities
|
|
|
|
|
||||
|
Equity:
|
||||||||
|
Preferred stock, $1 par value; 5,000,000 shares authorized; none issued
|
|
|
|
|
||||
|
Common stock, $1 par value; 300,000,000 shares authorized; 87,850,292 shares issued at 2019 and 2018
|
|
|
|
|
||||
|
Capital in excess of par value
|
|
|
|
|
||||
|
Retained earnings
|
|
|
|
|
||||
|
Accumulated other comprehensive loss
|
(
|
)
|
(
|
)
|
||||
|
Parent stockholders' equity before treasury stock
|
|
|
|
|
||||
|
Less: Common shares in treasury at cost (37,647,058 at 2019 and 37,776,659 at 2018)
|
(
|
)
|
(
|
)
|
||||
|
Total parent stockholders' equity
|
|
|
|
|
||||
|
Noncontrolling shareholders' interests in consolidated subsidiaries
|
|
|
|
|
||||
|
Total equity
|
|
|
|
|
||||
|
Total liabilities and equity
|
|
|
|
|
||||
See accompanying Notes to Consolidated Financial Statements.
-
38
-
|
COOPER TIRE & RUBBER COMPANY
|
||||||||||||||||||||||||||||||||
|
CONSOLIDATED STATEMENT OF EQUITY
|
||||||||||||||||||||||||||||||||
|
(Dollar amounts in thousands except per share amounts)
|
||||||||||||||||||||||||||||||||
|
Common
Stock $1 Par
Value
|
Capital in
Excess of
Par
Value
|
Retained
Earnings
|
Cumulative
Other
Comprehensive
(Loss) Income
|
Common
Shares in
Treasury
|
Total Parent
Stockholders’
Equity
|
Noncontrolling
Shareholders’
Interests in
Consolidated
Subsidiaries
|
Total
|
|||||||||||||||||||||||||
|
Balance at
December 31, 2016 |
$
|
|
|
$
|
|
|
$
|
|
|
$
|
(
|
)
|
$
|
(
|
)
|
$
|
|
|
$
|
|
|
$
|
|
|
||||||||
|
Net income
|
—
|
|
—
|
|
|
|
—
|
|
—
|
|
|
|
|
|
|
|
||||||||||||||||
|
Other comprehensive loss
|
—
|
|
—
|
|
—
|
|
|
|
—
|
|
|
|
|
|
|
|
||||||||||||||||
|
Comprehensive income (loss)
|
—
|
|
—
|
|
|
|
|
|
—
|
|
|
|
|
|
|
|
||||||||||||||||
|
Dividends payable to noncontrolling shareholder
|
—
|
|
—
|
|
—
|
|
—
|
|
—
|
|
—
|
|
(
|
)
|
(
|
)
|
||||||||||||||||
|
Share repurchase program
|
—
|
|
—
|
|
—
|
|
—
|
|
(
|
)
|
(
|
)
|
—
|
|
(
|
)
|
||||||||||||||||
|
Stock compensation plans
|
—
|
|
(
|
)
|
(
|
)
|
—
|
|
|
|
|
|
—
|
|
|
|
||||||||||||||||
|
Cash dividends - $0.42 per share
|
—
|
|
—
|
|
(
|
)
|
—
|
|
—
|
|
(
|
)
|
—
|
|
(
|
)
|
||||||||||||||||
|
Balance at
December 31, 2017 |
|
|
|
|
|
|
(
|
)
|
(
|
)
|
|
|
|
|
|
|
||||||||||||||||
|
Net income
|
—
|
|
—
|
|
|
|
—
|
|
—
|
|
|
|
|
|
|
|
||||||||||||||||
|
Other comprehensive income
|
—
|
|
—
|
|
—
|
|
|
|
—
|
|
|
|
(
|
)
|
|
|
||||||||||||||||
|
Comprehensive income
|
—
|
|
—
|
|
|
|
|
|
—
|
|
|
|
|
|
|
|
||||||||||||||||
|
Share repurchase program
|
—
|
|
—
|
|
—
|
|
—
|
|
(
|
)
|
(
|
)
|
—
|
|
(
|
)
|
||||||||||||||||
|
Stock compensation plans
|
—
|
|
|
|
(
|
)
|
—
|
|
|
|
|
|
—
|
|
|
|
||||||||||||||||
|
Cash dividends - $0.42 per share
|
—
|
|
—
|
|
(
|
)
|
—
|
|
—
|
|
(
|
)
|
—
|
|
(
|
)
|
||||||||||||||||
|
Balance at
December 31, 2018 |
|
|
|
|
|
|
(
|
)
|
(
|
)
|
|
|
|
|
|
|
||||||||||||||||
|
Net income
|
—
|
|
—
|
|
|
|
—
|
|
—
|
|
|
|
|
|
|
|
||||||||||||||||
|
Other comprehensive income
|
—
|
|
—
|
|
—
|
|
|
|
—
|
|
|
|
|
|
|
|
||||||||||||||||
|
Comprehensive income
|
—
|
|
—
|
|
|
|
|
|
—
|
|
|
|
|
|
|
|
||||||||||||||||
|
Stock compensation plans
|
—
|
|
|
|
(
|
)
|
—
|
|
|
|
|
|
—
|
|
|
|
||||||||||||||||
|
Cash dividends - $0.42 per share
|
—
|
|
—
|
|
(
|
)
|
—
|
|
—
|
|
(
|
)
|
—
|
|
(
|
)
|
||||||||||||||||
|
Balance at
December 31, 2019 |
$
|
|
|
$
|
|
|
$
|
|
|
$
|
(
|
)
|
$
|
(
|
)
|
$
|
|
|
$
|
|
|
$
|
|
|
||||||||
See accompanying Notes to Consolidated Financial Statements.
-
39
-
|
COOPER TIRE & RUBBER COMPANY
|
||||||||||||
|
CONSOLIDATED STATEMENTS OF CASH FLOWS
|
||||||||||||
|
(Dollar amounts in thousands)
|
||||||||||||
|
|
Twelve Months Ended December 31,
|
|||||||||||
|
|
2019
|
2018
|
2017
|
|||||||||
|
Operating activities:
|
||||||||||||
|
Net income
|
$
|
|
|
$
|
|
|
$
|
|
|
|||
|
Adjustments to reconcile net income to net cash provided by operations:
|
||||||||||||
|
Depreciation and amortization
|
|
|
|
|
|
|
||||||
|
Deferred income taxes
|
|
|
|
|
|
|
||||||
|
Stock-based compensation
|
|
|
|
|
|
|
||||||
|
Change in LIFO inventory reserve
|
|
|
(
|
)
|
|
|
||||||
|
Amortization of unrecognized postretirement benefits
|
|
|
|
|
|
|
||||||
|
Goodwill impairment charge
|
|
|
|
|
|
|
||||||
|
Changes in operating assets and liabilities:
|
||||||||||||
|
Accounts and notes receivable
|
|
|
(
|
)
|
(
|
)
|
||||||
|
Inventories
|
|
|
|
|
(
|
)
|
||||||
|
Other current assets
|
|
|
(
|
)
|
(
|
)
|
||||||
|
Accounts payable
|
|
|
|
|
(
|
)
|
||||||
|
Accrued liabilities
|
(
|
)
|
|
|
(
|
)
|
||||||
|
Pension and postretirement benefits
|
(
|
)
|
(
|
)
|
(
|
)
|
||||||
|
Other items
|
|
|
(
|
)
|
(
|
)
|
||||||
|
Net cash provided by operating activities
|
|
|
|
|
|
|
||||||
|
Investing activities:
|
||||||||||||
|
Additions to property, plant and equipment and capitalized software
|
(
|
)
|
(
|
)
|
(
|
)
|
||||||
|
Investment in joint venture
|
(
|
)
|
|
|
|
|
||||||
|
Proceeds from the sale of assets
|
|
|
|
|
|
|
||||||
|
Net cash used in investing activities
|
(
|
)
|
(
|
)
|
(
|
)
|
||||||
|
Financing activities:
|
||||||||||||
|
Issuances of short-term debt
|
|
|
|
|
|
|
||||||
|
Repayment of short-term debt
|
(
|
)
|
(
|
)
|
(
|
)
|
||||||
|
Issuance of long-term debt
|
|
|
|
|
|
|
||||||
|
Repayment of long-term debt and finance lease obligations
|
(
|
)
|
(
|
)
|
(
|
)
|
||||||
|
Payment of financing fees
|
(
|
)
|
(
|
)
|
|
|
||||||
|
Repurchase of common stock
|
|
|
(
|
)
|
(
|
)
|
||||||
|
Payments of employee taxes withheld from share-based awards
|
(
|
)
|
(
|
)
|
(
|
)
|
||||||
|
Payment of dividends to noncontrolling shareholders
|
|
|
|
|
(
|
)
|
||||||
|
Payment of dividends to Cooper Tire & Rubber Company stockholders
|
(
|
)
|
(
|
)
|
(
|
)
|
||||||
|
Issuance of common shares related to stock-based compensation
|
|
|
|
|
|
|
||||||
|
Net cash used in financing activities
|
(
|
)
|
(
|
)
|
(
|
)
|
||||||
|
Effects of exchange rate changes on cash
|
|
|
|
|
|
|
||||||
|
Net change in cash, cash equivalents and restricted cash
|
|
|
(
|
)
|
(
|
)
|
||||||
|
Cash, cash equivalents and restricted cash at beginning of period
|
|
|
|
|
|
|
||||||
|
Cash, cash equivalents and restricted cash at end of period
|
$
|
|
|
$
|
|
|
$
|
|
|
|||
|
Cash and cash equivalents
|
$
|
|
|
$
|
|
|
$
|
|
|
|||
|
Restricted cash included in Other current assets
|
|
|
|
|
|
|
||||||
|
Restricted cash included in Other assets
|
|
|
|
|
|
|
||||||
|
Total cash, cash equivalents and restricted cash
|
$
|
|
|
$
|
|
|
$
|
|
|
|||
See accompanying Notes to Consolidated Financial Statements.
-
40
-
|
COOPER TIRE & RUBBER COMPANY
|
||||
|
NOTES TO CONSOLIDATED FINANCIAL STATEMENTS
|
||||
|
(Dollar amounts in thousands except per share amounts)
|
||||
|
Note 1
.
|
|
Principles of consolidation
–
The consolidated financial statements include the accounts of the Company and its majority-owned subsidiaries. Acquired businesses are included in the consolidated financial statements from the dates of acquisition. All intercompany accounts and transactions have been eliminated.
The Company consolidates into its financial statements the accounts of the Company, all wholly-owned subsidiaries, and any partially-owned subsidiary that the Company has the power to control. Control generally equates to ownership percentage, whereby investments that are more than
50
percent
owned are consolidated, investments in subsidiaries of
50
percent
or less but greater than
20
percent
are accounted for using the equity method, and investments in subsidiaries of
20
percent
or less are accounted for using the cost method. The Company does not consolidate any entity for which it has a variable interest based solely on power to direct the activities and significant participation in the entity’s expected results that would not otherwise be consolidated based on control through voting interests. Further, the Company’s joint ventures are businesses established and maintained in connection with the Company’s operating strategy.
Cash and cash equivalents
–
The Company considers highly liquid investments with an original maturity of three months or less to be cash equivalents.
The Company’s objectives related to the investment of cash not required for operations is to preserve capital, meet the Company’s liquidity needs and earn a return consistent with these guidelines and market conditions. Investments deemed eligible for the investment of the Company’s cash include: 1) U.S. Treasury securities and general obligations fully guaranteed with respect to principal and interest by the government; 2) obligations of U.S. government agencies; 3) commercial paper or other corporate notes of prime quality purchased directly from the issuer or through recognized money market dealers; 4) time deposits, certificates of deposit or bankers’ acceptances of banks rated “A-” by Standard & Poor’s or “A3” by Moody’s; 5) collateralized mortgage obligations rated “AAA” by Standard & Poor’s and “Aaa” by Moody’s; 6) tax-exempt and taxable obligations of state and local governments of prime quality; and 7) mutual funds or outside managed portfolios that invest in the above investments. The Company had cash and cash equivalents totaling
$
391,332
and
$
356,254
at
December 31, 2019
and
December 31, 2018
, respectively. The majority of the cash and cash equivalents were invested in eligible financial instruments in excess of amounts insured by the Federal Deposit Insurance Corporation and, therefore, subject to credit risk. Management believes that the probability of losses related to credit risk on investments classified as cash and cash equivalents is remote.
Notes receivable
–
The Company has received bank secured notes from certain of its customers in the PRC to settle trade accounts receivable. These notes generally have maturities of six months or less and are redeemable at the bank of issuance. The Company evaluates the credit risk of the issuing bank prior to accepting a bank secured note from a customer. Management believes that the probability of material losses related to credit risk on notes receivable is remote.
Accounts receivable
–
The Company records trade accounts receivable when revenue is recorded in accordance with its revenue recognition policy and relieves accounts receivable when payments are received from customers.
Allowance for doubtful accounts
–
The allowance for doubtful accounts is established through charges to the provision for bad debts. The Company evaluates the adequacy of the allowance for doubtful accounts throughout the year. The evaluation includes historical trends in collections and write-offs, management’s judgment of the probability of collecting specific accounts and management’s evaluation of business risk. This evaluation is inherently subjective, as it requires estimates that are susceptible to revision as more information becomes available. Accounts are determined to be uncollectible when the debt is deemed to be worthless or only recoverable in part, and are written off at that time through a charge against the allowance for doubtful accounts.
Inventories
–
Inventory costs are determined using the LIFO method for substantially all U.S. inventories. Costs of other inventories have been determined by the first-in, first-out FIFO method. Inventories include direct material, direct labor, and applicable manufacturing and engineering overhead costs. FIFO inventories are valued at cost, which is not in excess of the net realizable value. Net realizable value is the estimated selling price in the ordinary course of business, less reasonably predictable costs of completion, disposal, and transportation. LIFO inventories are valued at the lower of cost or market.
-
41
-
Long-lived assets, including goodwill and right-of-use assets
–
Property, plant and equipment are recorded at cost and depreciated using the straight-line method over the following expected useful lives:
|
Land improvements
|
10 to 20 years
|
|
|
Buildings
|
10 to 40 years
|
|
|
Machinery and equipment
|
5 to 14 years
|
|
|
Furniture and fixtures
|
5 to 10 years
|
|
|
Molds, cores and rings
|
2 to 10 years
|
|
The Company capitalizes certain internal and external costs incurred to acquire or develop internal-use software. Capitalized software costs are amortized over the estimated useful life of the software, which ranges from
one
to
ten years
.
Intangibles with definite lives include trademarks, technology and intellectual property which
were fully amortized as of December 31, 2019
. Land use rights are amortized over their remaining useful lives, which range from
36
to
43
years
.
On January 1, 2019, the Company adopted ASC 842, "Leases," which requires lessees to record right-of-use assets and related lease obligations on the balance sheet, as well as disclose key information regarding leasing arrangements.
The Company evaluates the recoverability of long-lived assets, including property, plant and equipment and right-of-use assets for operating and finance leases, based on undiscounted projected cash flows, excluding interest and taxes, when any impairment is indicated. Goodwill and indefinite-lived intangibles are assessed for potential impairment at least annually or when events or circumstances indicate impairment may have occurred.
Earnings per common share
–
Net income per share is computed on the basis of the weighted average number of common shares outstanding each year. Diluted earnings per share includes the dilutive effect of stock options and other stock units.
The following table sets forth the computation of basic and diluted earnings per share:
|
(Number of shares and dollar amounts in thousands except per share amounts)
|
|
|
|
|||||||||
|
2019
|
2018
|
2017
|
||||||||||
|
Numerator
|
||||||||||||
|
Numerator for basic and diluted earnings per share - income from continuing operations available to common stockholders
|
$
|
|
|
$
|
|
|
$
|
|
|
|||
|
Denominator
|
||||||||||||
|
Denominator for basic earnings per share - weighted average shares outstanding
|
|
|
|
|
|
|
||||||
|
Effect of dilutive securities - stock options and other stock units
|
|
|
|
|
|
|
||||||
|
Denominator for diluted earnings per share - adjusted weighted average shares outstanding
|
|
|
|
|
|
|
||||||
|
Earnings per share:
|
||||||||||||
|
Basic
|
$
|
|
|
$
|
|
|
$
|
|
|
|||
|
Diluted
|
$
|
|
|
$
|
|
|
$
|
|
|
|||
At
December 31, 2019
,
2018
and
2017
, all options to purchase shares of the Company’s common stock were included in the computation of diluted earnings per share as the options’ exercise prices were less than the average market price of the common shares.
Derivative financial instruments
–
Derivative financial instruments are utilized by the Company to reduce foreign currency exchange risks. The Company has established policies and procedures for risk assessment and the approval, reporting and monitoring of derivative financial instrument activities. The Company does not enter into financial instruments for trading or speculative purposes. The Company offsets fair value amounts recognized on the Consolidated Balance Sheets for derivative financial instruments executed with the same counter-party.
The Company uses foreign currency forward contracts as hedges of the fair value of certain non-U.S. dollar denominated net asset and liability positions. Gains and losses resulting from the impact of currency exchange rate movements on these forward contracts are recognized in the accompanying Consolidated Statements of Income in the period in which the exchange rates change and offset the foreign currency gains and losses on the underlying exposure being hedged.
Foreign currency forward contracts are also used to hedge variable cash flows associated with forecasted sales and purchases denominated in currencies that are not the functional currency of certain entities. The forward contracts have maturities of less than twelve months pursuant to the Company’s policies and hedging practices. These forward contracts meet the criteria for and
-
42
-
have been designated as cash flow hedges. Accordingly, the effective portion of the change in fair value of unrealized gains and losses on such forward contracts are recorded as a separate component of stockholders’ equity in the accompanying Consolidated Balance Sheets and reclassified into earnings as the hedged transaction affects earnings.
The Company is exposed to interest rate risk on borrowings that bear interest at floating rates. The Company utilizes derivative instruments to manage the risk associated with the floating rate debt and has effectively fixed the variable interest rate component on the notional amount of this swap . The swaps qualify for hedge accounting and, therefore, changes in the fair value of the swaps have been recorded as a separate component of stockholders’ equity in the accompanying Consolidated Balance Sheets and reclassified into earnings as the hedged transaction affects earnings.
The Company assesses hedge effectiveness quarterly. In doing so, the Company monitors the actual and forecasted foreign currency sales and purchases versus the amounts hedged to identify any hedge ineffectiveness. The Company also performs regression analysis comparing the change in value of the hedging contracts versus the underlying foreign currency sales and purchases, which confirms a high correlation and hedge effectiveness. Any hedge ineffectiveness is recorded as an adjustment in the accompanying Consolidated Statements of Income in the period in which the ineffectiveness occurs.
The Company is exposed to price risk related to forecasted purchases of certain commodities that are used as raw materials, principally natural rubber. Accordingly, it uses commodity contracts with forward pricing for a portion of its production requirements. These contracts generally qualify for the normal purchase exception under guidance for derivative instruments and hedging activities, and therefore are not subject to its provisions.
Income taxes
–
Income tax expense is based on reported earnings or losses before income taxes in accordance with the tax rules and regulations of the specific legal entities within the various specific taxing jurisdictions where the Company’s income is earned. Taxable income may differ from earnings before income taxes for financial accounting purposes. To the extent that differences are due to revenue or expense items reported in one period for tax purposes and in another period for financial accounting purposes, a provision for deferred income taxes is made using enacted tax rates in effect for the year in which the differences are expected to reverse. A valuation allowance is recognized if it is anticipated that some or all of a deferred tax asset may not be realized. Deferred income taxes generally are not recorded on the majority of undistributed earnings of international subsidiaries based on the Company’s intention that these earnings will continue to be reinvested.
Upon enactment of the Tax Act, the Transition Tax was recorded based on approximately $495 million of unremitted foreign earnings. During 2018 and 2019, the Company re-evaluated its position on potential earnings repatriation and has concluded that repatriation implications of the Tax Act had no impact on its indefinite reinvestment assertion.
As such, no change has been made with respect to that assertion for the year ended
December 31, 2019
.
Product liability
–
The Company accrues costs for product liability at the time a loss is probable and the amount of loss can be estimated. The Company believes the probability of loss can be established and the amount of loss can be estimated only after certain minimum information is available, including verification that Company-produced product were involved in the incident giving rise to the claim, the condition of the product purported to be involved in the claim, the nature of the incident giving rise to the claim and the extent of the purported injury or damages. In cases where such information is known, each product liability claim is evaluated based on its specific facts and circumstances. A judgment is then made to determine the requirement for establishment or revision of an accrual for any potential liability. Adjustments to estimated reserves are recorded in the period in which the change in estimate occurs. The liability often cannot be determined with precision until the claim is resolved.
Pursuant to ASC 450 "Contingencies," the Company accrues the minimum liability for each known claim when the estimated outcome is a range of probable loss and no one amount within that range is more likely than another. The Company uses a range of losses because an average cost would not be meaningful since the product liability claims faced by the Company are unique and widely variable, and accordingly, the resolutions of those claims have an enormous amount of variability. The costs have ranged from
zero
dollars to
$
33
million
in one case with no “average” that is meaningful. No specific accrual is made for individual unasserted claims or for premature claims, asserted claims where the minimum information needed to evaluate the probability of a liability is not yet known. However, an accrual for such claims based, in part, on management’s expectations for future litigation activity and the settled claims history is maintained. The Company periodically reviews such estimates and any adjustments for changes in reserves are recorded in the period in which the change in estimate occurs. Because of the speculative nature of litigation in the U.S., the Company does not believe a meaningful aggregate range of potential loss for asserted and unasserted claims can be determined. While the Company believes its reserves are reasonably stated, it is possible an individual claim from time to time may result in an aberration from the norm and could have a material impact.
Advertising expense
–
Expenses incurred for advertising include production and media and are generally expensed when incurred. Costs associated with dealer-earned cooperative advertising are recorded as a reduction of the revenue component of Net sales at the time of sale.
Advertising expense for
2019
,
2018
and
2017
was
$
58,453
,
$
54,177
and
$
52,798
, respectively.
-
43
-
Stock-based compensation
–
The Company’s incentive compensation plans allow the Company to grant awards to employees in the form of stock options, stock awards, restricted stock units, stock appreciation rights, performance stock units, dividend equivalents and other awards. Compensation related to these awards is determined based on the fair value on the date of grant and is amortized to expense over the vesting period. If awards can be settled in cash, these awards are recorded as liabilities and marked to market.
See
Note 14
– Stock-Based Compensation for additional information.
|
2019
|
2018
|
2017
|
|||||||
|
Reserve at beginning of year
|
|
|
|
|
|
|
|||
|
Additions
|
|
|
|
|
|
|
|||
|
Payments
|
(
|
)
|
(
|
)
|
(
|
)
|
|||
|
Reserve at December 31
|
|
|
|
|
|
|
|||
Use of estimates
–
The preparation of consolidated financial statements in conformity with U.S. generally accepted accounting principles requires management to make estimates and assumptions that affect reported amounts of: (1) revenues and expenses during the reporting period; and (2) assets and liabilities, as well as disclosure of contingent assets and liabilities, at the date of the consolidated financial statements. Actual results could differ from those estimates.
Revenue recognition
–
In accordance with ASC 606 and ASU 2014-09, effective January 1, 2018, revenues are recognized when control of the promised goods or services is transferred to customers at an amount that reflects the consideration to which the entity expects to be entitled to in exchange for those goods and services. Shipping and handling costs are recorded in cost of products sold. Allowance programs such as volume rebates and cash discounts are recorded at the time of sale as a reduction to revenue based on anticipated accrual rates for the year.
Research and development
–
Costs are charged to Cost of products sold as incurred and amounted to approximately
$
69,928
,
$
64,007
and
$
59,869
during
2019
,
2018
and
2017
, respectively.
Related Party Transactions
–
The Company’s COOCSA joint venture paid
$
26,589
,
$
28,023
and
$
40,279
in
2019
,
2018
and
2017
, respectively, to an employment services company in Mexico owned by members of the joint venture workforce. COOCSA also recorded sales of
$
4,373
,
$
4,713
and
$
8,209
to the noncontrolling shareholder in
2019
,
2018
and
2017
, respectively.
The Company purchased
$
10,920
and
$
775
of TBR tires from Sailun Vietnam in 2019 and 2018, respectively, through an off-take agreement between the two parties.
Pensions and Postretirement Benefits Other than Pensions -
The Company provides certain pension and postretirement benefits other than pensions to employees and retired employees, including pensions, postretirement health care benefits, other postretirement benefits, and supplemental pensions. In general, the Company's policy is to fund its pension benefit obligation based on legal requirements, tax and liquidity considerations and local practices. The Company does not fund its postretirement benefit obligation.
Tariffs -
The Company is subject to tariffs on the import of tires, raw materials and tire-manufacturing equipment in certain of the jurisdictions in which it operates. Tariff costs are included within inventory as they pertain to tires and raw materials, while tariffs on tire-manufacturing equipment are included as part of the cost of fixed assets. Material components of the Company's tariff costs include:
|
•
|
Passenger Car and Light Truck Tire Tariffs -
Antidumping and countervailing duty investigations into certain passenger car and light truck tires imported from the PRC into the United States were initiated on July 14, 2014. The determinations announced in both investigations were affirmative and resulted in the imposition of significant additional duties from each. The rates are subject to review annually and a material change in the new rates could have a significant impact on the Company's results.
|
-
44
-
|
•
|
Truck and Bus Tire Tariffs
– Antidumping and countervailing duty investigations into certain TBR tires imported from the PRC into the U.S. were initiated on January 29, 2016. On February 22, 2017, the ITC made a final determination that the U.S. market had not suffered material injury because of imports of TBR tires from the PRC. However, on November 1, 2018, the CIT remanded the case back to the ITC for reconsideration. On January 30, 2019, the ITC reversed its earlier decision and made an affirmative determination of material injury. On February 15, 2019, the determination was published in the Federal Register and countervailing duties of
|
|
•
|
Section 301 Tariffs -
Pursuant to Section 301: China’s Acts, Policies, and Practices Related to Technology Transfer, Intellectual Property, and Innovation, passenger, light truck and truck and bus tires, raw materials and tire-manufacturing equipment from the PRC imported into the U.S. became subject to additional
|
|
•
|
Duty Drawbacks -
The enactment of the Modernized Drawback Final Rule under the TFTEA in December 2018 expanded the Company's ability to recover Section 301 and Ad Valorem duties paid on goods imported into the US when such goods, or similar items, are subsequently exported. Under the rule, recovery of duties is allowable for up to five years subsequent to the incurrence of the duty. In 2019, the Company recovered
$
|
North American Distribution Center
– On January 22, 2017, a tornado hit the Company’s leased Albany, Georgia distribution center, causing damage to the Company's assets and disrupting certain operations. Insurance, less applicable deductibles, covered the repair or replacement of the Company's assets that suffered loss or damage, and the Company worked closely with its insurance carriers and claims adjusters to ascertain the full amount of insurance proceeds due to the Company as a result of the damages and the loss the Company suffered. The Company's insurance policies also provided coverage for interruption to its business, including lost profits, and reimbursement for other expenses and costs that were incurred relating to the damages and losses suffered. For the year ended December 31, 2017, the Company incurred direct expenses of
$
12,583
, less proceeds of
$
7,000
recovered from insurance. For the year ended December 31, 2018, the Company recorded insurance recoveries of
$
7,300
, less direct costs of
$
1,569
. These amounts were recorded as a component of Cost of products sold in the
Consolidated Statements of Income
for the respective periods. The Company's insurance claim related to the tornado was closed in the year ended December 31, 2018, with no subsequent direct expenses or insurance recoveries.
Recent Accounting Pronouncements
Each change to U.S. GAAP is established by the Financial Accounting Standards Board (“FASB”) in the form of an accounting standards update (“ASU”) to the FASB’s Accounting Standards Codification (“ASC”).
The Company considers the applicability and impact of all ASUs. ASUs not listed below were assessed and determined to be either not applicable or are expected to have minimal impact on the Company’s consolidated financial statements.
Accounting Pronouncements – Recently adopted
SEC Disclosure Regulation Simplifications
During the fourth quarter of 2018, the U.S. Securities and Exchange Commission (“SEC”) published Final Rule Release No. 33-10532, "Disclosure Update and Simplification." This standard, effective for quarterly and annual reports submitted after November 5, 2018, streamlines disclosure requirements by removing certain redundant topics. For the Company, the most notable simplification implemented in 2019 was the expansion of the shareholders' equity reconciliation to display quarter-to-quarter details beginning in the first quarter of 2019. The changes to the SEC rules impacted the presentation of the Company's filings, but did not materially impact the Company's consolidated financial statements.
Leases
In February 2016, the FASB issued ASU 2016-02, “Leases,” which requires balance sheet recognition of lease liabilities and right-of-use assets for most leases having terms of twelve months or longer. The Company adopted the standard on the required effective date of January 1, 2019 using the transition option, “Comparatives Under 840 Option,” established by ASU 2018-11,
-
45
-
Leases (Topic 842), Targeted Improvements (ASU 2018-11). The FASB issued multiple amendments to the standard which provided clarification, additional guidance, practical expedients and other improvements to ASU 2016-02. The new guidance requires recognition of lease assets and liabilities for operating leases with terms of more than 12 months, in addition to those currently recorded, on the Company's
Consolidated Balance Sheets
. See
Note 11
for additional details.
Derivatives and Hedging
In August 2017, the FASB issued ASU 2017-12, “Targeted Improvements to Accounting for Hedging Activities,” which expands and refines hedge accounting for both financial and non-financial risk components, aligns the recognition and presentation of the effects of hedging instruments and hedge items in the financial statements, and includes certain targeted improvements to ease the application of current guidance related to the assessment of hedge effectiveness. The Company adopted this standard effective January 1, 2019. The adoption of this standard did not materially impact the Company's consolidated financial statements.
Additionally, in October 2018, the FASB issued ASU 2018-16, "Derivatives and Hedging (Topic 815)." The Federal Reserve and Alternative Reference Rates Committee expressed the importance of including the Overnight Index Swap ("OIS") rate based on the Secured Overnight Financing Rate ("SOFR") as a benchmark rate for hedge accounting purposes in facilitating broader use of the underlying SOFR rate in the marketplace to facilitate the market's move away from the London Interbank Offered Rate ("LIBOR"). This update, effective on January 1, 2019, provides the option to use the OIS rate based on SOFR as a benchmark for hedge accounting. The Company does not currently hold any SOFR-based instruments, but will continue to evaluate its use as the markets transition away from LIBOR.
Related Parties
In October 2018, the FASB issued ASU 2018-17 "Consolidation (Topic 810): Targeted Improvements to Related Party Guidance for VIEs." When determining if fees paid to decision makers and service providers are variable interests, entities must now also consider indirect interests of those decision makers and service providers held through related parties under common control. This standard is effective January 1, 2020, with early adoption permitted. The Company has incorporated this consideration into the related party procedures conducted as part of this annual report. No indirect interests of decision makers or service providers held through related parties under common control were identified. The adoption of this standard did not materially impact the Company's consolidated financial statements.
Accounting Pronouncements – To be adopted
Credit Losses
In June 2016, the FASB issued ASU 2016-13, "Measurement of Credit Losses on Financial Instruments," which changes accounting requirements for the recognition of credit losses from an incurred or probable impairment methodology to a current expected credit losses (CECL) methodology.
The FASB issued subsequent amendments to the initial guidance in November 2018, April 2019 and May 2019 with ASU 2018-19, ASU 2019-04 and ASU 2019-05,
respectively.
Trade receivables (including the allowance for doubtful accounts) is the only financial instrument in scope for ASU 2016-13 currently held by the Company. Implementation is anticipated to include an update to the Company's allowance for doubtful accounts methodology from one based on accounts receivable aging to one based on sales stratified by customer credit score. Disclosures will be updated accordingly. The Company expects minimal, if any, impact on the consolidated financial statements as implementation analyses show materially equivalent results between the two methods. This standard is effective for interim and annual reporting periods beginning after December 15, 2019 with a modified retrospective approach. The Company plans to adopt the standard effective January 1, 2020.
Fair Value Measurement
In August 2018, the FASB issued ASU 2018-13, "Fair Value Measurement (Topic 820)," which removes, modifies and adds various disclosure requirements around the topic in order to clarify and improve the cost-benefit nature of disclosures. For example, disclosures around transfers between fair value hierarchy levels will be removed and further detail around changes in unrealized gains and losses for the period and unobservable inputs determining level 3 fair value measurements will be added. This standard is effective for interim and annual reporting periods beginning after December 15, 2019, and early adoption is permitted. The Company is currently evaluating the impact the new standard will have on its consolidated financial statements and plans to adopt the standard effective January 1, 2020.
-
46
-
Defined Benefit Plans
In August 2018, the FASB issued ASU 2018-14, "Compensation – Retirement Benefits – Defined Benefit Plans – General (Subtopic 715-20)," which removes, modifies and adds various disclosure requirements around the topic in order to clarify and improve the cost-benefit nature of disclosures. For example, disclosures around the effect of a one-percentage-point change in assumed health care costs will be removed and an explanation of the reasons for significant gains and losses related to changes in the benefit obligation for the period will be added. This standard is effective for fiscal years ending after December 15, 2020, and early adoption is permitted. These amendments must be applied on a retrospective basis for all periods presented. The Company is currently evaluating the impact the new standard will have on its consolidated financial statements.
Internal-Use Software
In August 2018, the FASB issued ASU 2018-15, "Intangibles - Goodwill and Other - Internal-Use Software (Subtopic 350-40)," which aligns the requirements for capitalizing implementation costs incurred in a service contract hosting arrangement with those of developing or obtaining internal-use software. This standard is effective for interim and annual reporting periods beginning after December 15, 2019, and early adoption is permitted. The Company is currently evaluating the impact the new standard will have on its consolidated financial statements and plans to adopt the standard effective January 1, 2020.
|
Note 2
.
|
Restructuring
|
On January 17, 2019, Cooper Tire Europe, a wholly owned subsidiary of the Company, committed to a plan to cease light vehicle tire production at its Melksham, U.K. facility, which is included in the International Segment. The phasing out of light vehicle tire production was substantially completed in the third quarter of 2019. Approximately
300
roles were eliminated at the site. Cooper Tire Europe now obtains light vehicle tires to meet customer needs from other production sites within the Company’s global production network. Approximately
400
roles remain in Melksham to support the functions that continue there, including motorsports and motorcycle tire production, a materials business, Cooper Tire Europe headquarters, sales and marketing, and the Europe Technical Center. Costs related to the decision to cease light vehicle tire production at the Melksham, U.K. facility were
$
8,315
in 2019. In connection with this business realignment, a one-time payment from the U.S. to Serbia was made during the fourth quarter of 2019 in order to allow the Serbian operations to improve their financial standing and serve as a reliable and fully operational contract manufacturer for the U.S.
In the fourth quarter of 2019, the Company's Asian operations, included in the International Segment, completed a headcount optimization review. As a result of this optimization, the Company incurred
$
1,262
of restructuring expense during 2019.
For the year ended
December 31, 2019
, the Company recorded restructuring expense of
$
8,818
, made up of employee severance, asset write-downs and other costs. At
December 31, 2019
, the Company's accrued restructuring balance is
1,398
, composed primarily of severance costs related to the Asian operations.
|
Twelve Months Ended December 31, 2019
|
||||
|
Melksham employee severance costs
|
$
|
|
|
|
|
Asset write-downs & other costs
|
|
|
||
|
Asian operations employee severance costs
|
|
|
||
|
Total restructuring expense
|
$
|
|
|
|
|
Beginning balance of accrued restructuring
|
$
|
|
|
|
|
Accrued severance costs
|
|
|
||
|
Payment of severance costs
|
(
|
)
|
||
|
Accrued professional fees
|
|
|
||
|
Payment of professional fees
|
(
|
)
|
||
|
Ending balance of total accrued restructuring
|
$
|
|
|
|
-
47
-
|
Note 3
.
|
Revenue from Contracts with Customers
|
Accounting policy
On January 1, 2018, the Company adopted the new U.S. GAAP revenue standard using the modified retrospective transition method applied to contracts which were not completed as of January 1, 2018. Results from reporting periods beginning after January 1, 2018 are presented under the new revenue standard, while prior period amounts are not adjusted and continue to be reported under previous revenue recognition guidance. The new revenue standard requires revenue to be recognized when control of the promised goods or services is transferred to customers at an amount that reflects the consideration to which the entity expects to be entitled to in exchange for those goods and services.
In accordance with the new revenue standard, revenue is measured based on the consideration specified in a contract with a customer and excludes any sales incentives or rebates. The Company recognizes revenue when it satisfies a performance obligation by transferring control over a product to a customer. This occurs with shipment or delivery, depending on the underlying terms with the customer. The transaction price will include estimates of variable consideration to the extent it is probable that a significant reversal of revenue recognized will not occur. At the time of sale, the Company estimates provisions for different forms of variable consideration (discounts and rebates) based on historical experience, current conditions and contractual obligations, as applicable. Payment terms with customers vary by region and customer, but are generally 30-90 days. The Company does not have significant financing components or significant payment terms. Incidental items that are immaterial in the context of the contract are expensed as incurred.
Taxes assessed by a governmental authority that are both imposed on and concurrent with a specific revenue-producing transaction, that are collected by the Company from a customer, are excluded from revenue.
Shipping and handling costs associated with outbound freight after control of a product has transferred to a customer are accounted for as a fulfillment cost and not as a separate performance obligation. Therefore, such items are accrued upon recognition of revenue.
Nature of goods and services
The following is a description of principal activities, separated by reportable segments, from which the Company generates its revenue. See
Note 18
- Business Segments for additional details on the Company's reportable segments.
The Company’s reportable segments have the following revenue characteristics:
|
•
|
Americas Tire Operations - The Americas Tire Operations segment manufactures and markets passenger car and light truck tires. The segment also markets and distributes racing, motorcycle and TBR tires.
|
|
•
|
International Tire Operations - The International Tire Operations segment manufactures and markets passenger car, light truck, motorcycle, racing and TBR tires and tire retread material for global markets.
|
Disaggregation of revenue
In the following tables, revenue is disaggregated by major market channel for the
twelve months
ended
December 31, 2019
and
2018
, respectively:
|
Twelve Months Ended December 31, 2019
|
|||||||||||||||
|
Americas
|
International
|
Eliminations
|
Total
|
||||||||||||
|
Light Vehicle
(1)
|
$
|
|
|
$
|
|
|
$
|
(
|
)
|
$
|
|
|
|||
|
Truck and bus radial
|
|
|
|
|
(
|
)
|
|
|
|||||||
|
Other
(2)
|
|
|
|
|
|
|
|
|
|||||||
|
Net sales
|
$
|
|
|
$
|
|
|
$
|
(
|
)
|
$
|
|
|
|||
|
Twelve Months Ended December 31, 2018
|
|||||||||||||||
|
Americas
|
International
|
Eliminations
|
Total
|
||||||||||||
|
Light Vehicle
(1)
|
$
|
|
|
$
|
|
|
$
|
(
|
)
|
$
|
|
|
|||
|
Truck and bus radial
|
$
|
|
|
$
|
|
|
$
|
(
|
)
|
|
|
||||
|
Other
(2)
|
$
|
|
|
$
|
|
|
$
|
|
|
|
|
||||
|
Net sales
|
$
|
|
|
$
|
|
|
$
|
(
|
)
|
$
|
|
|
|||
|
(1)
|
Light vehicle includes passenger car and light truck tires
|
|
(2)
|
Other includes motorcycle and racing tires, wheels, tire retread material, and other items
|
-
48
-
Contract balances
Contract liabilities relate to customer payments received in advance of shipment. As the Company does not generally have rights to consideration for work completed but not billed at the reporting date, the Company does not have any contract assets. Accounts receivable are not considered contract assets under the new revenue standard as contract assets are conditioned upon the Company's future satisfaction of a performance obligation. Accounts receivable, in contrast, are unconditional rights to consideration.
Significant changes in the contract liabilities balance during the
twelve
months ended
December 31, 2019
are as follows:
|
Contract Liabilities
|
|||
|
Contract liabilities at beginning of year
|
$
|
|
|
|
Increases to deferred revenue for cash received in advance from customers
|
|
|
|
|
Decreases due to recognition of deferred revenue
|
(
|
)
|
|
|
Contract liabilities at December 31, 2019
|
$
|
|
|
Transaction price allocated to remaining performance obligations
For the
twelve months
ended
December 31, 2019
and
2018
, respectively, revenue recognized from performance obligations related to prior periods was
not material
.
Revenue expected to be recognized in any future year related to remaining performance obligations, excluding revenue pertaining to contracts that have an original expected duration of one year or less, contracts where revenue is recognized as invoiced and contracts with variable consideration related to undelivered performance obligations, is
not material
.
The Company applies the practical expedient in ASC 606 "Revenue from Contracts with Customers" and does not disclose information about remaining performance obligations that have original expected durations of one year or less.
Changes in accounting policies
The Company adopted ASC 606 with a date of initial application of January 1, 2018. As a result, the guidance has been applied to all contracts at the date of initial application. There were no significant changes to the Company's accounting for revenue following the adoption of the new revenue standard.
Impacts on financial statements
|
Note 4
.
|
Inventories
|
Inventory costs are determined using the LIFO method for substantially all U.S. inventories. The current cost of the U.S. inventories under the FIFO method was
$
365,585
and
$
380,990
at
December 31, 2019
and
December 31, 2018
, respectively. These FIFO values have been reduced by approximately
$
87,616
and
$
85,068
at
December 31, 2019
and
December 31, 2018
, respectively, to arrive at the LIFO value reported on the
Consolidated Balance Sheets
. The remaining inventories have been valued under the FIFO method. All LIFO inventories are valued at the lower of cost or market. All other inventories are stated at the lower of cost or net realizable value.
Note 5
.
Goodwill and Intangibles
Goodwill is recorded in the segment where it was generated by acquisitions. In 2011, the Company recorded
$
18,851
of goodwill related to the acquisition of additional ownership of COOCSA in the Americas Tire Operations segment and, in 2016, the Company recorded goodwill in the amount of
$
33,250
related to the acquisition of GRT in the International Tire Operations segment. Goodwill prior to 2011 was
zero
.
Purchased goodwill and indefinite-lived intangible assets are tested annually for impairment, unless indicators are present that would require an earlier test. On December 12, 2018, Cooper Vietnam and Sailun Vietnam entered into an equity joint venture contract to establish a joint venture in Vietnam which will produce and sell TBR tires. The new joint venture is expected to
-
49
-
begin commercially producing tires in 2020. The capacity created by this planned facility will decrease expected production requirements for Cooper's GRT joint venture. The Company included the expected impact of the new Vietnam joint venture on projected future cash flows in performing its annual goodwill impairment assessment on GRT in 2018. Based on the assessment performed, the goodwill balance was deemed to be fully impaired and resulted in a non-cash fourth quarter 2018 impairment charge of
$
33,827
recorded in the Consolidated Statement of Income. The
fair value of GRT utilized in the goodwill impairment assessment was determined based upon internal and external inputs considering various market transactions and discounted cash flow valuation methods, among other factors. This valuation approach represented a Level 3 fair value measurement measured on a non-recurring basis in the fair value hierarchy due to the Company's use of Company-specific inputs and unobservable measurement inputs.
During the fourth quarter of
2019
, the Company completed its annual goodwill and intangible asset impairment tests and
no
impairment was indicated for the goodwill related to the 2011 acquisition of additional ownership of COOCSA or the Company's other indefinite-lived intangible assets.
The following table presents intangible assets and accumulated amortization balances as of
December 31, 2019
and
2018
:
|
|
December 31, 2019
|
December 31, 2018
|
|||||||||||||||||||||||
|
Gross
Carrying
Amount
|
Accumulated
Amortization
|
Net
Carrying
Amount
|
Gross
Carrying
Amount
|
Accumulated
Amortization
|
Net
Carrying
Amount
|
||||||||||||||||||||
|
Definite-lived:
|
|||||||||||||||||||||||||
|
Capitalized software costs
|
|
|
(
|
)
|
|
|
|
|
(
|
)
|
|
|
|||||||||||||
|
Land use rights
|
|
|
(
|
)
|
|
|
|
|
(
|
)
|
|
|
|||||||||||||
|
Trademarks and tradenames
|
|
|
(
|
)
|
|
|
|
|
(
|
)
|
|
|
|||||||||||||
|
Other
|
|
|
(
|
)
|
|
|
|
|
(
|
)
|
|
|
|||||||||||||
|
|
|
(
|
)
|
|
|
|
|
(
|
)
|
|
|
||||||||||||||
|
Indefinite-lived:
|
|||||||||||||||||||||||||
|
Trademarks
|
|
|
—
|
|
|
|
|
|
—
|
|
|
|
|||||||||||||
|
$
|
|
|
$
|
(
|
)
|
$
|
|
|
$
|
|
|
$
|
(
|
)
|
$
|
|
|
||||||||
Estimated amortization expense over the next five years is as follows:
2020
-
$
19,274
,
2021
-
$
18,723
,
2022
-
$
16,935
,
2023
-
$
15,866
and
2024
-
$
14,378
.
Note 6
. Accrued Liabilities
Accrued liabilities at December 31 were as follows:
|
2019
|
2018
|
|||||||
|
Volume and customer rebate programs
|
$
|
|
|
$
|
|
|
||
|
Payroll and employee benefits, excluding postemployment benefits
|
|
|
|
|
||||
|
Operating lease liability, current
|
|
|
—
|
|
||||
|
Product liability
|
|
|
|
|
||||
|
Other postretirement benefits
|
|
|
|
|
||||
|
Advertising
|
|
|
|
|
||||
|
Taxes other than income taxes
|
|
|
|
|
||||
|
Warranty
|
|
|
|
|
||||
|
Other
|
|
|
|
|
||||
|
Accrued liabilities
|
$
|
|
|
$
|
|
|
||
-
50
-
|
Note 7
.
|
Income Taxes
|
Components of income (loss) from continuing operations before income taxes and noncontrolling shareholders’ interests were as follows:
|
2019
|
2018
|
2017
|
||||||||||
|
United States
|
$
|
(
|
)
|
$
|
|
|
$
|
|
|
|||
|
Foreign
|
|
|
|
|
|
|
||||||
|
Total
|
$
|
|
|
$
|
|
|
$
|
|
|
|||
The provision (benefit) for income tax for continuing operations consisted of the following:
|
2019
|
2018
|
2017
|
||||||||||
|
Current:
|
||||||||||||
|
Federal
|
$
|
|
|
$
|
|
|
$
|
|
|
|||
|
State and local
|
|
|
|
|
|
|
||||||
|
Foreign
|
|
|
|
|
|
|
||||||
|
|
|
|
|
|
|
|||||||
|
Deferred:
|
||||||||||||
|
Federal
|
|
|
|
|
|
|
||||||
|
State and local
|
(
|
)
|
|
|
|
|
||||||
|
Foreign
|
(
|
)
|
(
|
)
|
|
|
||||||
|
(
|
)
|
|
|
|
|
|||||||
|
$
|
|
|
$
|
|
|
$
|
|
|
||||
On December 22, 2017, the U.S. enacted comprehensive tax legislation ("Tax Act"), which made broad and complex changes to the tax code.
In conjunction with guidance set forth under SAB 118 pertaining to the Tax Act, the Company recorded provisional amounts both for the impact of remeasurement on its U.S. deferred tax assets to the new U.S. statutory rate of 21 percent and for the mandatory Transition Tax on unrepatriated foreign earnings. During the year ended December 31, 2018, the Company concluded its accounting under the Tax Act and updated its SAB 118 provisional estimates with respect to remeasurement of U.S. deferred tax assets and the Transition Tax on unrepatriated foreign earnings and recorded a tax benefit of
$
3,576
and tax expense of
$
5,026
, respectively. During the year ended December 31, 2019, final Transition Tax regulations were issued resulting in the Company recording an additional Transition Tax liability of
$
1,661
. The Company's outstanding Transition Tax payable as a result of the enactment of the Tax Act, subsequent SAB 118 revisions, and adjustments related to the final regulations was
$
20,434
and
$
18,773
at December 31, 2019 and 2018, respectively.
The Tax Act also subjects a U.S. parent shareholder to current tax on its global intangible low-taxed income ("GILTI"). At December 31, 2017, a provisional estimate under SAB 118 could not be made and the Company had not yet elected an accounting policy to either recognize deferred taxes for basis differences expected to reverse as GILTI or to record GILTI as a period cost when incurred. For the year ended December 31, 2018, the Company determined that its accounting policy is to record GILTI as a period cost only in the period it is incurred. For the years ended December 31, 2019 and 2018, the Company recognized additional tax expense associated with GILTI, exclusive of GILTI foreign tax credits, which is reflected in the rate reconciliation below.
Prior to enactment of the Tax Act, the Company did not recognize a deferred tax liability related to the U.S. federal and state income taxes and foreign withholding taxes on unremitted foreign earnings because it overcame the presumption of the repatriation of those earnings.
Upon enactment of the Tax Act, the Transition Tax was recorded based on approximately $495 million of unremitted foreign earnings. During 2018 and 2019, the Company re-evaluated its position on potential earnings repatriation and has concluded that repatriation implications of the Tax Act had no impact on its indefinite reinvestment assertion.
As such, no change has been made with respect to the Company's indefinite reinvestment assertion for the year ended December 31, 2019 and foreign income, foreign withholding, and state income tax liabilities have not been recorded on approximately
$
727
million
of undistributed foreign earnings. Determination of the amount of any deferred income or withholding tax liability on these earnings is not practicable because of the complexities of the hypothetical calculation.
During the year ended December 31, 2019, the Company's rate was primarily driven by a change in the mix of earnings between the U.S. and non-U.S. jurisdictions compared to 2018 and 2017. The change in the mix of earnings resulted from a business realignment strategy executed during 2019, as further described in Note 2, to improve the Company's market share for its European light vehicle tire business. The resulting tax effects are reflected as the difference in effective tax rates of international operations in the rate reconciliation below.
-
51
-
The Company's Serbian operations are benefiting from a ten-year tax holiday that is based largely on historical investments in property, plant, and equipment which has the impact of reducing the effective tax rate in Serbia to approximately
1.5
%
. The Company utilized remaining loss carryforwards during 2019 and recognized a tax holiday benefit of
$
15,030
inclusive of the impact of the business realignment strategy. The tax holiday will expire in 2026.
A reconciliation of income tax expense (benefit) for continuing operations to the tax based on the U.S. statutory rate is as follows:
|
2019
|
2018
|
2017
|
||||||||||
|
Income tax provision at 35 percent
|
$
|
—
|
|
$
|
—
|
|
$
|
|
|
|||
|
Income tax provision at 21 percent
|
|
|
|
|
—
|
|
||||||
|
Difference in effective tax rates of international operations
|
(
|
)
|
(
|
)
|
(
|
)
|
||||||
|
State and local income tax, net of federal income tax effect
|
(
|
)
|
|
|
|
|
||||||
|
Net U.S. GILTI inclusion
|
|
|
|
|
|
|
||||||
|
Valuation allowance
|
|
|
(
|
)
|
|
|
||||||
|
Income tax contingencies, net of federal income tax effect
|
|
|
|
|
(
|
)
|
||||||
|
Domestic manufacturing deduction
|
|
|
|
|
(
|
)
|
||||||
|
U.S. tax credits
|
(
|
)
|
(
|
)
|
(
|
)
|
||||||
|
Goodwill impairment
|
|
|
|
|
|
|
||||||
|
Mexico inflationary deferred tax adjustments
|
(
|
)
|
|
|
(
|
)
|
||||||
|
U.S. tax reform - transition tax
|
|
|
|
|
|
|
||||||
|
U.S. tax reform - remeasurement of deferred taxes
|
|
|
(
|
)
|
|
|
||||||
|
Other - net
|
(
|
)
|
|
|
(
|
)
|
||||||
|
Provision for income taxes
|
$
|
|
|
$
|
|
|
$
|
|
|
|||
Payments for income taxes in
2019
,
2018
and
2017
, net of refunds, were
$
10,244
,
$
19,763
and
$
67,782
, respectively.
Deferred tax assets and liabilities result from differences in the basis of assets and liabilities for tax and financial reporting purposes.
Significant components of the Company’s deferred tax assets and liabilities at December 31 were as follows:
|
2019
|
2018
|
|||||||
|
Deferred tax assets:
|
||||||||
|
Postretirement and other employee benefits
|
$
|
|
|
$
|
|
|
||
|
Product liability
|
|
|
|
|
||||
|
Net operating loss, capital loss, and tax credit carryforwards
|
|
|
|
|
||||
|
All other items
|
|
|
|
|
||||
|
Total deferred tax assets
|
|
|
|
|
||||
|
Deferred tax liabilities:
|
||||||||
|
Property, plant and equipment
|
(
|
)
|
(
|
)
|
||||
|
All other items
|
(
|
)
|
(
|
)
|
||||
|
Total deferred tax liabilities
|
(
|
)
|
(
|
)
|
||||
|
|
|
|
|
|||||
|
Valuation allowances
|
(
|
)
|
(
|
)
|
||||
|
Net deferred tax asset
|
$
|
|
|
$
|
|
|
||
At
December 31, 2019
, the Company has gross U.S. federal and foreign tax losses available for carryforward of
$
6,560
and
$
76,748
, respectively. U.S. federal and foreign tax attributes will expire from 2020 through 2026. For these jurisdictions, valuation allowances have been recorded against those attributes for which, based upon an assessment, it is more likely than not that some portion may not be realized.
The Company considers, on a quarterly basis, all available positive and negative evidence in assessing whether it is more likely than not that some portion or all of its deferred tax assets are realizable. The Company considers the historical and projected financial results of the tax paying component recording the deferred tax asset as well as all other positive and negative evidence including cumulative losses in recent years, a history of potential tax benefits expiring unused and whether a period of
-
52
-
sustainable earnings has been demonstrated. During the year ended December 31, 2019, the Company has assessed all available positive and negative evidence and, based on the weight of significant negative evidence, including cumulative losses, the Company has maintained valuation allowances totaling
$
27,270
against deferred tax assets primarily in China and the U.K.
The Company applies the rules under ASC 740-10 in its
Accounting for Uncertainty in Income Taxes
for uncertain tax positions using a “more likely than not” recognition threshold. Pursuant to these rules, the Company will initially recognize the financial statement effects of a tax position when it is more likely than not, based on the technical merits of the tax position, that such a position will be sustained upon examination by the relevant tax authorities. If the tax benefit meets the “more likely than not” threshold, the measurement of the tax benefit will be based on the Company’s estimate of the largest amount that meets the more likely than not recognition threshold. The Company’s unrecognized tax benefits, exclusive of interest, totaled approximately
$
9,934
at
December 31, 2019
, as itemized in the tabular roll forward below. The unrecognized tax benefits at
December 31, 2019
relate to uncertain tax positions in tax years 2012 through 2017. Based upon the outcome of tax examinations, judicial proceedings, or expiration of statutes of limitations, it is reasonably possible that the ultimate resolution of these unrecognized tax benefits may result in a payment that is materially different from the current estimate of the tax liabilities.
|
Unrecognized
Tax Benefits
|
|||
|
Balance at December 31, 2016
|
$
|
|
|
|
Settlements for tax positions of prior years
|
(
|
)
|
|
|
Additions for tax positions of current year
|
|
|
|
|
Additions for tax positions of prior years
|
|
|
|
|
Statute lapses
|
(
|
)
|
|
|
Balance at December 31, 2017
|
|
|
|
|
Settlements for tax positions of prior years
|
(
|
)
|
|
|
Additions for tax positions of the current year
|
|
|
|
|
Additions for tax positions of prior years
|
|
|
|
|
Statute lapses
|
(
|
)
|
|
|
Balance at December 31, 2018
|
|
|
|
|
Settlements for tax positions of prior years
|
(
|
)
|
|
|
Additions for tax positions of the prior year
|
|
|
|
|
Statute lapses
|
(
|
)
|
|
|
Balance at December 31, 2019
|
$
|
|
|
Of this amount, the effective rate would change upon the recognition of approximately
$
8,468
of these unrecognized tax benefits, net of federal income tax effect. The Company recorded, through the tax provision, approximately
$
1,262
of net interest expense for
2019
, and immaterial amounts of benefit on interest reductions for 2018 and 2017. At
December 31, 2019
, the Company has
$
1,353
of interest accrued as an ASC 740-10 reserve.
The Company operates in multiple jurisdictions throughout the world. The Company has effectively settled U.S. federal tax examinations for tax years before 2016 and state and local examinations for tax years before 2014, with limited exceptions. Furthermore, the Company’s non-U.S. subsidiaries are generally no longer subject to income tax examinations in major foreign taxing jurisdictions for tax years prior to 2014. Income tax returns of certain of our subsidiaries in various jurisdictions are currently under examination and it is possible that these examinations could conclude within the next twelve months; however, the Company does not anticipate any significant increases or decreases in its total amount of unrecognized tax benefits within that period.
-
53
-
|
Note 8
.
|
Debt
|
On February 15, 2018, the Company amended its revolving credit facility ("Credit Facility") with a consortium of banks that provided up to
$
400,000
based on available collateral, including an
$
110,000
letter of credit subfacility, set to expire in
February 2023
. As of June 27, 2019, the Company amended this Credit Facility with a consortium of several banks that provides up to
$
700,000
and is set to expire in
June 2024
. Of this amended borrowing capacity,
$
200,000
was allocated to a Delayed Draw Term Loan A ("Term Loan A"), which was drawn in December 2019, while the remaining
$
500,000
was allocated to the Credit Facility to provide working capital and funds for general corporate purposes. The Term Loan A funds were used primarily to pay for the unsecured notes which matured at that time. The Credit Facility still includes the
$
110,000
letter of credit sub-facility. The Company may elect, with lender consent, to increase the commitments under the Credit Facility or incur one or more tranches of term loans in an aggregate amount of up to
$
300,000
(or an unlimited increase if the Proforma Net Secured Leverage Ratio is less than
1.75
x). Debt issuance costs related to the Credit Facility amendment totaled
$
1,507
while those related to the Term Loan A totaled
$
700
, for a combined
$
2,207
in debt issuance costs. These costs, along with the remaining debt issuance costs from the February 2018 credit facility amendment, will be amortized over the life of the underlying debt instruments and are included in the Other assets classification in the
Consolidated Balance Sheets
. The Company may elect to add certain foreign subsidiaries as additional borrowers under the Credit Facility, subject to the satisfaction of certain conditions.
On
July 11, 2019
, the Company entered into forward-starting interest rate swaps to effectively hedge the cash flow exposure associated with the Company's forthcoming Term Loan A variable-rate borrowings. See
Note 9
Fair Value Measurement for further information.
The Company's accounts receivable securitization facility provides up to
$
150,000
based on available collateral and expires in
February 2021
. Pursuant to the terms of the facility, the Company is permitted to sell certain of its domestic trade receivables on a continuous basis to its wholly-owned, bankruptcy-remote subsidiary, Cooper Receivables LLC (“CRLLC”). In turn, CRLLC may sell from time to time an undivided ownership interest in the purchased trade receivables, without recourse, to a PNC Bank administered, asset-backed commercial paper conduit. The accounts receivable securitization facility has no significant financial covenants until available credit is less than specified amounts.
The Company had
no
borrowings under the revolving credit facility or the accounts receivable securitization facility at
December 31, 2019
or
December 31, 2018
, other than amounts used to secure letters of credit. Amounts used to secure letters of credit totaled
$
21,651
at
December 31, 2019
and
$
16,800
at
December 31, 2018
. The Company’s additional borrowing capacity, net of borrowings and amounts used to back letters of credit, and based on eligible collateral through use of its credit facility with its bank group and its accounts receivable securitization facility at
December 31, 2019
, was
$
601,649
.
The Company’s consolidated operations in Asia have renewable unsecured credit lines that provide up to
$
46,426
of borrowings and do not contain financial covenants. The additional borrowing capacity on the Asian credit lines, based on eligible collateral and the short-term notes payable, totaled
$
34,130
at
December 31, 2019
.
In 2010 and 2017, Industrial Revenue Bonds (IRBs) were issued by the City of Texarkana to finance the design, equipping and construction of expansions, as well as the on-going operations of the Texarkana manufacturing facility, in return for real estate and equipment located at the Company’s Texarkana tire manufacturing plant. The assets related to the expansion and on-going plant operations provide security for the bonds issued by the City of Texarkana. As a result, the City retains title to the assets and, in turn, provides a
100
percent
property tax exemption to the Company. However, the Company has recorded the property in its Consolidated Balance Sheets, along with a capital lease obligation to repay the proceeds of the IRBs, because the arrangements are cancelable at any time at the Company’s request. The Company has also purchased the IRBs and therefore is the bondholder, as well as the borrower/lessee of the property purchased with the IRB proceeds. The capital lease obligations and IRB assets are recorded net in the Consolidated Balance Sheets. At December 31,
2019
and
2018
, the assets and liabilities associated with these City of Texarkana IRBs were
$
72,080
and
$
35,000
, respectively.
-
54
-
The following table summarizes the long-term debt and finance leases of the Company at
December 31, 2019
and
December 31, 2018
.
|
December 31, 2019
|
December 31, 2018
|
|||||||
|
Parent company
|
||||||||
|
3.3% Term Loan A due June 2024
|
$
|
|
|
$
|
|
|
||
|
8% Unsecured Notes due December 2019
|
|
|
|
|
||||
|
7.625% Unsecured Notes due March 2027
|
|
|
|
|
||||
|
Finance leases and other
|
|
|
|
|
||||
|
|
|
|
|
|||||
|
Less: unamortized debt issuance costs
|
|
|
|
|
||||
|
|
|
|
|
|||||
|
Less: current maturities
|
|
|
|
|
||||
|
$
|
|
|
$
|
|
|
|||
Over the next five years, the Company has payments related to the above debt of:
|
Future Debt Payments
|
||||
|
2020
|
$
|
|
|
|
|
2021
|
|
|
||
|
2022
|
|
|
||
|
2023
|
|
|
||
|
2024
|
|
|
||
Interest paid on debt during
2019
,
2018
and
2017
was
$
33,161
,
$
34,070
and
$
34,085
, respectively. The amount of interest capitalized was
$
2,233
,
$
2,663
and
$
2,706
during
2019
,
2018
and
2017
, respectively.
In addition, at
December 31, 2019
and
December 31, 2018
, the Company had short-term notes payable of
$
12,296
and
$
15,288
, respectively, due within twelve months, consisting of funds borrowed by the Company’s operations in the PRC. The weighted average interest rate of the short-term notes payable at
December 31, 2019
and
December 31, 2018
was
4.70
percent
and
4.82
percent
, respectively.
|
Note 9
.
|
Fair Value Measurements
|
Derivative financial instruments are utilized by the Company to reduce foreign currency exchange risks. The Company has established policies and procedures for risk assessment and the approval, reporting and monitoring of derivative financial instrument activities. The Company does not enter into financial instruments for trading or speculative purposes. The derivative financial instruments include non-designated and cash flow hedges of foreign currency exposures. The change in values of the non-designated foreign currency hedges offset the exchange rate fluctuations related to assets and liabilities recorded on the Consolidated Balance Sheets. The cash flow hedges offset exchange rate fluctuations on the foreign currency-denominated intercompany loans and forecasted cash flows. The Company presently hedges exposures in various currencies generally for transactions expected to occur within the next
12
months
. Additionally, the Company utilizes cash flow hedges that hedge already recognized intercompany loans with maturities of up to
two years
. The notional amount of these foreign currency derivative instruments at
December 31, 2019
and
December 31, 2018
was
$
167,915
and
$
129,542
, respectively. The counterparties to each of these agreements are major commercial banks.
The Company uses non-designated foreign currency forward contracts to hedge its net foreign currency monetary assets and liabilities primarily resulting from non-functional currency denominated receivables and payables of certain U.S. and foreign entities.
Foreign currency forward contracts are also used to hedge variable cash flows associated with forecasted sales and purchases denominated in currencies that are not the functional currency of certain entities. The forward contracts have maturities of less than
twelve
months pursuant to the Company’s policies and hedging practices. These forward contracts meet the criteria for and have been designated as cash flow hedges. Accordingly, the effective portion of the change in fair value of such forward contracts (
$(
1,033
)
and
$
2,216
as of
December 31, 2019
and
December 31, 2018
, respectively) are recorded as a separate component of stockholders’ equity in the accompanying
Consolidated Balance Sheets
and reclassified into earnings as the hedged transactions occur.
-
55
-
The Company utilizes cross-currency interest rate swaps to hedge the principal and interest repayment of some intercompany loans. The Company also utilizes designated foreign currency forward contracts to hedge the principal amounts of certain intercompany loans. The fair value of these contracts is
$(
994
)
and
$(
1,503
)
at
December 31, 2019
and
December 31, 2018
, respectively. These contracts have maturities of up to
two years
and meet the criteria for and have been designated as cash flow hedges. Spot to spot changes are recorded in income and all other effective changes are recorded as a separate component of stockholders' equity.
On
July 11, 2019
, in order to hedge its upcoming Term Loan A variable rate debt, with an interest rate indexed to LIBOR plus 150 basis points, the Company entered into forward-starting interest rate swaps with effective dates of December 2, 2019 and termination dates of June 27, 2024. The initial notional amount of these swaps is
$
200,000
and decreases quarterly by varying amounts over the life of the swaps, in accordance with the Term Loan A repayment schedule. The net quarterly payments made as of
December 31, 2019
were
immaterial
. The interest rate swaps effectively fix the variable interest rate component on the notional amount of these swaps at
1.720
%
. The swaps qualify for hedge accounting and, therefore, changes in the fair value of the swaps have been recorded in accumulated other comprehensive income in the amount of
$(
1,032
)
at
December 31, 2019
.
The Company assesses hedge effectiveness prospectively and retrospectively, based on regression of the change in foreign currency exchange rates. Time value of money is included in effectiveness testing.
The derivative instruments are subject to master netting arrangements with the counterparties to the contracts.
The following table presents the location and amounts of derivative instrument fair values in the
Consolidated Balance Sheets
:
|
Assets/(liabilities)
|
December 31, 2019
|
December 31, 2018
|
||||||
|
Designated as hedging instruments:
|
||||||||
|
Gross amounts recognized
|
$
|
(
|
)
|
$
|
(
|
)
|
||
|
Gross amounts offset
|
|
|
|
|
||||
|
Net amounts
|
(
|
)
|
|
|
||||
|
Not designated as hedging instruments:
|
||||||||
|
Gross amounts recognized
|
$
|
(
|
)
|
$
|
(
|
)
|
||
|
Gross amounts offset
|
|
|
|
|
||||
|
Net amounts
|
(
|
)
|
(
|
)
|
||||
|
Net amounts presented:
|
||||||||
|
Other current assets
|
$
|
(
|
)
|
$
|
|
|
||
|
Other long-term liabilities
|
$
|
(
|
)
|
$
|
(
|
)
|
||
The following table presents the location and amount of gains and losses on derivative instruments designated as cash flow hedges in the
Consolidated Statements of Income
:
|
|
Twelve Months Ended December 31,
|
|||||||||||
|
2019
|
2018
|
2017
|
||||||||||
|
Amount of (Loss) Gain Recognized in Other Comprehensive Income on Derivatives
|
$
|
(
|
)
|
$
|
|
|
$
|
(
|
)
|
|||
|
Amount of Gain (Loss) Reclassified from Accumulated Other Comprehensive Income into Income
|
||||||||||||
|
Net sales
|
$
|
|
|
$
|
|
|
$
|
(
|
)
|
|||
|
Interest expense
|
(
|
)
|
(
|
)
|
(
|
)
|
||||||
|
Other non-operating expense
|
|
|
|
|
(
|
)
|
||||||
|
$
|
|
|
$
|
|
|
$
|
(
|
)
|
||||
The following table presents the location and amount of gains and losses on foreign exchange contract derivatives not designated as hedging instruments in the
Consolidated Statements of Income
.
|
Twelve Months Ended December 31,
|
||||||||||||
|
2019
|
2018
|
2017
|
||||||||||
|
Other non-operating (expense) income
|
$
|
(
|
)
|
$
|
|
|
$
|
(
|
)
|
|||
The Company has categorized its financial instruments, based on the priority of the inputs to the valuation technique, into the three-level fair value hierarchy. The fair value hierarchy gives the highest priority to quoted prices in active markets for
-
56
-
identical assets or liabilities (Level 1) and the lowest priority to unobservable inputs (Level 3). If the inputs used to measure the financial instruments fall within the different levels of the hierarchy, the categorization is based on the lowest level input that is significant to the fair value measurement of the instrument.
Financial assets and liabilities recorded on the Consolidated Balance Sheets are categorized based on the inputs to the valuation techniques as follows:
Level 1. Financial assets and liabilities whose values are based on unadjusted quoted prices for identical assets or liabilities in an active market that the Company has the ability to access.
Level 2. Financial assets and liabilities whose values are based on quoted prices in markets that are not active or model inputs that are observable either directly or indirectly for substantially the full term of the asset or liability. Level 2 inputs include the following.
a.
Quoted prices for similar assets or liabilities in active markets;
b.
Quoted prices for identical or similar assets or liabilities in non-active markets;
c.
Pricing models whose inputs are observable for substantially the full term of the asset or liability; and
|
d.
|
Pricing models whose inputs are derived principally from or corroborated by observable market data through correlation or other means for substantially the full term of the asset or liability.
|
Level 3. Financial assets and liabilities whose values are based on prices or valuation techniques that require inputs that are both unobservable and significant to the overall fair value measurement. These inputs reflect management’s own assumptions about the assumptions a market participant would use in pricing the asset or liability.
The valuation of foreign currency derivative instruments was determined using widely accepted valuation techniques. This analysis reflected the contractual terms of the derivatives, including the period to maturity, and used observable market-based inputs, including forward points. The Company incorporated credit valuation adjustments to appropriately reflect both its own nonperformance risk and the respective counterparty’s nonperformance risk in the fair value measurements. Although the Company determined that the majority of the inputs used to value its derivatives fall within Level 2 of the fair value hierarchy, the credit valuation adjustments associated with its derivatives utilize Level 3 inputs, such as current credit ratings, to evaluate the likelihood of default by itself and its counterparties. However, as of
December 31, 2019
and
December 31, 2018
, the Company assessed the significance of the impact of the credit valuation adjustments on the overall valuation of its derivative positions and determined that the credit valuation adjustments were not significant to the overall valuation of its derivatives. As a result, the Company determined that its derivative valuations in their entirety were to be classified in Level 2 of the fair value hierarchy.
The valuation of stock-based liabilities was determined using the Company's stock price, and as a result, these liabilities are classified in Level 1 of the fair value hierarchy.
The following table presents the Company’s fair value hierarchy for those assets and liabilities measured at fair value on a recurring basis as of
December 31, 2019
and
December 31, 2018
:
|
|
December 31, 2019
|
|||||||||||||||
|
|
Total
Liabilities |
Quoted Prices
in Active Markets for Identical Assets Level (1) |
Significant
Other Observable Inputs Level (2) |
Significant
Unobservable Inputs Level (3) |
||||||||||||
|
Foreign Currency Derivative
|
$
|
(
|
)
|
$
|
|
|
$
|
(
|
)
|
$
|
|
|
||||
|
Interest Rate Swaps
|
(
|
)
|
|
|
(
|
)
|
|
|
||||||||
|
Stock-based Liabilities
|
(
|
)
|
(
|
)
|
|
|
|
|
||||||||
|
|
December 31, 2018
|
||||||||||||||||
|
|
Total
Assets
(Liabilities)
|
Quoted Prices
in Active Markets
for Identical
Assets
Level (1)
|
Significant
Other
Observable
Inputs
Level (2)
|
Significant
Unobservable
Inputs
Level (3)
|
|||||||||||||
|
Foreign Currency Derivative
|
$
|
|
|
$
|
|
|
$
|
|
|
$
|
|
|
|||||
|
Stock-based Liabilities
|
(
|
)
|
(
|
)
|
|
|
|
|
|||||||||
The fair market value of
Cash and cash equivalents
,
Notes receivable
, restricted cash included in
Other current assets
,
Notes payable
and
Current portion of long-term debt and finance leases
at
December 31, 2019
and
December 31, 2018
are equal to their corresponding carrying values as reported on the
Consolidated Balance Sheets
as of
December 31, 2019
and
-
57
-
December 31, 2018
, respectively. Each of these classes of assets and liabilities is classified within Level 1 of the fair value hierarchy.
The fair market value of
Long-term debt and finance leases
is
$
292,719
and
$
137,343
at
December 31, 2019
and
December 31, 2018
, respectively, and is classified within Level 1 of the fair value hierarchy. The carrying value of Long-term debt is
$
309,148
and
$
121,284
as reported on the
Consolidated Balance Sheets
as of
December 31, 2019
and
December 31, 2018
, respectively.
|
Note 10
.
|
Pensions and Postretirement Benefits Other than Pensions
|
The Company has a number of plans providing pension and retirement benefits. These plans include defined benefit and defined contribution plans. The plans cover substantially all U.S. domestic employees. There are also plans that cover employees in the U.K. and Germany. The Company has an unfunded, nonqualified supplemental retirement benefit plan in the U.S. covering certain employees whose participation in the qualified plan is limited by provisions of the Internal Revenue Code.
For defined benefit plans, benefits are generally based on compensation and length of service for salaried employees and length of service for hourly employees. In the U.S., the Company froze the pension benefits in its Spectrum (salaried employees) Plan in 2009. In 2012, the Company closed the U.S. pension plans for the bargaining units to new participants. Certain grandfathered participants in the bargaining unit plans continue to accrue pension benefits. Employees of certain of the Company’s foreign operations in the U.K. and Germany are covered by either contributory or non-contributory trusteed pension plans. In 2012, the Company froze the benefits in the U.K. pension plan.
Participation in the Company’s defined contribution plans is voluntary. The Company matches plan participants’ contributions up to various limits. Participants’ contributions are limited based on their compensation and, for certain supplemental contributions which are not eligible for Company matching, based on their age. Certain employees covered by collective bargaining units receive company contributions. Expense for the defined contribution plans was
$
13,370
,
$
12,424
and
$
13,931
for
2019
,
2018
and
2017
, respectively.
The Company currently provides retiree health care and life insurance benefits to a portion of its U.S. salaried and hourly employees. U.S. salaried and non-bargained hourly employees hired on or after January 1, 2003 are not eligible for retiree health care or life insurance coverage. The Company has reserved the right to modify or terminate certain of these salaried benefits at any time.
The Company has implemented household caps on the amounts of retiree medical benefits it will provide to certain retirees in the U.S. The caps do not apply to individuals who retired prior to certain specified dates. Costs in excess of these caps will be paid by plan participants. The Company implemented increased cost sharing in 2004 in the retiree medical coverage provided to certain eligible current and future retirees. Since then, cost sharing has expanded such that nearly all covered retirees pay a charge to be enrolled.
In accordance with U.S. GAAP, the Company recognizes the funded status (i.e., the difference between the fair value of plan assets and the projected benefit obligation) of its pension and OPEB plans and the net unrecognized actuarial losses and unrecognized prior service costs in the consolidated balance sheets. The unrecognized actuarial losses and unrecognized prior service costs (components of Accumulated other comprehensive loss in the Equity section of the balance sheet) will be subsequently recognized as net periodic benefit costs pursuant to the Company’s historical accounting policy for amortizing such amounts. Further, actuarial gains and losses that arise in subsequent periods and are not recognized as net periodic benefit costs in the same periods will be recognized as a component of other comprehensive income.
-
58
-
The following table reflects changes in the projected obligations and fair market values of assets in all defined benefit pension and other postretirement benefit plans of the Company:
|
|
2019 Pension Benefits
|
2018 Pension Benefits
|
Other Postretirement Benefits
|
||||||||||||||||||||||||||||
|
|
Domestic
|
International
|
Total
|
Domestic
|
International
|
Total
|
2019
|
2018
|
|||||||||||||||||||||||
|
Change in benefit obligation:
|
|||||||||||||||||||||||||||||||
|
Projected Benefit Obligation at beginning of year
|
$
|
|
|
$
|
|
|
$
|
|
|
$
|
|
|
$
|
|
|
$
|
|
|
$
|
|
|
$
|
|
|
|||||||
|
Service cost - employer
|
|
|
|
|
|
|
|
|
|
|
|
|
|
|
|
|
|||||||||||||||
|
Interest cost
|
|
|
|
|
|
|
|
|
|
|
|
|
|
|
|
|
|||||||||||||||
|
Actuarial loss/(gain)
|
|
|
|
|
|
|
(
|
)
|
(
|
)
|
(
|
)
|
(
|
)
|
(
|
)
|
|||||||||||||||
|
Benefits paid
|
(
|
)
|
(
|
)
|
(
|
)
|
(
|
)
|
(
|
)
|
(
|
)
|
(
|
)
|
(
|
)
|
|||||||||||||||
|
Plan amendment
|
|
|
|
|
|
|
|
|
|
|
|
|
|
|
|
|
|||||||||||||||
|
Settlements
|
|
|
(
|
)
|
(
|
)
|
|
|
|
|
|
|
|
|
|
|
|||||||||||||||
|
Foreign currency translation effect
|
|
|
|
|
|
|
|
|
(
|
)
|
(
|
)
|
|
|
|
|
|||||||||||||||
|
Projected Benefit Obligation at December 31
|
$
|
|
|
$
|
|
|
$
|
|
|
$
|
|
|
$
|
|
|
$
|
|
|
$
|
|
|
$
|
|
|
|||||||
|
Change in plans’ assets:
|
|||||||||||||||||||||||||||||||
|
Fair value of plans’ assets at beginning of year
|
$
|
|
|
$
|
|
|
$
|
|
|
$
|
|
|
$
|
|
|
$
|
|
|
$
|
|
|
$
|
|
|
|||||||
|
Actual return on plans’ assets
|
|
|
|
|
|
|
(
|
)
|
(
|
)
|
(
|
)
|
|
|
|
|
|||||||||||||||
|
Employer contribution
|
|
|
|
|
|
|
|
|
|
|
|
|
|
|
|
|
|||||||||||||||
|
Benefits paid
|
(
|
)
|
(
|
)
|
(
|
)
|
(
|
)
|
(
|
)
|
(
|
)
|
|
|
|
|
|||||||||||||||
|
Settlements
|
|
|
(
|
)
|
(
|
)
|
|
|
|
|
|
|
|
|
|
|
|||||||||||||||
|
Foreign currency translation effect
|
|
|
|
|
|
|
|
|
(
|
)
|
(
|
)
|
|
|
|
|
|||||||||||||||
|
Fair value of plans’ assets at December 31
|
$
|
|
|
$
|
|
|
$
|
|
|
$
|
|
|
$
|
|
|
$
|
|
|
$
|
|
|
$
|
|
|
|||||||
|
Funded status
|
$
|
(
|
)
|
$
|
(
|
)
|
$
|
(
|
)
|
$
|
(
|
)
|
$
|
(
|
)
|
$
|
(
|
)
|
$
|
(
|
)
|
$
|
(
|
)
|
|||||||
|
Amounts recognized in the balance sheets:
|
|||||||||||||||||||||||||||||||
|
Accrued liabilities
|
$
|
(
|
)
|
$
|
|
|
$
|
(
|
)
|
$
|
(
|
)
|
$
|
|
|
$
|
(
|
)
|
$
|
(
|
)
|
$
|
(
|
)
|
|||||||
|
Postretirement benefits other than pensions
|
|
|
|
|
—
|
|
|
|
—
|
|
—
|
|
$
|
(
|
)
|
$
|
(
|
)
|
|||||||||||||
|
Pension benefits
|
$
|
(
|
)
|
$
|
(
|
)
|
$
|
(
|
)
|
$
|
(
|
)
|
$
|
(
|
)
|
$
|
(
|
)
|
—
|
|
—
|
|
|||||||||
Included in Accumulated other comprehensive
loss
at
December 31, 2019
are the following amounts that have not yet been recognized in net periodic benefit cost: unrecognized prior service costs of
$
5,780
(
$
4,338
net of tax) and unrecognized actuarial losses of
$
413,676
(
$
384,507
net of tax).
Included in Accumulated other comprehensive loss at
December 31, 2018
are the following amounts that have not yet been recognized in net periodic benefit cost: unrecognized prior service credits of
($
497
)
(
($
373
)
net of tax) and unrecognized actuarial losses of
$
438,176
(
$
401,979
net of tax).
The prior service cost and actuarial loss included in accumulated other comprehensive loss that are expected to be recognized in net periodic benefit cost during the fiscal year-ended December 31,
2020
are
$
620
and
$
33,169
, respectively.
The accumulated benefit obligation for all defined benefit pension plans was
$
1,552,037
and
$
1,406,263
at
December 31, 2019
and
2018
, respectively.
In 2019, lump-sum distributions out of the U.K. pension plan of
$
18,196
were made from plan assets. The vested benefit obligation associated with these former employees was approximately four percent of the U.K. plan's benefit obligation. Due to
-
59
-
the size of the lump-sum distributions, in accordance with U.S. GAAP, the Company was required to recognize a non-cash settlement charge of
$
4,262
for all 2019 settlements out of the U.K. plan.
Additionally, in 2019, an amendment to a domestic pension plan resulted in a retroactive increase in benefit levels for plan participants and has been accounted for as a prior service cost deferred in Other comprehensive loss, to be amortized as a component of net periodic benefit cost in future periods. The domestic pension plan projected benefit obligation increased
$
3,069
as a result of the amendment.
On October 26, 2018, in
Lloyds Banking Group Pensions Trustees Limited vs. Lloyds Bank plc and Others
, the High Court of Justice in the United Kingdom issued a ruling ("Court Ruling") requiring Lloyds Bank plc to equalize benefits payable to men and women under its U.K. defined benefit pension plan. The Court Ruling noted that the formulas used to determine guaranteed minimum pension (GMP) benefits violated gender-pay equality laws due to differences in the way benefits were calculated for men and women. As a result of this ruling, the U.K. pension plan was required to amend its benefit formulas and account for the higher pension payments resulting from GMP equalization. In accordance with ASC 715, this Court Ruling represents a change to the U.K. pension plan resulting in a retroactive increase in benefit levels for plan participants and has been accounted for as a prior service cost deferred in Other comprehensive loss, to be amortized as a component of net periodic benefit cost in future periods. The U.K. pension plan projected benefit obligation increased $
3,704
as a result of the amendment required due to the Court Ruling.
Weighted average assumptions used to determine benefit obligations at December 31:
|
|
Pension Benefits
|
Other Postretirement Benefits
|
||||||||||
|
|
2019
|
2018
|
2019
|
2018
|
||||||||
|
All plans
|
||||||||||||
|
Discount rate
|
|
%
|
|
%
|
|
%
|
|
%
|
||||
|
Domestic plans
|
||||||||||||
|
Discount rate
|
|
%
|
|
%
|
|
%
|
|
%
|
||||
|
Foreign plans
|
||||||||||||
|
Discount rate
|
|
%
|
|
%
|
|
|
|
|
||||
At
December 31, 2019
, the weighted average assumed annual rate of increase in the cost of medical benefits was
6.75
percent trending linearly to
4.50
percent per annum in
2029
.
-
60
-
The following tables disclose the amount of net periodic benefit costs for the
twelve months
ended
December 31, 2019
and
2018
, respectively, for the Company’s defined benefit plans and other postretirement benefits:
|
|
Pension Benefits - Domestic
|
|||||||||||
|
Twelve Months Ended December 31,
|
||||||||||||
|
|
2019
|
2018
|
2017
|
|||||||||
|
Components of net periodic benefit cost:
|
||||||||||||
|
Service cost
|
$
|
|
|
$
|
|
|
$
|
|
|
|||
|
Interest cost
|
|
|
|
|
|
|
||||||
|
Expected return on plan assets
|
(
|
)
|
(
|
)
|
(
|
)
|
||||||
|
Amortization of actuarial loss
|
|
|
|
|
|
|
||||||
|
Amortization of prior service cost
|
$
|
|
|
|
|
|
|
|||||
|
Net periodic benefit cost
|
$
|
|
|
$
|
|
|
$
|
|
|
|||
|
|
Pension Benefits - International
|
|||||||||||
|
Twelve Months Ended December 31,
|
||||||||||||
|
|
2019
|
2018
|
2017
|
|||||||||
|
Components of net periodic benefit cost:
|
||||||||||||
|
Interest cost
|
$
|
|
|
$
|
|
|
$
|
|
|
|||
|
Expected return on plan assets
|
(
|
)
|
(
|
)
|
(
|
)
|
||||||
|
Amortization of actuarial loss
|
|
|
|
|
|
|
||||||
|
Amortization of prior service cost
|
|
|
|
|
|
|
||||||
|
Effect of settlements
|
|
|
—
|
|
—
|
|
||||||
|
Net periodic benefit cost
|
$
|
|
|
$
|
|
|
$
|
|
|
|||
|
|
Other Post Retirement Benefits
|
|||||||||||
|
Twelve Months Ended December 31,
|
||||||||||||
|
|
2019
|
2018
|
2017
|
|||||||||
|
Components of net periodic benefit cost:
|
||||||||||||
|
Service cost
|
$
|
|
|
$
|
|
|
$
|
|
|
|||
|
Interest cost
|
|
|
|
|
|
|
||||||
|
Amortization of prior service credit
|
(
|
)
|
(
|
)
|
(
|
)
|
||||||
|
Net periodic benefit cost
|
$
|
|
|
$
|
|
|
|
|
||||
-
61
-
Weighted-average assumptions used to determine net periodic benefit cost for the years ended December 31:
|
|
Pension Benefits
|
Other Postretirement Benefits
|
||||||||||||||||
|
|
2019
|
2018
|
2017
|
2019
|
2018
|
2017
|
||||||||||||
|
All plans
|
||||||||||||||||||
|
Discount rate
|
|
%
|
|
%
|
|
%
|
|
%
|
|
%
|
|
%
|
||||||
|
Expected return on plan assets
|
|
%
|
|
%
|
|
%
|
|
%
|
|
%
|
|
%
|
||||||
|
Domestic plans
|
||||||||||||||||||
|
Discount rate
|
|
%
|
|
%
|
|
%
|
|
%
|
|
%
|
|
%
|
||||||
|
Expected return on plan assets
|
|
%
|
|
%
|
|
%
|
|
%
|
|
%
|
|
%
|
||||||
|
Foreign plans
|
||||||||||||||||||
|
Discount rate
|
|
%
|
|
%
|
|
%
|
|
%
|
|
%
|
|
%
|
||||||
|
Expected return on plan assets
|
|
%
|
|
%
|
|
%
|
|
%
|
|
%
|
|
%
|
||||||
The following table lists the projected benefit obligation, accumulated benefit obligation and fair value of plan assets for the pension plans with projected benefit obligations and accumulated benefit obligations in excess of plan assets at
December 31, 2019
and
2018
. The Spectrum Plan is excluded from the December 31, 2019 amounts as the plan assets exceeded the projected benefit obligation and accumulated benefit obligation at that date.
|
|
December 31,
|
|||||||
|
|
2019
|
2018
(a)
|
||||||
|
Projected benefit obligation
|
$
|
|
|
$
|
|
|
||
|
Accumulated benefit obligation
|
|
|
|
|
||||
|
Fair value of plan assets
|
|
|
|
|
||||
|
The following table lists the projected benefit obligation, accumulated benefit obligation and fair value of plan assets for the Spectrum Plan, which had plan assets in excess of projected benefit obligations and accumulated benefit obligations at December 31, 2019:
|
||||||||
|
|
December 31,
|
|||||||
|
2019
|
2018
(a)
|
|||||||
|
Projected benefit obligation
|
$
|
|
|
$
|
|
|
||
|
Accumulated benefit obligation
|
$
|
|
|
$
|
|
|
||
|
Fair value of plan assets
|
$
|
|
|
$
|
|
|
||
Assumed health care cost trend rates for other postretirement benefits have a significant effect on the amounts reported.
A one-percentage-point change in assumed health care cost trend rates would have the following effects:
|
|
Percentage Point
|
|||||||
|
|
Increase
|
Decrease
|
||||||
|
Increase (decrease) in total service and interest cost components
|
$
|
|
|
$
|
(
|
)
|
||
|
Increase (decrease) in the other postretirement benefit obligation
|
|
|
(
|
)
|
||||
The table below presents the weighted average asset allocations for the domestic and U.K. pension plans’ assets at
December 31, 2019
and
December 31, 2018
by asset category.
|
|
U.S. Plans
|
U.K. Plan
|
||||||||||
|
Asset Category
|
2019
|
2018
|
2019
|
2018
|
||||||||
|
Fixed Income Collective Trust Funds and Securities
|
|
%
|
|
%
|
|
%
|
|
%
|
||||
|
Equity Collective Trust Funds and Securities
|
|
|
|
|
|
|
|
|
||||
|
Other Investment Collective Trust Funds and Securities
|
|
|
|
|
|
|
|
|
||||
|
Cash
|
|
|
|
|
|
|
|
|
||||
|
Total
|
|
%
|
|
%
|
|
%
|
|
%
|
||||
-
62
-
The Company manages the plans' asset allocation relative to the liability profile and funded status of the plans. It is expected that as the plan’s funded status improves, the portfolio will take less risk as to preserve the funded status of the plan framework. The plans follow a glide path whereby a target return-seeking allocation is followed based upon a given funded ratio level. The plans' position with respect to the glide path is monitored and asset allocation and strategy changes to the plans' portfolio are made as appropriate. The plans' strategy is also monitored in relation to the capital markets, interest rates, and the regulatory environment. The assets of the Company’s pension plan in Germany consist of investments in German insurance contracts.
In 2018, the Company made a
$
25
million
one-time additional discretionary contribution to the U.S. pension plans. This contribution improved the funding of the U.S. pension plans, while generating tax savings for the Company due to the deductibility of the contribution on the Company's 2017 tax return at a 35 percent federal corporate income tax rate, prior to the enactment of the Tax Act as of January 1, 2018.
The fair market value of U.S. plan assets was
$
1,047,214
and
$
912,129
at
December 31, 2019
and
2018
, respectively. The fair market value of the U.K. plan assets was
$
377,536
and
$
347,108
at
December 31, 2019
and
2018
, respectively. The fair market value of the German pension plan assets was
$
1,806
and
$
1,893
at
December 31, 2019
and
2018
, respectively.
-
63
-
The table below classifies the assets of the U.S. and U.K. plans using the Fair Value Hierarchy described in
Note 9
- Fair Value Measurements.
|
|
|
Fair Value Hierarchy
|
||||||||||||||||||
|
|
Total
|
Level 1
|
Level 2
|
Level 3
|
NAV
(1)
|
|||||||||||||||
|
December 31, 2019
|
||||||||||||||||||||
|
United States plans
|
||||||||||||||||||||
|
Cash and cash equivalents
|
$
|
|
|
$
|
|
|
$
|
|
|
$
|
|
|
$
|
|
|
|||||
|
Collective Trust Funds - Equity
|
|
|
|
|
|
|
|
|
|
|
||||||||||
|
Collective Trust Funds - Fixed income
|
|
|
|
|
|
|
|
|
|
|
||||||||||
|
Collective Trust Funds - Real Estate
|
|
|
$
|
|
|
$
|
|
|
$
|
|
|
$
|
|
|
||||||
|
$
|
|
|
$
|
|
|
$
|
|
|
$
|
|
|
$
|
|
|
||||||
|
United Kingdom plan
|
||||||||||||||||||||
|
Cash and cash equivalents
|
$
|
|
|
$
|
|
|
$
|
|
|
$
|
|
|
$
|
|
|
|||||
|
Equity securities
|
|
|
|
|
|
|
|
|
|
|
||||||||||
|
Fixed income securities
|
|
|
|
|
|
|
|
|
|
|
||||||||||
|
Other investments
|
|
|
|
|
|
|
|
|
|
|
||||||||||
|
$
|
|
|
$
|
|
|
$
|
|
|
$
|
|
|
$
|
|
|
||||||
|
December 31, 2018
|
||||||||||||||||||||
|
United States plans
|
||||||||||||||||||||
|
Cash & Cash Equivalents
|
$
|
|
|
$
|
|
|
$
|
|
|
$
|
|
|
$
|
|
|
|||||
|
Collective Trust Funds - Equity
|
|
|
|
|
|
|
|
|
|
|
||||||||||
|
Collective Trust Funds - Fixed Income
|
|
|
|
|
|
|
|
|
|
|
||||||||||
|
Collective Trust Funds - Real Estate
|
|
|
|
|
|
|
|
|
|
|
||||||||||
|
$
|
|
|
$
|
|
|
$
|
|
|
$
|
|
|
$
|
|
|
||||||
|
United Kingdom plan
|
||||||||||||||||||||
|
Cash & Cash Equivalents
|
$
|
|
|
$
|
|
|
$
|
|
|
$
|
|
|
$
|
|
|
|||||
|
Equity securities
|
|
|
|
|
|
|
|
|
|
|
||||||||||
|
Fixed income securities
|
|
|
|
|
|
|
|
|
|
|
||||||||||
|
Other investments
|
|
|
|
|
|
|
|
|
|
|
||||||||||
|
$
|
|
|
$
|
|
|
$
|
|
|
$
|
|
|
$
|
|
|
||||||
(1) Investments in common/ collective trusts invest primarily in publicly traded securities and are valued using net asset value (NAV) of units of a bank collective trust. Therefore, these amounts have not been classified in the fair value hierarchy and are presented in the tables to reconcile the fair value hierarchy to the total fair value of plan assets.
Plan assets are measured at fair value. While the Company believes its valuation methodologies are appropriate and consistent with other market participants, the use of different methodologies or assumptions to determine fair value of certain financial instruments could result in a different fair value measurement at the reporting date. The Company’s valuation methodologies used for the plan assets measured at fair value are as follows:
Cash and cash equivalents –
Cash and cash equivalents include cash on deposit and investments in money market mutual funds that invest mainly in short-term instruments and cash, both of which are valued using a market approach.
Equity securities
– Common, preferred, and foreign stocks are valued using a market approach at the closing price on their principal exchange and are included in Level 1 of the fair value hierarchy.
Fixed income securities –
Corporate and foreign bonds are valued using a market approach at the closing price reported on the active market on which the individual securities are traded and are included in Level 1 of the fair value hierarchy.
Collective trust funds –
Collective trust funds are valued at the net asset value of units held at year end and are excluded from the fair value hierarchy. The Collective trust funds fair value has been included within the table above based on the underlying investment strategy.
•
Equity Funds –
Collective trust funds classified as Equity primarily invest in U.S. and non-U.S. securities in both small and large capitalization markets.
•
Fixed Income Funds –
Collective trust funds classified as Fixed Income primarily invest in debt securities, U.S. treasury securities, and fixed income securities.
-
64
-
•
Real Estate Funds -
Collective trust funds classified as Real Estate Funds are invested in global real estate securities.
The fair market values of the Level 3 assets in the U.K. plan are determined by the fund manager using a discounted cash flow methodology. The future cash flows expected to be generated by the assets of the funds and made available to investors are estimated and then discounted back to the valuation date. The discount rate is derived by adding a risk premium to the risk-free interest rate applicable to the country in which the assets are located.
The following table details the activity in these investments for the years ended December 31, 2017, 2018 and
2019
:
|
|
U.K. Plan
Level 3 Assets |
||
|
Balance at December 31, 2016
|
$
|
|
|
|
Transfer into level 3
|
|
|
|
|
Disbursements
|
|
|
|
|
Change in fair value
|
|
|
|
|
Foreign currency translation effect
|
|
|
|
|
Balance at December 31, 2017
|
|
|
|
|
Transfer into level 3
|
|
|
|
|
Disbursements
|
|
|
|
|
Change in fair value
|
(
|
)
|
|
|
Foreign currency translation effect
|
(
|
)
|
|
|
Balance at December 31, 2018
|
|
|
|
|
Transfer into level 3
|
|
|
|
|
Disbursements
|
|
|
|
|
Change in fair value
|
|
|
|
|
Foreign currency translation effect
|
|
|
|
|
Balance at December 31, 2019
|
$
|
|
|
The Company determines the annual expected rates of return on pension assets by first analyzing the composition of its asset portfolio. Historical rates of return are applied to the portfolio. These computed rates of return are reviewed by the Company’s investment advisers and actuaries. Industry comparables and other outside guidance are also considered in the annual selection of the expected rates of return on pension assets.
During
2019
, the Company contributed
$
48,899
to its domestic and foreign pension plans, and during
2020
, the Company expects to contribute between
$
45,000
and
$
55,000
to its domestic and foreign pension plans.
The Company estimates its benefit payments for its domestic and foreign pension plans and other postretirement benefit plans during the next ten years to be as follows:
|
Pension
Benefits
|
Other
Postretirement
Benefits
|
|||||||
|
2020
|
$
|
|
|
$
|
|
|
||
|
2021
|
|
|
|
|
||||
|
2022
|
|
|
|
|
||||
|
2023
|
|
|
|
|
||||
|
2024
|
|
|
|
|
||||
|
2025 through 2029
|
|
|
|
|
||||
|
Note 11
.
|
Lease Commitments
|
The Company leases certain warehouses, distribution centers, office space, material handling equipment, office equipment, cars and information technology hardware. The Company determines if an arrangement is a lease or contains an embedded lease at contract inception.
-
65
-
Upon implementing the new lease accounting standard in 2019, the Company elected the package of practical expedients, which permits a lessee to not reassess under the new standard its prior conclusions regarding lease identification, lease classification and initial direct costs.
Lease liabilities and their corresponding right-of-use assets, for leases with terms of 12 months or greater, are recorded based on the present value of lease payments over the expected lease term. The Company has elected not to present short term leases on the consolidated balance sheet, in accordance with the standard.
The interest rate implicit in lease contracts is typically not readily determinable. As such, the Company utilizes the appropriate incremental borrowing rate, which is the rate incurred to borrow on a collateralized basis over a similar term at an amount equal to the lease payments in a similar economic environment. Certain adjustments to the right-of-use asset may be required for items such as initial direct costs paid or incentives received.
Most leases include one or more options to renew, with renewal terms that can extend the lease term from
one
to
10
years
or more. The exercise of lease renewal options is at the Company's sole discretion. For purposes of calculating operating lease liabilities, lease terms may be deemed to include options to extend or terminate the lease when it is reasonably certain that the Company will exercise that option.
Certain of the Company's lease agreements include rental payments based on the use of the leased property over contractual levels. The Company's lease agreements do not contain any material residual value guarantees or material restrictive covenants.
The Company has lease agreements with lease and non-lease components, which are accounted for separately. Although separation of lease and non-lease components is required, certain practical expedients are available to entities. Entities electing the practical expedient would account for each lease component and the related non-lease component together as a single component. For certain building leases, including the lease of warehouses, distribution centers and office space, the Company accounts for the lease and non-lease components as a single lease component. For all other asset types, the Company accounts for lease and non-lease components separately.
For operating leases, the right-of-use asset is subsequently measured throughout the lease term at the carrying amount of the lease liability. Lease expense for lease payments is recognized on a straight-line basis over the lease term.
For finance leases, the right-of-use asset is subsequently amortized using the straight-line method from the lease commencement date to the earlier of the end of its useful life or the end of the lease term. In cases where the lease term exceeds the useful life, the right-of-use asset is amortized over the useful life of the underlying asset. Amortization of the right-of-use asset is recognized and presented separately from interest expense on the lease liability.
Variable lease expense includes payments based on performance or usage, as well as changes to index and rate-based lease payments.
Right-of-use assets for operating and finance leases are periodically reviewed for impairment losses. The Company uses the long-lived assets impairment guidance in ASC Subtopic 360-10, "Property, Plant, and Equipment - Overall", to determine whether a right-of-use asset is impaired, and if so, the amount of the impairment loss to recognize. No impairment losses have been recognized to date.
-
66
-
The following table presents the location and amount of lease assets and liabilities in the
Consolidated Balance Sheets
:
|
Assets
|
Location
|
December 31, 2019
|
||||
|
Operating lease assets, net
|
Operating lease right-of-use assets, net
|
$
|
|
|
||
|
Finance lease assets
|
Property, plant and equipment
|
|
|
|||
|
Total leased assets
|
$
|
|
|
|||
|
Liabilities
|
Location
|
|||||
|
Current:
|
||||||
|
Operating
|
Accrued liabilities
|
$
|
|
|
||
|
Finance
|
Current portion of long-term debt and finance leases
|
|
|
|||
|
Noncurrent:
|
||||||
|
Operating
|
Noncurrent operating leases
|
|
|
|||
|
Finance
|
Long-term debt and finance leases
|
|
|
|||
|
Total lease liabilities
|
$
|
|
|
|||
The following table presents the location and amount of lease expense in the Consolidated Income Statement:
|
Lease cost
|
Location
|
Twelve Months Ended December 31, 2019
|
||||
|
Operating lease cost
(a)
|
Cost of sales
|
$
|
|
|
||
|
Operating lease cost
|
Selling general & administrative expenses
|
|
|
|||
|
Total operating lease cost
|
|
|
|
|||
|
Amortization of finance lease assets
|
Cost of sales
|
$
|
|
|
||
|
Interest on finance lease liabilities
|
Interest expense
|
|
|
|||
|
Total finance lease cost
|
|
|
||||
|
Net lease cost
|
$
|
|
|
|||
The following table presents the future maturities of the Company's lease obligations:
|
December 31, 2019
|
||||||||||||
|
Operating
Leases |
Finance
Leases |
Total
|
||||||||||
|
2020
|
$
|
|
|
$
|
|
|
$
|
|
|
|||
|
2021
|
|
|
|
|
|
|
||||||
|
2022
|
|
|
|
|
|
|
||||||
|
2023
|
|
|
|
|
|
|
||||||
|
2024
|
|
|
|
|
|
|
||||||
|
After 2024
|
|
|
|
|
|
|
||||||
|
Total lease payments
|
|
|
|
|
|
|
||||||
|
Less: Interest
|
(
|
)
|
(
|
)
|
(
|
)
|
||||||
|
Present value of lease liabilities
|
$
|
|
|
|
$
|
|
|
|
$
|
|
|
|
-
67
-
The following table presents the weighted-average lease term and discount rates of the Company's lease obligations:
|
Weighted-average remaining lease term (years)
|
December 31, 2019
|
||
|
Operating leases
|
|
|
|
|
Finance Leases
|
|
|
|
|
Weighted-average discount rate
|
|||
|
Operating leases
|
|
%
|
|
|
Finance Leases
|
|
%
|
|
The following table presents the cash flow amounts related to lease liabilities included in the Company's Consolidated Statement of Cash Flows
|
Twelve Months Ended December 31, 2019
|
||||
|
Cash paid for amounts included in the measurement of lease liabilities
|
||||
|
Operating cash outflows from operating leases
|
$
|
|
|
|
|
Operating cash outflows from finance leases
|
|
|
||
|
Financing cash outflows from finance leases
|
(
|
)
|
||
|
Leased assets obtained in exchange for new finance lease liabilities
|
|
|
||
|
Leased assets obtained in exchange for new operating lease liabilities
|
|
|
||
Note 12
.
Other Long-Term Liabilities
Other long-term liabilities at December 31 were as follows:
|
2019
|
2018
|
|||||||
|
Product liability
|
$
|
|
|
$
|
|
|
||
|
Long-term income taxes payable
|
|
|
|
|
||||
|
Stock-based liabilities
|
|
|
|
|
||||
|
Other
|
|
|
|
|
||||
|
Other long-term liabilities
|
$
|
|
|
$
|
|
|
||
|
Note 13
.
|
Share Repurchase Program
|
Share repurchase programs require the approval of the Company's Board of Directors.
The following table summarizes the Company’s Board authorized share repurchase programs and related information for the
twelve months
ended
December 31, 2019
:
|
Program
(1)
|
Date Authorized by Board of Directors
|
Expiration Date
(2)
|
Amount Authorized (excluding commissions)
|
Amount Spent as of December 31, 2019 (excluding commissions)
|
Status
|
|||||||||
|
2017 Repurchase Program
|
February 16, 2017
|
December 31, 2021
|
$
|
|
|
$
|
|
|
Active
|
|||||
|
(1)
|
The repurchase programs listed do
not obligate the Company to acquire any specific number of shares and can be suspended or discontinued at any time without notice. Shares can be repurchased in privately negotiated and/or open market transactions, including under plans complying with Rule 10b5-1 under the Securities Exchange Act of 1934, as amended. All repurchases under the program listed above have been made using cash resources.
|
|
(2)
|
On December 3, 2019, the expiration of the 2017 Repurchase Program, scheduled for December 31, 2019, was extended to December 31, 2021. No other changes were made to the program.
|
-
68
-
The following table summarizes the Company’s open market and 10b5-1 plan share repurchase activity and related information during the
twelve months
ended
December 31, 2019
and December 31,
2018
:
|
Number of Shares
|
Average Repurchase Price Per Share
|
Amount
(including commissions)
|
||||||||
|
2019 share repurchase activity:
|
||||||||||
|
2017 Repurchase Program
|
|
|
|
|
$
|
|
|
|||
|
Total share repurchases
|
|
|
|
|
||||||
|
2018 share repurchase activity:
|
||||||||||
|
2017 Repurchase Program
|
|
|
|
|
$
|
|
|
|||
|
Total share repurchases
|
|
|
|
|
||||||
Since the share repurchases began in
August 2014
through
December 31, 2019
, the Company has repurchased
15,768,845
shares of the Company’s common stock at an average cost of
$
34.11
per share.
Reserved Shares
|
Note 14
.
|
Stock-Based Compensation
|
The Company’s incentive compensation plans allow the Company to grant awards to employees in the form of stock options, stock awards, restricted stock units, stock appreciation rights, performance stock units, dividend equivalents and other awards. Compensation related to these awards is determined based on the grant-date fair value and is amortized to expense over the vesting period. The Company recognizes compensation expense based on the earlier of the vesting date or the date when the employee becomes eligible to retire without forfeiture of the award. If awards can be settled in cash, these awards are recorded as liabilities and marked to market.
The following table discloses the amount of stock-based compensation expense:
|
|
Stock-Based Compensation
|
|||||||||||
|
2019
|
2018
|
2017
|
||||||||||
|
Stock options
|
$
|
|
|
$
|
|
|
$
|
|
|
|||
|
Restricted stock units
|
|
|
|
|
|
|
||||||
|
Performance stock units
|
|
|
|
|
|
|
||||||
|
Total stock-based compensation
|
$
|
|
|
$
|
|
|
$
|
|
|
|||
Stock Options
The 2010 and 2014 Incentive Compensation Plans provide for granting options to key employees to purchase common shares at prices not less than market at the date of grant. Options under these plans may have terms of up to
ten years
becoming exercisable in whole or in consecutive installments, cumulative or otherwise. The plans allow the granting of nonqualified stock options which are not intended to qualify for the tax treatment applicable to incentive stock options under provisions of the Internal Revenue Code.
In February 2014, executives participating in the 2014-2016 Long-Term Incentive Plan were granted
380,064
stock options, which vested one-third each year through February 2017.
No
stock options have been granted to executives participating in the Long-Term Incentive Plan since then. Outstanding options do not contain any performance-based criteria. The Company recognizes compensation expense based on the earlier of the vesting date or the date when the employee becomes eligible to retire.
-
69
-
Summarized information for the plans follows:
|
Number of
Shares
|
Weighted
Average
Exercise
Price (per share)
|
Aggregate
Intrinsic
Value
(thousands)
|
|||||||||
|
Outstanding at December 31, 2018
|
|
|
$
|
|
|
||||||
|
Granted
|
|
|
|
|
|||||||
|
Exercised
|
(
|
)
|
|
|
|||||||
|
Expired
|
|
|
|
|
|||||||
|
Canceled
|
(
|
)
|
|
|
|||||||
|
Outstanding at December 31, 2019
|
|
|
|
|
$
|
|
|
||||
|
Exercisable at December 31, 2019
|
|
|
|
|
|
|
|||||
|
|
Year ended December 31,
|
|||||||||||
|
2019
|
2018
|
2017
|
||||||||||
|
Weighted average grant-date fair value of options granted (per share)
|
$
|
|
|
$
|
|
|
$
|
|
|
|||
|
Aggregate intrinsic value of options exercised (thousands)
|
|
|
|
|
|
|
||||||
|
Weighted average grant-date fair value of shares vested (thousands)
|
|
|
|
|
|
|
||||||
The weighted average remaining contractual life of options outstanding at
December 31, 2019
is
3.1
years
. All outstanding stock options are exercisable.
Segregated disclosure of options outstanding at
December 31, 2019
was as follows:
|
|
Range of Exercise Prices
|
|||||||
|
Less than or
equal to $15.63
|
Greater than
$15.63
|
|||||||
|
Options outstanding
|
|
|
|
|
||||
|
Weighted average exercise price
|
$
|
|
|
$
|
|
|
||
|
Remaining contractual life
|
|
|
|
|
||||
|
Options exercisable
|
|
|
|
|
||||
|
Weighted average exercise price
|
$
|
|
|
$
|
|
|
||
At
December 31, 2019
, the Company had fully amortized all expense related to its stock option awards.
Restricted Stock Units
Under the 2001 and 2014 Incentive Compensation Plans, restricted stock units may be granted to officers and certain other employees as awards for exceptional performance, as a hiring or retention incentive or as part of the Long-Term Incentive Plan. The restricted stock units granted in
2017
,
2018
and
2019
have vesting periods of
three
to
four years
. Compensation expense related to the restricted stock units granted is determined based on the fair value of the Company’s stock on the date of grant. The Company recognizes compensation expense based on the earlier of the vesting date or the date when the employee becomes eligible to retire. Employees must remain employed for at least six months after the grant date to vest in the restricted stock units, even if retirement eligible.
-
70
-
The following table provides details of the nonvested restricted stock units for
2019
:
|
Number of
Restricted Units
|
Weighted Average
Grant-Date Fair
Value (per share)
|
Aggregate
Intrinsic
Value
(thousands)
|
|||||||||
|
Nonvested at December 31, 2018
|
|
|
$
|
|
|
||||||
|
Granted
|
|
|
|
|
|||||||
|
Vested
|
(
|
)
|
|
|
|||||||
|
Canceled
|
(
|
)
|
|
|
|||||||
|
Accrued dividend equivalents
|
|
|
|
|
|||||||
|
Nonvested at December 31, 2019
|
|
|
$
|
|
|
||||||
|
Vested but not released
|
|
|
$
|
|
|
||||||
|
Outstanding at December 31, 2019
|
|
|
$
|
|
|
$
|
|
|
|||
|
Weighted-average remaining contractual term of shares outstanding (months)
|
|
|
|||||||||
|
|
Year ended December 31,
|
|||||||||||
|
2019
|
2018
|
2017
|
||||||||||
|
Weighted average grant-date fair value of restricted shares granted (per share)
|
$
|
|
|
$
|
|
|
$
|
|
|
|||
|
Weighted average grant-date fair value of shares vested (thousands)
|
$
|
|
|
$
|
|
|
$
|
|
|
|||
The number of vested restricted stock units at
December 31, 2019
and
2018
was
1,483
and
1,460
, respectively. At
December 31, 2019
, the Company has
$
2,458
of unvested compensation cost related to restricted stock units and this cost will be recognized as expense over a weighted average period of
25
months
.
Performance Stock Units
Compensation related to the performance stock units is determined based on the fair value of the Company’s stock on the date of grant combined with performance metrics. The Company recognizes compensation expense based on the earlier of the vesting date or the date when the employee becomes eligible to retire, and in accordance with the achievement of the underlying performance condition.
-
71
-
The following table provides details of the nonvested performance stock units earned under the Company’s Long-Term Incentive Plan:
|
Number of
Performance
Units
|
Weighted
Average Grant-
Date Fair Value
(per share)
|
Aggregate
Intrinsic
Value
(thousands)
|
|||||||||
|
Nonvested at December 31, 2018
|
|
|
$
|
|
|
||||||
|
Earned
|
|
|
|
|
|||||||
|
Vested
|
(
|
)
|
|
|
|||||||
|
Canceled
|
(
|
)
|
|
|
|||||||
|
Accrued dividend equivalents
|
|
|
|
|
|||||||
|
Nonvested at December 31, 2019
|
|
|
$
|
|
|
||||||
|
Vested but not released
|
|
|
$
|
|
|
||||||
|
Outstanding at December 31, 2019
|
|
|
$
|
|
|
$
|
|
|
|||
|
Weighted-average remaining contractual term of performance stock units outstanding (months)
|
|
|
|||||||||
|
|
Year ended December 31,
|
|||||||||||
|
2019
|
2018
|
2017
|
||||||||||
|
Weighted average grant-date fair value of performance stock units granted (per share)
|
$
|
|
|
$
|
|
|
$
|
|
|
|||
|
Weighted average grant-date fair value of performance stock units vested (thousands)
|
$
|
|
|
$
|
|
|
$
|
|
|
|||
At
December 31, 2019
, the Company had
$
763
of unvested compensation cost related to performance stock units and this cost will be recognized as expense over a weighted average period of
19
months
.
The Company’s nonvested restricted stock units and performance stock units are not participating securities. These units will be converted into shares of Company common stock in accordance with the distribution date indicated in the agreements. Restricted stock units earn dividend equivalents from the time of the award until distribution is made in common shares. Performance stock units earn dividend equivalents from the time the units have been earned based upon Company performance metrics until distribution is made in common shares. Dividend equivalents are only earned subject to vesting of the underlying restricted stock units or performance stock units. Accordingly, such units do not represent participating securities.
At
December 31, 2019
, the company had
2,138,910
shares available for future issuance under equity compensation plans.
-
72
-
|
Note 15
.
|
Changes in Accumulated Other Comprehensive Income (Loss) by Component
|
The following tables provide a quarterly reconciliation of each component of accumulated other comprehensive (loss) income in the accompanying Consolidated Statements of Equity for the year to date as of
December 31, 2019
and
2018
:
|
Cumulative Translation Adjustment
|
Derivative Instruments
|
Post- retirement Benefits
|
Total
|
||||||||||||
|
Ending Balance, December 31, 2018
|
$
|
(
|
)
|
$
|
|
|
$
|
(
|
)
|
$
|
(
|
)
|
|||
|
Other comprehensive income (loss) before reclassifications
|
|
|
(
|
)
|
(
|
)
|
(
|
)
|
|||||||
|
Foreign currency translation effect
|
—
|
|
—
|
|
(
|
)
|
(
|
)
|
|||||||
|
Income tax effect
|
—
|
|
|
|
—
|
|
|
|
|||||||
|
Amount reclassified from accumulated other comprehensive (loss) income
|
|
|
|
|
|||||||||||
|
Cash flow hedges
|
—
|
|
(
|
)
|
—
|
|
(
|
)
|
|||||||
|
Amortization of prior service cost
|
—
|
|
—
|
|
|
|
|
|
|||||||
|
Amortization of actuarial losses
|
—
|
|
—
|
|
|
|
|
|
|||||||
|
Pension settlement charge
|
—
|
|
—
|
|
|
|
|
|
|||||||
|
Prior service effect of plan amendment
|
—
|
|
—
|
|
(
|
)
|
(
|
)
|
|||||||
|
Income tax effect
|
—
|
|
|
|
(
|
)
|
(
|
)
|
|||||||
|
Other comprehensive income (loss)
|
|
|
(
|
)
|
|
|
|
|
|||||||
|
Ending Balance, December 31, 2019
|
$
|
(
|
)
|
$
|
(
|
)
|
$
|
(
|
)
|
$
|
(
|
)
|
|||
|
Cumulative Translation Adjustment
|
Derivative Instruments
|
Post- retirement Benefits
|
Total
|
||||||||||||
|
Ending Balance, December 31, 2017
|
$
|
(
|
)
|
$
|
|
|
$
|
(
|
)
|
$
|
(
|
)
|
|||
|
Other comprehensive (loss) income before reclassifications
|
(
|
)
|
|
|
|
|
(
|
)
|
|||||||
|
Foreign currency translation effect
|
—
|
|
—
|
|
(
|
)
|
(
|
)
|
|||||||
|
Income tax effect
|
—
|
|
(
|
)
|
(
|
)
|
(
|
)
|
|||||||
|
Amount reclassified from accumulated other comprehensive (loss) income
|
|
|
|
||||||||||||
|
Cash flow hedges
|
—
|
|
(
|
)
|
—
|
|
(
|
)
|
|||||||
|
Amortization of prior service credit
|
—
|
|
—
|
|
(
|
)
|
(
|
)
|
|||||||
|
Amortization of actuarial losses
|
—
|
|
—
|
|
|
|
|
|
|||||||
|
Prior service effect of plan amendment
|
—
|
|
—
|
|
(
|
)
|
(
|
)
|
|||||||
|
Income tax effect
|
—
|
|
|
|
(
|
)
|
(
|
)
|
|||||||
|
Other comprehensive (loss) income
|
(
|
)
|
|
|
|
|
|
|
|||||||
|
Ending Balance, December 31, 2018
|
$
|
(
|
)
|
$
|
|
|
$
|
(
|
)
|
$
|
(
|
)
|
|||
|
Note 16
.
|
Comprehensive Income (Loss) Attributable to Noncontrolling Shareholders’ Interests
|
The following table provides the details of the comprehensive income (loss) attributable to noncontrolling shareholders' interests:
|
Twelve Months Ended December 31,
|
||||||||||||
|
2019
|
2018
|
2017
|
||||||||||
|
Net income attributable to noncontrolling shareholders’ interests
|
$
|
|
|
$
|
|
|
$
|
|
|
|||
|
Other comprehensive income (loss):
|
||||||||||||
|
Currency translation adjustments
|
|
|
(
|
)
|
|
|
||||||
|
Comprehensive income attributable to noncontrolling shareholders’ interests
|
$
|
|
|
$
|
|
|
$
|
|
|
|||
-
73
-
|
Note 17
.
|
Contingent Liabilities
|
Product Liability Claims
The Company is a defendant in various product liability claims brought in numerous jurisdictions in which individuals seek damages resulting from motor vehicle accidents allegedly caused by defective tires manufactured by the Company. Each of the product liability claims faced by the Company generally involves different types of tires and circumstances surrounding the accident such as different applications, vehicles, speeds, road conditions, weather conditions, driver error, tire repair and maintenance practices, service life conditions, as well as different jurisdictions and different injuries. In addition, in many of the Company’s product liability lawsuits the plaintiff alleges that his or her harm was caused by one or more co-defendants who acted independently of the Company. Accordingly, both the claims asserted and the resolutions of those claims have an enormous amount of variability. The aggregate amount of damages asserted at any point in time is not determinable since often times when claims are filed, the plaintiffs do not specify the amount of damages. Even when there is an amount alleged, at times the amount is wildly inflated and has no rational basis.
The fact that the Company is a defendant in product liability lawsuits is not surprising given the current litigation climate, which is largely confined to the United States. However, the fact that the Company is subject to claims does not indicate that there is a quality issue with the Company’s tires. The Company sells approximately
30
to
35
million
passenger car, light truck, CUV, SUV, TBR and motorcycle tires per year in North America. The Company estimates that approximately
300
million
Company-produced tires made up of thousands of different specifications are still on the road in North America. While tire disablements do occur, it is the Company’s and the tire industry’s experience that the vast majority of tire failures relate to service-related conditions, which are entirely out of the Company’s control, such as failure to maintain proper tire pressure, improper maintenance, improper repairs, road hazard and excessive speed.
The Company accrues costs for product liability at the time a loss is probable and the amount of loss can be estimated. The Company believes the probability of loss can be established and the amount of loss can be estimated only after certain minimum information is available, including verification that Company-produced product were involved in the incident giving rise to the claim, the condition of the product purported to be involved in the claim, the nature of the incident giving rise to the claim and the extent of the purported injury or damages. In cases where such information is known, each product liability claim is evaluated based on its specific facts and circumstances. A judgment is then made to determine the requirement for establishment or revision of an accrual for any potential liability. Adjustments to estimated reserves are recorded in the period in which the change in estimate occurs. The liability often cannot be determined with precision until the claim is resolved.
Pursuant to ASC 450 "Contingencies," the Company accrues the minimum liability for each known claim when the estimated outcome is a range of probable loss and no one amount within that range is more likely than another. The Company uses a range of losses because an average cost would not be meaningful since the product liability claims faced by the Company are unique and widely variable, and accordingly, the resolutions of those claims have an enormous amount of variability. The costs have ranged from
zero
dollars to
$
33
million
in one case with no “average” that is meaningful. No specific accrual is made for individual unasserted claims or for premature claims, asserted claims where the minimum information needed to evaluate the probability of a liability is not yet known. However, an accrual for such claims based, in part, on management’s expectations for future litigation activity and the settled claims history is maintained. The Company periodically reviews such estimates and any adjustments for changes in reserves are recorded in the period in which the change in estimate occurs. Because of the speculative nature of litigation in the U.S., the Company does not believe a meaningful aggregate range of potential loss for asserted and unasserted claims can be determined. While the Company believes its reserves are reasonably stated, it is possible an individual claim from time to time may result in an aberration from the norm and could have a material impact.
The time frame for the payment of a product liability claim is too variable to be meaningful. From the time a claim is filed to its ultimate disposition depends on the unique nature of the case, how it is resolved - claim dismissed, negotiated settlement, trial verdict or appeals process - and is highly dependent on jurisdiction, specific facts, the plaintiff’s attorney, the court’s docket and other factors. Given that some claims may be resolved in weeks and others may take five years or more, it is impossible to predict with any reasonable reliability the time frame over which the accrued amounts may be paid.
The Company regularly reviews the probable outcome of outstanding legal proceedings and the availability and limits of the insurance coverage, and accrues for such legal proceedings at the time a loss is probable and the amount of the loss can be estimated. As part of its regular review, the Company monitors trends that may affect its ultimate liability and analyzes the developments and variables likely to affect pending and anticipated claims against the Company and the reserves for such claims. The Company utilizes claims experience, as well as trends and developments in the litigation climate, in estimating its required accrual. Based on the Company's quarterly reviews, coupled with normal activity, including the addition of another quarter of self-insured incidents, settlements and changes in the amount of reserves, the Company increased its accrual to
$
117,219
at
December 31, 2019
from
$
112,124
at December 31, 2018.
For the year ended
December 31, 2019
, the addition of another
twelve
months of self-insured incidents accounted for an
increase
of
$
37,279
in the Company's product liability reserve. Settlements, changes in the amount of reserves for cases where
-
74
-
sufficient information is known to estimate a liability, and changes in assumptions
decreased
the liability by
$
8,272
for the
twelve months
ended
December 31, 2019
. The Company paid
$
24,020
during 2019 to resolve cases and claims.
The Company’s product liability reserve balance at
December 31, 2019
totaled
$
117,219
(the current portion of
$
25,366
is included in Accrued liabilities and the long-term portion is included in Other long-term liabilities on the
Consolidated Balance Sheets
), and the balance at
December 31, 2018
totaled
$
112,124
(current portion of
$
30,550
).
The product liability expense reported by the Company includes amortization of insurance premium costs, adjustments to settlement reserves and legal costs incurred in defending claims against the Company. Legal costs are expensed as incurred and product liability insurance premiums are amortized over coverage periods.
Product liability expenses are included in Cost of products sold in the
Consolidated Statements of Income
.
For the
twelve months
ended
December 31, 2019
and
2018
, respectively, product liability expense was as follows:
|
Twelve Months Ended December 31,
|
||||||||||||
|
2019
|
2018
|
2017
|
||||||||||
|
Product liability expense
|
$
|
|
|
$
|
|
|
$
|
|
|
|||
Other Litigation
In addition to the proceedings described above, the Company is involved in various other legal proceedings arising in the ordinary course of business. The Company regularly reviews the probable outcome of these proceedings, the expenses expected to be incurred, the availability and limits of the insurance coverage, and accrues for these proceedings at the time a loss is probable and the amount of the loss can be estimated. Although the outcome of these pending proceedings cannot be predicted with certainty and an estimate of any such loss cannot be made, the Company believes that any liabilities that may result from these proceedings are not reasonably likely to have a material adverse effect on the Company’s liquidity, financial condition or results of operations.
Employment Contracts and Agreements
No executives have employment agreements as of
December 31, 2019
. The Executive Officers and certain other employees are covered by the Cooper Tire & Rubber Company Change in Control Severance Pay Plan.
At
December 31, 2019
, approximately
38
percent
of the Company’s workforce was represented by collective bargaining units.
|
Note 18
.
|
Business Segments
|
The Company has
four
segments under ASC 280, "Segments":
|
•
|
North America, composed of the Company’s operations in the United States and Canada;
|
|
•
|
Latin America, composed of the Company’s operations in Mexico, Central America and South America;
|
|
•
|
Europe; and
|
|
•
|
Asia.
|
North America and Latin America meet the criteria for aggregation in accordance with ASC 280, as they are similar in their production and distribution processes and exhibit similar economic characteristics. The aggregated North America and Latin America segments are presented as “Americas Tire Operations” in the segment disclosure.
The Americas Tire Operations segment manufactures and markets passenger car and light truck tires, primarily for sale in the U.S. replacement market. The segment also has a joint venture manufacturing operation in Mexico,
COOCSA,
which supplies passenger car and light truck tires to the Mexican, North American, Central American and South American markets. On January 24, 2020, the Company acquired the remaining 42 percent noncontrolling ownership interest in COOCSA, making COOCSA a wholly-owned subsidiary. The segment also markets and distributes racing, TBR and motorcycle tires. The racing and motorcycle tires are manufactured by the Company’s European segment and by others. TBR tires are sourced from
GRT
and through off-take agreements
with PCT, through mid-2021, and Sailun Vietnam, through December 31, 2020. On April 5, 2019, Cooper Vietnam
and Sailun Vietnam established a joint venture in Vietnam, ACTR, which will produce and sell TBR tires. The new joint venture is expected to begin commercially producing tires in 2020.
Major distribution channels and customers include independent tire dealers, wholesale distributors, regional and national retail tire chains, large retail chains that sell tires as well as other automotive products, mass merchandisers and digital channels. The segment does not currently sell its products directly to end users, except through
three
Company-owned retail stores. The segment sells a limited number of tires to OEMs.
-
75
-
Both the Europe and Asia segments have been determined to be individually immaterial, as they do not meet the quantitative requirements for segment disclosure under ASC 280. In accordance with ASC 280, information about operating segments that are not reportable shall be combined and disclosed in an all other category separate from other reconciling items. As a result, these
two
segments have been combined in the segment operating results discussion. The results of the combined Europe and Asia segments are presented as “International Tire Operations.” The European operations include manufacturing operations in the U.K. and Serbia.
The U.K. entity manufactures and markets motorcycle and racing tires and tire retread material for domestic and global markets. The Serbian entity manufactures passenger car and light truck tires primarily for the European markets and for export to the North American segment.
The Asian operations are located in the PRC and Vietnam.
Cooper Kunshan Tire manufactures passenger car and light truck tires both for the Chinese domestic market and for export to markets outside of the PRC. GRT, a joint venture manufacturing facility located in the PRC, serves as a global source of TBR tire production for the Company. The segment also procures certain TBR tires under off-take agreements with PCT, through mid-2021, and Sailun Vietnam, through December 31, 2020.
On April 5, 2019, Cooper Vietnam
and Sailun Vietnam established a joint venture in Vietnam, ACTR, which will produce and sell TBR tires in addition to the off-take agreement. The new joint venture is expected to begin commercially producing tires in 2020.
The segment sells a majority of its tires in the replacement market, with a portion also sold to OEMs.
On January 17, 2019, Cooper Tire Europe, a wholly owned subsidiary of the Company, committed to a plan to cease light vehicle tire production at its Melksham, U.K. facility. The phasing out of light vehicle tire production was substantially completed in the third quarter of 2019. Approximately
300
roles were eliminated at the site. Cooper Tire Europe now obtains light vehicle tires to meet customer needs from other production sites within the Company’s global production network. Approximately
400
roles remain in Melksham to support the functions that continue there, including motorsports and motorcycle tire production, a materials business, Cooper Tire Europe headquarters, sales and marketing, and the Europe Technical Center.
-
76
-
The following table details segment financial information:
|
Twelve Months Ended December 31,
|
||||||||||||
|
2019
|
2018
|
2017
|
||||||||||
|
Net sales:
|
||||||||||||
|
Americas Tire
|
||||||||||||
|
External customers
|
$
|
|
|
$
|
|
|
$
|
|
|
|||
|
Intercompany
|
|
|
|
|
|
|
||||||
|
|
|
|
|
|
|
|||||||
|
International Tire
|
||||||||||||
|
External customers
|
|
|
|
|
|
|
||||||
|
Intercompany
|
|
|
|
|
|
|
||||||
|
|
|
|
|
|
|
|||||||
|
Eliminations
|
(
|
)
|
(
|
)
|
(
|
)
|
||||||
|
Consolidated net sales
|
|
|
|
|
|
|
||||||
|
Operating profit (loss):
|
||||||||||||
|
Americas Tire
|
|
|
|
|
|
|
||||||
|
International Tire
|
(
|
)
|
(
|
)
|
|
|
||||||
|
Unallocated corporate charges
|
(
|
)
|
(
|
)
|
(
|
)
|
||||||
|
Eliminations
|
|
|
|
|
(
|
)
|
||||||
|
Consolidated operating profit
|
|
|
|
|
|
|
||||||
|
Interest expense
|
(
|
)
|
(
|
)
|
(
|
)
|
||||||
|
Interest income
|
|
|
|
|
|
|
||||||
|
Other pension and postretirement benefit expense
|
(
|
)
|
(
|
)
|
(
|
)
|
||||||
|
Other non-operating expense
|
(
|
)
|
(
|
)
|
(
|
)
|
||||||
|
Income before income taxes
|
$
|
|
|
$
|
|
|
|
|
||||
|
Depreciation and amortization expense:
|
||||||||||||
|
Americas Tire
|
|
|
|
|
|
|
||||||
|
International Tire
|
|
|
|
|
|
|
||||||
|
Corporate
|
|
|
|
|
|
|
||||||
|
Consolidated depreciation and amortization expense
|
|
|
|
|
|
|
||||||
|
Segment assets:
|
||||||||||||
|
Americas Tire
|
|
|
|
|
|
|
||||||
|
International Tire
|
|
|
|
|
|
|
||||||
|
Corporate and other
|
|
|
|
|
|
|
||||||
|
Consolidated assets
|
|
|
|
|
|
|
||||||
|
Expenditures for long-lived assets:
|
||||||||||||
|
Americas Tire
|
|
|
|
|
|
|
||||||
|
International Tire
|
|
|
|
|
|
|
||||||
|
Corporate
|
|
|
|
|
(
|
)
|
||||||
|
Consolidated expenditures for long-lived assets
|
|
|
|
|
|
|
||||||
-
77
-
Geographic information for long-lived assets follows:
|
As of December 31,
|
||||||||||||
|
2019
|
2018
|
2017
|
||||||||||
|
Net sales
|
||||||||||||
|
United States
|
$
|
|
|
$
|
|
|
$
|
|
|
|||
|
Rest of world
|
|
|
|
|
|
|
||||||
|
Consolidated net sales
|
|
|
|
|
|
|
||||||
|
Long-lived assets
(a)
|
||||||||||||
|
United States
|
|
|
|
|
|
|
||||||
|
PRC
|
|
|
|
|
|
|
||||||
|
Rest of world
|
|
|
|
|
|
|
||||||
|
Consolidated long-lived assets
|
|
|
|
|
|
|
||||||
The following customers of the Americas Tire Operations segment contributed ten percent or more of the Company’s total consolidated net sales in
2019
,
2018
or
2017
.
Net sales and percentage of consolidated Company sales for these customers in
2019
,
2018
and
2017
were as follows:
|
|
2019
|
2018
|
2017
|
||||||||||||||||||
|
Customer
|
Net Sales
|
Consolidated
Net Sales
|
Net Sales
|
Consolidated
Net Sales
|
Net Sales
|
Consolidated
Net Sales
|
|||||||||||||||
|
American Tire Distributors, Inc.
|
$
|
|
|
|
%
|
$
|
|
|
|
%
|
$
|
|
|
|
%
|
||||||
|
TBC/Treadways
|
$
|
|
|
|
%
|
$
|
|
|
|
%
|
$
|
|
|
|
%
|
||||||
|
Note 19
.
|
Subsequent Events
|
-
78
-
Report of Independent Registered Public Accounting Firm
To the Shareholders and the Board of Directors of Cooper Tire & Rubber Company
Opinion on the Financial Statements
We have audited the accompanying consolidated balance sheets of Cooper Tire & Rubber Company (the Company) as of December 31, 2019 and 2018, the related consolidated statements of income, comprehensive income, equity and cash flows for each of the three years in the period ended December 31, 2019, and the related notes and financial statement schedules listed in the Index at Item 15(a)(2) (collectively referred to as the "consolidated financial statements"). In our opinion, the consolidated financial statements present fairly, in all material respects, the financial position of the Company at December 31, 2019 and 2018, and the results of its operations and its cash flows for each of the three years in the period ended December 31, 2019, in conformity with U.S. generally accepted accounting principles.
We also have audited, in accordance with the standards of the Public Company Accounting Oversight Board (United States) (PCAOB), the Company’s internal control over financial reporting as of December 31, 2019, based on criteria established in Internal Control-Integrated Framework issued by the Committee of Sponsoring Organizations of the Treadway Commission (2013 framework) and our report dated February 24, 2020 expressed an unqualified opinion thereon.
Basis for Opinion
These financial statements are the responsibility of the Company‘s management. Our responsibility is to express an opinion on the Company‘s financial statements based on our audits. We are a public accounting firm registered with the PCAOB and are required to be independent with respect to the Company in accordance with the U.S. federal securities laws and the applicable rules and regulations of the Securities and Exchange Commission and the PCAOB.
Critical Audit Matter
The critical audit matter communicated below is a matter arising from the current period audit of the consolidated financial statements that was communicated or required to be communicated to the audit committee and that: (1) relates to accounts or disclosures that are material to the consolidated financial statements and (2) involved especially challenging, subjective, or complex judgments. The communication of the critical audit matter does not alter in any way our opinion on the consolidated financial statements, taken as a whole, and we are not, by communicating the critical audit matter below, providing a separate opinion on the critical audit matter or on the accounts or disclosures to which it relates.
|
Product liability
|
|
|
Description of the matter
|
As described in Notes 1 and 17, the Company is a defendant in various product liability claims brought in numerous jurisdictions in which individuals seek damages resulting from motor vehicle accidents allegedly caused by defective tires manufactured by the Company. The Company accrues costs for product liability at the time a loss is probable and the amount of loss can be estimated. Each product liability claim is evaluated based on its specific facts and circumstances, and a judgment is then made to determine the requirement for establishment or revision of an accrual for any potential liability. An accrual for unasserted claims or for premature claims is based, in part, on management’s expectations for future litigation activity and the settled claims history. The Company periodically reviews such estimates, and any adjustments for changes in reserves are recorded in the period in which the change in estimate occurs. At December 31, 2019, the Company’s product liability reserve balance totaled $117 million.
|
|
Auditing management’s estimate of loss contingencies arising from product liability claims was complex and included evaluating the likelihood and amount of loss for asserted and unasserted claims, which are subjective and require significant judgment.
|
|
-
79
-
|
How we addressed the matter in our audit
|
We evaluated the design and tested the operating effectiveness of internal controls over the Company’s identification and evaluation of product liability claims, including the reserve on unasserted claims, including management’s review of the estimation model used to establish the best estimate of the required reserve, and the data inputs used in the estimation model.
|
|
Our audit procedures to test the adequacy and completeness of management’s assessment of the probability of loss included, among others, reviews of legal correspondence related to claims identified by management, reviews of confirmation letters obtained from internal and external legal counsel, inquiries of internal and external legal counsel to discuss asserted and known unasserted claims, and review of written representations obtained from the Company. In order to test the measurement of the product liability litigation reserve, we evaluated the Company’s estimation model used to establish the reserve for claims, asserted and unasserted, and tested the accuracy and completeness of the data used in management’s estimation model. In addition, we performed sensitivity analyses over management’s estimated range of losses in order to evaluate the magnitude of potential impact on the liability resulting from changes in assumptions. Lastly, we assessed the competency of management’s estimation model by performing hindsight analyses to assess the adequacy of prior estimates.
|
|
|
/s/ Ernst & Young LLP
|
|
We have served as the Company’s auditor since 1942.
|
|
Toledo, Ohio
|
|
February 24, 2020
|
-
80
-
|
SELECTED QUARTERLY DATA
|
|
(Unaudited)
|
|
(Dollar amounts in thousands except per share amounts.)
|
|
|
|
|
2019
|
|||||||||||||||
|
First
Quarter
|
Second
Quarter
|
Third
Quarter
|
Fourth
Quarter (a)
|
|||||||||||||
|
Net sales
|
$
|
|
|
$
|
|
|
$
|
|
|
$
|
|
|
||||
|
Gross profit
|
|
|
|
|
|
|
|
|
||||||||
|
Net income attributable to Cooper Tire & Rubber Company
|
|
|
|
|
|
|
|
|
||||||||
|
Earnings per share:
|
||||||||||||||||
|
Basic
|
|
|
|
|
|
|
|
|
||||||||
|
Diluted
|
|
|
|
|
|
|
|
|
||||||||
|
Net sales:
|
||||||||||||||||
|
Americas Tire
|
$
|
|
|
$
|
|
|
$
|
|
|
$
|
|
|
||||
|
International Tire
|
|
|
|
|
|
|
|
|
||||||||
|
Eliminations
|
(
|
)
|
(
|
)
|
(
|
)
|
(
|
)
|
||||||||
|
Consolidated net sales
|
$
|
|
|
$
|
|
|
$
|
|
|
$
|
|
|
||||
|
Operating profit (loss):
|
||||||||||||||||
|
Americas Tire
|
$
|
|
|
$
|
|
|
$
|
|
|
$
|
|
|
||||
|
International Tire
|
(
|
)
|
(
|
)
|
(
|
)
|
(
|
)
|
||||||||
|
Unallocated corporate charges
|
(
|
)
|
(
|
)
|
(
|
)
|
(
|
)
|
||||||||
|
Eliminations
|
(
|
)
|
(
|
)
|
|
|
|
|
||||||||
|
Consolidated operating profit
|
|
|
|
|
|
|
|
|
||||||||
|
Interest expense
|
(
|
)
|
(
|
)
|
(
|
)
|
(
|
)
|
||||||||
|
Interest income
|
|
|
|
|
|
|
|
|
||||||||
|
Other pension and postretirement benefit expense
|
(
|
)
|
(
|
)
|
(
|
)
|
(
|
)
|
||||||||
|
Other non-operating income (expense)
|
|
|
(
|
)
|
(
|
)
|
(
|
)
|
||||||||
|
Income before income taxes
|
$
|
|
|
$
|
|
|
$
|
|
|
$
|
|
|
||||
|
Net income
|
$
|
|
|
$
|
|
|
$
|
|
|
$
|
|
|
||||
|
Net income attributable to Cooper Tire & Rubber Company
|
$
|
|
|
$
|
|
|
$
|
|
|
$
|
|
|
||||
Basic and diluted earnings per share are computed independently for each quarter presented. Therefore, the sum of quarterly basic and diluted per share information may not equal annual basic and diluted earnings per share.
Each quarter's financial data is recorded here as disclosed in its respective 10-Q report. Therefore, the sum of quarterly information here may not equal the annual financial statement amounts due to rounding.
|
(a)
|
In the fourth quarter, the Company recorded an income tax benefit of
$
|
-
81
-
|
|
(Unaudited)
|
|
|
|
2018
|
|||||||||||||||
|
First
Quarter
|
Second
Quarter
|
Third
Quarter
|
Fourth
Quarter (a)
|
|||||||||||||
|
Net sales
|
$
|
|
|
$
|
|
|
$
|
|
|
$
|
|
|
||||
|
Gross profit
|
|
|
|
|
|
|
|
|
||||||||
|
Net income (loss) attributable to Cooper Tire & Rubber Company
|
|
|
|
|
|
|
(
|
)
|
||||||||
|
Earnings per share:
|
||||||||||||||||
|
Basic
|
|
|
|
|
|
|
(
|
)
|
||||||||
|
Diluted
|
|
|
|
|
|
|
(
|
)
|
||||||||
|
Net sales:
|
||||||||||||||||
|
Americas Tire
|
$
|
|
|
$
|
|
|
$
|
|
|
$
|
|
|
||||
|
International Tire
|
|
|
|
|
|
|
|
|
||||||||
|
Eliminations
|
(
|
)
|
(
|
)
|
(
|
)
|
(
|
)
|
||||||||
|
Consolidated net sales
|
$
|
|
|
$
|
|
|
$
|
|
|
$
|
|
|
||||
|
Operating profit (loss):
|
||||||||||||||||
|
Americas Tire
|
$
|
|
|
$
|
|
|
$
|
|
|
$
|
|
|
||||
|
International Tire
|
|
|
|
|
|
|
(
|
)
|
||||||||
|
Unallocated corporate charges (b)
|
(
|
)
|
(
|
)
|
(
|
)
|
(
|
)
|
||||||||
|
Eliminations
|
(
|
)
|
|
|
|
|
|
|
||||||||
|
Consolidated operating profit
|
|
|
|
|
|
|
|
|
||||||||
|
Interest expense
|
(
|
)
|
(
|
)
|
(
|
)
|
(
|
)
|
||||||||
|
Interest income
|
|
|
|
|
|
|
|
|
||||||||
|
Other pension and postretirement benefit expense
(b)
|
(
|
)
|
(
|
)
|
(
|
)
|
(
|
)
|
||||||||
|
Other non-operating (loss) income
|
(
|
)
|
(
|
)
|
|
|
(
|
)
|
||||||||
|
Income before income taxes
|
$
|
|
|
$
|
|
|
$
|
|
|
$
|
|
|
||||
|
Net income
|
$
|
|
|
$
|
|
|
$
|
|
|
$
|
|
|
||||
|
Net income (loss) attributable to Cooper Tire & Rubber Company
|
$
|
|
|
$
|
|
|
$
|
|
|
$
|
(
|
)
|
||||
Basic and diluted earnings (loss) per share are computed independently for each quarter presented. Therefore, the sum of quarterly basic and diluted per share information may not equal annual basic and diluted earnings per share.
Each quarter's financial data is recorded here as disclosed in its respective 10-Q report. Therefore, the sum of quarterly information here may not equal the annual financial statement amounts due to rounding.
|
(a)
|
In the fourth quarter, the Company recorded a non-cash goodwill impairment charge of
$
|
-
82
-
COOPER TIRE & RUBBER COMPANY
SCHEDULE II - VALUATION AND QUALIFYING ACCOUNTS
Years Ended
December 31, 2019
,
2018
and
2017
|
(Dollar amounts in thousands)
|
|
Additions
|
|
|
|
|||||||||||||||||||||
|
Balance at
Beginning of
Year
|
Charged to
Income
|
Charged to Equity
|
Acquisition of Business
|
Deductions
|
|
Balance at
End of Year
|
||||||||||||||||||||
|
Year Ended December 31, 2017
|
||||||||||||||||||||||||||
|
Allowance for doubtful accounts
|
$
|
|
|
$
|
|
|
$
|
|
|
$
|
|
|
$
|
|
|
(a)
|
$
|
|
|
|||||||
|
Tax valuation allowance
|
$
|
|
|
$
|
|
|
$
|
(
|
)
|
$
|
(
|
)
|
$
|
|
|
(b)
|
$
|
|
|
|||||||
|
Year Ended December 31, 2018
|
||||||||||||||||||||||||||
|
Allowance for doubtful accounts
|
$
|
|
|
$
|
|
|
$
|
|
|
$
|
|
|
$
|
|
|
(a)
|
$
|
|
|
|||||||
|
Tax valuation allowance
|
$
|
|
|
$
|
|
|
$
|
|
|
$
|
|
|
$
|
|
|
(b)
|
$
|
|
|
|||||||
|
Year Ended December 31, 2019
|
||||||||||||||||||||||||||
|
Allowance for doubtful accounts
|
$
|
|
|
$
|
|
|
$
|
|
|
$
|
|
|
$
|
|
|
(a)
|
$
|
|
|
|||||||
|
Tax valuation allowance
|
$
|
|
|
$
|
|
|
$
|
(
|
)
|
$
|
|
|
$
|
|
|
(b)
|
$
|
|
|
|||||||
|
(a)
|
Accounts written off during the year, net of recoveries of accounts previously written off.
|
|
(b)
|
Net increase in tax valuation allowance is primarily the result of a net increase in unbenefitted losses.
|
|
Item 9.
|
CHANGES IN AND DISAGREEMENTS WITH ACCOUNTANTS ON ACCOUNTING AND FINANCIAL DISCLOSURE
|
None.
|
Item 9A
.
|
CONTROLS AND PROCEDURES
|
(a) Evaluation of Disclosure Controls and Procedures
The Company maintains disclosure controls and procedures designed to ensure that information required to be disclosed in the reports the Company files or submits as defined in Rule 13a-15(e) of the Securities and Exchange Act of 1934 (“Exchange Act”), as amended, is recorded, processed, summarized and reported within the time periods specified in the SEC rules and forms, and that such information is accumulated and communicated to the Chief Executive Officer (“CEO”) and Chief Financial Officer (“CFO”) to allow timely decisions regarding required disclosures.
The Company, under the supervision and with the participation of management, including the CEO and CFO, evaluated the effectiveness of the design and operation of its disclosure controls and procedures (as defined in Rule 13a-15(e) under the Securities Exchange Act of 1934 as of
December 31, 2019
(“Evaluation Date”)). Based on its initial evaluation, the Company's CEO and CFO concluded that its disclosure controls and procedures were effective as of the Evaluation Date.
(b) Management’s Annual Report on Internal Control Over Financial Reporting
Management is responsible for establishing and maintaining adequate internal control over financial reporting for the Company. In order to evaluate the effectiveness of internal control over financial reporting, as required by Section 404 of the Sarbanes-Oxley Act of 2002, management conducted an assessment, including testing, using the criteria in
Internal Control – Integrated Framework (2013 framework),
issued by the Committee of Sponsoring Organizations of the Treadway Commission (“COSO”) as of
December 31, 2019
. The Company’s system of internal control over financial reporting is designed to provide reasonable assurance regarding the reliability of financial reporting and the preparation of financial statements for external purposes in accordance with generally accepted accounting principles. Because of its inherent limitations, internal control over financial reporting may not prevent or detect misstatements. Also, projections of any evaluation of effectiveness to future periods are subject to the risk that controls may become inadequate because of changes in conditions, or that the degree of compliance with the policies or procedures may deteriorate.
Based on its assessment, management concluded that the Company maintained effective internal control over financial reporting as of
December 31, 2019
, based on criteria in
Internal Control – Integrated Framework (2013)
issued by the COSO, and that the Company’s internal control over financial reporting was effective.
-
83
-
Ernst & Young LLP, the independent registered public accounting firm that has audited the Company’s consolidated financial statements included in this annual report, has issued its report on the effectiveness of the Company’s internal controls over financial reporting as of
December 31, 2019
.
(c) Report of Independent Registered Public Accounting Firm
To the Shareholders and the Board of Directors of Cooper Tire & Rubber Company
Opinion on Internal Control over Financial Reporting
We have audited Cooper Tire & Rubber Company’s internal control over financial reporting as of December 31, 2019, based on criteria established in Internal Control - Integrated Framework issued by the Committee of Sponsoring Organizations of the Treadway Commission (2013 framework) (the COSO criteria). In our opinion, Cooper Tire & Rubber Company (the Company) maintained, in all material respects, effective internal control over financial reporting as of December 31, 2019, based on the COSO criteria.
We also have audited, in accordance with the standards of the Public Company Accounting Oversight Board (United States) (PCAOB), the consolidated balance sheets of the Company as of December 31, 2019 and 2018, the related consolidated statements of income, comprehensive income, equity, and cash flows for each of the three years in the period ended December 31, 2019, and the related notes and financial statement schedule listed in the Index at Item 15(a)(2) and our report dated February 24, 2020 expressed an unqualified opinion thereon.
Basis for Opinion
The Company’s management is responsible for maintaining effective internal control over financial reporting and for its assessment of the effectiveness of internal control over financial reporting included in the accompanying Management’s Report on Internal Control over Financial Reporting. Our responsibility is to express an opinion on the Company’s internal control over financial reporting based on our audit. We are a public accounting firm registered with the PCAOB and are required to be independent with respect to the Company in accordance with the U.S. federal securities laws and the applicable rules and regulations of the Securities and Exchange Commission and the PCAOB.
We conducted our audit in accordance with the standards of the PCAOB. Those standards require that we plan and perform the audit to obtain reasonable assurance about whether effective internal control over financial reporting was maintained in all material respects.
Our audit included obtaining an understanding of internal control over financial reporting, assessing the risk that a material weakness exists, testing and evaluating the design and operating effectiveness of internal control based on the assessed risk, and performing such other procedures as we considered necessary in the circumstances. We believe that our audit provides a reasonable basis for our opinion.
Definitions and Limitations of Internal Control over Financial Reporting
A company’s internal control over financial reporting is a process designed to provide reasonable assurance regarding the reliability of financial reporting and the preparation of financial statements for external purposes in accordance with generally accepted accounting principles. A company’s internal control over financial reporting includes those policies and procedures that (1) pertain to the maintenance of records that, in reasonable detail, accurately and fairly reflect the transactions and dispositions of the assets of the company; (2) provide reasonable assurance that transactions are recorded as necessary to permit preparation of financial statements in accordance with generally accepted accounting principles, and that receipts and expenditures of the company are being made only in accordance with authorizations of management and directors of the company; and (3) provide reasonable assurance regarding prevention or timely detection of unauthorized acquisition, use, or disposition of the company’s assets that could have a material effect on the financial statements.
Because of its inherent limitations, internal control over financial reporting may not prevent or detect misstatements. Also, projections of any evaluation of effectiveness to future periods are subject to the risk that controls may become inadequate because of changes in conditions, or that the degree of compliance with the policies or procedures may deteriorate.
-
84
-
|
/s/ Ernst & Young LLP
|
|
Toledo, Ohio
|
|
February 24, 2020
|
(d) Changes in Internal Control over Financial Reporting
There were no changes in the Company’s internal control over financial reporting that occurred during the fourth quarter of
2019
that have materially affected, or are reasonably likely to materially affect, its internal control over financial reporting.
|
Item 9B.
|
OTHER INFORMATION
|
None.
-
85
-
|
Item 10.
|
DIRECTORS, EXECUTIVE OFFICERS AND CORPORATE GOVERNANCE
|
Information concerning the Company’s directors, corporate governance guidelines, Compensation Committee and Nominating and Governance Committee will appear in the Company’s definitive Proxy Statement for its
2020
Annual Meeting of Stockholders, which will be herein incorporated by reference.
AUDIT COMMITTEE
Information regarding the Audit Committee, including the identification of the Audit Committee members and the “audit committee financial experts,” will appear in the Company’s definitive Proxy Statement for its
2020
Annual Meeting of Stockholders, which will be herein incorporated by reference.
COMPLIANCE WITH SECTION 16(a) OF THE EXCHANGE ACT
Information regarding compliance with Section 16(a) of the Securities Exchange Act of 1934 will appear in the Company’s definitive Proxy Statement for its
2020
Annual Meeting of Stockholders, which will be herein incorporated by reference.
CODE OF ETHICS
Information regarding the Company’s code of conduct is available on the Company’s website at
http://www.coopertire.com
. To access this information, first click on “Investors”, then click on “Governance” and then click on "Governance Documents" on the Company’s website. Then, select the “Code of Business Ethics and Conduct” link listed in the middle of the web page under Governance.
|
Item 11.
|
EXECUTIVE COMPENSATION
|
Information regarding executive and director compensation will appear in the Company’s definitive Proxy Statement for its
2020
Annual Meeting of Stockholders, which will be herein incorporated by reference.
|
Item 12.
|
SECURITY OWNERSHIP OF CERTAIN BENEFICIAL OWNERS AND MANAGEMENT AND RELATED STOCKHOLDER MATTERS
|
Information concerning the security ownership of certain beneficial owners and management of the Company’s voting securities and equity securities will appear in the Company’s definitive Proxy Statement for its
2020
Annual Meeting of Stockholders, which will be herein incorporated by reference.
Equity Compensation Plan Information
The following table provides information as of
December 31, 2019
regarding the Company’s equity compensation plans, all of which were approved by the Company’s security holders:
|
Number of securities
to be issued upon
exercise of outstanding
options, warrants and
rights
|
Weighted-average
exercise price of
outstanding options,
warrants and rights
|
Number of securities
remaining available for
future issuance under
equity compensation
plans (excluding
securities reflected
in column (a))
|
||||||||
|
Plan category
|
(a)
|
(b)
|
(c)
|
|||||||
|
Equity compensation plans approved by stockholders
|
238,748
|
|
$
|
23.30
|
|
2,138,910
|
|
|||
|
Equity compensation plans not approved by stockholders
|
—
|
|
—
|
|
—
|
|
||||
|
Total
|
238,748
|
|
$
|
23.30
|
|
2,138,910
|
|
|||
Additional information on equity compensation plans is contained in
Note 14
- Stock-Based Compensation to the consolidated financial statements.
-
86
-
|
Item 13.
|
CERTAIN RELATIONSHIPS AND RELATED TRANSACTIONS, AND DIRECTOR INDEPENDENCE
|
There were
no
transactions with related persons that would require disclosure during
2019
.
Information regarding the independence of the Company’s directors will appear in the Company’s definitive Proxy Statement for its
2020
Annual Meeting of Stockholders, which will be herein incorporated by reference.
|
Item 14.
|
PRINCIPAL ACCOUNTING FEES AND SERVICES
|
Information regarding the fees and services of the Company’s independent auditor will appear in the Company’s definitive Proxy Statement for its
2020
Annual Meeting of Stockholders, which will be herein incorporated by reference.
-
87
-
Item 15.
EXHIBITS AND FINANCIAL STATEMENT SCHEDULES
(a) The following documents are filed as part of this report:
1. Consolidated Financial Statements
|
Page
reference
|
|
|
1. Consolidated Financial Statements
|
|
|
Consolidated Statements of Income for the years ended December 31, 2019, 2018 and 2017
|
|
|
Consolidated Statements of Comprehensive Income for the years ended December 31, 2019, 2018 and 2017
|
|
|
Consolidated Balance Sheets at December 31, 2019 and 2018
|
|
|
Consolidated Statements of Equity for the years ended December 31, 2019, 2018 and 2017
|
|
|
Consolidated Statements of Cash Flows for the years ended December 31, 2019, 2018 and 2017
|
|
|
Notes to Consolidated Financial Statements
|
|
|
Report of Independent Registered Public Accounting Firm
|
|
|
Selected Quarterly Data (Unaudited)
|
|
|
2. Financial Statement Schedule
|
|
|
Valuation and qualifying accounts – Allowance for doubtful accounts and tax valuation allowance
|
|
All other schedules have been omitted since the required information is not present or not present in amounts sufficient to require submission of the schedules, or because the information required is included in the Consolidated Financial Statements or the notes thereto.
3. Exhibits
The exhibits listed on the accompanying exhibit index are filed as part of this Annual Report on Form 10-K.
Item 16.
FORM 10-K SUMMARY
Not applicable.
-
88
-
SIGNATURES
Pursuant to the requirements of Section 13 or 15(d) of the Securities Exchange Act of 1934, the registrant has duly caused this report to be signed on its behalf by the undersigned, thereunto duly authorized.
|
COOPER TIRE & RUBBER COMPANY
|
|
/s/ Bradley E. Hughes
|
|
BRADLEY E. HUGHES, President,
|
|
Chief Executive Officer and Director
|
Date:
February 24, 2020
Pursuant to the requirements of the Securities Exchange Act of 1934, this report has been signed below by the following persons on behalf of the registrant and in the capacities and on the dates indicated.
|
Signature
|
|
Title
|
|
Date
|
|
/s/ Bradley E. Hughes
|
|
President, Chief Executive Officer and Director
|
|
February 24, 2020
|
|
BRADLEY E. HUGHES
|
|
(Principal Executive Officer)
|
|
|
|
/s/ Christopher J. Eperjesy
|
|
Senior Vice President and Chief Financial Officer
|
|
February 24, 2020
|
|
CHRISTOPHER J. EPERJESY
|
|
(Principal Financial Officer)
|
|
|
|
/s/ Mark A. Young
|
|
Chief Accounting Officer
|
|
February 24, 2020
|
|
MARK A. YOUNG
|
|
(Principal Accounting Officer)
|
|
|
|
THOMAS P. CAPO*
|
|
Non-Executive Chairman of the Board
|
|
February 24, 2020
|
|
STEVEN M. CHAPMAN*
|
|
Director
|
|
February 24, 2020
|
|
SUSAN F. DAVIS*
|
|
Director
|
|
February 24, 2020
|
|
KATHRYN P. DICKSON*
|
|
Director
|
|
February 24, 2020
|
|
JOHN J. HOLLAND*
|
Director
|
|
February 24, 2020
|
|
|
TRACEY I. JOUBERT*
|
|
Director
|
|
February 24, 2020
|
|
GARY S. MICHEL*
|
|
Director
|
|
February 24, 2020
|
|
BRIAN C. WALKER*
|
|
Director
|
|
February 24, 2020
|
|
ROBERT D. WELDING*
|
Director
|
February 24, 2020
|
||
|
*
|
The undersigned, by signing his name hereto, does sign and execute this Annual Report on Form 10-K pursuant to a Power of Attorney executed on behalf of the above-indicated directors of the registrant and filed herewith as Exhibit 24 on behalf of the registrant.
|
|
*By:
|
|
/s/ Stephen Zamansky
|
||||
|
|
STEPHEN ZAMANSKY, Attorney-in-fact
|
|||||
-
89
-
EXHIBIT INDEX
All documents referenced below were filed pursuant to the Securities Exchange Act of 1934 by Cooper Tire & Rubber Company (File Number 001-04329), unless otherwise noted.
|
(3)
|
(i)
|
|
|
(ii)
|
||
|
(4)
|
(i)
|
|
|
(ii)
|
||
|
(10)
|
(i)
|
|
|
(ii)
|
||
|
(iii)
|
||
|
(iv)
|
||
|
(v)
|
||
|
(vi)
|
||
|
(vii)
|
||
|
(viii)
|
||
|
(ix)
|
||
|
(x)
|
||
|
(xi)
|
||
|
(xii)
|
||
|
(xiii)
|
||
-
90
-
|
(xiv)
|
||
|
(xv)
|
||
|
(xvi)
|
||
|
(xvii)
|
||
|
(xviii)
|
||
|
(xix)
|
||
|
(xx)
|
||
|
(xxi)
|
||
|
(xxii)
|
||
|
(xxiii)
|
||
|
(xxiv)
|
||
|
(xxv)
|
||
|
(xxvi)
|
||
|
(xxvii)
|
||
|
(xxviii)
|
||
|
(xxix)
|
||
|
(xxx)
|
||
|
(xxxi)
|
||
|
(xxxii)
|
||
-
91
-
|
(xxxiii)
|
||
|
(xxxiv)
|
||
|
(xxxv)
|
||
|
(xxxvi)
|
||
|
(xxxvii)
|
||
|
(xxxviii)
|
||
|
(xxxix)
|
||
|
(xl)
|
||
|
(xli)
|
||
|
(xlii)
|
||
|
(21)
|
||
|
(23)
|
||
|
(24)
|
||
|
(31.1)
|
||
|
(31.2)
|
||
|
(32)
|
||
|
(101.INS)
|
XBRL Instance Document
|
|
|
(101.SCH)
|
XBRL Taxonomy Extension Schema Document
|
|
|
(101.DEF)
|
XBRL Taxonomy Extension Definition Linkbase Document
|
|
|
(101.CAL)
|
XBRL Taxonomy Extension Calculation Linkbase Document
|
|
|
(101.LAB)
|
XBRL Taxonomy Extension Label Linkbase Document
|
|
|
(101.PRE)
|
XBRL Taxonomy Extension Presentation Linkbase Document
|
|
|
*
|
Indicates management contracts or compensatory plans or arrangements.
|
-
92
-
TABLE OF CONTENTS
Part IItem 1. BusinessItem 1A. Risk FactorsItem 1B. Unresolved Staff CommentsItem 2. PropertiesItem 3 . Legal ProceedingsItem 4. Mine Safety DisclosuresPart IIItem 5. Market For Registrant's Common Equity, Related Stockholder Matters and Issuer Purchases Of Equity SecuritiesItem 6. Selected Financial DataItem 7 . Management's Discussion and Analysis Of Financial Condition and Results Of OperationsItem 7A . Quantitative and Qualitative Disclosures About Market RiskItem 8 . Financial Statements and Supplementary DataNote 1 . Significant Accounting PoliciesNote 2 . RestructuringNote 3 . Revenue From Contracts with CustomersNote 4 . InventoriesNote 5 . Goodwill and IntangiblesNote 6 . Accrued LiabilitiesNote 7 . Income TaxesNote 8 . DebtNote 9 . Fair Value MeasurementsNote 10 . Pensions and Postretirement Benefits Other Than PensionsNote 11 . Lease CommitmentsNote 12 . Other Long-term LiabilitiesNote 13 . Share Repurchase ProgramNote 14 . Stock-based CompensationNote 15 . Changes in Accumulated Other Comprehensive Income (loss) By ComponentNote 16 . Comprehensive Income (loss) Attributable To Noncontrolling Shareholders InterestsNote 17 . Contingent LiabilitiesNote 18 . Business SegmentsNote 19 . Subsequent EventsItem 9. Changes in and Disagreements with Accountants on Accounting and Financial DisclosureItem 9A . Controls and ProceduresItem 9B. Other InformationPart IIIItem 10. Directors, Executive Officers and Corporate GovernanceItem 11. Executive CompensationItem 12. Security Ownership Of Certain Beneficial Owners and Management and Related Stockholder MattersItem 13. Certain Relationships and Related Transactions, and Director IndependenceItem 14. Principal Accounting Fees and ServicesPart IVItem 15. Exhibits and Financial Statement SchedulesItem 16. Form 10-k Summary