COMMUNITY TRUST BANCORP INC /KY/
10-Ks and 10-Qs
|
|
|
|
|
|
|
|
|
|
|
|
|
|
|
|
|
|
|
|
|
|
|
|
|
|
|
|
|
|
|
|
|
|
|
|
|
|
|
|
|
|
|
|
|
|
|
|
|
|
|
|
|
|
|
|
UNITED STATES
SECURITIES AND EXCHANGE COMMISSION
WASHINGTON, D.C. 20549
FORM 10-K
|
[X]
|
ANNUAL REPORT PURSUANT TO SECTION 13 OR 15(d) OF THE SECURITIES EXCHANGE ACT OF 1934 (NO FEE REQUIRED)
|
|
For the fiscal year ended December 31, 2012
|
|
|
Or
|
|
|
[ ]
|
TRANSITION REPORT PURSUANT TO SECTION 13 OR 15(d) OF THE SECURITIES EXCHANGE ACT OF 1934 (NO FEE REQUIRED)
|
|
For the transition period from _____________ to _____________
|
Commission file number 0-11129
COMMUNITY TRUST BANCORP, INC.
(Exact name of registrant as specified in its charter
)
|
Kentucky
|
61-0979818
|
|
(State or other jurisdiction of incorporation or organization)
|
IRS Employer Identification No.
|
|
346 North Mayo Trail
Pikeville, Kentucky
(address of principal executive offices)
|
41501
(Zip Code)
|
(606) 432-1414
(Registrant’s telephone number)
Securities registered pursuant to Section 12(b) of the Act:
Common Stock, $5.00 par value
(Title of Class)
Securities registered pursuant to Section 12(g) of the Act:
None
Indicate by check mark if the registrant is a well-known seasoned issuer, as defined in Rule 405 of the Securities Act.
|
Yes
|
No
ü
|
Indicate by check mark if the registrant is not required to file reports pursuant to Section 13 or Section 15(d) of the Act.
|
Yes
|
No
ü
|
Indicate by check mark whether the registrant (1) has filed all reports required to be filed by Section 13 or 15(d) of the Securities Exchange Act of 1934 during the preceding 12 months (or for such shorter period that the registrant was required to file such reports) and (2) has been subject to such filing requirements for the past 90 days.
|
Yes
ü
|
No
|
Indicate by check mark whether the registrant has submitted electronically and posted on its corporate web site, if any, every interactive data file required to be submitted and posted pursuant to Rule 405 of Regulation S-T during the preceding 12 months (or for such shorter period that the registrant was required to submit and post such files.)
|
Yes
ü
|
No
|
Indicate by check mark if disclosure of delinquent filers pursuant to Item 405 of Regulation S-K is not contained herein, and will not be contained, to the best of registrant’s knowledge, in definitive proxy or information statements incorporated by reference in Part III of this Form 10-K or any amendment to this Form 10-K.
[ ]
Indicate by check mark whether the registrant is a large accelerated filer, an accelerated filer, a non-accelerated filer, or a smaller reporting company. See definition of “accelerated filer, large accelerated filer, and smaller reporting company” in Rule 12b-2 of the Exchange Act.
|
Large accelerated filer
|
Accelerated filer
ü
|
Non-accelerated filer
|
Smaller reporting company
|
|
(Do not check if a smaller reporting company)
|
Indicate by check mark whether the registrant is a shell company (as defined in Rule 12b-2 of the Exchange Act).
|
Yes
|
No
ü
|
Based upon the closing price of the Common Shares of the Registrant on the NASDAQ-Stock Market LLC – Global Select Market, the aggregate market value of voting stock held by non-affiliates of the Registrant as of June 30, 2012 was $493.3 million. For the purpose of the foregoing calculation only, all directors and executive officers of the Registrant have been deemed affiliates. The number of shares outstanding of the Registrant’s Common Stock as of February 28, 2013 was 15,640,590.
TABLE OF CONTENTS
Portions of the following documents are incorporated by reference into the Form 10-K part indicated:
|
Document
|
Form 10-K
|
|
(1) Proxy statement for the annual meeting of shareholders to be held April 23, 2013
|
Part III
|
REGARDING FORWARD LOOKING STATEMENTS
Certain of the statements contained herein that are not historical facts are forward-looking statements within the meaning of the Private Securities Litigation Reform Act. Community Trust Bancorp, Inc.’s (“CTBI”) actual results may differ materially from those included in the forward-looking statements. Forward-looking statements are typically identified by words or phrases such as “believe,” “expect,” “anticipate,” “intend,” “estimate,” “may increase,” “may fluctuate,” and similar expressions or future or conditional verbs such as “will,” “should,” “would,” and “could.” These forward-looking statements involve risks and uncertainties including, but not limited to, economic conditions, portfolio growth, the credit performance of the portfolios, including bankruptcies, and seasonal factors; changes in general economic conditions including the performance of financial markets, prevailing inflation and interest rates, realized gains from sales of investments, gains from asset sales, and losses on commercial lending activities; results of various investment activities; the effects of competitors’ pricing policies, changes in laws and regulations, competition, and demographic changes on target market populations’ savings and financial planning needs; industry changes in information technology systems on which we are highly dependent; failure of acquisitions to produce revenue enhancements or cost savings at levels or within the time frames originally anticipated or unforeseen integration difficulties; the adoption by CTBI of a Federal Financial Institutions Examination Council (FFIEC) policy that provides guidance on the reporting of delinquent consumer loans and the timing of associated credit charge-offs for financial institution subsidiaries; and the resolution of legal proceedings and related matters. In addition, the banking industry in general is subject to various monetary and fiscal policies and regulations, which include those determined by the Federal Reserve Board, the Federal Deposit Insurance Corporation, and state regulators, whose policies and regulations could affect CTBI’s results. These statements are representative only on the date hereof, and CTBI undertakes no obligation to update any forward-looking statements made.
Community Trust Bancorp, Inc. (“CTBI”) is a bank holding company registered with the Board of Governors of the Federal Reserve System pursuant to Section 5(a) of the Bank Holding Company Act of 1956, as amended. CTBI was incorporated August 12, 1980, under the laws of the Commonwealth of Kentucky for the purpose of becoming a bank holding company. Currently, CTBI owns all the capital stock of one commercial bank and one trust company, serving small and mid-sized communities in eastern, northeastern, central, and south central Kentucky, southern West Virginia, and northeastern Tennessee. The commercial bank is Community Trust Bank, Inc., Pikeville, Kentucky and the trust company is Community Trust and Investment Company, Lexington, Kentucky.
At December 31, 2012, CTBI had total consolidated assets of $3.6 billion and total consolidated deposits, including repurchase agreements, of $3.1 billion, making it the largest bank holding company headquartered in the Commonwealth of Kentucky.
Through its subsidiaries, CTBI engages in a wide range of commercial and personal banking and trust and wealth management activities, which include accepting time and demand deposits; making secured and unsecured loans to corporations, individuals and others; providing cash management services to corporate and individual customers; issuing letters of credit; renting safe deposit boxes; and providing funds transfer services. The lending activities of our Bank include making commercial, construction, mortgage, and personal loans. Lease-financing, lines of credit, revolving lines of credit, term loans, and other specialized loans, including asset-based financing, are also available. Our corporate subsidiaries act as trustees of personal trusts, as executors of estates, as trustees for employee benefit trusts, as registrars, transfer agents, and paying agents for bond and stock issues, as depositories for securities, and as providers of full service brokerage services.
COMPETITION
CTBI’s subsidiaries face substantial competition for deposit, credit, trust, wealth management, and brokerage relationships in the communities we serve. Competing providers include state banks, national banks, thrifts, trust companies, insurance companies, mortgage banking operations, credit unions, finance companies, brokerage companies, and other financial and non-financial companies which may offer products functionally equivalent to those offered by our subsidiaries. Many of these providers offer services within and outside the market areas served by our subsidiaries. We strive to offer competitively priced products along with quality customer service to build customer relationships in the communities we serve.
The United States and global markets, as well as general economic conditions, have been disruptive and volatile. Some financial institutions have failed and others have been forced to seek acquisition partners. Larger financial institutions could strengthen their competitive position as a result of ongoing consolidation within the financial services industry.
Since July 1989, banking legislation in Kentucky places no limits on the number of banks or bank holding companies that a bank holding company may acquire. Interstate acquisitions are allowed where reciprocity exists between the laws of Kentucky and the home state of the bank or bank holding company to be acquired. Bank holding companies continue to be limited to control of less than 15% of deposits held by banks in the states where they do business (exclusive of inter-bank and foreign deposits).
The Gramm-Leach-Bliley Act of 1999 (the “GLB Act”) has expanded the permissible activities of a bank holding company. The GLB Act allows qualifying bank holding companies to elect to be treated as financial holding companies. A financial holding company may engage in activities that are financial in nature or are incidental or complementary to financial activities. We have not yet elected to be treated as a financial holding company. The GLB Act also eliminated restrictions imposed by the Glass-Steagall Financial Services Law, adopted in the 1930s, which prevented banking, insurance, and securities firms from fully entering each other’s business. This legislation has resulted in further consolidation in the financial services industry. In addition, removal of these restrictions has increased the number of entities providing banking services and thereby created additional competition.
No material portion of our business is seasonal. We are not dependent upon any one customer or a few customers, and the loss of any one or a few customers would not have a material adverse effect on us. See note 18 to the consolidated financial statements for additional information regarding concentrations of credit.
We do not engage in any operations in foreign countries.
EMPLOYEES
As of December 31, 2012, CTBI and subsidiaries had 1,035 full-time equivalent employees. Our employees are provided with a variety of employee benefits. A retirement plan, an employee stock ownership plan, group life insurance, major medical insurance, a cafeteria plan, and management and employee incentive compensation plans are available to all eligible personnel.
SUPERVISION AND REGULATION
General
We, as a registered bank holding company, are restricted to those activities permissible under the Bank Holding Company Act of 1956, as amended, and are subject to actions of the Board of Governors of the Federal Reserve System thereunder. We are required to file an annual report with the Federal Reserve Board and are subject to an annual examination by the Board.
Community Trust Bank, Inc. (“CTB”) is a state-chartered bank subject to state and federal banking laws and regulations and periodic examination by the Kentucky Department of Financial Institutions and the restrictions, including dividend restrictions, thereunder. Our Bank is also a member of the Federal Reserve System and is subject to certain restrictions imposed by and to examination and supervision under the Federal Reserve Act. Community Trust and Investment Company is also regulated by the Kentucky Department of Financial Institutions and the Federal Reserve.
Deposits of our Bank are insured by the Federal Deposit Insurance Corporation (FDIC), which subjects banks to regulation and examination under the provisions of the Federal Deposit Insurance Act.
The operations of CTBI and our subsidiaries are also affected by other banking legislation and policies and practices of various regulatory authorities. Such legislation and policies include statutory maximum rates on some loans, reserve requirements, domestic monetary and fiscal policy, and limitations on the kinds of services that may be offered.
CTBI’s annual reports on Form 10-K, quarterly reports on Form 10-Q, current reports on Form 8-K, and all amendments to those reports are available free of charge on our website at
www.ctbi.com
as soon as reasonably practicable after such materials are electronically filed with or furnished to the Securities and Exchange Commission. CTBI’s Code of Business Conduct and Ethics is also available on our website. Copies of our annual report will be made available free of charge upon written request.
The Dodd-Frank Wall Street Reform and Consumer Protection Act
On July 21, 2010, President Obama signed the Dodd-Frank Act into law. This law has significantly changed the bank regulatory structure and affected the lending, deposit, investment, trading, and operating activities of financial institutions and their holding companies. The Dodd-Frank Act has required various federal agencies to adopt a broad range of implementing rules and regulations and to prepare numerous studies and reports for Congress. The federal agencies have been given significant discretion in drafting the implementing rules and regulations, and consequently, many of the details and much of the impact of the Dodd-Frank Act are still unknown.
Certain provisions of the Dodd-Frank Act that are relevant to us:
|
·
|
Broadened the base for FDIC insurance assessments, eliminated the ceiling and increased the size of the floor of the Deposit Insurance Fund, and offset the impact of the minimum floor on institutions with less than $10 billion in assets. Assessments are now based on the average consolidated total assets less tangible equity capital of a financial institution.
|
|
·
|
Removed the federal prohibition on payment of interest on demand deposits, thereby permitting businesses to have interest bearing checking accounts.
|
|
·
|
Require capital regulations which call for higher levels of capital. The same leverage and risk based capital requirements that apply to depository institutions now apply to holding companies. New issuances of trust preferred securities are no longer eligible to qualify as Tier 1 capital. However, CTBI’s currently outstanding trust preferred securities are grandfathered and are still considered in Tier 1 capital under the regulations. Under Dodd-Frank, and previously under Federal Reserve policy, we are required to act as a source of financial strength for our bank subsidiary and to commit sufficient resources to support it.
|
|
·
|
Created an agency, the Consumer Financial Protection Bureau (Bureau), responsible for the implementation of federal consumer protection laws. The Bureau has broad rule-making authority for a wide range of consumer protection laws that apply to all banks, including the authority to prohibit “unfair, deceptive or abusive” acts and practices. The term “abusive” is relatively new and untested, and we cannot predict how it will be interpreted and enforced. Although insured depository institutions with assets of $10 billion or less (such as CTB) will continue to be supervised and examined by their primary federal regulators, rather than the Bureau, with respect to compliance with federal consumer protection laws, any change in regulatory environment may have a negative impact on all financial institutions. In February 2012, the Bureau announced that it was launching an inquiry into industry checking account overdraft programs to determine how these practices are impacting consumers. The full reach and the impact of the Bureau’s inquiries and rulemaking powers on the operations of financial institutions are currently unknown.
|
|
·
|
Permanently increased the maximum amount of deposit insurance for banks, savings institutions and credit unions to $250,000 per depositor, retroactive to January 1, 2008, with noninterest bearing transaction accounts and IOLTA accounts having unlimited deposit insurance through December 31, 2012
. Effective
January 1, 2013, money in noninterest-bearing transaction accounts (including IOLTA/IOLA) no longer receive unlimited deposit insurance coverage from the FDIC, but will be FDIC-insured up to the legal maximum of $250,000 for each ownership category.
|
|
·
|
Increased the authority of the Federal Reserve Board to examine CTBI and its non-bank subsidiaries and gave the Federal Reserve Board the authority to establish rules regarding interchange fees charged for electronic debit transactions by payment card issuers having assets over $10 billion and to enforce a statutory requirement that such fees be reasonable and proportional to the actual cost of a transaction to the issuer. Under the final rule, the maximum permissible interchange fee that an issuer may receive for an electronic debit transaction is the sum of 21 cents per transaction and 5 basis points multiplied by the value of the transaction.
|
|
·
|
Restrict proprietary trading by banks, bank holding companies and others, and their acquisition and retention of ownership interests in and sponsorship of hedge funds and private equity funds, subject to an exception allowing a bank to organize and offer hedge funds and private equity funds to customers if certain conditions are met, including, among others, a requirement that the bank limit its ownership interest in any single fund to 3%, and its aggregate investment in all funds to 3%, of Tier 1 capital, with no director or employee of the bank holding an ownership interest in the fund unless he or she provides services directly to the funds.
|
|
·
|
Require publicly traded companies to give stockholders a non-binding vote on executive compensation and so-called “golden parachute” payments in mergers and acquisitions. The legislation also directs the federal banking regulators to issue rules prohibiting incentive compensation that encourages inappropriate risks.
|
|
·
|
Imposed restrictions related to mortgage lending, such as minimum underwriting standards, requiring certain loan provision qualifications, limitations on mortgage terms, and additional disclosures to mortgage borrowers and prohibits certain yield-spread compensation to mortgage originators. Proposed new rules under this requirement have been issued for comment.
|
|
·
|
Permits banks to establish de novo interstate branches at a location where a bank based in that state could establish a branch, and requires banks and bank holding companies to be well-capitalized and well-managed in order to acquire banks outside their home state.
|
With the appointment of a director for the Consumer Financial Protection Bureau (“CFPB”) in January 2012, the CFPB began to exercise its full authority under the Dodd-Frank Act. For example, the CFPB completed its first public enforcement actions regarding unfair, deceptive, or abusive practices in connection with marketing, sales, and operations of certain add-on products offered in connection with credit cards. Furthermore, in 2012 the CFPB issued its first major regulation, which covers remittance transfers (international wire transfers) by consumers, which should take effect later in 2013.
In mid-January 2013, the CFPB issued eight final regulations governing consumer mortgage lending. The first of these rules was issued on January 10, 2013, and included the ability to repay and qualified mortgage rule. This rule will impose additional requirements, including rules designed to require lenders to ensure borrowers’ ability to repay their mortgage. The same day, the CFPB also finalized a rule on escrow accounts for high-cost mortgages and a rule expanding the scope of the high-cost mortgage provision in the Truth in Lending Act. On January 17, 2013, the CFPB issued its final rules implementing provisions of the Dodd-Frank Act that relate to mortgage servicing, which will take effect on January 10, 2014. On January 18, 2013, the CFPB issued a final appraisal rule under the Equal Credit Opportunity Act and six agencies including the CFPB, the Federal Reserve Board, the Office of the Comptroller of the Currency, the FDIC, the National Credit Union Administration, and the Federal Housing Finance Agency issued an interagency rule on appraisals for higher-priced mortgage loans. A final rule on loan originator compensation was released on January 20, 2013, and the industry expects a final rule on integrated mortgage disclosures within the next year. Management does not expect these new rules to have a material impact on CTBI.
Basel III Proposal
In the summer of 2012, our primary federal regulators published two notices of proposed rulemaking (the “2012 Capital Proposals”) that would substantially revise the risk-based capital requirements applicable to bank holding companies and depository institutions, including CTBI and CTB, compared to the current U.S. risk-based capital rules, which are based on the international capital accords of the Basel Committee on Banking Supervision (the “Basel Committee”) which are generally referred to as “Basel I.”
One of the 2012 Capital Proposals (the “Basel III Proposal”) addresses the components of capital and other issues affecting the numerator in banking institutions’ regulatory capital ratios, and would implement the Basel Committee’s December 2010 framework, known as “Basel III,” for strengthening international capital standards. The other proposal (the “Standardized Approach Proposal”) addresses risk weights and other issues affecting the denominator in banking institutions’ regulatory capital ratios, and would replace the existing Basel I-derived risk weighting approach with a more risk-sensitive approach based, in part, on the standardized approach in the Basel Committee’s 2004 “Basel II” capital accords. Although the Basel III Proposal was proposed to come into effect on January 1, 2013, the federal banking agencies jointly announced on November 9, 2012 that they do not expect any of the proposed rules to become effective on that date. As proposed, the Standardized Approach Proposal would come into effect on January 1, 2015.
The federal banking agencies have not proposed rules implementing the final liquidity framework of Basel III, and have not determined to what extent they will apply to U.S. banks that are not large, internationally active banks.
It is management’s belief that, as of December 31, 2012, CTBI and CTB would meet all capital adequacy requirements under the Basel III and Standardized Approach Proposals on a fully phased-in basis if such requirements were currently effective. The regulations ultimately applicable to financial institutions may be substantially different from the Basel III final framework as published in December 2010 and the proposed rules issued in June 2012. Management will continue to monitor these and any future proposals submitted by our regulators.
An investment in our common stock is subject to risks inherent to our business. The material risks and uncertainties that management believes affect us are described below. Before making an investment decision, you should carefully consider the risks and uncertainties described below, together with all of the other information included or incorporated by reference herein. The risks and uncertainties described below are not the only ones facing us. Additional risks and uncertainties that management is not aware of or focused on or that management currently deems immaterial may also impair our business operations. This report is qualified in its entirety by these risk factors. See also, “Cautionary Statement Regarding Forward-Looking Statements.” If any of the following risks actually occur, our financial condition and results of operations could be materially and adversely affected. If this were to happen, the value of our common stock could decline significantly, and you could lose all or part of your investment.
Economic Risk
CTBI may continue to be adversely affected by current economic and market conditions.
The national and global economic downturn has resulted in unprecedented levels of financial market volatility and has in general adversely impacted the market value of financial institutions, limited access to capital, and had an adverse effect on the financial condition or results of operations of banking companies in general, including CTBI. In some cases, the markets have produced downward pressure on stock prices and credit capacity for certain issuers without regard to those issuers’ underlying financial strength. From early 2008 to the middle of 2010, we experienced significant challenges, credit quality deteriorated, and net income and results of operations were adversely impacted. While there has been some improvement in economic conditions in our markets starting in the second half of 2010 and continuing through 2012, we believe that we will continue to experience a challenging environment in 2013. We are part of the financial system and a lack of confidence in the financial sector, increased volatility in the financial markets, and reduced business activity could materially and adversely impact our business, financial condition, and results of operations. In addition, the possible duration and severity of the adverse economic cycle is unknown and may exacerbate financial service providers’, including CTBI’s, exposure to credit risk. Actions by Congress, Treasury, the FDIC, and other governmental agencies and regulators have been implemented and continue to be developed and implemented to address economic stabilization, yet the efficacy of these programs in stabilizing the economy and the banking system is still uncertain. There can be no assurance that these actions will not have an adverse effect on the financial position or results of operations of financial service providers including CTBI.
Economy of Our Markets
Our business may continue to be adversely affected by ongoing weaknesses in the local economies on which we depend.
Our loan portfolio is concentrated primarily in eastern, northeastern, central, and south central Kentucky, southern West Virginia, and northeastern Tennessee. Our profits depend on providing products and services to clients in these local regions. Although some of these regions have experienced decreases in unemployment and improved real estate values, unemployment rates remain high and real estate values remain depressed. Recent economic conditions in the coal and natural gas industry are resulting in increased unemployment in the markets where coal is a major contributor to the economy. Further increases in unemployment, decreases in real estate values, or increases in interest rates could weaken the local economies in which we operate. These economic indicators typically affect certain industries, such as real estate and financial services, more significantly. A continuation of high levels of unemployment and depressed real estate asset values in the markets we serve would likely prolong the economic recovery period in our market area. Weakness in our market area could depress our earnings and consequently our financial condition because:
|
·
|
Clients may not want, need, or qualify for our products and services;
|
|
·
|
Borrowers may not be able to repay their loans;
|
|
·
|
The value of the collateral securing our loans to borrowers may decline; and
|
|
·
|
The quality of our loan portfolio may decline.
|
Interest Rate Risk
Changes in interest rates could adversely affect our earnings and financial condition.
Our earnings and financial condition are dependent to a large degree upon net interest income, which is the difference between interest earned from loans and investments and interest paid on deposits and borrowings. The narrowing of interest-rate spreads, meaning the difference between the interest rates earned on loans and investments and the interest rates paid on deposits and borrowings, could adversely affect our earnings and financial condition. Interest rates are highly sensitive to many factors, including:
|
·
|
The rate of inflation;
|
|
·
|
The rate of economic growth;
|
|
·
|
Employment levels;
|
|
·
|
Monetary policies; and
|
|
·
|
Instability in domestic and foreign financial markets.
|
Changes in market interest rates will also affect the level of voluntary prepayments on our loans and the receipt of payments on our mortgage-backed securities resulting in the receipt of proceeds that may be reinvested at a lower rate than the loan or mortgage-backed security being prepaid.
We originate residential loans for sale and for our portfolio. The origination of loans for sale is designed to meet client financing needs and earn fee income. The origination of loans for sale is highly dependent upon the local real estate market and the level and trend of interest rates. Increasing interest rates may reduce the origination of loans for sale and consequently the fee income we earn. While our commercial banking, construction, and income property business lines remain a significant portion of our activities, high interest rates may reduce our mortgage-banking activities and thereby our income. In contrast, decreasing interest rates have the effect of causing clients to refinance mortgage loans faster than anticipated. This causes the value of assets related to the servicing rights on loans sold to be lower than originally anticipated. If this happens, we may need to write down our servicing assets faster, which would accelerate our expense and lower our earnings.
We consider interest rate risk one of our most significant market risks. Interest rate risk is the exposure to adverse changes in net interest income due to changes in interest rates. Consistency of our net interest revenue is largely dependent upon the effective management of interest rate risk. We employ a variety of measurement techniques to identify and manage our interest rate risk including the use of an earnings simulation model to analyze net interest income sensitivity to changing interest rates. The model is based on actual cash flows and repricing characteristics for on and off-balance sheet instruments and incorporates market-based assumptions regarding the effect of changing interest rates on the prepayment rates of certain financial assets and liabilities. Assumptions based on the historical behavior of deposit rates and balances in relation to changes in interest rates are also incorporated into the model. These assumptions are inherently uncertain, and as a result, the model cannot precisely measure net interest income or precisely predict the impact of fluctuations in interest rates on net interest income. Actual results will differ from simulated results due to timing, magnitude, and frequency of interest rate changes as well as changes in market conditions and management strategies.
Liquidity Risk
CTBI is subject to liquidity risk.
CTBI requires liquidity to meet its deposit and debt obligations as they come due and to fund loan demands. CTBI’s access to funding sources in amounts adequate to finance its activities or on terms that are acceptable to it could be impaired by factors that affect it specifically or the financial services industry or economy in general. Factors that could reduce its access to liquidity sources include a downturn in the market, difficult credit markets, or adverse regulatory actions against CTBI. CTBI’s access to deposits may also be affected by the liquidity needs of its depositors. In particular, a substantial majority of CTBI’s liabilities are demand, savings, interest checking, and money market deposits, which are payable on demand or upon several days’ notice, while by comparison, a substantial portion of its assets are loans, which cannot be called or sold in the same time frame. Although CTBI historically has been able to replace maturing deposits and advances as necessary, it might not be able to replace such funds in the future, especially if a large number of its depositors sought to withdraw their accounts, regardless of the reason. A failure to maintain adequate liquidity could have a material adverse effect on our financial condition and results of operations.
Banking Reform
Our business may be adversely affected by “banking reform” legislation.
On July 21, 2010, President Obama signed the Dodd-Frank Act into law. This law has significantly changed the bank regulatory structure and affected the lending, deposit, investment, trading, and operating activities of financial institutions and their holding companies. The Dodd-Frank Act has required various federal agencies to adopt a broad range of implementing rules and regulations, and to prepare numerous studies and reports for Congress. The federal agencies have been given significant discretion in drafting the implementing rules and regulations, and consequently, many of the details and much of the impact of the Dodd-Frank Act are still unknown. This legislation includes, among other things: (i) changes in the manner in which the FDIC deposit insurance assessments are computed and an increase in the minimum designated reserve ratio for the Deposit Insurance Fund; (ii) authorization of interest-bearing demand deposits; (iii) requirements for capital regulations applicable to banks and bank holding companies which call for higher levels of capital; (iv) creation of the Consumer Financial Protection Bureau, responsible for implementation of federal consumer protection laws which affect banks and bank holding companies; (v) a permanent increase in the maximum amount of deposit insurance for banks; (vi) a prohibition of certain proprietary trading and equity investment activities by banks; (vii) restrictions related to mortgage lending; (viii) allowance of de novo interstate branching; and (ix) additional corporate governance provisions relating to non-binding shareholder votes on executive compensation and rules prohibiting incentive compensation that encourages inappropriate risks.
Many aspects of the Dodd-Frank Act are subject to rulemaking and take effect over several years, making it difficult to anticipate the overall financial impact on CTBI. However, compliance with this law and its implementing regulations will result in additional operating costs that could have a material adverse effect on our financial condition and results of operations.
In the summer of 2012, our primary federal regulators published two notices of proposed rulemaking that would substantially revise the risk-based capital requirements applicable to bank holding companies and depository institutions, including CTBI and CTB, compared to the current U.S. risk-based capital rules. One of the proposals addresses the components of capital and other issues affecting the numerator in banking institutions’ regulatory capital ratios, and the other addresses risk weights and other issues affecting the denominator in banking institutions’ regulatory capital ratios, and would replace the existing approach with a more risk-sensitive approach. The federal banking agencies have not proposed rules implementing the final liquidity framework of Basel III, and have not determined to what extent they will apply to U.S. banks that are not large, internationally active banks.
In November 2012, the federal banking agencies announced that they did not expect any of the proposed rules to become effective on January 1, 2013 as originally proposed. The regulations ultimately applicable to financial institutions may be substantially different from the Basel III final framework as published in December 2010 and the proposed rules issued in June 2012. Management will continue to monitor these and any future proposals submitted by our regulators.
Government Policies and Oversight
Our business may be adversely affected by changes in government policies and oversight.
The earnings of banks and bank holding companies such as ours are affected by the policies of regulatory authorities, including the Federal Reserve Board, which regulates the money supply. Among the methods employed by the Federal Reserve Board are open market operations in U.S. Government securities, changes in the discount rate on member bank borrowings, and changes in reserve requirements against member bank deposits. These methods are used in varying combinations to influence overall growth and distribution of bank loans, investments and deposits, and their use may also affect interest rates charged on loans or paid on deposits. The monetary policies of the Federal Reserve Board have had a significant effect on the operating results of commercial and savings banks in the past and are expected to continue to do so in the future.
Many states and municipalities are experiencing financial stress due to the economy. As a result, various levels of government have sought to increase their tax revenues through increased tax levies, which could have an adverse impact on our results of operations.
Federal banking regulators are increasing regulatory scrutiny, and additional limitations (including those contained in the Dodd-Frank Act) on financial institutions have been proposed or adopted by regulators and by Congress. The banking industry is highly regulated and changes in federal and state banking regulations as well as policies and administration guidelines may affect our practices, growth prospects, and earnings. In particular, there is no assurance that recent governmental actions designed to stabilize the economy and banking system will not adversely affect the financial position or results of operations of CTBI.
We are involved from time to time in examinations, reviews, and investigations (both formal and informal) by governmental and regulatory authorities regarding our business. These matters could result in adverse judgments, settlements, fines, penalties, injunctions, and other relief.
Credit Risk
Our earnings and reputation may be adversely affected if we fail to effectively manage our credit risk.
Originating and underwriting loans are integral to the success of our business. This business requires us to take “credit risk,” which is the risk of losing principal and interest income because borrowers fail to repay loans. Collateral values and the ability of borrowers to repay their loans may be affected at any time by factors such as:
|
·
|
The length and severity of downturns in the local economies in which we operate or the national economy;
|
|
·
|
The length and severity of downturns in one or more of the business sectors in which our customers operate, particularly the automobile, hotel/motel, coal, and residential development industries; or
|
|
·
|
A rapid increase in interest rates.
|
Our loan portfolio includes loans with a higher risk of loss.
We originate commercial real estate loans, construction and development loans, consumer loans, and residential mortgage loans, primarily within our market area. Commercial real estate, commercial, and construction and development loans tend to involve larger loan balances to a single borrower or groups of related borrowers and are most susceptible to a risk of loss during a downturn in the business cycle. These loans also have historically had a greater credit risk than other loans for the following reasons:
|
·
|
Commercial Real Estate Loans.
Repayment is dependent on income being generated in amounts sufficient to cover operating expenses and debt service. As of December 31, 2012, commercial real estate loans, including multi-family loans, comprised approximately 36% of our total loan portfolio.
|
|
·
|
Other Commercial Loans.
Repayment is generally dependent upon the successful operation of the borrower’s business. In addition, the collateral securing the loans may depreciate over time, be difficult to appraise, be illiquid, or fluctuate in value based on the success of the business. As of December 31, 2012, other commercial loans comprised approximately 15% of our total loan portfolio.
|
|
·
|
Construction and Development Loans.
The risk of loss is largely dependent on our initial estimate of whether the property’s value at completion equals or exceeds the cost of property construction and the availability of take-out financing. During the construction phase, a number of factors can result in delays or cost overruns. If our estimate is inaccurate or if actual construction costs exceed estimates, the value of the property securing our loan may be insufficient to ensure full repayment when completed through a permanent loan, sale of the property, or by seizure of collateral. As of December 31, 2012, construction and development loans comprised approximately 7% of our total loan portfolio.
|
Consumer loans may carry a higher degree of repayment risk than residential mortgage loans, particularly when the consumer loan is unsecured. Repayment of a consumer loan typically depends on the borrower’s financial stability, and it is more likely to be affected adversely by job loss, illness, or personal bankruptcy. Economic conditions in the coal and natural gas industry are resulting in increases in unemployment in many of our market areas, which is likely to impact the repayment risk associated with our consumer loans. In addition, federal and state bankruptcy, insolvency, and other laws may limit the amount we can recover when a consumer client defaults. As of December 31, 2012, consumer loans comprised approximately 16% of our total loan portfolio.
A significant part of our lending business is focused on small to medium-sized business which may be impacted more severely during periods of economic weakness.
A significant portion of our commercial loan portfolio is tied to small to medium-sized businesses in our markets. During periods of economic weakness, small to medium-sized businesses may be impacted more severely than larger businesses. As a result, the ability of smaller businesses to repay their loans may deteriorate, particularly if economic challenges persist over a period of time, and such deterioration would adversely impact our results of operations and financial condition.
A large percentage of our loan portfolio is secured by real estate, in particular commercial real estate. Continued weakness in the real estate market or other segments of our loan portfolio would lead to additional losses, which could have a material adverse effect on our business, financial condition, and results of operations.
As of December 31, 2012, approximately 69% of our loan portfolio is secured by real estate, 36% of which is commercial real estate. High levels of commercial and consumer delinquencies or further declines in real estate market values could require increased net charge-offs and increases in the allowance for loan and lease losses, which could have a material adverse effect on our business, financial condition, and results of operations and prospects.
While we have seen a decline in our level of other real estate owned, it still remains above our historical norm, primarily as a result of foreclosures. To the extent that we continue to hold a higher level of real estate owned, related real estate expense would likely increase.
During the recent economic downturn, we experienced an increase in nonperforming real estate loans. As a result, we have experienced, and we continue to experience, an increase in the level of foreclosed properties. Foreclosed real estate expense consists of maintenance costs, taxes, valuation adjustments to appraisal values, and gains or losses on disposition. The amount that we may realize after a default is dependent upon factors outside of our control, including but not limited to: (i) general and local economic conditions; (ii) neighborhood values; (iii) interest rates; (iv) real estate tax rates; (v) operating expenses of the properties; (vi) environmental remediation liabilities; (vii) ability to obtain and maintain occupancy of the properties; (viii) zoning laws; (ix) governmental rules, regulations, and fiscal policies; (x) potential vandalism; and (xi) acts of God. Expenditures associated with the ownership of real estate, such as real estate taxes, insurance, and maintenance costs, may adversely affect income from the real estate. The cost of operating real property may exceed the income earned from the property, and we may need to advance funds in order to protect our investment in the property, or we may be required to dispose of the property at a loss.
If our levels of other real estate owned increase or are sustained and local real estate values decline, our foreclosed real estate expense will increase, which would adversely impact our results of operations.
Environmental Liability Risk
We are subject to environmental liability risk associated with lending activity.
A significant portion of our loan portfolio is secured by real property. During the ordinary course of business, we may foreclose on and take title to properties securing loans. In doing so, there is a risk that hazardous or toxic substances could be found on these properties. If hazardous or toxic substances are found, we may be liable for remediation costs, as well as for personal injury and property damage. Environmental laws may require us to incur substantial expenses and may materially reduce the affected property’s value or limit our ability to use or sell the affected property. In addition, future laws or more stringent interpretations or enforcement policies with respect to existing laws may increase our exposure to environmental liability. Although we have policies and procedures to perform an environmental review before initiating any foreclosure action on real property, these reviews may not be sufficient to detect all potential environmental hazards. The remediation costs and any other financial liabilities associated with an environmental hazard could have a material adverse effect on our financial condition and results of operations.
Competition
Strong competition within our market area may reduce our ability to attract and retain deposits and originate loans.
We face competition both in originating loans and in attracting deposits. Competition in the financial services industry is intense. We compete for clients by offering excellent service and competitive rates on our loans and deposit products. The type of institutions we compete with include commercial banks, savings institutions, mortgage banking firms, credit unions, finance companies, mutual funds, insurance companies and brokerage and investment banking firms. Competition arises from institutions located within and outside our market areas. As a result of their size and ability to achieve economies of scale, certain of our competitors offer a broader range of products and services than we offer. The recent economic crisis is likely to result in increased consolidation in the financial industry and larger financial institutions may strengthen their competitive positions. In addition, to stay competitive in our markets we may need to adjust the interest rates on our products to match the rates offered by our competitors, which could adversely affect our net interest margin. As a result, our profitability depends upon our continued ability to successfully compete in our market areas while achieving our investment objectives.
Acquisition Risk
We may have difficulty in the future continuing to grow through acquisitions.
We may experience difficulty in making acquisitions on acceptable terms due to the decreasing number of suitable acquisition targets, competition for attractive acquisitions, and certain limitations on interstate acquisitions.
Any future acquisitions or mergers by CTBI or its banking subsidiary are subject to approval by the appropriate federal and state banking regulators. The banking regulators evaluate a number of criteria in making their approval decisions, such as:
|
·
|
Safety and soundness guidelines;
|
|
·
|
Compliance with all laws including the USA Patriot Act, the International Money Laundering Abatement and Anti-Terrorist Financing Act, the Sarbanes-Oxley Act and the related rules and regulations promulgated under such Act or the Exchange Act, the Equal Credit Opportunity Act, the Fair Housing Act, the Community Reinvestment Act, the Home Mortgage Disclosure Act, and all other applicable fair lending laws and other laws relating to discriminatory business practices; and
|
|
·
|
Anti-competitive concerns with the proposed transaction.
|
If the banking regulators or a commenter on our regulatory application raise concerns about any of these criteria at the time a regulatory application is filed, the banking regulators may deny, delay, or condition their approval of a proposed transaction.
We have grown, and intend to continue to grow, through acquisitions of banks and other financial institutions. After these acquisitions, we may experience adverse changes in results of operations of acquired entities, unforeseen liabilities, asset quality problems of acquired entities, loss of key personnel, loss of clients because of change of identity, difficulties in integrating data processing and operational procedures, and deterioration in local economic conditions. These various acquisition risks can be heightened in larger transactions.
Integration Risk
We may not be able to achieve the expected integration and cost savings from our ongoing bank acquisition activities.
We have a long history of acquiring financial institutions and we expect this acquisition activity to continue in the future. Difficulties may arise in the integration of the business and operations of the financial institutions that agree to merge with and into CTBI and, as a result, we may not be able to achieve the cost savings and synergies that we expect will result from the merger activities. Achieving cost savings is dependent on consolidating certain operational and functional areas, eliminating duplicative positions and terminating certain agreements for outside services. Additional operational savings are dependent upon the integration of the banking businesses of the acquired financial institution with that of CTBI, including the conversion of the acquired entity’s core operating systems, data systems and products to those of CTBI and the standardization of business practices. Complications or difficulties in the conversion of the core operating systems, data systems, and products of these other banks to those of CTBI may result in the loss of clients, damage to our reputation within the financial services industry, operational problems, one-time costs currently not anticipated by us, and/or reduced cost savings resulting from the merger activities.
Operational Risk
An extended disruption of vital infrastructure or a security breach could negatively impact our business, results of operations, and financial condition.
Our operations depend upon, among other things, our infrastructure, including equipment and facilities. Extended disruption of vital infrastructure by fire, power loss, natural disaster, telecommunications failure, computer hacking or viruses, terrorist activity or the domestic and foreign response to such activity, or other events outside of our control could have a material adverse impact on the financial services industry as a whole and on our business, results of operations, cash flows, and financial condition in particular. Our business recovery plan may not work as intended or may not prevent significant interruption of our operations. The occurrence of any failures, interruptions, or security breaches of our information systems could damage our reputation, result in the loss of customer business, subject us to additional regulatory scrutiny, or expose us to civil litigation and possible financial liability, any of which could have an adverse effect on our financial condition and results of operation.
Market Risk
Community Trust Bancorp, Inc.'s stock price is volatile.
Our stock price has been volatile in the past, and several factors could cause the price to fluctuate substantially in the future. These factors include:
|
·
|
Actual or anticipated variations in earnings;
|
|
·
|
Changes in analysts' recommendations or projections;
|
|
·
|
CTBI's announcements of developments related to our businesses;
|
|
·
|
Operating and stock performance of other companies deemed to be peers;
|
|
·
|
New technology used or services offered by traditional and non-traditional competitors;
|
|
·
|
News reports of trends, concerns, and other issues related to the financial services industry; and
|
|
·
|
Additional governmental policies and enforcement of current laws.
|
Our stock price may fluctuate significantly in the future, and these fluctuations may be unrelated to CTBI's performance. The financial crisis has impacted investor confidence in the financial institutions sector. General market price declines or market volatility in the future could adversely affect the price of our common stock, and the current market price may not be indicative of future market prices.
Technology Risk
CTBI continually encounters technological change.
The financial services industry is continually undergoing rapid technological change with frequent introductions of new technology-driven products and services. The effective use of technology increases efficiency and enables financial institutions to better serve customers and to reduce costs. Our future success depends, in part, upon our ability to address the needs of our customers by using technology to provide products and services that will satisfy customer demands, as well as to create additional efficiencies in our operations. Many of our competitors have substantially greater resources to invest in technological improvements. We may not be able to effectively implement new technology-driven products and services or be successful in marketing these products and services to our customers. Failure to successfully keep pace with technological change affecting the financial services industry could have a material adverse impact on our business and, in turn, our financial condition and results of operations.
Counterparty Risk
The soundness of other financial institutions could adversely affect CTBI.
Our ability to engage in routine funding transactions could be adversely affected by the actions and commercial soundness of other financial institutions. Financial services companies are interrelated as a result of trading, clearing, counterparty, or other relationships. We have exposure to many different industries and counterparties, and we routinely execute transactions with counterparties in the financial services industry, including brokers and dealers, commercial banks, investment banks, mutual and hedge funds, and other institutional counterparties. As a result, defaults by, or even rumors or questions about, one or more financial services companies, or the financial services industry generally, have led to market-wide liquidity problems and could lead to losses or defaults by us or by other institutions. Many of these transactions expose us to credit risk in the event of default of our counterparty or client. In addition, our credit risk may be exacerbated when the collateral held by us cannot be realized or is liquidated at prices not sufficient to recover the full amount of the loan or derivative exposure due us. There is no assurance that any such losses would not materially and adversely affect our businesses, financial condition, or results of operations.
None.
The following tables set forth certain statistical information relating to CTBI and subsidiaries on a consolidated basis and should be read together with our consolidated financial statements.
Consolidated Average Balance Sheets and Taxable Equivalent Income/Expense and Yields/Rates
|
2012
|
2011
|
2010
|
||||||||||||||||||||||||||||||||||
|
(in thousands)
|
Average
Balances
|
Interest
|
Average
Rate
|
Average
Balances
|
Interest
|
Average
Rate
|
Average
Balances
|
Interest
|
Average
Rate
|
|||||||||||||||||||||||||||
|
Earning assets:
|
||||||||||||||||||||||||||||||||||||
|
Loans (1)(2)(3)
|
$ | 2,549,459 | $ | 138,172 | 5.42 | % | $ | 2,580,351 | $ | 145,178 | 5.63 | % | $ | 2,461,225 | $ | 142,519 | 5.79 | % | ||||||||||||||||||
|
Loans held for sale
|
1,434 | 198 | 13.81 | 749 | 112 | 14.95 | 1,040 | 111 | 10.67 | |||||||||||||||||||||||||||
|
Securities:
|
||||||||||||||||||||||||||||||||||||
|
U.S. Treasury and agencies
|
480,562 | 10,292 | 2.14 | 350,612 | 8,992 | 2.56 | 249,835 | 7,983 | 3.20 | |||||||||||||||||||||||||||
|
Tax exempt state and political subdivisions (3)
|
69,773 | 3,191 | 4.57 | 51,565 | 2,634 | 5.11 | 43,128 | 2,456 | 5.69 | |||||||||||||||||||||||||||
|
Other securities
|
54,664 | 1,717 | 3.14 | 30,492 | 1,141 | 3.74 | 36,927 | 951 | 2.58 | |||||||||||||||||||||||||||
|
Federal Reserve Bank and Federal Home Loan Bank stock
|
30,557 | 1,433 | 4.69 | 30,412 | 1,374 | 4.52 | 29,183 | 1,351 | 4.63 | |||||||||||||||||||||||||||
|
Federal funds sold
|
3,372 | 11 | 0.33 | 31,000 | 84 | 0.27 | 89,598 | 234 | 0.26 | |||||||||||||||||||||||||||
|
Interest bearing deposits
|
155,233 | 379 | 0.24 | 132,269 | 315 | 0.24 | 37,989 | 85 | 0.22 | |||||||||||||||||||||||||||
|
Other investments
|
10,229 | 91 | 0.89 | 12,342 | 87 | 0.70 | 11,190 | 77 | 0.69 | |||||||||||||||||||||||||||
|
Investment in unconsolidated subsidiaries
|
1,851 | 72 | 3.89 | 1,856 | 120 | 6.47 | 1,856 | 120 | 6.47 | |||||||||||||||||||||||||||
|
Total earning assets
|
3,357,134 | $ | 155,556 | 4.63 | % | 3,221,648 | $ | 160,037 | 4.97 | % | 2,961,971 | $ | 155,887 | 5.26 | % | |||||||||||||||||||||
|
Allowance for loan and lease losses
|
(33,781 | ) | (35,808 | ) | (35,741 | ) | ||||||||||||||||||||||||||||||
| 3,323,353 | 3,185,840 | 2,926,230 | ||||||||||||||||||||||||||||||||||
|
Nonearning assets:
|
||||||||||||||||||||||||||||||||||||
|
Cash and due from banks
|
62,807 | 70,239 | 66,740 | |||||||||||||||||||||||||||||||||
|
Premises and equipment, net
|
54,962 | 55,445 | 49,468 | |||||||||||||||||||||||||||||||||
|
Other assets
|
200,538 | 194,379 | 177,649 | |||||||||||||||||||||||||||||||||
|
Total assets
|
$ | 3,641,660 | $ | 3,505,903 | $ | 3,220,087 | ||||||||||||||||||||||||||||||
| 2012 | 2011 | 2010 | ||||||||||||||||||||||||||||||||||
| (in thousands) | Average Balances | Interest |
Average
Rate
|
Average Balances | Interest | Average Rate | Average Balances | Interest | Average Rate | |||||||||||||||||||||||||||
|
Interest bearing liabilities:
|
||||||||||||||||||||||||||||||||||||
|
Deposits:
|
||||||||||||||||||||||||||||||||||||
|
Savings and demand deposits
|
$ | 878,825 | $ | 2,894 | 0.33 | % | $ | 777,639 | $ | 2,824 | 0.36 | % | $ | 668,255 | $ | 3,074 | 0.46 | % | ||||||||||||||||||
|
Time deposits
|
1,445,018 | 15,017 | 1.04 | 1,460,627 | 18,458 | 1.26 | 1,392,510 | 26,078 | 1.87 | |||||||||||||||||||||||||||
|
Repurchase agreements and federal funds purchased
|
222,872 | 1,240 | 0.56 | 219,040 | 1,625 | 0.74 | 198,880 | 2,027 | 1.02 | |||||||||||||||||||||||||||
|
Advances from Federal Home Loan Bank
|
2,439 | 34 | 1.39 | 21,670 | 99 | 0.46 | 20,286 | 79 | 0.39 | |||||||||||||||||||||||||||
|
Long-term debt
|
61,341 | 2,403 | 3.92 | 61,341 | 3,999 | 6.52 | 61,341 | 3,999 | 6.52 | |||||||||||||||||||||||||||
|
Total interest bearing liabilities
|
2,610,495 | $ | 21,588 | 0.83 | % | 2,540,317 | $ | 27,005 | 1.06 | % | 2,341,272 | $ | 35,257 | 1.51 | % | |||||||||||||||||||||
|
Noninterest bearing liabilities:
|
||||||||||||||||||||||||||||||||||||
|
Demand deposits
|
604,736 | 573,067 | 514,196 | |||||||||||||||||||||||||||||||||
|
Other liabilities
|
37,052 | 36,746 | 30,974 | |||||||||||||||||||||||||||||||||
|
Total liabilities
|
3,252,283 | 3,150,130 | 2,886,442 | |||||||||||||||||||||||||||||||||
|
Shareholders’ equity
|
389,377 | 355,773 | 333,645 | |||||||||||||||||||||||||||||||||
|
Total liabilities and shareholders’ equity
|
$ | 3,641,660 | $ | 3,505,903 | $ | 3,220,087 | ||||||||||||||||||||||||||||||
|
Net interest income, tax equivalent
|
$ | 133,968 | $ | 133,032 | $ | 120,630 | ||||||||||||||||||||||||||||||
|
Less tax equivalent interest income
|
1,834 | 1,577 | 1,376 | |||||||||||||||||||||||||||||||||
|
Net interest income
|
$ | 132,134 | $ | 131,455 | $ | 119,254 | ||||||||||||||||||||||||||||||
|
Net interest spread
|
3.80 | % | 3.91 | % | 3.75 | % | ||||||||||||||||||||||||||||||
|
Benefit of interest free funding
|
0.19 | 0.22 | 0.32 | |||||||||||||||||||||||||||||||||
|
Net interest margin
|
3.99 | % | 4.13 | % | 4.07 | % | ||||||||||||||||||||||||||||||
(1) Interest includes fees on loans of $1,954, $1,889, and $1,766 in 2012, 2011, and 2010, respectively.
(2) Loan balances include deferred loan origination costs and principal balances on nonaccrual loans.
(3) Tax exempt income on securities and loans is reported on a fully taxable equivalent basis using a 35% rate.
Net Interest Differential
The following table illustrates the approximate effect of volume and rate changes on net interest differentials between 2012 and 2011 and also between 2011 and 2010.
|
Total Change
|
Change Due to
|
Total Change
|
Change Due to
|
|||||||||||||||||||||
|
(in thousands)
|
2012/2011 |
Volume
|
Rate
|
2011/2010 |
Volume
|
Rate
|
||||||||||||||||||
|
Interest income:
|
||||||||||||||||||||||||
|
Loans
|
$ | (7,006 | ) | $ | (1,754 | ) | $ | (5,252 | ) | $ | 2,659 | $ | 6,775 | $ | (4,116 | ) | ||||||||
|
Loans held for sale
|
86 | 95 | (9 | ) | 1 | (26 | ) | 27 | ||||||||||||||||
|
U.S. Treasury and agencies
|
1,300 | 2,952 | (1,652 | ) | 1,009 | 2,793 | (1,784 | ) | ||||||||||||||||
|
Tax exempt state and political subdivisions
|
557 | 855 | (298 | ) | 178 | 448 | (270 | ) | ||||||||||||||||
|
Other securities
|
576 | 784 | (208 | ) | 190 | (145 | ) | 335 | ||||||||||||||||
|
Federal Reserve Bank and Federal Home Loan Bank stock
|
59 | 7 | 52 | 23 | 56 | (33 | ) | |||||||||||||||||
|
Federal funds sold
|
(73 | ) | (62 | ) | (11 | ) | (150 | ) | (148 | ) | (2 | ) | ||||||||||||
|
Interest bearing deposits
|
64 | 56 | 8 | 230 | 224 | 6 | ||||||||||||||||||
|
Other investments
|
4 | (13 | ) | 17 | 10 | 8 | 2 | |||||||||||||||||
|
Investment in unconsolidated subsidiaries
|
(48 | ) | 0 | (48 | ) | 0 | 0 | 0 | ||||||||||||||||
|
Total interest income
|
(4,481 | ) | 2,920 | (7,401 | ) | 4,150 | 9,985 | (5,835 | ) | |||||||||||||||
|
Interest expense:
|
||||||||||||||||||||||||
|
Savings and demand deposits
|
70 | 348 | (278 | ) | (250 | ) | 457 | (707 | ) | |||||||||||||||
|
Time deposits
|
(3,441 | ) | (199 | ) | (3,242 | ) | (7,620 | ) | 1,221 | (8,841 | ) | |||||||||||||
|
Repurchase agreements and federal funds purchased
|
(385 | ) | 28 | (413 | ) | (402 | ) | 190 | (592 | ) | ||||||||||||||
|
Advances from Federal Home Loan Bank
|
(65 | ) | (33 | ) | (32 | ) | 20 | 6 | 14 | |||||||||||||||
|
Long-term debt
|
(1,596 | ) | 0 | (1,596 | ) | 0 | 0 | 0 | ||||||||||||||||
|
Total interest expense
|
(5,417 | ) | 144 | (5,561 | ) | (8,252 | ) | 1,874 | (10,126 | ) | ||||||||||||||
|
Net interest income
|
$ | 936 | $ | 2,776 | $ | (1,840 | ) | $ | 12,402 | $ | 8,111 | $ | 4,291 | |||||||||||
For purposes of the above table, changes which are due to both rate and volume are allocated based on a percentage basis, using the absolute values of rate and volume variance as a basis for percentages. Income is stated at a fully taxable equivalent basis, assuming a 35% tax rate.
Investment Portfolio
The maturity distribution and weighted average interest rates of securities at December 31, 2012 are as follows:
Available-for-sale
|
Estimated Maturity at December 31, 2012
|
||||||||||||||||||||||||||||||||||||||||||||
|
Within 1 Year
|
1-5 Years
|
5-10 Years
|
After 10 Years
|
Total Fair Value
|
Amortized Cost
|
|||||||||||||||||||||||||||||||||||||||
|
(in thousands)
|
Amount
|
Yield
|
Amount
|
Yield
|
Amount
|
Yield
|
Amount
|
Yield
|
Amount
|
Yield
|
Amount
|
|||||||||||||||||||||||||||||||||
|
U.S. Treasury, government agencies, and government sponsored agency mortgage-backed securities
|
$ | 517 | 0.99 | % | $ | 22,504 | 2.71 | % | $ | 97,933 | 2.14 | % | $ | 323,542 | 2.39 | % | $ | 444,496 | 2.35 | % | $ | 430,871 | ||||||||||||||||||||||
|
State and political subdivisions
|
5,968 | 5.17 | 15,501 | 3.53 | 53,826 | 4.03 | 37,926 | 4.52 | 113,221 | 4.18 | 107,987 | |||||||||||||||||||||||||||||||||
|
Other securities
|
0 | 0.00 | 45,626 | 3.38 | 0 | 0.00 | 0 | 0.00 | 45,626 | 3.38 | 45,000 | |||||||||||||||||||||||||||||||||
|
Total
|
$ | 6,485 | 4.84 | % | $ | 83,631 | 3.23 | % | $ | 151,759 | 2.81 | % | $ | 361,468 | 2.61 | % | $ | 603,343 | 2.77 | % | $ | 583,858 | ||||||||||||||||||||||
Held-to-maturity
|
Estimated Maturity at December 31, 2012
|
||||||||||||||||||||||||||||||||||||||||||||
|
Within 1 Year
|
1-5 Years
|
5-10 Years
|
After 10 Years
|
Total
Amortized Cost
|
Fair
Value
|
|||||||||||||||||||||||||||||||||||||||
|
(in thousands)
|
Amount
|
Yield
|
Amount
|
Yield
|
Amount
|
Yield
|
Amount
|
Yield
|
Amount
|
Yield
|
Amount
|
|||||||||||||||||||||||||||||||||
|
U.S. Treasury, government agencies, and government sponsored agency mortgage-backed securities
|
$ | 0 | 0.00 | % | $ | 0 | 0.00 | % | $ | 0 | 0.00 | % | $ | 480 | 2.48 | % | $ | 480 | 2.48 | % | $ | 476 | ||||||||||||||||||||||
|
State and political subdivisions
|
0 | 0.00 | 0 | 0.00 | 1,182 | 4.30 | 0 | 0.00 | 1,182 | 4.30 | 1,183 | |||||||||||||||||||||||||||||||||
|
Total
|
$ | 0 | 0.00 | % | $ | 0 | 0.00 | % | $ | 1,182 | 4.30 | % | $ | 480 | 2.48 | % | $ | 1,662 | 3.78 | % | $ | 1,659 | ||||||||||||||||||||||
Total Securities
|
Estimated Maturity at December 31, 2012
|
||||||||||||||||||||||||||||||||||||||||||||
|
Within 1 Year
|
1-5 Years
|
5-10 Years
|
After 10 Years
|
Total
Book Value
|
Fair
Value
|
|||||||||||||||||||||||||||||||||||||||
|
(in thousands)
|
Amount
|
Yield
|
Amount
|
Yield
|
Amount
|
Yield
|
Amount
|
Yield
|
Amount
|
Yield
|
Amount
|
|||||||||||||||||||||||||||||||||
|
Total
|
$ | 6,485 | 4.84 | % | $ | 83,631 | 3.23 | % | $ | 152,941 | 2.82 | % | $ | 361,948 | 2.61 | % | $ | 605,005 | 2.77 | % | $ | 605,002 | ||||||||||||||||||||||
The calculations of the weighted average interest rates for each maturity category are based upon yield weighted by the respective costs of the securities. The weighted average rates on state and political subdivisions are computed on a taxable equivalent basis using a 35% tax rate.
Excluding those holdings of the investment portfolio in U.S. Treasury securities, government agencies, and government sponsored agency mortgage-backed securities, there were no securities of any one issuer that exceeded 10% of our shareholders’ equity at December 31, 2012.
The book values of securities available-for-sale and securities held-to-maturity as of December 31, 2012 and 2011 are presented in note 3 to the consolidated financial statements.
The book value of securities at December 31, 2010 is presented below:
|
(in thousands)
|
Available-for-Sale
|
Held-to-Maturity
|
||||||
|
U.S. Treasury and government agencies
|
$ | 29,154 | $ | 480 | ||||
|
State and political subdivisions
|
52,017 | 1,182 | ||||||
|
U.S. government sponsored agency mortgage-backed securities
|
230,905 | 0 | ||||||
|
Total debt securities
|
312,076 | 1,662 | ||||||
|
Marketable equity securities
|
20,582 | 0 | ||||||
|
Total securities
|
$ | 332,658 | $ | 1,662 | ||||
Loan Portfolio
|
(in thousands)
|
2012
|
2011
|
2010
|
2009
|
2008
|
|||||||||||||||
|
Commercial:
|
||||||||||||||||||||
|
Construction
|
$ | 119,447 | $ | 120,577 | $ | 135,091 | $ | 141,440 | $ | 156,425 | ||||||||||
|
Secured by real estate
|
807,213 | 798,887 | 807,049 | 707,500 | 663,663 | |||||||||||||||
|
Equipment lease financing
|
9,246 | 9,706 | 14,151 | 20,048 | 12,343 | |||||||||||||||
|
Commercial other
|
376,348 | 374,597 | 388,746 | 373,829 | 365,685 | |||||||||||||||
|
Total commercial
|
1,312,254 | 1,303,767 | 1,345,037 | 1,242,817 | 1,198,116 | |||||||||||||||
|
Residential:
|
||||||||||||||||||||
|
Real estate construction
|
55,041 | 53,534 | 56,910 | 51,311 | 56,298 | |||||||||||||||
|
Real estate mortgage
|
696,928 | 650,075 | 623,851 | 528,592 | 524,827 | |||||||||||||||
|
Home equity
|
82,292 | 84,841 | 85,103 | 82,135 | 84,567 | |||||||||||||||
|
Total residential
|
834,261 | 788,450 | 765,864 | 662,038 | 665,692 | |||||||||||||||
|
Consumer:
|
||||||||||||||||||||
|
Consumer direct
|
122,581 | 123,949 | 126,046 | 115,555 | 117,186 | |||||||||||||||
|
Consumer indirect
|
281,477 | 340,382 | 368,233 | 415,350 | 367,657 | |||||||||||||||
|
Total consumer
|
404,058 | 464,331 | 494,279 | 530,905 | 484,843 | |||||||||||||||
|
Total loans
|
$ | 2,550,573 | $ | 2,556,548 | $ | 2,605,180 | $ | 2,435,760 | $ | 2,348,651 | ||||||||||
|
Percent of total year-end loans
|
||||||||||||||||||||
|
Commercial:
|
||||||||||||||||||||
|
Construction
|
4.68 | % | 4.72 | % | 5.19 | % | 5.80 | % | 6.65 | % | ||||||||||
|
Secured by real estate
|
31.65 | 31.25 | 30.98 | 29.05 | 28.26 | |||||||||||||||
|
Equipment lease financing
|
0.36 | 0.38 | 0.54 | 0.82 | 0.53 | |||||||||||||||
|
Commercial other
|
14.76 | 14.65 | 14.92 | 15.35 | 15.57 | |||||||||||||||
|
Total commercial
|
51.45 | 51.00 | 51.63 | 51.02 | 51.01 | |||||||||||||||
|
Residential:
|
||||||||||||||||||||
|
Real estate construction
|
2.16 | 2.09 | 2.18 | 2.11 | 2.40 | |||||||||||||||
|
Real estate mortgage
|
27.32 | 25.43 | 23.95 | 21.70 | 22.35 | |||||||||||||||
|
Home equity
|
3.23 | 3.32 | 3.27 | 3.37 | 3.60 | |||||||||||||||
|
Total residential
|
32.71 | 30.84 | 29.40 | 27.18 | 28.35 | |||||||||||||||
|
Consumer:
|
||||||||||||||||||||
|
Consumer direct
|
4.80 | 4.85 | 4.84 | 4.74 | 4.99 | |||||||||||||||
|
Consumer indirect
|
11.04 | 13.31 | 14.13 | 17.06 | 15.65 | |||||||||||||||
|
Total consumer
|
15.84 | 18.16 | 18.97 | 21.80 | 20.64 | |||||||||||||||
|
Total loans
|
100.00 | % | 100.00 | % | 100.00 | % | 100.00 | % | 100.00 | % | ||||||||||
The total loans above are net of deferred loan fees and costs.
The following table shows the amounts of loans (excluding residential mortgages of 1-4 family residences, consumer loans and lease financing) which, based on the remaining scheduled repayments of principal are due in the periods indicated. Also, the amounts are classified according to sensitivity to changes in interest rates (fixed, variable).
|
Maturity at December 31, 2012
|
||||||||||||||||
|
(in thousands)
|
Within One Year
|
After One but Within Five Years
|
After Five Years
|
Total
|
||||||||||||
|
Commercial secured by real estate and commercial other
|
$ | 236,194 | $ | 232,935 | $ | 714,432 | $ | 1,183,561 | ||||||||
|
Commercial and real estate construction
|
92,995 | 22,136 | 59,357 | 174,488 | ||||||||||||
| $ | 329,189 | $ | 255,071 | $ | 773,789 | $ | 1,358,049 | |||||||||
|
Rate sensitivity:
|
||||||||||||||||
|
Fixed rate
|
$ | 69,997 | $ | 49,044 | $ | 103,689 | $ | 222,730 | ||||||||
|
Adjustable rate
|
259,192 | 206,027 | 670,100 | 1,135,319 | ||||||||||||
| $ | 329,189 | $ | 255,071 | $ | 773,789 | $ | 1,358,049 | |||||||||
Nonperforming Assets
|
(in thousands)
|
2012
|
2011
|
2010
|
2009
|
2008
|
|||||||||||||||
|
Nonaccrual loans
|
$ | 16,791 | $ | 25,753 | $ | 45,021 | $ | 32,247 | $ | 40,945 | ||||||||||
|
90 days or more past due and still accruing interest
|
19,215 | 11,515 | 17,014 | 9,067 | 11,245 | |||||||||||||||
|
Total nonperforming loans
|
36,006 | 37,268 | 62,035 | 41,314 | 52,190 | |||||||||||||||
|
Other repossessed assets
|
5 | 58 | 129 | 276 | 239 | |||||||||||||||
|
Foreclosed properties
|
46,986 | 56,545 | 42,935 | 37,333 | 10,425 | |||||||||||||||
|
Total nonperforming assets
|
$ | 82,997 | $ | 93,871 | $ | 105,099 | $ | 78,923 | $ | 62,854 | ||||||||||
|
Nonperforming assets to total loans and foreclosed properties
|
3.20 | % | 3.59 | % | 3.97 | % | 3.19 | % | 2.66 | % | ||||||||||
|
Allowance to nonperforming loans
|
92.33 | % | 89.01 | % | 56.10 | % | 79.01 | % | 59.06 | % | ||||||||||
Nonaccrual and Past Due Loans
|
(in thousands)
|
Nonaccrual loans
|
As a % of Loan Balances by Category
|
Accruing Loans Past Due 90 Days or More
|
As a % of Loan Balances by Category
|
Balances
|
|||||||||||||||
|
December 31, 2012
|
||||||||||||||||||||
|
Commercial construction
|
$ | 5,955 | 4.99 | % | $ | 3,778 | 3.16 | % | $ | 119,447 | ||||||||||
|
Commercial secured by real estate
|
5,572 | 0.69 | 5,943 | 0.74 | 807,213 | |||||||||||||||
|
Equipment lease financing
|
0 | 0.00 | 0 | 0.00 | 9,246 | |||||||||||||||
|
Commercial other
|
1,655 | 0.44 | 3,867 | 1.03 | 376,348 | |||||||||||||||
|
Real estate construction
|
315 | 0.57 | 196 | 0.36 | 55,041 | |||||||||||||||
|
Real estate mortgage
|
3,153 | 0.45 | 4,511 | 0.65 | 696,928 | |||||||||||||||
|
Home equity
|
141 | 0.17 | 441 | 0.54 | 82,292 | |||||||||||||||
|
Consumer direct
|
0 | 0.00 | 98 | 0.08 | 122,581 | |||||||||||||||
|
Consumer indirect
|
0 | 0.00 | 381 | 0.14 | 281,477 | |||||||||||||||
|
Total
|
$ | 16,791 | 0.66 | % | $ | 19,215 | 0.75 | % | $ | 2,550,573 | ||||||||||
|
December 31, 2011
|
||||||||||||||||||||
|
Commercial construction
|
$ | 7,029 | 5.83 | % | $ | 3,292 | 2.73 | % | $ | 120,577 | ||||||||||
|
Commercial secured by real estate
|
9,810 | 1.23 | 3,969 | 0.50 | 798,887 | |||||||||||||||
|
Equipment lease financing
|
0 | 0.00 | 0 | 0.00 | 9,706 | |||||||||||||||
|
Commercial other
|
3,914 | 1.04 | 619 | 0.17 | 374,597 | |||||||||||||||
|
Real estate construction
|
607 | 1.13 | 16 | 0.03 | 53,534 | |||||||||||||||
|
Real estate mortgage
|
4,204 | 0.65 | 2,719 | 0.42 | 650,075 | |||||||||||||||
|
Home equity
|
189 | 0.22 | 346 | 0.41 | 84,841 | |||||||||||||||
|
Consumer direct
|
0 | 0.00 | 71 | 0.06 | 123,949 | |||||||||||||||
|
Consumer indirect
|
0 | 0.00 | 483 | 0.14 | 340,382 | |||||||||||||||
|
Total
|
$ | 25,753 | 1.01 | % | $ | 11,515 | 0.45 | % | $ | 2,556,548 | ||||||||||
Discussion of the Nonaccrual Policy
The accrual of interest income on loans is discontinued when management believes, after considering economic and business conditions, collateral value, and collection efforts, that the borrower’s financial condition is such that the collection of interest is doubtful. Cash payments received on nonaccrual loans generally are applied against principal, and interest income is only recorded once principal recovery is reasonably assured. Any loans greater than 90 days past due must be well secured and in the process of collection to continue accruing interest. See note 1 for further discussion on our nonaccrual policy.
Potential Problem Loans
Interest accrual is discontinued when we believe, after considering economic and business conditions, collateral value, and collection efforts, that the borrower’s financial condition is such that collection of interest is doubtful.
Foreign Outstandings
None
Loan Concentrations
We had no concentration of loans exceeding 10% of total loans at December 31, 2012. See note 18 to the consolidated financial statements for further information.
Analysis of the Allowance for Loan and Lease Losses
|
(in thousands)
|
2012
|
2011
|
2010
|
2009
|
2008
|
|||||||||||||||
|
Allowance for loan and lease losses, beginning of year
|
$ | 33,171 | $ | 34,805 | $ | 32,643 | $ | 30,821 | $ | 28,054 | ||||||||||
|
Loans charged off:
|
||||||||||||||||||||
|
Commercial construction
|
1,034 | 2,510 | 1,695 | 3,435 | 1,491 | |||||||||||||||
|
Commercial secured by real estate
|
2,035 | 4,018 | 3,826 | 3,192 | 914 | |||||||||||||||
|
Commercial other
|
3,233 | 4,092 | 5,184 | 4,342 | 2,080 | |||||||||||||||
|
Real estate construction
|
189 | 319 | 22 | 330 | 125 | |||||||||||||||
|
Real estate mortgage
|
1,123 | 1,589 | 684 | 858 | 458 | |||||||||||||||
|
Home equity
|
248 | 171 | 358 | 223 | 288 | |||||||||||||||
|
Consumer direct
|
1,245 | 961 | 1,256 | 1,892 | 1,891 | |||||||||||||||
|
Consumer indirect
|
3,483 | 3,874 | 4,611 | 4,587 | 4,051 | |||||||||||||||
|
Total charge-offs
|
12,590 | 17,534 | 17,636 | 18,859 | 11,298 | |||||||||||||||
|
Recoveries of loans previously charged off:
|
||||||||||||||||||||
|
Commercial construction
|
35 | 30 | 6 | 204 | 25 | |||||||||||||||
|
Commercial secured by real estate
|
303 | 140 | 163 | 415 | 177 | |||||||||||||||
|
Commercial other
|
764 | 441 | 688 | 350 | 534 | |||||||||||||||
|
Real estate construction
|
28 | 26 | 19 | 7 | 5 | |||||||||||||||
|
Real estate mortgage
|
151 | 82 | 99 | 132 | 50 | |||||||||||||||
|
Home equity
|
11 | 16 | 23 | 18 | 10 | |||||||||||||||
|
Consumer direct
|
538 | 452 | 635 | 792 | 654 | |||||||||||||||
|
Consumer indirect
|
1,384 | 1,451 | 1,681 | 1,295 | 1,158 | |||||||||||||||
|
Total recoveries
|
3,214 | 2,638 | 3,314 | 3,213 | 2,613 | |||||||||||||||
|
Net charge-offs:
|
||||||||||||||||||||
|
Commercial construction
|
999 | 2,480 | 1,689 | 3,231 | 1,466 | |||||||||||||||
|
Commercial secured by real estate
|
1,732 | 3,878 | 3,663 | 2,777 | 737 | |||||||||||||||
|
Commercial other
|
2,469 | 3,651 | 4,496 | 3,992 | 1,546 | |||||||||||||||
|
Real estate construction
|
161 | 293 | 3 | 323 | 120 | |||||||||||||||
|
Real estate mortgage
|
972 | 1,507 | 585 | 726 | 408 | |||||||||||||||
|
Home equity
|
237 | 155 | 335 | 205 | 278 | |||||||||||||||
|
Consumer direct
|
707 | 509 | 621 | 1,100 | 1,237 | |||||||||||||||
|
Consumer indirect
|
2,099 | 2,423 | 2,930 | 3,292 | 2,893 | |||||||||||||||
|
Total net charge-offs
|
9,376 | 14,896 | 14,322 | 15,646 | 8,685 | |||||||||||||||
|
Provisions charged against operations
|
9,450 | 13,262 | 16,484 | 17,468 | 11,452 | |||||||||||||||
|
Balance, end of year
|
$ | 33,245 | $ | 33,171 | $ | 34,805 | $ | 32,643 | $ | 30,821 | ||||||||||
|
Allocation of allowance, end of year:
|
||||||||||||||||||||
|
Commercial construction
|
$ | 4,033 | $ | 4,023 | $ | 4,332 | $ | 3,381 | $ | 3,645 | ||||||||||
|
Commercial secured by real estate
|
13,541 | 11,753 | 12,327 | 10,961 | 11,304 | |||||||||||||||
|
Equipment lease financing
|
126 | 112 | 148 | 221 | 191 | |||||||||||||||
|
Commercial other
|
5,469 | 5,608 | 7,392 | 7,472 | 5,782 | |||||||||||||||
|
Real estate construction
|
376 | 354 | 271 | 291 | 281 | |||||||||||||||
|
Real estate mortgage
|
4,767 | 4,302 | 2,982 | 3,041 | 2,616 | |||||||||||||||
|
Home equity
|
563 | 562 | 407 | 455 | 422 | |||||||||||||||
|
Consumer direct
|
1,102 | 917 | 1,169 | 1,258 | 1,590 | |||||||||||||||
|
Consumer indirect
|
3,268 | 5,540 | 5,777 | 5,563 | 4,990 | |||||||||||||||
|
Balance, end of year
|
$ | 33,245 | $ | 33,171 | $ | 34,805 | $ | 32,643 | $ | 30,821 | ||||||||||
| (in thousands) | 2012 | 2011 | 2010 | 2009 | 2008 | |||||||||||||||
|
Average loans outstanding, net of deferred loan costs and fees
|
$ | 2,549,459 | $ | 2,580,351 | $ | 2,461,225 | $ | 2,383,875 | $ | 2,283,180 | ||||||||||
|
Loans outstanding at end of year, net of deferred loan costs and fees
|
$ | 2,550,573 | $ | 2,556,548 | $ | 2,605,180 | $ | 2,435,760 | $ | 2,348,651 | ||||||||||
|
Net charge-offs to average loan type:
|
||||||||||||||||||||
|
Commercial construction
|
0.86 | % | 1.93 | % | 1.20 | % | 2.22 | % | 0.98 | % | ||||||||||
|
Commercial secured by real estate
|
0.21 | 0.48 | 0.48 | 0.40 | 0.11 | |||||||||||||||
|
Commercial other
|
0.64 | 0.95 | 1.24 | 1.07 | 0.43 | |||||||||||||||
|
Real estate construction
|
0.30 | 0.58 | 0.01 | 0.64 | 0.19 | |||||||||||||||
|
Real estate mortgage
|
0.15 | 0.24 | 0.11 | 0.14 | 0.08 | |||||||||||||||
|
Home equity
|
0.28 | 0.18 | 0.40 | 0.25 | 0.33 | |||||||||||||||
|
Consumer direct
|
0.57 | 0.41 | 0.53 | 0.95 | 1.04 | |||||||||||||||
|
Consumer indirect
|
0.67 | 0.68 | 0.75 | 0.84 | 0.87 | |||||||||||||||
|
Total
|
0.37 | % | 0.58 | % | 0.58 | % | 0.66 | % | 0.38 | % | ||||||||||
|
Other ratios:
|
||||||||||||||||||||
|
Allowance to net loans, end of year
|
1.30 | % | 1.30 | % | 1.34 | % | 1.34 | % | 1.31 | % | ||||||||||
|
Provision for loan losses to average loans
|
0.37 | % | 0.51 | % | 0.67 | % | 0.73 | % | 0.50 | % | ||||||||||
The allowance for loan and lease losses balance is maintained at a level considered adequate to cover anticipated probable losses based on past loss experience, general economic conditions, information about specific borrower situations including their financial position and collateral values, and other factors and estimates which are subject to change over time. This analysis is completed quarterly and forms the basis for allocation of the loan loss reserve and what charges to the provision may be required. See notes 1, 4, and 7 to the consolidated financial statements for further information.
Average Deposits and Other Borrowed Funds
|
(in thousands)
|
2012
|
2011
|
2010
|
|||||||||
|
Deposits:
|
||||||||||||
|
Noninterest bearing deposits
|
$ | 604,736 | $ | 573,067 | $ | 514,196 | ||||||
|
NOW accounts
|
23,678 | 21,622 | 20,919 | |||||||||
|
Money market accounts
|
568,217 | 500,179 | 422,329 | |||||||||
|
Savings accounts
|
286,930 | 255,838 | 225,007 | |||||||||
|
Certificates of deposit of $100,000 or more
|
648,035 | 632,961 | 576,382 | |||||||||
|
Certificates of deposit < $100,000 and other time deposits
|
796,983 | 827,666 | 816,128 | |||||||||
|
Total deposits
|
2,928,579 | 2,811,333 | 2,574,961 | |||||||||
|
Other borrowed funds:
|
||||||||||||
|
Repurchase agreements and federal funds purchased
|
222,872 | 219,040 | 198,880 | |||||||||
|
Advances from Federal Home Loan Bank
|
2,439 | 21,670 | 20,286 | |||||||||
|
Long-term debt
|
61,341 | 61,341 | 61,341 | |||||||||
|
Total other borrowed funds
|
286,652 | 302,051 | 280,507 | |||||||||
|
Total deposits and other borrowed funds
|
$ | 3,215,231 | $ | 3,113,384 | $ | 2,855,468 | ||||||
The maximum balance for federal funds purchased and repurchase agreements at any month-end during 2012 occurred at March 31, 2012, with a month-end balance of $246.1 million. The maximum balance for federal funds purchased and repurchase agreements at any month-end during 2011 occurred at September 30, 2011, with a month-end balance of $245.3 million. The maximum balance for federal funds purchased and repurchase agreements at any month-end during 2010 occurred at November 30, 2010, with a month-end balance of $210.7 million.
Maturities and/or repricing of time deposits of $100,000 or more outstanding at December 31, 2012 are summarized as follows:
|
(in thousands)
|
Certificates of Deposit
|
Other Time Deposits
|
Total
|
|||||||||
|
Three months or less
|
$ | 146,910 | $ | 10,026 | $ | 156,936 | ||||||
|
Over three through six months
|
110,335 | 8,524 | 118,859 | |||||||||
|
Over six through twelve months
|
306,877 | 17,033 | 323,910 | |||||||||
|
Over twelve through sixty months
|
79,507 | 13,455 | 92,962 | |||||||||
|
Over sixty months
|
0 | 0 | 0 | |||||||||
| $ | 643,629 | $ | 49,038 | $ | 692,667 | |||||||
Our main office, which is owned by Community Trust Bank, Inc., is located at 346 North Mayo Trail, Pikeville, Kentucky 41501. Following is a schedule of properties owned and leased by CTBI and its subsidiaries as of December 31, 2012:
|
Location
|
Owned
|
Leased
|
Total
|
||
|
Banking locations:
|
|||||
|
Community Trust Bank, Inc.
|
|||||
|
*
|
Pikeville Market (lease land to 3 owned locations)
|
9
|
1
|
10
|
|
|
10 locations in Pike County, Kentucky
|
|||||
|
Floyd/Knott/Johnson Market (lease land to 1 owned location)
|
3
|
1
|
4
|
||
|
2 locations in Floyd County, Kentucky, 1 location in Knott County, Kentucky, and 1 location in Johnson County, Kentucky
|
|||||
|
Tug Valley Market (lease land to 1 owned location)
|
2
|
0
|
2
|
||
|
1 location in Pike County, Kentucky, 1 location in Mingo County, West Virginia
|
|||||
|
Whitesburg Market (lease land to 1 owned location)
|
4
|
1
|
5
|
||
|
5 locations in Letcher County, Kentucky
|
|||||
|
Hazard Market (lease land to 2 owned locations)
|
4
|
0
|
4
|
||
|
4 locations in Perry County, Kentucky
|
|||||
|
*
|
Lexington Market (lease land to 3 owned locations)
|
4
|
2
|
6
|
|
|
6 locations in Fayette County, Kentucky
|
|||||
|
Winchester Market
|
2
|
0
|
2
|
||
|
2 locations in Clark County, Kentucky
|
|||||
|
Richmond Market (lease land to 1 owned location)
|
3
|
0
|
3
|
||
|
3 locations in Madison County, Kentucky
|
|||||
|
Mt. Sterling Market
|
2
|
0
|
2
|
||
|
2 locations in Montgomery County, Kentucky
|
|||||
|
*
|
Versailles Market (lease land to 1 owned locations)
|
2
|
3
|
5
|
|
|
2 locations in Woodford County, Kentucky, 2 locations in Franklin County, Kentucky, and 1 location in Scott County, Kentucky
|
|||||
|
Danville Market (lease land to 1 owned location)
|
3
|
0
|
3
|
||
|
2 locations in Boyle County, Kentucky and 1 location in Mercer County, Kentucky
|
|||||
|
*
|
Ashland Market (lease land to 1 owned location)
|
5
|
0
|
5
|
|
|
4 locations in Boyd County, Kentucky and 1 location in Greenup County, Kentucky
|
|||||
|
Flemingsburg Market
|
3
|
0
|
3
|
||
|
3 locations in Fleming County, Kentucky
|
|||||
|
Advantage Valley Market
|
3
|
1
|
4
|
||
|
2 locations in Lincoln County, West Virginia, 1 location in Wayne County, West Virginia, and 1 location in Cabell County, West Virginia
|
|||||
|
Summersville Market
|
1
|
0
|
1
|
||
|
1 location in Nicholas County, West Virginia
|
|||||
|
Middlesboro Market (lease land to 1 owned location)
|
3
|
0
|
3
|
||
|
3 locations in Bell County, Kentucky
|
|||||
|
Williamsburg Market
|
5
|
0
|
5
|
||
|
2 locations in Whitley County, Kentucky and 3 locations in Laurel County, Kentucky
|
|||||
|
Campbellsville Market (lease land to 2 owned locations)
|
8
|
0
|
8
|
||
|
2 locations in Taylor County, Kentucky, 2 locations in Pulaski County, Kentucky, 1 location in Adair County, Kentucky, 1 location in Green County, Kentucky, 1 location in Russell County, Kentucky, and 1 location in Marion County, Kentucky
|
|||||
|
Mt. Vernon Market
|
2
|
0
|
2
|
||
|
2 locations in Rockcastle County, Kentucky
|
|||||
|
*
|
LaFollette Market
|
3
|
1
|
4
|
|
|
3 locations in Campbell County, Tennessee and 1 location in Anderson County, Tennessee
|
|||||
|
Total banking locations
|
71
|
10
|
81
|
||
|
Operational locations:
|
|||||
|
Community Trust Bank, Inc.
|
|||||
|
Pikeville (Pike County, Kentucky) (lease land to 1 owned location)
|
1
|
0
|
1
|
||
|
Lexington (Fayette County, Kentucky)
|
0
|
1
|
1
|
||
|
Total operational locations
|
1
|
1
|
2
|
||
|
Total locations
|
72
|
11
|
83
|
||
*Community Trust and Investment Company has leased offices in the main office locations in these markets.
See notes 8 and 15 to the consolidated financial statements included herein for the year ended December 31, 2012, for additional information relating to lease commitments and amounts invested in premises and equipment.
CTBI and subsidiaries, and from time to time, our officers, are named defendants in legal actions arising from ordinary business activities. Management, after consultation with legal counsel, believes any pending actions are without merit or that the ultimate liability, if any, will not materially affect our consolidated financial position or results of operations.
Not applicable.
Our common stock is listed on The NASDAQ-Stock Market LLC – Global Select Market under the symbol CTBI. As of February 28, 2013, there were approximately 6,900 holders of record of our outstanding common shares.
Dividends
The annual dividend paid to our stockholders was increased from $1.23 per share to $1.25 per share during 2012. We have adopted a conservative policy of cash dividends by maintaining an average annual cash dividend ratio of less than 45%, with periodic stock dividends. The current year cash dividend ratio was 43.1%. Dividends are typically paid on a quarterly basis. Future dividends are subject to the discretion of CTBI’s Board of Directors, cash needs, general business conditions, dividends from our subsidiaries, and applicable governmental regulations and policies. For information concerning restrictions on dividends from the subsidiary bank to CTBI, see note 20 to the consolidated financial statements included herein for the year ended December 31, 2012.
Stock Repurchases
CTBI did not acquire any shares of common stock through the stock repurchase program during the years 2012 and 2011. There are 288,519 shares remaining under CTBI's current repurchase authorization. For further information, see the Stock Repurchase Program section of Item 7.
Management’s Discussion and Analysis of Financial Condition and Results of Operations.
Common Stock Performance
The following graph shows the cumulative return experienced by CTBI's shareholders during the last five years compared to the NASDAQ Stock Market (U.S.) and the NASDAQ Bank Stock Index. The graph assumes the investment of $100 on December 31, 2007 in CTBI's common stock and in each index and the reinvestment of all dividends paid during the five-year period.
Comparison of 5 Year Cumulative Total Return
among Community Trust Bancorp, Inc., NASDAQ Stock Market (U.S.),
and NASDAQ Bank Stocks
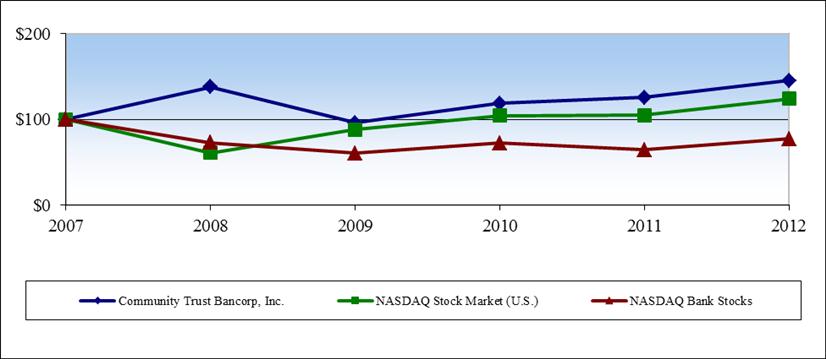
|
Fiscal Year Ending December 31 ($)
|
||||||
|
2007
|
2008
|
2009
|
2010
|
2011
|
2012
|
|
|
Community Trust Bancorp, Inc.
|
100.00
|
137.74
|
96.14
|
118.63
|
125.55
|
145.22
|
|
NASDAQ Stock Market (U.S.)
|
100.00
|
61.17
|
87.93
|
104.13
|
104.69
|
123.85
|
|
NASDAQ Bank Stocks
|
100.00
|
72.91
|
60.66
|
72.13
|
64.51
|
77.18
|
(in thousands except ratios, per share amounts and # of employees)
|
Year Ended December 31
|
2012
|
2011
|
2010
|
2009
|
2008
|
|||||||||||||||
|
Interest income
|
$ | 153,722 | $ | 158,460 | $ | 154,511 | $ | 153,050 | $ | 167,611 | ||||||||||
|
Interest expense
|
21,588 | 27,005 | 35,257 | 47,540 | 63,974 | |||||||||||||||
|
Net interest income
|
132,134 | 131,455 | 119,254 | 105,510 | 103,637 | |||||||||||||||
|
Provision for loan losses
|
9,450 | 13,262 | 16,484 | 17,468 | 11,452 | |||||||||||||||
|
Noninterest income
|
45,957 | 43,832 | 40,926 | 41,420 | 21,767 | |||||||||||||||
|
Noninterest expense
|
103,554 | 106,387 | 96,050 | 93,801 | 82,532 | |||||||||||||||
|
Income before income taxes
|
65,087 | 55,638 | 47,646 | 35,661 | 31,420 | |||||||||||||||
|
Income taxes
|
20,225 | 16,811 | 14,612 | 10,602 | 8,347 | |||||||||||||||
|
Net income
|
$ | 44,862 | $ | 38,827 | $ | 33,034 | $ | 25,059 | $ | 23,073 | ||||||||||
|
Per common share:
|
||||||||||||||||||||
|
Basic earnings per share
|
$ | 2.90 | $ | 2.54 | $ | 2.17 | $ | 1.66 | $ | 1.54 | ||||||||||
|
Diluted earnings per share
|
$ | 2.89 | $ | 2.53 | $ | 2.16 | $ | 1.65 | $ | 1.52 | ||||||||||
|
Cash dividends declared-
|
$ | 1.25 | $ | 1.23 | $ | 1.21 | $ | 1.20 | $ | 1.17 | ||||||||||
|
as a % of net income
|
43.10 | % | 48.43 | % | 55.76 | % | 72.29 | % | 75.97 | % | ||||||||||
|
Book value, end of year
|
$ | 25.64 | $ | 23.78 | $ | 22.08 | $ | 21.15 | $ | 20.44 | ||||||||||
|
Market price, end of year
|
$ | 32.78 | $ | 29.42 | $ | 28.96 | $ | 24.45 | $ | 36.75 | ||||||||||
|
Market to book value, end of year
|
1.28 | x | 1.24 | x | 1.31 | x | 1.16 | x | 1.80 | x | ||||||||||
|
Price/earnings ratio, end of year
|
11.30 | x | 11.58 | x | 13.35 | x | 14.73 | x | 23.86 | x | ||||||||||
|
Cash dividend yield, end of year
|
3.81 | % | 4.18 | % | 4.18 | % | 4.91 | % | 3.18 | % | ||||||||||
|
At year-end:
|
||||||||||||||||||||
|
Total assets
|
$ | 3,635,664 | $ | 3,591,179 | $ | 3,355,872 | $ | 3,086,659 | $ | 2,954,531 | ||||||||||
|
Long-term debt
|
61,341 | 61,341 | 61,341 | 61,341 | 61,341 | |||||||||||||||
|
Shareholders’ equity
|
400,344 | 366,866 | 338,638 | 321,457 | 308,206 | |||||||||||||||
|
Averages:
|
||||||||||||||||||||
|
Assets
|
$ | 3,641,660 | $ | 3,505,903 | $ | 3,220,087 | $ | 3,047,100 | $ | 2,921,217 | ||||||||||
|
Deposits
|
2,928,579 | 2,811,333 | 2,574,961 | 2,409,848 | 2,303,720 | |||||||||||||||
|
Earning assets
|
3,357,134 | 3,221,648 | 2,961,971 | 2,830,701 | 2,703,054 | |||||||||||||||
|
Loans
|
2,549,459 | 2,580,351 | 2,461,225 | 2,383,875 | 2,283,180 | |||||||||||||||
|
Shareholders’ equity
|
389,377 | 355,773 | 333,645 | 317,711 | 308,401 | |||||||||||||||
|
Profitability ratios:
|
||||||||||||||||||||
|
Return on average assets
|
1.23 | % | 1.11 | % | 1.03 | % | 0.82 | % | 0.79 | % | ||||||||||
|
Return on average equity
|
11.52 | 10.91 | 9.90 | 7.89 | 7.48 | |||||||||||||||
|
Capital ratios:
|
||||||||||||||||||||
|
Equity to assets, end of year
|
11.01 | % | 10.22 | % | 10.09 | % | 10.41 | % | 10.43 | % | ||||||||||
|
Average equity to average assets
|
10.69 | 10.15 | 10.36 | 10.43 | 10.56 | |||||||||||||||
|
Risk based capital ratios:
|
||||||||||||||||||||
|
Tier 1 capital
|
||||||||||||||||||||
|
(to average assets)
|
10.65 | % | 9.89 | % | 10.16 | % | 10.38 | % | 10.37 | % | ||||||||||
|
Tier 1 capital
|
||||||||||||||||||||
|
(to risk weighted assets)
|
15.23 | 13.88 | 12.90 | 12.90 | 13.05 | |||||||||||||||
|
Total capital
|
||||||||||||||||||||
|
(to risk weighted assets)
|
16.49 | 15.14 | 14.10 | 14.15 | 14.30 | |||||||||||||||
|
Other significant ratios:
|
||||||||||||||||||||
|
Allowance to net loans, end of year
|
1.30 | % | 1.30 | % | 1.34 | % | 1.34 | % | 1.31 | % | ||||||||||
|
Allowance to nonperforming loans, end of year
|
92.33 | 89.01 | 56.10 | 79.01 | 59.06 | |||||||||||||||
|
Nonperforming assets to loans and foreclosed properties, end of year
|
3.20 | 3.59 | 3.97 | 3.19 | 2.66 | |||||||||||||||
|
Net interest margin
|
3.99 | 4.13 | 4.07 | 3.77 | 3.88 | |||||||||||||||
|
Efficiency ratio
|
57.93 | 60.23 | 59.45 | 63.56 | 58.39 | |||||||||||||||
|
Other statistics:
|
||||||||||||||||||||
|
Average common shares outstanding
|
15,466 | 15,313 | 15,234 | 15,129 | 15,017 | |||||||||||||||
|
Number of full-time equivalent employees, end of year
|
1,035 | 1,015 | 1,041 | 982 | 986 | |||||||||||||||
Quarterly Financial Data
(Unaudited)
(in thousands except ratios and per share amounts)
|
Three Months Ended
|
December 31
|
September 30
|
June 30
|
March 31
|
||||||||||||
|
2012
|
||||||||||||||||
|
Net interest income
|
$ | 33,763 | $ | 33,046 | $ | 32,319 | $ | 33,006 | ||||||||
|
Net interest income, taxable equivalent basis
|
34,221 | 33,518 | 32,785 | 33,444 | ||||||||||||
|
Provision for loan losses
|
2,946 | 2,919 | 2,425 | 1,160 | ||||||||||||
|
Noninterest income
|
11,943 | 10,838 | 11,989 | 11,187 | ||||||||||||
|
Noninterest expense
|
27,843 | 25,813 | 24,148 | 25,750 | ||||||||||||
|
Net income
|
10,552 | 10,209 | 12,232 | 11,869 | ||||||||||||
|
Per common share:
|
||||||||||||||||
|
Basic earnings per share
|
$ | 0.68 | $ | 0.66 | $ | 0.79 | $ | 0.77 | ||||||||
|
Diluted earnings per share
|
0.68 | 0.66 | 0.79 | 0.77 | ||||||||||||
|
Dividends declared
|
0.315 | 0.315 | 0.31 | 0.31 | ||||||||||||
|
Common stock price:
|
||||||||||||||||
|
High
|
$ | 36.40 | $ | 36.92 | $ | 33.68 | $ | 32.67 | ||||||||
|
Low
|
29.60 | 33.15 | 30.25 | 29.13 | ||||||||||||
|
Last trade
|
32.78 | 35.53 | 33.49 | 32.07 | ||||||||||||
|
Selected ratios:
|
||||||||||||||||
|
Return on average assets, annualized
|
1.15 | % | 1.11 | % | 1.35 | % | 1.32 | % | ||||||||
|
Return on average common equity, annualized
|
10.47 | 10.26 | 12.77 | 12.72 | ||||||||||||
|
Net interest margin, annualized
|
4.03 | 3.96 | 3.93 | 4.05 | ||||||||||||
|
Three Months Ended
|
December 31
|
September 30
|
June 30
|
March 31
|
||||||||||||
|
2011
|
||||||||||||||||
|
Net interest income
|
$ | 32,908 | $ | 33,095 | $ | 32,878 | $ | 32,574 | ||||||||
|
Net interest income, taxable equivalent basis
|
33,325 | 33,509 | 33,258 | 32,940 | ||||||||||||
|
Provision for loan losses
|
3,040 | 2,515 | 3,320 | 4,387 | ||||||||||||
|
Noninterest income
|
11,559 | 10,942 | 10,593 | 10,738 | ||||||||||||
|
Noninterest expense
|
26,867 | 25,827 | 27,146 | 26,547 | ||||||||||||
|
Net income
|
9,888 | 10,665 | 8,970 | 9,304 | ||||||||||||
|
Per common share:
|
||||||||||||||||
|
Basic earnings per share
|
$ | 0.64 | $ | 0.70 | $ | 0.59 | $ | 0.61 | ||||||||
|
Diluted earnings per share
|
0.64 | 0.70 | 0.58 | 0.61 | ||||||||||||
|
Dividends declared
|
0.31 | 0.31 | 0.305 | 0.305 | ||||||||||||
|
Common stock price:
|
||||||||||||||||
|
High
|
$ | 29.99 | $ | 28.82 | $ | 28.74 | $ | 30.35 | ||||||||
|
Low
|
22.28 | 22.64 | 26.00 | 27.03 | ||||||||||||
|
Last trade
|
29.42 | 23.29 | 27.72 | 27.67 | ||||||||||||
|
Selected ratios:
|
||||||||||||||||
|
Return on average assets, annualized
|
1.09 | % | 1.20 | % | 1.03 | % | 1.11 | % | ||||||||
|
Return on average common equity, annualized
|
10.71 | 11.75 | 10.23 | 10.96 | ||||||||||||
|
Net interest margin, annualized
|
3.98 | 4.11 | 4.17 | 4.27 | ||||||||||||
Overview
The following Management's Discussion and Analysis of Financial Condition and Results of Operations (“MD&A”) is intended to help the reader understand Community Trust Bancorp, Inc., our operations, and our present business environment. The MD&A is provided as a supplement to—and should be read in conjunction with—our consolidated financial statements and the accompanying notes thereto contained in Item 8 of this annual report. The MD&A includes the following sections:
|
v
|
Our Business
|
|
v
|
Financial Goals and Performance
|
|
v
|
Results of Operations and Financial Condition
|
|
v
|
Contractual Obligations and Commitments
|
|
v
|
Liquidity and Market Risk
|
|
v
|
Interest Rate Risk
|
|
v
|
Capital Resources
|
|
v
|
Impact of Inflation, Changing Prices, and Economic Conditions
|
|
v
|
Stock Repurchase Program
|
|
v
|
Critical Accounting Policies and Estimates
|
Our Business
Community Trust Bancorp, Inc. (“CTBI”) is a bank holding company headquartered in Pikeville, Kentucky. Currently, we own one commercial bank and one trust company. Through our subsidiaries, we have eighty-one banking locations in eastern, northeastern, central, and south central Kentucky, southern West Virginia, and northeastern Tennessee, four trust offices across Kentucky, and one trust office in northeastern Tennessee. At December 31, 2012, we had total consolidated assets of $3.6 billion and total consolidated deposits, including repurchase agreements, of $3.1 billion, making us the largest bank holding company headquartered in the Commonwealth of Kentucky. Total shareholders’ equity at December 31, 2012 was $400.3 million.
Through our subsidiaries, we engage in a wide range of commercial and personal banking and trust and wealth management activities, which include accepting time and demand deposits; making secured and unsecured loans to corporations, individuals and others; providing cash management services to corporate and individual customers; issuing letters of credit; renting safe deposit boxes; and providing funds transfer services. The lending activities of our Bank include making commercial, construction, mortgage, and personal loans. Lease-financing, lines of credit, revolving lines of credit, term loans, and other specialized loans, including asset-based financing, are also available. Our corporate subsidiaries act as trustees of personal trusts, as executors of estates, as trustees for employee benefit trusts, as registrars, transfer agents, and paying agents for bond and stock issues, as depositories for securities, and as providers of full service brokerage services. For further information, see Item 1 of this annual report.
Financial Goals and Performance
The following table shows the primary measurements used by management to assess annual performance. The goals in the table below should not be viewed as a forecast of our performance for 2013. Rather, the goals represent a range of target performance for 2013. There is no assurance that any or all of these goals will be achieved. See “Cautionary Statement Regarding Forward Looking Statements.”
| 2012 Goals | 2012 Performance | Variance | 2013 Goals | |
|
Earnings per share
|
$2.63
|
$2.90
|
$0.27
|
$2.90 - $3.06
|
|
Net income
|
$40.7 million
|
$44.9 million
|
$4.2 million
|
$45.2 - $48.0 million
|
|
ROAA
|
1.11%
|
1.23%
|
0.12%
|
1.22% - 1.28%
|
|
ROAE
|
10.74%
|
11.52%
|
0.78%
|
11.15% - 11.21%
|
|
Revenues
|
$182.6 million
|
$178.1 million
|
($4.5 million)
|
$180.6 - $190.6 million
|
|
Noninterest revenue
as of % of total revenue
|
22.3%
|
25.8%
|
3.5%
|
22.0% - 27.0%
|
|
Assets
|
$3.7 billion
|
$3.6 billion
|
($0.1 billion)
|
$3.6 - $3.8 billion
|
|
Loans
|
$2.7 billion
|
$2.6 billion
|
($0.1 billion)
|
$2.6 - $2.8 billion
|
|
Deposits
,
including repurchase agreements
|
$3.2 billion
|
$3.1 billion
|
($0.1 billion)
|
$3.1 - $3.3 billion
|
|
Shareholders’ equity
|
$388.2 million
|
$400.3 million
|
$12.1 million
|
$425 - $431 million
|
Results of Operations and Financial Condition
For the year ended December 31, 2012, we reported record earnings of $44.9 million, or $2.90 per basic share, an increase of 15.5% from the $38.8 million, or $2.54 per basic share, earned during the year ended December 31, 2011. Earnings for the year ended December 31, 2010 were $33.0 million or $2.17 per basic share.
2012 Highlights
|
v
|
Basic earnings per share for the year 2012 increased $0.36 per share from prior year. The increase in earnings from prior year was supported by increased net interest income and noninterest income and decreased provision for loan loss and noninterest expense.
|
|
v
|
Net interest income for the year increased 0.5% while our net interest margin declined 14 basis points.
|
|
v
|
Our nonperforming loans at $36.0 million decreased $1.3 million from December 31, 2011. Nonperforming assets at $83.0 million were a $10.9 million decrease from prior year.
|
|
v
|
Net loan charge-offs for the year 2012 were $9.4 million, or 0.37% of average loans, compared to $14.9 million, or 0.58% of average loans, for the year 2011.
|
|
v
|
Our loan loss provision for the year 2012 was $3.8 million below 2011 as net charge-offs declined $5.5 million and loans declined $6.0 million.
|
|
v
|
Our loan loss reserve as a percentage of total loans outstanding remained at 1.30% from December 31, 2011 to December 31, 2012. Our reserve coverage (allowance for loan loss reserve to nonperforming loans) at December 31, 2012 was 92.3% compared to 89.0% at December 31, 2011.
|
|
v
|
Noninterest income for the year 2012 increased 4.8% as a result of increased gains on sales of loans, trust revenue, and loan related fees, as well as a $1.0 million increase in net securities gains.
|
|
v
|
Noninterest expense for the year decreased 2.7% from prior year as a result of decreases in FDIC insurance premiums, legal fees, other real estate owned expense, and repossession expense, partially offset by an increase in personnel expense.
|
|
v
|
Our loan portfolio decreased $6.0 million from prior year.
|
|
v
|
Our investment portfolio increased $75.9 million from prior year.
|
|
v
|
Deposits, including repurchase agreements, increased $18.4 million from prior year.
|
|
v
|
Our tangible common equity/tangible assets ratio remains strong at 9.36%.
|
|
(
dollars in thousands)
|
Change 2012 vs. 2011
|
|||||||||||||||||||
|
Year Ended December 31
|
2012
|
2011
|
2010
|
Amount
|
Percent
|
|||||||||||||||
|
Net interest income
|
$ | 132,134 | $ | 131,455 | $ | 119,254 | $ | 679 | 0.5 | % | ||||||||||
|
Provision for loan losses
|
9,450 | 13,262 | 16,484 | (3,812 | ) | (28.7 | ) | |||||||||||||
|
Noninterest income
|
45,957 | 43,832 | 40,926 | 2,125 | 4.8 | |||||||||||||||
|
Noninterest expense
|
103,554 | 106,387 | 96,050 | (2,833 | ) | (2.7 | ) | |||||||||||||
|
Income taxes
|
20,225 | 16,811 | 14,612 | 3,414 | 20.3 | |||||||||||||||
|
Net income
|
$ | 44,862 | $ | 38,827 | $ | 33,034 | $ | 6,035 | 15.5 | % | ||||||||||
|
Average earning assets
|
$ | 3,357,134 | $ | 3,221,648 | $ | 2,961,971 | $ | 135,486 | 4.2 | % | ||||||||||
|
Yield on average earnings assets
|
4.63 | % | 4.97 | % | 5.26 | % | (0.34 | )% | (6.8 | )% | ||||||||||
|
Cost of interest bearing funds
|
0.83 | % | 1.06 | % | 1.51 | % | (0.23 | )% | (21.7 | )% | ||||||||||
|
Net interest margin
|
3.99 | % | 4.13 | % | 4.07 | % | (0.14 | %) | (3.4 | %) | ||||||||||
Net Interest Income
Net interest income for the year 2012 increased $0.7 million as our net interest margin declined 14 basis points and average earning assets increased 4.2%. Our yield on average earning assets decreased 34 basis points from prior year. Loans represented 75.9% of our average earning assets for the year ended December 31, 2012, compared to 80.1% for the year ended December 31, 2011. Our cost of interest bearing funds decreased 23 basis points from prior year. The increased cost of our Hoops CD product resulting from the University of Kentucky’s national championship win increased our cost of interest bearing funds and decreased our net interest margin by approximately 4 basis points for the year.
We experienced a 6 basis point improvement in our net interest margin for the year 2011 compared to prior year. Average earning assets for the year increased 8.8% from prior year, and the yield on average earning assets decreased 29 basis points. The decline in yield on earning assets was the result of a change in our earning asset mix. Loans represented 80.1% of our average earning assets for the year ended December 31, 2011, compared to 83.1% for the year ended December 31, 2010. As deposits, including repurchase agreements, increased and loan demand slowed, management chose to invest the excess liquidity in our investment portfolio. The cost of interest bearing funds decreased 45 basis points from prior year, primarily the result of the repricing of our CD products.
Provision for Loan Losses
The provision for loan losses that was added to the allowance for 2012 of $9.5 million was a $3.8 million decrease from prior year. This provision represented a charge against current earnings in order to maintain the allowance at an appropriate level determined using the accounting estimates described in the Critical Accounting Policies and Estimates section.
The provision for loan losses that was added to the allowance for 2011 of $13.3 million was a $3.2 million decrease from 2010.
Noninterest Income
Noninterest income for the year ended December 31, 2012 increased 4.8% from prior year. The year over year increase was a result of increased gains on sales of loans, trust revenue, and loan related fees, partially offset by a decline in deposit service charges. Deposit service charges were negatively impacted by a change in the processing of overdraft items. Loan related fees were impacted by a $0.8 million variance year over year in adjustments to the fair value of our mortgage servicing rights, as well as the receipt of a $0.4 million commercial loan prepayment penalty. Noninterest income was also impacted by $1.2 million in net securities gains for the year 2012 compared to $0.2 million for the year 2011.
Noninterest income for the year ended December 31, 2011 increased 7.1% from prior year. The year over year increase was primarily attributable to increased gains on sales of loans, deposit service charges, and trust revenue partially offset by decreased loan related fees.
Noninterest Expense
Noninterest expense for the year ended December 31, 2012 decreased 2.7% from prior year as a result of decreases in FDIC insurance premiums, legal fees, other real estate owned expense, and repossession expense, partially offset by an increase in personnel expense associated with our employee incentive accrual of $3.0 million.
Noninterest expense for the year ended December 31, 2011 increased 10.8% from prior year, primarily as a result of increased personnel expense, including health insurance and the increase related to our LaFollette acquisition; repossession expense; and other real estate owned expense, including adjustments to reflect declines in the values of foreclosed properties, as well as expected losses in investments in limited partnerships that were offset by tax credits. Other real estate owned expense during the year of $8.6 million was significantly impacted by a $3.2 million decrease in the carrying value of two groups of foreclosed properties that were vandalized.
The insurance claims relative to these vandalisms have been resolved with no significant recoveries.
CTBI’s total assets at $3.6 billion increased $44.5 million, or 1.2%, from December 31, 2011. Loans outstanding at December 31, 2012 were $2.6 billion, decreasing $6.0 million, or 0.2%, year over year. Loan growth during the year of $8.5 million in the commercial loan portfolio and $45.8 million in the residential loan portfolio was offset by decline of $60.3 million in the consumer loan portfolio, primarily in our indirect auto lending area. The increase in the residential loan portfolio resulted from our decision to keep a portion of Federal Home Loan Mortgage Corporation (FHLMC) qualified loans which we normally sell in our in-house loan portfolio during the year. The decrease in indirect auto lending is the result of management’s decision not to invest in long-term fixed rate auto loans at the current market rates. We recently began offering a new program to be more competitive in the indirect lending area while still obtaining an appropriate yield. CTBI's investment portfolio increased $75.9 million, or 14.4%, from December 31, 2011. Deposits, including repurchase agreements, at $3.1 billion increased $18.4 million, or 0.6%, from December 31, 2011.
Shareholders’ equity at December 31, 2012 was $400.3 million compared to $366.9 million at December 31, 2011. CTBI's annualized dividend yield to shareholders as of December 31, 2012 was 3.84%.
Loans
|
(in thousands)
|
December 31, 2012
|
|||||||||||||||||||
|
Loan Category
|
Balance
|
Variance from Prior Year
|
Net Charge-Offs
|
Nonperforming
|
ALLL
|
|||||||||||||||
|
Commercial:
|
||||||||||||||||||||
|
Construction
|
$ | 119,447 | (0.9 | )% | $ | 999 | $ | 9,733 | $ | 4,033 | ||||||||||
|
Secured by real estate
|
807,213 | 1.0 | 1,732 | 11,515 | 13,541 | |||||||||||||||
|
Equipment lease financing
|
9,246 | (4.7 | ) | 0 | 0 | 126 | ||||||||||||||
|
Other commercial
|
376,348 | 0.5 | 2,469 | 5,522 | 5,469 | |||||||||||||||
|
Total commercial
|
1,312,254 | 0.7 | 5,200 | 26,770 | 23,169 | |||||||||||||||
|
Residential:
|
||||||||||||||||||||
|
Real estate construction
|
55,041 | 2.8 | 161 | 511 | 376 | |||||||||||||||
|
Real estate mortgage
|
696,928 | 7.2 | 972 | 7,664 | 4,767 | |||||||||||||||
|
Home equity
|
82,292 | (3.0 | ) | 237 | 582 | 563 | ||||||||||||||
|
Total residential
|
834,261 | 5.8 | 1,370 | 8,757 | 5,706 | |||||||||||||||
|
Consumer:
|
||||||||||||||||||||
|
Consumer direct
|
122,581 | (1.1 | ) | 707 | 98 | 1,102 | ||||||||||||||
|
Consumer indirect
|
281,477 | (17.3 | ) | 2,099 | 381 | 3,268 | ||||||||||||||
|
Total consumer
|
404,058 | (13.0 | ) | 2,806 | 479 | 4,370 | ||||||||||||||
|
Total loans
|
$ | 2,550,573 | (0.2 | )% | $ | 9,376 | $ | 36,006 | $ | 33,245 | ||||||||||
Asset Quality
CTBI's total nonperforming loans were $36.0 million at December 31, 2012, a 3.4% decrease from the $37.3 million at December 31, 2011. The decrease for the year included a $9.0 million decrease in nonaccrual loans partially offset by a $7.7 million increase in the 90+ days past due category. The increase in the 90+ past due loans is made up of various commercial loans that are considered to be well secured and in the process of collection. Loans 30-89 days past due at $27.0 million is an increase of $5.3 million from December 31, 2011. The increase in our 30-89 days past due loans is primarily one commercial relationship collateralized by income producing property and is considered well secured. Our loan portfolio management processes focus on the immediate identification, management, and resolution of problem loans to maximize recovery and minimize loss. Our loan risk management processes include weekly delinquent loan review meetings at the market levels and monthly delinquent loan review meetings involving senior corporate management to review all nonaccrual loans and loans 30 days or more past due. Any activity regarding a criticized/classified loan (i.e. problem loan) must be approved by CTB's Watch List Asset Committee (i.e. Problem Loan Committee). CTB's Watch List Asset Committee also meets on a quarterly basis and reviews every criticized/classified loan of $100,000 or greater. We also have a Loan Review Department that reviews every market within CTB annually and performs extensive testing of the loan portfolio to assure the accuracy of loan grades and classifications for delinquency, troubled debt restructuring, impaired status, impairment, nonaccrual status, and adequate loan loss reserves. The Loan Review Department has annually reviewed on average 94% of the outstanding commercial loan portfolio for the past three years. The average annual review percentage of the consumer and residential loan portfolio for the past three years was 89% based on the loan production during the number of months included in the review scope which is generally four to six months.
Impaired loans, loans not expected to meet contractual principal and interest payments, at December 31, 2012 totaled $62.5 million compared to $47.1 million at December 31, 2011. Included in certain loan categories of impaired loans are troubled debt restructurings that were classified as impaired. At December 31, 2012, CTBI had $19.5 million in commercial loans secured by real estate, $5.0 million in commercial real estate construction loans, $4.5 million in commercial other loans, and $0.7 million in real estate mortgage loans that were modified in troubled debt restructurings and impaired. Management evaluates all impaired loans for impairment and records a direct charge-off or provides specific reserves when necessary.
For further information regarding nonperforming and impaired loans, see note 4 to the consolidated financial statements.
CTBI generally does not offer high risk loans such as option ARM products, high loan to value ratio mortgages, interest-only loans, loans with initial teaser rates, or loans with negative amortizations, and therefore, CTBI would have no significant exposure to these products.
Our level of foreclosed properties at $47.0 million at December 31, 2012 was a decrease from $56.5 million at December 31, 2011. Sales of foreclosed properties for the year ended December 31, 2012 totaled $19.3 million while new foreclosed properties totaled $12.0 million. At December 31, 2012, the book value of properties under contracts to sell was $3.3 million; however, the closings had not occurred at year-end.
When foreclosed properties are acquired, appraisals are obtained and the properties are booked at the current market value less expected sales costs. Additionally, periodic updated appraisals are obtained on unsold foreclosed properties. When an updated appraisal reflects a market value below the current book value, a charge is booked to current earnings to reduce the property to its new market value less expected sales costs. Charges to earnings in 2012 to reflect the decrease in current market values of foreclosed properties totaled $2.7 million. There were 136 properties reappraised during 2012. Of these, 59 were written down by a total of $2.3 million. Charges during the year ended December 31, 2011 were $6.4 million. Our policy for determining the frequency of periodic reviews is based upon consideration of the specific properties and the known or perceived market fluctuations in a particular market and is typically between 12 and 18 months but generally not more than 24 months. Sixty-one percent of our OREO properties have been reappraised within the past 12 months. Our nonperforming loans and foreclosed properties remain primarily concentrated in our Central Kentucky Region. Management anticipates that our foreclosed properties will remain elevated as we work through current market conditions.
The major classifications of foreclosed properties are shown in the following table:
|
(in thousands)
December 31
|
2012
|
2011
|
||||||
|
1-4 family
|
$ | 12,381 | $ | 20,065 | ||||
|
Agricultural/farmland
|
653 | 652 | ||||||
|
Construction/land development/other
|
23,823 | 23,006 | ||||||
|
Multifamily
|
1,281 | 1,841 | ||||||
|
Non-farm/non-residential
|
8,848 | 10,981 | ||||||
|
Total foreclosed properties
|
$ | 46,986 | $ | 56,545 | ||||
The appraisal aging analysis of foreclosed properties, as well as the holding period, at December 31, 2012 is shown below:
|
(in thousands)
|
|||||||||
|
Appraisal Aging Analysis
|
Holding Period Analysis
|
||||||||
|
Days Since Last Appraisal
|
Current Book Value
|
Holding Period
|
Current Book Value
|
||||||
|
Up to 90 days
|
$ | 17,006 |
Less than one year
|
$ | 7,676 | ||||
|
91 to 180 days
|
2,343 |
1 to 2 years
|
19,625 | ||||||
|
181 to 270 days
|
6,207 |
2 to 3 years
|
4,430 | ||||||
|
271 to 365 days
|
3,315 |
3 to 4 years
|
13,092 | ||||||
|
Over one year
|
18,115 |
Over 4 years
|
2,163 | ||||||
|
Total
|
$ | 46,986 |
Total
|
$ | 46,986 | ||||
Net loan charge-offs for the year were $9.4 million, or 0.37% of average loans annualized, a decrease from prior year's $14.9 million, or 0.58% of average loans annualized. Of the total net charge-offs, $5.2 million were in commercial loans, $2.1 million were in indirect auto loans, and $1.1 million were in residential real estate mortgage loans.
Our loan loss reserve as a percentage of total loans outstanding at December 31, 2012 remained at 1.30% from December 31, 2011. Our reserve coverage (allowance for loan loss reserve to nonperforming loans) was 92.3% at December 31, 2012 compared to 89.0% at December 31, 2011.
Contractual Obligations and Commitments
As disclosed in the notes to the consolidated financial statements, we have certain obligations and commitments to make future payments under contracts. At December 31, 2012, the aggregate contractual obligations and commitments are:
|
Contractual Obligations:
|
Payments Due by Period
|
|||||||||||||||
|
(in thousands)
|
Total
|
1 Year
|
2-5 Years
|
After 5 Years
|
||||||||||||
|
Deposits without stated maturity
|
$ | 1,488,881 | $ | 1,488,881 | $ | 0 | $ | 0 | ||||||||
|
Certificates of deposit and other time deposits
|
1,414,967 | 1,241,997 | 172,604 | 366 | ||||||||||||
|
Repurchase agreements and other short-term borrowings
|
222,434 | 222,434 | 0 | 0 | ||||||||||||
|
Advances from Federal Home Loan Bank
|
1,429 | 152 | 439 | 838 | ||||||||||||
|
Interest on advances from Federal Home Loan Bank*
|
102 | 28 | 65 | 9 | ||||||||||||
|
Long-term debt
|
61,341 | 0 | 0 | 61,341 | ||||||||||||
|
Interest on long-term debt*
|
59,245 | 1,193 | 9,063 | 48,989 | ||||||||||||
|
Annual rental commitments under leases
|
7,284 | 1,607 | 3,074 | 2,603 | ||||||||||||
|
Total contractual obligations
|
$ | 3,255,683 | $ | 2,956,292 | $ | 185,245 | $ | 114,146 | ||||||||
*The amounts provided as interest on advances from Federal Home Loan Bank and interest on long-term debt assume the liabilities will not be prepaid and interest is calculated to their individual maturities.
The interest on $61.3 million in long-term debt is calculated based on the three-month LIBOR plus 1.59% until its maturity of June 1, 2037. The three-month LIBOR rate is projected using the most likely rate forecast from assumptions incorporated in the interest rate risk model and is determined two business days prior to the interest payment date. These assumptions are uncertain, and as a result, the actual payments will differ from the projection due to changes in economic conditions.
|
Other Commitments:
|
Amount of Commitment - Expiration by Period
|
|||||||||||||||
|
(in thousands)
|
Total
|
1 Year
|
2-5 Years
|
After 5 Years
|
||||||||||||
|
Standby letters of credit
|
$ | 41,207 | $ | 33,435 | $ | 7,772 | $ | 0 | ||||||||
|
Commitments to extend credit
|
386,293 | 309,691 | 63,595 | 13,007 | ||||||||||||
|
Total other commitments
|
$ | 427,500 | $ | 343,126 | $ | 71,367 | $ | 13,007 | ||||||||
Commitments to extend credit and standby letters of credit do not necessarily represent future cash requirements in that these commitments often expire without being drawn upon. Refer to note 17 to the consolidated financial statements for additional information regarding other commitments.
Liquidity and Market Risk
The objective of CTBI’s Asset/Liability management function is to maintain consistent growth in net interest income within our policy limits. This objective is accomplished through management of our consolidated balance sheet composition, liquidity, and interest rate risk exposures arising from changing economic conditions, interest rates, and customer preferences. The goal of liquidity management is to provide adequate funds to meet changes in loan and lease demand or deposit withdrawals. This is accomplished by maintaining liquid assets in the form of cash and cash equivalents and investment securities, sufficient unused borrowing capacity, and growth in core deposits. As of December 31, 2012, we had approximately $207.6 million in cash and cash equivalents and approximately $603.3 million in securities valued at estimated fair value designated as available-for-sale and available to meet liquidity needs on a continuing basis. Additional asset-driven liquidity is provided by the remainder of the securities portfolio and the repayment of loans. In addition to core deposit funding, we also have a variety of other short-term and long-term funding sources available. We also rely on Federal Home Loan Bank advances for both liquidity and management of our asset/liability position. Federal Home Loan Bank advances were $1.4 million at December 31, 2012 compared to $21.6 million at December 31, 2011. As of December 31, 2012, we had a $320.9 million available borrowing position with the Federal Home Loan Bank. We generally rely upon net inflows of cash from financing activities, supplemented by net inflows of cash from operating activities, to provide cash for our investing activities. As is typical of many financial institutions, significant financing activities include deposit gathering, use of short-term borrowing facilities such as repurchase agreements and federal funds purchased, and issuance of long-term debt. At December 31, 2012, we had $44 million in lines of credit with various correspondent banks available to meet any future cash needs. Our primary investing activities include purchases of securities and loan originations. We do not rely on any one source of liquidity and manage availability in response to changing consolidated balance sheet needs. At December 31, 2012, federal funds sold were $6.7 million compared to $2.7 million at December 31, 2011, and deposits with the Federal Reserve were $123.9 million compared to $159.0 million at December 31, 2011. Additionally, we project cash flows from our investment portfolio to generate additional liquidity over the next 90 days.
The investment portfolio consists of investment grade short-term issues suitable for bank investments. The majority of the investment portfolio is in U.S. government and government sponsored agency issuances. The average life of the portfolio is
4.28 years.
At the end of 2012, available-for-sale (“AFS”) securities comprised approximately 99.7%
of the total investment portfolio, and the AFS portfolio
was approximately 151%
of equity capital. Eighty-seven percent
of the pledge eligible portfolio was pledged.
Interest Rate Risk
We consider interest rate risk one of our most significant market risks. Interest rate risk is the exposure to adverse changes in net interest income due to changes in interest rates. Consistency of our net interest revenue is largely dependent upon the effective management of interest rate risk. We employ a variety of measurement techniques to identify and manage our interest rate risk including the use of an earnings simulation model to analyze net interest income sensitivity to changing interest rates. The model is based on actual cash flows and repricing characteristics for on and off-balance sheet instruments and incorporates market-based assumptions regarding the effect of changing interest rates on the prepayment rates of certain assets and liabilities. Assumptions based on the historical behavior of deposit rates and balances in relation to changes in interest rates are also incorporated into the model. These assumptions are inherently uncertain, and as a result, the model cannot precisely measure net interest income or precisely predict the impact of fluctuations in interest rates on net interest income. Actual results will differ from simulated results due to timing, magnitude, and frequency of interest rate changes as well as changes in market conditions and management strategies.
CTBI’s Asset/Liability Management Committee (ALCO), which includes executive and senior management representatives and reports to the Board of Directors, monitors and manages interest rate risk within Board-approved policy limits. Our current exposure to interest rate risks is determined by measuring the anticipated change in net interest income spread evenly over the twelve-month period.
The following table shows our estimated earnings sensitivity profile as of December 31, 2012:
|
Change in Interest Rates
(basis points)
|
Percentage Change in Net Interest Income
(12 Months)
|
|
+400
|
3.28%
|
|
+300
|
2.02%
|
|
+200
|
0.95%
|
|
+100
|
0.40%
|
|
-25
|
(0.16)%
|
The following table shows our estimated earnings sensitivity profile as of December 31, 2011:
|
Change in Interest Rates
(basis points)
|
Percentage Change in Net Interest Income
(12 Months)
|
|
+400
|
3.32%
|
|
+300
|
2.08%
|
|
+200
|
1.03%
|
|
+100
|
0.46%
|
|
-25
|
(0.25)%
|
The simulation model used the yield curve spread evenly over a twelve-month period. The measurement at December 31, 2012 estimates that our net interest income in an up-rate environment would increase by 3.28% at a 400 basis point change, 2.02% increase at a 300 basis point change, 0.95% increase at a 200 basis point change, and a 0.40% increase at a 100 basis point change. In a down-rate environment, a 25 basis point decrease in interest rates would decrease net interest income by 0.16% over one year. In order to reduce the exposure to interest rate fluctuations and to manage liquidity, we have developed sale procedures for several types of interest-sensitive assets. Virtually all long-term, fixed rate single family residential mortgage loans underwritten according to Federal Home Loan Mortgage Corporation guidelines are sold for cash upon origination or originated under terms where they could be sold. Periodically, additional assets such as commercial loans are also sold. In 2012 and 2011, $113.6 million and $81.1 million, respectively, was realized on the sale of fixed rate residential mortgages. We focus our efforts on consistent net interest revenue and net interest margin growth through each of the retail and wholesale business lines. We do not currently engage in trading activities.
The preceding analysis was prepared using a rate ramp analysis which attempts to spread changes evenly over a specified time period as opposed to a rate shock which measures the impact of an immediate change. Had these measurements been prepared using the rate shock method, the results would vary.
Our Static Repricing GAP as of December 31, 2012 is presented below. In the 12 month repricing GAP, rate sensitive liabilities (“RSL”) exceeded rate sensitive assets (“RSA”) by $197.1 million.
|
(dollars in thousands)
|
1-3 Months
|
4-6 Months
|
7-9 Months
|
10-12 Months
|
2-3
Years
|
4-5
Years
|
> 5
Years
|
|||||||||||||||||||||
|
Assets
|
$ | 1,542,534 | $ | 206,889 | $ | 167,737 | $ | 146,998 | $ | 515,436 | $ | 225,432 | $ | 830,637 | ||||||||||||||
|
Liabilities and
Equity
|
882,147 | 353,677 | 416,304 | 609,180 | 872,467 | 53,951 | 447,937 | |||||||||||||||||||||
|
Repricing difference
|
660,388 | (146,788 | ) | (248,566 | ) | (462,182 | ) | (357,031 | ) | 171,480 | 382,699 | |||||||||||||||||
|
Cumulative GAP
|
660,388 | 513,599 | 265,033 | (197,149 | ) | (554,179 | ) | (382,699 | ) | 0 | ||||||||||||||||||
|
RSA/RSL
|
1.75 | x | 0.58 | x | 0.40 | x | 0.24 | x | 0.59 | x | 4.18 | x | 1.85 | x | ||||||||||||||
|
Cumulative GAP to total assets
|
18.16 | % | 14.13 | % | 7.29 | % | (5.42 | )% | (15.24 | )% | (10.53 | )% | 0.00 | % | ||||||||||||||
Capital Resources
We continue to grow our shareholders’ equity while also providing an annual dividend yield for the year 2012 of 3.81% to shareholders. Shareholders’ equity increased 9.1% from December 31, 2011 to $400.3 million at December 31, 2012. Our primary source of capital growth is the retention of earnings. Cash dividends were $1.25 per share for 2012 and $1.23 per share for 2011. We retained 56.9% of our earnings in 2012 compared to 51.6% in 2011.
Regulatory guidelines require bank holding companies, commercial banks, and savings banks to maintain certain minimum capital ratios and define companies as “well-capitalized” that sufficiently exceed the minimum ratios. The banking regulators may alter minimum capital requirements as a result of revising their internal policies and their ratings of individual institutions. To be “well-capitalized” banks and bank holding companies must maintain a Tier 1 leverage ratio of no less than 5.0%, a Tier 1 risk based ratio of no less than 6.0%, and a total risk based ratio of no less than 10.0%. Our ratios as of December 31, 2012 were 10.65%, 15.23%, and 16.49%, respectively, all exceeding the threshold for meeting the definition of “well-capitalized.” See note 20 to the consolidated financial statements for further information.
As of December 31, 2012, we are not aware of any current recommendations by banking regulatory authorities which, if they were to be implemented, would have, or are reasonably likely to have, a material adverse impact on our liquidity, capital resources, or operations, except as provided for in the Dodd-Frank Act which is discussed in the Supervision and Regulation section of Item 1. Business and the Basel III Proposal which is discussed below.
Basel III Proposal
In the summer of 2012, our primary federal regulators, published two notices of proposed rulemaking (the “2012 Capital Proposals”) that would substantially revise the risk-based capital requirements applicable to bank holding companies and depository institutions, including CTBI and CTB, compared to the current U.S. risk-based capital rules, which are based on the international capital accords of the Basel Committee on Banking Supervision (the “Basel Committee”) which are generally referred to as “Basel I.”
One of the 2012 Capital Proposals (the “Basel III Proposal”) addresses the components of capital and other issues affecting the numerator in banking institutions’ regulatory capital ratios, and would implement the Basel Committee’s December 2010 framework, known as “Basel III,” for strengthening international capital standards. The other proposal (the “Standardized Approach Proposal”) addresses risk weights and other issues affecting the denominator in banking institutions’ regulatory capital ratios, and would replace the existing Basel I-derived risk weighting approach with a more risk-sensitive approach based, in part, on the standardized approach in the Basel Committee’s 2004 “Basel II” capital accords. Although the Basel III Proposal was proposed to come into effect on January 1, 2013, the federal banking agencies jointly announced on November 9, 2012 that they do not expect any of the proposed rules to become effective on that date. As proposed, the Standardized Approach Proposal would come into effect on January 1, 2015.
The federal banking agencies have not proposed rules implementing the final liquidity framework of Basel III, and have not determined to what extent they will apply to U.S. banks that are not large, internationally active banks.
It is management’s belief that, as of December 31, 2012, CTBI and CTB would meet all capital adequacy requirements under the Basel III and Standardized Approach Proposals on a fully phased-in basis if such requirements were currently effective. The regulations ultimately applicable to financial institutions may be substantially different from the Basel III final framework as published in December 2010 and the proposed rules issued in June 2012. Management will continue to monitor these and any future proposals submitted by our regulators.
Deposit Insurance
Substantially all of the deposits of CTBI are insured up to applicable limits by the Deposit Insurance Fund (DIF) of the FDIC and are subject to deposit insurance assessments to maintain the DIF. The FDIC utilizes a risk-based assessment system that imposes insurance premiums based upon a risk matrix that takes into account a bank’s capital level and supervisory rating (“CAMELS rating”). The risk matrix utilizes four risk categories which are distinguished by capital levels and supervisory ratings.
In December 2008, the FDIC issued a final rule that raised the then current assessment rates uniformly by seven basis points for the first quarter of 2009 assessment, which resulted in annualized assessment rates for institutions in the highest risk category (“Risk Category 1 institutions”) ranging from 12 to 14 basis points (basis points representing cents per $100 of assessable deposits). In February 2009, the FDIC issued final rules to amend the DIF restoration plan, change the risk-based assessment system and set assessment rates for Risk Category 1 institutions beginning in the second quarter of 2009. For Risk Category 1 institutions that have long-term debt issuer ratings, the FDIC determines the initial base assessment rate using a combination of weighted average CAMELS component ratings, long-term debt issuer ratings (converted to numbers and averaged) and the financial ratios method assessment rate (as defined), each equally weighted. The initial base assessment rates for Risk Category 1 institutions range from 12 to 16 basis points, on an annualized basis. After the effect of potential base-rate adjustments, total base assessment rates range from 7 to 24 basis points. The potential adjustments to a Risk Category 1 institution’s initial base assessment rate include (i) a potential decrease of up to five basis points for long-term unsecured debt, including senior and subordinated debt and (ii) a potential increase of up to eight basis points for secured liabilities in excess of 25% of domestic deposits.
In May 2009, the FDIC issued a final rule which levied a special assessment applicable to all insured depository institutions totaling five basis points of each institution’s total assets less Tier 1 capital as of June 30, 2009, not to exceed 10 basis points of domestic deposits. The special assessment was part of the FDIC’s efforts to rebuild the DIF. Deposit insurance expense during 2009 included $1.3 million recognized in the second quarter related to the special assessment.
In November 2009, the FDIC issued a rule that required all insured depository institutions, with limited exceptions, to prepay their estimated quarterly risk-based assessments for the fourth quarter of 2009 and for all of 2010, 2011, and 2012. The FDIC also adopted a uniform three-basis point increase in assessment rates effective on January 1, 2011. In December 2009, CTBI paid $14.2 million in prepaid risk-based assessment, which included $0.9 million related to the fourth quarter of 2009 that would have otherwise been payable in the first quarter of 2010. This amount was included in deposit insurance expense for 2009. The remaining $13.3 million in prepaid deposit insurance was included in other assets on the consolidated balance sheet as of December 31, 2009. During 2010, $3.9 million was expensed as a component of FDIC insurance and $0.9 million in prepaid deposit insurance was acquired from LaFollette, leaving $10.3 million in the prepaid. During 2011, $2.9 million was expensed as a component of FDIC insurance, leaving $7.4 million in the prepaid. During 2012, $2.4 million was expensed as a component of FDIC insurance, leaving $5.0 million in the prepaid.
FDIC insurance expense totaled $2.6 million, $3.2 million, and $4.4 million in 2012, 2011, and 2010. FDIC insurance expense includes deposit insurance assessments and Financing Corporation (FICO) assessments.
On July 21, 2010, President Obama signed the Dodd-Frank Act into law. This law has significantly changed the current bank regulatory structure and affected the lending, deposit, investment, trading, and operating activities of financial institutions and their holding companies. The Dodd-Frank Act requires various federal agencies to adopt a broad range of implementing rules and regulations, and to prepare numerous studies and reports for Congress. The federal agencies have been given significant discretion in drafting the implementing rules and regulations, and consequently, many of the details and much of the impact of the Dodd-Frank Act are still unknown.
Among many other provisions, the Dodd-Frank Act broadens the base for FDIC insurance assessments. Assessments are now based on the average consolidated total assets less tangible equity capital of a financial institution. The Dodd-Frank Act also permanently increased the maximum amount of deposit insurance for banks, savings institutions and credit unions to $250,000 per depositor, retroactive to January 1, 2008, and noninterest bearing transaction accounts and IOLTA accounts had unlimited deposit insurance through December 31, 2012.
Effective
January 1, 2013, money in noninterest-bearing transaction accounts (including IOLTA/IOLA) no longer receive unlimited deposit insurance coverage from the FDIC, but will be FDIC-insured up to the legal maximum of $250,000 for each ownership category.
See the Supervision and Regulation section of Item 1. Business for further information on the provisions of the Dodd-Frank Act.
Impact of Inflation, Changing Prices, and Economic Conditions
The majority of our assets and liabilities are monetary in nature. Therefore, CTBI differs greatly from most commercial and industrial companies that have significant investment in nonmonetary assets, such as fixed assets and inventories. However, inflation does have an important impact on the growth of assets in the banking industry and on the resulting need to increase equity capital at higher than normal rates in order to maintain an appropriate equity to assets ratio. Inflation also affects other expenses, which tend to rise during periods of general inflation.
We believe one of the most significant impacts on financial and operating results is our ability to react to changes in interest rates. We seek to maintain an essentially balanced position between interest rate sensitive assets and liabilities in order to protect against the effects of wide interest rate fluctuations.
Our success is dependent on the general economic conditions of the communities we serve. Unlike larger banks that are more geographically diversified, we provide financial and banking services primarily to eastern, northeastern, central, and south central Kentucky, southern West Virginia, and northeastern Tennessee. The economic conditions in these areas have a significant impact on loan demand, the ability of borrowers to repay loans, and the value of the collateral securing loans. A significant decline in general economic conditions will affect these local economic conditions and will negatively affect the financial results of our banking operations. Factors influencing general conditions include inflation, recession, unemployment, and other factors beyond our control.
The national and global economic downturn has resulted in unprecedented levels of financial market volatility and has in general adversely impacted the market value of financial institutions, limited access to capital and had an adverse effect on the financial condition and results of operations of banking companies in general, including CTBI. From early 2008 to the middle of 2010, CTBI experienced significant challenges, credit quality deteriorated, and net income and results of operations were adversely impacted. While there has been improvement in economic conditions in our markets starting in the second half of 2010 and continuing into 2012, we believe that we will continue to experience a challenging environment in 2013. CTBI is a part of the financial system and a continuation of systemic lack of available credit, lack of confidence in the financial sector, increased volatility in the financial markets, and reduced business activity could materially and adversely impact CTBI’s business, financial condition and results of operations.
Stock Repurchase Program
CTBI’s stock repurchase program began in December 1998 with the authorization to acquire up to 500,000 shares and was increased by an additional 1,000,000 shares in July 2000 and in May 2003. We have not repurchased any shares of our common stock since February 2008. There are currently 288,519 shares remaining under CTBI’s current repurchase authorization. As of December 31, 2012, a total of 2,211,481 shares have been repurchased through this program. The following table shows Board authorizations and repurchases made through the stock repurchase program for the years 1998 through 2012:
|
Board Authorizations
|
Repurchases*
|
Shares Available for Repurchase
|
||
|
Average Price ($)
|
# of Shares
|
|||
|
1998
|
500,000
|
-
|
0
|
|
|
1999
|
0
|
15.89
|
131,517
|
|
|
2000
|
1,000,000
|
11.27
|
694,064
|
|
|
2001
|
0
|
14.69
|
444,945
|
|
|
2002
|
0
|
19.48
|
360,287
|
|
|
2003
|
1,000,000
|
21.58
|
235,668
|
|
|
2004
|
0
|
25.45
|
55,000
|
|
|
2005
|
0
|
-
|
0
|
|
|
2006
|
0
|
-
|
0
|
|
|
2007
|
0
|
31.42
|
196,500
|
|
|
2008
|
0
|
28.08
|
93,500
|
|
|
2009
|
0
|
-
|
0
|
|
|
2010
|
0
|
-
|
0
|
|
|
2011
|
0
|
-
|
0
|
|
|
2012
|
0
|
-
|
0
|
|
|
Total
|
2,500,000
|
17.52
|
2,211,481
|
288,519
|
*Repurchased shares and average prices have been restated to reflect stock dividends that have occurred; however, board authorized shares have not been adjusted.
Critical Accounting Policies and Estimates
The preparation of consolidated financial statements in conformity with accounting principles generally accepted in the United States of America requires the appropriate application of certain accounting policies, many of which require us to make estimates and assumptions about future events and their impact on amounts reported in our consolidated financial statements and related notes. Since future events and their impact cannot be determined with certainty, the actual results will inevitably differ from our estimates. Such differences could be material to the consolidated financial statements.
We believe the application of accounting policies and the estimates required therein are reasonable. These accounting policies and estimates are constantly reevaluated, and adjustments are made when facts and circumstances dictate a change. Historically, we have found our application of accounting policies to be appropriate, and actual results have not differed materially from those determined using necessary estimates.
Our accounting policies are described in note 1 to the consolidated financial statements. We have identified the following critical accounting policies:
Investments
–
Management determines the classification of securities at purchase. We classify securities into held-to-maturity, trading, or available-for-sale categories. Held-to-maturity securities are those which we have the positive intent and ability to hold to maturity and are reported at amortized cost. In accordance with Financial Accounting Standards Board (FASB) Accounting Standards Codification (ASC) 320,
Investment Securities
, investments in debt securities that are not classified as held-to-maturity and equity securities that have readily determinable fair values shall be classified in one of the following categories and measured at fair value in the statement of financial position:
a. Trading securities
.
Securities that are bought and held principally for the purpose of selling them in the near term (thus held for only a short period of time) shall be classified as trading securities
.
Trading generally reflects active and frequent buying and selling, and trading securities are generally used with the objective of generating profits on short-term differences in price.
b. Available-for-sale securities. Investments not classified as trading securities (nor as held-to-maturity securities) shall be classified as available-for-sale securities.
We do not have any securities that are classified as trading securities. Available-for-sale securities are reported at fair value, with unrealized gains and losses included as a separate component of shareholders’ equity, net of tax. If declines in fair value are other than temporary, the carrying value of the securities is written down to fair value as a realized loss with a charge to income for the portion attributable to credit losses and a charge to other comprehensive income for the portion that is not credit related.
Gains or losses on disposition of securities are computed by specific identification for all securities except for shares in mutual funds, which are computed by average cost. Interest and dividend income, adjusted by amortization of purchase premium or discount, is included in earnings.
When the fair value of a security is below its amortized cost, and depending on the length of time the condition exists and the extent the fair market value is below amortized cost, additional analysis is performed to determine whether an other than temporary impairment condition exists. Available-for-sale and held-to-maturity securities are analyzed quarterly for possible other than temporary impairment. The analysis considers (i) whether we have the intent to sell our securities prior to recovery and/or maturity and (ii) whether it is more likely than not that we will not have to sell our securities prior to recovery and/or maturity. Often, the information available to conduct these assessments is limited and rapidly changing, making estimates of fair value subject to judgment. If actual information or conditions are different than estimated, the extent of the impairment of the security may be different than previously estimated, which could have a material effect on the CTBI’s results of operations and financial condition.
Loans
–
Loans with the ability and the intent to be held until maturity and/or payoff are reported at the carrying value of unpaid principal reduced by unearned interest, an allowance for loan and lease losses, and unamortized deferred fees or costs. Income is recorded on the level yield basis. Interest accrual is discontinued when management believes, after considering economic and business conditions, collateral value, and collection efforts, that the borrower’s financial condition is such that collection of interest is doubtful. Any loan greater than 90 days past due must be well secured and in the process of collection to continue accruing interest. Cash payments received on nonaccrual loans generally are applied against principal, and interest income is only recorded once principal recovery is reasonably assured. Loans are not reclassified as accruing until principal and interest payments remain current for a period of time, generally six months, and future payments appear reasonably certain. Included in certain loan categories of impaired loans are troubled debt restructurings that were classified as impaired. A restructuring of a debt constitutes a troubled debt restructuring if the creditor for economic or legal reasons related to the debtor’s financial difficulties grants a concession to the debtor that it would not otherwise consider.
Loan origination and commitment fees and certain direct loan origination costs are deferred and the net amount amortized over the estimated life of the related loans, leases, or commitments as a yield adjustment.
Allowance for Loan and Lease Losses
–
We maintain an allowance for loan and lease losses (“ALLL”) at a level that is appropriate to cover estimated credit losses on individually evaluated loans determined to be impaired, as well as estimated credit losses inherent in the remainder of the loan and lease portfolio. Since arriving at an appropriate ALLL involves a high degree of management judgment, we use an ongoing quarterly analysis to develop a range of estimated losses. In accordance with accounting principles generally accepted in the United States, we use our best estimate within the range of potential credit loss to determine the appropriate ALLL. Credit losses are charged and recoveries are credited to the ALLL.
We utilize an internal risk grading system for commercial credits. Those larger commercial credits that exhibit probable or observed credit weaknesses are subject to individual review. The borrower’s cash flow, adequacy of collateral coverage, and other options available to CTBI, including legal remedies, are evaluated. The review of individual loans includes those loans that are impaired as defined by ASC 310-35,
Impairment of a Loan
. We evaluate the collectability of both principal and interest when assessing the need for loss provision. Historical loss rates are analyzed and applied to other commercial loans not subject to specific allocations. The ALLL allocation for this pool of commercial loans is established based on the historical average, maximum, minimum, and median loss ratios.
A loan is considered impaired when, based on current information and events, it is probable that CTBI will be unable to collect the scheduled payments of principal or interest when due according to the contractual terms of the loan agreement. Factors considered by management in determining impairment include payment status, collateral value, and the probability of collecting scheduled principal and interest payments when due. Loans that experience insignificant payment delays and payment shortfalls generally are not classified as impaired. Management determines the significance of payment delays and payment shortfalls on a case-by-case basis, taking into consideration all of the circumstances surrounding the loan and the borrower, including the length of the delay, the reasons for the delay, the borrower’s prior payment record, and the amount of the shortfall in relation to the principal and interest owed. Impairment is measured on a loan-by-loan basis for commercial and construction loans by either the present value of expected future cash flows discounted at the loan’s effective interest rate, the loan’s obtainable market price, or the fair value of the collateral if the loan is collateral dependent.
Homogenous loans, such as consumer installment, residential mortgages, and home equity lines are not individually risk graded. The associated ALLL for these loans is measured under ASC 450,
Contingencies
.
When any secured commercial loan is considered uncollectable, whether past due or not, a current assessment of the value of the underlying collateral is made. If the balance of the loan exceeds the fair value of the collateral, the loan is placed on non-accrual and the loan is charged down to the value of the collateral less estimated cost to sell or a specific reserve equal to the difference between book value of the loan and the fair value assigned to the collateral is created until such time as the loan is foreclosed. When the foreclosed collateral has been legally assigned to CTBI, a charge off is taken, if necessary, in order that the remaining balance reflects the fair value estimated less costs to sell of the collateral then transferred to other real estate owned or other repossessed assets. When any unsecured commercial loan is considered uncollectable the loan is charged off no later than at 90 days past due.
All closed-end consumer loans (excluding conventional 1-4 family residential loans and installment and revolving loans secured by real estate) are charged off no later than 120 days (5 monthly payments) delinquent. If a loan is considered uncollectable, it is charged off earlier than 120 days delinquent. For conventional 1-4 family residential loans and installment and revolving loans secured by real estate, when a loan is 90 days past due, a current assessment of the value of the real estate is made. If the balance of the loan exceeds the fair value of the property, the loan is placed on nonaccrual and foreclosure proceedings are initiated. When the foreclosed property has been legally assigned to CTBI, a charge-off is taken with the remaining balance, reflecting the fair value less estimated costs to sell, transferred to other real estate owned.
Historical loss rates for loans are adjusted for significant factors that, in management’s judgment, reflect the impact of any current conditions on loss recognition. We generally review the historical loss rates over eight quarters and four quarters on a rolling average basis. Factors that we consider include delinquency trends, current economic conditions and trends, strength of supervision and administration of the loan portfolio, levels of underperforming loans, level of recoveries to prior year’s charge-offs, trend in loan losses, industry concentrations and their relative strengths, amount of unsecured loans and underwriting exceptions. Based upon management’s judgment, “best case,” “worst case,” and “most likely” scenarios are determined. The total of each of these weighted factors is then applied against the applicable portion of the portfolio and the ALLL is adjusted accordingly to approximate the most likely scenario. Management continually reevaluates the other subjective factors included in its ALLL analysis. During the third quarter 2012 analysis, management increased several of these subjective factors including trends in past dues, trends in losses, and current economic and regulatory conditions impacting business and individual customers in our geographic markets. The cumulative effect of all of the changes increased the amount calculated for our “most likely” scenario by $3.2 million at December 31, 2012.
Other Real Estate Owned
– When foreclosed properties are acquired, appraisals are obtained and the properties are booked at the current market value less expected sales costs. Additionally, periodic updated appraisals are obtained on unsold foreclosed properties. When an updated appraisal reflects a market value below the current book value, a charge is booked to current earnings to reduce the property to its new market value less expected sales costs. Our policy for determining the frequency of periodic reviews is based upon consideration of the specific properties and the known or perceived market fluctuations in a particular market and is typically between 12 and 18 months but generally not more than 24 months. All revenues and expenses related to the carrying of other real estate owned are recognized by a charge to income.
CTBI currently does not engage in any hedging activity or any derivative activity which management considers material. Analysis of CTBI’s interest rate sensitivity can be found in the Interest Rate Risk section of Item 7. Management’s Discussion and Analysis of Financial Condition and Results of Operations.
Community Trust Bancorp, Inc.
Consolidated Balance Sheets
|
(dollars in thousands)
December 31
|
2012
|
2011
|
||||||
|
Assets:
|
||||||||
|
Cash and due from banks
|
$ | 73,451 | $ | 69,723 | ||||
|
Interest bearing deposits
|
127,438 | 166,057 | ||||||
|
Federal funds sold
|
6,671 | 2,701 | ||||||
|
Cash and cash equivalents
|
207,560 | 238,481 | ||||||
|
Certificates of deposit in other banks
|
5,336 | 11,875 | ||||||
|
Securities available-for-sale at fair value (amortized cost of $583,858 and $511,731, respectively)
|
603,343 | 527,398 | ||||||
|
Securities held-to-maturity at amortized cost (fair value of $1,659 and $1,661, respectively)
|
1,662 | 1,662 | ||||||
|
Loans held for sale
|
22,486 | 536 | ||||||
|
Loans
|
2,550,573 | 2,556,548 | ||||||
|
Allowance for loan losses
|
(33,245 | ) | (33,171 | ) | ||||
|
Net loans
|
2,517,328 | 2,523,377 | ||||||
|
Premises and equipment, net
|
54,321 | 54,297 | ||||||
|
Federal Home Loan Bank stock
|
25,673 | 25,673 | ||||||
|
Federal Reserve Bank stock
|
4,885 | 4,883 | ||||||
|
Goodwill
|
65,490 | 65,490 | ||||||
|
Core deposit intangible (net of accumulated amortization of $7,712 and $7,499, respectively)
|
904 | 1,117 | ||||||
|
Bank owned life insurance
|
44,893 | 43,483 | ||||||
|
Mortgage servicing rights
|
2,364 | 2,282 | ||||||
|
Other real estate owned
|
47,537 | 56,965 | ||||||
|
Other assets
|
31,882 | 33,660 | ||||||
|
Total assets
|
$ | 3,635,664 | $ | 3,591,179 | ||||
|
Liabilities and shareholders’ equity:
|
||||||||
|
Deposits
|
||||||||
|
Noninterest bearing
|
$ | 606,448 | $ | 584,735 | ||||
|
Interest bearing
|
2,297,400 | 2,293,624 | ||||||
|
Total deposits
|
2,903,848 | 2,878,359 | ||||||
|
Repurchase agreements
|
210,120 | 217,177 | ||||||
|
Federal funds purchased and other short-term borrowings
|
12,314 | 13,104 | ||||||
|
Advances from Federal Home Loan Bank
|
1,429 | 21,609 | ||||||
|
Long-term debt
|
61,341 | 61,341 | ||||||
|
Other liabilities
|
46,268 | 32,723 | ||||||
|
Total liabilities
|
3,235,320 | 3,224,313 | ||||||
|
Shareholders’ equity:
|
||||||||
|
Preferred stock, 300,000 shares authorized and unissued
|
- | - | ||||||
|
Common stock, $5 par value, shares authorized 25,000,000; shares outstanding 2012 – 15,612,935; 2011 – 15,429,992
|
78,065 | 77,151 | ||||||
|
Capital surplus
|
160,670 | 156,101 | ||||||
|
Retained earnings
|
148,944 | 123,431 | ||||||
|
Accumulated other comprehensive income, net of tax
|
12,665 | 10,183 | ||||||
|
Total shareholders’ equity
|
400,344 | 366,866 | ||||||
|
Total liabilities and shareholders’ equity
|
$ | 3,635,664 | $ | 3,591,179 | ||||
See notes to consolidated financial statements.
Consolidated Statements of Income and Other Comprehensive Income
|
(in thousands except per share data)
Year Ended December 31
|
2012
|
2011
|
2010
|
|||||||||
|
Interest income:
|
||||||||||||
|
Interest and fees on loans, including loans held for sale
|
$ | 137,653 | $ | 144,635 | $ | 142,109 | ||||||
|
Interest and dividends on securities:
|
||||||||||||
|
Taxable
|
12,009 | 10,133 | 8,934 | |||||||||
|
Tax exempt
|
2,074 | 1,712 | 1,601 | |||||||||
|
Interest and dividends on Federal Reserve Bank and Federal Home Loan Bank stock
|
1,433 | 1,374 | 1,351 | |||||||||
|
Other, including interest on federal funds sold
|
553 | 606 | 516 | |||||||||
|
Total interest income
|
153,722 | 158,460 | 154,511 | |||||||||
|
Interest expense:
|
||||||||||||
|
Interest on deposits
|
17,911 | 21,282 | 29,152 | |||||||||
|
Interest on repurchase agreements and other short-term borrowings
|
1,240 | 1,625 | 2,027 | |||||||||
|
Interest on advances from Federal Home Loan Bank
|
34 | 99 | 79 | |||||||||
|
Interest on long-term debt
|
2,403 | 3,999 | 3,999 | |||||||||
|
Total interest expense
|
21,588 | 27,005 | 35,257 | |||||||||
|
Net interest income
|
132,134 | 131,455 | 119,254 | |||||||||
|
Provision for loan losses
|
9,450 | 13,262 | 16,484 | |||||||||
|
Net interest income after provision for loan losses
|
122,684 | 118,193 | 102,770 | |||||||||
|
Noninterest income:
|
||||||||||||
|
Service charges on deposit accounts
|
23,996 | 25,576 | 23,255 | |||||||||
|
Gains on sales of loans, net
|
2,562 | 1,749 | 1,642 | |||||||||
|
Trust income
|
6,918 | 6,354 | 5,846 | |||||||||
|
Loan related fees
|
4,042 | 2,372 | 3,247 | |||||||||
|
Bank owned life insurance
|
1,760 | 1,721 | 1,676 | |||||||||
|
Securities gains
|
1,155 | 218 | 0 | |||||||||
|
Other noninterest income
|
5,524 | 5,842 | 5,260 | |||||||||
|
Total noninterest income
|
45,957 | 43,832 | 40,926 | |||||||||
|
Noninterest expense:
|
||||||||||||
|
Officer salaries and employee benefits
|
10,561 | 8,379 | 8,244 | |||||||||
|
Other salaries and employee benefits
|
41,327 | 40,416 | 39,020 | |||||||||
|
Occupancy, net
|
7,546 | 7,929 | 7,058 | |||||||||
|
Equipment
|
3,876 | 3,750 | 3,865 | |||||||||
|
Data processing
|
6,394 | 6,495 | 6,889 | |||||||||
|
Bank franchise tax
|
4,571 | 4,290 | 4,065 | |||||||||
|
Legal fees
|
2,154 | 2,644 | 2,727 | |||||||||
|
Professional fees
|
1,545 | 1,256 | 1,199 | |||||||||
|
FDIC insurance
|
2,553 | 3,192 | 4,410 | |||||||||
|
Other real estate owned provision and expense
|
5,267 | 8,604 | 2,626 | |||||||||
|
Other noninterest expense
|
17,760 | 19,432 | 15,947 | |||||||||
|
Total noninterest expense
|
103,554 | 106,387 | 96,050 | |||||||||
|
Income before income taxes
|
65,087 | 55,638 | 47,646 | |||||||||
|
Income taxes
|
20,225 | 16,811 | 14,612 | |||||||||
|
Net income
|
$ | 44,862 | $ | 38,827 | $ | 33,034 | ||||||
|
Other comprehensive income:
|
||||||||||||
|
Unrealized holding gains (losses) on securities available-for-sale:
|
||||||||||||
|
Unrealized holding gains arising during the period
|
4,973 | 9,868 | (464 | ) | ||||||||
|
Less: Reclassification adjustments for realized gains included in net income
|
(1,155 | ) | (218 | ) | 0 | |||||||
|
Tax expense (benefit)
|
1,336 | 3,378 | (162 | ) | ||||||||
|
Other comprehensive income (loss), net of tax
|
2,482 | 6,272 | (302 | ) | ||||||||
|
Comprehensive income
|
$ | 47,344 | $ | 45,099 | $ | 32,732 | ||||||
|
Basic earnings per share
|
$ | 2.90 | $ | 2.54 | $ | 2.17 | ||||||
|
Diluted earnings per share
|
$ | 2.89 | $ | 2.53 | $ | 2.16 | ||||||
|
Weighted average shares outstanding-basic
|
15,466 | 15,313 | 15,234 | |||||||||
|
Weighted average shares outstanding-diluted
|
15,521 | 15,364 | 15,259 | |||||||||
|
Dividends declared per share
|
$ | 1.25 | $ | 1.23 | $ | 1.21 | ||||||
See notes to consolidated financial statements.
Consolidated Statements of Changes in Shareholders’ Equity
|
(in thousands except per share and share amounts)
|
Common Shares
|
Common Stock
|
Capital Surplus
|
Retained Earnings
|
Accumulated Other Comprehensive Income (Loss), Net of Tax
|
Total
|
||||||||||||||||||
|
Balance, January 1, 2010
|
15,200,773 | $ | 76,004 | $ | 152,400 | $ | 88,840 | $ | 4,213 | $ | 321,457 | |||||||||||||
|
Net income
|
33,034 | 33,034 | ||||||||||||||||||||||
|
Net change in unrealized gain/loss on securities available-for-sale, net of tax of $162
|
(302 | ) | (302 | ) | ||||||||||||||||||||
|
Cash dividends declared ($1.21 per share)
|
(18,435 | ) | (18,435 | ) | ||||||||||||||||||||
|
Issuance of common stock
|
93,115 | 466 | 1,409 | 1,875 | ||||||||||||||||||||
|
Issuance of restricted stock
|
44,996 | 225 | (225 | ) | 0 | |||||||||||||||||||
|
Forfeiture of restricted stock
|
(4,474 | ) | (22 | ) | 22 | 0 | ||||||||||||||||||
|
Stock-based compensation and related excess tax benefits
|
1,009 | 1,009 | ||||||||||||||||||||||
|
Balance, December 31, 2010
|
15,334,410 | 76,673 | 154,615 | 103,439 | 3,911 | 338,638 | ||||||||||||||||||
|
Net income
|
38,827 | 38,827 | ||||||||||||||||||||||
|
Net change in unrealized gain/loss on securities available-for-sale, net of tax of ($3,378)
|
6,272 | 6,272 | ||||||||||||||||||||||
|
Cash dividends declared ($1.23 per share)
|
(18,835 | ) | (18,835 | ) | ||||||||||||||||||||
|
Issuance of common stock
|
50,256 | 251 | 1,040 | 1,291 | ||||||||||||||||||||
|
Issuance of restricted stock
|
45,542 | 228 | (228 | ) | 0 | |||||||||||||||||||
|
Forfeiture of restricted stock
|
(216 | ) | (1 | ) | 1 | 0 | ||||||||||||||||||
|
Stock-based compensation and related excess tax benefits
|
673 | 673 | ||||||||||||||||||||||
|
Balance, December 31, 2011
|
15,429,992 | 77,151 | 156,101 | 123,431 | 10,183 | 366,866 | ||||||||||||||||||
|
Net income
|
44,862 | 44,862 | ||||||||||||||||||||||
|
Net change in unrealized gain/loss on securities available-for-sale, net of tax of ($1,336)
|
2,482 | 2,482 | ||||||||||||||||||||||
|
Cash dividends declared ($1.25 per share)
|
(19,349 | ) | (19,349 | ) | ||||||||||||||||||||
|
Issuance of common stock
|
182,612 | 912 | 3,483 | 4,395 | ||||||||||||||||||||
|
Issuance of restricted stock
|
331 | 2 | (2 | ) | 0 | |||||||||||||||||||
|
Stock-based compensation and related excess tax benefits
|
1,088 | 1,088 | ||||||||||||||||||||||
|
Balance, December 31, 2012
|
15,612,935 | $ | 78,065 | $ | 160,670 | $ | 148,944 | $ | 12,665 | $ | 400,344 | |||||||||||||
See notes to consolidated financial statements.
|
(in thousands)
Year Ended December 31
|
2012
|
2011
|
2010
|
|||||||||
|
Cash flows from operating activities:
|
||||||||||||
|
Net income
|
$ | 44,862 | $ | 38,827 | $ | 33,034 | ||||||
|
Adjustments to reconcile net income to net cash provided by operating activities:
|
||||||||||||
|
Depreciation and amortization
|
4,324 | 4,216 | 4,377 | |||||||||
|
Deferred taxes
|
5,441 | (94 | ) | 219 | ||||||||
|
Stock-based compensation
|
592 | 650 | 804 | |||||||||
|
Excess tax benefits of stock-based compensation
|
496 | 23 | 205 | |||||||||
|
Provision for loan losses
|
9,450 | 13,262 | 16,484 | |||||||||
|
Write-downs of other real estate owned and other repossessed assets
|
2,704 | 6,464 | 689 | |||||||||
|
Securities gains
|
(1,155 | ) | (218 | ) | 0 | |||||||
|
Gains on sale of mortgage loans held for sale
|
(2,562 | ) | (1,749 | ) | (1,642 | ) | ||||||
|
(Gains)/losses on sale of assets, net
|
328 | (34 | ) | 139 | ||||||||
|
Proceeds from sale of mortgage loans held for sale
|
113,632 | 81,095 | 82,324 | |||||||||
|
Funding of mortgage loans held for sale
|
(133,021 | ) | (79,427 | ) | (79,319 | ) | ||||||
|
Amortization of securities premiums and discounts, net
|
5,375 | 3,719 | 2,422 | |||||||||
|
Change in cash surrender value of bank owned life insurance
|
(1,410 | ) | (1,407 | ) | (1,580 | ) | ||||||
|
Death benefits received on bank owned life insurance
|
0 | 79 | 0 | |||||||||
|
Mortgage servicing rights:
|
||||||||||||
|
Fair value adjustments
|
559 | 1,405 | 769 | |||||||||
|
New servicing assets created
|
(641 | ) | (526 | ) | (524 | ) | ||||||
|
Changes in:
|
||||||||||||
|
Other assets
|
1,792 | (746 | ) | 1,259 | ||||||||
|
Other liabilities
|
7,130 | (1,213 | ) | 1,644 | ||||||||
|
Net cash provided by operating activities
|
57,896 | 64,326 | 61,304 | |||||||||
|
Cash flows from investing activities:
|
||||||||||||
|
Certificates of deposit in other banks:
|
||||||||||||
|
Purchase of certificates of deposit
|
0 | 0 | (16,363 | ) | ||||||||
|
Maturity of certificates of deposit
|
6,539 | 2,887 | 1,701 | |||||||||
|
Securities available-for-sale (AFS):
|
||||||||||||
|
Purchase of AFS securities
|
(285,795 | ) | (312,615 | ) | (168,612 | ) | ||||||
|
Proceeds from sales of AFS securities
|
39,856 | 12,045 | 0 | |||||||||
|
Proceeds from prepayments and maturities of AFS securities
|
169,592 | 117,996 | 127,072 | |||||||||
|
Securities held-to-maturity (HTM):
|
||||||||||||
|
Purchase of HTM securities
|
0 | (480 | ) | (480 | ) | |||||||
|
Proceeds from prepayments and maturities of HTM securities
|
0 | 480 | 13,154 | |||||||||
|
Change in loans, net
|
(7,664 | ) | 4,632 | (75,996 | ) | |||||||
|
Purchase of premises and equipment
|
(4,301 | ) | (3,116 | ) | (2,426 | ) | ||||||
|
Proceeds from sale of premises and equipment
|
108 | 271 | 9 | |||||||||
|
Asset Retirement
|
167 | 0 | 0 | |||||||||
|
Additional investment in Federal Reserve Bank stock
|
(2 | ) | (449 | ) | (23 | ) | ||||||
|
Proceeds from sale of other real estate owned and repossessed assets
|
11,082 | 9,258 | 7,480 | |||||||||
|
Additional investment in other real estate owned
|
(545 | ) | (744 | ) | (225 | ) | ||||||
|
Additional investment in bank owned life insurance
|
0 | (2,458 | ) | 0 | ||||||||
|
Net cash received in acquisition
|
0 | 0 | 2,906 | |||||||||
|
Net cash used in investing activities
|
(70,963 | ) | (172,293 | ) | (111,803 | ) | ||||||
|
Cash flows from financing activities:
|
||||||||||||
|
Change in deposits, net
|
25,489 | 172,242 | 79,794 | |||||||||
|
Change in repurchase agreements, federal funds purchased, and other short-term borrowings, net
|
(7,847 | ) | 32,326 | 4,853 | ||||||||
|
Advances from Federal Home Loan Bank
|
0 | 571 | 40,000 | |||||||||
|
Payments on advances from Federal Home Loan Bank
|
(20,180 | ) | (200 | ) | (40,632 | ) | ||||||
|
Issuance of common stock
|
4,395 | 1,291 | 1,875 | |||||||||
|
Excess tax benefits of stock-based compensation
|
(496 | ) | (23 | ) | (205 | ) | ||||||
|
Dividends paid
|
(19,215 | ) | (18,742 | ) | (18,332 | ) | ||||||
|
Net cash provided by (used in) financing activities
|
(17,854 | ) | 187,465 | 67,353 | ||||||||
|
Net increase (decrease) in cash and cash equivalents
|
(30,921 | ) | 79,498 | 16,854 | ||||||||
|
Cash and cash equivalents at beginning of year
|
238,481 | 158,983 | 142,129 | |||||||||
|
Cash and cash equivalents at end of year
|
$ | 207,560 | $ | 238,481 | $ | 158,983 | ||||||
|
Supplemental disclosures:
|
||||||||||||
|
Income taxes paid
|
$ | 11,325 | $ | 13,680 | $ | 15,820 | ||||||
|
Interest paid
|
22,451 | 27,682 | 36,095 | |||||||||
|
Non-cash activities:
|
||||||||||||
|
Loans to facilitate the sale of other real estate owned and other repossessed assets
|
7,768 | 2,517 | 1,209 | |||||||||
|
Common stock dividends accrued, paid in subsequent quarter
|
4,887 | 4,753 | 4,677 | |||||||||
|
Real estate acquired in settlement of loans
|
12,031 | 31,536 | 11,806 | |||||||||
See notes to consolidated financial statements.
1. Accounting Policies
Basis of Presentation
– The consolidated financial statements include Community Trust Bancorp, Inc. (“CTBI”) and its subsidiaries, including its principal subsidiary, Community Trust Bank, Inc. (“CTB”). Intercompany transactions and accounts have been eliminated in consolidation.
Nature of Operations
– Substantially all assets, liabilities, revenues, and expenses are related to banking operations, including lending, investing of funds, obtaining of deposits, trust and wealth management operations, full service brokerage operations, and other financing activities. All of our business offices and the majority of our business are located in eastern, northeastern, central, and south central Kentucky, southern West Virginia, and northeastern Tennessee.
Use of Estimates
– In preparing the consolidated financial statements, management must make certain estimates and assumptions. These estimates and assumptions affect the amounts reported for assets, liabilities, revenues, and expenses, as well as affecting the disclosures provided. Future results could differ from the current estimates. Such estimates include, but are not limited to, the allowance for loan and lease losses, valuation of other real estate owned, fair value of securities and mortgage servicing rights, goodwill, and valuation of deferred tax assets.
The current protracted economic decline continues to present financial institutions with circumstances and challenges, which in some cases have resulted in large and unanticipated declines in the fair values of investments and other assets, constraints on liquidity and capital, and significant credit quality problems, including severe volatility in the valuation of real estate and other collateral supporting loans.
The accompanying financial statements have been prepared using values and information currently available to CTBI.
Given the volatility of current economic conditions, the values of assets and liabilities recorded in the financial statements could change rapidly, resulting in material future adjustments in asset values, the allowance for loan losses, and capital.
Cash and Cash Equivalents
– CTBI considers all liquid investments with original maturities of three months or less to be cash equivalents. Cash and cash equivalents include cash on hand, amounts due from banks, interest bearing deposits in other financial institutions, and federal funds sold. Generally, federal funds are sold for one-day periods.
Certificates of Deposit in Other Banks
– Certificates of deposit in other banks generally mature within 18 months and are carried at cost.
Investments
–
Management determines the classification of securities at purchase. We classify securities into held-to-maturity, trading, or available-for-sale categories. Held-to-maturity securities are those which we have the positive intent and ability to hold to maturity and are reported at amortized cost. In accordance with Financial Accounting Standards Board (FASB) Accounting Standards Codification (ASC) 320,
Investment Securities
, investments in debt securities that are not classified as held-to-maturity and equity securities that have readily determinable fair values shall be classified in one of the following categories and measured at fair value in the statement of financial position:
a. Trading securities
.
Securities that are bought and held principally for the purpose of selling them in the near term (thus held for only a short period of time) shall be classified as trading securities
.
Trading generally reflects active and frequent buying and selling, and trading securities are generally used with the objective of generating profits on short-term differences in price.
b. Available-for-sale securities. Investments not classified as trading securities (nor as held-to-maturity securities) shall be classified as available-for-sale securities.
We do not have any securities that are classified as trading securities. Available-for-sale securities are reported at fair value, with unrealized gains and losses included as a separate component of shareholders’ equity, net of tax. If declines in fair value are other than temporary, the carrying value of the securities is written down to fair value as a realized loss with a charge to income for the portion attributable to credit losses and a charge to other comprehensive income for the portion that is not credit related.
Gains or losses on disposition of securities are computed by specific identification for all securities except for shares in mutual funds, which are computed by average cost. Interest and dividend income, adjusted by amortization of purchase premium or discount, is included in earnings.
When the fair value of a security is below its amortized cost, and depending on the length of time the condition exists and the extent the fair market value is below amortized cost, additional analysis is performed to determine whether an other than temporary impairment condition exists. Available-for-sale and held-to-maturity securities are analyzed quarterly for possible other than temporary impairment. The analysis considers (i) whether we have the intent to sell our securities prior to recovery and/or maturity and (ii) whether it is more likely than not that we will not have to sell our securities prior to recovery and/or maturity. Often, the information available to conduct these assessments is limited and rapidly changing, making estimates of fair value subject to judgment. If actual information or conditions are different than estimated, the extent of the impairment of the security may be different than previously estimated, which could have a material effect on the CTBI’s results of operations and financial condition.
Loans
–
Loans with the ability and the intent to be held until maturity and/or payoff are reported at the carrying value of unpaid principal reduced by unearned interest, an allowance for loan and lease losses, and unamortized deferred fees or costs. Income is recorded on the level yield basis. Interest accrual is discontinued when management believes, after considering economic and business conditions, collateral value, and collection efforts, that the borrower’s financial condition is such that collection of interest is doubtful. Any loan greater than 90 days past due must be well secured and in the process of collection to continue accruing interest. Cash payments received on nonaccrual loans generally are applied against principal, and interest income is only recorded once principal recovery is reasonably assured. Loans are not reclassified as accruing until principal and interest payments remain current for a period of time, generally six months, and future payments appear reasonably certain. Included in certain loan categories of impaired loans are troubled debt restructurings that were classified as impaired. A restructuring of a debt constitutes a troubled debt restructuring if the creditor for economic or legal reasons related to the debtor’s financial difficulties grants a concession to the debtor that it would not otherwise consider.
Loan origination and commitment fees and certain direct loan origination costs are deferred and the net amount amortized over the estimated life of the related loans, leases, or commitments as a yield adjustment.
Allowance for Loan and Lease Losses
–
We maintain an allowance for loan and lease losses (“ALLL”) at a level that is appropriate to cover estimated credit losses on individually evaluated loans determined to be impaired, as well as estimated credit losses inherent in the remainder of the loan and lease portfolio. Since arriving at an appropriate ALLL involves a high degree of management judgment, we use an ongoing quarterly analysis to develop a range of estimated losses. In accordance with accounting principles generally accepted in the United States, we use our best estimate within the range of potential credit loss to determine the appropriate ALLL. Credit losses are charged and recoveries are credited to the ALLL.
We utilize an internal risk grading system for commercial credits. Those larger commercial credits that exhibit probable or observed credit weaknesses are subject to individual review. The borrower’s cash flow, adequacy of collateral coverage, and other options available to CTBI, including legal remedies, are evaluated. The review of individual loans includes those loans that are impaired as defined by ASC 310-35,
Impairment of a Loan
. We evaluate the collectability of both principal and interest when assessing the need for loss provision. Historical loss rates are analyzed and applied to other commercial loans not subject to specific allocations. The ALLL allocation for this pool of commercial loans is established based on the historical average, maximum, minimum, and median loss ratios.
A loan is considered impaired when, based on current information and events, it is probable that CTBI will be unable to collect the scheduled payments of principal or interest when due according to the contractual terms of the loan agreement. Factors considered by management in determining impairment include payment status, collateral value, and the probability of collecting scheduled principal and interest payments when due. Loans that experience insignificant payment delays and payment shortfalls generally are not classified as impaired. Management determines the significance of payment delays and payment shortfalls on a case-by-case basis, taking into consideration all of the circumstances surrounding the loan and the borrower, including the length of the delay, the reasons for the delay, the borrower’s prior payment record, and the amount of the shortfall in relation to the principal and interest owed. Impairment is measured on a loan-by-loan basis for commercial and construction loans by either the present value of expected future cash flows discounted at the loan’s effective interest rate, the loan’s obtainable market price, or the fair value of the collateral if the loan is collateral dependent.
Homogenous loans, such as consumer installment, residential mortgages, and home equity lines are not individually risk graded. The associated ALLL for these loans is measured under ASC 450,
Contingencies
.
When any secured commercial loan is considered uncollectable, whether past due or not, a current assessment of the value of the underlying collateral is made. If the balance of the loan exceeds the fair value of the collateral, the loan is placed on non-accrual and the loan is charged down to the value of the collateral less estimated cost to sell or a specific reserve equal to the difference between book value of the loan and the fair value assigned to the collateral is created until such time as the loan is foreclosed. When the foreclosed collateral has been legally assigned to CTBI, a charge off is taken, if necessary, in order that the remaining balance reflects the fair value estimated less costs to sell of the collateral then transferred to other real estate owned or other repossessed assets. When any unsecured commercial loan is considered uncollectable the loan is charged off no later than at 90 days past due.
All closed-end consumer loans (excluding conventional 1-4 family residential loans and installment and revolving loans secured by real estate) are charged off no later than 120 days (5 monthly payments) delinquent. If a loan is considered uncollectable, it is charged off earlier than 120 days delinquent. For conventional 1-4 family residential loans and installment and revolving loans secured by real estate, when a loan is 90 days past due, a current assessment of the value of the real estate is made. If the balance of the loan exceeds the fair value of the property, the loan is placed on nonaccrual and foreclosure proceedings are initiated. When the foreclosed property has been legally assigned to CTBI, a charge-off is taken with the remaining balance, reflecting the fair value less estimated costs to sell, transferred to other real estate owned.
Historical loss rates for loans are adjusted for significant factors that, in management’s judgment, reflect the impact of any current conditions on loss recognition. We generally review the historical loss rates over eight quarters and four quarters on a rolling average basis. Factors that we consider include delinquency trends, current economic conditions and trends, strength of supervision and administration of the loan portfolio, levels of underperforming loans, level of recoveries to prior year’s charge-offs, trend in loan losses, industry concentrations and their relative strengths, amount of unsecured loans and underwriting exceptions. Based upon management’s judgment, “best case,” “worst case,” and “most likely” scenarios are determined. The total of each of these weighted factors is then applied against the applicable portion of the portfolio and the ALLL is adjusted accordingly to approximate the most likely scenario. Management continually reevaluates the other subjective factors included in its ALLL analysis. During the third quarter 2012 analysis, management increased several of these subjective factors including trends in past dues, trends in losses, and current economic and regulatory conditions impacting business and individual customers in our geographic markets. The cumulative effect of all of the changes increased the amount calculated for our “most likely” scenario by $3.2 million at December 31, 2012.
Loans Held for Sale –
Mortgage loans originated and intended for sale in the secondary market are carried at the lower of cost or estimated market value in the aggregate. Net unrealized losses, if any, are recognized by charges to income. Gains and losses on loan sales are recorded in noninterest income.
Premises and Equipment
– Premises and equipment are stated at cost less accumulated depreciation and amortization. Capital leases are included in premises and equipment at the capitalized amount less accumulated amortization. Premises and equipment are evaluated for impairment on a quarterly basis.
Depreciation and amortization are computed primarily using the straight-line method. Estimated useful lives range up to 40 years for buildings, 2 to 10 years for furniture, fixtures, and equipment, and up to the lease term for leasehold improvements. Capitalized leased assets are amortized on a straight-line basis over the lives of the respective leases.
Federal Home Loan Bank and Federal Reserve Stock
– CTB is a member of the Federal Home Loan Bank (“FHLB”) system. Members are required to own a certain amount of stock based on the level of borrowings and other factors and may invest on additional amounts. FHLB stock is carried at cost, classified as a restricted security, and periodically evaluated for impairment based on the ultimate recovery par value. Both cash and stock dividends are reported as income.
CTB is also a member of its regional Federal Reserve Bank. Federal Reserve Bank stock is carried at cost, classified as a restricted security, and periodically evaluated for impairment based on the ultimate recovery par value. Both cash and stock dividends are reported as income.
Other Real Estate Owned
– When foreclosed properties are acquired, appraisals are obtained and the properties are booked at the current market value less expected sales costs. Additionally, periodic updated appraisals are obtained on unsold foreclosed properties. When an updated appraisal reflects a market value below the current book value, a charge is booked to current earnings to reduce the property to its new market value less expected sales costs. Our policy for determining the frequency of periodic reviews is based upon consideration of the specific properties and the known or perceived market fluctuations in a particular market and is typically between 12 and 18 months but generally no more than 24 months. All revenues and expenses related to the carrying of other real estate owned are recognized by a charge to income.
Goodwill and Core Deposit Intangible
–
We evaluate total goodwill and core deposit intangible for impairment, based upon ASC 350,
Intangibles-Goodwill and Other
, using fair value techniques including multiples of price/equity. Goodwill and core deposit intangible are evaluated for impairment on an annual basis or as other events may warrant.
The activity to goodwill and core deposit intangible for the years ended December 31, 2012, 2011, and 2010 are shown below.
Goodwill:
|
(in thousands)
|
2012
|
2011
|
2010
|
|||||||||
|
Beginning balance, January 1
|
$ | 65,490 | $ | 65,499 | $ | 65,059 | ||||||
|
Acquisition adjustments
|
0 | (9 | ) | 440 | ||||||||
|
Ending balance, December 31
|
$ | 65,490 | $ | 65,490 | $ | 65,499 | ||||||
Core Deposit Intangible:
|
(in thousands)
|
2012
|
2011
|
2010
|
|||||||||
|
Beginning balance, January 1
|
$ | 1,117 | $ | 1,342 | $ | 648 | ||||||
|
Amortization
|
(213 | ) | (213 | ) | (430 | ) | ||||||
|
Acquisition adjustments
|
0 | (12 | ) | 1,124 | ||||||||
|
Ending balance, December 31
|
$ | 904 | $ | 1,117 | $ | 1,342 | ||||||
Amortization of core deposit intangible is estimated at approximately $0.2 million annually for years one through five.
Transfers of Financial Assets --
Transfers of financial assets are accounted for as sales, when control over the assets has been surrendered. Control over transferred assets is deemed to be surrendered when (1) the assets have been isolated from CTBI—put presumptively beyond the reach of the transferor and its creditors, even in bankruptcy or other receivership, (2) the transferee obtains the right (free of conditions that constrain it from taking advantage of that right) to pledge or exchange the transferred assets, and (3) CTBI does not maintain effective control over the transferred assets through an agreement to repurchase them before their maturity or the ability to unilaterally cause the holder to return specific assets.
Income Taxes
– Income tax expense is based on the taxes due on the consolidated tax return plus deferred taxes based on the expected future tax benefits and consequences of temporary differences between carrying amounts and tax bases of assets and liabilities, using enacted tax rates.
Earnings Per Share (“EPS”)
– Basic EPS is calculated by dividing net income available to common shareholders by the weighted average number of common shares outstanding, excluding restricted shares.
Diluted EPS adjusts the number of weighted average shares of common stock outstanding by the dilutive effect of stock options, including restricted shares, as prescribed in ASC 718,
Share-Based Payment
.
Segments –
Management analyzes the operation of CTBI assuming one operating segment, community banking services. CTBI, through its operating subsidiaries, offers a wide range of consumer and commercial community banking services. These services include: (i) residential and commercial real estate loans; (ii) checking accounts; (iii) regular and term savings accounts and savings certificates; (iv) full service securities brokerage services; (v) consumer loans; (vi) debit cards; (vii) annuity and life insurance products; (viii) Individual Retirement Accounts and Keogh plans; (ix) commercial
loans; (x) trust and wealth management services; and (xi) commercial demand deposit accounts.
Bank Owned Life Insurance –
CTBI’s bank owned life insurance policies are carried at their cash surrender value. We recognize tax-free income from the periodic increases in cash surrender value of these policies and from death benefits.
Mortgage Servicing Rights
– Mortgage servicing rights (“MSRs”) are carried at fair market value following the accounting guidance in ASC 860-50,
Servicing Assets and Liabilities
. MSRs are valued using Level 3 inputs as defined in ASC 820,
Fair Value Measurements
. The fair value is determined quarterly based on an independent third-party valuation using a discounted cash flow analysis and calculated using a computer pricing model. The system used in this evaluation, Compass Point, attempts to quantify loan level idiosyncratic risk by calculating a risk derived value. As a result, each loan’s unique characteristics determine the valuation assumptions ascribed to that loan. Additionally, the computer valuation is based on key economic assumptions including the prepayment speeds of the underlying loans generated using the Andrew Davidson Prepayment Model, FHLMC/FNMA guidelines, the weighted-average life of the loan, the discount rate, the weighted-average coupon, and the weighted-average default rate, as applicable. Along with the gains received from the sale of loans, fees are received for servicing loans. These fees include late fees, which are recorded in interest income, and ancillary fees and monthly servicing fees, which are recorded in noninterest income. Costs of servicing loans are charged to expense as incurred. Changes in fair market value of the MSRs are reported as an increase or decrease to mortgage banking income.
Share-Based Compensation
– CTBI has a share-based employee compensation plan, which is described more fully in note 14 to the consolidated financial statements. CTBI accounts for this plan under the recognition and measurement principles of ASC 718,
Share-Based Payment
.
Comprehensive Income
– Comprehensive income consists of net income and other comprehensive income, net of applicable income taxes. Other comprehensive income includes unrealized appreciation (depreciation) on available-for-sale securities and unrealized appreciation (depreciation) on available-for-sale securities for which a portion of an other than temporary impairment has been recognized in income.
Transfers between Fair Value Hierarchy Levels –
Transfers in and out
of Level 1 (quoted market prices), Level 2 (other significant observable inputs), and Level 3 (significant unobservable inputs) are recognized on the period ending date.
Reclassifications –
Certain reclassifications considered to be immaterial have been made in the prior year condensed consolidated financial statements to conform to current year classifications. These reclassifications had no effect on net income.
New Accounting Standards
–
Ø
Reconsideration of Effective Control for Repurchase Agreements –
In April 2011, the FASB issued ASU 2011-03,
Reconsideration of Effective Control for Repurchase Agreements
. The main objective in developing this ASU was to improve the accounting for repurchase agreements and other agreements that both entitle and obligate a transferor to repurchase or redeem financial assets before their maturity. The amendments in this ASU remove from the assessment of effective control (1) the criterion requiring the transferor to have the ability to repurchase or redeem the financial assets on substantially the agreed terms, even in the event of default by the transferee, and (2) the collateral maintenance implementation guidance related to that criterion. Other criteria applicable to the assessment of effective control were not changed by the amendments in this Update. The guidance in this Update is effective for the first interim or annual period beginning on or after December 15, 2011. The guidance should be applied prospectively to transactions or modifications of existing transactions that occur on or after the effective date. The adoption of ASU No. 2011-03 did not have a material impact on CTBI’s consolidated financial statements.
Ø
Amendments to Achieve Common Fair Value Measurement and Disclosure Requirements in U.S. GAAP and IFRSs –
In May 2011, the FASB issued ASU No. 2011-04,
Amendments to Achieve Common Fair Value Measurement and Disclosure Requirements in U.S. GAAP and IFRSs
. The amendments in this ASU generally represent clarifications of Topic 820, but also include some instances where a particular principle or requirement for measuring fair value or disclosing information about fair value measurements has changed. This ASU results in common principles and requirements for measuring fair value and for disclosing information about fair value measurements in accordance with U.S. GAAP and IFRSs.
The amendments in this ASU are to be applied prospectively. For public entities, the amendments are effective during interim and annual periods beginning after December 15, 2011. The adoption of this ASU did not have a material effect on our financial position or results of operations.
Ø
Amendments to Topic 220, Comprehensive Income –
In June 2011, the FASB issued ASU No. 2011-05,
Amendments to Topic 220, Comprehensive Income
. Under the amendments in this ASU, an entity has the option to present the total of comprehensive income, the components of net income, and the components of other comprehensive income either in a single continuous statement of comprehensive income or in two separate but consecutive statements. In both choices, an entity is required to present each component of net income along with total net income, each component of other comprehensive income along with a total for other comprehensive income, and a total amount for comprehensive income. This ASU eliminates the option to present the components of other comprehensive income as part of the statement of changes in stockholders' equity. The amendments in this ASU do not change the items that must be reported in other comprehensive income or when an item of other comprehensive income must be reclassified to net income.
The amendments in this ASU should be applied retrospectively. For public entities, the amendments are effective for fiscal years, and interim periods within those years, beginning after December 15, 2011. The amendments do not require any transition disclosures. In October 2011, the FASB decided that the specific requirement to present items that are reclassified from other comprehensive income to net income alongside their respective components of net income and other comprehensive income will be deferred. Therefore, those requirements will not be effective for public entities for fiscal years and interim periods within those years beginning after December 15, 2011. The adoption of ASU 2011-05 did not have a material impact on our consolidated financial statements.
In December 2011, the FASB issued ASU No. 2011-12,
Comprehensive Income (Topic 220): Deferral of the Effective Date for Amendments to the Presentation of Reclassification of Items Out of Accumulated Other Comprehensive Income in ASU No. 2011-05
. The amendments in this ASU supersede certain pending paragraphs in ASU No. 2011-05 to effectively defer only those changes that relate to the presentation of reclassification adjustments out of accumulated other comprehensive income. The amendments will be temporary to allow the FASB time to redeliberate the presentation requirements for reclassifications out of accumulated other comprehensive income for annual and interim financial statements for public, private, and non-profit entities.
Ø
Testing Goodwill for Impairment –
In September 2011, the FASB issued ASU No. 2011-08,
Intangibles-Goodwill and Other (Topic 350): Testing Goodwill for Impairment
. The amendments in this ASU will allow an entity to first assess qualitative factors to determine whether it is necessary to perform the two-step quantitative goodwill impairment test. Under these amendments, an entity would not be required to calculate the fair value of a reporting unit unless the entity determines, based on a qualitative assessment, that it is more likely than not that its fair value is less than its carrying amount. The amendments include a number of events and circumstances for an entity to consider in conducting the qualitative assessment. ASU 2011-08 is effective for annual and interim goodwill impairment tests performed for fiscal years beginning after December 15, 2011. Adoption of this ASU did not have a material effect on our consolidated financial statements.
In July 2012, the FASB issued ASU 2012-02,
Intangibles-Goodwill and Other (Topic 350): Testing Goodwill for Impairment
. Under these amendments, an entity would not be required to calculate the fair value of an indefinite-lived intangible asset unless the entity determines, based on qualitative assessment, that it is not more likely than not that the indefinite-lived intangible asset is impaired. The amendments include a number of events and circumstances for an entity to consider in conducting the qualitative assessment. ASU 2012-02 is effective for annual and interim indefinite-lived intangible asset impairment tests performed for fiscal years beginning after September 15, 2012. Early adoption is permitted. Adoption of this ASU did not have a material effect on our consolidated financial statements.
Ø
Amounts Reclassified Out of Other Comprehensive Income –
In February 2013, the FASB issued ASU No. 2013-02,
Comprehensive Income (Topic 220): Reporting of Amounts Reclassified Out of Accumulated Other Comprehensive Income
, to improve the transparency of reporting these reclassifications. Other comprehensive income includes gains and losses that are initially excluded from net income for an accounting period. Those gains and losses are later reclassified out of accumulated other comprehensive income into net income. The amendments in the ASU do not change the current requirements for reporting net income or other comprehensive income in financial statements. All of the information that this ASU requires already is required to be disclosed elsewhere in the financial statements under U.S. GAAP. The new amendments will require an organization to:
|
-
|
Present (either on the face of the statement where net income is presented or in the notes) the effects on the line items of net income of significant amounts reclassified out of accumulated other comprehensive income - but only if the item reclassified is required under U.S. GAAP to be reclassified to net income in its entirety in the same reporting period; and
|
|
-
|
Cross-reference to other disclosures currently required under U.S. GAAP for other reclassification items (that are not required under U.S. GAAP) to be reclassified directly to net income in their entirety in the same reporting period. This would be the case when a portion of the amount reclassified out of accumulated other comprehensive income is initially transferred to a balance sheet account (e.g., inventory for pension-related amounts) instead of directly to income or expense.
|
The amendments apply to all public and private companies that report items of other comprehensive income. Public companies are required to comply with these amendments for all reporting periods (interim and annual).
The amendments are effective for reporting periods beginning after December 15, 2012, for public companies. Early adoption is permitted. The adoption of ASU No. 2013-02 is not expected to have a material impact on CTBI’s consolidated financial statements.
2. Cash and Due from Banks and Interest Bearing Deposits
Included in cash and due from banks and interest bearing deposits are amounts required to be held at the Federal Reserve or maintained in vault cash in accordance with regulatory reserve requirements. The balance requirements were $56.8 million and $52.1 million at December 31, 2012 and 2011, respectively.
Effective July 21, 2010, the FDIC’s insurance limits were permanently increased to $250,000. Pursuant to legislation enacted in 2010, the FDIC fully insured all noninterest bearing transaction accounts December 31, 2010 through December 31, 2012, at all FDIC insured institutions. Effective
January 1, 2013, money in noninterest-bearing transaction accounts (including IOLTA/IOLA) no longer receive unlimited deposit insurance coverage from the FDIC, but will be FDIC-insured up to the legal maximum of $250,000 for each ownership category.
At December 31, 2012, CTBI had no cash accounts which exceeded federally insured limits except our Federal Home Loan Bank interest bearing deposit account which had a balance of $3.5 million at December 31, 2012; however, CTBI had $124 million in deposits with the Federal Reserve which are not subject to FDIC insurance.
At December 31, 2012, we had cash on deposit in noninterest bearing accounts with correspondent banks in the amount of $35.4 million, of which $34.9 million is no longer covered by FDIC insurance effective January 1, 2013.
3. Securities
Securities are classified into held-to-maturity and available-for-sale categories. Held-to-maturity (HTM) securities are those that CTBI has the positive intent and ability to hold to maturity and are reported at amortized cost. Available-for-sale (AFS) securities are those that CTBI may decide to sell if needed for liquidity, asset-liability management or other reasons. Available-for-sale securities are reported at fair value, with unrealized gains or losses included as a separate component of equity, net of tax.
The amortized cost and fair value of securities at December 31, 2012 are summarized as follows:
Available-for-Sale
|
(in thousands)
|
Amortized Cost
|
Gross Unrealized Gains
|
Gross Unrealized Losses
|
Fair Value
|
||||||||||||
|
U.S. Treasury and government agencies
|
$ | 60,625 | $ | 463 | $ | (173 | ) | $ | 60,915 | |||||||
|
State and political subdivisions
|
107,987 | 5,369 | (135 | ) | 113,221 | |||||||||||
|
U.S. government sponsored agency mortgage-backed securities
|
370,246 | 13,347 | (12 | ) | 383,581 | |||||||||||
|
Total debt securities
|
538,858 | 19,179 | (320 | ) | 557,717 | |||||||||||
|
Marketable equity securities
|
45,000 | 626 | (0 | ) | 45,626 | |||||||||||
|
Total available-for-sale securities
|
$ | 583,858 | $ | 19,805 | $ | (320 | ) | $ | 603,343 | |||||||
Held-to-Maturity
|
(in thousands)
|
Amortized Cost
|
Gross Unrealized Gains
|
Gross Unrealized Losses
|
Fair Value
|
||||||||||||
|
U.S. Treasury and government agencies
|
$ | 480 | $ | 0 | $ | (4 | ) | $ | 476 | |||||||
|
State and political subdivisions
|
1,182 | 1 | 0 | 1,183 | ||||||||||||
|
Total held-to-maturity securities
|
$ | 1,662 | $ | 1 | $ | (4 | ) | $ | 1,659 | |||||||
The amortized cost and fair value of securities at December 31, 2011 are summarized as follows:
Available-for-Sale
|
(in thousands)
|
Amortized Cost
|
Gross Unrealized Gains
|
Gross Unrealized Losses
|
Fair Value
|
||||||||||||
|
U.S. Treasury and government agencies
|
$ | 32,077 | $ | 1,171 | $ | 0 | $ | 33,248 | ||||||||
|
State and political subdivisions
|
68,358 | 3,816 | (30 | ) | 72,144 | |||||||||||
|
U.S. government sponsored agency mortgage-backed securities
|
390,714 | 10,186 | (57 | ) | 400,843 | |||||||||||
|
Total debt securities
|
491,149 | 15,173 | (87 | ) | 506,235 | |||||||||||
|
Marketable equity securities
|
20,582 | 718 | (137 | ) | 21,163 | |||||||||||
|
Total available-for-sale securities
|
$ | 511,731 | $ | 15,891 | $ | (224 | ) | $ | 527,398 | |||||||
Held-to-Maturity
|
(in thousands)
|
Amortized Cost
|
Gross Unrealized Gains
|
Gross Unrealized Losses
|
Fair Value
|
||||||||||||
|
U.S. Treasury and government agencies
|
$ | 480 | $ | 0 | $ | (1 | ) | $ | 479 | |||||||
|
State and political subdivisions
|
1,182 | 0 | 0 | 1,182 | ||||||||||||
|
Total held-to-maturity securities
|
$ | 1,662 | $ | 0 | $ | (1 | ) | $ | 1,661 | |||||||
The amortized cost and fair value of securities at December 31, 2012 by contractual maturity are shown below. Expected maturities will differ from contractual maturities because issuers may have the right to call or prepay obligations with or without call or prepayment penalties.
|
Available-for-Sale
|
Held-to-Maturity
|
|||||||||||||||
|
(in thousands)
|
Amortized Cost
|
Fair Value
|
Amortized Cost
|
Fair Value
|
||||||||||||
|
Due in one year or less
|
$ | 6,408 | $ | 6,483 | $ | 0 | $ | 0 | ||||||||
|
Due after one through five years
|
23,034 | 24,006 | 0 | 0 | ||||||||||||
|
Due after five through ten years
|
102,857 | 105,721 | 1,182 | 1,183 | ||||||||||||
|
Due after ten years
|
36,313 | 37,926 | 480 | 476 | ||||||||||||
|
U.S. government sponsored agency mortgage-backed securities
|
370,246 | 383,581 | 0 | 0 | ||||||||||||
|
Total debt securities
|
538,858 | 557,717 | 1,662 | 1,659 | ||||||||||||
|
Marketable equity securities
|
45,000 | 45,626 | 0 | 0 | ||||||||||||
|
Total securities
|
$ | 583,858 | $ | 603,343 | $ | 1,662 | $ | 1,659 | ||||||||
There was a combined gain of $1.2 million realized in 2012 due to sales of four agency securities, one mortgage-backed security, and five auction rate securities and a call of a municipal security. A pre-tax gain of $2.4 million and a pre-tax loss of $1.2 million were realized during the year. There was a pre-tax gain of $218 thousand realized in 2011 due to the sale of an agency security. There were no securities gains or losses during the year 2010.
The amortized cost of securities pledged as collateral, to secure public deposits and for other purposes, was $262.4 million at December 31, 2012 and $198.6 million at December 31, 2011.
The amortized cost of securities sold under agreements to repurchase amounted to $237.3 million at December 31, 2012 and $217.2 million at December 31, 2011.
Certain investments in debt and marketable equity securities are reported in the financial statements at amounts less than their historical costs. CTBI evaluates its investment portfolio on a quarterly basis for impairment. The analysis performed as of December 31, 2012 indicates that all impairment is considered temporary, market driven, and not credit-related. The percentage of total investments with unrealized losses as of December 31, 2012 was 11.5% compared to 4.8% as of December 31, 2011. The following tables provide the amortized cost, gross unrealized losses, and fair market value, aggregated by investment category and length of time the individual securities have been in a continuous unrealized loss position as of December 31, 2012 that are not deemed to be other-than-temporarily impaired.
Available-for-Sale
|
(in thousands)
|
Amortized Cost
|
Gross Unrealized Losses
|
Fair Value
|
|||||||||
|
Less Than 12 Months
|
||||||||||||
|
U.S. Treasury and government agencies
|
$ | 47,576 | $ | (173 | ) | $ | 47,403 | |||||
|
State and political subdivisions
|
11,126 | (135 | ) | 10,991 | ||||||||
|
U.S. government sponsored agency mortgage-backed securities
|
10,563 | (12 | ) | 10,551 | ||||||||
|
Total debt securities
|
69,265 | (320 | ) | 68,945 | ||||||||
|
Total < 12 months temporarily impaired AFS securities
|
69,265 | (320 | ) | 68,945 | ||||||||
|
Total
|
||||||||||||
|
U.S. Treasury and government agencies
|
47,576 | (173 | ) | 47,403 | ||||||||
|
State and political subdivisions
|
11,126 | (135 | ) | 10,991 | ||||||||
|
U.S. government sponsored agency mortgage-backed securities
|
10,563 | (12 | ) | 10,551 | ||||||||
|
Total debt securities
|
69,265 | (320 | ) | 68,945 | ||||||||
|
Total temporarily impaired AFS securities
|
$ | 69,265 | $ | (320 | ) | $ | 68,945 | |||||
Held-to-Maturity
|
(in thousands)
|
Amortized Cost
|
Gross Unrealized Losses
|
Fair Value
|
|||||||||
|
Less Than 12 Months
|
||||||||||||
|
U.S. Treasury and government agencies
|
$ | 480 | $ | (4 | ) | $ | 476 | |||||
|
Total temporarily impaired HTM securities
|
$ | 480 | $ | (4 | ) | $ | 476 | |||||
The analysis performed as of December 31, 2011 indicated that all impairment was considered temporary, market driven, and not credit-related. The following tables provide the amortized cost, gross unrealized losses, and fair market value, aggregated by investment category and length of time the individual securities have been in a continuous unrealized loss position as of December 31, 2011 that are not deemed to be other-than-temporarily impaired.
Available-for-Sale
|
(in thousands)
|
Amortized Cost
|
Gross Unrealized Losses
|
Fair Value
|
|||||||||
|
Less Than 12 Months
|
||||||||||||
|
State and political subdivisions
|
$ | 6,173 | $ | (25 | ) | $ | 6,148 | |||||
|
U.S. government sponsored agency mortgage-backed securities
|
17,900 | (57 | ) | 17,843 | ||||||||
|
Total debt securities
|
24,073 | (82 | ) | 23,991 | ||||||||
|
Total < 12 months temporarily impaired AFS securities
|
24,073 | (82 | ) | 23,991 | ||||||||
|
12 Months or More
|
||||||||||||
|
State and political subdivisions
|
613 | (5 | ) | 608 | ||||||||
|
Total debt securities
|
613 | (5 | ) | 608 | ||||||||
|
Marketable equity securities
|
329 | (137 | ) | 192 | ||||||||
|
Total ≥12 months temporarily impaired AFS securities
|
942 | (142 | ) | 800 | ||||||||
|
Total
|
||||||||||||
|
State and political subdivisions
|
6,786 | (30 | ) | 6,756 | ||||||||
|
U.S. government sponsored agency mortgage-backed securities
|
17,900 | (57 | ) | 17,843 | ||||||||
|
Total debt securities
|
24,686 | (87 | ) | 24,599 | ||||||||
|
Marketable equity securities
|
329 | (137 | ) | 192 | ||||||||
|
Total temporarily impaired AFS securities
|
$ | 25,015 | $ | (224 | ) | $ | 24,791 | |||||
Held-to-Maturity
|
(in thousands)
|
Amortized Cost
|
Gross Unrealized Losses
|
Fair Value
|
|||||||||
|
Less Than 12 Months
|
||||||||||||
|
U.S. Treasury and government agencies
|
$ | 480 | $ | (1 | ) | $ | 479 | |||||
|
Total temporarily impaired HTM securities
|
$ | 480 | $ | (1 | ) | $ | 479 | |||||
4. Loans
Major classifications of loans, net of unearned income, deferred loan origination costs, and net premiums on acquired loans, are summarized as follows:
|
(in thousands)
|
December 31
2012
|
December 31
2011
|
||||||
|
Commercial construction
|
$ | 119,447 | $ | 120,577 | ||||
|
Commercial secured by real estate
|
807,213 | 798,887 | ||||||
|
Equipment lease financing
|
9,246 | 9,706 | ||||||
|
Commercial other
|
376,348 | 374,597 | ||||||
|
Real estate construction
|
55,041 | 53,534 | ||||||
|
Real estate mortgage
|
696,928 | 650,075 | ||||||
|
Home equity
|
82,292 | 84,841 | ||||||
|
Consumer direct
|
122,581 | 123,949 | ||||||
|
Consumer indirect
|
281,477 | 340,382 | ||||||
|
Total loans
|
$ | 2,550,573 | $ | 2,556,548 | ||||
CTBI has segregated and evaluates its loan portfolio through nine portfolio classes. The nine classes are commercial construction, commercial secured by real estate, equipment lease financing, commercial other, real estate construction, real estate mortgage, home equity, consumer direct, and consumer indirect. CTBI serves customers in small and mid-sized communities in eastern, northeastern, central, and south central Kentucky, southern West Virginia, and northeastern Tennessee. Therefore, CTBI’s exposure to credit risk is significantly affected by changes in these communities.
Commercial construction loans are for the purpose of erecting or rehabilitating buildings or other structures for commercial purposes, including any infrastructure necessary for development. Included in this category are improved property, land development, and tract development loans. The terms of these loans are generally short-term with permanent financing upon completion.
Commercial real estate loans include loans secured by nonfarm, nonresidential properties, 1-4 family/multi-family properties, farmland, and other commercial real estate. These loans are originated based on the borrower’s ability to service the debt and secondarily based on the fair value of the underlying collateral.
Equipment lease financing loans are fixed, variable, and tax exempt leases for commercial purposes.
Commercial other loans consist of commercial check loans, agricultural loans, receivable financing, floorplans, loans to financial institutions, loans for purchasing or carrying securities, and other commercial purpose loans. Commercial loans are underwritten based on the borrower’s ability to service debt from the business’s underlying cash flows. As a general practice, we obtain collateral such as real estate, equipment, or other assets, although such loans may be uncollateralized but guaranteed.
Real estate construction loans are typically for owner-occupied properties. The terms of these loans are generally short-term with permanent financing upon completion.
Residential real estate loans are a mixture of fixed rate and adjustable rate first and second lien residential mortgage loans. As a policy, CTBI holds adjustable rate loans and sells the majority of its fixed rate first lien mortgage loans into the secondary market. Changes in interest rates or market conditions may impact a borrower’s ability to meet contractual principal and interest payments. Residential real estate loans are secured by real property.
Home equity lines are revolving adjustable rate credit lines secured by real property.
Consumer direct loans are fixed rate products comprised of unsecured loans, consumer revolving credit lines, deposit secured loans, and all other consumer purpose loans.
Consumer indirect loans are fixed rate loans secured by automobiles, trucks, vans, and recreational vehicles originated at the selling dealership underwritten and purchased by CTBI’s indirect lending department. Both new and used products are financed. Only dealers who have executed dealer agreements with CTBI participate in the indirect lending program.
Not included in the loan balances above were loans held for sale in the amount of $22.5 million at December 31, 2012 and $0.5 million at December 31, 2011, respectively. The amount of capitalized fees and costs under ASC 310-20
,
included in the above loan totals were $0.4 million and $0.7 million at December 31, 2012 and 2011, respectively.
Refer to note 1 to the consolidated financial statements for further information regarding our nonaccrual policy. Nonaccrual loans segregated by class of loans were as follows:
|
(in thousands)
|
December 31
2012
|
December 31
2011
|
||||||
|
Commercial:
|
||||||||
|
Commercial construction
|
$ | 5,955 | $ | 7,029 | ||||
|
Commercial secured by real estate
|
5,572 | 9,810 | ||||||
|
Commercial other
|
1,655 | 3,914 | ||||||
|
Residential:
|
||||||||
|
Real estate construction
|
315 | 607 | ||||||
|
Real estate mortgage
|
3,153 | 4,204 | ||||||
|
Home equity
|
141 | 189 | ||||||
|
Total nonaccrual loans
|
$ | 16,791 | $ | 25,753 | ||||
The following tables present CTBI’s loan portfolio aging analysis, segregated by class, as of December 31, 2012 and 2011:
|
December 31, 2012
|
||||||||||||||||||||||||||||
|
(in thousands)
|
30-59 Days Past Due
|
60-89 Days Past Due
|
90+ Days Past Due
|
Total Past Due
|
Current
|
Total Loans
|
90+ and Accruing*
|
|||||||||||||||||||||
|
Commercial:
|
||||||||||||||||||||||||||||
|
Commercial construction
|
$ | 1,413 | $ | 312 | $ | 9,598 | $ | 11,323 | $ | 108,124 | $ | 119,447 | $ | 3,778 | ||||||||||||||
|
Commercial secured by real estate
|
9,733 | 1,633 | 10,456 | 21,822 | 785,391 | 807,213 | 5,943 | |||||||||||||||||||||
|
Equipment lease financing
|
0 | 0 | 0 | 0 | 9,246 | 9,246 | 0 | |||||||||||||||||||||
|
Commercial other
|
259 | 1,142 | 5,164 | 6,565 | 369,783 | 376,348 | 3,867 | |||||||||||||||||||||
|
Residential:
|
||||||||||||||||||||||||||||
|
Real estate construction
|
248 | 572 | 511 | 1,331 | 53,710 | 55,041 | 196 | |||||||||||||||||||||
|
Real estate mortgage
|
2,765 | 4,029 | 7,138 | 13,932 | 682,996 | 696,928 | 4,511 | |||||||||||||||||||||
|
Home equity
|
921 | 102 | 565 | 1,588 | 80,704 | 82,292 | 441 | |||||||||||||||||||||
|
Consumer:
|
||||||||||||||||||||||||||||
|
Consumer direct
|
1,360 | 336 | 98 | 1,794 | 120,787 | 122,581 | 98 | |||||||||||||||||||||
|
Consumer indirect
|
2,772 | 907 | 381 | 4,060 | 277,417 | 281,477 | 381 | |||||||||||||||||||||
|
Total
|
$ | 19,471 | $ | 9,033 | $ | 33,911 | $ | 62,415 | $ | 2,488,158 | $ | 2,550,573 | $ | 19,215 | ||||||||||||||
|
December 31, 2011
|
||||||||||||||||||||||||||||
|
(in thousands)
|
30-59 Days Past Due
|
60-89 Days Past Due
|
90+ Days Past Due
|
Total Past Due
|
Current
|
Total Loans
|
90+ and Accruing*
|
|||||||||||||||||||||
|
Commercial:
|
||||||||||||||||||||||||||||
|
Commercial construction
|
$ | 362 | $ | 33 | $ | 10,171 | $ | 10,566 | $ | 110,011 | $ | 120,577 | $ | 3,292 | ||||||||||||||
|
Commercial secured by real estate
|
4,566 | 2,978 | 11,998 | 19,542 | 779,345 | 798,887 | 3,969 | |||||||||||||||||||||
|
Equipment lease financing
|
0 | 0 | 0 | 0 | 9,706 | 9,706 | 0 | |||||||||||||||||||||
|
Commercial other
|
2,286 | 688 | 2,504 | 5,478 | 369,119 | 374,597 | 619 | |||||||||||||||||||||
|
Residential:
|
||||||||||||||||||||||||||||
|
Real estate construction
|
305 | 91 | 622 | 1,018 | 52,516 | 53,534 | 16 | |||||||||||||||||||||
|
Real estate mortgage
|
2,067 | 4,974 | 6,547 | 13,588 | 636,487 | 650,075 | 2,719 | |||||||||||||||||||||
|
Home equity
|
968 | 312 | 482 | 1,762 | 83,079 | 84,841 | 346 | |||||||||||||||||||||
|
Consumer:
|
||||||||||||||||||||||||||||
|
Consumer direct
|
1,723 | 171 | 71 | 1,965 | 121,984 | 123,949 | 71 | |||||||||||||||||||||
|
Consumer indirect
|
2,684 | 755 | 483 | 3,922 | 336,460 | 340,382 | 483 | |||||||||||||||||||||
|
Total
|
$ | 14,961 | $ | 10,002 | $ | 32,878 | $ | 57,841 | $ | 2,498,707 | $ | 2,556,548 | $ | 11,515 | ||||||||||||||
*90+ and Accruing are also included in 90+ Days Past Due column.
The risk characteristics of CTBI’s material portfolio segments are as follows:
Commercial real estate loans are viewed primarily as cash flow loans and secondarily as loans secured by real estate. Commercial real estate lending typically involves higher loan principal amounts and the repayment of these loans is generally dependent on the successful operation of the property securing the loan or the business conducted on the property securing the loan. Commercial real estate loans may be more adversely affected by conditions in the real estate markets or in the general economy. Management monitors and evaluates commercial real estate loans based on collateral and risk grade criteria.
Commercial loans are primarily based on the identified cash flows of the borrower and secondarily on the underlying collateral provided by the borrower. The cash flows of borrowers, however, may not be as expected and the collateral securing these loans may fluctuate in value. Most commercial loans are secured by the assets being financed or other business assets such as accounts receivable or inventory and may incorporate a personal guarantee; however, some short-term loans may be made on an unsecured basis. In the case of loans secured by accounts receivable, the availability of funds for the repayment of these loans may be substantially dependent on the ability of the borrower to collect amounts due from its customers.
With respect to residential loans that are secured by 1-4 family residences and are generally owner occupied, CTBI generally establishes a maximum loan-to-value ratio and requires private mortgage insurance if that ratio is exceeded. Home equity loans are typically secured by a subordinate interest in 1-4 family residences, and consumer loans are secured by consumer assets such as automobiles or recreational vehicles. Some consumer loans are unsecured such as small installment loans and certain lines of credit. Repayment of these loans is primarily dependent on the personal income and credit rating of the borrowers, which can be impacted by economic conditions in their market areas such as unemployment levels. Repayment can also be impacted by changes in property values on residential properties. Risk is mitigated by the fact that the loans are of smaller individual amounts and spread over a large number of borrowers.
Credit Quality Indicators:
CTBI categorizes loans into risk categories based on relevant information about the ability of borrowers to service their debt such as: current financial information, historical payment experience, credit documentation, public information, and current economic trends, among other factors. CTBI also considers the fair value of the underlying collateral and the strength and willingness of the guarantor(s). CTBI analyzes commercial loans individually by classifying the loans as to credit risk. Loans classified as loss, doubtful, substandard, or special mention are reviewed quarterly for further deterioration or improvement to determine if appropriately classified and valued if deemed impaired. All other commercial loan reviews are completed every 12 to 18 months. In addition, during the renewal process of any loan, as well as if a loan becomes past due or if other information becomes available, CTBI will evaluate the loan grade. CTBI uses the following definitions for risk ratings:
|
Ø
|
Pass
grades include investment grade, low risk, moderate risk, and acceptable risk loans. The loans range from loans that have no chance of resulting in a loss to loans that have a limited chance of resulting in a loss. Customers in this grade have excellent to fair credit ratings. The cash flows are adequate to meet required debt repayments.
|
|
Ø
|
Watch
graded loans are loans that warrant extra management attention but are not currently criticized. Loans on the watch list may be potential troubled credits or may warrant “watch” status for a reason not directly related to the asset quality of the credit. The watch grade is a management tool to identify credits which may be candidates for future classification or may temporarily warrant extra management monitoring.
|
|
Ø
|
Other assets especially mentioned (OAEM)
reflects loans that are currently protected but are potentially weak. These loans constitute an undue and unwarranted credit risk but not to the point of justifying a classification of substandard. The credit risk may be relatively minor yet constitute an unwarranted risk in light of circumstances surrounding a specific asset. Loans in this grade display potential weaknesses which may, if unchecked or uncorrected, inadequately protect CTBI’s credit position at some future date. The loans may be adversely affected by economic or market conditions.
|
|
Ø
|
Substandard
grading indicates that the loan is inadequately protected by the current sound worth and paying capacity of the obligor or of the collateral pledged. These loans have a well-defined weakness or weaknesses that jeopardize the orderly liquidation of the debt with the distinct possibility that CTBI will sustain some loss if the deficiencies are not corrected.
|
|
Ø
|
Doubtful
graded loans have the weaknesses inherent in the substandard grading with the added characteristic that the weaknesses make collection or liquidation in full, on the basis of currently existing facts, conditions, and values, highly questionable and improbable. The probability of loss is extremely high, but because of certain important and reasonably specific pending factors which may work to CTBI’s advantage or strengthen the asset(s), its classification as an estimated loss is deferred until its more exact status may be determined. Pending factors include proposed merger, acquisition, or liquidation procedures, capital injection, perfecting liens on additional collateral, and refinancing plans.
|
|
Ø
|
A
loss
grading applies to loans that are considered uncollectible and of such little value that their continuance as bankable assets is not warranted. This classification does not mean that the asset has absolutely no recovery value, but rather it is not practical or desirable to defer writing off the asset. Losses must be taken in the period in which they surface as uncollectible, or in the case of collateral-dependent loans, a specific reserve in the amount of the expected loss is applied to the loan until the collateral is liquidated or we have taken possession and moved it into other real estate owned.
|
The following tables present the credit risk profile of CTBI’s commercial loan portfolio based on rating category and payment activity, segregated by class of loans, as of December 31, 2012 and 2011:
|
(
in thousands)
|
Commercial Construction
|
Commercial Secured by Real Estate
|
Commercial Other
|
Equipment Leases
|
Total
|
|||||||||||||||
|
December 31, 2012
|
||||||||||||||||||||
|
Pass
|
$ | 92,140 | $ | 665,764 | $ | 328,646 | $ | 9,246 | $ | 1,095,796 | ||||||||||
|
Watch
|
12,915 | 79,517 | 28,760 | 0 | 121,192 | |||||||||||||||
|
OAEM
|
1,054 | 16,532 | 2,816 | 0 | 20,402 | |||||||||||||||
|
Substandard
|
7,383 | 40,021 | 14,878 | 0 | 62,282 | |||||||||||||||
|
Doubtful
|
5,955 | 5,379 | 1,248 | 0 | 12,582 | |||||||||||||||
|
Total
|
$ | 119,447 | $ | 807,213 | $ | 376,348 | $ | 9,246 | $ | 1,312,254 | ||||||||||
|
December 31, 2011
|
||||||||||||||||||||
|
Pass
|
$ | 85,886 | $ | 643,312 | $ | 323,471 | $ | 9,706 | $ | 1,062,375 | ||||||||||
|
Watch
|
17,721 | 78,611 | 38,185 | 0 | 134,517 | |||||||||||||||
|
OAEM
|
1,379 | 21,087 | 1,668 | 0 | 24,134 | |||||||||||||||
|
Substandard
|
8,783 | 46,238 | 7,364 | 0 | 62,385 | |||||||||||||||
|
Doubtful
|
6,808 | 9,639 | 3,909 | 0 | 20,356 | |||||||||||||||
|
Total
|
$ | 120,577 | $ | 798,887 | $ | 374,597 | $ | 9,706 | $ | 1,303,767 | ||||||||||
The following tables present the credit risk profile of CTBI’s residential real estate and consumer loan portfolios based on performing or nonperforming status, segregated by class, as of December 31, 2012 and 2011:
|
(in thousands)
|
Real Estate Construction
|
Real Estate Mortgage
|
Home Equity
|
Consumer Direct
|
Consumer
Indirect
|
Total
|
||||||||||||||||||
|
December 31, 2012
|
||||||||||||||||||||||||
|
Performing
|
$ | 54,530 | $ | 689,264 | $ | 81,710 | $ | 122,483 | $ | 281,096 | $ | 1,229,083 | ||||||||||||
|
Nonperforming (1)
|
511 | 7,664 | 582 | 98 | 381 | 9,236 | ||||||||||||||||||
|
Total
|
$ | 55,041 | $ | 696,928 | $ | 82,292 | $ | 122,581 | $ | 281,477 | $ | 1,238,319 | ||||||||||||
|
December 31, 2011
|
||||||||||||||||||||||||
|
Performing
|
$ | 52,911 | $ | 643,152 | $ | 84,306 | $ | 123,878 | $ | 339,899 | $ | 1,244,146 | ||||||||||||
|
Nonperforming (1)
|
623 | 6,923 | 535 | 71 | 483 | 8,635 | ||||||||||||||||||
|
Total
|
$ | 53,534 | $ | 650,075 | $ | 84,841 | $ | 123,949 | $ | 340,382 | $ | 1,252,781 | ||||||||||||
(1) A loan is considered nonperforming if it is 90 days or more past due or on nonaccrual.
A loan is considered impaired, in accordance with the impairment accounting guidance (ASC 310-10-35-16), when based on current information and events, it is probable CTBI will be unable to collect all amounts due from the borrower in accordance with the contractual terms of the loan. Impaired loans include nonperforming commercial loans but also include loans modified in troubled debt restructurings where concessions have been granted to borrowers experiencing financial difficulties. These concessions could include a reduction in the interest rate on the loan, payment extensions, forgiveness of principal, forbearance, or other actions intended to maximize collection.
The following table presents impaired loans, the average investment in impaired loans, and interest income recognized on impaired loans for the years ended December 31, 2012 and 2011:
|
December 31, 2012
|
||||||||||||||||||||
|
(in thousands)
|
Recorded Balance
|
Unpaid Contractual Principal Balance
|
Specific Allowance
|
Average Investment in Impaired Loans
|
*Interest Income Recognized
|
|||||||||||||||
|
Loans without a specific valuation allowance:
|
||||||||||||||||||||
|
Commercial construction
|
$ | 3,692 | $ | 4,146 | $ | 0 | $ | 4,249 | $ | 97 | ||||||||||
|
Commercial secured by real estate
|
35,046 | 35,818 | 0 | 35,542 | 1,337 | |||||||||||||||
|
Commercial other
|
13,285 | 15,484 | 0 | 11,083 | 416 | |||||||||||||||
|
Real estate mortgage
|
695 | 695 | 0 | 481 | 30 | |||||||||||||||
|
Loans with a specific valuation allowance:
|
||||||||||||||||||||
|
Commercial construction
|
5,703 | 6,933 | 1,820 | 6,585 | 0 | |||||||||||||||
|
Commercial secured by real estate
|
3,067 | 3,189 | 1,090 | 3,243 | 0 | |||||||||||||||
|
Commercial other
|
1,010 | 2,331 | 338 | 1,441 | 0 | |||||||||||||||
|
Commercial
|
61,803 | 67,901 | 3,248 | 62,143 | 1,850 | |||||||||||||||
|
Residential
|
695 | 695 | 0 | 481 | 30 | |||||||||||||||
|
Total
|
$ | 62,498 | $ | 68,596 | $ | 3,248 | $ | 62,624 | $ | 1,880 | ||||||||||
|
December 31, 2011
|
||||||||||||||||||||
|
(in thousands)
|
Recorded Balance
|
Unpaid Contractual Principal Balance
|
Specific Allowance
|
Average Investment in Impaired Loans
|
*Interest Income Recognized
|
|||||||||||||||
|
Loans without a specific valuation allowance:
|
||||||||||||||||||||
|
Commercial construction
|
$ | 4,778 | $ | 4,778 | $ | 0 | $ | 8,992 | $ | 252 | ||||||||||
|
Commercial secured by real estate
|
27,811 | 29,765 | 0 | 31,480 | 1,543 | |||||||||||||||
|
Commercial other
|
1,770 | 2,501 | 0 | 3,392 | 143 | |||||||||||||||
|
Loans with a specific valuation allowance:
|
||||||||||||||||||||
|
Commercial construction
|
5,794 | 6,643 | 2,203 | 7,681 | 0 | |||||||||||||||
|
Commercial secured by real estate
|
3,525 | 3,669 | 1,156 | 4,747 | 23 | |||||||||||||||
|
Commercial other
|
3,432 | 6,022 | 1,310 | 5,071 | 22 | |||||||||||||||
|
Commercial
|
47,110 | 53,378 | 4,669 | 61,363 | 1,983 | |||||||||||||||
|
Total
|
$ | 47,110 | $ | 53,378 | $ | 4,669 | $ | 61,363 | $ | 1,983 | ||||||||||
|
December 31, 2010
|
||||||||||||||||||||
|
(in thousands)
|
Recorded Balance
|
Unpaid Contractual Principal Balance
|
Specific Allowance
|
Average Investment in Impaired Loans
|
*Interest Income Recognized
|
|||||||||||||||
|
Loans without a specific valuation allowance:
|
||||||||||||||||||||
|
Commercial construction
|
$ | 6,313 | $ | 6,313 | $ | 0 | $ | 6,262 | $ | 43 | ||||||||||
|
Commercial secured by real estate
|
23,503 | 24,034 | 0 | 23,629 | 330 | |||||||||||||||
|
Commercial other
|
4,357 | 4,616 | 0 | 4,407 | 71 | |||||||||||||||
|
Real estate construction
|
790 | 790 | 0 | 790 | 0 | |||||||||||||||
|
Real estate mortgage
|
950 | 950 | 0 | 950 | 0 | |||||||||||||||
|
Loans with a specific valuation allowance:
|
||||||||||||||||||||
|
Commercial construction
|
9,528 | 10,813 | 2,554 | 9,686 | 0 | |||||||||||||||
|
Commercial secured by real estate
|
9,188 | 9,358 | 2,575 | 9,191 | 2 | |||||||||||||||
|
Commercial other
|
8,680 | 10,338 | 3,093 | 8,090 | 85 | |||||||||||||||
|
Commercial
|
61,569 | 65,472 | 8,222 | 61,265 | 531 | |||||||||||||||
|
Residential
|
1,740 | 1,740 | 0 | 1,740 | 0 | |||||||||||||||
|
Total
|
$ | 63,309 | $ | 67,212 | $ | 8,222 | $ | 63,005 | $ | 531 | ||||||||||
*Cash basis interest is substantially the same as interest income recognized.
Included in certain loan categories of impaired loans are certain loans and leases that have been modified in a troubled debt restructuring, where economic concessions have been granted to borrowers who have experienced financial difficulties. These concessions typically result from our loss mitigation activities and could include reductions in the interest rate, payment extensions, forgiveness of principal, forbearance or other actions. Modifications of terms for our loans and their inclusion as troubled debt restructurings are based on individual facts and circumstances. Loan modifications that are included as troubled debt restructurings may involve either an increase or reduction of the interest rate, extension of the term of the loan, or deferral of principal and/or interest payments, regardless of the period of the modification. All of the loans identified as troubled debt restructuring were modified due to financial stress of the borrower. In order to determine if a borrower is experiencing financial difficulty, an evaluation is performed to determine the probability that the borrower will be in payment default on any of its debt in the foreseeable future with the modification. This evaluation is performed under CTBI’s internal underwriting policy.
When we modify loans and leases in a troubled debt restructuring, we evaluate any possible impairment similar to other impaired loans based on the present value of expected future cash flows, discounted at the contractual interest rate of the original loan or lease agreement, or use the current fair value of the collateral, less selling costs for collateral dependent loans. If we determined that the value of the modified loan is less than the recorded investment in the loan (net of previous charge-offs, deferred loan fees or costs and unamortized premium or discount), impairment is recognized through an allowance estimate or a charge-off to the allowance. In periods subsequent to modification, we evaluate all troubled debt restructuring, including those that have payment defaults, for possible impairment and recognize impairment through the allowance. At December 31, 2012, we had no restructured loans with commitments to extend additional credit.
During 2012, certain loans were modified in troubled debt restructurings, where economic concessions were granted to borrowers consisting of reductions in the interest rates, payment extensions, forgiveness of principal, and forbearances. Presented below, segregated by class of loans, are troubled debt restructurings that occurred during the year ended December 31, 2012 and 2011:
|
Year Ended December 31, 2012
|
||||||||||||
|
(in thousands)
|
Number of Loans
|
Post-Modification Outstanding Balance
|
Net Charge-offs Resulting from Modification
|
|||||||||
|
Commercial:
|
||||||||||||
|
Commercial construction
|
5 | $ | 557 | $ | 0 | |||||||
|
Commercial secured by real estate
|
11 | 4,506 | 0 | |||||||||
|
Commercial other
|
23 | 3,233 | 0 | |||||||||
|
Residential:
|
||||||||||||
|
Real estate mortgage
|
1 | 391 | 0 | |||||||||
|
Total troubled debt restructurings
|
40 | $ | 8,687 | $ | 0 | |||||||
|
Year Ended December 31, 2011
|
||||||||||||
|
(in thousands)
|
Number of Loans
|
Post-Modification Outstanding Balance
|
Net Charge-offs Resulting from Modification
|
|||||||||
|
Commercial:
|
||||||||||||
|
Commercial construction
|
7 | $ | 3,457 | $ | 0 | |||||||
|
Commercial secured by real estate
|
19 | 17,497 | 0 | |||||||||
|
Commercial other
|
13 | 2,068 | (1 | ) | ||||||||
|
Total troubled debt restructurings
|
39 | $ | 23,022 | $ | (1 | ) | ||||||
Loans retain their accrual status at the time of their modification. As a result, if a loan is on nonaccrual at the time it is modified, it stays as nonaccrual, and if a loan is on accrual at the time of the modification, it generally stays on accrual. Commercial and consumer loans modified in a troubled debt restructuring are closely monitored for delinquency as an early indicator of possible future default. If loans modified in a troubled debt restructuring subsequently default, CTBI evaluates the loan for possible further impairment. The allowance for loan losses may be increased, adjustments may be made in the allocation of the allowance, or partial charge-offs may be taken to further write-down the carrying value of the loan. Presented below, segregated by class of loans, are loans that were modified as troubled debt restructurings which have subsequently defaulted. CTBI considers a loan in default when it is 90 days or more past due or transferred to nonaccrual.
|
(in thousands)
|
Year Ended
December 31, 2012
|
|||||||
|
Number of Loans
|
Recorded Balance
|
|||||||
|
Commercial:
|
||||||||
|
Commercial secured by real estate
|
1 | $ | 344 | |||||
|
Commercial other
|
6 | 83 | ||||||
|
Total defaulted restructured loans
|
7 | $ | 427 | |||||
|
(in thousands)
|
Year Ended
December 31, 2011
|
|||||||
|
Number of Loans
|
Recorded Balance
|
|||||||
|
Commercial:
|
||||||||
|
Commercial construction
|
2 | $ | 3,913 | |||||
|
Commercial secured by real estate
|
2 | 1,669 | ||||||
|
Commercial other
|
6 | 1,280 | ||||||
|
Total defaulted restructured loans
|
10 | $ | 6,862 | |||||
5. Mortgage Banking and Servicing Rights
Mortgage banking activities primarily include residential mortgage originations and servicing. As discussed in note 1 above, mortgage servicing rights (“MSRs”) are carried at fair market value. The fair value is determined quarterly based on an independent third-party valuation using a discounted cash flow analysis and calculated using a computer pricing model. The system used in this evaluation, Compass Point, attempts to quantify loan level idiosyncratic risk by calculating a risk derived value. As a result, each loan’s unique characteristics determine the valuation assumptions ascribed to that loan. Additionally, the computer valuation is based on key economic assumptions including the prepayment speeds of the underlying loans generated using the Andrew Davidson Prepayment Model, FHLMC/FNMA guidelines, the weighted-average life of the loan, the discount rate, the weighted-average coupon, and the weighted-average default rate, as applicable. Along with the gains received from the sale of loans, fees are received for servicing loans. These fees include late fees, which are recorded in interest income, and ancillary fees and monthly servicing fees, which are recorded in noninterest income. Costs of servicing loans are charged to expense as incurred. Changes in fair market value of the MSRs are reported as an increase or decrease to mortgage banking income.
The following table presents the components of mortgage banking income:
|
(in thousands)
Year Ended December 31
|
2012
|
2011
|
2010
|
|||||||||
|
Net gain on sale of loans held for sale
|
$ | 2,562 | $ | 1,749 | $ | 1,642 | ||||||
|
Net loan servicing income (expense)
|
||||||||||||
|
Servicing fees
|
1,083 | 1,072 | 1,110 | |||||||||
|
Late fees
|
83 | 77 | 74 | |||||||||
|
Ancillary fees
|
382 | 278 | 269 | |||||||||
|
Fair value adjustments
|
(559 | ) | (1,405 | ) | (769 | ) | ||||||
|
Net loan servicing income
|
989 | 22 | 684 | |||||||||
|
Mortgage banking income
|
$ | 3,551 | $ | 1,771 | $ | 2,326 | ||||||
Mortgage loans serviced for others are not included in the accompanying balance sheets. Loans serviced for the benefit of others (primarily FHLMC) totaled $419 million at December 31, 2012 and $425 million at December 31, 2011 and 2010. Servicing loans for others generally consists of collecting mortgage payments, maintaining escrow accounts, disbursing payments to investors, and processing foreclosures. Custodial escrow balances maintained in connection with the foregoing loan servicing, and included in demand deposits, were approximately $673 thousand, $579 thousand, and $485 thousand at December 31, 2012, 2011, and 2010, respectively.
Activity for capitalized mortgage servicing rights using the fair value method is as follows:
|
(in thousands)
|
2012
|
2011
|
2010
|
|||||||||
|
Fair value of MSRs, beginning of period
|
$ | 2,282 | $ | 3,161 | $ | 3,406 | ||||||
|
New servicing assets created
|
641 | 526 | 524 | |||||||||
|
Change in fair value during the period due to:
|
||||||||||||
|
Time decay (1)
|
(116 | ) | (124 | ) | (161 | ) | ||||||
|
Payoffs (2)
|
(478 | ) | (439 | ) | (190 | ) | ||||||
|
Changes in valuation inputs or assumptions (3)
|
35 | (842 | ) | (418 | ) | |||||||
|
Fair value of MSRs, end of period
|
$ | 2,364 | $ | 2,282 | $ | 3,161 | ||||||
|
(1)
|
Represents decrease in value due to regularly scheduled loan principal payments and partial loan paydowns.
|
|
(2)
|
Represents decrease in value due to loans that paid off during the period.
|
|
(3)
|
Represents change in value resulting from market-driven changes in interest rates.
|
The fair values of capitalized mortgage servicing rights were $2.4 million, $2.3 million, and $3.2 million at December 31, 2012, 2011, and 2010, respectively. Fair values were determined by third-party valuations using a discount rate of 10.50% for the year ended December 31, 2012, and 10.0% for the years ended December 31, 2011 and 2010, respectively, and weighted average default rates of 2.65%, 2.61%, and 2.0%, respectively. Prepayment speeds generated using the Andrew Davidson Prepayment Model averaged 16.3%, 19.2%, and 13.3% at December 31, 2012, 2011, and 2010, respectively. These assumptions are prepared by the third party provider and reviewed and approved by management prior to final determination of the fair value. MSR values are very sensitive to movement in interest rates as expected future net servicing income depends on the projected balance of the underlying loans, which can be greatly impacted by the level of prepayments. CTBI does not currently hedge against changes in the fair value of its MSR portfolio.
6. Related Party Transactions
In the ordinary course of business, CTB has made extensions of credit and had transactions with certain directors and executive officers of CTBI or our subsidiaries, including their associates (as defined by the Securities and Exchange Commission). We believe such extensions of credit and transactions were made on substantially the same terms, including interest rate and collateral, as those prevailing at the same time for comparable transactions with other persons.
Activity for related party extensions of credit, including unfunded commitments, during 2012 and 2011 is as follows:
|
(in thousands)
|
2012
|
2011
|
||||||
|
Related party extensions of credit, beginning of period
|
$ | 22,860 | $ | 19,545 | ||||
|
New loans and commitments
|
466 | 5,295 | ||||||
|
Repayments
|
(2,141 | ) | (1,281 | ) | ||||
|
Increase/(decrease) due to changes in related parties
|
11,853 | (699 | ) | |||||
|
Related party extensions of credit, end of period
|
$ | 33,038 | $ | 22,860 | ||||
The aggregate balances of related party deposits at December 31, 2012 and 2011 were $17.2 million and $20.7 million, respectively.
A director of CTBI is a shareholder in a law firm that provides services to CTBI and its subsidiaries. The total of those payments for legal services for the years ended December 31, 2012, 2011, and 2010 were $1.5 million, $1.4 million, and $1.1 million, respectively.
7. Allowance for Loan and Lease Losses
Activity in the allowance for loan and lease losses (“ALLL”) was as follows:
|
(in thousands)
|
2012
|
2011
|
2010
|
|||||||||
|
ALLL balance, beginning of year
|
$ | 33,171 | $ | 34,805 | $ | 32,643 | ||||||
|
Provision charged to operations
|
9,450 | 13,262 | 16,484 | |||||||||
|
Recoveries
|
3,214 | 2,638 | 3,314 | |||||||||
|
Charge-offs
|
12,590 | 17,534 | 17,636 | |||||||||
|
ALLL balance, end of year
|
$ | 33,245 | $ | 33,171 | $ | 34,805 | ||||||
The following tables present the balance in the allowance for loan losses and the recorded investment in loans based on portfolio segment and impairment method as of December 31, 2012 and 2011:
|
2012
|
||||||||||||||||||||||||||||||||||||||||
|
(in thousands)
|
Commercial Construction
|
Commercial Secured by Real Estate
|
Commercial Other
|
Equipment Lease Financing
|
Real Estate Construction
|
Real Estate Mortgage
|
Home Equity
|
Consumer Direct
|
Consumer Indirect
|
Total
|
||||||||||||||||||||||||||||||
|
Allowance for loan losses
|
||||||||||||||||||||||||||||||||||||||||
|
Balance, beginning of year
|
$ | 4,023 | $ | 11,753 | $ | 5,608 | $ | 112 | $ | 354 | $ | 4,302 | $ | 562 | $ | 917 | $ | 5,540 | $ | 33,171 | ||||||||||||||||||||
|
Provision charged to expense
|
1,009 | 3,520 | 2,330 | 14 | 183 | 1,437 | 238 | 892 | (173 | ) | 9,450 | |||||||||||||||||||||||||||||
|
Losses charged off
|
1,034 | 2,035 | 3,233 | 0 | 189 | 1,123 | 248 | 1,245 | 3,483 | 12,590 | ||||||||||||||||||||||||||||||
|
Recoveries
|
35 | 303 | 764 | 0 | 28 | 151 | 11 | 538 | 1,384 | 3,214 | ||||||||||||||||||||||||||||||
|
Balance, end of year
|
$ | 4,033 | $ | 13,541 | $ | 5,469 | $ | 126 | $ | 376 | $ | 4,767 | $ | 563 | $ | 1,102 | $ | 3,268 | $ | 33,245 | ||||||||||||||||||||
|
Ending balance:
|
||||||||||||||||||||||||||||||||||||||||
|
Individually evaluated for impairment
|
$ | 1,820 | $ | 1,090 | $ | 338 | $ | 0 | $ | 0 | $ | 0 | $ | 0 | $ | 0 | $ | 0 | $ | 3,248 | ||||||||||||||||||||
|
Collectively evaluated for impairment
|
$ | 2,213 | $ | 12,451 | $ | 5,131 | $ | 126 | $ | 376 | $ | 4,767 | $ | 563 | $ | 1,102 | $ | 3,268 | $ | 29,997 | ||||||||||||||||||||
|
Loans
|
||||||||||||||||||||||||||||||||||||||||
|
Ending balance:
|
||||||||||||||||||||||||||||||||||||||||
|
Individually evaluated for impairment
|
$ | 9,395 | $ | 38,113 | $ | 14,295 | $ | 0 | $ | 0 | $ | 695 | $ | 0 | $ | 0 | $ | 0 | $ | 62,498 | ||||||||||||||||||||
|
Collectively evaluated for impairment
|
$ | 110,052 | $ | 769,100 | $ | 362,053 | $ | 9,246 | $ | 55,041 | $ | 696,233 | $ | 82,292 | $ | 122,581 | $ | 281,477 | $ | 2,488,075 | ||||||||||||||||||||
|
2011
|
||||||||||||||||||||||||||||||||||||||||
|
(in thousands)
|
Commercial Construction
|
Commercial Secured by Real Estate
|
Commercial Other
|
Equipment Lease Financing
|
Real Estate Construction
|
Real Estate Mortgage
|
Home Equity
|
Consumer Direct
|
Consumer Indirect
|
Total
|
||||||||||||||||||||||||||||||
|
Allowance for loan losses
|
||||||||||||||||||||||||||||||||||||||||
|
Balance, beginning of year
|
$ | 4,332 | $ | 12,327 | $ | 7,392 | $ | 148 | $ | 271 | $ | 2,982 | $ | 407 | $ | 1,169 | $ | 5,777 | $ | 34,805 | ||||||||||||||||||||
|
Provision charged to expense
|
2,171 | 3,304 | 1,867 | (36 | ) | 376 | 2,827 | 310 | 257 | 2,186 | 13,262 | |||||||||||||||||||||||||||||
|
Losses charged off
|
2,510 | 4,018 | 4,092 | 0 | 319 | 1,589 | 171 | 961 | 3,874 | 17,534 | ||||||||||||||||||||||||||||||
|
Recoveries
|
30 | 140 | 441 | 0 | 26 | 82 | 16 | 452 | 1,451 | 2,638 | ||||||||||||||||||||||||||||||
|
Balance, end of year
|
$ | 4,023 | $ | 11,753 | $ | 5,608 | $ | 112 | $ | 354 | $ | 4,302 | $ | 562 | $ | 917 | $ | 5,540 | $ | 33,171 | ||||||||||||||||||||
|
Ending balance:
|
||||||||||||||||||||||||||||||||||||||||
|
Individually evaluated for impairment
|
$ | 2,203 | $ | 1,156 | $ | 1,310 | $ | 0 | $ | 0 | $ | 0 | $ | 0 | $ | 0 | $ | 0 | $ | 4,669 | ||||||||||||||||||||
|
Collectively evaluated for impairment
|
$ | 1,820 | $ | 10,597 | $ | 4,298 | $ | 112 | $ | 354 | $ | 4,302 | $ | 562 | $ | 917 | $ | 5,540 | $ | 28,502 | ||||||||||||||||||||
|
Loans
|
||||||||||||||||||||||||||||||||||||||||
|
Ending balance:
|
||||||||||||||||||||||||||||||||||||||||
|
Individually evaluated for impairment
|
$ | 10,572 | $ | 31,336 | $ | 5,202 | $ | 0 | $ | 0 | $ | 0 | $ | 0 | $ | 0 | $ | 0 | $ | 47,110 | ||||||||||||||||||||
|
Collectively evaluated for impairment
|
$ | 110,005 | $ | 767,551 | $ | 369,395 | $ | 9,706 | $ | 53,534 | $ | 650,075 | $ | 84,841 | $ | 123,949 | $ | 340,382 | $ | 2,509,438 | ||||||||||||||||||||
8. Premises and Equipment
Premises and equipment are summarized as follows:
|
(in thousands)
December 31
|
2012
|
2011
|
||||||
|
Land and buildings
|
$ | 75,918 | $ | 75,240 | ||||
|
Leasehold improvements
|
4,778 | 5,113 | ||||||
|
Furniture, fixtures, and equipment
|
46,680 | 46,463 | ||||||
|
Construction in progress
|
847 | 621 | ||||||
|
Total premises and equipment
|
128,223 | 127,437 | ||||||
|
Less accumulated depreciation and amortization
|
(73,902 | ) | (73,140 | ) | ||||
|
Premises and equipment, net
|
$ | 54,321 | $ | 54,297 | ||||
Depreciation and amortization of premises and equipment was $4.1 million for 2012 and $4.0 million for 2011 and 2010.
9. Other Real Estate Owned
Activity for other real estate owned was as follows:
|
(in thousands)
|
2012
|
2011
|
||||||
|
Beginning balance of other real estate owned
|
$ | 56,965 | $ | 42,935 | ||||
|
New assets acquired
|
12,031 | 31,536 | ||||||
|
Capitalized costs
|
545 | 744 | ||||||
|
Fair value adjustments
|
(2,704 | ) | (6,464 | ) | ||||
|
Sale of assets
|
(19,300 | ) | (11,786 | ) | ||||
|
Ending balance of other real estate owned
|
$ | 47,537 | $ | 56,965 | ||||
Foreclosed properties at December 31, 2012 and 2011 were $47.0 million and $56.5 million, respectively. Also included in other real estate owned are two properties totaling $0.6 million which were not acquired through foreclosure. Carrying costs and fair value adjustments associated with foreclosed properties were $5.3 million, $8.6 million, and $2.6 million for 2012, 2011, and 2010, respectively. See note 1 for a description of our accounting policies relative to foreclosed properties and other real estate owned.
10. Deposits
Major classifications of deposits are categorized as follows:
|
(in thousands)
December 31
|
2012
|
2011
|
||||||
|
Noninterest bearing deposits
|
$ | 606,448 | $ | 584,735 | ||||
|
NOW accounts
|
28,717 | 19,113 | ||||||
|
Money market deposits
|
560,855 | 556,765 | ||||||
|
Savings
|
292,861 | 264,271 | ||||||
|
Certificates of deposit and other time deposits of $100,000 or more
|
692,667 | 693,655 | ||||||
|
Certificates of deposit and other time deposits less than $100,000
|
722,300 | 759,820 | ||||||
|
Total deposits
|
$ | 2,903,848 | $ | 2,878,359 | ||||
Interest expense on deposits is categorized as follows:
|
(in thousands)
|
2012
|
2011
|
2010
|
|||||||||
|
Savings, NOW, and money market accounts
|
$ | 2,894 | $ | 2,824 | $ | 3,074 | ||||||
|
Certificates of deposit and other time deposits of $100,000 or more
|
7,378 | 8,778 | 11,695 | |||||||||
|
Certificates of deposit and other time deposits less than $100,000
|
7,639 | 9,680 | 14,383 | |||||||||
|
Total interest expense on deposits
|
$ | 17,911 | $ | 21,282 | $ | 29,152 | ||||||
Maturities of certificates of deposits and other time deposits are presented below:
|
Maturities by Period at December 31, 2012
|
||||||||||||||||||||||||||||
|
(in thousands)
|
Total
|
Within 1 Year
|
2 Years
|
3 Years
|
4 Years
|
5 Years
|
After 5 Years
|
|||||||||||||||||||||
|
Certificates of deposit and other time deposits of $100,000 or more
|
$ | 692,667 | $ | 599,705 | $ | 45,172 | $ | 17,152 | $ | 12,251 | $ | 18,387 | $ | 0 | ||||||||||||||
|
Certificates of deposit and other time deposits less than $100,000
|
722,300 | 642,292 | 42,675 | 15,875 | 10,348 | 10,744 | 366 | |||||||||||||||||||||
|
Total maturities
|
$ | 1,414,967 | $ | 1,241,997 | $ | 87,847 | $ | 33,027 | $ | 22,599 | $ | 29,131 | $ | 366 | ||||||||||||||
11. Advances from Federal Home Loan Bank
Federal Home Loan Bank advances consisted of the following monthly amortizing and term borrowings at December 31:
|
(in thousands)
|
2012
|
2011
|
||||||
|
Monthly amortizing
|
$ | 1,429 | $ | 1,609 | ||||
|
Term
|
0 | 20,000 | ||||||
|
Total FHLB advances
|
$ | 1,429 | $ | 21,609 | ||||
The advances from the FHLB that require monthly principal payments were due for repayment as follows:
|
Principal Payments Due by Period at December 31, 2012
|
||||||||||||||||||||||||||||
|
(in thousands)
|
Total
|
Within 1 Year
|
2 Years
|
3 Years
|
4 Years
|
5 Years
|
After 5 Years
|
|||||||||||||||||||||
|
Outstanding advances, weighted average interest rate – 2.00%
|
$ | 1,429 | $ | 152 | $ | 116 | $ | 114 | $ | 111 | $ | 98 | $ | 838 | ||||||||||||||
At December 31, 2011, CTBI had monthly amortizing FHLB advances totaling $1.6 million at a weighted average interest rate of 2.20%.
The term advances that require the total payment to be made at maturity follow:
|
(in thousands)
December 31
|
2012
|
2011
|
||||||
|
Advance #271, 0.25%, due 1/18/12
|
$ | 0 | $ | 20,000 | ||||
|
Total term advances
|
$ | 0 | $ | 20,000 | ||||
Advances totaling $1.4 million at December 31, 2012 were collateralized by FHLB stock of $25.7 million and a blanket lien on qualifying first mortgage loans. As of December 31, 2012, CTBI had a $436.1 million FHLB borrowing capacity with $1.4 million in advances and $113.8 million in letters of credit used for public fund pledging leaving $320.9 million available for additional advances. The advances had fixed interest rates ranging from 0.00% to 7.42% with a weighted average rate of 2.00%. The advances are subject to restrictions or penalties in the event of prepayment. Advance #271 matured and was paid off on January 18, 2012.
12. Borrowings
Short-term debt is categorized as follows:
|
(in thousands)
December 31
|
2012
|
2011
|
||||||
|
Repurchase agreements
|
$ | 210,120 | $ | 217,177 | ||||
|
Federal funds purchased
|
12,314 | 13,104 | ||||||
|
Total short-term debt
|
$ | 222,434 | $ | 230,281 | ||||
All federal funds purchased and the majority of repurchase agreements mature and reprice daily. The average rates paid for federal funds purchased and repurchase agreements on December 31, 2012 were 0.15% and 0.53%, respectively.
The maximum balance for repurchase agreements at any month-end during 2012 occurred at March 31, 2012, with a month-end balance of $225.3 million. The average balance of repurchase agreements for the year was $210.6 million.
Long-term debt is categorized as follows:
|
(in thousands)
December 31
|
2012
|
2011
|
||||||
|
Junior subordinated debentures, 1.90%, due 6/1/37
|
$ | 61,341 | $ | 61,341 | ||||
On March 31, 2007, CTBI issued $61.3 million in junior subordinated debentures to a newly formed unconsolidated Delaware statutory trust subsidiary which in turn issued $59.5 million of capital securities in a private placement to institutional investors. The debentures, which mature in 30 years but are redeemable at par at CTBI's option after five years, were issued at a rate of 6.52% until June 1, 2012, and thereafter at a floating rate based on the three-month LIBOR plus 1.59%. The underlying capital securities were issued at the equivalent rates and terms. The proceeds of the debentures were used to fund the redemption on April 2, 2007 of all CTBI's outstanding 9.0% and 8.25% junior subordinated debentures in the total amount of $61.3 million.
On December 5, 2012, the coupon rate was set at 1.90% for the March 1, 2013 distribution date, which was based on the three-month LIBOR rate as of November 29, 2012 of 0.31% plus 1.59%.
On October 26, 2012, Community Trust Bancorp, Inc. entered into a revolving credit promissory note for a line of credit in the amount of $12 million at a floating interest rate of 2.25% in excess of the one-month LIBOR Rate, with an unused commitment fee of 0.15%. Currently, all $12 million remain available for general corporate purposes. The agreement, which was effective October 26, 2012, replaced the agreement dated October 27, 2011, and will mature on October 25, 2013.
13. Income Taxes
The components of the provision for income taxes, exclusive of tax effect of unrealized securities gains, are as follows:
|
(in thousands)
|
2012
|
2011
|
2010
|
|||||||||
|
Current income tax expense
|
$ | 14,784 | $ | 16,905 | $ | 14,393 | ||||||
|
Deferred income tax expense (benefit)
|
5,441 | (94 | ) | 219 | ||||||||
|
Total income tax expense
|
$ | 20,225 | $ | 16,811 | $ | 14,612 | ||||||
A reconciliation of income tax expense at the statutory rate to our actual income tax expense is shown below:
|
(in thousands)
|
2012
|
2011
|
2010
|
|||||||||||||||||||||
|
Computed at the statutory rate
|
$ | 22,781 | 35.00 | % | $ | 19,602 | 35.23 | % | $ | 16,818 | 35.71 | % | ||||||||||||
|
Adjustments resulting from:
|
||||||||||||||||||||||||
|
Tax-exempt interest
|
(1,278 | ) | (1.96 | ) | (948 | ) | (1.70 | ) | (806 | ) | (1.71 | ) | ||||||||||||
|
Housing and new markets credits
|
(704 | ) | (1.08 | ) | (1,007 | ) | (1.81 | ) | (507 | ) | (1.08 | ) | ||||||||||||
|
Dividends received deduction
|
(202 | ) | (0.31 | ) | (183 | ) | (0.33 | ) | (172 | ) | (0.36 | ) | ||||||||||||
|
Bank owned life insurance
|
(470 | ) | (0.72 | ) | (470 | ) | (0.85 | ) | (477 | ) | (1.01 | ) | ||||||||||||
|
ESOP dividend deduction
|
(271 | ) | (0.42 | ) | (262 | ) | (0.47 | ) | (245 | ) | (0.53 | ) | ||||||||||||
|
Other, net
|
369 | 0.56 | 79 | 0.14 | 1 | 0.01 | ||||||||||||||||||
|
Total
|
$ | 20,225 | 31.07 | % | $ | 16,811 | 30.21 | % | $ | 14,612 | 31.03 | % | ||||||||||||
The components of the net deferred tax liability as of December 31 are as follows:
|
(in thousands)
|
2012
|
2011
|
||||||
|
Deferred tax assets:
|
||||||||
|
Allowance for loan and lease losses
|
$ | 11,561 | $ | 11,610 | ||||
|
Interest on nonperforming loans
|
841 | 883 | ||||||
|
Accrued expenses
|
1,456 | 356 | ||||||
|
Dealer reserve valuation
|
0 | 982 | ||||||
|
Allowance for other real estate owned
|
3,269 | 3,964 | ||||||
|
Write-down of auction rate securities
|
0 | 3,969 | ||||||
|
Other
|
663 | 317 | ||||||
|
Total deferred tax assets
|
17,790 | 22,081 | ||||||
|
Deferred tax liabilities:
|
||||||||
|
Depreciation and amortization
|
(18,091 | ) | (16,852 | ) | ||||
|
FHLB stock dividends
|
(4,956 | ) | (4,956 | ) | ||||
|
Loan fee income
|
(842 | ) | (1,092 | ) | ||||
|
Mortgage servicing rights
|
(827 | ) | (799 | ) | ||||
|
Capitalized lease obligations
|
(850 | ) | (766 | ) | ||||
|
Unrealized gains on AFS securities
|
(7,424 | ) | (6,088 | ) | ||||
|
Other
|
(1,077 | ) | (1,028 | ) | ||||
|
Total deferred tax liabilities
|
(34,067 | ) | (31,581 | ) | ||||
|
Net deferred tax liability
|
$ | (16,277 | ) | $ | (9,500 | ) | ||
CTBI accounts for income taxes in accordance with income tax accounting guidance (ASC 740,
Income Taxes
). The income tax accounting guidance results in two components of income tax expense: current and deferred. Current income tax expense reflects taxes to be paid or refunded for the current period by applying the provisions of the enacted tax law to the taxable income or excess of deductions over revenues. CTBI determines deferred income taxes using the liability (or balance sheet) method. Under this method, the net deferred tax asset or liability is based on the tax effects of the differences between the book and tax bases of assets and liabilities, and enacted changes in tax rates and laws are recognized in the period in which they occur. Deferred income tax expense results from changes in deferred tax assets and liabilities between periods. Deferred tax assets are reduced by a valuation allowance if, based on the weight of evidence available, it is more likely than not that some portion or all of a deferred tax asset will not be realized.
Uncertain tax positions are recognized if it is more likely than not, based on the technical merits, that the tax position will be realized or sustained upon examination. The term more likely than not means a likelihood of more than 50 percent; the terms examined and upon examination also include resolution of the related appeals or litigation processes, if any. A tax position that meets the more-likely-than-not recognition threshold is initially and subsequently measured as the largest amount of tax benefit that has a greater than 50 percent likelihood of being realized upon settlement with a taxing authority that has full knowledge of all relevant information. The determination of whether or not a tax position has met the more-likely-than-not recognition threshold considers the facts, circumstances, and information available at the reporting date and is subject to management’s judgment.
With a few exceptions, CTBI is no longer subject to U.S. federal tax examinations by tax authorities for years before 2009, and state and local income tax examinations by tax authorities for years before 2007. For federal tax purposes, CTBI recognizes interest and penalties on income taxes as a component of income tax expense.
CTBI files consolidated income tax returns with its subsidiaries.
14. Employee Benefits
CTBI maintains two separate retirement savings plans, a 401(k) Plan and an Employee Stock Ownership Plan (“ESOP”).
The 401(k) Plan is available to all employees (age 21 and over) with one year of service and who work at least 1,000 hours per year. Participants in the plan have the option to contribute from 1% to 15% of their annual compensation. CTBI matches 50% of participant contributions up to 4% of gross pay. CTBI may at its discretion, contribute an additional percentage of covered employees’ compensation. CTBI’s matching contributions were $1.0 million for the year ended December 31, 2012 and $0.9 million for both of the years ended December 31, 2011 and 2010. The 401(k) Plan owned 501,388, 531,361, and 507,932 shares of CTBI’s common stock at December 31, 2012, 2011, and 2010, respectively. Substantially all shares owned by the 401(k) were allocated to employee accounts on those dates. The market price of the shares at the date of allocation is essentially the same as the market price at the date of purchase.
The ESOP Plan has the same entrance requirements as the 401(k) Plan above. CTBI currently contributes 4% of covered employees’ gross compensation to the ESOP. The ESOP uses the contributions to acquire shares of CTBI’s common stock. CTBI’s contributions to the ESOP were $1.4 million for both of the years ended December 31, 2012 and 2011 and $1.3 million for the year ended December 31, 2010. The ESOP owned 680,613, 661,691, and 647,158 shares of CTBI’s common stock at December 31, 2012, 2011, and 2010, respectively. Substantially all shares owned by the ESOP were allocated to employee accounts on those dates. The market price of the shares at the date of allocation is essentially the same as the market price at the date of purchase.
Stock-Based Compensation:
CTBI currently maintains one active and one inactive incentive stock option plan covering key employees. The 2006 Stock Ownership Incentive Plan (“2006 Plan”) was approved by the Board of Directors and the Shareholders in 2006. The 1998 Stock Option Plan (“1998 Plan”) was approved by the Board of Directors and the Shareholders in 1998. The 1998 Plan was rendered inactive as of April 26, 2006. The 2006 Plan had 1,500,000 shares authorized, 1,245,189 of which were available at December 31, 2012 for future grants. In addition, any shares reserved for issuance under the 1998 Stock Option Plan (“1998 Plan”) in excess of the number of shares as to which options or other benefits are awarded thereunder, plus any shares as to which options or other benefits granted under the 1998 Plan may lapse, expire, terminate or be canceled, shall also be reserved and available for issuance or reissuance under the 2006 Plan. As of December 31, 2012, the 1998 Plan had 1,046,831 shares authorized, 198,024 of which were transferred to the 2006 Plan. The total shares available for issuance under the 2006 Plan as of December 31, 2012 was 1,443,213. The following table provides detail of the number of shares to be issued upon exercise of outstanding stock-based awards and remaining shares available for future issuance under all of CTBI’s equity compensation plans as of December 31, 2012:
|
Plan Category
(shares in thousands)
|
Number of Shares to Be Issued Upon Exercise/Vesting
|
Weighted
Average Price
|
Shares Available for Future Issuance
|
||||||
|
Equity compensation plans approved by shareholders:
|
|||||||||
|
Stock options
|
326 | $ 32.64 | 1,443 (a) | ||||||
|
Restricted stock
|
(c)
|
(b)
|
(a)
|
||||||
|
Performance units
|
(d)
|
(b)
|
(a)
|
||||||
|
Stock appreciation rights (“SARs”)
|
(e)
|
(b)
|
(a)
|
||||||
|
Total
|
1,443 |
|
(a)
|
Under the 2006 Plan, 1.5 million shares (plus any shares reserved for issuance under the 1998 Stock Option Plan) were authorized for issuance as nonqualified and incentive stock options, SARS, restricted stock and performance units. As of December 31, 2012, the above shares remained available for issuance.
|
|
(b)
|
Not applicable
|
|
(c)
|
The maximum number of shares of Restricted Stock that may be granted is 400,000 shares, and the maximum that may be granted to a participant during any calendar year is 40,000 shares.
|
|
(d)
|
No performance units had been issued as of December 31, 2012. The maximum payment that can be made pursuant to Performance Units granted to any one Participant in any calendar year shall be $250,000.
|
|
(e)
|
No SARS have been issued
.
The maximum number of shares with respect to which SARs may be granted to a Participant during any calendar year shall be 100,000 shares.
|
The following table details the shares available for future issuance under the 2006 Plan at December 31, 2012.
|
Plan Category
|
Shares Available for Future Issuance
|
||
|
Shares available at January 1, 2012
|
1,442,719 | ||
|
1998 Plan forfeitures in 2012
|
100 | ||
|
2006 Plan restricted stock issuances in 2012
|
(331 | ) | |
|
2006 Plan forfeitures in 2012
|
725 | ||
|
Shares available for future issuance
|
1,443,213 |
CTBI uses a Black-Scholes option pricing model with the following weighted average assumptions, which are evaluated and revised as necessary, in estimating the grant-date fair value of each option grant for the year end:
|
2012
|
2011
|
2010
|
||||||||||
|
Expected option life (in years)
|
-- | -- | 7.5 | |||||||||
|
Expected volatility
|
-- | -- | 0.391 | |||||||||
|
Expected dividend yield
|
-- | -- | 4.78 | % | ||||||||
|
Risk-free interest rate
|
-- | -- | 3.139 | % | ||||||||
The expected option life is derived from the “safe-harbor” rules for estimating option life in ASC 718,
Share-Based Payment
. The expected volatility is based on historical volatility of the stock using a historical look back that approximates the expected life of the option grant. The interest rate for periods within the contractual life of the option is based on the U.S. Treasury yield curve in effect at the time of the grant. CTBI’s stock-based compensation expense for the years 2012, 2011, and 2010 was $0.6 million, $0.7 million, and $0.8 million, respectively. Dividends paid on restricted stock shares were $121 thousand, $120 thousand, and $74 thousand, respectively, for the same periods.
CTBI’s stock option activity for the 2006 Plan for the years ended December 31, 2012, 2011, and 2010 is summarized as follows:
|
December 31
|
2012
|
2011
|
2010
|
|||||||||||||||||||||
|
Options
|
Weighted Average Exercise Price
|
Options
|
Weighted Average Exercise Price
|
Options
|
Weighted Average Exercise Price
|
|||||||||||||||||||
|
Outstanding at beginning of year
|
152,571 | $ | 34.57 | 177,125 | $ | 34.61 | 174,678 | $ | 34.85 | |||||||||||||||
|
Granted
|
0 | -- | 0 | -- | 4,525 | 25.09 | ||||||||||||||||||
|
Exercised
|
(3,188 | ) | 28.51 | 0 | -- | 0 | -- | |||||||||||||||||
|
Forfeited/expired
|
(725 | ) | 30.05 | (24,554 | ) | 34.84 | (2,078 | ) | 33.83 | |||||||||||||||
|
Outstanding at end of year
|
148,658 | $ | 34.72 | 152,571 | $ | 34.57 | 177,125 | $ | 34.61 | |||||||||||||||
|
Exercisable at end of year
|
102,323 | $ | 37.69 | 101,092 | $ | 37.81 | 90,962 | $ | 37.70 | |||||||||||||||
A summary of the status of CTBI’s 2006 Plan for nonvested shares as of December 31, 2012, and changes during the year ended December 31, 2012, is presented as follows:
|
Nonvested Shares
|
Shares
|
Weighted Average Grant Date Fair Value
|
||||||
|
Nonvested at January 1, 2012
|
51,479 | $ | 6.53 | |||||
|
Granted
|
0 | -- | ||||||
|
Vested
|
(4,894 | ) | 7.02 | |||||
|
Forfeited
|
(250 | ) | 7.05 | |||||
|
Nonvested at December 31, 2012
|
46,335 | $ | 6.48 | |||||
The 2006 Plan had options with the following remaining lives at December 31, 2012:
|
2006 Option Plan
|
||||||||
|
Remaining Life
|
Outstanding Options
|
Weighted Average Price
|
||||||
|
Four years
|
89,746 | $ | 38.95 | |||||
|
Five years
|
46,700 | 28.32 | ||||||
|
Six years
|
7,937 | 29.82 | ||||||
|
Seven years
|
4,275 | 25.09 | ||||||
|
Total outstanding
|
148,658 | |||||||
|
Weighted average price
|
$ | 34.72 | ||||||
No stock options were granted during 2012 or 2011. The weighted-average fair value of options granted from the 2006 Plan during the year 2010 was $0.03 million or $6.53 per share.
The following table shows the intrinsic values of options exercised, exercisable, and outstanding for the 2006 Plan for the years ended December 31, 2012, 2011, and 2010:
|
(in thousands)
|
2012
|
2011
|
2010
|
|||||||||
|
Options exercised
|
$ | 22 | $ | 0 | $ | 0 | ||||||
|
Options exercisable
|
88 | 43 | 0 | |||||||||
|
Outstanding options
|
388 | 345 | 0 | |||||||||
The following table shows restricted stock activity for the years ended December 31, 2012, 2011, and 2010:
|
December 31
|
2012
|
2011
|
2010
|
|||||||||||||||||||||
|
Grants
|
Weighted Average Fair
Value at Grant
|
Grants
|
Weighted Average Fair
Value at Grant
|
Grants
|
Weighted Average Fair Value at Grant
|
|||||||||||||||||||
|
Outstanding at beginning of year
|
96,543 | $ | 27.91 | 52,834 | $ | 26.10 | 16,786 | $ | 28.83 | |||||||||||||||
|
Granted
|
331 | 30.92 | 45,542 | 30.09 | 44,996 | 25.09 | ||||||||||||||||||
|
Exercised
|
-- | -- | (1,617 | ) | 30.09 | (4,474 | ) | 26.14 | ||||||||||||||||
|
Forfeited/expired
|
-- | -- | (216 | ) | 30.09 | (4,474 | ) | 26.14 | ||||||||||||||||
|
Outstanding at end of year
|
96,874 | $ | 27.92 | 96,543 | $ | 27.91 | 52,834 | $ | 26.10 | |||||||||||||||
During 2011 and 2010, the Compensation Committee of the Board of Directors approved the accelerated vesting of restricted stock grants of certain employees who had retired. The total amount of restricted stock grants for which vesting was accelerated during the years 2011 and 2010 was 1,617 shares at a weighted average fair value of $30.09 and 4,474 shares at a weighted average fair value of $26.14, respectively. During 2010, the Compensation Committee also approved the accelerated vesting of regular stock options consisting of 5,215 shares with an option price of $38.95 and 3,750 shares with an option price of $28.32.
CTBI’s stock option activity for the 1998 Plan for the years ended December 31, 2012, 2011, and 2010 is summarized as follows:
|
December 31
|
2012
|
2011
|
2010
|
|||||||||||||||||||||
|
Options
|
Weighted Average Exercise Price
|
Options
|
Weighted Average Exercise Price
|
Options
|
Weighted Average Exercise Price
|
|||||||||||||||||||
|
Outstanding at beginning of year
|
321,540 | $ | 26.85 | 371,077 | $ | 27.07 | 420,731 | $ | 25.64 | |||||||||||||||
|
Granted
|
0 | -- | 0 | -- | 0 | -- | ||||||||||||||||||
|
Exercised
|
(143,914 | ) | 21.83 | (6,824 | ) | 19.63 | (48,730 | ) | 14.66 | |||||||||||||||
|
Forfeited/expired
|
(100 | ) | 32.44 | (42,713 | ) | 29.94 | (924 | ) | 32.44 | |||||||||||||||
|
Outstanding at end of year
|
177,526 | $ | 30.89 | 321,540 | $ | 26.85 | 371,077 | $ | 27.07 | |||||||||||||||
|
Exercisable at end of year
|
177,526 | $ | 30.89 | 321,540 | $ | 26.85 | 361,077 | $ | 26.92 | |||||||||||||||
The 1998 Plan had options with the following remaining lives at December 31, 2012:
|
1998 Option Plan
|
||||||||
|
Remaining Life
|
Outstanding Options
|
Weighted Average Price
|
||||||
|
One year or less
|
2,435 | $ | 20.99 | |||||
|
Two years
|
34,100 | 27.85 | ||||||
|
Three years
|
57,849 | 30.88 | ||||||
|
Four years
|
83,142 | 32.44 | ||||||
|
Total outstanding
|
177,526 | |||||||
|
Weighted average price
|
$ | 30.89 | ||||||
The following table shows the intrinsic values of options exercised, exercisable, and outstanding for the 1998 Plan for the years ended December 31, 2012, 2011, and 2010:
|
(in thousands)
|
2012
|
2011
|
2010
|
|||||||||
|
Options exercised
|
$ | 690 | $ | 27 | $ | 627 | ||||||
|
Options exercisable
|
1,517 | 833 | 1,206 | |||||||||
|
Outstanding options
|
1,517 | 833 | 1,206 | |||||||||
There were no nonvested shares in the 1998 Plan shares as of December 31, 2012 and December 31, 2011.
The following table shows the
unrecognized compensation cost related to nonvested share-based compensation arrangements granted under the plans at December 31, 2012, 2011, and 2010 and the total grant-date fair value of shares vested, cash received from option exercises under all share-based payment arrangements, and the actual tax benefit realized for the tax deductions from option exercises of the share-based payment arrangements for the years ended December 31, 2012, 2011, and 2010.
|
(in thousands)
|
2012
|
2011
|
2010
|
|||||||||
|
Unrecognized compensation cost of unvested share-based compensation arrangements granted under the plan at year-end
|
$ | 1,133 | $ | 1,729 | $ | 990 | ||||||
|
Grant date fair value of shares vested for the year
|
34 | 284 | 719 | |||||||||
|
Cash received from option exercises under all share-based payment arrangements for the year
|
3,137 | 134 | 672 | |||||||||
|
Tax benefit realized for the tax deductions from option exercises of the share-based payment arrangements for the year
|
496 | 23 | 205 | |||||||||
The unrecognized compensation cost related to nonvested share-based compensation arrangements granted under the plans at December 31, 2012 is expected to be recognized over a weighted-average period of 1.5 years.
15. Operating Leases
Certain premises and equipment are leased under operating leases. Additionally, certain premises are leased or subleased to third parties. These leases generally contain renewal options and require CTBI to pay all executory costs, such as taxes, maintenance fees, and insurance. Minimum non-cancellable rental payments and rental receipts are as follows:
|
(in thousands)
|
Payments
|
Receipts
|
||||||
|
2013
|
$ | 1,607 | $ | 534 | ||||
|
2014
|
1,068 | 202 | ||||||
|
2015
|
851 | 160 | ||||||
|
2016
|
647 | 106 | ||||||
|
2017
|
508 | 3 | ||||||
|
Thereafter
|
2,603 | 0 | ||||||
|
Total
|
$ | 7,284 | $ | 1,005 | ||||
Rental expense net of rental income under operating leases was $0.8 million for 2012, $0.9 million for 2011, and $0.7 million for 2010.
16. Fair Market Value of Financial Assets and Liabilities
Fair Value Measurements
ASC 820,
Fair Value Measurements
, defines fair value, establishes a framework for measuring fair value in generally accepted accounting principles and expands disclosures about fair value measurements. ASC 820 applies whenever other standards require (or permit) assets or liabilities to be measured at fair value but does not expand the use of fair value in any new circumstances. Fair value measurements must maximize the use of observable inputs and minimize the use of unobservable inputs. In this standard, the FASB clarifies the principle that fair value should be based on the assumptions market participants would use when pricing the asset or liability. In support of this principle, ASC 820 establishes a fair value hierarchy that prioritizes the information used to develop those assumptions. The fair value hierarchy is as follows:
Level 1 Inputs – Quoted prices in active markets for identical assets or liabilities.
Level 2 Inputs - Inputs other than quoted prices included in Level 1 that are observable for the asset or liability, either directly or indirectly. These might include quoted prices for similar assets and liabilities in active markets, and inputs other than quoted prices that are observable for the asset or liability, such as interest rates and yield curves that are observable at commonly quoted intervals.
Level 3 Inputs - Unobservable inputs for determining the fair values of assets or liabilities that reflect an entity’s own assumptions about the assumptions that market participants would use in pricing the assets or liabilities.
Recurring Measurements
The following tables present the fair value measurements of assets recognized in the accompanying balance sheets measured at fair value on a recurring basis as of December 31, 2012 and December 31, 2011 and indicates the level within the fair value hierarchy of the valuation techniques.
|
(in thousands)
|
Fair Value Measurements at
December 31, 2012 Using
|
|||||||||||||||
|
Fair Value
|
Quoted Prices in Active Markets for Identical Assets
(Level 1)
|
Significant Other Observable Inputs
(Level 2)
|
Significant Unobservable Inputs
(Level 3)
|
|||||||||||||
|
Assets measured – recurring basis
|
||||||||||||||||
|
Available-for-sale securities:
|
||||||||||||||||
|
U.S. Treasury and government agencies
|
$ | 60,915 | $ | 0 | $ | 60,915 | $ | 0 | ||||||||
|
State and political subdivisions
|
113,221 | 0 | 113,221 | 0 | ||||||||||||
|
U.S. government sponsored agency mortgage-backed securities
|
383,581 | 0 | 383,581 | 0 | ||||||||||||
|
Marketable equity securities
|
45,626 | 45,626 | 0 | 0 | ||||||||||||
|
Mortgage servicing rights
|
2,364 | 0 | 0 | 2,364 | ||||||||||||
|
(in thousands)
|
Fair Value Measurements at
December 31, 2011 Using
|
|||||||||||||||
|
Fair Value
|
Quoted Prices in Active Markets for Identical Assets
(Level 1)
|
Significant Other Observable Inputs
(Level 2)
|
Significant Unobservable Inputs
(Level 3)
|
|||||||||||||
|
Assets measured – recurring basis
|
||||||||||||||||
|
Available-for-sale securities:
|
||||||||||||||||
|
U.S. Treasury and government agencies
|
$ | 33,248 | $ | 0 | $ | 33,248 | $ | 0 | ||||||||
|
State and political subdivisions
|
72,144 | 0 | 72,144 | 0 | ||||||||||||
|
U.S. government sponsored agency mortgage-backed securities
|
400,843 | 507 | 400,336 | 0 | ||||||||||||
|
Marketable equity securities
|
21,163 | 20,675 | 277 | 211 | ||||||||||||
|
Mortgage servicing rights
|
2,282 | 0 | 0 | 2,282 | ||||||||||||
Following is a description of the valuation methodologies and inputs used for assets measured at fair value on a recurring basis and recognized in the accompanying balance sheets, as well as the general classification of such assets pursuant to the valuation hierarchy. These valuation methodologies were applied to all of CTBI’s financial assets carried at fair value. CTBI had no liabilities measured at fair value as of December 31, 2012 and December 31, 2011. There have been no significant changes in the valuation techniques during the year ended December 31, 2012. For assets classified within Level 3 of the fair value hierarchy, the process used to develop the reported fair value is described below.
Available-for-Sale Securities
Securities classified as available-for-sale are reported at fair value on a recurring basis. CTBI’s CRA investment funds and Federated GNMA trust fund (included in marketable equity securities) are classified as Level 1 of the valuation hierarchy where quoted market prices are available in the active market on which the individual securities are traded.
If quoted market prices are not available, CTBI obtains fair value measurements from an independent pricing service, such as Interactive Data, which utilizes pricing models to determine fair value measurement. CTBI reviews the pricing quarterly to verify the reasonableness of the pricing. The fair value measurements consider observable data that may include dealer quotes, market spreads, cash flows, the U.S. Treasury yield curve, live trading levels, trade execution data, market consensus prepayment speeds, credit information and the bond’s terms and conditions, among other factors. U.S. Treasury and government agencies, state and political subdivisions, and U.S. government sponsored agency mortgage-backed securities are classified as Level 2 inputs.
In certain cases where Level 1 or Level 2 inputs are not available, securities are classified within Level 3 of the hierarchy. Fair value determinations for Level 3 measurements are estimated on a quarterly basis where assumptions used are reviewed to ensure the estimated fair value complies with accounting standards generally accepted in the United States. As of December 31, 2012, CTBI does not own any securities classified as Level 3 inputs.
Mortgage Servicing Rights
Mortgage servicing rights do not trade in an active, open market with readily observable prices. CTBI reports mortgage servicing rights at fair value on a recurring basis with subsequent remeasurement of MSRs based on change in fair value.
In determining fair value, CTBI utilizes the expertise of an independent third party. Accordingly, fair value is determined by the independent third party by utilizing assumptions about factors such as mortgage interest rates, discount rates, mortgage loan prepayment speeds, market trends and industry demand. Due to the nature of the valuation inputs, mortgage servicing rights are classified within Level 3 of the hierarchy. Fair value determinations for Level 3 measurements of mortgage servicing rights are tested for impairment on a quarterly basis where assumptions used are reviewed to ensure the estimated fair value complies with accounting standards generally accepted in the United States. See the table below for inputs and valuation techniques used for Level 3 mortgage servicing rights.
Transfers between Levels
Transfers between Levels 1, 2, and 3 during the year 2012 and the reasons for those transfers are as follows:
|
(in thousands)
|
Quoted Prices in Active Markets for Identical Assets
(Level 1)
|
Significant Other Observable Inputs
(Level 2)
|
Significant Unobservable Inputs
(Level 3)
|
Reason for Transfer
|
|||||||||
|
Transfers from level:
|
|||||||||||||
|
U.S. government sponsored agency mortgage-backed securities
|
$ | 464 | $ | 0 | $ | 0 |
Quoted prices in exact security not available on the measurement date
|
||||||
|
Marketable equity securities
|
0 | 323 | 0 |
Quoted prices available on the measurement date
|
|||||||||
|
Total transfers from level
|
$ | 464 | $ | 323 | $ | 0 | |||||||
|
Transfers to level:
|
|||||||||||||
|
U.S. government sponsored agency mortgage-backed securities
|
$ | 0 | $ | 464 | $ | 0 |
Quoted prices in exact security not available on the measurement date
|
||||||
|
Marketable equity securities
|
323 | 0 | 0 |
Quoted prices available on the measurement date
|
|||||||||
|
Total transfers to level
|
$ | 323 | $ | 464 | $ | 0 | |||||||
Level 3 Reconciliation
Following is a reconciliation of the beginning and ending balances of recurring fair value measurements recognized in the accompanying balance sheet using significant unobservable (Level 3) inputs:
|
(in thousands)
|
2012
|
2011
|
||||||||||||||
|
Marketable Equity Securities
|
Mortgage Servicing Rights
|
Marketable Equity Securities
|
Mortgage Servicing Rights
|
|||||||||||||
|
Beginning balance
|
$ | 211 | $ | 2,282 | $ | 211 | $ | 3,161 | ||||||||
|
Total recognized gains (losses)
|
||||||||||||||||
|
Included in net income
|
(41 | ) | 35 | 0 | (842 | ) | ||||||||||
|
Issues
|
0 | 641 | 0 | 526 | ||||||||||||
|
Sales
|
(170 | ) | 0 | 0 | 0 | |||||||||||
|
Settlements
|
0 | (594 | ) | 0 | (563 | ) | ||||||||||
|
Ending balance
|
$ | 0 | $ | 2,364 | $ | 211 | $ | 2,282 | ||||||||
|
Total gains (losses) for the period included in net income attributable to the change in unrealized gains or losses related to assets still held at the reporting date
|
$ | 0 | $ | 35 | $ | 0 | $ | (842 | ) | |||||||
Realized and unrealized gains and losses for items reflected in the table above are included in net income in the consolidated statements of income as follows:
|
(in thousands)
|
2012
|
2011
|
||||||||||||||
|
Noninterest Income
|
Noninterest Expense
|
Noninterest Income
|
Noninterest Expense
|
|||||||||||||
|
Total gains
|
$ | (600 | ) | $ | 0 | $ | (1,405 | ) | $ | 0 | ||||||
Nonrecurring Measurements
The following table presents the fair value measurements of assets recognized in the accompanying balance sheets measured at fair value on a nonrecurring basis as of December 31, 2012 and December 31, 2011 and indicates the level within the fair value hierarchy of the valuation techniques.
|
(in thousands)
|
Fair Value Measurements at
December 31, 2012 Using
|
|||||||||||||||
|
Fair Value
|
Quoted Prices in Active Markets for Identical Assets
(Level 1)
|
Significant Other Observable Inputs
(Level 2)
|
Significant Unobservable Inputs
(Level 3)
|
|||||||||||||
|
Assets measured – nonrecurring basis
|
||||||||||||||||
|
Impaired loans (collateral dependent)
|
$ | 5,465 | $ | 0 | $ | 0 | $ | 5,465 | ||||||||
|
Other real estate/assets owned
|
13,892 | 0 | 0 | 13,892 | ||||||||||||
|
(in thousands)
|
Fair Value Measurements at
December 31, 2011 Using
|
|||||||||||||||
|
Fair Value
|
Quoted Prices in Active Markets for Identical Assets
(Level 1)
|
Significant Other Observable Inputs
(Level 2)
|
Significant Unobservable Inputs
(Level 3)
|
|||||||||||||
|
Assets measured – nonrecurring basis
|
||||||||||||||||
|
Impaired loans (collateral dependent)
|
$ | 7,898 | $ | 0 | $ | 0 | $ | 7,898 | ||||||||
|
Other real estate/assets owned
|
16,362 | 0 | 0 | 16,362 | ||||||||||||
Following is a description of the valuation methodologies and inputs used for assets measured at fair value on a nonrecurring basis and recognized in the accompanying balance sheet, as well as the general classification of such assets pursuant to the valuation hierarchy. For assets classified within Level 3 of the fair value hierarchy, the process used to develop the reported fair value is described below.
Impaired Loans (Collateral Dependent)
The estimated fair value of collateral-dependent impaired loans is based on the appraised fair value of the collateral, less estimated cost to sell. Collateral-dependent impaired loans are classified within Level 3 of the fair value hierarchy.
CTBI considers the appraisal or evaluation as the starting point for determining fair value and then considers other factors and events in the environment that may affect the fair value. Appraisals of the collateral underlying collateral-dependent loans are obtained when the loan is determined to be collateral-dependent and subsequently as deemed necessary by the Chief Credit Officer. Appraisals are reviewed for accuracy and consistency by the Chief Credit Officer. Appraisers are selected from the list of approved appraisers maintained by management. The appraised values are reduced by discounts to consider lack of marketability and estimated cost to sell if repayment or satisfaction of the loan is dependent on the sale of the collateral. These discounts and estimates are developed by the Chief Credit Officer by comparison to historical results.
Loans considered impaired under ASC 310-35,
Impairment of a Loan,
are loans for which, based on current information and events, it is probable that the creditor will be unable to collect all amounts due according to the contractual terms of the loan agreement. Impaired loans are subject to nonrecurring fair value adjustments to reflect subsequent (1) partial write-downs that are based on the observable market price or current appraised value of the collateral or (2) the full charge-off of the loan carrying value. Fair value adjustments on impaired loans were $1.2 million and $2.6 million for the years ended December 31, 2012 and December 31, 2011, respectively.
Other Real Estate Owned
In accordance with the provisions of ASC 360,
Property, Plant, and Equipment,
other real estate owned (OREO) is carried at the lower of fair value at acquisition date or current estimated fair value, less estimated cost to sell when the real estate is acquired. Estimated fair value of OREO is based on appraisals or evaluations. OREO is classified within Level 3 of the fair value hierarchy. Long-lived assets are subject to nonrecurring fair value adjustments to reflect subsequent partial write-downs that are based on the observable market price or current appraised value of the collateral. Fair value adjustments on other real estate/assets owned were $2.7 million and $6.5 million for the years ended December 31, 2012 and December 31, 2011, respectively.
Appraisals of OREO are obtained when the real estate is acquired and subsequently as deemed necessary by the Chief Credit Officer. Appraisers are selected from the list of approved appraisers maintained by management.
Unobservable (Level 3) Inputs
The following table presents quantitative information about unobservable inputs used in recurring and nonrecurring Level 3 fair value measurements.
|
(in thousands)
|
Quantitative Information about Level 3 Fair Value Measurements
|
|||||||||
|
Fair Value at December 31, 2012
|
Valuation Technique(s)
|
Unobservable Input
|
Range
(Weighted Average)
|
|||||||
|
Mortgage servicing rights
|
$ | 2,364 |
Discount cash flows, computer pricing model
|
Constant prepayment rate
|
8.5% - 25.0%
(16.3%
|
) | ||||
|
Probability of default
|
1.02% - 4.81%
(2.65%
|
) | ||||||||
|
Discount rate
|
Not applicable
(10.5%)
|
|||||||||
|
Impaired loans (collateral-dependent)
|
$ | 5,465 |
Market comparable properties
|
Marketability discount
|
5.0% - 10.0%
(7.0%
|
) | ||||
|
Other real estate/assets owned
|
$ | 13,892 |
Market comparable properties
|
Comparability adjustments (%)
|
5.0% - 35.0%
(13.0%
|
) | ||||
Sensitivity of Significant Unobservable Inputs
The following is a discussion of the sensitivity of significant unobservable inputs, the interrelationships between those inputs and other unobservable inputs used in recurring fair value measurement and of how those inputs might magnify or mitigate the effect of changes in the unobservable inputs on the fair value measurement.
Mortgage Servicing Rights
Market value for mortgage servicing rights is derived based on unobservable inputs, such as prepayment speeds of the underlying loans generated using the Andrew Davidson Prepayment Model, FHLMC/FNMA guidelines, the weighted-average life of the loan, the discount rate, the weighted average coupon, and the weighted average default rate. Significant increases (decreases) in either of those inputs in isolation would result in a significantly lower (higher) fair value measurement. Generally, a change in the assumption used for prepayment speeds is accompanied by a directionally opposite change in the assumption for interest rates.
Fair Value of Financial Instruments
The following table presents estimated fair value of CTBI’s financial instruments as of December 31, 2012 and indicates the level within the fair value hierarchy of the valuation techniques.
|
(in thousands)
|
Fair Value Measurements
at December 31, 2012 Using
|
|||||||||||||||
|
Carrying
Amount
|
Quoted Prices in Active Markets for Identical Assets
(Level 1)
|
Significant Other Observable Inputs (Level 2)
|
Significant Unobservable Inputs
(Level 3)
|
|||||||||||||
|
Financial assets:
|
||||||||||||||||
|
Cash and cash equivalents
|
$ | 207,560 | $ | 207,560 | $ | 0 | $ | 0 | ||||||||
|
Certificates of deposit in other banks
|
5,336 | 0 | 5,370 | 0 | ||||||||||||
|
Securities available-for-sale
|
603,343 | 45,626 | 557,717 | 0 | ||||||||||||
|
Securities held-to-maturity
|
1,662 | 0 | 1,659 | 0 | ||||||||||||
|
Loans held for sale
|
22,486 | 22,960 | 0 | 0 | ||||||||||||
|
Loans, net
|
2,517,328 | 0 | 0 | 2,540,272 | ||||||||||||
|
Federal Home Loan Bank stock
|
25,673 | 0 | 25,673 | 0 | ||||||||||||
|
Federal Reserve Bank stock
|
4,885 | 0 | 4,885 | 0 | ||||||||||||
|
Accrued interest receivable
|
12,970 | 0 | 12,790 | 0 | ||||||||||||
|
Mortgage servicing rights
|
2,364 | 0 | 0 | 2,364 | ||||||||||||
|
Financial liabilities:
|
||||||||||||||||
|
Deposits
|
$ | 2,903,848 | $ | 606,448 | $ | 2,297,632 | $ | 0 | ||||||||
|
Repurchase agreements
|
210,120 | 0 | 0 | 210,008 | ||||||||||||
|
Federal funds purchased
|
12,314 | 0 | 12,314 | 0 | ||||||||||||
|
Advances from Federal Home Loan Bank
|
1,429 | 0 | 1,719 | 0 | ||||||||||||
|
Long-term debt
|
61,341 | 0 | 0 | 31,185 | ||||||||||||
|
Accrued interest payable
|
1,309 | 0 | 1,309 | 0 | ||||||||||||
|
Unrecognized financial instruments:
|
||||||||||||||||
|
Letters of credit
|
$ | 0 | $ | 0 | $ | 0 | $ | 0 | ||||||||
|
Commitments to extend credit
|
0 | 0 | 0 | 0 | ||||||||||||
|
Forward sale commitments
|
0 | 0 | 0 | 0 | ||||||||||||
The following table presents estimated fair value of CTBI’s financial instruments as of December 31, 2011 and indicates the level within the fair value hierarchy of the valuation techniques.
|
(in thousands)
|
Fair Value Measurements
at December 31, 2011 Using
|
|||||||||||||||
|
Carrying
Amount
|
Quoted Prices in Active Markets for Identical Assets
(Level 1)
|
Significant Other Observable Inputs (Level 2)
|
Significant Unobservable Inputs
(Level 3)
|
|||||||||||||
|
Financial assets:
|
||||||||||||||||
|
Cash and cash equivalents
|
$ | 238,481 | $ | 238,481 | $ | 0 | $ | 0 | ||||||||
|
Certificates of deposit in other banks
|
11,875 | 0 | 11,860 | 0 | ||||||||||||
|
Securities available-for-sale
|
527,398 | 21,182 | 506,005 | 211 | ||||||||||||
|
Securities held-to-maturity
|
1,662 | 0 | 1,661 | 0 | ||||||||||||
|
Loans held for sale
|
536 | 550 | 0 | 0 | ||||||||||||
|
Loans, net
|
2,523,377 | 0 | 0 | 2,520,297 | ||||||||||||
|
Federal Home Loan Bank stock
|
25,673 | 0 | 25,673 | 0 | ||||||||||||
|
Federal Reserve Bank stock
|
4,883 | 0 | 4,883 | 0 | ||||||||||||
|
Accrued interest receivable
|
12,280 | 0 | 12,280 | 0 | ||||||||||||
|
Mortgage servicing rights
|
2,282 | 0 | 0 | 2,282 | ||||||||||||
|
Financial liabilities:
|
||||||||||||||||
|
Deposits
|
$ | 2,878,359 | $ | 584,735 | $ | 2,294,987 | $ | 0 | ||||||||
|
Repurchase agreements
|
217,177 | 0 | 0 | 217,062 | ||||||||||||
|
Federal funds purchased
|
13,104 | 0 | 13,104 | 0 | ||||||||||||
|
Advances from Federal Home Loan Bank
|
21,609 | 0 | 21,617 | 0 | ||||||||||||
|
Long-term debt
|
61,341 | 0 | 0 | 31,030 | ||||||||||||
|
Accrued interest payable
|
2,171 | 0 | 2,171 | 0 | ||||||||||||
|
Unrecognized financial instruments:
|
||||||||||||||||
|
Letters of credit
|
$ | 0 | $ | 0 | $ | 0 | $ | 0 | ||||||||
|
Commitments to extend credit
|
0 | 0 | 0 | 0 | ||||||||||||
|
Forward sale commitments
|
0 | 0 | 0 | 0 | ||||||||||||
The following methods and assumptions were used to estimate the fair value of each class of financial instruments for which it is practicable to estimate that value:
Cash and cash equivalents – The carrying amount approximates fair value.
Certificates of deposit in other banks – Fair values are based on quoted market prices or dealer quotes for similar instruments.
Securities held-to-maturity – Fair values are based on quoted market prices, if available. If a quoted price is not available, fair value is estimated using quoted prices for similar securities. The fair value estimate is provided to management from a third party using modeling assumptions specific to each type of security that are reviewed and approved by management. Quarterly sampling of fair values provided by additional third parties supplement the fair value review process.
Loans held for sale – The fair value is predetermined at origination based on sale price.
Loans (net of the allowance for loan and lease losses) – The fair value of fixed rate loans and variable rate mortgage loans is estimated by discounting the future cash flows using current rates at which similar loans would be made to borrowers with similar credit ratings and for the same remaining maturities. For other variable rate loans, the carrying amount approximates fair value. Loans acquired through acquisition were booked at their fair value on their date of acquisition. Management utilized a third party to assist in the valuation of the acquired loans and considered such factors as coupon rate on the acquired loans versus the current rate for similar instruments on the date of acquisition, weighted average expected life and expected loss rates using both national and regional loss rates on similar loans, and the historic loss rates on the pools of loans acquired.
Federal Home Loan Bank stock – The carrying value of Federal Home Loan Bank stock approximates fair value based on the redemption provisions of the Federal Home Loan Bank.
Federal Reserve Bank stock – The carrying value of Federal Reserve Bank stock approximates fair value based on the redemption provisions of the Federal Reserve Bank.
Accrued interest receivable – The carrying amount approximates fair value.
Deposits – The fair value of fixed maturity time deposits is estimated by discounting the future cash flows using the rates currently offered for deposits of similar remaining maturities. For deposits including demand deposits, savings accounts, NOW accounts, and certain money market accounts, the carrying value approximates fair value.
Repurchase agreements – The fair value is estimated by discounting future cash flows using current rates.
Federal funds purchased – The carrying amount approximates fair value.
Advances from Federal Home Loan Bank – The fair value of these fixed-maturity advances is estimated by discounting future cash flows using rates currently offered for advances of similar remaining maturities.
Long-term debt – The fair value is estimated by discounting future cash flows using current rates.
Accrued interest payable – The carrying amount approximates fair value.
Commitments to originate loans, forward sale commitments, letters of credit, and lines of credit – The fair value of commitments to originate loans is estimated using the fees currently charged to enter into similar agreements, taking into account the remaining terms of the agreements and the present creditworthiness of the counterparties. For fixed-rate loan commitments, fair value also considers the difference between current levels of interest rates and the committed rates. The fair value of forward sale commitments is estimated based on current market prices for loans of similar terms and credit quality. The fair values of letters of credit and lines of credit are based on fees currently charged for similar agreements or on the estimated cost to terminate or otherwise settle the obligations with the counterparties at the reporting date. The fair values of these commitments are not material.
17. Off-Balance Sheet Transactions and Guarantees
CTBI is a party to transactions with off-balance sheet risk in the normal course of business to meet the financing needs of its customers. These financial instruments include standby letters of credit and commitments to extend credit in the form of unused lines of credit. CTBI uses the same credit policies in making commitments and conditional obligations as it does for on-balance sheet instruments.
At December 31, CTBI had the following off-balance sheet financial instruments, whose approximate contract amounts represent additional credit risk to CTBI:
|
(in thousands)
|
2012
|
2011
|
||||||
|
Standby letters of credit
|
$ | 41,207 | $ | 50,201 | ||||
|
Commitments to extend credit
|
386,293 | 375,736 | ||||||
|
Total off-balance sheet financial instruments
|
$ | 427,500 | $ | 425,937 | ||||
Standby letters of credit represent conditional commitments to guarantee the performance of a third party. The credit risk involved is essentially the same as the risk involved in making loans. At December 31, 2012, we maintained a credit loss reserve of approximately $5 thousand relating to these financial standby letters of credit. The reserve coverage calculation was determined using essentially the same methodology as used for the allowance for loan and lease losses. Approximately 87% of the total standby letters of credit are secured, with $30.3 million of the total $41.2 million secured by cash. Collateral for the remaining secured standby letters of credit varies but is comprised primarily of accounts receivable, inventory, property, equipment, and income-producing properties.
Commitments to extend credit are agreements to originate loans to customers as long as there is no violation of any condition of the contract. At December 31, 2012, a credit loss reserve of $193 thousand was maintained relating to these commitments. Commitments generally have fixed expiration dates or other termination clauses and may require payment of a fee. Since a portion of the commitments may expire without being drawn upon, the total commitment amounts do not necessarily represent future cash requirements. Each customer's creditworthiness is evaluated on a case-by-case basis. The amount of collateral obtained, if deemed necessary, is based on management's credit evaluation of the counterparty. Collateral held varies, but may include accounts receivable, inventory, property, plant and equipment, commercial real estate, and residential real estate. A portion of the commitments is to extend credit at fixed rates. Fixed rate loan commitments at December 31, 2012 of $19.9 million had interest rates and terms ranging predominantly from 4.50% to 5.50% and 6 months to 1 year, respectively. These credit commitments were based on prevailing rates, terms, and conditions applicable to other loans being made at December 31, 2012.
Included in our commitments to extend credit, are mortgage loans in the process of origination which are intended for sale to investors in the secondary market. These forward sale commitments are on an individual loan basis that CTBI originates as part of its mortgage banking activities. CTBI commits to sell the loans at specified prices in a future period, typically within 60 days. These commitments are acquired to reduce market risk on mortgage loans in the process of origination and mortgage loans held for sale since CTBI is exposed to interest rate risk during the period between issuing a loan commitment and the sale of the loan into the secondary market. Total mortgage loans in the process of origination amounted to $2.6 million and $5.1 million at December 31, 2012 and 2011, respectively, and mortgage loans held for sale amounted to $22.5 million and $0.5 million at both December 31, 2012 and 2011, respectively.
18. Concentrations of Credit Risk
CTBI’s banking activities include granting commercial, residential, and consumer loans to customers primarily located in eastern, northeastern, central, and south central Kentucky, southern West Virginia, and northeastern Tennessee. CTBI is continuing to manage all components of its portfolio mix in a manner to reduce risk from changes in economic conditions. Concentrations of credit, as defined for regulatory purposes, are reviewed quarterly by management to ensure that internally established limits based on Tier 1 Capital plus the allowance for loan and lease losses are not exceeded. At December 31, 2012 and 2011, our concentrations of hotel/motel industry credits were 35% and 37% of Tier 1 Capital plus the allowance for loan and lease losses, respectively. Lessors of residential buildings and dwellings credits were 32% and 33%, respectively. Lessors of non-residential buildings were 30% and 29%, respectively. Agriculture credits were 17% at both December 31, 2012 and 2011. Coal mining and related support industries credits were 16% and 22%, respectively. These percentages are within our internally established limits regarding concentrations of credit.
19. Commitments and Contingencies
CTBI and our subsidiaries, and from time to time, our officers, are named defendants in legal actions arising from ordinary business activities. Management, after consultation with legal counsel, believes any pending actions are without merit or that the ultimate liability, if any, will not materially affect our consolidated financial position or results of operations.
20. Regulatory Matters
CTBI’s principal source of funds is dividends received from our subsidiary bank, Community Trust Bank, Inc. (“CTB”). Regulations limit the amount of dividends that may be paid by CTB without prior approval. During 2013, approximately $47.9 million plus any 2013 net profits can be paid by CTB without prior regulatory approval.
The Federal Reserve Bank adopted quantitative measures which assign risk weightings to assets and off-balance sheet items and also define and set minimum regulatory capital requirements (risk based capital ratios). All banks are required to have a minimum Tier 1 (core capital) leverage ratio of 4% of adjusted quarterly average assets, Tier 1 capital of at least 4% of risk-weighted assets, and total capital of at least 8% of risk-weighted assets. Tier 1 capital consists principally of shareholders’ equity including capital-qualifying subordinated debt but excluding unrealized gains and losses on securities available-for-sale, less goodwill and certain other intangibles. Total capital consists of Tier 1 capital plus certain debt instruments and the reserve for credit losses, subject to limitation. Failure to meet certain capital requirements can initiate certain actions by regulators that, if undertaken, could have a direct material effect on our consolidated financial statements. The regulations also define well-capitalized levels of Tier 1 leverage, Tier 1, and total capital as 5%, 6%, and 10%, respectively. We had Tier 1 leverage, Tier 1, and total capital ratios above the well-capitalized levels at December 31, 2012 and 2011. We believe, as of December 31, 2012, CTBI meets all capital adequacy requirements for which it is subject to be defined as well-capitalized under the regulatory framework for prompt corrective action.
Under the current Federal Reserve Board’s regulatory framework, certain capital securities offered by wholly owned unconsolidated trust preferred entities of CTBI are included as Tier 1 regulatory capital. On March 1, 2005, the Federal Reserve Board adopted a final rule that allows the continued limited inclusion of trust preferred securities in the Tier 1 capital of bank holding companies (“BHCs”). Under the final rule, trust preferred securities and other restricted core capital elements are subject to stricter quantitative limits. The Board's final rule limits restricted core capital elements to 25 percent of all core capital elements, net of goodwill less any associated deferred tax liability. Amounts of restricted core capital elements in excess of these limits generally may be included in Tier 2 capital. The final rule provided a five-year transition period, which ended March 31, 2009, for application of the quantitative limits. The requirement for trust preferred securities to include a call option has been eliminated, and standards for the junior subordinated debt underlying trust preferred securities eligible for Tier 1 capital treatment have been clarified. The final rule addresses supervisory concerns, competitive equity considerations, and the accounting for trust preferred securities. The final rule also strengthens the definition of regulatory capital by incorporating longstanding Board policies regarding the acceptable terms of capital instruments included in banking organizations' Tier 1 or Tier 2 capital. The final rule did not have a material impact on our regulatory ratios.
Consolidated Capital Ratios
|
Actual
|
For Capital Adequacy Purposes
|
|||||||||||||||
|
(in thousands)
|
Amount
|
Ratio
|
Amount
|
Ratio
|
||||||||||||
|
As of December 31, 2012:
|
||||||||||||||||
|
Tier 1 capital (to average assets)
|
$ | 380,549 | 10.65 | % | $ | 142,929 | 4.00 | % | ||||||||
|
Tier 1 capital (to risk weighted assets)
|
380,549 | 15.23 | 99,947 | 4.00 | ||||||||||||
|
Total capital (to risk weighted assets)
|
412,014 | 16.49 | 199,886 | 8.00 | ||||||||||||
|
As of December 31, 2011:
|
||||||||||||||||
|
Tier 1 capital (to average assets)
|
$ | 349,348 | 9.89 | % | $ | 141,293 | 4.00 | % | ||||||||
|
Tier 1 capital (to risk weighted assets)
|
349,348 | 13.88 | 100,677 | 4.00 | ||||||||||||
|
Total capital (to risk weighted assets)
|
381,038 | 15.14 | 201,341 | 8.00 | ||||||||||||
Community Trust Bank, Inc.'s Capital Ratios
|
Actual
|
For Capital Adequacy Purposes
|
To Be Well-Capitalized Under Prompt Corrective Action Provision
|
||||||||||||||||||||||
|
(in thousands)
|
Amount
|
Ratio
|
Amount
|
Ratio
|
Amount
|
Ratio
|
||||||||||||||||||
|
As of December 31, 2012:
|
||||||||||||||||||||||||
|
Tier 1 capital (to average assets)
|
$ | 363,331 | 10.21 | % | $ | 142,343 | 4.00 | % | $ | 177,929 | 5.00 | % | ||||||||||||
|
Tier 1 capital (to risk weighted assets)
|
363,331 | 14.58 | 99,679 | 4.00 | 149,519 | 6.00 | ||||||||||||||||||
|
Total capital (to risk weighted assets)
|
394,796 | 15.84 | 199,392 | 8.00 | 249,240 | 10.00 | ||||||||||||||||||
|
As of December 31, 2011:
|
||||||||||||||||||||||||
|
Tier 1 capital (to average assets)
|
$ | 334,553 | 9.51 | % | $ | 140,716 | 4.00 | % | $ | 175,895 | 5.00 | % | ||||||||||||
|
Tier 1 capital (to risk weighted assets)
|
334,553 | 13.32 | 100,466 | 4.00 | 150,700 | 6.00 | ||||||||||||||||||
|
Total capital (to risk weighted assets)
|
366,243 | 14.58 | 200,956 | 8.00 | 251,195 | 10.00 | ||||||||||||||||||
In the summer of 2012, our primary federal regulators, published two notices of proposed rulemaking (the “2012 Capital Proposals”) that would substantially revise the risk-based capital requirements applicable to bank holding companies and depository institutions, including CTBI and CTB, compared to the current U.S. risk-based capital rules, which are based on the international capital accords of the Basel Committee on Banking Supervision (the “Basel Committee”) which are generally referred to as “Basel I.”
One of the 2012 Capital Proposals (the “Basel III Proposal”) addresses the components of capital and other issues affecting the numerator in banking institutions’ regulatory capital ratios, and would implement the Basel Committee’s December 2010 framework, known as “Basel III,” for strengthening international capital standards. The other proposal (the “Standardized Approach Proposal”) addresses risk weights and other issues affecting the denominator in banking institutions’ regulatory capital ratios, and would replace the existing Basel I-derived risk weighting approach with a more risk-sensitive approach based, in part, on the standardized approach in the Basel Committee’s 2004 “Basel II” capital accords.
The proposed rules include new risk-based capital and leverage ratios, which would be phased in through 2019 and would revise the definition of what constitutes “capital” for purposes of calculating those ratios. The proposed new minimum capital level requirements applicable to CTBI and CTB under the proposals would be: (i) a new common equity Tier 1 capital ratio of 4.5%; (ii) a Tier 1 capital ratio of 6% (increased from 4%); (iii) a total capital ratio of 8% (unchanged from current rules); and (iv) a Tier 1 leverage ratio of 4% for all institutions. The proposed rules would also establish a “capital conservation buffer” of 2.5% above the new regulatory minimum capital requirements, which must consist entirely of common equity Tier 1 capital and would result in the following minimum ratios: (i) a common equity Tier 1 capital ratio of 7.0%; (ii) a Tier 1 capital ratio of 8.5%; and (iii) a total capital ratio of 10.5%. The new capital conservation buffer requirement would be phased in beginning in January 2016 at 0.625% of risk-weighted assets and would increase by that amount each year until fully implemented in January 2019. An institution would be subject to limitations on paying dividends, engaging in share repurchases, and paying discretionary bonuses if its capital level falls below the buffer amount. These limitations would establish a maximum percentage of eligible retained income that could be utilized for such actions.
Although the Basel III Proposal was proposed to come into effect on January 1, 2013, the federal banking agencies jointly announced on November 9, 2012 that they did not expect any of the proposed rules to become effective on that date. As proposed, the Standardized Approach Proposal would come into effect on January 1, 2015.
21. Parent Company Financial Statements
Condensed Balance Sheets
|
(in thousands)
December 31
|
2012
|
2011
|
||||||
|
Assets:
|
||||||||
|
Cash on deposit
|
$ | 5,442 | $ | 6,105 | ||||
|
Investment in and advances to subsidiaries
|
454,949 | 421,572 | ||||||
|
Goodwill
|
4,973 | 4,973 | ||||||
|
Premises and equipment, net
|
250 | 211 | ||||||
|
Other assets
|
1,277 | 498 | ||||||
|
Total assets
|
$ | 466,891 | $ | 433,359 | ||||
|
Liabilities and shareholders’ equity:
|
||||||||
|
Long-term debt
|
$ | 61,341 | $ | 61,341 | ||||
|
Other liabilities
|
5,206 | 5,152 | ||||||
|
Total liabilities
|
66,547 | 66,493 | ||||||
|
Shareholders’ equity
|
400,344 | 366,866 | ||||||
|
Total liabilities and shareholders’ equity
|
$ | 466,891 | $ | 433,359 | ||||
Condensed Statements of Income and Other Comprehensive Income
|
(in thousands)
Year Ended December 31
|
2012
|
2011
|
2010
|
|||||||||
|
Income:
|
||||||||||||
|
Dividends from subsidiary banks
|
$ | 16,572 | $ | 20,370 | $ | 34,620 | ||||||
|
Other income
|
238 | 255 | 34 | |||||||||
|
Total income
|
16,810 | 20,625 | 34,654 | |||||||||
|
Expenses:
|
||||||||||||
|
Interest expense
|
2,403 | 3,999 | 3,999 | |||||||||
|
Depreciation expense
|
127 | 72 | 25 | |||||||||
|
Other expenses
|
1,990 | 1,808 | 1,557 | |||||||||
|
Total expenses
|
4,520 | 5,879 | 5,581 | |||||||||
|
Income before income taxes and equity in undistributed income of subsidiaries
|
12,290 | 14,746 | 29,073 | |||||||||
|
Income tax benefit
|
(1,750 | ) | (2,277 | ) | (2,145 | ) | ||||||
|
Income before equity in undistributed income of subsidiaries
|
14,040 | 17,023 | 31,218 | |||||||||
|
Equity in undistributed income of subsidiaries
|
30,822 | 21,804 | 1,816 | |||||||||
|
Net income
|
$ | 44,862 | $ | 38,827 | $ | 33,034 | ||||||
|
Other comprehensive income:
|
||||||||||||
|
Unrealized holding gains (losses) on securities available-for-sale:
|
||||||||||||
|
Unrealized holding gains arising during the period
|
4,973 | 9,868 | (464 | ) | ||||||||
|
Less: Reclassification adjustments for realized gains included in net income
|
(1,155 | ) | (218 | ) | 0 | |||||||
|
Tax expense (benefit)
|
1,336 | 3,378 | (162 | ) | ||||||||
|
Other comprehensive income (loss), net of tax
|
2,482 | 6,272 | (302 | ) | ||||||||
|
Comprehensive income
|
$ | 47,344 | $ | 45,099 | $ | 32,732 | ||||||
Condensed Statements of Cash Flows
|
(in thousands)
Year Ended December 31
|
2012
|
2011
|
2010
|
|||||||||
|
Cash flows from operating activities:
|
||||||||||||
|
Net income
|
$ | 44,862 | $ | 38,827 | $ | 33,034 | ||||||
|
Adjustments to reconcile net income to net cash provided by operating activities:
|
||||||||||||
|
Depreciation
|
127 | 72 | 25 | |||||||||
|
Equity in undistributed earnings of subsidiaries
|
(30,822 | ) | (21,804 | ) | (1,816 | ) | ||||||
|
Stock-based compensation
|
512 | 555 | 393 | |||||||||
|
Excess tax benefit of stock-based compensation
|
496 | 23 | 205 | |||||||||
|
Changes in:
|
||||||||||||
|
Other assets
|
(771 | ) | 395 | 1,795 | ||||||||
|
Other liabilities
|
495 | 0 | 675 | |||||||||
|
Net cash provided by operating activities
|
14,899 | 18,068 | 34,311 | |||||||||
|
Cash flows from investing activities:
|
||||||||||||
|
Purchase of premises and equipment
|
(166 | ) | (198 | ) | (76 | ) | ||||||
|
Repayment of investments in and advances to subsidiaries
|
(80 | ) | (96 | ) | (411 | ) | ||||||
|
Additional investment in subsidiaries
|
0 | 0 | (17,306 | ) | ||||||||
|
Net cash used in investing activities
|
(246 | ) | (294 | ) | (17,793 | ) | ||||||
|
Cash flows from financing activities:
|
||||||||||||
|
Issuance of common stock
|
4,395 | 1,291 | 1,875 | |||||||||
|
Excess tax benefit of stock-based compensation
|
(496 | ) | (23 | ) | (205 | ) | ||||||
|
Dividends paid
|
(19,215 | ) | (18,742 | ) | (18,332 | ) | ||||||
|
Net cash used in financing activities
|
(15,316 | ) | (17,474 | ) | (16,662 | ) | ||||||
|
Net increase (decrease) in cash and cash equivalents
|
(663 | ) | 300 | (144 | ) | |||||||
|
Cash and cash equivalents at beginning of year
|
6,105 | 5,805 | 5,949 | |||||||||
|
Cash and cash equivalents at end of year
|
$ | 5,442 | $ | 6,105 | $ | 5,805 | ||||||
22. Earnings Per Share
The following table sets forth the computation of basic and diluted earnings per share:
|
Year Ended December 31
|
2012
|
2011
|
2010
|
|||||||||
|
Numerator:
|
||||||||||||
|
Net income
(in thousands)
|
$ | 44,862 | $ | 38,827 | $ | 33,034 | ||||||
|
Denominator:
|
||||||||||||
|
Basic earnings per share:
|
||||||||||||
|
Weighted average shares
|
15,466,274 | 15,313,081 | 15,233,858 | |||||||||
|
Diluted earnings per share:
|
||||||||||||
|
Dilutive effect of equity grants
|
54,243 | 51,112 | 24,936 | |||||||||
|
Adjusted weighted average shares
|
15,520,517 | 15,364,193 | 15,258,794 | |||||||||
|
Earnings per share:
|
||||||||||||
|
Basic earnings per share
|
$ | 2.90 | $ | 2.54 | $ | 2.17 | ||||||
|
Diluted earnings per share
|
2.89 | 2.53 | 2.16 | |||||||||
At December 31, 2012, 89,746 stock options at a weighted average price of $38.95 were outstanding and were not used in the computation of diluted earnings per share because their exercise price was greater than the average market value of the common stock. Unvested restricted stock grants were also used in the calculation of diluted earnings per share based on the treasury method. At December 31, 2011, 323,255 stock options at a price of $33.02 were outstanding and were not used in the computation of diluted earnings per share. At December 31, 2010, 422,972 stock options at a price of $32.36 were outstanding and were not used in the computation of diluted earnings per share.
Audit Committee, Board of Directors
and Stockholders
Community Trust Bancorp, Inc.
Pikeville, Kentucky
We have audited Community Trust Bancorp, Inc.’s (Company) internal control over financial reporting as of December 31, 2012, based on criteria established in Internal Control – Integrated Framework issued by the Committee of Sponsoring Organizations of the Treadway Commission (COSO). The Company’s management is responsible for maintaining effective internal control over financial reporting and for its assessment of the effectiveness of internal control over financial reporting, included in the accompanying management report on internal control over financial reporting. Our responsibility is to express an opinion on the Company’s internal control over financial reporting based on our audit.
We conducted our audit in accordance with the standards of the Public Company Accounting Oversight Board (United States). Those standards require that we plan and perform the audit to obtain reasonable assurance about whether effective internal control over financial reporting was maintained in all material respects. Our audit included obtaining an understanding of internal control over financial reporting, assessing the risk that a material weakness exists and testing and evaluating the design and operating effectiveness of internal control based on the assessed risk. Our audit also included performing such other procedures as we considered necessary in the circumstances. We believe that our audit provides a reasonable basis for our opinion.
A company’s internal control over financial reporting is a process designed to provide reasonable assurance regarding the reliability of financial reporting and the preparation of financial statements for external purposes in accordance with generally accepted accounting principles. A company’s internal control over financial reporting includes those policies and procedures that (1) pertain to the maintenance of records that, in reasonable detail, accurately and fairly reflect the transactions and dispositions of the assets of the company, (2) provide reasonable assurance that transactions are recorded as necessary to permit preparation of financial statements in accordance with generally accepted accounting principles and that receipts and expenditures of the company are being made only in accordance with authorizations of management and directors of the company and (3) provide reasonable assurance regarding prevention or timely detection of unauthorized acquisition, use or disposition of the company’s assets that could have a material effect on the financial statements.
Because of its inherent limitations, internal control over financial reporting may not prevent or detect misstatements. Also, projections of any evaluation of effectiveness to future periods are subject to the risk that controls may become inadequate because of changes in conditions or that the degree of compliance with the policies or procedures may deteriorate.
In our opinion, the Company maintained, in all material respects, effective internal control over financial reporting as of December 31, 2012, based on criteria established in Internal Control – Integrated Framework issued by the Committee of Sponsoring Organizations of the Treadway Commission (COSO).
We have also audited, in accordance with the standards of the Public Company Accounting Oversight Board (United States), the consolidated financial statements of the Company and our report dated March 14, 2013, expressed an unqualified opinion thereon.
/s/ BKD, LLP
Louisville, Kentucky
March 14, 2013
REPORT OF INDEPENDENT REGISTERED PUBLIC ACCOUNTING FIRM
Audit Committee, Board of Directors
and Stockholders
Community Trust Bancorp, Inc.
Pikeville, Kentucky
We have audited the accompanying consolidated balance sheets of Community Trust Bancorp, Inc. (Company) as of December 31, 2012 and 2011, and the related consolidated statements of income and other comprehensive income, changes in shareholders’ equity and cash flows for each of the years in the three-year period ended December 31, 2012. The Company’s management is responsible for these financial statements. Our responsibility is to express an opinion on these financial statements based on our audits.
We conducted our audits in accordance with the standards of the Public Company Accounting Oversight Board (United States). Those standards require that we plan and perform the audits to obtain reasonable assurance about whether the financial statements are free of material misstatement. Our audits included examining, on a test basis, evidence supporting the amounts and disclosures in the financial statements, assessing the accounting principles used and significant estimates made by management and evaluating the overall financial statement presentation. We believe that our audits provide a reasonable basis for our opinion.
In our opinion, the consolidated financial statements referred to above present fairly, in all material respects, the financial position of the Company as of December 31, 2012 and 2011, and the results of its operations and its cash flows for each of the years in the three-year period ended December 31, 2012, in conformity with accounting principles generally accepted in the United States of America.
We also have audited, in accordance with the standards of the Public Company Accounting Oversight Board (United States), the Company’s internal control over financial reporting as of December 31, 2012, based on criteria established in Internal Control – Integrated Framework issued by the Committee of Sponsoring Organizations of the Treadway Commission (COSO) and our report dated March 14, 2013, expressed an unqualified opinion on the effectiveness of the Company’s internal control over financial reporting.
/s/ BKD, LLP
Louisville, Kentucky
March 14, 2013
None.
EVALUATION OF DISCLOSURE CONTROLS AND PROCEDURES
CTBI's management is responsible for establishing and maintaining effective disclosure controls and procedures, as defined under Rules 13a-15(e) and 15d-15(e) of the Securities Exchange Act of 1934. As of December 31, 2012, an evaluation was carried out by CTBI’s management, with the participation of our Chief Executive Officer and the Executive Vice President/Treasurer, of the effectiveness of the design and operation of our disclosure controls and procedures. Based on this evaluation, management concluded that disclosure controls and procedures as of December 31, 2012 were effective in ensuring material information required to be disclosed in this annual report on Form 10-K was recorded, processed, summarized, and reported on a timely basis.
CHANGES IN INTERNAL CONTROL OVER FINANCIAL REPORTING
There were no changes in CTBI's internal control over financial reporting that occurred during the year ended December 31, 2012 that have materially affected, or are reasonably likely to materially affect, CTBI's internal control over financial reporting.
MANAGEMENT REPORT ON INTERNAL CONTROL
We, as management of Community Trust Bancorp, Inc. and its subsidiaries (“CTBI”), are responsible for establishing and maintaining adequate internal control over financial reporting. Pursuant to the rules and regulations of the Securities and Exchange Commission, internal control over financial reporting is a process designed by, or under the supervision of, the company’s principal executive and principal financial officers, or persons performing similar functions, and effected by the company’s board of directors, management and other personnel, to provide reasonable assurance regarding the reliability of financial reporting and the preparation of financial statements for external purposes in accordance with generally accepted accounting principles and includes those policies and procedures that:
|
·
|
Pertain to the maintenance of records that in reasonable detail accurately and fairly reflect the transactions and dispositions of the assets of the company;
|
|
·
|
Provide reasonable assurance that transactions are recorded as necessary to permit preparation of financial statements in accordance with generally accepted accounting principles, and that receipts and expenditures of the company are being made only in accordance with authorizations of management and directors of the company; and
|
|
·
|
Provide reasonable assurance regarding prevention or timely detection of unauthorized acquisition, use or disposition of the company’s assets that could have a material effect on the financial statements.
|
All internal control systems, no matter how well designed, have inherent limitations, including the possibility of human error and the circumvention of overriding controls. Accordingly, even effective internal control can provide only reasonable assurance with respect to financial statement preparation. Further, because of changes in conditions, the effectiveness of internal control may vary over time.
Because of the inherent limitations, any system of internal control over financial reporting, no matter how well designed, may not prevent or detect misstatements due to the possibility that a control can be circumvented or overridden or that misstatements due to error or fraud may occur that are not detected. Also, projections of the effectiveness to future periods are subject to the risk that the internal controls may become inadequate because of changes in conditions, or that the degree of compliance with the policies and procedures included in such controls may deteriorate.
Management has evaluated the effectiveness of its internal control over financial reporting as of December 31, 2012 based on the control criteria established in a report entitled
Internal Control—Integrated Framework
, issued by the Committee of Sponsoring Organizations of the Treadway Commission. Based on such evaluation, we have concluded that CTBI’s internal control over financial reporting is effective as of December 31, 2012.
The effectiveness of CTBI’s internal control over financial reporting as of December 31, 2012 has been audited by BKD, LLP, an independent registered public accounting firm that audited the CTBI’s consolidated financial statements included in this annual report.
|
March 14, 2013
|
|
/s/ Jean R. Hale | |
| Jean R. Hale | |||
| Chairman, President and Chief Executive Officer | |||
|
|
|
/s/ Kevin J. Stumbo | |
| Kevin J. Stumbo | |||
| Executive Vice President and Treasurer | |||
| (Principal Financial Officer) |
None
The information required by this item other than the information set forth below is omitted because CTBI is filing a definitive proxy statement pursuant to Regulation 14A not later than 120 days after the end of the fiscal year covered by this report which includes the required information. The required information contained in CTBI’s proxy statement is incorporated herein by reference.
Executive Officers of the Registrant
Set forth below are the executive officers of CTBI, their positions with CTBI, and the year in which they first became an executive officer or director.
|
Name and Age
(1)
|
Positions and Offices Currently Held
|
Date First Became
Director or
Executive Officer
|
Principal Occupation
|
|
|
Jean R. Hale; 66
|
Chairman, President and CEO
|
1992
|
Chairman, President and CEO of Community Trust Bancorp, Inc.
|
|
|
Mark A. Gooch; 54
|
Executive Vice President and Secretary
|
1997
|
President and CEO of Community Trust Bank, Inc.
|
|
|
Larry W. Jones; 66
|
Executive Vice President
|
2000
|
(2)
|
Executive Vice President/ Central Kentucky Region President of Community Trust Bank, Inc.
|
|
James B. Draughn; 53
|
Executive Vice President
|
2001
|
Executive Vice President/Operations of Community Trust Bank, Inc.
|
|
|
Kevin J. Stumbo; 52
|
Executive Vice President and Treasurer
|
2002
|
Executive Vice President/ Controller of Community Trust Bank, Inc.
|
|
|
Ricky D. Sparkman; 50
|
Executive Vice President
|
2002
|
Executive Vice President/ South Central Region President of Community Trust Bank, Inc.
|
|
|
Richard W. Newsom; 58
|
Executive Vice President
|
2002
|
Executive Vice President/ Eastern Region President of Community Trust Bank, Inc.
|
|
|
James J. Gartner; 71
|
Executive Vice President
|
2002
|
Executive Vice President/ Chief Credit Officer of Community Trust Bank, Inc.
|
|
|
Steven E. Jameson; 56
|
Executive Vice President
|
2004
|
(3)
|
Executive Vice President/ Chief Internal Audit & Risk Officer
|
|
D. Andrew Jones; 50
|
Executive Vice President
|
2010
|
(4)
|
Executive Vice President/ Northeastern Region President of Community Trust Bank, Inc.
|
|
Andy D. Waters; 47
|
Executive Vice President
|
2011
|
(5)
|
President and CEO of Community Trust and Investment Company
|
|
(1)
|
The ages listed for CTBI's executive officers are as of February 28, 2013.
|
|
(2)
|
Mr. Larry Jones was named Executive Vice President/Central Kentucky Region President of Community Trust Bank, Inc. in November 2010. Mr. Jones had served as Executive Vice President/Northeastern Region President since September 2002.
|
|
(3)
|
Mr. Jameson is a non-voting member of the Executive Committee.
|
|
(4)
|
Mr. Andrew Jones replaced Mr. Larry Jones as Executive Vice President/Northeastern Region President. Mr. Andrew Jones has been employed by Community Trust Bank, Inc. since 1987. His most recent position was Senior Vice President/Senior Lender of the Ashland Market which he had held since 2002.
|
|
(5)
|
Mr. Waters has been with Community Trust and Investment Company since 2004, serving as Senior Vice President/Manager of Trust and Estate Services prior to becoming President and CEO effective January 1, 2011.
|
The information required by this item is omitted because CTBI is filing a definitive proxy statement pursuant to Regulation 14A not later than 120 days after the end of the fiscal year covered by this report which includes the required information. The required information contained in CTBI’s proxy statement is incorporated herein by reference.
The information required by this item other than the information provided below is omitted because CTBI is filing a definitive proxy statement pursuant to Regulation 14A not later than 120 days after the end of the fiscal year covered by this report which includes the required information. The required information contained in CTBI’s proxy statement is incorporated herein by reference.
Equity Compensation Plan Information
The following table provides information as of December 31, 2012, with respect to compensation plans under which common shares of CTBI are authorized for issuance to officers or employees in exchange for consideration in the form of services provided to CTBI and/or its subsidiaries. We currently maintain one active and one inactive incentive stock option plans covering key employees. The 2006 Stock Ownership Incentive Plan (“2006 Plan”) was approved by the Board of Directors and the Shareholders in 2006. The 1998 Stock Option Plan (“1998 Plan”) was approved by the Board of Directors and the Shareholders in 1998. The 1998 Plan was rendered inactive as of April 26, 2006. The 2006 Plan had 1,500,000 shares authorized, 1,245,189 of which were available at December 31, 2012 for future grants. In addition, any shares reserved for issuance under the 1998 Stock Option Plan (“1998 Plan”) in excess of the number of shares as to which options or other benefits are awarded thereunder, plus any shares as to which options or other benefits granted under the 1998 Plan may lapse, expire, terminate or be canceled, shall also be reserved and available for issuance or reissuance under the 2006 Plan. As of December 31, 2012, the 1998 Plan had 1,046,831 shares authorized, 198,024 of which were transferred to the 2006 Plan. The total shares available for issuance under the 2006 Plan as of December 31, 2012 was 1,443,213.
|
A
|
B
|
C
|
|
|
Plan Category
(shares in thousands)
|
Number of Common Shares to be Issued Upon Exercise/Vesting
|
Weighted Average Price
|
Number of Securities Available for Future Issuance Under Equity Compensation Plans (excluding securities reflected in Column A)
|
|
Equity compensation plans approved by shareholders:
|
|
||
|
Stock options
|
326
|
$32.64
|
1,443
|
|
Equity compensation plans not approved by shareholders
|
0
|
--
|
0
|
|
Total
|
1,443
|
Additional information regarding CTBI’s stock option plans can be found in notes 1 and 14 to the consolidated financial statements.
The information required by this item is omitted because CTBI is filing a definitive proxy statement pursuant to Regulation 14A not later than 120 days after the end of the fiscal year covered by this report which includes the required information. The required information contained in CTBI’s proxy statement is incorporated herein by reference.
The information required by this item is omitted because CTBI is filing a definitive proxy statement pursuant to Regulation 14A not later than 120 days after the end of the fiscal year covered by this report which includes the required information. The required information contained in CTBI’s proxy statement is incorporated herein by reference.
(a) 1. Financial Statements
The following financial statements of CTBI and the auditor’s report thereon are filed as part of this Form 10-K under Item 8. Financial Statements and Supplementary Data:
Consolidated Balance Sheets
Consolidated Statements of Income and Other Comprehensive Income
Consolidated Statements of Shareholders’ Equity
Consolidated Statements of Cash Flows
Notes to Consolidated Financial Statements
Reports of Independent Registered Public Accounting Firm
2. Financial Statement Schedules
All required financial statement schedules for CTBI have been included in this Form 10-K in the consolidated financial statements or the related footnotes.
3. Exhibits
|
Exhibit No.
|
Description of Exhibits
|
|
|
3.1
|
Articles of Incorporation and all amendments thereto {incorporated by reference to registration statement no. 33-35138}
|
|
|
3.2
|
By-laws of CTBI as amended July 25, 1995 {incorporated by reference to registration statement no. 33-61891}
|
|
|
3.3
|
By-laws of CTBI as amended January 29, 2008 {incorporated by reference to current report on Form 8-K filed January 30, 2008}
|
|
|
10.1
|
Community Trust Bancorp, Inc. Employee Stock Ownership Plan (effective January 1, 2007) {incorporated herein by reference to Form 10-K for the fiscal year ended December 31, 2006 under SEC file no. 000-111-29}
|
|
|
10.2
|
Community Trust Bancorp, Inc. Savings and Employee Stock Ownership Plan (Amendment Number One effective January 1, 2002, Amendment Number Two effective January 1, 2004, Amendment Number Three effective March 28, 2005, and Amendment Number Four effective January 1, 2006) {incorporated herein by reference to Form 10-K for the fiscal year ended December 31, 2006 under SEC file no. 000-111-29}
|
|
|
10.3
|
Second restated Pikeville National Corporation 1989 Stock Option Plan (commonly known as Community Trust Bancorp, Inc. 1989 Stock Option Plan) {incorporated by reference to registration statement no. 33-36165}
|
|
|
10.4
|
Community Trust Bancorp, Inc. 1998 Stock Option Plan {incorporated by reference to registration statement no. 333-74217}
|
|
|
10.5
|
Community Trust Bancorp, Inc. 2006 Stock Ownership Incentive Plan {incorporated by reference to Proxy Statement dated March 24, 2006}
|
|
|
10.6
|
Form of Severance Agreement between Community Trust Bancorp, Inc. and executive officers (currently in effect with respect to eleven executive officers) {incorporated herein by reference to Form 10-K for the fiscal year ended December 31, 2001 under SEC file no. 000-111-29}
|
|
|
10.7
|
Senior Management Incentive Compensation Plan (2013) {incorporated herein by reference to current report on Form 8-K dated January 29, 2013}
|
|
|
10.8
|
Restricted Stock Agreement {incorporated herein by reference to Form 10-K for the fiscal year ended December 31, 2011 under SEC file no. 000-111-29}
|
|
|
10.9
|
Employee Incentive Compensation Plan (2013) {incorporated herein by reference to current report on Form 8-K dated January 29, 2013}
|
|
|
10.10
|
Amendment to the Community Trust Bancorp, Inc. 2006 Stock Ownership Incentive Plan {incorporated herein by reference to current report on Form 8-K dated January 26, 2012}
|
|
|
10.11
|
Community Trust Bancorp, Inc. 2012 Executive Committee Long-Term Incentive Compensation Plan {incorporated herein by reference to current report on Form 8-K dated January 26, 2012}
|
|
|
10.12
|
Community Trust Bancorp, Inc. 2013 Executive Committee Long-Term Incentive Compensation Plan {incorporated herein by reference to current report on Form 8-K dated January 29, 2013}
|
|
|
List of subsidiaries
|
||
|
Consent of BKD, LLP, Independent Registered Public Accounting Firm
|
||
|
Certification of Principal Executive Officer (Jean R. Hale, Chairman, President and CEO)
|
||
|
Certification of Principal Financial Officer (Kevin J. Stumbo, Executive Vice President and Treasurer)
|
||
|
Certification of Jean R. Hale, Chairman, President and CEO, pursuant to 18 U.S.C. Section 1350, as adopted pursuant to Section 906 of the Sarbanes-Oxley Act of 2002
|
||
|
Certification of Kevin J. Stumbo, Executive Vice President and Treasurer, pursuant to 18 U.S.C. Section 1350, as adopted pursuant to Section 906 of the Sarbanes-Oxley Act of 2002
|
||
|
101.INS
|
XBRL Instance Document*
|
|
|
101.SCH
|
XBRL Taxonomy Extension Schema*
|
|
|
101.DEF
|
XBRL Taxonomy Extension Definition Linkbase*
|
|
|
101.CAL
|
XBRL Taxonomy Extension Calculation Linkbase*
|
|
|
101.LAB
|
XBRL Taxonomy Extension Label Linkbase*
|
|
|
101.PRE
|
XBRL Taxonomy Extension Presentation Linkbase*
|
*
These interactive data files are being submitted electronically with this report and, in accordance with Rule 406T of Regulation S-T, are not deemed filed or part of a registration statement or prospectus for purposes of Section 11 or 12 of the Securities Act of 1933, as amended, are not deemed filed for purposes of Section 18 of the Securities Exchange Act of 1934, as amended, and otherwise are not subject to liability under those sections.
(b) Exhibits
The response to this portion of Item 15 is submitted in (a) 3. above.
(c) Financial Statement Schedules
None
Pursuant to the requirements of Section 13 or 15 (d) of the Securities Exchange Act of 1934, the Registrant has duly caused this report to be signed on its behalf the undersigned, thereunto duly authorized.
| COMMUNITY TRUST BANCORP, INC. | |||
|
March 14, 2013
|
By:
|
/s/ Jean R. Hale | |
| Jean R. Hale | |||
| Chairman, President and Chief Executive Officer | |||
|
|
|
/s/ Kevin J. Stumbo | |
| Kevin J. Stumbo | |||
| Executive Vice President | |||
| (Principal Financial Officer) |
Pursuant to the requirements of the Securities Exchange Act of 1934, this report has been signed below by the following persons on behalf of the Registrant and in the capacities and on the date indicated.
|
March 14, 2013
|
/s/ Jean R. Hale
|
Chairman, President, and Chief Executive Officer
|
|
Jean R. Hale
|
||
|
March 14, 2013
|
/s/ Kevin J. Stumbo
|
Executive Vice President and Treasurer
(Principal Financial Officer)
|
|
Kevin J. Stumbo
|
||
|
March 14, 2013
|
/s/ Charles J. Baird
|
Director
|
|
Charles J. Baird
|
||
|
March 14, 2013
|
/s/ Nick Carter
|
Director
|
|
Nick Carter
|
||
|
March 14, 2013
|
/s/ James E. McGhee, II
|
Director
|
|
James E. McGhee II
|
||
|
March 14, 2013
|
/s/ M. Lynn Parrish
|
Director
|
|
M. Lynn Parrish
|
||
|
March 14, 2013
|
/s/ James R. Ramsey
|
Director
|
|
James R. Ramsey
|
||
|
March 14, 2013
|
/s/ Anthony W. St. Charles
|
Director
|
|
Anthony W. St. Charles
|
COMMUNITY TRUST BANCORP, INC. AND SUBSIDIARIES
|
Exhibit No.
|
Description of Exhibits
|
|
3.1
|
Articles of Incorporation for CTBI {incorporated herein by reference}
|
|
3.2
|
By-laws of CTBI as amended July 25, 1995 {incorporated herein by reference}
|
|
3.3
|
By-laws of CTBI as amended January 29, 2008 {incorporated herein by reference}
|
|
10.1
|
Community Trust Bancorp, Inc. Employee Stock Ownership Plan (effective January 1, 2007) {incorporated herein by reference}
|
|
10.2
|
Community Trust Bancorp, Inc. Savings and Employee Stock Ownership Plan (Amendment Number One effective January 1, 2002, Amendment Number Two effective January 1, 2004, Amendment Number Three effective March 28, 2005, and Amendment Number Four effective January 1, 2006) {incorporated herein by reference}
|
|
10.3
|
Second restated Pikeville National Corporation 1989 Stock Option Plan (commonly known as Community Trust Bancorp, Inc. 1989 Stock Option Plan) {incorporated herein by reference}
|
|
10.4
|
Community Trust Bancorp, Inc. 1998 Stock Option Plan {incorporated herein by reference}
|
|
10.5
|
Community Trust Bancorp, Inc. 2006 Stock Ownership Incentive Plan {incorporated herein by reference}
|
|
10.6
|
Form of Severance Agreement between Community Trust Bancorp, Inc. and executive officers (currently in effect with respect to eleven executive officers) {incorporated herein by reference}
|
|
10.7
|
Senior Management Incentive Compensation Plan (2013) {incorporated herein by reference}
|
|
10.8
|
Restricted Stock Agreement{incorporated herein by reference}
|
|
10.9
|
Employee Incentive Compensation Plan (2013) {incorporated herein by reference}
|
|
10.10
|
Amendment to the Community Trust Bancorp, Inc. 2006 Stock Ownership Incentive Plan {incorporated herein by reference}
|
|
10.11
|
Community Trust Bancorp, Inc. 2012 Executive Committee Long-Term Incentive Compensation Plan {incorporated herein by reference}
|
|
10.12
|
Community Trust Bancorp, Inc. 2013 Executive Committee Long-Term Incentive Compensation Plan {incorporated herein by reference}
|
|
21
|
List of subsidiaries
|
|
23.1
|
Consent of BKD, LLP, Independent Registered Public Accounting Firm
|
|
31.1
|
Certification of Principal Executive Officer (Jean R. Hale, Chairman, President and CEO)
|
|
31.2
|
Certification of Principal Financial Officer (Kevin J. Stumbo, Executive Vice President and Treasurer)
|
|
32.1
|
Certification of Jean R. Hale, Chairman, President and CEO, pursuant to 18 U.S.C. Section 1350, as adopted pursuant to Section 906 of the Sarbanes-Oxley Act of 2002
|
|
32.2
|
Certification of Kevin J. Stumbo, Executive Vice President and Treasurer, pursuant to 18 U.S.C. Section 1350, as adopted pursuant to Section 906 of the Sarbanes-Oxley Act of 2002
|
|
101.INS
|
XBRL Instance Document*
|
|
101.SCH
|
XBRL Taxonomy Extension Schema*
|
|
101.DEF
|
XBRL Taxonomy Extension Definition Linkbase*
|
|
101.CAL
|
XBRL Taxonomy Extension Calculation Linkbase*
|
|
101.LAB
|
XBRL Taxonomy Extension Label Linkbase*
|
|
101.PRE
|
XBRL Taxonomy Extension Presentation Linkbase*
|
* These interactive data files are being submitted electronically with this report and, in accordance with Rule 406T of Regulation S-T, are not deemed filed or part of a registration statement or prospectus for purposes of Section 11 or 12 of the Securities Act of 1933, as amended, are not deemed filed for purposes of Section 18 of the Securities Exchange Act of 1934, as amended, and otherwise are not subject to liability under those sections.
TABLE OF CONTENTS
Part IItem 1. BusinessItem 1A. Risk FactorsItem 1B. Unresolved Staff CommentsItem 2. PropertiesItem 3. Legal ProceedingsItem 4. Mine Safety DisclosuresPart IIItem 5. Market For The Registrant S Common Equity, Related Shareholder Matters, and Issuer Purchases Of Equity SecuritiesItem 6. Selected Financial Data 2008-2012Item 7. Management S Discussion and Analysis Of Financial Condition and Results Of OperationsItem 7A. Quantitative and Qualitative Disclosures About Market RiskItem 8. Financial Statements and Supplementary DataItem 9. Changes in and Disagreements with Accountants on Accounting and Financial DisclosureItem 9A. Controls and ProceduresItem 9B. Other InformationPart IIIItem 10. Directors, Executive Officers, and Corporate GovernanceItem 11. Executive CompensationItem 12. Security Ownership Of Certain Beneficial Owners and Management and Related Shareholder MattersItem 13. Certain Relationships, Related Transactions, and Director IndependenceItem 14. Principal Accountant Fees and ServicesPart IVItem 15. Exhibits and Financial Statement Schedules