|
|
|
|
|
|
|
|
|
|
|
|
|
|
|
|
|
|
|
|
|
|
|
|
|
|
|
|
|
|
|
|
|
|
|
|
|
|
|
|
|
|
|
|
|
|
|
|
|
|
|
|
|
|
UNITED STATES
|
|
SECURITIES AND EXCHANGE COMMISSION
|
|
Washington, D.C. 20549
|
|
x
|
ANNUAL REPORT PURSUANT TO SECTION 13 OR 15(D) OF THE SECURITIES EXCHANGE ACT OF 1934
|
|
o
|
TRANSITION REPORT PURSUANT TO SECTION 13 OR 15 (d) OF THE EXCHANGE ACT OF 1934
|
|
USA Technologies, Inc.
|
||
|
(Exact name of registrant as specified in its charter)
|
||
|
Pennsylvania
|
23-2679963
|
|||||||||
|
(State or other jurisdiction of incorporation or organization)
|
(I.R.S. Employer Identification No.)
|
|||||||||
|
100 Deerfield Lane, Suite 140, Malvern, Pennsylvania
|
19355
|
|||||
|
(Address of principal executive offices)
|
(Zip Code)
|
|||||
|
(610) 989-0340
|
||
|
(Registrant’s telephone number, including area code)
|
||
|
Title of Each Class
|
Name Of Each Exchange On Which Registered
|
|||||
|
Common Stock, no par value
Series A Convertible Preferred Stock
|
The NASDAQ Stock Market LLC
|
|||||
|
Large accelerated filer
o
Accelerated filer
o
Non-accelerated filer
o
Smaller reporting company
x
|
| PAGE | ||||
|
4
|
||||
|
12
|
||||
|
17
|
||||
|
17
|
||||
|
17
|
||||
|
18
|
||||
|
20
|
||||
|
23
|
||||
|
33
|
||||
|
34
|
||||
|
35
|
||||
|
35
|
||||
|
36
|
||||
|
39
|
||||
|
49
|
||||
|
50
|
||||
|
51
|
||||
|
52
|
| 2 |
| 3 |
| 4 |
|
■
|
Ongoing shift toward electronic payment transactions and away from cash and checks;
|
|
■
|
Increasing demand for electronic transaction functionality from both consumers and merchant/operators; and
|
|
■
|
Improving POS technology and NFC equipped mobile phone payment technology.
|
| 5 |
|
●
|
Diverse POS options. Ability to connect to a broad product line of cashless acceptance devices or software.
|
|
●
|
Card Processing Services. Through our existing relationships with card processors and card associations, we provide merchant account and terminal ID set up, pre-negotiated discounted fees on small ticket purchases, and direct electronic funds transfers (EFTs) to our customers’ bank accounts for all settled card transactions as well as ensure compliance with current processing regulations.
|
|
●
|
Wireless Connectivity. We manage the wireless account activation, distribution, and the relationship with wireless providers for our customers, if needed.
|
|
●
|
Customer/Consumer Services. We support our installed base by providing 24-hour help desk support, repairs, and replacement of impaired system solutions. In addition, all inbound billing inquiries are handled through a 24-hour help desk, thereby eliminating the need for our customers to deal with consumer billing inquiries and potential chargebacks.
|
|
●
|
Online Sales Reporting. Via the USALive online reporting system, we provide customers with a host of sales and operational data, including information regarding their credit and cash transactions, user configuration, reporting by machine and region, by date range and transaction type, data reports for operations and finance, graphical reporting of sales, and condition monitoring for equipment service, as well as activation of new devices and redeployments.
|
|
●
|
M2M Telemetry and DEX data transfer. DEX, an acronym for digital exchange, is the Vending Industry’s standard way to communicate information such as sales, cash in bill validators, coins in coin boxes, sales of units by selection, pricing, door openings, and much more. USA Technologies is able to remotely transfer and push DEX data to customers’ route management systems through its DEX partner program. USA Technologies operates within the VDI (Vending Data Interchange) standards established by NAMA (National Automatic Merchandising Association) and sends DEX files compatible with most major remote management software systems.
|
|
●
|
Over-the-Air Update Capabilities. Automatic over-the-air updates to software, settings, and security protocol from our network to our ePort card reader keep our customers’ hardware up-to-date and enable customers to benefit from any advancement made after their hardware or software purchase.
|
|
●
|
Value-added Services. Access to additional services such as
MORE
, our loyalty and prepaid program, two-tier pricing, special promotions such our nationwide Softcard mobile payment and loyalty promotion for vending customers, as well as a menu of hardware purchasing options including JumpStart, our terminal-included service option.
|
|
●
|
Deployment Planning. Access to services to help operators successfully deploy cashless payment systems and integrated solutions that is based on our extensive market and customer experience data.
|
|
●
|
ePort Edge™ is a one-piece design and is intended for those customers who require a magnetic swipe-only cashless system with basic features at a lower price point.
|
| 6 |
|
●
|
ePort G-8 is a PCI compliant two-piece design that supports traditional magnetic stripe credit/debit cards and contactless cards. The ePort G8 telemeter is also available as a stand-alone DEX telemetry solution.
|
|
●
|
ePort G-9 was introduced in Fiscal 2013
and became
available to the market in the latter part of our second quarter of Fiscal 2014. It has been designed to offer all the features of the G-8 plus additional new features that support expanded acceptance options, consumer engagement offerings and advanced diagnostics.
|
|
●
|
QuickConnect is a Web service that allows a client application to securely interface with the Company’s ePort Connect service. QuickConnect essentially replaces ePort SDK (software development kit), which captured our ePort technology in software form for PC-based devices such as kiosks.
|
|
●
|
eSuds, our solution developed for the commercial laundry industry that enables laundry operators to provide customers cashless transactions via the use of their credit cards, debit cards and other payment mediums such as student IDs. Effective with the April 2013 mutually exclusive agreement with Setomatic Systems, we are no longer selling the entire eSuds solution to new customers, but we continue to provide processing services for laundry machines equipped with cashless hardware supplied by Setomatics Systems.
|
|
●
|
ePort Mobile is a mobile acceptance solution for credit and debit cards that is supported by USAT’s ePort Connect service. ePort Mobile is available as a download from the iTunes and Google Play Store and is also available as an All-In-One solution that includes the phone and data plan.
|
|
●
|
ePortGO was introduced in August 2013. ePortGO integrates our ePort Mobile solution and ePort Connect service with software developed by eTaxi USA, LLC, to address the opportunities for streamlined business process and credit and debit card acceptance in the taxi and for-hire vehicle market.
|
|
1.
|
One-Stop Shop, End-to-End Solution.
We believe that our ability to offer our customers one point of contact through a bundled cashless payment solution makes it easy and efficient for our customers to adopt and deploy our electronic payment solutions and results in a service that is unmatched in the small ticket, self-service retail market today. To our knowledge, other cashless payment solutions available in the market today require the operator to set up their own accounts for cashless processing and manage multiple service providers (i.e., hardware terminal manufacturer, wireless network provider, and/or credit card processor). We interface directly with our card processor and wireless service provider, and with our hardware solutions are able to offer a bundled solution to our customers.
|
| 7 |
|
2.
|
Trusted Brand Name.
We believe that the ePort and Energy Miser brands have a strong national reputation for quality, reliability, and innovation. We believe that card associations, payment processors, and merchants/operators trust our system solutions and services to handle financial transactions in a secure operating environment. Our trusted brand name is best exemplified by our high level of customer retention, over two dozen exclusive three-year agreements with customers for use of our ePort Connect service. We have agreements with partners like Visa and Verizon Wireless as well as several one-way exclusive relationships which we have solidified with leading organizations within the unattended POS industry, including Setomatic Systems, AMI Entertainment Network, Inc., Innovative Foto, and Air-Serv.
|
|
3.
|
Market Leadership.
We believe we have the largest installed base of unattended POS electronic payment systems in the unattended small-ticket retail market for food and beverage vending and we are continuing to expand to other adjacent markets such as laundry, taxi, amusement and gaming and kiosks. As of June 30, 2014, we had approximately 266,000 connections to our network. Our installed base supports our sales and marketing initiatives by enhancing our ability to establish or expand our market position. Finally, we believe our installed base provides multiple opportunities for referrals for new business, either from the merchant or operator of the deployed asset or through one of our several strategic relationships.
|
|
4.
|
Attractive Value Proposition for Our Customers
. We believe that our solutions provide our customers an attractive value proposition. Our solutions and services make possible increased purchases by consumers who in the past were limited to the physical cash on hand while making a purchase at an unattended terminal, thereby increasing the universe of potential customers and the buying activity of those customers. In addition, value-added offerings and services such as Two-Tier Pricing, which allows the operator to charge different amounts for the same product depending upon how the consumer choices to pay, and M2M telemetry provide operators with the ability to pursue additional opportunities to reduce costs and improve operating efficiencies. Lastly, new consumer engagement services further extend the potential for customers to build new revenue opportunities, customer loyalty and brand distinction.
|
|
5.
|
Increasing Scale and Financial Stability.
Due to the continued growth in connections to the Company’s ePort Connect service, during the 2014 fiscal year, 84% of the Company’s revenues were from licensing and processing fees which are recurring in nature. We believe that this growing scale provides us improved financial stability and the footprint to market and distribute our products and services more effectively and in more markets than most of our competitors.
|
|
6.
|
Customer-Focused Research and Development.
Our research and development initiatives focus
primarily
on adding features and functionality to our electronic payment solutions based on customer input and emerging market trends. Since we began operations in 1992
and through June 30, 2014
, we have been granted 87 patents (US and International) and currently have
10
patent applications pending. We have generated considerable intellectual property and know-how associated with creating a seamless, end-to-end experience for our customers.
|
| 8 |
| 9 |
| 10 |
| 11 |
|
●
|
fluctuations in revenue generated by our business;
|
|
●
|
fluctuations in operating expenses;
|
|
●
|
our ability to establish or maintain effective relationships with significant partners and suppliers on acceptable terms;
|
|
●
|
the amount of debit or credit card interchange rates that are charged by Visa and Mastercard;
|
|
●
|
the fees that we charge our customers for processing services;
|
|
●
|
the successful operation of our network;
|
|
●
|
the commercial success of our customers, which could be affected by such factors as general economic conditions;
|
|
●
|
the level of product and price competition;
|
|
●
|
the timing and cost of, and our ability to develop and successfully commercialize, new or enhanced products and services;
|
|
●
|
activities of, and acquisitions or announcements by, competitors;
|
| ● |
the impact from any impairment of inventory, goodwill, fixed assets or intangibles;
|
| ● |
the ability to increase the number of customer connections to our network;
|
| ● |
marketing programs which delay realization by us of monthly service fees on our new connections
;
|
| ● |
t
he material breach of security of any of the Company’s systems or third party systems utilized by the Company; and
|
| ● |
t
he anticipation of and response to technological changes, including mobile commerce.
|
|
●
|
our vulnerability to adverse economic conditions and competitive pressures may be heightened;
|
|
●
|
our flexibility in planning for, or reacting to, changes in our business and industry may be limited;
|
|
●
|
our debt covenants may affect our flexibility in planning for, and reacting to, changes in the economy and in our industry;
|
| 12 |
|
●
|
a high level of debt may place us at a competitive disadvantage compared to our competitors that are less leveraged and therefore, may be able to take advantage of opportunities that our indebtedness would prevent us from pursuing;
|
|
●
|
the covenants contained in the agreements governing our outstanding indebtedness may limit our ability to borrow additional funds, dispose of assets and make certain investments;
|
|
●
|
a significant portion of our cash flows could be used to service our indebtedness;
|
|
●
|
we may be sensitive to fluctuations in interest rates if any of our debt obligations are subject to variable interest rates; and
|
|
●
|
our ability to obtain additional financing in the future for working capital, capital expenditures, acquisitions, general corporate purposes or other purposes may be impaired.
|
|
●
|
they have specialized knowledge about our company and operations;
|
|
●
|
they have specialized skills that are important to our operations; or
|
|
●
|
they would be particularly difficult to replace.
|
|
●
|
any of the remaining patent applications will be granted to us;
|
|
●
|
we will develop additional products that are patentable or do not infringe the patents of others;
|
|
●
|
any patents issued to us will provide us with any competitive advantages or adequate protection for our products;
|
|
●
|
any patents issued to us will not be challenged, invalidated or circumvented by others; or
|
|
●
|
any of our products would not infringe the patents of others.
|
| 13 |
|
●
|
the need to maintain significant inventory of components that are in limited supply;
|
|
●
|
buying components in bulk for the best pricing;
|
|
●
|
responding to the unpredictable demand for products;
|
|
●
|
responding to customer requests for short lead-time delivery schedules; and
|
|
●
|
failure of customers to take delivery of ordered products.
|
| 14 |
| 15 |
|
●
|
variations in operating results and achievement of key business metrics;
|
|
●
|
changes in earnings estimates by securities analysts, if any;
|
|
●
|
any differences between reported results and securities analysts’ published or unpublished expectations;
|
|
●
|
announcements of new contracts, service offerings or technological innovations by us or our competitors;
|
|
●
|
market reaction to any acquisitions, joint ventures or strategic investments announced by us or our competitors;
|
| 16 |
|
●
|
demand for our services and products;
|
|
●
|
shares of common stock being sold pursuant to Rule 144 or upon exercise of warrants;
|
|
●
|
regulatory matters;
|
|
●
|
concerns about our financial position, operating results, litigation, government regulation, developments or disputes relating to agreements, patents or proprietary rights;
|
|
●
|
potential dilutive effects of future sales of shares of common stock by shareholders and by the Company;
|
|
●
|
the amount of average daily trading volume in our common stock;
|
|
●
|
our ability to obtain working capital financing; and
|
|
●
|
general economic or stock market conditions unrelated to our operating performance.
|
| 17 |
|
Year ended June 30, 2014
|
High
|
Low
|
||||||
|
First Quarter (through September 30, 2013)
|
$ | 2.18 | $ | 1.60 | ||||
|
Second Quarter (through December 31, 2013)
|
$ | 2.01 | $ | 1.40 | ||||
|
Third Quarter (through March 31, 2014)
|
$ | 2.48 | $ | 1.80 | ||||
|
Fourth Quarter (through June 30, 2014)
|
$ | 2.24 | $ | 1.73 | ||||
|
Year ended June 30, 2013
|
High
|
Low
|
||||||
|
First Quarter (through September 30, 2012)
|
$ | 1.75 | $ | 1.16 | ||||
|
Second Quarter (through December 31, 2012)
|
$ | 1.97 | $ | 1.22 | ||||
|
Third Quarter (through March 31, 2013)
|
$ | 2.75 | $ | 1.73 | ||||
|
Fourth Quarter (through June 30, 2013)
|
$ | 2.65 | $ | 1.60 | ||||
|
Plan category
|
Number of Securities
to be issued upon exercise of outstanding options and warrants
(a)
|
Weighted average
exercise price of outstanding options and warrants
(b)
|
Number of securities
remaining available for future issuance (excluding securities reflected in column (a))
(c)
|
||||||||||
|
Equity compensation plans approved by security holders
|
120,000 | $ | 2.05 | 1,218,991 | (1) | ||||||||
|
Total
|
120,000 | $ | 2.05 | 1,218,991 | |||||||||
|
●
|
4,309,000 shares issuable upon the exercise of common stock warrants at exercise prices ranging from $2.10 to $2.6058 per share; all warrants were exercisable as of September 15, 2014;
|
|
|
●
|
98,
529
shares issuable upon the conversion of outstanding Preferred Stock and cumulative Preferred Stock dividends;
|
|
|
●
|
31,484 shares issuable under the 2012 Stock Incentive Plan;
|
|
|
●
|
466,740
shares issuable under the 2013 Stock Incentive Plan;
|
|
|
●
|
750,000 shares underlying stock options issued or to be issued under the 2014 Stock Option Incentive Plan; and
|
|
|
●
|
140,000 shares issuable to our former CEO upon the occurrence of a USA Transaction.
|
| 18 |
|
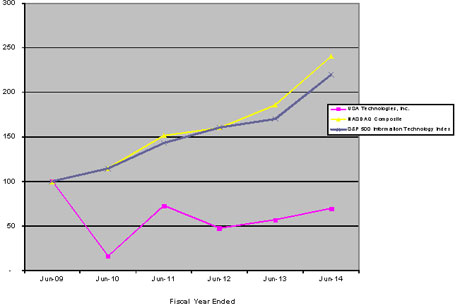
Total Return For:
|
Jun-09
|
Jun-10
|
Jun-11
|
Jun-12
|
Jun-13
|
Jun-14
|
||||||||||||||||||
|
USA Technologies, Inc.
|
$ | 100 | $ | 16 | $ | 73 | $ | 48 | $ | 57 | $ | 69 | ||||||||||||
|
NASDAQ Composite
|
$ | 100 | $ | 115 | $ | 151 | $ | 160 | $ | 185 | $ | 240 | ||||||||||||
|
S&P 500 Information Technology Index
|
$ | 100 | $ | 115 | $ | 143 | $ | 161 | $ | 170 | $ | 220 | ||||||||||||
| 19 |
|
Year ended June 30,
|
||||||||||||||||||||
|
2014
|
2013
|
2012
|
2011
|
2010
|
||||||||||||||||
|
OPERATIONS DATA
|
||||||||||||||||||||
|
Revenues
|
$ | 42,344,964 | $ | 35,940,244 | $ | 29,017,243 | $ | 22,868,789 | $ | 15,771,106 | ||||||||||
|
Operating income (loss)
|
$ | 436,332 | $ | 713,925 | $ | (7,000,392 | ) | $ | (5,688,217 | ) | $ | (11,595,697 | ) | |||||||
|
Net Income (loss)
|
$ | 27,530,652 | $ | 854,123 | $ | (5,211,238 | ) | $ | (6,457,067 | ) | $ | (11,571,495 | ) | |||||||
|
Cumulative preferred dividends
|
(664,452 | ) | (664,452 | ) | (664,452 | ) | (665,577 | ) | (735,139 | ) | ||||||||||
|
Net income (loss) applicable to common shares
|
$ | 26,866,200 | $ | 189,671 | $ | (5,875,690 | ) | $ | (7,122,644 | ) | $ | (12,306,634 | ) | |||||||
|
Net earnings (loss) per common share - basic
|
$ | 0.78 | $ | 0.01 | $ | (0.18 | ) | $ | (0.26 | ) | $ | (0.55 | ) | |||||||
|
Net earnings (loss) per common share - diluted
|
$ | 0.78 | $ | 0.01 | $ | (0.18 | ) | $ | (0.26 | ) | $ | (0.55 | ) | |||||||
|
Cash dividends per common share
|
- | - | - | - | - | |||||||||||||||
|
BALANCE SHEET DATA
|
||||||||||||||||||||
|
Total assets
|
$ | 70,764,242 | $ | 36,576,196 | $ | 33,219,657 | $ | 36,004,005 | $ | 29,848,424 | ||||||||||
|
Long-term debt
|
$ | 422,776 | $ | 369,906 | $ | 728,330 | $ | 253,061 | $ | 596,155 | ||||||||||
|
Shareholders’ equity
|
$ | 53,736,667 | $ | 23,379,191 | $ | 21,655,022 | $ | 26,125,531 | $ | 22,812,172 | ||||||||||
| 20 |
|
UNAUDITED
|
||||||||||||||||||||
|
YEAR ENDED JUNE 30, 2014
|
First Quarter
|
Second Quarter
|
Third Quarter
|
Fourth Quarter
|
Year
|
|||||||||||||||
|
Revenues
|
$ | 10,123,058 | $ | 10,570,514 | $ | 10,443,932 | $ | 11,207,460 | $ | 42,344,964 | ||||||||||
|
Gross profit
|
$ | 3,582,771 | $ | 3,830,133 | $ | 3,997,788 | $ | 3,662,144 | $ | 15,072,836 | ||||||||||
|
Operating income (loss)
|
$ | 128,918 | $ | 509,690 | $ | 365,535 | $ | (567,811 | ) | $ | 436,332 | |||||||||
|
Net income (loss)
|
$ | 293,654 | $ | 409,191 | $ | 26,866,526 | $ | (38,719 | ) | $ | 27,530,652 | |||||||||
|
Cumulative preferred dividends
|
$ | (332,226 | ) | $ | - | $ | (332,226 | ) | $ | - | $ | (664,452 | ) | |||||||
|
Net income (loss) applicable to common shares
|
$ | (38,572 | ) | $ | 409,191 | $ | 26,534,300 | $ | (38,719 | ) | $ | 26,866,200 | ||||||||
|
Net earnings (loss) per common share - basic
|
$ | - | $ | 0.01 | $ | 0.75 | $ | - | $ | 0.78 | ||||||||||
|
Weighted average number of common shares outstanding
|
33,324,295 | 34,136,884 | 35,504,911 | 35,517,099 | 34,613,497 | |||||||||||||||
|
Net earnings (loss) per common share - diluted
|
$ | - | $ | 0.01 | $ | 0.75 | $ | - | $ | 0.78 | ||||||||||
|
Diluted weighted average number of common shares outstanding
|
33,324,295 | 34,222,731 | 35,504,911 | 35,517,099 | 34,613,497 | |||||||||||||||
|
UNAUDITED
|
||||||||||||||||||||
|
YEAR ENDED JUNE 30, 2013
|
First Quarter
|
Second Quarter
|
Third Quarter
|
Fourth Quarter
|
Year
|
|||||||||||||||
|
Revenues
|
$ | 8,390,277 | $ | 8,884,321 | $ | 8,980,804 | $ | 9,684,842 | $ | 35,940,244 | ||||||||||
|
Gross profit
|
$ | 3,144,281 | $ | 3,600,181 | $ | 3,681,339 | $ | 3,670,812 | $ | 14,096,613 | ||||||||||
|
Operating income (loss)
|
$ | (414,232 | ) | $ | 567,650 | $ | 350,219 | $ | 210,288 | $ | 713,925 | |||||||||
|
Net income (loss)
|
$ | 39,140 | $ | 153,758 | $ | (1,015,943 | ) | $ | 1,677,168 | $ | 854,123 | |||||||||
|
Cumulative preferred dividends
|
$ | (332,226 | ) | $ | - | $ | (332,226 | ) | $ | - | $ | (664,452 | ) | |||||||
|
Net income (loss) applicable to common shares
|
$ | (293,086 | ) | $ | 153,758 | $ | (1,348,169 | ) | $ | 1,677,168 | $ | 189,671 | ||||||||
|
Net earnings (loss) per common share - basic
|
$ | (0.01 | ) | $ | - | $ | (0.04 | ) | $ | 0.05 | $ | 0.01 | ||||||||
|
Weighted average number of common shares outstanding
|
32,518,230 | 32,734,394 | 32,821,345 | 33,080,641 | 32,787,673 | |||||||||||||||
|
Net earnings (loss) per common share - diluted
|
$ | (0.01 | ) | $ | - | $ | (0.04 | ) | $ | 0.05 | $ | 0.01 | ||||||||
|
Diluted weighted average number of common shares outstanding
|
32,518,230 | 33,468,336 | 32,821,345 | 34,115,444 | 33,613,346 | |||||||||||||||
| 21 |
|
UNAUDITED
|
||||||||||||||||||||
|
YEAR ENDED JUNE 30, 2014
|
First Quarter
|
Second Quarter
|
Third Quarter
|
Fourth Quarter
|
Year
|
|||||||||||||||
|
Net cash provided by operating activities
|
$ | 911,824 | $ | 1,743,352 | $ | 2,162,782 | $ | 2,267,442 | $ | 7,085,400 | ||||||||||
|
Net cash used in investing activities
|
$ | (2,089,601 | ) | $ | (2,478,986 | ) | $ | (2,673,060 | ) | $ | (675,805 | ) | $ | (7,917,452 | ) | |||||
|
Net cash provided by financing activities
|
$ | 1,008,677 | $ | 1,578,733 | $ | 432,396 | $ | 903,566 | $ | 3,923,372 | ||||||||||
|
Net increase (decrease) in cash and cash equivalents
|
(169,100 | ) | 843,099 | (77,882 | ) | 2,495,203 | 3,091,320 | |||||||||||||
|
Cash and cash equivalents at beginning of year
|
5,981,000 | 5,811,900 | 6,654,999 | 6,577,117 | 5,981,000 | |||||||||||||||
|
Cash and cash equivalents at end of year
|
$ | 5,811,900 | $ | 6,654,999 | $ | 6,577,117 | $ | 9,072,320 | $ | 9,072,320 | ||||||||||
|
UNAUDITED
|
||||||||||||||||||||
|
YEAR ENDED JUNE 30, 2013
|
First Quarter
|
Second Quarter
|
Third Quarter
|
Fourth Quarter
|
Year
|
|||||||||||||||
|
Net cash provided by (used in) operating activities
|
$ | 678,010 | $ | 1,922,175 | $ | (217,437 | ) | $ | 3,656,204 | $ | 6,038,952 | |||||||||
|
Net cash used in investing activities
|
$ | (2,076,915 | ) | $ | (2,515,533 | ) | $ | (1,790,849 | ) | $ | (2,797,540 | ) | $ | (9,180,837 | ) | |||||
|
Net cash provided by (used in) financing activities
|
$ | 1,175,963 | $ | (563,999 | ) | $ | 910,477 | $ | 1,173,799 | $ | 2,696,240 | |||||||||
|
Net increase (decrease) in cash and cash equivalents
|
(222,942 | ) | (1,157,357 | ) | (1,097,809 | ) | 2,032,463 | (445,645 | ) | |||||||||||
|
Cash and cash equivalents at beginning of year
|
6,426,645 | 6,203,703 | 5,046,346 | 3,948,537 | 6,426,645 | |||||||||||||||
|
Cash and cash equivalents at end of year
|
$ | 6,203,703 | $ | 5,046,346 | $ | 3,948,537 | $ | 5,981,000 | $ | 5,981,000 | ||||||||||
| 22 |
| 23 |
|
|
||
|
●
|
$27.3 million of deferred tax assets recognized;
|
|
|
●
|
Total revenue up 18% to $42.3 million;
|
|
|
●
|
Recurring license and transaction fee revenue up 19% to $35.6 million; and
|
|
|
●
|
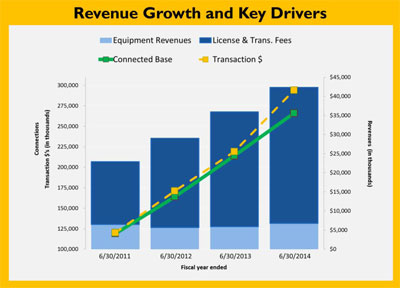
Total connections to its ePort Connect service base as of June 30, 2014 up 24% as compared to June 30, 2013.
|
| ● |
Adding 52,000 net connections to our service, consisting of 76,000 new connections to our ePort Connect service in fiscal 2014, offset by 24,000 deactivations, compared to 50,000 net connections added in fiscal 2013;
|
|
| ● |
As of June 30, 2014, the Company had approximately 266,000 connections to the ePort Connect service compared to approximately 214,000 connections to the ePort Connect service as of June 30, 2013, an increase of 52,000 net connections or 24%;
|
|
| ● |
Increases in the number of small-ticket, credit/debit transactions and dollars handled for fiscal 2014 of 31% and 34%, respectively, compared to the same period a year ago; and
|
|
| ● |
ePort Connect customer base grew 24% from June 30, 2013.
|
| 24 |
|
Year ended June 30,
|
||||||||
|
2014
|
2013
|
|||||||
|
Net income
|
$ | 27,530,652 | $ | 854,123 | ||||
|
Non-GAAP adjustments:
|
||||||||
|
Operating expenses
|
||||||||
|
Selling, general and administrative:
|
||||||||
|
Proxy related costs
|
- | 328,000 | ||||||
|
Fair value of warrant adjustment
|
(65,429 | ) | (267,928 | ) | ||||
|
Benefit from reduction of valuation allowances
|
(26,713,897 | ) | - | |||||
|
Non-GAAP net income
|
$ | 751,326 | $ | 914,195 | ||||
|
Net income
|
$ | 27,530,652 | $ | 854,123 | ||||
|
Non-GAAP net income
|
$ | 751,326 | $ | 914,195 | ||||
|
Cumulative preferred dividends
|
(664,452 | ) | (664,452 | ) | ||||
|
Net income applicable to common shares
|
$ | 26,866,200 | $ | 189,671 | ||||
|
Non-GAAP net income applicable to common shares
|
$ | 86,874 | $ | 249,743 | ||||
|
Net earnings per common share - basic
|
$ | 0.78 | $ | 0.01 | ||||
|
Non-GAAP net earnings per common share - basic
|
$ | - | $ | 0.01 | ||||
|
Weighted average number of common shares outstanding - basic
|
34,613,497 | 32,787,673 | ||||||
|
Net earnings per common share - diluted
|
$ | 0.78 | $ | 0.01 | ||||
|
Non-GAAP net earnings per common share - diluted
|
$ | - | $ | 0.01 | ||||
|
Diluted weighted average number of common shares outstanding
|
34,613,497 | 33,613,346 | ||||||
| 25 |
|
Year ended June 30,
|
||||||||
|
2014
|
2013
|
|||||||
|
Net income
|
$ | 27,530,652 | $ | 854,123 | ||||
|
Less interest income
|
(30,337 | ) | (57,121 | ) | ||||
|
Plus interest expense
|
256,844 | 157,205 | ||||||
|
Plus income tax expense (benefit)
|
(27,255,398 | ) | 27,646 | |||||
|
Plus depreciation expense
|
5,463,985 | 3,837,174 | ||||||
|
Plus amortization expense
|
21,953 | 742,400 | ||||||
|
Plus change in fair value of warrant liabilities
|
(65,429 | ) | (267,928 | ) | ||||
|
Plus stock-based compensation
|
529,041 | 502,907 | ||||||
|
Adjusted EBITDA
|
$ | 6,451,311 | $ | 5,796,406 | ||||
| 26 |
| ● |
Total revenue up 24%;
|
|
| ● | Recurring license and transaction fee revenue up 29%; | |
| ● |
ePort Connect service base up 30%;
|
|
| ● |
Gross profit dollars up 42%, and
|
|
| ● |
Net income of $854,000 (includes $268,000 non-cash income for change in fair value of warrants), from a net loss of ($5.2) million (includes $1.8 million non-cash income for fair value of warrants).
|
| ● |
50,000 additional net connections to the Company’s ePort Connect service in fiscal 2013 compared to 45,000 for fiscal 2012;
|
|
| ● |
As of June 30, 2013, the Company had approximately 214,000 connections to the ePort Connect service compared to approximately 164,000 connections to the ePort Connect service as of June 30, 2012, an increase of approximately 30%;
|
|
| ● |
Increases in the number of small-ticket, credit/debit transactions and dollars handled for fiscal 2013 of 26% and 28%, respectively, compared to the same period a year ago; and
|
|
| ● |
1,750 ePort Connect customers added in the current fiscal year, up 53% from the prior fiscal year, for 5,050 customers at June 30, 2013.
|
| 27 |
|
Year ended June 30,
|
||||||||
|
2013
|
2012
|
|||||||
|
Net income (loss)
|
$
|
854,123
|
$
|
(5,211,238
|
)
|
|||
|
Non-GAAP adjustments:
|
||||||||
|
Operating expenses
|
||||||||
|
Selling, general and administrative:
|
||||||||
|
Proxy related costs
|
328,000
|
2,229,000
|
||||||
|
CEO Separation
|
-
|
975,000
|
||||||
|
Fair value of warrant adjustment
|
(267,928
|
)
|
(1,813,687
|
)
|
||||
|
Non-GAAP net income (loss)
|
$
|
914,195
|
$
|
(3,820,925
|
)
|
|||
|
Net income (loss)
|
$
|
854,123
|
$
|
(5,211,238
|
)
|
|||
|
Non-GAAP net income (loss)
|
$
|
914,195
|
$
|
(3,820,925
|
)
|
|||
|
Cumulative preferred dividends
|
(664,452
|
)
|
(664,452
|
)
|
||||
|
Net income (loss) applicable to common shares
|
$
|
189,671
|
$
|
(5,875,690
|
)
|
|||
|
Non-GAAP net income (loss) applicable to common shares
|
$
|
249,743
|
$
|
(4,485,377
|
)
|
|||
|
Net earnings (loss) per common share - basic
|
$
|
0.01
|
$
|
(0.18
|
)
|
|||
|
Non-GAAP net earnings (loss) per common share - basic
|
$
|
0.01
|
$
|
(0.14
|
)
|
|||
|
Weighted average number of common shares outstanding
|
32,787,673
|
32,423,987
|
||||||
|
Net earnings (loss) per common share - diluted
|
$
|
0.01
|
$
|
(0.18
|
)
|
|||
|
Non-GAAP net earnings (loss) per common share - diluted
|
$
|
0.01
|
$
|
(0.14
|
)
|
|||
|
Diluted weighted average number of common shares outstanding
|
33,613,346
|
32,423,987
|
||||||
|
Year ended June 30,
|
||||||||
|
2013
|
2012
|
|||||||
|
Net income (loss)
|
$
|
854,123
|
$
|
(5,211,238
|
)
|
|||
|
Less interest income
|
(57,121
|
)
|
(72,059
|
)
|
||||
|
Plus interest expense
|
157,205
|
83,993
|
||||||
|
Plus income tax expense
|
27,646
|
12,599
|
||||||
|
Plus depreciation expense
|
3,837,174
|
2,443,054
|
||||||
|
Plus amortization expense
|
742,400
|
997,900
|
||||||
|
Plus (gain)/loss for change in fair value of warrant liabilities
|
(267,928
|
)
|
(1,813,687
|
)
|
||||
|
Plus stock-based compensation
|
502,907
|
782,100
|
||||||
|
Adjusted EBITDA income (loss)
|
$
|
5,796,406
|
$
|
(2,777,338
|
)
|
|||
| 28 |
| 29 |
|
●
|
Recurring license and transaction fee revenue up 16% to $9 million; and
|
|
●
|
Total connections to its ePort Connect service as of June 30, 2014 up 24% as compared to June 30, 2013.
|
|
●
|
Adding 22,000 net connections to our service compared to 18,000 net connections added in the same quarter of Fiscal 2013;
|
|
●
|
Increases in the number of small-ticket, credit/debit transactions and dollars handled in the fourth quarter of 29% and 32%, respectively, compared to the same period a year ago; and
|
|
●
|
ePort Connect customer base grew 45% from June 30, 2013.
|
| 30 |
|
Three months ended June 30,
|
||||||||
|
2014
|
2013
|
|||||||
|
Net income (loss)
|
$ | (38,719 | ) | $ | 1,677,168 | |||
|
Non-GAAP adjustments:
|
||||||||
|
Fair value of warrant adjustment
|
(53,125 | ) | (1,517,384 | ) | ||||
|
Non-GAAP net income (loss)
|
$ | (91,844 | ) | $ | 159,784 | |||
|
Net income (loss)
|
$ | (38,719 | ) | $ | 1,677,168 | |||
|
Non-GAAP net income (loss)
|
$ | (91,844 | ) | $ | 159,784 | |||
|
Cumulative preferred dividends
|
- | - | ||||||
|
Net income (loss) applicable to common shares
|
$ | (38,719 | ) | $ | 1,677,168 | |||
|
Non-GAAP net income (loss) applicable to common shares
|
$ | (91,844 | ) | $ | 159,784 | |||
|
Net earnings (loss) per common share - basic
|
$ | - | $ | 0.05 | ||||
|
Non-GAAP net earnings (loss) per common share - basic
|
$ | - | $ | - | ||||
|
Weighted average number of common shares outstanding - basic
|
35,517,099 | 33,080,641 | ||||||
|
Net earnings (loss) per common share - diluted
|
$ | - | $ | 0.05 | ||||
|
Non-GAAP net earnings (loss) per common share - diluted
|
$ | - | $ | - | ||||
|
Diluted weighted average number of common shares outstanding
|
35,517,099 | 34,115,444 | ||||||
|
Three months ended June 30,
|
||||||||
|
2014
|
2013
|
|||||||
|
Net income (loss)
|
$ | (38,719 | ) | $ | 1,677,168 | |||
|
Less interest income
|
(8,995 | ) | (4,212 | ) | ||||
|
Plus interest expense
|
74,529 | 47,804 | ||||||
|
Plus income tax expense (benefit)
|
(541,501 | ) | 6,911 | |||||
|
Plus depreciation expense
|
1,553,875 | 1,094,978 | ||||||
|
Plus amortization expense
|
- | 185,600 | ||||||
|
Plus change in fair value of warrant liabilities
|
(53,125 | ) | (1,517,384 | ) | ||||
|
Plus stock-based compensation
|
280,161 | 133,674 | ||||||
|
Adjusted EBITDA
|
$ | 1,266,225 | $ | 1,624,539 | ||||
| 31 |
| 32 |
|
Payments due by period
|
||||||||||||||||||||
|
Less Than
|
More than
|
|||||||||||||||||||
|
Contractual Obligations
|
Total
|
1 year
|
1-3 years
|
3-5 years
|
5 years
|
|||||||||||||||
|
Long-Term Debt Obligations
|
$ | 8,452 | $ | 8,452 | $ | - | $ | - | $ | - | ||||||||||
|
Capital Lease Obligations
|
486,271 | 198,416 | 264,493 | 23,362 | - | |||||||||||||||
|
Operating Lease Obligations, other
|
798,315 | 435,578 | 362,737 | - | - | |||||||||||||||
|
Operating Lease Obligations under Sale Leaseback
|
2,965,143 | 988,381 | 1,976,762 | - | - | |||||||||||||||
|
Purchase Obligations
|
- | - | - | - | - | |||||||||||||||
|
Other Long-Term Liabilities Reflected on
the Registrant’s Balance Sheet under GAAP
|
- | - | - | - | - | |||||||||||||||
|
Total
|
$ | 4,258,181 | $ | 1,630,827 | $ | 2,603,992 | $ | 23,362 | $ | - | ||||||||||
| 33 |
|
Financial Statements:
|
|
|
F-1
|
|
|
F-2
|
|
|
F-3
|
|
|
F-4
|
|
|
F-6
|
|
|
F-7
|
| 34 |
| F-1 |
|
June 30,
|
||||||||
|
2014
|
2013
|
|||||||
|
Assets
|
||||||||
|
Current assets:
|
||||||||
|
Cash and cash equivalents
|
$ | 9,072,320 | $ | 5,981,000 | ||||
|
Accounts receivable, less allowance for uncollectible accounts of $63,000 and
$18,000, respectively
|
2,683,579 | 2,620,684 | ||||||
|
Finance receivables
|
119,793 | 116,444 | ||||||
|
Inventory
|
1,486,777 | 1,823,615 | ||||||
|
Prepaid expenses and other current assets
|
363,367 | 184,336 | ||||||
|
Deferred income taxes
|
907,691 | - | ||||||
|
Total current assets
|
14,633,527 | 10,726,079 | ||||||
|
Finance receivables, less current portion
|
352,794 | 408,674 | ||||||
|
Other assets
|
190,703 | 84,117 | ||||||
|
Property and equipment, net
|
21,138,580 | 17,240,065 | ||||||
|
Deferred income taxes
|
26,353,330 | - | ||||||
|
Intangibles, net
|
432,100 | 454,053 | ||||||
|
Goodwill
|
7,663,208 | 7,663,208 | ||||||
|
Total assets
|
$ | 70,764,242 | $ | 36,576,196 | ||||
|
Liabilities and shareholders’ equity
|
||||||||
|
Current liabilities:
|
||||||||
|
Accounts payable
|
$ | 7,753,911 | $ | 7,301,247 | ||||
|
Accrued expenses
|
1,915,799 | 1,468,184 | ||||||
|
Line of credit
|
5,000,000 | 3,000,000 | ||||||
|
Current obligations under long-term debt
|
172,911 | 247,152 | ||||||
|
Income taxes payable
|
21,021 | - | ||||||
|
Deferred gain from sale-leaseback transactions
|
380,895 | - | ||||||
|
Total current liabilities
|
15,244,537 | 12,016,583 | ||||||
|
Long-term liabilities:
|
||||||||
|
Long-term debt, less current portion
|
249,865 | 122,754 | ||||||
|
Accrued expenses, less current portion
|
186,174 | 366,785 | ||||||
|
Deferred tax liabilities
|
- | 40,245 | ||||||
|
Warrant liabilities
|
585,209 | 650,638 | ||||||
|
Deferred gain from sale-leaseback transactions, less current portion
|
761,790 | - | ||||||
|
Total long-term liabilities
|
1,783,038 | 1,180,422 | ||||||
|
Total liabilities
|
17,027,575 | 13,197,005 | ||||||
|
Commitments and contingencies
|
||||||||
|
Shareholders’ equity:
|
||||||||
|
Preferred stock, no par value:
|
||||||||
|
Authorized shares- 1,800,000 Series A convertible preferred- Authorized shares- 900,000
Issued and outstanding shares- 442,968 (liquidation preference of $16,690,456 and $16,026,004, respectively)
|
3,138,056 | 3,138,056 | ||||||
|
Common stock, no par value: Authorized shares- 640,000,000 Issued and outstanding
shares- 35,514,685 and 33,284,232,
respectively
|
224,210,197 | 221,383,373 | ||||||
|
Accumulated deficit
|
(173,611,586 | ) | (201,142,238 | ) | ||||
|
Total shareholders’ equity
|
53,736,667 | 23,379,191 | ||||||
|
Total liabilities and shareholders’ equity
|
$ | 70,764,242 | $ | 36,576,196 | ||||
| F-2 |
|
Year ended June 30,
|
||||||||||||
|
2014
|
2013
|
2012
|
||||||||||
|
Revenues:
|
||||||||||||
|
License and transaction fees
|
$ | 35,638,121 | $ | 30,044,429 | $ | 23,370,754 | ||||||
|
Equipment sales
|
6,706,843 | 5,895,815 | 5,646,489 | |||||||||
|
Total revenues
|
42,344,964 | 35,940,244 | 29,017,243 | |||||||||
|
Cost of services
|
23,018,001 | 18,219,945 | 15,312,966 | |||||||||
|
Cost of equipment
|
4,254,127 | 3,623,686 | 3,743,226 | |||||||||
|
Gross profit
|
15,072,836 | 14,096,613 | 9,961,051 | |||||||||
|
Operating expenses:
|
||||||||||||
|
Selling, general and administrative
|
14,036,016 | 12,068,566 | 15,460,668 | |||||||||
|
Depreciation and amortization
|
600,488 | 1,314,122 | 1,500,775 | |||||||||
|
Total operating expenses
|
14,636,504 | 13,382,688 | 16,961,443 | |||||||||
|
Operating income (loss)
|
436,332 | 713,925 | (7,000,392 | ) | ||||||||
|
Other income (expense):
|
||||||||||||
|
Interest income
|
30,337 | 57,121 | 72,059 | |||||||||
|
Interest expense
|
(256,844 | ) | (157,205 | ) | (83,993 | ) | ||||||
|
Change in fair value of warrant liabilities
|
65,429 | 267,928 | 1,813,687 | |||||||||
|
Total other income (expense), net
|
(161,078 | ) | 167,844 | 1,801,753 | ||||||||
|
Income (loss) before benefit (provision) for income taxes
|
275,254 | 881,769 | (5,198,639 | ) | ||||||||
|
Benefit (provision) for income taxes
|
27,255,398 | (27,646 | ) | (12,599 | ) | |||||||
|
Net income (loss)
|
27,530,652 | 854,123 | (5,211,238 | ) | ||||||||
|
Cumulative preferred dividends
|
(664,452 | ) | (664,452 | ) | (664,452 | ) | ||||||
|
Net income (loss) applicable to common shares
|
$ | 26,866,200 | $ | 189,671 | $ | (5,875,690 | ) | |||||
|
Net earnings (loss) per common share - basic
|
$ | 0.78 | $ | 0.01 | $ | (0.18 | ) | |||||
|
Weighted average number of common shares outstanding
|
34,613,497 | 32,787,673 | 32,423,987 | |||||||||
|
Net earnings (loss) per common share - diluted
|
$ | 0.78 | $ | 0.01 | $ | (0.18 | ) | |||||
|
Diluted weighted average number of common shares outstanding
|
34,613,497 | 33,613,346 | 32,423,987 | |||||||||
| F-3 |
|
Series A
|
||||||||||||||||||||||||
|
Convertible
|
||||||||||||||||||||||||
|
Preferred Stock
|
Common Stock
|
Accumulated
|
||||||||||||||||||||||
|
Shares
|
Amount
|
Shares
|
Amount
|
Deficit
|
Total
|
|||||||||||||||||||
|
Balance, June 30, 2011
|
442,968 | $ | 3,138,056 | 32,281,140 | $ | 219,772,598 | (196,785,123 | ) | $ | 26,125,531 | ||||||||||||||
|
Exercise of 4,550 warrants at $2.20
resulting in issuance of common stock
|
- | - | 4,550 | 10,010 | - | 10,010 | ||||||||||||||||||
|
Cashless exercise of 2,767 warrants
resulting in issuance of common stock
|
- | - | 990 | - | - | - | ||||||||||||||||||
|
Issuance of fully-vested shares of common stock to
employees and directors and vesting of shares under the 2010 Stock Incentive Plan
|
- | - | 120,472 | 248,851 | - | 248,851 | ||||||||||||||||||
|
Issuance of fully-vested shares of common stock to
employees and directors and vesting of shares under the 2011 Stock Incentive Plan
|
- | - | 141,666 | 335,636 | - | 335,636 | ||||||||||||||||||
|
Vesting of shares under the 2012 Stock
Incentive Plan
|
- | - | - | 197,613 | - | 197,613 | ||||||||||||||||||
|
Retirement of common stock
|
- | - | (38,749 | ) | (51,381 | ) | - | (51,381 | ) | |||||||||||||||
|
Net loss
|
- | - | - | - | (5,211,238 | ) | (5,211,238 | ) | ||||||||||||||||
|
Balance, June 30, 2012
|
442,968 | 3,138,056 | 32,510,069 | 220,513,327 | (201,996,361 | ) | 21,655,022 | |||||||||||||||||
|
Exercise of 382,503 warrants at $1.13
resulting in issuance of common stock
|
- | - | 382,503 | 432,229 | - | 432,229 | ||||||||||||||||||
|
Cashless exercise of 36,186 warrants
resulting in issuance of common stock
|
- | - | 17,094 | - | - | - | ||||||||||||||||||
|
Warrants issued in conjunction with Line
of Credit Amendment
|
- | - | - | 55,962 | - | 55,962 | ||||||||||||||||||
|
Issuance of fully-vested shares of common stock to
employees and directors and vesting of shares under the 2010 Stock Incentive Plan
|
- | - | 62,942 | 68,723 | - | 68,723 | ||||||||||||||||||
|
Issuance of fully-vested shares of common stock to
employees and directors and vesting of shares under the 2011 Stock Incentive Plan
|
- | - | 96,665 | 157,645 | - | 157,645 | ||||||||||||||||||
|
Issuance of fully-vested shares of common stock to
employees and directors and vesting of shares under the 2012 Stock Incentive Plan
|
- | - | 279,806 | 276,539 | - | 276,539 | ||||||||||||||||||
|
Retirement of common stock
|
- | - | (64,847 | ) | (121,052 | ) | - | (121,052 | ) | |||||||||||||||
|
Net Income
|
- | - | - | - | 854,123 | 854,123 | ||||||||||||||||||
|
Balance, June 30, 2013
|
442,968 | $ | 3,138,056 | 33,284,232 | $ | 221,383,373 | $ | (201,142,238 | ) | $ | 23,379,191 |
| F-4 |
|
Series A
|
||||||||||||||||||||||||
|
Convertible
|
||||||||||||||||||||||||
|
Preferred Stock
|
Common Stock
|
Accumulated
|
||||||||||||||||||||||
|
Shares
|
Amount
|
Shares
|
Amount
|
Deficit
|
Total
|
|||||||||||||||||||
|
Exercise of 2,090,226 warrants at $1.13
resulting in issuance of common stock
|
- | - | 2,090,226 | 2,361,956 | - | 2,361,956 | ||||||||||||||||||
|
Issuance of fully-vested shares of common stock to
employees and directors and vesting of shares
under the 2010 Stock Incentive Plan
|
- | - | 6,668 | 6,024 | - | 6,024 | ||||||||||||||||||
|
Issuance of fully-vested shares of common stock to
employees and directors and vesting of shares under the 2011 Stock Incentive Plan
|
- | - | 51,667 | 17,366 | - | 17,366 | ||||||||||||||||||
|
Issuance of fully-vested shares of common stock to
employees and directors and vesting of shares under the 2012 Stock Incentive Plan
|
- | - | 131,203 | 505,651 | - | 505,651 | ||||||||||||||||||
|
Retirement of common stock
|
- | - | (49,311 | ) | (89,020 | ) | - | (89,020 | ) | |||||||||||||||
|
Excess tax benefits from share-based
compensation
|
- | - | - | 24,847 | - | 24,847 | ||||||||||||||||||
|
Net Income
|
- | - | - | - | 27,530,652 | 27,530,652 | ||||||||||||||||||
|
Balance, June 30, 2014
|
442,968 | $ | 3,138,056 | 35,514,685 | $ | 224,210,197 | $ | (173,611,586 | ) | $ | 53,736,667 | |||||||||||||
| F-5 |
|
Year ended June 30,
|
||||||||||||
|
2014
|
2013
|
2012
|
||||||||||
|
OPERATING ACTIVITIES:
|
||||||||||||
|
Net income (loss)
|
$ | 27,530,652 | $ | 854,123 | $ | (5,211,238 | ) | |||||
|
Adjustments to reconcile net income (loss) to net cash provided by
operating activities:
|
||||||||||||
|
Charges incurred in connection with the vesting and issuance
of common stock for employee and director compensation
|
529,041 | 502,907 | 782,100 | |||||||||
|
(Gain) Loss on disposal of property and equipment
|
4,245 | (20,343 | ) | 134,350 | ||||||||
|
Non-cash interest and amortization of debt discount
|
2,095 | 53,867 | - | |||||||||
|
Bad debt expense (recoveries), net
|
134,176 | 68,615 | (48,270 | ) | ||||||||
|
Depreciation
|
5,463,985 | 3,837,174 | 2,443,054 | |||||||||
|
Amortization
|
21,953 | 742,400 | 997,900 | |||||||||
|
Change in fair value of warrant liabilities
|
(65,429 | ) | (267,928 | ) | (1,813,687 | ) | ||||||
|
Deferred income taxes, net
|
(27,301,266 | ) | 27,646 | 12,599 | ||||||||
|
Recognition of deferred gain from sale-leaseback transactions
|
(9,522 | ) | - | - | ||||||||
|
Changes in operating assets and liabilities:
|
||||||||||||
|
Accounts receivable
|
(157,071 | ) | (247,358 | ) | (758,952 | ) | ||||||
|
Finance receivables
|
52,531 | 17,729 | (61,460 | ) | ||||||||
|
Inventory
|
370,104 | 716,470 | 158,584 | |||||||||
|
Prepaid expenses and other current assets
|
(190,783 | ) | 503,937 | 431,276 | ||||||||
|
Accounts payable
|
412,664 | 1,164,804 | 498,082 | |||||||||
|
Accrued expenses
|
267,004 | (1,915,091 | ) | 2,513,898 | ||||||||
|
Income taxes payable
|
21,021 | - | - | |||||||||
|
Net cash provided by operating activities
|
7,085,400 | 6,038,952 | 78,236 | |||||||||
|
INVESTING ACTIVITIES:
|
||||||||||||
|
Purchase of property and equipment
|
(111,121 | ) | (107,351 | ) | (478,144 | ) | ||||||
|
Purchase of property for rental program
|
(10,883,473 | ) | (9,092,394 | ) | (5,754,670 | ) | ||||||
|
Proceeds from sale of rental equipment under sale-leaseback transactions
|
2,995,095 | - | - | |||||||||
|
Proceeds from sale of property and equipment
|
82,047 | 18,908 | - | |||||||||
|
Net cash used in investing activities
|
(7,917,452 | ) | (9,180,837 | ) | (6,232,814 | ) | ||||||
|
FINANCING ACTIVITIES:
|
||||||||||||
|
Net proceeds from the issuance (retirement) of common stock and
exercise of common stock warrants
|
2,272,936 | 311,177 | (41,371 | ) | ||||||||
|
Excess tax benefits from share-based compensation
|
24,847 | - | - | |||||||||
|
Proceeds from line of credit
|
2,000,000 | 3,000,000 | - | |||||||||
|
Repayment of long-term debt
|
(374,411 | ) | (614,937 | ) | (368,917 | ) | ||||||
|
Net cash provided by (used in) financing activities
|
3,923,372 | 2,696,240 | (410,288 | ) | ||||||||
|
Net increase (decrease) in cash and cash equivalents
|
3,091,320 | (445,645 | ) | (6,564,866 | ) | |||||||
|
Cash and cash equivalents at beginning of year
|
5,981,000 | 6,426,645 | 12,991,511 | |||||||||
|
Cash and cash equivalents at end of year
|
$ | 9,072,320 | $ | 5,981,000 | $ | 6,426,645 | ||||||
|
Supplemental disclosures of cash flow information
:
|
||||||||||||
|
Cash paid for interest
|
$ | 259,820 | $ | 118,934 | $ | 38,891 | ||||||
|
Depreciation expense allocated to cost of sales
|
$ | 4,880,529 | $ | 3,265,452 | $ | 1,940,179 | ||||||
|
Reclass of rental program property to inventory, net
|
$ | 33,266 | $ | 28,337 | $ | - | ||||||
|
Prepaid items financed with debt
|
$ | 101,850 | $ | 133,588 | $ | 95,263 | ||||||
|
Prepaid interest from issuance of warrants for debt costs
|
$ | - | $ | 55,962 | $ | - | ||||||
|
Equipment and software acquired under capital lease
|
$ | 325,431 | $ | 124,917 | $ | 495,955 | ||||||
|
Equipment and software financed with long-term debt
|
$ | - | $ | - | $ | 252,968 | ||||||
|
Disposal of property and equipment
|
$ | 709,638 | $ | 98,928 | $ | 652,093 | ||||||
|
Disposal of property and equipment under sale-leaseback transactions
|
$ | 1,918,920 | $ | - | $ | - | ||||||
| F-6 |
| F-7 |
| F-8 |
| F-9 |
|
June 30,
|
June 30,
|
|||||||
|
2014
|
2013
|
|||||||
|
Total finance receivables
|
$ | 472,587 | $ | 525,118 | ||||
|
Less current portion
|
119,793 | 116,444 | ||||||
|
Non-current portion of finance receivables
|
$ | 352,794 | $ | 408,674 | ||||
|
Credit Quality Indicators
|
||||
|
As of June 30, 2014
|
||||
|
Credit risk profile based on payment activity:
|
||||
|
Leases
|
||||
|
Performing
|
$ | 472,587 | ||
|
Nonperforming
|
- | |||
|
Total
|
$ | 472,587 | ||
| F-10 |
|
Age Analysis of Past Due Finance Receivables
|
||||||||||||||||||||||||
|
As of June 30, 2014
|
||||||||||||||||||||||||
| 31 – 60 | 61 – 90 |
Greater than
|
Total
|
|||||||||||||||||||||
|
Days Past
Due |
Days Past
Due |
90 Days Past
Due |
Total Past
Due |
Current
|
Finance Receivables
|
|||||||||||||||||||
|
Leases
|
$ | - | $ | 909 | $ | 378 | $ | 1,287 | $ | 471,300 | $ | 472,587 | ||||||||||||
|
Total
|
$ | - | $ | 909 | $ | 378 | $ | 1,287 | $ | 471,300 | $ | 472,587 | ||||||||||||
|
Age Analysis of Past Due Finance Receivables
|
||||||||||||||||||||||||
|
As of June 30, 2013
|
||||||||||||||||||||||||
| 31 – 60 | 61 – 90 |
Greater than
|
Total
|
|||||||||||||||||||||
|
Days Past
Due |
Days Past
Due |
90 Days Past
Due |
Total Past
Due |
Current
|
Finance Receivables
|
|||||||||||||||||||
|
Leases
|
$ | - | $ | 814 | $ | - | $ | 814 | $ | 524,304 | $ | 525,118 | ||||||||||||
|
Total
|
$ | - | $ | 814 | $ | - | $ | 814 | $ | 524,304 | $ | 525,118 | ||||||||||||
|
Useful
|
June 30,
|
|||||||||
|
Lives
|
2014
|
2013
|
||||||||
|
Computer equipment and purchased software
|
3-7 years
|
$ | 4,581,001 | $ | 4,688,104 | |||||
|
Property and equipment used for Rental Program
|
5 years
|
30,348,918 | 21,574,225 | |||||||
|
Furniture and equipment
|
3-7 years
|
681,717 | 693,554 | |||||||
|
Leasehold improvements
|
Lesser of
life or lease term
|
575,343 | 539,629 | |||||||
| 36,186,979 | 27,495,512 | |||||||||
|
Less accumulated depreciation
|
(15,048,399 | ) | (10,255,447 | ) | ||||||
| $ | 21,138,580 | $ | 17,240,065 | |||||||
|
June 30, 2014
|
||||||||||||
|
Gross
|
||||||||||||
|
Carrying
|
Accumulated
|
Net Carrying
|
||||||||||
|
Amount
|
Amortization
|
Value
|
||||||||||
|
Intangible assets:
|
||||||||||||
|
Trademarks
|
$ | 1,482,100 | $ | (1,050,000 | ) | $ | 432,100 | |||||
|
Patents
|
9,294,000 | (9,294,000 | ) | - | ||||||||
|
Total
|
$ | 10,776,100 | $ | (10,344,000 | ) | $ | 432,100 | |||||
|
June 30, 2013
|
||||||||||||
|
Gross
|
||||||||||||
|
Carrying
|
Accumulated
|
Net Carrying
|
||||||||||
|
Amount
|
Amortization
|
Value
|
||||||||||
|
Intangible assets:
|
||||||||||||
|
Trademarks
|
$ | 1,482,100 | $ | (1,050,000 | ) | $ | 432,100 | |||||
|
Patents
|
9,294,000 | (9,272,047 | ) | 21,953 | ||||||||
|
Total
|
$ | 10,776,100 | $ | (10,322,047 | ) | $ | 454,053 | |||||
| F-11 |
|
June 30,
|
June 30,
|
|||||||
|
2014
|
2013
|
|||||||
|
Accrued compensation and related sales commissions
|
$ | 545,110 | $ | 583,710 | ||||
|
Accrued professional fees
|
214,615 | 165,444 | ||||||
|
Accrued taxes and filing fees
|
640,958 | 253,527 | ||||||
|
Advanced customer billings
|
370,040 | 346,868 | ||||||
|
Accrued rent
|
155,712 | 226,582 | ||||||
|
Accrued other
|
175,538 | 258,838 | ||||||
| $ | 2,101,973 | $ | 1,834,969 | |||||
| F-12 |
As of June 30, 2014, the Company and the Bank entered into an Eighth Amendment (“Eighth Amendment”) to the Loan and Security Agreement to change the minimum Adjusted EBITDA covenant for the quarter ended June 30, 2014.
|
June 30,
|
June 30,
|
|||||||
|
2014
|
2013
|
|||||||
|
Capital lease obligations
|
$ | 414,525 | $ | 345,925 | ||||
|
Loan agreements
|
8,251 | 23,981 | ||||||
| 422,776 | 369,906 | |||||||
|
Less current portion
|
172,911 | 247,152 | ||||||
| $ | 249,865 | $ | 122,754 | |||||
|
2015
|
$ | 172,911 | ||
|
2016
|
91,003 | |||
|
2017
|
80,251 | |||
|
2018
|
56,282 | |||
|
Thereafter
|
22,329 | |||
| $ | 422,776 |
| F-13 |
|
June 30, 2014
|
Level 1
|
Level 2
|
Level 3
|
Total
|
||||||||||||
|
Cash equivalents
|
$ | - | $ | - | $ | - | $ | - | ||||||||
|
Common stock warrant liability, warrants exercisable at $2.6058 from September 18, 2011 through September 18, 2016
|
$ | - | $ | - | $ | 585,209 | $ | 585,209 | ||||||||
|
June 30, 2013
|
Level 1
|
Level 2
|
Level 3
|
Total
|
||||||||||||
|
Cash equivalents
|
$ | 192,620 | $ | - | $ | - | $ | 192,620 | ||||||||
|
Common stock warrant liability, warrants exercisable at $2.6058 from September 18, 2011 through September 18, 2016
|
$ | - | $ | - | $ | 650,638 | $ | 650,638 | ||||||||
| F-14 |
|
June 30,
|
||||||||
|
2014
|
2013
|
|||||||
|
Beginning balance
|
$ | (650,638 | ) | $ | (918,566 | ) | ||
|
Gain due to change in fair value of warrant liabilities, net
|
65,429 | 267,928 | ||||||
|
Ending balance
|
$ | (585,209 | ) | $ | (650,638 | ) | ||
| F-15 |
|
June
30,
|
||||||||
|
2014
|
2013
|
|||||||
|
Deferred
tax assets:
|
||||||||
|
Net
operating loss carryforwards
|
$ | 47,776,042 | $ | 49,534,732 | ||||
|
Deferred
research and development costs
|
710,640 | 135,189 | ||||||
|
Intangibles
|
907,274 | 1,132,471 | ||||||
|
Stock-based
compensation
|
250,426 | 230,452 | ||||||
|
Deferred
gain on assets under sale-leaseback transaction
|
460,902 | - | ||||||
|
Other
|
740,040 | 671,947 | ||||||
| 50,845,324 | 51,704,791 | |||||||
|
Deferred
tax liabilities:
|
||||||||
|
Intangibles
and goodwill
|
(67,459 | ) | (40,245 | ) | ||||
|
Fixed
Assets
|
(683,159 | ) | (585,889 | ) | ||||
|
Deferred
tax assets, net
|
50,094,706 | 51,078,657 | ||||||
|
Valuation
allowance
|
(22,833,685 | ) | (51,118,902 | ) | ||||
|
Deferred
tax assets (liabilties), net of allowance
|
27,261,021 | (40,245 | ) | |||||
|
Less
current portion
|
907,691 | - | ||||||
|
Deferred
tax assets (liabilties), non-current
|
$ | 26,353,330 | $ | (40,245 | ) | |||
| F-16 |
| F-17 |
|
Exercise
of Common Stock Warrants
|
4,309,000 | |||
|
Conversions
of Preferred Stock and cumulative Preferred Stock dividends
|
98,197 | |||
|
Issuance
under 2012 Stock Incentive Plan
|
31,484 | |||
|
Issuance
under 2013 Stock Incentive Plan
|
500,000 | |||
|
Issuance
under 2014 Stock Option Incentive Plan
|
750,000 | |||
|
Issuance
to former Chief Executive Officer upon the occurrence of a USA Transaction
|
140,000 | |||
|
Total
shares reserved for future issuance
|
5,828,681 |
| F-18 |
|
Weighted-Average
|
||||||||
|
Grant-Date
|
||||||||
|
Shares
|
Fair
Value
|
|||||||
|
Nonvested
Shares
|
||||||||
|
Nonvested
at June 30, 2011
|
187,335 | $ | 2.32 | |||||
|
Granted
|
473,285 | 1.58 | ||||||
|
Vested
|
(380,282 | ) | 1.73 | |||||
|
Forfeited
due to Separation Agreement
|
(91,667 | ) | 2.00 | |||||
|
Forfeited,
Director changes
|
(16,668 | ) | 1.71 | |||||
|
Nonvested
at June 30, 2012
|
172,003 | $ | 1.82 | |||||
|
Granted
|
156,429 | 1.45 | ||||||
|
Vested
|
(204,587 | ) | 1.72 | |||||
|
Forfeited,
Employee shares not earned
|
(26,699 | ) | 1.52 | |||||
|
Nonvested
at June 30, 2013
|
97,146 | $ | 1.52 | |||||
|
Granted
|
10,000 | 2.17 | ||||||
|
Vested
|
(55,001 | ) | 1.62 | |||||
|
Forfeited,
Director changes
|
(3,334 | ) | 0.94 | |||||
|
Forfeited,
Employee shares not earned
|
(5,000 | ) | 1.52 | |||||
|
Nonvested
at June 30, 2014
|
43,811 | $ | 1.59 | |||||
|
Exercise
|
||||||
|
Warrants
|
Price |
Expiration
|
||||
|
Outstanding
|
Per
Share
|
Date
|
||||
|
4,264,000
|
$ | 2.6058 |
September
18, 2016
|
|||
|
45,000
|
$ | 2.10 |
December
31, 2017
|
|||
|
4,309,000
|
||||||
|
Warrants
|
||||
|
Outstanding
at June 30, 2011
|
15,567,199 | |||
|
Issued
|
- | |||
|
Exercised
|
(7,317 | ) | ||
|
Expired
|
(7,514,263 | ) | ||
|
Outstanding
at June 30, 2012
|
8,045,619 | |||
|
Issued
|
45,000 | |||
|
Exercised
|
(399,597 | ) | ||
|
Expired
|
(329,314 | ) | ||
|
Outstanding
at June 30, 2013
|
7,361,708 | |||
|
Issued
|
- | |||
|
Exercised
|
(2,090,226 | ) | ||
|
Expired
|
(962,482 | ) | ||
|
Outstanding
at June 30, 2014
|
4,309,000 | |||
| F-19 |
|
Year
ended
|
||||
|
June
30, 2014
|
||||
|
Expected
volatility
|
79 | % | ||
|
Expected
life
|
7
years
|
|||
|
Expected
dividends
|
0.00 | % | ||
|
Risk-free
interest rate
|
2.22 | % | ||
| F-20 |
|
Weighted-
|
||||||||||||
|
Exercise
|
Average
|
|||||||||||
|
Options
|
Price
|
Exercise
|
||||||||||
|
Outstanding
|
Per
Share
|
Price
|
||||||||||
|
Outstanding
and exercisable at June 30, 2011
|
90,666 | $ | 7.50-8 | $ | 7.53 | |||||||
|
Granted
|
- | - | - | |||||||||
|
Expired
|
(45,333 | ) | $ | 7.50-8 | $ | 7.53 | ||||||
|
Outstanding
and exercisable at June 30, 2012
|
45,333 | $ | 7.50-8 | $ | 7.53 | |||||||
|
Granted
|
- | - | - | |||||||||
|
Expired
|
(45,333 | ) | $ | 7.50-8 | $ | 7.53 | ||||||
|
Outstanding
and exercisable at June 30, 2013
|
- | $ | - | $ | - | |||||||
|
Granted
|
120,000 | $ | 2.05 | $ | 2.05 | |||||||
|
Exercised/vested
|
- | $ | - | $ | - | |||||||
|
Expired
|
- | $ | - | $ | - | |||||||
|
Outstanding
at June 30, 2014
|
120,000 | $ | 2.05 | $ | 2.05 | |||||||
|
Weighted
Average
|
|||||||||||||||||||||||||
|
Options
|
Options
|
Exercise
Price Per
|
Remaining
Life
|
Remaining
Life
|
Intrinsic
Value-
|
||||||||||||||||||||
|
Outstanding
|
Exercisable
|
Share
|
Outstanding
|
Exercisable
|
Outstanding
|
Exercisable
|
|||||||||||||||||||
|
120,000
|
- | $ | 2.05 | 6.97 | - | - | - | ||||||||||||||||||
|
120,000
|
- | 6.97 | - | - | - | ||||||||||||||||||||
| F-21 |
|
Rental
equipment sold, cost
|
$ | 1,918,920 | ||
|
Rental
equipment sold, accumulated depreciation upon sale
|
(76,032 | ) | ||
|
Rental
equipment sold, net book value
|
1,842,888 | |||
|
Proceeds
from Sale
|
2,995,095 | |||
|
Gain
on sale of rental equipment
|
$ | 1,152,207 |
| F-22 |
|
Operating
Leases
|
Other
Operating
|
Total
Operating
|
Capital
|
|||||||||||||
|
from
Sale Leaseback
|
Leases
|
Leases
|
Leases
|
|||||||||||||
|
2015
|
$ | 988,381 | $ | 435,578 | $ | 1,423,959 | $ | 198,416 | ||||||||
|
2016
|
988,381 | 361,927 | 1,350,308 | 111,647 | ||||||||||||
|
2017
|
988,381 | 810 | 989,191 | 92,261 | ||||||||||||
|
2018
|
- | - | - | 60,585 | ||||||||||||
|
2019
|
- | - | - | 23,362 | ||||||||||||
|
Thereafter
|
- | - | - | - | ||||||||||||
|
Total
minimum lease payments
|
$ | 2,965,143 | $ | 798,315 | $ | 3,763,458 | $ | 486,271 | ||||||||
|
Less
amount representing interest
|
71,745 | |||||||||||||||
|
Present
value of net minimum lease payments
|
414,526 | |||||||||||||||
|
Less
current obligations under capital leases
|
164,660 | |||||||||||||||
|
Obligations
under capital leases, less current portion
|
$ | 249,866 | ||||||||||||||
| F-23 |
| F-24 |
| F-25 |
| 35 |
|
Name
|
Age
|
Position(s) Held
|
||
|
Deborah G. Arnold (4)
|
64
|
Director
|
||
|
Steven D. Barnhart (2)(3)
|
52
|
Director
|
||
|
Joel Brooks (1)
|
55
|
Director
|
||
|
David M. DeMedio
|
43
|
Chief Financial Officer
|
||
|
Stephen P. Herbert
|
51
|
Chief Executive Officer, Chairman of the Board of Directors
|
||
|
Albin F. Moschner(1)(3)
|
61
|
Director
|
||
|
William J. Reilly, Jr.(1)(4)
|
65
|
Director
|
||
|
William J. Schoch (4)
|
49
|
Director
|
| 36 |
| 37 |
| 38 |
|
|
●
|
19% increase in license and transaction fee revenues to $35.6 million, representing 84% of total revenues for the 2014 fiscal year;
|
|
|
●
|
18% increase in total revenues to $42.3 million;
|
|
|
●
|
Adjusted EBITDA of $6.4 million compared to Adjusted EBITDA of $5.8 million representing a 12% increase;
|
|
|
●
|
GAAP net income of $27.5 million (reflects recognition of $27.3 million of deferred tax assets) compared to a GAAP net income of $0.9 million;
|
|
|
●
|
Total connections to the Company’s cashless payment and telemetry service, ePort Connect®, grew by 24% during fiscal 2014;
|
|
|
●
|
After accrual for preferred dividends, net earnings per common share, for fiscal 2014 was $0.78 compared to a net earnings per common share of $0.01 for Fiscal 2013; and
|
|
|
|
|
●
|
Cash generated from operations was $7.1 million for fiscal 2014 compared to $6.0 million for fiscal 2013, an increase of approximately 18%.
|
| 39 |
|
●
|
PAR Technology Corp.
|
|
●
|
Kit Digital Inc.
|
|
●
|
Local.com Corp.
|
|
●
|
TransAct Technologies, Inc.
|
|
●
|
Digimarc Corp.
|
|
●
|
Immersion Corp.
|
|
●
|
Onvia Inc.
|
|
●
|
LML Payment Systems, Inc.
|
|
●
|
Broadvision, Inc.
|
|
●
|
Edgar Online, Inc.
|
|
●
|
Interphase Corp.
|
|
●
|
Innovaro, Inc.
|
|
●
|
Pay-for-performance
. For the 2014 fiscal year, our chief executive officer had approximately 53% of his total target compensation tied to our performance while our chief financial officer had approximately 47% of his total target compensation tied to our performance and individual performance goals.
|
|
●
|
Stretch performance goals
. Our performance target goals are designed to stretch individual and organizational performance.
|
|
●
|
Capped payouts under incentive plans
. Both our long-term and short-term bonus programs have maximum payout amounts in order to discourage excessive risk taking.
|
|
●
|
Stock ownership guidelines
. Our chief executive officer is required to hold common stock with a value equal to a multiple of three times his base salary and our chief financial officer is required to hold common stock with a value equal to one time his base salary.
|
|
●
|
Tax Gross-Up Provisions
. Effective September 27, 2011, the Company amended Mr. Herbert’s employment agreement to eliminate all excise tax gross-up provisions with respect to payments contingent upon a change in control.
|
|
●
|
Limited perquisites for our executives
. Perquisites are not a significant portion of our executive officers’ compensation, representing 1% of Mr. Herbert’s and 0% of Mr. DeMedio’s total target compensation.
|
|
●
|
Independent compensation consultant
. The Committee has from time to time retained an independent compensation consultant, Buck Consultants, LLC, to review the executive compensation programs and practices.
|
|
●
|
No payment on change in control without a “double trigger”
. Payments under our employment agreements require two events for vesting – both the change in control and a “good reason” for termination of employment.
|
| 40 |
|
Element
|
Key Characteristics
|
Why We Pay this Element
|
How We Determine the Amount
|
|||
|
Base Salary
|
Fixed compensation component payable in cash. Reviewed annually and adjusted when appropriate.
|
Provide a base level of competitive cash compensation for executive talent.
|
Experience, job scope, peer group, individual performance.
|
|||
|
Annual Bonus
|
Variable compensation component payable in cash or stock based on performance as compared to annually-established company and individual performance goals.
|
Motivate and reward executives for performance on key operational, financial and personal measures during the year.
|
Peer group and individual performance, with actual payouts based on the extent to which performance goals are satisfied.
|
|||
|
Long Term Incentives
|
Variable compensation component payable in restricted stock.
|
Alignment of long term interests of management and shareholders.
Retention of executive talent.
|
Peer group and individual performance, with actual payouts based on the extent to which goals are satisfied.
|
|||
|
Perquisites and Other Personal Benefits
|
Fixed compensation component to provide basic competitive benefits.
|
Provide a base level of competitive compensation for executive talent.
|
Periodic review of benefits provided generally to all employees.
|
|
Named
Executive Officer
|
Base
Salary
|
Annual
Bonus
|
Long-Term
Incentive
Compensation
|
Perquisites &
Other
Benefits
|
Total
Compensation
|
||||
|
Stephen P. Herbert
|
46%
|
7%
|
46%
|
1%
|
100%
|
||||
|
David M. DeMedio
|
53%
|
7%
|
40%
|
0%
|
100%
|
||||
|
Michael Lawlor
|
49%
|
49%
|
0%
|
2%
|
100%
|
||||
|
Cary Sagady
|
61%
|
37%
|
0%
|
2%
|
100%
|
|
Named Executive Officer
|
Base
Salary
|
Annual
Bonus
|
Long-Term
Incentive
Compensation
|
Perquisites &
Other
Benefits
|
Total
Compensation
|
||||
|
Stephen P. Herbert
|
76%
|
7%
|
15%
|
2%
|
100%
|
||||
|
David M. DeMedio
|
82%
|
6%
|
12%
|
0%
|
100%
|
||||
|
Michael Lawlor
|
88%
|
8%
|
0%
|
4%
|
100%
|
||||
|
Cary Sagady
|
93%
|
3%
|
0%
|
4%
|
100%
|
| 41 |
|
|
Threshold Performance
|
Target Performance
|
Distinguished Performance
|
|||||||||
|
Stephen P. Herbert
|
$
|
-
|
$
|
51,184
|
$
|
102,368
|
||||||
|
David M. DeMedio
|
$
|
-
|
$
|
29,283
|
$
|
58,566
|
||||||
|
|
Threshold
Performance
|
Target
Performance
|
Distinguished Performance
|
|||||||||
|
Stephen P. Herbert
|
$
|
-
|
$
|
341,277
|
$
|
682,554
|
||||||
|
David M. DeMedio
|
$
|
-
|
$
|
175,699
|
$
|
351,396
|
||||||
|
Number of
Shares |
Value of Shares
as of June 30, 2014 |
|||||||
|
Stephen P. Herbert
|
36,649
|
$
|
76,776
|
|||||
|
David M. DeMedio
|
19,161
|
$
|
39,532
|
|||||
| 42 |
| 43 |
|
Fiscal
|
Stock
|
All Other
|
||||||||||||||||||||
|
Name and Principal Position
|
Year
|
Salary
|
Bonus (2)
|
Awards (3)
|
Compensation (4)
|
Total
|
||||||||||||||||
|
Stephen P. Herbert
|
2014
|
$ | 341,227 | $ | 29,673 | $ | 341,227 | $ | 10,000 | $ | 695,127 | |||||||||||
|
Chief Executive Officer, President
|
2013
|
$ | 341,227 | $ | 51,250 | $ | 111,399 | $ | 10,000 | $ | 513,876 | |||||||||||
|
& Chairman of the Board (1)
|
2012
|
$ | 332,246 | $ | 40,000 | $ | 391,300 | $ | 18,748 | $ | 782,294 | |||||||||||
|
David M. DeMedio
|
2014
|
$ | 237,875 | $ | 17,238 | $ | 213,709 | $ | - | $ | 468,822 | |||||||||||
|
Chief Financial Officer
|
2013
|
$ | 234,265 | $ | - | $ | 4,024 | $ | 4,813 | $ | 243,102 | |||||||||||
|
2012
|
$ | 219,615 | $ | - | $ | 134,542 | $ | 18,190 | $ | 372,347 | ||||||||||||
|
Cary Sagady
|
2014
|
$ | 200,300 | $ | 7,109 | $ | - | $ | 7,721 | $ | 215,130 | |||||||||||
|
Sr. VP Product Management &
|
2013
|
$ | 198,200 | $ | 42,063 | $ | - | $ | 12,100 | $ | 252,363 | |||||||||||
|
Network Solutions
|
2012
|
$ | 193,066 | $ | 64,680 | $ | - | $ | 16,016 | $ | 273,762 | |||||||||||
|
Michael Lawlor
|
2014
|
$ | 179,800 | $ | 15,953 | $ | - | $ | 8,670 | $ | 204,423 | |||||||||||
|
VP of Sales & Business
|
2013
|
$ | 179,800 | $ | 62,930 | $ | - | $ | 10,000 | $ | 252,730 | |||||||||||
|
Development
|
2012
|
$ | 173,745 | $ | 96,320 | $ | 36,200 | $ | 15,197 | $ | 321,462 | |||||||||||
|
(1)
|
Mr. Herbert was formerly the Company’s President and Chief Operating Officer through October 4, 2011 and interim Chairman and Chief Executive Officer from October 5 through November 28, 2011. Mr. Herbert was named Chairman of the Board, Chief Executive Officer and President on November 30, 2011.
|
|
(2)
|
Represents cash bonuses earned upon such person’s performance during the fiscal year or upon the attainment by the Company of certain target goals.
|
|
(3)
|
In
accordance with FASB ASC Topic 718, the price of our common stock on the grant date equals the grant date fair value of these
stock awards. For fiscal year 2014, represents (i) 188,523 shares with a value of $341,227 that would have
been earned by Mr. Herbert under the 2014 LTI Stock Plan if all of the target goals had been achieved, (ii)
21,000 shares with a value of $38,010 granted to Mr. DeMedio as a bonus on November 7, 2013, and (iii) 97,071
shares with a value of $175,699 that would have been earned by Mr. DeMedio under the 2014 LTI Stock Plan if all of the
target goals had been achieved. Based on the actual financial results, Mr. Herbert was awarded 36,649 shares with a grant date
value of $66,335 and Mr. DeMedio was awarded 19,161 shares with a grant date value of $34,861 under the 2014 LTI Stock
Plan. If all of the maximum target levels had been achieved under the 2014 LTI Stock Plan, Mr. Herbert would have earned 377,102 shares with a grant date value of $682,554, and Mr. DeMedio would have earned 194,141 shares with a grant date value of $351,396. The shares earned under the 2014 LTI Stock Plan vest as follows: one-third on June 30, 2014; one-third on June 30, 2015; and one-third on June 30, 2016.
|
|
(4)
|
During the 2014 fiscal year, represents matching 401(k) contributions for Messrs. Herbert, Lawlor and Sagady.
|
|
Estimated Future Payouts Under
Non-Equity Incentive Plan Awards (1) |
Estimated Future Payouts Under
Equity Incentive Plan Awards (2) |
All Other
Stock Awards: Number of Shares of Stock or Units (3) |
Grant Date
Fair Value of Stock Awards (4) |
|||||||||||||||||||||||||||||||
|
Name
|
Grant Date
|
Threshold
($) |
Target
($) |
Maximum
($) |
Threshold
(#) |
Target
(#) |
Maximum
(#) |
Units (#)
|
Awards ($)
|
|||||||||||||||||||||||||
|
Stephen P. Herbert
|
- | 51,184 | 102,368 | - | - | - | - | $ | - | |||||||||||||||||||||||||
|
11/7/2013
|
- | - | - | - | 188,523 | 377,102 | $ | 341,227 | ||||||||||||||||||||||||||
|
David M. DeMedio
|
- | 29,283 | 58,566 | - | - | - | - | $ | - | |||||||||||||||||||||||||
|
11/7/2013
|
- | - | - | - | 97,071 | 194,141 | - | $ | 175,699 | |||||||||||||||||||||||||
|
11/7/2013
|
- | - | - | - | - | - | 21,000 | $ | 38,010 | |||||||||||||||||||||||||
|
Cary Sagady
|
- | 120,000 | - | - | - | - | - | $ | - | |||||||||||||||||||||||||
|
Michael Lawlor
|
- | 179,800 | - | - | - | - | - | $ | - | |||||||||||||||||||||||||
| 44 |
|
(1)
|
Represents
awards granted to Messrs. Herbert and DeMedio by the Board of Directors under the 2014 STI Plan. The plan provides
for the award of a cash bonus if all targets are achieved as follows: Mr. Herbert - $51,184 and Mr. DeMedio - $29,283.
If none of the minimum, threshold targets are achieved, the executive officers would not earn a cash bonus. If all of the maximum
distinguished target goals are achieved, the executive officers would earn a cash bonus as follows: Mr. Herbert – $102,368
and Mr. DeMedio – $58,566. Mr. Herbert was awarded $29,673 and Mr. DeMedio was awarded $17,238 under the plan.
Represents cash bonus opportunity for Messrs. Sagady and Lawlor if all of the target goals were achieved. Mr. Sagady was awarded $7,109 and Mr. Lawlor was awarded $15,953
|
|
|
(2)
|
Represents
awards granted by the Board of Directors under the 2014 LTI Stock Plan. The plan provides for the award of shares having the following
value if all targets are achieved; Mr. Herbert - $341,227 and Mr. DeMedio - $175,699. If none of the minimum threshold
year-over-year percentage target goals are achieved, the executive officers would not be awarded any shares; and if all maximum
distinguished targets are achieved the executive officers would be awarded shares having the following value: Mr. Herbert
- $682,454 and Mr. DeMedio - $356,812. The number of shares in the table above represents the total dollar value of the award
divided by the grant date value of the share. Mr. Herbert was awarded 36,649 shares and Mr. DeMedio was awarded 19,161 shares
under the plan of which one-third vested on June 30, 2014, one-third vests on June 30, 2015 and one-third vests on June
30, 2016.
|
|
(3)
|
Represents 21,000 shares of common stock granted to Mr. DeMedio as a bonus in recognition of his performance during the 2013 fiscal year.
|
|
(4)
|
Amount
represents the grant date fair value determined in accordance with ASC 718. For Mr. Herbert, represents the grant
date value of 188,523 shares which would have been awarded to him if the target goals had been achieved under the 2014 LTI
Stock Plan. For Mr. DeMedio, represents the grant date value of 97,071 shares which would have been awarded to him if the
target goals had been achieved under the 2014 LTI Stock Plan as well as the grant date value of 21,000 shares awarded to him
on November 7, 2013. Based on the actual financial results, Mr. Herbert was awarded 36,649 shares with a grant date value of
$66,335 and Mr. DeMedio was awarded 19,161 shares with a grant date value of $34,861 under the 2014 LTI Stock Plan.
|
|
Option Awards
|
Stock Awards
|
||||||||||||||||
|
Name
|
Number of Securities Underlying Unexercised Options(#) Exercisable
|
Option
Exercise Price($) |
Option Expiration
Date |
Number of
Shares or Units of Stock That Have Not Vested (#) |
Market
Value of Shares or Units of Stock That Have Not Vested($) |
||||||||||||
|
Stephen P. Herbert
|
- | $ | - | 48,241 | (1) | $ | 101,789 | ||||||||||
|
David M. DeMedio
|
- | $ | - | 12,774 | (1) | $ | 26,953 | ||||||||||
|
Cary Sagady
|
- | $ | - | - | $ | - | |||||||||||
|
Michael Lawlor
|
- | $ | - | - | $ | - | |||||||||||
|
(1)
|
Reflects 24,432 shares for Mr. Herbert and 12,774 shares for Mr. DeMedio awarded under the 2014 LTI Stock Plan. Shares vest one-half on June 30, 2015 and one-half on June 30, 2016. The closing market price on June 30, 2014, or $2.11 per share, was used in the calculation of market value. Reflects 23,809 shares granted to Mr. Herbert under a long term incentive plan on September 5, 2012. The shares vest any time prior to September 5, 2015, and at such time the Company’s common stock would close above $2.50 per share for thirty consecutive trading days. The closing market price on June 30, 2014, or $2.11 per share, was used in the calculation of market value
|
|
Option Awards
|
Stock Awards
|
|||||||||||||||
|
Number of
|
Number of
|
|||||||||||||||
|
Shares
|
Value
|
Shares
|
Value
|
|||||||||||||
|
Acquired on
|
Realized on
|
Acquired on
|
Realized on
|
|||||||||||||
|
Name
|
Exercise (#)
|
Exercise ($)
|
Vesting (#)
|
Vesting ($)
|
||||||||||||
|
Stephen P. Herbert (1)
|
- | $ | - | 33,334 | $ | 59,001 | ||||||||||
|
David M. DeMedio (2)
|
- | $ | - | 29,334 | $ | 52,761 | ||||||||||
|
Cary Sagady
|
- | $ | - | - | $ | - | ||||||||||
|
Michael Lawlor
|
- | $ | - | - | $ | - | ||||||||||
| 45 |
|
(1)
|
Represents 33,334 shares valued at $1.77 per share that vested on September 27, 2013.
|
|
(2)
|
Represents 8,334 shares valued at $1.77 per share that vested on September 27, 2013 and 21,000 shares valued at $1.81 that vested on November 7, 2013.
|
| 46 |
|
Name
|
Fees Earned
or Paid in Cash($)(2) |
Stock
Awards ($) |
Option
Awards ($)(3) |
Total($)
|
||||||||||||
|
Deborah G. Arnold
|
$ | 30,000 | $ | - | $ | 29,800 | $ | 59,800 | ||||||||
|
Steven D. Barnhart
|
$ | 70,000 | $ | - | $ | 29,800 | $ | 99,800 | ||||||||
|
Joel Brooks
|
$ | 30,000 | $ | - | $ | 29,800 | $ | 59,800 | ||||||||
|
Albin F. Moschner
|
$ | 30,000 | $ | - | $ | 29,800 | $ | 59,800 | ||||||||
|
Frank A. Petito, III (1)
|
$ | 20,000 | $ | - | $ | - | $ | 20,000 | ||||||||
|
Jack E. Price
|
$ | 30,000 | $ | - | $ | - | $ | 30,000 | ||||||||
|
William J. Reilly, Jr.
|
$ | 40,000 | $ | - | $ | 29,800 | $ | 69,800 | ||||||||
|
William J. Schoch
|
$ | 30,000 | $ | - | $ | 29,800 | $ | 59,800 | ||||||||
| 47 |
|
(1)
|
Resigned as a director effective February 27, 2014.
|
|
(2)
|
During fiscal year ended June 30, 2014, we paid the following fees:
|
|
●
|
Director: each Director received $20,000. Mr. Petito received $13,333.
|
|
●
|
Lead Independent Director: Mr. Barnhart received $40,000.
|
|
●
|
Audit Committee: each of Messrs. Brooks, Price and Reilly received $10,000.
|
|
●
|
Compensation Committee: each of Messrs. Barnhart and Moschner received $10,000. Mr. Petito received $6,667.
|
|
●
|
Nominating and Corporate Governance Committee: each of Ms. Arnold, Messrs. Reilly and Schoch received $10,000.
|
|
●
|
Ms. Arnold and Messrs. Moschner and Schoch each elected to receive 15,980 shares for $30,000 of fees; Mr. Barnhart elected to receive 37,287 shares for $70,000 of fees; Mr. Petito elected to receive 11,217 shares for $20,000 of fees; and Mr. Reilly elected to receive 16,475 shares for $30,000 of fees.
|
|
(3)
|
Represents the fair value of options granted to each non-employee director on June 19, 2014 pursuant to our 2014 Incentive Stock Option Plan computed in accordance with FASB ASC Topic 718. Each non-employee director was granted options to purchase up to 20,000 shares of Common Stock which vest as follows:
one-third on the first anniversary of the grant date; one-third on the second anniversary of the grant date; and one-third on the third anniversary of the grant date.
|
| 48 |
|
Name and Address of Beneficial Owner(1)
|
Number of Shares of
Common Stock
Beneficially
Owned(2)
|
Percent of
Class
|
||||||
|
Deborah G. Arnold
9704 Clos du Lac Circle
Loomis, California 95630
|
43,416 | * | ||||||
|
Steven D. Barnhart
1 W. Onwentsia Road
Lake Forest, Illinois 60045
|
240,197 | * | ||||||
|
Joel Brooks
303 George Street, Suite 140
New Brunswick, New Jersey 08901
|
35,000 | * | ||||||
|
David M. DeMedio
100 Deerfield Lane, Suite 140
Malvern, Pennsylvania 19355
|
130,675 | * | ||||||
|
Stephen P. Herbert
100 Deerfield Lane, Suite 140
Malvern, Pennsylvania 19355
|
346,656 | (3) | * | |||||
|
Michael Lawlor
100 Deerfield Lane, Suite 140
Malvern, Pennsylvania 19355
|
35,552 | * | ||||||
|
Albin F. Moschner
1022 Aynsley Avenue
Lake Forest, Illinois 60045
|
483,172 | (4) | 1.36 | % | ||||
|
William J. Reilly, Jr.
1280 South Concord Road
West Chester, Pennsylvania 19382
|
42,080 | (5) | * | |||||
|
Cary Sagady
100 Deerfield Lane, Suite 140
Malvern, Pennsylvania 19355
|
5,050 | * | ||||||
|
William J. Schoch
300 Montgomery Street, #400
San Francisco, California 94104
|
41,958 | * | ||||||
|
All Directors and Executive Officers
As a Group (8 persons)
|
1,363,154 | 3.83 | % | |||||
|
*
|
Less than one percent (1%)
|
|
(1)
|
Beneficial ownership is determined in accordance with the rules of the Securities and Exchange Commission and derives from either voting or investment power with respect to securities. Shares of Common Stock issuable upon conversion of the Series A Preferred Stock, or shares of Common Stock issuable upon exercise of warrants currently exercisable, or exercisable within sixty days of September 5, 2014, are deemed to be beneficially owned for purposes hereof.
|
|
(2)
|
The percentage of common stock beneficially owned is based on 35,603,271 shares outstanding as of September 5, 2014.
|
|
(3)
|
Includes 32,010 shares of common stock beneficially owned by Mr. Herbert’s child, 27,440 shares of common stock beneficially owned by his spouse. Includes 23,809 shares which vest upon the attainment of at least $2.50 per share closing price for thirty consecutive trading days at any time prior to September 5, 2015.
|
|
(4)
|
Includes 1,163 shares underlying preferred stock.
|
|
(5)
|
Includes 100 shares of common stock beneficially owned by Mr. Reilly’s child.
|
| 49 |
| 50 |
|
Fiscal
|
Fiscal
|
|||||||
|
2014
|
2013
|
|||||||
|
Audit Fees
|
$ | 225,530 | $ | 211,186 | ||||
|
Audit-Related Fees
|
5,800 | 10,905 | ||||||
|
Tax Fees
|
9,500 | - | ||||||
|
All Other Fees
|
- | - | ||||||
|
Total
|
$ | 240,830 | $ | 222,091 | ||||
| 51 |
|
Exhibit
Number
|
Description
|
|
|
3.1
|
Amended and Restated Articles of Incorporation of the Company filed January 26, 2004 (Incorporated by reference to Exhibit 3.1.20 to Form 10-QSB filed on February 12, 2004).
|
|
|
3.1.1
|
First Amendment to Amended and Restated Articles of Incorporation of the Company filed on March 17, 2005 (Incorporated by reference to Exhibit 3.1.1 to Form S-1 Registration Statement No. 333-124078).
|
|
|
3.1.2
|
Second Amendment to Amended and Restated Articles of Incorporation of the Company filed on December 13, 2005 (Incorporated by reference to Exhibit 3.1.2 to Form S-1 Registration Statement No. 333-130992).
|
|
|
3.1.3
|
Third Amendment to Amended and Restated Articles of Incorporation of the Company filed on February 7, 2006 (Incorporated by reference to Exhibit 3.1.3 to Form 10-K filed on September 30, 2013).
|
|
|
3.1.4
|
Fourth Amendment to Amended and Restated Articles of Incorporation of the Company filed on July 25, 2007. (Incorporated by reference to Exhibit 3.1.3 to Form 10-K filed September 23, 2008).
|
|
|
3.1.5
|
Fifth Amendment to Amended and Restated Articles of Incorporation of the Company filed on March 6, 2008. (Incorporated by reference to Exhibit 3.1.4 to Form 10-K filed September 23, 2008).
|
|
|
3.2
|
Amended and Restated By-Laws of the Company dated as of April 24, 2014 (Incorporated by reference to Exhibit 3(i) to Form8-K filed on April 30, 2014).
|
|
|
4.1
|
Warrant dated January 1, 2013 in favor of Avidbank Holdings, Inc. (Incorporated by reference to Exhibit 4.1 to Form 8-K filed on April 19, 2013).
|
|
10.1
|
Agreement of Lease between Deerfield Corporate Center 1 Associates LP, as landlord, and the Company, as tenant, dated March 2003 (Incorporated by reference to Exhibit 10.22 to Form 10-KSB filed on September 28, 2004).
|
|
|
10.2
|
Amendment to Office Space Lease dated as of April 1, 2005 by and between the Company and Deerfield Corporate Center Associates, LP. (Incorporated by reference to Exhibit 10.19.1 to Form S-1 Registration Statement No. 333-124078).
|
|
|
10.3
|
Employment and Non-Competition Agreement between the Company and David M. DeMedio dated April 12, 2005 (Incorporated by reference to Exhibit 10.22 to Form S-1 Registration Statement No. 333-124078).
|
|
|
10.4
|
First Amendment to Employment and Non-Competition Agreement between the Company and David M. DeMedio dated May 11, 2006 (Incorporated by reference to Exhibit 10.3 to Form 10-Q filed on May 15, 2006).
|
|
|
|
||
|
10.5
|
USA Technologies, Inc. 2013 Stock Incentive Plan (Incorporated by reference to Exhibit 10.6 to Form 10-K filed on September 30, 2013).
|
|
|
10.6
|
Second Amendment to Employment and Non-Competition Agreement dated March 13, 2007, between the Company and David M. DeMedio (Incorporated by reference to Exhibit 10.34 to Form S-1 filed April 12, 2007).
|
|
|
10.7
|
Form of Indemnification Agreement between the Company and each of its officers and Directors (Incorporated by reference to Exhibit 10.1 to Form 10-Q filed May 14, 2007).
|
|
|
10.8
|
Third Amendment to Employment and Non-Competition Agreement between the Company and David M. DeMedio dated September 22, 2008. (Incorporated by reference to Exhibit 10.29 to Form 10-K filed September 24, 2008).
|
|
|
10.9
|
Promotional Agreement between the Company and Visa U.S.A. Inc., dated October 12, 2011 (Portions of this exhibit were redacted pursuant to a confidential treatment request) (Incorporated by reference to Exhibit 10.1 to Post-Effective Amendment No.4 to Form S-1 Registration Statement No. 333-165516).
|
|
|
10.10
|
First Amendment to Visa Promotional Agreement between the Company and Visa U.S.A. Inc. dated as of October 9, 2012 (Portions of this exhibit were redacted pursuant to a confidential treatment request) (Incorporated by reference to Exhibit 10.32 to Post-Effective Amendment No.6 to Form S-1 Registration Statement No. 333-165516).
|
|
|
10.11
|
Letter from the Company to David M. DeMedio dated September 24, 2009. (Incorporated by reference to Exhibit 10.32 to Form 10-K filed September 25, 2009).
|
|
|
10.12
|
Amended and Restated Employment and Non-Competition Agreement between the Company and Stephen P. Herbert dated November 30, 2011. (Incorporated by reference to Exhibit 10.1 to Form 8-K filed December 5, 2011).
|
|
10.13
|
Fifth Amendment to Employment and Non-Competition Agreement dated as of July 1, 2011 between the Company and David M. DeMedio. (Incorporated by reference to Exhibit 10.31 to Form 10-K filed September 27, 2011).
|
|
|
10.14
|
Sixth Amendment to Employment and Non-Competition Agreement dated September 27, 2011 between the Company and David M. DeMedio. (Incorporated by reference to Exhibit 10.32 to Form 10-K filed September 27, 2011).
|
|
|
10.15
|
Employment and Non-Competition Agreement dated July 2, 2008 between the Company and Cary Sagady (Incorporated by reference to Exhibit 10.21 to Form 10-K filed on September 30, 2013).
|
|
|
10.16
|
Employment and Non-Competition Agreement dated June 7, 2010 between the Company and Michael Lawlor (Incorporated by reference to Exhibit 10.22 to Form 10-K filed on September 30, 2013).
|
|
|
10.17
|
First Amendment to Employment and Non-competition Agreement dated April 27, 2012 between the Company and Michael Lawlor (Incorporated by reference to Exhibit 10.23 to Form 10-K filed on September 30, 2013).
|
| 52 |
|
10.18
10.19
|
Second Amendment to Office Space Lease dated as of November 17, 2010 by and between the Company and Liberty Malvern, LP. (Incorporated by reference to Exhibit 10.2 to Form 10-Q filed on January 20, 2011).
USA
Technologies, Inc. 2014 Stock Option Incentive Plan. (Incorporated by reference to Appendix A to the Company’s Definitive
Proxy Statement on form DEF 14A filed on May 15, 2014).
|
|
|
10.20
|
Loan and Security Agreement between the Company and Avidbank Corporate Finance, a division of Avidbank, dated as of June 21, 2012 (Incorporated by reference to Exhibit 10.40 to Form 10-K filed on September 25, 2012).
|
|
|
10.21
|
First Amendment to Loan and Security Agreement dated as of January 1, 2013 between the Company and Avidbank Corporate Finance, a division of Avidbank (Incorporated by reference to Exhibit 10.1 to Form 8-K filed on April 18, 2013).
|
|
|
10.22
|
Second Amendment to Loan and Security Agreement dated as of April 2, 2013 between the Company and Avidbank Corporate Finance, a division of Avidbank (Incorporated by reference to Exhibit 10.2 to Form 8-K filed on April 18, 2013).
|
|
|
10.23
|
Third Amendment to Loan and Security Agreement dated as of April 11, 2013 between the Company and Avidbank Corporate Finance, a division of Avidbank (Incorporated by reference to Exhibit 10.3 to Form 8-K filed on April 18, 2013).
|
|
|
10.24
|
Fourth Amendment to Loan and Security Agreement dated as of April 29, 2013 between the Company and Avidbank Corporate Finance, a division of Avidbank (Incorporated by reference to Exhibit 10.1 to Form 10-Q filed on May 14, 2013)
|
|
|
10.25
|
Fifth Amendment to Loan and Security Agreement dated as of September 26, 2013 between the Company and Avidbank Corporate Finance, a division of Avidbank
(Incorporated by reference to Exhibit 10.30 to Form 10-K filed September 30, 2013).
|
|
| 10.26 | Intellectual Property Security Agreement between the Company and Avidbank Corporate Finance, a division of Avidbank, dated as of June 21, 2012 (Incorporated by reference to Exhibit 10.41 to Form 10-K filed on September 25, 2012). | |
| 10.27 | Seventh Amendment to Employment and Non-Competition Agreement dated as of November 7, 2013 between the Company and David M. DeMedio. (Incorporated by reference to Exhibit 10.1 to Form 10-Q filed November 13, 2013). | |
| 10.28** | Sixth Amendment to Loan and Security Agreement dated as of May 15, 2014 between the Company and Avidbank Corporate Finance, a division of Avidbank . | |
| 10.29** | Seventh Amendment to Loan and Security Agreement dated as of June 17, 2014 between the Company and Avidbank Corporate Finance, a division of Avidbank. | |
| 10.30** | Eighth Amendment to Loan and Security Agreement dated as of June 30, 2014 between the Company and Avidbank Corporate Finance, a division of Avidbank. | |
| 10.31** | Master Lease Agreement by and between the Company and Varilease Finance, Inc. as of June 26, 2014 | |
| 10.32** |
Sale Leaseback Agreement and Schedule No. 1 by and between the Company and Varilease Finance, Inc. as of June 26, 2014.
|
|
| 10.33** | Sale Leaseback Agreement and Schedule No. 2 by and between the Company and Varilease Finance, Inc. as of June 26, 2014. | |
| 10.34** | Sale Leaseback Agreement and Schedule No. 3 by and between the Company and Varilease Finance, Inc. as of June 26, 2014. | |
| 10.35** | Sale Leaseback Agreement and Schedule No. 4 by and between the Company and Varilease Finance, Inc. as of June 26, 2014. | |
| 10.36** | Sale Leaseback Agreement and Schedule No. 5 by and between the Company and Varilease Finance, Inc. as of June 26, 2014. | |
| 10.37** | Sale Leaseback Agreement and Schedule No. 6 by and between the Company and Varilease Finance, Inc. as of June 26, 2014. | |
| 10.38** | Amendment No. 1 to Schedule No. 1 to Sale Leaseback Agreement by and between the Company and Varilease Finance, Inc. as of July 9, 2014 | |
| 10.39** | Amendment No. 1 to Schedule No. 2 to Sale Leaseback Agreement by and between the Company and Varilease Finance, Inc. as of July 9, 2014 | |
| 10.40** | Amendment No. 1 to Schedule No. 3 to Sale Leaseback Agreement by and between the Company and Varilease Finance, Inc. as of July 25, 2014 | |
| 10.41** | Amendment No. 1 to Schedule No. 4 to Sale Leaseback Agreement by and between the Company and Varilease Finance, Inc. as of July 29, 2014 | |
| 10.42** | Amendment No. 1 to Schedule No. 5 to Sale Leaseback Agreement by and between the Company and Varilease Finance, Inc. as of July 30, 2014 | |
|
10.43**
|
Amendment No. 1 to Schedule No. 6 to Sale Leaseback Agreement by and between the Company and Varilease Finance, Inc. as of August 1, 2014
|
|
|
21
|
List of significant subsidiaries of the Company (Incorporated by reference to Exhibit 21 to Form S-1 filed on March 16, 2010).
|
|
|
23.1**
|
Consent of McGladrey LLP, Independent Registered Public Accounting Firm.
|
|
|
31.1**
|
Certifications of Chief Executive Officer pursuant to Rule 13a-14(a) under the Securities Exchange Act of 1934.
|
|
|
31.2**
|
Certifications of Chief Financial Officer pursuant to Rule 13a-14(a) under the Securities Exchange Act of 1934.
|
|
|
32**
|
Certifications by the Chief Executive Officer and Chief Financial Officer pursuant to 18 USC Section 1350, as adopted pursuant to Section 906 of the Sarbanes-Oxley Act of 2002.
|
|
|
**
|
Filed herewith.
|
| 53 |
|
Deductions
|
||||||||||||||||
|
uncollectible
|
||||||||||||||||
|
Balance at
|
Additions
|
receivables
|
Balance
|
|||||||||||||
|
beginning
|
charged to
|
written off, net
|
at end
|
|||||||||||||
|
ACCOUNTS RECEIVABLE
|
of period
|
earnings
|
of recoveries
|
of period
|
||||||||||||
|
June 30, 2014
|
$ | 18,000 | $ | 94,000 | $ | 49,000 | $ | 63,000 | ||||||||
|
June 30, 2013
|
$ | 25,000 | $ | 69,000 | $ | 76,000 | $ | 18,000 | ||||||||
|
June 30, 2012
|
$ | 113,000 | $ | (46,000 | ) | $ | 42,000 | $ | 25,000 | |||||||
|
Balance at
|
Additions
|
Deductions,
|
Balance
|
|||||||||||||
|
beginning
|
charged to
|
Shrinkage and
|
at end
|
|||||||||||||
|
INVENTORY
|
of period
|
earnings
|
obsolescence
|
of period
|
||||||||||||
|
June 30, 2014
|
$ | 727,000 | $ | 164,000 | $ | 126,000 | $ | 765,000 | ||||||||
|
June 30, 2013
|
$ | 712,000 | $ | 135,000 | $ | 120,000 | $ | 727,000 | ||||||||
|
June 30, 2012
|
$ | 628,000 | $ | 136,000 | $ | 52,000 | $ | 712,000 | ||||||||
| 54 |
|
USA TECHNOLOGIES, INC.
|
||
|
By: /s/ Stephen P. Herbert
|
||
|
Stephen P. Herbert, Chairman
|
||
|
and Chief Executive Officer
|
|
SIGNATURES
|
TITLE
|
DATE
|
||
|
/s/ Stephen P. Herbert
|
Chairman of the Board of Directors
|
September 29, 2014
|
||
|
Stephen P. Herbert
|
and Chief Executive Officer
|
|||
|
(Principal Executive Officer)
|
||||
|
/s/ David M. DeMedio
|
Chief Financial Officer (Principal
|
September 29, 2014
|
||
|
David M. DeMedio
|
Accounting Officer)
|
|||
|
/s/ Deborah G. Arnold
|
Director
|
September
24, 2014
|
||
|
Deborah G. Arnold
|
||||
|
/s/ Steven D. Barnhart
|
Director
|
September
25, 2014
|
||
|
Steven D. Barnhart
|
||||
|
/s/ Joel Brooks
|
Director
|
September 26, 2014
|
||
|
Joel Brooks
|
||||
|
/s/ Albin F. Moschner
|
Director
|
September 26, 2014
|
||
|
Albin F. Moschner
|
||||
|
/s/ William J. Reilly, Jr.
|
Director
|
September 26, 2014
|
||
|
William J. Reilly, Jr.
|
||||
|
/s/ William J. Schoch
|
Director
|
September
25, 2014
|
||
|
William J. Schoch
|
| 55 |