CUSTOMERS BANCORP, INC.
10-Ks and 10-Qs
|
|
|
|
|
|
|
|
|
|
|
|
|
|
|
|
|
|
|
|
|
|
|
|
|
|
|
|
|
|
|
|
|
|
|
|
|
|
|
|
|
UNITED STATES
SECURITIES AND EXCHANGE COMMISSION
WASHINGTON, DC 20549
________________________________________
FORM 10-K
________________________________________
ANNUAL REPORT PURSUANT TO SECTION 13 OR 15(d)
OF THE SECURITIES EXCHANGE ACT OF 1934
For the fiscal year ended
December 31, 2016
001-35542
(Commission File Number)
________________________________________

(Exact name of registrant as specified in its charter)
________________________________________
|
Pennsylvania
|
|
27-2290659
|
|
(State or other jurisdiction of
incorporation or organization)
|
|
(I.R.S. Employer
Identification Number)
|
1015 Penn Avenue
Suite 103
Wyomissing PA 19610
(Address of principal executive offices)
(610) 933-2000
(Registrants telephone number, including area code)
N/A
Securities registered pursuant to Section 12(b) of the Act:
|
Title of Each Class
|
|
Name of Each Exchange on which Registered
|
|
Voting Common Stock, par value $1.00 per share
|
|
New York Stock Exchange
|
|
6.375% Senior Notes due 2018
|
|
New York Stock Exchange
|
|
Fixed-to-Floating Rate Non-Cumulative Perpetual
Preferred Stock, Series C, par value $1.00 per share
|
New York Stock Exchange
|
|
|
Fixed-to-Floating Rate Non-Cumulative Perpetual
Preferred Stock, Series D, par value $1.00 per share
|
New York Stock Exchange
|
|
|
Fixed-to-Floating Rate Non-Cumulative Perpetual
Preferred Stock, Series E, par value $1.00 per share |
New York Stock Exchange
|
|
|
Fixed-to-Floating Rate Non-Cumulative Perpetual
Preferred Stock, Series F, par value $1.00 per share |
New York Stock Exchange
|
|
Securities registered pursuant to Section 12(g) of the Act: None
________________________________________
Indicate by check mark whether the registrant is a well-known seasoned issuer, as defined in Rule 405 of the Securities Act. Yes
¨
No
x
Indicate by check mark whether the registrant is not required to file reports pursuant to Section 13 or Section 15(d) of the Act. Yes
¨
No
x
Indicate by check mark whether the registrant (1) has filed all reports required to be filed by Section 13 or 15(d) of the Securities Exchange Act of 1934 during the preceding 12 months (or for such shorter period that the registrant was required to file such reports), and (2) has been subject to such filing requirements for the past 90 days. Yes
x
No
¨
Indicate by check mark whether the registrant has submitted electronically and posted on its corporate Web site, if any, every Interactive Data File required to be submitted and posted pursuant to Rule 405 of Regulation S-T (§232.405 of this chapter) during the preceding 12 months (or for such shorter period that the registrant was required to submit and post such files). Yes
x
No
¨
Indicate by check mark if disclosure of delinquent filers pursuant to Item 405 of Regulation S-K is not contained herein, and will not be contained, to the best of registrant’s knowledge, in definitive proxy or information statements incorporated by reference in Part III of this Form 10-K or any amendment to this Form 10-K.
¨
Indicate by check mark whether the registrant is a large accelerated filer, an accelerated filer, a non-accelerated filer, or a smaller reporting company. See the definitions of “large accelerated filer,” and “smaller reporting company” in Rule 12b-2 of the Exchange Act. (Check One):
|
Large accelerated filer
|
|
¨
|
Accelerated filer
|
|
x
|
|
Non-accelerated filer
|
|
¨
|
Smaller reporting company
|
|
¨
|
Indicate by check mark whether the registrant is a shell company (as defined in Rule 12b-2 of the Act). Yes
¨
No
x
The aggregate market value of common stock held by non-affiliates of the registrant was approximately
$638,256,138
as of June 30, 2016, based upon the closing price quoted on the New York Stock Exchange for such date. Shares of common stock held by each executive officer and director have been excluded because such persons may under certain circumstances be deemed to be affiliates. This determination of executive officer or affiliate status is not necessarily a conclusive determination for other purposes.
On
February 28, 2017
,
30,469,997
shares of Voting Common Stock were issued and outstanding.
DOCUMENTS INCORPORATED BY REFERENCE
Portions of the registrant’s definitive proxy statement to be delivered to shareholders in connection with the Annual Meeting of Shareholders to be held on or about
May 31, 2017
are incorporated by reference into Part III of this Annual Report.
INDEX
|
|
|
PAGE
|
|
Item 1.
|
||
|
Item 1A.
|
||
|
Item 1B.
|
||
|
Item 2.
|
||
|
Item 3.
|
||
|
Item 4.
|
||
|
Item 5.
|
||
|
Item 6.
|
||
|
Item 7.
|
||
|
Item 7A.
|
||
|
Item 8.
|
||
|
Item 9.
|
||
|
Item 9A.
|
||
|
Item 9B.
|
||
|
Item 10.
|
||
|
Item 11.
|
||
|
Item 12.
|
||
|
Item 13.
|
||
|
Item 14.
|
||
|
Item 15.
|
||
2
FORWARD-LOOKING STATEMENTS
This Annual Report on Form 10-K, as well as other written or oral communications made from time to time by us, contains forward-looking information within the meaning of the safe harbor provisions of the U.S. Private Securities Litigation Reform Act of 1995. These statements relate to future events or future predictions, including events or predictions relating to future financial performance, and are generally identifiable by the use of forward-looking terminology such as “believe,” “expect,” “may,” “will,” “should,” “plan,” “intend,” or “anticipate” or the negative thereof or comparable terminology. Forward-looking statements reflect numerous assumptions, estimates and forecasts as to future events. No assurance can be given that the assumptions, estimates and forecasts underlying such forward-looking statements will accurately reflect future conditions, or that any guidance, goals, targets or projected results will be realized. The assumptions, estimates and forecasts underlying such forward-looking statements involve judgments with respect to, among other things, future economic, competitive, regulatory and financial market conditions and future business decisions, which may not be realized and which are inherently subject to significant business, economic, competitive and regulatory uncertainties and known and unknown risks, including the risks described under “Risk Factors” in this Annual Report on Form 10-K, as such factors may be updated from time to time in our filings with the SEC, including our Quarterly Reports on Form 10-Q. Our actual results may differ materially from those reflected in the forward-looking statements.
In addition to the risks described in the “Risk Factors” section of this Annual Report on Form 10-K and the other reports we filed with the SEC, important factors to consider and evaluate with respect to such forward-looking statements include:
|
•
|
Changes in external competitive market factors that might impact our results of operations;
|
|
•
|
Changes in laws and regulations, including without limitation changes in capital requirements under Basel III;
|
|
•
|
Changes in our business strategy or an inability to execute our strategy due to the occurrence of unanticipated events;
|
|
•
|
Our ability to identify potential candidates for, and consummate, acquisition or investment transactions;
|
|
•
|
The timing of acquisition, investment, or disposition transactions;
|
|
•
|
Constraints on our ability to consummate an attractive acquisition or investment transaction because of significant competition for these opportunities;
|
|
•
|
Local, regional and national economic conditions and events and the impact they may have on us and our customers;
|
|
•
|
Costs and effects of regulatory and legal developments, including the results of regulatory examinations and the outcome of regulatory or other governmental inquiries and proceedings, such as fines or restitutions on our business activities;
|
|
•
|
Our ability to attract deposits and other sources of liquidity;
|
|
•
|
Changes in the financial performance and/or condition of our borrowers;
|
|
•
|
Changes in the level of non-performing and classified assets and charge-offs;
|
|
•
|
Changes in estimates of future loan loss reserve requirements based upon the periodic review thereof under relevant regulatory and accounting requirements;
|
|
•
|
Inflation, interest rate, securities market and monetary fluctuations;
|
|
•
|
Timely development and acceptance of new banking products and services and perceived overall value of these products and services by users, including the products and services being developed and introduced to the market the BankMobile division of Customers Bank;
|
|
•
|
Changes in consumer spending, borrowing and saving habits;
|
|
•
|
Technological changes;
|
|
•
|
Our ability to increase market share and control expenses;
|
|
•
|
Continued volatility in the credit and equity markets and its effect on the general economy;
|
|
•
|
Effects of changes in accounting policies and practices, as may be adopted by the regulatory agencies, as well as the Public Company Accounting Oversight Board, the Financial Accounting Standards Board and other accounting standard setters;
|
|
•
|
The businesses of Customers Bank and any acquisition targets or merger partners and subsidiaries not integrating successfully or such integration being more difficult, time-consuming or costly than expected;
|
3
|
•
|
Material differences in the actual financial results of merger and acquisition activities compared with expectations, such as with respect to the full realization of anticipated cost savings and revenue enhancements within an expected time frame;
|
|
•
|
Our ability to successfully implement our growth strategy, control expenses and maintain liquidity;
|
|
•
|
Customers Bank’s ability to pay dividends to Customers Bancorp;
|
|
•
|
Risks related to our proposed sale of BankMobile to Flagship Bank, including:
|
|
◦
|
Our
ability to successfully complete the proposed sale and the timing of completion;
|
|
•
|
The ability of Customers and Flagship Bank to meet all of the conditions to completion of the proposed sale;
|
|
•
|
The impact of the announcement of the proposed sale on the value of our securities, our business and our relationship with employees and customers;
|
|
•
|
Our use of the proceeds from the sale;
|
|
•
|
The effect on Customers' business if the proposed sale is not completed and Customers is unable to sell or otherwise dispose of BankMobile before exceeding $10 billion in assets;
|
|
•
|
Risks relating to BankMobile, including:
|
|
◦
|
That integration of the Higher One Disbursement business with BankMobile may be less successful, more difficult, time-consuming or costly than expected, and that BankMobile may be unable to realize anticipated cost savings and revenue enhancements within the expected time frame or at all;
|
|
◦
|
The number of existing student customers who transfer their accounts to BankMobile from one of Higher One's former bank partners;
|
|
◦
|
Material variances in the adoption rate of BankMobile's services by new students and/or the usage rate of BankMobile's services by current student customers compared to our expectations;
|
|
◦
|
Material variances in the number of BankMobile student accounts retained following graduation compared to our expectations;
|
|
◦
|
The levels of usage of other BankMobile student customers following graduation of additional product and service offerings of BankMobile or Customers Bank, including mortgages and consumer loans, and the mix of products and services used;
|
|
◦
|
Our ability to implement changes to BankMobile's product and service offerings under current and future regulations and governmental policies;
|
|
◦
|
Our ability to effectively manage revenue and expense fluctuations that may occur with respect to BankMobile's student-oriented business activities, which result from seasonal factors related to the higher-education academic year;
|
|
◦
|
Our ability to implement our strategy regarding BankMobile, including with respect to our intent to sell or otherwise dispose of the BankMobile business in the future, depending upon market conditions and opportunities; and
|
|
◦
|
BankMobile's ability to successfully implement its growth strategy and control expenses.
|
You are cautioned not to place undue reliance on any forward-looking statements we make, which speak only as of the date they are made. We do not undertake any obligation to release publicly or otherwise provide any revisions to any forward-looking statements we may make, including any forward-looking financial information, to reflect events or circumstances occurring after the date hereof or to reflect the occurrence of unanticipated events, except as may be required under applicable law.
4
CUSTOMERS BANCORP, INC. AND SUBSIDIARIES
Customers Bancorp, Inc. (the “Bancorp” or “Customers Bancorp”) is a bank holding company engaged in banking activities through its wholly owned subsidiary, Customers Bank (“Customers Bank” or the “Bank”), collectively referred to as "Customers" herein. Customers Bancorp has made certain equity investments through its wholly owned subsidiaries CB Green Ventures Pte Ltd. and CUBI India Ventures Pte Ltd.
On March 7, 2017, Customers entered into a Purchase and Assumption Agreement (the “Purchase Agreement”) with Flagship Community Bank (“Flagship Bank”). Subject to the terms and conditions of the Purchase Agreement, Customers will sell to Flagship the assets, and Flagship will assume from Customers the liabilities, of the BankMobile division of Customers Bank.
In fourth quarter 2016, Customers announced its intent to sell BankMobile and, as a result, BankMobile has been classified as “held for sale” on the consolidated balance sheets at December 31, 2016 and 2015 and BankMobile’s operating results have been presented as discontinued operations in the consolidated financial statements included in this Annual Report on Form 10-K. Although Customers currently anticipates that the sale of BankMobile to Flagship Bank will be completed in 2017, the information included herein regarding BankMobile’s business, operations, strategy, and risk factors is included in this Annual Report on Form 10-K to provide disclosure regarding Customers’ ownership and operation of BankMobile to date and through the completion of the sale of BankMobile to Flagship Bank or another sale or disposition of BankMobile if the sale to Flagship Bank is not completed.
For a description of certain risks relating to the proposed sale of BankMobile to Flagship Bank, please see “Risk Factors - Risks Related to the Proposed Sale of BankMobile.”
Business Summary
Customers Bancorp, through its wholly owned subsidiary Customers Bank, provides financial products and services to small and middle market businesses, not-for-profits, and consumers through its branches and offices in Southeastern Pennsylvania (Bucks, Berks, Chester, Delaware and Philadelphia Counties), Rye Brook, Melville and New York, New York (Westchester, Suffolk and New York Counties), Hamilton, New Jersey (Mercer County), Providence, Rhode Island (Providence County), Portsmouth, New Hampshire (Rockingham County) and Boston, Massachusetts (Suffolk County). Customers Bank also provides liquidity to the mortgage market nationwide through the operation of its loans to mortgage banking companies. At
December 31, 2016
, Customers had total assets of
$9.4 billion
, including loans, net of the allowance for loan losses (including held-for-sale loans) of
$8.2 billion
, total deposits of
$6.8 billion
, and shareholders’ equity of
$0.9 billion
.
Customers' strategic plan is to become a leading regional bank holding company through organic growth and value-added acquisitions. Customers differentiates itself from its competitors through its focus on exceptional customer service supported by state of the art technology. The primary customers of Customers Bank are privately held businesses, business customers, not-for-profit organizations, and consumers. Customers Bank also focuses on certain low-cost specialty lending areas such as multi-family/commercial real estate lending and lending to commercial mortgage banking businesses. The Bank’s lending activities are funded in part by deposits from its branch model, which seeks higher deposit levels per branch than a typical bank, combined with lower branch operating expenses, without sacrificing exceptional customer service. Customers also creates franchise value through its disciplined approach to acquisitions, both in terms of identifying targets and structuring transactions. Enterprise risk management is an important part of the strategies Customers employs.
Customers also launched BankMobile as a key strategic initiative in January 2015, recognizing the product delivery flexibility demanded by the millennial generation and the low cost of the smart phone delivery channel. BankMobile refers to Customers' efforts to build a full service bank that is accessible to our customers anywhere and anytime through the customer's smartphone or other web-enabled device. As part of the BankMobile strategic initiative, on June 15, 2016, Customers completed the acquisition of substantially all the assets and the assumption of certain liabilities of the OneAccount Student Checking and Refund Management Disbursement Services business (the "Disbursement business") from Higher One Holdings, Inc. and Higher One, Inc. (together, "Higher One"). Higher One was acquired by a subsidiary of Blackboard, Inc. in third quarter 2016 and we continue to refer to that combined business as “Higher One” throughout this document. BankMobile, including the Disbursement business, provides a nationwide deposit-aggregation platform. BankMobile focuses on the aggregation of low-cost deposits and currently offers no fee banking, lines of credits to qualified customers, no overdraft fees, higher than average interest rate on savings, and access to 55,000 ATMs (and if the customer makes a monthly direct deposit into their BankMobile account over 400,000 ATMs) across the U.S. Customers believed that consolidating BankMobile with the Disbursement business would uniquely position it to become the graduating students "bank for life" and service each graduate's financial needs throughout their life. BankMobile's revenues are largely derived from interchange charges paid by the product selling
5
vendor and user based fees for specific activities (such as lost card replacement). It is BankMobile's strategy to disrupt traditional banks' retail branch customer service delivery model and become the bank of choice for life of college students and middle income and under-banked Americans using its low-cost digital delivery platform and superior deposit products, serve as a white label deposit service customer to large companies, and disrupt payday lenders and high cost check lenders by making low cost quality banking services available to key under-banked markets. BankMobile has obtained and is applying for patents and copyrights to protect key elements of its products and delivery methods. This intellectual property will allow BankMobile to continue to differentiate its business from potential competitors. In fourth quarter 2016, Customers announced its intent to sell BankMobile and anticipates the sale to close in 2017. Accordingly, BankMobile has been classified as "held for sale" on the consolidated balance sheets at December 31, 2016 and 2015 and BankMobile's operating results have been presented as discontinued operations in the accompanying consolidated financial statements.
The management team of Customers consists of experienced banking executives led by its Chairman and Chief Executive Officer, Jay Sidhu, who joined Customers in June 2009. Mr. Sidhu brings over 40 years of banking experience, including 20 years as the Chief Executive Officer and Chairman of Sovereign Bancorp. In addition to Mr. Sidhu, a number of the members of the current management team have experience working together at Sovereign with Mr. Sidhu. Many other team members who have joined Customers' management team have significant experience helping build and lead other banking organizations. Combined, the Customers management team has significant experience in building a banking organization, completing and integrating mergers and acquisitions, and developing valuable community and business relationships in its core markets.
Background and History
Customers Bancorp was incorporated in Pennsylvania in April 2010 to facilitate a reorganization into a bank holding company structure pursuant to which Customers Bank became a wholly owned subsidiary of Customers Bancorp (the “Reorganization”) on September 17, 2011. Pursuant to the Reorganization, all of the issued and outstanding shares of Voting Common Stock and Class B Non-Voting Common Stock of Customers Bank were exchanged on a one-for-three basis for shares of Voting Common Stock and Class B Non-Voting Common Stock, respectively, of Customers Bancorp. Customers Bancorp’s corporate headquarters are located at 1015 Penn Avenue, Wyomissing, Pennsylvania 19610. The main telephone number is (610) 933-2000.
The deposits of Customers Bank, which was chartered as New Century Bank in 1994, are insured by the Federal Deposit Insurance Corporation. Customers Bank’s home office is located at 99 Bridge Street, Phoenixville, Pennsylvania 19460. The main telephone number is (610) 933-2000. BankMobile is a division of Customers Bank, first marketing its deposit products beginning in January 2015. As a division of Customers Bank, BankMobile's deposits are also insured by the Federal Deposit Insurance Corporation.
Executive Summary
Customers' Markets
Market Criteria
Customers looks to grow organically as well as through selective acquisitions in its current and prospective markets. Customers believes that there is significant opportunity to both enhance its presence in its current markets and enter new complementary markets that meet its objectives. Customers focuses on markets that it believes are characterized by some or all of the following:
|
•
|
Population density;
|
|
•
|
Concentration of business activity;
|
|
•
|
Attractive deposit bases;
|
|
•
|
Significant market share held by large banks;
|
|
•
|
Advantageous competitive landscape that provides opportunity to achieve meaningful market presence;
|
|
•
|
Lack of consolidation in the banking sector and corresponding opportunities for add-on transactions;
|
|
•
|
Potential for economic growth over time; and
|
|
•
|
Management experience in the applicable markets.
|
6
BankMobile products are delivered to customers nationwide, via its digital delivery channels, such as a smartphone or other web-enable device. The BankMobile business is currently focused on millennials, now the largest generation in the United States, developing white label relationships with large companies that wish to expand their relationships with their retail customers and employees, and the under-banked who can utilize a low cost banking services provider. As a general retail deposit product and related services provider, the BankMobile segment does not have a dependency on a particular customer, but is focused on providing deposit services to college students who receive federal government loans or grants. BankMobile currently provides deposit products and services to students on nearly 800 college and university campuses.
Current Markets
Customers' target market is broadly defined as extending from the greater Washington, D.C. area to Boston, Massachusetts roughly following Interstate 95. As of
December 31, 2016
, Customers had bank branches or limited purpose offices (“LPOs”) in the following locations:
|
Market
|
Offices
|
Type
|
||
|
Berks County, PA
|
4
|
|
Branch
|
|
|
New Haven, CT
|
1
|
|
LPO
|
|
|
Boston, Massachusetts
|
1
|
|
LPO
|
|
|
Mercer County, NJ
|
2
|
|
Branch/LPO
|
|
|
New York, NY
|
1
|
|
LPO
|
|
|
Philadelphia-Southeastern PA
|
9
|
|
Branch/LPO
|
|
|
Portsmouth, NH
|
1
|
|
LPO
|
|
|
Providence, RI
|
1
|
|
LPO
|
|
|
Suffolk County, NY
|
1
|
|
LPO
|
|
|
Westchester County, NY
|
1
|
|
Branch/LPO
|
|
Customers believes its target market has highly attractive demographic, economic and competitive dynamics that are consistent with its objectives and favorable to executing its organic growth and acquisition strategies.
The BankMobile suite of deposit products and services is provided nationally through digital delivery channels, such as a smartphone or other web-enabled device. The BankMobile deposit products and services are available nationwide throughout the United States. Customers believes that digital delivery without geographic limitations is the future of banking.
Prospective Markets
The organic growth strategy of Customers focuses on expanding market share in its existing and contiguous markets by generating deposits, loan and fee based services through its Concierge Banking® high-touch personalized service supported by state of the art technology for the Bank’s commercial, consumer, not-for-profit, and specialized lending markets. While Customers has not acquired any banks since 2011, its bank acquisition strategy is focused on undervalued and troubled community banks in Pennsylvania, New Jersey, New York, Maryland, Virginia and New England, where such acquisitions further Customers' objectives and meet its critical success factors. Customers will also consider other acquisitions that will contribute banking business. As Customers evaluates potential acquisition and asset purchase opportunities, it believes there are many banking institutions that continue to face credit challenges, capital constraints and liquidity issues and that lack the scale and management expertise to manage the increasing regulatory burden. The BankMobile suite of deposit products and services is delivered through digital delivery channels, such as a smartphone or other web-enabled device across the United States. As such, the product does not have geographic limitations. Currently, BankMobile is focused on the market for deposits, but is developing loan products and relationships with market place lenders that will facilitate competing in loan markets prospectively, either as a direct lender or referral to other lenders.
7
Competitive Strengths
|
•
|
Experienced and respected management team.
An integral element of the business strategy of Customers is to capitalize on and leverage the prior experience of its executive management team. The management team is led by Chairman and Chief Executive Officer, Jay Sidhu, who is the former Chief Executive Officer and Chairman of Sovereign Bancorp. In addition to Mr. Sidhu, a number of the members of the current management team of Customers have experience working together at Sovereign with Mr. Sidhu, including Richard Ehst, President and Chief Operating Officer, as well as Warren Taylor, Chief Financial Officer of BankMobile. During their tenure at Sovereign, these individuals established a track record of producing strong financial results, integrating acquisitions, managing risk, working with regulators and achieving organic growth and expense control. Team leaders Timothy Romig, Regional Chief Lending Officer, Steve Issa, New England Marketing President and Chief Lending Officer, and George Maroulis, Head of Private and Commercial Banking - New York, head the New Jersey and Pennsylvania, New England, and New York commercial lending areas, respectively, with 33, 40, and 25 years of experience, respectively. Ken Keiser, Director of Multi-Family and Investment Commercial Real Estate Lending, leads the commercial real estate and multi-family lending group and brings more than 40 years of experience including oversight of the Mid-Atlantic commercial real estate group at Sovereign. In addition, the residential lending group, which primarily includes commercial loans (warehouse facilities) to residential mortgage originators and, to a lesser extent, mortgage loans to individuals is led by Glenn Hedde, President of Warehouse Lending who brings more than 25 years of experience in this sector. This team has significant experience in successfully building a banking organization as well as existing valuable community and business relationships in our core markets.
|
|
•
|
Unique Asset and Deposit Generation Strategies.
Customers focuses on local market lending combined with relatively low-risk specialty lending segments. Local market asset generation provides various types of business lending products and consumer lending products, such as mortgage loans and home equity loans. Customers has also established a multi-family and commercial real estate product line that is focused on the Mid-Atlantic region, particularly New York City. The strategy is to focus on refinancing existing loans with conservative underwriting and to keep costs low. Through the multi-family and commercial real estate product, Customers earns interest and fee income and generates commercial deposits. Customers also maintains a specialty lending business, commercial loans to mortgage originators, which is a national business where the Bank provides liquidity to non-depository mortgage companies to fund their mortgage pipelines and meet other business needs. Through the loans to mortgage bankers business, Customers earns interest and fee income and generates core deposits.
|
|
•
|
BankMobile Strategy
. Customers launched BankMobile as a key strategic initiative in January 2015, recognizing the product delivery flexibility demanded by the millennial generation and the low cost of the smartphone delivery channel. BankMobile refers to Customers' efforts to build a full service bank that is accessible to our customers anywhere and anytime through the customer's smartphone or other web-enabled device. BankMobile provides a nationwide deposit-aggregation platform. BankMobile focuses on the aggregation of low-cost deposits and currently offers no fee banking, lines of credits to qualified customers, no overdraft fees, higher than average interest rate on savings, and access to 55,000 ATMs (and if the customer makes a monthly direct deposit over 400,000 ATMs) across the U.S. Customers believed that consolidating BankMobile with the acquired Disbursement business uniquely positioned Customers to become the graduating students "bank for life" and service each graduate's financial needs throughout their life. Successful execution of the BankMobile strategy, including its consolidation with the Disbursement business, greatly accelerated BankMobile's ability to achieve profitability. BankMobile's revenues are largely derived from interchange charges paid by the product selling vendor and user based fees for specific activities (such as lost card replacement).
|
|
•
|
Unique product experience.
As a digital bank, BankMobile provides a unique experience to a banking customer in delivering a full banking experience through a smartphone or other web-enabled device. This alternative delivery channel, available nationwide, provides Customers with access to a customer base today with the opportunity to develop life long profitable banking relationships with a large population segment of what reasonably is expected to be the higher income segment of the millennial generation.
|
|
•
|
Attractive low credit risk profile.
Customers has sought to maintain high asset quality and moderate credit risk by using conservative underwriting standards and early identification of potential problem assets. Customers has also formed a special assets department to manage classified and non-performing assets. As of
December 31, 2016
, only
$17.8 million
, or
0.22%
, of the Bank's total loan portfolio was non performing.
|
8
|
•
|
Superior Community Banking Model.
Customers expects to drive organic growth by employing its Concierge Banking® strategy, which provides specific relationship managers or private bankers for all customers, delivering an appointment banking approach available 12 hours a day, seven days a week. This allows Customers to provide services in a personalized, convenient and expeditious manner. This approach, coupled with superior technology, including remote account opening, remote deposit capture, mobile banking and the first fee free mobile first digital bank, BankMobile, results in a competitive advantage over larger institutions, which management believes contributes to the profitability of its franchise and allows the Bank to generate core deposits. The “high-tech, high-touch,” model requires less staff and smaller branch locations to operate, thereby significantly reducing operating costs.
|
|
•
|
Acquisition Expertise.
The depth of Customers' management team and their experience working together and successfully completing acquisitions provides unique insight in identifying and analyzing potential markets and acquisition targets. The experience of Customers' team, which includes the acquisition and integration of over 35 institutions, as well as numerous asset and branch acquisitions, provides a substantial advantage in pursuing and consummating future acquisitions. Additionally, management believes Customers' strengths in structuring transactions to limit its risk, its experience in the financial reporting and regulatory process related to troubled bank acquisitions, and its ongoing risk management expertise, particularly in problem loan workouts, collectively enable it to capitalize on the potential of the franchises it acquires. With Customers' depth of operational experience in connection with completing merger and acquisition transactions, it expects to be able to integrate and reposition acquired franchises cost-efficiently with a minimum disruption to customer relationships.
|
Customers believes its ability to operate efficiently is enhanced by its centralized risk management structure, its access to attractive labor and real estate costs in its markets, and an infrastructure that is unencumbered by legacy systems. Furthermore, Customers anticipates additional expense synergies from the integration of its acquisitions, which it believes will enhance its financial performance.
Segments
Customers has historically operated under
one
business segment, "Community Banking." However, beginning in third quarter 2016, Customers revised its segment financial reporting to reflect the manner in which its chief operating decision makers (our Chief Executive Officer and Board of Directors) have begun allocating resources and assessing performance subsequent to Customers' acquisition of the Disbursement business from Higher One and the combination of that business with the BankMobile technology platform late in second quarter 2016.
Management has determined that Customers' operations consist of
two
reportable segments - Community Business Banking and BankMobile. Each segment generates revenues, manages risk, and offers distinct products and services to targeted customers through different delivery channels. The strategy, marketing, and analysis of these segments vary considerably. For more information on Customers' reportable operating segments, see NOTE 25 - BUSINESS SEGMENTS.
In third quarter 2016, Customers announced its intent to sell BankMobile and anticipates a sale to close in 2017. Because BankMobile met the criteria to be classified as held for sale at December 31, 2016, the assets and liabilities of BankMobile have been presented as "Assets held for sale" and "Liabilities held for sale" on the consolidated balance sheets at December 31, 2016 and 2015. BankMobile's operating results and associated cash flows have been presented as "Discontinued operations" within the accompanying consolidated financial statements and prior period amounts have been reclassified to conform with the current period presentation. For more information on BankMobile discontinued operations, see NOTE 3 - DISCONTINUED OPERATIONS.
The BankMobile operating segment results differ from the amounts reported as "Discontinued operations" on the consolidated financial statements primarily because of the internal funds transfer pricing methodology used by management to allocate interest income to BankMobile for the value provided to the Community Business Banking segment for the use of low/no cost deposits.
9
Products
Customers offers a broad range of traditional loan and deposit banking products and financial services, and non-traditional products and services through the successful Phase 1 launch of BankMobile in January 2015, to its commercial and consumer customers. Customers offers an array of lending products to cater to its customers’ needs, including commercial mortgage warehouse loans, multi-family and commercial real estate loans, small business loans, equipment loans, residential mortgage loans and other consumer loans. Customers also offers traditional deposit products, including commercial and consumer checking accounts, non-interest-bearing demand accounts, money market deposit accounts, savings accounts, and time deposit accounts, and cash management services. Prior to January 2015, deposit products were available to customers only through branches of Customers Bank. With the successful launch of BankMobile, the acquisition of the Disbursement business from Higher One and the combination of that business with the BankMobile platform, Customers is able to provide fee free banking to millennials, students, middle class American families and underserved consumers throughout the United States.
BankMobile is focused on providing quality low cost deposit products and related services to its customers, such as no or low fee checking, no overdraft charges, photo bill pay, no opening balance requirements, instant virtual debit cards, and similar customer friendly technology enabled services. Customers can also obtain cash free of any fees from over 55,000 ATMs in the United States. BankMobile looks to develop its capabilities to deliver retail loan products, such as automobile loans, credit cards, and personal loans, to its customers, either as a referral or direct lender, as its technological capabilities develop.
Lending Activities
Customers Bank focuses its lending efforts on the following lending areas:
|
•
|
Commercial Lending – our focus is on Business Banking (commercial and industrial lending), including Small and Middle Market Business Banking (including small business administration (SBA) loans), Multi-family and Commercial Real Estate lending, and commercial loans to mortgage originators; and
|
|
•
|
Consumer Lending – local market mortgage and home equity lending.
|
Commercial Lending
The Bank’s commercial lending activities are divided into four distinct groups: Business Banking, Small and Middle Market Business Banking, Multi-family and Commercial Real Estate Lending, and Mortgage Banking Lending. This grouping is designed to allow for greater resource deployment, higher standards of risk management, strong asset quality, lower interest rate risk and higher productivity levels.
The commercial lending group focuses on companies with annual revenues ranging from $1.0 million to $100.0 million, which typically have credit requirements between $0.5 million and $10.0 million.
The small and middle market business banking platform originates loans, including SBA loans, through the branch network sales force and a team of dedicated Small Business relationship managers. The support administration of the platform for this lending activity is centralized including risk management, product management, marketing, performance tracking and overall strategic planning. Credit and sales training has been established for the sales force, ensuring that the Bank has small business experts in place providing appropriate financial solutions to the small business owners in its communities. A division approach focuses on industries that offer high asset quality and are deposit rich to drive profitability.
The goal of the Bank’s multi-family lending group is to build a portfolio of high-quality multi-family and commercial real estate loans within its covered markets, while cross selling its other products and services. This business line primarily focuses on refinancing existing loans, using conservative underwriting. The primary collateral for these loans is a first-lien mortgage on the multi-family property, plus an assignment of all leases related to such property. During the years ended
December 31, 2016
and
2015
, the Bank originated approximately $0.9 billion and $1.3 billion, respectively, of multi-family loans.
The goal of commercial loans to mortgage originators is to provide liquidity to mortgage companies. The loans are predominately short-term facilities used by mortgage companies to fund their pipelines from closing of individual mortgage loans until their sale into the secondary market. Most of the individual mortgage loans that collateralize our commercial loans to mortgage companies are insured or guaranteed by the U.S. government through one of their programs such as FHA, VA, or are conventional loans eligible for sale to Fannie Mae and Freddie Mac. The Bank is currently expanding its product offerings to mortgage companies to meet a wider array of business needs. During the years ended
December 31, 2016
and
2015
, the Bank funded
$36.1 billion
and
$29.9 billion
of mortgage loans, respectively, to mortgage originators via warehouse facilities.
10
As of
December 31, 2016
and
2015
, the Bank had
$8.0 billion
and
$6.9 billion
, respectively, in commercial loans outstanding, composing approximately
96.4%
and
94.6%
, respectively, of its total loan portfolio, which includes loans held for sale. During the years ended
December 31, 2016
and
2015
, the Bank originated $0.8 billion and $0.9 billion, respectively, of commercial loans, exclusive of multi-family loan originations and loans to mortgage originators via warehouse facilities.
Consumer Lending
The Bank provides home equity and residential mortgage loans to customers. Underwriting standards for home equity lending are conservative and lending is offered to solidify customer relationships and grow relationship revenues in the long term. This lending is important in the Bank’s efforts to grow total relationship revenues for its consumer households. These areas also support the Bank's commitment to lower and moderate income families in its market area. The Bank plans to expand its product offerings in real estate secured consumer lending.
Beginning in 2013, Customers Bank launched a community outreach program in Philadelphia to encourage a higher percentage of homeownership in urban communities. As part of this program, the Bank is offering an “Affordable Mortgage Product”. This community outreach program is penetrating the underserved population, especially in low-and moderate income neighborhoods. As part of this commitment, a loan production office was opened at Progress Plaza, 1501 North Broad Street, Philadelphia, PA. The program includes homebuyer seminars that prepare potential homebuyers for homeownership by teaching money management and budgeting skills, including the financial responsibilities that come with having a mortgage and owning a home. The “Affordable Mortgage Product” is offered throughout Customers Bank’s CRA assessment areas.
As of
December 31, 2016
and
2015
, the Bank had
$298.7 million
and
$391.1 million
, respectively, in consumer loans outstanding, composing
3.6%
and
5.4%
, respectively, of the Bank’s total loan portfolio, which includes loans held for sale. During the years ended
December 31, 2016
and
2015
, the Bank originated $59.3 million and $63.0 million of consumer loans, respectively.
Private Banking
Beginning in 2013, Customers Bank introduced a Private Banking model for its commercial clients in the major markets within its geographic footprint. This unique model provides unparalleled service to customers through an in-market team of experienced private bankers. Acting as a single-point-of-contact for all the banking needs of the Bank’s commercial clients, these private bankers deliver the whole bank – not only to its clients, but to their families, their management teams, and their employees, as well. With a world-class suite of sophisticated cash management products, these private bankers deliver on Customers Bank’s “high-tech, high-touch” strategy and provide real value to its mid-market commercial clients.
Customers Bank opened its first private banking representative office in Manhattan in second quarter 2013, and eventually, all of its markets will be served by private bankers.
Deposit Products and Other Funding Sources
Customers Bank offers a variety of deposit products to its customers, including checking accounts, savings accounts, money market deposit accounts and other deposit accounts, including fixed-rate, fixed-maturity retail time deposits ranging in terms from 30 days to five years, individual retirement accounts, and non-retail time deposits consisting of jumbo certificates greater than or equal to $100,000. Using its high touch supported by high tech model, the Bank has experienced significantly higher above average growth in core deposits in all of its markets. Customers Bank also utilizes wholesale deposit products, money market and certificates of deposit obtained through listing services, and borrowings from the FHLB as a source of funding. These funding sources offer attractive funding costs in comparison to traditional sources of funding given the low interest rate environment.
11
Financial Products and Services
In addition to traditional banking activities, Customers Bank provides other financial services to its customers, including: mobile phone banking, internet banking, wire transfers, electronic bill payment, lock box services, remote deposit capture services, courier services, merchant processing services, cash vault, controlled disbursements, positive pay and cash management services (including account reconciliation, collections and sweep accounts). In January 2015, the Bank successfully launched BankMobile, America's first mobile platform based full service consumer bank. In June 2016, Customers acquired the Disbursement business of Higher One and subsequently combined that business with the BankMobile platform. The Disbursement business assists higher educational institutions in their distributions of Title IV monies to students. In combining the businesses, Customers serviced over 1.2 million active deposit accounts at December 31, 2016. The combined businesses also have the potential to add in excess of 400,000 new student deposit accounts annually.
Competition
Customers Bank competes with other financial institutions for deposit and loan business. Competitors include other commercial banks, savings banks, savings and loan associations, insurance companies, securities brokerage firms, credit unions, finance companies, mutual funds, money market funds, and certain government agencies. Financial institutions compete principally on the quality of the services rendered, interest rates offered on deposit products, interest rates charged on loans, fees and service charges, the convenience of banking office locations and hours of operation, and in the consideration of larger commercial borrowers, lending limits.
Many competitors are significantly larger than Customers Bank, and have significantly greater financial resources, personnel and locations from which to conduct business. In addition, Customers Bank is subject to regulation, while certain of its competitors are not. Non-regulated companies face relatively few barriers to entry into the financial services industry. Customers Bank’s larger competitors enjoy greater name recognition and greater resources to finance wide ranging advertising campaigns. Customers Bank competes for business principally on the basis of high-quality, personal service to customers, customer access to Customers Bank’s decision makers, and competitive interest and fee structure. Customers Bank also strives to provide maximum convenience of access to services by employing innovative delivery vehicles such as internet banking, and the convenience of Concierge Banking®.
Customers Bank’s current market is primarily served by large national and regional banks, with a few larger institutions capturing more than 50% of the deposit market share. Customers Bank’s large competitors primarily utilize expensive, branch-based models to sell products to consumers and small businesses, which requires our larger competitors to price their products with wider margins and charge more fees to justify their higher expense base. While maintaining physical branch locations remains an important component of Customers Bank’s strategy, Customers Bank utilizes an operating model with fewer and less expensive locations, thereby lowering overhead costs and allowing for greater pricing flexibility.
BankMobile competes for deposit customers with traditional bank branches that may have a physical presence near the university and college campuses we serve, large national banks, as well as smaller regional or local banks, with other student and disbursement businesses, both banks and prepaid card providers, and with local and national loan providers. Banks providing student disbursement services include PNC, Wells Fargo Bank, and U.S. Bank. BankMobile is developing strategies to white label deposit products to commercial entities, again competing with traditional bank deposit product branch delivery channels.
Employees
As of
December 31, 2016
, Customers Bancorp had
739
full-time equivalent employees, including approximately 225 employees dedicated to the BankMobile business segment.
Available Information
Customers Bancorp’s internet website address is www.customersbank.com. Information on Customers Bancorp’s website is not part of this Annual Report on Form 10-K. Investors can obtain copies of Customers Bancorp’s annual report on Form 10-K, quarterly reports on Form 10-Q, current reports on Form 8-K, and any amendments to those reports filed or furnished pursuant to Section 13(a) or 15(d) of the Securities Exchange Act of 1934, as amended, on Customers Bancorp’s website (accessible under “About Us” – “Investor Relations” – “SEC Filings”) as soon as reasonably practicable after Customers Bancorp has filed such materials with, or furnished them to, the Securities and Exchange Commission (“SEC”). Customers Bancorp will also furnish a paper copy of such filings free of charge upon request. Investors can also read and copy any materials filed by Customers Bancorp with the SEC at the SEC’s Public Reference Room which is located at 100 F Street, NE, Washington, DC
12
20549. Information about the operation of the Public Reference Room can be obtained by calling the SEC at 1-800-SEC-0330. Customers Bancorp’s filings can also be accessed at the SEC’s internet website: www.sec.gov.
SUPERVISION AND REGULATION
GENERAL
Customers Bancorp is subject to extensive regulation, examination and supervision by the Pennsylvania Department of Banking and Securities and, as a member of the Federal Reserve System, by the Federal Reserve Board. Federal and state banking laws and regulations govern, among other things, the scope of a bank’s business, the investments a bank may make, the reserves against deposits a bank must maintain, terms of deposit accounts, loans a bank makes, the interest rates it charges and collateral it takes, the activities of a bank with respect to mergers and consolidations and the establishment of branches.
PENNSYLVANIA BANKING LAWS
Pennsylvania banks that are Federal Reserve members may establish new branch offices only after approval by the Pennsylvania Department of Banking and Securities and the Board of Governors of the Federal Reserve System (the “Federal Reserve Board”). Approval by these regulators can be subject to a variety of factors, including the convenience and needs of the community, whether the institution is sufficiently capitalized and well managed, issues of safety and soundness, the institution’s record of meeting the credit needs of its community, whether there are significant supervisory concerns with respect to the institution or affiliated organizations, and whether any financial or other business arrangement, direct or indirect, involving bank “insiders” (directors, officers, employees and 10%-or-greater shareholders) which involves terms and conditions more favorable to the insiders than would be available in a comparable transaction with unrelated parties.
Under the Pennsylvania Banking Code, Customers Bank is permitted to branch throughout Pennsylvania. Pennsylvania law also provides Pennsylvania state-chartered banks elective parity with the power of national banks, federal thrifts, and state-chartered institutions in other states as authorized by the FDIC, subject to a required notice to the Pennsylvania Department of Banking and Securities. The Pennsylvania Banking Code also imposes restrictions on payment of dividends, as well as minimum capital requirements.
On October 24, 2012, Pennsylvania enacted three laws known as the “Banking Law Modernization Package,” all of which became effective on December 24, 2012. The intended goal of the law, which applies to Customers Bank, is to modernize Pennsylvania’s banking laws and to reduce regulatory burden at the state level where possible, given the increased regulatory demands at the federal level as described below.
The law also permits banks to disclose formal enforcement actions initiated by the Pennsylvania Department of Banking and Securities, clarifies that the Department has examination and enforcement authority over subsidiaries as well as affiliates of regulated banks and bolsters the Department’s enforcement authority over its regulated institutions by clarifying its ability to remove directors, officers and employees from institutions for violations of laws or orders or for any unsafe or unsound practice or breach of fiduciary duty. Changes to existing law also allow the Department to assess civil money penalties of up to $25,000 per violation.
The law also sets a new standard of care for bank officers and directors, applying the same standard that exists for non-banking corporations in Pennsylvania. The standard is one of performing duties in good faith, in a manner reasonably believed to be in the best interests of the institutions and with such care, including reasonable inquiry, skill and diligence, as a person of ordinary prudence would use under similar circumstances. Directors may rely in good faith on information, opinions and reports provided by officers, employees, attorneys, accountants, or committees of the board, and an officer may not be held liable simply because he or she served as an officer of the institution.
Interstate Branching
. Federal law allows the Federal Reserve and FDIC, and the Pennsylvania Banking Code allows the Pennsylvania Department of Banking and Securities, to approve an application by a state banking institution to acquire interstate branches. For more information on federal law, see the discussion under “Federal Banking Laws – Interstate Branching” that follows.
Pennsylvania banking laws authorize banks in Pennsylvania to acquire existing branches or branch de novo in other states, and also permits out-of-state banks to acquire existing branches or branch de novo in Pennsylvania.
13
In April 2008, Banking Regulators in the States of New Jersey, New York, and Pennsylvania entered into a Memorandum of Understanding (the “Interstate MOU”) to clarify their respective roles, as home and host state regulators, regarding interstate branching activity on a regional basis pursuant to the Riegle-Neal Amendments Act of 1997. The Interstate MOU establishes the regulatory responsibilities of the respective state banking regulators regarding bank regulatory examinations and is intended to reduce the regulatory burden on state-chartered banks branching within the region by eliminating duplicative host state compliance exams.
Under the Interstate MOU, the activities of branches Customers established in New Jersey or New York would be governed by Pennsylvania state law to the same extent that federal law governs the activities of the branch of an out-of-state national bank in such host states. Issues regarding whether a particular host state law is preempted are to be determined in the first instance by the Pennsylvania Department of Banking and Securities. In the event that the Pennsylvania Department of Banking and Securities and the applicable host state regulator disagree regarding whether a particular host state law is pre-empted, the Pennsylvania Department of Banking and Securities and the applicable host state regulator would use their reasonable best efforts to consider all points of view and to resolve the disagreement.
FEDERAL BANKING LAWS
Interstate Branching.
The Riegle-Neal Interstate Banking and Branching Efficiency Act of 1994 (called the “Interstate Act”), among other things, permits bank holding companies to acquire banks in any state. A bank may also merge with a bank in another state. Interstate acquisitions and mergers are subject, in general, to certain concentration limits and state entry rules relating to the age of the Bank. Under the Interstate Act, the responsible federal regulatory agency is permitted to approve the acquisition of less than all of the branches of an insured bank by an out-of-state bank or bank holding company without the acquisition of an entire bank, only if the law of the state in which the branch is located permits. Under the Interstate Act, branches of state-chartered banks that operate in other states are covered by the laws of the chartering state, rather than the host state. The Dodd-Frank Wall Street Reform and Consumer Protection Act (“Dodd-Frank Act”) created a more permissive interstate branching regime by permitting banks to establish branches de novo in any state if a bank chartered by such state would have been permitted to establish the branch. For more information on interstate branching under Pennsylvania law, see “Pennsylvania Banking Laws – Interstate Branching” above.
Prompt Corrective Action
. Federal banking law mandates certain “prompt corrective actions,” which Federal banking agencies are required to take, and certain actions which they have discretion to take, based upon the capital category into which a Federally regulated depository institution falls. Regulations have been adopted by the Federal bank regulatory agencies setting forth detailed procedures and criteria for implementing prompt corrective action in the case of any institution that is not adequately capitalized. Under the rules, an institution will be deemed to be “adequately capitalized” or better if it exceeds the minimum Federal regulatory capital requirements. However, it will be deemed “undercapitalized” if it fails to meet the minimum capital requirements, “significantly undercapitalized” if it has a common equity tier 1 risk-based capital ratio that is less than 3.0%, or has a total risk-based capital ratio that is less than 6.0%, a Tier 1 risk-based capital ratio that is less than 3.0%, or a leverage ratio that is less than 3.0%, and “critically undercapitalized” if the institution has a ratio of tangible equity to total assets that is equal to or less than 2.0%. The rules require an undercapitalized institution to file a written capital restoration plan, along with a performance guaranty by its holding company or a third party. In addition, an undercapitalized institution becomes subject to certain restrictions including a prohibition on the payment of dividends, a limitation on asset growth and expansion, and in certain cases, a limitation on the payment of bonuses or raises to senior executive officers, and a prohibition on the payment of certain “management fees” to any “controlling person.” Institutions that are classified as undercapitalized are also subject to certain additional supervisory actions, including increased reporting burdens and regulatory monitoring, a limitation on the institution’s ability to make acquisitions, open new branch offices, or engage in new lines of business, obligations to raise additional capital, restrictions on transactions with affiliates, and restrictions on interest rates paid by the institution on deposits. In certain cases, bank regulatory agencies may require replacement of senior executive officers or directors, or sale of the institution to a willing purchaser. If an institution is deemed to be “critically undercapitalized” and continues in that category for four quarters, the statute requires, with certain narrowly limited exceptions, that the institution be placed in receivership.
14
Safety and Soundness; Regulation of Bank Management
. The Federal Reserve Board possesses the power to prohibit a bank from engaging in any activity that would be an unsafe and unsound banking practice and in violation of the law. Moreover, Federal law enactments have expanded the circumstances under which officers or directors of a bank may be removed by the institution’s Federal supervisory agency; restricted and further regulated lending by a bank to its executive officers, directors, principal shareholders or related interests thereof; restricted management personnel of a bank from serving as directors or in other management positions with certain depository institutions whose assets exceed a specified amount or which have an office within a specified geographic area; and restricted management personnel from borrowing from another institution that has a correspondent relationship with the bank for which they work.
Capital Rules
. Federal banking agencies have issued certain “risk-based capital” guidelines, which supplemented existing capital requirements. In addition, the Federal Reserve Board imposes certain “leverage” requirements on member banks. Banking regulators have authority to require higher minimum capital ratios for an individual bank or bank holding company in view of its circumstances.
The risk-based capital guidelines require all banks and bank holding companies to maintain capital levels in compliance with “risk-based capital” ratios. In these ratios, the on-balance sheet assets and off balance sheet exposures are assigned a risk-weight based upon the perceived and historical risk of incurring a loss of principal from that exposure. The risk-based capital rules are designed to make regulatory capital requirements more sensitive to differences in risk profiles among banks and bank holding companies and to minimize disincentives for holding liquid assets.
The risk-based capital rules also may consider interest rate risk. Institutions with interest rate risk exposure above a normal level would be required to hold extra capital in proportion to that risk. The Bank currently monitors and manages its assets and liabilities for interest rate risk, and management believes that the interest rate risk rules which have been implemented and proposed will not materially adversely affect its operations.
The Federal Reserve Board’s “leverage” ratio rules require member banks which are rated the highest in the composite areas of capital, asset quality, management, earnings and liquidity to maintain a ratio of “Tier 1” capital to “adjusted total assets” of not less than 3.0%. For banks which are not the most highly rated, the minimum “leverage” ratio will range from 4.0% to 5.0%, or higher at the discretion of the Federal Reserve Board, and is required to be at a level commensurate with the nature of the level of risk of the Bancorp's condition and activities.
For purposes of the capital requirements, “Tier 1” or “core” capital is defined to include common shareholders’ equity and certain noncumulative perpetual preferred stock and related surplus. “Tier 2” or “qualifying supplementary” capital is defined to include a bank’s allowance for loan losses up to 1.25% of risk-weighted assets, plus certain types of preferred stock and related surplus, certain “hybrid capital instruments” and certain term subordinated debt instruments.
New Capital Rules.
On July 2, 2013, the Federal Reserve approved final rules that substantially amend the regulatory risk-based capital rules applicable to the Bancorp and the Bank. The FDIC and the OCC have subsequently approved these rules. The final rules were adopted following the issuance of proposed rules by the Federal Reserve in June 2012 and implement the “Basel III” regulatory capital reforms and changes required by the Dodd-Frank Act. “Basel III” refers to two consultative documents released by the Basel Committee on Banking Supervision in December 2009, the rules text released in December 2010, and loss absorbency rules issued in January 2011, which include significant changes to bank capital, leverage and liquidity requirements.
The rules include new risk-based capital and leverage ratios, planned to be phased in from 2015 to 2019, and refine the definition of what constitutes “capital” for purposes of calculating those ratios. Effective January 1, 2015, the new minimum capital level requirements applicable to the Bancorp and the Bank under the final rules were:
(i) a common equity Tier 1 risk-based capital ratio of 4.5%;
(ii) a Tier 1 risk-based capital ratio of 6% (increased from 4%);
(iii) a Total risk-based capital ratio of 8% (unchanged from rules in effect prior to January 1, 2015); and
(iv) a Tier 1 leverage ratio of 4% for all institutions.
The final rules also establish a “capital conservation buffer” above the new regulatory minimum capital requirements.
The capital conservation buffer will be phased-in over four years beginning on January 1, 2016, as follows: the maximum buffer will be 0.625% of risk-weighted assets for 2016, 1.25% for 2017, 1.875% for 2018, and 2.5% for 2019 and thereafter.
15
Effective January 1, 2016, the minimum capital level requirements (including the capital conservation buffer) applicable to the Bancorp and the Bank under the final rules were:
(i) a common equity Tier 1 capital ratio of 5.125%;
(ii) a Tier 1 Risk based capital ratio of 6.625%; and
(iii) a Total Risk based capital ratio of 8.625%.
Effective January 1, 2017, the minimum capital level requirements (including the capital conservation buffer) applicable to the Bancorp and the Bank under the final rules are:
(i) a common equity Tier 1 capital ratio of 5.75%;
(ii) a Tier 1 Risk based capital ratio of 7.25%; and
(iii) a Total Risk based capital ratio of 9.25%.
Considering the capital conservation buffer, to avoid limitations on certain actions or activities, banks will be required to maintain the following ratios beginning January 1, 2019:
(i) a common equity Tier 1 capital ratio of 7.0%;
(ii) a Tier 1 Risk Based capital ratio of 8.5%; and
(iii) a Total Risk based capital ratio of 10.5%.
Under the final rules, institutions are subject to limitations on paying dividends, engaging in share repurchases, and paying discretionary bonuses if its capital level falls below the minimum capital level plus capital conservation buffer amount. These limitations establish a maximum percentage of eligible retained income that could be utilized for such actions.
Basel III provided discretion for regulators to impose an additional buffer, the “countercyclical buffer,” of up to 2.5% of common equity Tier 1 capital to take into account the macro-financial environment and periods of excessive credit growth. However, the final rules permit the countercyclical buffer to be applied only to “advanced approach banks” (i.e., banks with $250 billion or more in total assets or $10 billion or more in total foreign exposures), which currently excludes the Bancorp and the Bank. The final rules also implement revisions and clarifications consistent with Basel III regarding the various components of Tier 1 capital, including common equity, unrealized gains and losses, as well as certain instruments that will no longer qualify as Tier 1 capital, some of which will be phased out over time. However, the final rules provide that small depository institution holding companies with less than $15 billion in total assets as of December 31, 2009 (which includes the Bancorp) will be able to permanently include non-qualifying instruments that were issued and included in Tier 1 or Tier 2 capital prior to May 19, 2010 in additional Tier 1 or Tier 2 capital until they redeem such instruments or until the instruments mature.
In addition, the final rules provide for smaller banking institutions (less than $250 billion in consolidated assets) an opportunity to make a one-time election to opt out of including most elements of accumulated other comprehensive income in regulatory capital. Importantly, the opt-out excludes from regulatory capital not only unrealized gains and losses on available-for-sale debt securities, but also accumulated net gains and losses on cash-flow hedges and amounts attributable to defined benefit postretirement plans. Customers Bank selected the opt-out election in its March 31, 2015 Call Report.
The final rules also contain revisions to the prompt corrective action framework, which is designed to place restrictions on insured depository institutions, including the Bank, if their capital levels begin to show signs of weakness. These revisions took effect on January 1, 2015. Under the prompt corrective action requirements, which are designed to complement the capital conservation buffer, insured depository institutions will be required to meet the following increased capital level requirements in order to qualify as “well capitalized:”
(i) a common equity Tier 1 capital ratio of 6.5%;
(ii) a Tier 1 Risk based capital ratio of 8% (increased from 6%);
(iii) a Total Risk based capital ratio of 10% (unchanged from rules in effect prior to January 1, 2015); and
(iv) a Tier 1 leverage ratio of 5% (increased from 4%).
16
The final rules set forth certain changes for the calculation of risk-weighted assets, which were required to be utilized as of January 1, 2015. The standardized approach final rule utilizes an increased number of credit risk exposure categories and risk weights, and also addresses:
(i) an alternative standard of creditworthiness consistent with Section 939A of the Dodd-Frank Act;
(ii) revisions to recognition of credit risk mitigation;
(iii) rules for risk weighting of equity exposures and past due loans;
(iv) revised capital treatment for derivatives and repo-style transactions; and
(v) disclosure requirements for top-tier banking organizations with $50 billion or more in total assets that are not subject to the “advance approach rules” that apply to banks with greater than $250 billion in consolidated assets.
As of
December 31, 2016
and
2015
, management believed that the Bank and Bancorp met all capital adequacy requirements to which they were subject. For additional information on Customers' regulatory capital ratios, refer to “NOTE 19 – REGULATORY MATTERS.”
Dodd-Frank Wall Street Reform and Consumer Protection Act.
The Dodd-Frank bill was enacted by Congress on July 15, 2010, and was signed into law by President Obama on July 21, 2010. Among many other provisions, the legislation:
|
•
|
established the Financial Stability Oversight Council, a federal agency acting as the financial system’s systemic risk regulator with the authority to review the activities of significant bank holding companies and non-bank financial firms, to make recommendations and impose standards regarding capital, leverage, conflicts and other requirements for financial firms and to impose regulatory standards on certain financial firms deemed to pose a systemic threat to the financial health of the U.S. economy;
|
|
•
|
created a new Consumer Financial Protection Bureau within the U.S. Federal Reserve, which has substantive rule-making authority over a wide variety of consumer financial services and products, including the power to regulate unfair, deceptive, or abusive acts or practices;
|
|
•
|
permitted state attorneys general and other state enforcement authorities broader power to enforce consumer protection laws against banks;
|
|
•
|
authorized federal regulatory agencies to ban compensation arrangements at financial institutions that give employees incentives to engage in conduct that could pose risks to the nation’s financial system;
|
|
•
|
granted the U.S. government resolution authority to liquidate or take emergency measures with regard to troubled financial institutions, such as bank holding companies, that fall outside the existing resolution authority of the Federal Deposit Insurance Corporation;
|
|
•
|
gave the FDIC substantial new authority and flexibility in assessing deposit insurance premiums, which may result in increased deposit insurance premiums for us in the future;
|
|
•
|
increased the deposit insurance coverage limit for insurable deposits to $250,000 generally, and removes the limit entirely for transaction accounts;
|
|
•
|
permitted banks to pay interest on business demand deposit accounts;
|
|
•
|
extended the national bank lending (or loans-to-one-borrower) limits to other institutions;
|
|
•
|
prohibited banks subject to enforcement action such as a memorandum of understanding from changing their charter without the approval of both their existing charter regulator and their proposed new charter regulator; and
|
|
•
|
imposed new limits on asset purchase and sale transactions between banks and their insiders.
|
Many of these provisions are subject to further rule making and to the discretion of regulatory bodies, including Customers Bank’s primary federal banking regulator, the Federal Reserve. It is not possible to predict at this time the extent to which regulations authorized or mandated by the Dodd-Frank Act will impose requirements or restrictions on Customers Bank in addition to or different from the provisions summarized above.
17
Deposit Insurance Assessments
. Customers Bank’s deposits are insured by the FDIC up to the limits set forth under applicable law and are subject to deposit insurance premium assessments. The FDIC imposes a risk-based deposit premium assessment system, which was amended pursuant to the Federal Deposit Insurance Reform Act of 2005 (the “Act”). Under this system, the amount of FDIC assessments paid by an individual insured depository institution, like Customers Bank, is based on the level of perceived risk incurred in its activities. The FDIC places a depository institution in one of four risk categories determined by reference to its capital levels and supervisory ratings. In addition, in the case of those institutions in the lowest risk category, the FDIC further determines its assessment rates based on certain specified financial ratios.
On February 7, 2011, the FDIC adopted a final rule modifying the risk-based assessment system and setting initial base assessment rates beginning April 1, 2011, ranging from 2.5 to 45 basis points of Tier I capital.
In addition to deposit insurance assessments, banks are subject to assessments to pay the interest on Financing Corporation bonds. The Financing Corporation was created by Congress to issue bonds to finance the resolution of failed thrift institutions. The FDIC sets the Financing Corporation assessment rate every quarter.
Community Reinvestment Act
. Under the Community Reinvestment Act of 1977 (“CRA”), the record of a bank holding company and its subsidiary banks must be considered by the appropriate Federal banking agencies, including the Federal Reserve Board, in reviewing and approving or disapproving a variety of regulatory applications including approval of a branch or other deposit facility, office relocation, a merger and certain acquisitions. Federal banking agencies have demonstrated an increased readiness to deny applications based on unsatisfactory CRA performance. The Federal Reserve Board is required to assess our record to determine if we are meeting the credit needs of the community (including low and moderate neighborhoods) that we serve. The Financial Institutions Reform, Recovery, and Enforcement Act of 1989 amended the CRA to require, among other things, that the Federal Reserve Board make publicly available an evaluation of the Bank’s record of meeting the credit needs of its entire community including low- and moderate-income neighborhoods. This evaluation includes a descriptive rating (outstanding, satisfactory, needs to improve, or substantial noncompliance) and a statement describing the basis for the rating.
Consumer Protection Laws
. Customers Bank is subject to a variety of consumer protection laws, including the Truth in Lending Act, the Truth in Savings Act adopted as part of the Federal Deposit Insurance Corporation Improvement Act of 1991 (“FDICIA”), the Equal Credit Opportunity Act, the Home Mortgage Disclosure Act, the Electronic Funds Transfer Act, the Real Estate Settlement Procedures Act and the regulations adopted thereunder. In the aggregate, compliance with these consumer protection laws and regulations involves substantial expense and administrative time on the part of Customers.
Bank Holding Company Regulation
As a bank holding company, Customers Bancorp is also subject to additional regulation.
The Bank Holding Company Act requires the Bancorp to secure the prior approval of the Federal Reserve Board before it owns or controls, directly or indirectly, more than five percent (5%) of the voting shares or substantially all of the assets of any bank. It also prohibits acquisition by the Bancorp of more than five percent (5%) of the voting shares of, or interest in, or all or substantially all of the assets of, any bank located outside of the state in which a current bank subsidiary is located unless such acquisition is specifically authorized by laws of the state in which such bank is located. A bank holding company is prohibited from engaging in or acquiring direct or indirect control of more than five percent (5%) of the voting shares of any company engaged in non-banking activities unless the Federal Reserve Board, by order or regulation, has found such activities to be so closely related to banking or managing or controlling banks as to be a proper incident thereto. In making this determination, the Federal Reserve Board considers whether the performance of these activities by a bank holding company would offer benefits to the public that outweigh possible adverse effects. Applications under the Bank Holding Company Act and the Change in Control Act are subject to review, based upon the record of compliance of the applicant with the CRA.
The Bancorp is required to file an annual report with the Federal Reserve Board and any additional information that the Federal Reserve Board may require pursuant to the Bank Holding Company Act. Further, under Section 106 of the 1970 amendments to the Bank Holding Company Act and the Federal Reserve Board’s regulations, a bank holding company and its subsidiaries are prohibited from engaging in certain tie-in arrangements in connection with any extension of credit or provision of credit or provision of any property or services. The so-called “anti-tie-in” provisions state generally that a bank may not extend credit, lease, sell property or furnish any service to a customer on the condition that the customer obtains additional credit or service from Customers Bank, or on the condition that the customer not obtain other credit or service from a competitor.
18
The Federal Reserve Board permits bank holding companies to engage in non-banking activities so closely related to banking or managing or controlling banks as to be a proper incident thereto. A number of activities are authorized by Federal Reserve Board regulation, while other activities require prior Federal Reserve Board approval. The types of permissible activities are subject to change by the Federal Reserve Board.
Risks Related to the Proposed Sale of BankMobile
Failure to complete the proposed sale of BankMobile could negatively impact our share price, our future business and financial results.
We cannot assure you that our proposed sale of BankMobile to Flagship Bank will be completed in the time frame we currently anticipate or at all. If we do not complete the proposed sale, we will not receive the expected benefits of such proposed sale transaction but will have incurred significant costs in connection with our pursuit of the sale, including our own costs relating to the proposed sale to Flagship Bank and the costs of Flagship Bank relating to the proposed sale and related matters, certain of which we are obligated to pay even if the proposed sale is completed. In addition, we cannot assure you that alternative opportunities to sell BankMobile will be available to us, or, if available, will be on terms at least as favorable to us as the terms of the proposed sale to Flagship Bank. Market conditions, the possible need to secure regulatory, shareholder or other approvals, and other factors will affect our ability to pursue alternative opportunities.
In addition, the value of our common and preferred stock may decline if the proposed sale is not completed, and uncertainty as to whether alternative transactions may be available for the disposition of the BankMobile business, and as to the timing, form and terms of any such alternative disposition may adversely affect analyst and shareholder views as to the value of the BankMobile business, which could further adversely affect the value of our securities.
If we are unable to complete the sale of BankMobile before exceeding the $10 billion total asset threshold our business and potential for future success could be materially adversely effected.
Our business and future prospects may suffer if we are unable to remain under $10 billion in total assets as of December 31 of each year before we sell or otherwise dispose of the BankMobile business. If we are unable to complete the sale or other disposition of BankMobile before exceeding the $10 billion total asset threshold, we would experience a significant reduction in BankMobile interchange fee income. Under federal law and regulation, we must remain under $10 billion in total assets as of December 31 of each year to qualify as a small issuer of debit cards and receive the optimal debit card processing fee. If we were to lose this status, BankMobile would operate unprofitably unless we were able to generate additional fees to replace the lost interchange fee revenue. As a result, our inability to complete the sale of BankMobile to Flagship Bank or otherwise in a timely manner could materially and adversely affect our financial condition and results of operations.
Completion of the proposed sale of BankMobile is subject to a number of important conditions, some of which are not in Customers’ control.
Completion of the proposed sale of BankMobile to Flagship Bank is subject to the fulfillment, or waiver (where permitted) of a variety of conditions to closing. Certain of those conditions to closing are not within our control. If any of these conditions are not fulfilled and the parties refuse to waive, or cannot waive, those conditions, we will be unable to complete the proposed sale. The significant conditions to completing the propose sale include the receipt of all necessary regulatory approvals, the approval by Flagship Bank’s shareholders of certain matters relating to the proposed sale, and Flagship obtaining financing in an amount not less than $260 million.
We have broad discretion in using the net proceeds from the proposed sale of BankMobile and may use the proceeds in ways with which you may not agree and in ways that may not enhance our operating results or the value of our securities.
Our management will retain broad discretion over the use of the net proceeds received on closing of the proposed sale of BankMobile, and we may ultimately use the proceeds in ways that do not improve our results of operations or enhance the value of our common and preferred stock or otherwise in ways with which you do not agree. If we do not invest or apply the proceeds effectively and on a timely basis, it could have a material adverse effect on our business and could cause the value of our securities to decline.
19
The proposed sale of BankMobile, whether or not consummated, may adversely affect our business.
Our announcement of the proposed sale of BankMobile and steps we take to complete the sale may adversely affect our relationships with BankMobile’s current and potential higher education institutions customers and our BankMobile employees, and could result in the loss of customers and key employees. Further, the actions needed to complete the sale of BankMobile may result in the diversion of our management’s attention from Customers’ day-to-day operations generally, which could adversely affect Customers’ business.
Certain terms of our agreement with Flagship Bank may expose us to significant liabilities.
We have agreed to indemnify Flagship Bank and its directors and officers against losses and liabilities incurred by them in connection with the proposed sale and to indemnify them and certain others in connection with certain additional matters relating to the proposed sale. In addition, we have agreed to obtain, at our expense, director and officer liability insurance for the benefit of Flagship Bank’s directors and officers to cover them for similar losses and liabilities. Although our agreement to provide indemnification is subject to certain limitations and exceptions, including limitations on the dollar amount of losses payable by us, significant indemnification claims by Flagship Bank or its directors and officers or other indemnitees could materially and adversely affect our financial condition.
If we are unable to complete the sale of BankMobile in a timely fashion, or at all, we will continue to face the risks and challenges associated with the BankMobile business.
If we do not complete the proposed sale of BankMobile to Flagship Bank in a timely fashion, or at all, we will continue to face the risks and challenges associated with the BankMobile business, including those relating to the integration of the Disbursement business, described in this Risk Factors discussion and elsewhere in this Annual Report on Form 10-K. We cannot assure you that we will be able to address and manage these risks so as to preserve or increase the value of BankMobile, and any failure to preserve or increase the value of BankMobile could adversely affect the business of Customers as a whole and our ability to sell or otherwise dispose of BankMobile in an alternative transaction on favorable terms or at all.
Risks Related to the Bancorp’s Banking Operations
If our allowance for loan losses is insufficient to absorb losses in our loan portfolio, our earnings could decrease.
Lending money is a substantial part of our business, and each loan carries a certain risk that it will not be repaid in accordance with its terms or that any underlying collateral will not be sufficient to assure repayment. This risk is affected by, among other things:
|
•
|
the financial condition and cash flows of the borrower and/or the project being financed;
|
|
•
|
the changes and uncertainties as to the future value of the collateral, in the case of a collateralized loan;
|
|
•
|
the discount on the loan at the time of its acquisition and capital, which could have regulatory implications;
|
|
•
|
the duration of the loan;
|
|
•
|
the credit history of a particular borrower; and
|
|
•
|
changes in economic and industry conditions.
|
At
December 31, 2016
, the Bancorp’s allowance for loan losses totaled
$37.3 million
, which represents
0.61%
of total loans held for investment. Management makes various assumptions and judgments about the collectability of our loan portfolio, including the creditworthiness of our borrowers and the probability of making payment, as well as the value of real estate and other assets serving as collateral for the repayment of many of our loans.
In determining the amount of the allowance for loan losses, significant factors considered include loss experience in particular segments of the portfolio, trends and absolute levels of classified and criticized loans, trends and absolute levels in delinquent loans, trends in risk ratings, trends in industry and Customers charge-offs by particular segments and changes in existing general economic and business conditions affecting our lending areas and the national economy. If our assumptions are incorrect, our allowance for loan losses may not be sufficient to cover losses inherent in our loan portfolio, resulting in additions to the allowance.
20
Management reviews and re-estimates the allowance for loan losses quarterly. Additions to our allowance for loan losses as a result on management's review and estimate could materially decrease net income. Our regulators, as an integral part of their examination process, periodically review our allowance for loan losses and may require us to increase our allowance for loan losses by recognizing additional provisions for loan losses charged to expense, or to decrease our allowance for loan losses by recognizing loan charge-offs, net of recoveries. Any such additional provisions for loan losses or charge-offs, as required by these regulatory agencies, could have a material adverse effect on our financial condition and results of operations.
Our emphasis on commercial, multi-family/commercial real estate and mortgage warehouse lending may expose us to increased lending risks.
We intend to continue emphasizing the origination of commercial loans and specialty loans, including loans to mortgage banking businesses. Commercial loans, including multi-family and commercial real estate loans, can expose a lender to risk of non-payment and loss because repayment of the loans often depends on the successful operation of a business or property and the borrower’s cash flows. Such loans typically involve larger loan balances to single borrowers or groups of related borrowers compared to one- to four-family residential mortgage loans. In addition, we may need to increase our allowance for loan losses in the future to account for an increase in probable credit losses associated with such loans. Also, we expect that many of our commercial borrowers will have more than one loan outstanding with us. Consequently, an adverse development with respect to one loan or one credit relationship can expose us to a significantly greater risk of loss compared to an adverse development with respect to a one- to four-family residential mortgage loan.
As a lender to mortgage banking businesses, we provide financing to mortgage bankers by purchasing, subject to resale under a master repurchase agreement, the underlying residential mortgages on a short-term basis pending the ultimate sale of the mortgages to investors. We are subject to the risks associated with such lending, including, but not limited to, the risks of fraud, bankruptcy and possible default by the borrower, closing agents, and the residential borrower on the underlying mortgage, any of which could result in credit losses. The risk of fraud associated with this type of lending includes, but is not limited to, settlement process risks, the risk of financing nonexistent loans or fictitious mortgage loan transactions, or the risk that collateral delivered is fraudulent or non-existent, creating a risk of loss of the full amount financed on the underlying residential mortgage loan, or in the settlement processes. As discussed in NOTE 22 – LOSS CONTINGENCY, in first quarter 2013, a suspected fraud was discovered in the Bank’s held-for-sale loan portfolio. Additional fraudulent transactions could have a material adverse effect on our financial condition and results of operations.
Our lending to commercial mortgage businesses is a significant part of our assets and earnings. This business is subject to cyclicality of the mortgage lending business, and volumes are likely to decline if interest rates increase, generally. A decline in the rate of growth, volume or profitability of this business unit, or a loss of its leadership could adversely affect our results of operations and financial condition.
As of
December 31, 2016
, the Bank had
$8.0 billion
in commercial loans outstanding, composing approximately
96.4%
of its total loan portfolio, which includes loans held for sale.
Decreased origination, volume and pricing decisions of competitors may adversely affect our profitability.
The Bank currently operates a residential mortgage banking business but plans to expand our origination, sale, and servicing of residential mortgage loans in the future. The Bank also began selling recent multi-family loan originations to third parties in third quarter 2014. Changes in market interest rates and pricing decisions by our loan competitors may adversely affect demand for our residential mortgage and multi-family loan products, the revenue realized on the sale of loans and revenues received from servicing such loans for others, and ultimately reduce our net income. New regulations, increased regulatory reviews, and/or changes in the structure of the secondary mortgage markets which we would utilize to sell mortgage loans or other rule changes that could affect the multi-family resale market may be introduced and may increase costs and make it more difficult to operate a residential mortgage origination business or sell multi-family loans.
21
Federal Home Loan Bank of Pittsburgh may not pay dividends or repurchase capital stock in the future.
On December 23, 2008, the Federal Home Loan Bank of Pittsburgh (“FHLB”) announced that it would voluntarily suspend the payment of dividends and the repurchase of excess capital stock until further notice. The FHLB announced at that time that it expected its ability to pay dividends and add to retained earnings to be significantly curtailed due to low short-term interest rates, an increased cost of maintaining liquidity, other than temporary impairment charges, and constrained access to debt markets at attractive rates. While the FHLB resumed payment of dividends and capital stock repurchases in 2012, capital stock repurchases from member banks are reviewed on a quarterly basis by the FHLB, and there is no guarantee that such dividends and capital stock repurchases will continue in the future. As of
December 31, 2016
, the Bank held
$51.3 million
of FHLB capital stock.
The fair value of our investment securities can fluctuate due to market conditions. Adverse economic performance can lead to adverse security performance and other-than-temporary impairment.
As of
December 31, 2016
, the fair value of our investment securities portfolio was
$493.5 million
. We have historically followed a conservative investment strategy, with concentrations in securities that are backed by government sponsored enterprises. In the future, we may seek to increase yields through more aggressive strategies, which may include a greater percentage of corporate securities, structured credit products or non-agency mortgage backed securities. Factors beyond our control can significantly influence the fair value of securities in our portfolio and can cause potential adverse changes to the fair value of these securities. These factors include, but are not limited to, rating agency actions in respect of the securities, defaults by the issuer or with respect to the underlying securities, and changes in market interest rates and continued instability in the capital markets. Any of these factors, among others, such as a change in management's intent to hold the securities until recovery in fair value, could cause other-than-temporary impairments and realized and/or unrealized losses in future periods and declines in other comprehensive income, which could have a material adverse effect on us. The process for determining whether impairment of a security is other-than-temporary usually requires complex, subjective judgments about the future financial performance and liquidity of the issuer and any collateral underlying the security in order to assess the probability of receiving all contractual principal and interest payments on the security.
At December 31, 2016, management evaluated its equity holdings issued by Religare Enterprises Limited for other-than-temporary impairment. Because management no longer has the intent to hold these securities until a recovery in fair value, Customers recorded an other-than-temporarily impairment loss of
$7.3 million
in fourth quarter 2016 for the full amount of the decline in fair value below the cost basis. The fair value of the equity securities at December 31, 2016 of
$15.2 million
became the new cost basis of the securities.
Changes to estimates and assumptions made by management in preparing financial statements could adversely affect the Bancorp’s business, operating results, reported assets and liabilities, financial condition, and capital levels.
Changes to estimates and assumptions made by management in connection with the preparation of the Bancorp’s consolidated financial statements could adversely affect the reported amounts of assets and liabilities and the reported amounts of income and expenses. The preparation of the Bancorp’s consolidated financial statements requires management to make certain critical accounting estimates and assumptions that could affect the reported amounts of assets and liabilities and the reported amounts of income and expense during the reporting periods. Changes to management’s assumptions or estimates could materially and adversely affect Customers' business, operating results, reported assets and liabilities, financial condition, and capital levels.
Changes in accounting standards and policies can be difficult to predict and can materially impact how we record and report our financial results.
Our accounting policies and methods are fundamental to how we record and report our financial condition and results of operations. From time to time, the FASB or the SEC changes the financial accounting and reporting standards or the policies that govern the preparation of our financial statements. These changes can be difficult to predict and can materially impact how we record and report our financial condition and results of operations. We could be required to apply new or revised guidance retrospectively, which may result in the revision of prior period financial statements by material amounts. The implementation of new or revised accounting guidance could have a material adverse effect on our financial results or net worth. Notably, the FASB recently issued a new framework for estimating the allowance for loan and lease losses which could significantly alter the current estimate as well as other elements of the U.S. banking model.
22
Downgrades in U.S. Government and federal agency securities could adversely affect Customers Bancorp and the Bank.
The long-term impact of the downgrade of the U.S. Government and federal agencies from an AAA to an AA+ credit rating is still uncertain. However, in addition to causing economic and financial market disruptions, the downgrade, and any future downgrades and/or failures to raise the U.S. debt limit if necessary in the future, could, among other things, materially adversely affect the market value of the U.S. and other government and governmental agency securities owned by Customers Bank, the availability of those securities as collateral for borrowing, and our ability to access capital markets on favorable terms, as well as have other material adverse effects on the operation of our business and our financial results and condition. In particular, it could increase interest rates and disrupt payment systems, money markets, and long-term or short-term fixed income markets, adversely affecting the cost and availability of funding, which could negatively affect profitability. Also, the adverse consequences as a result of the downgrade could extend to the borrowers of the loans the Bank makes and, as a result, could adversely affect its borrowers’ ability to repay their loans.
We may not be able to maintain consistent earnings or profitability.
Although we made a profit for the years of 2011 through
2016
, there can be no assurance that we will be able to remain profitable in future periods, or, if profitable, that our overall earnings will remain consistent or increase in the future. Our earnings also may be reduced by increased expenses associated with increased assets, such as additional employee compensation expense, and increased interest expense on any liabilities incurred or deposits solicited to fund increases in assets. If earnings do not grow proportionately with our assets or equity, our overall profitability may be adversely affected.
Continued or worsening general business and economic conditions could materially and adversely affect us.
Our business and operations are sensitive to general business and economic conditions in the United States. If the U.S. economy experiences worsening conditions such as a recession, we could be materially and adversely affected. Weak economic conditions may be characterized by deflation, instability in debt and equity capital markets, a lack of liquidity and/or depressed prices in the secondary market for mortgage loans, increased delinquencies on loans, residential and commercial real estate price declines and lower home sales and commercial activity. Adverse changes in any of these factors could be detrimental to our business. Our business is also significantly affected by monetary and related policies of the U.S. federal government, its agencies and government-sponsored entities. Adverse changes in economic factors or U.S. government policies could have a negative effect on Customers Bancorp.
The geographic concentration in the Northeast and Mid-Atlantic region makes our business susceptible to downturns in the local economies and depressed banking markets, which could materially and adversely affect us.
Our loan and deposit activities are largely based in the Northeast and Mid-Atlantic regions. As a result, our financial performance depends upon economic conditions in this region. This region experienced deteriorating local economic conditions in the past economic cycle and a downturn in the regional real estate market could harm our financial condition and results of operations because of the geographic concentration of loans within this region and because a large percentage of the loans are secured by real property. If there is decline in real estate values, the collateral value for our loans will decrease and our probability of incurring losses will increase as the ability to recover on defaulted loans by selling the underlying real estate will be lessened.
Additionally, Customers has made a significant investment in commercial real estate loans. Often in a commercial real estate transaction, repayment of the loan is dependent on the property generating sufficient rental income to service the loan. Economic conditions may affect the tenant’s ability to make rental payments on a timely basis, and may cause some tenants not to renew their leases, each of which may impact the debtor’s ability to make loan payments. Further, if expenses associated with commercial properties increase dramatically, the tenant’s ability to repay, and therefore the debtor’s ability to make timely loan payments, could be adversely affected. All of these factors could increase the amount of non-performing loans, increase our provision for loan losses and reduce our net income.
23
Our business is highly susceptible to credit risk.
As a lender, we are exposed to the risk that our customers will be unable to repay their loans according to the contractual terms and that the collateral securing the payment of their loans (if any) may not be sufficient to assure repayment. The risks inherent in making any loan include risks with respect to the ability of borrowers to repay their loans and, if applicable, the period of time over which the loan is repaid, risks relating to proper loan underwriting and guidelines, risks resulting from changes in economic and industry conditions, risks inherent in dealing with individual borrowers, and risks resulting from uncertainties as to the future value of collateral. Similarly, we have credit risk embedded in our securities portfolio. Our credit standards, procedures and policies are designed to reduce the risk of credit losses to a low level, but may not prevent us from incurring substantial credit losses.
Additionally, we may restructure originated or acquired loans if we believe the borrowers are experiencing problems servicing the debt pursuant to current terms and we believe the borrower is likely to fully repay their restructured obligations. We may also be subject to legal or regulatory requirements for restructured loans. With respect to restructured loans, we may grant concessions to borrowers experiencing financial difficulties in order to facilitate repayment of the loan by a reduction of the stated interest rate for the remaining life of the loan to lower than the current market rate for new loans with similar risk or an extension of the maturity date.
We depend on our executive officers and key personnel to implement our strategy and could be harmed by the loss of their services.
We believe that the implementation of our strategy will depend in large part on the skills of our executive management team and our ability to motivate and retain these and other key personnel. Accordingly, the loss of service of one or more of our executive officers or key personnel could reduce our ability to successfully implement our growth strategy and materially and adversely affect us. Leadership changes will occur from time to time, and if significant resignations occur, we may not be able to recruit additional qualified personnel. We believe our executive management team possesses valuable knowledge about the banking industry and that their knowledge and relationships would be very difficult to replicate. Although our Chief Executive Officer, President, and Chief Financial Officer have entered into employment agreements with us, it is possible that they may not complete the term of their employment agreement or may choose not to renew it upon expiration.
Our customers also rely on us to deliver personalized financial services. Our strategic model is dependent upon relationship managers and private bankers who act as a customer’s point of contact to us. The loss of the service of these individuals could undermine the confidence of our customers in our ability to provide such personalized services. We need to continue to attract and retain these individuals and to recruit other qualified individuals to ensure continued growth. In addition, competitors may recruit these individuals in light of the value of the individuals’ relationships with their customers and communities and we may not be able to retain such relationships absent the individuals. In any case, if we are unable to attract and retain our relationship managers and private bankers, and recruit individuals with appropriate skills and knowledge to support our business, our growth strategy, business, financial condition and results of operations may be adversely affected.
Our success also depends on the experience of our branch managers and lending officers and on their relationships with the customers and communities they serve. The loss of these key personnel could negatively impact our banking operations. The loss of key senior personnel, or the inability to recruit and retain qualified personnel in the future, could have a material adverse effect on us.
We face significant competition from other financial institutions and financial services providers, which may materially and adversely affect us.
Commercial and consumer banking is highly competitive. Our markets contain a large number of community and regional banks as well as a significant presence of the country’s largest commercial banks. We compete with other state and national financial institutions, including savings and loan associations, savings banks and credit unions, for deposits and loans. In addition, we compete with financial intermediaries, such as consumer finance companies, mortgage banking companies, insurance companies, securities firms, mutual funds and several government agencies, as well as major retailers, in providing various types of loans and other financial services. Some of these competitors may have a long history of successful operations in our markets, greater ties to local businesses and more expansive banking relationships, as well as better established depositor bases. Competitors may also have greater resources and access to capital and may possess other advantages such as operating more ATMs and conducting extensive promotional and advertising campaigns or operating a more developed Internet platform. Competitors may also exhibit a greater tolerance for risk and behave more aggressively with respect to pricing in order to increase their market share.
24
The financial services industry could become even more competitive as a result of legislative, regulatory and technological changes and continued consolidation. Increased competition among financial services companies due to the recent consolidation of certain competing financial institutions may adversely affect our ability to market our products and services. Technological advances have lowered barriers to entry and made it possible for banks to compete in our market without a retail footprint by offering competitive rates, as well as non-banks to offer products and services traditionally provided by banks. Our ability to compete successfully depends on a number of factors, including, among others:
|
•
|
the ability to develop, maintain and build upon long-term customer relationships based on high quality, personal service, effective and efficient products and services, high ethical standards and safe and sound assets;
|
|
•
|
the scope, relevance and competitive pricing of products and services offered to meet customer needs and demands;
|
|
•
|
the ability to provide customers with maximum convenience of access to services and availability of banking representatives;
|
|
•
|
the ability to attract and retain highly qualified employees to operate our business;
|
|
•
|
the ability to expand our market position;
|
|
•
|
customer access to our decision makers, and customer satisfaction with our level of service; and
|
|
•
|
the ability to operate our business effectively and efficiently.
|
Failure to perform in any of these areas could significantly weaken our competitive position, which could materially and adversely affect us.
Like other financial services institutions, our asset and liability structures are monetary in nature. Such structures are affected by a variety of factors, including changes in interest rates, which can impact the value of financial instruments held by us.
Like other financial services institutions, we have asset and liability structures that are essentially monetary in nature and are directly affected by many factors, including domestic and international economic and political conditions, broad trends in business and finance, legislation and regulation affecting the national and international business and financial communities, monetary and fiscal policies, inflation, currency values, market conditions, the availability and terms (including cost) of short-term or long-term funding and capital, the credit capacity or perceived creditworthiness of customers and counterparties and the level and volatility of trading markets. Such factors can impact customers and counterparties of a financial services institution and may impact the value of financial instruments held by a financial services institution.
Our earnings and cash flows largely depend upon the level of our net interest income, which is the difference between the interest income we earn on loans, investments and other interest earning assets, and the interest we pay on interest bearing liabilities, such as deposits and borrowings. Because different types of assets and liabilities may react differently and at different times to market interest rate changes, changes in interest rates can increase or decrease our net interest income. When interest-bearing liabilities mature or reprice more quickly than interest earning assets in a period, an increase in interest rates would reduce net interest income. Similarly, when interest earning assets mature or reprice more quickly, and because the magnitude of repricing of interest earning assets is often greater than interest bearing liabilities, falling interest rates would reduce net interest income.
Accordingly, changes in the level of market interest rates affect our net yield on interest earning assets and liabilities, loan and investment securities portfolios and our overall results. Changes in interest rates may also have a significant impact on any future loan origination revenues. Changes in interest rates also have a significant impact on the carrying value of a significant percentage of the assets, both loans and investment securities, on our balance sheet. We may incur debt in the future and that debt may also be sensitive to interest rates and any increase in interest rates could materially and adversely affect us. Interest rates are highly sensitive to many factors beyond our control, including general economic conditions and policies of various governmental and regulatory agencies, particularly the Federal Reserve. Adverse changes in the Federal Reserve’s interest rate policies or other changes in monetary policies and economic conditions could materially and adversely affect us.
25
We are dependent on our information technology and telecommunications systems and third-party servicers, and systems failures, interruptions or breaches of security could have a material adverse effect on us.
Our business is highly dependent on the successful and uninterrupted functioning of our information technology and telecommunications systems and third-party servicers. We outsource many of our major systems, such as data processing, loan servicing and deposit processing systems. The failure of these systems, or the termination of a third-party software license or service agreement on which any of these systems is based, could interrupt our operations. Because our information technology and telecommunications systems interface with and depend on third-party systems, we could experience service denials if demand for such services exceeds capacity or such third-party systems fail or experience interruptions. If significant, sustained or repeated, a system failure or service denial could compromise our ability to operate effectively, damage our reputation, result in a loss of customer business, and/or subject us to additional regulatory scrutiny and possible financial liability, any of which could have a material adverse effect on us.
In addition, we provide our customers with the ability to bank remotely, including online, over the Internet and over the telephone. The secure transmission of confidential information over the Internet and other remote channels is a critical element of remote banking. Our network could be vulnerable to unauthorized access, computer viruses, phishing schemes and other security breaches. We may be required to spend significant capital and other resources to protect against the threat of security breaches and computer viruses, or to alleviate problems caused by security breaches or viruses. To the extent that our activities or the activities of our customers involve the storage and transmission of confidential information, security breaches and viruses could expose us to claims, regulatory scrutiny, litigation and other possible liabilities. Any inability to prevent security breaches or computer viruses could also cause existing customers to lose confidence in our systems and could materially and adversely affect us.
Additionally, financial products and services have become increasingly technology-driven. Our ability to meet the needs of our customers competitively, and in a cost-efficient manner, is dependent on the ability to keep pace with technological advances and to invest in new technology as it becomes available. Certain competitors may have greater resources to invest in technology and may be better equipped to market new technology-driven products and services. The ability to keep pace with technological change is important, and the failure to do so could have a material adverse impact on our business and therefore on our financial condition and results of operations.
Loss of, or failure to adequately safeguard, confidential or proprietary information may adversely affect the Bancorp’s operations, net income or reputation.
The Bancorp regularly collects, processes, transmits and stores significant amounts of confidential information regarding its customers, employees and others. This information is necessary for the conduct of the Bancorp’s business activities, including the ongoing maintenance of deposit, loan, investment management and other account relationships for our customers, and receiving instructions and affecting transactions for those customers and other users of the Bancorp’s products and services. In addition to confidential information regarding its customers, employees and others, the Bancorp compiles, processes, transmits and stores proprietary, non-public information concerning its own business, operations, plans and strategies. In some cases, this confidential or proprietary information is collected, compiled, processed, transmitted or stored by third parties on behalf of the Bancorp.
Information security risks have generally increased in recent years because of the proliferation of new technologies and the increased sophistication and activities of perpetrators of cyber-attacks. A failure in or breach of the Bancorp’s operational or information security systems, or those of the Bancorp’s third-party service providers, as a result of cyber-attacks or information security breaches or due to employee error, malfeasance or other disruptions could adversely affect our business, result in the disclosure or misuse of confidential or proprietary information, damage our reputation, increase our costs and/or cause losses. As a result, cyber security and the continued development and enhancement of the controls and processes designed to protect the Bancorp’s systems, computers, software, data and networks from attack, damage or unauthorized access remain a priority for the Bancorp.
If this confidential or proprietary information were to be mishandled, misused or lost, the Bancorp could be exposed to significant regulatory consequences, reputational damage, civil litigation and financial loss. Mishandling, misuse or loss of this confidential or proprietary information could occur, for example, if the confidential or proprietary information were erroneously provided to parties who are not permitted to have the information, either by fault of the systems or employees of the Bancorp, or the systems or employees of third parties which have collected, compiled, processed, transmitted or stored the information on the Bancorp’s behalf, where the information is intercepted or otherwise inappropriately taken by third parties or where there is a failure or breach of the network, communications or information systems which are used to collect, compile, process, transmit or store the information.
26
Although the Bancorp employs a variety of physical, procedural and technological safeguards to protect this confidential and proprietary information from mishandling, misuse or loss, these safeguards do not provide absolute assurance that mishandling, misuse or loss of the information will not occur, or that if mishandling, misuse or loss of the information did occur, those events would be promptly detected and addressed. Additionally, as information security risks and cyber threats continue to evolve, the Bancorp may be required to expend additional resources to continue to enhance its information security measures and/or to investigate and remediate any information security vulnerabilities.
Our directors and executive officers can influence the outcome of shareholder votes and, in some cases, shareholders may not have the opportunity to evaluate and affect the investment decision regarding a potential investment or acquisition transaction.
As of
December 31, 2016
, the directors and executive officers of Customers Bancorp as a group owned a total of 2,051,523 shares of Voting Common Stock and exercisable options and warrants to purchase up to an additional 1,086,718 shares of Voting Common Stock, which potentially gives them, as a group, the ability to control approximately 10.00
%
of the issued and outstanding Voting Common Stock. In addition, a director of Customers Bank who is not a director of Customers Bancorp owns an additional 14,706 shares of Voting Common Stock, which if combined with the directors and officers of Customers Bancorp, potentially gives them, as a group, the ability to control approximately 10.05% of the issued and outstanding Voting Common Stock. We believe ownership of stock causes directors and officers to have the same interests as shareholders, but it also gives them the ability to vote as shareholders for matters that are in their personal interest, which may be contrary to the wishes of other shareholders. Shareholders will not necessarily be provided with an opportunity to evaluate the specific merits or risks of one or more target institutions. Any decision regarding a potential investment or acquisition transaction will be made by our board of directors. Except in limited circumstances as required by applicable law, consummation of an acquisition will not require the approval of holders of Voting Common Stock. Accordingly, the shareholder may not have an opportunity to evaluate and affect the investment decision regarding potential investment or acquisition transactions.
We intend to engage in acquisitions of other businesses from time to time. These acquisitions may not produce revenue or earnings enhancements or cost savings at levels, or within timeframes, originally anticipated and may result in unforeseen integration difficulties.
We regularly evaluate opportunities to strengthen our current market position by acquiring and investing in banks and in other complementary businesses, or opening new branches, and when appropriate opportunities arise, subject to regulatory approval, we plan to engage in acquisitions of other businesses and in opening new branches. Such transactions could, individually or in the aggregate, have a material effect on our operating results and financial condition, including short and long-term liquidity. Our acquisition activities could be material to our business. For example, we could issue additional shares of Voting Common Stock in a purchase transaction, which could dilute current shareholders’ value or ownership interest. These activities could require us to use a substantial amount of cash, other liquid assets and/or incur debt. In addition, if goodwill recorded in connection with acquisitions were determined to be impaired, then we would be required to recognize a charge against our earnings, which could materially and adversely affect our results of operations during the period in which the impairment was recognized. Our acquisition activities could involve a number of additional risks, including the risks of:
|
•
|
incurring time and expense associated with identifying and evaluating potential acquisitions and negotiating the terms of potential transactions, resulting in our attention being diverted from the operation of our existing business;
|
|
•
|
using inaccurate estimates and judgments to evaluate credit, operations, management and market risks with respect to the target institution or assets;
|
|
•
|
being potentially exposed to unknown or contingent liabilities of banks and businesses we acquire;
|
|
•
|
being required to expend time and expense to integrate the operations and personnel of the combined businesses;
|
|
•
|
experiencing higher operating expenses relative to operating income from the new operations;
|
|
•
|
creating an adverse short-term effect on our results of operations;
|
|
•
|
losing key employees and customers as a result of an acquisition that is poorly received; and
|
|
•
|
incurring significant problems relating to the conversion of the financial and customer data of the entity being acquired into our financial and customer product systems.
|
27
Additionally, in evaluating potential acquisition opportunities we may seek to acquire failed banks through FDIC-assisted acquisitions. While the FDIC may, in such acquisitions, provide assistance to mitigate certain risks, such as sharing in exposure to loan losses, and providing indemnification against certain liabilities, of the failed institution, we may not be able to accurately estimate our potential exposure to loan losses and other potential liabilities, or the difficulty of integration, in acquiring such institutions.
Depending on the condition of any institutions or assets that are acquired, any acquisition may, at least in the near term, materially adversely affect our capital and earnings and, if not successfully integrated following the acquisition, may continue to have such effects. We cannot assure you that we will be successful in overcoming these risks or any other problems encountered in connection with pending or potential acquisitions. Our inability to overcome these risks could have an adverse effect on levels of reported net income, return on equity and return on assets, and the ability to achieve our business strategy and maintain market value.
Our business and future success may suffer if we are unable to remain under $10 billion in total assets as of December 31 of each year before we sell or otherwise dispose of the BankMobile business, including the Disbursement business.
Under federal law and regulation, we must remain under $10 billion in total assets as of December 31 of each year to qualify as a small issuer of debit cards and receive the optimal debit card processing fee. Failure to qualify for the small issuer exception would result in a significant reduction in interchange fee income and would mean we would operate unprofitably or additional fees would need to be charged to students to replace the lost revenue. To optimize the value of the Customers franchise to shareholders, we have stated our intention to sell BankMobile before crossing the $10 billion total asset threshold. Market conditions, regulatory and legal conditions, BankMobile’s performance and other factors, some of which are not in our control, may limit, delay or prevent our planned sale, and prevent us from remaining under the $10 billion total asset threshold before the planned disposition. Accordingly, this could materially and adversely affect our financial condition and results of operations.
In connection with the Disbursement business, we depend on our relationship with higher education institutions and, in turn, student usage of our products and services for future growth of our BankMobile business.
The future growth of our BankMobile business depends, in part, on our ability to enter into agreements with higher education institutions. Our contracts with these clients can generally be terminated at will and, therefore, there can be no assurance that we will be able to maintain these clients. We may also be unable to maintain our agreements with these clients on terms and conditions acceptable to us. In addition, we may not be able to continue to establish new relationships with higher education institution clients. The termination of our current client contracts or our inability to continue to attract new clients could have a material adverse effect on our business, financial condition and results of operations.
Establishing new client relationships and maintaining current ones are also essential components of our strategy for attracting new student customers, deepening the relationship we have with existing customers and maximizing customer usage of our products and services. A reduction in enrollment, a failure to attract and maintain student customers, as well as any future demographic or other trends that reduce the number of higher education students could materially and adversely affect BankMobile's capability for both revenue and cash generation and, as a result, could have a material adverse effect on our business, financial condition and results of operations.
BankMobile's Disbursement business depends on the current government financial aid regime that relies on the outsourcing of financial aid disbursements through higher education institutions.
In general, the U.S. federal government distributes financial aid to students through higher education institutions as intermediaries. BankMobile's Disbursement business provides our higher education institution clients an electronic system for improving the administrative efficiency of this refund disbursement process. If the government, through legislation or regulatory action, restructures the existing financial aid regime in such a way that reduces or eliminates the intermediary role played by financial institutions serving higher education institutions or limits or regulates the role played by service providers such as us, our business, results of operations and BankMobile's prospects for future growth could be materially and adversely affected.
28
A change in the availability of financial aid, as well as U.S. budget constraints, could materially and adversely affect our financial performance by reducing demand for BankMobile's services.
The higher education industry depends heavily upon the ability of students to obtain financial aid. As part of our contracts with our higher education institution clients that use BankMobile's Disbursement business services, students’ financial aid and other refunds are sent to us for disbursement. The fees that we charge most of our Disbursement business higher education institution clients are based on the number of financial aid disbursements that we make to students. In addition, our relationships with Disbursement business higher education institution clients provide us with a market for BankMobile. Consequently, a change in the availability or amount of financial aid that restricted client use of our Disbursement business service or otherwise limited our ability to attract new higher education institution clients could materially and adversely affect our financial performance. Also, decreases in the amount of financial aid disbursements from higher education institutions to students could materially and adversely affect our financial performance. Future legislative and executive branch efforts to reduce the U.S. federal budget deficit or worsening economic conditions may require the government to severely curtail its financial aid spending, which could materially and adversely affect our business, financial condition and results of operations.
Providing disbursement services to higher education institutions is an uncertain business; if the market for BankMobile's products does not continue to develop, we will not be able to grow this portion of our business.
The success of BankMobile's Disbursement business will depend, in part, on our ability to generate revenues by providing financial transaction services to higher education institutions and their students. The market for these services has evolved and the long-term viability and profitability of this market is unproven. Our business will be materially and adversely affected if we do not develop and market products and services that achieve and maintain market acceptance. Outsourcing disbursement services may not become as widespread in the higher education industry as we anticipate, and our products and services may not achieve continued commercial success. In addition, higher education institution clients could discontinue using our services and return to in-house disbursement solutions. If outsourcing disbursement services does not become as widespread as we anticipate or if higher education institution clients return to their prior methods of disbursement, our growth prospects, business, financial condition and results of operations could be materially and adversely affected.
Our business will suffer if we fail to successfully integrate the Disbursement businesses and technologies or to appropriately assess the risks associated with that transaction.
The successful integration of the Disbursement business, on a cost-effective basis, may be critical to our future performance. There are a number of risks and uncertainties associated with such integration, including: we may not be able to achieve expected synergies and operating efficiencies regarding the Disbursement business acquisition within the expected time-frames or at all and to successfully integrate the Disbursement business operations; such integration may be more difficult, time-consuming or costly than expected; we may not be successful in converting new clients gained through the acquisition to our own; revenues following the transaction may be lower than expected; operating costs, client and customer loss and business disruption (including, difficulties in maintaining relationships with employees, customers, clients or suppliers) may be greater than expected following the acquisition; we may have difficulty retaining certain key employees in the acquired Disbursement business; we may be subject to legal proceedings that may be instituted against the parties and others related to the acquisition agreement; and the amount of the costs, fees, expenses and charges related to the acquisition may be greater than anticipated. If we do not successfully integrate the Disbursement business, or if the benefits of this transaction do not meet the expectations of financial or industry analysts, the market price of our common stock may decline. Even if we successfully integrate the Disbursement business, we may incur substantial expenses and devote significant management time and resources in seeking to complete the integration and the acquired Disbursement business may not perform as we expect or enhance the value of our business as a whole.
Our business and future success may suffer if we are unable to successfully implement our strategy to combine the Disbursement business with BankMobile.
A significant component of our growth strategy is dependent on our ability to have students of our higher education institution clients select BankMobile during the refund disbursement selection process and to convert those student BankMobile customers, along with the existing student customers we acquired through the Disbursement business acquisition, into lifetime customers with BankMobile as their primary banking relationship. In particular, our growth strategy depends on our ability to successfully cross-sell our core banking products and services to these student customers after they graduate from college. We may not be successful in implementing this strategy because these student customers and potential student customers may believe our products and services unnecessary or unattractive. Our failure to sell our products and services to students after they graduate and to attract new student customers could have a material adverse effect on our prospects, business, financial condition and results of operations.
29
If the integration of the Disbursement business disrupts our business operations and prevents us from realizing intended benefits, our business may be harmed.
The integration of the Disbursement business may disrupt the operation of our business and prevent us from realizing the intended benefits of the Disbursement business as a result of a number of obstacles, such as the loss of key employees, customers or business partners, the failure to adjust or implement our business strategies, additional expenditures required to facilitate the integration and the diversion of management’s attention from our day-to-day operations.
Breaches of security measures, unauthorized access to or disclosure of data relating to our higher education institution clients or BankMobile and student BankMobile account holders, computer viruses or unauthorized software (malware), fraudulent activity, and infrastructure failures could materially and adversely affect our reputation or harm our business.
Companies that process and transmit cardholder information have been specifically and increasingly targeted by sophisticated criminal organizations in an effort to obtain the information and utilize it for fraudulent transactions. The encryption software and the other technologies we use to provide security for storage, processing and transmission of confidential customer and other information may not be effective to protect against data security breaches. The risk of unauthorized circumvention of our security measures has been heightened by advances in computer capabilities and the increasing sophistication of hackers.
Unauthorized access to our computer systems, or those of our third-party service providers, could result in the theft or publication of the information or the deletion or modification of sensitive records, and could cause interruptions in our operations. Any inability to prevent security breaches could damage our relationships with our higher education institution customers, cause a decrease in transactions by individual cardholders, expose us to liability for unauthorized purchases, and subject us to network fines. These claims also could result in protracted and costly litigation. If unsuccessful in defending that litigation, we might be forced to pay damages and/or change our business practices. Further, a significant data security breach could lead to additional regulation, which could impose new and costly compliance obligations. Any material increase in our costs resulting from litigation or additional regulatory burdens being imposed upon us or litigation could have a material adverse effect on our operating revenues and profitability.
In addition, our higher education institution clients and student BankMobile account holders disclose to us certain “personally identifiable” information, including student contact information, identification numbers and the amount of credit balances, which they expect we will maintain in confidence. It is possible that hackers, customers or employees acting unlawfully or contrary to our policies, or other individuals, could improperly access our or our vendors’ systems and obtain or disclose data about our customers. Further, because customer data may also be collected, stored, or processed by third-party vendors, it is possible that these vendors could intentionally, negligently or otherwise disclose data about our clients or customers.
We rely to a large extent upon sophisticated information technology systems, databases, and infrastructure, and take reasonable steps to protect them. However, due to their size, complexity, content and integration with or reliance on third-party systems they are vulnerable to breakdown, malicious intrusion, natural disaster and random attack, all of which pose a risk of exposure of sensitive data to unauthorized persons or to the public.
A cybersecurity breach of our information systems could lead to fraudulent activity such as identity theft, losses on the part of our banking customers, additional security costs, negative publicity and damage to our reputation and brand. In addition, our customers could be subject to scams that may result in the release of sufficient information concerning themselves or their accounts to allow others unauthorized access to their accounts or our systems (e.g., “phishing” and “smishing”). Claims for compensatory or other damages may be brought against us as a result of a breach of our systems or fraudulent activity. If we are unsuccessful in defending against any resulting claims against us, we may be forced to pay damages, which could materially and adversely affect our financial condition and results of operations.
Because the techniques used to obtain unauthorized access, disable or degrade service, or sabotage systems change frequently and often are not recognized until launched against a target, we may be unable to anticipate these techniques or to implement adequate preventative measures.
Further, computer viruses or malware could infiltrate our systems, thus disrupting our delivery of services and making our applications unavailable. Although we utilize several preventative and detective security controls in our network, they may be ineffective in preventing computer viruses or malware that could damage our relationships with our merchant customers, cause a decrease in transactions by individual cardholders, or cause us to be in non-compliance with applicable network rules and regulations.
30
In addition, a significant incident of fraud or an increase in fraud levels generally involving our products could result in reputational damage to us, which could reduce the use of our products and services. Such incidents could also lead to a large financial loss as a result of the protection for unauthorized purchases we provide to BankMobile customers given that we may be liable for any uncollectible account holder overdrafts and any other losses due to fraud or theft. Such incidents of fraud could also lead to regulatory intervention, which could increase our compliance costs. Compliance with the various complex laws and regulations is costly and time consuming, and failure to comply could have a material adverse effect on our business. Additionally, increased regulatory requirements on our services may increase our costs, which could materially and adversely affect our business, financial condition and results of operations. Accordingly, account data breaches and related fraudulent activity could have a material adverse effect on our future growth prospects, business, financial condition and results of operations.
A disruption to our systems or infrastructure could damage our reputation, expose us to legal liability, cause us to lose customers and revenue, result in the unintentional disclosure of confidential information or require us to expend significant efforts and resources or incur significant expense to eliminate these problems and address related data and security concerns. The harm to our business could be even greater if such an event occurs during a period of disproportionately heavy demand for our products or services or traffic on our systems or networks.
Prior to our acquisition of the Disbursement business,
the Federal Reserve Board and FDIC took regulatory enforcement action against Higher One, which subjected us to regulatory inquiry and potential regulatory enforcement action, which may result in liabilities adversely affecting our business, financial conditions and/or results of operations, or in reputational harm.
Since August 2013 until the acquisition of the Disbursement business, Customers provided deposit accounts and services to college students through Higher One, which had relationships with colleges and universities in the United States, using Higher One’s technological services. Because Higher One was not a bank, it had to partner with one or more banks to provide the deposit accounts and services to students. Higher One and one of Higher One’s former bank partners (the “predecessor bank”), announced in May 2014 that the Federal Reserve Board notified them that certain disclosures and operating processes of these entities may have violated certain laws and regulations and may result in penalties and restitution. In May 2014, the Federal Reserve also informed Customers, as one of Higher One’s bank partners, that it was recommending a regulatory enforcement action be initiated against Customers Bank based on the same allegations.
In July 2014, the predecessor bank referenced above, which no longer is a partner with Higher One, entered into a consent order to cease and desist with the Federal Reserve Board pursuant to which it agreed to pay a total of $3.5 million in civil money penalties and an additional amount that it may be required to pay in restitution to students in the event Higher One is unable to pay the restitution obligations, if any, imposed on Higher One (“back-up restitution”). Customers Bank believes that the circumstances of its relationship with Higher One and the student customers are different than the relationship between the predecessor bank and Higher One and the student customers.
In December 2015, Higher One entered into consent orders with both the Federal Reserve Board and the FDIC. Under the consent order with the Federal Reserve Board, Higher One agreed to pay $2.2 million in civil money penalties, and $24 million in restitution to students. Under the consent order with the FDIC, Higher One agreed to pay an additional $2.2 million in civil money penalties, and $31 million in restitution to students. In addition, a third partner bank, which is regulated by the FDIC, also entered into a consent order to cease and desist with the FDIC pursuant to which it agreed to pay $1.8 million in civil money penalties and an additional amount in restitution to students in the event Higher One is unable to meet its restitution obligation.
Customers believes that it identified key critical alleged compliance deficiencies within 30 days of first accepting deposits through its relationship with Higher One, and caused such deficiencies to be remediated within approximately 120 days. In addition, Customers understands that the total amount of fees that Higher One collected from students who opened accounts at Customers during the relevant time period is substantially less than the total fees that Higher One collected from students who opened deposit accounts at the other partner banks during the relevant time period. In addition, as Higher One paid the restitution, and deposited such monies to pay the required restitution, Customers does not expect that backup restitution will be required.
Nonetheless, as previously disclosed, Customers had been in discussions with the Federal Reserve Board regarding these matters from 2013 and in an effort to move forward, on December 6, 2016, Customers agreed to the issuance by the Federal Reserve Board of a combined Order to Cease and Desist and Order of Assessment of a Civil Money Penalty Issued Upon Consent Pursuant to the Federal Deposit Insurance Act, as amended (the "Order") and agreed to a penalty of $960,000.
31
Customers remains subject to the jurisdiction and examination of the Federal Reserve Board and further action could be taken to the extent we do not comply with the terms of the Order or if the Federal Reserve Board were to identify additional violations of applicable laws and regulations. Any further action could have a material adverse effect on our business, financial conditions and/or results of operations, or our reputation.
Termination of, or changes to, the MasterCard association registration could materially and adversely affect our business, financial condition and results of operations.
The student checking account debit cards issued in connection with the Disbursement business are subject to MasterCard association rules that could subject us to a variety of fines or penalties that may be levied by MasterCard for acts or omissions by us or businesses that work with us. The termination of the card association registration held by us or any changes in card association or other network rules or standards, including interpretation and implementation of existing rules or standards, that increase the cost of doing business or limit our ability to provide our products and services could materially and adversely affect our business, financial condition and results of operations.
Our business and future success may suffer if we are unable to continue to successfully implement our strategy for BankMobile.
The effective use of technology can increase efficiency and enable financial institutions to better serve customers and to reduce costs. However, some new technologies, including BankMobile, are not fully tested and we may incur substantial expenses and devote significant management time and resources in order for BankMobile to compete effectively. Revenue generated from BankMobile’s no fee or very low fee banking strategy may not perform as well as we expect or enhance the value of our business as a whole and it could materially and adversely affect our financial condition and results of operations. Additionally, if the benefits of BankMobile do not meet the expectations of financial or industry analysts, the market price of our common stock may decline.
Our acquisitions generally will require regulatory approvals, and failure to obtain them would restrict our growth.
We intend to complement and expand our business by pursuing strategic acquisitions of community banking franchises and other businesses. Generally, any acquisition of target financial institutions, banking centers or other banking assets by us may require approval by, and cooperation from, a number of governmental regulatory agencies, possibly including the Federal Reserve, the OCC and the FDIC, as well as state banking regulators. In acting on applications, federal banking regulators consider, among other factors:
|
•
|
the effect of the acquisition on competition;
|
|
•
|
the financial condition, liquidity, results of operations, capital levels and future prospects of the applicant and the bank(s) involved;
|
|
•
|
the quantity and complexity of previously consummated acquisitions;
|
|
•
|
the managerial resources of the applicant and the bank(s) involved;
|
|
•
|
the convenience and needs of the community, including the record of performance under the Community Reinvestment Act (“CRA”);
|
|
•
|
the effectiveness of the applicant in combating money laundering activities; and
|
|
•
|
the extent to which the acquisition would result in greater or more concentrated risks to the stability of the United States banking or financial system.
|
Such regulators could deny our application based on the above criteria or other considerations, which could restrict our growth, or the regulatory approvals may not be granted on terms that are acceptable to us. For example, we could be required to sell banking centers as a condition to receiving regulatory approvals, and such a condition may not be acceptable to us or may reduce the benefit of any acquisition.
32
The success of future transactions will depend on our ability to successfully identify and consummate acquisitions of banking franchises that meet our investment objectives. Because of the intense competition for acquisition opportunities and the limited number of potential targets, we may not be able to successfully consummate acquisitions on attractive terms, or at all, that are necessary to grow our business.
Our acquisition history should be viewed in the context of the recent opportunities available to us as a result of the confluence of our access to capital at a time when market dislocations of historical proportions resulted in attractive asset acquisition opportunities. As conditions change, we may prove to be unable to execute our acquisition strategy, which could materially and adversely affect us. The success of future transactions will depend on our ability to successfully identify and consummate transactions with target banking franchises that meet our investment objectives. There are significant risks associated with our ability to identify and successfully consummate these acquisitions. There are a limited number of acquisition opportunities, and we expect to encounter intense competition from other banking organizations competing for acquisitions and also from other investment funds and entities looking to acquire financial institutions. Many of these entities are well established and have extensive experience in identifying and consummating acquisitions directly or through affiliates. Many of these competitors possess ongoing banking operations with greater financial, technical, human and other resources and access to capital than we do, which could limit the acquisition opportunities we pursue. Our competitors may be able to achieve greater cost savings, through consolidating operations or otherwise, than we could. These competitive limitations give others an advantage in pursuing certain acquisitions. In addition, increased competition may drive up the prices for the acquisitions we pursue and make the other acquisition terms more onerous, which would make the identification and successful consummation of those acquisitions less attractive to us. Competitors may be willing to pay more for acquisitions than we believe are justified, which could result in us having to pay more for them than we prefer or to forego the opportunity. As a result of the foregoing, we may be unable to successfully identify and consummate acquisitions on attractive terms, or at all, that are necessary to grow our business.
We will generally establish the pricing of transactions and the capital structure of banking franchises to be acquired by us on the basis of financial projections for such banking franchises. In general, projected operating results will be based on the judgment of our management team. In all cases, projections are only estimates of future results that are based upon assumptions made at the time that the projections are developed and the projected results may vary significantly from actual results. General economic, political and market conditions can have a material adverse impact on the reliability of such projections. In the event that the projections made in connection with our acquisitions, or future projections with respect to new acquisitions, are not accurate, such inaccuracies could materially and adversely affect us.
We are subject to certain risks related to FDIC-assisted acquisitions.
The success of past FDIC-assisted acquisitions, and any FDIC-assisted acquisitions in which we may participate in the future, will depend on a number of factors, including our ability to:
|
•
|
fully integrate, and to integrate successfully, the branches acquired into bank operations;
|
|
•
|
limit the outflow of deposits held by new customers in the acquired branches and to successfully retain and manage interest-earning assets (loans) acquired in FDIC-assisted acquisitions;
|
|
•
|
retain existing deposits and to generate new interest-earning assets in the geographic areas previously served by the acquired banks;
|
|
•
|
effectively compete in new markets in which we did not previously have a presence;
|
|
•
|
successfully deploy the cash received in the FDIC-assisted acquisitions into assets bearing sufficiently high yields without incurring unacceptable credit or interest rate risk;
|
|
•
|
control the incremental non-interest expense from the acquired branches in a manner that enables us to maintain a favorable overall efficiency ratio;
|
|
•
|
retain and attract the appropriate personnel to staff the acquired branches; and
|
|
•
|
earn acceptable levels of interest and non-interest income, including fee income, from the acquired bank.
|
As with any acquisition involving a financial institution, particularly one involving the transfer of a large number of bank branches (as is often the case with FDIC-assisted acquisitions), there may be higher than average levels of service disruptions that would cause inconveniences or potentially increase the effectiveness of competing financial institutions in attracting our customers. Integrating the acquired branches could present unique challenges and opportunities because of the nature of the transactions. Integration efforts will also likely divert our management’s attention and resources. It is not known whether we will be able to integrate acquired branches successfully, and the integration process could result in the loss of key employees,
33
the disruption of ongoing business or inconsistencies in standards, controls, procedures and policies that adversely affect our ability to maintain relationships with clients, customers, depositors and employees or to achieve the anticipated benefits of the FDIC-assisted acquisitions. We may also encounter unexpected difficulties or costs during integration that could materially adversely affect our earnings and financial condition. Additionally, we may be unable to compete effectively in the market areas previously served by the acquired branches or to manage any growth resulting from FDIC-assisted acquisitions effectively.
Our willingness and ability to grow acquired branches following FDIC-assisted acquisitions depend on several factors, most importantly the ability to retain certain key personnel that we hire or transfer in connection with FDIC-assisted acquisitions. Our failure to retain these employees could adversely affect the success of FDIC-assisted acquisitions and our future growth.
FDIC-assisted acquisition opportunities may not become available and increased competition may make it more difficult for us to bid on failed bank transactions on terms considered to be acceptable.
Our near-term business strategy includes consideration of potential acquisitions of failing banks that the FDIC plans to place in receivership. The FDIC may not place banks that meet our strategic objectives into receivership. Failed bank transactions are attractive opportunities in part because of loss sharing arrangements with the FDIC that limit the acquirer’s downside risk on the purchased loan portfolio and, apart from our assumption of deposit liabilities, we have significant discretion as to the non-deposit liabilities that we assume. In addition, assets purchased from the FDIC are marked to their fair value and in many cases there is little or no addition to goodwill arising from an FDIC-assisted acquisition. The bidding process for failing banks could become very competitive, and the increased competition may make it more difficult for us to bid on terms we consider to be acceptable. Further, all FDIC-assisted acquisitions would require us to obtain applicable regulatory approval.
Some institutions we could acquire may have distressed assets and there can be no assurance that we will be able to realize the value predicted from these assets or that we will make sufficient provision for future losses in the value of, or accurately estimate the future write-downs taken in respect of, these assets.
Loan portfolios and other assets acquired in transactions may experience increases in delinquencies and losses in the loan portfolios, or in amounts that exceed initial forecasts developed during the due diligence investigation prior to acquiring those institutions. In addition, asset values may be impaired in the future due to factors that cannot currently be predicted, including deterioration in economic conditions and subsequent declines in collateral values and credit quality indicators. Any of these events could adversely affect the financial condition, liquidity, capital position and value of institutions acquired and of our business as a whole. Further, as a registered bank holding company, if we acquire bank subsidiaries, they may become subject to cross-guaranty liability under applicable banking law. If we do so and any of the foregoing adverse events occur with respect to one subsidiary, they may adversely affect other subsidiaries. Asset valuations are estimates of value and there is no certainty that we will be able to sell assets of target institutions at the estimated value, even if it is determined to be in our best interests to do so. The institutions we may target may have substantial amounts of asset classes for which there is currently limited or no marketability.
As a result of an investment or acquisition transaction, we may be required to take write-downs or write-offs, restructuring and impairment or other charges that could have a significant negative effect on our financial condition and results of operations.
We conduct due diligence investigations of target institutions we intend to acquire. Due diligence is time consuming and expensive due to the operations, accounting, finance and legal professionals who must be involved in the due diligence process. Even if extensive due diligence is conducted on a target institution with which we may be combined, this diligence may not reveal all material issues that may affect a particular target institution, and factors outside our control, or the control of the target institution, may later arise. If, during the diligence process, we fail to identify issues specific to a target institution or the environment in which the target institution operates, we may be forced to later write down or write off assets, restructure operations or incur impairment or other charges that could result in reporting losses. These charges may also occur if we are not successful in integrating and managing the operations of the target institution with which we combine. In addition, charges of this nature may cause us to violate net worth or other covenants to which we may be subject as a result of assuming preexisting debt held by a target institution or by virtue of obtaining debt financing.
34
Resources could be expended in considering or evaluating potential investment or acquisition transactions that are not consummated, which could materially and adversely affect subsequent attempts to locate and acquire or merge with another business.
We anticipate that the investigation of each specific target institution and the negotiation, drafting and execution of relevant agreements, disclosure documents and other instruments will require substantial management time and attention and substantial costs for accountants, attorneys and others. If a decision is made not to complete a specific investment or acquisition transaction, the costs incurred up to that point for the proposed transaction likely would not be recoverable. Furthermore, even if an agreement is reached relating to a specific target institution, we may fail to consummate the investment or acquisition transaction for any number of reasons, including those beyond our control. Any such event will result in a loss of the related costs incurred, and could result in additional costs or expenses, which could materially and adversely affect subsequent attempts to locate and acquire or merge with another institution and our reported earnings.
If we do not open new branches as planned, or do not achieve targeted profitability on new branches, earnings may be reduced.
Customers Bank is interested in opening or acquiring four to six new branches annually for the next several years in and around our target markets of southeastern Pennsylvania, New Jersey, New York, Maryland, Connecticut, Virginia and Delaware. Our ability to open or acquire branches is subject to regulatory approvals. We cannot predict whether the banking regulators will agree with our growth plans or if or when they will provide the necessary branch approvals. Numerous factors contribute to the performance of a new branch, such as the ability to select a suitable location, competition, our ability to hire and retain qualified personnel, and the effectiveness of our marketing strategy. It takes time for a new branch to generate significant deposits and loan volume to offset expenses, some of which, like salaries and occupancy expense, are relatively fixed costs. The initial cost, including capital asset purchases, for each new branch to open would be in a range of approximately $200,000 to $250,000. Additionally, there can be no assurance that any of these new branches will ever become profitable. During the period of time before a branch can become profitable, operating a branch will negatively impact net income.
To the extent that we are unable to increase loans through organic loan growth, we may be unable to successfully implement our growth strategy, which could materially and adversely affect us.
In addition to growing our business through strategic acquisitions, we also intend to grow our business through organic loan growth. While loan growth has been strong and our loan balances have increased over the past three fiscal years, much of the loan growth came from multi-family and commercial real estate lending. If the bank is unsuccessful with diversifying its loan originations or if we do not grow the existing business lines, our results of operations and financial condition could be negatively impacted.
We may not be able to effectively manage our growth.
Our future operating results and financial condition depend to a large extent on our ability to successfully manage our growth. Our growth has placed, and it may continue to place, significant demands on our operations and management. Whether through additional acquisitions or organic growth, our current plan to expand our business is dependent upon our ability to:
|
•
|
continue to implement and improve our operational, credit underwriting and administration, financial, accounting, enterprise risk management and other internal and disclosure controls and processes and our reporting systems and procedures in order to manage a growing number of client relationships;
|
|
•
|
comply with changes in, and an increasing number of, laws, rules and regulations, including those of any national securities exchange on which any of our securities become listed;
|
|
•
|
scale our technology and other systems’ platforms;
|
|
•
|
maintain and attract appropriate staffing;
|
|
•
|
operate profitably or raise capital; and
|
|
•
|
support our asset growth with adequate deposits, funding and liquidity while maintaining our net interest margin and meeting our customers’ and regulators’ liquidity requirements.
|
35
We may not successfully implement improvements to, or integrate, our management information and control systems, credit underwriting and administration, internal and disclosure controls, and procedures and processes in an efficient or timely manner and may discover deficiencies in existing systems and controls. In particular, our controls and procedures must be able to accommodate an increase in loan volume in various markets and the infrastructure that comes with new banking centers and banks. Our growth strategy may divert management from our existing business and may require us to incur additional expenditures to expand our administrative and operational infrastructure and, if we are unable to effectively manage and grow our banking franchise, including to the satisfaction of our regulators, we could be materially and adversely affected. In addition, if we are unable to manage our current and future expansion in our operations, we may experience compliance, operational and regulatory problems and delays, have to slow our pace of growth or even stop our market and product expansion, or have to incur additional expenditures beyond current projections to support such growth, any one of which could materially and adversely affect us. If we experience difficulties with the development of new business activities or the integration process of acquired businesses, the anticipated benefits of any particular acquisition may not be realized fully, or at all, or may take longer to realize than expected. Additionally, we may be unable to recognize synergies, operating efficiencies and/or expected benefits within expected timeframes and cost projections, or at all. We also may not be able to preserve the goodwill of an acquired financial institution. Our growth could lead to increases in our legal, audit, administrative and financial compliance costs, which could materially and adversely affect us.
If our techniques for managing risk are ineffective, we may be exposed to material unanticipated losses.
In order to manage the significant risks inherent in our business, we must maintain effective policies, procedures and systems that enable us to identify, monitor and control our exposure to material risks, such as credit, operational, legal and reputational risks. Our risk management methods may prove to be ineffective due to their design, their implementation or the degree to which we adhere to them, or as a result of the lack of adequate, accurate or timely information or otherwise. If our risk management efforts are ineffective, we could suffer losses that could have a material adverse effect on our business, financial condition or results of operations. In addition, we could be subject to litigation, particularly from our customers, and sanctions or fines from regulators. Our techniques for managing the risks we face may not fully mitigate the risk exposure in all economic or market environments, including exposure to risks that we might fail to identify or anticipate.
We are dependent upon maintaining an effective system of internal controls to provide reasonable assurance that transactions and activities are conducted in accordance with established policies and procedures and are all captured and reported in the financial statements. Failure to comply with the system of internal controls may result in events or losses which could adversely affect Customers' operations, net income, financial condition, reputation, and compliance with laws and regulations.
Customers' system of internal controls, including internal controls over financial reporting, is an important element of our risk
management framework. Management regularly reviews and seeks to improve Customers’ internal controls, including annual review of key policies and procedures, and annual review and testing of key internal controls over financial reporting. Any system of internal controls, however well designed and operated, is based in part on certain assumptions and expectations of employee conduct and can only provide reasonable, not absolute, assurance that the objectives of the internal control structure are met. Any failure or circumvention of Customers’ controls and procedures, or failure to comply with regulations related to controls and procedures, could have a material adverse effect on the Customers’ operations, net income, financial condition, reputation and compliance with laws and regulations.
We may not be able to meet the cash flow requirements of our loan funding obligations, deposit withdrawals, or other business needs and fund our asset growth unless we maintain sufficient liquidity.
Customers Bank must maintain sufficient liquidity to fund its balance sheet growth in order to successfully grow our revenues, make loans and to repay deposit and other liabilities as these mature or are drawn. This liquidity can be gathered in both wholesale and non-wholesale funding markets. Our asset growth over the past few years has been funded with various forms of deposits and wholesale funding, including brokered and wholesale time deposits, FHLB advances, and Federal funds line borrowings. Total wholesale deposits including brokered and municipal deposits were 56.3.% of total deposits at
December 31, 2016
. Our gross loan to deposit ratio was
120.6%
at
December 31, 2016
and our loan to deposit ratio excluding the mortgage warehouse portfolio funded by short term FHLB borrowings was
89.7%
at
December 31, 2016
.
Wholesale funding can cost more than deposits generated from our traditional branch system and customer relationships and is subject to certain practical limits such as our liquidity policy limits, our available collateral for FHLB borrowings capacity and Federal funds line limits with our lenders. Additionally, regulators consider wholesale funding beyond certain points to be imprudent and might suggest that future asset growth be reduced or halted. In the absence of appropriate levels and mix of funding, we might need to reduce interest-earning asset growth through the reduction of current production, sales of loans and/or the sale of participation interests in future and current loans. This might reduce our future growth and net income.
36
The amount of funds loaned to us is generally dependent on the value of the eligible collateral pledged and our financial condition. These lenders could reduce the percentages loaned against various collateral categories, eliminate certain types of collateral and otherwise modify or even terminate their loan programs, if further disruptions in the capital markets occur. Any change or termination of our borrowings from the FHLB or correspondent banks could have an adverse effect on our profitability and financial condition, including liquidity.
We may not be able to develop and retain a strong core deposit base and other low-cost, stable funding sources.
Customers Bank depends on checking, savings and money market deposit account balances and other forms of customer deposits as a primary source of funding for our lending activities. We expect that our future loan growth will largely depend on our ability to retain and grow a strong, low-cost deposit base. Because
41.4%
of our deposit base as of
December 31, 2016
was time deposits, it may prove harder to maintain and grow our deposit base than would otherwise be the case, especially since many of these deposits currently pay interest at above-market rates. As of
December 31, 2016
,
$2.0 billion
, or
72.3%
, of our total time deposits, are scheduled to mature through December 31, 2017. We are working to transition certain of our customers to lower cost traditional bank deposits as higher cost funding, such as time deposits, mature. If interest rates increase, whether due to changes in inflation, monetary policy, competition or other factors, we would expect to pay higher interest rates on deposits, which would increase our funding costs and compress our net interest margin. We may not succeed in moving our deposits to lower yielding savings and transactions products, which could materially and adversely affect us. In addition, with concerns about bank failures over the past several years and the end of the FDIC’s non-interest transaction deposit guarantee program on December 31, 2012, customers, particularly those who may maintain deposits in excess of insured limits, have become concerned about the extent to which their deposits are insured by the FDIC. Our customers may withdraw deposits to ensure that their deposits with us are fully insured, and may place excess amounts in other institutions or make investments that are perceived as being more secure and/or higher yielding. Further, even if we are able to maintain and grow our deposit base, deposit balances can decrease when customers perceive alternative investments, such as the stock market, will provide a better risk/return tradeoff. If customers move money out of bank deposits, we could lose a relatively low cost source of funds, increasing our funding costs and reducing our net interest income and net income. Additionally, any such loss of funds could result in lower loan originations and growth, which could materially and adversely affect our results of operations and financial condition, including liquidity.
Our “high-touch” personalized service banking model may be replicated by competitors.
We expect to drive organic growth by employing our Concierge Banking® strategy, which provides specific relationship managers or private bankers for all customers. Many of our competitors provide similar services and others may replicate our model. Our competitors may have greater resources than we do and may be able to provide similar services more quickly, efficiently and extensively. To the extent others replicate our model, we could lose what we view as a competitive advantage, and our financial condition and results of operations may be adversely affected.
Competitors’ technology-driven products and services and improvements to such products and services may adversely affect our ability to generate core deposits through mobile banking.
Our organic growth strategy focuses on, among other things, expanding market share through our “high-tech” model, which includes remote account opening, remote deposit capture and mobile banking. These technological advances, such as BankMobile, are intended to allow the Bank to generate additional core deposits at a lower cost than generating deposits through opening and operating branch locations. Some of our competitors may have greater resources to invest in technology and may be better equipped to market new technology-driven products and services. This may result in limiting, reducing or otherwise adversely affecting our growth strategy in this area and our access to deposits through mobile banking. In addition, to the extent we fail to keep pace with technological changes, or incur respectively large expenses to implement technological changes, our business, financial condition and results of operations may be adversely affected.
We may suffer losses due to minority investments in other financial institutions or related companies.
From time to time, we may make or consider making minority investments in other financial institutions or technology companies in the financial services business. If we do so, we may not be able to influence the activities of companies in which we invest, and may suffer losses due to these activities. Investments in foreign companies could pose additional risks as a result of distance, language barriers and potential lack of information (for example, foreign institutions, including foreign financial institutions, may not be obligated to provide as much information regarding their operations as those in the United States). Our investment in Religare Enterprises Limited (or Religare), which is a diversified financial services company in India, represents such an investment. In fourth quarter 2016, we announced our decision to exit our investment in Religare. As a result of that decision, we recorded an impairment loss of $7.3 million in earnings in fourth quarter 2016 and adjusted our cost basis of the
37
Religare securities to their estimated fair value of $15.2 million at December 31, 2016. To the extent we are unable to exit the Religare investment as planned, and pursuant to the terms contemplated, further declines in the market price per share of the Religare common stock and adverse changes in foreign currency exchange rates, may have an adverse effect on our financial condition and results of operations.
We are required to hold capital for United States bank regulatory purposes to support our investment in Religare securities.
Under the newly adopted U.S. capital adequacy rules, which became effective as of January 1, 2015, we have to hold risk based capital based on the amount of Religare common stock we own. Based upon the implementation of the final U.S. capital adequacy rules, these investments are currently subject to risk weighting of 100% of the amount of the investment; however, to the extent future aggregated carrying value of certain equity exposures exceed 10% of the Bancorp's then total capital, risk weightings of 300% may apply. Any capital that is required to be used to support our Religare investment will not be available to support our United States operations or Customers Bank, if needed.
Risks Relating to the Regulation of Our Industry
The implementation of the Dodd-Frank Wall Street Reform and Consumer Protection Act of 2010 may have a material adverse effect on our business.
On July 21, 2010, President Obama signed into law the Dodd-Frank Wall Street Reform and Consumer Protection Act of 2010 (which we refer to as the “Dodd-Frank Act”), which imposes significant regulatory and compliance changes. The key effects of the Dodd-Frank Act on our business are:
|
•
|
changes to regulatory capital requirements;
|
|
•
|
exclusion of hybrid securities, including trust preferred securities, issued on or after May 19, 2010 from Tier 1 capital;
|
|
•
|
creation of new government regulatory agencies (such as the Financial Stability Oversight Council, which will oversee systemic risk, and the Consumer Financial Protection Bureau, which will develop and enforce rules for bank and non-bank providers of consumer financial products);
|
|
•
|
potential limitations on federal preemption;
|
|
•
|
changes to deposit insurance assessments;
|
|
•
|
regulation of debit interchange fees we earn;
|
|
•
|
changes in retail banking regulations, including potential limitations on certain fees we may charge; and
|
|
•
|
changes in regulation of consumer mortgage loan origination and risk retention.
|
In addition, the Dodd-Frank Act restricts the ability of banks to engage in certain proprietary trading or to sponsor or invest in private equity or hedge funds. The Dodd-Frank Act also contains provisions designed to limit the ability of insured depository institutions, their holding companies and their affiliates to conduct certain swaps and derivatives activities and to take certain principal positions in financial instruments.
Some provisions of the Dodd-Frank Act became effective immediately upon its enactment. Many provisions, however, still require regulations to be promulgated by various federal agencies in order to be implemented, some of which have been proposed by the applicable federal agencies. The provisions of the Dodd-Frank Act may have unintended effects, which will not be clear until implementation. The changes resulting from the Dodd-Frank Act could limit our business activities, require changes to certain of our business practices, impose upon us more stringent capital, liquidity and leverage requirements or otherwise materially and adversely affect us. These changes may also require us to invest significant management attention and resources to evaluate and make any changes necessary to comply with new statutory and regulatory requirements. Failure to comply with the new requirements could also materially and adversely affect us. Any changes in the laws or regulations or their interpretations could be materially adverse to investors in our Voting Common Stock. For a more detailed description of the Dodd-Frank Act, see “Supervision and Regulation – Changes in Laws, Regulations or Policies and the Dodd-Frank Act.”
38
New regulations could adversely impact our earnings due to, among other things, increased compliance costs or costs due to noncompliance.
The Consumer Financial Protection Bureau issued a rule, effective as of January 14, 2014, designed to clarify for lenders how they can avoid monetary damages under the Dodd-Frank Act, which would hold lenders accountable for ensuring a borrower’s ability to repay a mortgage. Loans that satisfy this “qualified mortgage” safe-harbor will be presumed to have complied with the new ability-to-repay standard. Under the Consumer Financial Protection Bureau’s rule, a “qualified mortgage” loan must not contain certain specified features, including but not limited to: (i) excessive upfront points and fees (those exceeding 3% of the total loan amount, less “bona fide discount points” for prime loans); (ii) interest-only payments; (iii) negative-amortization; and (iv) terms longer than 30 years. Also, to qualify as a “qualified mortgage,” a borrower’s total monthly debt service-to-income ratio may not exceed 43%. Lenders must also verify and document the income and financial resources relied upon to qualify the borrower for the loan and underwrite the loan based on a fully amortizing payment schedule and maximum interest rate during the first five years, taking into account all applicable taxes, insurance and assessments. The Consumer Financial Protection Bureau’s rule on qualified mortgages could limit our ability or desire to make certain types of loans or loans to certain borrowers, or could make it more expensive and/or time consuming to make these loans, which could adversely impact our growth or profitability.
Additionally, on December 10, 2013, five financial regulatory agencies, including our primary federal regulator, the Federal Reserve, adopted final rules (the “Final Rules”) implementing the so-called Volcker Rule embodied in Section 13 of the Bank Holding Company Act, which was added by Section 619 of the Dodd-Frank Act. The Final Rules prohibit banking entities from, among other things, (1) engaging in short-term proprietary trading for their own accounts, and (2) having certain ownership interests in and relationships with hedge funds or private equity funds (“covered funds”). The Final Rules are intended to provide greater clarity with respect to both the extent of those primary prohibitions and of the related exemptions and exclusions. The Final Rules also require each regulated entity to establish an internal compliance program that is consistent with the extent to which it engages in activities covered by the Volcker Rule, which must include (for the largest entities) making regular reports about those activities to regulators. Community banks, such as Customers, have been afforded some relief under the Final Rules. If such banks are engaged only in exempted proprietary trading, such as trading in U.S. government, agency, state and municipal obligations, they are exempt entirely from compliance program requirements. Moreover, even if a community bank engages in proprietary trading or covered fund activities under the rule, they need only incorporate references to the Volcker Rule into their existing policies and procedures. The Final Rules were effective April 1, 2014, but the conformance period has been extended from its statutory end date of July 21, 2014 until July 21, 2016, and the Federal Reserve has announced its intention to further extend the conformance period until July 21, 2017. Management continues to evaluate the Final Rules, which are lengthy and detailed.
We operate in a highly regulated environment and the laws and regulations that govern our operations, corporate governance, executive compensation and accounting principles, or changes in them, or our failure to comply with them, could materially and adversely affect us.
We are subject to extensive regulation, supervision, and legislation that govern almost all aspects of our operations. Intended to protect customers, depositors and the FDIC’s Deposit Insurance Fund (the “DIF”) and not our shareholders, these laws and regulations, among other matters, prescribe minimum capital requirements, impose limitations on our business activities, limit the dividends or distributions that we can pay, restrict the ability of our subsidiary bank to engage in transactions with the Bancorp, and impose certain specific accounting requirements on us that may be more restrictive and may result in greater or earlier charges to earnings or reductions in our capital than generally accepted accounting principles. Compliance with laws and regulations can be difficult and costly, and changes to laws and regulations often impose additional compliance costs, and may make certain products impermissible or uneconomic. Our failure to comply with these laws and regulations, even if the failure follows good faith effort or reflects a difference in interpretation, could subject us to restrictions on our business activities, reputational harm, fines and other penalties, any of which could materially and adversely affect us. Further, any new laws, rules and regulations could make compliance more difficult or expensive and also materially and adversely affect us.
Our use of third party vendors and our other ongoing third party business relationships are subject to increasing regulatory
requirements and attention.
We regularly use third party vendors as part of our business and have other ongoing business relationships with other third parties. These types of third party relationships are subject to increasingly demanding regulatory requirements and attention by federal banking regulators. Regulation requires us to perform enhanced due diligence, perform ongoing monitoring and control our third party vendors and other ongoing third party business relationships. In certain cases we may be required to renegotiate our agreements with these vendors to meet these enhanced requirements, which could increase our costs. We expect that our regulators will hold us responsible for deficiencies in our oversight and control of our third party relationships and in the
39
performance of the parties with which we have these relationships. As a result, if our regulators conclude that we have not exercised adequate oversight and control over our third party vendors or other ongoing third party business relationships or that such third parties have not performed appropriately, we could be subject to enforcement actions, including civil money penalties or other administrative or judicial penalties or fines as well as requirements for customer remediation, any of which could have a material adverse effect on our business, financial condition or results of operations.
We are subject to numerous laws and governmental regulations and to regular examinations by our regulators of our business and compliance with laws and regulations, and our failure to comply with such laws and regulations or to adequately address any matters identified during our examinations could materially and adversely affect us.
Federal banking agencies regularly conduct comprehensive examinations of our business, including our compliance with applicable laws, regulations and policies applicable to the Bancorp and the Bank. Examination reports and ratings (which often are not publicly available) and other aspects of this supervisory framework can materially impact the conduct, organic and acquisition growth, and profitability of our business. Our regulators have extensive discretion in their supervisory and enforcement activities and may impose a variety of remedial actions, conditions or limitations on our business operations if, as a result of an examination, they determined that our financial condition, capital resources, asset quality, earnings prospects, management, liquidity or other aspects of any of our operations had become unsatisfactory, or that the Bancorp or its management was in violation of any law, regulation or policy. Examples of those actions, conditions or limitations include enjoining “unsafe or unsound” practices, requiring affirmative actions to correct any conditions resulting from any asserted violation of law, issuing administrative orders that can be judicially enforced, directing increases in our capital, assessing civil monetary penalties against our officers or directors, removing officers and directors and, if a conclusion was reached that the offending conditions cannot be corrected or there is an imminent risk of loss to depositors, terminating our deposit insurance. Other actions, formal or informal, that may be imposed could restrict our growth, including regulatory denials to expand branches, relocate, add subsidiaries and affiliates, expand into new financial activities or merge with or purchase other financial institutions. The timing of these examinations, including the timing of the resolution of any issues identified by our regulators in the examinations and the final determination by them with respect to the imposition of any remedial actions, conditions or limitations on our business operations, is generally not within our control. We also could suffer reputational harm in the event of any perceived or actual noncompliance with certain laws and regulations. If we become subject to such regulatory actions, we could be materially and adversely affected.
Other litigation and regulatory actions, including possible enforcement actions, could subject us to significant fines, penalties, judgments or other requirements resulting in increased expenses or restrictions on our business activities.
Our business is subject to increased litigation and regulatory risks as a result of a number of factors, including the highly regulated nature of the financial services industry and the focus of state and federal prosecutors on banks and the financial services industry generally. This focus has only intensified since the latest financial crisis, with regulators and prosecutors focusing on a variety of financial institution practices and requirements. We may, from time to time, be the subject of subpoenas, requests for information, reviews, investigations and proceedings (both formal and informal) by governmental agencies regarding our business. Legal or regulatory actions may subject us to substantial compensatory or punitive damages, significant fines, penalties, obligations to change our business practices or other requirements resulting in increased expenses, diminished income and damage to our reputation. Our involvement in any such matters, even if the matters are ultimately determined in our favor, could also cause significant harm to our reputation and divert management attention from the operation of our business. Further, any settlement, consent order or adverse judgment in connection with any formal or informal proceeding or investigation by government agencies may result in litigation, investigations or proceedings as other litigants and government agencies begin independent reviews of the same activities. As a result, the outcome of legal and regulatory actions could be material to our business, results of operations, financial condition and cash flows depending on, among other factors, the level of our earnings for that period, and could have a material adverse effect on our business, financial condition or results
of operations.
The FDIC’s restoration plan and the related increased assessment rate could materially and adversely affect us.
The FDIC insures deposits at FDIC-insured depository institutions up to applicable limits. The amount of a particular institution’s deposit insurance assessment is based on that institution’s risk classification under an FDIC risk-based assessment system. An institution’s risk classification is assigned based on its capital levels and the level of supervisory concern the institution poses to its regulators. Market developments have significantly depleted the DIF of the FDIC and reduced the ratio of reserves to insured deposits. As a result of the enactment of the Dodd-Frank Act, the FDIC has increased the deposit insurance assessment rates and thus raised deposit insurance premiums for insured depository institutions. If these increases are insufficient for the DIF to meet its funding requirements, there may need to be further special assessments or increases in deposit insurance premiums. We are generally unable to control the amount of premiums that we are required to pay for FDIC
40
insurance. If there are additional bank or financial institution failures, we may be required to pay even higher FDIC premiums than the recently increased levels. Any future additional assessments, increases or required prepayments in FDIC insurance premiums may materially and adversely affect us, including by reducing our profitability or limiting our ability to pursue certain business opportunities.
The Federal Reserve may require us to commit capital resources to support our subsidiary banks.
As a matter of policy, the Federal Reserve, which examines us and our subsidiaries, expects a bank holding company to act as a source of financial and managerial strength to a subsidiary bank and to commit resources to support such subsidiary bank. Under the “source of strength” doctrine, the Federal Reserve may require a bank holding company to make capital injections into a troubled subsidiary bank and may charge the bank holding company with engaging in unsafe and unsound practices for failure to commit resources to such a subsidiary bank. In addition, the Dodd-Frank Act directs the federal bank regulators to require that all companies that directly or indirectly control an insured depository institution serve as a source of strength for the institution. Under this requirement, we could be required to provide financial assistance to Customers Bank or any other subsidiary banks we may own in the future should they experience financial distress.
A capital injection may be required at times when we do not have the resources to provide it and therefore we may be required to borrow the funds or raise additional equity capital from third parties. Any loans by a holding company to its subsidiary bank are subordinate in right of payment to deposits and to certain other indebtedness of the subsidiary bank. In the event of a bank holding company’s bankruptcy, the bankruptcy trustee will assume any commitment by the holding company to a federal bank regulatory agency to maintain the capital of a subsidiary bank. Moreover, bankruptcy law provides that claims based on any such commitment will be entitled to a priority of payment over the claims of the holding company’s general unsecured creditors, including the holders of its indebtedness. Any financing that must be done by the holding company in order to make the required capital injection may be difficult and expensive and may not be available on attractive terms, or at all, which likely would have a material adverse effect on us.
The long-term impact of the new regulatory capital standards and the forthcoming new capital rules on U.S. banks is uncertain.
On September 12, 2010, the Basel Committee on Banking Supervision, announced an agreement to a strengthened set of capital requirements for internationally active banking organizations in the United States and around the world, known as Basel III. Basel III narrows the definition of capital, introduces requirements for minimum Tier 1 common capital, increases requirements for minimum Tier 1 capital and total risk-based capital, and changes risk-weighting methodologies. Basel III is scheduled to be phased in over time until fully phased in by January 1, 2019.
On July 2, 2013, the Federal Reserve adopted a final rule regarding new capital requirements pursuant to Basel III. These rules, which became effective on January 1, 2015 for community banks, increase the required amount of regulatory capital that we must hold and failure to comply with the capital rules will lead to limitations on the dividend payments to us by Customers Bank and other elective distributions.
Various provisions of the Dodd-Frank Act increase the capital requirements of bank holding companies, such as Customers Bancorp, and non-bank financial companies that are supervised by the Federal Reserve. The leverage and risk-based capital ratios of these entities may not be lower than the leverage and risk-based capital ratios for insured depository institutions. The Basel III changes and other regulatory capital requirements will likely result in generally higher regulatory capital standards for the Bank and the Bancorp.
We face a risk of noncompliance and enforcement action with the Bank Secrecy Act and other anti-money laundering statutes and regulations.
The federal Bank Secrecy Act, the Uniting and Strengthening America by Providing Appropriate Tools Required to Intercept and Obstruct Terrorism Act of 2001 (the “PATRIOT Act”) and other laws and regulations require financial institutions, among other duties, to institute and maintain an effective anti-money laundering program and file suspicious activity and currency transaction reports as appropriate. The federal Financial Crimes Enforcement Network, established by the U.S. Treasury Department to administer the Bank Secrecy Act, is authorized to impose significant civil money penalties for violations of those requirements, and has recently engaged in coordinated enforcement efforts with the individual federal banking regulators, as well as the U.S. Department of Justice, Drug Enforcement Administration, and Internal Revenue Service. There is also increased scrutiny of compliance with the rules enforced by the Office of Foreign Assets Control (the “OFAC”). If our policies, procedures and systems are deemed deficient or the policies, procedures and systems of the financial institutions that we have already acquired or may acquire in the future are deficient, we would be subject to liability, including fines and regulatory
41
actions (such as restrictions on our ability to pay dividends and the necessity to obtain regulatory approvals to proceed with certain aspects of our business plan, including our acquisition plans), which could materially and adversely affect us. Failure to maintain and implement adequate programs to combat money laundering and terrorist financing could also have serious reputational consequences for us.
Federal, state and local consumer lending laws may restrict our ability to originate certain mortgage loans or increase our risk of liability with respect to such loans and could increase our cost of doing business.
Federal, state and local laws have been adopted that are intended to eliminate certain lending practices considered “predatory.” These laws prohibit practices such as steering borrowers away from more affordable products, selling unnecessary insurance to borrowers, repeatedly refinancing loans and making loans without a reasonable expectation that the borrowers will be able to repay the loans irrespective of the value of the underlying property. It is our policy not to make predatory loans, but these laws create the potential for liability with respect to our lending and loan investment activities. They increase our cost of doing business and, ultimately, may prevent us from making certain loans and cause us to reduce the average percentage rate or the points and fees on loans that we do make.
Loans that we make through certain federal programs are dependent on the federal government’s continuation and support of these programs and on our compliance with their requirements
.
We participate in various U.S. government agency guarantee programs, including programs operated by the Small Business Administration. We are responsible for following all applicable U.S. government agency regulations, guidelines and policies whenever we originate loans as part of these guarantee programs. If we fail to follow any applicable regulations, guidelines or policies associated with a particular guarantee program, any loans we originate as part of that program may lose the associated guarantee, exposing us to credit risk we would not otherwise be exposed to or underwritten as part of our origination process for U.S. government agency guaranteed loans, or result in our inability to continue originating loans under such programs. The loss of any guarantees for loans we have extended under U.S. government agency guarantee programs or the loss of our ability to participate in such programs could have a material adverse effect on our business, financial condition or results of operations.
In connection with Customers’ acquisition of the Disbursement business, Customers is subject to further substantial federal and state governmental regulation related to the Disbursement business that could change and thus force us to make modifications to the Disbursement business. Compliance with the various complex laws and regulations is costly and time consuming, and failure to comply could have a material adverse effect on our business. Additionally, increased regulatory requirements on the Disbursement business may increase costs, which could materially and adversely affect our business, financial condition and/or operating results.
As a third party servicer under the Title IV regulations, we are directly or indirectly subject to a variety of federal and state laws and regulations. Our contracts with most of our higher education institution clients require us to comply with applicable laws and regulations, including:
|
•
|
Title IV of the Higher Education Act of 1965, or Title IV;
|
|
•
|
the Family Educational Rights and Privacy Act of 1975, or FERPA;
|
|
•
|
the USA PATRIOT Act and related anti-money laundering requirements; and
|
|
•
|
certain federal rules regarding safeguarding personal information, including rules implementing the privacy provisions of Gramm-Leach-Bliley Act of 1999, or GLBA.
|
Higher Education Regulations
Third-Party Servicer.
Because of the services we provide to some institutions with regard to the handling of Title IV funds, we are considered a “third-party servicer” under the Title IV regulations. Those regulations require a third-party servicer annually to submit a compliance audit conducted by outside independent auditors that cover the servicer’s Title IV activities. Each year we must submit a “Compliance Attestation Examination of the Title IV Student Financial Assistance Programs” audit to the Department of Education (“ED”), which includes a report by an independent audit firm. This yearly compliance audit submission to ED provides comfort to our higher education institution clients that we are in compliance with the third-party servicer regulations that may apply to us. We also provide this compliance audit report to clients upon request to help them fulfill their compliance audit obligations as Title IV participating institutions.
42
Under ED’s regulations, a third party servicer that contracts with a Title IV institution acts in the nature of a fiduciary in the administration of Title IV programs. Among other requirements, the regulations provide that a third-party servicer is jointly and severally liable with its client institution for any liability to ED arising out of the servicer’s violation of Title IV or its implementing regulations, which could subject us to material fines related to acts or omissions of entities beyond our control. ED is also empowered to limit, suspend or terminate the violating servicer’s eligibility to act as a third-party servicer and to impose significant civil penalties on the violating servicer.
Additionally, on behalf of our higher education institution clients, we are required to comply with ED’s cash management regulations regarding payment of financial aid credit balances to students and providing bank accounts to students that may be used for receiving such payments. In the event ED concluded that we had violated Title IV or its implementing regulations and should be subject to one or more of these sanctions, our business and results of operations could be materially and adversely affected. There is limited enforcement and interpretive history of Title IV regulations.
On May 18, 2015, ED published its Notice of Proposed Rulemaking, or NPRM on program integrity and improvement issues. Final rules relating to Title IV Cash Management were published in the Federal Register on October 30, 2015. The Final Rules included, among others, provisions related to (i) restrictions on the ability of higher education institutions and third party servicers like us to market financial products to students including sending unsolicited debit cards to students, (ii) prohibitions on the assessment of certain types of account fees on student account holders and (iii) requirements related to ATM access for student account holders that became effective as of July 1, 2016. Although the complete impact of the Final Rules are unknown, there could be a significant negative impact on the Disbursement business and, in turn, Customers’ business.
FERPA.
Our higher education institution clients are subject to FERPA, which provides, with certain exceptions, that an educational institution that receives any federal funding under a program administered by ED may not have a policy or practice of disclosing education records or “personally identifiable information” from education records, other than directory information, to third parties without the student’s or parent’s written consent. Our higher education institution clients that use the Disbursement business services disclose to us certain non-directory information concerning their students, including contact information, student identification numbers and the amount of students’ credit balances. We believe that our higher education institution clients may disclose this information to us without the students’ or their parents’ consent pursuant to one or more exceptions under FERPA. However, if ED asserts that we do not fall into one of these exceptions or if future changes to legislation or regulations require student consent before our higher education institution clients can disclose this information to us, a sizable number of students may cease using our products and services, which could materially and adversely affect our business, financial condition and results of operations.
Additionally, as we are indirectly subject to FERPA, we may not permit the transfer of any personally identifiable information to another party other than in a manner in which a higher education institution may disclose it. In the event that we re-disclose student information in violation of this requirement, FERPA requires our clients to suspend our access to any such information for a period of five years. Any such suspension could have a material adverse effect on our business, financial condition and results of operations.
State Laws.
We may also be subject to similar state laws and regulations, including those that restrict higher education institutions from disclosing certain personally identifiable information of students. State attorneys general and other enforcement agencies may monitor our compliance with state and federal laws and regulations that affect our business, including those pertaining to higher education and banking, and conduct investigations of our business that are time consuming and expensive and could result in fines and penalties that have a material adverse effect on our business, financial condition and results of operations.
Additionally, individual state legislatures may propose and enact new laws that restrict or otherwise affect our ability to offer our products and services as we currently do, which could have a material adverse effect on our business, financial condition and results of operations.
Reviews performed by the Internal Revenue Service and State Taxing Authorities for the fiscal years that remain open for investigation may result in a change to income taxes recorded in our consolidated financial statements and adversely affect our results of operations.
The Bancorp and its subsidiaries are subject to U.S. federal income tax as well as income tax of various states primarily in the mid-Atlantic region of the United States. Years that remain open for potential review by (1) the Internal Revenue Service are 2013 through 2015, and (2) state taxing authorities are 2011 through 2015. The results of these reviews could result in increased recognition of income tax expense in our consolidated financial statements as well as possible fines and penalties.
43
Our financial results may be adversely affected by changes in U.S. and non-U.S. tax and other laws and regulations.
The U.S. Congress and the Administration have indicated an interest in reforming the U.S. corporate income tax code. Possible approaches include lowering the 35 percent corporate tax rate, modifying the taxation of income earned outside the U.S. and limiting or eliminating various other deductions, tax credits and/or other tax preferences. It is not possible at this time to quantify either the one-time impacts from the remeasurement of deferred tax assets and liabilities that might result upon tax reform enactment or the ongoing impacts reform proposals might have on income tax expense.
We will be subject to heightened regulatory requirements if we exceed $10 billion in assets.
Based on our current total assets and growth strategy, we anticipate our bank’s total assets will exceed $10 billion in the near future. The Dodd-Frank Act and its implementing regulations impose various additional requirements on bank holding companies with $10 billion or more in total assets, including compliance with portions of the Federal Reserve’s enhanced prudential oversight requirements and annual stress testing requirements. In addition, banks with $10 billion or more in total assets are primarily examined by the Consumer Financial Protection Bureau (“CFPB”) with respect to various federal consumer financial protection laws and regulations. Currently, our bank is subject to regulations adopted by the CFPB, but the Federal Reserve is primarily responsible for examining our bank’s compliance with consumer protection laws and those CFPB regulations. As a relatively new agency with evolving regulations and practices, there is uncertainty as to how the CFPB’s examination and regulatory authority might impact our business.
Compliance with these requirements may necessitate that we hire additional compliance or other personnel, design and implement additional internal controls, or incur other significant expenses, any of which could have a material adverse effect on our business, financial condition or results of operations. Compliance with the annual stress testing requirements, part of which must be publicly disclosed, may also be misinterpreted by the market generally or our customers and, as a result, may adversely affect our stock price or our ability to retain our customers or effectively compete for new business opportunities. To ensure compliance with these heightened requirements when effective, our regulators may require us to fully comply with these requirements or take actions to prepare for compliance even before our or our bank’s total assets equal or exceed $10 billion. As a result, we may incur compliance-related costs before we might otherwise be required, including if we do not continue to grow at the rate we expect or at all. Our regulators may also consider our preparation for compliance with these regulatory requirements when examining our operations generally or considering any request for regulatory approval we may make, even
requests for approvals on unrelated matters.
Risks Relating to Our Securities
Risks Relating to Our Voting Common Stock
The trading volume in our common stock is less than that of other larger financial services companies.
Although the shares of our common stock are listed on the New York Stock Exchange, the trading volume in our common stock is less than that of other larger financial services companies. A public trading market having the desired characteristics of depth, liquidity and orderliness depends upon the presence in the marketplace of willing buyers and sellers of our Voting Common Stock at any given time, which presence will be dependent upon the individual decisions of investors, over which we have no control. Illiquidity of the stock market, or in the trading of our common stock on the New York Stock Exchange, could have a material adverse effect on the value of your shares, particularly if significant sales of our Voting Common Stock, or the expectation of significant sales, were to occur.
We do not expect to pay cash dividends on our Voting Common Stock in the foreseeable future, and our ability to pay dividends is subject to regulatory limitations.
We have not historically declared nor paid cash dividends on our Voting Common Stock and we do not expect to do so in the near future. Any future determination relating to dividend policy will be made at the discretion of our board of directors and will depend on a number of factors, including earnings and financial condition, liquidity and capital requirements, the general economic and regulatory climate, ability to service any equity or debt obligations senior to the Voting Common Stock, and other factors deemed relevant by the board of directors. We must be current in the payment of dividends payable to holders of our Series C, Series D, Series E, and Series F Preferred Stock before any dividends can be paid on our common stock.
44
In addition, as a bank holding company, we are subject to general regulatory restrictions on the payment of cash dividends. Federal bank regulatory agencies have the authority to prohibit bank holding companies from engaging in unsafe or unsound practices in conducting their business, which depending on the financial condition and liquidity of the holding company at the time, could include the payment of dividends. Further, various federal and state statutory provisions limit the amount of dividends that our bank subsidiaries can pay to us as its holding company without regulatory approval. See “Market Price of Common Stock and Dividends – Dividends on Voting Common Stock” below for further detail regarding restrictions on our ability to pay dividends.
We may issue additional shares of our common stock in the future which could adversely affect the value or voting power of the Voting Common Stock.
Actual or anticipated issuances or sales of substantial amounts of our common stock in the future could cause the value of our Voting Common Stock to decline significantly and make it more difficult for us to sell equity or equity-related securities in the future at a time and on terms that we deem appropriate. The issuance of any shares of our common stock in the future also would, and equity-related securities could, dilute the percentage ownership interest held by shareholders prior to such issuance. Actual issuances of our Voting Common Stock could also significantly dilute the voting power of the Voting Common Stock. In 2016, we issued 2,641,677 shares of Voting Common Stock in public offerings.
We have also made grants of restricted stock units and stock options with respect to shares of Voting Common Stock to our directors and certain employees. We may also issue further equity-based awards in the future. As such shares are issued upon vesting and as such options may be exercised and the underlying shares are or become freely tradeable, the value or voting power of our Voting Common Stock may be adversely affected and our ability to sell more equity or equity-related securities could also be adversely affected.
Except for
184,706
warrants held by certain investors at
December 31, 2016
, we are not required to issue any additional equity securities to existing holders of our Voting Common Stock on a preemptive basis. Therefore, additional common stock issuances, directly or through convertible or exchangeable securities, warrants or options, will generally dilute the holdings of our existing holders of Voting Common Stock and such issuances or the perception of such issuances may reduce the market price of our Voting Common Stock. Our outstanding preferred stock has preference on distribution payments, periodically or upon liquidation, which could eliminate or otherwise limit our ability to make distributions to holders of our Voting Common Stock. Because our decision to issue debt or equity securities or incur other borrowings in the future will depend on market conditions and other factors beyond our control, the amount, timing, nature or success of our future capital raising efforts is uncertain. Thus, holders of our Voting Common Stock bear the risk that our future issuances of debt or equity securities or our incurrence of other borrowings will negatively affect the value of our Voting Common Stock.
Future issuances of debt securities, which would rank senior to our Voting Common Stock upon our liquidation, and future issuances of equity securities, which would dilute the holdings of our existing holders of Voting Common Stock and may be senior to our Voting Common Stock for the purposes of making distributions, periodically or upon liquidation, may negatively affect the market price of our Voting Common Stock.
In the future, we may issue debt or equity securities or incur other borrowings. Upon our liquidation, holders of our debt securities and other loans and preferred stock will receive a distribution of our available assets before holders of our Voting Common Stock. If we incur debt in the future, our future interest costs could increase, and adversely affect our liquidity, cash flows and results of operations.
Provisions in our articles of incorporation and bylaws may inhibit a takeover of us, which could discourage transactions that would otherwise be in the best interests of our shareholders and could entrench management.
Provisions of our articles of incorporation and bylaws, and applicable provisions of Pennsylvania law and the federal Change in Bank Control Act may delay, inhibit or prevent someone from gaining control of our business through a tender offer, business combination, proxy contest or some other method even though some of our shareholders might believe a change in control is desirable. They might also increase the costs of completing a transaction in which we acquire another financial services business, merge with another financial institution, or sell our business to another financial institution. These increased costs could reduce the value of the shares held by our shareholders upon completion of these types of transactions.
45
Shareholders may be deemed to be acting in concert or otherwise in control of us and our bank subsidiaries, which could impose prior approval requirements and result in adverse regulatory consequences for such holders.
We are a bank holding company regulated by the Federal Reserve. Any entity (including a “group” composed of natural persons) owning 25% or more of a class of our outstanding shares of voting stock, or a lesser percentage if such holder or group otherwise exercises a “controlling influence” over us, may be subject to regulation as a “bank holding company” in accordance with the Bank Holding Company Act of 1956, as amended (the “BHCA”). In addition, (1) any bank holding company or foreign bank with a U.S. presence is required to obtain the approval of the Federal Reserve under the BHCA to acquire or retain 5% or more of a class of our outstanding shares of voting stock, and (2) any person other than a bank holding company may be required to obtain prior regulatory approval under the Change in Bank Control Act to acquire or retain 10% or more of our outstanding shares of voting stock. Any shareholder that is deemed to “control” the Company for bank regulatory purposes would become subject to prior approval requirements and ongoing regulation and supervision. Such a holder may be required to divest amounts equal to or exceeding 5% of the voting shares of investments that may be deemed incompatible with bank holding company status, such as an investment in a company engaged in non-financial activities. Regulatory determination of “control” of a depository institution or holding company is based on all of the relevant facts and circumstances. Potential investors are advised to consult with their legal counsel regarding the applicable regulations and requirements.
Our common stock owned by holders determined by a bank regulatory agency to be acting in concert would be aggregated for purposes of determining whether those holders have control of a bank or bank holding company. Each shareholder obtaining control that is a “company” would be required to register as a bank holding company. “Acting in concert” generally means knowing participation in a joint activity or parallel action towards the common goal of acquiring control of a bank or a parent company, whether or not pursuant to an express agreement. The manner in which this definition is applied in individual circumstances can vary and cannot always be predicted with certainty. Many factors can lead to a finding of acting in concert, including where: (i) the shareholders are commonly controlled or managed; (ii) the shareholders are parties to an oral or written agreement or understanding regarding the acquisition, voting or transfer of control of voting securities of a bank or bank holding company; (iii) the shareholders each own stock in a bank and are also management officials, controlling shareholders, partners or trustees of another company; or (iv) both a shareholder and a controlling shareholder, partner, trustee or management official of such shareholder own equity in the bank or bank holding company.
The FDIC’s policy statement imposing restrictions and criteria on private investors in failed bank acquisitions will apply to us and our investors.
On August 26, 2009, the FDIC issued a policy statement imposing restrictions and criteria on private investors in failed bank acquisitions. The policy statement is broad in scope and both complex and potentially ambiguous in its application. In most cases it would apply to an investor with more than 5% of the total voting power of an acquired depository institution or its holding company, but in certain circumstances it could apply to investors holding fewer voting shares. The policy statement will be applied to us if we make additional failed bank acquisitions from the FDIC or if the FDIC changes its interpretation of the policy statement or determines at some future date that it should be applied because of our circumstances.
Investors subject to the policy statement could be prohibited from selling or transferring their interests for three years. They also would be required to provide the FDIC with information about the investor and all entities in the investor’s ownership chain, including information on the size of the capital fund or funds, its diversification, its return profile, its marketing documents, and its management team and business model. Investors owning 80% or more of two or more banks or savings associations would be required to pledge their proportionate interests in each institution to cross-guarantee the FDIC against losses to the Deposit Insurance Fund.
Under the policy statement, the FDIC also could prohibit investment through ownership structures involving multiple investment vehicles that are owned or controlled by the same parent company. Investors that directly or indirectly hold 10% or more of the equity of a bank or savings association in receivership also would not be eligible to bid to become investors in the deposit liabilities of that failed institution. In addition, an investor using ownership structures with entities that are domiciled in bank secrecy jurisdictions would not be eligible to own a direct or indirect interest in an insured depository institution unless the investor’s parent company is subject to comprehensive consolidated supervision as recognized by the Federal Reserve and the investor enters into certain agreements with the U.S. bank regulators regarding access to information, maintenance of records and compliance with U.S. banking laws and regulations. If the policy statement applies, we (including any failed bank we acquire) could be required to maintain a ratio of Tier 1 common equity to total assets of at least 10% for a period of 3 years, and thereafter maintain a capital level sufficient to be well capitalized under regulatory standards during the remaining period of ownership of the investors. Bank subsidiaries also may be prohibited from extending any new credit to investors that own at least 10% of our equity.
46
Risks Relating to Our Fixed-to-Floating Rate Non-Cumulative Perpetual Preferred Stock, Series C, Series D, Series E, and Series F
The shares of our Series C, Series D, Series E, and Series F Preferred Stock are equity securities and are subordinate to our existing and future indebtedness.
The shares of Series C, Series D, Series E, and Series F Preferred Stock are equity interests in Customers Bancorp and do not constitute indebtedness of Customers Bancorp or any of our subsidiaries, and rank junior to all of Customer Bancorp’s and our subsidiaries’ existing and future indebtedness and other non-equity claims with respect to assets available to satisfy claims against us, including claims in the event of Customer Bancorp’s liquidation. If we are forced to liquidate our assets to pay our creditors, we may not have sufficient funds to pay amounts due on any or all of the Series C, Series D, Series E, and Series F Preferred Stock then outstanding.
We may not pay dividends on the shares of Series C, Series D, Series E, and Series F Preferred Stock.
Dividends on the shares of Series C, Series D, Series E, and Series F Preferred Stock are payable only if declared by our board of directors or a duly authorized committee of the board. As a bank holding company, we are subject to general regulatory restrictions on the payment of cash dividends. Federal bank regulatory agencies have the authority to prohibit bank holding companies from engaging in unsafe or unsound practices in conducting their business, which depending on the financial condition and liquidity of the holding company at the time, could include the payment of dividends. Further, various federal and state statutory provisions limit the amount of dividends that our bank subsidiaries can pay to us as its holding company without regulatory approval.
Dividends on the shares of Series C, Series D, Series E, and Series F Preferred Stock are non-cumulative.
Dividends on the shares of Series C, Series D, Series E, and Series F Preferred Stock are payable only when, as and if authorized and declared by our board of directors or a duly authorized committee of the board. Consequently, if our board of directors or a duly authorized committee of the board does not authorize and declare a dividend for any dividend period, holders of the Series C, Series D, Series E, and Series F Preferred Stock will not be entitled to receive any such dividend, and such unpaid dividend will cease to accrue or be payable. If we do not declare and pay dividends on the Series C, Series D, Series E, and Series F Preferred Stock, the market prices of the shares of Series C, Series D, Series E, and Series F Preferred Stock may decline.
Our ability to pay dividends on the shares of Series C, Series D, Series E, and Series F Preferred Stock is dependent on dividends and distributions we receive from our subsidiaries, which are subject to regulatory and other limitations.
Our principal source of cash flow is dividends from Customers Bank. We cannot assure you that Customers Bank will, in any circumstances, pay dividends to us. If Customers Bank fails to make dividend payments or other permitted distributions to us, and sufficient cash is not otherwise available, we may not be able to make dividend payments on the Series C, Series D, Series E, and Series F Preferred Stock. Various federal and state statutes, regulations and rules limit, directly or indirectly, the amount of dividends that our banking and other subsidiaries may pay to us without regulatory approval. In particular, dividend and other distributions from Customers Bank to us would require notice to or approval of the applicable regulatory authority. There can be no assurances that we would receive such approval.
In addition, our right to participate in any distribution of assets of any of our subsidiaries upon the subsidiary’s liquidation or otherwise, and, as a result, the ability of a holder of Series C, Series D, Series E, and Series F Preferred Stock to benefit indirectly from such distribution, will be subject to the prior claims of preferred equity holders and creditors of that subsidiary, except to the extent that any of our claims as a creditor of such subsidiary may be recognized. As a result, shares of the Series C, Series D, Series E, and Series F Preferred Stock are effectively subordinated to all existing and future liabilities and any preferred equity of our subsidiaries.
Holders of Series C, Series D, Series E, and Series F Preferred Stock should not expect us to redeem their shares when they first become redeemable at our option or on any particular date thereafter, and our ability to redeem the shares will be subject to the prior approval of the Federal Reserve.
Our Series C, Series D, Series E, and Series F Preferred Stock are perpetual equity securities, meaning that the Series C, Series D, Series E, and Series F Preferred Stock have no maturity date or mandatory redemption date and the shares are not redeemable at the option of the holders thereof. Any determination we make at any time to propose a redemption of the Series
47
C, Series D, Series E, and Series F Preferred Stock will depend upon a number of factors, including our evaluation of our capital position, the composition of our shareholders’ equity and general market conditions at that time. In addition, our right to redeem the Series C, Series D, Series E, and Series F Preferred Stock is subject to any limitations established by the Federal Reserve. Under the Federal Reserve’s risk-based capital guidelines applicable to bank holding companies, any redemption of the Series C, Series D, Series E, and Series F Preferred Stock is subject to prior approval of the Federal Reserve. There can be no assurance that the Federal Reserve will approve any such redemption.
We may be able to redeem the Series C, Series D, Series E, and Series F Preferred Stock before their initial redemption dates upon a “regulatory capital treatment event.”
We may be able to redeem the Series C, Series D, Series E, and Series F Preferred Stock before their respective initial redemption dates, in whole but not in part, upon the occurrence of certain events involving the capital treatment of the Series C, Series D, Series E, and Series F Preferred Stock, as applicable. In particular, upon our determination in good faith that an event has occurred that would constitute a “regulatory capital treatment event,” with respect to a particular series of the preferred stock, we may redeem that particular series of securities in whole but not in part upon the prior approval of the Federal Reserve.
Holders of Series C, Series D, Series E, and Series F Preferred stock have limited voting rights.
Holders of Series C, Series D, Series E, and Series F Preferred Stock have no voting rights with respect to matters that generally require the approval of voting shareholders. However, holders of Series C, Series D, Series E, and Series F Preferred Stock will have the right to vote in the event of non-payments of dividends under certain circumstances, with respect to authorizing classes or series of preferred stock senior to the Series C, Series D, Series E, and Series F Preferred Stock, as applicable, and with respect to certain fundamental changes in the terms of the Series C, Series D, Series E, and Series F Preferred Stock, as applicable, or as otherwise required by law.
General market conditions and unpredictable factors could adversely affect market prices for the Series C, Series D, Series E, and Series F Preferred Stock.
There can be no assurance regarding the market prices for the Series C, Series D, Series E, and Series F Preferred Stock. A variety of factors, many of which are beyond our control, could influence the market prices, including:
|
•
|
whether we declare or fail to declare dividends on the series of preferred stock from time to time;
|
|
•
|
our operating performance, financial condition and prospects, or the operating performance financial condition and prospects of our competitors;
|
|
•
|
real or anticipated changes in the credit ratings (if any) assigned to the Series C, Series D, Series E, and Series F Preferred Stock or our other securities;
|
|
•
|
our creditworthiness;
|
|
•
|
changes in interest rates and expectations regarding changes in rates;
|
|
•
|
our issuance of additional preferred equity;
|
|
•
|
the market for similar securities;
|
|
•
|
developments in the securities, credit and housing markets, and developments with respect to financial institutions generally; and
|
|
•
|
economic, financial, corporate, securities market, geopolitical, regulatory or judicial events that affect us, the banking industry or the financial markets generally.
|
The Series C, Series D, Series E, and Series F Preferred Stock may not have an active trading market.
Although the shares of Series C, Series D, Series E, and Series F Preferred Stock are listed on the New York Stock Exchange, an active trading market may not be established or maintained for the shares and transaction costs could be high. As a result, the difference between bid and asked prices in any secondary market could be substantial.
The Series C, Series D, Series E, and Series F Preferred Stock may be junior or equal in rights and preferences to preferred stock we may issue in the future.
Our Series C, Series D, Series E, and Series F Preferred Stock rank equally. Although we do not currently have outstanding preferred stock that ranks senior to the Series C, Series D, Series E, and Series F Preferred Stock, the Series C, Series D, Series E, and Series F Preferred Stock may rank junior to other preferred stock we may issue in the future that by its terms is expressly senior in rights and preferences to the Series C, Series D, Series E, and Series F Preferred Stock, although the affirmative vote
48
or consent of the holders of at least two-thirds of all outstanding shares of the affected class of preferred stock is required to issue any shares of stock ranking senior in rights and preferences to such class. Any preferred stock that ranks senior to the Series C, Series D, Series E, and Series F Preferred Stock in the future would have priority in payment of dividends and the making of distributions in the event of any liquidation, dissolution or winding up of Customers Bancorp. Additional issuances by us of preferred stock ranking equally with Series C, Series D, Series E, and Series F Preferred Stock do not generally require the approval of holders of the Series C, Series D, Series E, and Series F Preferred Stock.
Risks Relating to Our Debt Securities
Our 6.375% Senior Notes and 4.625% Senior Notes contain limited covenants.
The terms of our 6.375% Senior Notes and 4.625% Senior Notes generally do not prohibit us from incurring additional debt or other liabilities. If we incur additional debt or liabilities, our ability to pay our obligations on the 6.375% Senior Notes and 4.625% Senior Notes could be adversely affected. In addition, the terms of our 6.375% Senior Notes and 4.625% Senior Notes do not require us to maintain any financial ratios or specific levels of net worth, revenues, income, cash flows or liquidity and, accordingly, do not protect holders of those notes in the event that we experience material adverse changes in our financial condition or results of operations. Holders of the 6.375% Senior Notes and 4.625% Senior Notes also have limited protection in the event of a highly leveraged transaction, reorganization, default under our existing indebtedness, restructuring, merger or similar transaction.
Our ability to make interest and principal payments on the 6.375% Senior Notes and 4.625% Senior Notes is dependent on dividends and distributions we receive from our subsidiaries, which are subject to regulatory and other limitations.
Our principal source of cash flow is dividends from Customers Bank. We cannot assure you that Customers Bank will, in any circumstances, pay dividends to us. If Customers Bank fails to make dividend payments to us, and sufficient cash is not otherwise available, we may not be able to make interest and principal payments on the 6.375% Senior Notes and 4.625% Senior Notes. Various federal and state statutes, regulations and rules limit, directly or indirectly, the amount of dividends that our banking and other subsidiaries may pay to us without regulatory approval. In particular, dividend and other distributions from Customers Bank to us would require notice to or approval of the applicable regulatory authority. There can be no assurances that we would receive such approval.
In addition, our right to participate in any distribution of assets of any of our subsidiaries upon the subsidiary’s liquidation or otherwise, and, as a result, the ability of a holder of 6.375% Senior Notes and 4.625% Senior Notes to benefit indirectly from such distribution, will be subject to the prior claims of preferred equity holders and creditors of that subsidiary, except to the extent that any of our claims as a creditor of such subsidiary may be recognized. As a result, the 6.375% Senior Notes and 4.625% Senior Notes are effectively subordinated to all existing and future liabilities and any preferred equity of our subsidiaries.
We may not be able to generate sufficient cash to service our debt obligations, including our obligations under the 6.375% Senior Notes and 4.625% Senior Notes.
Our ability to make payments on and to refinance our indebtedness, including the 6.375% Senior Notes and 4.625% Senior Notes, will depend on our financial and operating performance, including dividends payable to us from Customers Bank, which are subject to prevailing economic and competitive conditions and to certain financial, business and other factors beyond our control. We may be unable to maintain a level of cash flows from operating activities sufficient to permit us to pay the principal, premium, if any, and interest on our indebtedness, including the notes.
If our cash flows and capital resources, and dividends from Customers Bank, are insufficient to fund our debt service obligations, we may be unable to provide new loans, other products or to fund our obligations to existing customers and otherwise implement our business plans. As a result, we may be unable to meet our scheduled debt service obligations. In the absence of sufficient operating results and resources, we could face substantial liquidity problems and might be required to dispose of material assets or operations to meet our debt service and other obligations, or seek to restructure our indebtedness, including the notes. We may not be able to consummate these transactions, and these proceeds may not be adequate to meet our debt service obligations then due.
The 6.375% Senior Notes and 4.625% Senior Notes are our unsecured obligations. The 6.375% Senior Notes and 4.625% Senior Notes will rank equal in right of payment with all of our secured and unsecured senior indebtedness and will rank senior in right of payment to all of our subordinated indebtedness. Although the 6.375% Senior Notes and 4.625% Senior Notes are “senior notes,” they will be effectively subordinate to all liabilities of our subsidiaries, including secured indebtedness.
49
The 6.375% Senior Notes and 4.625% Senior Notes may not have an active trading market.
Although the 6.375% Senior Notes are listed on the New York Stock Exchange, an active trading market may not be established or maintained for those notes and transaction costs could be high. The 4.625% Senior Notes are not listed on any securities exchange and there is no active trading market for these notes. In addition to the other factors described below, the lack of a trading market for the 4.625% Senior Notes may adversely affect the holder’s ability to sell the notes and the prices at which the notes may be sold.
The prices realizable from sales of the 6.375% Senior Notes and 4.625% Senior Notes in any secondary market also will be affected by the supply and demand of the notes, the interest rate, the ranking and a number of other factors, including:
|
•
|
yields on U.S. Treasury obligations and expectations about future interest rates;
|
|
•
|
actual or anticipated changes in our financial condition or results, including our levels of indebtedness;
|
|
•
|
general economic conditions and expectations regarding the effects of national policies;
|
|
•
|
investors’ views of securities issued by both holding companies and similar financial service firms; and
|
|
•
|
the market for similar securities.
|
None.
The table below summarizes all Customers' locations. It includes our leased branch, limited purpose and administrative office properties, by county and state, as of
December 31, 2016
.
|
Bank Branches
|
|||
|
County
|
State
|
Leased
|
|
|
Berks (1)
|
PA
|
4
|
|
|
Bucks
|
PA
|
3
|
|
|
Chester (2)
|
PA
|
3
|
|
|
Delaware
|
PA
|
2
|
|
|
Westchester
|
NY
|
1
|
|
|
Mercer
|
NJ
|
1
|
|
|
14
|
|
||
50
|
Limited Purpose and Administrative Offices
|
|||
|
County
|
State
|
Leased
|
|
|
Berks (3)
|
PA
|
3
|
|
|
Bucks (6)
|
PA
|
1
|
|
|
Chester (2)
|
PA
|
2
|
|
|
Delaware (7)
|
PA
|
1
|
|
|
Lancaster (14)
|
PA
|
1
|
|
|
Philadelphia (8)
|
PA
|
1
|
|
|
Fairfax (9)
|
VA
|
1
|
|
|
Mercer (4)
|
NJ
|
1
|
|
|
Morris (14)
|
NJ
|
1
|
|
|
New Haven (16)
|
CT
|
1
|
|
|
New York (10)
|
NY
|
2
|
|
|
Westchester (5)
|
NY
|
2
|
|
|
Suffolk (13)
|
NY
|
1
|
|
|
Providence (11)
|
RI
|
1
|
|
|
Rockingham (15)
|
NH
|
1
|
|
|
Suffolk (12)
|
MA
|
1
|
|
|
21
|
|
||
|
(1)
|
Includes the full service branch at 1001 Penn Avenue, Wyomissing, PA as well as three branches acquired through the Berkshire Bancorp, Inc. acquisition. The lease expirations range from 2017 to 2021.
|
|
(2)
|
Includes the corporate headquarters of Customers Bank and a full service branch located in a freestanding building at 99 Bridge St., Phoenixville, PA 19460, wherein we lease approximately 31,054 square feet on 4 floors. The lease on this location expires in 2023. Also includes the lease of 5,523 square feet of property at 513 Kimberton Road in Phoenixville, PA where we maintain a full service commercial bank branch and corporate offices. The lease on this location expires in 2019.
|
|
(3)
|
Includes the corporate headquarters of Customers Bancorp and a full service branch located at 1015 Penn Avenue, Wyomissing, PA. The leased space covers a total of 23,719 square feet. This lease expires in 2020. Also, includes the leased administrative offices for the corporate lending group which is housed within the Exeter branch location, expiring in 2021, and an administrative office for Customers personnel in Shillington, PA, expiring in 2018.
|
|
(4)
|
Includes 7,327 square feet of leased space in Hamilton, NJ from which we conduct our mortgage warehouse activities. The lease on this location expires in 2019.
|
|
(5)
|
Represents administrative offices for Customers personnel. The leases at these locations expire in 2019 and 2022.
|
|
(6)
|
Represents administrative office for Customers personnel. The lease on this location expires in 2017.
|
|
(7)
|
Represents administrative office for Customers personnel. The lease on this location expires in 2018.
|
|
(8)
|
Represents limited purpose office for Customers personnel. The lease on this location expires in 2023.
|
|
(9)
|
Represents limited purpose office. The space is currently sublet to a third party. The lease on this location expires in 2019.
|
|
(10)
|
Represents limited purpose offices. One location is currently sublet to a third party (expires in 2020). Our new location, utilized for Customers personnel, expires in 2027.
|
|
(11)
|
Represents limited purpose office for Customers personnel. The lease on this location expires in 2021.
|
|
(12)
|
Represents limited purpose office for Customers personnel. The lease on this location expires in 2019.
|
|
(13)
|
Represents limited purpose office for Customers personnel. The lease on this location expires in 2025.
|
|
(14)
|
Represents administrative office for Customers personnel. The lease on this location expires in 2017.
|
|
(15)
|
Represents limited purpose office for Customers personnel. The lease on this location expires in 2018.
|
|
(16)
|
Includes facilities utilized by BankMobile for the acquired Disbursement business. Usage of the facility through June 30, 2017 is included in the Transition Services Agreement. See NOTE 2 - ACQUISITION ACTIVITY for more information.
|
The Bank branch locations, which range in size from approximately 1,500 to 6,100 square feet, have leases on these locations which expire between 2017 and 2025.
51
The total minimum net cash lease payments for our current branches, administrative offices and mortgage warehouse lending locations amount to approximately $325,000 per month.
Halbreiner Matter
On December 16, 2016, Elizabeth Halbreiner and Robert Halbreiner (“Plaintiffs”) filed a Second Amended Complaint captioned
Elizabeth Halbreiner and Robert Halbriener, v. Customers Bank, Robert B.White, Richard A. Ehst, Thomas Jastrem, Timothy D. Romig, Andrew Bowman, Michael Fuoco, Saldutti Law Group f/k/a Saldutti, LLC a/k/a Saldutti Law, LLC, Robert L. Saldutti, LLC, Robert L. Saldutti, Esquire, Brian J. Schaffer, Esquire, Robert Lieber, Jr., Esquire, Jay Sidhu, James Zardecki, Zardecki Associates LLC, No. 01419 in the First Judicial District of Pennsylvania, Court of Common Pleas of Philadelphia, Trial Division
. In this Second Amended Complaint, the Plaintiffs generally allege that Customers Bank, and the other named defendants, conspired to misuse the legal system for improper purposes and it also alleges defamation, false light, tortious interference with contractual relations, infliction of emotional distress, negligent infliction of emotional distress and loss of consortium
.
On January 6, 2017, Customers Bank filed Preliminary Objections to the Complaint seeking dismissal of Plaintiff’s claims against Customers Bank and the employees of Customers Bank named as co-defendants.
Customers Bank intends to vigorously defend itself against these allegations but is currently unable to predict the outcome of this lawsuit and therefore cannot determine the likelihood of loss nor estimate a range of possible loss.
Lifestyle Healthcare Group, Inc. Matter
On January 9, 2017, Lifestyle Healthcare Group, Inc., et al (“Plaintiffs”) filed a Complaint captioned
Lifestyle Healthcare Group, Inc.; Fred Rappaport; Victoria Rappaport; Lifestyle Management Group, LLC Trading as Lifestyle Real Estate I, LP; Lifestyle Real Estate I GP, LLC; Daniel Muck; Lifestyle Management Group, LLC; Lifestyle Management Group, LLC Tradign as Lyfestyle I, LP D/B/A Lifestyle Medspa, Plaintiffs v. Customers Bank, Robert White; Saldutti Law, LLC a/k/a Saldutti Law Group; Robert L. Saldutti, Esquire; and Michael Fuoco, Civil Action No. 01206, in the First Judicial District of Pennsylvania, Court of Common Pleas of Philadelphia
. In this Complaint, which is related to the
Halbreiner Matter described above
, the Plaintiffs generally allege wrongful use of civil proceedings and abuse of process in connection with a case filed and later dismissed in federal court, titled,
Customers Bank v. Fred Rappaport, et al., U.S.D.C.E.D. Pa., No. 15-6145.
On January 30, 2017, Customers Bank filed Preliminary Objections to the Complaint seeking dismissal of Plaintiff’s claims against Customers Bank and Robert White, named as co-defendants.
In response to the Preliminary Objections, Lifestyle filed an Amended Complaint against Customers Bank and Robert White. Customers Bank intends to vigorously defend itself against these allegations but is currently unable to predict the outcome of this lawsuit and therefore cannot determine the likelihood of loss nor estimate a range of possible loss.
Civil Money Penalty Resolution
As previously disclosed, Customers Bank had been in discussions with the Board of Governors of the Federal Reserve (the "Federal Reserve Board") staff regarding certain compliance matters relating to certain past activities of Higher One Holdings, Inc. To settle these matters from 2013 and to move forward, on December 6, 2016, Customers Bank agreed to the issuance by the Federal Reserve Board of a combined Order to Cease and Desist and Order of Assessment of a Civil Money Penalty Issued Upon Consent Pursuant to the Federal Deposit Insurance Act, as amended (the "Order") with respect to these matters. Pursuant to the terms of the Order, Customers Bank was, among other things, assessed a civil money penalty of $960,000. Customers had previously set aside a reserve for the civil money penalty and made payment in 2016. Therefore, the civil money penalty, and other provisions of the Order, will not have a material adverse effect on Customers' results of operations or the conduct of Customers' business prospectively.
Not Applicable.
52
|
Item 5.
|
Market For Registrant’s Common Equity, Related Stockholder Matters and Issuer Purchases of Equity Securities
|
Trading Market for Voting Common Stock
Our common stock is traded on the New York Stock Exchange under the symbol “CUBI.”
Market Price of Voting Common Stock
The chart below displays the high and low closing sale prices of the common stock of Customers Bancorp as reported on the New York Stock Exchange for each of the four quarters of 2016 and 2015.
|
High
|
Low
|
||||||
|
2017
|
|||||||
|
First quarter (through February 28, 2017)
|
$
|
36.21
|
|
$
|
33.83
|
|
|
|
2016
|
|||||||
|
Fourth quarter
|
$
|
36.68
|
|
$
|
24.49
|
|
|
|
Third quarter
|
26.24
|
|
23.99
|
|
|||
|
Second quarter
|
27.27
|
|
22.34
|
|
|||
|
First quarter
|
26.50
|
|
21.78
|
|
|||
|
2015
|
|||||||
|
Fourth quarter
|
$
|
31.00
|
|
$
|
24.30
|
|
|
|
Third quarter
|
29.02
|
|
22.51
|
|
|||
|
Second quarter
|
27.49
|
|
24.05
|
|
|||
|
First quarter
|
24.65
|
|
17.96
|
|
|||
As of
February 28, 2017
, there were
449
shareholders of record and
30,469,997
shares outstanding of Customers Bancorp's Voting Common Stock.
Dividends on Voting Common Stock
Customers Bancorp historically has not paid any cash dividends on its shares of common stock. Customers Bancorp does not expect to do so in the foreseeable future.
Any future determination relating to dividend policy will be made at the discretion of Customers Bancorp’s board of directors and will depend on a number of factors, including earnings and financial condition, liquidity and capital requirements, the general economic and regulatory climate, ability to service any equity or debt obligations senior to the Voting Common Stock, including obligations to pay dividends to the holders of Customers Bancorp's issued and outstanding shares of preferred stock, and other factors deemed relevant by the board of directors.
In addition, as a bank holding company, Customers Bancorp is subject to general regulatory restrictions on the payment of cash dividends. Federal bank regulatory agencies have the authority to prohibit bank holding companies from engaging in unsafe or unsound practices in conducting their business, which depending on the financial condition and liquidity of the holding company at the time, could include the payment of dividends. Further, various federal and state statutory provisions limit the amount of dividends that bank subsidiaries can pay to their parent holding company without regulatory approval. Generally, subsidiaries are prohibited from paying dividends when doing so would cause them to fall below the regulatory minimum capital levels, and limits exist on paying dividends in excess of net income for specified periods.
53
Beginning January 1, 2015, the ability to pay dividends and the amounts that can be paid, will be limited to the extent the bank capital ratios do not exceed the minimum required levels plus 250 basis points, as these requirements are phased in through January 1, 2019. See "Item 1, Business - Federal Banking Laws" for more information relating to restrictions on the Bank's ability to pay dividends to the Bancorp and the Bancorp's payment of dividends.
Issuer Purchases of Equity Securities
On November 26, 2013, the Bancorp’s Board of Directors authorized a stock repurchase plan in which the Bancorp could acquire up to 5% of its current outstanding shares at prices not to exceed a 20% premium over the then current book value. The repurchase program has no expiration date but may be suspended, modified or discontinued at any time, and the Bancorp has no obligation to repurchase any amount of its common stock under the program. There were no common stock repurchases during 2016.
EQUITY COMPENSATION PLANS
The following table provides certain summary information as of
December 31, 2016
concerning our compensation plans (including individual compensation arrangements) under which shares of our common stock may be issued.
|
Number of Securities
|
||||||||||
|
Number of Securities
|
Remaining
|
|||||||||
|
to be Issued upon
|
Available for Future Issuance
|
|||||||||
|
Exercise of
|
Weighted-Average
|
Issuance Under Equity
|
||||||||
|
Outstanding Options,
|
Exercise Price of
|
Compensation Plans
|
||||||||
|
Warrants, and
|
Outstanding Options
|
(Excluding Securities Reflected
|
||||||||
|
Plan Category
|
Rights (#)
|
($) (2)
|
in the First Column) (#)
|
|||||||
|
Equity Compensation Plans
|
||||||||||
|
Approved by Security Holders (1)
|
4,605,545
|
|
$
|
15.25
|
|
1,360,280
|
(3)
|
|||
|
Equity Compensation Plans Not
|
||||||||||
|
Approved by Security Holders
|
N/A
|
N/A
|
N/A
|
|||||||
(1) Includes shares of common stock that may be issued upon the exercise of awards granted or rights accrued under the Amended and Restated Customers Bancorp, Inc. 2004 Incentive Equity and Deferred Compensation Plan, Customers Bancorp, Inc. 2010 Stock Option Plan, the Bonus Recognition and Retention Program ("BRRP"), and Customers Bancorp, Inc. Amended and Restated 2014 Employee Stock Purchase Plan.
(2) Does not include restricted stock units and stock awards for which, by definition, there exists no exercise price.
(3) Does not include securities available for future issuance under the BRRP as there is no specific number of shares reserved under this plan. By its terms, the plan limits the award of restricted stock units to the amount of the cash bonuses paid to the participants in the BRRP.
Common Stock Performance Graph
The following graph compares the performance of our common stock over the period from December 31, 2012 to
December 31, 2016
, to that of the total return index for the SNL Mid-Atlantic Bank Index, SNL U.S. Bank NASDAQ Index and SNL U.S. Bank NYSE Index, assuming an investment of $100 on December 31, 2012. The SNL U.S. Bank NYSE Index was added to the performance graph because the Bancorp changed the listing of its Voting Common Stock to the NYSE from NASDAQ in December 2014. In calculating total annual shareholder return, reinvestment of dividends, if any, is assumed. Customers Bancorp obtained the information contained in the performance graph from SNL Financial.
54
The graph below is furnished under this Part II, Item 5 of this Annual Report on Form 10-K and shall not be deemed to be “soliciting material” or to be “filed” with the Commission or subject to Regulation 14A or 14C, or to the liabilities of Section 18 of the Exchange Act of 1934, as amended.
Total Return Performance
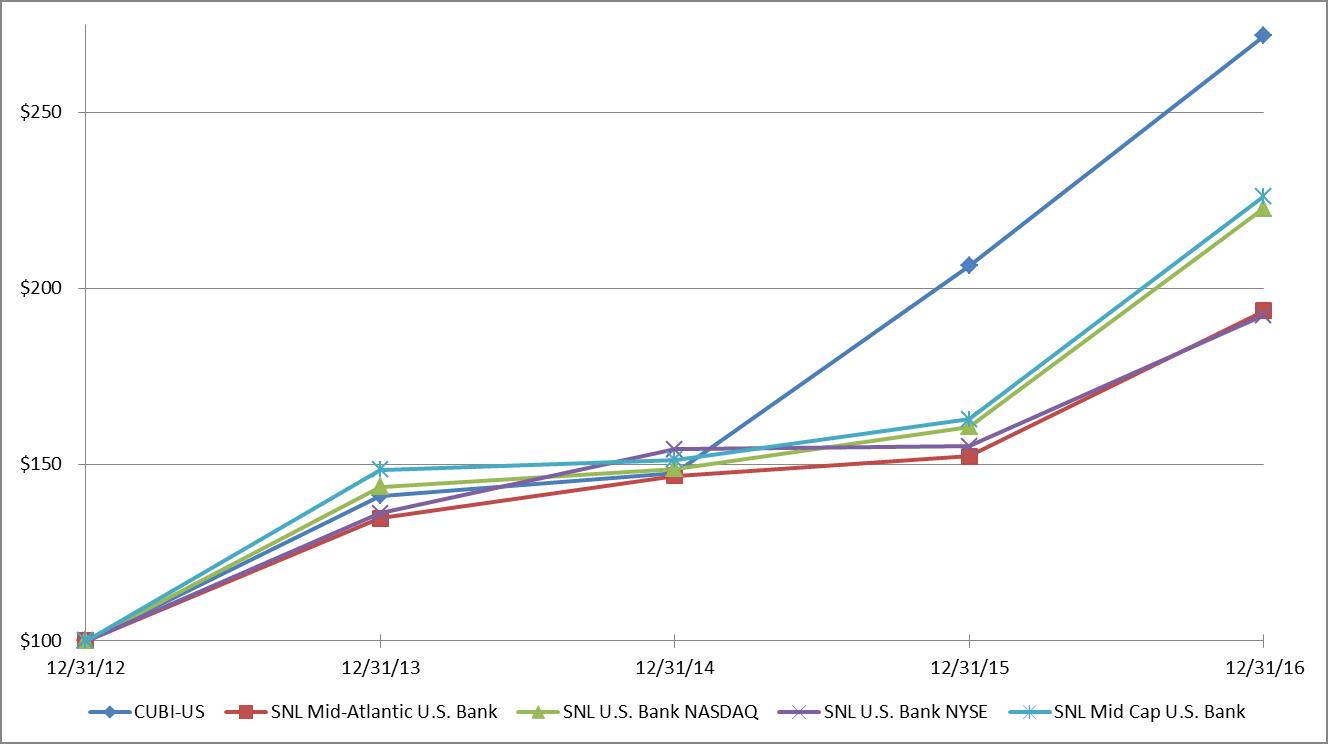
55
Customers Bancorp, Inc. and Subsidiaries
The following table presents Customers Bancorp’s summary consolidated financial data. Customers Bancorp derived the balance sheet and income statement data for the years ended
December 31, 2016
,
2015
,
2014
,
2013
, and
2012
from its audited financial statements. The summary consolidated financial data should be read in conjunction with, and is qualified in their entirety by, Customers Bancorp’s financial statements and the accompanying notes and the other information included elsewhere in this Annual Report on Form 10-K. Certain amounts reported below have been reclassified to conform to the
2016
presentation, including the presentation of BankMobile as discontinued operations.
|
2016
|
2015
|
2014
|
2013
|
2012
|
|||||||||||||||
|
(dollars in thousands, except per share information)
|
|||||||||||||||||||
|
For the Years Ended December 31,
|
|||||||||||||||||||
|
Interest income
|
$
|
322,539
|
|
$
|
249,850
|
|
$
|
190,427
|
|
$
|
128,156
|
|
$
|
93,814
|
|
||||
|
Interest expense
|
73,023
|
|
53,551
|
|
38,504
|
|
24,301
|
|
21,761
|
|
|||||||||
|
Net interest income
|
249,516
|
|
196,299
|
|
151,923
|
|
103,855
|
|
72,053
|
|
|||||||||
|
Provision for loan losses
|
2,345
|
|
20,566
|
|
14,747
|
|
2,236
|
|
14,270
|
|
|||||||||
|
Total non-interest income
|
23,165
|
|
27,572
|
|
25,126
|
|
22,703
|
|
28,958
|
|
|||||||||
|
Total non-interest expense
|
131,217
|
|
107,568
|
|
96,788
|
|
73,676
|
|
50,651
|
|
|||||||||
|
Income from continuing operations before income tax expense
|
139,119
|
|
95,737
|
|
65,514
|
|
50,646
|
|
36,090
|
|
|||||||||
|
Income tax expense
|
51,412
|
|
32,664
|
|
20,982
|
|
17,736
|
|
12,272
|
|
|||||||||
|
Net income from continuing operations
|
87,707
|
|
63,073
|
|
44,532
|
|
32,910
|
|
23,818
|
|
|||||||||
|
Loss from discontinued operations before income taxes (1)
|
(14,524
|
)
|
(7,242
|
)
|
(2,126
|
)
|
(348
|
)
|
—
|
|
|||||||||
|
Income tax benefit from discontinued operations
|
(5,519
|
)
|
(2,752
|
)
|
(808
|
)
|
(132
|
)
|
—
|
|
|||||||||
|
Net loss from discontinued operations
|
(9,005
|
)
|
(4,490
|
)
|
(1,318
|
)
|
(216
|
)
|
—
|
|
|||||||||
|
Net income
|
78,702
|
|
58,583
|
|
43,214
|
|
32,694
|
|
23,818
|
|
|||||||||
|
Preferred stock dividends
|
9,515
|
|
2,493
|
|
—
|
|
—
|
|
—
|
|
|||||||||
|
Net income attributable to common shareholders
|
$
|
69,187
|
|
$
|
56,090
|
|
$
|
43,214
|
|
$
|
32,694
|
|
$
|
23,818
|
|
||||
|
Earnings per common share:
|
|||||||||||||||||||
|
Basic earnings per common share from continuing operations
|
$
|
2.83
|
|
$
|
2.26
|
|
$
|
1.67
|
|
$
|
1.34
|
|
$
|
1.61
|
|
||||
|
Basic earnings per common share
|
$
|
2.51
|
|
$
|
2.09
|
|
$
|
1.62
|
|
$
|
1.34
|
|
$
|
1.61
|
|
||||
|
Diluted earnings per common share from continuing operations
|
$
|
2.61
|
|
$
|
2.11
|
|
$
|
1.59
|
|
$
|
1.31
|
|
$
|
1.57
|
|
||||
|
Diluted earnings per common share
|
$
|
2.31
|
|
$
|
1.96
|
|
$
|
1.55
|
|
$
|
1.30
|
|
$
|
1.57
|
|
||||
|
At Period End
|
|||||||||||||||||||
|
Total assets
|
$
|
9,382,736
|
|
$
|
8,398,205
|
|
$
|
6,821,500
|
|
$
|
4,150,493
|
|
$
|
3,201,234
|
|
||||
|
Cash and cash equivalents
|
244,709
|
|
264,593
|
|
371,023
|
|
233,068
|
|
186,016
|
|
|||||||||
|
Investment securities
|
493,474
|
|
560,253
|
|
416,685
|
|
497,573
|
|
129,093
|
|
|||||||||
|
Loans held for sale (2)
|
2,117,510
|
|
1,797,064
|
|
1,435,459
|
|
747,593
|
|
1,439,889
|
|
|||||||||
|
Loans receivable
|
6,142,390
|
|
5,452,895
|
|
4,311,374
|
|
2,464,158
|
|
1,324,467
|
|
|||||||||
|
Allowance for loan losses
|
37,315
|
|
35,647
|
|
30,932
|
|
23,998
|
|
25,837
|
|
|||||||||
|
FDIC loss sharing receivable (3)
|
—
|
|
—
|
|
2,320
|
|
10,046
|
|
12,343
|
|
|||||||||
|
Deposits
|
6,846,980
|
|
5,662,433
|
|
4,296,242
|
|
2,959,922
|
|
2,440,818
|
|
|||||||||
|
Deposits (classified in liabilities held for sale)
|
456,795
|
|
247,068
|
|
236,297
|
|
236,481
|
|
—
|
|
|||||||||
|
Borrowings (4)
|
1,147,706
|
|
1,890,442
|
|
1,812,380
|
|
782,070
|
|
478,000
|
|
|||||||||
|
Liabilities held for sale
|
484,797
|
|
247,139
|
|
236,297
|
|
236,481
|
|
—
|
|
|||||||||
56
|
Shareholders’ equity
|
855,872
|
|
553,902
|
|
443,145
|
|
386,623
|
|
269,475
|
|
|||||||||
|
Tangible common equity (5)
|
620,780
|
|
494,682
|
|
439,481
|
|
382,947
|
|
265,786
|
|
|||||||||
|
Selected Ratios and Share Data
|
|||||||||||||||||||
|
Return on average assets
|
0.86
|
%
|
0.81
|
%
|
0.78
|
%
|
0.95
|
%
|
1.02
|
%
|
|||||||||
|
Return on average common equity
|
12.41
|
%
|
11.82
|
%
|
10.39
|
%
|
9.49
|
%
|
12.69
|
%
|
|||||||||
|
Common book value per share
|
$
|
21.08
|
|
$
|
18.52
|
|
$
|
16.57
|
|
$
|
14.51
|
|
$
|
13.27
|
|
||||
|
Tangible book value per common share (5)
|
$
|
20.49
|
|
$
|
18.39
|
|
$
|
16.43
|
|
$
|
14.37
|
|
$
|
13.09
|
|
||||
|
Common shares outstanding
|
30,289,917
|
|
26,901,801
|
|
26,745,529
|
|
26,646,566
|
|
20,305,452
|
|
|||||||||
|
Net interest margin
|
2.84
|
%
|
2.81
|
%
|
2.86
|
%
|
3.13
|
%
|
3.21
|
%
|
|||||||||
|
Equity to assets
|
9.12
|
%
|
6.60
|
%
|
6.50
|
%
|
9.32
|
%
|
8.42
|
%
|
|||||||||
|
Tangible common equity to tangible assets (5)
|
6.63
|
%
|
5.89
|
%
|
6.45
|
%
|
9.23
|
%
|
8.31
|
%
|
|||||||||
|
Tier 1 leverage ratio – Customers Bank
|
9.23
|
%
|
7.30
|
%
|
7.39
|
%
|
10.81
|
%
|
7.74
|
%
|
|||||||||
|
Tier 1 leverage ratio – Customers Bancorp
|
9.07
|
%
|
7.16
|
%
|
6.69
|
%
|
10.11
|
%
|
9.30
|
%
|
|||||||||
|
Tier 1 risk-based capital ratio – Customers Bank
|
11.63
|
%
|
8.62
|
%
|
9.27
|
%
|
13.33
|
%
|
8.50
|
%
|
|||||||||
|
Tier 1 risk-based capital ratio – Customers Bancorp
|
11.41
|
%
|
8.46
|
%
|
8.39
|
%
|
12.44
|
%
|
10.23
|
%
|
|||||||||
|
Total risk-based capital ratio – Customers Bank
|
13.61
|
%
|
10.85
|
%
|
11.98
|
%
|
14.11
|
%
|
9.53
|
%
|
|||||||||
|
Total risk-based capital ratio – Customers Bancorp
|
13.05
|
%
|
10.62
|
%
|
11.09
|
%
|
13.21
|
%
|
11.26
|
%
|
|||||||||
|
Asset Quality
|
|||||||||||||||||||
|
Non-performing loans
|
$
|
17,792
|
|
$
|
10,771
|
|
$
|
11,733
|
|
$
|
19,163
|
|
$
|
32,851
|
|
||||
|
Non-performing loans to total loans receivable
|
0.29
|
%
|
0.20
|
%
|
0.27
|
%
|
0.78
|
%
|
2.48
|
%
|
|||||||||
|
Non-performing loans to total loans
|
0.22
|
%
|
0.15
|
%
|
0.20
|
%
|
0.60
|
%
|
1.19
|
%
|
|||||||||
|
Other real estate owned
|
$
|
3,108
|
|
$
|
5,057
|
|
$
|
15,371
|
|
$
|
12,265
|
|
$
|
8,114
|
|
||||
|
Non-performing assets
|
20,900
|
|
15,828
|
|
27,104
|
|
31,428
|
|
40,965
|
|
|||||||||
|
Non-performing assets to total assets
|
0.22
|
%
|
0.19
|
%
|
0.40
|
%
|
0.76
|
%
|
1.28
|
%
|
|||||||||
|
Allowance for loan losses to total loans receivable
|
0.61
|
%
|
0.65
|
%
|
0.72
|
%
|
0.97
|
%
|
1.95
|
%
|
|||||||||
|
Allowance for loan losses to non-performing loans
|
209.73
|
%
|
330.95
|
%
|
263.63
|
%
|
125.23
|
%
|
78.65
|
%
|
|||||||||
|
Net charge-offs
|
$
|
1,662
|
|
$
|
11,979
|
|
$
|
3,124
|
|
$
|
6,894
|
|
$
|
5,466
|
|
||||
|
Net charge-offs to average total loans receivable
|
0.03
|
%
|
0.26
|
%
|
0.09
|
%
|
0.37
|
%
|
0.38
|
%
|
|||||||||
|
1.
|
BankMobile's results are reflected in discontinued operations.
|
|
2.
|
In
2016
,
2015
and
2014
, loans held for sale included
$2,116,815
,
$1,754,950
and $1,332,019 of mortgage warehouse loans at fair value, respectively
|
|
3.
|
The FDIC loss sharing receivable, as of December 2015, is included in "Accrued interest payable and other liabilities" net of the clawback liability.
|
|
4.
|
Borrowings includes FHLB advances, Federal funds purchased, Subordinated debt, and other borrowings
|
|
5.
|
Customers’ selected financial data contains non-GAAP financial measures calculated using non-GAAP amounts. These measures include tangible common equity and tangible book value per common share and tangible common equity to tangible assets. Management uses these non-GAAP measures to present historical periods comparable to the current period presentation. In addition, management believes the use of these non-GAAP measures provides additional clarity when assessing the Bancorp’s financial results and use of equity. These disclosures should not be viewed as substitutes for results determined to be in accordance with U.S. GAAP, nor are they necessarily comparable to non-GAAP performance measures that may be presented by other entities. Customers Bancorp calculates tangible common equity by excluding intangible assets from total shareholders’ equity. Tangible book value per common share equals tangible common equity divided by common shares outstanding.
|
57
A reconciliation of shareholders’ equity to tangible common equity and other related amounts is set forth below.
|
2016
|
2015
|
2014
|
2013
|
2012
|
|||||||||||||||
|
(in thousands, except per share data)
|
|||||||||||||||||||
|
Shareholders’ equity
|
$
|
855,872
|
|
$
|
553,902
|
|
$
|
443,145
|
|
$
|
386,623
|
|
$
|
269,475
|
|
||||
|
Less: intangible assets
|
(17,621
|
)
|
(3,651
|
)
|
(3,664
|
)
|
(3,676
|
)
|
(3,689
|
)
|
|||||||||
|
Less: preferred stock
|
(217,471
|
)
|
(55,569
|
)
|
—
|
|
—
|
|
—
|
|
|||||||||
|
Tangible common equity
|
$
|
620,780
|
|
$
|
494,682
|
|
$
|
439,481
|
|
$
|
382,947
|
|
$
|
265,786
|
|
||||
|
Shares outstanding
|
30,290
|
|
26,902
|
|
26,746
|
|
26,647
|
|
20,305
|
|
|||||||||
|
Common book value per share
|
$
|
21.08
|
|
$
|
18.52
|
|
$
|
16.57
|
|
$
|
14.51
|
|
$
|
13.27
|
|
||||
|
Less: effect of excluding intangible assets
|
(0.59
|
)
|
(0.13
|
)
|
(0.14
|
)
|
(0.14
|
)
|
(0.18
|
)
|
|||||||||
|
Common tangible book value per share
|
$
|
20.49
|
|
$
|
18.39
|
|
$
|
16.43
|
|
$
|
14.37
|
|
$
|
13.09
|
|
||||
|
Total assets
|
$
|
9,382,736
|
|
$
|
8,398,205
|
|
$
|
6,821,500
|
|
$
|
4,150,493
|
|
$
|
3,201,234
|
|
||||
|
Less: intangible assets
|
(17,621
|
)
|
(3,651
|
)
|
(3,664
|
)
|
(3,676
|
)
|
(3,689
|
)
|
|||||||||
|
Total tangible assets
|
$
|
9,365,115
|
|
$
|
8,394,554
|
|
$
|
6,817,836
|
|
$
|
4,146,817
|
|
$
|
3,197,545
|
|
||||
|
Equity to assets
|
9.12
|
%
|
6.60
|
%
|
6.50
|
%
|
9.32
|
%
|
8.42
|
%
|
|||||||||
|
Tangible common equity to tangible assets
|
6.63
|
%
|
5.89
|
%
|
6.45
|
%
|
9.23
|
%
|
8.31
|
%
|
|||||||||
58
This Management's Discussion and Analysis should be read in conjunction with “Business – Executive Summary” and the Bancorp’s consolidated financial statements and related notes for the year ended
December 31, 2016
. Certain amounts reported in the
2015
and
2014
financial statements have been reclassified to conform to the
2016
presentation. These reclassifications did not significantly impact Customers' financial position or results of operations.
Critical Accounting Policies
Customers has adopted various accounting policies that govern the application of accounting principles generally accepted in the United States of America (U.S. GAAP) and that are consistent with general practices within the banking industry in the preparation of its financial statements. Customers' significant accounting policies are described in NOTE 4 - SIGNIFICANT ACCOUNTING POLICIES AND BASIS OF PRESENTATION to its audited financial statements.
Certain accounting policies involve significant judgments and assumptions by Customers that have a material impact on the carrying value of certain assets and liabilities. Customers considers these accounting policies to be critical accounting policies. The judgment and assumptions used are based on historical experience and other factors, which are believed to be reasonable under the circumstances. Because of the nature of the judgments and assumptions management makes, actual results could differ from these judgments and estimates, which could have a material impact on the carrying values of Customers' assets and liabilities and results of operations.
The following is a summary of the policies Customers recognizes as involving critical accounting estimates: Allowance for Loan Losses, Stock-Based Compensation, Unrealized Gains and Losses on Available-for-Sale Securities and Other-Than-Temporary Impairment Analysis, Fair Values of Financial Instruments, Accounting for Purchased-Credit-Impaired (PCI) Loans, Deferred Income Taxes, and Goodwill and Other Intangible Assets.
Allowance for Loan Losses
Customers maintains an allowance for loan losses at a level management believes is sufficient to absorb estimated credit losses incurred as of the report date. Management’s determination of the adequacy of the allowance is based on periodic evaluations of the loan portfolio and other relevant factors. However, this evaluation is inherently subjective as it requires significant estimates by management. Consideration is given to a variety of factors in establishing these estimates including historical losses, peer and industry data, current economic conditions, the size and composition of the loan portfolio, delinquency statistics, criticized and classified assets and impaired loans, results of internal loan reviews, borrowers’ perceived financial and management strengths, the adequacy of underlying collateral, the dependence on collateral, or the strength of the present value of future cash flows and other relevant factors. These factors may be susceptible to significant change. To the extent actual outcomes differ from management estimates, additional provisions for loan losses may be required which may adversely affect Customers' results of operations in the future.
Subsequent to the acquisition of purchased-credit-impaired loans, estimates of cash flows expected to be collected are updated each reporting period based on updated assumptions regarding default rates, loss severities, and other factors that are reflective of current market conditions. Subsequent decreases in expected cash flows will generally result in a provision for loan losses. Subsequent increases in expected cash flows result in a reversal of the provision for loan losses to the extent of prior charges.
Stock-Based Compensation
Customers recognizes compensation expense for share-based awards in accordance with ASC 718,
Compensation – Stock Compensation.
Expense related to stock option awards is based on the fair value of the option at the grant date, with compensation expense recognized over the service period, which is usually the vesting period. For performance based awards, compensation cost is recognized over the vesting period as long as it remains probable that the performance conditions will be met. If the service or performance conditions are not met, Customers reverses previously recorded compensation expense upon forfeiture. Customers utilizes the Black-Scholes option-pricing model to estimate the fair value of each option on the date of grant. The Black-Scholes model takes into consideration the exercise price of the option, the expected life of the option, the current price of the underlying stock and its expected volatility, expected dividends on the stock, and the current risk-free interest rate for the expected life of the option. Customers' estimate of the fair value of a stock option is based on expectations derived from its limited historical experience and may not necessarily equate to market value when fully vested.
59
Unrealized Gains and Losses on Securities Available for Sale and Other-Than-Temporary Impairment Analysis
Customers receives estimated fair values of debt securities from independent valuation services and brokers. In developing these fair values, the valuation services and brokers use estimates of cash flows based on historical performance of similar instruments in similar rate environments. Debt securities available for sale consist primarily of mortgage-backed securities issued by U.S. government-sponsored agencies. Customers uses various indicators in determining whether a security is other-than-temporarily impaired including, for debt securities, when it is probable that the contractual interest and principal will not be collected, or for equity securities, whether the market value is below its cost for an extended period of time with low expectation of recovery. The debt securities are monitored for changes in credit ratings because adverse changes in credit ratings could indicate a change in the estimated cash flows of the underlying collateral or issuer.
For marketable equity securities, Customers considers the issuer’s financial condition, capital strength and near term prospects to determine whether an impairment is temporary or other-than-temporary. Customers also considers the volatility of a security’s price in comparison to the market as a whole and any recoveries or declines in fair value subsequent to the balance sheet date. If management determines that the impairment is other-than-temporary, the entire amount of the impairment as of the balance sheet date is recognized in earnings even if the decision to sell the security has not been made. The fair value of the security becomes the new amortized cost basis of the investment and is not adjusted for subsequent recoveries in fair value.
At December 31, 2016, management evaluated its available-for-sale debt securities for other-than-temporary impairment. The unrealized losses associated with the available-for-sale debt securities were not considered to be other-than-temporarily impaired at
December 31, 2016
because the losses were related to changes in interest rates and did not affect the expected cash flows of the underlying collateral or issuer. Customers does not intend to sell these securities and it is not more likely than not that Customers will be required to sell the securities before recovery of the amortized cost basis.
At December 31, 2016, management evaluated its equity holdings issued by a foreign entity for other-than-temporary impairment. Management determined it no longer had the intent to hold the securities until a recovery in fair value. Accordingly, Customers recognized an other-than-temporarily impairment loss of
$7.3 million
on these securities for the year ended
December 31, 2016
.
Fair Value
Fair value is defined as the price that would be received to sell an asset or paid to transfer a liability in an orderly transaction between market participants, other than in a forced or liquidation sale as of the measurement date (also referred to as an exit price). Management estimates the fair values of financial instruments using a variety of valuation methods. When financial instruments are actively traded and have quoted market prices, the quoted market prices are used for fair value. When the financial instruments are not actively traded, other observable market inputs, such as quoted prices of securities with similar characteristics, may be used, if available, to determine fair value. When observable market prices do not exist, Customers estimates fair value using unobservable data. The valuation methods and inputs consider factors such as types of underlying assets or liabilities, rates of estimated credit losses, interest rates or discount rates, and collateral. The best estimate of fair value involves assumptions including, but not limited to, various performance indicators, such as historical and projected default and recovery rates, credit ratings, current delinquency rates, loan-to-value ratios and the possibility of obligor refinancing. U.S. GAAP requires the use of fair values in determining the carrying values of certain assets and liabilities, as well as for specific disclosures. The most significant uses of fair values include residential mortgage loans acquired subject to an agreement to resell, residential mortgage loans originated with an intent to sell, available-for-sale investment securities, derivative assets and liabilities, impaired loans and foreclosed property and the net assets acquired in business combinations. For additional information, refer to NOTE 20 – DISCLOSURES ABOUT FAIR VALUE OF FINANCIAL INSTRUMENTS.
Purchased Credit-Impaired Loans
For certain acquired loans that have experienced a deterioration of credit quality, Customers follows the guidance contained in ASC 310-30,
Loans and Debt Securities Acquired with Deteriorated Credit Quality
. Purchased credit-impaired loans are loans that were acquired in business combinations or asset purchases with evidence of credit deterioration since origination to the date acquired and for which it is probable that all contractually required payments will not be collected are considered to be credit impaired. Evidence of credit quality deterioration as of purchase dates may include information such as past-due and non-accrual status, borrower credit scores and recent loan to value percentages.
The fair value of loans with evidence of credit deterioration is recorded net of a nonaccretable difference and, if appropriate, an accretable yield. The difference between contractually required payments at acquisition and the cash flows expected to be collected at acquisition is the nonaccretable difference, which is not included in the carrying amount of acquired loans.
60
Subsequent to acquisition, estimates of cash flows expected to be collected are updated each reporting period based on updated assumptions regarding default rates, loss severities, and other factors that are reflective of current market conditions. Subsequent decreases in the estimated cash flows of the loan will generally result in a provision for loan losses. Subsequent increases in cash flows result in a reversal of the provision for loan losses to the extent of prior charges, or a reclassification of the difference from nonaccretable to accretable with a positive impact on accretion of interest income in future periods. Further, any excess of cash flows expected at the time of acquisition over the estimated fair value is referred to as the accretable yield and is recognized in interest income over the remaining life of the loan when there is a reasonable expectation about the amount and timing of those cash flows.
Purchased-credit-impaired loans acquired may be aggregated into one or more pools, provided that the loans have common risk characteristics. A pool is then accounted for as a single asset with a single composite interest rate and an aggregate expectation of cash flows. On a quarterly basis, the Bank re-estimates the total cash flows (both principal and interest) expected to be collected over the remaining life of each pool. These estimates incorporate assumptions regarding default rates, loss severities, the amounts and timing of prepayments and other factors that reflect then-current market conditions. If the timing and/or amounts of expected cash flows on purchased-credit-impaired loans were determined not to be reasonably estimable, no interest would be accreted and the loans would be reported as non-accrual loans; however, when the timing and amounts of expected cash flows for purchased-credit-impaired loans are reasonably estimable, interest is being accreted and the loans are being reported as performing loans. Charge-offs are not recorded on purchased-credit-impaired loans until actual losses exceed the estimated losses that were recorded as purchase accounting adjustments at acquisition date.
Deferred Income Taxes
Customers provides for deferred income taxes on the liability method whereby tax assets are recognized for deductible temporary differences and deferred tax liabilities are recognized for taxable temporary differences. Temporary differences are the differences between the reported amounts of assets and liabilities in the financial statements and their tax basis. Deferred tax assets are reduced by a valuation allowance when, in the opinion of management, it is more likely than not that some portion or all of the deferred tax assets will not be realized. Deferred tax assets and liabilities are adjusted for the effects of changes in tax laws and rates on the date of enactment.
Goodwill and Other Intangible Assets
Goodwill represents the excess of cost over the identifiable net assets of businesses acquired. Other intangible assets represent purchased assets that lack physical substance but can be distinguished from goodwill because of contractual or other legal rights. Intangible assets that have finite lives, such as customer and university relationship intangibles and non-compete agreements, are amortized over their estimated useful lives and subject to periodic impairment testing. Goodwill and other intangible assets recognized as part of the Disbursement business acquisition were based on a preliminary allocation of the purchase price. In fourth quarter 2016, Customers recorded adjustments to the estimated fair values of the net assets acquired, which resulted in a
$1.0 million
increase in goodwill. For more information regarding the net assets acquired and goodwill recorded upon acquisition of the Disbursement business, see NOTE 2 - ACQUISITION ACTIVITY.
Goodwill and other intangible assets are reviewed for impairment annually as of October 31 and between annual tests when events and circumstances indicate that impairment may have occurred. Impairment of goodwill is a condition that exists when the carrying amount exceeds its implied fair value. A qualitative factor test can be performed to determine whether it is necessary to perform the two-step quantitative impairment test. If the results of the qualitative review indicate that it is unlikely (less than
50%
probability) that the carrying value of the reporting unit exceeds its fair value, no further evaluation needs to be performed.
Intangible assets subject to amortization are reviewed for impairment under ASC 360 which requires that a long-lived asset or asset group be tested for recoverability whenever events or changes in circumstances indicate that the carrying value may not be recoverable. The carrying value of a long-lived asset is not recoverable if it exceeds the sum of the undiscounted cash flows expected to result from the use and eventual disposition of the asset.
61
Overview
Like most financial institutions, Customers derives the majority of its income from interest it receives on its interest-earning assets, such as loans and investments. Customers' primary source of funds for making these loans and investments is its deposits, on which it pays interest. Consequently, one of the key measures of Customers' success is the amount of net interest income, or the difference between the income on its interest-earning assets and the expense on its interest-bearing liabilities, such as deposits and borrowings. Another key measure is the spread between the yield earned on these interest-earning assets and the rate paid on these interest-bearing liabilities, which is referred to as net interest spread.
There is credit risk inherent in all loans, so Customers maintains an allowance for loan losses to absorb probable losses on existing loans that may become uncollectible. Customers maintains this allowance by charging a provision for loan losses against its operating earnings. Customers has included a detailed discussion of this process, as well as several tables describing its allowance for loan losses.
BankMobile, a division of Customers Bank, derives the majority of its revenue from interchange and card revenue earned from the Disbursement business acquired from Higher One. In fourth quarter 2016, Customers decided to sell BankMobile and anticipates the sale to close in third quarter 2017. Accordingly, BankMobile has been classified as "held for sale" on the consolidated balance sheets and BankMobile's operating results have been presented as discontinued operations in the accompanying consolidated financial statements.
2017 Economic Outlook
U.S. Real GDP is forecast to grow 2.0% to 3.0% during 2017. Additionally, a dichotomy could develop between the U.S. and global economies as a result of President Trump’s policies (e.g., higher tariffs on trade, curbing illegal immigration, increased federal stimulus, and tax cuts for corporations and Americans), with the U.S. getting a short-term pickup in GDP growth while global growth is dampened by U.S. economic policy. Sectors tied closely to the domestic economy should fare better than those sectors that are more closely tied to the global economy. The U.S. economy is forecast to expand 2.2% in 2017 from around 1.6% in 2016, as consumer spending is bolstered by healthy employment and wage prospects, despite continued weak business investment.
While inflation has remained below the Federal Reserve's target of 2% (1.7% through the 12 months ended November 30, 2016 as published by the U.S. government on December 15, 2016), it is expected to climb to 2.2% in 2017 and 2.4% in 2018. If current projections are correct, it would be the first stretch of sustained inflation above 2% since before the recession of 2007 to 2009.
Since “lift off” in mid-December 2015 and an additional 25 basis points interest rate increase in mid-December 2016, it is expected that the Federal Reserve will continue to raise the overnight rate, increasing it three times during 2017. For these interest rate hikes to occur, the CPI and PCE deflators will need to continue to approach the Federal Reserve's 2% target and employment will need to improve or at least retain recent positive trends.
While the outlook in the U.S. remains optimistic in the short run, the Trump administration’s policies are likely to result in higher U.S. interest rates and a stronger dollar, which could have a significantly adverse impact on the global economy. In the longer run, however, these policies could also have a negative impact on U.S. growth as the boost from the fiscal stimulus diminishes and President Trump’s other policies (e.g., higher tariffs, curtailed immigration, and tighter monetary policy by the Federal Reserve) ultimately begin to weigh on domestic growth. In Customers Bancorp's market area, management sees continued moderate (2.0% to 3.0%) growth in 2017, the housing market continuing to improve, and unemployment improving or at least remaining at current levels during the year. Management is seeing improvement in loan demand in the Bank's commercial and industrial, multi-family and commercial real estate loan portfolios, although the market for multi-family loans is expected to be down by 25% to 30% in 2017 (with the Bank being down approximately 20% because it is better positioned than the large banks with exposure to a lot of potential refinance activity). As the Trump administration is only beginning to take shape, the political uncertainty in the U.S. and the challenges associated with that uncertainty will continue over the next few years. Overall, management is optimistic that 2017 will show a continuation of the improving economic environment experienced in 2016, providing the caveat that the political uncertainty surrounding the Trump administration’s ability to execute its policies could have a significant impact on the continued economic recovery.
62
Results of Operations
The following discussion of Customers Bancorp’s consolidated results of operations should be read in conjunction with its consolidated financial statements, including the accompanying notes. Also see "CRITICAL ACCOUNTING POLICIES” and “NOTE 4 - SIGNIFICANT ACCOUNTING POLICIES AND BASIS OF PRESENTATION” for information concerning certain significant accounting policies and estimates applied in determining reported results of operations.
For the years ended
December 31, 2016
and
2015
Net income available to common shareholders
increased
$13.1 million
, or
23.3%
, to
$69.2 million
for the year ended
December 31, 2016
, compared to
$56.1 million
for the year ended
December 31, 2015
. The
increased
net income available to common shareholders resulted from an increase in net interest income of
$53.2 million
and a decrease in provision for loan losses of
$18.2 million
, partly offset by a decrease in non-interest income of
$4.4 million
and increases in non-interest expense of
$23.6 million
, tax expense of
$18.7 million
, net loss from discontinued operations of
$4.5 million
, and preferred stock dividends of
$7.0 million
.
Net interest income from continuing operations increased
$53.2 million
, or
27.1%
, for the year ended
December 31, 2016
to
$249.5 million
, compared to
$196.3 million
for the year ended
December 31, 2015
. The increase in net interest income was driven by an increase in the average balance of loans and securities of
$1.8 billion
, from
$6.7 billion
in
2015
to
$8.5 billion
in
2016
, as well as the expansion of net interest margin (tax equivalent) by
3
basis points (from
2.81%
in
2015
to
2.84%
in
2016
).
The provision for loan losses from continuing operations
declined
$18.2 million
to
$2.3 million
for the year ended
December 31, 2016
, compared to
$20.6 million
for the same period in
2015
. The
decrease
in the provision for loan losses during
2016
was primarily attributable to a provision expense of $9.0 million recorded in 2015 for a fraudulent loan that was charged off in its entirety during 2015, greater growth in loans held for investment in 2015 as compared to 2016, a benefit of $0.3 million in 2016 attributable to FDIC loss sharing arrangements versus expense of $3.9 million in 2015, and recoveries totaling $2.7 million in 2016 compared to recoveries of $1.4 million in 2015.
Non-interest income from continuing operations
declined
$4.4 million
, or
16.0%
, for the year ended December 31,
2016
to
$23.2 million
, compared to
$27.6 million
for the year ended December 31,
2015
. The
decrease
resulted primarily from an impairment charge of
$7.3 million
recorded in 2016 due to Customers' change in intent to hold certain equity securities until the market price of the securities recovered and a decrease in bank-owned life insurance income of
$2.3 million
as a result of a $2.4 million benefit received on a bank-owned life insurance policy in 2015. These decreases were offset in part by increased mortgage warehouse transactional fees of $1.2 million resulting from higher transaction volumes in 2016 as compared to 2015 and a $2.2 million recovery of a previously recorded loss during 2016.
Non-interest expense from continuing operations increased
$23.6 million
, or
22.0%
, during the year ended December 31,
2016
to
$131.2 million
, compared to
$107.6 million
during the year ended December 31,
2015
. The increase was primarily driven by increases in salaries and employee benefits of
$11.5 million
, technology, communications and bank operations of
$3.5 million
, FDIC assessments, non-income taxes, and regulatory fees of
$2.5 million
, professional services of
$1.6 million
, occupancy expenses of
$1.4 million
, and one-time charges of $1.4 million associated with legal matters. Much of the increased non-interest expense was attributable to the increased level of staff and other operating expenses necessary to support and operate a
$9.4 billion
bank.
Income tax expense from continuing operations
increased
$18.7 million
for the year ended December 31,
2016
to
$51.4 million
, compared to
$32.7 million
in the same period in
2015
. The
increase
in income tax expense was driven primarily from increased pre-tax income of
$43.4 million
in
2016
and an increase in our effective tax rate of 2.84%, partially offset by the early adoption of ASU 2016-09,
Improvements to Employee Share Based Accounting
, which decreased income tax expense by
$4.1 million
for the year ended December 31,
2016
.
The loss from discontinued operations increased
$7.3 million
for the year ended December 31, 2016 to
$14.5 million
, compared to
$7.2 million
in the same period in 2015. The increase was primarily driven by additional expenses realized as a result of the acquisition of the Disbursement business in June 2016. The loss from discontinued operations provided a tax benefit of
$5.5 million
for the year ended December 31,
2016
, compared to
$2.8 million
for the same period of
2015
.
Preferred stock dividends increased
$7.0 million
for
2016
due to the issuance of the Series D, Series E and Series F Preferred Stock during 2016 with an aggregate principal balance of $167.5 million and an average dividend yield of 6.23%.
63
For the years ended
December 31, 2015
and
2014
Net income available to common shareholders increased $12.9 million, or 29.8%, to $56.1 million for the year ended December 31, 2015, compared to $43.2 million for the year ended December 31, 2014. The increased net income available to common shareholders resulted from increases in net interest income of $44.4 million and non-interest income of
$2.4 million
, partly offset by increases in the provision for loan losses of $5.8 million, non-interest expense of $10.8 million, tax expense of
$11.7 million
, net loss from discontinued operations of $3.2 million, and preferred stock dividends of $2.5 million.
Net interest income from continuing operations increased $44.4 million, or 29.2%, for the year ended December 31, 2015 to $196.3 million, compared to $151.9 million for the year ended December 31, 2014. The increase in net interest income was driven by an increase in the average balance of loans and securities of $1.6 billion, from $5.0 billion in 2014 to $6.7 billion in 2015, offset in part by a decline in the net interest margin (tax equivalent) of 6 basis points (from 2.87% in 2014 to 2.81% in 2015). The net margin decrease was largely a result of the growth in the lower yielding mortgage warehouse portfolio.
The provision for loan losses increased $5.8 million to $20.6 million for the year ended December 31, 2015, compared to $14.7 million for the same period in 2014. The increase in the provision for loan losses during 2015 was primarily attributable to a provision expense of $9.0 million for a fraudulent loan identified by Customers in third quarter 2015 that was charged off in its entirety during 2015.
Non-interest income from continuing operations increased $2.4 million, or 9.7%, during the year ended December 31, 2015 to $27.6 million, compared to $25.1 million for the year ended December 31, 2014. The increase resulted primarily from a benefit received on a bank-owned life insurance policy of $2.4 million, higher mortgage warehouse transactional fees driven by increased transaction volume and an increase in the gain on sale of loans, offset in part by gains realized from sales of investment securities of $3.2 million in 2014 compared to a loss of $0.1 million in 2015.
Non-interest expense from continuing operations increased $10.8 million, or 11.1%, during the year ended December 31, 2015 to $107.6 million, compared to $96.8 million during the year ended December 31, 2014. The increases in salaries and employee benefits of $10.3 million, professional services of $2.2 million, and technology of $0.9 million resulted from growth of Customers' business, which required additional team members, services, and support. These increases were offset in part by decreased assessments and regulatory fees of $1.0 million related primarily to an adjustment in the Pennsylvania shares tax expense and reduced loan workout expenses of $0.6 million resulting from lower levels of non-performing loans and recoveries of prior expenses on resolved loans during the year.
Income tax expense from continuing operations increased $11.7 million for the year ended December 31, 2015 to $32.7 million, compared to $21.0 million in the same period in 2014. The increase in income tax expense was driven primarily from increased pre-tax income of
$30.2 million
in 2015, offset in part by the benefit received on a bank-owned life insurance policy of $2.4 million, which was not taxable.
The loss from discontinued operations increased
$5.1 million
for the year ended December 31, 2015 to
$7.2 million
, compared to
$2.1 million
in the same period of 2014. The increase was driven by additional expenses incurred due to the launch of BankMobile in January 2015. The loss from discontinued operations provided a tax benefit of
$2.8 million
for the year ended December 31, 2015, compared to
$0.8 million
for the same period in 2014.
Preferred stock dividends increased $2.5 million for 2015 due to the accrual of dividends on Customers' Series C Preferred Stock issued in second quarter 2015.
64
NET INTEREST INCOME
Net interest income (the difference between the interest earned on loans, investments and interest-earning deposits with banks, and interest paid on deposits, borrowed funds and subordinated debt) is the primary source of Customers' earnings. The following table summarizes Customers' net interest income and related spread and margin for the periods indicated.
|
For the Years Ended December 31,
|
||||||||||||||||||||||||||||||||
|
2016
|
2015
|
2014
|
||||||||||||||||||||||||||||||
|
Average
balance
|
Interest
income or
expense
|
Average
yield or
cost
|
Average
balance
|
Interest
income or
expense
|
Average
yield or
cost
|
Average
balance
|
Interest
income or
expense
|
Average
yield or
cost
|
||||||||||||||||||||||||
|
(amounts in thousands)
|
||||||||||||||||||||||||||||||||
|
Assets
|
||||||||||||||||||||||||||||||||
|
Interest-earning deposits
|
$
|
225,409
|
|
$
|
1,218
|
|
0.54
|
%
|
$
|
271,201
|
|
$
|
718
|
|
0.26
|
%
|
$
|
228,668
|
|
$
|
577
|
|
0.25
|
%
|
||||||||
|
Investment securities (A)
|
540,532
|
|
14,293
|
|
2.64
|
%
|
427,638
|
|
10,405
|
|
2.43
|
%
|
451,932
|
|
10,386
|
|
2.30
|
%
|
||||||||||||||
|
Loans held for sale
|
1,967,436
|
|
69,469
|
|
3.53
|
%
|
1,589,176
|
|
51,553
|
|
3.24
|
%
|
911,506
|
|
30,801
|
|
3.38
|
%
|
||||||||||||||
|
Loans receivable (B)
|
5,971,530
|
|
233,349
|
|
3.91
|
%
|
4,635,136
|
|
182,280
|
|
3.93
|
%
|
3,655,938
|
|
146,388
|
|
4.00
|
%
|
||||||||||||||
|
Other interest earning assets
|
84,797
|
|
4,210
|
|
4.96
|
%
|
72,693
|
|
4,894
|
|
6.73
|
%
|
66,669
|
|
2,275
|
|
3.41
|
%
|
||||||||||||||
|
Total interest-earning assets
|
8,789,704
|
|
|
322,539
|
|
3.67
|
%
|
6,995,844
|
|
|
249,850
|
|
3.57
|
%
|
5,314,713
|
|
190,427
|
|
3.58
|
%
|
||||||||||||
|
Non-interest-earning assets
|
272,253
|
|
263,997
|
|
223,404
|
|
||||||||||||||||||||||||||
|
Assets held for sale
|
40,160
|
|
2,690
|
|
1,337
|
|
||||||||||||||||||||||||||
|
Total assets
|
$
|
9,102,117
|
|
$
|
7,262,531
|
|
$
|
5,539,454
|
|
|||||||||||||||||||||||
|
Liabilities
|
||||||||||||||||||||||||||||||||
|
Interest checking accounts
|
$
|
190,279
|
|
1,069
|
|
0.56
|
%
|
$
|
123,527
|
|
686
|
|
0.56
|
%
|
62,840
|
|
361
|
|
0.57
|
%
|
||||||||||||
|
Money market deposit accounts
|
3,085,140
|
|
19,233
|
|
0.62
|
%
|
2,412,958
|
|
12,548
|
|
0.52
|
%
|
1,712,896
|
|
10,391
|
|
0.61
|
%
|
||||||||||||||
|
Other savings accounts
|
36,548
|
|
76
|
|
0.21
|
%
|
35,659
|
|
102
|
|
0.29
|
%
|
40,795
|
|
172
|
|
0.42
|
%
|
||||||||||||||
|
Certificates of deposit
|
2,633,425
|
|
27,871
|
|
1.06
|
%
|
2,087,641
|
|
20,637
|
|
0.99
|
%
|
1,403,774
|
|
13,530
|
|
0.96
|
%
|
||||||||||||||
|
Total interest-bearing deposits
|
5,945,392
|
|
|
48,249
|
|
0.81
|
%
|
4,659,785
|
|
|
33,973
|
|
0.73
|
%
|
3,220,305
|
|
|
24,454
|
|
0.76
|
%
|
|||||||||||
|
Borrowings
|
1,498,899
|
|
24,774
|
|
1.65
|
%
|
1,369,841
|
|
19,578
|
|
1.43
|
%
|
1,264,860
|
|
14,050
|
|
1.11
|
%
|
||||||||||||||
|
Total interest-bearing liabilities
|
7,444,291
|
|
|
73,023
|
|
0.98
|
%
|
6,029,626
|
|
|
53,551
|
|
0.89
|
%
|
4,485,165
|
|
|
38,504
|
|
0.86
|
%
|
|||||||||||
|
Non-interest-bearing deposits
|
496,571
|
|
379,196
|
|
288,565
|
|
||||||||||||||||||||||||||
|
Non-interest-bearing deposits held for sale
|
377,028
|
|
312,963
|
|
331,820
|
|
||||||||||||||||||||||||||
|
Total deposits and borrowings
|
8,317,890
|
|
0.88
|
%
|
6,721,785
|
|
0.80
|
%
|
5,105,550
|
|
0.75
|
%
|
||||||||||||||||||||
|
Other non-interest-bearing liabilities
|
69,442
|
|
30,348
|
|
17,905
|
|
||||||||||||||||||||||||||
|
Liabilities held for sale
|
17,884
|
|
1,207
|
|
—
|
|
||||||||||||||||||||||||||
|
Total liabilities
|
8,405,216
|
|
6,753,340
|
|
5,123,455
|
|
||||||||||||||||||||||||||
|
Shareholders’ equity
|
696,901
|
|
509,191
|
|
415,999
|
|
||||||||||||||||||||||||||
|
Total liabilities and shareholders’ equity
|
$
|
9,102,117
|
|
$
|
7,262,531
|
|
$
|
5,539,454
|
|
|||||||||||||||||||||||
|
Net interest earnings
|
249,516
|
|
196,299
|
|
151,923
|
|
||||||||||||||||||||||||||
|
Tax-equivalent adjustment (C)
|
390
|
|
449
|
|
405
|
|
||||||||||||||||||||||||||
|
Net interest earnings
|
$
|
249,906
|
|
$
|
196,748
|
|
$
|
152,328
|
|
|||||||||||||||||||||||
|
Interest spread
|
2.79
|
%
|
2.77
|
%
|
2.83
|
%
|
||||||||||||||||||||||||||
|
Net interest margin
|
2.84
|
%
|
2.81
|
%
|
2.86
|
%
|
||||||||||||||||||||||||||
|
Net interest margin tax equivalent (C)
|
2.84
|
%
|
2.81
|
%
|
2.87
|
%
|
||||||||||||||||||||||||||
|
(A)
|
For presentation in this table, balances and the corresponding average rates for investment securities are based upon historical cost, adjusted for other than temporary impairment and amortization of premiums and accretion of discounts.
|
|
(B)
|
Includes non-accrual loans, the effect of which is to reduce the yield earned on loans, and deferred loan fees.
|
|
(C)
|
Full tax equivalent basis, using a 35% statutory tax rate to approximate interest income as a taxable asset.
|
65
The following table presents the dollar amount of changes in interest income and interest expense for the major categories of interest-earning assets and interest-bearing liabilities. Information is provided for each category of interest-earning assets and interest-bearing liabilities with respect to (i) changes attributable to volume (i.e., changes in average balances multiplied by the prior-period average rate) and (ii) changes attributable to rate (i.e., changes in average rate multiplied by prior-period average balances). For purposes of this table, changes attributable to both rate and volume which cannot be segregated have been allocated proportionately to the change due to volume and the change due to rate.
|
2016 vs. 2015
|
2015 vs. 2014
|
||||||||||||||||||||||
|
Increase (decrease) due
to change in
|
Increase (decrease) due
to change in
|
||||||||||||||||||||||
|
Rate
|
Volume
|
Total
|
Rate
|
Volume
|
Total
|
||||||||||||||||||
|
(amounts in thousands)
|
|||||||||||||||||||||||
|
Interest income:
|
|||||||||||||||||||||||
|
Interest-earning deposits
|
$
|
639
|
|
$
|
(139
|
)
|
$
|
500
|
|
$
|
29
|
|
$
|
112
|
|
$
|
141
|
|
|||||
|
Investment securities
|
961
|
|
2,927
|
|
3,888
|
|
594
|
|
(575
|
)
|
19
|
|
|||||||||||
|
Loans held for sale
|
4,854
|
|
13,062
|
|
17,916
|
|
(1,279
|
)
|
22,031
|
|
20,752
|
|
|||||||||||
|
Loans receivable
|
(1,160
|
)
|
52,229
|
|
51,069
|
|
(2,659
|
)
|
38,551
|
|
35,892
|
|
|||||||||||
|
Other interest-earning assets
|
(1,416
|
)
|
732
|
|
(684
|
)
|
2,396
|
|
223
|
|
2,619
|
|
|||||||||||
|
Total interest income
|
3,878
|
|
68,811
|
|
72,689
|
|
|
(919
|
)
|
60,342
|
|
59,423
|
|
||||||||||
|
Interest expense:
|
|||||||||||||||||||||||
|
Interest checking accounts
|
8
|
|
375
|
|
383
|
|
(12
|
)
|
337
|
|
325
|
|
|||||||||||
|
Money market deposit accounts
|
2,784
|
|
3,901
|
|
6,685
|
|
(1,640
|
)
|
3,797
|
|
2,157
|
|
|||||||||||
|
Other savings accounts
|
(29
|
)
|
3
|
|
(26
|
)
|
(49
|
)
|
(21
|
)
|
(70
|
)
|
|||||||||||
|
Certificates of deposit
|
1,539
|
|
5,695
|
|
7,234
|
|
355
|
|
6,752
|
|
7,107
|
|
|||||||||||
|
Total interest-bearing deposits
|
4,302
|
|
9,974
|
|
14,276
|
|
|
(1,346
|
)
|
10,865
|
|
9,519
|
|
||||||||||
|
Borrowings
|
3,243
|
|
1,953
|
|
5,196
|
|
4,288
|
|
1,240
|
|
5,528
|
|
|||||||||||
|
Total interest expense
|
7,545
|
|
11,927
|
|
19,472
|
|
|
2,942
|
|
12,105
|
|
15,047
|
|
||||||||||
|
Net interest income
|
$
|
(3,667
|
)
|
$
|
56,884
|
|
$
|
53,217
|
|
|
$
|
(3,861
|
)
|
$
|
48,237
|
|
$
|
44,376
|
|
||||
For the years ended
December 31, 2016
and
2015
Net interest income from continuing operations was
$249.5 million
for the year ended
December 31, 2016
, an increase of
$53.2 million
, or
27.1%
, when compared to net interest income for the year ended
December 31, 2015
of
$196.3 million
. The increase in net interest income in 2016 was primarily attributable to an increase of
$1.8 billion
in the average balance of interest-earning assets. Customers' net interest margin also expanded to
2.84%
for the year ended
December 31, 2016
from
2.81%
for the year ended
December 31, 2015
.
For the years ended
December 31, 2015
and
2014
Net interest income from continuing operations was
$196.3 million
for the year ended
December 31, 2015
, an increase of
$44.4 million
, or
29.2%
, when compared to net interest income for the year ended December 31,
2014
of
$151.9 million
. The increase in net interest income was primarily attributable to an increase of $1.6 billion in the average balance of loans and securities. While Customers' net interest margin decreased to 2.81% for the year ended
December 31, 2015
from 2.87% for the year ended December 31, 2014, the impact on net interest income was secondary to the significant increase in loan volume.
66
PROVISION FOR LOAN LOSSES
For more information about our provision and allowance for loan losses methodology and our loss experience, see “Critical Accounting Policies,” “Credit Risk” and “Asset Quality” herein and “NOTE 4 – SIGNIFICANT ACCOUNTING POLICIES AND BASIS OF PRESENTATION.”
Customers maintains its allowance for loan losses through a provision for loan losses charged as an expense on the consolidated statements of income. The loan portfolio is reviewed quarterly to evaluate the outstanding loans and to measure both the performance of the portfolio and the adequacy of the allowance for loan losses. The allowance for loan losses is estimated as of the end of each quarter and compared to the balance recorded in the general ledger net of charge-offs and recoveries. The allowance is adjusted to the estimated allowance for loan losses balance via a charge (or debit) to the provision for loan losses.
For the years ended
December 31, 2016
and
2015
During
2016
, the provision for loan losses from continuing operations was
$2.3 million
, a
decrease
of
$18.2 million
from a provision of
$20.6 million
in
2015
. The 2015 provision for loan losses included $9.0 million for a fraudulent loan that was charged off in its entirety and reflected greater growth in loans held for investment. The held-for-investment loan portfolio grew approximately $0.7 billion in 2016 compared to $1.1 billion in 2015, resulting in less provision for new loans of approximately $2.5 million. The 2016 provision included a benefit of $0.3 million attributable to FDIC loss share arrangements versus expense of $3.9 million in 2015. Recoveries in
2016
totaled
$2.7 million
compared to recoveries of
$1.4 million
in
2015
. There were no significant changes in Customers' methodology for estimating its allowance for loan losses and the provision for loan losses in 2016.
For the years ended
December 31, 2015
and
2014
During 2015, the provision for loan losses was $20.6 million, an increase of $5.8 million from a provision of $14.7 million in 2014. The 2015 provision for loan losses included $9.0 million for a fraudulent loan identified by Customers in third quarter 2015. The increase in the provision for loan losses resulting from this loan was offset in part by a $2.4 million reduction to the provision for loan losses resulting primarily from Customers' low level of historical losses on loans originated after 2009 and updating the estimated loss ratios to reflect actual industry performance rather than qualitative estimates. $5.3 million of the fraudulent loan was charged off in third quarter 2015 and the residual balance of $3.7 million was charged off in fourth quarter 2015.
67
NON-INTEREST INCOME
The chart below shows the various components of non-interest income for the years ended
December 31, 2016
,
2015
and
2014
.
|
For the Years Ended December 31,
|
|||||||||||
|
2016
|
2015
|
2014
|
|||||||||
|
(amounts in thousands)
|
|||||||||||
|
Mortgage warehouse transactional fees
|
$
|
11,547
|
|
$
|
10,394
|
|
$
|
8,233
|
|
||
|
Bank-owned life insurance
|
4,736
|
|
7,006
|
|
3,702
|
|
|||||
|
Gains on sales of loans
|
3,685
|
|
4,047
|
|
3,125
|
|
|||||
|
Deposit fees
|
1,140
|
|
943
|
|
801
|
|
|||||
|
Mortgage loan and banking income
|
969
|
|
741
|
|
2,048
|
|
|||||
|
Interchange and card revenue
|
620
|
|
536
|
|
532
|
|
|||||
|
Gain (loss) on sales of investment securities
|
25
|
|
(85
|
)
|
3,191
|
|
|||||
|
Impairment loss on investment securities
|
(7,262
|
)
|
—
|
|
—
|
|
|||||
|
Other
|
7,705
|
|
3,990
|
|
3,494
|
|
|||||
|
Total non-interest income
|
$
|
23,165
|
|
|
$
|
27,572
|
|
$
|
25,126
|
|
|
For the years ended
December 31, 2016
and
2015
Non-interest income from continuing operations
declined
$4.4 million
, or
16.0%
, for the year ended December 31,
2016
to
$23.2 million
, compared to
$27.6 million
for the year ended December 31,
2015
. The
decrease
resulted primarily from an impairment charge of
$7.3 million
recorded in 2016 due to Customers' change in intent to hold certain equity securities until the market price of the securities recovered, and a decrease in bank-owned life insurance income of
$2.3 million
as a result of a $2.4 million benefit received on a bank-owned life insurance policy in 2015. These decreases were offset in part by increased mortgage warehouse transactional fees of $1.2 million resulting from higher transaction volumes in 2016 as compared to 2015 and a $2.2 million recovery of a previously recorded loss during 2016.
For the years ended
December 31, 2015
and
2014
Non-interest income from continuing operations increased $2.4 million, or 9.7%, for the year ended December 31, 2015 to $27.6 million, compared to $25.1 million for the year ended December 31, 2014. The increase resulted primarily from a benefit received on a bank-owned life insurance policy of $2.4 million, higher mortgage warehouse transactional fees driven by increased transaction volume and an increase in the gain on sale of loans, offset in part by gains realized from sales of investment securities of $3.2 million in 2014 compared to a loss of $0.1 million in 2015.
68
NON-INTEREST EXPENSE
The below chart shows the various components of non-interest expense for the years ended
December 31, 2016
,
2015
, and
2014
.
|
|
For the Years Ended December 31,
|
||||||||||
|
|
2016
|
2015
|
2014
|
||||||||
|
(amounts in thousands)
|
|||||||||||
|
Salaries and employee benefits
|
$
|
67,877
|
|
$
|
56,341
|
|
$
|
46,083
|
|
||
|
Technology, communication and bank operations
|
12,888
|
|
9,379
|
|
8,466
|
|
|||||
|
FDIC assessments, taxes, and regulatory fees
|
12,568
|
|
10,110
|
|
11,116
|
|
|||||
|
Professional services
|
11,017
|
|
9,386
|
|
7,218
|
|
|||||
|
Occupancy
|
9,846
|
|
8,467
|
|
8,063
|
|
|||||
|
Loan workout
|
2,063
|
|
1,127
|
|
1,706
|
|
|||||
|
Other real estate owned
|
1,953
|
|
2,516
|
|
3,601
|
|
|||||
|
Advertising and promotion
|
576
|
|
697
|
|
1,180
|
|
|||||
|
Other
|
12,429
|
|
9,545
|
|
9,355
|
|
|||||
|
Total non-interest expense
|
$
|
131,217
|
|
|
$
|
107,568
|
|
|
$
|
96,788
|
|
For the years ended
December 31, 2016
and
2015
Non-interest expense from continuing operations was
$131.2 million
for the year ended
December 31, 2016
, which was an
increase
of
$23.6 million
over non-interest expense of
$107.6 million
for the year ended
December 31, 2015
.
Salaries and employee benefits, which represent the largest component of non-interest expense,
increased
$11.5 million
, or
20.5%
, to
$67.9 million
for the year ended
December 31, 2016
from
$56.3 million
for the year ended
December 31, 2015
. The increase was primarily related to headcount growth to support the larger multi-family, commercial real estate and commercial and industrial loan portfolios, and the increased deposits.
Technology, communication and bank operations expense
increased
$3.5 million
to
$12.9 million
for the year ended
December 31, 2016
from
$9.4 million
for the year ended
December 31, 2015
, primarily attributable to the organic growth of the Bank.
FDIC assessments, taxes, and regulatory fees
increased
$2.5 million
to
$12.6 million
for the year ended
December 31, 2016
from
$10.1 million
for the year ended
December 31, 2015
. The primary reason for the 2016 increase was an adjustment in 2015 that reduced the Pennsylvania shares tax expense by $2.3 million.
Professional services expense
increased
by
$1.6 million
to
$11.0 million
for the year ended
December 31, 2016
from
$9.4 million
for the year ended
December 31, 2015
, primarily attributable to increases in consulting, lending service fees, and other professional services expenses to support a $9.4 billion bank.
Occupancy expense
increased
by
$1.4 million
to
$9.8 million
for the year ended
December 31, 2016
from
$8.5 million
for the year ended
December 31, 2015
. This increase was driven by increased business activity in existing and new markets which required additional team members and facilities.
Other expense
increased
by
$2.9 million
to
$12.4 million
for the year ended
December 31, 2016
from
$9.5 million
for the year ended
December 31, 2015
. The increase was primarily attributable to one-time charges of $1.4 million associated with legal matters. In addition, Customers experienced higher levels of miscellaneous expenses resulting from the organic growth experienced over the past year, increased staffing, and other activities associated with business development.
For the years ended
December 31, 2015
and
2014
Non-interest expense from continuing operations was $107.6 million for the year ended December 31, 2015, which was an increase of $10.8 million over non-interest expense of $96.8 million for the year ended December 31, 2014.
Salaries and employee benefits, which represent the largest component of non-interest expense, increased $10.3 million, or 22.3%, to $56.3 million for the year ended December 31, 2015 from $46.1 million for the year ended December 31, 2014. Most
69
of the increased expense is attributable to increased salaries and other compensation costs, as well as increased level of staff necessary to run a larger bank. More specifically, the increased headcount was needed to support the growing multi-family, commercial real estate and commercial and industrial loan portfolios, and the increased deposits.
Professional services expense increased by $2.2 million to $9.4 million for the year ended December 31, 2015 from $7.2 million for the year ended December 31, 2014 due to increased professional services expense related to fees paid for the FHLB letter of credit used to collateralize municipal deposits, and other professional service expenses driven by the organic growth of the Bank.
FDIC assessments, taxes, and regulatory fees declined $1.0 million to $10.1 million for the year ended December 31, 2015 from $11.1 million for the year ended December 31, 2014. The primary reason for this decrease was due to an adjustment that reduced the Pennsylvania shares tax expense by $2.3 million recorded in second quarter 2015 offset in part by increased deposit premiums and other regulatory and filing fees largely as a result of the Bank's organic growth.
Technology, communication and bank operations expense increased $0.9 million to $9.4 million for the year ended December 31, 2015 from $8.5 million for the year ended December 31, 2014. This increase was primarily attributable to technology related expenses driven by the organic growth of the Bank.
Occupancy expense increased by $0.4 million to $8.5 million for the year ended December 31, 2015 from $8.1 million for the year ended December 31, 2014. This increase was driven by increased business activity in existing and new markets which required additional team members and facilities.
Other real estate owned expense declined $1.1 million to $2.5 million for the year ended December 31, 2015 from $3.6 million for the year ended December 31, 2014 as the level of other real estate owned declined from 2014. The decrease primarily resulted from lower valuation adjustments, reduced holding expenses, and decreased losses realized from the sale of other real estate owned.
Loan workout expense decreased by $0.6 million to $1.1 million for the year ended December 31, 2015 from $1.7 million for the year ended December 31, 2014. The decrease was attributable to lower workout costs driven by reduced levels of non-performing loans and recoveries of prior expenses incurred on two resolved loans during the year.
INCOME TAXES
For the years ended
December 31, 2016
and
2015
The income tax expense and effective tax rate include both federal and state income taxes. In
2016
, income tax expense from continuing operations was
$51.4 million
with an effective tax rate of
36.96%
, compared to an expense of
$32.7 million
and an effective tax rate of
34.12%
for
2015
. Income tax expense was driven primarily by net income before taxes of
$139.1 million
and
$95.7 million
, for the years ended
December 31, 2016
and
2015
, respectively. In
2016
, the effective tax rate was
higher
due to state income tax items totaling
$5.0 million
, or a
3.58%
effective tax rate increase, driven by a greater proportion of income producing assets domiciled in New York, particularly in New York City, an unrecorded basis difference in a foreign subsidiary of
$2.8 million
, or
2.03%
, related to an other-than-temporary impairment charge recorded on a equity investment in fourth quarter 2016, partially offset by an equity-based compensation benefit of
$3.7 million
or a
2.67%
effective tax rate reduction, from the early adoption of Accounting Standards Update No. 2016-09,
Improvements to Employee Share-Based Accounting,
and a reduction of
$1.7 million
, or a
1.23%
effective tax rate reduction, due to a tax benefit resulting from bank-owned life insurance income. In
2015
, the effective tax rate was reduced due to a tax benefit resulting from bank-owned life insurance income of
$2.4 million
, or
2.53%
.
For the years ended
December 31, 2015
and
2014
The income tax expense and effective tax rate include both federal and state income taxes. In 2015, income tax expense from continuing operations was
$32.7 million
with an effective tax rate of
34.12%
, compared to an expense of
$21.0 million
and an effective tax rate of
32.03%
for 2014. Income tax expense was driven primarily by net income before taxes of
$95.7 million
and
$65.5 million
, for the years ended December 31, 2015 and 2014, respectively. n 2015, the effective tax rate was lower due to non-taxable bank-owned life income and a non-taxable death benefit received totaling $2.4 million, or a 2.53% effective tax rate reduction. In 2014, the effective tax rate was reduced due to a tax benefit resulting from bank-owned life insurance income of $1.3 million, or a 1.98% effective tax rate reduction, and a benefit of $1.8 million, or a 2.77% effective tax rate reduction,
70
resulting primarily from recording a $1.5 million benefit from a return to provision and deferred tax analysis completed in third quarter 2014.
DISCONTINUED OPERATIONS
For the years ended
December 31, 2016
and
2015
The loss from discontinued operations before income taxes increased
$7.3 million
for the year ended
December 31, 2016
to
$14.5 million
, compared to
$7.2 million
in the same period in
2015
. The increase was primarily driven by additional net expense incurred as a result of the acquisition of the Disbursement business in June 2016. The loss from discontinued operations provided a tax benefit of
$5.5 million
for the year ended December 31,
2016
, compared to
$2.8 million
for the same period in
2015
, due to the larger operating loss from the business.
For the years ended
December 31, 2015
and
2014
The loss from discontinued operations before income taxes increased
$5.1 million
for the year ended December 31, 2015 to
$7.2 million
, compared to
$2.1 million
in the same period in 2014. The increase was driven by increased expenses for salaries and employee benefits, technology-related expenses and professional services due to the growth of BankMobile as Customers invested in a new business. The loss from discontinued operations provided a tax benefit of
$2.8 million
for the year ended December 31, 2015, compared to
$0.8 million
for the same period in 2014.
FINANCIAL CONDITION
GENERAL
Total assets were
$9.4 billion
at
December 31, 2016
. This represented a
$1.0 billion
, or
11.7%
,
increase
from total assets of
$8.4 billion
at
December 31, 2015
. The major change in our financial position occurred as a result of organic growth in loans receivable, which
increased
by $
0.7 billion
, or
12.6%
, to
$6.1 billion
at
December 31, 2016
, from
$5.5 billion
at
December 31, 2015
.
In 2016, Customers moderated its efforts to increase loan balances in order to focus on building a stronger balance sheet, capital base, and risk management infrastructure, and build BankMobile into a successful company that could be divested so both Customers and BankMobile can grow and thrive, without Durbin Amendment restrictions. Multi-family loans increased by
$0.3 billion
to
$3.2 billion
at
December 31, 2016
. Commercial loans and lines of credit to mortgage companies increased by
$0.4 billion
to
$2.2 billion
at
December 31, 2016
. Additionally, commercial and industrial loans, including owner-occupied commercial real estate,
increased
by
$0.3 billion
to
$1.3 billion
at
December 31, 2016
.
Total liabilities were
$8.5 billion
at
December 31, 2016
. This represented a
$0.7 billion
, or
8.7%
,
increase
from total liabilities of
$7.8 billion
at
December 31, 2015
. The
increase
in total liabilities resulted primarily from a higher level of deposits in
2016
compared to
2015
. Total deposits grew by
$1.2 billion
, or
20.9%
, to
$6.8 billion
at
December 31, 2016
from
$5.7 billion
at
December 31, 2015
. Transaction deposits increased by
$0.7 billion
, or
21.1%
, to
$4.0 billion
at
December 31, 2016
from
$3.3 billion
at
December 31, 2015
, with non-interest bearing deposits increasing by
$104 million
. Certificates of deposit accounts increased by
$0.5 billion
, or
20.6%
, to
$2.8 billion
at
December 31, 2016
from
$2.3 billion
at
December 31, 2015
.
71
The following table sets forth certain key condensed balance sheet data:
|
|
December 31,
|
||||||
|
|
2016
|
2015
|
|||||
|
(amounts in thousands)
|
|||||||
|
Cash and cash equivalents
|
$
|
244,709
|
|
$
|
264,593
|
|
|
|
Investment securities available for sale, at fair value
|
493,474
|
|
560,253
|
|
|||
|
Loans held for sale (includes $2,117,510 and $1,757,807 respectively at fair value)
|
2,117,510
|
|
1,797,064
|
|
|||
|
Loans receivable
|
6,142,390
|
|
5,452,895
|
|
|||
|
Total loans receivable, net of allowance for loan losses
|
6,105,075
|
|
5,417,248
|
|
|||
|
Total assets
|
9,382,736
|
|
8,398,205
|
|
|||
|
Total deposits
|
6,846,980
|
|
5,662,433
|
|
|||
|
Federal funds purchased
|
83,000
|
|
70,000
|
|
|||
|
FHLB advances
|
868,800
|
|
1,625,300
|
|
|||
|
Other borrowings
|
87,123
|
|
86,457
|
|
|||
|
Subordinated debt
|
108,783
|
|
108,685
|
|
|||
|
Liabilities held for sale
|
484,797
|
|
247,139
|
|
|||
|
Total liabilities
|
8,526,864
|
|
7,844,303
|
|
|||
|
Total shareholders’ equity
|
855,872
|
|
553,902
|
|
|||
|
Total liabilities and shareholders’ equity
|
9,382,736
|
|
8,398,205
|
|
|||
CASH AND CASH EQIVALENTS
Cash and due from banks consists mainly of vault cash and cash items in the process of collection. These balances totaled
$17.5 million
at
December 31, 2016
. This represents a
$36.1 million
decrease
from
$53.6 million
at
December 31, 2015
. These balances vary from day to day, primarily due to variations in customers’ deposits with the Bank.
Interest earning deposits consist mainly of deposits at the Federal Reserve Bank of Philadelphia. These deposits totaled
$227.2 million
at
December 31, 2016
, which was a
$16.2 million
increase
from
$211.0 million
at
December 31, 2015
. This balance varies from day to day, depending on several factors, such as variations in customers’ deposits with the Bank, payment of checks drawn on customers’ accounts, and strategic investment decisions made to maximize net interest income, while effectively managing interest-rate risk and liquidity.
INVESTMENT SECURITIES
The investment securities portfolio is an important source of interest income and liquidity. It consists of mortgage-backed securities (guaranteed by an agency of the United States government), domestic corporate debt, and marketable equity securities. In addition to generating revenue, the investment portfolio is maintained to manage interest rate risk, provide liquidity, provide collateral for other borrowings, and diversify the credit risk of interest-earning assets. The portfolio is structured to maximize net interest income, given changes in the economic environment, liquidity position and balance sheet mix.
At
December 31, 2016
, investment securities were
$493.5 million
compared to
$560.3 million
at
December 31, 2015
. The
decrease
was primarily the result of principal payments received on agency-guaranteed residential mortgage-backed securities and a decision to use the net proceeds from payments to invest in higher yielding loans.
Unrealized gains and losses on available-for-sale securities are included in other comprehensive income and reported as a separate component of shareholders’ equity, net of the related tax effect.
72
The following table sets forth the amortized cost of the investment securities at the last two fiscal year ends:
|
December 31,
|
|||||||
|
2016
|
2015
|
||||||
|
(amounts in thousands)
|
|||||||
|
Available for Sale:
|
|||||||
|
Residential mortgage-backed securities
|
$
|
233,002
|
|
$
|
299,392
|
|
|
|
Commercial real estate mortgage-backed securities
|
204,689
|
|
206,719
|
|
|||
|
Corporate notes (1)
|
44,932
|
|
39,925
|
|
|||
|
Equity securities (2)
|
15,246
|
|
22,514
|
|
|||
|
$
|
497,869
|
|
|
$
|
568,550
|
|
|
|
(1)
|
Includes subordinated debt issued by other bank holding companies.
|
|
(2)
|
Consists primarily of equity securities in a foreign entity.
|
For financial reporting purposes, available-for-sale securities are carried at fair value.
The following table sets forth information about the maturities and weighted-average yield of the securities portfolio. Yields are not reported on a tax-equivalent basis.
|
December 31, 2016
|
|
||||||||||||||||||||||||||
|
Amortized Cost
|
Fair
Value
|
||||||||||||||||||||||||||
|
<
1yr
|
1 -5
years
|
5 -10
years
|
After 10
years
|
No
Specific
Maturity
|
Total
|
Total
|
|||||||||||||||||||||
|
(amounts in thousands)
|
|||||||||||||||||||||||||||
|
Available for Sale
|
|||||||||||||||||||||||||||
|
Residential mortgage-backed securities
|
$
|
—
|
|
$
|
—
|
|
$
|
—
|
|
$
|
—
|
|
$
|
233,002
|
|
$
|
233,002
|
|
$
|
231,263
|
|
||||||
|
Yield
|
2.65
|
%
|
2.65
|
%
|
—
|
|
|||||||||||||||||||||
|
Commercial real estate mortgage-backed securities
|
204,689
|
|
$
|
204,689
|
|
201,817
|
|
||||||||||||||||||||
|
Yield
|
—
|
|
—
|
|
—
|
|
—
|
|
2.80
|
%
|
2.80
|
%
|
—
|
|
|||||||||||||
|
Corporate notes
|
—
|
|
—
|
|
37,932
|
|
7,000
|
|
—
|
|
44,932
|
|
45,148
|
|
|||||||||||||
|
Yield
|
—
|
|
—
|
|
5.58
|
%
|
5.54
|
%
|
—
|
|
5.57
|
%
|
—
|
|
|||||||||||||
|
Equity securities
|
—
|
|
—
|
|
—
|
|
—
|
|
15,246
|
|
15,246
|
|
15,246
|
|
|||||||||||||
|
Yield
|
—
|
|
—
|
|
—
|
|
—
|
|
—
|
%
|
—
|
%
|
—
|
|
|||||||||||||
|
Total
|
$
|
—
|
|
|
$
|
—
|
|
|
$
|
37,932
|
|
|
$
|
7,000
|
|
|
$
|
452,937
|
|
|
$
|
497,869
|
|
|
$
|
493,474
|
|
|
Weighted Average Yield
|
—
|
%
|
—
|
%
|
5.58
|
%
|
5.54
|
%
|
2.63
|
%
|
2.89
|
%
|
|||||||||||||||
The mortgage-backed securities in the portfolio were issued by Fannie Mae, Freddie Mac, and Ginnie Mae and contain guarantees for the collection of principal and interest on the underlying mortgages. The corporate notes in the portfolio include subordinated notes issued by other bank holding companies.
LOANS
Existing lending relationships are primarily with small and middle market businesses and individual consumers primarily in Bucks, Berks, Chester, Montgomery, Delaware, and Philadelphia Counties, Pennsylvania; Camden and Mercer Counties, New Jersey; and Westchester County and New York City, New York; and the New England area. The loans to mortgage banking companies portfolio is nation-wide. The loan portfolio consists primarily of loans to support mortgage banking companies’ funding needs, multi-family/commercial real estate, and commercial and industrial loans. The Bank continues to focus on small and middle market business loans to grow its commercial lending efforts, expand its specialty mortgage warehouse lending business, and expand its multi-family/commercial real estate lending business, and maintain its consumer portfolio.
73
Commercial Lending
Customers' commercial lending is divided into four groups: Business Banking, Small and Middle Market Business Banking, Multi-family and Commercial Real Estate Lending, and Mortgage Banking Lending. This grouping is designed to allow for greater resource deployment, higher standards of risk management, strong asset quality, lower interest rate risk and higher productivity levels.
The commercial lending group focuses on companies with annual revenues ranging from $1 million to $100 million, which typically have credit requirements between $0.5 million and $10 million.
The small and middle market business banking platform originates loans, including Small Business Administration loans, through the branch network sales force and a team of dedicated relationship managers. The support administration of this platform is centralized including risk management, product management, marketing, performance tracking and overall strategy. Credit and sales training has been established for Customers' sales force, ensuring that it has small business experts in place providing appropriate financial solutions to the small business owners in its communities. A division approach focuses on industries that offer high asset quality and are deposit rich to drive profitability.
In 2009, Customers launched its lending to mortgage banking businesses products, which primarily provides financing to mortgage bankers for residential mortgage originations from loan closing until sale in the secondary market. Many providers of liquidity in this segment exited the business in 2009 during a period of market turmoil. Customers saw an opportunity to provide liquidity to this business segment at attractive spreads. There was also the opportunity to attract escrow deposits and to generate fee income in this business.
The goal of the mortgage banking business lending group is to provide liquidity to mortgage companies. These loans are primarily used by mortgage companies to fund their pipelines from closing of individual mortgage loans until their sale into the secondary market. The underlying residential loans are taken as collateral for Customers' loans. As of December 31, 2016, loans in the warehouse lending portfolio totaled $2.1 billion and are designated as held for sale.
The goal of the multi-family lending product is to build a portfolio of high-quality multi-family loans within Customers' covered markets, while cross selling other products and services. This product primarily targets refinancing existing loans with other banks using conservative underwriting and provides purchase money for new acquisitions by borrowers. The primary collateral for these loans is a first lien mortgage on the multi-family property, plus an assignment of all leases related to such property. As of December 31, 2016, Customers had multi-family loans of $3.2 billion outstanding, comprising approximately 39.0% of the total loan portfolio, compared to $2.9 billion, or approximately 40.7% of the total loan portfolio, at December 31, 2015.
As of December 31, 2016, Customers had $8.0 billion in commercial loans outstanding, composing approximately 96.4% of its total loan portfolio, which includes loans held for sale, compared to $6.9 billion, composing approximately 94.6% at December 31, 2015.
Consumer Lending
Customers provides home equity and residential mortgage loans to customers. Underwriting standards for home equity lending are conservative and lending is offered to solidify customer relationships and grow relationship revenues in the long term. This lending is important in Customers' efforts to grow total relationship revenues for its consumer households. As of December 31, 2016, Customers had $298.7 million in consumer loans outstanding, or 3.6% of the total loan portfolio, which includes loans held for sale. The Bank plans to expand its product offerings in real estate secured consumer lending.
Customers Bank has launched a community outreach program in Philadelphia to finance homeownership in urban communities. As part of this program, the Bank is offering an “Affordable Mortgage Product”. This community outreach program is penetrating the underserved population, especially in low-and moderate income neighborhoods. As part of this commitment, a loan production office was opened in Progress Plaza, 1501 North Broad Street, Philadelphia, PA. The program includes homebuyer seminars that prepare potential homebuyers for homeownership by teaching money management and budgeting skills, including the financial responsibilities that come with having a mortgage and owning a home. The “Affordable Mortgage Product” is offered throughout Customers Bank’s assessment areas.
74
The composition of loans held for sale was as follows:
|
December 31,
|
|||||||||||||||||||
|
2016
|
2015
|
2014
|
2013
|
2012
|
|||||||||||||||
|
(amounts in thousands)
|
|
||||||||||||||||||
|
Commercial Loans:
|
|||||||||||||||||||
|
Mortgage warehouse loans at fair value
|
$
|
2,116,815
|
|
$
|
1,754,950
|
|
$
|
1,332,019
|
|
$
|
740,694
|
|
$
|
1,439,889
|
|
||||
|
Multi-family loans at lower of cost or fair value
|
—
|
|
39,257
|
|
99,791
|
|
—
|
|
—
|
|
|||||||||
|
Total commercial loans held for sale
|
2,116,815
|
|
1,794,207
|
|
1,431,810
|
|
740,694
|
|
1,439,889
|
|
|||||||||
|
Consumer Loans:
|
|||||||||||||||||||
|
Residential mortgage loans at fair value
|
695
|
|
2,857
|
|
3,649
|
|
6,899
|
|
—
|
|
|||||||||
|
Loans held for sale
|
$
|
2,117,510
|
|
$
|
1,797,064
|
|
$
|
1,435,459
|
|
$
|
747,593
|
|
$
|
1,439,889
|
|
||||
Because the FDIC loss sharing agreements were terminated in 2016, and the balance of covered loans was not significant to Customers' total loan portfolio, the disaggregation between covered and non-covered loans is no longer presented in the disclosures that follow. Additional disaggregation of the commercial real estate loan portfolio between owner occupied and non-owner occupied is presented for 2016, 2015 and 2014. For years prior, owner occupied and non-owner occupied are presented collectively as commercial real estate loans.
The composition of loans receivable (excluding loans held for sale) was as follows:
|
December 31,
|
|||||||||||||||||||
|
2016
|
2015
|
2014
|
2013
|
2012
|
|||||||||||||||
|
(amounts in thousands)
|
|||||||||||||||||||
|
Commercial:
|
|||||||||||||||||||
|
Multi-family
|
$
|
3,214,999
|
|
$
|
2,909,439
|
|
$
|
2,208,405
|
|
$
|
1,064,059
|
|
$
|
363,336
|
|
||||
|
Commercial and industrial (a)
|
1,370,853
|
|
1,111,400
|
|
785,669
|
|
296,595
|
|
126,333
|
|
|||||||||
|
Commercial real estate (b)
|
1,193,715
|
|
956,255
|
|
839,310
|
|
753,591
|
|
489,332
|
|
|||||||||
|
Construction
|
64,789
|
|
87,240
|
|
49,718
|
|
42,917
|
|
45,554
|
|
|||||||||
|
Mortgage warehouse (c)
|
—
|
|
—
|
|
—
|
|
—
|
|
9,565
|
|
|||||||||
|
Total commercial loans
|
5,844,356
|
|
5,064,334
|
|
3,883,102
|
|
|
2,157,162
|
|
|
1,034,120
|
|
|||||||
|
|
|
|
|
|
|
|
|
|
|||||||||||
|
Consumer:
|
|||||||||||||||||||
|
Residential real estate
|
193,502
|
|
271,613
|
|
297,395
|
|
163,920
|
|
129,960
|
|
|||||||||
|
Manufactured housing
|
101,730
|
|
113,490
|
|
126,731
|
|
139,471
|
|
153,429
|
|
|||||||||
|
Other
|
2,726
|
|
3,124
|
|
3,634
|
|
4,517
|
|
5,801
|
|
|||||||||
|
Total consumer loans
|
297,958
|
|
388,227
|
|
427,760
|
|
|
307,908
|
|
|
289,190
|
|
|||||||
|
Total loans receivable
|
6,142,314
|
|
5,452,561
|
|
4,310,862
|
|
|
2,465,070
|
|
|
1,323,310
|
|
|||||||
|
Deferred costs (fees) and unamortized premiums (discounts), net
|
76
|
|
334
|
|
512
|
|
(912
|
)
|
1,157
|
|
|||||||||
|
Allowance for loan losses
|
(37,315
|
)
|
(35,647
|
)
|
(30,932
|
)
|
(23,998
|
)
|
(25,837
|
)
|
|||||||||
|
Loans receivable, net of allowance
|
$
|
6,105,075
|
|
$
|
5,417,248
|
|
$
|
4,280,442
|
|
|
$
|
2,440,160
|
|
|
$
|
1,298,630
|
|
||
|
(a)
|
Includes owner occupied commercial real estate loans for 2016, 2015 and 2014.
|
|
(b)
|
Includes non-owner occupied commercial real estate loans for 2016, 2015 and 2014. For 2013 and 2012, includes owner occupied and non-owner occupied commercial real estate loans.
|
|
(c)
|
Beginning in third quarter 2012, certain mortgage warehouse lending transactions were documented under master repurchase agreements and classified as held for sale.
|
75
Loans to mortgage banking businesses and certain residential mortgage and multi-family loans expected to be sold are classified as loans held for sale. Loans held for sale totaled
$2.1 billion
and
$1.8 billion
at
December 31, 2016
and
2015
, respectively. The mortgage warehouse product line provides financing to mortgage companies nationwide from the time of loan origination until the loans are sold into the secondary market. As a mortgage warehouse lender, we provide a form of financing to mortgage bankers by purchasing for resale the underlying residential mortgages on a short-term basis under a master repurchase agreement. We are subject to the risks associated with such lending, including, but not limited to, the risks of fraud, bankruptcy and default of the mortgage banker or of the underlying residential borrower, any of which could result in credit losses. The mortgage warehouse lending employees monitor these mortgage originators by obtaining financial and other relevant information to reduce these risks during the lending period.
Loans receivable, net of the allowance for loan losses, increased by $0.7 billion to
$6.1 billion
at
December 31, 2016
from
$5.4 billion
at
December 31, 2015
. The increase in loans receivable, net of the allowance for loan losses, was attributable to higher balances in multi-family, commercial and industrial (including owner occupied commercial real estate) and non-owner occupied commercial real estate loans, which increased $0.3 billion, $0.3 billion, and $0.2 billion, respectively, from
December 31, 2015
. The increase in these loan balances are the result of the Bank's successful execution of its organic growth strategy.
The following table sets forth Customers' commercial loans receivable as of
December 31, 2016
, in terms of contractual maturity date and interest rate characteristics:
|
Within
one year
|
After one
but
within
five
years
|
After
five
years
|
Total
|
||||||||||||
|
(amounts in thousands)
|
|||||||||||||||
|
Commercial Loans:
|
|||||||||||||||
|
Multi-family
|
$
|
96,048
|
|
$
|
2,404,520
|
|
$
|
714,431
|
|
$
|
3,214,999
|
|
|||
|
Commercial and industrial (including owner occupied commercial real estate)
|
145,407
|
|
711,928
|
|
513,518
|
|
1,370,853
|
|
|||||||
|
Commercial real estate non-owner occupied
|
82,669
|
|
740,261
|
|
370,785
|
|
1,193,715
|
|
|||||||
|
Construction
|
14,625
|
|
18,050
|
|
32,114
|
|
64,789
|
|
|||||||
|
Total commercial loans
|
$
|
338,749
|
|
|
$
|
3,874,759
|
|
|
$
|
1,630,848
|
|
|
$
|
5,844,356
|
|
|
Amount of such loans with:
|
|||||||||||||||
|
Predetermined rates
|
$
|
177,131
|
|
$
|
3,223,407
|
|
$
|
617,275
|
|
$
|
4,017,813
|
|
|||
|
Floating or adjustable rates
|
161,618
|
|
651,352
|
|
1,013,573
|
|
1,826,543
|
|
|||||||
|
Total commercial loans
|
$
|
338,749
|
|
|
$
|
3,874,759
|
|
|
$
|
1,630,848
|
|
|
$
|
5,844,356
|
|
CREDIT RISK
Customers Bancorp manages credit risk by maintaining diversification in its loan portfolio, establishing and enforcing prudent underwriting standards and collection efforts, and continuous and periodic loan classification reviews. Management also considers the effect of credit risk on financial performance by reviewing quarterly and maintaining an adequate allowance for loan losses. Credit losses are charged when they are identified, and provisions are added when it is estimated that a loss has occurred, to the allowance for loan losses at least quarterly. The allowance for loan losses is estimated at least quarterly.
The provision for loan losses was $2.3 million, $20.6 million, and $14.7 million for the years ended December 31, 2016, 2015 and 2014, respectively. The allowance for loan losses maintained for loans receivable (excludes loans held for sale as estimable credit losses are embedded in the fair values at which the loans are reported) was $37.3 million, or 0.61% of total loans receivable, at December 31, 2016 and $35.7 million, or 0.65% of total loans receivable, at December 31, 2015. The percentage of the allowance of loan losses to total loans receivable declined during 2016 primarily due to continued growth of the multi-family and commercial real estate portfolios, which have lower reserving factors due to their notably better historical loss experience than other commercial loans. Net charge-offs were $1.7 million for the year ended December 31, 2016, a decrease of $10.3 million compared to $12.0 million for the year ending December 31, 2015. The decrease in net charge offs was driven by the identification of a $9.0 million fraudulent loan that was charged-off in its entirety during 2015.
76
Customers had no loans that were covered under loss share arrangements with the FDIC as of December 31, 2016. Customers had approximately $13.8 million in loans that were covered under loss share arrangements with the FDIC as of December 31, 2015. On July 11, 2016, Customers entered into an agreement to terminate all existing rights and obligations pursuant to the loss sharing agreements with the FDIC. In connection with the termination agreement, Customers paid the FDIC
$1.4 million
as final payment under these agreements. The negotiated settlement amount was based on net losses incurred on the covered assets through September 30, 2015, adjusted for cash payments to and receipts from the FDIC as part of the December 31, 2015 and March 31, 2016 certifications. Consequently, loans and other real estate owned previously reported as covered assets pursuant to the loss sharing agreements were no longer presented as covered assets as of June 30, 2016.
Customers Bank considered the covered loans in estimating the allowance for loan losses and considered recovery of estimated credit losses from the FDIC in the FDIC indemnification asset. Refer to “NOTE 4 – SIGNIFICANT ACCOUNTING POLICIES AND BASIS OF PRESENTATION” for further discussion on the accounting for the FDIC loss sharing receivable balance.
77
The chart below depicts the Bank's allowance for loan losses, excluding the effects of the FDIC receivable, for the periods indicated.
|
|
For the Years Ended December 31,
|
||||||||||||||||||
|
|
2016
|
2015
|
2014
|
2013
|
2012
|
||||||||||||||
|
(amounts in thousands)
|
|||||||||||||||||||
|
Beginning Balance
|
$
|
35,647
|
|
$
|
30,932
|
|
$
|
23,998
|
|
$
|
25,837
|
|
$
|
15,032
|
|
||||
|
Loan charge-offs: (1)
|
|||||||||||||||||||
|
Construction
|
—
|
|
1,064
|
|
895
|
|
2,096
|
|
2,507
|
|
|||||||||
|
Commercial and industrial (2)
|
2,947
|
|
11,709
|
|
1,637
|
|
1,387
|
|
522
|
|
|||||||||
|
Commercial real estate (3)
|
140
|
|
327
|
|
1,715
|
|
3,358
|
|
2,462
|
|
|||||||||
|
Residential real estate
|
493
|
|
276
|
|
667
|
|
410
|
|
649
|
|
|||||||||
|
Other consumer
|
129
|
|
36
|
|
33
|
|
87
|
|
26
|
|
|||||||||
|
Charge-offs for BankMobile loans (4)
|
696
|
|
—
|
|
—
|
|
—
|
|
—
|
|
|||||||||
|
Total Loan Charge-offs
|
4,405
|
|
|
13,412
|
|
|
4,947
|
|
|
7,338
|
|
|
6,166
|
|
|||||
|
Loan recoveries (1):
|
|||||||||||||||||||
|
Construction
|
1,854
|
|
204
|
|
13
|
|
—
|
|
4
|
|
|||||||||
|
Commercial and industrial (2)
|
381
|
|
562
|
|
736
|
|
391
|
|
514
|
|
|||||||||
|
Commercial real estate (3)
|
130
|
|
801
|
|
42
|
|
63
|
|
|||||||||||
|
Residential real estate
|
367
|
|
575
|
|
265
|
|
2
|
|
5
|
|
|||||||||
|
Other consumer
|
11
|
|
92
|
|
8
|
|
9
|
|
114
|
|
|||||||||
|
Total Recoveries
|
2,743
|
|
1,433
|
|
1,823
|
|
444
|
|
700
|
|
|||||||||
|
Total net charge-offs
|
1,662
|
|
|
11,979
|
|
|
3,124
|
|
|
6,894
|
|
|
5,466
|
|
|||||
|
Provision for loan losses (5)
|
2,634
|
|
16,694
|
|
10,058
|
|
5,055
|
|
16,271
|
|
|||||||||
|
Provision for BankMobile loans (4)
|
696
|
|
—
|
|
—
|
|
—
|
|
—
|
|
|||||||||
|
Ending Balance
|
$
|
37,315
|
|
$
|
35,647
|
|
$
|
30,932
|
|
$
|
23,998
|
|
$
|
25,837
|
|
||||
|
Net charge-offs as a percentage of average loans receivable
|
0.03
|
%
|
0.26
|
%
|
0.09
|
%
|
0.37
|
%
|
0.38
|
%
|
|||||||||
|
(1)
|
Charge-offs and recoveries on purchased-credit-impaired loans that are accounted for in pools are recognized on a net basis when the pool matures.
|
|
(2)
|
Includes owner occupied commercial real estate loans for 2016, 2015 and 2014.
|
|
(3)
|
Includes non-owner occupied commercial real estate loans for 2016, 2015 and 2014. For 2013 and 2012, includes owner occupied and non-owner occupied commercial real estate loans.
|
|
(4)
|
Includes activities for BankMobile related loans, primarily overdrawn deposit accounts.
|
|
(5)
|
The provision amounts exclude the (cost)/benefit of the FDIC loss share arrangements of $0.3 million, $(3.9) million, $(4.7) million, $2.8 million, and $2.0 million, respectively.
|
The allowance for loan losses is based on a quarterly evaluation of the loan portfolio and is maintained at a level that management considers adequate to absorb probable losses incurred as of the balance sheet date. All commercial loans are assigned credit risk ratings, based upon an assessment of the borrower, the structure of the transaction and the available collateral and/or guarantees. All loans are monitored regularly by the responsible officer, and the risk ratings are adjusted when considered appropriate. The risk assessment allows management to identify problem loans timely. Management considers a variety of factors, and recognizes the inherent risk of loss that always exists in the lending process. Management uses a disciplined methodology to estimate an appropriate level of allowance for loan losses. Refer to “Critical Accounting Policies” herein and “NOTE 4 – SIGNIFICANT ACCOUNTING POLICIES AND BASIS OF PRESENTATION” for further discussion on management's methodology for estimating the allowance for loan losses.
78
Approximately 80% of the Bank’s commercial real estate, commercial and residential construction, consumer residential and commercial and industrial loan types have real estate as collateral (collectively, “the real estate portfolio”). The Bank’s lien position on the real estate collateral will vary on a loan-by-loan basis and will change as a result of changes in the value of the collateral. Current appraisals providing current value estimates of the property are received when the Bank’s credit group determines that the facts and circumstances have significantly changed since the date of the last appraisal, including that real estate values have deteriorated. The credit committee and loan officers review loans that are fifteen or more days delinquent and all non-accrual loans on a periodic basis. In addition, loans where the loan officers have identified a “borrower of interest” are discussed to determine if additional analysis is necessary to apply the risk rating criteria properly. The risk ratings for the real estate loan portfolio are determined based upon the current information available, including but not limited to discussions with the borrower, updated financial information, economic conditions within the geographic area and other factors that may affect the cash flow of the loan. If a loan is individually evaluated for impairment, the collateral value or discounted cash flow analysis is used to determine the estimated fair value of the underlying collateral and compared, net of estimated selling costs, to the outstanding loan balance to measure a specific reserve. Appraisals used in this evaluation process are typically less than two years aged. For loans where real estate is not the primary source of collateral, updated financial information is obtained, including accounts receivable and inventory aging reports and relevant supplemental financial data to estimate the fair value of the loan and compared, net of estimated selling costs, to the outstanding loan balance to estimate the required reserve.
These impairment measurements are inherently subjective as they require material estimates, including, among others, estimates of property values in appraisals, the amounts and timing of expected future cash flows on individual loans, and general considerations for historical loss experience, economic conditions, uncertainties in estimating losses and inherent risks in the various credit portfolios, all of which require judgment and may be susceptible to significant change over time and as a result of changing economic conditions or other factors. Pursuant to ASC 310-10-35
Loan Impairment
and ASC 310-40
Troubled Debt Restructurings by Creditors,
impaired loans, consisting primarily of non-accrual and restructured loans, are considered in the methodology for determining the allowance for credit losses. Impaired loans are generally evaluated based on the expected future cash flows or the fair value of the underlying collateral (less estimated costs to sell) if principal repayment is expected to come from the sale or operation of such collateral.
The following table shows the allowance for loan losses by various loan portfolios:
|
|
December 31,
|
|||||||||||||||||||||||||||||||||
|
|
2016
|
2015
|
2014
|
2013
|
2012
|
|||||||||||||||||||||||||||||
|
|
Allowance
for loan
losses
|
Percent of
Loans in
each
category
to total
loans
|
Allowance
for loan
losses
|
Percent of
Loans in
each
category
to total
loans
|
Allowance
for loan
losses
|
Percent of
Loans in
each
category
to total
loans
|
Allowance
for loan losses |
Percent of
Loans in each category to total loans |
Allowance
for loan losses |
Percent of
Loans in each category to total loans |
||||||||||||||||||||||||
|
(amounts in thousands)
|
||||||||||||||||||||||||||||||||||
|
Construction
|
$
|
840
|
|
2.3
|
%
|
$
|
1,074
|
|
3.0
|
%
|
$
|
1,047
|
|
3.4
|
%
|
$
|
2,385
|
|
9.9
|
%
|
$
|
3,991
|
|
15.4
|
%
|
|||||||||
|
Commercial and industrial (a)
|
13,233
|
|
35.4
|
%
|
10,212
|
|
28.6
|
%
|
9,120
|
|
29.5
|
%
|
2,674
|
|
11.2
|
%
|
1,477
|
|
5.7
|
%
|
||||||||||||||
|
Commercial real estate (b)
|
7,894
|
|
21.2
|
%
|
8,420
|
|
23.6
|
%
|
9,198
|
|
29.7
|
%
|
11,478
|
|
47.8
|
%
|
13,645
|
|
52.9
|
%
|
||||||||||||||
|
Multi-family
|
11,602
|
|
31.0
|
%
|
12,016
|
|
33.7
|
%
|
8,493
|
|
27.5
|
%
|
4,227
|
|
17.6
|
%
|
1,794
|
|
6.9
|
%
|
||||||||||||||
|
Residential real estate
|
3,342
|
|
9.0
|
%
|
3,298
|
|
9.3
|
%
|
2,698
|
|
8.7
|
%
|
2,490
|
|
10.4
|
%
|
3,233
|
|
12.5
|
%
|
||||||||||||||
|
Other consumer
|
118
|
|
0.3
|
%
|
133
|
|
0.4
|
%
|
114
|
|
0.4
|
%
|
130
|
|
0.5
|
%
|
154
|
|
0.6
|
%
|
||||||||||||||
|
Manufactured housing
|
286
|
|
0.8
|
%
|
494
|
|
1.4
|
%
|
262
|
|
0.8
|
%
|
614
|
|
2.6
|
%
|
750
|
|
2.9
|
%
|
||||||||||||||
|
Mortgage warehouse
|
—
|
|
—
|
%
|
—
|
|
—
|
%
|
—
|
|
—
|
%
|
—
|
|
—
|
%
|
71
|
|
0.3
|
%
|
||||||||||||||
|
Residual reserve
|
—
|
|
—
|
%
|
—
|
|
—
|
%
|
—
|
|
—
|
%
|
—
|
|
—
|
%
|
722
|
|
2.8
|
%
|
||||||||||||||
|
$
|
37,315
|
|
100.0
|
%
|
$
|
35,647
|
|
100.0
|
%
|
$
|
30,932
|
|
100.0
|
%
|
$
|
23,998
|
|
100.0
|
%
|
$
|
25,837
|
|
100.0
|
%
|
||||||||||
(a) Includes owner occupied commercial real estate loans for 2016, 2015 and 2014.
(b) Includes non-owner occupied commercial real estate loans for 2016, 2015 and 2014. For 2013 and 2012, includes owner occupied and non-owner occupied commercial real estate loans.
79
ASSET QUALITY
Customers divides its loan portfolio into two categories to analyze and understand loan activity and performance: loans that were originated, and loans that were acquired. Customers' originated loans were subject to the current underwriting standards that were put in place in 2009. Management believes this additional information provides a better understanding of the risk in the portfolio and the various types of reserves that are available to absorb loan losses that may arise in future periods. Credit losses from originated loans are absorbed by the allowance for loan loss reserves. Credit losses from acquired loans are absorbed by the allowance for loan losses, nonaccretable difference fair value marks, and cash reserves, as described below. The allowance for loan losses is to absorb only those losses estimated to have been incurred after acquisition, whereas the fair value mark and cash reserves absorb losses estimated to have been embedded in the acquired loans at acquisition. This schedule includes both loans held for sale and loans held for investment.
Asset Quality at December 31, 2016
|
Loan Type
|
Total Loans
|
Current
|
30-90
Days
|
Greater
than 90
Days
and
Accruing
|
Non-
accrual/
NPL (a)
|
OREO
(b)
|
NPA
(a)+(b)
|
NPL
to
Loan
Type
(%)
|
NPA
to
Loans +
OREO
(%)
|
||||||||||||||||||||||||
|
(amounts in thousands)
|
|
||||||||||||||||||||||||||||||||
|
Originated Loans
|
|||||||||||||||||||||||||||||||||
|
Multi-Family
|
$
|
3,211,516
|
|
$
|
3,198,943
|
|
$
|
12,573
|
|
$
|
—
|
|
$
|
—
|
|
$
|
—
|
|
$
|
—
|
|
—
|
%
|
—
|
%
|
||||||||
|
Commercial & Industrial (1)
|
1,271,237
|
|
1,260,565
|
|
487
|
|
—
|
|
10,185
|
|
371
|
|
10,556
|
|
0.80
|
%
|
0.83
|
%
|
|||||||||||||||
|
Commercial Real Estate Non-Owner Occupied
|
1,158,531
|
|
1,158,531
|
|
—
|
|
—
|
|
—
|
|
—
|
|
—
|
|
—
|
%
|
—
|
%
|
|||||||||||||||
|
Residential
|
114,510
|
|
112,969
|
|
1,200
|
|
—
|
|
341
|
|
—
|
|
341
|
|
0.30
|
%
|
0.30
|
%
|
|||||||||||||||
|
Construction
|
64,789
|
|
64,789
|
|
—
|
|
—
|
|
—
|
|
—
|
|
—
|
|
—
|
%
|
—
|
%
|
|||||||||||||||
|
Other Consumer
|
190
|
|
190
|
|
—
|
|
—
|
|
—
|
|
—
|
|
—
|
|
—
|
%
|
—
|
%
|
|||||||||||||||
|
Total Originated Loans
|
5,820,773
|
|
|
5,795,987
|
|
|
14,260
|
|
|
—
|
|
|
10,526
|
|
|
371
|
|
|
10,897
|
|
0.18
|
%
|
0.19
|
%
|
|||||||||
|
Loans Acquired
|
|
|
|
|
|||||||||||||||||||||||||||||
|
Bank Acquisitions
|
167,946
|
|
157,994
|
|
3,262
|
|
1,660
|
|
5,030
|
|
2,360
|
|
7,390
|
|
3.00
|
%
|
4.34
|
%
|
|||||||||||||||
|
Loan Purchases
|
153,595
|
|
143,454
|
|
3,861
|
|
4,044
|
|
2,236
|
|
377
|
|
2,613
|
|
1.46
|
%
|
1.70
|
%
|
|||||||||||||||
|
Total Loans Acquired
|
321,541
|
|
|
301,448
|
|
|
7,123
|
|
|
5,704
|
|
|
7,266
|
|
|
2,737
|
|
|
10,003
|
|
2.26
|
%
|
3.08
|
%
|
|||||||||
|
Unearned Origination Fees
|
76
|
|
76
|
|
—
|
|
—
|
|
—
|
|
—
|
|
—
|
|
|
|
|
|
|||||||||||||||
|
Total Loans Receivable
|
6,142,390
|
|
|
6,097,511
|
|
|
21,383
|
|
|
5,704
|
|
|
17,792
|
|
|
3,108
|
|
|
20,900
|
|
0.29
|
%
|
0.34
|
%
|
|||||||||
|
Total Loans Held for Sale
|
2,117,510
|
|
2,117,510
|
|
—
|
|
—
|
|
—
|
|
—
|
|
—
|
|
|
|
|
|
|||||||||||||||
|
Total Portfolio
|
$
|
8,259,900
|
|
|
$
|
8,215,021
|
|
|
$
|
21,383
|
|
|
$
|
5,704
|
|
|
$
|
17,792
|
|
|
$
|
3,108
|
|
|
$
|
20,900
|
|
0.22
|
%
|
0.25
|
%
|
||
(1) Commercial & industrial loans, including owner occupied commercial real estate.
80
Asset Quality at December 31, 2016 (continued)
|
Loan Type
|
Total Loans
|
NPL
|
ALL
|
Cash
Reserve
|
Total
Credit
Reserves
|
Reserves
to Loans
(%)
|
Reserves
to NPLs
(%)
|
||||||||||||||||||
|
|
|||||||||||||||||||||||||
|
Originated Loans
|
|||||||||||||||||||||||||
|
Multi-Family
|
$
|
3,211,516
|
|
$
|
—
|
|
$
|
11,602
|
|
$
|
—
|
|
$
|
11,602
|
|
0.36
|
%
|
n/a
|
|
||||||
|
Commercial & Industrial
|
1,271,237
|
|
10,185
|
|
12,560
|
|
—
|
|
12,560
|
|
0.99
|
%
|
123.32
|
%
|
|||||||||||
|
Commercial Real Estate
|
1,158,531
|
|
—
|
|
4,569
|
|
—
|
|
4,569
|
|
0.39
|
%
|
n/a
|
|
|||||||||||
|
Residential
|
114,510
|
|
341
|
|
2,270
|
|
—
|
|
2,270
|
|
1.98
|
%
|
665.69
|
%
|
|||||||||||
|
Construction
|
64,789
|
|
—
|
|
772
|
|
—
|
|
772
|
|
1.19
|
%
|
n/a
|
|
|||||||||||
|
Other Consumer
|
190
|
|
—
|
|
12
|
|
—
|
|
12
|
|
6.32
|
%
|
n/a
|
|
|||||||||||
|
Total Originated Loans
|
5,820,773
|
|
10,526
|
|
31,785
|
|
—
|
|
31,785
|
|
0.55
|
%
|
301.97
|
%
|
|||||||||||
|
Loans Acquired
|
|
|
|
|
|
||||||||||||||||||||
|
Bank Acquisitions
|
167,946
|
|
5,030
|
|
5,244
|
|
—
|
|
5,244
|
|
3.12
|
%
|
104.25
|
%
|
|||||||||||
|
Loan Purchases
|
153,595
|
|
2,236
|
|
286
|
|
993
|
|
1,279
|
|
0.83
|
%
|
57.20
|
%
|
|||||||||||
|
Total Loans Acquired
|
321,541
|
|
7,266
|
|
5,530
|
|
993
|
|
6,523
|
|
2.03
|
%
|
89.77
|
%
|
|||||||||||
|
Unearned Origination Fees
|
76
|
|
|
|
|
|
|
|
|||||||||||||||||
|
Total Loans Held for Investment
|
6,142,390
|
|
17,792
|
|
37,315
|
|
993
|
|
38,308
|
|
0.62
|
%
|
215.31
|
%
|
|||||||||||
|
Total Loans Held for Sale
|
2,117,510
|
|
|
—
|
|
|
—
|
|
|
—
|
|
|
—
|
|
|
|
|
|
|||||||
|
Total Portfolio
|
$
|
8,259,900
|
|
$
|
17,792
|
|
$
|
37,315
|
|
$
|
993
|
|
$
|
38,308
|
|
0.46
|
%
|
215.31
|
%
|
||||||
Originated Loans
Post 2009 originated loans (excluding held-for-sale loans) totaled
$5.8 billion
, or
70.5%
, of total loans at
December 31, 2016
, compared to $5.0 billion, or 69.0%, at December 31, 2015. The new management team adopted new underwriting standards that management believes better limits risks of loss. Only $10.5 million, or 0.18%, of the post 2009 loans were non-performing at December 31, 2016. Only $3.6 million, or 0.07%, of the post 2009 loans were non-performing at December 31, 2015. The post 2009 originated loans were supported by an allowance for loan losses of $31.8 million (0.55% of post 2009 originated loans) and $27.7 million (0.55% of post 2009 originated loans) at December 31, 2016 and 2015, respectively.
Loans Acquired
At December 31, 2016, Customers reported $0.3 billion of acquired loans, which was 3.9% of total loans, compared to $0.5 billion, or 6.2%, of total loans at December 31, 2015. Non-performing acquired loans totaled $7.3 million at December 31, 2016 and $7.2 million at December 31, 2015. When loans are acquired, they are recorded on the balance sheet at fair value. Acquired loans include purchased portfolios, FDIC failed-bank acquisitions, and unassisted acquisitions. Of the manufactured housing loans purchased from Tammac prior to 2012, $57.6 million were supported by a $1.0 million cash reserve at December 31, 2016, compared to $63.4 million supported by a cash reserve of $1.2 million at December 31, 2015. The cash reserve was created as part of the purchase transaction to absorb losses and is maintained in a demand deposit account at Customers. All current losses and delinquent interest are absorbed by this reserve. For the manufactured housing loans purchased in 2012, Tammac has an obligation to pay Customers the full payoff amount of the defaulted loan, including any principal, unpaid interest, or advances on the loans, once the borrower vacates the property. At December 31, 2016, $36.6 million of these loans were outstanding, compared to $41.9 million at December 31, 2015.
Many of the acquired loans were purchased at a discount. The price paid considered management’s judgment as to the credit and interest rate risk inherent in the portfolio at the time of purchase. Every quarter, management reassesses the risk and adjusts the cash flow forecast to incorporate changes in the credit outlook. Generally, a decrease in forecasted cash flows for a purchased loan will result in a provision for loan losses, and absent charge-offs, an increase in the allowance for loan losses. Acquired loans have a significantly higher percentage of non-performing loans than loans originated after September 2009. Management acquired these loans with the expectation that non-performing loan levels would be elevated, and therefore incorporated that expectation into the price paid. There is a Special Assets Group that focuses on workouts for these acquired non-performing assets. Total acquired loans were supported by reserves (allowance for loan losses and cash reserves) of $6.5 million (2.03% of total acquired loans) and $9.1 million (2.03% of total acquired loans), respectively, at December 31, 2016 and 2015.
81
Held-for-Sale Loans
At December 31, 2016, loans held for sale were $2.1 billion, or 25.6%, of the total loan portfolio, compared to $1.8 billion, or 24.8% of the total loan portfolio at December 31, 2015. The loans held-for-sale portfolio at December 31, 2016 included $2.1 billion of loans to mortgage banking businesses and $0.7 million of residential mortgage loans, compared to $1.8 billion of loans to mortgage banking businesses, $39.3 million of multi-family loans and $2.9 million of residential mortgages loans at December 31, 2015. Held-for-sale loans are carried on our balance sheet at either fair value (due to the election of the fair value option) or the lower of cost of fair value. An allowance for loan losses is not recorded on loans that are held for sale.
Customers manages its credit risk through the diversification of the loan portfolio and the application of policies and procedures designed to foster sound credit standards and monitoring practices. While various degrees of credit risk are associated with substantially all investing activities, the lending function carries the greatest degree of potential loss. At December 31, 2016 and 2015, non-performing loans to total loans were 0.22% and 0.15%, respectively. Total reserves to non-performing loans were 215.3% and 341.7%, respectively, at December 31, 2016 and 2015.
The tables below set forth non-accrual loans and non-performing assets and asset quality ratios:
|
December 31,
|
|||||||||||||||||||
|
|
2016
|
2015
|
2014
|
2013
|
2012
|
||||||||||||||
|
(amounts in thousands)
|
|||||||||||||||||||
|
Loans 90+ days delinquent still accruing (1)
|
$
|
2,813
|
|
$
|
2,805
|
|
$
|
4,388
|
|
$
|
3,772
|
|
$
|
1,966
|
|
||||
|
Non-accrual loans
|
17,792
|
|
10,771
|
|
11,733
|
|
19,163
|
|
32,851
|
|
|||||||||
|
OREO
|
3,108
|
|
5,057
|
|
15,371
|
|
12,265
|
|
8,114
|
|
|||||||||
|
Total non-performing assets
|
$
|
20,900
|
|
$
|
15,828
|
|
$
|
27,104
|
|
$
|
31,428
|
|
$
|
40,965
|
|
||||
|
(1)
|
Excludes purchased-credit-impaired loans.
|
|
|
December 31,
|
|||||||||||||
|
2016
|
2015
|
2014
|
2013
|
2012
|
||||||||||
|
Non-accrual loans to total loans receivable
|
0.29
|
%
|
0.20
|
%
|
0.27
|
%
|
0.78
|
%
|
2.48
|
%
|
||||
|
Non-accrual loans to total loans
|
0.22
|
%
|
0.15
|
%
|
0.20
|
%
|
0.60
|
%
|
1.19
|
%
|
||||
|
Non-performing assets to total assets
|
0.22
|
%
|
0.19
|
%
|
0.40
|
%
|
0.76
|
%
|
1.28
|
%
|
||||
|
Non-accrual loans and 90+ days delinquent to total assets
|
0.22
|
%
|
0.16
|
%
|
0.24
|
%
|
0.55
|
%
|
1.09
|
%
|
||||
|
Allowance for loan losses to:
|
||||||||||||||
|
Total loans receivable
|
0.61
|
%
|
0.65
|
%
|
0.72
|
%
|
0.97
|
%
|
1.95
|
%
|
||||
|
Non-accrual loans
|
209.73
|
%
|
330.95
|
%
|
263.63
|
%
|
125.23
|
%
|
78.65
|
%
|
||||
82
The table below sets forth loans that were non-performing at
December 31, 2016
,
2015
,
2014
,
2013
and
2012
.
|
|
December 31,
|
||||||||||||||||||
|
|
2016
|
2015
|
2014
|
2013
|
2012
|
||||||||||||||
|
(amounts in thousands)
|
|||||||||||||||||||
|
Commercial and industrial (1)
|
$
|
8,443
|
|
$
|
1,973
|
|
$
|
2,513
|
|
$
|
125
|
|
$
|
388
|
|
||||
|
Commercial real estate (2)
|
2,039
|
|
2,700
|
|
2,514
|
|
11,615
|
|
21,482
|
|
|||||||||
|
Commercial real estate non-owner occupied
|
2,057
|
|
1,307
|
|
1,460
|
|
N/A
|
|
N/A
|
|
|||||||||
|
Construction
|
—
|
|
—
|
|
2,325
|
|
5,431
|
|
7,667
|
|
|||||||||
|
Residential real estate
|
2,959
|
|
2,202
|
|
1,855
|
|
1,533
|
|
3,027
|
|
|||||||||
|
Manufactured housing
|
2,236
|
|
2,449
|
|
931
|
|
459
|
|
231
|
|
|||||||||
|
Other consumer
|
58
|
|
140
|
|
135
|
|
0
|
|
56
|
|
|||||||||
|
Total non-performing loans
|
$
|
17,792
|
|
|
$
|
10,771
|
|
|
$
|
11,733
|
|
|
$
|
19,163
|
|
|
$
|
32,851
|
|
|
(1)
|
Includes owner occupied commercial real estate loans for 2016, 2015 and 2014.
|
|
(2)
|
Includes non-owner occupied commercial real estate loans for 2016, 2015 and 2014. For 2013 and 2012, includes owner occupied and non-owner occupied commercial real estate loans.
|
Customers seeks to manage credit risk through the diversification of the loan portfolio and the application of credit underwriting policies and procedures designed to foster sound credit standards and monitoring practices. While various degrees of credit risk are associated with substantially all investing activities, the lending function carries the greatest degree of potential loss.
Asset quality assurance activities include careful monitoring of borrower payment status and the periodic review of borrower current financial information to ensure ongoing financial strength and borrower cash flow viability. The Bank has established credit policies and procedures, seeks the consistent application of those policies and procedures across the organization, and adjusts policies as appropriate for changes in market conditions and applicable regulations.
Problem Loan Identification and Management
To facilitate the monitoring of credit quality within the commercial and industrial, commercial real estate, construction portfolio and residential real estate segments, and for purposes of analyzing historical loss rates used in the determination of the allowance for loan losses for the respective portfolio segment, Customers utilizes the following categories of risk ratings: pass (there are six risk ratings of pass loans), special mention, substandard, doubtful or loss. The risk rating categories, which are derived from standard regulatory rating definitions, are assigned upon initial approval of credit to borrowers and updated regularly thereafter. Pass ratings, which are assigned to those borrowers who do not have an identified potential or well-defined weaknesses and for which there is a high likelihood of orderly repayment, are updated periodically based on the size and credit characteristics of the borrower. All other categories are updated on a quarterly basis during the month preceding the end of the calendar quarter. While assigning risk ratings involves judgment, the risk rating process allows management to identify riskier credits in a timely manner and allocate the appropriate resources to managing the loans.
Customers assigns a special mention rating to loans that have potential weaknesses that deserve management’s close attention. If left uncorrected, these potential weaknesses may, at some future date, result in the deterioration of the repayment prospects for the loan and our credit position. At December 31, 2016 and 2015, special mention loans were $56.9 million and $24.5 million, respectively.
Risk ratings are not established for home equity loans, consumer loans, and installment loans, mainly because these portfolios consist of a larger number of homogenous loans with smaller balances. Instead, these portfolios are evaluated for risk mainly based on aggregate payment history, through the monitoring of delinquency levels and trends.
83
A regular reporting and review process is in place to provide for proper portfolio oversight and control, and to monitor those loans identified as problem credits by management. This process is designed to assess our progress in working toward a solution, and to assist in determining an appropriate specific allowance for possible losses. All loan work-out situations involve the active participation of management and are reported regularly to the Board. When a loan becomes delinquent 90 days or more, or earlier if considered appropriate, the loan is assigned to Customers’ Special Asset Group (“SAG”) for workout or other resolution.
Loan charge-offs are determined on a case-by-case basis. Loans are generally charged off when principal is likely to be unrecoverable and after appropriate collection steps have been taken. Loan charge-offs are proposed by the SAG and approved by the Board of Directors.
Loan policies and procedures are reviewed internally for possible revisions and changes on a regular basis. In addition, these policies and procedures, together with the loan portfolio, are reviewed on a periodic basis by various regulatory agencies and by our internal, external and loan review auditors, as part of their examination and audit procedures.
Troubled Debt Restructurings (TDRs)
At
December 31, 2016
,
2015
and
2014
there were
$16.4 million
,
$11.4 million
,
$5.0 million
respectively, in loans categorized as troubled debt restructurings (“TDRs”). TDRs are reported as impaired loans in the calendar year of their restructuring and are evaluated to determine whether they should be placed on non-accrual status. In subsequent years, a TDR may be returned to accrual status if the borrower satisfies a minimum
six
-month performance requirement; however, it will remain classified as impaired. Generally, the Bank requires sustained performance for
nine months
before returning a TDR to accrual status.
Modification of purchased-credit-impaired loans that are accounted for within loan pools in accordance with the accounting standards for purchased-credit-impaired loans do not result in the removal of these loans from the pool even if modifications would otherwise be considered a TDR. Accordingly, as each pool is accounted for as a single asset with a single composite interest rate and an expectation of cash flows, modifications of loans within such pools are not reported as TDRs.
TDR modifications primarily involve interest rate concessions, extensions of term, deferrals of principal, and other modifications. Other modifications typically reflect other nonstandard terms which Customers would not offer in non-troubled situations. During the years ended
December 31, 2016
, 2015 and 2014, loans aggregating $6.7 million, $7.5 million and $1.1 million, respectively, were modified in troubled debt restructurings. TDR modifications of loans within the commercial and industrial category were primarily interest rate concessions, deferrals of principal and other modifications; modifications of commercial real estate loans were primarily deferrals of principal, extensions of term and other modifications; and modifications of residential real estate loans were primarily interest rate concessions and deferrals of principal. As of December 31, 2016, 2015 and 2014, there were no commitments to lend additional funds to debtors whose terms have been modified in troubled debt structuring.
As of
December 31, 2016
,
eight
manufactured housing loans totaling
$0.2 million
,
one
commercial real estate non-owner occupied loan totaling
$1.8 million
, and
one
residential real estate loan of
$0.1 million
that were modified in troubled debt restructurings within the past twelve months, defaulted on payments. As of
December 31, 2015
,
eleven
manufactured housing loans totaling
$0.3 million
, were modified in troubled debt restructurings within the past twelve months, defaulted on payments. As of December 31, 2014 there were
no
loans modified as troubled debt restructurings within the past twelve months, defaulted on payments.
Loans modified in troubled debt restructurings are evaluated for impairment. The nature and extent of impairment of TDRs, including those which have experienced a subsequent default, is considered in the determination of an appropriate level of allowance for credit losses. There were no specific allowances resulting from TDR modifications during
2016
. There were
three
specific allowances resulting from TDR modifications during
2015
, totaling
$0.2 million
for
two
commercial and industrial loans, and
$0.1 million
for
one
commercial real estate non-owner occupied loan. There were
no
specific allowances resulting from TDR modifications during
2014
.
84
FDIC LOSS SHARING RECEIVABLE AND CLAWBACK LIABILITY
On July 11, 2016, Customers entered into an agreement to terminate all existing rights and obligations pursuant to the loss sharing agreements with the FDIC. In connection with the termination agreement, Customers paid the FDIC
$1.4 million
as final payment under these agreements. The negotiated settlement amount was based on net losses incurred on the covered assets through September 30, 2015, adjusted for cash payments to and receipts from the FDIC as part of the December 31, 2015 and March 31, 2016 certifications. Consequently, loans and other real estate owned previously reported as covered assets pursuant to the loss sharing agreements were no longer presented as covered assets as of June 30, 2016.
As part of the FDIC loss sharing arrangements, Customers also assumed a liability to be paid within 45 days subsequent to the maturity or termination of the loss sharing arrangements that was contingent upon actual losses incurred over the life of the arrangements relative to expected losses and the consideration paid upon acquisition of the failed institutions. Due to cash received on the covered assets in excess of the original cash to be received expectations of the FDIC, the Bank anticipated that it would be required to pay the FDIC at the end of its loss sharing arrangements. As of December 31, 2015, a clawback liability of $2.3 million was recorded.
As of December 31, 2015, the Bank expected to collect $0.2 million from the FDIC for estimated losses and reimbursement of external costs, such as legal fees, real estate taxes and appraisal expenses, and estimated the clawback liability due to the FDIC in 2020 at $2.3 million. The net amount of $2.1 million was included in "Accrued interest payable and other liabilities" in the accompanying consolidated balance sheet.
ACCRUED INTEREST RECEIVABLE
Accrued interest receivable
increased
by
$3.8 million
, or
18.8%
, to
$23.7 million
at
December 31, 2016
from
$19.9 million
at
December 31, 2015
. This
increase
was primarily associated with the
increase
in total loans of
$1.0 billion
to
$8.3 billion
at
December 31, 2016
from
$7.2 billion
at
December 31, 2015
.
PREMISES AND EQUIPMENT AND OTHER ASSETS
Our premises and equipment, net of accumulated depreciation, totaled
$12.3 million
and
$11.1 million
at
December 31, 2016
and
2015
, respectively. Technology equipment contributed
$0.9 million
due to the increase of additional technology, facilities and team members. Leasehold improvements and furniture and equipment purchases contributed
$2.0 million
to the increase.
Customers Bank’s restricted stock holdings at
December 31, 2016
and
2015
were
$68.4 million
and
$90.8 million
, respectively. These consist of stock of the Federal Reserve Bank, Federal Home Loan Bank and Atlantic Central Bankers Bank, and are required as part of our relationship with these banks.
Other assets at
December 31, 2016
and
2015
were
$70.1 million
and
$68.5 million
, respectively, consisting primarily of deferred taxes, prepaid expenses, cash pledged for collateral, and mark to market adjustment for interest rate swaps.
BOLI cash surrender value increased by
$4.3 million
, to
$161.5 million
at
December 31, 2016
from
$157.2 million
at
December 31, 2015
. BOLI is used by the Bank as tax-free funding for employee benefits. Covered in BOLI on the balance sheet is the cash surrender value of the Supplemental Executive Retirement Plan (“SERP”) balance of
$2.9 million
and
$2.7 million
at
December 31, 2016
and
2015
, respectively.
ASSETS HELD FOR SALE
Assets held for sale related to the planned disposition of BankMobile were $79.3 million and $2.1 million at
December 31, 2016
and
2015
, respectively. The increase of $77.2 million was primarily a result of the acquisition of the Disbursement business in June 2016. For more information on assets designated as held for sale, refer to NOTE 3 - DISCONTINUED OPERATIONS.
85
DEPOSITS
The Bank offers a variety of deposit accounts, including checking, savings, money market deposit accounts (“MMDA”) and time deposits. Deposits are obtained primarily from our geographic service area. Total deposits grew to
$6.8 billion
at
December 31, 2016
, an increase of
$1.2 billion
, or
20.9%
, from
$5.7 billion
at
December 31, 2015
. Transaction deposits increased by
$0.7 billion
, or
21.1%
, to
$4.0 billion
at
December 31, 2016
from
$3.3 billion
at
December 31, 2015
, with non-interest bearing deposits increasing by
$104 million
. Certificate of deposit accounts increased
$0.5 billion
, or
20.6%
, to
$2.8 billion
at
December 31, 2016
from
$2.3 billion
at
December 31, 2015
.
The components of deposits were as follows at the dates indicated:
|
|
December 31,
|
||||||||||
|
|
2016
|
2015
|
2014
|
||||||||
|
(amounts in thousands)
|
|||||||||||
|
Demand, non-interest bearing
|
$
|
512,664
|
|
$
|
408,874
|
|
$
|
310,139
|
|
||
|
Demand, interest bearing
|
339,398
|
|
127,215
|
|
71,202
|
|
|||||
|
Savings, including MMDA
|
3,163,156
|
|
2,778,747
|
|
2,203,237
|
|
|||||
|
Time, $100,000 and over
|
2,106,905
|
|
1,624,562
|
|
1,043,265
|
|
|||||
|
Time, other
|
724,857
|
|
723,035
|
|
668,398
|
|
|||||
|
Total deposits
|
$
|
6,846,980
|
|
$
|
5,662,433
|
|
$
|
4,296,241
|
|
||
Non-interest bearing demand deposits totaled
$0.5 billion
at
December 31, 2016
, up from
$0.4 billion
at
December 31, 2015
.
Excluded from the above deposits were non-interest bearing demand deposits of
$453.4 million
and
$244.8 million
at
December 31, 2016
and
2015
, respectively, and savings accounts of
$3.4 million
and
$2.3 million
at
December 31, 2016
and
2015
, respectively. These deposits were classified as liabilities held for sale on the consolidated balance sheet. No time deposits were listed as held for sale.
Average deposit balances by type and the associated average rate paid are summarized below:
|
|
For the Years ended December 31,
|
|||||||||||||||||||
|
2016
|
2015
|
2014
|
||||||||||||||||||
|
|
Average
Balance
|
Average
Rate Paid
|
Average
Balance
|
Average
Rate Paid
|
Average
Balance
|
Average
Rate Paid
|
||||||||||||||
|
(amounts in thousands)
|
||||||||||||||||||||
|
Demand deposits
|
$
|
496,571
|
|
0.00
|
%
|
$
|
379,196
|
|
0.00
|
%
|
$
|
288,565
|
|
0.00
|
%
|
|||||
|
Interest-bearing demand deposits
|
190,279
|
|
0.56
|
%
|
123,527
|
|
0.56
|
%
|
62,840
|
|
0.57
|
%
|
||||||||
|
Savings, including MMDA
|
3,121,688
|
|
0.62
|
%
|
2,448,617
|
|
0.52
|
%
|
1,753,691
|
|
0.61
|
%
|
||||||||
|
Time deposits
|
2,633,425
|
|
1.06
|
%
|
2,087,641
|
|
0.99
|
%
|
1,403,774
|
|
0.96
|
%
|
||||||||
|
Total
|
$
|
6,441,963
|
|
$
|
5,038,981
|
|
$
|
3,508,870
|
|
|||||||||||
At
December 31, 2016
, the scheduled maturities of time deposits greater than $100,000 were as follows:
|
December 31, 2016
|
|||
|
(amounts in thousands)
|
|||
|
3 months or less
|
$
|
371,923
|
|
|
Over 3 through 6 months
|
682,368
|
|
|
|
Over 6 through 12 months
|
643,589
|
|
|
|
Over 12 months
|
409,025
|
|
|
|
Total
|
$
|
2,106,905
|
|
86
FHLB ADVANCES and OTHER BORROWINGS
Borrowed funds from various sources are generally used to supplement deposit growth and meet other operating needs. The Bank strategically views the short term FHLB advances as funding the loans to mortgage companies national business.
Short-term debt
Short-term debt was as follows:
|
|
December 31,
|
|||||||||||||||||||
|
|
2016
|
2015
|
2014
|
|||||||||||||||||
|
|
Amount
|
Rate
|
Amount
|
Rate
|
Amount
|
Rate
|
||||||||||||||
|
(amounts in thousands)
|
||||||||||||||||||||
|
FHLB advances
|
$
|
688,800
|
|
0.85
|
%
|
$
|
1,365,300
|
|
0.48
|
%
|
$
|
1,298,000
|
|
0.29
|
%
|
|||||
|
Federal funds purchased
|
83,000
|
|
0.74
|
|
70,000
|
|
0.56
|
|
—
|
|
—
|
%
|
||||||||
|
Total short-term borrowings
|
$
|
771,800
|
|
$
|
1,435,300
|
|
$
|
1,298,000
|
|
|||||||||||
For additional information on the Company’s short-term debt, refer to “NOTE 12 – BORROWINGS.”
Long-term debt
The contractual maturities of fixed-rate long-term FHLB advances are as noted below.
|
|
December 31,
|
||||||||||||
|
|
2016
|
2015
|
|||||||||||
|
|
Amount
|
Rate
|
Amount
|
Rate
|
|||||||||
|
(amounts in thousands)
|
|||||||||||||
|
2017
|
$
|
—
|
|
—
|
%
|
$
|
205,000
|
|
1.18
|
%
|
|||
|
2018
|
180,000
|
|
1.32
|
|
55,000
|
|
1.61
|
|
|||||
|
$
|
180,000
|
|
$
|
260,000
|
|
||||||||
Senior notes
On June 26, 2014, Customers Bancorp, Inc. closed a private placement transaction in which it issued
$25.0 million
of
4.625%
senior notes due 2019. Interest is paid semi-annually in arrears in June and December. The notes are unsecured obligations of the Bancorp and rank equally with all of its secured and unsecured senior indebtedness.
In July and August 2013, the Bancorp issued
$63.3 million
in aggregate principal amount of senior notes due 2018.
The notes bear interest at
6.375%
per year which is payable on March 15, June 15, September 15, and December 15.
Subordinated debt
On June 26, 2014, Customers Bank closed a private placement transaction in which it issued
$110.0 million
of fixed-to-floating rate subordinated notes due 2029. The subordinated notes bear interest at an annual fixed rate of
6.125%
until June 26, 2024, and interest is paid semiannually. From June 26, 2024, the subordinated notes will bear an annual interest rate equal to three-month LIBOR plus
344.3
basis points until maturity on June 26, 2029. Customers Bank has the ability to call the subordinated notes, in whole or in part, at a redemption price equal to
100%
of the principal balance at certain times on or after June 26, 2024.
The subordinated notes qualify as Tier 2 capital for regulatory capital purposes.
87
LIABILITIES HELD FOR SALE
Liabilities held for sale related to the planned disposition of BankMobile were $484.8 million and $247.1 million at
December 31, 2016
and
2015
, respectively. The increase of $237.7 million was primarily a result of an increase in non-interest bearing demand deposits of $208.6 million related to the acquisition of the Disbursement business and the election of depositors of another bank electing to move their deposit accounts to Customers Bank and a $27.9 million increase in accrued expenses and other liabilities related to the acquisition of the Disbursement business. For more information on liabilities designated as held for sale, refer to NOTE 3 - DISCONTINUED OPERATIONS.
SHAREHOLDERS’ EQUITY
Shareholders’ equity
increased
by
$302.0 million
to
$855.9 million
at
December 31, 2016
, from
$553.9 million
at
December 31, 2015
. The increase in equity was primarily the result of net income from continuing operations for
2016
of
$87.7 million
, the issuance of 6,700,000 shares of preferred stock, and the issuance of 2,641,677 shares of common stock. The preferred stock issuances and common stock issuances resulted in increases to shareholders' equity of
$161.9 million
and $64.0 million, respectively. For more information regarding the issuance of preferred and common stock, and dividends paid to preferred shareholders, see NOTE 13 - SHAREHOLDERS' EQUITY.
LIQUIDITY AND CAPITAL RESOURCES
Liquidity for a financial institution is a measure of that institution’s ability to meet depositors’ needs for funds, to satisfy or fund loan commitments, and for other operating purposes. Ensuring adequate liquidity is an objective of the Asset/Liability Management process. Customers coordinates its management of liquidity with our interest rate sensitivity and capital position, and strives to maintain a strong liquidity position.
Customers' investment portfolio provides periodic cash flows through regular maturities and amortization, and can be used as collateral to secure additional liquidity funding. Our principal sources of funds are proceeds from common and preferred stock issuance, deposits, debt issuance, principal and interest payments on loans, and other funds from operations. Borrowing arrangements are maintained with the Federal Home Loan Bank and the Federal Reserve Bank of Philadelphia to meet short-term liquidity needs. As of
December 31, 2016
our borrowing capacity with the Federal Home Loan Bank was
$4.1 billion
of which $0.9 billion was utilized in borrowings and commitments and $1.7 billion of available capacity was used to collateralize state and municipal deposits. As of December 31, 2015 our borrowing capacity with the Federal Home Loan Bank was $3.7 billion of which $1.6 billion was utilized in borrowings and commitments and $1.4 billion of available capacity was used to collateralize state and municipal deposits. As of
December 31, 2016
and
2015
, our borrowing capacity with the Federal Reserve Bank of Philadelphia was
$158.6 million
and
$59.2 million
, respectively.
Net cash flows used in operating activities of continuing operations were
$263.0 million
for the year ended
December 31, 2016
, compared to net cash flows used in operating activities of continuing operations of
$352.7 million
for the year ended
December 31, 2015
. Origination of loans held for sale in excess of the proceeds from the sales of loans contributed
$358.8 million
and
$421.7 million
to cash flows used in operating activities during
2016
and
2015
, respectively.
Investing activities of continuing operations used net cash flows of
$570.7 million
for the year ended
December 31, 2016
, compared to the net cash flows used in investing activities of
$1.3 billion
for the year ended
December 31, 2015
. The net increase in loans was
$0.8 billion
for the year ended
December 31, 2016
compared to a net increase of
$1.3 billion
for the year ended
December 31, 2015
.
Financing activities provided
$0.7 billion
for the year ended
December 31, 2016
compared to
$1.5 billion
for the year ended
December 31, 2015
. For
2016
, increases in cash from deposits provided
$1.2 billion
, net proceeds from common stock issuances provided $
65.1 million
, and net proceeds from preferred stock issuances provided
$161.9 million
offset by a net decrease in short-term FHLB borrowings which used
$0.8 billion
. For
2015
, increases in cash from deposits provided
$1.4 billion
, proceeds from federal funds purchased provided
$70.0 million
, and net proceeds from preferred stock issuances provided
$55.6 million
.
Overall, based on our core deposit base and available sources of borrowed funds, management believes that we have adequate resources to meet our short-term and long-term cash requirements for the foreseeable future.
88
CAPITAL ADEQUACY
The Bank and the Bancorp are subject to various regulatory capital requirements administered by the federal banking agencies. Failure to meet the minimum capital requirements can result in certain mandatory, and possibly additional discretionary, actions by regulators that, if undertaken, could have a direct material effect on Customers' financial statements. Under capital adequacy guidelines and the regulatory framework for prompt corrective action, the Bank and Bancorp must meet specific capital guidelines that involve quantitative measures of their assets, liabilities and certain off-balance sheet items, as calculated under the regulatory accounting practices. The capital amounts and classification are also subject to qualitative judgments by the regulators about components, risk weightings and other factors. Prompt corrective action provisions are not applicable to bank holding companies.
Quantitative measures established by regulation to ensure capital adequacy require the Bank and Bancorp to maintain minimum amounts and ratios (set forth in the following table) of total and Tier 1 capital to risk-weighted assets and of Tier 1 capital to average assets (as defined in the regulations).
The Dodd-Frank Act required the FRB to establish minimum consolidated capital requirements for bank holding companies that are as stringent as those required for insured depositary subsidiaries. In 2013, the federal banking agencies approved rules that implemented the Dodd-Frank requirements and certain other regulatory capital reforms effective January 1, 2015, that (i) introduced a new capital ratio pursuant to the prompt corrective action provisions, the common equity tier 1 capital to risk rated assets ratio, (ii) increased the adequately capitalized and well capitalized thresholds for the Tier 1 risk based capital ratios to
6%
and
8%
, respectively, (iii) changed the treatment of certain capital components for determining Tier 1 and Tier 2 capital, and (iv) changed the risk weighting of certain assets and off balance sheet items in determining risk weighted assets.
89
Generally, to be considered adequately capitalized, or well capitalized, respectively, an institution must at least maintain the common equity Tier 1, Tier 1 and total risk based ratios and the Tier 1 leveraged ratio in excess of the related minimum ratios set forth in the following table.
|
|
Actual
|
For Capital Adequacy
Purposes
(Minimum Plus Capital Buffer)
|
To Be Well Capitalized
Under
Prompt Corrective Action
Provisions
|
|||||||||||||||||
|
(amounts in thousands)
|
Amount
|
Ratio
|
|
Amount
|
Ratio
|
Amount
|
Ratio
|
|||||||||||||
|
December 31, 2016
|
||||||||||||||||||||
|
Common equity Tier 1 (to risk-weighted assets)
|
||||||||||||||||||||
|
Customers Bancorp, Inc.
|
$
|
628,139
|
|
8.487
|
%
|
$
|
379,306
|
|
5.125
|
%
|
N/A
|
|
N/A
|
|
||||||
|
Customers Bank
|
$
|
857,421
|
|
11.626
|
%
|
$
|
377,973
|
|
5.125
|
%
|
$
|
479,380
|
|
6.500
|
%
|
|||||
|
Tier 1 capital (to risk-weighted assets)
|
||||||||||||||||||||
|
Customers Bancorp, Inc.
|
$
|
844,755
|
|
11.414
|
%
|
$
|
490,322
|
|
6.625
|
%
|
N/A
|
|
N/A
|
|
||||||
|
Customers Bank
|
$
|
857,421
|
|
11.626
|
%
|
$
|
488,599
|
|
6.625
|
%
|
$
|
590,006
|
|
8.000
|
%
|
|||||
|
Total capital (to risk-weighted assets)
|
||||||||||||||||||||
|
Customers Bancorp, Inc.
|
$
|
966,097
|
|
13.053
|
%
|
$
|
638,343
|
|
8.625
|
%
|
N/A
|
|
N/A
|
|
||||||
|
Customers Bank
|
$
|
1,003,609
|
|
13.608
|
%
|
$
|
636,101
|
|
8.625
|
%
|
$
|
737,508
|
|
10.000
|
%
|
|||||
|
Tier 1 capital (to average assets)
|
||||||||||||||||||||
|
Customers Bancorp, Inc.
|
$
|
844,755
|
|
9.067
|
%
|
$
|
372,652
|
|
4.000
|
%
|
N/A
|
|
N/A
|
|
||||||
|
Customers Bank
|
$
|
857,421
|
|
9.233
|
%
|
$
|
371,466
|
|
4.000
|
%
|
$
|
464,333
|
|
5.000
|
%
|
|||||
|
December 31, 2015
|
||||||||||||||||||||
|
Common equity Tier 1 (to risk-weighted assets)
|
||||||||||||||||||||
|
Customers Bancorp, Inc.
|
$
|
500,624
|
|
7.610
|
%
|
$
|
296,014
|
|
4.500
|
%
|
N/A
|
|
N/A
|
|
||||||
|
Customers Bank
|
$
|
565,217
|
|
8.620
|
%
|
$
|
294,916
|
|
4.500
|
%
|
$
|
425,990
|
|
6.500
|
%
|
|||||
|
Tier 1 capital (to risk-weighted assets)
|
||||||||||||||||||||
|
Customers Bancorp, Inc.
|
$
|
556,193
|
|
8.460
|
%
|
$
|
394,685
|
|
6.000
|
%
|
N/A
|
|
N/A
|
|
||||||
|
Customers Bank
|
$
|
565,217
|
|
8.620
|
%
|
$
|
393,221
|
|
6.000
|
%
|
$
|
524,295
|
|
8.000
|
%
|
|||||
|
Total capital (to risk-weighted assets)
|
||||||||||||||||||||
|
Customers Bancorp, Inc.
|
$
|
698,323
|
|
10.620
|
%
|
$
|
526,247
|
|
8.000
|
%
|
N/A
|
|
N/A
|
|
||||||
|
Customers Bank
|
$
|
710,864
|
|
10.850
|
%
|
$
|
524,295
|
|
8.000
|
%
|
$
|
655,369
|
|
10.000
|
%
|
|||||
|
Tier 1 capital (to average assets)
|
||||||||||||||||||||
|
Customers Bancorp, Inc.
|
$
|
556,193
|
|
7.160
|
%
|
$
|
310,812
|
|
4.000
|
%
|
N/A
|
|
N/A
|
|
||||||
|
Customers Bank
|
$
|
565,217
|
|
7.300
|
%
|
$
|
309,883
|
|
4.000
|
%
|
$
|
387,353
|
|
5.000
|
%
|
|||||
At
December 31, 2016
and
2015
, the Bank and Bancorp met all capital adequacy requirements to which they were subject.
Capital Ratios
Customers continued to build the amount of capital during
2016
. In general, for the past few years, capital growth has been achieved by retained earnings, increases in capital from sales of common stock and issuance of preferred stock and subordinated debt. During
2016
, the Bancorp issued non-cumulative perpetual preferred stock, which meets the definition of Tier 1 capital per regulatory guidelines, and common stock. The net proceeds of these offerings is included in the Bancorp's Tier 1 capital ratios presented above. For more information relating to preferred and common stock offerings in 2016, see NOTE 13 - SHAREHOLDERS' EQUITY.
Customers is unaware of any current recommendations by the regulatory authorities which, if they were to be implemented, would have a material effect on our liquidity, capital resources, or operations.
90
The maintenance of appropriate levels of capital is an important objective of our Asset and Liability Management process. Through our initial capitalization and our subsequent offerings, we believe we have continued to maintain a strong capital position. To date, Customers Bank's board of directors declared a cash dividend to its sole shareholder, Customers Bancorp. Cash dividends declared by the Bank and paid to Customers Bancorp, include the following:
|
•
|
$4.0 million declared on March 17, 2015 and paid on March 31, 2015;
|
|
•
|
$4.0 million declared and paid on June 30, 2015;
|
|
•
|
$5.5 million declared and paid on September 23, 2015;
|
|
•
|
$5.0 million declared on October 28, 2015 and paid on December 10, 2015;
|
|
•
|
$5.1 million declared on January 20, 2016 and paid on March 10, 2016;
|
|
•
|
$6.0 million declared on April 27, 2016 and paid on June 27, 2016;
|
|
•
|
$6.5 million declared on July 27, 2016 and paid on September 12, 2016;
|
|
•
|
$7.8 million declared on October 26, 2016 and paid on December 12, 2016; and
|
|
•
|
$7.8 million declared on January 25, 2017 and payable on March 10, 2017.
|
Effective January 1, 2015, Customers Bancorp and Customers Bank became subject to new capital requirements as detailed earlier in this document. Management has reviewed the new requirements and both the Bank and Bancorp are compliant with the new requirements.
OFF-BALANCE SHEET ARRANGEMENTS
Customers is involved with financial instruments and other commitments with off-balance sheet risks. Financial instruments with off-balance sheet risks are incurred in the normal course of business to meet the financing needs of our customers. These financial instruments include commitments to extend credit, including unused portions of lines of credit, and standby letters of credit. Those instruments involve, to varying degrees, elements of credit risk in excess of the amount recognized on the balance sheets.
With commitments to extend credit, exposures to credit loss in the event of non-performance by the other party to the financial instrument is represented by the contractual amount of those instruments. The same credit policies are used in making commitments and conditional obligations as for on-balance sheet instruments. Because they involve credit risk similar to extending a loan, these financial instruments are subject to the Bank’s Credit Policy and other underwriting standards.
As of
December 31, 2016
and
2015
, the following off-balance sheet commitments, financial instruments and other arrangements were outstanding:
|
|
December 31,
|
||||||
|
|
2016
|
2015
|
|||||
|
(amounts in thousands)
|
|||||||
|
Commitments to fund loans
|
$
|
244,784
|
|
$
|
537,380
|
|
|
|
Unfunded commitments to fund mortgage warehouse loans
|
1,230,596
|
|
1,302,759
|
|
|||
|
Unfunded commitments under lines of credit
|
480,446
|
|
436,550
|
|
|||
|
Letters of credit
|
40,223
|
|
42,002
|
|
|||
Commitments to fund loans, unfunded commitments to fund mortgage warehouse loans, unfunded commitments under lines of credit and letters of credit are agreements to extend credit to or for the benefit of a customer in the ordinary course of our business.
91
Commitments to fund loans and unfunded commitments under lines of credit may be obligations of ours as long as there is no violation of any condition established in the contract. Because many of the commitments are expected to expire without being drawn upon, the total commitment amounts do not necessarily represent future cash requirements. Commitments generally have fixed expiration dates or other termination clauses and may require payment of a fee. We evaluate each customer’s creditworthiness on a case-by-case basis. The amount of collateral obtained, if we deem it necessary upon extension of credit, is based on management’s credit evaluation. Collateral held varies but may include personal or commercial real estate, accounts receivable, inventory and equipment.
Mortgage warehouse loan commitments are agreements to fund the pipelines of mortgage banking businesses from closing of individual mortgage loans until their sale into the secondary market. Most of the individual mortgage loans are insured or guaranteed by the U.S. government through one of their programs such as FHA, VA, or are conventional loans eligible for sale to Fannie Mae and Freddie Mac. These commitments generally fluctuate monthly based on changes in interest rates, refinance activity, new home sales and laws and regulation.
Outstanding letters of credit written are conditional commitments issued by us to guarantee the performance of a customer to a third party. Letters of credit may obligate us to fund draws under those letters of credit whether or not a customer continues to meet the conditions of the extension of credit. The credit risk involved in issuing letters of credit is essentially the same as that involved in extending loan facilities to customers.
CONTRACTUAL OBLIGATIONS
The following table sets forth contractual obligations and other commitments representing required and potential cash outflows as of
December 31, 2016
. Interest on subordinated notes, FHLB long-term advances, and senior notes was calculated using then current contractual interest rates.
|
Total
|
Within one
year
|
After one but
within three years
|
After three but
within five years
|
More than
five years
|
|||||||||||||||
|
(amounts in thousands)
|
|||||||||||||||||||
|
Operating leases
|
$
|
24,528
|
|
$
|
3,897
|
|
$
|
7,343
|
|
$
|
5,225
|
|
$
|
8,063
|
|
||||
|
Benefit plan commitments
|
4,500
|
|
300
|
|
600
|
|
600
|
|
3,000
|
|
|||||||||
|
Contractual maturities of time deposits
|
2,831,762
|
|
2,047,297
|
|
644,955
|
|
139,434
|
|
76
|
|
|||||||||
|
Subordinated notes
|
110,000
|
|
—
|
|
—
|
|
—
|
|
110,000
|
|
|||||||||
|
Interest on subordinated notes
|
84,144
|
|
6,738
|
|
13,475
|
|
13,475
|
|
50,456
|
|
|||||||||
|
Loan commitments
|
1,955,826
|
|
1,532,806
|
|
108,852
|
|
85,443
|
|
228,725
|
|
|||||||||
|
FHLB long-term advances
|
180,000
|
|
—
|
|
180,000
|
|
—
|
|
—
|
|
|||||||||
|
Interest on FHLB long-term advances
|
3,119
|
|
2,379
|
|
740
|
|
—
|
|
—
|
|
|||||||||
|
Senior notes
|
88,250
|
|
—
|
|
88,250
|
|
—
|
|
—
|
|
|||||||||
|
Interest on senior notes
|
9,262
|
|
5,188
|
|
4,074
|
|
—
|
|
—
|
|
|||||||||
|
Other commitments (1)
|
5,310
|
|
—
|
|
5,310
|
|
—
|
|
—
|
|
|||||||||
|
Standby letters of credit
|
40,223
|
|
32,353
|
|
685
|
|
7,140
|
|
45
|
|
|||||||||
|
Total
|
$
|
5,336,924
|
|
$
|
3,630,958
|
|
$
|
1,054,284
|
|
$
|
251,317
|
|
$
|
400,365
|
|
||||
|
(1)
|
Represents a commitment expiring in approximately three years that is subject to unscheduled requests for payment.
|
NEW ACCOUNTING PRONOUNCEMENTS
For information about the impact that recently adopted or issued accounting guidance will have on us, refer to “NOTE 4 – SIGNIFICANT ACCOUNTING POLICIES AND BASIS OF PRESENTATION”.
92
Interest Rate Sensitivity
The largest component of our net income is net interest income, and the majority of our financial instruments are interest rate sensitive assets and liabilities with various term structures and maturities. One of the primary objectives of management is to maximize net interest income while minimizing interest rate risk. Interest rate risk is derived from timing differences in the repricing of assets and liabilities, loan prepayments, deposit withdrawals, and differences in lending and funding rates. Our Asset/Liability Committee actively seeks to monitor and control the mix of interest rate sensitive assets and interest rate sensitive liabilities.
We use two complementary methods to analyze and measure interest rate sensitivity as part of the overall management of interest rate risk. They are income simulation modeling and estimates of economic value of equity. The combination of these two methods provides a reasonably comprehensive summary of the levels of interest rate risk of our exposure to time factors and changes in interest rate environments.
Income simulation modeling is used to measure our interest rate sensitivity and manage our interest rate risk. Income simulation considers not only the impact of changing market interest rates upon forecasted net interest income, but also other factors such as yield curve relationships, the volume and mix of assets and liabilities, customer preferences and general market conditions.
Through the use of income simulation modeling, we have estimated the net interest income for the year ending December 31, 2017, based upon the assets, liabilities and off-balance sheet financial instruments in existence at
December 31, 2016
. We have also estimated changes to that estimated net interest income based upon interest rates rising or falling immediately (“rate shocks”). For upward rate shocks modeling a rising rate environment, current market interest rates were increased immediately by 100, 200, and 300 basis points. For downward rate shocks modeling a falling rate environment, current market rates were only decreased immediately by 100 basis points due to the limitations of the current low interest rate environment that renders the Down 200 and Down 300 rate shocks impractical. The following table reflects the estimated percentage change in estimated net interest income for the year ending December 31, 2017, resulting from changes in interest rates.
Net change in net interest income
|
Rate Shocks
|
%
Change
|
|
|
Up 3%
|
1.0
|
%
|
|
Up 2%
|
4.1
|
%
|
|
Up 1%
|
3.7
|
%
|
|
Down 1%
|
(5.2
|
)%
|
The net changes in net interest income in all scenarios are within Customers Bank’s interest rate risk policy guidelines.
Economic Value of Equity (“EVE”) estimates the discounted present value of asset and liability cash flows. Discount rates are based upon market prices for comparable assets and liabilities. Upward and downward rate shocks are used to measure volatility of EVE in relation to a constant rate environment. For upward rate shocks modeling a rising rate environment, current market interest rates were increased immediately by 100, 200, and 300 basis points. For downward rate shocks modeling a falling rate environment, current market rates were only decreased immediately by 100 basis points due to the limitations of the current low interest rate environment that renders the Down 200 and Down 300 rate shocks impractical. This method of measurement primarily evaluates the longer term repricing risks and options in Customers Bank’s balance sheet. The following table reflects the estimated EVE at risk and the ratio of EVE to EVE adjusted assets at December 31, 2016, resulting from shocks to interest rates.
93
The following table reflects the estimated EVE at risk and the ratio of EVE to EVE adjusted assets at
December 31, 2016
, resulting from the referenced shocks to interest rates.
|
Rate Shocks
|
From base
|
|
|
Up 3%
|
(24.6
|
)%
|
|
Up 2%
|
(14.2
|
)%
|
|
Up 1%
|
(5.9
|
)%
|
|
Down 1%
|
2.3
|
%
|
The net changes in economic value of equity in all scenarios are within Customers Bank’s interest rate risk policy guidelines.
The matching of assets and liabilities may also be analyzed by examining the extent to which such assets and liabilities are interest rate sensitive and by monitoring a bank’s interest rate sensitivity “gap”. An asset or liability is said to be interest rate sensitive within a specific time period if it will mature or reprice within that time period. The interest rate sensitivity gap is defined as the difference between the amount of interest earning assets maturing or repricing within a specific time period and the amount of interest bearing liabilities maturing or repricing within that time period.
The following table sets forth the amounts of interest-earning assets and interest-bearing liabilities outstanding at
December 31, 2016
that are anticipated, based upon certain assumptions, to reprice or mature in each of the future time periods shown. Except as stated below, the amount of assets and liabilities shown that reprice or mature during a particular period were determined in accordance with the earlier of term to repricing or the contractual maturity of the asset or liability. The table sets forth an approximation of the projected repricing of assets and liabilities at
December 31, 2016
on the basis of contractual maturities, anticipated prepayments, and scheduled rate adjustments within a three-month period and subsequent selected time intervals. The loan amounts in the table reflect principal balances expected to be repaid and/or repriced as a result of contractual amortization and anticipated prepayments of adjustable and fixed rate loans, and as a result of contractual-rate adjustments on adjustable-rate loans.
94
|
|
|
|
|
|
|
|
|
||||||||||||||||||||
|
|
3 months
or less |
3 to 6
months |
6 to 12
months |
1 to 3
years |
3 to 5
years |
Over 5
years |
Total
|
||||||||||||||||||||
|
|
(dollars in thousands)
|
||||||||||||||||||||||||||
|
Assets
|
|||||||||||||||||||||||||||
|
Interest earning deposits and federal funds sold
|
$
|
227,224
|
|
$
|
—
|
|
$
|
—
|
|
$
|
—
|
|
$
|
—
|
|
$
|
—
|
|
$
|
227,224
|
|
||||||
|
Investment securities
|
15,937
|
|
15,395
|
|
29,296
|
|
105,435
|
|
81,138
|
|
226,932
|
|
474,133
|
|
|||||||||||||
|
Loans (a)
|
3,527,715
|
|
134,487
|
|
299,878
|
|
1,894,080
|
|
2,212,847
|
|
160,179
|
|
8,229,186
|
|
|||||||||||||
|
Other interest-earning assets
|
—
|
|
—
|
|
71,763
|
|
—
|
|
—
|
|
—
|
|
71,763
|
|
|||||||||||||
|
Total interest-earning assets
|
3,770,876
|
|
149,882
|
|
400,937
|
|
1,999,515
|
|
2,293,985
|
|
387,111
|
|
9,002,306
|
|
|||||||||||||
|
Non interest-earning assets
|
—
|
|
—
|
|
—
|
|
—
|
|
—
|
|
327,064
|
|
327,064
|
|
|||||||||||||
|
Total assets
|
3,770,876
|
|
149,882
|
|
400,937
|
|
1,999,515
|
|
2,293,985
|
|
714,175
|
|
$
|
9,329,370
|
|
||||||||||||
|
Liabilities
|
|||||||||||||||||||||||||||
|
Other interest-bearing deposits
|
$
|
370,796
|
|
$
|
165,371
|
|
$
|
305,690
|
|
$
|
946,163
|
|
$
|
503,588
|
|
$
|
1,220,342
|
|
$
|
3,511,950
|
|
||||||
|
Time deposits
|
483,733
|
|
763,392
|
|
803,079
|
|
646,483
|
|
135,075
|
|
—
|
|
2,831,762
|
|
|||||||||||||
|
Other borrowings
|
591,800
|
|
100,000
|
|
80,000
|
|
180,000
|
|
—
|
|
—
|
|
951,800
|
|
|||||||||||||
|
Subordinated debt
|
—
|
|
—
|
|
—
|
|
—
|
|
—
|
|
108,783
|
|
108,783
|
|
|||||||||||||
|
Total interest-bearing liabilities
|
1,446,329
|
|
1,028,763
|
|
1,188,769
|
|
1,772,646
|
|
638,663
|
|
1,329,125
|
|
7,404,295
|
|
|||||||||||||
|
Non-interest-bearing liabilities
|
35,079
|
|
33,682
|
|
63,395
|
|
397,939
|
|
97,387
|
|
429,051
|
|
1,056,533
|
|
|||||||||||||
|
Shareholders’ equity
|
—
|
|
—
|
|
—
|
|
—
|
|
—
|
|
868,542
|
|
868,542
|
|
|||||||||||||
|
Total liabilities and shareholders’ equity
|
1,481,408
|
|
1,062,445
|
|
1,252,164
|
|
2,170,585
|
|
736,050
|
|
2,626,718
|
|
$
|
9,329,370
|
|
||||||||||||
|
Interest sensitivity gap
|
$
|
2,289,468
|
|
$
|
(912,563
|
)
|
$
|
(851,227
|
)
|
$
|
(171,070
|
)
|
$
|
1,557,935
|
|
$
|
(1,912,543
|
)
|
|||||||||
|
Cumulative interest sensitivity gap
|
$
|
1,376,905
|
|
$
|
525,678
|
|
$
|
354,608
|
|
$
|
1,912,543
|
|
$
|
—
|
|
||||||||||||
|
Cumulative interest sensitivity gap to total assets
|
24.5
|
%
|
14.8
|
%
|
5.6
|
%
|
3.8
|
%
|
20.5
|
%
|
0.0
|
%
|
|||||||||||||||
|
Cumulative interest-earning assets to cumulative interest-bearing liabilities
|
260.7
|
%
|
158.4
|
%
|
118.0
|
%
|
116.3
|
%
|
141.8
|
%
|
121.6
|
%
|
|||||||||||||||
|
(a)
|
Including loans held for sale
|
As shown above, we have a positive cumulative gap (cumulative interest sensitive assets are higher than cumulative interest sensitive liabilities) within the next year, which generally indicates that an increase in rates may lead to an increase in net interest income, and a decrease in rates may lead to a decrease in net interest income. Interest rate sensitivity gap analysis measures whether assets or liabilities may reprice but does not capture the ability to reprice or the range of potential repricing on assets or liabilities. Thus indications based on a negative or positive gap position need to be analyzed in conjunction with other interest rate risk management tools.
Management believes that the assumptions and combination of methods utilized in evaluating estimated net interest income are reasonable. However, the interest rate sensitivity of our assets, liabilities and off-balance sheet financial instruments, as well as the estimated effect of changes in interest rates on estimated net interest income, could vary substantially if different assumptions are used or actual experience differs from the assumptions used in the model.
95
Financial Statements for the three years ended
December 31, 2016
,
2015
and
2014
INDEX TO CUSTOMERS BANCORP, INC. FINANCIAL STATEMENTS
96
Report of Independent Registered Public Accounting Firm
Board of Directors and Shareholders
Customers Bancorp, Inc.
Wyomissing, Pennsylvania
We have audited the accompanying consolidated balance sheets of Customers Bancorp, Inc. and Subsidiaries (the “Bancorp”) as of December 31, 2016 and 2015, and the related consolidated statements of income and comprehensive income, changes in shareholders’ equity, and cash flows for each of the three years in the period ended December 31, 2016. These consolidated financial statements are the responsibility of the Bancorp’s management. Our responsibility is to express an opinion on these consolidated financial statements based on our audits.
We conducted our audits in accordance with the standards of the Public Company Accounting Oversight Board (United States). Those standards require that we plan and perform the audit to obtain reasonable assurance about whether the financial statements are free of material misstatement. An audit includes examining, on a test basis, evidence supporting the amounts and disclosures in the financial statements, assessing the accounting principles used and significant estimates made by management, as well as evaluating the overall presentation of the financial statements and schedules. We believe that our audits provide a reasonable basis for our opinion.
In our opinion, the consolidated financial statements referred to above present fairly, in all material respects, the financial position of Customers Bancorp, Inc. and Subsidiaries at December 31, 2016 and 2015, and the results of their operations and their cash flows for each of the three years in the period ended December 31, 2016, in conformity with accounting principles generally accepted in the United States of America.
We also have audited, in accordance with the standards of the Public Company Accounting Oversight Board (United States), the Bancorp’s internal control over financial reporting as of December 31, 2016, based on criteria established in
Internal Control – Integrated Framework (2013)
issued by the Committee of Sponsoring Organizations of the Treadway Commission (COSO) and our report dated
March 8, 2017
expressed an unqualified opinion thereon.
/s/ BDO USA, LLP
Philadelphia, Pennsylvania
March 8, 2017
97
Report of Independent Registered Public Accounting Firm
Board of Directors and Shareholders
Customers Bancorp, Inc.
Wyomissing, Pennsylvania
We have audited Customers Bancorp, Inc. and Subsidiaries’ (the “Bancorp”) internal control over financial reporting as of December 31, 2016, based on criteria established in
Internal Control – Integrated Framework (2013)
issued by the Committee of Sponsoring Organizations of the Treadway Commission (the “COSO criteria”). The Bancorp’s management is responsible for maintaining effective internal control over financial reporting, and for its assessment of the effectiveness of internal control over financial reporting included in the accompanying Management’s Responsibility for Financial Statements and Report on Internal Control over Financial Reporting. Our responsibility is to express an opinion on the Bancorp’s internal control over financial reporting based on our audit.
We conducted our audit in accordance with the standards of the Public Company Accounting Oversight Board (United States). Those standards require that we plan and perform the audit to obtain reasonable assurance about whether effective internal control over financial reporting was maintained in all material respects. Our audit of internal control over financial reporting included obtaining an understanding of internal control over financial reporting, assessing the risk that a material weakness exists, and testing and evaluating the design and operating effectiveness of internal control based on the assessed risk. Our audit also included performing such other procedures as we considered necessary in the circumstances. We believe that our audit provides a reasonable basis for our opinion.
A company’s internal control over financial reporting is a process designed to provide reasonable assurance regarding the reliability of financial reporting and the preparation of financial statements for external purposes in accordance with accounting principles generally accepted in the United States of America. A company’s internal control over financial reporting includes those policies and procedures that (1) pertain to the maintenance of records that, in reasonable detail, accurately and fairly reflect the transactions and dispositions of the assets of the company; (2) provide reasonable assurance that transactions are recorded as necessary to permit preparation of financial statements in accordance with generally accepted accounting principles, and that receipts and expenditures of the company are being made only in accordance with authorizations of management and directors of the company; and (3) provide reasonable assurance regarding prevention or timely detection of unauthorized acquisition, use, or disposition of the company’s assets that could have a material effect on the financial statements.
Because of its inherent limitations, internal control over financial reporting may not prevent or detect misstatements. Also, projections of any evaluation of effectiveness to future periods are subject to the risk that controls may become inadequate because of changes in conditions, or that the degree of compliance with the policies or procedures may deteriorate.
In our opinion, Customers Bancorp, Inc. and Subsidiaries maintained, in all material respects, effective internal control over financial reporting as of December 31, 2016, based on the COSO criteria.
We have also audited, in accordance with the standards of the Public Company Accounting Oversight Board (United States), the consolidated balance sheets of Customers Bancorp, Inc. and Subsidiaries as of December 31, 2016 and 2015 and the related consolidated statement of income, comprehensive income, changes in shareholders’ equity, and cash flow for each of the three years in the period ended December 31, 2016, and our report dated
March 8, 2017
expressed an unqualified opinion thereon.
/s/ BDO USA, LLP
Philadelphia, Pennsylvania
March 8, 2017
98
CUSTOMERS BANCORP, INC. AND SUBSIDIARIES
CONSOLIDATED BALANCE SHEETS
(amounts in thousands, except share and per share data)
|
|
December 31,
|
||||||
|
|
2016
|
2015
|
|||||
|
ASSETS
|
|||||||
|
Cash and due from banks
|
$
|
17,485
|
|
$
|
53,550
|
|
|
|
Interest earning deposits
|
227,224
|
|
211,043
|
|
|||
|
Cash and cash equivalents
|
244,709
|
|
264,593
|
|
|||
|
Investment securities available for sale, at fair value
|
493,474
|
|
560,253
|
|
|||
|
Loans held for sale (includes $2,117,510 and $1,757,807 respectively at fair value)
|
2,117,510
|
|
1,797,064
|
|
|||
|
Loans receivable
|
6,142,390
|
|
5,452,895
|
|
|||
|
Allowance for loan losses
|
(37,315
|
)
|
(35,647
|
)
|
|||
|
Total loans receivable, net of allowance for loan losses
|
6,105,075
|
|
5,417,248
|
|
|||
|
FHLB, Federal Reserve Bank, and other restricted stock
|
68,408
|
|
90,841
|
|
|||
|
Accrued interest receivable
|
23,690
|
|
19,939
|
|
|||
|
Bank premises and equipment, net
|
12,259
|
|
11,146
|
|
|||
|
Bank-owned life insurance
|
161,494
|
|
157,211
|
|
|||
|
Other real estate owned
|
3,108
|
|
5,057
|
|
|||
|
Goodwill and other intangibles
|
3,639
|
|
3,651
|
|
|||
|
Assets held for sale
|
79,271
|
|
2,680
|
|
|||
|
Other assets
|
70,099
|
|
68,522
|
|
|||
|
Total assets
|
$
|
9,382,736
|
|
$
|
8,398,205
|
|
|
|
LIABILITIES AND SHAREHOLDERS’ EQUITY
|
|||||||
|
Liabilities:
|
|||||||
|
Deposits:
|
|||||||
|
Demand, non-interest bearing
|
$
|
512,664
|
|
$
|
408,874
|
|
|
|
Interest bearing
|
6,334,316
|
|
5,253,559
|
|
|||
|
Total deposits
|
6,846,980
|
|
5,662,433
|
|
|||
|
Federal funds purchased
|
83,000
|
|
70,000
|
|
|||
|
FHLB advances
|
868,800
|
|
1,625,300
|
|
|||
|
Other borrowings
|
87,123
|
|
86,457
|
|
|||
|
Subordinated debt
|
108,783
|
|
108,685
|
|
|||
|
Liabilities held for sale
|
484,797
|
|
247,139
|
|
|||
|
Accrued interest payable and other liabilities
|
47,381
|
|
44,289
|
|
|||
|
Total liabilities
|
8,526,864
|
|
7,844,303
|
|
|||
|
Commitments and contingencies (NOTES 18 and 22)
|
|
|
|||||
|
Shareholders’ equity:
|
|||||||
|
Preferred stock, par value $1.00 per share; liquidation preference $25.00 per share; 100,000,000 shares authorized, 9,000,000 and 2,300,000 shares issued and outstanding as of December 31, 2016 and 2015
|
217,471
|
|
55,569
|
|
|||
|
Common stock, par value $1.00 per share; 200,000,000 shares authorized; 30,820,177 and 27,432,061 shares issued as of December 31, 2016 and 2015; 30,289,917 and 26,901,801 shares outstanding as of December 31, 2016 and 2015
|
30,820
|
|
27,432
|
|
|||
|
Additional paid in capital
|
427,008
|
|
362,607
|
|
|||
|
Retained earnings
|
193,698
|
|
124,511
|
|
|||
|
Accumulated other comprehensive loss, net
|
(4,892
|
)
|
(7,984
|
)
|
|||
|
Treasury stock, at cost (530,260 shares as of December 31, 2016 and 2015)
|
(8,233
|
)
|
(8,233
|
)
|
|||
|
Total shareholders’ equity
|
855,872
|
|
553,902
|
|
|||
|
Total liabilities and shareholders’ equity
|
$
|
9,382,736
|
|
$
|
8,398,205
|
|
|
See accompanying notes to the consolidated financial statements.
99
CUSTOMERS BANCORP, INC. AND SUBSIDIARIES
(amounts in thousands, except per share data)
|
|
For the Years Ended December 31,
|
||||||||||
|
|
2016
|
2015
|
2014
|
||||||||
|
Interest income:
|
|||||||||||
|
Loans receivable, including fees
|
$
|
233,349
|
|
$
|
182,280
|
|
$
|
146,388
|
|
||
|
Loans held for sale
|
69,469
|
|
51,553
|
|
30,801
|
|
|||||
|
Investment securities
|
14,293
|
|
10,405
|
|
10,386
|
|
|||||
|
Other
|
5,428
|
|
5,612
|
|
2,852
|
|
|||||
|
Total interest income
|
322,539
|
|
249,850
|
|
190,427
|
|
|||||
|
Interest expense:
|
|||||||||||
|
Deposits
|
48,249
|
|
33,973
|
|
24,454
|
|
|||||
|
Other borrowings
|
6,438
|
|
6,096
|
|
5,342
|
|
|||||
|
FHLB advances
|
11,597
|
|
6,743
|
|
5,194
|
|
|||||
|
Subordinated debt
|
6,739
|
|
6,739
|
|
3,514
|
|
|||||
|
Total interest expense
|
73,023
|
|
53,551
|
|
38,504
|
|
|||||
|
Net interest income
|
249,516
|
|
196,299
|
|
151,923
|
|
|||||
|
Provision for loan losses
|
2,345
|
|
20,566
|
|
14,747
|
|
|||||
|
Net interest income after provision for loan losses
|
247,171
|
|
175,733
|
|
137,176
|
|
|||||
|
Non-interest income:
|
|||||||||||
|
Mortgage warehouse transactional fees
|
11,547
|
|
10,394
|
|
8,233
|
|
|||||
|
Bank-owned life insurance
|
4,736
|
|
7,006
|
|
3,702
|
|
|||||
|
Gains on sales of loans
|
3,685
|
|
4,047
|
|
3,125
|
|
|||||
|
Deposit fees
|
1,140
|
|
943
|
|
801
|
|
|||||
|
Mortgage loan and banking income
|
969
|
|
741
|
|
2,048
|
|
|||||
|
Interchange and card revenue
|
620
|
|
536
|
|
532
|
|
|||||
|
Gain (loss) on sale of investment securities
|
25
|
|
(85
|
)
|
3,191
|
|
|||||
|
Impairment loss on investment securities
|
(7,262
|
)
|
—
|
|
—
|
|
|||||
|
Other
|
7,705
|
|
3,990
|
|
3,494
|
|
|||||
|
Total non-interest income
|
23,165
|
|
27,572
|
|
25,126
|
|
|||||
|
Non-interest expense:
|
|||||||||||
|
Salaries and employee benefits
|
67,877
|
|
56,341
|
|
46,083
|
|
|||||
|
Technology, communication and bank operations
|
12,888
|
|
9,379
|
|
8,466
|
|
|||||
|
FDIC assessments, taxes, and regulatory fees
|
12,568
|
|
10,110
|
|
11,116
|
|
|||||
|
Professional services
|
11,017
|
|
9,386
|
|
7,218
|
|
|||||
|
Occupancy
|
9,846
|
|
8,467
|
|
8,063
|
|
|||||
|
Loan workout
|
2,063
|
|
1,127
|
|
1,706
|
|
|||||
|
Other real estate owned
|
1,953
|
|
2,516
|
|
3,601
|
|
|||||
|
Advertising and promotion
|
576
|
|
697
|
|
1,180
|
|
|||||
|
Other
|
12,429
|
|
9,545
|
|
9,355
|
|
|||||
|
Total non-interest expense
|
131,217
|
|
107,568
|
|
96,788
|
|
|||||
|
Income from continuing operations before income tax expense
|
139,119
|
|
95,737
|
|
65,514
|
|
|||||
|
Income tax expense
|
51,412
|
|
32,664
|
|
20,982
|
|
|||||
|
Net income from continuing operations
|
87,707
|
|
63,073
|
|
44,532
|
|
|||||
|
Loss from discontinued operations before tax expense
|
(14,524
|
)
|
(7,242
|
)
|
(2,126
|
)
|
|||||
|
Income tax benefit from discontinued operations
|
(5,519
|
)
|
(2,752
|
)
|
(808
|
)
|
|||||
|
Net loss from discontinued operations
|
(9,005
|
)
|
(4,490
|
)
|
(1,318
|
)
|
|||||
|
Net income
|
78,702
|
|
58,583
|
|
43,214
|
|
|||||
|
Preferred stock dividend
|
9,515
|
|
2,493
|
|
—
|
|
|||||
|
Net income available to common shareholders
|
$
|
69,187
|
|
$
|
56,090
|
|
$
|
43,214
|
|
||
|
Basic earnings per common share from continuing operations
|
$
|
2.83
|
|
$
|
2.26
|
|
$
|
1.67
|
|
||
|
Basic earnings per common share
|
$
|
2.51
|
|
$
|
2.09
|
|
$
|
1.62
|
|
||
|
Diluted earnings per common share from continuing operations
|
$
|
2.61
|
|
$
|
2.11
|
|
$
|
1.59
|
|
||
|
Diluted earnings per common share
|
$
|
2.31
|
|
$
|
1.96
|
|
$
|
1.55
|
|
||
See accompanying notes to the consolidated financial statements.
100
CUSTOMERS BANCORP, INC. AND SUBSIDIARIES
CONSOLIDATED STATEMENTS OF COMPREHENSIVE INCOME
(amounts in thousands)
|
|
For the Years Ended December 31,
|
||||||||||
|
|
2016
|
2015
|
2014
|
||||||||
|
Net income from continuing operations
|
$
|
87,707
|
|
$
|
63,073
|
|
$
|
44,532
|
|
||
|
Net loss from discontinued operations
|
(9,005
|
)
|
(4,490
|
)
|
(1,318
|
)
|
|||||
|
Net income
|
78,702
|
|
58,583
|
|
43,214
|
|
|||||
|
Unrealized gains (losses) on available-for-sale securities:
|
|||||||||||
|
Unrealized holding gains (losses) on securities arising during the period
|
(3,335
|
)
|
(10,140
|
)
|
17,437
|
|
|||||
|
Income tax effect
|
1,317
|
|
3,759
|
|
(6,103
|
)
|
|||||
|
Reclassification adjustments for losses (gains) on securities included in net income
|
7,237
|
|
85
|
|
(3,191
|
)
|
|||||
|
Income tax effect
|
(2,714
|
)
|
(32
|
)
|
1,117
|
|
|||||
|
Net unrealized gains (losses) on available-for-sale securities
|
2,505
|
|
(6,328
|
)
|
9,260
|
|
|||||
|
Unrealized losses on cash flow hedges:
|
|||||||||||
|
Unrealized losses arising during the period
|
(1,093
|
)
|
(2,532
|
)
|
(1,945
|
)
|
|||||
|
Income tax effect
|
464
|
|
998
|
|
681
|
|
|||||
|
Reclassification adjustment for losses included in net income
|
1,946
|
|
—
|
|
—
|
|
|||||
|
Income tax effect
|
(730
|
)
|
—
|
|
—
|
|
|||||
|
Net unrealized losses on cash flow hedges
|
587
|
|
(1,534
|
)
|
(1,264
|
)
|
|||||
|
Other comprehensive income (loss), net of income tax effect
|
3,092
|
|
(7,862
|
)
|
7,996
|
|
|||||
|
Comprehensive income
|
$
|
81,794
|
|
$
|
50,721
|
|
$
|
51,210
|
|
||
See accompanying notes to the consolidated financial statements.
101
CUSTOMERS BANCORP, INC. AND SUBSIDIARIES
CONSOLIDATED STATEMENTS OF CHANGES IN SHAREHOLDERS’ EQUITY
For the Years Ended
December 31, 2016
,
2015
and
2014
(amounts in thousands, except share data)
|
Preferred Stock
|
Common Stock
|
||||||||||||||||||||||||||||||||
|
Shares of Preferred Stock Outstanding
|
Preferred Stock
|
Shares of
Common
Stock Outstanding
|
Common
Stock
|
Additional
Paid in
Capital
|
Retained
Earnings
|
Accumulated
Other
Comprehensive
Income (Loss)
|
Treasury
Stock
|
Total
|
|||||||||||||||||||||||||
|
Balance, December 31, 2013
|
—
|
|
$
|
—
|
|
24,224,151
|
|
$
|
24,756
|
|
$
|
307,231
|
|
$
|
71,008
|
|
$
|
(8,118
|
)
|
$
|
(8,254
|
)
|
$
|
386,623
|
|
||||||||
|
Net income from continuing operations
|
—
|
|
—
|
|
—
|
|
—
|
|
—
|
|
44,532
|
|
—
|
|
—
|
|
44,532
|
|
|||||||||||||||
|
Net loss from discontinued operations
|
—
|
|
—
|
|
—
|
|
—
|
|
—
|
|
(1,318
|
)
|
—
|
|
—
|
|
(1,318
|
)
|
|||||||||||||||
|
Other comprehensive income
|
—
|
|
—
|
|
—
|
|
—
|
|
—
|
|
—
|
|
7,996
|
|
—
|
|
7,996
|
|
|||||||||||||||
|
Stock dividend
|
—
|
|
—
|
|
2,429,375
|
|
2,429
|
|
43,364
|
|
(45,801
|
)
|
—
|
|
—
|
|
(8
|
)
|
|||||||||||||||
|
Share-based compensation expense
|
—
|
|
—
|
|
—
|
|
—
|
|
4,209
|
|
—
|
|
—
|
|
—
|
|
4,209
|
|
|||||||||||||||
|
Exercise of warrants
|
—
|
|
—
|
|
546
|
|
1
|
|
5
|
|
—
|
|
—
|
|
—
|
|
6
|
|
|||||||||||||||
|
Issuance of common stock under share-based-compensation arrangements
|
—
|
|
—
|
|
91,457
|
|
92
|
|
1,013
|
|
—
|
|
—
|
|
—
|
|
1,105
|
|
|||||||||||||||
|
Balance, December 31, 2014
|
—
|
|
—
|
|
26,745,529
|
|
27,278
|
|
355,822
|
|
68,421
|
|
(122
|
)
|
(8,254
|
)
|
443,145
|
|
|||||||||||||||
|
Net income from continuing operations
|
—
|
|
—
|
|
—
|
|
—
|
|
—
|
|
63,073
|
|
—
|
|
—
|
|
63,073
|
|
|||||||||||||||
|
Net loss from discontinued operations
|
—
|
|
—
|
|
—
|
|
—
|
|
—
|
|
(4,490
|
)
|
—
|
|
—
|
|
(4,490
|
)
|
|||||||||||||||
|
Other comprehensive loss
|
—
|
|
—
|
|
—
|
|
—
|
|
—
|
|
—
|
|
(7,862
|
)
|
—
|
|
(7,862
|
)
|
|||||||||||||||
|
Issuance of preferred stock, net of offering costs of $1,931
|
2,300,000
|
|
55,569
|
|
—
|
|
—
|
|
—
|
|
—
|
|
—
|
|
—
|
|
55,569
|
|
|||||||||||||||
|
Preferred stock dividends
|
—
|
|
—
|
|
—
|
|
—
|
|
—
|
|
(2,493
|
)
|
—
|
|
—
|
|
(2,493
|
)
|
|||||||||||||||
|
Share-based compensation expense
|
—
|
|
—
|
|
—
|
|
—
|
|
4,862
|
|
—
|
|
—
|
|
—
|
|
4,862
|
|
|||||||||||||||
|
Exercise of warrants
|
—
|
|
—
|
|
7,611
|
|
8
|
|
90
|
|
—
|
|
—
|
|
—
|
|
98
|
|
|||||||||||||||
|
Issuance of common stock under share-based-compensation arrangements
|
—
|
|
—
|
|
148,661
|
|
146
|
|
1,833
|
|
—
|
|
—
|
|
21
|
|
2,000
|
|
|||||||||||||||
|
Balance, December 31, 2015
|
2,300,000
|
|
55,569
|
|
26,901,801
|
|
27,432
|
|
362,607
|
|
124,511
|
|
(7,984
|
)
|
(8,233
|
)
|
553,902
|
|
|||||||||||||||
|
Net income from continuing operations
|
—
|
|
—
|
|
—
|
|
—
|
|
—
|
|
87,707
|
|
—
|
|
—
|
|
87,707
|
|
|||||||||||||||
|
Net loss from discontinued operations
|
—
|
|
—
|
|
—
|
|
—
|
|
—
|
|
(9,005
|
)
|
—
|
|
—
|
|
(9,005
|
)
|
|||||||||||||||
|
Other comprehensive income
|
—
|
|
—
|
|
—
|
|
—
|
|
—
|
|
—
|
|
3,092
|
|
—
|
|
3,092
|
|
|||||||||||||||
|
Issuance of common stock, net of offering costs of $2,238
|
2,641,677
|
|
2,642
|
|
61,389
|
|
64,031
|
|
|||||||||||||||||||||||||
|
Issuance of preferred stock, net of offering costs of $5,598
|
6,700,000
|
|
161,902
|
|
—
|
|
—
|
|
—
|
|
—
|
|
—
|
|
—
|
|
161,902
|
|
|||||||||||||||
|
Preferred stock dividends
|
—
|
|
—
|
|
—
|
|
—
|
|
—
|
|
(9,515
|
)
|
—
|
|
—
|
|
(9,515
|
)
|
|||||||||||||||
|
Share-based compensation expense
|
—
|
|
—
|
|
—
|
|
—
|
|
6,189
|
|
—
|
|
—
|
|
—
|
|
6,189
|
|
|||||||||||||||
|
Exercise of warrants
|
—
|
|
—
|
|
345,414
|
|
345
|
|
1,186
|
|
—
|
|
—
|
|
—
|
|
1,531
|
|
|||||||||||||||
|
Issuance of common stock under share-based-compensation arrangements
|
—
|
|
—
|
|
401,025
|
|
401
|
|
(4,363
|
)
|
—
|
|
—
|
|
—
|
|
(3,962
|
)
|
|||||||||||||||
|
Balance, December 31, 2016
|
9,000,000
|
|
$
|
217,471
|
|
30,289,917
|
|
$
|
30,820
|
|
$
|
427,008
|
|
$
|
193,698
|
|
$
|
(4,892
|
)
|
$
|
(8,233
|
)
|
$
|
855,872
|
|
||||||||
See accompanying notes to the consolidated financial statements.
102
CUSTOMERS BANCORP, INC. AND SUBSIDIARIES
(amounts in thousands)
|
|
For the Years Ended December 31,
|
||||||||||
|
|
2016
|
2015
|
2014
|
||||||||
|
Cash Flows from Operating Activities of Continuing Operations
|
|||||||||||
|
Net income from continuing operations
|
$
|
87,707
|
|
$
|
63,073
|
|
$
|
44,532
|
|
||
|
Adjustments to reconcile net income to net cash (used in) provided by operating activities of continuing operations:
|
|||||||||||
|
Provision for loan losses, net of change to FDIC receivable and clawback liability
|
2,345
|
|
20,566
|
|
14,747
|
|
|||||
|
Provision for depreciation and amortization
|
3,569
|
|
3,641
|
|
3,583
|
|
|||||
|
Share-based compensation expense
|
6,492
|
|
5,547
|
|
5,237
|
|
|||||
|
Deferred taxes
|
(2,579
|
)
|
(10,092
|
)
|
(6,187
|
)
|
|||||
|
Net amortization of investment securities premiums and discounts
|
891
|
|
858
|
|
821
|
|
|||||
|
Loss (gain) on sale of investment securities
|
7,237
|
|
85
|
|
(3,191
|
)
|
|||||
|
Gain on sale of mortgages and other loans
|
(3,685
|
)
|
(4,479
|
)
|
(5,344
|
)
|
|||||
|
Origination of loans held for sale
|
(36,130,924
|
)
|
(29,925,763
|
)
|
(18,138,339
|
)
|
|||||
|
Proceeds from the sale of loans held for sale
|
35,772,081
|
|
29,504,104
|
|
17,553,196
|
|
|||||
|
Increase in FDIC loss sharing receivable net of clawback liability
|
255
|
|
(2,430
|
)
|
(2,409
|
)
|
|||||
|
Amortization (accretion) of fair value discounts
|
405
|
|
832
|
|
(273
|
)
|
|||||
|
Net loss on sales of other real estate owned
|
130
|
|
761
|
|
966
|
|
|||||
|
Valuation and other adjustments to other real estate owned, net of FDIC receivable
|
1,473
|
|
992
|
|
1,979
|
|
|||||
|
Earnings on investment in bank-owned life insurance
|
(4,736
|
)
|
(7,006
|
)
|
(3,702
|
)
|
|||||
|
Increase in accrued interest receivable and other assets
|
(9,982
|
)
|
(12,021
|
)
|
(15,210
|
)
|
|||||
|
Increase in accrued interest payable and other liabilities
|
6,278
|
|
8,635
|
|
9,606
|
|
|||||
|
Net Cash Used in Operating Activities of Continuing Operations
|
(263,043
|
)
|
(352,697
|
)
|
(539,988
|
)
|
|||||
|
Cash Flows from Investing Activities of Continuing Operations
|
|||||||||||
|
Purchases of investment securities available for sale
|
(5,000
|
)
|
(231,703
|
)
|
(164,940
|
)
|
|||||
|
Proceeds from maturities, calls and principal repayments on investment securities available for sale
|
64,701
|
|
76,331
|
|
49,195
|
|
|||||
|
Proceeds from sales of investment securities available for sale
|
2,852
|
|
806
|
|
213,249
|
|
|||||
|
Net increase in loans
|
(783,290
|
)
|
(1,341,348
|
)
|
(1,814,317
|
)
|
|||||
|
Purchase of loan portfolios
|
—
|
|
—
|
|
(309,927
|
)
|
|||||
|
Proceeds from sale of loans held for investment
|
133,104
|
|
248,060
|
|
162,724
|
|
|||||
|
Net purchases of bank-owned life insurance
|
—
|
|
(15,000
|
)
|
(30,465
|
)
|
|||||
|
Proceeds from bank-owned life insurance
|
619
|
|
3,384
|
|
—
|
|
|||||
|
Net proceeds from (purchases of) FHLB, Federal Reserve Bank, and other restricted stock
|
22,433
|
|
(8,839
|
)
|
(39,578
|
)
|
|||||
|
(Payments to) reimbursements from the FDIC on loss sharing agreements
|
(2,049
|
)
|
3,917
|
|
5,446
|
|
|||||
|
Purchases of bank premises and equipment
|
(5,117
|
)
|
(1,836
|
)
|
(1,270
|
)
|
|||||
|
Proceeds from sales of other real estate owned
|
1,051
|
|
8,890
|
|
7,991
|
|
|||||
|
Net Cash Used in Investing Activities of Continuing Operations
|
(570,696
|
)
|
(1,257,338
|
)
|
(1,921,892
|
)
|
|||||
|
Cash Flows from Financing Activities of Continuing Operations
|
|||||||||||
|
Net increase in deposits
|
1,184,549
|
|
1,366,239
|
|
1,573,167
|
|
|||||
|
Net (decrease) increase in short-term borrowed funds from the FHLB
|
(831,500
|
)
|
(17,700
|
)
|
633,500
|
|
|||||
|
Net increase in federal funds purchased
|
13,000
|
|
70,000
|
|
—
|
|
|||||
|
Proceeds from long-term FHLB borrowings
|
75,000
|
|
25,000
|
|
265,000
|
|
|||||
|
Proceeds from issuance of long-term debt, net
|
—
|
|
—
|
|
133,142
|
|
|||||
|
Repayment of subordinated debt
|
—
|
|
—
|
|
(2,000
|
)
|
|||||
|
Net proceeds from issuance of preferred stock
|
161,902
|
|
55,569
|
|
—
|
|
|||||
|
Preferred stock dividends paid
|
(9,051
|
)
|
(2,314
|
)
|
—
|
|
|||||
|
Exercise and redemption of warrants
|
1,532
|
|
98
|
|
6
|
|
|||||
|
Purchase of treasury stock
|
—
|
|
—
|
|
—
|
|
|||||
|
Net proceeds from issuance of common stock
|
65,088
|
|
806
|
|
77
|
|
|||||
|
Net Cash Provided by Financing Activities of Continuing Operations
|
660,520
|
|
1,497,698
|
|
2,602,892
|
|
|||||
|
Net (Decrease) Increase in Cash and Cash Equivalents from Continuing Operations
|
(173,219
|
)
|
(112,337
|
)
|
141,012
|
|
|||||
|
Discontinued Operations:
|
|||||||||||
|
Net cash used in operating activities
|
(27,419
|
)
|
(3,951
|
)
|
(2,510
|
)
|
|||||
|
Net cash used in investing activities
|
(28,973
|
)
|
(888
|
)
|
(28
|
)
|
|||||
|
Net cash provided by financing activities
|
209,727
|
|
10,746
|
|
(519
|
)
|
|||||
|
Net cash flows provided by (Used In) discontinued operations
|
153,335
|
|
5,907
|
|
(3,057
|
)
|
|||||
|
Net (Decrease) Increase in Cash and Cash Equivalents
|
(19,884
|
)
|
(106,430
|
)
|
137,955
|
|
|||||
|
Cash and Cash Equivalents – Beginning
|
264,593
|
|
371,023
|
|
233,068
|
|
|||||
|
Cash and Cash Equivalents – Ending
|
$
|
244,709
|
|
$
|
264,593
|
|
$
|
371,023
|
|
||
(continued)
103
CUSTOMERS BANCORP, INC. AND SUBSIDIARIES
CONSOLIDATED STATEMENTS OF CASH FLOWS (continued)
(amounts in thousands)
|
|
For the Years Ended December 31,
|
||||||||||
|
|
2016
|
2015
|
2014
|
||||||||
|
Supplementary Cash Flow Information
|
|||||||||||
|
Interest paid
|
$
|
71,216
|
|
$
|
51,313
|
|
$
|
37,580
|
|
||
|
Income taxes paid
|
57,251
|
|
38,734
|
|
29,843
|
|
|||||
|
Non-cash Items:
|
|||||||||||
|
Transfer of loans to other real estate owned
|
$
|
703
|
|
$
|
3,467
|
|
$
|
14,042
|
|
||
|
Transfer of loans from held for investment to held for sale
|
—
|
|
—
|
|
164,681
|
|
|||||
|
Transfer of loans from held for sale to held for investment
|
25,118
|
|
30,365
|
|
18,826
|
|
|||||
See accompanying notes to the consolidated financial statements.
104
CUSTOMERS BANCORP, INC. AND SUBSIDIARIES
NOTES TO CONSOLIDATED FINANCIAL STATEMENTS
Customers Bancorp, Inc. (the “Bancorp” or “Customers Bancorp”) is a bank holding company engaged in banking activities through its wholly owned subsidiary, Customers Bank (the “Bank”), collectively referred to as “Customers” herein. The consolidated financial statements have been prepared in conformity with accounting principles generally accepted in the United States (“U.S. GAAP”) and pursuant to the rules and regulations of the Securities and Exchange Commission (“SEC”).
Customers Bancorp, Inc. and its wholly owned subsidiaries, Customers Bank, and non-bank subsidiaries, serve residents and businesses in Southeastern Pennsylvania (Bucks, Berks, Chester, Philadelphia and Delaware Counties); Rye, New York (Westchester County); Hamilton, New Jersey (Mercer County); Boston, Massachusetts; Providence, Rhode Island; Portsmouth, New Hampshire (Rockingham County); Manhattan, New York; and nationally for certain loan and deposit products. The Bank has
14
full-service branches and provides commercial banking products, primarily loans and deposits. Customers Bank administratively supports loan and other financial products to customers through its limited purpose offices in Boston, Massachusetts, Providence, Rhode Island, Portsmouth, New Hampshire, Manhattan and Melville, New York and Philadelphia, Pennsylvania. The Bank also provides liquidity to residential mortgage originators nationwide through commercial loans to mortgage companies.
Through BankMobile, a division of Customers Bank, Customers offers state of the art high tech digital banking services to consumers, students, and the "under banked" nationwide. The combination of the BankMobile technology software platform with the OneAccount Student Checking and Refund Management Disbursement Services business (the "Disbursement business") acquired from Higher One Holdings, Inc. and Higher One, Inc. (together, "Higher One") propelled BankMobile to one of the largest mobile banking services in the United States by number of customers. Customers has announced its intent to sell BankMobile and anticipates the sale to close in 2017. Accordingly, BankMobile has been classified as "held for sale" on the consolidated balance sheets and BankMobile's operating results and associated cash flows have been presented as discontinued operations in the consolidated financial statements, see NOTE 3 - DISCONTINUED OPERATIONS.
Customers Bank is subject to regulation of the Pennsylvania Department of Banking and Securities and the Federal Reserve Bank and is periodically examined by those regulatory authorities. Customers Bancorp has made certain equity investments through its wholly owned subsidiaries CB Green Ventures Pte Ltd. and CUBI India Ventures Pte Ltd.
On June 15, 2016, Customers completed the acquisition of substantially all the assets and the assumption of certain liabilities of the Disbursement business from Higher One. The acquisition was completed pursuant to the terms of an Asset Purchase Agreement (the "Purchase Agreement") dated as of December 15, 2015 between Customers and Higher One. Under the terms of the Purchase Agreement, Customers also acquired all existing relationships with vendors and educational institutions, and all intellectual property and assumed normal business related liabilities. In conjunction with the acquisition, Customers hired approximately
225
Higher One employees primarily located in New Haven, Connecticut that manage the Disbursement business and serve the Disbursement business customers.
The transaction contemplates aggregate guaranteed payments to Higher One of
$42 million
. The aggregate purchase price payable by Customers is
$37 million
in cash, with the payments to be made as follows: (i)
17 million
in cash paid upon the closing of the acquisition, (ii)
$10 million
in cash to be paid upon the first anniversary of the closing and (iii)
$10 million
in cash to be paid upon the second anniversary of the closing. In addition, concurrently with the closing, the parties entered into a Transition Services Agreement pursuant to which Higher One will provide certain transition services to Customers through June 30, 2017. As consideration for these services, Customers will pay Higher One an additional
$5 million
in cash. Customers also will be required to make additional payments to Higher One if, during the
three
years following the closing, revenues from the Disbursement business exceed
$75 million
in a year. The possible payment will be equal to
35%
of the amount the Disbursement business related revenue exceeds
$75 million
in each year. As of
December 31, 2016
, Customers has not recorded a liability for any additional contingent consideration payable under the Purchase Agreement.
As specified in the Purchase Agreement, the payments of
$10 million
payable to Higher One upon each of the first and second anniversary of the transaction closing were placed into an escrow account with a third party. The escrow account with
$20.0 million
in aggregate restricted cash and the corresponding obligation to pay Higher One pursuant to the terms of the Purchase Agreement have been assigned to BankMobile and are presented in "Assets held for sale" and "Liabilities held for sale" on the
December 31, 2016
consolidated balance sheets. For more information regarding Customers' plans for BankMobile and the presentation of BankMobile within the consolidated financial statements, see NOTE 3 - DISCONTINUED OPERATIONS.
105
The following table presents the fair values of the assets acquired and liabilities assumed as of the June 15, 2016 acquisition date of the Disbursement business:
|
June 15, 2016
|
||||||
|
(amounts in thousands)
|
Preliminary
|
Adjusted
|
||||
|
Fair value of assets acquired:
|
||||||
|
Developed software
|
$
|
27,400
|
|
$
|
27,400
|
|
|
Other intangible assets
|
9,300
|
|
9,300
|
|
||
|
Accounts receivable
|
2,784
|
|
2,784
|
|
||
|
Prepaid expenses
|
1,180
|
|
418
|
|
||
|
Fixed assets, net
|
229
|
|
229
|
|
||
|
Total assets acquired
|
40,893
|
|
40,131
|
|
||
|
Fair value of liabilities assumed:
|
||||||
|
Other liabilities
|
5,531
|
|
5,735
|
|
||
|
Deferred revenue
|
2,655
|
|
2,655
|
|
||
|
Total liabilities assumed
|
8,186
|
|
8,390
|
|
||
|
Net assets acquired
|
$
|
32,707
|
|
$
|
31,741
|
|
|
Transaction cash consideration (1)
|
$
|
37,000
|
|
$
|
37,000
|
|
|
Goodwill recognized
|
$
|
4,293
|
|
$
|
5,259
|
|
(1) Includes
$10 million
payable to Higher One upon each of the first and second anniversary of the transaction closing, which has been placed into an escrow account with a third party (aggregate amount of
$20 million
).
The assets acquired and liabilities assumed were initially presented at their estimated fair values based on a preliminary allocation of the purchase price. In many cases, the determination of these fair values required management to make estimates about discount rates, future expected cash flows, market conditions and other future events that were highly subjective and subject to change. The fair value estimates were considered preliminary and subject to change for up to one year after the closing date of the acquisition as additional information became available. Based on a preliminary purchase price allocation, Customers recorded
$4.3 million
in goodwill as a result of the acquisition. At December 31, 2016, Customers recorded adjustments to the estimated fair values of prepaid expenses and other liabilities, which resulted in a
$1.0 million
increase in goodwill. The adjusted amount of goodwill of
$5.3 million
reflects the excess purchase price over the estimated fair value of the net assets acquired. The goodwill recorded is deductible for tax purposes. Customers does not anticipate any additional adjustments to the purchase price allocation.
The fair value for the developed software was estimated based on expected revenue attributable to the software utilizing a discounted cash flow methodology giving consideration to potential obsolescence. The developed software was being amortized over
ten years
based on the estimated economic benefits received. The fair values for the other intangible assets represent the value of existing student and university relationships and a non-compete agreement with Higher One based on estimated retention rates and discounted cash flows. Other intangible assets were being amortized over an estimated life ranging from
four
to
twenty years
. Because BankMobile has been classified as held for sale at December 31, 2016, these assets are reported at the lower of cost or market on the consolidated balance sheet and are no longer being amortized. At December 31, 2016, Customers estimated the fair values of these assets to be higher than their amortized cost basis. Accordingly, a lower of cost or fair value adjustment was not recorded in fourth quarter 2016.
In connection with the Disbursement business acquisition, Customers incurred acquisition related expenses of
$1.2 million
for the year ended
December 31, 2016
, related predominantly to professional services. These expenses are presented in "Net loss from discontinued operations" on the consolidated statements of income.
106
In the third quarter 2016, Customers announced its intent to sell BankMobile and anticipates a sale to close within one year. Because BankMobile met the criteria to be classified as held for sale at December 31, 2016, the assets and liabilities of BankMobile have been presented as "Assets held for sale" and "Liabilities held for sale" on the consolidated balance sheets at December 31, 2016 and 2015. BankMobile's operating results and associated cash flows have been presented as "Discontinued operations" within the accompanying consolidated financial statements and prior period amounts have been reclassified to conform with the current period presentation. BankMobile will continue to be presented as "Discontinued operations" until completion of the sale or at such time that BankMobile no longer meets the held-for-sale criteria.
The following summarized financial information related to BankMobile has been segregated from continuing operations and reported as discontinued operations for the periods presented. The amounts presented below exclude the effect of internal allocations made by management when assessing the performance of the BankMobile operating segment. For more information on the BankMobile operating segment, see NOTE 25 - BUSINESS SEGMENTS.
|
|
For the Years Ended December 31,
|
||||||||||
|
(amounts in thousands)
|
2016
|
2015
|
2014
|
||||||||
|
Discontinued operations:
|
|||||||||||
|
Interest income
|
$
|
—
|
|
$
|
—
|
|
$
|
—
|
|
||
|
Interest expense
|
19
|
|
9
|
|
—
|
|
|||||
|
Net interest income
|
(19
|
)
|
(9
|
)
|
—
|
|
|||||
|
Provision for loan losses
|
696
|
|
—
|
|
—
|
|
|||||
|
Non-interest income
|
33,205
|
|
145
|
|
—
|
|
|||||
|
Non-interest expense
|
47,014
|
|
7,378
|
|
2,126
|
|
|||||
|
Loss from discontinued operations before income tax benefit
|
(14,524
|
)
|
(7,242
|
)
|
(2,126
|
)
|
|||||
|
Income tax benefit
|
(5,519
|
)
|
(2,752
|
)
|
(808
|
)
|
|||||
|
Net loss from discontinued operations
|
$
|
(9,005
|
)
|
$
|
(4,490
|
)
|
$
|
(1,318
|
)
|
||
The assets and liabilities held for sale on the consolidated balance sheets as of December 31, 2016 and 2015 were as follows:
|
|
December 31,
|
||||||
|
(amounts in thousands)
|
2016
|
2015
|
|||||
|
ASSETS
|
|||||||
|
Restricted cash (1)
|
$
|
20,000
|
|
$
|
—
|
|
|
|
Loans receivable
|
12,248
|
|
584
|
|
|||
|
Bank premises and equipment, net
|
510
|
|
385
|
|
|||
|
Goodwill and other intangibles
|
13,982
|
|
—
|
|
|||
|
Other assets
|
32,531
|
|
1,711
|
|
|||
|
Assets held for sale
|
$
|
79,271
|
|
$
|
2,680
|
|
|
|
LIABILITIES
|
|||||||
|
Deposits:
|
|||||||
|
Demand, non-interest bearing
|
$
|
453,394
|
|
$
|
244,805
|
|
|
|
Interest bearing
|
3,401
|
|
2,263
|
|
|||
|
Total deposits
|
456,795
|
|
247,068
|
|
|||
|
Accrued expenses and other liabilities (1)
|
28,002
|
|
71
|
|
|||
|
Liabilities held for sale
|
$
|
484,797
|
|
$
|
247,139
|
|
|
(1) Includes
$10 million
payable to Higher One upon each of the first and second anniversary of the transaction closing, which has been placed into an escrow account with a third party (aggregate amount of
$20 million
).
At December 31, 2016, Customers anticipates that cash, securities or loans (or a combination thereof) with a market value equal to the amount of BankMobile deposits outstanding at the time the anticipated sale closes will be included in the net assets transferred pursuant to the terms of the contemplated purchase and sale agreement.
107
Basis of Presentation
The accounting and reporting policies of Customers Bancorp, Inc. and subsidiaries are in conformity with accounting principles generally accepted in the United States of America and predominant practices of the banking industry. The preparation of financial statements requires management to make estimates and assumptions that affect the reported balances of assets and liabilities and disclosure of contingent assets and liabilities at the date of the financial statements and the reported amounts of revenues and expenses during the reporting period. Actual results could differ from those estimates. Material estimates that are particularly susceptible to significant change in the near-term relate to the determination of the allowance for loan losses, credit deterioration and expected cash flows of purchased-credit-impaired loans, valuation of deferred tax assets, other-than-temporary impairment losses on securities, fair values of financial instruments, and annual goodwill and intangible asset impairment analysis. Certain amounts reported in the
2015
and
2014
financial statements have been reclassified to conform to the
2016
presentation.
In the third quarter 2016, Customers announced its intent to sell BankMobile and expects a sale to close within one year. Because BankMobile met the criteria to be classified as held for sale at December 31, 2016, the assets and liabilities of BankMobile have been presented as "Assets held for sale" and "Liabilities held for sale" on the consolidated balance sheets at December 31, 2016 and 2015. BankMobile's operating results and associated cash flows have been presented as "Discontinued operations" within the accompanying consolidated financial statements and prior period amounts have been reclassified to conform with the current period presentation.
Principles of Consolidation
The accompanying consolidated financial statements include the accounts of the parent company and its wholly owned subsidiaries: Customers Bank, CB Green Ventures Pte Ltd. and CUBI India Ventures Pte Ltd. Customers Bank includes the accounts of its wholly owned subsidiary CIC, Inc. and other subsidiaries. All significant intercompany balances and transactions have been eliminated in consolidation.
Cash and Cash Equivalents and Statements of Cash Flows
Cash and cash equivalents include cash on hand, amounts due from banks, and interest-bearing deposits with banks with a maturity date of three months or less and are recorded at cost. The carrying value of cash and cash equivalents is a reasonable estimate of its approximate fair value. Changes in the balances of cash and cash equivalents are reported in the consolidated statements of cash flows. Cash receipts from the repayment or sale of loans are classified within the statement of cash flows based on management's original intent upon origination of the loan, as prescribed by accounting guidance related to the statement of cash flows. Cash used upon initial funding of Customers' mortgage warehousing lending transactions and proceeds received when the mortgage loans are sold into the secondary market are classified as operating activities within the statement of cash flows.
Restrictions on Cash and Amounts due from Banks
Customers Bank is required to maintain average balances on hand or with the Federal Reserve Bank. At
December 31, 2016
and
2015
, these reserve balances were
$149.3 million
and
$73.2 million
, respectively.
In connection with the acquisition of the Disbursement business from Higher One, Customers placed
$20 million
in an escrow account with a third party to be paid to Higher One upon each of the first and second anniversary of the transaction closing. This cash is restricted in use and is reported in "Assets held for sale" on the consolidated balance sheets as of
December 31, 2016
. For more information, see NOTE 3 - DISCONTINUED OPERATIONS.
Business Combinations
Business combinations are accounted for by applying the acquisition method in accordance with Accountings Standards Codification ("ASC") 805,
Business Combinations
. Under the acquisition method, identifiable assets acquired and liabilities assumed are measured at their fair values as of the date of acquisition, and are recognized separately from goodwill. Results of operations of the acquired entity are included in the consolidated statement of income from the date of acquisition.
108
Investment Securities
Customers acquires securities, largely mortgage-backed securities, to effectively utilize cash and capital and to generate earnings. Security transactions are recorded as of the trade date. Securities are classified at the time of acquisition as available for sale, held to maturity, or trading, and their classification determines the accounting as follows:
Available for sale
: Investment securities classified as available for sale are those debt and equity securities that Customers intends to hold for an indefinite period of time but not necessarily to maturity. Investment securities available for sale are carried at fair value. Unrealized gains or losses are reported as increases or decreases in accumulated other comprehensive income, net of the related deferred tax effect. Realized gains or losses, determined on the basis of the cost of the specific securities sold, are included in earnings and recorded at the trade date. Premiums and discounts are recognized in interest income using the interest method over the terms of the securities.
Held to maturity
: Investment securities classified as held to maturity are those debt securities that Customers has both the intent and ability to hold to maturity regardless of changes in market conditions, liquidity needs, or changes in general economic conditions. These securities are carried at cost, adjusted for the amortization of premiums and accretion of discounts, computed by a method which approximates the interest method over the terms of the securities. There were no securities classified as held to maturity as of
December 31, 2016
and
2015
.
Trading:
Investment securities classified as trading are those debt and equity securities that management intends to actively trade. These securities are carried at their current fair value, with changes in fair value reported in income. Customers does not actively trade securities.
For available-for-sale and held-to-maturity securities, management periodically assesses whether the securities are other than temporarily impaired. Other-than-temporary impairment means that management believes a security’s decline in fair value below its amortized cost basis is due to factors that could include the issuer’s inability to pay interest or dividends, its potential for default, and/or other factors. When a held-to-maturity or available-for-sale debt security is assessed for other-than-temporary impairment, management has to first consider (a) whether Customers intends to sell the security, and (b) whether it is more likely than not that Customers will be required to sell the security prior to recovery of its amortized cost basis.
If one of these circumstances applies to a security, an other-than-temporary impairment loss is recognized in the consolidated statements of income equal to the full amount of the decline in fair value below the amortized cost basis. If neither of these circumstances applies to a security, but Customers does not expect to recover the entire amortized cost basis, an other-than-temporary impairment has occurred that must be separated into two categories for debt securities: (a) the amount related to credit loss, and (b) the amount related to other factors. In assessing the level of other-than-temporary impairment attributable to credit loss, management compares the present value of cash flows expected to be collected with the amortized cost basis of the security. The portion of the total other-than-temporary impairment related to credit loss is recognized in earnings (as the difference between the fair value and the present value of the estimated cash flows), while the amount related to other factors is recognized in other comprehensive income. The total other-than-temporary impairment loss is presented in the statement of income, less the portion recognized in other comprehensive income. When a debt security becomes other-than-temporarily impaired, its amortized cost basis is reduced to reflect the portion of the total impairment related to credit loss.
For marketable equity securities, Customers considers the issuer’s financial condition, capital strength and near term prospects to determine whether an impairment is temporary or other-than-temporary. Customers also considers the volatility of a security’s price in comparison to the market as a whole and any recoveries or declines in fair value subsequent to the balance sheet date. If management determines that the impairment is other-than-temporary, the entire amount of the impairment as of the balance sheet date is recognized in earnings even if the decision to sell the security has not been made. The fair value of the security becomes the new amortized cost basis of the investment and is not adjusted for subsequent recoveries in fair value.
109
Loan Accounting Framework
The accounting for a loan depends on management’s strategy for the loan, and on whether the loan was credit impaired at the date of acquisition. The Bank accounts for loans based on the following categories:
|
•
|
Loans held for sale
|
|
•
|
Loans at fair value
|
|
•
|
Loans receivable
|
|
•
|
Purchased loans
|
|
•
|
Loans receivable covered under Loss Sharing Agreements with the FDIC.
|
The following provides a detailed discussion of the accounting for loans in these categories:
Loans Held for Sale and Loans at Fair Value
Loans originated or acquired by the Bank with the intent to sell in the secondary market are carried either at the lower of cost or fair value, determined in the aggregate, or at fair value, depending upon an election made at the time the loan is made. These loans are generally sold on a non-recourse basis with servicing released. Gains and losses on the sale of loans accounted for at lower of cost or fair value are recognized in earnings based on the difference between the proceeds received and the carrying amount of the loans, inclusive of deferred origination fees and costs, if any. As a result of changes in events and circumstances or developments regarding management’s view of the foreseeable future, loans not originated or acquired with the intent to sell may subsequently be designated as held for sale. These loans are transferred to the held-for-sale portfolio at the lower of amortized cost or fair value.
Loans originated or acquired by the Bank with the intent to sell for which fair value accounting is elected are reported at fair value,with changes in fair value recognized in earnings in the period they occur. Upon sale, any difference between the proceeds received and the carrying amount of the loan is recognized in earnings.
No
fees or costs related to such loans are deferred, so they do not affect the gain or loss calculation at the time of sale.
Certain mortgage warehouse lending transactions subject to master repurchase agreements are designated as held for sale and reported at fair value based on an election made to account for the loans at fair value. Pursuant to these agreements, the Bank funds the pipelines for these mortgage lenders by sending payments directly to the closing agents for funded loans (i.e., the purchase event) and receives proceeds directly from third party investors when the loans are sold into the secondary market (i.e, the repurchase event).
An allowance for loan losses is not maintained on loans designated as held for sale or reported at fair value.
Loans Receivable
Loans receivable that management has the intent and ability to hold for the foreseeable future or until maturity or payoff are reported at their outstanding unpaid principal balances, net of an allowance for loan losses and any deferred fees. Interest income is accrued on the unpaid principal balance. Loan origination fees, net of certain direct origination costs, are deferred and recognized as an adjustment of the yield (interest income) of the related loans using the level-yield method without anticipating prepayments. The Bank is generally amortizing these amounts over the contractual life of the loans.
The accrual of interest is generally discontinued when the contractual payment of principal or interest has become
90 days
past due or when management has doubts about further collectibility of principal or interest, even though the loan is currently performing. A loan may remain on accrual status if it is in the process of collection and is well secured. When a loan is placed on non-accrual status, unpaid accrued interest previously credited to income is reversed. Interest received on non-accrual loans is applied against principal until all principal has been recovered. Thereafter, payments are recognized as interest income until all unpaid amounts have been received. Generally, loans are restored to accrual status when the obligation is brought current and has performed in accordance with the contractual terms for a minimum of
six months
and the ultimate collectibility of the total contractual principal and interest is no longer in doubt.
110
Transfers of financial assets, including loan participations sold, are accounted for as sales when control over the assets has been surrendered (settlement date). Control over transferred assets is deemed to be surrendered when (1) the assets have been isolated from the Bank, (2) the transferee obtains the right (free of conditions that constrain it from taking advantage of that right) to pledge or exchange the transferred assets, and (3) the Bank does not maintain effective control over the transferred assets through an agreement to repurchase them before their maturity.
Purchased Loans
Customers believes that the varying circumstances under which it purchases loans and the diverse credit quality of loans purchased should drive the decision as to whether loans in a portfolio should be deemed to be purchased-credit-impaired loans. Therefore, loan purchases are evaluated on a case-by-case basis to determine the appropriate accounting treatment. Loans acquired that do not have evidence of credit deterioration at the purchase date are accounted for in accordance with ASC 310-20,
Nonrefundable Fees and Other Costs,
and loans acquired with evidence of credit deterioration since origination and for which it is probable that all contractually required payments will not be collected are accounted for in accordance with ASC 310-30,
Loans and Debt Securities Acquired with Deteriorated Credit Quality.
Loans that are purchased that do not have evidence of credit deterioration
Purchased performing loans are initially recorded at fair value and include credit and interest rate marks associated with acquisition accounting adjustments. Purchase premiums or discounts are subsequently amortized as an adjustment to yield over the estimated contractual lives of the loans. There is no allowance for loan losses established at the acquisition date for acquired performing loans. An allowance for loan losses is recorded for any credit deterioration in these loans subsequent to acquisition.
Loans that are purchased that have evidence of credit deterioration since origination and for which it is probable that all contractually required payments will not be collected
For purchases of this loan type, evidence of deteriorated credit quality may include past-due and non-accrual status, borrower credit scores and recent loan-to-value percentages.
The fair value of loans with evidence of credit deterioration is recorded net of a nonaccretable difference and accretable yield. The difference between contractually required payments at acquisition and the cash flows expected to be collected at acquisition is the nonaccretable difference, which is not included in the carrying amount of acquired loans. Subsequent to acquisition, estimates of cash flows expected to be collected are updated each reporting period based on updated assumptions regarding default rates, loss severities, and other factors that are reflective of current market conditions. Subsequent decreases in expected cash flows will generally result in a provision for loan losses. Subsequent increases in expected cash flows result in a reversal of the provision for loan losses to the extent of prior charges, or a reclassification of the difference from nonaccretable to accretable with a positive impact on accretion of interest income in future periods. Further, any excess of cash flows expected at acquisition over the estimated fair value is referred to as the accretable yield and is recognized in interest income over the remaining life of the loan when there is a reasonable expectation about the amount and timing of those cash flows.
Purchased-credit-impaired loans acquired in the same fiscal quarter may be aggregated into one or more pools, provided that the loans have common risk characteristics. A pool is then accounted for as a single asset with a single composite interest rate and an aggregate expectation of cash flows. On a quarterly basis, the Bank re-estimates the total cash flows (both principal and interest) expected to be collected over the remaining life of each pool. These estimates incorporate assumptions regarding default rates, loss severities, the amounts and timing of prepayments and other factors that reflect then-current market conditions. If the timing and/or amounts of expected cash flows on purchased-credit-impaired loans were determined not to be reasonably estimable, no interest would be accreted and the loans would be reported as non-accrual loans; however, when the timing and amounts of expected cash flows for purchased-credit-impaired loans are reasonably estimable, interest is being accreted and the loans are being reported as performing loans.
Loans Receivable Covered Under Loss Sharing Agreements
On July 11, 2016, Customers entered into an agreement to terminate all existing rights and obligations pursuant to the loss sharing agreements with the FDIC. In connection with the termination agreement, Customers paid the FDIC
$1.4 million
as final payment under these agreements. The negotiated settlement amount was based on net losses incurred on the covered assets through September 30, 2015, adjusted for cash payments to and cash receipts from the FDIC as part of the December 31, 2015 and March 31, 2016 certifications. Consequently, loans and other real estate owned previously reported as covered assets pursuant to the loss sharing agreements are no longer reported as covered assets as of June 30, 2016.
111
Allowance for Loan Losses
The allowance for loan losses is established as losses are estimated to have occurred through provisions for loan losses. Loans deemed to be uncollectible are charged against the allowance for loan losses, and subsequent recoveries, if any, are credited to the allowance for loan losses. The allowance for loan losses is maintained at a level considered appropriate to absorb probable incurred loan losses inherent in the loan portfolio as of the reporting date.
The Bank disaggregates its loan portfolio into groups of loans with similar risk characteristics for purposes of estimating the allowance for loan losses.
The Bank’s loan groups include multi-family, commercial and industrial, owner and non-owner occupied commercial real estate, construction, residential real estate, manufactured housing, consumer, and PCI loans. The Bank further disaggregates its residential real estate portfolio into two classes based upon certain risk characteristics: first mortgage loans and home equity loans and lines of credit. The remaining loan groups are also considered classes for purposes of monitoring and assessing credit quality based on certain risk characteristics. Additionally, within each loan group the acquired loans that are accounted for under ASC 310-10 are further segregated.
The total allowance for loan losses consists of an allowance for impaired loans, a general allowance for losses, and may also include residual non-specific reserve amounts. The allowance for loan losses is maintained at a level considered adequate to provide for losses that are estimated to have been incurred. Management performs a quarterly assessment of the adequacy of the allowance for loan losses, which is based on the Bank’s past loan loss experience, known and inherent risks in the portfolio, adverse situations that may affect the borrower’s ability to repay, the estimated value of any underlying collateral, composition of the loan portfolio, current economic conditions, peer and industry data, and other relevant factors. This evaluation is inherently subjective as it requires material estimates that may be susceptible to significant revision as more information becomes available. The Bank’s current methodology for determining the allowance for loan losses is based on historical loss rates, peer and industry data, current economic conditions, risk ratings, specific allocations on loans identified as impaired, and other qualitative adjustments as considered appropriate.
The impaired loan component of the allowance for loan losses generally relates to loans for which it is probable that the Bank will be unable to collect all contractual principal and interest due. Customers analyzes certain loans in its portfolio for impairment in accordance with ASC 310-10-35. Customers' impaired loans generally include loans that have been (i) placed on non-accrual, (ii) restructured in a troubled debt restructuring, regardless of their payment status, and (iii) charged-off to their net realizable value. For such loans, an allowance is established when the (i) discounted cash flows, (ii) collateral value, or (iii) the impaired loan value is lower than the carrying value of the loan.
The general component of the allowance for loan losses covers groups of loans by loan class, including commercial loans not considered impaired, as well as smaller balance homogeneous loans, such as residential real estate, home equity loans, home equity lines of credit and other consumer loans. These pools of loans are evaluated for loss exposure based upon industry, peer or Customers' historical loss rates for each of these groups of loans. After determining the appropriate historical loss rate for each group of loans, management considers current qualitative or environmental factors that are likely to cause estimated credit losses as of the evaluation date to differ from the historical loss experience. The overall effect of these factors is recorded as an adjustment that, as appropriate, increases or decreases the historical loss rate applied to the loan group. The qualitative factors that management generally considers include the following:
|
•
|
National, regional, and local economic and business conditions, including review of changes in the unemployment rate;
|
|
•
|
Volume and severity of past due loans and classified loans;
|
|
•
|
Lending policies and procedures, including underwriting standards and historical-based loss/collection, charge-off, and recovery practices;
|
|
•
|
Nature and volume of the portfolio, including lending concentrations;
|
|
•
|
Risk ratings;
|
|
•
|
Changes in the values of collateral for collateral dependent loans;
|
|
•
|
Experience, ability, and depth of lending management and staff; and
|
|
•
|
Other external factors, such as changes in the legal, regulatory or competitive environment.
|
112
A residual reserve may be maintained to cover uncertainties that could affect management’s estimate of probable losses. The residual reserve amount reflects the margin of imprecision inherent in the underlying assumptions used in the methodologies for estimating specific and general losses in the portfolio.
Commercial and industrial loans
are underwritten after evaluating historical and projected profitability and cash flow to determine the borrower’s ability to repay their obligation as agreed. Commercial and industrial loans are made primarily based on the identified cash flow of the borrower and secondarily on the underlying collateral supporting the loan facility. Accordingly, the repayment of a commercial and industrial loan depends primarily on the creditworthiness of the borrower (and any guarantors), while liquidation of collateral is a secondary and often insufficient source of repayment.
Construction loans
are underwritten based upon a financial analysis of the developers and property owners and construction cost estimates, in addition to independent appraisal valuations. These loans rely on the value associated with the project upon completion. These cost and valuation amounts used are estimates and may be inaccurate. Construction loans generally involve the disbursement of substantial funds over a short period of time with repayment substantially dependent upon the success of the completed project. Sources of repayment of these loans would be permanent financing upon completion or sales of developed property. These loans are closely monitored by onsite inspections and are considered to be of a higher risk than other real estate loans due to their ultimate repayment being sensitive to general economic conditions, availability of long-term financing, interest rate sensitivity, and governmental regulation of real property.
Commercial real estate and multi-family loans
are subject to the underwriting standards and processes similar to commercial and industrial loans, in addition to those underwriting standards for real estate loans. These loans are viewed primarily as cash flow dependent and secondarily as loans secured by real estate. Repayment of these loans is generally dependent upon the successful operation of the property securing the loan or the principal business conducted on the property securing the loan. In addition, the underwriting considers the amount of the principal advanced relative to the property value. Commercial real estate and multi-family loans may be adversely affected by conditions in the real estate markets or the economy in general. Management monitors and evaluates commercial real estate and multi-family loans based on cash flow estimates, collateral and risk-rating criteria. The Bank also utilizes third-party experts to provide environmental and market valuations. Substantial effort is required to underwrite, monitor and evaluate commercial real estate and multi-family loans.
Residential real estate loans
are secured by one to four dwelling units. This group is further divided into first mortgage and home equity loans. First mortgages are originated at a loan to value ratio of
80%
or less. Home equity loans have additional risks as a result of typically being in a second position or lower in the event collateral is liquidated.
Manufactured housing loans
represent loans that are secured by the manufactured housing unit where the borrower may or may not own the underlying real estate and therefore have a higher risk than a residential real estate loan.
Other consumer loans
consist of loans to individuals originated through the Bank’s retail network and are typically unsecured or secured by personal property. Consumer loans have a greater credit risk than residential loans because of the difference in the underlying collateral, if any. The application of various federal and state bankruptcy and insolvency laws may limit the amount that can be recovered on such loans.
Delinquency status and other borrower characteristics are used to monitor loans and identify credit risks, and the general reserves are established based on the expected net charge-offs, adjusted for qualitative factors.
Charge-offs on commercial and industrial, construction, multi-family and commercial real estate loans are recorded when management estimates that there are insufficient cash flows to repay the contractual loan obligation based upon financial information available and valuation of the underlying collateral. Shortfalls in the underlying collateral value for loans determined to be collateral dependent are charged-off immediately.
113
The Bank also takes into account the strength of any guarantees and the ability of the borrower to provide value related to those guarantees in determining the ultimate charge-off or reserve associated with an impaired loan. Accordingly, the Bank may charge-off a loan to a value below the net appraised value if it believes that an expeditious liquidation is desirable in the circumstance and it has legitimate offers or other indications of interest to support a value that is less than the net appraised value. Alternatively, the Bank may carry a loan at a value that is in excess of the appraised value in certain circumstances, such as when the Bank has a guarantee from a borrower that the Bank believes has realizable value. In evaluating the strength of any guarantee, the Bank evaluates the financial wherewithal of the guarantor, the guarantor’s reputation, and the guarantor’s willingness and desire to work with the Bank. The Bank then conducts a review of the strength of a guarantee on a frequency established as the circumstances and conditions of the borrower warrant.
The Bank records charge-offs for residential real estate, consumer, and manufactured housing loans after
120 days
of delinquency or sooner when cash flows are determined to be insufficient for repayment. The Bank may also charge-off these loans below the net appraised valuation if the Bank holds a junior mortgage position in a piece of collateral whereby the risk to acquiring control of the property through the purchase of the senior mortgage position is deemed to potentially increase the risk of loss upon liquidation due to the amount of time to ultimately market the property and the volatile market conditions. In such cases, the Bank may abandon its junior mortgage and charge-off the loan balance in full.
Estimates of cash flows expected to be collected for purchased credit impaired loans are updated each reporting period. If the Bank estimates decreases in expected cash flows to be collected after acquisition, the Bank charges the provision for loan losses and establishes an allowance for loan losses.
Credit Quality Factors
Commercial and industrial, multi-family, commercial real estate, residential real estate and construction loans are each assigned a numerical rating of risk based on an internal risk rating system. The risk rating is assigned at loan origination and indicates management's estimate of credit quality. Risk ratings are reviewed on a periodic or “as needed” basis. Consumer and manufactured housing loans are evaluated primarily based on the payment activity of the loan. Risk ratings are not established for home equity loans, consumer loans, manufactured housing loans, and installment loans, mainly because these portfolios consist of a larger number of homogeneous loans with smaller balances. Instead, these portfolios are evaluated for risk mainly based on aggregate payment history (through the monitoring of delinquency levels and trends). For additional information about credit quality factor ratings refer to NOTE 9 – LOANS RECEIVABLE AND ALLOWANCE FOR LOAN LOSSES.
Impaired Loans
A loan is generally considered impaired when, based on current information and events, it is probable that the Bank will be unable to collect all amounts due according to the contractual terms of the loan agreement. Customers' impaired loans generally include loans that have been (i) placed on non-accrual, (ii) restructured in a troubled debt restructuring, regardless of their payment status, and (iii) charged-off to their net realizable value. Factors considered by management in determining impairment include payment status, collateral value and the probability of collecting scheduled principal and interest payments when due. Loans that experience insignificant payment delays and payment shortfalls generally are not classified as impaired. Management determines the significance of payment delays and payment shortfalls on a case-by-case basis, taking into consideration all of the circumstances surrounding the loan and the borrower, including the length of the delay, the reasons for the delay, the borrower’s prior payment record and the amount of the shortfall in relation to the principal and interest owed.
Impairment is generally measured on a loan by loan basis for commercial and construction loans by the present value of expected future cash flows discounted at the loan’s effective interest rate, the loan’s obtainable market price or the fair value of the collateral if the loan is collateral dependent. The fair value of the collateral is measured based on the value of the collateral securing the loans, less estimated costs to sell. Collateral may be in the form of real estate or business assets including equipment, inventory, and accounts receivable. The vast majority of the Bank's collateral is real estate. The value of real estate collateral is determined utilizing an income or market valuation approach based on an appraisal conducted by an independent, licensed appraiser outside of the Bank using observable market data. The value of business equipment is based upon an outside appraisal if deemed significant, or the net book value on the applicable business’ financial statements if not considered significant using observable market data. Likewise, values for inventory and accounts receivable collateral are based on financial statement balances or aging reports.
114
Goodwill and Other Intangible Assets
Goodwill represents the excess of cost over the identifiable net assets of businesses acquired. Other intangible assets represent purchased assets that lack physical substance but can be distinguished from goodwill because of contractual or other legal rights. Intangible assets that have finite lives, such as customer and university relationship intangibles and non-compete agreements, are amortized over their estimated useful lives and are subject to impairment testing. Goodwill and other intangible assets recognized as part of the Disbursement business acquisition were based on a preliminary allocation of the purchase price. In fourth quarter 2016, Customers recorded adjustments to the estimated fair values of the net assets acquired, which resulted in a
$1.0 million
increase in goodwill. For more information regarding the net assets acquired and goodwill recorded upon acquisition of the Disbursement business, see NOTE 2 - ACQUISITION ACTIVITY.
Goodwill and other intangible assets are reviewed for impairment annually as of October 31 and between annual tests when events and circumstances indicate that impairment may have occurred. Impairment of goodwill is a condition that exists when the carrying amount exceeds its implied fair value. A qualitative factor test can be performed to determine whether it is necessary to perform the two-step quantitative impairment test. If the results of the qualitative review indicate that it is unlikely (less than
50%
probability) that the carrying value of the reporting unit exceeds its fair value, no further evaluation needs to be performed.
Intangible assets subject to amortization are reviewed for impairment under ASC 360 which requires that a long-lived asset or asset group be tested for recoverability whenever events or changes in circumstances indicate that the carrying value may not be recoverable. The carrying value of a long-lived asset is not recoverable if it exceeds the sum of the undiscounted cash flows expected to result from the use and eventual disposition of the asset.
As part of its qualitative assessment, Customers reviewed regional and national trends in current and expected economic conditions, examining indicators such as GDP growth, interest rates and unemployment rates. Customers also considered its own historical performance, expectations of future performance and other trends specific to the banking industry. Based on its qualitative assessment, Customers determined that there was no evidence of impairment on the balance of goodwill and other intangible assets. As of
December 31, 2016
and
2015
, goodwill and other intangible assets totaled $
3.6 million
and
$3.7 million
, respectively, from continuing operations. Goodwill and other intangible assets acquired as part of the Disbursement business acquisition of
$14.0 million
have been subsequently reclassified and are presented in "Assets held for sale" on the consolidated balance sheets at December 31, 2016.
FHLB, Federal Reserve Bank, and other restricted stock
FHLB, Federal Reserve Bank, and other restricted stock represents required investment in the capital stock of the Federal Home Loan Bank (“FHLB”), the Federal Reserve Bank and Atlantic Central Bankers Bank and is carried at cost. Total restricted stock as of
December 31, 2016
and
2015
was
$68.4 million
and
$90.8 million
, respectively, which included
$51.3 million
and
$78.9 million
, respectively, of FHLB stock.
Other Real Estate Owned
Real estate properties acquired through, or in lieu of, loan foreclosure are initially recorded at fair value less estimated costs to sell at the date of foreclosure, establishing a new cost basis. After foreclosure, valuations are periodically performed by management and the real estate is carried at the lower of its carrying amount or fair value less estimated costs to sell. Revenue and expenses from operations and changes in the valuation allowance are included in earnings.
FDIC Loss Sharing Receivable and Clawback Liability
The FDIC loss sharing receivable was measured separately from the related covered assets because it was not contractually embedded in the assets and was not transferable if the assets were sold. The FDIC loss sharing receivable was initially recorded at fair value, based on the discounted value of expected future cash flows under the loss share agreements. The difference between the present value and the undiscounted cash flows the Bank expected to collect from the FDIC was accreted into interest income over the life of the FDIC loss sharing receivable.
115
The FDIC loss sharing receivable was reviewed quarterly and adjusted for changes in expected cash flows based on recent performance and expectations for future performance of the covered portfolio. These adjustments were measured on the same basis as the related covered assets. Increases in estimated cash flows on the covered assets reduced the FDIC loss sharing receivable and decreases in estimated cash flows on the covered assets increased the FDIC loss sharing receivable. Increases to the FDIC loss sharing receivable resulting from reduced cash flow estimates on the covered loans were recorded as a reduction to the provision for loan losses and decreases to the FDIC loss sharing receivable were recorded either as an increase to the provision for loan losses (to the extent an increase in the FDIC receivable balance was previously recorded as a reduction to the provision for loan losses) or recognized over the life of the loss share agreements. Decreases in the valuations of covered other real estate owned were recorded net of the FDIC receivable balance as an increase to other real estate owned expense (a component of non-interest expense).
The FDIC loss sharing receivable balance was reduced through a charge to the provision for loan losses, with no offsetting reduction to the allowance for loan losses, as the period to submit losses under the FDIC loss sharing agreements approached expiration and the estimated losses in the covered loans had not yet emerged or been realized in a final disposition event. The period to submit losses under the FDIC loss sharing agreements for non-single family loans expired in third quarter 2015. The period to submit losses under the FDIC loss sharing agreements for single family loans was set to expire in third quarter 2017. The final maturity of the FDIC loss sharing agreements was scheduled for third quarter 2020.
As part of the FDIC loss sharing agreements, the Bank also assumed a potential liability to be paid within
45 days
subsequent to the maturity or termination of the loss sharing agreements that was contingent upon actual losses incurred over the life of the agreements relative to expected losses and the consideration paid upon acquisition of the failed institutions. Due to cash received on the covered assets in excess of the original expectations of the FDIC, the Bank anticipated that it would be required to pay the FDIC at the end of its loss sharing agreements.
On July 11, 2016, Customers entered into an agreement to terminate all existing rights and obligations pursuant to the loss sharing agreements with the FDIC. In connection with the termination agreement, Customers paid the FDIC
$1.4 million
as final payment under these agreements. The negotiated settlement amount was based on net losses incurred on the covered assets through September 30, 2015, adjusted for cash payments to and cash receipts from the FDIC as part of the December 31, 2015 and March 31, 2016 certifications. Consequently, loans and other real estate owned previously reported as covered assets pursuant to the loss sharing agreements were no longer reported as covered assets as of June 30, 2016.
Bank-Owned Life Insurance
Bank-owned life insurance policies insure the lives of officers of the Bank, and name the Bank as beneficiary. Non-interest income is generated tax-free (subject to certain limitations) from the increase in value of the policies’ underlying investments made by the insurance company. The Bank is capitalizing on the ability to partially offset costs associated with employee compensation and benefit programs with the bank-owned life insurance.
Bank Premises and Equipment
Bank premises and equipment are recorded at cost less accumulated depreciation. Depreciation is computed on the straight-line method over the estimated useful lives of the related assets. Leasehold improvements are amortized over the shorter of the term of the lease or estimated useful life, unless extension of the lease term is reasonably assured.
Treasury Stock
Common stock purchased for treasury is recorded at cost.
Income Taxes
Customers accounts for income taxes under the liability method of accounting for income taxes. The income tax accounting guidance results in two components of income tax expense: current and deferred. Current income tax expense reflects taxes to be paid or refunded for the current period by applying the provisions of the enacted tax law to the taxable income or excess of deductions over revenues. Customers determines deferred income taxes using the liability (or balance sheet) method. Under this method, the net deferred tax asset or liability is based on the tax effects of the differences between the book and tax bases of assets and liabilities, and enacted changes in tax rates and laws are recognized in the period in which they occur.
116
A tax position is recognized if it is more likely than not, based on the technical merits, that the tax position will be realized or sustained upon examination. The term more likely than not means a likelihood of more than
50 percent
; the term upon examination includes resolution of the related appeals or litigation process. A tax position that meets the more-likely-than-not recognition threshold is initially and subsequently measured as the largest amount of tax benefit that has a greater than
50 percent
likelihood of being realized upon settlement with a taxing authority that has full knowledge of all relevant information. The determination of whether or not a tax position has met the more-likely-than-not recognition threshold considers the facts, circumstances, and information available at the reporting date and is subject to management’s judgment.
In assessing the realizability of federal or state deferred tax assets, management considers whether it is more likely than not that some portion or all of the deferred tax assets will not be realized. The ultimate realization of deferred tax assets is dependent upon the generation of future taxable income during periods in which those temporary differences become deductible. Management considers the scheduled reversal of deferred tax liabilities, projected future taxable income and prudent, feasible and permissible as well as available tax planning strategies in making this assessment. Based on the level of historical taxable income and projections for future taxable income over the periods in which the deferred tax assets are deductible as well as available tax planning strategies, management believes it is more likely than not that Customers will realize the benefits of these deferred tax assets.
Share-Based Compensation
Customers has
four
active share-based compensation plans. Share-based compensation accounting guidance requires that the compensation cost relating to share-based-payment transactions be recognized in earnings. The cost is measured based on the grant-date fair value of the equity instruments issued. The Black-Scholes model is used to estimate the fair value of stock options, while the closing market price of Customers’ common stock at the date of grant is generally used for restricted stock awards.
Compensation cost for all share-based awards is calculated and recognized over the employees’ service period, generally defined as the vesting period. For performance based awards, compensation cost is recognized over the vesting period as long as it remains probable that the performance conditions will be met. If the service or performance conditions are not met, Customers reverses previously recorded compensation expense upon forfeiture. Customers' accounting policy election is to recognize forfeitures as they occur.
In 2014, the shareholders of Customers Bancorp approved an employee stock purchase plan. Because the purchase price under the plan is
85%
of (a
15%
discount to the market price) the fair market value of a share of common stock on the first day of each quarterly subscription period, the plan is considered to be a compensatory plan under current accounting guidance. Therefore, the entire amount of the discount is recognizable compensation expense.
Segment Information
In connection with the acquisition of the Disbursement business from Higher One and the combination of that business with the BankMobile technology platform late in second quarter 2016, Customers' chief operating decision makers, our Chief Executive Officer and Board of Directors, began allocating resources and assessing performance for
two
distinct business segments, "Community Business Banking" and "BankMobile." The Community Business Banking segment is delivered predominately to commercial customers in Southeastern Pennsylvania, New York, New Jersey, Massachusetts, Rhode Island and New Hampshire through a single point of contact business model and provides liquidity to residential mortgage originators nationwide through commercial loans to mortgage companies. The BankMobile segment provides state of the art high tech digital banking and disbursement services to consumers, students, and the "under banked" nationwide. BankMobile, as a division of Customers Bank, is a full service bank that is accessible to customers anywhere and anytime through the customer's smartphone or other web-enabled device. Prior to third quarter 2016, Customers operated in
one
business segment, “Community Banking.” Additional information regarding reportable segments can be found in NOTE 25 - BUSINESS SEGMENTS.
117
Derivative Instruments and Hedging
ASC 815,
Derivatives and Hedging
(“ASC 815”), provides the disclosure requirements for derivatives and hedging activities with the intent to provide users of financial statements with an enhanced understanding of: (a) how and why an entity uses derivative instruments, (b) how the entity accounts for derivative instruments and related hedged items, and (c) how derivative instruments and related hedged items affect an entity’s financial position, financial performance, and cash flows. Further, qualitative disclosures are required that explain the objectives and strategies for using derivatives, as well as quantitative disclosures about the fair value of and gains and losses on derivative instruments, and disclosures about credit-risk-related contingent features in derivative instruments.
As required by ASC 815, Customers records all derivatives on the balance sheet at fair value. The accounting for changes in the fair value of derivatives depends on the intended use of the derivative, whether Customers has elected to designate a derivative in a hedging relationship and apply hedge accounting and whether the hedging relationship has satisfied the criteria necessary to apply hedge accounting. Derivatives designated and qualifying as a hedge of the exposure to changes in the fair value of an asset, liability, or firm commitment attributable to a particular risk, such as interest rate risk, are considered fair value hedges. Derivatives designated and qualifying as a hedge of the exposure to variability in expected future cash flows, or other types of forecasted transactions, are considered cash flow hedges. Derivatives may also be designated as hedges of the foreign currency exposure of a net investment in a foreign operation. Hedge accounting generally provides for the matching of the timing of gain or loss recognition on the hedging instrument with the recognition of the changes in the fair value of the hedged asset or liability that are attributable to the hedged risk in a fair value hedge or the earnings effect of the hedged forecasted transactions in a cash flow hedge. Customers may enter into derivative contracts that are intended to economically hedge certain of its risks, even though hedge accounting does not apply or Customers elects not to apply hedge accounting.
Prior to first quarter 2014, none of Customers' financial derivatives were designated in qualifying hedge relationships in accordance with the applicable accounting guidance. As such, all changes in fair value of the financial derivatives were recognized directly in earnings. In March 2014, Customers entered into a
$150.0 million
notional balance forward starting pay fixed interest rate swap to hedge the variable cash flows associated with the forecasted issuance of debt. In December 2016, Customers entered into
three
additional pay fixed interest rate swaps totaling
$175.0 million
notional balance to hedge the variable cash flows associated with the forecasted issuance of debt. Customers documented and designated these interest rate swaps as cash flow hedges. The effective portion of changes in the fair value of financial derivatives designated and qualifying as cash flow hedges is recorded in Accumulated Other Comprehensive Income and is subsequently reclassified into earnings in the period that the hedged forecasted transaction affects earnings. The ineffective portion of the change in fair value of the financial derivatives is recognized directly in earnings. Amounts reported in accumulated other comprehensive income related to financial derivatives will be reclassified to interest expense as interest payments are made on Customers' variable-rate debt. As of
December 31, 2016
, Customers had
four
financial derivatives designated in qualifying hedge relationships with a current notional balance of
$325.0 million
.
Customers has also purchased and sold credit derivatives to either hedge or participate in the performance risk associated with some of its counterparties. These derivatives were not designated in hedge relationships for accounting purposes and are being recorded at their fair value, with fair value changes recorded directly in earnings. At December 31, 2016, Customers had an outstanding notional balance of credit derivatives of
$44.9 million
.
In accordance with the FASB’s fair value measurement guidance, Customers made an accounting policy election to measure the credit risk of its derivative financial instruments that are subject to master netting agreements on a net basis by counterparty portfolio.
Comprehensive Income
Comprehensive income (loss) consists of net income (loss) and other comprehensive income (loss). Other comprehensive income includes changes in unrealized gains and losses on securities available for sale arising during the period and reclassification adjustments for realized gains and losses on securities available for sale included in net income. Unrealized gains and losses on securities available for sale include a component for unrealized changes in foreign currency exchange rates relating to Customers’ investment in certain foreign equity securities. Other comprehensive income also includes the effective portion of changes in fair value of financial derivatives designated and qualifying as cash flow hedges. Cash flow hedge amounts classified as comprehensive income are subsequently reclassified into earnings in the period that the hedged forecasted transaction affects earnings.
118
Earnings per Share
Basic earnings per share represents net income divided by the weighted-average number of common shares outstanding during the period. Diluted earnings per share includes all potentially dilutive common shares outstanding during the period. Potential common shares that may be issued related to outstanding stock options, restricted stock units, and warrants are determined using the treasury stock method.
Recently Issued Accounting Standards and Updates
In January 2017, the Financial Accounting Standards Board ("FASB") issued Accounting Standards Update ("ASU") No. 2017-04,
Simplifying the Test for Goodwill Impairment
. To simplify the subsequent measurement of goodwill, FASB eliminated Step 2 from the goodwill impairment test. Namely, an entity had to perform procedures to determine the fair value at the impairment testing date of its assets and liabilities (including unrecognized assets and liabilities) following the procedure that would be required in determining the fair value of assets acquired and liabilities assumed in a business combination. Instead, under the amendments in this ASU, an entity should perform its annual, or interim, goodwill impairment test by comparing the fair value of a reporting unit with its carrying amount. An entity should recognize an impairment charge for the amount by which the carrying amount exceeds the reporting unit’s fair value; however, the loss recognized should not exceed the total amount of goodwill allocated to that reporting unit. Additionally, an entity should consider income tax effects from any tax deductible goodwill on the carrying amount of the reporting unit when measuring the goodwill impairment loss, if applicable. FASB also eliminated the requirements for any reporting unit with a zero or negative carrying amount to perform a qualitative assessment and, if it fails that qualitative test, to perform Step 2 of the goodwill impairment test. Therefore, the same impairment assessment applies to all reporting units. An entity is required to disclose the amount of goodwill allocated to each reporting unit with a zero or negative carrying amount of net assets. An entity still has the option to perform the qualitative assessment for a reporting unit to determine if the quantitative impairment test is necessary. The amendments in this ASU are effective for fiscal years beginning after December 15, 2019, and interim periods within those fiscal years. Customers does not expect the adoption of this ASU to have a significant impact on its financial statements and results of operations.
In January 2017, the FASB issued ASU No. 2017-01,
Clarifying the Definition of a Business
. Under current guidance, there are three elements of a business—inputs, processes, and outputs. While an integrated set of assets and activities (collectively referred to as a “set”) that is a business usually has outputs, outputs are not required to be present. In addition, all the inputs and processes that a seller uses in operating a set are not required if market participants can acquire the set and continue to produce outputs, for example, by integrating the acquired set with their own inputs and processes. The amendments in this ASU provide a criterion to determine when a set is not a business. The criterion requires that a set not be deemed to be a business when substantially all of the fair value of the gross assets acquired (or disposed of) is concentrated in a single identifiable asset or a group of similar identifiable assets. This criterion reduces the number of transactions that need to be further evaluated. If the criterion is not met, the amendments in this ASU (1) require that to be considered a business, a set must include, at a minimum, an input and a substantive process that together significantly contribute to the ability to create output and (2) remove the evaluation of whether a market participant could replace missing elements. The amendments provide a framework to assist entities in evaluating whether both an input and a substantive process are present. The amendments in this ASU are effective for annual periods beginning after December 15, 2017, including interim periods within those periods. Customers does not expect the adoption of this ASU to have a significant impact on its financial statements and results of operations.
In November 2016, the FASB issued ASU No. 2016-18,
Statement of Cash Flows Restricted Cash
. The amendments in this ASU require that a statement of cash flows explain the change during the period in the total of cash, cash equivalents, and amounts generally described as restricted cash or restricted cash equivalents. Therefore, amounts generally described as restricted cash and restricted cash equivalents should be included with cash and cash equivalents when reconciling the beginning-of-period and end-of-period total amounts shown on the statement of cash flows. The amendments in this ASU are effective for fiscal years beginning after December 15, 2017, and interim periods within those fiscal years. Customers does not expect the adoption to this ASU to have a significant impact on its financial statements and results of operations.
119
In October 2016, the FASB issued ASU No. 2016-17,
Interests Held through Related Parties That Are under Common Control
. The amendments in this ASU do not change the characteristics of a primary beneficiary under current guidance. Namely, that a primary beneficiary of a Variable Interest Entity (VIE) has: (1) the power to direct the activities of a VIE that most significantly impact the VIE’s economic performance and (2) the obligation to absorb losses of the VIE that could potentially be significant to the VIE or the right to receive benefits from the VIE that could potentially be significant to the VIE. If a reporting entity satisfies the first characteristic, (i.e. it is the single decision maker of a VIE), the amendments in this ASU require that reporting entity, in determining whether it satisfies the second characteristic of a primary beneficiary, to include all of its direct variable interests in a VIE and, on a proportionate basis, its indirect variable interests in a VIE held through related parties, including related parties that are under common control with the reporting entity. Therefore, under the amendments, a single decision maker is not required to consider indirect interests held through related parties that are under common control with the single decision maker to be the equivalent of direct interests in their entirety. Instead, a single decision maker is required to include those interests on a proportionate basis consistent with indirect interests held through other related parties.
If, after performing that assessment, a reporting entity that is the single decision maker of a VIE concludes that it does not have the characteristics of a primary beneficiary, the amendments continue to require that reporting entity to evaluate whether it and one or more of its related parties under common control, as a group, have the characteristics of a primary beneficiary. If the single decision maker and its related parties that are under common control, as a group, have the characteristics of a primary beneficiary, then the party within the related party group that is most closely associated with the VIE is the primary beneficiary.
The amendments in this ASU are effective for public business entities for fiscal years beginning after December 15, 2016, including interim periods within those fiscal years. Customers' adoption of this ASU in first quarter 2017 did not have a significant impact on its financial statements and results of operations.
In October 2016, the FASB issued ASU No. 2016-16—
Income Taxes, Intra-Entity Transfers of Assets Other Than Inventory
. This ASU requires that an entity recognize the income tax consequences of an intra-entity transfer of an asset other than inventory when the transfer occurs. Consequently, the amendments in this ASU eliminate the exception for an intra-entity transfer of an asset other than inventory. Two common examples of assets included in the scope of this ASU are intellectual property and property, plant, and equipment. Intra-entity transfers of inventory will continue to follow existing US GAAP. The amendments in this ASU do not include new disclosure requirements; however, existing disclosure requirements might be applicable when accounting for the current and deferred income taxes for an intra-entity transfer of an asset other than inventory. For public business entities, the amendments in this ASU are effective for annual reporting periods beginning after December 15, 2017, including interim reporting periods within those annual reporting periods. Early adoption is permitted for all entities as of the beginning of an annual reporting period for which financial statements (interim or annual) have not been issued or made available for issuance. Customers is currently evaluating the impact of this ASU on its financial condition, results of operations and consolidated financial statements.
In August 2016, the FASB issued ASU No. 2016-15,
Statement of Cash Flows: Classification of Certain Cash Receipts and Cash Payments
. This ASU is aimed at reducing the existing diversity in practice with regards to the following specific items in the Statement of Cash Flows:
|
1.
|
Cash payments for debt prepayment or extinguishment costs will be classified in financing activities.
|
|
2.
|
Upon settlement of zero-coupon bonds and bonds with insignificant cash coupons, the portion of the payment attributable to imputed interest will be classified as an operating activity, while the portion of the payment attributable to principal will be classified as a financing activity.
|
|
3.
|
Cash paid by an acquirer that isn’t soon after a business combination for the settlement of a contingent consideration liability will be separated between financing activities and operating activities. Cash payments up to the amount of the contingent consideration liability recognized at the acquisition date will be classified in financing activities; any excess will be classified in operating activities. Cash paid soon after the business combination will be classified in investing activities.
|
|
4.
|
Cash proceeds received from the settlement of insurance claims will be classified on the basis of the related insurance coverage (that is, the nature of the loss). Cash proceeds from lump-sum settlements will be classified based on the nature of each loss included in the settlement.
|
|
5.
|
Cash proceeds received from the settlement of bank-owned life insurance (BOLI) policies will be classified as cash inflows from investing activities. Cash payments for premiums on BOLI may be classified as cash outflows for investing, operating, or a combination of both.
|
|
6.
|
A transferor’s beneficial interest obtained in a securitization of financial assets will be disclosed as a non-cash activity, and cash received from beneficial interests will be classified in investing activities.
|
120
|
7.
|
Distributions received from equity method investees will be classified using either a cumulative earnings approach or a look-through approach as an accounting policy election.
|
The ASU contains additional guidance clarifying when an entity should separate cash receipts and cash payments and classify them into more than one class of cash flows (including when reasonable judgment is required to estimate and allocate cash flows) versus when an entity should classify the aggregate amount into one class of cash flows on the basis of predominance.
F
or public business entities, the amendments are effective for fiscal years beginning after December 15, 2017, including interim periods within those fiscal years. Customers is currently evaluating the impact of this ASU and does not expect this ASU to have a material impact on the presentation of its statement of cash flows.
In June 2016, the FASB issued ASU No. 2016-13
, Financial Instruments - Credit Losses: Measurement of Credit Losses on Financial Instruments.
This ASU requires an entity to utilize a new impairment model known as the current expected credit loss ("CECL") model to estimate lifetime expected credit loss and record an allowance that, when deducted from the amortized cost basis of the financial asset, presents the net amount expected to be collected on the financial asset. The CECL model is expected to result in earlier recognition of credit losses. The ASU also requires new disclosures for financial assets measured at amortized cost, loans, and available for sale debt securities. For public business entities, the amendments in this ASU are effective for fiscal years beginning after December 15, 2019, including interim periods within those fiscal years. Customers is currently evaluating the impact of this ASU, initiating implementation efforts across the company, and planning for loss modeling requirements consistent with lifetime expected loss estimates. The adoption of this ASU could have a material impact on Customers' financial condition, results of operations and consolidated financial statements. The extent of the impact upon adoption will likely depend on the characteristics of Customers loan portfolio and economic conditions at that date.
In March 2016, the FASB issued ASU No. 2016-09
, Compensation - Stock Compensation: Improvements to Employee Share-Based Payment Accounting.
The FASB issued this ASU as part of its initiative to reduce complexity in accounting standards. The areas for simplification in this ASU involve several aspects of the accounting for employee share-based payment transactions, including the income tax consequences, classification of awards as either equity or liabilities, and classification on the statement of cash flows. Some areas for simplification apply only to non-public entities. For public business entities, the amendments are effective for annual periods beginning after December 15, 2016, and interim periods within those annual periods. In addition, the amendments in this ASU eliminate the guidance in Topic 718 that was indefinitely deferred shortly after the issuance of FASB Statement No. 123 (revised 2004),
Share-Based Payment.
In fourth quarter 2016, Customers elected to early-adopt this ASU and has retroactively applied the guidance effective as of January 1, 2016. As a result of the early adoption, Customers recognized excess tax benefits as a reduction of income tax expense of
$4.1 million
for the year ended
December 31, 2016
, which would have been recognized as an increase in additional paid in capital prior to the adoption. The adoption of the ASU resulted in an increase in weighted average diluted shares of
559,209
for the year ended December 31, 2016 as excess tax benefits are no longer included in assumed proceeds when determining diluted shares outstanding under the treasury method. Customers adopted the amendments to presentation requirements for the statement of cash flows on a prospective basis and the impact of adopting these amendments was not material.
The following tables provide a summary of the quarterly impact of the adoption of ASU 2016-09 on current and previously reported financial statements and results of operations:
|
Quarter ended
September 30, 2016
|
Quarter ended
June 30, 2016
|
Quarter ended
March 31, 2016
|
||||||||||||||||||
|
(amounts in thousands, except share and per share amounts)
|
As Previously Reported
|
As Reported Under New Guidance
|
As Previously Reported
|
As Reported Under New Guidance
|
As Previously Reported
|
As Reported Under New Guidance
|
||||||||||||||
|
Statement of income
|
||||||||||||||||||||
|
Provision for income taxes
|
$
|
14,576
|
|
$
|
14,558
|
|
$
|
13,016
|
|
$
|
12,964
|
|
$
|
9,537
|
|
$
|
9,051
|
|
||
|
Net income
|
21,189
|
|
21,207
|
|
19,430
|
|
19,483
|
|
17,699
|
|
18,184
|
|
||||||||
|
Net income available to common shareholders
|
18,637
|
|
18,655
|
|
17,368
|
|
17,421
|
|
16,413
|
|
16,898
|
|
||||||||
|
Basic earnings per share
|
$
|
0.68
|
|
$
|
0.68
|
|
$
|
0.64
|
|
$
|
0.64
|
|
$
|
0.61
|
|
$
|
0.63
|
|
||
|
Diluted earnings per share
|
$
|
0.64
|
|
$
|
0.63
|
|
$
|
0.60
|
|
$
|
0.59
|
|
$
|
0.57
|
|
$
|
0.58
|
|
||
|
Weighted-average number of common shares - diluted
|
29,149,734
|
|
29,697,207
|
|
28,971,040
|
|
29,504,329
|
|
28,783,101
|
|
29,271,255
|
|
||||||||
121
In March 2016, the FASB issued ASU No. 2016-07,
Investments - Equity Method and Joint Ventures.
To simplify the accounting for equity method investments, the amendments in the ASU eliminate the requirement in Topic 323,
Investments - Equity Method and Joint Venture
, that an entity retroactively adopt the equity method of accounting if an investment qualifies for use of the equity method as a result of an increase in the level of ownership or degree of influence. The amendments require that the equity method investor add the cost of acquiring the additional interest in the investee to the current basis of the investor’s previously held interest and adopt the equity method of accounting as of the date the investment becomes qualified for equity method accounting. The ASU is effective for all entities for fiscal years beginning after December 15, 2016, and interim periods within those fiscal years. The adoption of this ASU in first quarter 2017did not have a significant impact on Customers' financial condition or results of operations.
In March 2016, the FASB issued ASU No. 2016-06,
Derivatives and Hedging: Contingent Put and Call Options in Debt Instruments.
Topic 815,
Derivatives and Hedging
, requires that embedded derivatives be separated from the host contract and accounted for separately as derivatives if certain criteria are met, including the “clearly and closely related” criterion. The amendments in this ASU clarify the requirements for assessing whether contingent call (put) options that can accelerate the payment of principal on debt instruments are clearly and closely related to their debt hosts. An entity performing the assessment under the amendments is required to assess the embedded call (put) options solely in accordance with the four-step decision sequence. Namely, this decision sequence requires that an entity consider whether:
|
1.
|
the payoff is adjusted based on changes in an index;
|
|
2.
|
the payoff is indexed to an underlying other than interest rates or credit risk;
|
|
3.
|
the debt involves a substantial premium or discount; and
|
|
4.
|
the call (put) option is contingently exercisable.
|
The amendments apply to all entities that are issuers of or investors in debt instruments (or hybrid financial instruments that are determined to have a debt host) with embedded call (put) options. For public business entities, the amendments are effective for financial statements issued for fiscal years beginning after December 15, 2016, and interim periods within those fiscal years. The adoption of this ASU in first quarter 2017 did not have a significant impact on Customers' financial condition or results of operations.
In March 2016, the FASB issued ASU No. 2016-05,
Derivatives and Hedging: Effect of Derivative Contract Novations on Existing Hedge Accounting Relationships
. The term novation refers to replacing one counterparty to a derivative instrument with a new counterparty. That change occurs for a variety of reasons, including financial institution mergers, intercompany transactions, an entity exiting a particular derivatives business or relationship, an entity managing against internal credit limits, or in response to laws or regulatory requirements. The amendments in this ASU clarify that a change in the counterparty to a derivative instrument that has been designated as the hedging instrument under Topic 815, does not, in and of itself, require dedesignation of that hedging relationship provided that all other hedge accounting criteria continue to be met. For public business entities, the amendments are effective for financial statements issued for fiscal years beginning after December 15, 2016, and interim periods within those fiscal years. The adoption of this ASU in first quarter 2017 did not have a significant impact on Customers' financial condition or results of operations.
In March 2016, the FASB issued ASU No. 2016-04,
Liabilities - Extinguishments of Liabilities: Recognition of Breakage for Certain Prepaid Stored-Value Products
. When an entity sells a prepaid stored-value product (such as gift cards, telecommunication cards, and traveler’s checks), it recognizes a financial liability for its obligation to provide the product holder with the ability to purchase goods or services at a third-party merchant. When a prepaid stored-value product goes unused wholly or partially for an indefinite time period, the amount that remains on the product is referred to as breakage. There currently is diversity in the methodology used to recognize breakage. Subtopic 405-20,
Extinguishment of Liabilities
, includes derecognition guidance for both financial liabilities and nonfinancial liabilities, and Topic 606,
Revenue from Contracts
with Customers, includes authoritative breakage guidance but excludes financial liabilities. The amendments in this ASU provide a narrow scope exception to the guidance in Subtopic 405-20 to require that breakage be accounted for consistent with the breakage guidance in Topic 606. For public business entities, the amendments are effective for financial statements issued for fiscal years beginning after December 15, 2017, and interim periods within those fiscal years. Customers does not expect the adoption of this ASU to have a significant impact on its financial condition or results of operations.
122
In February 2016, the FASB issued ASU No. 2016-02,
Leases.
From the lessee's perspective, the new standard establishes a right-of-use (ROU) model that requires a lessee to record a ROU asset and a lease liability on the balance sheet for all leases with terms longer than 12 months. Leases will be classified as either finance or operating, with classification affecting the pattern of expense recognition in the income statement for a lessee. From the lessor's perspective, the new standard requires a lessor to classify leases as either sales-type, finance or operating. A lease will be treated as a sale if it transfers all of the risks and rewards, as well as control of the underlying asset, to the lessee. If risks and rewards are conveyed without the transfer of control, the lease is treated as a financing. If the lessor doesn’t convey risks and rewards or control, an operating lease results. The new standard is effective for fiscal years beginning after December 15, 2018, including interim periods within those fiscal years. A modified retrospective transition approach is required for lessees for capital and operating leases existing at, or entered into after, the beginning of the earliest comparative period presented in the financial statements, with certain practical expedients available. A modified retrospective transition approach is required for lessors for sales-type, direct financing, and operating leases existing at, or entered into after, the beginning of the earliest comparative period presented in the financial statements, with certain practical expedients available. Customers is currently evaluating the impact of this ASU on its financial condition and results of operations and expects to recognize right-of-use assets and lease liabilities for substantially all of its operating lease commitments disclosed in NOTE 10 - BANK PREMISES AND EQUIPMENT based on the present value of unpaid lease payments as of the date of adoption.
In January 2016, the FASB issued ASU No. 2016-01,
Financial Instruments - Overall.
The guidance in this ASU among other things, (1) requires equity investments with certain exceptions, to be measured at fair value with changes in fair value recognized in net income, (2) simplifies the impairment assessment of equity investments without readily determinable fair values by requiring a qualitative assessment to identify impairment, (3) eliminates the requirement for public businesses entities to disclose the methods and significant assumptions used to estimate the fair value that is required to be disclosed for financial instruments measured at amortized cost on the balance sheet, (4) requires public business entities to use the exit price notion when measuring the fair value of financial instruments for disclosure purposes, (5) requires an entity to present separately in other comprehensive income the portion of the change in fair value of a liability resulting from a change in the instrument-specific credit risk when the entity has elected to measure the liability at fair value in accordance with the fair value option for financial instruments, (6) requires separate presentation of financial assets and financial liabilities by measurement category and form of financial asset on the balance sheet or the accompanying notes to the financial statements and (7) clarifies that an entity should evaluate the need for a valuation allowance on a deferred tax asset related to available-for-sale securities. The guidance in this ASU is effective for fiscal years beginning after December 15, 2017, including interim periods within those fiscal years. Customers does not expect the adoption of this ASU to have a significant impact on its financial condition or results of operations.
In November 2015, the FASB issued ASU No. 2015-17,
Income Taxes
. The amendments in this ASU, which will align the presentation of deferred income tax assets and liabilities with International Financial Reporting Standards (IFRS), require that deferred tax liabilities and assets be classified as non-current in a classified statement of financial position. The amendments in this ASU apply to all entities that present a classified statement of financial position. The current requirement that deferred tax liabilities and assets of a tax-paying component of an entity be offset and presented as a single amount is not affected by the amendments in this ASU. The amendments in this ASU were effective for financial statements issued for annual periods beginning after December 15, 2016, and interim periods within those annual periods. The adoption of this ASU in first quarter 2017 did not have a significant impact on Customers' financial condition or results of operations.
In September 2015, the FASB issued ASU No. 2015-16,
Simplifying the Accounting for Measurement-Period Adjustments
. To simplify the accounting for adjustments made to provisional amounts recognized in a business combination, the guidance in this ASU eliminates the requirement to retrospectively account for those adjustments and requires an entity to present separately on the face of the income statement or disclose in the notes the portion of the amount recorded in current-period earnings by line item that would have been recorded in previous reporting periods if the adjustment to the provisional amounts had been recognized as of the acquisition date. The guidance in this ASU was effective for fiscal years beginning after December 15, 2015, including interim periods within those fiscal years and should be applied prospectively to adjustment to provisional amounts that occur after the effective date of this ASU. The adoption of this ASU in first quarter 2016 did not have a significant impact on Customers' financial condition or results of operations.
In April 2015 and August 2015, the FASB issued ASU 2015-03,
Simplifying the Presentation of Debt Issuance Costs
and ASU
2015-15,
Presentation and Subsequent Measurement of Debt Issuance Costs Associated with Line-of-Credit Arrangements- Amendments to SEC Paragraphs Pursuant to Staff Announcement at June 18, 2015 EITF Meeting,
respectively
.
The guidance in these ASUs is intended to simplify the presentation of debt issuance costs, and requires that debt issuance costs related to a recognized debt liability be presented in the balance sheet as a direct deduction from the carrying amount of the debt liability consistent with debt discounts and is applicable on a retrospective basis. The guidance in these ASUs was effective for interim and annual periods beginning after December 15, 2015. The adoption of these ASUs on January 1, 2016 resulted in a
123
reclassification adjustment, which reduced "Other borrowings" by
$1.8 million
and "Subordinated debt" by
$1.3 million
, with a corresponding decrease in "Other assets" of
$3.1 million
as of December 31, 2015.
In February 2015, the FASB issued ASU No. 2015-02,
Amendments to the Consolidation Analysis.
The guidance in this ASU affects reporting entities that must determine whether they should consolidate certain legal entities. This ASU modifies the evaluation of whether limited partnerships or similar legal entities are variable interest entities (VIEs) or voting interest entities, eliminates the presumption that a general partner should consolidate a limited partnership and affects the consolidation analysis of reporting entities that are involved with VIEs, particularly those that have fee arrangements and related party relationships. The guidance in this ASU was effective for annual and interim periods beginning after December 15, 2015. The adoption of this ASU in first quarter 2016 did not have an impact on Customers' financial condition or results of operations.
In January 2015, the FASB issued ASU No. 2015-01,
Income Statement - Extraordinary and Unusual Items (Subtopic 225-20)Simplifying Income Statement Presentation by Eliminating the Concept of Extraordinary Items.
The guidance in this ASU was issued as part of the FASB's initiative to reduce complexity in accounting standards and eliminates from GAAP the concept of extraordinary items. The guidance in this update is effective for fiscal years and interim periods within those fiscal years beginning after December 15, 2015. The adoption of this ASU in first quarter 2016 did not have an impact on Customers' financial condition or results of operations.
In November 2014, the FASB issued ASU No. 2014-16,
Derivatives and Hedging: Determining Whether the Host contract in a Hybrid Financial Instrument in the Form of a Share is More Akin to Debt or to Equity.
The guidance in this ASU requires entities that issue or invest in a hybrid financial instrument to separate an embedded derivative feature from a host contract and account for the feature as a derivative. In the case of derivatives embedded in a hybrid financial instrument that is issued in the form of a share, that criterion requires evaluating whether the nature of the host contract is more akin to debt or to equity and whether the economic characteristics and risks of the embedded derivative feature are clearly and closely related to the host contract. If the host contract is akin to equity, then equity-like features (for example, a conversion option) are considered clearly and closely related to the host contract and, thus, would not be separated from the host contract. If the host contract is akin to debt, then equity-like features are not considered clearly and closely related to the host contract. In the latter case, an entity may be required to separate the equity-like embedded derivative feature from the debt host contract if certain other criteria in Subtopic 815-15 are met. Similarly, debt-like embedded derivative features may require separate accounting from an equity-like host contract. The guidance in this ASU is effective for fiscal years, and interim periods within those fiscal years, beginning after December 15, 2015. The adoption of this ASU in first quarter 2016 did not have an impact on Customers' financial condition or results of operations.
In August 2014, the FASB issued ASU No. 2014-13
, Consolidation: Measuring the Financial Assets and the Financial Liabilities of a Consolidated Collateralized Financing Entity.
The guidance in this ASU applies to a reporting entity that is required to consolidate a collateralized financing entity under the Variable Interest Entities guidance when: (1) the reporting entity measures all of the financial assets and the financial liabilities of that consolidated collateralized financing entity at fair value in the consolidated financial statements based on other Codification Topics; and (2) the changes in the fair values of those financial assets and financial liabilities are reflected in earnings. The guidance in this ASU was effective in first quarter 2016. The adoption of this ASU did not have an impact on Customers' financial condition or results of operations.
In June 2014, the FASB issued ASU No. 2014-12,
Compensation-Stock Compensation
. The guidance in this ASU requires that a performance target that affects vesting and that could be achieved after the requisite service period is treated as a performance condition. As such, the performance target should not be reflected in estimating the grant-date fair value of the award. Compensation cost should be recognized in the period in which it becomes probable that the performance target will be achieved and should represent the compensation cost attributable to the period(s) for which the requisite has already been rendered. If the performance target becomes probable of being achieved before the end of the requisite period, the remaining unrecognized cost should be recognized prospectively over the remaining requisite service period. The total amount of compensation cost recognized during and after the requisite service period should reflect the number of awards that are expected to vest and should be adjusted to reflect those awards that ultimately vest. The requisite service period ends when the employee can cease rendering service and still be eligible to vest in the award if the performance target is achieved. As indicated in the definition of vest, the stated vesting period (which includes the period in which the performance target could be achieved) may differ from the requisite service period. The guidance in this ASU was effective in first quarter 2016. The adoption of this ASU did not have an impact on Customers' financial condition or results of operations.
In May 2014, the FASB issued ASU No. 2014-09,
Revenue from Contracts with Customers
. This ASU establishes a comprehensive revenue recognition standard for virtually all industries following U.S. GAAP, including those that previously followed industry-specific guidance such as the real estate and construction industries. The revenue standard’s core principal is built on the contract between a vendor and a customer for the provision of goods and services. It attempts to depict the exchange of rights and obligations between the parties in the pattern of revenue recognition based on the consideration to which
124
the vendor is entitled. To accomplish this, the standard requires five basic steps: (i) identify the contract with the customer, (ii) identify the performance obligations in the contract, (iii) identify the transaction price, (iv) allocate the transaction price to the performance obligations in the contract, and (v) recognize revenue when (or as) the entity satisfies the performance obligation. Three basic transition methods are available - full retrospective, retrospective with certain practical expedients, and a cumulative effect approach. Under the cumulative effect alternative, an entity would apply the new revenue standard only to contracts that are incomplete under legacy U.S. GAAP at the date of initial application and recognize the cumulative effect of the new standard as an adjustment to the opening balance of retained earnings.
In August 2015, the FASB issued ASU No. 2015-14,
Revenue from
Contracts with Customers: Deferral of the Effective Date
. The guidance in this ASU is now effective for annual reporting periods beginning after December 15, 2017, including interim reporting periods within that reporting period.
In March 2016, the FASB issued ASU No. 2016-08,
Revenue from Contracts with Customers: Principal versus Agent Considerations (Reporting Revenue Gross versus Net
). While the ASU does not change the core provisions of Topic 606, it clarifies the implementation guidance on principal versus agent considerations. Namely, the ASU clarifies and offers guidance to help determine when the reporting entity is providing goods or services to a customer itself (i.e., the entity is a principal), or merely arranging for that good or service to be provided by the other party (i.e., the reporting entity is an agent). If the entity is a principal, it recognizes revenue in the gross amount of consideration to which it expects to be entitled in exchange for the specified good or service transferred to the customer. When the reporting entity is an agent, it recognizes revenue in the amount of any fee or commission to which it expects to be entitled in exchange for arranging for the specified good or service to be provided by the other party. An entity is a principal if it controls the specified good or service before that good or service is transferred to a customer. The guidance includes indicators to assist in determining whether the control criteria are met. If a contract with a customer includes more than one specified good or service, an entity could be a principal for some specified goods or services and an agent for others.
In April 2016, the FASB issued ASU No. 2016-10
, Revenue from Contracts with Customers: Identifying Performance Obligations and Licensing.
This ASU clarifies guidance related to identifying performance obligations and licensing implementation guidance contained in the new revenue recognition standard. The ASU includes targeted improvements based on input the FASB received from the Transition Resource Group for Revenue Recognition and other stakeholders. The ASU seeks to proactively address areas in which diversity in practice potentially could arise, as well as to reduce the cost and complexity of applying certain aspects of the guidance both at implementation and on an ongoing basis. The amendments in this ASU affect the guidance in ASU 2014-09, Revenue from Contracts with Customers, which will be effective for fiscal years beginning after December 31, 2017 for public entities.
In May 2016, the FASB issued ASU No. 2016-12
, Revenue from Contracts with Customers: Narrow-Scope Improvements and Practical Expedients.
This ASU clarifies certain aspects of Topic 606 guidance as follows:
|
•
|
The objective of the collectibility assessment is to determine whether the contract is valid and represents a substantive transaction on the basis of whether a customer has the ability and intention to pay the promised consideration in exchange for the goods or services transferred.
|
|
•
|
An entity can recognize revenue in the amount of consideration received when it has transferred control of the goods or services, has no additional obligation to transfer goods or services, and the consideration received is nonrefundable.
|
|
•
|
A reporting entity is permitted to make the accounting policy election to exclude amounts collected from customers for all sales taxes from the transaction price.
|
|
•
|
The measurement date is specified as being the contract inception, and variable consideration guidance applies only to variability resulting from reasons other than the form of the consideration.
|
|
•
|
As a practical expedient, a reporting entity is permitted to reflect the aggregate effect of all modifications that occur before the beginning of the earliest period presented in accordance with Topic 606 when identifying the satisfied and unsatisfied performance obligations, determining the transaction price, and allocating the transaction price to the satisfied and unsatisfied performance obligations.
|
125
|
•
|
The ASU clarifies that a completed contract for purposes of transition is a contract for which all (or substantially all) of the revenue was recognized under legacy GAAP before the date of initial application. Accounting for elements of a contract that do not affect revenue under legacy GAAP are irrelevant to the assessment of whether a contract is complete. In addition, the amendments in this ASU permit an entity to apply the modified retrospective transition method either to all contracts or only to contracts that are not completed contracts.
|
The amendments in this ASU clarify that an entity that retrospectively applies the guidance in Topic 606 to each prior reporting period is not required to disclose the effect of the accounting change for the period of adoption. However, an entity is still required to disclose the effect of the changes on any prior periods retrospectively adjusted.
The guidance in the revenue recognition ASUs listed above is effective for annual reporting periods beginning after December 15, 2017, including interim reporting periods within that reporting period. Customers is currently evaluating the impact of the various revenue recognition ASUs. The guidance does not apply to revenue associated with financial instruments, including loans and securities. Customers is currently evaluating its non-interest revenue sources and does not anticipate the adoption of these ASUs to have a material impact on its financial condition or results of operations.
The following are the components and results of the Bancorp’s earnings per share ("EPS") calculation for the periods presented.
|
For the Years Ended
|
|||||||||||
|
|
December 31,
|
||||||||||
|
|
2016
|
2015
|
2014
|
||||||||
|
(amounts in thousands, except share and per share data)
|
|||||||||||
|
Net income from continuing operations available to common shareholders (1)
|
$
|
78,192
|
|
$
|
60,580
|
|
$
|
44,532
|
|
||
|
Net loss from discontinued operations
|
(9,005
|
)
|
(4,490
|
)
|
(1,318
|
)
|
|||||
|
Net income available to common shareholders
|
$
|
69,187
|
|
$
|
56,090
|
|
$
|
43,214
|
|
||
|
Weighted-average number of common shares outstanding – basic
|
27,596,020
|
|
26,844,545
|
|
26,719,626
|
|
|||||
|
Share-based compensation plans
|
2,221,517
|
|
1,516,297
|
|
968,671
|
|
|||||
|
Warrants
|
196,113
|
|
324,097
|
|
250,707
|
|
|||||
|
Weighted-average number of common shares – diluted
|
30,013,650
|
|
28,684,939
|
|
27,939,004
|
|
|||||
|
Basic earnings per common share from continuing operations
|
$
|
2.83
|
|
$
|
2.26
|
|
$
|
1.67
|
|
||
|
Basic loss per common share from discontinued operations
|
$
|
(0.33
|
)
|
$
|
(0.17
|
)
|
$
|
(0.05
|
)
|
||
|
Basic earnings per common share
|
$
|
2.51
|
|
$
|
2.09
|
|
$
|
1.62
|
|
||
|
Diluted earnings per common share from continuing operations
|
$
|
2.61
|
|
$
|
2.11
|
|
$
|
1.59
|
|
||
|
Diluted loss per share from discontinued operations
|
$
|
(0.30
|
)
|
$
|
(0.16
|
)
|
$
|
(0.05
|
)
|
||
|
Diluted earnings per common share
|
$
|
2.31
|
|
$
|
1.96
|
|
$
|
1.55
|
|
||
|
(1) Net income from continuing operations, net of preferred stock dividends
|
|||||||||||
The following is a summary of securities that could potentially dilute basic EPS in the future that were not included in the computation of diluted EPS because to do so would have been anti-dilutive for the periods presented.
|
For the Years Ended
|
||||||||
|
|
December 31,
|
|||||||
|
|
2016
|
2015
|
2014
|
|||||
|
Anti-dilutive securities:
|
||||||||
|
Share-based compensation awards
|
894,720
|
|
606,095
|
|
135,861
|
|
||
|
Warrants
|
52,242
|
|
52,242
|
|
118,745
|
|
||
|
Total anti-dilutive securities
|
946,962
|
|
658,337
|
|
254,606
|
|
||
126
The following tables present the changes in accumulated other comprehensive income (loss) by component for the years ended
December 31, 2016
and
2015
.
|
Available-for-sale Securities
|
||||||||||||||||||||
|
Total
|
||||||||||||||||||||
|
Unrealized
|
Foreign
|
Unrealized
|
Unrealized
|
|||||||||||||||||
|
Gains
|
Currency
|
Gains
|
Loss on Cash
|
|||||||||||||||||
|
(amounts in thousands)
|
(Losses) (2)
|
Items
|
(Losses)
|
Flow Hedge
|
Total
|
|||||||||||||||
|
Balance, December 31, 20
14
|
$
|
1,142
|
|
$
|
—
|
|
$
|
1,142
|
|
$
|
(1,264
|
)
|
$
|
(122
|
)
|
|||||
|
Current period:
|
||||||||||||||||||||
|
Other comprehensive loss before
|
||||||||||||||||||||
|
reclassifications
|
(5,797
|
)
|
(584
|
)
|
(6,381
|
)
|
(1,534
|
)
|
(7,915
|
)
|
||||||||||
|
Amounts reclassified from accumulated other
|
||||||||||||||||||||
|
comprehensive income to net income (2)
|
53
|
|
—
|
|
53
|
|
—
|
|
53
|
|
||||||||||
|
Net current-period other comprehensive loss
|
(5,744
|
)
|
(584
|
)
|
(6,328
|
)
|
(1,534
|
)
|
(7,862
|
)
|
||||||||||
|
Balance, December 31, 2015
|
(4,602
|
)
|
(584
|
)
|
(5,186
|
)
|
(2,798
|
)
|
(7,984
|
)
|
||||||||||
|
Current period:
|
||||||||||||||||||||
|
Other comprehensive loss before
|
||||||||||||||||||||
|
reclassifications
|
(1,872
|
)
|
(146
|
)
|
(2,018
|
)
|
(629
|
)
|
(2,647
|
)
|
||||||||||
|
Amounts reclassified from accumulated other
|
||||||||||||||||||||
|
comprehensive income to net income (2)
|
3,793
|
|
730
|
|
4,523
|
|
1,216
|
|
5,739
|
|
||||||||||
|
Net current-period other comprehensive income
|
1,921
|
|
584
|
|
2,505
|
|
587
|
|
3,092
|
|
||||||||||
|
Balance, December 31, 2016
|
$
|
(2,681
|
)
|
$
|
—
|
|
$
|
(2,681
|
)
|
$
|
(2,211
|
)
|
$
|
(4,892
|
)
|
|||||
(1) All amounts are presented net of tax. Amounts in parentheses indicate reductions to accumulated other comprehensive income.
(2) Reclassification amounts for available-for-sale securities are reported as gain or loss on sale of investment securities or impairment loss on investment securities on the consolidated statements of income. During the year ended December 31, 2016, Customers reclassified
$3.8 million
of unrealized losses and
$25 thousand
of unrealized gains as impairment loss on investment securities and gain (loss) on sale of investment securities, respectively, on the consolidated statements of income. Reclassification amounts for cash flow hedges are reported as interest expense on FHLB advances on the consolidated statements of income.
127
The amortized cost and approximate fair value of investment securities as of
December 31, 2016
and
2015
are summarized as follows:
|
|
December 31, 2016
|
||||||||||||||
|
|
Amortized
Cost
|
Gross
Unrealized
Gains
|
Gross
Unrealized
Losses
|
Fair Value
|
|||||||||||
|
(amounts in thousands)
|
|||||||||||||||
|
Available for Sale:
|
|||||||||||||||
|
Agency-guaranteed residential mortgage-backed securities
|
$
|
233,002
|
|
$
|
918
|
|
$
|
(2,657
|
)
|
$
|
231,263
|
|
|||
|
Agency-guaranteed commercial real estate mortgage-backed securities
|
204,689
|
|
—
|
|
(2,872
|
)
|
201,817
|
|
|||||||
|
Corporate notes (1)
|
44,932
|
|
401
|
|
(185
|
)
|
45,148
|
|
|||||||
|
Equity securities (2)
|
15,246
|
|
—
|
|
—
|
|
15,246
|
|
|||||||
|
Total
|
$
|
497,869
|
|
$
|
1,319
|
|
$
|
(5,714
|
)
|
$
|
493,474
|
|
|||
|
(1)
|
Includes subordinated debt issued by other bank holding companies.
|
|
(2)
|
Includes equity securities issued by a foreign entity.
|
|
|
December 31, 2015
|
||||||||||||||
|
|
Amortized
Cost
|
Gross
Unrealized
Gains
|
Gross
Unrealized
Losses
|
Fair Value
|
|||||||||||
|
(amounts in thousands)
|
|||||||||||||||
|
Available for Sale:
|
|||||||||||||||
|
Agency-guaranteed residential mortgage-backed securities
|
$
|
299,392
|
|
$
|
1,453
|
|
$
|
(2,741
|
)
|
$
|
298,104
|
|
|||
|
Agency-guaranteed commercial real estate mortgage-backed securities
|
206,719
|
|
—
|
|
(3,849
|
)
|
202,870
|
|
|||||||
|
Corporate notes (1)
|
39,925
|
|
320
|
|
(178
|
)
|
40,067
|
|
|||||||
|
Equity securities (2)
|
22,514
|
|
—
|
|
(3,302
|
)
|
19,212
|
|
|||||||
|
Total
|
$
|
568,550
|
|
$
|
1,773
|
|
$
|
(10,070
|
)
|
$
|
560,253
|
|
|||
|
(1)
|
Includes subordinated debt issued by other bank holding companies.
|
|
(2)
|
Consists primarily of equity securities issued by a foreign entity.
|
The following table shows proceeds from the sale of available-for-sale investment securities, gross gains, and gross losses on those sales of securities:
|
|
For the Years Ended December 31,
|
||||||||||
|
|
2016
|
2015
|
2014
|
||||||||
|
(amounts in thousands)
|
|||||||||||
|
Proceeds from sale of available-for-sale investment securities
|
$
|
2,852
|
|
$
|
806
|
|
$
|
213,249
|
|
||
|
Gross gains
|
$
|
26
|
|
$
|
—
|
|
$
|
3,191
|
|
||
|
Gross losses
|
(1
|
)
|
(85
|
)
|
—
|
|
|||||
|
Net gains (losses)
|
$
|
25
|
|
$
|
(85
|
)
|
$
|
3,191
|
|
||
These gains and losses were determined using the specific identification method and were included in non-interest income.
128
The following table shows debt investment securities by stated maturity. Investment securities backed by mortgages have expected maturities that differ from contractual maturities because borrowers have the right to call or prepay, and are, therefore, classified separately with no specific maturity date:
|
|
December 31, 2016
|
||||||
|
|
Available for Sale
|
||||||
|
|
Amortized
Cost
|
Fair
Value
|
|||||
|
(amounts in thousands)
|
|||||||
|
Due in one year or less
|
$
|
—
|
|
$
|
—
|
|
|
|
Due after one year through five years
|
—
|
|
—
|
|
|||
|
Due after five years through ten years
|
37,932
|
|
38,237
|
|
|||
|
Due after ten years
|
7,000
|
|
6,911
|
|
|||
|
Agency-guaranteed residential mortgage-backed securities
|
233,002
|
|
231,263
|
|
|||
|
Agency-guaranteed commercial mortgage-backed securities
|
204,689
|
|
201,817
|
|
|||
|
Total debt securities
|
$
|
482,623
|
|
$
|
478,228
|
|
|
Gross unrealized losses and fair value of Customers' investment securities aggregated by investment category and length of time that individual securities have been in a continuous unrealized loss position were as follows:
|
|
December 31, 2016
|
||||||||||||||||||||||
|
|
Less than 12 months
|
12 months or more
|
Total
|
||||||||||||||||||||
|
|
Fair Value
|
Unrealized
Losses
|
Fair Value
|
Unrealized
Losses
|
Fair Value
|
Unrealized
Losses
|
|||||||||||||||||
|
(amounts in thousands)
|
|||||||||||||||||||||||
|
Available for Sale:
|
|||||||||||||||||||||||
|
Agency-guaranteed residential mortgage-backed securities
|
$
|
87,433
|
|
$
|
(1,330
|
)
|
$
|
30,592
|
|
$
|
(1,327
|
)
|
$
|
118,025
|
|
$
|
(2,657
|
)
|
|||||
|
Agency-guaranteed commercial mortgage-backed securities
|
201,817
|
|
(2,872
|
)
|
—
|
|
—
|
|
201,817
|
|
(2,872
|
)
|
|||||||||||
|
Corporate notes (1)
|
9,747
|
|
(185
|
)
|
—
|
|
—
|
|
9,747
|
|
(185
|
)
|
|||||||||||
|
Total
|
$
|
298,997
|
|
$
|
(4,387
|
)
|
$
|
30,592
|
|
$
|
(1,327
|
)
|
$
|
329,589
|
|
$
|
(5,714
|
)
|
|||||
|
(1)
|
Includes subordinated debt issued by other bank holding companies.
|
|
|
December 31, 2015
|
||||||||||||||||||||||
|
|
Less than 12 months
|
12 months or more
|
Total
|
||||||||||||||||||||
|
|
Fair Value
|
Unrealized
Losses
|
Fair Value
|
Unrealized
Losses
|
Fair Value
|
Unrealized
Losses
|
|||||||||||||||||
|
(amounts in thousands)
|
|||||||||||||||||||||||
|
Available for Sale:
|
|||||||||||||||||||||||
|
Agency-guaranteed residential mortgage-backed securities
|
$
|
102,832
|
|
$
|
(535
|
)
|
$
|
57,357
|
|
$
|
(2,206
|
)
|
$
|
160,189
|
|
$
|
(2,741
|
)
|
|||||
|
Agency-guaranteed commercial mortgage-backed securities
|
202,870
|
|
(3,849
|
)
|
—
|
|
—
|
|
202,870
|
|
(3,849
|
)
|
|||||||||||
|
Corporate notes (1)
|
9,748
|
|
(178
|
)
|
—
|
|
—
|
|
9,748
|
|
(178
|
)
|
|||||||||||
|
Equity securities (2)
|
19,206
|
|
(3,301
|
)
|
6
|
|
(1
|
)
|
19,212
|
|
(3,302
|
)
|
|||||||||||
|
Total
|
$
|
334,656
|
|
$
|
(7,863
|
)
|
$
|
57,363
|
|
$
|
(2,207
|
)
|
$
|
392,019
|
|
$
|
(10,070
|
)
|
|||||
|
(1)
|
Includes subordinated debt issued by other bank holding companies.
|
|
(2)
|
Consists primarily of equity securities issued by a foreign entity.
|
129
At
December 31, 2016
, there were
twenty-nine
available-for-sale investment securities in the less-than-twelve-month category and
seven
available-for-sale investment securities in the twelve-month-or-more category. The unrealized losses on the mortgage backed securities are guaranteed by government-sponsored entities and primarily relate to changes in market interest rates. All amounts are expected to be recovered when market prices recover or at maturity. Customers does not intend to sell these securities and it is not more likely than not that Customers will be required to sell the securities before recovery of the amortized cost basis.
At December 31, 2016, management evaluated its equity holdings issued by a foreign entity for other-than-temporary impairment. Because management no longer has the intent to hold these securities until a recovery in fair value, Customers recorded an other-than-temporarily impairment loss of
$7.3 million
in fourth quarter 2016 for the full amount of the decline in fair value below the cost basis. The fair value of the equity securities at December 31, 2016 of
$15.2 million
became the new cost basis of the securities.
At
December 31, 2016
and
2015
, Customers Bank had pledged investment securities aggregating
$231.3 million
and
$299.8 million
fair value, respectively, as collateral against its borrowings primarily with the FHLB and an unused line of credit with another financial institution. These counterparties do not have the ability to sell or repledge these securities.
The composition of loans held for sale as of
December 31, 2016
and
2015
was as follows:
|
|
December 31,
|
||||||
|
|
2016
|
2015
|
|||||
|
(amounts in thousands)
|
|||||||
|
Commercial loans:
|
|||||||
|
Mortgage warehouse loans at fair value
|
$
|
2,116,815
|
|
$
|
1,754,950
|
|
|
|
Multi-family loans at lower of cost or fair value
|
—
|
|
39,257
|
|
|||
|
Total commercial loans held for sale
|
2,116,815
|
|
1,794,207
|
|
|||
|
Consumer loans:
|
|||||||
|
Residential mortgage loans at fair value
|
695
|
|
2,857
|
|
|||
|
Total loans held for sale
|
$
|
2,117,510
|
|
$
|
1,797,064
|
|
|
Commercial loans held for sale consists primarily of mortgage warehouse loans. These mortgage warehouse lending transactions are subject to master repurchase agreements and are designated as held for sale and reported at fair value based on an election made to account for these loans at fair value. Pursuant to the master repurchase agreements, Customers funds the pipelines for these mortgage lenders by sending cash payments directly to the closing agents for funded loans (i.e., the purchase event) and receives proceeds directly from third party investors when the loans are sold into the secondary market (i.e., the sale event). The fair values of the mortgage warehouse loans are estimated as the amount of cash initially advanced to fund the underlying mortgage, plus accrued interest and fees, as specified in the respective agreements. The interest rates on these loans are variable and the lending transactions are short-term, with an average life of
22
days from purchase to sale. The primary goal of these lending transactions is to provide liquidity to mortgage companies.
Effective December 31, 2016, Customers transferred
$25.1 million
of multi-family loans from held for sale to loans receivable (held for investment) because the Bank no longer has the intent to sell these loans. Customers transferred these loans at their carrying value, which was lower than the estimated fair value at the time of transfer.
Effective September 30, 2015, Customers transferred
$30.4 million
of multi-family loans from held for sale to loans receivable (held for investment) because the Bank no longer has the intent to sell these loans. Customers transferred these loans at their carrying value, which was lower than the estimated fair value at the time of transfer.
130
At December 31, 2016, BankMobile met the criteria to be classified as held for sale. As a result, Customers reclassified BankMobile-related loans from "Loans receivable" to "Assets held for sale" on the consolidated balance sheets at December 31, 2016 and 2015. For more information on BankMobile, see NOTE 3 - DISCONTINUED OPERATIONS.
The following table presents loans receivable as of
December 31, 2016
and
2015
.
|
|
December 31,
|
||||||
|
|
2016
|
2015
|
|||||
|
(amounts in thousands)
|
|||||||
|
Commercial:
|
|||||||
|
Multi-family
|
$
|
3,214,999
|
|
$
|
2,909,439
|
|
|
|
Commercial and industrial (including owner occupied commercial real estate)
|
1,370,853
|
|
1,111,400
|
|
|||
|
Commercial real estate non-owner occupied
|
1,193,715
|
|
956,255
|
|
|||
|
Construction
|
64,789
|
|
87,240
|
|
|||
|
Total commercial loans
|
5,844,356
|
|
5,064,334
|
|
|||
|
Consumer:
|
|||||||
|
Residential real estate
|
193,502
|
|
271,613
|
|
|||
|
Manufactured housing
|
101,730
|
|
113,490
|
|
|||
|
Other
|
2,726
|
|
3,124
|
|
|||
|
Total consumer loans
|
297,958
|
|
388,227
|
|
|||
|
Total loans receivable
|
6,142,314
|
|
5,452,561
|
|
|||
|
Deferred costs and unamortized premiums, net
|
76
|
|
334
|
|
|||
|
Allowance for loan losses
|
(37,315
|
)
|
(35,647
|
)
|
|||
|
Loans receivable, net of allowance for loan losses
|
$
|
6,105,075
|
|
$
|
5,417,248
|
|
|
131
The following tables summarize loans receivable by loan type and performance status as of
December 31, 2016
and
2015
:
|
|
December 31, 2016
|
||||||||||||||||||||||||||
|
|
30-89 Days
Past Due (1)
|
90 Or
More Days
Past Due (1)
|
Total Past
Due Still
Accruing (1)
|
Non-
Accrual
|
Current (2)
|
Purchased-
Credit-
Impaired
Loans (3)
|
Total Loans (4)
|
||||||||||||||||||||
|
(amounts in thousands)
|
|||||||||||||||||||||||||||
|
Multi-family
|
$
|
12,573
|
|
$
|
—
|
|
$
|
12,573
|
|
$
|
—
|
|
$
|
3,200,322
|
|
$
|
2,104
|
|
$
|
3,214,999
|
|
||||||
|
Commercial and industrial
|
350
|
|
—
|
|
350
|
|
8,443
|
|
967,391
|
|
1,037
|
|
977,221
|
|
|||||||||||||
|
Commercial real estate - owner occupied
|
137
|
|
—
|
|
137
|
|
2,039
|
|
379,227
|
|
12,229
|
|
393,632
|
|
|||||||||||||
|
Commercial real estate - non-owner occupied
|
—
|
|
—
|
|
—
|
|
2,057
|
|
1,185,331
|
|
6,327
|
|
1,193,715
|
|
|||||||||||||
|
Construction
|
—
|
|
—
|
|
—
|
|
—
|
|
64,789
|
|
—
|
|
64,789
|
|
|||||||||||||
|
Residential real estate
|
4,417
|
|
—
|
|
4,417
|
|
2,959
|
|
178,559
|
|
7,567
|
|
193,502
|
|
|||||||||||||
|
Manufactured housing (5)
|
3,761
|
|
2,813
|
|
6,574
|
|
2,236
|
|
89,850
|
|
3,070
|
|
101,730
|
|
|||||||||||||
|
Other consumer
|
12
|
|
—
|
|
12
|
|
58
|
|
2,420
|
|
236
|
|
2,726
|
|
|||||||||||||
|
Total
|
$
|
21,250
|
|
|
$
|
2,813
|
|
|
$
|
24,063
|
|
|
$
|
17,792
|
|
|
$
|
6,067,889
|
|
|
$
|
32,570
|
|
$
|
6,142,314
|
|
|
|
|
December 31, 2015
|
||||||||||||||||||||||||||
|
|
30-89 Days
Past Due (1)
|
90 Or
More Days
Past Due (1)
|
Total Past
Due Still
Accruing (1)
|
Non-
Accrual
|
Current (2)
|
Purchased-
Credit-
Impaired
Loans (3)
|
Total Loans (4)
|
||||||||||||||||||||
|
(amounts in thousands)
|
|||||||||||||||||||||||||||
|
Multi-family
|
$
|
—
|
|
$
|
—
|
|
$
|
—
|
|
$
|
—
|
|
$
|
2,905,789
|
|
$
|
3,650
|
|
$
|
2,909,439
|
|
||||||
|
Commercial and industrial
|
39
|
|
—
|
|
39
|
|
1,973
|
|
799,595
|
|
1,552
|
|
803,159
|
|
|||||||||||||
|
Commercial real estate - owner occupied
|
268
|
|
—
|
|
268
|
|
2,700
|
|
292,312
|
|
12,961
|
|
308,241
|
|
|||||||||||||
|
Commercial real estate - non-owner occupied
|
1,997
|
|
—
|
|
1,997
|
|
1,307
|
|
940,895
|
|
12,056
|
|
956,255
|
|
|||||||||||||
|
Construction
|
—
|
|
—
|
|
—
|
|
—
|
|
87,006
|
|
234
|
|
87,240
|
|
|||||||||||||
|
Residential real estate
|
2,986
|
|
—
|
|
2,986
|
|
2,202
|
|
257,984
|
|
8,441
|
|
271,613
|
|
|||||||||||||
|
Manufactured housing (5)
|
3,752
|
|
2,805
|
|
6,557
|
|
2,449
|
|
101,132
|
|
3,352
|
|
113,490
|
|
|||||||||||||
|
Other consumer
|
107
|
|
—
|
|
107
|
|
140
|
|
2,643
|
|
234
|
|
3,124
|
|
|||||||||||||
|
Total
|
$
|
9,149
|
|
$
|
2,805
|
|
$
|
11,954
|
|
$
|
10,771
|
|
$
|
5,387,356
|
|
$
|
42,480
|
|
$
|
5,452,561
|
|
||||||
|
(1)
|
Includes past due loans that are accruing interest because collection is considered probable.
|
|
(2)
|
Loans where next payment due is less than
30 days
from the report date.
|
|
(3)
|
Purchased-credit-impaired loans aggregated into a pool are accounted for as a single asset with a single composite interest rate and an aggregate expectation of cash flows, and the past due status of the pools, or that of the individual loans within the pools, is not meaningful. Because of the credit impaired nature of the loans, the loans are recorded at a discount reflecting estimated future cash flows and the Bank recognizes interest income on each pool of loans reflecting the estimated yield and passage of time. Such loans are considered to be performing. Purchased-credit-impaired loans that are not in pools accrete interest when the timing and amount of their expected cash flows are reasonably estimable, and are reported as performing loans.
|
|
(4)
|
Amounts exclude deferred costs and fees, unamortized premiums and discounts, and the allowance for loan losses.
|
|
(5)
|
Manufactured housing loans purchased in 2010 are supported by cash reserves held at the Bank that are used to fund past-due payments when the loan becomes
90 days
or more delinquent. Subsequent purchases are subject to varying provisions in the event of borrowers’ delinquencies.
|
As of December 31, 2016 and 2015, the Bank had
$0.5 million
and
$1.2 million
, respectively, of residential real estate held in other real estate owned. As of December 31, 2016 and 2015, the Bank initiated foreclosure proceedings on
$0.4 million
and
$0.6 million
, respectively, in loans secured by residential real estate.
132
Allowance for loan losses
During second quarter 2015, the Bank refined its methodology for estimating the general allowance for loan losses. Previously, the general allowance for the portion of the loan portfolio originated after December 31, 2009 ("Post 2009 loan portfolio") was based generally on qualitative factors due to insufficient historical loss data on the portfolio. During second quarter 2015, the Bank began using objectively verifiable industry and peer loss data to estimate probable incurred losses as of the balance sheet date for the Post 2009 loan portfolio until sufficient internal loss history is available. The same methodology was also adopted for the portion of the loan portfolio originated on or before December 31, 2009 ("Legacy loan portfolio") that had no loss history over the past two years.
The changes in the allowance for loan losses for the years ended
December 31, 2016
and
2015
and the loans and allowance for loan losses by loan type based on impairment evaluation method were as follows. The amounts presented for the provision for loan losses below do not include the effect of changes to estimated benefits resulting from the FDIC loss share arrangements for the covered loans for periods prior to the termination of the FDIC loss sharing arrangements.
|
Twelve months ended December 31, 2016
|
Multi-family
|
Commercial
and
Industrial
|
Commercial
Real Estate Owner Occupied
|
Commercial
Real Estate Non-Owner Occupied
|
Construction
|
Residential
Real Estate
|
Manufactured
Housing |
Other Consumer
|
Total
|
||||||||||||||||||||||||||
|
(amounts in thousands)
|
|||||||||||||||||||||||||||||||||||
|
Allowance for loan losses:
|
|||||||||||||||||||||||||||||||||||
|
Ending Balance, December 31, 2015
|
$
|
12,016
|
|
$
|
8,864
|
|
$
|
1,348
|
|
$
|
8,420
|
|
$
|
1,074
|
|
$
|
3,298
|
|
$
|
494
|
|
$
|
133
|
|
$
|
35,647
|
|
||||||||
|
Charge-offs
|
—
|
|
(2,920
|
)
|
(27
|
)
|
(140
|
)
|
—
|
|
(493
|
)
|
—
|
|
(129
|
)
|
(3,709
|
)
|
|||||||||||||||||
|
Charge-offs for BankMobile loans
(1)
|
—
|
|
—
|
|
—
|
|
—
|
|
—
|
|
—
|
|
—
|
|
(696
|
)
|
(696
|
)
|
|||||||||||||||||
|
Recoveries
|
—
|
|
381
|
|
—
|
|
130
|
|
1,854
|
|
367
|
|
—
|
|
11
|
|
2,743
|
|
|||||||||||||||||
|
Provision for loan losses
|
(414
|
)
|
4,725
|
|
862
|
|
(516
|
)
|
(2,088
|
)
|
170
|
|
(208
|
)
|
103
|
|
2,634
|
|
|||||||||||||||||
|
Provision for BankMobile loans
(1)
|
—
|
|
—
|
|
—
|
|
—
|
|
—
|
|
—
|
|
—
|
|
696
|
|
696
|
|
|||||||||||||||||
|
Ending Balance, December 31, 2016
|
$
|
11,602
|
|
$
|
11,050
|
|
$
|
2,183
|
|
$
|
7,894
|
|
$
|
840
|
|
$
|
3,342
|
|
$
|
286
|
|
$
|
118
|
|
$
|
37,315
|
|
||||||||
|
Loans:
|
|||||||||||||||||||||||||||||||||||
|
Individually evaluated for impairment
|
$
|
—
|
|
$
|
8,516
|
|
$
|
2,050
|
|
$
|
2,151
|
|
$
|
—
|
|
$
|
6,972
|
|
$
|
9,665
|
|
$
|
57
|
|
$
|
29,411
|
|
||||||||
|
Collectively evaluated for impairment
|
3,212,895
|
|
967,668
|
|
379,353
|
|
1,185,237
|
|
64,789
|
|
178,963
|
|
88,995
|
|
2,433
|
|
6,080,333
|
|
|||||||||||||||||
|
Loans acquired with credit deterioration
|
2,104
|
|
1,037
|
|
12,229
|
|
6,327
|
|
—
|
|
7,567
|
|
3,070
|
|
236
|
|
32,570
|
|
|||||||||||||||||
|
$
|
3,214,999
|
|
$
|
977,221
|
|
$
|
393,632
|
|
$
|
1,193,715
|
|
$
|
64,789
|
|
$
|
193,502
|
|
$
|
101,730
|
|
$
|
2,726
|
|
$
|
6,142,314
|
|
|||||||||
|
Allowance for loan losses:
|
|||||||||||||||||||||||||||||||||||
|
Individually evaluated for impairment
|
$
|
—
|
|
$
|
1,024
|
|
$
|
287
|
|
$
|
14
|
|
$
|
—
|
|
$
|
35
|
|
$
|
—
|
|
$
|
—
|
|
$
|
1,360
|
|
||||||||
|
Collectively evaluated for impairment
|
11,602
|
|
9,686
|
|
1,896
|
|
4,626
|
|
772
|
|
2,414
|
|
88
|
|
60
|
|
31,144
|
|
|||||||||||||||||
|
Loans acquired with credit deterioration
|
—
|
|
340
|
|
—
|
|
3,254
|
|
68
|
|
893
|
|
198
|
|
58
|
|
4,811
|
|
|||||||||||||||||
|
$
|
11,602
|
|
$
|
11,050
|
|
$
|
2,183
|
|
$
|
7,894
|
|
$
|
840
|
|
$
|
3,342
|
|
$
|
286
|
|
$
|
118
|
|
$
|
37,315
|
|
|||||||||
|
'(1) Includes activities for BankMobile-related loans, primarily overdrawn consumer deposit accounts.
|
|||||||||||||||||||||||||||||||||||
133
|
Twelve months ended December 31, 2015
|
Multi-family
|
Commercial
and
Industrial
|
Commercial
Real Estate Owner Occupied
|
Commercial
Real Estate Non-Owner Occupied
|
Construction
|
Residential
Real Estate
|
Manufactured
Housing |
Other Consumer
|
Total
|
||||||||||||||||||||||||||
|
(amounts in thousands)
|
|||||||||||||||||||||||||||||||||||
|
Allowance for loan losses:
|
|||||||||||||||||||||||||||||||||||
|
Ending Balance, December 31, 2014
|
$
|
8,493
|
|
$
|
4,784
|
|
$
|
4,336
|
|
$
|
9,198
|
|
$
|
1,047
|
|
$
|
2,698
|
|
$
|
262
|
|
$
|
114
|
|
$
|
30,932
|
|
||||||||
|
Charge-offs
|
—
|
|
(11,331
|
)
|
(378
|
)
|
(327
|
)
|
(1,064
|
)
|
(276
|
)
|
—
|
|
(36
|
)
|
(13,412
|
)
|
|||||||||||||||||
|
Recoveries
|
—
|
|
548
|
|
14
|
|
—
|
|
204
|
|
575
|
|
—
|
|
92
|
|
1,433
|
|
|||||||||||||||||
|
Provision for loan losses
|
3,523
|
|
14,863
|
|
(2,624
|
)
|
(451
|
)
|
887
|
|
301
|
|
232
|
|
(37
|
)
|
16,694
|
|
|||||||||||||||||
|
Ending Balance, December 31, 2015
|
$
|
12,016
|
|
$
|
8,864
|
|
$
|
1,348
|
|
$
|
8,420
|
|
$
|
1,074
|
|
$
|
3,298
|
|
$
|
494
|
|
$
|
133
|
|
$
|
35,647
|
|
||||||||
|
Loans:
|
|||||||||||||||||||||||||||||||||||
|
Individually evaluated for impairment
|
$
|
661
|
|
$
|
17,621
|
|
$
|
8,329
|
|
$
|
4,831
|
|
$
|
—
|
|
$
|
4,726
|
|
$
|
8,300
|
|
$
|
140
|
|
$
|
44,608
|
|
||||||||
|
Collectively evaluated for impairment
|
2,905,128
|
|
783,986
|
|
286,951
|
|
939,368
|
|
87,006
|
|
258,446
|
|
101,838
|
|
2,750
|
|
5,365,473
|
|
|||||||||||||||||
|
Loans acquired with credit deterioration
|
3,650
|
|
1,552
|
|
12,961
|
|
12,056
|
|
234
|
|
8,441
|
|
3,352
|
|
234
|
|
42,480
|
|
|||||||||||||||||
|
$
|
2,909,439
|
|
$
|
803,159
|
|
$
|
308,241
|
|
$
|
956,255
|
|
$
|
87,240
|
|
$
|
271,613
|
|
$
|
113,490
|
|
$
|
3,124
|
|
$
|
5,452,561
|
|
|||||||||
|
Allowance for loan losses:
|
|||||||||||||||||||||||||||||||||||
|
Individually evaluated for impairment
|
$
|
—
|
|
$
|
1,990
|
|
$
|
1
|
|
$
|
148
|
|
$
|
—
|
|
$
|
84
|
|
$
|
—
|
|
$
|
50
|
|
$
|
2,273
|
|
||||||||
|
Collectively evaluated for impairment
|
12,016
|
|
6,650
|
|
1,347
|
|
3,858
|
|
1,074
|
|
2,141
|
|
98
|
|
28
|
|
27,212
|
|
|||||||||||||||||
|
Loans acquired with credit deterioration
|
—
|
|
224
|
|
—
|
|
4,414
|
|
—
|
|
1,073
|
|
396
|
|
55
|
|
6,162
|
|
|||||||||||||||||
|
$
|
12,016
|
|
$
|
8,864
|
|
$
|
1,348
|
|
$
|
8,420
|
|
$
|
1,074
|
|
$
|
3,298
|
|
$
|
494
|
|
$
|
133
|
|
$
|
35,647
|
|
|||||||||
The manufactured housing portfolio was purchased in August 2010. A portion of the purchase price may be used to reimburse the Bank under the specified terms in the Purchase Agreement for defaults of the underlying borrower and other specified items. At December 31, 2016 and 2015, funds available for reimbursement, if necessary, were
$1.0 million
and
$1.2 million
, respectively. Each quarter, these funds are evaluated to determine if they would be sufficient to absorb probable losses within the manufactured housing portfolio.
134
Loans Individually Evaluated for Impairment
The following tables present the recorded investment (net of charge-offs), unpaid principal balance, and related allowance by loan type for loans that are individually evaluated for impairment as of December 31, 2016 and 2015 and the average recorded investment and interest income recognized for the years ended December 31, 2016 and 2015. Purchased-credit-impaired loans are considered to be performing and are not included in the tables below.
|
December 31, 2016
|
Twelve months ended December 31, 2016
|
||||||||||||||||||
|
|
Recorded
Investment
Net of
Charge Offs
|
Unpaid
Principal
Balance
|
Related
Allowance
|
Average
Recorded
Investment
|
Interest
Income
Recognized
|
||||||||||||||
|
(amounts in thousands)
|
|||||||||||||||||||
|
With no related allowance recorded:
|
|||||||||||||||||||
|
Multi-family
|
$
|
—
|
|
$
|
—
|
|
$
|
—
|
|
$
|
964
|
|
$
|
53
|
|
||||
|
Commercial and industrial
|
2,396
|
|
3,430
|
|
—
|
|
15,424
|
|
804
|
|
|||||||||
|
Commercial real estate - owner occupied
|
1,210
|
|
1,210
|
|
—
|
|
7,963
|
|
426
|
|
|||||||||
|
Commercial real estate - non-owner occupied
|
2,002
|
|
2,114
|
|
—
|
|
5,265
|
|
155
|
|
|||||||||
|
Construction
|
—
|
|
—
|
|
—
|
|
—
|
|
—
|
|
|||||||||
|
Other consumer
|
57
|
|
57
|
|
—
|
|
47
|
|
—
|
|
|||||||||
|
Residential real estate
|
6,682
|
|
6,749
|
|
—
|
|
4,567
|
|
120
|
|
|||||||||
|
Manufactured housing
|
9,665
|
|
9,665
|
|
—
|
|
8,961
|
|
465
|
|
|||||||||
|
With an allowance recorded:
|
|||||||||||||||||||
|
Multi-family
|
—
|
|
—
|
|
—
|
|
232
|
|
—
|
|
|||||||||
|
Commercial and industrial
|
6,120
|
|
6,120
|
|
1,024
|
|
7,028
|
|
436
|
|
|||||||||
|
Commercial real estate - owner occupied
|
840
|
|
840
|
|
287
|
|
173
|
|
—
|
|
|||||||||
|
Commercial real estate - non-owner occupied
|
149
|
|
204
|
|
14
|
|
380
|
|
—
|
|
|||||||||
|
Other consumer
|
—
|
|
—
|
|
—
|
|
29
|
|
—
|
|
|||||||||
|
Residential real estate
|
290
|
|
303
|
|
35
|
|
395
|
|
—
|
|
|||||||||
|
Total
|
$
|
29,411
|
|
$
|
30,692
|
|
$
|
1,360
|
|
$
|
51,428
|
|
$
|
2,459
|
|
||||
135
|
December 31, 2015
|
Twelve months ended December 31, 2015
|
||||||||||||||||||
|
|
Recorded
Investment
Net of
Charge Offs
|
Unpaid
Principal
Balance
|
Related
Allowance
|
Average
Recorded
Investment
|
Interest
Income
Recognized
|
||||||||||||||
|
(amounts in thousands)
|
|
||||||||||||||||||
|
With no related allowance recorded:
|
|||||||||||||||||||
|
Multi-family
|
$
|
661
|
|
$
|
661
|
|
$
|
—
|
|
$
|
267
|
|
$
|
24
|
|
||||
|
Commercial and industrial
|
12,056
|
|
13,028
|
|
—
|
|
8,543
|
|
891
|
|
|||||||||
|
Commercial real estate - owner occupied
|
8,317
|
|
8,317
|
|
—
|
|
6,526
|
|
454
|
|
|||||||||
|
Commercial real estate - non-owner occupied
|
4,276
|
|
4,276
|
|
6,605
|
|
648
|
|
|||||||||||
|
Construction
|
—
|
|
—
|
|
—
|
|
749
|
|
—
|
|
|||||||||
|
Other consumer
|
48
|
|
48
|
|
—
|
|
42
|
|
1
|
|
|||||||||
|
Residential real estate
|
4,331
|
|
4,331
|
|
—
|
|
2,254
|
|
86
|
|
|||||||||
|
Manufactured housing
|
8,300
|
|
8,300
|
|
—
|
|
5,433
|
|
368
|
|
|||||||||
|
With an allowance recorded:
|
|||||||||||||||||||
|
Commercial and industrial
|
5,565
|
|
5,914
|
|
1,990
|
|
9,331
|
|
191
|
|
|||||||||
|
Commercial real estate - owner occupied
|
12
|
|
12
|
|
1
|
|
15
|
|
1
|
|
|||||||||
|
Commercial real estate - non-owner occupied
|
555
|
|
555
|
|
148
|
|
817
|
|
12
|
|
|||||||||
|
Other consumer
|
92
|
|
92
|
|
50
|
|
83
|
|
—
|
|
|||||||||
|
Residential real estate
|
395
|
|
395
|
|
84
|
|
426
|
|
2
|
|
|||||||||
|
Total
|
$
|
44,608
|
|
$
|
45,929
|
|
$
|
2,273
|
|
$
|
41,091
|
|
$
|
2,678
|
|
||||
Troubled Debt Restructurings
At
December 31, 2016
,
2015
and
2014
, there were
$16.4 million
,
$11.4 million
, and
$5.0 million
respectively, in loans categorized as troubled debt restructurings (“TDRs”). TDRs are reported as impaired loans in the calendar year of their restructuring and are evaluated to determine whether they should be placed on non-accrual status. In subsequent years, a TDR may be returned to accrual status if the borrower satisfies a minimum
six
-month performance requirement; however, the TDR will remain classified as impaired. Generally, the Bank requires sustained performance for
nine months
before returning a TDR to accrual status.
Modifications of purchased-credit-impaired loans that are accounted for within loan pools in accordance with the accounting standards for purchased-credit-impaired loans do not result in the removal of these loans from the pool even if modifications would otherwise be considered a TDR. Accordingly, as each pool is accounted for as a single asset with a single composite interest rate and an aggregate expectation of cash flows, modifications of loans within such pools are not considered TDRs.
The following is an analysis of loans modified in a troubled debt restructuring by type of concession for the years ended
December 31, 2016
,
2015
and 2014. There were no modifications that involved forgiveness of debt.
|
For the Years Ended December 31,
|
||||||||||||||||||||
|
|
2016
|
2015
|
2014
|
|||||||||||||||||
|
|
Number
of Loans |
Recorded
Investment |
Number
of Loans |
Recorded
Investment |
Number
of Loans |
Recorded
Investment |
||||||||||||||
|
(dollars in thousands)
|
||||||||||||||||||||
|
Extensions of maturity
|
3
|
|
$
|
1,995
|
|
1
|
|
$
|
183
|
|
11
|
|
$
|
460
|
|
|||||
|
Interest-rate reductions
|
61
|
|
4,621
|
|
161
|
|
7,274
|
|
10
|
|
620
|
|
||||||||
|
Total
|
64
|
|
$
|
6,616
|
|
162
|
|
$
|
7,457
|
|
21
|
|
$
|
1,080
|
|
|||||
136
The following table provides, by loan type, the number of loans modified in troubled debt restructurings and the related recorded investment for the years ended December 31, 2016, 2015 and 2014.
|
For the Years Ended December 31,
|
||||||||||||||||||||
|
|
2016
|
2015
|
2014
|
|||||||||||||||||
|
|
Number
of Loans
|
Recorded
Investment
|
Number
of Loans
|
Recorded
Investment
|
Number
of Loans |
Recorded
Investment |
||||||||||||||
|
(dollars in thousands)
|
||||||||||||||||||||
|
Commercial and industrial
|
1
|
|
$
|
76
|
|
3
|
|
$
|
791
|
|
—
|
|
$
|
—
|
|
|||||
|
Commercial real estate non-owner occupied
|
1
|
|
1,844
|
|
1
|
|
211
|
|
—
|
|
—
|
|
||||||||
|
Manufactured housing
|
58
|
|
2,286
|
|
156
|
|
6,251
|
|
10
|
|
$
|
620
|
|
|||||||
|
Residential real estate
|
4
|
|
2,410
|
|
2
|
|
204
|
|
11
|
|
460
|
|
||||||||
|
Total loans
|
64
|
|
$
|
6,616
|
|
162
|
|
$
|
7,457
|
|
21
|
|
$
|
1,080
|
|
|||||
As of
December 31, 2016
,
2015
, 2014, there were
no
commitments to lend additional funds to debtors whose terms have been modified in TDRs.
As of
December 31, 2016
,
eight
manufactured housing loans totaling
$0.2 million
,
one
commercial real estate non-owner occupied loan of
$1.8 million
, and
one
residential real estate loan of
$0.1 million
that were modified in troubled debt restructurings within the past twelve months, defaulted on payments. As of
December 31, 2015
,
eleven
manufactured housing loans totaling
$0.3 million
that were modified in troubled debt restructurings within the past twelve months, defaulted on payments. As of December 31, 2014, there were
no
loans modified in troubled debt restructurings within the past twelve months, that defaulted on payments.
Loans modified in troubled debt restructurings are evaluated for impairment. The nature and extent of impairment of TDRs, including those which have experienced a subsequent default, is considered in the determination of an appropriate level of allowance for loan losses. There were no specific allowances resulting from TDR modifications during
2016
. There were
three
specific allowances resulting from TDR modifications during
2015
, totaling
$0.2 million
for
two
commercial and industrial loans, and
$0.1 million
for
one
commercial real estate non-owner occupied loan. There were
no
specific allowances resulting from TDR modifications during
2014
.
Purchase Credit Impaired Loans
The changes in accretable yield related to purchased-credit-impaired loans for the years ended December 31, 2016, 2015 and 2014
were as follows:
|
|
For the Years Ended December 31,
|
||||||||||
|
|
2016
|
2015
|
2014
|
||||||||
|
(amounts in thousands)
|
|
||||||||||
|
Accretable yield balance, beginning of period
|
$
|
12,947
|
|
$
|
17,606
|
|
$
|
22,557
|
|
||
|
Accretion to interest income
|
(3,760
|
)
|
(2,299
|
)
|
(3,201
|
)
|
|||||
|
Reclassification from nonaccretable difference and disposals, net
|
1,015
|
|
(2,360
|
)
|
(1,750
|
)
|
|||||
|
Accretable yield balance, end of period
|
$
|
10,202
|
|
$
|
12,947
|
|
$
|
17,606
|
|
||
Allowance for Loan Losses and the FDIC Loss Sharing Receivable and Clawback Liability
Losses incurred on covered loans were eligible for partial reimbursement by the FDIC. Subsequent to the purchase date, the expected cash flows on the covered loans were subject to evaluation. Decreases in the present value of expected cash flows on the covered loans were recognized by increasing the allowance for loan losses with a related charge to the provision for loan losses. At the same time, the FDIC indemnification asset was increased reflecting an estimated future collection from the FDIC, which was recorded as a reduction to the provision for loan losses. If the expected cash flows on the covered loans increased such that a previously recorded impairment could be reversed, the Bank recorded a reduction in the allowance for loan losses (with a related credit to the provision for loan losses) accompanied by a reduction in the FDIC receivable balance (with a related charge to the provision for loan losses). Increases in expected cash flows on covered loans and decreases in expected cash flows of the FDIC loss sharing receivable, when there were no previously recorded impairments, were considered together and recognized over the remaining life of the loans as interest income. Decreases in the
137
valuations of other real estate owned covered by the loss sharing agreements were recorded net of the estimated FDIC receivable as an increase to other real estate owned expense (a component of non-interest expense).
As part of the FDIC loss sharing agreements, the Bank also assumed a potential liability to be paid within
45 days
subsequent to the maturity or termination of the loss sharing agreements that was contingent upon actual losses incurred over the life of the agreements relative to expected losses and the consideration paid upon acquisition of the failed institutions (the "Clawback liability"). Due to cash received on the covered assets in excess of the original expectations of the FDIC, the Bank anticipated that it would be required to pay the FDIC at the end of its loss sharing agreements.
The Bank presented the FDIC Loss Sharing Receivable, net of the estimated Clawback liability on the consolidated balance sheets. In the event the estimated Clawback liability exceeded the FDIC Loss Sharing Receivable balance, the net liability amount was presented in "Accrued interest payable and other liabilities" on the consolidated balance sheets.
On July 11, 2016, Customers entered into an agreement to terminate all existing rights and obligations pursuant to the loss sharing agreements with the FDIC. In connection with the termination agreement, Customers paid the FDIC
$1.4 million
as final payment under these agreements. The negotiated settlement amount was based on net losses incurred on the covered assets through September 30, 2015, adjusted for cash payments to and cash receipts from the FDIC as part of the December 31, 2015 and March 31, 2016 certifications. Consequently, loans and other real estate owned previously reported as covered assets pursuant to the loss sharing agreements were no longer presented as covered assets as of June 30, 2016.
The following table presents changes in the allowance for loans losses and the FDIC loss sharing receivable, including the effect of the estimated clawback liability for the years ended
December 31, 2016
,
2015
and
2014
.
|
|
Allowance for Loan Losses
For The Years Ended December 31,
|
||||||||||
|
|
2016
|
2015
|
2014
|
||||||||
|
(amounts in thousands)
|
|||||||||||
|
Ending balance as of December 31,
|
$
|
35,647
|
|
$
|
30,932
|
|
$
|
23,998
|
|
||
|
Provision for loan losses (1)
|
2,634
|
|
16,694
|
|
10,058
|
|
|||||
|
Provision for BankMobile loans (presented as discontinued operations)
|
696
|
|
—
|
|
—
|
|
|||||
|
Charge-offs
|
(3,709
|
)
|
(13,412
|
)
|
(4,947
|
)
|
|||||
|
Charge-offs for BankMobile loans
|
(696
|
)
|
—
|
|
—
|
|
|||||
|
Recoveries
|
2,743
|
|
1,433
|
|
1,823
|
|
|||||
|
Ending balance as of December 31,
|
$
|
37,315
|
|
$
|
35,647
|
|
$
|
30,932
|
|
||
|
|
FDIC Loss Sharing Receivable
For The Years Ended December 31,
|
||||||||||
|
|
2016
|
2015
|
2014
|
||||||||
|
(amounts in thousands)
|
|||||||||||
|
Ending balance as of December 31,
|
$
|
(2,083
|
)
|
$
|
2,320
|
|
$
|
10,046
|
|
||
|
Increased (decreased) estimated cash flows (2)
|
289
|
|
(3,872
|
)
|
(4,689
|
)
|
|||||
|
Increased estimated cash flows from covered OREO (a)
|
—
|
|
3,138
|
|
—
|
|
|||||
|
Other activity, net (b)
|
(255
|
)
|
248
|
|
2,409
|
|
|||||
|
Cash payments to (receipts from) the FDIC
|
2,049
|
|
(3,917
|
)
|
(5,446
|
)
|
|||||
|
Ending balance as of December 31,
|
$
|
—
|
|
$
|
(2,083
|
)
|
$
|
2,320
|
|
||
|
(1) Provision for loan losses
|
$
|
2,634
|
|
$
|
16,694
|
|
$
|
10,058
|
|
||
|
(2) Effect attributable to FDIC loss share arrangements
|
(289
|
)
|
3,872
|
|
4,689
|
|
|||||
|
Net amount reported as provision for loan losses (from continuing operations)
|
$
|
2,345
|
|
$
|
20,566
|
|
$
|
14,747
|
|
||
(a) Recorded as a reduction to Other Real Estate Owned expense (a component of non-interest expense).
(b) Includes external costs, such as legal fees, real estate taxes and appraisal expenses, that qualified for reimbursement under loss share arrangements.
138
Credit Quality Indicators
Commercial and industrial, commercial real estate, multi-family, residential real estate and construction loans are based on an internally assigned risk rating system which are assigned at loan origination and reviewed on a periodic or “as needed” basis. Other consumer and manufactured housing loans are evaluated based on the payment activity of the loan.
To facilitate the monitoring of credit quality within commercial and industrial, commercial real estate, construction, multi-family and residential real estate loans, and for purposes of analyzing historical loss rates used in the determination of the allowance for loan losses for the respective portfolio class, the Bank utilizes the following categories of risk ratings: pass/satisfactory (includes risk rating 1 through 6), special mention, substandard, doubtful, and loss. The risk rating categories, which are derived from standard regulatory rating definitions, are assigned upon initial approval of credit to borrowers and updated periodically thereafter. Pass/satisfactory ratings, which are assigned to those borrowers who do not have identified potential or well-defined weaknesses and for whom there is a high likelihood of orderly repayment, are updated periodically based on the size of the exposure and credit characteristics of the borrower. All other categories are updated on a quarterly basis during the month preceding the end of the calendar quarter. Certain consumer loans are not assigned a risk rating. While assigning risk ratings involves judgment, the risk-rating process allows management to identify riskier credits in a timely manner and allocate the appropriate resources to managing the loans.
The risk rating grades are defined as follows:
“1” –
Pass
/
Excellent
Loans rated 1 represent a credit extension of the highest quality. The borrower’s historic (at least five years) cash flows manifest extremely large and stable margins of coverage. Balance sheets are conservative, well capitalized, and liquid. After considering debt service for proposed and existing debt, projected cash flows continue to be strong and provide ample coverage. The borrower typically reflects broad geographic and product diversification and has access to alternative financial markets.
“2” –
Pass
/
Superior
Loans rated 2 are those for which the borrower has a strong financial condition, balance sheet, operations, cash flow, debt capacity and coverage, with ratios better than industry norms. The borrowers of these loans exhibit a limited leverage position, are virtually immune to local economies, and are in stable growing industries. The management team is well respected and the company has ready access to public markets.
“3” –
Pass
/
Strong
Loans rated 3 are those loans for which the borrowers have above average financial condition and flexibility; more than satisfactory debt service coverage; balance sheet and operating ratios are consistent with or better than industry peers; operate in industries with little industry risk; move in diversified markets; and are experienced and competent in their industry. These borrowers' access to capital markets is limited mostly to private sources, often secured, but the borrower typically has access to a wide range of refinancing alternatives.
“4” –
Pass
/
Good
Loans rated 4 have a sound primary and secondary source of repayment. The borrower may have access to alternative sources of financing, but sources are not as widely available as they are to a higher grade borrower. These loans carry a normal level of risk, with very low loss exposure. The borrower has the ability to perform according to the terms of the credit facility. The margins of cash flow coverage are satisfactory but vulnerable to more rapid deterioration than the higher quality loans.
“5” –
Satisfactory
Loans rated 5 are extended to borrowers who are determined to be a reasonable credit risk and demonstrate the ability to repay the debt from normal business operations. Risk factors may include reliability of margins and cash flows, liquidity, dependence on a single product or industry, cyclical trends, depth of management, or limited access to alternative financing sources. The borrower’s historical financial information may indicate erratic performance, but current trends are positive and the quality of financial information is adequate, but is not as detailed and sophisticated as information found on higher grade loans. If adverse circumstances arise, the impact on the borrower may be significant.
139
“6” –
Satisfactory
/
Bankable with Care
Loans rated 6 are those for which the borrower has higher than normal credit risk; however, cash flow and asset values are generally intact. These borrowers may exhibit declining financial characteristics, with increasing leverage and decreasing liquidity, and may have limited resources and access to financial alternatives. Signs of weakness in these borrowers may include delinquent taxes, trade slowness and eroding profit margins.
“7” –
Special Mention
Loans rated Special Mention are credit facilities that may have potential developing weaknesses and deserve extra attention from the account manager and other management personnel. In the event potential weaknesses are not corrected or mitigated, deterioration in the ability of the borrower to repay the debt in the future may occur. This grade is not assigned to loans that bear certain peculiar risks normally associated with the type of financing involved, unless circumstances have caused the risk to increase to a level higher than would have been acceptable when the credit was originally approved. Loans where significant actual, not potential, weaknesses or problems are clearly evident are graded in the category below.
“8” –
Substandard
Loans are classified Substandard when the loans are inadequately protected by the current sound worth and payment capacity of the obligor or of the collateral pledged, if any. Loans so classified must have a well-defined weakness or weaknesses that jeopardize the liquidation of the debt and are characterized by the distinct possibility that the company will sustain some loss if the weaknesses are not corrected.
“9” –
Doubtful
Doubtful ratings are assigned to loans that have all the attributes of a substandard rating with the added characteristic that the weaknesses make collection or liquidation in full, on the basis of currently existing facts, conditions, and values, highly questionable and improbable. The possibility of loss is extremely high, but because of certain important and reasonable specific pending factors that may work to the advantage of and strengthen the credit quality of the loan, its classification as an estimated loss is deferred until its more exact status may be determined. Pending factors may include a proposed merger or acquisition, liquidation proceeding, capital injection, perfecting liens on additional collateral or refinancing plans.
“10” –
Loss
The Bank assigns a loss rating to loans considered uncollectible and of such little value that their continuance as an active asset is not warranted. Amounts classified as loss are immediately charged off.
Risk ratings are not established for certain consumer loans, including home equity loans, manufactured housing, and installment loans, mainly because these portfolios consist of a larger number of homogeneous loans with smaller balances. Instead, these portfolios are evaluated for risk mainly based upon aggregate payment history through the monitoring of delinquency levels and trends and are classified as performing and nonperforming.
The following table presents the credit ratings as of
December 31, 2016
and
2015
for the loans receivable portfolio.
|
|
December 31, 2016
|
||||||||||||||||||||||||||||||||||
|
|
Multi-family
|
Commercial
and Industrial |
Commercial
Real Estate Owner Occupied |
Commercial
Real Estate Non-Owner Occupied |
Construction
|
Residential
Real Estate |
Manufactured
Housing |
Other Consumer
|
Total
|
||||||||||||||||||||||||||
|
(amounts in thousands)
|
|||||||||||||||||||||||||||||||||||
|
Pass/Satisfactory
|
$
|
3,198,290
|
|
$
|
943,356
|
|
$
|
375,919
|
|
$
|
1,175,850
|
|
$
|
50,291
|
|
$
|
189,919
|
|
$
|
—
|
|
$
|
—
|
|
$
|
5,933,625
|
|
||||||||
|
Special Mention
|
—
|
|
19,552
|
|
12,065
|
|
10,824
|
|
14,498
|
|
—
|
|
—
|
|
—
|
|
56,939
|
|
|||||||||||||||||
|
Substandard
|
16,709
|
|
14,313
|
|
5,648
|
|
7,041
|
|
—
|
|
3,583
|
|
—
|
|
—
|
|
47,294
|
|
|||||||||||||||||
|
Performing (1)
|
—
|
|
—
|
|
—
|
|
—
|
|
—
|
|
—
|
|
92,920
|
|
2,656
|
|
95,576
|
|
|||||||||||||||||
|
Non-performing (2)
|
—
|
|
—
|
|
—
|
|
—
|
|
—
|
|
—
|
|
8,810
|
|
70
|
|
8,880
|
|
|||||||||||||||||
|
Total
|
$
|
3,214,999
|
|
$
|
977,221
|
|
$
|
393,632
|
|
$
|
1,193,715
|
|
$
|
64,789
|
|
$
|
193,502
|
|
$
|
101,730
|
|
$
|
2,726
|
|
$
|
6,142,314
|
|
||||||||
140
|
|
December 31, 2015
|
||||||||||||||||||||||||||||||||||
|
|
Multi-family
|
Commercial
and
Industrial
|
Commercial
Real Estate Owner Occupied
|
Commercial
Real Estate Non-Owner Occupied
|
Construction
|
Residential
Real Estate
|
Manufactured
Housing |
Other Consumer
|
Total
|
||||||||||||||||||||||||||
|
(amounts in thousands)
|
|||||||||||||||||||||||||||||||||||
|
Pass/Satisfactory
|
$
|
2,907,362
|
|
$
|
784,892
|
|
$
|
295,762
|
|
$
|
950,886
|
|
$
|
87,240
|
|
$
|
268,210
|
|
$
|
—
|
|
$
|
—
|
|
$
|
5,294,352
|
|
||||||||
|
Special Mention
|
661
|
|
14,052
|
|
7,840
|
|
1,671
|
|
—
|
|
282
|
|
—
|
|
—
|
|
24,506
|
|
|||||||||||||||||
|
Substandard
|
1,416
|
|
4,215
|
|
4,639
|
|
3,698
|
|
—
|
|
3,121
|
|
—
|
|
—
|
|
17,089
|
|
|||||||||||||||||
|
Performing (1)
|
—
|
|
—
|
|
—
|
|
—
|
|
—
|
|
—
|
|
104,484
|
|
2,877
|
|
107,361
|
|
|||||||||||||||||
|
Non-performing (2)
|
—
|
|
—
|
|
—
|
|
—
|
|
—
|
|
—
|
|
9,006
|
|
247
|
|
9,253
|
|
|||||||||||||||||
|
Total
|
$
|
2,909,439
|
|
$
|
803,159
|
|
$
|
308,241
|
|
$
|
956,255
|
|
$
|
87,240
|
|
$
|
271,613
|
|
$
|
113,490
|
|
$
|
3,124
|
|
$
|
5,452,561
|
|
||||||||
|
(1)
|
Includes consumer and other installment loans not subject to risk ratings.
|
|
(2)
|
Includes loans that are past due and still accruing interest and loans on non-accrual status.
|
The components of bank premises and equipment as of
December 31, 2016
and
2015
were as follows:
|
|
|
December 31,
|
|||||||
|
|
Expected Useful Life
|
2016
|
2015
|
||||||
|
(amounts in thousands)
|
|||||||||
|
Leasehold improvements
|
3 to 25 years
|
$
|
13,665
|
|
$
|
12,506
|
|
||
|
Furniture, fixtures and equipment
|
5 to 10 years
|
6,036
|
|
5,245
|
|
||||
|
IT equipment
|
3 to 5 years
|
6,502
|
|
5,558
|
|
||||
|
Automobiles
|
3 to 5 years
|
506
|
|
206
|
|
||||
|
26,709
|
|
23,515
|
|
||||||
|
Accumulated depreciation
|
(14,450
|
)
|
(12,369
|
)
|
|||||
|
Total
|
$
|
12,259
|
|
$
|
11,146
|
|
|||
Premises and equipment for BankMobile totaled approximately
$0.5 million
and
$0.4 million
, net of accumulated depreciation of
$221 thousand
and
$58 thousand
, at
December 31, 2016
and
2015
, respectively. These amounts are presented within "Assets held for sale" on the consolidated balance sheets.
Future minimum rental commitments pursuant to non-cancelable leases as of
December 31, 2016
were as follows:
|
|
December 31, 2016
|
||
|
(amounts in thousands)
|
|||
|
2017
|
$
|
3,897
|
|
|
2018
|
3,988
|
|
|
|
2019
|
3,355
|
|
|
|
2020
|
2,835
|
|
|
|
2021
|
2,390
|
|
|
|
Thereafter
|
8,063
|
|
|
|
Total minimum payments
|
$
|
24,528
|
|
Rent expense from continuing operations was approximately
$4.5 million
,
$3.7 million
and
$3.3 million
for the years ended
December 31, 2016
,
2015
and
2014
, respectively. Rent expense included in discontinued operations was
$0.2 million
and
$0.1 million
for the years ended
December 31, 2016
and
2015
, respectively. There was
no
rent expense included in discontinued
141
operations for the year ended December 31, 2014. Customers' leases are for land and branch or office space. A majority of the leases provide for the payment of taxes, maintenance, insurance and certain other expenses applicable to the leased premises. Many of the leases contain extension provisions and escalation clauses. These leases are generally renewable and may, in certain cases, contain renewal provisions and options to expand and contract space and terminate the leases at predetermined contractual dates. In addition, escalation clauses may exist, which are tied to a predetermined rate or may change based on a specified percentage increase or the Consumer Price Index.
At
December 31, 2016
, BankMobile met the criteria to be classified as "held for sale". As a result, Customers reclassified BankMobile-related deposits from "Total deposits" to "Liabilities held for sale" on the consolidated balance sheets at
December 31, 2016
and
2015
. For more information on BankMobile, see NOTE 3 - DISCONTINUED OPERATIONS.
The components of deposits from continuing operations at
December 31, 2016
and
2015
were as follows:
|
December 31,
|
|||||||
|
2016
|
2015
|
||||||
|
(amounts in thousands)
|
|||||||
|
Demand, non-interest bearing
|
$
|
512,664
|
|
$
|
408,874
|
|
|
|
Demand, interest bearing
|
339,398
|
|
127,215
|
|
|||
|
Savings, including money market deposit accounts
|
3,163,156
|
|
2,778,747
|
|
|||
|
Time, $100,000 and over
|
2,106,905
|
|
1,624,562
|
|
|||
|
Time, other
|
724,857
|
|
723,035
|
|
|||
|
Total deposits
|
$
|
6,846,980
|
|
$
|
5,662,433
|
|
|
The scheduled maturities for time deposits from continuing operations at
December 31, 2016
were as follows:
|
|
December 31, 2016
|
||
|
(amounts in thousands)
|
|||
|
2017
|
$
|
2,047,297
|
|
|
2018
|
446,220
|
|
|
|
2019
|
198,735
|
|
|
|
2020
|
47,729
|
|
|
|
2021
|
91,705
|
|
|
|
Thereafter
|
76
|
|
|
|
Total time deposits
|
$
|
2,831,762
|
|
The aggregate amounts of demand deposit overdrafts from continuing operations that were reclassified as loans were not material at
December 31, 2016
and 2015. Time deposits greater than $250,000 from continuing operations totaled
$1.2 billion
and
$920.5 million
at
December 31, 2016
and
2015
, respectively.
Included in the savings balances above were
$972.2 million
and
$815.7 million
of brokered money market deposits at
December 31, 2016
and
2015
, respectively. Also included in time, other balances above were
$721.9 million
and
$612.8 million
of brokered time deposits, respectively, at
December 31, 2016
and
2015
.
BankMobile non-interest bearing demand deposits were
$453.4 million
and
$244.8 million
at
December 31, 2016
and
2015
, respectively, and savings account balances were
$3.4 million
and
$2.3 million
at
December 31, 2016
and
2015
, respectively. Total BankMobile demand deposit overdrafts reclassified as assets held for sale were
$12.2 million
and
$0.6 million
at
December 31, 2016
and
2015
, respectively. Overdraft balances for BankMobile at
December 31, 2016
related primarily to one commercial customer and were collected the next business day.
142
Short-term debt at
December 31, 2016
and
2015
was as follows:
|
|
December 31,
|
||||||||||||
|
|
2016
|
2015
|
|||||||||||
|
|
Amount
|
Rate
|
Amount
|
Rate
|
|||||||||
|
(amounts in thousands)
|
|
||||||||||||
|
FHLB advances
|
$
|
688,800
|
|
0.85
|
%
|
$
|
1,365,300
|
|
0.48
|
%
|
|||
|
Federal funds purchased
|
83,000
|
|
0.74
|
|
70,000
|
|
0.56
|
|
|||||
|
Total short-term debt
|
$
|
771,800
|
|
$
|
1,435,300
|
|
|||||||
The following is a summary of additional information relating to Customers' short-term debt:
|
|
December 31,
|
||||||||||
|
|
2016
|
2015
|
2014
|
||||||||
|
(amounts in thousands)
|
|
||||||||||
|
FHLB advances:
|
|||||||||||
|
Maximum outstanding at any month end
|
$
|
1,697,800
|
|
$
|
1,365,300
|
|
$
|
1,383,000
|
|
||
|
Average balance during the year
|
965,293
|
|
844,835
|
|
898,396
|
|
|||||
|
Weighted-average interest rate during the year
|
0.95
|
%
|
0.60
|
%
|
0.46
|
%
|
|||||
|
Federal funds purchased:
|
|||||||||||
|
Maximum outstanding at any month end
|
137,000
|
|
85,000
|
|
35,000
|
|
|||||
|
Average balance during the year
|
84,514
|
|
41,397
|
|
13,312
|
|
|||||
|
Weighted-average interest rate during the year
|
0.58
|
%
|
0.35
|
%
|
0.31
|
%
|
|||||
At
December 31, 2016
and
2015
, the Bank had aggregate availability under federal funds lines totaling
$237.0 million
and
$175.0 million
, respectively.
Long-term debt
FHLB advances
The contractual maturities of long-term advances from the FHLB were as follows:
|
|
December 31,
|
||||||||||||
|
|
2016
|
2015
|
|||||||||||
|
|
Amount
|
Rate
|
Amount
|
Rate
|
|||||||||
|
(amounts in thousands)
|
|||||||||||||
|
2017
|
$
|
—
|
|
—
|
%
|
$
|
205,000
|
|
1.18
|
%
|
|||
|
2018
|
180,000
|
|
1.32
|
|
55,000
|
|
1.61
|
|
|||||
|
$
|
180,000
|
|
$
|
260,000
|
|
||||||||
Of the
$180.0 million
of long-term advances that mature in 2018,
$170.0 million
are fixed rate.
The Bank had a total maximum borrowing capacity with the Federal Home Loan Bank of
$4.1 billion
and with the Federal Reserve Bank of Philadelphia of
$158.6 million
at
December 31, 2016
. The Bank had a total borrowing capacity with the Federal Home Loan Bank of
$3.7 billion
and with the Federal Reserve Bank of Philadelphia of
$59.2 million
at
December 31, 2015
. Amounts can be borrowed as short-term or long-term. As of
December 31, 2016
, advances under these arrangements were secured by certain assets, which included a blanket lien on securities of
$200.2 million
and qualifying loans of Customers Bank of
$3.9 billion
.
143
Senior notes
On June 26, 2014, the Bancorp closed a private placement transaction in which it issued
$25.0 million
of
4.625%
senior notes due 2019. Interest is paid semi-annually in arrears in June and December.
In July and August 2013, the Bancorp issued
$63.3 million
in aggregate principal amount of senior notes due 2018. The notes bear interest at
6.375%
per year which is payable on March 15, June 15, September 15, and December 15. The notes are unsecured obligations of the Bancorp and rank equally with all of its secured and unsecured senior indebtedness.
Subordinated debt
On June 26, 2014, the Bank closed a private placement transaction in which it issued
$110.0 million
of fixed-to-floating rate subordinated notes due 2029. The subordinated notes bear interest at an annual fixed rate of
6.125%
until June 26, 2024, and interest is paid semiannually. From June 26, 2024, the subordinated notes will bear an annual interest rate equal to three-month LIBOR plus
344.3
basis points until maturity on June 26, 2029. The Bank has the ability to call the subordinated notes, in whole or in part, at a redemption price equal to
100%
of the principal balance at certain times on or after June 26, 2024. The subordinated notes qualify as Tier 2 capital for regulatory capital purposes.
Common Stock
During 2016, Customers Bancorp issued shares of its common stock pursuant to the following public offerings:
On November 9, 2016, Customers Bancorp issued
2,415,000
shares of common stock at a price to the public of
$25.00
per share as part of an underwritten public offering. Customers received net proceeds of
$58.3 million
from the offering, after deducting offering costs.
On August 11, 2016, Customers Bancorp entered into an At Market Issuance Sales Agreement ("the Sales Agreement") with FBR Capital Markets & Co., Keefe, Bruyette & Woods, Inc. and Maxim Group LLC. Customers Bancorp has authorized the sale, at its discretion, of shares of its common stock, in an aggregate offering amount up to
$50 million
under the Sales Agreement. Customers issued
219,386
shares in connection with this Sales Agreement during 2016 receiving net proceeds of
$5.5 million
, net of offering costs.
The net proceeds from the common stock offerings will be used for general corporate purposes, which may include working capital and the funding of organic growth at Customers Bank.
In May 2014, Customers announced that its Board of Directors had declared a
10%
stock dividend to all shareholders of record as of May 27, 2014. This special dividend was paid on June 30, 2014 in the form of an aggregate of
2,429,375
additional shares.
In November 2013, Customers Bancorp announced that its Board of Directors had authorized a stock repurchase plan in which it could acquire up to
5%
of its current outstanding shares at prices not to exceed a
20%
premium over the current book value. The repurchase program may be suspended, modified or discontinued at any time, and the Bancorp has no obligation to repurchase any amount of its common stock under the program. There was no stock repurchased during 2016, 2015 or 2014.
At
December 31, 2016
and 2015, there were warrants outstanding to purchase
184,706
shares and
627,673
shares, respectively, of Customers Bancorp’s common stock. The purchase prices at
December 31, 2016
and
2015
ranged from
$9.55
per share to
$73.01
per share.
144
Preferred Stock
Customers Bancorp currently has
four
series of preferred stock outstanding.
Preferred stock issued during 2016 included the following:
On September 16, 2016, Customers Bancorp issued
3,400,000
shares of Fixed-to-Floating Rate Non-Cumulative Perpetual Preferred Stock, Series F, (the “Series F Preferred Stock”) par value
$1.00
per share, at a price of
$25.00
per share in a public offering. Dividends on the Series F Preferred Stock will accrue and be payable quarterly in arrears, at a fixed rate per annum equal to
6.00%
from the original issue date to, but excluding, December 15, 2021, and thereafter at a floating rate per annum equal to three-month LIBOR on the related dividend determination date plus a spread of
4.762%
per annum. Customers received net proceeds of
$82.2 million
from the offering, after deducting offering costs.
On April 28, 2016, Customers Bancorp issued
2,300,000
shares of Fixed-to-Floating Rate Non-Cumulative Perpetual Preferred Stock, Series E, (the “Series E Preferred Stock”) par value
$1.00
per share, at a price of
$25.00
per share in a public offering. Dividends on the Series E Preferred Stock will accrue and be payable quarterly in arrears, at a fixed rate per annum equal to
6.45%
from the original issue date to, but excluding, June 15, 2021, and thereafter at a floating rate per annum equal to three-month LIBOR on the related dividend determination date plus a spread of
5.14%
per annum. Customers received net proceeds of
$55.6 million
from the offering, after deducting offering costs.
On January 29, 2016, Customers Bancorp issued
1,000,000
shares of Fixed-to-Floating Rate Non-Cumulative Perpetual Preferred Stock, Series D, (the "Series D Preferred Stock") par value
$1.00
per share, at a price of
$25.00
per share in a public offering. Dividends on the Series D Preferred Stock will accrue and be payable quarterly in arrears, at a fixed rate per annum equal to
6.50%
from the original issue date to, but excluding, March 15, 2021, and thereafter at a floating rate per annum equal to three-month LIBOR on the related dividend determination date plus a spread of
5.09%
per annum. Customers received net proceeds of
$24.1 million
from the offering, after deducting offering costs.
Preferred stock issued during 2015 included the following:
On May 18, 2015, Customers Bancorp issued
2,300,000
shares of Fixed-to-Floating Rate Non-Cumulative Perpetual Preferred Stock, Series C, (the "Series C Preferred Stock") par value
$1.00
per share, at a price of
$25.00
per share in a public offering. Dividends on the Series C Preferred Stock will accrue and be payable quarterly in arrears, at a fixed rate per annum equal to
7.00%
from the original issue date to, but excluding, June 15, 2020, and thereafter at a floating rate per annum equal to three-month LIBOR on the related dividend determination date plus a spread of
5.30%
per annum. Customers received net proceeds of
$55.6 million
from the offering, after deducting offering costs.
The net proceeds from the preferred stock offerings will be used for general corporate purposes, which may include working capital and the funding of organic growth at Customers Bank.
Dividends on the Series C, Series D, Series E, and Series F Preferred Stock are not cumulative. If Customers Bancorp's board of directors or a duly authorized committee of the board does not declare a dividend on the Series C, Series D, Series E, and Series F Preferred Stock in respect of a dividend period, then no dividend shall be deemed to have accrued for such dividend period, be payable on the applicable dividend payment date, or be cumulative, and Customers Bancorp will have no obligation to pay any dividend for that dividend period, whether or not the board of directors or a duly authorized committee of the board declares a dividend on the Series C, Series D, Series E, and Series F Preferred Stock for any future dividend period.
The Series C, Series D, Series E, and Series F Preferred Stock have no stated maturity, are not subject to any mandatory redemption, sinking fund or other similar provisions and will remain outstanding unless redeemed at Customers Bancorp's option. Customers Bancorp may redeem the Series C, Series D, Series E and Series F Preferred Stock at its option, at a redemption price equal to
$25.00
per share, plus any declared and unpaid dividends (without regard to any undeclared dividends), (i) in whole or in part, from time to time, on any dividend payment date on or after June 15, 2020 for the Series C Preferred Stock, March 15, 2021 for the Series D Preferred Stock, June 15, 2021 for the Series E Preferred Stock, and December 15, 2021 for the Series F Preferred Stock and or (ii) in whole but not in part, within 90 days following the occurrence of a regulatory capital treatment event. Any redemption of the Series C, Series D, Series E, and Series F Preferred Stock is subject to prior approval of the Board of Governors of the Federal Reserve System. The Series C, Series D, Series E,
145
and Series F Preferred Stock qualify as Tier 1 capital under regulatory capital guidelines. Except in limited circumstances, the Series C, Series D, Series E, and Series F Preferred Stock do not have any voting rights.
Preferred stock dividends paid during 2016 included the following:
On December 15, 2016, Customers made the following dividend payments to preferred shareholders of record as of November 30, 2016:
• a cash dividend on its Series C Preferred Stock of
$0.4375
per share.
• a cash dividend on its Series D Preferred Stock of
$0.40625
per share.
• a cash dividend on its Series E Preferred Stock of
$0.403125
per share.
• a cash dividend on its Series F Preferred Stock of
$0.370833
per share.
On September 15, 2016, Customers made the following dividend payments to preferred shareholders of record as of August 31, 2016:
• a cash dividend on its Series C Preferred Stock of
$0.4375
per share.
• a cash dividend on its Series D Preferred Stock of
$0.40625
per share.
• a cash dividend on its Series E Preferred Stock of
$0.403125
per share.
On June 15, 2016, Customers made the following dividend payments to preferred shareholders of record as of May 31, 2016:
• a cash dividend on its Series C Preferred Stock of
$0.4375
per share.
• a cash dividend on its Series D Preferred Stock of
$0.40625
per share.
• a cash dividend on its Series E Preferred Stock of
$0.210521
per share.
On March 15, 2016, Customers made the following dividend payments to preferred shareholders of record as of February 29, 2016:
• a cash dividend on its Series C Preferred Stock of
$0.4375
per share.
• a cash dividend on its Series D Preferred Stock of
$0.2076
per share.
Preferred stock dividends paid during 2015 included the following:
On December 15, 2015, Customers made the following dividend payment to preferred shareholders of record on November 30, 2015:
|
•
|
a cash dividend on its Series C Preferred Stock of
$0.4375
per share.
|
On September 15, 2015, Customers made the following dividend payment to preferred shareholders of record on August 31, 2015:
•
a cash dividend on its Series C Preferred Stock of
$0.56875
per share.
401(k) Plan
Customers Bank has a 401(k) profit sharing plan whereby eligible team members may contribute amounts up to the annual IRS statutory contribution limit. Customers Bank provides a matching contribution equal to
50%
of the first
6%
of the contribution made by the team member. Employer contributions for the years ended
December 31, 2016
,
2015
, and
2014
were
$1.6 million
,
$1.1 million
, and
$1.0 million
, respectively, including contributions for BankMobile team members. Employer contributions for BankMobile team members for the year ended
December 31, 2016
were
$0.2 million
.
Employer contributions for BankMobile team members prior to 2016 were not material.
146
Supplemental Executive Retirement Plans
Customers Bank entered into a supplemental executive retirement plan (SERP) with its Chairman and Chief Executive Officer that provides annual retirement benefits for a
15
-year period upon the later of his reaching the age of
65
or when he terminates employment. The SERP is a defined-contribution type of deferred compensation arrangement that is designed to provide a target annual retirement benefit of
$300,000
per year for
15 years
starting at age
65
, based on an assumed constant rate of return of
7%
per year. The level of retirement benefit is not guaranteed by the Bank, and the ultimate retirement benefit can be less than or greater than the target. The Bank intends to fund its obligations under the SERP with the increase in cash surrender value of a life insurance policy on the life of the Chairman and Chief Executive Officer which is owned by the Bank. The present value of the amount owed as of
December 31, 2016
was
$3.9 million
and was included in other liabilities.
Summary
During 2010, the shareholders of Customers Bancorp approved the 2010 Stock Option Plan (“2010 Plan”), and during 2012, the shareholders of Customers Bancorp approved the 2012 Amendment and Restatement of the Customers Bancorp, Inc. Amended and Restated 2004 Incentive Equity and Deferred Compensation Plan (“2004 Plan”). The purpose of these plans is to promote the success and enhance the value of the Bancorp by linking the personal interests of the members of the Board of Directors and employees, officers, and executives of Customers to those of the shareholders of Customers and by providing such individuals with an incentive for outstanding performance in order to generate superior returns to shareholders of Customers. The 2010 Plan and 2004 Plan are intended to provide flexibility to Customers in its ability to motivate, attract, and retain the services of members of the Board of Directors, and employees, officers, and executives of Customers. Stock options and restricted stock units normally vest on the third or fifth anniversary of the grant date provided the grantee remains employed by Customers or continues to serve on the Board. With respect to certain stock options granted under the 2010 Plan, vested options shall be exercisable only when Customers' fully diluted tangible book value will have increased by
50%
from the date of grant. Certain share-based awards provide for accelerated vesting if there is a change in control (as defined in the Plans). No stock options may be exercisable for more than
10 years
from the date of grant.
The 2010 and 2004 Plans are administered by the Compensation Committee of the Board of Directors. The 2010 Plan provides exclusively for the grant of stock options, some or all of which may be structured to qualify as Incentive Stock Options, to employees, officers and executives. The maximum number of shares of common stock which may be issued under the 2010 Plan is
3,666,667
shares. The 2004 Plan provides for the grant of options, some or all of which may be structured to qualify as Incentive Stock Options if granted to employees, stock appreciation rights, restricted stock, restricted stock units, and unrestricted stock to employees, officers, executives, and members of the Board of Directors. The maximum number of shares of common stock which may be issued under the 2004 Plan is
2,750,000
shares. At
December 31, 2016
, the aggregate number of shares of common stock available for grant under these plans was
1,360,280
shares.
On January 1, 2011, Customers initiated a Bonus Recognition and Retention Program (“BRRP”). This is a restricted stock unit plan. Employees eligible to participate in the BRRP include the Chief Executive Officer and other senior management and highly compensated employees as determined by the Compensation Committee at its sole discretion. Under the BRRP, a participant may elect to defer not less than
25%
, nor more than
50%
, of his or her bonus payable with respect to each year of participation. Shares of Voting Common Stock having a value equal to the portion of the bonus deferred by a participant are allocated to an annual deferral account, and a matching amount equal to an identical number of shares of common stock is also allocated to the annual deferral account. A participant becomes
100%
vested in the annual deferral account on the fifth anniversary date of the initial funding of the account, provided he or she remains continuously employed by Customers from the date of funding to the anniversary date.
Vesting is accelerated in the event of involuntary termination other than for cause, retirement at or after age
65
, death, termination on account of disability, or a change in control of Customers. Participants were first eligible to make elections under the BRRP with respect to their bonuses for 2011, which were payable in first quarter 2012. The BRRP does not provide for a specific number of shares to be reserved; by its terms, the award of restricted stock units under this plan is limited by the amount of cash bonuses paid to the participants in the plan. At
December 31, 2016
, restricted stock units outstanding under this plan totaled
340,165
.
Share-based compensation expense relating to stock options and restricted stock units is recognized on a straight-line basis over the vesting periods of the awards and is a component of salaries and employee benefits expense. Total share-based compensation expense for
2016
,
2015
, and
2014
was
$6.2 million
,
$4.9 million
, and $
4.2 million
, respectively, including share-based compensation expense for BankMobile team members. Share based compensation related to BankMobile team members for
2016
and
2015
was
$0.6 million
and
$0.1 million
, respectively. Share based compensation related to BankMobile team
147
members 2014 was not material. At
December 31, 2016
, there was
$13.1 million
of unrecognized compensation cost related to all non-vested share-based compensation awards. This cost is expected to be recognized through
December 2021
.
In 2014, the shareholders of Customers Bancorp approved the 2014 Employee Stock Purchase Plan (the "ESPP"). The ESPP is intended to encourage team member participation in the ownership and economic progress of Customers. This plan is intended to qualify as an employee stock purchase plan within the meaning of the Internal Revenue Code and is administered by the Compensation Committee of the Board of Directors.
Under the ESPP, team members may elect to purchase shares of Customers' common stock through payroll deduction. Because the purchase price under the plan is
85%
of the fair market value of a share of common stock on the first day of each quarterly subscription period (a
15%
discount to the market price), Customers' ESPP is considered to be a compensatory plan under current accounting guidance. Therefore, the entire amount of the discount is recognizable compensation expense. ESPP expense for
2016
and
2015
was
$103 thousand
and
$80 thousand
, respectively.
Stock Options
Customers estimated the fair value of each option on the date of grant using the Black-Scholes option pricing model. The risk-free interest rate was based upon the zero-coupon Treasury rates in effect on the grant date of the options based on the expected life of the option. Expected volatility was based upon limited historical information because Customers' common stock has only been traded since February 2012. Expected life was management’s estimate which took into consideration the vesting requirement, generally
three
or
five
years.
During
2016
, options to purchase an aggregate of
297,725
shares of Customers Bancorp voting common stock were granted to certain officers and team members. The exercise price for the options granted is equal to the closing price of Customers Bancorp's voting common stock on the date of grant. The majority of the options issued are subject to a
five
-year cliff vesting and expire after
ten
years. In addition to the
five
-year service requirement,
277,725
of the options issued must meet one of the following conditions in order for the options to become exercisable:
|
•
|
Total shareholder returns over the
five
-year vesting period must be a minimum of
50%
, or
|
|
•
|
Customers Bancorp must have achieved at least a
7%
compound annual increase in core earnings per share over the five-year vesting period.
|
Customers evaluated the likelihood that at least one of these conditions would be met over the requisite service period and determined that it was more likely than not that one of the conditions would be satisfied (based upon historical performance). Accordingly, the grant-date fair value of these awards is being recognized as expense over the
five
-year vesting period.
The following table presents the weighted-average assumptions used and the resulting weighted-average fair value of each option granted for the periods presented.
|
2016
|
2015
|
2014
|
|||||||||
|
Weighted-average risk-free interest rate
|
1.84
|
%
|
1.90
|
%
|
2.16
|
%
|
|||||
|
Expected dividend yield
|
—
|
%
|
—
|
%
|
—
|
%
|
|||||
|
Weighted-average expected volatility
|
23.39
|
%
|
21.18
|
%
|
18.00
|
%
|
|||||
|
Weighted-average expected life (in years)
|
7.00
|
|
7.00
|
|
7.00
|
|
|||||
|
Weighted-average fair value of each option granted
|
$
|
7.61
|
|
$
|
6.42
|
|
$
|
4.52
|
|
||
148
The following summarizes stock option activity for the year ended
December 31, 2016
:
|
Number
of Shares
|
Weighted-
average
Exercise
Price
|
Weighted-
average
Remaining
Contractual
Term
in Years
|
Aggregate
Intrinsic
Value
|
|||||||||
|
(dollars in thousands, except weighted-average exercise price)
|
||||||||||||
|
Outstanding, December 31, 2015
|
3,731,761
|
|
$
|
14.33
|
|
|||||||
|
Granted
|
297,725
|
|
25.92
|
|
||||||||
|
Exercised
|
(46,171
|
)
|
10.31
|
|
658
|
|
||||||
|
Forfeited
|
(23,275
|
)
|
13.90
|
|
||||||||
|
Outstanding, December 31, 2016
|
3,960,040
|
|
$
|
15.25
|
|
6.10
|
$
|
81,439
|
|
|||
|
Exercisable at December 31, 2016
|
1,094,078
|
|
$
|
10.03
|
|
3.77
|
$
|
28,221
|
|
|||
Cash received from the exercise of options during the year ended
December 31, 2016
was
$0.5 million
with a related tax benefit of
$0.2 million
.
A summary of the status of Customers' non-vested options at
December 31, 2016
and changes during the year ended
December 31, 2016
was as follows:
|
Options
|
Weighted-
average
exercise price
|
|||||
|
Non-vested at December 31, 2015
|
3,026,766
|
|
$
|
15.53
|
|
|
|
Granted
|
297,725
|
|
25.92
|
|
||
|
Vested
|
(435,254
|
)
|
14.97
|
|
||
|
Forfeited
|
(23,275
|
)
|
13.90
|
|
||
|
Non-vested at December 31, 2016
|
2,865,962
|
|
17.24
|
|
||
Restricted Stock Units
The fair value of restricted stock units granted under the 2004 Plan is generally determined based on the closing market price of Customers' common stock on the date of grant. The fair value of restricted stock units granted under the BRRP is measured as of the date on which such portion of the bonus would have been paid had the deferral not been elected.
In February 2012, the Compensation Committee recommended and the Board of Directors approved a restricted stock award that had
two
vesting requirements. The first requirement was that the recipient remained an employee or director through December 31, 2016. The second requirement was that Customers' Voting Common Stock will have traded at a price greater than $
17.18
per share (adjusted for any stock splits or stock dividends) for at least
five
consecutive trading days during the five-year period ending December 31, 2016. This second requirement was satisfied during fourth quarter 2013. Pursuant to the terms of this award,
375,402
of restricted stock units vested on December 31, 2016.
There were
247,285
restricted stock units granted during the year ended
December 31, 2016
. Of the aggregate restricted stock units granted,
86,654
were granted under the Bonus Recognition and Retention Program and are subject to
five
-year cliff vesting. The remaining
160,631
units were granted under the Bancorp's Restated and Amended 2004 Incentive Equity and Deferred Compensation Plan and are subject to either a
three
-year waterfall vesting (with one third of the amount vesting annually) or a three-year cliff vesting.
149
The table below presents the status of the restricted stock units at
December 31, 2016
and changes during the year ended
December 31, 2016
:
|
Restricted
Stock Units
|
Weighted-
average grant-
date fair value
|
|||||
|
Outstanding and unvested at December 31, 2015
|
873,264
|
|
$
|
14.24
|
|
|
|
Granted
|
247,285
|
|
23.85
|
|
||
|
Vested
|
(473,066
|
)
|
12.15
|
|
||
|
Forfeited
|
(1,978
|
)
|
22.84
|
|
||
|
Outstanding and unvested at December 31, 2016
|
645,505
|
|
$
|
19.43
|
|
|
Customers has a policy that permits its directors to elect to receive shares of Voting Common Stock in lieu of their cash retainers. During the year ended
December 31, 2016
, Customers issued
29,079
shares of Voting Common Stock with a fair value of
$0.8 million
to the directors as compensation for their services. The fair values were generally determined based on the closing price of the common stock the day before the shares were issued.
The components of income tax expense were as follows:
|
For the Years Ended December 31,
|
|||||||||||
|
2016
|
2015
|
2014
|
|||||||||
|
(amounts in thousands)
|
|||||||||||
|
Current
|
$
|
53,991
|
|
$
|
42,756
|
|
$
|
27,169
|
|
||
|
Deferred
|
(2,579
|
)
|
(10,092
|
)
|
(6,187
|
)
|
|||||
|
Income tax expense from continuing operations
|
51,412
|
|
32,664
|
|
20,982
|
|
|||||
|
Income tax benefit from discontinued operations
|
(5,519
|
)
|
(2,752
|
)
|
(808
|
)
|
|||||
|
Total
|
$
|
45,893
|
|
$
|
29,912
|
|
$
|
20,174
|
|
||
Effective tax rates differ from the federal statutory rate of
35%
, which is applied to income before income tax expense, due to the following:
|
For the Years Ended December 31,
|
||||||||||||||||||||
|
2016
|
2015
|
2014
|
||||||||||||||||||
|
Amount
|
% of
pretax income |
Amount
|
% of
pretax income |
Amount
|
% of
pretax income |
|||||||||||||||
|
(amounts in thousands)
|
||||||||||||||||||||
|
Federal income tax at statutory rate
|
$
|
48,691
|
|
35.00
|
%
|
$
|
33,508
|
|
35.00
|
%
|
$
|
22,930
|
|
35.00
|
%
|
|||||
|
State income tax
|
4,983
|
|
3.58
|
|
1,651
|
|
1.72
|
|
1,418
|
|
2.16
|
|
||||||||
|
Tax-exempt interest, net of disallowance
|
(237
|
)
|
(0.17
|
)
|
(277
|
)
|
(0.29
|
)
|
(249
|
)
|
(0.38
|
)
|
||||||||
|
Bank-owned life insurance
|
(1,716
|
)
|
(1.23
|
)
|
(2,422
|
)
|
(2.53
|
)
|
(1,296
|
)
|
(1.98
|
)
|
||||||||
|
Equity-based compensation benefit
|
(3,715
|
)
|
(2.67
|
)
|
—
|
|
—
|
|
—
|
|
—
|
|
||||||||
|
Unrecorded basis difference in foreign subsidiary
|
2,830
|
|
2.03
|
|
—
|
|
—
|
|
—
|
|
—
|
|
||||||||
|
Other
|
576
|
|
0.42
|
|
204
|
|
0.22
|
|
(1,821
|
)
|
(2.77
|
)
|
||||||||
|
Effective income tax rate
|
$
|
51,412
|
|
36.96
|
%
|
$
|
32,664
|
|
34.12
|
%
|
$
|
20,982
|
|
32.03
|
%
|
|||||
150
Customers accounts for income taxes under the liability method of accounting for income taxes. The income tax accounting guidance results in two components of income tax expense: current and deferred. Current income tax expense reflects taxes to be paid or refunded for the current period by applying the provisions of the enacted tax law to the taxable income or excess of deductions over revenues. Customers determines deferred income taxes using the liability (or balance sheet) method. Under this method, the net deferred tax asset or liability is based on the tax effects of the differences between the book and tax bases of assets and liabilities, and enacted changes in tax rates and laws are recognized in the period in which they occur.
A tax position is recognized if it is more likely than not, based on the technical merits, that the tax position will be realized or sustained upon examination. The term more likely than not means a likelihood of more than
50 percent
; the terms examined and upon examination also include resolution of the related appeals or litigation process, if any. A tax position that meets the more likely than not recognition threshold is initially and subsequently measured as the largest amount of tax benefit that has a greater than
50 percent
likelihood of being realized upon settlement with a taxing authority that has full knowledge of all relevant information. The determination of whether or not a tax position has met the more likely than not recognition threshold considers the facts, circumstances, and information available at the reporting date and is subject to management’s judgment.
At
December 31, 2016
and
2015
, Customers had no ASC 740-10 unrecognized tax benefits. Customers does not expect the total amount of unrecognized tax benefits to significantly increase within the next twelve months. Customers recognizes interest and penalties on unrecognized tax benefits in other expense.
Realization of deferred tax assets is dependent upon the generation of future taxable income or the existence of sufficient taxable income within the carry-back period. A valuation allowance is provided when it is more likely than not that some portion of the deferred tax assets will not be realized. We have not recorded a deferred tax asset on our unrecorded basis difference in our foreign subsidiary because we currently do not expect it to reverse in the foreseeable future. In assessing the need for a valuation allowance, management considers the scheduled reversal of the deferred tax liabilities, the level of historical taxable income, and the projected future taxable income over the periods in which the temporary differences comprising the deferred tax assets will be deductible. Based on its assessment, management determined that no valuation allowance is necessary at
December 31, 2016
and
2015
.
Deferred income taxes reflect temporary differences in the recognition of revenue and expenses for tax reporting and financial statement purposes, principally because certain items are recognized in different periods for financial reporting and tax return purposes. The following represents the Bancorp's deferred tax asset and liabilities as
December 31, 2016
and
2015
:
151
|
December 31,
|
|||||||
|
2016
|
2015
|
||||||
|
(amounts in thousands)
|
|
||||||
|
Deferred tax assets:
|
|||||||
|
Allowance for loan losses
|
$
|
14,540
|
|
$
|
13,248
|
|
|
|
Net unrealized losses on securities
|
1,714
|
|
3,112
|
|
|||
|
OREO expenses
|
1,233
|
|
728
|
|
|||
|
Non-accrual interest
|
589
|
|
840
|
|
|||
|
Net operating losses
|
2,137
|
|
2,290
|
|
|||
|
Deferred compensation
|
1,523
|
|
1,337
|
|
|||
|
Equity-based compensation
|
5,548
|
|
5,196
|
|
|||
|
Fair value adjustments on acquisitions
|
—
|
|
428
|
|
|||
|
Cash flow hedge
|
1,413
|
|
1,679
|
|
|||
|
Incentive compensation
|
3,041
|
|
2,497
|
|
|||
|
Other
|
1,972
|
|
1,374
|
|
|||
|
Total deferred tax assets
|
33,710
|
|
32,729
|
|
|||
|
Deferred tax liabilities:
|
|||||||
|
Fair value adjustments on acquisitions
|
(1,039
|
)
|
—
|
|
|||
|
Net deferred loan fees
|
(1,090
|
)
|
(2,688
|
)
|
|||
|
Bank premises and equipment
|
(713
|
)
|
(875
|
)
|
|||
|
Other
|
(1,379
|
)
|
(592
|
)
|
|||
|
Total deferred tax liabilities
|
(4,221
|
)
|
(4,155
|
)
|
|||
|
Net deferred tax asset
|
$
|
29,489
|
|
$
|
28,574
|
|
|
Customers had approximately
$6.1 million
of federal net operating loss carryovers at
December 31, 2016
, that expire in
2025 through 2031
.
Customers is subject to U.S. federal income tax as well as income tax in various state and local taxing jurisdictions. Generally, Customers is no longer subject to examination by federal, state and local taxing authorities for years prior to December 31, 2013.
Customers has had, and may be expected to have in the future, banking transactions in the ordinary course of business with its executive officers, directors, principal shareholders, their immediate families and affiliated companies (commonly referred to as related parties). The activity relating to loans to such persons was as follows:
|
For the Years Ended December 31,
|
|||||||||||
|
2016
|
2015
|
2014
|
|||||||||
|
(amounts in thousands)
|
|||||||||||
|
Balance – January 1
|
$
|
220
|
|
$
|
9
|
|
$
|
7,273
|
|
||
|
Additions
|
1,160
|
|
2,218
|
|
5
|
|
|||||
|
Repayments
|
(1,142
|
)
|
(2,007
|
)
|
(7,269
|
)
|
|||||
|
Balance – December 31
|
$
|
238
|
|
$
|
220
|
|
$
|
9
|
|
||
As of December 31, 2016 and 2015, Customers Bank had an outstanding commitment to provide short-term commercial real estate financing, subject to certain terms and conditions, not to exceed
$8.0 million
, and an available line of credit of
$1.8 million
with one of its related parties.
152
Some current directors, nominees for director and executive officers of Customers and entities or organizations in which they were executive officers or the equivalent or owners of more than
10%
of the equity were customers of and had transactions with or involving Customers in the ordinary course of business during the fiscal year ended
December 31, 2016
. None of these transactions involved amounts in excess of
5%
of the Customers' gross revenues during
2016
nor was Customers indebted to any of the foregoing persons or entities in an aggregate amount in excess of
5%
of Customers' total assets at
December 31, 2016
. Additional transactions with such persons and entities may be expected to take place in the ordinary course of business in the future.
At
December 31, 2016
and
2015
, the Bank had approximately
$6.4 million
and
$14.0 million
, respectively, in deposits from related parties, including directors and certain executive officers.
During 2015 and
2014
, Customers paid
$27,300
and
$46,900
to Jaxxon Promotions, Inc., a company in which a Bancorp director owns
25%
interest.
No
payments were made to Jaxxon Promotions, Inc. in 2016.
153
Customers is a party to financial instruments with off-balance-sheet risk in the normal course of business to meet the financing needs of its customers. These financial instruments include commitments to extend credit and letters of credit. Those instruments involve, to varying degrees, elements of credit risk in excess of the amount recognized in the consolidated balance sheets.
Customers' exposure to credit loss in the event of nonperformance by the other party to the financial instrument for commitments to extend credit is represented by the contractual amount of those instruments. Customers uses the same credit policies in making commitments and conditional obligations as it does for on-balance-sheet instruments.
The following financial instruments were outstanding whose contract amounts represent credit risk:
|
December 31,
|
|||||||
|
2016
|
2015
|
||||||
|
(amounts in thousands)
|
|||||||
|
Commitments to fund loans
|
$
|
244,784
|
|
$
|
537,380
|
|
|
|
Unfunded commitments to fund mortgage warehouse loans
|
1,230,596
|
|
1,302,759
|
|
|||
|
Unfunded commitments under lines of credit
|
480,446
|
|
436,550
|
|
|||
|
Letters of credit
|
40,223
|
|
42,002
|
|
|||
|
Other unused commitments
|
5,310
|
|
6,360
|
|
|||
Commitments to extend credit are agreements to lend to a customer as long as there is no violation of any condition established in the contract. Because many of the commitments are expected to expire without being drawn upon, the total commitment amounts do not necessarily represent future cash requirements. Mortgage warehouse loan commitments are agreements to purchase mortgage loans from mortgage bankers that agree to purchase the loans back in a short period of time. These commitments generally fluctuate monthly as existing loans are repurchased by the mortgage bankers and new loans are purchased by Customers.
Commitments generally have fixed expiration dates or other termination clauses and may require payment of a fee. Customers evaluates each customer’s credit worthiness on a case-by-case basis. The amount of collateral obtained, if deemed necessary by Customers upon extension of credit, is based on management’s credit evaluation. Collateral held varies but may include personal or commercial real estate, accounts receivable, inventory and equipment.
Outstanding letters of credit written are conditional commitments issued by Customers to guarantee the performance of a customer to a third party. The majority of these standby letters of credit expire within the next year. The credit risk involved in issuing letters of credit is essentially the same as that involved in extending other loan commitments. Customers requires collateral supporting these letters of credit as deemed necessary. Management believes that the proceeds obtained through a liquidation of such collateral would be sufficient to cover the maximum potential amount of future payments required under the corresponding guarantees. The current amount of the liabilities as of
December 31, 2016
and
2015
for guarantees under standby letters of credit issued was not material.
154
The Bank and the Bancorp are subject to various regulatory capital requirements administered by the federal banking agencies. Failure to meet the minimum capital requirements can result in certain mandatory, and possibly additional discretionary, actions by regulators that, if undertaken, could have a direct material effect on Customers' financial statements. Under capital adequacy guidelines and the regulatory framework for prompt corrective action, the Bank and Bancorp must meet specific capital guidelines that involve quantitative measures of their assets, liabilities and certain off-balance sheet items, as calculated under the regulatory accounting practices. The capital amounts and classification are also subject to qualitative judgments by the regulators about components, risk weightings and other factors. Prompt corrective action provisions are not applicable to bank holding companies.
Quantitative measures established by regulation to ensure capital adequacy require the Bank and Bancorp to maintain minimum amounts and ratios (set forth in the following table) of common equity Tier 1, Tier 1, total capital to risk-weighted assets, and Tier 1 capital to average assets (as defined in the regulations). At
December 31, 2016
and
2015
, the Bank and the Bancorp met all capital adequacy requirements to which they were subject.
The Dodd-Frank Act required the Federal Reserve Bank to establish minimum consolidated capital requirements for bank holding companies that are as stringent as those required for insured depositary subsidiaries. In 2013, the federal banking agencies approved rules that implemented the Dodd-Frank requirements and certain other regulatory capital reforms effective January 1, 2015, that (i) introduced a new capital ratio pursuant to the prompt corrective action provisions, the common equity tier 1 capital to risk weighted assets ratio, (ii) increased the adequately capitalized and well capitalized thresholds for the Tier 1 risk based capital ratios to
6%
and
8%
, respectively, (iii) changed the treatment of certain capital components for determining Tier 1 and Tier 2 capital, and (iv) changed the risk weighting of certain assets and off balance sheet items in determining risk weighted assets.
155
Generally, to be considered adequately capitalized, or well capitalized, respectively, an institution must at least maintain the common equity Tier 1, Tier 1 and total risk based ratios and the Tier 1 leveraged ratio in excess of the related minimum ratios set forth in the following table.
|
|
Actual
|
For Capital Adequacy
Purposes
(Minimum Plus Capital Buffer)
|
To Be Well Capitalized
Under
Prompt Corrective Action
Provisions
|
|||||||||||||||||
|
(amounts in thousands)
|
Amount
|
Ratio
|
Amount
|
Ratio
|
Amount
|
Ratio
|
||||||||||||||
|
December 31, 2016
|
||||||||||||||||||||
|
Common equity Tier 1 (to risk-weighted assets)
|
||||||||||||||||||||
|
Customers Bancorp, Inc.
|
$
|
628,139
|
|
8.487
|
%
|
$
|
379,306
|
|
5.125
|
%
|
N/A
|
|
N/A
|
|
||||||
|
Customers Bank
|
$
|
857,421
|
|
11.626
|
%
|
$
|
377,973
|
|
5.125
|
%
|
$
|
479,380
|
|
6.500
|
%
|
|||||
|
Tier 1 capital (to risk-weighted assets)
|
||||||||||||||||||||
|
Customers Bancorp, Inc.
|
$
|
844,755
|
|
11.414
|
%
|
$
|
490,322
|
|
6.625
|
%
|
N/A
|
|
N/A
|
|
||||||
|
Customers Bank
|
$
|
857,421
|
|
11.626
|
%
|
$
|
488,599
|
|
6.625
|
%
|
$
|
590,006
|
|
8.000
|
%
|
|||||
|
Total capital (to risk-weighted assets)
|
||||||||||||||||||||
|
Customers Bancorp, Inc.
|
$
|
966,097
|
|
13.053
|
%
|
$
|
638,343
|
|
8.625
|
%
|
N/A
|
|
N/A
|
|
||||||
|
Customers Bank
|
$
|
1,003,609
|
|
13.608
|
%
|
$
|
636,101
|
|
8.625
|
%
|
$
|
737,508
|
|
10.000
|
%
|
|||||
|
Tier 1 capital (to average assets)
|
||||||||||||||||||||
|
Customers Bancorp, Inc.
|
$
|
844,755
|
|
9.067
|
%
|
$
|
372,652
|
|
4.000
|
%
|
N/A
|
|
N/A
|
|
||||||
|
Customers Bank
|
$
|
857,421
|
|
9.233
|
%
|
$
|
371,466
|
|
4.000
|
%
|
$
|
464,333
|
|
5.000
|
%
|
|||||
|
December 31, 2015
|
||||||||||||||||||||
|
Common equity Tier 1 (to risk-weighted assets)
|
||||||||||||||||||||
|
Customers Bancorp, Inc.
|
$
|
500,624
|
|
7.610
|
%
|
$
|
296,014
|
|
4.500
|
%
|
N/A
|
|
N/A
|
|
||||||
|
Customers Bank
|
$
|
565,217
|
|
8.620
|
%
|
$
|
294,916
|
|
4.500
|
%
|
$
|
425,990
|
|
6.500
|
%
|
|||||
|
Tier 1 capital (to risk-weighted assets)
|
||||||||||||||||||||
|
Customers Bancorp, Inc.
|
$
|
556,193
|
|
8.460
|
%
|
$
|
394,685
|
|
6.000
|
%
|
N/A
|
|
N/A
|
|
||||||
|
Customers Bank
|
$
|
565,217
|
|
8.620
|
%
|
$
|
393,221
|
|
6.000
|
%
|
$
|
524,295
|
|
8.000
|
%
|
|||||
|
Total capital (to risk-weighted assets)
|
||||||||||||||||||||
|
Customers Bancorp, Inc.
|
$
|
698,323
|
|
10.620
|
%
|
$
|
526,247
|
|
8.000
|
%
|
N/A
|
|
N/A
|
|
||||||
|
Customers Bank
|
$
|
710,864
|
|
10.850
|
%
|
$
|
524,295
|
|
8.000
|
%
|
$
|
655,369
|
|
10.000
|
%
|
|||||
|
Tier 1 capital (to average assets)
|
||||||||||||||||||||
|
Customers Bancorp, Inc.
|
$
|
556,193
|
|
7.160
|
%
|
$
|
310,812
|
|
4.000
|
%
|
N/A
|
|
N/A
|
|
||||||
|
Customers Bank
|
$
|
565,217
|
|
7.300
|
%
|
$
|
309,883
|
|
4.000
|
%
|
$
|
387,353
|
|
5.000
|
%
|
|||||
The new risk-based capital rules adopted effective January 1, 2015 required that banks and holding companies maintain a "capital conservation buffer" of 250 basis points in excess of the "minimum capital ratio." The minimum capital ratio is equal to the prompt corrective action adequately capitalized threshold ratio. The capital conservation buffer will be phased in over four years beginning on January 1, 2016, with a maximum buffer of
0.625%
of risk weighted assets for 2016,
1.25%
for 2017,
1.875%
for 2018, and
2.5%
for 2019 and thereafter.
Effective January 1, 2016, the capital level required to avoid limitation on elective distributions applicable to the Bancorp and the Bank were as follows:
(i) a common equity Tier 1 risk-based capital ratio of
5.125%
;
(ii) a Tier 1 risk-based capital ratio of
6.625%
; and
(iii) a Total risk-based capital ratio of
8.625%
.
Failure to maintain the required capital conservation buffer will result in limitations on capital distributions and on discretionary bonuses to executive officers.
156
Customers uses fair value measurements to record fair value adjustments to certain assets and liabilities and to disclose the fair value of its financial instruments. FASB Accounting Standards Codification ("ASC") Topic 825,
Financial Instruments
, requires disclosure of the estimated fair value of an entity’s assets and liabilities considered to be financial instruments. For Customers, as for most financial institutions, the majority of its assets and liabilities are considered to be financial instruments. However, many of these instruments lack an available trading market as characterized by a willing buyer and willing seller engaging in an exchange transaction. For fair value disclosure purposes, Customers utilized certain fair value measurement criteria under the FASB ASC 820,
Fair Value Measurements and Disclosures
, as explained below.
In accordance with ASC 820, the fair value of a financial instrument is the price that would be received to sell an asset or paid to transfer a liability in an orderly transaction between market participants at the measurement date. Fair value is best determined based upon quoted market prices. However, in many instances, there are no quoted market prices for Customers’ various financial instruments. In cases where quoted market prices are not available, fair values are based on estimates using present value or other valuation techniques. Those techniques are significantly affected by the assumptions used, including the discount rate and estimates of future cash flows. Accordingly, the fair value estimates may not be realized in an immediate settlement of the instrument.
The fair value guidance provides a consistent definition of fair value, focusing on an exit price in an orderly transaction (that is, not a forced liquidation or distressed sale) between market participants at the measurement date under current market conditions. If there has been a significant decrease in the volume and level of activity for the asset or liability, a change in valuation technique or the use of multiple valuation techniques may be appropriate. In such instances, determining the price at which willing market participants would transact at the measurement date under current market conditions depends on the facts and circumstances and requires the use of significant judgment. The fair value is a reasonable point within the range that is most representative of fair value under current market conditions.
The fair value guidance also establishes a fair value hierarchy and describes the following three levels used to classify fair value measurements:
|
Level 1:
|
Unadjusted quoted prices in active markets that are accessible at the measurement date for identical, unrestricted assets or liabilities.
|
|
Level 2:
|
Quoted prices in markets that are not active, or inputs that are observable either directly or indirectly, for substantially the full term of the asset or liability.
|
|
Level 3:
|
Prices or valuation techniques that require inputs that are both significant to the fair value measurement and unobservable (i.e., supported with little or no market activity).
|
A financial instrument’s level within the fair value hierarchy is based on the lowest level of input that is significant to the fair value measurement.
The following methods and assumptions were used to estimate the fair values of Customers’ financial instruments as of
December 31, 2016
and
2015
:
Cash and cash equivalents:
The carrying amounts reported on the balance sheet for cash and cash equivalents approximate those assets’ fair values. These assets are included as Level 1 fair values, based upon the lowest level of input that is significant to the fair value measurements.
157
Investment securities:
The fair values of investment securities available for sale are determined by obtaining quoted market prices on nationally recognized and foreign securities exchanges (Level 1), matrix pricing (Level 2), which is a mathematical technique used widely in the industry to value debt securities without relying exclusively on quoted market prices for the specific securities, but rather by relying on the securities’ relationship to other benchmark quoted prices, or externally developed models that use unobservable inputs due to limited or no market activity of the instrument (Level 3). These assets are included as Level 1, 2, or 3 fair values, based upon the lowest level of input that is significant to the fair value measurements.
The carrying amount of FHLB, Federal Reserve Bank, and other restricted stock approximates fair value, and considers the limited marketability of such securities. These assets are classified as Level 2 fair values, based upon the lowest level of input that is significant to the fair value measurements.
Loans held for sale - Residential mortgage loans:
The Bank generally estimates the fair values of residential mortgage loans held for sale based on commitments on hand from investors within the secondary market for loans with similar characteristics. These assets are included as Level 2 fair values, based upon the lowest level of input that is significant to the fair value measurements.
Loans held for sale - Mortgage warehouse loans:
The fair value of mortgage warehouse loans is the amount of cash initially advanced to fund the mortgage, plus accrued interest and fees, as specified in the respective agreements. The loan is used by mortgage companies as short-term bridge financing between the funding of mortgage loans and the finalization of the sale of the loans to an investor. Changes in fair value are not expected to be recognized since at inception of the transaction the underlying loans have already been sold to an approved investor. Additionally, the interest rate is variable, and the transaction is short-term, with an average life of
22 days
from purchase to sale. These assets are included as Level 2 fair values, based upon the lowest level of input that is significant to the fair value measurements.
Loans held for sale - Multi-family loans:
The fair values of multi-family loans held for sale are estimated using pricing indications from letters of intent with third party investors, recent sale transactions within the secondary markets for loans with similar characteristics, non-binding indicative bids from brokers, or estimates made by management considering current market rates and terms. These assets are included as Level 3 fair values, based upon the lowest level of input that is significant to the fair value measurements.
Loans receivable, net of allowance for loan losses:
The fair values of loans held for investment are estimated using discounted cash flows, using market rates at the balance sheet date that reflect the credit and interest rate-risk inherent in the loans. Projected future cash flows are calculated based upon contractual maturity or call dates, projected repayments and prepayments of principal. Generally, for variable rate loans that reprice frequently and with no significant change in credit risk, fair values are based on carrying values. These assets are included as Level 3 fair values, based upon the lowest level of input that is significant to the fair value measurements.
Impaired loans:
Impaired loans are those that are accounted for under ASC 310,
Receivables
, in which the Bank has measured impairment generally based on the fair value of the loan’s collateral or discounted cash flow analysis. Fair value is generally determined based upon independent third-party appraisals of the properties that collateralize the loans, or discounted cash flows based upon the expected proceeds. These assets are included as Level 3 fair values, based upon the lowest level of input that is significant to the fair value measurements.
Other real estate owned:
The fair value of other real estate owned ("OREO") is determined using appraisals, which may be discounted based on management’s review and changes in market conditions or sales agreements with third parties. All appraisals must be performed in accordance with the Uniform Standards of Professional Appraisal Practice. Appraisals are certified to the Bank and performed by appraisers on the Bank’s approved list of appraisers. Evaluations are completed by a person independent of management. The content of the appraisal depends on the complexity of the property. Appraisals are completed on a “retail value” and an “as is value”. These assets are included as Level 3 fair values, based upon the lowest level of input that is significant to the fair value measurements.
158
Deposit liabilities:
The fair values disclosed for interest and non-interest checking, passbook savings and money market deposit accounts are, by definition, equal to the amount payable on demand at the reporting date (i.e., their carrying amounts). These liabilities are classified as Level 1 fair values, based upon the lowest level of input that is significant to the fair value measurements.
Fair values for fixed-rate certificates of deposit are estimated using a discounted cash flow calculation that applies interest rates currently being offered in the market on certificates to a schedule of aggregated expected monthly maturities on time deposits. These liabilities are included as Level 2 fair values, based upon the lowest level of input that is significant to the fair value measurements.
Federal funds purchased:
For these short-term instruments, the carrying amount is considered a reasonable estimate of fair value. These liabilities are classified as Level 1 fair values, based upon the lowest level of input that is significant to the fair value measurements.
Borrowings:
Borrowings consist of long-term and short-term FHLB advances,
5
-year senior unsecured notes, and subordinated debt. For the short-term borrowings, the carrying amount is considered a reasonable estimate of fair value and is classified as a Level 1 fair values measurement. Fair values of long-term FHLB advances are estimated using discounted cash flow analysis, based on quoted prices for new FHLB advances with similar credit risk characteristics, terms and remaining maturity. The prices obtained from this active market represent a market value that is deemed to represent the transfer price if the liability were assumed by a third party. Fair values of privately placed subordinated and senior unsecured debt are estimated by a third-party financial adviser using discounted cash flow analysis, based on market rates currently offered on such debt with similar credit-risk characteristics, terms and remaining maturity. These liabilities are included as Level 2 fair values, based upon the lowest level of input that is significant to the fair value measurements. The
$63 million
senior unsecured notes issued during third quarter 2013 are traded on the New York Stock Exchange, and their price can be obtained daily. This fair value measurement is classified as Level 1.
Derivatives (Assets and Liabilities):
The fair values of interest rate swaps and credit derivatives are determined using models that incorporate readily observable market data into a market standard methodology. This methodology nets the discounted future fixed cash receipts and the discounted expected variable cash payments. The discounted variable cash payments are based on expectations of future interest rates derived from observable market interest rate curves. In addition, fair value is adjusted for the effect of nonperformance risk by incorporating credit valuation adjustments for the Bank and its counterparties. These assets and liabilities are included as Level 2 fair values, based upon the lowest level of input that is significant to the fair value measurements.
The fair values of the residential mortgage loan commitments are derived from the estimated fair values that can be generated when the underlying mortgage loan is sold in the secondary market. The Bank generally uses commitments on hand from third party investors to estimate an exit price, and adjusts for the probability of the commitment being exercised based on the Bank’s internal experience (i.e., pull-through rate). These assets and liabilities are included as Level 3 fair values, based upon the lowest level of input that is significant to the fair value measurements.
Derivative assets and liabilities are presented in "Other assets" and "Accrued interest payable and other liabilities" on the consolidated balance sheet.
Assets and Liabilities held for sale:
Assets and liabilities held for sale are recorded at the lower of cost basis or market value. Assets classified as held for sale at
December 31, 2016
were
$79.3 million
. Included in assets held for sale were financial instruments including restricted cash of
$20 million
(Level 1) and loans receivable of
$12.2 million
(Level 3). The remaining assets designated as held for sale consist of goodwill, intangibles and other assets not designated as financial instruments. Liabilities classified as held for sale consisted primarily of
$457.0 million
of transaction deposit accounts (Level 1). The remaining liabilities classified as held for sale consist of accrued liabilities not considered financial instruments under ASC 825 - Financial Instruments.
159
Off-balance-sheet financial instruments:
The fair values of unused commitments to lend and standby letters of credit are considered to be the same as their contractual amounts.
The following information should not be interpreted as an estimate of Customers' fair value in its entirety because fair value calculations are only provided for a limited portion of Customers’ assets and liabilities. Due to a wide range of valuation techniques and the degree of subjectivity used in making these estimates, comparisons between Customers’ disclosures and those of other companies may not be meaningful.
The estimated fair values of Customers’ financial instruments were as follows at
December 31, 2016
and
2015
.
|
Carrying
Amount
|
Estimated
Fair Value
|
Fair Value Measurements at December 31, 2016
|
|||||||||||||||||
|
Quoted
Prices in
Active
Markets for
Identical
Assets
(Level 1)
|
Significant
Other
Observable
Inputs
(Level 2)
|
Significant
Unobservable
Inputs
(Level 3)
|
|||||||||||||||||
|
(amounts in thousands)
|
|||||||||||||||||||
|
Assets:
|
|||||||||||||||||||
|
Cash and cash equivalents
|
$
|
244,709
|
|
$
|
244,709
|
|
$
|
244,709
|
|
$
|
—
|
|
$
|
—
|
|
||||
|
Investment securities, available for sale
|
493,474
|
|
493,474
|
|
15,246
|
|
478,228
|
|
—
|
|
|||||||||
|
Loans held for sale
|
2,117,510
|
|
2,117,510
|
|
—
|
|
2,117,510
|
|
—
|
|
|||||||||
|
Loans receivable, net of allowance for loan losses
|
6,105,075
|
|
6,149,773
|
|
—
|
|
—
|
|
6,149,773
|
|
|||||||||
|
FHLB, Federal Reserve Bank and other restricted stock
|
68,408
|
|
68,408
|
|
—
|
|
68,408
|
|
—
|
|
|||||||||
|
Derivatives
|
10,864
|
|
10,864
|
|
—
|
|
10,819
|
|
45
|
|
|||||||||
|
Assets held for sale
|
32,248
|
|
32,248
|
|
20,000
|
|
—
|
|
12,248
|
|
|||||||||
|
Liabilities:
|
|||||||||||||||||||
|
Deposits
|
$
|
6,846,980
|
|
$
|
6,846,868
|
|
$
|
4,015,218
|
|
$
|
2,831,650
|
|
$
|
—
|
|
||||
|
Deposits held for sale
|
456,795
|
|
456,795
|
|
456,795
|
|
—
|
|
—
|
|
|||||||||
|
Federal funds purchased
|
83,000
|
|
83,000
|
|
83,000
|
|
—
|
|
—
|
|
|||||||||
|
FHLB advances
|
868,800
|
|
869,049
|
|
688,800
|
|
180,249
|
|
—
|
|
|||||||||
|
Other borrowings
|
87,123
|
|
91,761
|
|
66,261
|
|
25,500
|
|
—
|
|
|||||||||
|
Subordinated debt
|
108,783
|
|
111,375
|
|
—
|
|
111,375
|
|
—
|
|
|||||||||
|
Derivatives
|
14,172
|
|
14,172
|
|
—
|
|
14,172
|
|
—
|
|
|||||||||
160
|
Carrying
Amount
|
Estimated
Fair Value
|
Fair Value Measurements at December 31, 2015
|
|||||||||||||||||
|
Quoted
Prices in
Active
Markets for
Identical
Assets
(Level 1)
|
Significant
Other
Observable
Inputs
(Level 2)
|
Significant
Unobservable
Inputs
(Level 3)
|
|||||||||||||||||
|
(amounts in thousands)
|
|||||||||||||||||||
|
Assets:
|
|||||||||||||||||||
|
Cash and cash equivalents
|
$
|
264,593
|
|
$
|
264,593
|
|
$
|
264,593
|
|
$
|
—
|
|
$
|
—
|
|
||||
|
Investment securities, available for sale
|
560,253
|
|
560,253
|
|
19,212
|
|
541,041
|
|
—
|
|
|||||||||
|
Loans held for sale
|
1,797,064
|
|
1,797,458
|
|
—
|
|
1,757,807
|
|
39,651
|
|
|||||||||
|
Loans receivable, net of allowance for loan losses
|
5,417,248
|
|
5,353,326
|
|
—
|
|
—
|
|
5,353,326
|
|
|||||||||
|
FHLB and Federal Reserve Bank, and other restricted stock
|
90,841
|
|
90,841
|
|
—
|
|
90,841
|
|
—
|
|
|||||||||
|
Derivatives
|
9,295
|
|
9,295
|
|
—
|
|
9,250
|
|
45
|
|
|||||||||
|
Assets held for sale
|
584
|
|
584
|
|
—
|
|
—
|
|
584
|
|
|||||||||
|
Liabilities:
|
|||||||||||||||||||
|
Deposits
|
$
|
5,662,433
|
|
$
|
5,664,685
|
|
$
|
3,314,836
|
|
$
|
2,349,849
|
|
$
|
—
|
|
||||
|
Deposits held for sale
|
247,068
|
|
247,068
|
|
247,068
|
|
—
|
|
—
|
|
|||||||||
|
Federal funds purchased
|
70,000
|
|
70,000
|
|
70,000
|
|
—
|
|
—
|
|
|||||||||
|
FHLB advances
|
1,625,300
|
|
1,625,468
|
|
1,365,300
|
|
260,168
|
|
—
|
|
|||||||||
|
Other borrowings
|
86,457
|
|
93,804
|
|
68,867
|
|
24,937
|
|
—
|
|
|||||||||
|
Subordinated debt
|
108,685
|
|
110,825
|
|
—
|
|
110,825
|
|
—
|
|
|||||||||
|
Derivatives
|
13,932
|
|
13,932
|
|
—
|
|
13,932
|
|
—
|
|
|||||||||
For financial assets and liabilities measured at fair value on a recurring and non-recurring basis, the fair value measurements by level within the fair value hierarchy used at
December 31, 2016
and
2015
were as follows:
|
December 31, 2016
|
|||||||||||||||
|
Fair Value Measurements at the End of the Reporting Period Using
|
|||||||||||||||
|
Quoted Prices in
Active Markets for Identical Assets (Level 1) |
Significant Other
Observable Inputs (Level 2) |
Significant
Unobservable Inputs (Level 3) |
Total
|
||||||||||||
|
(amounts in thousands)
|
|
||||||||||||||
|
Measured at Fair Value on a Recurring Basis:
|
|||||||||||||||
|
Assets
|
|||||||||||||||
|
Available-for-sale securities:
|
|||||||||||||||
|
Agency-guaranteed residential mortgage-backed securities
|
$
|
—
|
|
$
|
231,263
|
|
$
|
—
|
|
$
|
231,263
|
|
|||
|
Agency-guaranteed commercial mortgage-backed securities
|
—
|
|
201,817
|
|
—
|
|
201,817
|
|
|||||||
|
Corporate notes
|
—
|
|
45,148
|
|
—
|
|
45,148
|
|
|||||||
|
Equity securities
|
15,246
|
|
—
|
|
—
|
|
15,246
|
|
|||||||
|
Derivatives (1)
|
—
|
|
10,819
|
|
45
|
|
10,864
|
|
|||||||
|
Loans held for sale – fair value option
|
—
|
|
2,117,510
|
|
—
|
|
2,117,510
|
|
|||||||
|
Total assets - recurring fair value measurements
|
$
|
15,246
|
|
$
|
2,606,557
|
|
$
|
45
|
|
$
|
2,621,848
|
|
|||
|
Liabilities
|
|||||||||||||||
|
Derivatives (2)
|
$
|
—
|
|
$
|
14,172
|
|
$
|
—
|
|
$
|
14,172
|
|
|||
|
Measured at Fair Value on a Nonrecurring Basis:
|
|||||||||||||||
|
Assets
|
|||||||||||||||
|
Impaired loans, net of specific reserves of $1,360
|
$
|
—
|
|
$
|
—
|
|
$
|
6,527
|
|
$
|
6,527
|
|
|||
|
Other real estate owned
|
—
|
|
—
|
|
2,731
|
|
2,731
|
|
|||||||
|
Total assets - nonrecurring fair value measurements
|
$
|
—
|
|
$
|
—
|
|
$
|
9,258
|
|
$
|
9,258
|
|
|||
161
|
December 31, 2015
|
|||||||||||||||
|
Fair Value Measurements at the End of the Reporting Period Using
|
|||||||||||||||
|
Quoted Prices in
Active Markets for
Identical Assets
(Level 1)
|
Significant Other
Observable Inputs
(Level 2)
|
Significant
Unobservable
Inputs
(Level 3)
|
Total
|
||||||||||||
|
(amounts in thousands)
|
|||||||||||||||
|
Measured at Fair Value on a Recurring Basis:
|
|||||||||||||||
|
Assets
|
|||||||||||||||
|
Available-for-sale securities:
|
|||||||||||||||
|
Agency-guaranteed residential mortgage-backed securities
|
$
|
—
|
|
$
|
298,104
|
|
$
|
—
|
|
$
|
298,104
|
|
|||
|
Agency-guaranteed commercial mortgage-backed securities
|
—
|
|
202,870
|
|
—
|
|
202,870
|
|
|||||||
|
Corporate notes
|
—
|
|
40,067
|
|
—
|
|
40,067
|
|
|||||||
|
Equity securities
|
19,212
|
|
—
|
|
—
|
|
19,212
|
|
|||||||
|
Derivatives (1)
|
—
|
|
9,250
|
|
45
|
|
9,295
|
|
|||||||
|
Loans held for sale – fair value option
|
—
|
|
1,757,807
|
|
—
|
|
1,757,807
|
|
|||||||
|
Total assets - recurring fair value measurements
|
$
|
19,212
|
|
$
|
2,308,098
|
|
$
|
45
|
|
$
|
2,327,355
|
|
|||
|
Liabilities
|
|||||||||||||||
|
Derivatives (2)
|
$
|
—
|
|
$
|
13,932
|
|
$
|
—
|
|
$
|
13,932
|
|
|||
|
Measured at Fair Value on a Nonrecurring Basis:
|
|||||||||||||||
|
Assets
|
|||||||||||||||
|
Impaired loans, net of specific reserves of $2,273
|
$
|
—
|
|
$
|
—
|
|
$
|
4,346
|
|
$
|
4,346
|
|
|||
|
Other real estate owned
|
—
|
|
—
|
|
358
|
|
358
|
|
|||||||
|
Total assets - nonrecurring fair value measurements
|
$
|
—
|
|
$
|
—
|
|
$
|
4,704
|
|
$
|
4,704
|
|
|||
|
(1)
|
Included in Other Assets
|
|
(2)
|
Included in Other Liabilities
|
The changes in Level 3 assets and liabilities measured at fair value on a recurring basis at
December 31, 2016
and
2015
were as follows:
|
For the Years Ended December 31,
|
||||||||
|
2016
|
2015
|
|||||||
|
Residential Mortgage Loan Commitments
|
||||||||
|
(amounts in thousands)
|
||||||||
|
Balance at January 1,
|
$
|
45
|
|
$
|
43
|
|
||
|
Issuances
|
400
|
|
273
|
|
||||
|
Settlements
|
(400
|
)
|
(271
|
)
|
||||
|
Balance at December 31,
|
$
|
45
|
|
$
|
45
|
|
||
Customers' policy is to recognize transfers between fair value levels when events or circumstances warrant transfers. There were no transfers between levels during the years ended
December 31,
2016
and
2015
.
162
The following table summarizes financial assets and financial liabilities measured at fair value as of
December 31, 2016
and
2015
for which Customers utilized Level 3 inputs to measure fair value:
|
Quantitative Information about Level 3 Fair Value Measurements
|
||||||||||
|
December 31, 2016
|
Fair Value
Estimate |
Valuation Technique
|
Unobservable Input
|
Range (Weighted
Average) (4) |
||||||
|
(dollars in thousands)
|
||||||||||
|
Impaired loans
|
$
|
1,431
|
|
Collateral appraisal (1)
|
Liquidation expenses (2)
|
(8
|
)%
|
|||
|
Impaired loans
|
5,096
|
|
Discounted cash flow
|
Projected cash flows (3)
|
4 times EBIDTA
|
|
||||
|
Discount rate (3)
|
0
|
%
|
||||||||
|
Other real estate owned
|
2,731
|
|
Collateral appraisal (1)
|
Liquidation expenses (2)
|
(8
|
)%
|
||||
|
Residential mortgage loan commitments
|
45
|
|
Adjusted market bid
|
Pull-through rate
|
90
|
%
|
||||
|
|
Quantitative Information about Level 3 Fair Value Measurements
|
|||||||||
|
December 31, 2015
|
Fair Value
Estimate |
Valuation Technique
|
Unobservable Input
|
Range (Weighted
Average) (4) |
||||||
|
(dollars in thousands)
|
||||||||||
|
Impaired loans
|
$
|
4,346
|
|
Collateral appraisal (1)
|
Liquidation expenses (2)
|
(8
|
)%
|
|||
|
Other real estate owned
|
358
|
|
Collateral appraisal (1)
|
Liquidation expenses (2)
|
(8
|
)%
|
||||
|
Residential mortgage loan commitments
|
45
|
|
Adjusted market bid
|
Pull-through rate
|
94
|
%
|
||||
|
(1)
|
Obtained from approved independent appraisers. Appraisals are current and in compliance with credit policy. The Bank does not generally discount appraisals.
|
|
(2)
|
Fair value is adjusted for estimated costs to sell based on a percentage of the value determined by appraisal.
|
|
(3)
|
Projected cash flows of the business derived using EBITDA multiple based on management's best estimate.
|
|
(4)
|
Presented as a percentage of the value determined by appraisal for impaired loans and other real estate owned.
|
163
Risk Management Objectives of Using Derivatives
Customers is exposed to certain risks arising from both its business operations and economic conditions. Customers manages economic risks, including interest rate, liquidity, and credit risk, primarily by managing the amount, sources, and durations of its assets and liabilities. Specifically, Customers enters into derivative financial instruments to manage exposures that arise from business activities that result in the receipt or payment of future known and uncertain cash amounts, the values of which are determined by interest rates. Customers’ derivative financial instruments are used to manage differences in the amount, timing, and duration of Customers’ known or expected cash receipts and its known or expected cash payments principally related to certain borrowings. Customers also has interest-rate derivatives resulting from a service provided to certain qualifying customers, and therefore, they are not used to manage Customers’ interest-rate risk in assets or liabilities. Customers manages a matched book with respect to its derivative instruments used in this customer service in order to minimize its net risk exposure resulting from such transactions.
Cash Flow Hedges of Interest Rate Risk
Customers’ objectives in using interest-rate derivatives are to add stability to interest expense and to manage exposure to interest rate movements. To accomplish this objective, Customers sometimes uses interest rate swaps as part of its interest-rate-risk management strategy. Interest-rate swaps designated as cash flow hedges involve the receipt of variable amounts from a counterparty in exchange for Customers making fixed-rate payments over the life of the agreements without exchange of the underlying notional amount.
The effective portion of changes in the fair value of derivatives designated and qualifying as cash flow hedges is recorded in accumulated other comprehensive income and is subsequently reclassified into earnings in the period that the hedged forecasted transaction affects earnings. During
2016
and
2015
, such derivatives were used to hedge the variable cash flows associated with the forecasted issuances of debt. The ineffective portion of the change in fair value of the derivatives is to be recognized directly in earnings. During 2016 and 2015, Customers did not record any hedge ineffectiveness.
Amounts reported in accumulated other comprehensive income related to derivatives will be reclassified to interest expense as interest payments are made on Customers’ variable-rate debt. Customers expects to reclassify
$2.5 million
from accumulated other comprehensive income to interest expense during the next 12 months.
Customers is hedging its exposure to the variability in future cash flows for forecasted transactions over a maximum period of 24 months (excluding forecasted transactions related to the payment of variable interest on existing financial instruments).
At
December 31, 2016
, Customers had
four
outstanding interest rate derivatives with notional amounts totaling $
325.0 million
that were designated as cash flow hedges of interest rate risk. At December 31, 2015, Customers had
one
outstanding interest rate derivative with a notional amount of
$150.0 million
that was designated as a cash flow hedge of interest rate risk. The hedges expire between October 2018 and April 2019.
Derivatives Not Designated as Hedging Instruments
Customers executes interest rate swaps with commercial banking customers to facilitate the customer's respective risk management strategies (typically the loan customers will swap a floating rate loan to a fixed rate loan). The customer interest rate swaps are simultaneously offset by interest rate swaps that Customers executes with a third party in order to minimize interest rate risk exposure resulting from such transactions. Because the interest rate swaps associated with this program do not meet the hedge accounting requirements, changes in the fair value of both the customer swaps and the offsetting third-party market swaps are recognized directly in earnings. At
December 31, 2016
, Customers had
76
interest rate swaps with an aggregate notional amount of $
716.6 million
related to this program. At
December 31, 2015
, Customers had
62
interest rate swaps with an aggregate notional amount of $
461.0 million
related to this program.
Customers enters into residential mortgage loan commitments in connection with its consumer mortgage banking activities to fund mortgage loans at specified rates and times in the future. These commitments are short-term in nature and generally expire in
30
to
60 days
. The residential mortgage loan commitments that relate to the origination of mortgage loans that will be held for sale are considered derivative instruments under applicable accounting guidance and are reported at fair value, with changes in fair value recorded directly in earnings. At
December 31, 2016
and
2015
, Customers had an outstanding notional balance of residential mortgage loan commitments of $
3.6 million
and $
2.8 million
, respectively.
164
Customers has also purchased and sold credit derivatives to either hedge or participate in the performance risk associated with some of its counterparties. These derivatives are not designated as hedging instruments and are reported at fair value, with changes in fair value reported directly in earnings. At
December 31, 2016
and
2015
, Customers had an outstanding notional balance of credit derivatives of
$44.9 million
and
$19.3 million
, respectively.
Fair Value of Derivative Instruments on the Balance Sheet
The following table presents the fair value of Customers’ derivative financial instruments as well as their presentation on the consolidated balance sheets at
December 31, 2016
and
2015
.
|
December 31, 2016
|
||||||||||||
|
Derivative Assets
|
Derivative Liabilities
|
|||||||||||
|
Balance Sheet
|
Balance Sheet
|
|||||||||||
|
Location
|
Fair Value
|
Location
|
Fair Value
|
|||||||||
|
(amounts in thousands)
|
||||||||||||
|
Derivatives designated as cash flow hedges:
|
||||||||||||
|
Interest rate swaps
|
Other assets
|
$
|
—
|
|
Other liabilities
|
$
|
3,624
|
|
||||
|
Total
|
$
|
—
|
|
$
|
3,624
|
|
||||||
|
Derivatives not designated as hedging instruments:
|
||||||||||||
|
Interest rate swaps
|
Other assets
|
$
|
10,683
|
|
Other liabilities
|
$
|
10,537
|
|
||||
|
Credit contracts
|
Other assets
|
136
|
|
Other liabilities
|
11
|
|
||||||
|
Residential mortgage loan commitments
|
Other assets
|
45
|
|
Other liabilities
|
—
|
|
||||||
|
Total
|
$
|
10,864
|
|
$
|
10,548
|
|
||||||
|
|
December 31, 2015
|
|||||||||||
|
|
Derivative Assets
|
Derivative Liabilities
|
||||||||||
|
|
Balance Sheet
Location
|
Fair Value
|
Balance Sheet
Location
|
Fair Value
|
||||||||
|
(amounts in thousands)
|
||||||||||||
|
Derivatives designated as cash flow hedges:
|
||||||||||||
|
Interest rate swaps
|
Other assets
|
$
|
—
|
|
Other liabilities
|
$
|
4,477
|
|
||||
|
Total
|
$
|
—
|
|
$
|
4,477
|
|
||||||
|
Derivatives not designated as hedging instruments:
|
||||||||||||
|
Interest rate swaps
|
Other assets
|
$
|
9,088
|
|
Other liabilities
|
$
|
9,455
|
|
||||
|
Credit contracts
|
Other assets
|
162
|
|
Other liabilities
|
—
|
|
||||||
|
Residential mortgage loan commitments
|
Other assets
|
45
|
|
Other liabilities
|
—
|
|
||||||
|
Total
|
$
|
9,295
|
|
$
|
9,455
|
|
||||||
165
Effect of Derivative Instruments on Comprehensive Income
The following table presents the effect of Customers' derivative financial instruments on comprehensive income for the years ended
December 31, 2016
,
2015
, and 2014.
|
|
For the Year Ended December 31, 2016
|
|||
|
|
Income Statement Location
|
Amount of income (loss)
recognized in earnings
|
||
|
(amounts in thousands)
|
||||
|
Derivatives not designated as hedging instruments:
|
||||
|
Interest rate swaps
|
Other non-interest income
|
$
|
2,955
|
|
|
Credit contracts
|
Other non-interest income
|
163
|
|
|
|
Residential mortgage loan commitments
|
Mortgage loan and banking income
|
—
|
|
|
|
Total
|
$
|
3,118
|
|
|
|
|
For the Year Ended December 31, 2015
|
|||
|
|
Income Statement Location
|
Amount of income (loss)
recognized in earnings
|
||
|
(amounts in thousands)
|
||||
|
Derivatives not designated as hedging instruments:
|
||||
|
Interest rate swaps
|
Other non-interest income
|
$
|
1,889
|
|
|
Credit contracts
|
Other non-interest income
|
(15
|
)
|
|
|
Residential mortgage loan commitments
|
Mortgage loan and banking income
|
2
|
|
|
|
Total
|
$
|
1,876
|
|
|
|
|
For the Year Ended December 31, 2014
|
|||
|
|
Income Statement Location
|
Amount of income (loss)
recognized in earnings
|
||
|
(amounts in thousands)
|
||||
|
Derivatives not designated as hedging instruments:
|
||||
|
Interest rate swaps
|
Other non-interest income
|
$
|
550
|
|
|
Credit contracts
|
Other non-interest income
|
(91
|
)
|
|
|
Residential mortgage loan commitments
|
Mortgage loan and banking income
|
(197
|
)
|
|
|
Total
|
$
|
262
|
|
|
|
For the Year Ended December 31, 2016
|
||||||||||
|
Location of Gain
|
Amount of Gain (Loss)
|
|||||||||
|
Amount of Income
|
(Loss) Reclassified
|
Reclassified from
|
||||||||
|
Recognized in OCI on
|
from Accumulated
|
Accumulated OCI into
|
||||||||
|
Derivatives (Effective
|
OCI into Income
|
Income (Effective
|
||||||||
|
Portion) (1)
|
(Effective Portion)
|
Portion)
|
||||||||
|
(amounts in thousands)
|
||||||||||
|
Derivatives in cash flow hedging relationships:
|
||||||||||
|
Interest rate swaps
|
$
|
587
|
|
Interest expense
|
$
|
(1,946
|
)
|
|||
166
|
For the Year Ended December 31, 2015
|
||||||||||
|
Location of Gain
|
Amount of Gain (Loss)
|
|||||||||
|
Amount of Loss
|
(Loss) Reclassified
|
Reclassified from
|
||||||||
|
Recognized in OCI on
|
from Accumulated
|
Accumulated OCI into
|
||||||||
|
Derivatives (Effective
|
OCI into Income
|
Income (Effective
|
||||||||
|
Portion) (1)
|
(Effective Portion)
|
Portion)
|
||||||||
|
(amounts in thousands)
|
||||||||||
|
Derivative in cash flow hedging relationship:
|
||||||||||
|
Interest rate swaps
|
$
|
(1,534
|
)
|
Interest expense
|
$
|
—
|
|
|||
|
December 31, 2014
|
||||||||||
|
Location of Gain
|
Amount of Gain (Loss)
|
|||||||||
|
Amount of Loss
|
(Loss) Reclassified
|
Reclassified from
|
||||||||
|
Recognized in OCI on
|
from Accumulated
|
Accumulated OCI into
|
||||||||
|
Derivatives (Effective
|
OCI into Income
|
Income (Effective
|
||||||||
|
Portion) (1)
|
(Effective Portion)
|
Portion)
|
||||||||
|
(amounts in thousands)
|
||||||||||
|
Derivative in cash flow hedging relationship:
|
||||||||||
|
Interest rate swaps
|
$
|
(1,264
|
)
|
Interest expense
|
$
|
—
|
|
|||
(1) Amounts presented are net of taxes
Credit-risk-related Contingent Features
By entering into derivative contracts, Customers is exposed to credit risk. The credit risk associated with derivatives executed with customers is the same as that involved in extending the related loans and is subject to the same standard credit policies. To mitigate the credit-risk exposure to major derivative dealer counterparties, Customers only enters into agreements with those counterparties that maintain credit ratings of high quality.
Agreements with major derivative dealer counterparties contain provisions whereby default on any of Customers' indebtedness would be considered a default on its derivative obligations. Customers also has entered into agreements that contain provisions under which the counterparty could require Customers to settle its obligations if Customers fails to maintain its status as a well/adequately-capitalized institution. As of
December 31, 2016
, the fair value of derivatives in a net liability position (which includes accrued interest but excludes any adjustment for nonperformance-risk) related to these agreements was $
10.0 million
. In addition, Customers has collateral posting thresholds with certain of these counterparties and at
December 31, 2016
, had posted $
4.5 million
of cash as collateral. Customers records cash posted as collateral as a reduction in the outstanding balance of cash and cash equivalents and an increase in the balance of other assets.
167
Disclosures about Offsetting Assets and Liabilities
The following tables present derivative instruments that are subject to enforceable master netting arrangements. Customers' interest rate swaps with institutional counterparties are subject to master netting arrangements and are included in the table below. Interest rate swaps with commercial banking customers and residential mortgage loan commitments are not subject to master netting arrangements and are excluded from the table below. Customers has not made a policy election to offset its derivative positions.
|
Offsetting of Financial Assets and Derivative Assets at
|
|||||||||||||||||||||||
|
December 31, 2016
|
|||||||||||||||||||||||
|
Gross Amounts Not Offset in
the Consolidated Balance Sheet
|
|||||||||||||||||||||||
|
Gross Amount of
Recognized Assets
|
Gross
Amounts
Offset in the
Consolidated
Balance
Sheet
|
Net
Amounts of
Assets
Presented
in the
Consolidated
Balance
Sheet
|
Financial Instruments
|
Cash
Collateral
Received
|
Net Amount
|
||||||||||||||||||
|
(amounts in thousands)
|
|||||||||||||||||||||||
|
Description
|
|||||||||||||||||||||||
|
Interest rate swap derivatives with institutional counterparties
|
$
|
4,723
|
|
$
|
—
|
|
$
|
4,723
|
|
$
|
—
|
|
$
|
—
|
|
$
|
4,723
|
|
|||||
|
Offsetting of Financial Assets and Derivative Assets at
|
|||||||||||||||||||||||
|
December 31, 2015
|
|||||||||||||||||||||||
|
Gross Amounts Not Offset in
the Consolidated Balance Sheet
|
|||||||||||||||||||||||
|
Gross Amount of
Recognized Assets
|
Gross
Amounts
Offset in the
Consolidated
Balance
Sheet
|
Net
Amounts of
Assets
Presented
in the
Consolidated
Balance
Sheet
|
Financial Instruments
|
Cash
Collateral
Received
|
Net Amount
|
||||||||||||||||||
|
(amounts in thousands)
|
|||||||||||||||||||||||
|
Description
|
|||||||||||||||||||||||
|
Interest rate swap derivatives with institutional counterparties
|
$
|
—
|
|
$
|
—
|
|
$
|
—
|
|
$
|
—
|
|
$
|
—
|
|
$
|
—
|
|
|||||
168
|
Offsetting of Financial Liabilities and Derivative Liabilities at
|
|||||||||||||||||||||||
|
December 31, 2016
|
|||||||||||||||||||||||
|
Gross Amounts Not Offset in
the Consolidated Balance Sheet
|
|||||||||||||||||||||||
|
Gross Amount of
Recognized Liabilities
|
Gross
Amounts
Offset in the
Consolidated
Balance
Sheet
|
Net
Amounts of
Liabilities
Presented
in the
Consolidated
Balance
Sheet
|
Financial
Instruments
|
Cash
Collateral
Pledged
|
Net Amount
|
||||||||||||||||||
|
(amounts in thousands)
|
|||||||||||||||||||||||
|
Description
|
|||||||||||||||||||||||
|
Interest rate swap derivatives with institutional counterparties
|
$
|
9,825
|
|
$
|
—
|
|
$
|
9,825
|
|
$
|
—
|
|
$
|
4,472
|
|
$
|
5,353
|
|
|||||
|
Offsetting of Financial Liabilities and Derivative Liabilities at
|
|||||||||||||||||||||||
|
December 31, 2015
|
|||||||||||||||||||||||
|
Gross Amount of
Recognized Liabilities
|
Gross
Amounts
Offset in the
Consolidated
Balance
Sheet
|
Net
Amounts of
Liabilities
Presented
in the
Consolidated
Balance
Sheet
|
Financial
Instruments
|
Cash
Collateral
Pledged
|
Net Amount
|
||||||||||||||||||
|
(amounts in thousands)
|
|||||||||||||||||||||||
|
Description
|
|||||||||||||||||||||||
|
Interest rate swap derivatives with institutional counterparties
|
$
|
13,932
|
|
$
|
—
|
|
$
|
13,932
|
|
$
|
—
|
|
$
|
13,932
|
|
$
|
—
|
|
|||||
169
At December 31, 2015, Customers had a net receivable of
$0.6 million
recorded in "Other assets" related to a suspected fraud discovered in the Bank’s held-for-sale loan portfolio during 2013. Since 2013, Customers has aggressively pursued restitution against the involved parties and ultimately reached a settlement agreement with one of the parties in third quarter 2016. Customers continues to seek restitution against the remaining involved party. At December 31, 2016, Customers had
no
receivable amount recorded on its consolidated balance sheet related to this matter.
The following tables present the condensed financial statements for Customers Bancorp, Inc. (parent company only) for the periods presented.
Balance Sheets
|
|
December 31,
|
||||||
|
|
2016
|
2015
|
|||||
|
(amounts in thousands)
|
|||||||
|
Assets
|
|||||||
|
Cash in subsidiary bank
|
$
|
54,441
|
|
$
|
54,567
|
|
|
|
Investment securities available for sale, at fair value
|
—
|
|
5
|
|
|||
|
Investments in and receivables due from subsidiaries
|
883,793
|
|
583,875
|
|
|||
|
Other assets
|
10,784
|
|
4,190
|
|
|||
|
Total assets
|
$
|
949,018
|
|
$
|
642,637
|
|
|
|
Liabilities and Shareholders’ equity
|
|||||||
|
Borrowings
|
$
|
87,123
|
|
$
|
88,250
|
|
|
|
Other liabilities
|
6,023
|
|
485
|
|
|||
|
Total liabilities
|
93,146
|
|
88,735
|
|
|||
|
Shareholders’ equity
|
855,872
|
|
553,902
|
|
|||
|
Total Liabilities and Shareholders’ Equity
|
$
|
949,018
|
|
$
|
642,637
|
|
|
170
Income and Comprehensive Income Statements
|
|
For the Years Ended December 31,
|
||||||||||
|
|
2016
|
2015
|
2014
|
||||||||
|
(amounts in thousands)
|
|||||||||||
|
Operating income:
|
|||||||||||
|
Other
|
$
|
25,400
|
|
$
|
18,545
|
|
$
|
90
|
|
||
|
Total operating income
|
25,400
|
|
18,545
|
|
90
|
|
|||||
|
Operating expense:
|
|||||||||||
|
Interest
|
5,854
|
|
5,854
|
|
5,251
|
|
|||||
|
Other
|
4,570
|
|
4,604
|
|
5,611
|
|
|||||
|
Total operating expense
|
10,424
|
|
10,458
|
|
10,862
|
|
|||||
|
Income (loss) before taxes and undistributed income of subsidiaries
|
14,976
|
|
8,087
|
|
(10,772
|
)
|
|||||
|
Income tax benefit
|
3,961
|
|
3,516
|
|
3,797
|
|
|||||
|
Income (loss) before undistributed income of subsidiaries
|
18,937
|
|
11,603
|
|
(6,975
|
)
|
|||||
|
Equity in undistributed income of subsidiaries
|
59,765
|
|
46,980
|
|
50,189
|
|
|||||
|
Net income
|
78,702
|
|
58,583
|
|
43,214
|
|
|||||
|
Preferred stock dividends
|
9,515
|
|
2,493
|
|
—
|
|
|||||
|
Net income available to common shareholders
|
69,187
|
|
56,090
|
|
43,214
|
|
|||||
|
Comprehensive income
|
$
|
81,794
|
|
$
|
50,721
|
|
$
|
51,210
|
|
||
Statements of Cash Flows
|
|
For the Years Ended December 31,
|
||||||||||
|
(amounts in thousands)
|
2016
|
2015
|
2014
|
||||||||
|
Cash Flows from Operating Activities:
|
|||||||||||
|
Net income
|
$
|
78,702
|
|
$
|
58,583
|
|
$
|
43,214
|
|
||
|
Adjustments to reconcile net income to net cash provided by (used in) operating activities:
|
|||||||||||
|
Equity in undistributed earnings of subsidiaries, net of dividends received from Bank
|
(59,765
|
)
|
(46,980
|
)
|
(50,189
|
)
|
|||||
|
Loss on sale of available for sale investment securities
|
1
|
|
—
|
|
—
|
|
|||||
|
(Increase) decrease in other assets
|
(7,721
|
)
|
2,488
|
|
(1,354
|
)
|
|||||
|
Increase (decrease) in other liabilities
|
54
|
|
(112
|
)
|
1,497
|
|
|||||
|
Net Cash Provided By (Used in) Operating Activities
|
11,271
|
|
13,979
|
|
(6,832
|
)
|
|||||
|
Cash Flows from Investing Activities:
|
|||||||||||
|
Proceeds from sales of investment securities available for sale
|
4
|
|
—
|
|
—
|
|
|||||
|
Payments for investments in and advances to subsidiaries
|
(230,872
|
)
|
(30,036
|
)
|
(15,032
|
)
|
|||||
|
Net Cash Used in Investing Activities
|
(230,868
|
)
|
(30,036
|
)
|
(15,032
|
)
|
|||||
|
Cash Flows from Financing Activities:
|
|||||||||||
|
Proceeds from issuance of common stock
|
65,088
|
|
904
|
|
77
|
|
|||||
|
Proceeds from issuance of preferred stock
|
161,902
|
|
55,569
|
|
—
|
|
|||||
|
Proceeds from issuance of long-term debt
|
—
|
|
—
|
|
25,000
|
|
|||||
|
Exercise and redemption of warrants
|
1,532
|
|
—
|
|
6
|
|
|||||
|
Payments on partial shares for stock dividend
|
—
|
|
—
|
|
(8
|
)
|
|||||
|
Preferred stock dividends paid
|
(9,051
|
)
|
(2,314
|
)
|
—
|
|
|||||
|
Net Cash Provided by Financing Activities
|
219,471
|
|
54,159
|
|
25,075
|
|
|||||
|
Net Increase (Decrease) in Cash and Cash Equivalents
|
(126
|
)
|
38,102
|
|
3,211
|
|
|||||
|
Cash and Cash Equivalents – Beginning
|
54,567
|
|
16,465
|
|
13,254
|
|
|||||
|
Cash and Cash Equivalents – Ending
|
$
|
54,441
|
|
$
|
54,567
|
|
$
|
16,465
|
|
||
171
The following table presents selected quarterly data for the years ended
December 31, 2016
and
2015
. Quarterly data may not agree to full year results.
|
|
2016
|
||||||||||||||
|
Quarter Ended
|
December 31
|
September 30
|
June 30
|
March 31
|
|||||||||||
|
(amounts in thousands, except per share data)
|
|||||||||||||||
|
Interest income
|
$
|
83,609
|
|
$
|
84,212
|
|
$
|
81,320
|
|
$
|
73,398
|
|
|||
|
Interest expense
|
19,475
|
|
19,622
|
|
18,159
|
|
15,767
|
|
|||||||
|
Net interest income
|
64,134
|
|
64,590
|
|
63,161
|
|
57,631
|
|
|||||||
|
Provision for loan losses
|
(261
|
)
|
(161
|
)
|
786
|
|
1,980
|
|
|||||||
|
Non-interest income
|
921
|
|
11,121
|
|
5,853
|
|
5,267
|
|
|||||||
|
Non-interest expenses
|
30,509
|
|
36,750
|
|
32,085
|
|
31,871
|
|
|||||||
|
Income from continuing operations before income taxes
|
34,807
|
|
39,122
|
|
36,143
|
|
29,047
|
|
|||||||
|
Provision for income taxes
|
11,470
|
|
15,834
|
|
14,369
|
|
9,739
|
|
|||||||
|
Net income from continuing operations
|
23,337
|
|
23,288
|
|
21,774
|
|
19,308
|
|
|||||||
|
Loss from discontinued operations before income taxes
|
(5,659
|
)
|
(3,357
|
)
|
(3,696
|
)
|
(1,812
|
)
|
|||||||
|
Income tax benefit from discontinued operations
|
(2,150
|
)
|
(1,276
|
)
|
(1,405
|
)
|
(688
|
)
|
|||||||
|
Net loss from discontinued operations
|
(3,509
|
)
|
(2,081
|
)
|
(2,291
|
)
|
(1,124
|
)
|
|||||||
|
Net income
|
19,828
|
|
21,207
|
|
19,483
|
|
18,184
|
|
|||||||
|
Preferred stock dividend
|
3,615
|
|
2,552
|
|
2,062
|
|
1,286
|
|
|||||||
|
Net income available to common shareholders
|
$
|
16,213
|
|
$
|
18,655
|
|
$
|
17,421
|
|
$
|
16,898
|
|
|||
|
Earnings per common share:
|
|||||||||||||||
|
Basic earnings per common share from continuing operations
|
$
|
0.68
|
|
$
|
0.76
|
|
$
|
0.73
|
|
$
|
0.67
|
|
|||
|
Basic earnings per common share
|
$
|
0.56
|
|
$
|
0.68
|
|
$
|
0.64
|
|
$
|
0.63
|
|
|||
|
Diluted earnings per common share from continuing operations
|
$
|
0.62
|
|
$
|
0.70
|
|
$
|
0.67
|
|
$
|
0.62
|
|
|||
|
Diluted earnings per common share
|
$
|
0.51
|
|
$
|
0.63
|
|
$
|
0.59
|
|
$
|
0.58
|
|
|||
In fourth quarter 2016, Customers elected to early-adopt ASU 2016-09
, Compensation - Stock Compensation: Improvements to Employee Share-Based Payment,
and has retroactively applied the guidance effective as of January 1, 2016. As a result of the adoption, Customers recognized excess tax benefits recognized as a a reduction of income tax expense of
$4.1 million
for the year ended
December 31, 2016
. The adoption of the ASU also resulted in an increase in weighted average diluted shares of
559,209
for the year ended December 31, 2016 as excess tax benefits are no longer included in assumed proceeds when determining diluted shares outstanding under the treasury method. Form more information regarding the impact of adoption, see NOTE 4 - SIGNIFICANT ACCOUNTING POLICIES AND BASIS OF PRESENTATION. The quarterly data above has been adjusted to reflect the retrospective adoption of this ASU.
172
|
|
2015
|
||||||||||||||
|
Quarter Ended
|
December 31
|
September 30
|
June 30
|
March 31
|
|||||||||||
|
(amounts in thousands, except per share data)
|
|||||||||||||||
|
Interest income
|
$
|
67,713
|
|
$
|
63,736
|
|
$
|
59,683
|
|
$
|
58,718
|
|
|||
|
Interest expense
|
14,241
|
|
13,799
|
|
13,123
|
|
12,388
|
|
|||||||
|
Net interest income
|
53,472
|
|
49,937
|
|
46,560
|
|
46,330
|
|
|||||||
|
Provision for loan losses
|
6,173
|
|
2,094
|
|
9,335
|
|
2,964
|
|
|||||||
|
Non-interest income
|
9,300
|
|
6,159
|
|
6,387
|
|
5,726
|
|
|||||||
|
Non-interest expenses
|
29,587
|
|
28,354
|
|
23,582
|
|
26,045
|
|
|||||||
|
Income from continuing operations before income taxes
|
27,012
|
|
25,648
|
|
20,030
|
|
23,047
|
|
|||||||
|
Provision for income taxes
|
8,103
|
|
9,155
|
|
7,187
|
|
8,219
|
|
|||||||
|
Net income from continuing operations
|
18,909
|
|
16,493
|
|
12,843
|
|
14,828
|
|
|||||||
|
Loss from discontinued operations before income taxes
|
(1,811
|
)
|
(1,944
|
)
|
(2,074
|
)
|
(1,413
|
)
|
|||||||
|
Income tax benefit from discontinued operations
|
(688
|
)
|
(740
|
)
|
(787
|
)
|
(537
|
)
|
|||||||
|
Net loss from discontinued operations
|
(1,123
|
)
|
(1,204
|
)
|
(1,287
|
)
|
(876
|
)
|
|||||||
|
Net income
|
17,786
|
|
15,289
|
|
11,556
|
|
13,952
|
|
|||||||
|
Preferred stock dividend
|
1,006
|
|
980
|
|
507
|
|
—
|
|
|||||||
|
Net income available to common shareholders
|
$
|
16,780
|
|
$
|
14,309
|
|
$
|
11,049
|
|
$
|
13,952
|
|
|||
|
Earnings per common share:
|
|||||||||||||||
|
Basic earnings per common share from continuing operations
|
$
|
0.67
|
|
$
|
0.58
|
|
$
|
0.46
|
|
$
|
0.55
|
|
|||
|
Basic earnings per common share
|
$
|
0.62
|
|
$
|
0.53
|
|
$
|
0.41
|
|
$
|
0.52
|
|
|||
|
Diluted earnings per common share from continuing operations
|
$
|
0.62
|
|
$
|
0.54
|
|
$
|
0.43
|
|
$
|
0.52
|
|
|||
|
Diluted earnings per common share
|
$
|
0.58
|
|
$
|
0.50
|
|
$
|
0.39
|
|
$
|
0.49
|
|
|||
173
Customers has historically operated under
one
business segment, "Community Banking." However, beginning in third quarter 2016, Customers revised its segment financial reporting to reflect the manner in which its chief operating decision makers (our Chief Executive Officer and Board of Directors) have begun allocating resources and assessing performance subsequent to Customers' acquisition of the Disbursement business from Higher One and the combination of that business with the BankMobile technology platform late in second quarter 2016.
Management has determined that Customers' operations consist of
two
reportable segments - Community Business Banking and BankMobile. Each segment generates revenues, manages risk, and offers distinct products and services to targeted customers through different delivery channels. The strategy, marketing, and analysis of these segments vary considerably.
The Community Business Banking segment is delivered predominately to commercial customers in Southeastern Pennsylvania, New York, New Jersey, Massachusetts, Rhode Island and New Hampshire through a single point of contact business model and provides liquidity to residential mortgage originators nationwide through commercial loans to mortgage companies. Lending and deposit gathering activities are focused primarily on privately held businesses, high net worth families, selected commercial real estate lending, and commercial mortgage companies. Revenues are generated primarily through net interest income (the difference between interest earned on loans, investments, and other interest earning assets and interest paid on deposits and other borrowed funds) and other non-interest income, such as mortgage warehouse transactional fees and bank owned life insurance.
The BankMobile segment provides state of the art high tech digital banking and disbursement services to consumers, students, and the "under banked" nationwide. BankMobile, as a division of Customers Bank, is a full service bank that is accessible to customers anywhere and anytime through the customer's smartphone or other web-enabled device. Revenues are currently being generated primarily through interchange and card revenue, deposit and wire transfer fees and university fees. The majority of revenue and expenses for BankMobile are a result of the Disbursement business acquisition.
The following tables present the operating results for Customers' reportable business segments for the years ended December 31, 2016, 2015 and 2014. Customers has presented the financial information and disclosures for prior periods to reflect the segment disclosures as if they had been in effect for the periods presented. The segment financial results include directly attributable revenues and expenses. Corporate overhead costs are assigned to the Community Business Banking segment as those expenses are expected to continue following the planned disposition of BankMobile. Similarly, the preferred stock dividends have been allocated in their entirety to the Community Business Banking segment. The tax benefit assigned to BankMobile was based on an estimated effective tax rate of
38%
.
In the third quarter 2016, Customers announced its intent to sell BankMobile and anticipates a sale to close within one year. Because BankMobile met the criteria to be classified as held for sale at December 31, 2016, the assets and liabilities of BankMobile have been presented as "Assets held for sale" and "Liabilities held for sale" on the consolidated balance sheets at December 31, 2016 and 2015. BankMobile's operating results and associated cash flows have been presented as "Discontinued operations" within the accompanying consolidated financial statements and prior period amounts have been reclassified to conform with the current period presentation. For more information on BankMobile discontinued operations, see NOTE 3 - DISCONTINUED OPERATIONS.
The BankMobile segment results presented below differ from the amounts reported as "Discontinued operations" on the consolidated financial statements primarily because of the internal funds transfer pricing methodology used by management to allocate interest income to BankMobile for the value provided to the Community Business Banking segment for the use of low/no cost deposits.
174
|
For the Year Ended December 31, 2016
|
||||||||||||
|
(amounts in thousands)
|
Community
Business Banking
|
BankMobile
|
Consolidated
|
|||||||||
|
Interest income
(1)
|
$
|
315,643
|
|
$
|
6,896
|
|
(1
|
)
|
$
|
322,539
|
|
|
|
Interest expense
|
73,004
|
|
38
|
|
|
|
73,042
|
|
||||
|
Net interest income
|
242,639
|
|
6,858
|
|
249,497
|
|
||||||
|
Provision for loan losses
|
2,246
|
|
795
|
|
3,041
|
|
||||||
|
Non-interest income
|
23,165
|
|
33,205
|
|
56,370
|
|
||||||
|
Non-interest expense
|
131,217
|
|
47,014
|
|
178,231
|
|
||||||
|
Income (loss) before income taxes
|
132,341
|
|
(7,746
|
)
|
124,595
|
|
||||||
|
Income tax expense (benefit)
|
48,836
|
|
(2,943
|
)
|
45,893
|
|
||||||
|
Net income (loss)
|
83,505
|
|
(4,803
|
)
|
78,702
|
|
||||||
|
Preferred stock dividends
|
9,515
|
|
—
|
|
9,515
|
|
||||||
|
Net income (loss) available to common shareholders
|
$
|
73,990
|
|
$
|
(4,803
|
)
|
$
|
69,187
|
|
|||
|
Goodwill and other intangibles
|
$
|
3,639
|
|
$
|
13,982
|
|
$
|
17,621
|
|
|||
|
Total assets
|
$
|
9,303,465
|
|
$
|
79,271
|
|
$
|
9,382,736
|
|
|||
|
Total deposits
|
$
|
6,846,980
|
|
$
|
456,795
|
|
$
|
7,303,775
|
|
|||
|
For the Year Ended December 31, 2015
|
||||||||||||
|
(amounts in thousands)
|
Community
Business Banking
|
BankMobile
|
Consolidated
|
|||||||||
|
Interest income
(1)
|
$
|
243,404
|
|
$
|
6,446
|
|
(1
|
)
|
$
|
249,850
|
|
|
|
Interest expense
|
53,536
|
|
24
|
|
|
|
53,560
|
|
||||
|
Net interest income
|
189,868
|
|
6,422
|
|
196,290
|
|
||||||
|
Provision for loan losses
|
20,562
|
|
4
|
|
20,566
|
|
||||||
|
Non-interest income
|
27,573
|
|
144
|
|
27,717
|
|
||||||
|
Non-interest expense
|
107,569
|
|
7,377
|
|
114,946
|
|
||||||
|
Income (loss) before income taxes
|
89,310
|
|
(815
|
)
|
88,495
|
|
||||||
|
Income tax expense (benefit)
|
30,221
|
|
(309
|
)
|
29,912
|
|
||||||
|
Net income (loss)
|
59,089
|
|
(506
|
)
|
58,583
|
|
||||||
|
Preferred stock dividends
|
2,493
|
|
—
|
|
2,493
|
|
||||||
|
Net income (loss) available to common shareholders
|
$
|
56,596
|
|
$
|
(506
|
)
|
$
|
56,090
|
|
|||
|
Goodwill and other intangibles
|
$
|
3,651
|
|
$
|
—
|
|
$
|
3,651
|
|
|||
|
Total assets
|
$
|
8,395,525
|
|
$
|
2,680
|
|
$
|
8,398,205
|
|
|||
|
Total deposits
|
$
|
5,662,433
|
|
$
|
247,068
|
|
$
|
5,909,501
|
|
|||
(1) - Amounts reported include funds transfer pricing of
$6.9 million
and
$6.4 million
, respectively, for the years ended
December 31, 2016
, and
2015
credited to BankMobile for the value provided to the Community Business Banking segment for the use of low/no cost deposits.
175
|
For the Year Ended December 31, 2014
|
||||||||||||
|
(amounts in thousands)
|
Community
Business Banking
|
BankMobile
|
Consolidated
|
|||||||||
|
Interest income
(1)
|
$
|
186,089
|
|
$
|
4,338
|
|
(1
|
)
|
$
|
190,427
|
|
|
|
Interest expense
|
38,485
|
|
19
|
|
|
|
38,504
|
|
||||
|
Net interest income
|
147,604
|
|
4,319
|
|
151,923
|
|
||||||
|
Provision for loan losses
|
14,747
|
|
—
|
|
14,747
|
|
||||||
|
Non-interest income
|
25,126
|
|
—
|
|
25,126
|
|
||||||
|
Non-interest expense
|
96,788
|
|
2,126
|
|
98,914
|
|
||||||
|
Income before income taxes
|
61,195
|
|
2,193
|
|
63,388
|
|
||||||
|
Income tax expense
|
19,340
|
|
834
|
|
20,174
|
|
||||||
|
Net income
|
41,855
|
|
1,359
|
|
43,214
|
|
||||||
|
Preferred stock dividends
|
—
|
|
—
|
|
—
|
|
||||||
|
Net income available to common shareholders
|
$
|
41,855
|
|
$
|
1,359
|
|
$
|
43,214
|
|
|||
|
Goodwill and other intangibles
|
$
|
3,664
|
|
$
|
—
|
|
$
|
3,664
|
|
|||
|
Total assets
|
$
|
6,819,354
|
|
$
|
2,146
|
|
$
|
6,821,500
|
|
|||
|
Total deposits
|
$
|
4,296,242
|
|
$
|
236,296
|
|
$
|
4,532,538
|
|
|||
(1) - Amounts reported include funds transfer pricing of
$4.3 million
for the year ended December 31, 2014 credited to BankMobile for the value provided to the Community Business Banking segment for the use of low/no cost deposits.
176
On March 7, 2017, Customers entered into a Purchase and Assumption Agreement (the “Purchase Agreement”) with Flagship Community Bank (“Flagship”). Subject to the terms and conditions of the Purchase Agreement, Customers will sell to Flagship the assets, and Flagship will assume from Customers the liabilities, of the BankMobile division of Customers Bank. The purchase price to be paid by Flagship to Customers is
$175 million
, which is subject to adjustment as provided in the Purchase Agreement. Customers expects that its net proceeds on the closing of the transaction will be approximately
$173 million
, and expects to realize a pre-tax net benefit from this transaction of approximately
$100 million
, considering the expected purchase price adjustments, fees, expenses, and the payment of transaction-based compensation of approximately
$24.5 million
to certain Customers’ employees, pursuant to the terms previously disclosed by Customers in its Current Report on Form 8-K filed December 30, 2016.
The transaction has been approved by the respective board of directors of Customers Bancorp, Customers Bank and Flagship. Certain matters related to the transaction must be approved by the shareholders of Flagship, which will be considered and voted on at a special meeting of Flagship’s shareholders to be held not later than May 31, 2017.
Completion of the transaction is subject to certain closing conditions, including (i) receipt of required regulatory approvals, (ii) Flagship obtaining financing in an amount not less than
$260 million
, (iii) approval by Flagship shareholders of certain matters related to the transaction and (iv) certain other customary conditions.
The Purchase Agreement includes customary representations, warranties and covenants of the parties and contains certain termination rights for both Customers and Flagship. The executed Purchase Agreement was included as Exhibit 2.1 to the Current Report on Form 8-K filed on March 8, 2017.
177
MANAGEMENT’S RESPONSIBILITY FOR FINANCIAL STATEMENTS AND REPORT ON INTERNAL CONTROL OVER FINANCIAL REPORTING
Management of Customers Bancorp is responsible for the integrity and objectivity of all information presented in this report. The consolidated financial statements were prepared in conformity with United States generally accepted accounting principles. Management believes that the consolidated financial statements of Customers Bancorp fairly reflect the form and substance of transactions and that the financial statements fairly represent Customers Bancorp’s financial position and results of operations. Management has included in Customers Bancorp’s financial statements amounts that are based on estimates and judgments which it believes are reasonable under the circumstances.
The independent registered public accounting firm of BDO USA, LLP audits Customers Bancorp’s consolidated financial statements in accordance with the standards of the Public Company Accounting Oversight Board (United States).
The Board of Directors of Customers Bancorp has an Audit Committee composed of three independent directors. The Committee meets periodically with financial management, the internal auditors and the independent registered public accounting firm to review accounting, internal control, auditing, corporate governance and financial reporting matters. The Audit Committee is responsible for the engagement of the independent auditors. The independent auditors and internal auditors have access to the Audit Committee.
Management of Customers Bancorp is responsible for establishing and maintaining adequate internal control over financial reporting, as such term is defined in Exchange Act Rule 13a-15(f). Under the supervision and with the participation of management, including the Chief Executive Officer and Chief Financial Officer, we conducted an evaluation of the effectiveness of our internal control over financial reporting based on the framework in
Internal Control – Integrated Framework (2013)
issued by the Committee of Sponsoring Organizations of the Treadway Commission. Based on our evaluation under the framework in
Internal Control – Integrated Framework
, management concluded that our internal control over financial reporting was effective as of December 31, 2016. The effectiveness of our internal control over financial reporting as of December 31, 2016 has been audited by BDO USA, LLP, an independent registered public accounting firm, as stated in their report which is included herein.
178
None.
Evaluation of Disclosure Controls and Procedures.
We have established disclosure controls and procedures to ensure that material information relating to us, including our consolidated subsidiaries, is made known to the officers who certify our financial reports and to other members of senior management and the Board of Directors.
We carried out an evaluation, under the supervision and with the participation of our management, including our Chief Executive Officer and Chief Financial Officer, of the design and operating effectiveness of our disclosure controls and procedures, as defined in Exchange Act Rule 13a-15. Based upon that evaluation, our Chief Executive Officer and Chief Financial Officer concluded that, as of
December 31, 2016
, our disclosure controls and procedures are effective.
Management’s Responsibility for Financial Statements and Report on Internal Control over Financial Reporting are included in Part II, Item 8, “Financial Statements and Supplementary Data,” and are incorporated by reference herein.
Our independent registered public accounting firm, BDO USA, LLP, also attested to, and reported on, the effectiveness of internal control over financial reporting as of
December 31, 2016
. BDO USA, LLP’s attestation report, which appears in Part II, Item 8, "Financial Statements and Supplementary Data," is incorporated herein by reference.
Changes in Internal Control over Financial Reporting
During fourth quarter
2016
, there have been no changes in the Bancorp’s internal control over financial reporting that have materially affected or are reasonably likely to materially affect the Bancorp’s internal control over financial reporting.
None.
179
The information required by this Item will be included in the Proxy Statement for the 2017 annual meeting in the sections titled “Our Board of Directors and Management,” and “Board Governance,” and is incorporated herein by reference.
The information required by this Item will be included in the Proxy Statement for the 2017 annual meeting in the sections titled “Director Compensation,” “Executive Officer Compensation,” and “Board Governance,” and is incorporated herein by reference.
The information required by this Item will be included in the Proxy Statement for the 2017 annual meeting in the sections titled “Security Ownership of Certain Beneficial Owners and Management” and “Equity Compensation Plan Information” and is incorporated herein by reference.
The information required by this Item will be included in the Proxy Statement for the 2017 annual meeting in the sections titled “Certain Relationships and Related Transactions” and “Board Governance” and is incorporated herein by reference.
The information required by this Item will be included in the Proxy Statement for the 2017 annual meeting in the section titled “Proposal 2 — Ratification of Appointment of Independent Registered Public Accounting Firm,” and is incorporated herein by reference.
180
|
(a)
|
1. Financial Statements
|
Consolidated financial statements are included under Item 8 of Part II of this Form 10-K.
|
(b)
|
2. Financial Statements Schedules
|
Financial statements schedules are omitted because the required information is either not applicable, not required or is shown in the respective financial statements or in the notes thereto.
|
(c)
|
Exhibits
|
|
Exhibit
No.
|
Description
|
|
|
2.1
|
Purchase and Assumption Agreement, dated as of July 9, 2010, by and among Customers Bank, the FDIC as Receiver of USA Bank, and the FDIC acting in its corporate capacity, incorporated by reference to Exhibit 2.3 to the Customers Bancorp Form S-1/A filed with the SEC on January 13, 2011
|
|
|
2.2
|
Purchase and Assumption Agreement, dated as of September 17, 2010, by and among Customers Bank, the FDIC as Receiver of ISN Bank, and the FDIC acting in its corporate capacity, incorporated by reference to Exhibit 2.4 to the Customers Bancorp Form S-1/A filed with the SEC on January 13, 2011
|
|
|
2.3
|
Asset Purchase Agreement dated as of December 15, 2015 by and among Customers Bancorp, Customers Bank, Higher One, Inc. and Higher One Holdings, Inc., incorporated by reference to Exhibit 2.3 to the Customers Bancorp Form 10-K filed with the SEC on February 26, 2016
|
|
|
3.1
|
Amended and Restated Articles of Incorporation of Customers Bancorp, Inc., incorporated by reference to Exhibit 3.1 to the Customers Bancorp Form 8-K filed with the SEC on April 30, 2012
|
|
|
3.2
|
Amended and Restated Bylaws of Customers Bancorp, Inc., incorporated by reference to Exhibit 3.2 to the Customers Bancorp Form 8-K filed with the SEC on April 30, 2012
|
|
|
3.3
|
Articles of Amendment to the Amended and Restated Articles of Incorporation of Customers Bancorp, Inc., incorporated by reference to Exhibit 3.1 to the Customers Bancorp Form 8-K filed with the SEC on July 2, 2012
|
|
|
3.4
|
Statement with Respect to Shares relating to the Fixed-to-Floating Rate Non-Cumulative Perpetual Preferred Stock, Series C, incorporated by reference to Exhibit 3.1 to the Customers Bancorp Form 8-K filed with the SEC on May 18, 2015
|
|
|
3.5
|
Statement with Respect to Shares relating to the Fixed-to-Floating Rate Non-Cumulative Perpetual Preferred Stock, Series D, incorporated by reference to Exhibit 3.1 to the Customers Bancorp Form 8-K filed with the SEC on January 29, 2016
|
|
|
3.6
|
Statement with Respect to Shares of Fixed-to-Floating Rate Non-Cumulative Perpetual Preferred Stock, Series E, incorporated by reference to Exhibit 3.1 to the Customers Bancorp Form 8-K filed with the SEC on April 28, 2016.
|
|
|
3.7
|
Statement with Respect to Shares of Fixed-to-Floating Rate Non-Cumulative Perpetual Preferred Stock, Series F, incorporated by reference to Exhibit 3.1 to the Customers Bancorp Form 8-K filed with the SEC on September 16, 2016.
|
|
|
4.1
|
Specimen stock certificate of Customers Bancorp, Inc. Voting Common Stock and Class B Non-Voting Common Stock, incorporated by reference to Exhibit 4.1 to the Customers Bancorp Form S-1/A filed with the SEC on May 1, 2012
|
|
|
4.2
|
Form of Warrant issued to investors in New Century Bank’s March and February 2010 private offerings, 2009 private offering, and in partial exchange for New Century Bank’s shares of 10% Series A Non-Cumulative Perpetual Convertible Preferred Stock in June 2009, incorporated by reference to Exhibit 4.8 to the Customers Bancorp Form S-1 filed with the SEC on April 22, 2010
|
|
|
4.3
|
Warrants issued to Jay S. Sidhu, June 30, 2009, incorporated by reference to Exhibit 4.9 to the Customers Bancorp Form S-1 filed with the SEC on April 22, 2010
|
|
|
4.4
|
Indenture, dated as of July 30, 2013, by and between Customers Bancorp, Inc., as Issuer, and Wilmington Trust, National Association, as Trustee, incorporated by reference to Exhibit 4.1 to the Customers Bancorp Form 8-K filed with the SEC on July 31, 2013
|
|
|
4.5
|
First Supplemental Indenture, dated as of July 30, 2013, by and between Customers Bancorp, Inc., as Issuer, and Wilmington Trust, National Association, as Trustee, incorporated by reference to Exhibit 4.2 to the Customers Bancorp Form 8-K filed with the SEC on July 31, 2013
|
|
181
|
Exhibit
No.
|
Description
|
|
|
4.6
|
6.375% Global Note in aggregate principal amount of $55,000,000, incorporated by reference to Exhibit 4.3 to the Customers Bancorp Form 8-K filed with the SEC on July 31, 2013
|
|
|
4.7
|
Amendment to First Supplemental Indenture, dated August 27, 2013, by and between Customers Bancorp, Inc. and Wilmington Trust Company, National Association, as trustee, incorporated by reference to Exhibit 4.1 to the Customers Bancorp Form 8-K filed with the SEC on August 29, 2013
|
|
|
4.8
|
6.375% Global Note in aggregate principal amount of $8,250,000, incorporated by reference to Exhibit 4.2 to the Customers Bancorp Form 8-K filed with the SEC on August 29, 2013
|
|
|
4.9
|
Form of Note Subscription Agreement (including form of Subordinated Note Certificate and Senior Note Certificate) incorporated by reference to Exhibit 10.1 to the Customers Bancorp Form 8-K filed with the SEC on June 26, 2014
|
|
|
10.1+
|
New Century Bank Management Stock Purchase Plan, incorporated by reference to Exhibit 10.1 to the Customers Bancorp Form S-1 filed with the SEC on April 22, 2010
|
|
|
10.2+
|
Amended and Restated Customers Bancorp, Inc. 2010 Stock Option Plan, incorporated by reference to Exhibit 10.2 to the Customers Bancorp Form 10-K filed with the SEC on March 21, 2012
|
|
|
10.3+
|
Amended and Restated Employment Agreement, dated as of March 26, 2012, by and between Customers Bancorp, Inc. and Jay S. Sidhu, incorporated by reference to Exhibit 10.3 to the Customers Bancorp Form S-1 filed with the SEC on March 28, 2012
|
|
|
10.4+
|
Amended and Restated Employment Agreement, dated as of March 26, 2012, by and between Customers Bancorp, Inc. and Richard Ehst, incorporated by reference to Exhibit 10.4 to the Customers Bancorp Form S-1 filed with the SEC on March 28, 2012
|
|
|
10.5+
|
Amended and Restated Customers Bancorp, Inc. 2004 Incentive Equity and Deferred Compensation Plan, incorporated by reference to Exhibit 10.7 to the Customers Bancorp Form 10-K filed with the SEC on March 21, 2012
|
|
|
10.6+
|
Form of Restricted Stock Unit Award Agreement for Employees relating to the 2012 Special Stock Reward Program, incorporated by reference to Exhibit 10.25 to the Customers Bancorp Form S-1/A filed with the SEC on May 1, 2012
|
|
|
10.7+
|
Amended and Restated Customers Bancorp, Inc. Bonus Recognition and Retention Plan, incorporated by reference to Exhibit 10.15 to the Customers Bancorp Form 10-K filed with the SEC on March 21, 2012
|
|
|
10.8+
|
Supplemental Executive Retirement Plan of Jay S. Sidhu, incorporated by reference to Exhibit 10.15 to the Customers Bancorp Form S-1/A filed with the SEC on April 18, 2011
|
|
|
10.9+
|
Form of Restricted Stock Unit Award Agreement for Directors relating to the 2012 Special Stock Reward Program, incorporated by reference to Exhibit 10.26 to the Customers Bancorp Form S-1/A filed with the SEC on May 1, 2012
|
|
|
10.10+
|
Form of Stock Option Agreement, incorporated by reference to Exhibit 10.18 to the Customers Bancorp Form 10-K filed with the SEC on March 21, 2012
|
|
|
10.11+
|
Form of Restricted Stock Unit Agreement, incorporated by reference to Exhibit 10.17 to the Customers Bancorp Form 10-K filed with the SEC on March 21, 2012
|
|
|
10.12+
|
Change of Control Agreement, dated as of January 30, 2013, by and between Customers Bancorp, Inc. and Glenn Hedde, incorporated by reference to Exhibit 10.29 to Customers Bancorp’s Form 10-K filed with the SEC on March 18, 2013
|
|
|
10.13+
|
Change of Control Agreement, dated as of January 30, 2013, by and between Customers Bancorp, Inc. and Warren Taylor, incorporated by reference to Exhibit 10.30 to Customers Bancorp’s Form 10-K filed with the SEC on March 18, 2013
|
|
|
10.14+
|
Change of Control Agreement, dated as of December 22, 2012, by and between Customers Bancorp, Inc. and Ken Keiser, incorporated by reference to Exhibit 10.14 to the Customers Bancorp Form 10-K filed with the SEC on February 26, 2016
|
|
|
10.15+
|
Employment Agreement, dated as of August 5, 2013, by and between Customers Bancorp, Inc. and Robert Wahlman, incorporated by reference to Exhibit 10.15 to the Customers Bancorp Form 10-K filed with the SEC on February 26, 2016
|
|
182
|
Exhibit
No.
|
Description
|
|
|
10.16+
|
Employment Agreement, dated as of March 1, 2014, by and between Customers Bancorp, Inc. and Steven Issa, incorporated by reference to Exhibit 10.16 to the Customers Bancorp Form 10-K filed with the SEC on February 26, 2016
|
|
|
10.17+
|
Amendment to Employment Agreement, dated as of February 26, 2016, by and between Customers Bancorp, Inc. and Steven Issa, incorporated by reference to Exhibit 10.17 to the Customers Bancorp Form 10-K filed with the SEC on February 26, 2016
|
|
|
10.18
|
Termination and Non-Renewal Agreement, dated as of April 4, 2013, by and among Customers Bancorp, Inc., Acacia Life Insurance Company, and Ameritas Life Insurance Corp., incorporated by reference to Exhibit 10.1 to the Customers Bancorp Form 8-K filed with the SEC on April 10, 2013
|
|
|
10.19
|
At Market Issuance Sales Agreement dated as of December 23, 2015, by and among the Company, FBR Capital Markets & Co., MLV & Co. LLC and Maxim Group LLC, incorporated by reference to Exhibit 10.1 to the Customers Bancorp Form 8-K filed with the SEC on December 23, 2015
|
|
|
10.20
|
Termination of At Market Issuance Sales Agreement dated as of January 20, 2016, incorporated by reference to Exhibit 10.20 to the Customers Bancorp Form 10-K filed with the SEC on February 26, 2016
|
|
|
10.21
|
Transition Services Agreement dated as of June 15, 2016 by and among Customers Bancorp, Customers Bank, Higher One, Inc. and Higher One Holdings, Inc., incorporated by reference to Exhibit 10.1 to the Customers Bancorp’s Form 8-K filed with the SEC on June 16, 2016
|
|
|
10.22
|
At Market Issuance Sales Agreement dated as of August 11, 2016, by and among Customers Bancorp, FBR Capital Markets & Co., Keefe, Bruyette & Woods, Inc. and Maxim Group LLC., incorporated by reference to Exhibit 10.1 to the Customers Bancorp Form 8-K filed with the SEC on August 11, 2016
|
|
|
10.23
|
Order to Cease and Desist and Order of Assessment of Civil Money Penalty Issued Upon Consent Dated December 6, 2016, incorporated by reference to Exhibit 10.2 to the Customers Bancorp Form 8-K filed with the SEC on December 7, 2016
|
|
|
10.24
|
Amended and Restated Employment Agreement, dated as of December 30, 2016, by and between Customers Bancorp, Inc. and Richard Ehst, incorporated by reference to Exhibit 10.2 to the Customers Bancorp Form 8-K filed with the SEC on December 30, 2016
|
|
|
10.25
|
Amended and Restated Employment Agreement, dated as of December 30, 2016, by and between Customers Bancorp, Inc. and Jay S. Sidhu. incorporated by reference to Exhibit 10.1 to the Customers Bancorp Form 8-K filed with the SEC on December 30, 2016
|
|
|
10.26
|
Letter Agreement, dated as of December 30, 2016, by and between Customers Bancorp, Inc. and Jay S. Sidhu. incorporated by reference to Exhibit 10.3 to the Customers Bancorp Form 8-K filed with the SEC on December 30, 2016
|
|
|
21.1
|
List of Subsidiaries of Customers Bancorp, Inc.
|
|
|
23.1
|
Consent of BDO USA, LLP, filed herewith
|
|
|
31.1
|
Certification of the Chief Executive Officer Pursuant to Exchange Act Rule 13a-14(a) or Rule 15d-14(a)
|
|
|
31.2
|
Certification of the Chief Financial Officer Pursuant to Exchange Act Rule 13a-14(a) or Rule 15d-14(a)
|
|
|
32.1
|
Certification of the Chief Executive Officer Pursuant to 18 U.S.C. Section 1350, as Adopted Pursuant to Section 906 of the Sarbanes-Oxley Act of 2002
|
|
|
32.2
|
Certification of the Chief Financial Officer Pursuant to 18 U.S.C. Section 1350, as Adopted Pursuant to Section 906 of the Sarbanes-Oxley Act of 2002
|
|
|
101
|
Interactive Data Files regarding (a) Balance Sheets as of December 31, 2016 and 2015, (b) Statements of Income for the years ended December 31, 2016, 2015 and 2014, (c) Statements of Comprehensive Income for the years ended December 31, 2016, 2015 and 2014, (d) Statements of Cash Flows for the years ended December 31, 2016, 2015 and 2014, (e) Statements of Changes in Shareholders’ Equity for the years ended December 31, 2016, 2015 and 2014 and (f) Notes to Financial Statements for the years ended December 31, 2016, 2015 and 2014.
|
|
|
+
|
Management Contract or compensatory plan or arrangement
|
|
183
SIGNATURES
Pursuant to the requirements of the Section 13 or 15(d) of the Securities Exchange Act of 1934, the registrant has duly caused this report to be signed on its behalf by the undersigned, thereunto duly authorized.
|
Customers Bancorp, Inc.
|
|||
|
March 8, 2017
|
By:
|
/s/ Jay S. Sidhu
|
|
|
Name:
|
Jay S. Sidhu
|
||
|
Title:
|
Chairman and Chief Executive Officer
|
||
|
Customers Bancorp, Inc.
|
|||
|
March 8, 2017
|
By:
|
/s/ Robert E. Wahlman
|
|
|
Name:
|
Robert E. Wahlman
|
||
|
Title:
|
Chief Financial Officer
|
||
Pursuant to the requirements of the Securities Exchange Act of 1934, this report has been signed below by the following persons on behalf of the Registrant and in the capacities and on the dates indicated.
184
|
Signature:
|
Title(s):
|
Date:
|
||
|
/s/ Jay S. Sidhu
|
Chairman, Chief Executive Officer and Director (principal executive officer)
|
March 8, 2017
|
||
|
Jay S. Sidhu
|
||||
|
/s/ Robert E. Wahlman
|
Executive Vice President and Chief Financial Officer (principal financial officer)
|
March 8, 2017
|
||
|
Robert E. Wahlman
|
||||
|
/s/ Carla A. Leibold
|
Senior Vice President - Chief Accounting Officer and Controller (principal accounting officer)
|
March 8, 2017
|
||
|
Carla A. Leibold
|
||||
|
/s/ Daniel K. Rothermel
|
Director
|
|||
|
Daniel K. Rothermel
|
March 8, 2017
|
|||
|
/s/ Bhanu Choudhrie
|
Director
|
|||
|
Bhanu Choudhrie
|
March 8, 2017
|
|||
|
/s/ Andrea R. Allon
|
Director
|
|||
|
Andrea R. Allon
|
March 8, 2017
|
|||
|
/s/ T. Lawrence Way
|
Director
|
|||
|
T. Lawrence Way
|
March 8, 2017
|
|||
|
/s/ Rick B. Burkey
|
Director
|
|||
|
Rick B. Burkey
|
March 8, 2017
|
|||
|
/s/ Steven J. Zuckerman
|
Director
|
|||
|
Steven J. Zuckerman
|
March 8, 2017
|
|||
185
TABLE OF CONTENTS
Part IItem 1. BusinessItem 1A. Risk FactorsItem 1B. Unresolved Staff CommentsItem 2. PropertiesItem 3. Legal ProceedingsItem 4. Mine Safety DisclosuresPart IIItem 5. Market For Registrant S Common Equity, Related Stockholder Matters and Issuer Purchases Of Equity SecuritiesItem 6. Selected Financial DataItem 7. Management S Discussion and Analysis Of Financial Condition and Results Of OperationsItem 7A. Quantitative and Qualitative Disclosure About Market RiskItem 8. Financial Statements and Supplementary DataNote 1 Description Of The BusinessNote 2 Acquisition ActivityNote 3 Discontinued OperationsNote 4 Significant Accounting Policies and Basis Of PresentationNote 5 Earnings Per ShareNote 6 - Changes in Accumulated Other Comprehensive Income (loss) By Component (1)Note 7 Investment SecuritiesNote 8 Loans Held For SaleNote 9 Loans Receivable and Allowance For Loan LossesNote 10 Bank Premises and EquipmentNote 11 DepositsNote 12 BorrowingsNote 13 Shareholders EquityNote 14 Employee Benefit PlansNote 15 Share-based Compensation PlansNote 16 Income TaxesNote 17 Transactions with Executive Officers, Directors, and Principal ShareholdersNote 18 Financial Instruments with Off-balance-sheet RiskNote 19 Regulatory MattersNote 20 Disclosures About Fair Value Of Financial InstrumentsNote 21 Derivative Instruments and Hedging ActivitiesNote 22 Loss ContingencyNote 23 Condensed Financial Statements Of Parent CompanyNote 24 Selected Quarterly Financial Data (unaudited)Note 25 Business SegmentsNote 26 - Subsequent EventsItem 9. Changes in and Disagreements with Accountants on Accounting and Financial DisclosureItem 9A. Controls and ProceduresItem 9B. Other InformationPart IIIItem 10. Directors, Executive Officers and Corporate GovernanceItem 11. Executive CompensationItem 12. Security Ownership Of Certain Beneficial Owners and Management and Related Stockholder MattersItem 13. Certain Relationships and Related Transactions, and Director IndependenceItem 14. Principal Accounting Fees and ServicesPart IVItem 15 Exhibits and Financial Statement Schedules