CULP INC
10-Ks and 10-Qs
|
|
|
|
|
|
|
|
|
|
|
|
|
|
|
|
|
|
|
|
|
|
|
|
|
|
|
|
|
|
|
|
|
|
|
|
|
|
|
|
|
|
|
|
|
|
|
|
|
|
|
|
|
|
|
|
|
|
|
UNITED STATES
SECURITIES AND EXCHANGE COMMISSION
Washington, D.C. 20549
FORM 10-K
ANNUAL REPORT PURSUANT TO SECTION 13 OR 15(d) OF
THE SECURITIES EXCHANGE ACT OF 1934
For the fiscal year ended April 29, 2012
Commission File No. 1-12597
CULP, INC.
(Exact name of registrant as specified in its charter)
|
NORTH CAROLINA
(State or other jurisdiction of
incorporation or other organization)
|
56-1001967
(I.R.S. Employer Identification No.)
|
|
1823 Eastchester Drive, High Point, North Carolina
(Address of principal executive offices)
|
27265
(zip code)
|
(336) 889-5161
(Registrant’s telephone number, including area code)
Securities registered pursuant to Section 12(b) of the Act:
|
Title of Each Class
|
Name of Each Exchange
On Which Registered
|
|
Common Stock, par value $.05/ Share
|
New York Stock Exchange
|
Securities registered pursuant to Section 12(g) of the Act: None
Indicate by check mark if the registrant is a well-known seasoned issuer, as defined in Rule 405 of the Securities Act. YES
o
NO
x
Indicate by check mark if the registrant is not required to file reports pursuant to Section 13 or Section 15(d) of the Securities Exchange Act of 1934. YES
o
NO
x
Indicate by check mark whether the registrant (1) has filed all reports required to be filed by Section 13 or 15(d) of the Securities Exchange Act of 1934 during the preceding 12 months and (2) has been subject to the filing requirements for at least the past 90 days. YES
x
NO
o
Indicate by check mark whether the registrant has submitted electronically and posted on its corporate Web site, if any, every Interactive Data File required to be submitted and posted pursuant to Rule 405 of Regulation S-T during the preceding 12 months (or for such shorter period that the registrant was required to submit and post such files).
YES
x
NO
o
Indicate by check mark if disclosure of delinquent filers pursuant to Item 405 of Regulation S-K is not contained herein, and will not be contained, to the best of registrant’s knowledge, in definitive proxy or information statements incorporated by reference in Part III of this Form 10-K or any amendment to this Form 10-K.
x
Indicate by check mark whether the registrant is a large accelerated filer, an accelerated filer, a non-accelerated filer, or a smaller reporting company. See definition of “large accelerated filer, accelerated filer, and smaller reporting company” in Rule 12b-2 of the Exchange Act. (Check one):
|
Large Accelerated Filer
o
|
Accelerated Filer
x
|
Non-Accelerated Filer
o
|
|
|
Smaller Reporting Company
o
|
Indicate by check mark whether the registrant is a shell company (as defined in Rule 12b-2 of the Act). YES
o
NO
x
As of April 29, 2012, 12,702,806 shares of common stock were outstanding. As of October 30, 2011, the aggregate market value of the voting stock held by non-affiliates of the registrant on that date was $87,350,477 based on the closing sales price of such stock as quoted on the New York Stock Exchange (NYSE), assuming, for purposes of this report, that all executive officers and directors of the registrant are affiliates.
DOCUMENTS INCORPORATED BY REFERENCE
Portions of the registrant’s Proxy Statement to be filed pursuant to Regulation 14A of the Securities and Exchange Commission in connection with its Annual Meeting of Shareholders to be held on September 18, 2012 are incorporated by reference into Part III of this Form 10-K.
CULP, INC.
FORM 10-K REPORT
TABLE OF CONTENTS
|
Item No.
|
Page
|
|
|
1.
|
||
|
2
|
||
|
3
|
||
|
3
|
||
|
6
|
||
|
6
|
||
|
7
|
||
|
7
|
||
|
8
|
||
|
9
|
||
|
10
|
||
|
10
|
||
|
11
|
||
|
11
|
||
|
12
|
||
|
12
|
||
|
13
|
||
|
14
|
||
|
15
|
||
|
15
|
||
|
1A.
|
15
|
|
|
1B.
|
19
|
|
|
2.
|
19
|
|
|
3.
|
20
|
|
|
4.
|
20
|
|
|
5.
|
21
|
|
|
6.
|
24
|
|
|
7.
|
25
|
|
|
7A.
|
47
|
|
|
8.
|
48
|
|
|
9.
|
84
|
|
|
9A(T).
|
84
|
|
|
9B.
|
86
|
|
Item No.
|
Page
|
|
|
10.
|
86
|
|
|
11.
|
86
|
|
|
12.
|
86
|
|
|
13.
|
87
|
|
|
14.
|
87
|
|
|
15.
|
88
|
|
|
88
|
||
|
88
|
||
|
88
|
||
|
92
|
||
|
93
|
CAUTIONARY STATEMENT CONCERNING FORWARD-LOOKING INFORMATION
Parts I and II of this report contain “forward-looking statements” within the meaning of the federal securities laws, including the Private Securities Litigation Reform Act of 1995 (Section 27A of the Securities Act of 1933 and Section 27A of the Securities and Exchange Act of 1934). Such statements are inherently subject to risks and uncertainties. Further, forward-looking statements are intended to speak only as of the date on which they are made. Forward-looking statements are statements that include projections, expectations or beliefs about future events or results or otherwise are not statements of historical fact. Such statements are often but not always characterized by qualifying words such as “expect,” “believe,” “estimate,” “plan” and “project” and their derivatives, and include but are not limited to statements about expectations for the company’s future operations, production levels, sales, gross profit margins, operating income, SG&A or other expenses, earnings, other performance measures, as well as any statements regarding future economic or industry trends or future developments. Factors that could influence the matters discussed in such statements include the level of housing starts and sales of existing homes, consumer confidence, trends in disposable income, and general economic conditions. Decreases in these economic indicators could have a negative effect on our business and prospects. Likewise, increases in interest rates, particularly home mortgage rates, and increases in consumer debt or the general rate of inflation, could affect the company adversely. Changes in consumer tastes or preferences toward products not produced by us could erode demand for our products. Changes in the value of the U.S. dollar versus other currencies could affect our financial results because a significant portion of our operations are located outside the United States. Strengthening of the U.S. dollar against other currencies could make our products less competitive on the basis of price in markets outside the United States, and strengthening of currencies in Canada and China can have a negative impact on our sales in the U.S. of products produced in those places. Also, economic and political instability in international areas could affect our operations or sources of goods in those areas, as well as demand for our products in international markets. Further information about these factors, as well as other factors that could affect our future operations or financial results and the matters discussed in forward-looking statements are included in the “Risk Factors” section of this report in Item 1A.
1
Culp, Inc. manufactures, sources, and markets mattress fabrics used for covering mattresses and box springs, and upholstery fabrics primarily for use in production of upholstered furniture (residential and commercial).
We believe that Culp is the largest producer of mattress fabrics in North America, as measured by total sales, and one of the largest marketers of upholstery fabrics for furniture in North America, again measured by total sales. We have two operating segments — mattress fabrics and upholstery fabrics. The mattress fabric business markets fabrics that are used primarily in the production of bedding products, including mattresses, box springs, and mattress sets. The upholstery fabric business markets a variety of fabric products that are used in the production of residential and commercial upholstered furniture, sofas, recliners, chairs, loveseats, sectionals, sofa-beds, and office seating. Culp primarily markets fabrics that have broad appeal in the “good” and “better” priced categories of furniture and bedding.
Culp markets a variety of fabrics in different categories to its global customer base, including fabrics produced at our manufacturing facilities and fabrics produced by other suppliers. We had twelve active manufacturing plants and distribution facilities as of the end of fiscal 2012, which are located in North and South Carolina; Quebec, Canada; Shanghai, China; and Poznan, Poland. We also source fabrics from other manufacturers, located primarily in China and Turkey, with almost all of those fabrics being produced specifically for Culp and created by Culp designers. We operate distribution centers in North Carolina, and Shanghai, China, to facilitate distribution of our products, and early last year we opened a new distribution facility in Poznan, Poland. In recent years, the portion of total company sales represented by fabrics produced outside of the U.S. and Canada has increased, while sales of goods produced in the U.S. have decreased. This trend is due primarily to the upholstery fabrics segment, where more than 85% of our sales now consist of fabrics produced in China.
Total net sales in fiscal 2012 were $254.4 million. The mattress fabrics segment had net sales of $145.5 million (57.2% of total net sales), while the upholstery fabrics segment had net sales of $108.9 million (42.8% of total net sales).
During fiscal 2011, our business was affected by continued weak business conditions, especially slow sales of home furnishings. In addition, both segments were significantly affected by higher raw material prices during the year, which led to an overall decline in profit margins. In spite of these conditions, the company had an overall increase in sales of five percent compared to the prior year, as well as higher pre-tax and net income.
Weak business conditions and slow sales of home furnishings, especially during the first half of the fiscal year, continued to affect our business during fiscal 2012. However, industry demand improved somewhat compared to the prior year, and we also had more positive responses from customers to innovative designs and new products introduced during the year. Sales increased in both our business segments, increasing 19% in mattress fabrics and 15% in upholstery fabrics. These sales levels represent our third consecutive year of increased revenues, and our fiscal 2012 net sales were the highest level in the past six years.
2
During fiscal 2012, both segments continued to build upon strategic initiatives and structural changes they made over the last several years. The platforms created through these changes allowed for a sharp focus on product innovation and introduction of new designs to drive sales growth and keep current with home furnishing trends.
The mattress fabrics segment has invested $57 million over an eight year period in significant capital expenditures and acquisitions. These expenditures provided increased manufacturing capacity and more efficient equipment for this segment, as well as two successful acquisitions. Most recently, this segment announced a new joint marketing agreement to market sewn mattress covers, which will include establishment of a small production facility.
The upholstery fabrics segment underwent major changes over the past decade, transforming from a primarily U.S.-based manufacturing operation with large amounts of fixed assets to a more flexible variable cost model, with most fabrics sourced in China, while still maintaining control over the value-added components of fabric production such as design, finishing, quality control and distribution. These changes involved a multi-year restructuring process that ended in fiscal 2009, during which time our upholstery fabric sales declined considerably. The trend of declining upholstery sales has reversed, and sales in this segment have now increased for each of the past three fiscal years. Since the end of the multi-year restructuring, we have focused on product development and marketing, including the exploration of new markets. A part of this effort has been the establishment of a new marketing and distribution operation in Poland, known as Culp Europe, which accounted for about three percent of upholstery sales last year.
Additional information about trends and developments in each of our business segments is provided in the “Segments” discussion below.
Culp, Inc. was organized as a North Carolina corporation in 1972 and made its initial public offering in 1983. Since 1997, our stock has been listed on the New York Stock Exchange and traded under the symbol “CFI.” Our fiscal year is the 52 or 53 week period ending on the Sunday closest to April 30. Our executive offices are located in High Point, North Carolina.
Culp maintains an Internet website at www.culp.com. We will make this annual report and our other annual reports on Form 10-K, quarterly reports on Form 10-Q, current reports on Form 8-K and amendments to these reports, available free of charge on our Internet site as soon as reasonably practicable after such material is electronically filed with, or furnished to, the Securities and Exchange Commission. Information included on our website is not incorporated by reference into this annual report.
Our two operating segments are mattress fabrics and upholstery fabrics. The following table sets forth certain information for each of our segments.
3
|
Sales by Fiscal Year ($ in Millions) and
Percentage of Total Company Sales
|
||||||||||||
|
Segment
|
Fiscal 2012 |
Fiscal 2011
|
Fiscal 2010
|
|||||||||
|
Mattress Fabrics
|
$145.5
|
(57%)
|
$122.4
|
(56%)
|
$114.8
|
(56%)
|
||||||
|
Upholstery Fabrics
|
||||||||||||
|
Non-U.S.-Produced
|
$95.5
|
(38%)
|
$81.2
|
(37%)
|
$77.3
|
(37%)
|
||||||
|
U.S.-Produced
|
$13.4
|
(5%)
|
$13.2
|
(6%)
|
$14.3
|
(7%)
|
||||||
|
Total Upholstery
|
$108.9
|
(43%)
|
$94.4
|
(44%)
|
$91.6
|
(44%)
|
||||||
|
Total company
|
$254.4
|
(100%)
|
$216.8
|
(100%)
|
$206.4
|
(100%)
|
||||||
Additional financial information about our operating segments can be found in Note 18 to the Consolidated Financial Statements included in Item 8 of this report.
Mattress Fabrics.
The mattress fabrics segment, known as Culp Home Fashions in the industry, manufactures and markets mattress fabric to bedding manufacturers. These fabrics encompass woven jacquard fabric, knitted fabric and some upholstery type fabrics. Culp Home Fashions has manufacturing facilities located in Stokesdale and High Point, North Carolina, and St. Jerome, Quebec, Canada. The Stokesdale and St. Jerome plants manufacture jacquard (damask) fabric. The Stokesdale plant also finishes jacquard and knit fabric, and houses the division offices and finished goods distribution capabilities. In fiscal 2009, a third manufacturing plant facility was added when we acquired the knitted mattress fabrics business of Bodet & Horst USA, including its manufacturing facilities in High Point. We have also maintained flexibility in our supply of the major categories of mattress fabrics. Almost all woven jacquard and knitted fabrics can be produced in multiple facilities, (internal or external to the company) providing us with mirrored, reactive capacity involving state-of-the-art capabilities across plant facilities.
Culp Home Fashions had capital expenditures during the period fiscal 2005 through 2012 totaling approximately $38 million, which primarily provided for the purchase of faster and more efficient weaving machines as well as increased knit machine capacity. These capital expenditures also provided high technology finishing equipment for woven and knitted fabric. With most of these modernization and expansion projects completed, we expect lower capital expenditures in the near term for this segment.
The Bodet & Horst USA, LP acquisition in fiscal 2009 was another step to enhance and secure our competitive position, as we invested $11.4 million to purchase the manufacturing operation that had been serving as our primary source of knitted mattress fabric. The completion of this acquisition not only secured our supply of knitted mattress fabrics, but allowed for improved supply logistics, greater control of product development, and accelerated responsiveness to our customers. Since the acquisition, we made further investments in knitting machines and finishing equipment, increasing our internal production capacity substantially.
Our recently announced joint marketing agreement for the production and marketing of sewn mattress covers represents a further step in our efforts to respond to industry demands. The CHF division has established a new venture to be known as Culp-Lava Applied Sewn Solutions, which is a joint marketing effort with A. Lava & Son Co. of Chicago, a leading provider of mattress covers. We are establishing a small manufacturing operation near our current plants in North Carolina, which will involve leased space and a limited capital investment in equipment, to produce and market sewn mattress covers, a growing product category in the bedding industry. Teaming with A. Lava & Son allows us to have two mirrored manufacturing facilities and great flexibility in meeting demand from bedding producers for mattress covers.
4
Upholstery Fabrics.
The upholstery fabrics segment markets a wide variety of fabrics for residential and commercial furniture customers. The upholstery fabrics segment operates fabric manufacturing facilities in Anderson, South Carolina, and Shanghai, China. We market fabrics produced in these two locations, as well as a variety of upholstery fabrics sourced from third party producers, mostly in China. In each of the past two fiscal years, sales of non-U.S. produced upholstery accounted for more than 85% of our upholstery fabric sales.
Demand for U.S.-produced upholstery declined significantly over the past decade, and we took aggressive steps to reduce our U.S. manufacturing costs, capacity, and selling, general and administrative expenses. These restructuring actions reduced our U.S. upholstery operations to the one manufacturing plant in South Carolina and one upholstery distribution facility in Burlington, North Carolina.
During the time that U.S. upholstery operations were being reduced, we established operations in China and gradually expanded them over time to include a variety of activities. The facilities near Shanghai now include fabric sourcing, finishing, quality control and inspection operations, as well as a plant where sourced fabrics are cut and sewn into “kits” made to specifications of furniture manufacturing customers. More recent developments in our China operations include expansion of our product development and design capabilities in China and further strengthening of key strategic partnerships with mills. We also expanded our marketing efforts to sell our China products in countries other than the U.S., including the Chinese local market.
We established a new subsidiary during fiscal 2011 called Culp Europe, which is a marketing and distribution operation based in Poland, in an area with a high concentration of furniture suppliers. This operation targets furniture manufacturers in the European market. We view this market as a significant long-term opportunity for growth, with high living standards, fashion conscious consumers, and short replacement cycles for upholstered furniture. Culp Europe accounted for approximately 3% for our upholstery sales in fiscal 2012.
Over the past decade, we have moved our upholstery business from one that relied on a large fixed capital base that is difficult to adjust to a more flexible and scalable marketer of upholstery fabrics that meets changing levels of customer demand and tastes for various products. At the same time, we have maintained control of the most important “value added” aspects of our business, such as design, finishing, quality control, and logistics. This strategic approach has allowed us to limit our investment of capital in fixed assets and to lower the costs of our products significantly, while continuing to leverage our design and finishing expertise, industry knowledge and important relationships.
Even as economic conditions and furniture demand remained relatively weak during fiscal 2012, our upholstery fabrics sales increased for the third consecutive year. These gains reversed a ten year trend of declining upholstery sales that ended with fiscal 2009, as we substantially overhauled our operating model. We believe our increased sales in the upholstery fabrics segment were achieved primarily through implementation of a business strategy that included: 1) innovation in a low-cost environment, 2) speed to market execution, 3) consistent quality, 4) reliable service and lead times, and 5) increased recognition of and reliance on the Culp brand. A return to profitability in upholstery fabrics has been achieved through development of a unique business model that has enabled the upholstery segment to execute a strategy that we believe is clearly differentiated from competitors. In this way, we have maintained our ability to provide furniture manufacturers with products from every category of fabric used to cover upholstered furniture, and to meet continually changing demand levels and consumer preferences.
5
Culp markets products primarily to manufacturers that operate in three principal markets. The mattress fabrics segment supplies the bedding industry, which produces mattress sets (mattresses, box springs, and foundations). The upholstery fabrics segment supplies the residential furniture industry and, to a lesser extent, the commercial furniture industry. The residential furniture market includes upholstered furniture sold to consumers for household use, including sofas, sofa-beds, chairs, recliners, loveseats, sectionals, and office seating. The commercial furniture and fabrics market includes upholstered office seating and modular office systems sold primarily for use in offices and other institutional settings, and commercial textile wall covering. The principal industries into which the company sells products are described below. Currently the vast majority of our products are sold to manufacturers for end use in the U.S., and thus the discussions below are focused on U.S. markets.
In calendar 2010 and 2011, the bedding industry experienced gains in both dollar and unit sales, reversing a recent trend of declining sales over several years prior to that. According to the International Sleep Products Association (ISPA), a trade association, the U.S. wholesale bedding industry increased dollar sales by 7.7% to 6.3 billion in 2011. Unit volume sales increased only slightly (0.2%) in 2011 compared to 2010, having experienced a 6.2% increase the previous year after four years of declines. Specialty bedding manufacturers, which produce mattresses that do not use inner spring construction, now account for about 30% of bedding dollar sales, but only 14% of the unit volume in the industry. This category of bedding, which has a higher average selling price, has continued to increase its share of total bedding sales, according to industry statistics. ISPA also reported that overall average unit prices in the bedding industry increased 7.5% in 2011, reversing a trend of declines in the prior two years.
The bedding industry is comprised of several hundred manufacturers, but the largest five manufacturers accounted for more than 70% of total wholesale shipments in 2011, while the top fifteen accounted for approximately 86%. Until recently, the industry has been mature and stable, generally experiencing slow and steady growth in sales. However, during the past few years sales have been more unpredictable, as the economic downturn caused two years of sales declines, followed by a return to growth in 2010. On a long-term basis, the stability of this market has been due in part to replacement purchases, which account for the majority of bedding industry sales.
Unlike the residential furniture industry, which has faced intense competition from imports, the U.S. bedding industry has largely remained a North American based business with limited competition from imports. Imports of bedding into the U.S. have increased in recent years, but imports still represent only a small fraction of total U.S. bedding sales. The primary reasons for this fact include: 1) the short lead times demanded by mattress manufacturers and retailers due to their quick service delivery model, 2) the limited inventories carried by manufacturers and retailers requires “just-in-time” delivery of product, 3) the customized nature of each manufacturer and retailer’s product lines, 4) high shipping and import duty costs, 5) the relatively low direct labor content in mattresses, and 6) strong brand recognition and importance.
Other key trends in the bedding industry include:
|
|
●
|
Consumers have become increasingly aware of and are concerned with the health benefits of better sleep. This has caused an increased focus on the quality of bedding products and an apparent willingness on the part of consumers to upgrade their bedding.
|
6
|
|
●
|
While mattress fabrics serve the functional purpose of providing a soft and durable cover, there is a growing emphasis on the design knitted or woven into the fabrics to appeal to the customer’s visual attraction and perceived value of the mattress on the retail floor. Mattress fabric design efforts are based on current trends in home decor and fashion.
|
|
|
●
|
Growth in non-traditional sources for retail mattress sales is now an important factor in home furnishings sales. These outlets, such as wholesale warehouse clubs and the internet, have the potential to increase overall consumption of goods due to convenience and high traffic volume which in turn result in higher turnover of product.
|
|
|
●
|
Increased popularity of knitted fabric has continued. Knitted fabric was initially used primarily on premium mattresses, but these products are now being placed increasingly on mattresses at mid-range retail price points.
|
The residential furniture industry was severely affected by the global economic downturn and experienced significant declines in sales for 2008 and 2009 due to lower consumer spending and a very weak housing market. U.S. sales of residential furniture rebounded during the past two years and equaled $15.1 billion in 2011. This level represents a 4.4% increase from 2010, but is still far below sales levels experienced in the years prior to 2008. According to data published by the American Home Furnishings Alliance (AHFA), a trade association, before 2008 the residential furniture industry was mature and more stable, with generally modest yearly changes in sales levels that were at or below the overall growth rate of the U.S. economy. However, shipments declined by 14.8% in 2008 compared to the prior year, and in 2009 retail furniture shipments dropped 18.1% compared to 2008. Although industry sales appeared to have stabilized over the past two years, overall weak demand for residential furniture has continued to affect the industry, creating significant challenges for suppliers to the residential furniture industry.
Other important trends and issues facing the residential furniture industry include:
|
|
●
|
The sourcing of components and fully assembled furniture from overseas continues to play a major role in the residential furniture industry. By far, the largest source for these imports continues to be China, which now accounts for approximately 56% of total U.S. furniture imports.
|
|
|
●
|
Imports of upholstery fabric, both in roll and in “kit” form, have increased in recent years. Fabrics entering the U.S. from China and other low labor cost countries are resulting in increased price competition in the upholstery fabric and upholstered furniture markets.
|
|
|
●
|
Leather and suede upholstered furniture has been gaining market share over the last ten to twelve years. This trend has increased over the last seven years in large part because selling prices of leather furniture have been declining significantly over this time period.
|
|
|
●
|
The residential furniture industry has been consolidating at the manufacturing level for several years. The result of this trend is fewer, but larger, customers for marketers of upholstery fabrics.
|
The market for commercial furniture - furniture used in offices and other institutional settings - grew approximately 13% from 2010 to 2011, following a 5.8% increase the previous year. The increases in 2010 and 2011 reflect economic trends affecting businesses, which are the ultimate customers in this industry. According to the Business and Institutional Furniture Manufacturer’s Association (BIFMA), a trade association, the commercial furniture market in the U.S. totaled approximately $9.4 billion in 2011 in wholesale shipments by manufacturers, an increase from the $8.3 billion total for 2010. However, this total represents a significant decrease from the industry’s peak of $13.3 billion in 2000.
7
As described above, our products include mattress fabrics and upholstery fabrics, which are the company’s identified operating segments.
Mattress Fabrics Segment
Mattress fabrics segment sales constituted about 56-57% of our total net sales in each of the past three fiscal years. The company has emphasized fabrics that have broad appeal at prices generally ranging from $1.29 to $10.99 per yard.
Upholstery Fabrics Segment
Upholstery fabrics segment sales totaled 43-44% of our sales for each of the past three fiscal years. The company has emphasized fabrics that have broad appeal at “good” and “better” prices, generally ranging from $4.25 to $5.25 per yard.
Culp Fabric Categories by Segment
We market products in most categories of fabric that manufacturers currently use for bedding and furniture. The following table indicates the product lines within each segment, and a brief description of their characteristics.
|
Mattress Fabrics
|
|
|
Woven jacquards
|
Various patterns and intricate designs. Woven on complex looms using a variety of synthetic and natural yarns.
|
|
Upholstery-type
|
Suedes, pile and embroidered fabrics, and other specialty type products are sourced to offer diversity for higher end mattresses.
|
|
Knitted Fabric
|
Various patterns and intricate designs produced on special-width circular knit machines utilizing a variety of synthetic and natural yarns. Knitted mattress fabrics have inherent stretching properties and spongy softness, which conforms well with layered foam packages.
|
|
Upholstery Fabrics
|
|
|
Woven jacquards
|
Elaborate, complex designs such as florals and tapestries in traditional, transitional and contemporary styles. Woven on intricate looms using a wide variety of synthetic and natural yarns.
|
|
Woven dobbies
|
Fabrics that use straight lines to produce geometric designs such as plaids, stripes and solids in traditional and country styles. Woven on less complicated looms using a variety of weaving constructions and primarily synthetic yarns.
|
8
|
Velvets
|
Soft fabrics with a plush feel. Produced with synthetic yarns, by weaving into a base fabric. Basic designs such as plaids in both traditional and contemporary styles.
|
|
Suede fabrics
|
Fabrics woven or knitted using microdenier polyester yarns, which are piece dyed and finished, usually by sanding. The fabrics are typically plain or small jacquard designs, with some being printed. These are sometimes referred to as microdenier suedes, and some are “leather look” fabrics.
|
Mattress Fabrics Segment
Our mattress fabrics segment operates three manufacturing plants, located in Stokesdale, North Carolina; High Point, North Carolina and St. Jerome, Quebec, Canada. Over the past eight fiscal years, we made capital expenditures of approximately $38 million to consolidate all of our production of woven jacquards, or damask fabric, to these plants and to modernize the equipment, enhance and provide finishing capabilities and expand capacity in each of these facilities. The result has been an increase in manufacturing efficiency and reductions in operating costs. Jacquard mattress fabric is woven at the Stokesdale and St. Jerome plants, and knitted fabrics are produced at the High Point facility. Most finishing and inspection processes for mattress fabrics are conducted at the Stokesdale plant.
In addition to the mattress fabrics we manufacture, we have important supply arrangements in place that allow us to source mattress fabric from strategic suppliers. A portion of our woven jacquard fabric and knitted fabric is obtained from a supplier located in Turkey, based on designs created by Culp designers, and we are sourcing certain converted fabric products (such as suedes, pile fabrics and embroidered fabrics) through our China platform.
We recently announced a new joint marketing arrangement with a producer of sewn mattress covers for bedding. This effort will result in the establishment of an additional manufacturing facility to produce and market sewn mattress covers.
Upholstery Fabrics Segment
We currently operate one upholstery manufacturing facility in the U.S. and three in China. The U.S. plant is located in Anderson, South Carolina, and mainly produces velvet upholstery fabrics with some production of certain decorative fabrics.
Our upholstery manufacturing facilities in China are all located within the same industrial area near Shanghai. At these plants, we apply value-added finishing processes to fabrics sourced from a limited number of strategic suppliers in China, and we inspect sourced fabric there as well. In addition, the Shanghai operations include facilities where sourced fabric is cut and sewn to provide “kits” that are designed to be placed on specific furniture frames designated by our customers.
A large portion of our upholstery fabric products, as well as certain elements of our production processes, are being sourced from outside suppliers. The development of our facilities in China has provided a base from which to access a variety of products, including certain fabrics (such as microdenier suedes) that are not produced anywhere within the U.S. We have found opportunities to develop significant relationships with key overseas suppliers that allow us to source products on a cost-effective basis while at the same time limiting our investment of capital in manufacturing assets. We source unfinished and finished fabrics from a limited number of strategic suppliers in China who are willing to commit significant capacity to meet our needs while working with our product development team to meet the demands of our customers. We also source a substantial portion of our yarns, both for U.S. and China upholstery operations, through our China facilities. The remainder of our yarn is obtained from other suppliers around the world.
9
Consumer tastes and preferences related to bedding and upholstered furniture change over time. The use of new fabrics and designs remains an important consideration for manufacturers to distinguish their products at retail and to capitalize on changes in preferred colors, patterns and textures. Culp’s success is largely dependent on our ability to market fabrics with appealing designs and patterns. The process of developing new designs involves maintaining an awareness of broad fashion and color trends both in the United States and internationally.
Mattress Fabrics Segment
Design is an increasingly important element of producing mattress fabrics. Price point delineation is accomplished through fabric quality as well as variation in design. Additionally, consumers are drawn to the mattress that is most visually appealing when walking into a retail showroom. Fibers also play an important part in design. For example, rayon, organic cotton and other special fibers are incorporated into the design process to allow the retailer to offer consumers additional benefits related to their sleeping experience. Similarly, many fabrics contain special production finishes that enhance fabric performance. Mattress fabric designs are not introduced on a scheduled season. Designs are typically introduced upon the request of customer as they plan introduction to their retailers. Additionally, we work closely with our customers on new design offerings around the major furniture markets such as High Point and Las Vegas.
Upholstery Fabrics Segment
The company has developed an upholstery fabrics design and product development team (with staff located in the U.S. and in China) with focus on designing for value primarily on body cloths, while promoting style leadership with pillow fabrics and color. The team searches continually for new ideas and for the best sources of raw materials, yarns and fabrics, utilizing a China supply network. Using these design elements, they develop product offerings using ideas and materials which take both fashion trends and cost considerations into account, to offer products designed to meet the needs of furniture manufacturers and ultimately the desires of consumers. Upholstery fabric designs are introduced at major fabric trade conferences that occur twice a year in the United States (June and December). In recent years we have become more aggressive in registering copyrights for popular fabric patterns and taking steps to discourage the illegal copying of our proprietary designs.
Mattress Fabrics Segment
All of our shipments of mattress fabrics originate from our manufacturing facility in Stokesdale, North Carolina. Through arrangements with major customers and in accordance with industry practice, we maintain a significant inventory of mattress fabrics at our distribution facility in Stokesdale (“make to stock”), so that products may be shipped to customers with short lead times and on a “just in time” basis.
10
Upholstery Fabrics Segment
The majority of our upholstery fabrics are marketed on a “make to order” basis and are shipped directly from our distribution facilities in Burlington and Shanghai. Also, we are now beginning to distribute upholstery fabrics from our new facilities in Poznan, Poland. In addition to “make to order” distribution, an inventory comprising of a limited number of fabric patterns is held at our distribution facilities in Burlington and Shanghai from which our customers can obtain quick delivery of fabrics through a program known as “Culp Express.” We also have a marketing strategy for our U.S.-produced upholstery products, providing customers with very quick delivery on target products at key price points. Beginning in fiscal 2010 and continuing through fiscal 2012, market share opportunities have been expanded through strategic selling partnerships.
Mattress Fabrics Segment
Raw materials account for approximately 60%-70% of mattress fabric production costs. The mattress fabrics segment purchases synthetic yarns (polypropylene, polyester and rayon), certain greige (unfinished) goods, latex adhesives, laminates, dyes and other chemicals. Most of these materials are available from several suppliers and prices fluctuate based on supply and demand, the general rate of inflation, and particularly on the price of petrochemical products. The mattress fabrics segment has generally not had significant difficulty in obtaining raw materials, although increases in raw material prices materially affected our profitability during the past two fiscal years.
Upholstery Fabrics Segment
Raw materials account for approximately 65% of upholstery fabric manufacturing costs for products the company manufactures. This segment purchases synthetic yarns (polypropylene, polyester, acrylic and rayon), acrylic staple fiber, latex adhesives, dyes and other chemicals from various suppliers.
Increased reliance by both our U.S. and China upholstery operations on outside suppliers for basic production needs such as base fabrics, yarns, and finishing services has caused the upholstery fabrics segment to become more vulnerable to price increases, delays, or production interruptions caused by problems within businesses that we do not control. Significant increases in raw material prices had a negative effect on our upholstery fabrics profits during the past two fiscal years.
Both Segments
Many of our basic raw materials are petrochemical products or are produced from such products. For this reason, our material costs can be sensitive to changes in prices for petrochemicals and the underlying price of oil. Additionally, basic raw material prices recently have been greatly affected recently by general worldwide demand, especially fiber demand from China.
Mattress Fabrics Segment
The mattress fabrics business and the bedding industry in general are slightly seasonal, with sales being the highest in late spring and late summer, with another peak in mid-winter.
11
Upholstery Fabrics Segment
The upholstery fabrics business is somewhat seasonal, with increased sales during our first and fourth fiscal quarters. Sales also tend to be lower in our second fiscal quarter.
Competition for our products is high and is based primarily on price, design, quality, timing of delivery and service.
Mattress Fabrics Segment
The mattress fabrics market is concentrated in a few relatively large suppliers. We believe our principal mattress fabric competitors are Bekaert Textiles B.V., Global Textile Alliance and several smaller companies producing knitted and other fabric.
Upholstery Fabrics Segment
In the upholstery fabric market, we compete against a large number of companies, ranging from a few large manufacturers comparable in size to the company to small producers, and a growing number of “converters” of fabrics (companies who buy and re-sell, but do not manufacture fabrics). We believe our principal upholstery fabric competitors are Richloom Fabrics, Merrimack Fabrics, Morgan Fabrics, and Specialty Textile, Inc. (or STI), plus a large number of smaller competitors (both manufacturers and converters).
The trend in the upholstery fabrics industry to greater overseas competition and the entry of more converters has caused the upholstery fabrics industry to become substantially more fragmented in recent years, with lower barriers to entry. This has resulted in a larger number of competitors selling upholstery fabrics, with an increase in competition based on price.
We are subject to various federal and state laws and regulations, including the Occupational Safety and Health Act (“OSHA”) and federal and state environmental laws, as well as similar laws governing our manufacturing facilities in China and Canada. We periodically review our compliance with these laws and regulations in an attempt to minimize the risk of violations.
Our operations involve a variety of materials and processes that are subject to environmental regulation. Under current law, environmental liability can arise from previously owned properties, leased properties and properties owned by third parties, as well as from properties currently owned and leased by the company. Environmental liabilities can also be asserted by adjacent landowners or other third parties in toxic tort litigation.
12
In addition, under the Comprehensive Environmental Response, Compensation, and Liability Act of 1980, as amended (“CERCLA”), and analogous state statutes, liability can be imposed for the disposal of waste at sites targeted for cleanup by federal and state regulatory authorities. Liability under CERCLA is strict as well as joint and several.
The U.S. Congress is currently considering legislation to address climate change that is intended to reduce overall green house gas emissions, including carbon dioxide. In addition, the U.S. Environmental Protection Agency has made a determination that green house gas emissions may be a threat to human health and the environment. International agreements may also result in new regulations on green house gas emissions. It is uncertain if, when, and in what form, a mandatory carbon dioxide emissions reduction program may be enacted either through legislation or regulation. However, if enacted, this type of program could materially increase our operating costs, including costs of raw materials, transportation and electricity. It is difficult to predict the extent to which any new rules or regulations would impact our business, but we would expect the effect on our operations to be similar to that for other manufacturers, particularly those in our industry.
We are periodically involved in environmental claims or litigation and requests for information from environmental regulators. Each of these matters is carefully evaluated, and the company provides for environmental matters based on information presently available. Based on this information, we do not believe that environmental matters will have a material adverse effect on either the company’s financial condition or results of operations. However, there can be no assurance that the costs associated with environmental matters will not increase in the future.
See the discussion of a current environmental claim against the company below in Item 3 — “Legal Proceedings.”
As of April 29, 2012, we had 1,114 employees, compared to 1,149 at the end of fiscal 2011. Overall, our total number of employees has remained fairly steady over the past five years, with increases in the mattress fabrics segment and decreases in the upholstery segment during that period.
The hourly employees at our manufacturing facility in Canada (approximately 14% of the company’s workforce) are represented by a local, unaffiliated union. The collective bargaining agreement for these employees expires on February 1, 2014. We are not aware of any efforts to organize any more of our employees, and we believe our relations with our employees are good.
13
The following table illustrates the changes in the location of our workforce and number of employees, as of year-end, over the past five fiscal years.
|
Number of Employees
|
||||||||||||||||||||
|
Fiscal
2012
|
Fiscal
2011
|
Fiscal
2010
|
Fiscal
2009
|
Fiscal
2008
|
||||||||||||||||
|
Mattress Fabrics Segment
|
492 | 466 | 439 | 420 | 373 | |||||||||||||||
|
Upholstery Fabrics Segment
|
||||||||||||||||||||
|
United States
|
113 | 130 | 125 | 119 | 230 | |||||||||||||||
|
China
|
497 | 543 | 537 | 504 | 481 | |||||||||||||||
|
Poland
|
8 | 6 | - | - | - | |||||||||||||||
|
Total Upholstery Fabrics Segment
|
618 | 679 | 662 | 623 | 711 | |||||||||||||||
|
Unallocated corporate
|
4 | 4 | 4 | 4 | 3 | |||||||||||||||
|
Total
|
1,114 | 1,149 | 1,105 | 1,047 | 1,087 | |||||||||||||||
Mattress Fabrics Segment
Major customers for our mattress fabrics include the leading bedding manufacturers: Sealy, Serta (National Bedding), and Simmons. The loss of one or more of these customers would have a material adverse effect on the company. Our two largest customers in the mattress fabrics segment are (1) the parent company of Serta and Simmons (controlled by Ares Management, LLC and Ontario Teachers&apos), accounting for approximately 12% of the company’s overall sales in fiscal 2012, and (2) Sealy, Inc., accounting for approximately 10% of our overall sales last year. The loss of either of these customers would have a material adverse effect on the company. Our mattress fabrics customers also include many small and medium-size bedding manufacturers.
Upholstery Fabrics Segment
Our major customers for upholstery fabrics are leading manufacturers of upholstered furniture, including Ashley, Bassett, Best Home Furnishings, Flexsteel, Furniture Brands International (Broyhill and Lane), Klaussner Furniture, La-Z-Boy (La-Z-Boy Residential, Bauhaus, and England) Man Wah Furniture and Southern Motion. Major customers for the company’s fabrics for commercial furniture include HON Industries. Our largest customer in the upholstery fabrics segment is La-Z-Boy Incorporated, the loss of which would have a material adverse effect on the company. Our sales to La-Z-Boy accounted for approximately 13% of the company’s total net sales in fiscal 2012.
14
The following table sets forth our net sales by geographic area by amount and percentage of total net sales for the three most recent fiscal years.
(dollars in thousands)
|
Fiscal 2012
|
Fiscal 2011
|
Fiscal 2010
|
||||||||||||||||||||||
|
United States
|
$ | 200,394 | 78.8 | % | $ | 168,212 | 77.5 | % | $ | 160,360 | 77.7 | % | ||||||||||||
|
North America
|
10,417 | 4.1 | 10,505 | 4.8 | 11,654 | 5.6 | ||||||||||||||||||
|
(Excluding USA)
|
||||||||||||||||||||||||
|
Far East and Asia
|
38,279 | 15.0 | 36,587 | 17.0 | 31,856 | 15.4 | ||||||||||||||||||
|
All other areas
|
5,353 | 2.1 | 1,502 | 0.7 | 2,546 | 1.2 | ||||||||||||||||||
|
Subtotal
(International)
|
54,049 | 21.2 | 48,594 | 22.5 | 46,056 | 22.3 | ||||||||||||||||||
|
Total
|
$ | 254,443 | 100.00 | % | $ | 216,806 | 100.0 | % | $ | 206,416 | 100.0 | % | ||||||||||||
For additional segment information, see Note 18 in the consolidated financial statements.
Mattress Fabrics Segment
The backlog for mattress fabric is not a reliable predictor of future shipments because the majority of sales are on a just-in-time basis.
Upholstery Fabrics Segment
Although it is difficult to predict the amount of backlog that is “firm,” we have reported the portion of the upholstery fabric backlog from customers with confirmed shipping dates within five weeks of the end of the fiscal year. On April 29, 2012 the portion of the upholstery fabric backlog with confirmed shipping dates prior to June 3, 2012 was $12.2 million, all of which are expected to be filled early during fiscal 2013, as compared to $8.0 million as of the end of fiscal 2011 (for confirmed shipping dates prior to June 5, 2011).
Our business is subject to risks and uncertainties. In addition to the matters described above under “Cautionary Statement Concerning Forward-Looking Information,” set forth below are some of the risks and uncertainties that could cause a material adverse change in our results of operations or financial condition.
Continued economic weakness could negatively affect our sales and earnings.
Overall demand for our products depends upon consumer demand for furniture and bedding, which is subject to variations in the general economy. Because purchases of furniture or bedding are discretionary purchases for most individuals and businesses, demand for these products is sometimes more easily influenced by economic trends than demand for other products. Economic downturns can affect consumer spending habits and demand for home furnishings, which reduces the demand for our products and therefore can cause a decrease in our sales and earnings. Continuing weak economic conditions have caused a decrease in consumer spending and demand for home furnishings, including goods that incorporate our products. If these conditions persist, our business will be negatively affected.
15
It has been difficult to maintain and increase sales levels in the upholstery fabrics segment.
Although sales have stabilized in recent years for our upholstery fabrics segment, we experienced declines in sales for this business for many years prior to the last three fiscal years. Increased competition and fragmentation of the upholstery fabrics business, including a dramatic shift to imported fabrics and resulting price deflation for upholstery fabrics, have led to a significant reduction in the size of our upholstery business. Opportunities for growth and profitability gains for this segment are encouraging, but there is no assurance that we will be able to maintain or consistently grow this business in the future.
Increased reliance on offshore operations and foreign sources of products or raw materials increases the likelihood of disruptions to our supply chain or our ability to deliver products to our customers on a timely basis.
We now rely significantly on operations in distant locations, particularly China, and in addition we have been purchasing an increasing share of our products and raw materials from offshore sources. At the same time, our domestic manufacturing capacity for the upholstery fabrics segment has been greatly reduced. These changes have caused us to place greater reliance on a much longer supply chain and on a larger number of suppliers that we do not control, both of which are inherently subject to greater risks of delay or disruption. In addition, operations and sourcing in foreign areas are subject to the risk of changing local governmental rules, taxes, changes in import rules or customs, potential political unrest, or other threats that could disrupt or increase the costs of operating in foreign areas or sourcing products overseas. Changes in the value of the U.S. dollar versus other currencies can affect our financial results because a significant portion of our operations are located outside the United States. Strengthening of the U.S. dollar against other currencies can have a negative impact on our sales of products produced in those countries. Any of the risks associated with foreign operations and sources could cause unanticipated increases in operating costs or disruptions in business, which could negatively impact our ultimate financial results.
We may have difficulty managing the outsourcing arrangements increasingly being used for products and services.
We rely on outside sources for various products and services, including yarn and other raw materials, greige (unfinished) fabrics, finished fabrics, and services such as weaving and finishing. Increased reliance on outsourcing lowers our capital investment and fixed costs, but it decreases the amount of control that we have over certain elements of our production capacity. Interruptions in our ability to obtain raw materials or other required products or services from our outside suppliers on a timely and cost effective basis, especially if alternative suppliers cannot be immediately obtained, could disrupt our production and damage our financial results.
Further write-offs or write-downs of assets would result in a decrease in our earnings and shareholders’ equity.
The company has long-lived assets, consisting mainly of property, plant and equipment and goodwill. ASC Topic 360 establishes an impairment accounting model for long-lived assets such as property, plant, and equipment and requires the company to assess for impairment whenever events or changes in circumstances indicate that the carrying value of the asset may not be recovered. ASC Topic 350 requires that goodwill be tested at least annually for impairment or whenever events or changes in circumstances indicate that the carrying value of the asset may not be recovered. Restructuring activities and other tests for impairment have resulted and could in the future result in the write-down of a portion of our long-lived assets and a corresponding reduction in earnings and net worth. Although no significant write-downs were experienced in the past three fiscal years, there is no assurance that future write-downs of fixed assets or goodwill will not occur if business conditions deteriorate.
16
Changes in the price, availability and quality of raw materials could increase our costs or cause production delays and sales interruptions, which would result in decreased earnings.
We depend upon outside suppliers for most of our raw material needs, and increasingly we rely upon outside suppliers for component materials such as yarn and unfinished fabrics, as well as for certain services such as finishing and weaving. Fluctuations in the price, availability and quality of these goods and services could have a negative effect on our production costs and ability to meet the demands of our customers, which would affect our ability to generate sales and earnings. In many cases, we are not able to pass through increased costs of raw materials or increased production costs to our customers through price increases. In particular, many of our basic raw materials are petrochemical products or are produced from such products. For this reason, our material costs are especially sensitive to changes in prices for petrochemicals and the underlying price of oil. Increases in prices for oil, petrochemical products or other raw materials and services provided by outside suppliers could significantly increase our costs and negatively affect earnings. Increases in market prices for certain fibers and yarns had a material adverse impact on our profit margins during fiscal 2011 and 2012. Although some of our raw material costs have recently begun to stabilize, higher raw material prices can have a negative effect on our profits in the future.
Increases in energy costs would increase our operating costs and could adversely affect earnings.
Higher prices for electricity, natural gas and fuel increase our production and shipping costs. A significant shortage, increased prices, or interruptions in the availability of these energy sources would increase the costs of producing and delivering products to our customers, and would be likely to adversely affect our earnings. In many cases, we are not able to pass along the full extent of increases in our production costs to customers through price increases. Energy costs have varied significantly during recent fiscal years, and remain a volatile element of our costs. Further increases in energy costs could have a negative effect on our earnings.
Business difficulties or failures of large customers could result in a decrease in our sales and earnings.
We currently have several customers that account for a substantial portion of our sales. In the mattress fabrics segment, several large bedding manufacturers have large market shares and comprise a significant portion of our mattress fabric sales, with the parent company of Serta (National Bedding) and Simmons accounting for approximately 12% of consolidated net sales, and Sealy, Inc. accounting for approximately 10% of net sales, in fiscal 2012. In the upholstery fabrics segment, La-Z-Boy Incorporated accounted for approximately 13% of consolidated net sales during fiscal 2012, and several other large furniture manufacturers comprised a significant portion of sales. A business failure or other significant financial difficulty by one or more of our major customers could cause a significant loss in sales, an adverse effect on our earnings, and difficulty in collection of our trade accounts receivable.
Loss of market share due to competition would result in declines in sales and could result in losses or decreases in earnings.
Our business is highly competitive, and in particular the upholstery fabric industry is fragmented and is experiencing an increase in the number of competitors. As a result, we face significant competition from a large number of competitors, both foreign and domestic. We compete with many other manufacturers of fabric, as well as converters who source fabrics from various producers and market them to manufacturers of furniture and bedding. In many cases, these fabrics are sourced from foreign suppliers who have a lower cost structure than the company. The highly competitive nature of our business means we are constantly subject to the risk of losing market share. Our sales of upholstery fabrics have decreased significantly over the past ten fiscal years due in part to the increased number of competitors in the marketplace, especially foreign sources of fabric. As a result of increased competition, there have been deflationary pressures on the prices for many of our products, which make it more difficult to pass along increased operating costs such as raw materials, energy or labor in the form of price increases and puts downward pressure on our profit margins. Also, the large number of competitors and wide range of product offerings in our business can make it more difficult to differentiate our products through design, styling, finish and other techniques.
17
If we fail to anticipate and respond to changes in consumer tastes and fashion trends, our sales and earnings may decline.
Demand for various types of upholstery fabrics and mattress coverings changes over time due to fashion trends and changing consumer tastes for furniture and bedding. Our success in marketing our fabrics depends upon our ability to anticipate and respond in a timely manner to fashion trends in home furnishings. If we fail to identify and respond to these changes, our sales of these products may decline. In addition, incorrect projections about the demand for certain products could cause the accumulation of excess raw material or finished goods inventory, which could lead to inventory mark-downs and further decreases in earnings.
We are subject to litigation and environmental regulations that could adversely impact our sales and earnings.
We are, and in the future may be, a party to legal proceedings and claims, including environmental matters, product liability and employment disputes, some of which claim significant damages. We face the continual business risk of exposure to claims that our business operations have caused personal injury or property damage. We maintain insurance against product liability claims and in some cases have indemnification agreements with regard to environmental claims, but there can be no assurance that these arrangements will continue to be available on acceptable terms or that such arrangements will be adequate for liabilities actually incurred. Given the inherent uncertainty of litigation, there can be no assurance that claims against the company will not have a material adverse impact on our earnings or financial condition. We are also subject to various laws and regulations in our business, including those relating to environmental protection and the discharge of materials into the environment. We could incur substantial costs as a result of noncompliance with or liability for cleanup or other costs or damages under environmental laws or other regulations.
We must comply with a number of governmental regulations applicable to our business, and changes in those regulations could adversely affect our business.
Our products and raw materials are and will continue to be subject to regulation in the United States by various federal, state and local regulatory authorities. In addition, other governments and agencies in other jurisdictions regulate the manufacture, sale and distribution of our products and raw materials. For example, standards for flame resistance of fabrics have been recently adopted on a nationwide basis. Also, rules and restrictions regarding the importation of fabrics and other materials, including custom duties, quotas and other regulations, are continually changing. Environmental laws, labor laws, tax regulations and other regulations continually affect our business. All of these rules and regulations can and do change from time to time, which can increase our costs or require us to make changes in our manufacturing processes, product mix, sources of products and raw materials, or distribution. Changes in the rules and regulations applicable to our business may negatively impact our sales and earnings.
18
None.
Our headquarters are located in High Point, North Carolina. As of the end of fiscal 2012, we owned or leased twelve active manufacturing and distribution facilities and our corporate headquarters. The following is a list of our principal administrative, manufacturing and distribution facilities. The manufacturing facilities and distribution centers are organized by segment.
|
Approx.
|
||||
|
Total Area
|
Expiration
|
|||
|
Location
|
Principal Use
|
(
Sq. Ft.)
|
of Lease (1)
|
|
|
●
Administrative:
|
||||
|
High Point, North Carolina
|
Upholstery fabric division
|
29,812
|
2025
|
|
|
offices and corporate
|
||||
|
headquarters
|
||||
|
●
Mattress Fabrics:
|
||||
|
Stokesdale, North Carolina
|
Manufacturing, distribution,
|
230,000
|
Owned
|
|
|
and division offices
|
||||
|
Stokesdale, North Carolina (2)
|
Warehouse
|
30,800
|
-
|
|
|
High Point, North Carolina (2)
|
Manufacturing
|
63,522
|
-
|
|
|
High Point, North Carolina
|
Warehouse and offices
|
65,886
|
2014
|
|
|
St. Jerome, Quebec, Canada
|
Manufacturing
|
202,500
|
Owned
|
|
|
●
Upholstery Fabrics:
|
||||
|
Anderson, South Carolina
|
Manufacturing
|
99,000
|
Owned
|
|
|
Burlington, North Carolina
|
Finished goods distribution
|
67,330
|
2012
|
|
|
Shanghai, China
|
Manufacturing and offices
|
69,000
|
2013
|
|
|
Shanghai, China
|
Manufacturing and warehousing
|
90,000
|
2015
|
|
|
Shanghai, China
|
Manufacturing and warehousing
|
101,632
|
2013
|
|
|
Shanghai, China
|
Warehouse
|
12,917
|
2013
|
|
|
Poznan, Poland
|
Finished goods distribution
|
26,160
|
2015
|
____________________________________________________
|
(1)
|
Includes all options to renew.
|
|
(2)
|
This lease agreement is currently on a month to month basis.
|
We believe that our facilities are in good condition, well-maintained and suitable and adequate for present utilization. In the upholstery fabrics segment, we have the ability to source upholstery fabric from outside suppliers to meet current and expected demand trends and further increase our output of finished goods. This ability to source upholstery fabric is part of our long-term strategy to have a low-cost platform that is scalable, but not capital intensive. In the mattress fabrics segment, management has estimated that it is currently performing at near capacity. In response, we had capital expenditures of $17.2 million in fiscal 2012, 2011 and 2010 for modernizing and expanding our woven and knit capacities. Also, we have the ability to source additional mattress fabric from outside suppliers to further increase our ultimate output of finished goods.
19
A lawsuit was filed against us and other defendants (Chromatex, Inc., Rossville Industries, Inc., Rossville Companies, Inc. and Rossville Investments, Inc.) on February 5, 2008 in United States District Court for the Middle District of Pennsylvania. The plaintiffs are Alan Shulman, Stanley Siegel, Ruth Cherenson as Personal Representative of Estate of Alan Cherenson, and Adrienne Rolla and M.F. Rolla as Executors of the Estate of Joseph Byrnes. The plaintiffs were partners in a general partnership that formerly owned a manufacturing plant in West Hazleton, Pennsylvania (the “Site”). Approximately two years after this general partnership sold the Site to defendants Chromatex, Inc. and Rossville Industries, Inc., we leased and operated the Site as part of our Rossville/Chromatex division. The lawsuit involves court judgments that have been entered against the plaintiffs and against defendant Chromatex, Inc. requiring them to pay costs incurred by the United States Environmental Protection Agency (“USEPA”) responding to environmental contamination at the Site, in amounts approximating $8.6 million, plus unspecified future environmental costs. We understand that the USEPA’s costs now exceed $13 million, but are not expected to increase significantly in the future. Neither USEPA nor any other governmental authority has asserted any claim against us on account of these matters. The plaintiffs seek contribution from us and other defendants and a declaration that the company and the other defendants are responsible for environmental response costs under environmental laws and certain agreements. The plaintiffs also assert that we tortiously interfered with contracts between them and other defendants in the case and diverted assets to prevent the plaintiffs from being paid monies owed to them. We do not believe we have any liability for the matters described in this litigation and intend to defend ourselves vigorously. In addition, we have an indemnification agreement with certain other defendants in the litigation pursuant to which the other defendants agreed to indemnify us for any damages we incur as a result of the environmental matters that are the subject of this litigation, although it is unclear whether the indemnitors have significant assets at this time. Since the loss is not probable and cannot be estimated, no reserve has been recorded.
Not applicable.
20
Registrar and Transfer Agent
Computershare Trust Company, N.A.
c/o Computershare Investor Services
Post Office Box 43078
Providence, Rhode Island 02940-3078
(800) 254-5196
(781) 575-2879 (Foreign shareholders)
www.computershare.com/investor
Stock Listing
Culp, Inc. common stock is traded on the New York Stock Exchange (“NYSE”) under the symbol CFI. As of April 29, 2012, Culp, Inc. had approximately 1,775 shareholders based on the number of holders of record and an estimate of individual participants represented by security position listings.
Analyst Coverage
These analysts cover Culp, Inc.:
Raymond, James & Associates - Budd Bugatch, CFA
Value Line – Craig Sirois
Sidoti & Company, LLC – Steve Shaw
Dividends and Share Repurchases; Sales of Unregistered Securities
Share Repurchases
ISSUER PURCHASES OF EQUITY SECURITIES
|
Period
|
(a)
Total Number
of Shares
Purchased
|
(b)
Average Price
Paid per Share
|
(c)
Total Number of
Shares Purchased as
Part of Publicly
Announced Plans or
Programs
|
(d)
Approximate Dollar
Value of Shares that
May Yet Be Purchased
Under the Plans or
Programs (1) (2)
|
|
January 30, 2012 to
March 4, 2012
|
-
|
$ -
|
-
|
$1,617,983
|
|
March 5, 2012 to
April 1, 2012
|
-
|
$ -
|
-
|
$1,617,983
|
|
April 2, 2012 to
April 29, 2012
|
-
|
$ -
|
-
|
$1,617,983
|
|
Total
|
-
|
$ -
|
-
|
$1,617,983
|
21
|
|
(1)
|
On June 16, 2011, our board of directors authorized the expenditure of $5.0 million for the repurchase of our common stock. On August 29, 2011, our board of directors authorized the expenditure of an additional $2.0 million (a cumulative total of $7.0 million) for the repurchase of our common stock. The amounts determined in column (d) above are based on the cumulative authorized amount of $7.0 million as of August 29, 2011.
|
|
|
(2)
|
On June 13, 2012, we announced that our board of directors approved a new authorization for us to acquire up to $5.0 million of our common stock. This action replaces the authorization to acquire up to $7.0 million of our common stock noted in footnote 1 above.
|
Dividends
We did not pay any cash dividends during fiscal 2012, 2011, and 2010.
On June 13, 2012, we announced that our board of directors approved the payment of a quarterly cash dividend of $0.03 per share, to be paid on or about July 16, 2012, to shareholders of record as of the close of business on July 2, 2012. We anticipate paying a cash dividend each quarter, with expected payment dates in October, January, April, and July. Future dividend payments are subject to board approval and may be adjusted at the board’s discretion as business needs or market conditions change.
Sales of Unregistered Securties
There were no sales of unregistered securities during fiscal 2012, 2011, or 2010.
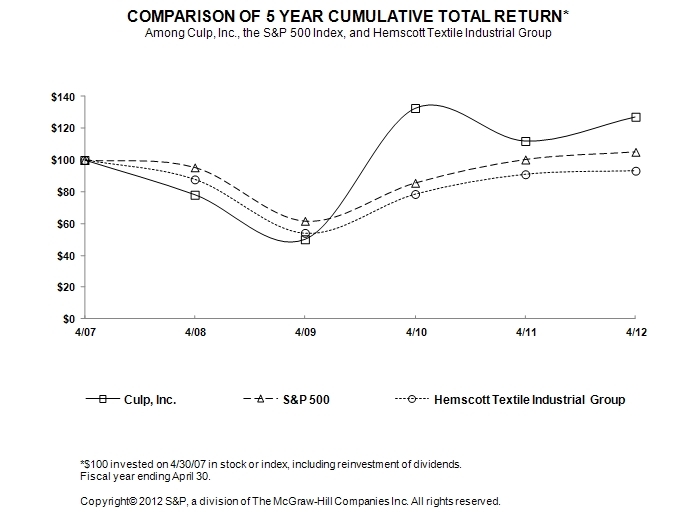
Performance Comparison
The following graph shows changes over the five fiscal years ending April 29, 2012 in the value of $100 invested in (1) the common stock of the company, (2) the Hemscott Textile Manufacturing Group Index (formerly named Core Data Textile Manufacturing Group Index) reported by Standard and Poor’s, consisting of twelve companies (including the company) in the textile industry, and (3) the Standard & Poor’s 500 Index.
The graph assumes an initial investment of $100 at the end of fiscal 2007 and the reinvestment of all dividends during the periods identified.
22
Market Information
See Item 6, Selected Financial Data, and Selected Quarterly Data in Item 8, for market information regarding the company’s common stock.
23
|
percent
|
||||||||||||||||||||||||
|
fiscal
|
fiscal
|
fiscal
|
fiscal
|
fiscal
|
change
|
|||||||||||||||||||
|
(amounts in thousands)
|
2012
|
2011
|
2010
|
2009
|
2008
|
2012/2011 | ||||||||||||||||||
|
INCOME (LOSS) STATEMENT DATA
|
||||||||||||||||||||||||
|
net sales
|
$ | 254,443 | 216,806 | 206,416 | 203,938 | 254,046 | 17.4 | % | ||||||||||||||||
|
cost of sales (5)
|
214,711 | 179,966 | 167,639 | 179,286 | 220,887 | 19.3 | ||||||||||||||||||
|
gross profit
|
39,732 | 36,840 | 38,777 | 24,652 | 33,159 | 7.9 | ||||||||||||||||||
|
selling, general, and administrative expenses (5)
|
25,026 | 21,069 | 22,805 | 19,751 | 23,973 | 18.8 | ||||||||||||||||||
|
restructuring expense (credit) (5)
|
- | 28 | (370 | ) | 9,471 | 886 | (100.0 | ) | ||||||||||||||||
|
income (loss) from operations
|
14,706 | 15,743 | 16,342 | (4,570 | ) | 8,300 | (6.6 | ) | ||||||||||||||||
|
interest expense
|
780 | 881 | 1,314 | 2,359 | 2,975 | (11.5 | ) | |||||||||||||||||
|
interest income
|
(508 | ) | (240 | ) | (116 | ) | (89 | ) | (254 | ) | 111.7 | |||||||||||||
|
other expense
|
236 | 40 | 828 | 43 | 736 | 490.0 | ||||||||||||||||||
|
income (loss) before income taxes
|
14,198 | 15,062 | 14,316 | (6,883 | ) | 4,843 | (5.7 | ) | ||||||||||||||||
|
income taxes
|
902 | (1,102 | ) | 1,128 | 31,959 | (542 | ) |
N.M.
|
||||||||||||||||
|
net income (loss)
|
$ | 13,296 | 16,164 | 13,188 | (38,842 | ) | 5,385 | (17.7 | ) | |||||||||||||||
|
depreciation (6)
|
$ | 4,865 | 4,372 | 4,010 | 6,712 | 5,548 | 11.3 | |||||||||||||||||
|
weighted average shares outstanding
|
12,711 | 12,959 | 12,709 | 12,651 | 12,624 | (1.9 | ) | |||||||||||||||||
|
weighted average shares outstanding, assuming dilution
|
12,866 | 13,218 | 13,057 | 12,651 | 12,765 | (2.7 | ) | |||||||||||||||||
|
PER SHARE DATA
|
||||||||||||||||||||||||
|
net income (loss) per share - basic
|
$ | 1.05 | 1.25 | 1.04 | (3.07 | ) | 0.43 | (16.1 | ) | |||||||||||||||
|
net income (loss) per share - diluted
|
1.03 | 1.22 | 1.01 | (3.07 | ) | 0.42 | (15.5 | ) | ||||||||||||||||
|
book value
|
$ | 7.00 | 6.06 | 4.83 | 3.76 | 6.83 | 15.5 | |||||||||||||||||
|
BALANCE SHEET DATA
|
||||||||||||||||||||||||
|
operating working capital (4)
|
$ | 30,596 | 23,921 | 22,979 | 23,503 | 38,368 | 27.9 | % | ||||||||||||||||
|
property, plant and equipment, net
|
31,279 | 30,296 | 28,403 | 24,253 | 32,939 | 3.2 | ||||||||||||||||||
|
total assets
|
144,716 | 130,051 | 112,598 | 95,294 | 148,029 | 11.3 | ||||||||||||||||||
|
capital expenditures
|
5,919 | 6,302 | 7,397 | 3,160 | 6,928 | (6.1 | ) | |||||||||||||||||
|
long-term debt, current maturities of long-term debt and line of credit (1)
|
10,012 | 11,547 | 11,687 | 16,368 | 21,423 | (13.3 | ) | |||||||||||||||||
|
shareholders' equity
|
89,000 | 80,341 | 63,047 | 48,031 | 86,359 | 10.8 | ||||||||||||||||||
|
capital employed (3)
|
67,887 | 62,521 | 57,296 | 56,659 | 75,036 | 8.6 | ||||||||||||||||||
|
RATIOS & OTHER DATA
|
||||||||||||||||||||||||
|
gross profit margin
|
15.6 | % | 17.0 | % | 18.8 | % | 12.1 | % | 13.1 | % | ||||||||||||||
|
operating income (loss) margin
|
5.8 | % | 7.3 | % | 7.9 | % | (2.2 | )% | 3.3 | % | ||||||||||||||
|
net income (loss) margin
|
5.2 | % | 7.5 | % | 6.4 | % | (19.0 | )% | 2.1 | % | ||||||||||||||
|
effective income tax rate
|
6.4 | % | (7.3 | )% | 7.9 | % | (464.3 | )% | (11.2 | )% | ||||||||||||||
|
debt to total capital employed ratio (1)
|
14.7 | % | 18.5 | % | 20.4 | % | 28.9 | % | 28.6 | % | ||||||||||||||
|
operating working capital turnover (4)
|
8.9 | 8.8 | 9.0 | 6.4 | 5.8 | |||||||||||||||||||
|
days sales in receivables
|
36 | 34 | 35 | 32 | 37 | |||||||||||||||||||
|
inventory turnover
|
6.6 | 6.6 | 6.7 | 6.0 | 5.8 | |||||||||||||||||||
|
STOCK DATA
|
||||||||||||||||||||||||
|
stock price
|
||||||||||||||||||||||||
|
high
|
$ | 11.81 | 14.10 | 16.98 | 7.91 | 12.30 | ||||||||||||||||||
|
low
|
7.05 | 6.56 | 3.50 | 1.30 | 6.12 | |||||||||||||||||||
|
close
|
11.05 | 10.08 | 11.94 | 4.40 | 7.53 | |||||||||||||||||||
|
P/E ratio (2)
|
||||||||||||||||||||||||
|
high
|
11 | 12 | 17 |
N.M.
|
29 | |||||||||||||||||||
|
low
|
7 | 5 | 3 |
N.M.
|
15 | |||||||||||||||||||
|
daily average trading volume (shares)
|
30.6 | 58.0 | 80.1 | 19.2 | 38.3 | |||||||||||||||||||
|
(1)
|
Debt includes long-term and current maturities of long-term debt and line of credit.
|
|
(2)
|
P/E ratios based on trailing 12-month net income per share.
|
|
(3)
|
Capital employed represents long-term and current maturities of long-term debt, lines of credit, current and noncurrent
deferred income tax liabilities, current and long-term income taxes payable, stockholders' equity, offset by cash and cash equivalents,
short-term investments, current and noncurrent deferred income tax assets, and income taxes receivable.
|
|
(4)
|
Operating working capital for this calculation is accounts receivable and inventories, offset by accounts payable-trade and capital expenditures.
|
|
(5)
|
The company incurred restructuring and related charges (credits) in fiscal 2008 through 2011. See note 2 of the company's consolidated financial statements.
|
|
(6)
|
Includes accelerated depreciation of $2.1 in fiscal 2009. No accelerated depreciation was recorded in fiscal 2012, 2011, 2010, and 2008.
|
24
The following analysis of the financial condition and results of operations should be read in conjunction with the consolidated financial statements and notes attached thereto.
General
Our fiscal year is the 52 or 53 week period ending on the Sunday closest to April 30. Fiscal 2012, 2011 and 2010 each included 52 weeks. Our operations are classified into two business segments: mattress fabrics and upholstery fabrics. The mattress fabrics segment manufactures, sources, and sells fabrics to bedding manufacturers. The upholstery fabrics segment sources, manufacturers and sells fabrics primarily to residential and commercial (contract) furniture manufacturers.
We evaluate the operating performance of our segments based upon income from operations before restructuring and related charges (credits), certain unallocated corporate expenses, and other non-recurring items. Cost of sales in both segments include costs to manufacture or source our products, including costs such as raw material and finished goods purchases, direct and indirect labor, overhead and incoming freight charges. Unallocated corporate expenses primarily represent compensation and benefits for certain executive officers and all costs related to being a public company. Segment assets include assets used in the operation of each segment and primarily consist of accounts receivable, inventories, and property, plant and equipment. The mattress fabrics segment also includes in segment assets, assets held for sale, goodwill, and non-compete agreements associated with certain acquisitions. The upholstery fabrics segment also includes assets held for sale in segment assets.
Executive Summary
Net sales were $254.4 million in fiscal 2012, an increase of 17.4%, compared with $216.8 million for fiscal 2011. Also, net sales were $75.7 million in the fourth quarter of fiscal 2012, an increase of 25.4%, compared with $60.4 million in the fourth quarter of fiscal 2011. The $75.7 million reported in the fourth quarter of fiscal 2012 is the highest quarterly net sales level in eight years. These results reflect improved industry demand and the benefits of our outstanding design capabilities and lean global manufacturing platform.
Income before income taxes was $14.2 million in fiscal 2012, a decrease of 5.7% compared with $15.1 million in fiscal 2011. Despite the increase in net sales, income before income taxes declined primarily because of significant increases in raw material costs in both business segments and higher selling, general, and administrative expenses (SG&A). To help partially offset the increased raw material costs, we implemented price increases in both business segments. While the increased raw material costs affected our operating margins for the full fiscal year for 2012, raw material prices stabilized in the fourth quarter of fiscal 2012.
SG&A was higher in fiscal 2012 compared to fiscal 2011 due to start-up expenses associated with our Culp Europe operations and an increase in incentive compensation accruals reflecting stronger financial results in relation to pre-established performance targets. SG&A as a percent of net sales was 9.8% and 9.7% in fiscal 2012 and 2011, respectively.
25
We reported net income of $13.3 million, or $1.03 per diluted share, in fiscal 2012 compared with net income of $16.2 million, or $1.22 per diluted share, in fiscal 2011. Net income for fiscal 2012 included income tax expense of $902,000 and net income for fiscal 2011 included an income tax benefit of $1.1 million. The income tax expense of $902,000 in fiscal 2012 includes an income tax benefit of $4.8 million for the reduction of our valuation allowance against our U.S. net deferred tax assets. The income tax benefit of $1.1 million in fiscal 2011 includes an income tax benefit of $6.4 million for the reduction of our valuations allowances against our U.S. and China net deferred tax assets.
At April 29, 2012, our cash and cash equivalents and short-term investments totaled $31.0 million compared with $30.9 million at May 1, 2011. Our cash and cash equivalents and short-term investments remained unchanged despite common stock repurchases of $5.4 million, capital expenditures of $5.9 million, long-term debt payments of $2.4 million, and working capital spending of $6.9 million to meet increasing business needs. Our cash and cash equivalents and short-term investments of $31.0 million exceeded our total debt (current maturities of long-term debt, long-term debt, and line of credit) of $10.0 million. Our next scheduled significant principal payment of $2.2 million is due August 2012.
During fiscal 2012, our board of directors authorized the expenditure of up to $7.0 million for the repurchase of shares of our common stock. Under the common stock repurchase program, shares may be purchased from time to time in open market transactions, block trades, and through plans established under the Securities Exchange Act Rule 10b5-1. The amount of shares purchased and the timing of such purchases is based on working capital requirements, market and general business conditions and other factors including alternative investment opportunities. Since the initial authorization of this program on June 16, 2011, we repurchased approximately 624,000 shares of our common stock at a cost of $5.4 million through April 29, 2012.
On June 13, 2012, we announced that our board of directors approved a new authorization to repurchase up to $5.0 million of our common stock. This action replaces the authorization to acquire up to $7.0 million of our common stock noted above.
On June 13, 2012, we announced that our board of directors approved the payment of a quarterly cash dividend of $0.03 per share to be paid on or about July 16, 2012, to shareholders of record as of the close of business on July 2, 2012. Our last dividend payment was over eleven years ago. We anticipate paying a cash dividend each quarter, with expected payment dates in October, January, April, and July. Future dividend payments are subject to board approval and may be adjusted at the board’s discretion as business needs or market conditions change.
26
Results of Operations
The following table sets forth certain items in our consolidated statements of net income as a percentage of net sales.
|
Fiscal
|
Fiscal
|
Fiscal
|
||||||||||
|
2012
|
2011
|
2010
|
||||||||||
|
Net sales
|
100.0 | % | 100.0 | % | 100.0 | % | ||||||
|
Cost of sales
|
84.4 | 83.0 | 81.2 | |||||||||
|
Gross profit
|
15.6 | 17.0 | 18.8 | |||||||||
|
Selling, general and administrative expenses
|
9.8 | 9.7 | 11.0 | |||||||||
|
Restructuring expense (credit)
|
0.0 | 0.0 | (0.2 | ) | ||||||||
|
Income from operations
|
5.8 | 7.3 | 7.9 | |||||||||
|
Interest expense, net
|
0.1 | 0.3 | 0.5 | |||||||||
|
Other expense
|
0.1 | 0.0 | 0.4 | |||||||||
|
Income before income taxes
|
5.6 | 6.9 | 6.9 | |||||||||
|
Income taxes *
|
6.4 | (7.3 | ) | 7.9 | ||||||||
|
Net income
|
5.2 | % | 7.5 | % | 6.4 | % | ||||||
* Calculated as a percentage of income before income taxes.
The tables on the following two pages set forth the company’s statements of operations by segment for the fiscal years ended April 29, 2012, May 1, 2011, and May 2, 2010.
27
CULP, INC.
FOR THE TWELVE MONTHS ENDED APRIL 29, 2012 AND MAY 1, 2011
(Amounts in thousands)
|
TWELVE MONTHS ENDED (UNAUDITED)
|
||||||||||||||||||||||||||
|
Amounts
|
Percent of Total Sales
|
|||||||||||||||||||||||||
|
April 29,
|
May 1,
|
% Over
|
April 29,
|
May 1,
|
||||||||||||||||||||||
|
Net Sales by Segment
|
2012
|
2011
|
(Under)
|
2012
|
2011
|
|||||||||||||||||||||
|
Mattress Fabrics
|
$ | 145,519 | 122,431 | 18.9 | % | 57.2 | % | 56.5 | % | |||||||||||||||||
|
Upholstery Fabrics
|
108,924 | 94,375 | 15.4 | % | 42.8 | % | 43.5 | % | ||||||||||||||||||
|
Net Sales
|
$ | 254,443 | 216,806 | 17.4 | % | 100.0 | % | 100.0 | % | |||||||||||||||||
|
Gross Profit by Segment
|
Gross Profit Margin
|
|||||||||||||||||||||||||
|
Mattress Fabrics
|
$ | 24,825 | 23,248 | 6.8 | % | 17.1 | % | 19.0 | % | |||||||||||||||||
|
Upholstery Fabrics
|
14,984 | 13,592 | 10.2 | % | 13.8 | % | 14.4 | % | ||||||||||||||||||
|
Subtotal
|
39,809 | 36,840 | 8.1 | % | 15.6 | % | 17.0 | % | ||||||||||||||||||
|
Other non-recurring charges
|
(77 | ) | (1) | - | 100.0 | % | (0.0 | ) % | 0.0 | % | ||||||||||||||||
|
Gross Profit
|
39,732 | 36,840 | 7.9 | % | 15.6 | % | 17.0 | % | ||||||||||||||||||
|
Selling, General and Administrative expenses by Segment
|
Percent of Sales
|
|||||||||||||||||||||||||
|
Mattress Fabrics
|
$ | 9,061 | 7,875 | 15.1 | % | 6.2 | % | 6.4 | % | |||||||||||||||||
|
Upholstery Fabrics
|
11,453 | 9,233 | 24.0 | % | 10.5 | % | 9.8 | % | ||||||||||||||||||
|
Unallocated Corporate expenses
|
4,512 | 3,961 | 13.9 | % | 1.8 | % | 1.8 | % | ||||||||||||||||||
|
Subtotal
|
25,026 | 21,069 | 18.8 | % | 9.8 | % | 9.7 | % | ||||||||||||||||||
|
Operating Income (loss) by Segment
|
Operating Income (Loss) Margin
|
|||||||||||||||||||||||||
|
Mattress Fabrics
|
$ | 15,764 | 15,373 | 2.5 | % | 10.8 | % | 12.6 | % | |||||||||||||||||
|
Upholstery Fabrics
|
3,531 | 4,359 | (19.0 | ) % | 3.2 | % | 4.6 | % | ||||||||||||||||||
|
Unallocated corporate expenses
|
(4,512 | ) | (3,961 | ) | 13.9 | % | (1.8 | ) % | (1.8 | ) % | ||||||||||||||||
|
Subtotal
|
14,783 | 15,771 | (6.3 | ) % | 5.8 | % | 7.3 | % | ||||||||||||||||||
|
Other non-recurring charges
|
(77 | ) | (1) | (28 | ) | (2) | 175.0 | % | (0.0 | ) % | (0.0 | ) % | ||||||||||||||
|
Operating income
|
$ | 14,706 | 15,743 | (6.6 | ) % | 5.8 | % | 7.3 | % | |||||||||||||||||
|
Depreciation by Segment
|
||||||||||||||||||||||||||
|
Mattress Fabrics
|
$ | 4,275 | 3,820 | 11.9 | % | |||||||||||||||||||||
|
Upholstery Fabrics
|
590 | 552 | 6.9 | % | ||||||||||||||||||||||
|
Subtotal
|
4,865 | 4,372 | 11.3 | % | ||||||||||||||||||||||
Notes:
|
(1)
|
The $77 represents employee termination benefits associated with our Anderson, SC plant facility.
|
|
(2)
|
This $28 represents an impairment charge of $28 related to equipment associated with the upholstery fabrics segment
that is classified as held for sale, a charge of $24 for lease termination and other exit costs, offset by a credit of $14
for employee termination benefits, and a credit of $10 for sales proceeds received on equipment with no carrying value.
|
28
CULP, INC.
STATEMENTS OF OPERATIONS BY SEGMENT
FOR THE TWELVE MONTHS ENDED MAY 1, 2011 AND MAY 2, 2010
(Amounts in thousands)
|
TWELVE MONTHS ENDED (UNAUDITED)
|
||||||||||||||||||||||||||
|
Amounts
|
Percent of Total Sales
|
|||||||||||||||||||||||||
|
May 1,
|
May 2,
|
% Over
|
May 1,
|
May 2,
|
||||||||||||||||||||||
|
Net Sales by Segment
|
2011
|
2010
|
(Under)
|
2011
|
2010
|
|||||||||||||||||||||
|
Mattress Fabrics
|
$ | 122,431 | 114,848 | 6.6 | % | 56.5 | % | 55.6 | % | |||||||||||||||||
|
Upholstery Fabrics
|
94,375 | 91,568 | 3.1 | % | 43.5 | % | 44.4 | % | ||||||||||||||||||
|
Net Sales
|
$ | 216,806 | 206,416 | 5.0 | % | 100.0 | % | 100.0 | % | |||||||||||||||||
|
Gross Profit by Segment
|
Gross Profit Margin
|
|||||||||||||||||||||||||
|
Mattress Fabrics
|
$ | 23,248 | 23,652 | (1.7 | ) % | 19.0 | % | 20.6 | % | |||||||||||||||||
|
Upholstery Fabrics
|
13,592 | 15,183 | (10.5 | ) % | 14.4 | % | 16.6 | % | ||||||||||||||||||
|
Subtotal
|
36,840 | 38,835 | (5.1 | ) % | 17.0 | % | 18.8 | % | ||||||||||||||||||
|
Restructuring related charges
|
- | (58 | ) | (2) | (100.0 | ) % | 0.0 | % | (0.0 | ) % | ||||||||||||||||
|
Gross Profit
|
$ | 36,840 | 38,777 | (5.0 | ) % | 17.0 | % | 18.8 | % | |||||||||||||||||
|
Selling, General and Administrative expenses by Segment
|
Percent of Sales
|
|||||||||||||||||||||||||
|
Mattress Fabrics
|
$ | 7,875 | 8,178 | (3.7 | ) % | 6.4 | % | 7.1 | % | |||||||||||||||||
|
Upholstery Fabrics
|
9,233 | 9,227 | 0.1 | % | 9.8 | % | 10.1 | % | ||||||||||||||||||
|
Unallocated Corporate expenses
|
3,961 | 5,400 | (26.6 | ) % | 1.8 | % | 2.6 | % | ||||||||||||||||||
|
Subtotal
|
$ | 21,069 | 22,805 | (7.6 | ) % | 9.7 | % | 11.0 | % | |||||||||||||||||
|
Operating Income (loss) by Segment
|
Operating Income (Loss) Margin
|
|||||||||||||||||||||||||
|
Mattress Fabrics
|
$ | 15,373 | 15,474 | (0.7 | ) % | 12.6 | % | 13.5 | % | |||||||||||||||||
|
Upholstery Fabrics
|
4,359 | 5,956 | (26.8 | ) % | 4.6 | % | 6.5 | % | ||||||||||||||||||
|
Unallocated corporate expenses
|
(3,961 | ) | (5,400 | ) | (26.6 | ) % | (1.8 | ) % | (2.6 | ) % | ||||||||||||||||
|
Subtotal
|
15,771 | 16,030 | (1.6 | ) % | 7.3 | % | 7.8 | % | ||||||||||||||||||
|
Restructuring and related (charges) credit
|
(28 | ) | (1) | 312 | (3) |
N.M.
|
(4) | (0.0 | ) % | 0.2 | % | |||||||||||||||
|
Operating income
|
$ | 15,743 | 16,342 | (3.7 | ) % | 7.3 | % | 7.9 | % | |||||||||||||||||
|
Depreciation by Segment
|
||||||||||||||||||||||||||
|
Mattress Fabrics
|
$ | 3,820 | 3,458 | 10.5 | % | |||||||||||||||||||||
|
Upholstery Fabrics
|
552 | 552 | 0.0 | % | ||||||||||||||||||||||
|
Subtotal
|
$ | 4,372 | 4,010 | 9.0 | % | |||||||||||||||||||||
Notes:
|
(1)
|
This $28 represents an impairment charge of $28 related to equipment associated with the upholstery fabrics segment
that is classified as held for sale, and a charge of $24 for lease termination and other exit costs, offset by a credit of $14
for employee termination benefits, and a credit of $10 for sales proceeds received on equipment with no carrying value.
|
|
(2)
|
The $58 represents a restructuring related charge of $108 for other operating costs associated with closed plant
facilities, offset by a credit of $50 for the sale of inventory previously reserved for.
|
|
(3)
|
The $312 restructuring credit of $186 for employee termination benefits, a credit of $170 for sales proceeds received on
equipment with no carrying value, a credit of $50 fo the sale of inventory previously reserved for, a credit of $14 for lease
termination and other exit costs, offset by a charge of $108 for other operating costs associated with closed plant facilities.
|
|
(4)
|
N.M. - Not meaningful.
|
29
2012 compared with 2011
Segment Analysis
Mattress Fabrics Segment
Net Sales
Net sales were $145.5 million for fiscal 2012, an increase of 19% compared with $122.4 million for fiscal 2011. The $145.5 million in net sales represents the highest annual net sales in our history. Also, net sales were $43.4 million in the fourth quarter of fiscal 2012, an increase of 23% compared with $35.2 million in the fourth quarter of fiscal 2011. This increase in net sales was primarily due to improved industry demand and our sales and marketing initiatives. We have been able to respond to this increased demand as we are benefitting from our recent investments in production facilities that have expanded our internal capacity. The bedding industry is evolving into a more decorative business with increased product diversity and growing consumer demand for better bedding and a higher quality mattress fabric. Our expanded manufacturing platform has allowed us to better serve our customers by providing them with a diverse product line in all major product categories. This product diversity, along with our design capabilities, has created additional sales opportunities with customers who are leading suppliers in the bedding industry. As a result, we experienced sales gains across all major product categories in fiscal 2012 compared to fiscal 2011. The increase in net sales also reflects price increases we implemented starting in the fourth quarter of fiscal 2011 to partially offset the increased raw material costs noted below.
Sales and Marketing Initiatives
In order to expand our product offerings and keep pace with the changing customer demand trends within the bedding industry, we entered into a joint product development, sales and marketing agreement with A. Lava & Son Co. (Lava) on May 21, 2012. This agreement forms a new business named Culp-Lava Applied Sewn Solutions and will provide us the opportunity to enter the business of designing, producing, and marketing sewn mattress covers. As we enter the business of sewn mattress covers, we will be able to leverage our design capabilities and expand our product offerings from mattress fabrics to finished covers. In connection with this agreement, Lava will provide us with technical assistance and know-how for the start-up of the business and will work with us on the design, sales and marketing of sewn mattress covers.
As part of the agreement, the new business will be fully funded and 100% owned by us. We plan to establish a manufacturing facility located in the Southeastern U.S. that will be selected by us. As a result, we will have two mirrored manufacturing facilities to better serve our customer base and meet current and expected demand trends in the bedding industry. We will have responsibility for all operating control of the new business, including capital expenditures and production and operating costs. We are projecting capital expenditures to start the business to be approximately $500,000 for fiscal 2013, as sewn products are a different business than our current normal operations and do not require large investments in plant and equipment. Lava is not required to invest capital into the Company.
We are expecting production to start in the second quarter of fiscal 2013 with approximately 35 employees. Our plan is to let the market dictate our growth strategy and we feel it is important to enter this business gradually to protect our investment as we learn what types of products and volume meet demand trends.
30
Gross Profit and Operating Income
Gross profit was $24.8 million in fiscal 2012, or 17% of net sales, compared with $23.2 million, or 19% of net sales, in fiscal 2011. SG&A expenses for fiscal 2012 were $9.1 million compared with $7.9 million for fiscal 2011. Operating income was $15.8 million in fiscal 2012, an increase of 2.5% compared with $15.4 million in fiscal 2011. Operating margins were 10.8% and 12.6% of net sales for fiscal 2012 and 2011, respectively.
Our gross profit and operating margins for fiscal 2012 were affected by higher raw material costs and customer pricing pressure that started in fiscal 2011 and continued through most of fiscal 2012. As a result, we implemented customer price increases starting in the fourth quarter of fiscal 2011. In addition, operating margins were affected by increased SG&A expenses due to increased incentive compensation expense, which reflects stronger financial results in relation to pre-established performance targets. While the increased raw material costs affected our gross profit and operating margins for the full fiscal year for 2012, raw material prices stabilized in the fourth quarter of fiscal 2012.
Segment Assets
Segment assets consist of accounts receivable, inventory, assets held for sale, non-compete agreements associated with certain acquisitions, goodwill, and property, plant and equipment. As of April 29, 2012, accounts receivable and inventory totaled $29.9 million, compared to $25.5 million at May 1, 2011. This change reflects the net sales increase in the fourth quarter of fiscal 2012 noted above.
At April 29, 2012, and May 1, 2011, property, plant and equipment totaled $29.2 million and $28.6 million, respectively. The $29.2 million represents property, plant, and equipment located in the U.S. of $21.2 million and located in Canada of $8.0 million. The $28.6 million represents property, plant, and equipment located in the U.S. of $20.0 million and located in Canada of $8.6 million. The increase in this segment’s property, plant, and equipment balance at April 29, 2012 compared with May 1, 2011, is primarily due to fiscal 2012 capital spending of $4.9 million offset by depreciation expense of $4.3 million.
At April 29, 2012, and May 1, 2011, the carrying value of the segment’s goodwill was $11.5 million. At April 29, 2012, and May 1, 2011, the carrying values of our non-compete agreements were $333,000 and $480,000, respectively. The decrease in the carrying values of the non-compete agreements during fiscal 2012 primarily represents amortization expense. At April 29, 2012 and May 1, 2011, assets held for sale totaled $15,000.
Upholstery Fabrics Segment
Net Sales
Upholstery fabric net sales (which include both fabric and cut and sewn kits) were $108.9 million in fiscal 2012, compared with $94.4 million in fiscal 2011, an increase of 15%. Also, upholstery fabric net sales were $32.3 million in the fourth quarter of fiscal 2012, an increase of 28% compared with $25.2 million in the fourth quarter of fiscal 2011. The $32.3 million reported in the fourth quarter of fiscal 2012 was the highest quarterly net sales total in five fiscal years. This increase in net sales reflects improved industry demand and customer response to our designs and new product introductions. In addition, this increase in net sales is also reflects price increases we implemented starting in the fourth quarter of fiscal 2011 which continued in fiscal 2012 to partially offset increased raw material costs.
31
Net sales of upholstery fabric produced outside our U.S. manufacturing operations were 88% of total upholstery fabric net sales in fiscal 2012, of which 85% and 3% were generated from our operations located in China and Poland, respectively. Net sales of upholstery fabric produced outside our U.S. manufacturing operations were 86% of total upholstery fabric net sales in fiscal 2011, of which primarily all of these net sales were generated from our operations located in China. Net sales of upholstery fabrics produced outside our U.S. manufacturing operations were $95.5 million in fiscal 2012, of which $92.5 million and $3.0 million were generated from our operations located in China and Poland, respectively. Net sales of upholstery fabrics produced outside our U.S. manufacturing operations were $81.2 million in fiscal 2011, of which primarily all of these net sales were generated from our operations located in China.
Net sales of U.S.-produced upholstery fabrics were $13.4 million or 12% of total upholstery fabric net sales in fiscal 2012 compared with $13.2 million or 14% of total upholstery fabric net sales in fiscal 2011.
Our increase in net sales was primarily driven by growth of our China produced fabrics, as this platform has played a significant role in our global development in fiscal 2012, with increased net sales to key customers located in the U.S., the local China market, and other international customers.
In the third quarter of fiscal 2011, we established a wholly-owned subsidiary called Culp Europe in Poland, and we continued to make progress in the development of this operation in fiscal 2012. We have been encouraged by the initial response from several of the largest furniture manufacturers and retailers in Europe. During fiscal 2012, Culp Europe accounted for 3% of our total upholstery fabric net sales, and we expect this percentage to increase further over the next fiscal year. While we experienced a small operating loss for this operation during fiscal 2012 due to start-up costs, we expect this subsidiary to be more profitable in fiscal 2013.
Also, we are pleased with the sales and profit improvement during the fourth quarter of fiscal 2012 from our U.S. operation, with increased demand for both velvet and woven texture fabrics. We have struggled for several years with declining sales and low profitability with this operation. However, we felt it was strategically important to keep one U.S. upholstery fabric operation. Our actions in the second quarter of fiscal 2012 to align our U.S. capacity with expected demand and increase prices had a favorable impact on profitability. We reported net sales of $4.1 million in the fourth quarter of fiscal 2012 from our U.S. operation, an increase of 44% from $2.9 million in the second quarter of fiscal 2012. We are also encouraged by new placements with our U.S. produced fabrics and are expecting future sales growth and profitability in the first quarter of fiscal 2013. We are cautiously optimistic about our long-term prospects with this operation.
Gross Profit and Operating Income
Gross profit was $15.0 million in fiscal 2012, or 13.8% of net sales, compared with $13.6 million, or 14.4% of net sales, in fiscal 2011. SG&A expenses were $11.5 million, or 10.5% of net sales in fiscal 2012 compared with $9.2 million, or 9.8% in fiscal 2011. Operating income was $3.5 million in fiscal 2012, a decrease of 19% compared with $4.4 million in fiscal 2011. Operating margins were 3.2% and 4.6% of net sales for fiscal 2012 and 2011, respectively.
Our gross profit and operating margins were affected by higher raw material costs. As a result, we implemented customer price increases starting in the fourth quarter of fiscal 2011 which continued in fiscal 2012. In addition, our gross profit and operating margins were affected by lower profitability in our U.S. velvet product line in the first half of fiscal 2012. In response, we aligned our U.S. capacity with expected demand and increased prices. As a result of these actions, our U.S. upholstery operation returned to profitability during the third quarter and continued to be profitable through the fourth quarter of fiscal 2012.
In addition, operating margins were affected by increased SG&A expenses due to start-up expenses associated with our Culp Europe operation and an increase in incentive compensation accruals reflecting stronger financial results in relation to pre-established performance targets.
32
While our gross profit and operating margins for the full fiscal year for fiscal 2012 declined, our gross profit margins increased to 16% in the fourth quarter of fiscal 2012 from 13% for the third quarter of fiscal 2012. In addition, operating margins increased to 5.5% in the fourth quarter of fiscal 2012 from 2.9% in the third quarter of fiscal 2012. These increases in gross profit and operating margins in the fourth quarter of fiscal 2012 are primarily due to the increase in net sales and actions taken with our U.S. upholstery fabric operation noted above, as well as the stabilization of raw material price increases in the fourth quarter of fiscal 2012.
Segment Assets
Segment assets consist of accounts receivable, inventory, property, plant and equipment, and assets held for sale.
As of April 29, 2012, and May 1, 2011, accounts receivable and inventory totaled $31.5 million and $23.5 million, respectively. There were no assets classified as held for sale at April 29, 2012. At May 1, 2011, assets held for sale totaled $60,000.
At April 29, 2012, property, plant, and equipment totaled $1.1 million compared with $967,000 at May 1, 2011. The $1.1 million at April 29, 2012, represents property, plant, and equipment located in the U.S. of $837,000, located in China of $183,000, and located in Poland of $104,000. The $967,000 at May 1, 2011, represents property, plant, and equipment located in the U.S. of $727,000, located in China of $184,000, and located in Poland of $56,000.
Other Income Statement Categories
Selling, General and Administrative Expenses – SG&A expenses for the company as a whole were $25.0 million for fiscal 2012 compared with $21.1 million for fiscal 2011, an increase of 19%. This increase primarily pertains to start-up expenses associated with our Culp Europe operations that did not significantly occur until fiscal 2012 and increased incentive compensation expense, which reflects stronger financial results in relation to pre-established performance targets. SG&A as a percent of net sales was 9.8% and 9.7% in fiscal 2012 and 2011, respectively.
Interest Expense (Income) --
Interest expense was $780,000 for fiscal 2012 compared with $881,000 for fiscal 2011. This trend reflects lower outstanding balances on our long-term debt.
Interest income was $508,000 in fiscal 2012 compared with $240,000 for fiscal 2011. Our increase in interest income is primarily due to a higher rate of return on increased short-term investment balances throughout fiscal 2012 compared to fiscal 2011
Other Expense
–
Other expense was $236,000 for fiscal 2012 compared with $40,000 for fiscal 2011.
This increase reflects fluctuations in the foreign exchange rate for our subsidiaries domiciled in Canada, China, and Poland. We have been able to reduce these expenses through maintenance of a natural hedge by keeping a balance of our assets and liabilities denominated in Canadian dollars during fiscal 2012. Although we will continue to try to maintain this natural hedge, there is no assurance that we will be able to continue to do so in future reporting periods.
33
Income Taxes
Significant judgment is required in determining the provision for income taxes. During the ordinary course of business, there are many transactions and calculations for which the ultimate tax determination is uncertain. We account for income taxes using the asset and liability approach as prescribed by ASC Topic 740, “Income Taxes.” This approach requires recognition of deferred tax assets and liabilities for the expected future tax consequences of events that have been included in the consolidated financial statements or income tax returns. Using the enacted tax rates in effect for the fiscal year in which differences are expected to reverse, deferred tax assets and liabilities are determined based on the differences between financial reporting and tax basis of an asset or liability. If a change in the effective tax rate to be applied to a timing difference is determined to be appropriate, it will affect the provision for income taxes during the period that the determination is made.
Effective Income Tax Rate
We recorded income tax expense of $902,000, or 6.4% of income before income tax expense, in fiscal 2012 compared with an income tax benefit of $1.1 million or 7.3% of income before income tax expense, in fiscal 2011. The income tax expense for fiscal 2012 is different from the amount obtained by applying our statutory rate of 34% to income before income taxes for the following reasons:
|
|
●
|
The income tax rate was reduced by 26% or an income tax benefit of $3.7 million was recorded for the reduction in the valuation allowance recorded against our net deferred tax assets associated with our U.S. operations. This income tax benefit of $3.7 million represents a $4.2 million income tax benefit pertaining to a change in judgment about the future realization of our U.S. net deferred tax assets, offset by an income tax charge of $477,000 associated with the realization of our U.S. loss carryforwards from fiscal 2012 pre-tax income.
|
|
|
●
|
The income tax rate was reduced by 9% for taxable income subject to lower statutory income rates in foreign jurisdictions compared with the statutory income tax rate of 34% for the United States.
|
|
|
●
|
The income tax rate increased 6% for an increase in unrecognized tax benefits.
|
|
|
●
|
The income tax rate increased 1.4% for non-deductible stock-based compensation expense and other miscellaneous items.
|
The income tax benefit for fiscal 2011 is different from the amount obtained by applying our statutory rate of 34% to income before income taxes for the following reasons:
|
|
●
|
The income tax rate was reduced by 42% or an income tax benefit of $6.4 million was recorded for the reduction in the valuation allowance recorded against our net deferred tax assets associated with our U.S. and China operations. This income tax benefit of $6.4 million represents a $2.8 million realization of U.S. loss carryforwards associated with fiscal 2011 pre-tax income from our U.S. operations, a $2.3 million adjustment pertaining to a change in judgment about the future realization of our U.S. net deferred tax assets, and a $1.3 million adjustment pertaining to a change in judgment about the future realization of our China net deferred tax assets.
|
|
|
●
|
The income tax rate was reduced by 7% for taxable income subject to lower statutory income rates in foreign jurisdictions compared with the statutory income tax rate of 34% for the United States.
|
|
|
●
|
The income tax rate was reduced by 2% for adjustments made to our Canadian deferred tax liabilities associated with our election to file our Canadian income tax returns in U.S. dollars commencing with our fiscal 2011 tax year. Our Canadian income tax returns were filed in Canadian dollars for fiscal years prior to fiscal 2011. This adjustment totaled $315,000 and represented a discrete event in which the full tax effects were recorded in the first quarter and the full year of fiscal 2011.
|
34
|
●
|
The income tax rate increased 9% for an increase in unrecognized tax benefits.
|
|
●
|
The income tax rate increased 0.7% for non-deductible stock-based compensation expense and other miscellaneous items.
|
Deferred Income Taxes – Valuation Allowance
Summary
In accordance with ASC Topic 740, we evaluate our deferred income taxes to determine if a valuation allowance is required. ASC Topic 740 requires that companies assess whether a valuation allowance should be established based on the consideration of all available evidence using a “more likely than not” standard with significant weight being given to evidence that can be objectively verified. Since the company operates in multiple jurisdictions, we assess the need for a valuation allowance on a jurisdiction-by-jurisdiction basis, taking into account the effects of local tax law. Based on this assessment, we recorded a partial valuation allowance of $12.8 million and $16.4 million against our net deferred tax assets associated with our U.S. operations at April 29, 2012 and May 1, 2011, respectively. At April 29, 2012 and May 1, 2011, no valuation allowance was recorded against our net deferred tax assets associated with our operations located in China and Poland.
United States
Our net deferred tax asset regarding our U.S. operations primarily pertain to incurring significant U.S. pre-tax losses during previous years, with U.S. loss carryforwards totaling $59.9 million and $60.0 million at April 29, 2012 and May 1, 2011, respectively.
Fiscal 2011
Due to the favorable results of our multi-year restructuring process in our upholstery fabric operations and key acquisitions and capital investments made for our mattress fabric segment, on a cumulative three-year basis ending May 1, 2011, our U.S. operations earned a pre-tax income of $4.2 million. In addition, our U.S. operations reported a pre-tax income over fiscal years 2011 and 2010 totaling $8.2 million. We believe that fiscal years 2011 and 2010 are a more indicative measure of future pre-tax income as these fiscal years reflect operating performance after the cost savings of the profit-improvement and restructuring plans were realized and the full operational effects of the acquisitions associated with the company’s mattress fabric operations located in the U.S.
Although the financial results of our U.S. operations improved, the significant uncertainty in the overall economic climate made it very difficult to forecast medium and long-term financial results associated with our U.S. operations. Based on these economic conditions, we believed it was too uncertain to project pre-tax income associated with our U.S. operations after fiscal 2012.
Based on this significant positive and negative evidence, we recorded a partial valuation allowance of $16.4 million against our net deferred tax assets associated with our U.S. operations that was expected to reverse beyond fiscal 2012 and we recognized an income tax benefit of $2.3 million in the fourth quarter of fiscal 2011 for the reduction in this valuation allowance for projected U.S. taxable income in fiscal 2012 that was expected to reduce our U.S. loss carryforwards.
Fiscal 2012
This improvement in the U.S. operations' financial results continued through fiscal 2012. Our U.S. operations earned a cumulative pretax income through the second quarter of fiscal 2012 and fiscal years 2011 and 2010 totaling $10.0 million. This continued earnings improvement from our U.S. operations was driven by our mattress fabrics operations (which primarily resides in the U.S.). During the second quarter of fiscal 2012, our mattress fabrics operations had net sales totaling $35.2 million compared with $28.3 million in the second quarter of fiscal 2011. In addition, our mattress fabrics operations had operating income totaling $3.8 million in the second quarter of fiscal 2012 compared with $3.3 million in the second quarter of fiscal 2011. These improved results in the second quarter of fiscal 2012, which were better than expected, can be attributed to increased sales from our sales and marketing initiatives and new programs with customers who are leading suppliers in the bedding industry. Collectively these developments increased our confidence in forecasting U.S. taxable income through fiscal 2014 in the second quarter of fiscal 2012.
35
Although our U.S. operations' financial results continued to improve through the second quarter of fiscal 2012, the significant uncertainty in the overall economic climate also continued. As a result, to forecast medium and long-term financial results associated with our U.S. operations remained difficult. Since it will take a significant period of time for our U.S. operations to realize its U.S. net deferred income tax assets based on earned and forecasted U.S. pre-tax income levels, we believe it was too uncertain to project U.S. pre-tax income levels associated with our U.S. operations after fiscal 2014 that support a "more likely than not" assertion at the end of our second quarter of fiscal 2012.
These trends continued through the fourth quarter of fiscal 2012 and, as a result, we maintain our position that we can forecast U.S. taxable income through fiscal 2014. Our mattress fabric operations had net sales totaling $145.5 million in fiscal 2012 compared with $122.4 million in fiscal 2011. In addition our mattress fabric operations reported operating income of $15.8 million in fiscal 2012 compared with $15.4 million in fiscal 2011.
Based on this positive and negative evidence noted above, we recorded a partial valuation allowance of $12.8 million at April 29, 2012, against the net deferred tax assets associated with our U.S. operations that are expected to reverse beyond fiscal 2014. Accordingly, we recognized an income tax benefit of $4.4 million in the second quarter of fiscal 2012 for the reduction in this valuation allowance for estimated U.S. taxable income in fiscal years 2013 and 2014 that is expected reduce our U.S. loss carryfowards. In the fourth quarter of fiscal 2012, we booked an income tax charge of $211,000 due to a change in our estimate of U.S. taxable income in fiscal years 2013 and 2014 that was made in the second quarter of fiscal 2012.
China
Our net deferred tax asset regarding our China operations primarily pertains to the book versus tax basis difference associated with our China operation’s fixed assets. This book versus tax basis difference resulted from our impairment losses and fixed asset write-downs associated with our September 2008 upholstery fabrics restructuring plan. In order for this net deferred tax asset to have been realized, our China operations must have had sufficient pre-tax income levels to utilize its tax over book depreciation expense. During fiscal 2011, management assessed both positive and negative evidence and concluded that there was sufficient positive evidence that our net deferred tax assets regarding our China operations will more likely than not be realized. Due to the favorable results from our restructuring activities and profit improvement plan initiated in the second quarter of fiscal 2009, our China operations became profitable, reporting pre-tax income of $7.9 million in fiscal 2011 and fiscal 2010. In addition, our China operations earned pre-tax income of $10.2 million over a cumulative three-year period ending May 1, 2011. As a result of the improvement of our China operations’ pre-tax income levels that have been demonstrated over a cumulative period of three years, there was sufficient positive evidence that our China operations can provide sufficient pre-tax income levels to utilize its tax over book depreciation expense. Based on this significant positive evidence, we do not have a valuation allowance against our China net deferred tax assets at April 29, 2012 and May 1, 2011, respectively. During fiscal 2011 we recognized an income tax benefit of $1.3 million to reduce the valuation allowance of $1.3 million recorded at May 2, 2010 (the beginning of fiscal 2011).
36
Income Taxes Paid
Although we reported income tax expense of $902,000 in fiscal 2012 and an income tax benefit of $1.1 million in fiscal 2011, we pay income taxes associated with our subsidiaries in China and Canada. We had income tax payments of $2.4 million and $1.2 million in fiscal 2012 and 2011, respectively.
2011 compared with 2010
Segment Analysis
Mattress Fabrics Segment
Net Sales
Net sales were $122.4 million for fiscal 2011, an increase of 6.6% compared with $114.8 million for fiscal 2010. Also, we reported net sales of $35.2 million in the fourth quarter of fiscal 2011, an increase of 5.3% compared with $33.4 million in the fourth quarter of fiscal 2010. These results reflected favorable growth trends during fiscal 2011 as a result of a stronger competitive position and small price increases we implemented in the fourth quarter of fiscal 2011 to partially offset increased raw material costs and customer pricing pressure.
Gross Profit and Operating Income
Gross profit was $23.2 million in fiscal 2011, or 19% of net sales, compared with $23.7 million, or 20.6% of net sales, in fiscal 2010. SG&A expenses for fiscal 2011were $7.9 million compared with $8.2 million for fiscal 2010. Operating income was $15.3 million in fiscal 2011, a decrease of 0.7% compared with $15.5 million in fiscal 2010. Operating margins were 12.6% and 13.5% of net sales for fiscal 2011 and 2010, respectively.
Although net sales increased 6.6% in fiscal 2011 compared with fiscal 2010, gross profit and operating income decreased by 1.7% and 0.7%, respectively. This trend in profitability was primarily due to increased competitive pricing pressure and higher raw material costs that started in the second quarter of fiscal 2011.
Segment Assets
Segment assets consist of accounts receivable, inventory, assets held for sale, non-compete agreements associated with certain acquisitions, goodwill, and property, plant and equipment. As of May 1, 2011, accounts receivable and inventory totaled $25.5 million, compared to $22.3 million at May 2, 2010. This was a product of the net sales increase in the fourth quarter of fiscal 2011 noted above.
At May 1, 2011, and May 2, 2010, property, plant and equipment totaled $28.6 million and $26.7 million, respectively. The $28.6 million represents property, plant, and equipment located in the U.S. of $20.0 million and located in Canada of $8.6 million. The $26.7 million represented property, plant, and equipment located in the U.S. of $18.8 million and located in Canada of $7.9 million. The increase in this segment’s property, plant, and equipment balance at May 1, 2011 compared with May 2, 2010, was primarily due to fiscal 2011 capital spending of $5.7 million offset by depreciation expense of $3.8 million.
37
At May 1, 2011, and May 2, 2010, the carrying value of the segment’s goodwill was $11.5 million. At May 1, 2011, and May 2, 2010, the carrying value of our non-compete agreements were $480,000 and $843,000, respectively. The decrease in the carrying values of the non-compete agreements during fiscal 2011 primarily represented amortization expense. At May 1, 2011, and May 2, 2010, assets held for sale totaled $15,000 and $34,000, respectively.
Upholstery Fabrics Segment
Net Sales
Upholstery fabric net sales (which include both fabric and cut and sewn kits) were $94.4 million in fiscal 2011, compared with $91.6 million in fiscal 2010, an increase of 3.1%. Also, we reported net sales of $25.2 million in the fourth quarter of fiscal 2011, an increase of 5.7% compared with $23.8 million in the fourth quarter of fiscal 2010. This increase in net sales reflected favorable growth trends during fiscal 2011 as a result of a stronger competitive position and price increases we implemented in the fourth quarter of fiscal 2011 that were used to partially offset increased raw material costs, and a significant increase in the provision for returns, allowances, and discounts in fiscal 2010 that did not recur in fiscal 2011.
Our upholstery fabric net sales continued to be driven by our operations located in China, accounting for 86% and 84% of total upholstery fabric net sales in fiscal 2011 and 2010, respectively. Net sales of upholstery fabrics produced outside our U.S. manufacturing operations were $81.2 million in fiscal 2011, an increase of 5% from $77.3 million in fiscal 2010. Net sales of U.S.-produced upholstery fabrics were $13.2 million in fiscal 2011, a decrease of 8% from $14.3 million in fiscal 2010. These trends reflected our continued shift toward production outside our U.S. manufacturing operations and are the result of our long-term strategy to build a wholly-owned and low-cost business located in China that is scalable, and not capital intensive.
Gross Profit and Operating Income
Gross profit was $13.6 million in fiscal 2011, or 14.4% of net sales, compared with $15.2 million, or 16.6% of net sales, in fiscal 2010. SG&A expenses were $9.2 million for both fiscal 2011 and 2010. Operating income was $4.4 million in fiscal 2011, a decrease of 27% compared with $6.0 million in fiscal 2010. Operating margins were 4.6% and 6.5% of net sales for fiscal 2011 and 2010, respectively.
Although net sales increased 3.1% in fiscal 2011 compared with fiscal 2010, gross profit and operating income decreased by 11% and 27%, respectively. This trend in profitability was primarily due to higher raw material costs which started to increase in the second quarter of fiscal 2011 and weaker operating performance of our one remaining U.S. facility as compared to the prior year. Our one remaining U.S. facility experienced weaker performance in fiscal 2011 due to the higher raw material costs as mentioned above and a decrease in net sales of 8%.
Segment Assets
Segment assets consist of accounts receivable, inventory, property, plant and equipment, and assets held for sale.
As of May 1, 2011, and May 2, 2010, accounts receivable and inventory totaled $23.5 million. At May 1, 2011, assets held for sale totaled $60,000 compared with $89,000 at May 2, 2010.
38
At May 1, 2011, property, plant, and equipment totaled $967,000 compared with $989,000 at May 2, 2010. The $967,000 at May 1, 2011, represented property, plant, and equipment located in the U.S. of $727,000, located in China of $184,000, and located in Poland of $56,000. The $989,000 at May 2, 2010, represented property, plant, and equipment of $887,000 and $102,000 located in the U.S. and China, respectively.
Other Income Statement Categories
Selling, General and Administrative Expenses – SG&A expenses for the company as a whole were $21.1 million for fiscal 2011 compared with $22.8 million for fiscal 2010, a decrease of 8%. This decrease primarily reflected (i) a decrease in stock-based compensation expense reflecting a decrease in stock-based awards and the company’s stock price, (ii) a decrease in incentive bonus accruals reflecting weaker financial results in relation to pre-established performance targets, and (iii) a decrease in bad debt expense reflecting management’s assessment of estimated credit exposures within its accounts receivable portfolio.
Interest Expense (Income) --
Interest expense was $881,000 for fiscal 2011 compared with $1.3 million for fiscal 2010. This trend reflected lower outstanding balances on our long-term debt.
Interest income was $240,000 in fiscal 2011 compared with $116,000 for fiscal 2010. Our increase in interest income was primarily due to higher cash and cash equivalent and short-term investment balances during fiscal 2011 compared with fiscal 2010, and a higher rate of return in fiscal 2011 on short-term investment purchases that did not commence until the third quarter of fiscal 2010.
Other Expense – Other expense was $40,000 for fisc
al 2011 compared with $828,000 for fiscal 2010.
This decrease reflected fluctuations in the foreign exchange rate for our subsidiaries domiciled in Canada and China and our ability to maintain a natural hedge by keeping a balance of our assets and liabilities denominated in Canadian dollars during fiscal 2011.
Income Taxes
We recorded an income tax benefit of $1.1 million, or 7.3% of income before income tax expense, in fiscal 2011 compared with income tax expense of $1.1 million, or 7.9% of income before income tax expense, in fiscal 2010. The income tax benefit for fiscal 2011 is different from the amount obtained by applying our statutory rate of 34% to income before income taxes for the following reasons:
|
●
|
The income tax rate was reduced by 42% or an income tax benefit of $6.4 million was recorded for the reduction in the valuation allowance recorded against our net deferred tax assets associated with our U.S. and China operations. This income tax benefit of $6.4 million represents a $2.8 million realization of U.S. loss carryforwards associated with fiscal 2011 pre-tax income from our U.S. operations, a $2.3 million adjustment pertaining to a change in judgment about the future realization of our U.S. net deferred tax assets, and a $1.3 million adjustment pertaining to a change in judgment about the future realization of our China net deferred tax assets.
|
|
●
|
The income tax rate was reduced by 7% for taxable income subject to lower statutory income rates in foreign jurisdictions compared with the statutory income tax rate of 34% for the United States.
|
39
|
●
|
The income tax rate was reduced by 2% for adjustments made to our Canadian deferred tax liabilities associated with our election to file our Canadian income tax returns in U.S. dollars commencing with our fiscal 2011 tax year. Our Canadian income tax returns were filed in Canadian dollars for fiscal years prior to fiscal 2011. This adjustment totaled $315,000 and represented a discrete event in which the full tax effects were recorded in the first quarter and the full year of fiscal 2011.
|
|
●
|
The income tax rate increased 9% for an increase in unrecognized tax benefits.
|
|
●
|
The income tax rate increased 0.7% for non-deductible stock-based compensation expense and other miscellaneous items.
|
Income tax expense for fiscal 2010 is different from the amount obtained by applying our statutory rate of 34% to income before income taxes for the following reasons:
|
●
|
The income tax rate was reduced by 33% for the reduction in the valuation allowance recorded against substantially all of our net deferred tax assets associated with our U.S. and China operations. This reduction in our valuation allowance was primarily due to U.S. taxable income generated by the repatriation of undistributed earnings from our subsidiaries located in China and the resulting usage of U.S. net operating loss carryforwards. Also, this reduction pertains to the realization on and projected realization of deferred tax assets created from tax versus book depreciation associated with the company’s China operations.
|
|
●
|
The income tax rate was reduced by 12% for the tax effects of foreign exchange losses on U.S. denominated account balances in which income taxes are paid in Canadian dollars. In fiscal 2010 the Canadian foreign exchange rate in relation to the U.S. dollar was very volatile due to changes in oil prices and global economic conditions. In order to mitigate our exposure to the Canadian foreign exchange rate in relation to the U.S. dollar and its impact on our income tax provision, we elected to file our Canadian tax returns in U.S. dollars commencing with our fiscal 2011 tax year.
|
|
●
|
The income tax rate was reduced by 6% for taxable income subject to lower statutory income rates in foreign jurisdictions compared with the statutory income tax rate of 34% for the United States.
|
|
●
|
The income tax rate increased 12% for the recording of a deferred tax liability for estimated U.S. income taxes that were paid upon repatriation of undistributed earnings from the company’s subsidiaries located in China.
|
|
●
|
The income tax rate increased 10% for an increase in unrecognized tax benefits.
|
|
●
|
The income tax rate increased 2.9% for non-deductible stock-based compensation expense and other miscellaneous items.
|
Handling Costs
The company records warehousing costs in selling, general and administrative expenses. These costs were $2.6 million, $2.4 million, and $2.2 million in fiscal 2012, 2011, and 2010, respectively. Warehousing costs include the operating expenses of our various finished goods distribution centers, such as personnel costs, utilities, building rent and material handling equipment, and lease expense. Had these costs been included in cost of sales, gross profit would have been $37.1 million or 14.6%, in fiscal 2012, $34.4 million, or 15.9%, in fiscal 2011, and $36.6 million, or 17.7%, in fiscal 2010.
40
Liquidity and Capital Resources
Liquidity
Our sources of liquidity include cash and cash equivalents, short-term investments, cash flow from operations, and amounts available under our unsecured revolving credit lines. These sources have been adequate for day-to-day operations and capital expenditures. We believe our present cash and cash equivalents and short-term investment balance of $31.0 million at April 29, 2012, cash flow from operations, and current availability under our unsecured revolving credit lines will be sufficient to fund our business needs and fiscal 2013 contractual obligations (see commitments table below).
We have maintained a strong financial position during fiscal 2012. Our cash and cash equivalents and short-term investments totaled $31.0 million at April 29, 2012, compared with $30.9 million at May 1, 2011. We were able to maintain a comparable cash and cash equivalents and short-term investment balance at the end of fiscal 2012 compared with the end of fiscal 2011, despite common stock repurchases of $5.4 million, capital expenditures of $5.9 million, long-term debt payments of $2.4 million, and working capital spending of $6.9 million to meet increasing business needs.
Our cash and cash equivalents and short-term investment balance of $31.0 million exceeded our total debt (current maturities of long-term debt, long-term debt, and line of credit) of $10.0 million at the end of fiscal 2012 and represents 35% of shareholders’ equity. Our next major scheduled long-term debt principal payment of $2.2 million is due August 2012. As of April 29, 2012, our lines of credit approximating $16.0 million had an outstanding balance of $889,000. All of our long-term debt and line of credit agreements are unsecured.
We are currently planning for capital expenditures of $5.5 million in fiscal 2013, which primarily pertain to our mattress fabrics segment.
During fiscal 2012, our board of directors authorized the expenditure of up to $7.0 million for the repurchase of shares of our common stock. Under the common stock repurchase program, shares may be purchased from time to time in open market transactions, block trades, and through plans established under the Securities Exchange Act Rule 10b5-1. The amount of shares purchased and the timing of such purchases is based on working capital requirements, market and general business conditions and other factors including alternative investment opportunities. Since the initial authorization of this program on June 16, 2011, we repurchased approximately 624,000 shares of our common stock at a cost of $5.4 million through April 29, 2012.
On June 13, 2012, we announced that our board of directors approved a new authorization to repurchase up to $5.0 million of our common stock. This action replaces the authorization to acquire up to $7.0 million of our common stock noted above.
On June 13, 2012, we announced that our board of directors approved the payment of a quarterly cash dividend of $0.03 per share to be paid on or about July 16, 2012, to shareholders of record as of the close of business on July 2, 2012. Our last dividend payment was over eleven years ago. We anticipate paying a cash dividend each quarter, with expected payment dates in October, January, April, and July. Future dividend payments are subject to board approval and may be adjusted at the board’s discretion as business needs or market conditions change.
Our cash and cash equivalents and short-term investment balance may be adversely affected by factors beyond our control, such as weakening industry demand and delays in receipt of payment on accounts receivable.
41
Working Capital
Accounts receivable at April 29, 2012, were $25.1 million, an increase of 24% compared with $20.2 million, at May 1, 2011. This increase primarily reflects increased business volume in both our business segments for fiscal 2012 compared with fiscal 2011. Days’ sales in receivables were 29 days and 30 days during the fourth quarters of fiscal 2012 and 2011, respectively.
Inventories at April 29, 2012 were $36.4 million, an increase of 27%, compared with $28.7 million at May 1, 2011. This increase primarily reflects increased business volume in both our business segments for fiscal 2012 compared with fiscal 2011. Inventory turns were 6.6 for fiscal 2012 and 2011, respectively.
Accounts payable-trade as of April 29, 2012, were $30.7 million, an increase of 23%, compared with $24.9 million at May 1, 2011. This increase primarily reflects increased business volume and inventory purchases in both our business segments for fiscal 2012 compared with fiscal 2011.
Operating working capital (comprised of accounts receivable and inventories, less accounts payable –trade and capital expenditures) was $30.6 million at April 29, 2012, compared with $23.9 million at May 1, 2011. Operating working capital turnover was 8.9 in fiscal 2012 compared to 8.8 in fiscal 2011.
Financing Arrangements
Unsecured Term Notes
In connection with the Bodet & Horst acquisition during fiscal 2009, we entered into a note agreement dated August 11, 2008. This agreement provided for the issuance of $11.0 million of unsecured term notes with a fixed interest rate of 8.01% and a term of seven years. Principal payments of $2.2 million per year are due on the notes beginning August 11, 2011. The principal payments are payable over an average term of 3.3 years through August 11, 2015. Any principal prepayments will be assessed a penalty as defined in the agreement. The agreement contains customary financial and other covenants as defined in the agreement.
We made our first principal payment of $2.2 million associated with this note agreement on August 11, 2011.
Government of Quebec Loan
We have an agreement with the Government of Quebec for a term loan that is non-interest bearing and is payable in 48 equal monthly installments (denominated in Canadian dollars) that commenced on December 1, 2009. The proceeds were used to partially finance capital expenditures at our Rayonese facility located in Quebec, Canada.
Revolving Credit Agreement –United States
At May 1, 2011, we had an unsecured Amended and Restated Credit Agreement that provided for a revolving loan commitment of $6.5 million, including letters of credit up to $3.0 million. This agreement was set to expire August 15, 2012. On August 25, 2011, we entered into a seventeenth amendment to the Amended and Restated Credit Agreement, amending the agreement effective May 1, 2011 (end of our fiscal 2011). This amendment extends the expiration date of the line of credit through August 25, 2013, increasing the revolving loan commitment from $6.5 million to $10.0 million, and decreases the capital expenditure limit for fiscal years 2012 and 2013 from $10.0 million to $6.0 million. On January 17, 2012, and in connection with the Culp Europe Credit Agreement discussed below, we entered into an eighteenth amendment to decrease our revolving loan commitment from $10.0 million to $7.6 million.
42
The amended agreement provides for a pricing matrix to determine the interest rate payable on loans made under the agreement (applicable interest rate of 2.24% at April 29, 2012). As of April 29, 2012, there were no outstanding letters of credit under this agreement. As of April 29, 2012 and May 1, 2011, there were no borrowings outstanding under the agreement.
Revolving Credit Agreement - China
We have an unsecured credit agreement for our Chinese operations that provides for a line of credit up to 40 million RMB (approximately $6.4 million USD at April 29, 2012). This agreement expires on September 2, 2012 and has an interest rate determined by the Chinese government. There were no borrowings under this agreement as of April 29, 2012 and May 1, 2011.
Revolving Credit Agreement - Europe
On January 17, 2012, we entered into an unsecured credit agreement associated with our operations in Poland that provides for a line of credit up to 6.8 million Polish Zloty (approximately $2.2 million in USD at April 29, 2012). This agreement expires on January 15, 2013 and bears interest at WIBOR (Warsaw Interbank Offered Rate) plus 2% (applicable interest rate of 6.85% interest rate at April 29, 2012). At April 29, 2012, $889,000 (2.8 million Polish Zloty) was outstanding under this agreement.
Overall
Our loan agreements require, among other things, that we maintain compliance with certain financial covenants. At April 29, 2012, the company was in compliance with these financial covenants.
The principal payment requirements for long-term debt during the next four fiscal years are: 2013 – $2.4 million; 2014 – $2.3 million; 2015 - $2.2 million; and 2016 – $2.2 million.
Commitments
The following table summarizes our contractual payment obligations and commitments for each of the next five fiscal years (in thousands):
|
2013
|
2014
|
2015
|
2016
|
2017
|
Thereafter
|
Total
|
||||||||||||||||||||||
|
Capital expenditures
|
$ | 1,191 | - | - | - | - | - | 1,191 | ||||||||||||||||||||
|
Accounts payable – capital expenditures
|
169 | - | - | - | - | - | 169 | |||||||||||||||||||||
|
Operating leases
|
1,727 | 1,027 | 764 | 449 | 24 | - | 3,991 | |||||||||||||||||||||
|
Interest expense (1)
|
621 | 402 | 226 | 49 | - | - | 1,298 | |||||||||||||||||||||
|
Line of credit
|
889 | - | - | - | - | - | 889 | |||||||||||||||||||||
|
Long-term debt – principal
|
2,404 | 2,319 | 2,200 | 2,200 | - | - | 9,123 | |||||||||||||||||||||
|
Total (2)
|
$ | 7,001 | 3,748 | 3,190 | 2,698 | 24 | - | 16,661 | ||||||||||||||||||||
Note: Payment Obligations by End of Each Fiscal Year
|
(1)
|
Interest expense includes interest incurred on long-term debt and line of credit.
|
|
(2)
|
At April 29, 2012, the company had $12.5 million of total gross unrecognized tax benefits, of which $8.3 million and $4.2 million were classified as net non-current deferred income taxes and income taxes payable – long-term, respectively. The final outcome of these tax uncertainties is dependent upon various matters including tax examinations, legal proceedings, competent authority proceedings, changes in regulatory tax laws, or interpretations of those tax laws, or expiration of statutes of limitation. As a result of these inherent uncertainties, the company cannot reasonably estimate the timing of payment of these amounts. Of the $12.5 million in total gross unrecognized tax benefits, $8.3 million would not be subject to cash payments due to the company’s U.S. federal and state net operating loss carryforwards.
|
43
Capital Expenditures
Capital expenditures on a cash basis were $5.9 million and $6.4 million for fiscal 2012 and 2011, respectively. These capital expenditures for fiscal 2012 and 2011 primarily pertain to our mattress fabrics segment. Depreciation expense was $4.9 million and $4.4 million for fiscal 2012 and 2011, respectively. Depreciation expense for fiscal 2012 and 2011 primarily pertained to our mattress fabrics segment.
We are currently planning for capital expenditures of $5.5 million in fiscal 2013, which primarily pertain to our mattress fabrics segment.
For fiscal 2013, we are estimating capital expenditures and depreciation expense for the company as a whole to be $5.5 million and $5.2 million, respectively. The estimated capital expenditures and depreciation expense primarily relates to the mattress fabrics segment. These are management’s current expectations only, and changes in our business needs could cause changes in plans for capital expenditures and expectations for related depreciation expense.
Accounts Payable – Capital Expenditures
At April 29, 2012, we had total amounts due regarding capital expenditures totaling $169,000, which pertain to outstanding vendor invoices, none of which are financed. This amount due of $169,000 is required to be paid in full during fiscal 2013.
Inflation
Any significant increase in our raw material costs, utility/energy costs and general economic inflation could have a material adverse impact on the company, because competitive conditions have limited our ability to pass significant operating increases on to customers. As discussed elsewhere in this report (see “Segment Analysis”), significant increases in raw material costs led to lower profit margins for both of our business segments during fiscal years 2012 and 2011.
Critical Accounting Policies
U.S. generally accepted accounting principles require us to make estimates and assumptions that affect our reported amounts in the consolidated financial statements and accompanying notes. Some of these estimates require difficult, subjective and/or complex judgments about matters that are inherently uncertain, and as a result actual results could differ significantly from those estimates. Due to the estimation processes involved, management considers the following summarized accounting policies and their application to be critical to understanding the company’s business operations, financial condition and results of operations.
Accounts Receivable
-
Allowance for Doubtful Accounts
. Substantially all of our accounts receivable are due from residential and commercial furniture and bedding manufacturers. Ownership of these manufacturers is increasingly concentrated and certain bedding manufacturers have a high degree of leverage. As of April 29, 2012, accounts receivable from furniture manufacturers totaled approximately $12.8 million, and accounts receivable from bedding manufacturers totaled approximately $12.3 million. Additionally, as of April 29, 2012, the aggregate accounts receivable balance of the company’s ten largest customers was $12.9 million, or 52% of trade accounts receivable. One customer within the upholstery fabrics segment represented 12% of consolidated accounts receivable at April 29, 2012. No customers within the mattress fabrics segment represented more than 10% of consolidated accounts receivable at April 29, 2012.
44
We continuously perform credit evaluations of our customers, considering numerous inputs including customers’ financial position, past payment history, cash flows and management capability; historical loss experience; and economic conditions and prospects. Once evaluated, each customer is assigned a credit grade. Credit grades are adjusted as warranted. Significant management judgment and estimates must be used in connection with establishing the reserve for allowance for doubtful accounts. While management believes that adequate allowances for doubtful accounts have been provided in the consolidated financial statements, it is possible that we could experience additional unexpected credit losses.
The reserve balance for doubtful accounts was $567,000 and $776,000 at April 29, 2012 and May 1, 2011, respectively.
Inventory Valuation.
We operate as a “make-to-order” and “make-to-stock” business. Although management closely monitors demand in each product area to decide which patterns and styles to hold in inventory, the increasing availability of low cost imports and the gradual shifts in consumer preferences expose the company to markdowns of inventory.
Management continually examines inventory to determine if there are indicators that the carrying value exceeds its net realizable value. Experience has shown that the most significant indicator of the need for inventory markdowns is the age of the inventory and the planned discontinuance of certain patterns. As a result, the company provides inventory valuation markdowns based upon set percentages for inventory aging categories, generally using six, nine, twelve and fifteen month categories. We also provide inventory valuation write-downs based on the planned discontinuance of certain products based on the current market values at that time as compared to their current carrying values. While management believes that adequate markdowns for excess and obsolete inventory have been made in the consolidated financial statements, significant unanticipated changes in demand or changes in consumer tastes and preferences could result in additional excess and obsolete inventory in the future.
The reserve for inventory markdowns was $2.0 million and $1.8 million at April 29, 2012 and May 1, 2011, respectively.
Goodwill
. Management assesses goodwill for impairment at the end of each fiscal year or between annual tests if an event that occurs or circumstances change that would more likely than not reduce the fair value of a reporting unit below its carrying values. During the fourth quarter of fiscal 2012, we early adopted ASU No. 2011-08, Intangibles – Goodwill and Other (ASC Topic 350) – Testing Goodwill for Impairment when we performed our annual impairment test. ASU No. 2011-08 provides companies with a new option to determine whether or not it is necessary to apply the traditional two-step quantitative goodwill impairment test in ASC Topic 350. Under ASU No. 2011-08, companies are no longer required to calculate the fair value of the reporting unit (mattress fabrics segment) unless it determines, on the basis of qualitative information, that it is more likely than not (i.e. greater than 50%) that the fair value of a reporting unit is less than its carrying amount. Based on our qualitative assessment, we determined that our goodwill is not impaired using a more likely than not standard.
The company’s goodwill at April 29, 2012, of $11.5 million relates to the mattress fabrics segment.
Although we believe we have based the impairment testing on reasonable estimates and assumptions, the use of different estimates and assumptions could result in materially different results.
45
Income Taxes
. Income taxes are accounted for under the asset and liability method. Deferred income taxes are recognized for temporary differences between the financial statement carrying amounts and the tax bases of the company’s assets and liabilities and operating loss and tax credit carryforwards at income tax rates expected to be in effect when such amounts are realized or settled. The effect on deferred income taxes of a change in tax rates is recognized in income (loss) in the period that includes the enactment date.
In accordance with ASC Topic 740, we evaluate our deferred income taxes to determine if a valuation allowance is required. ASC Topic 740 requires that companies assess whether a valuation allowance should be established based on the consideration of all available evidence using a “more likely than not” standard with significant weight being given to evidence that can be objectively verified. Since the company operates in multiple jurisdictions, we assess the need for a valuation allowance on a jurisdiction-by-jurisdiction basis, taking into account the effects of local tax law. Based on this assessment, we recorded a partial valuation allowance of $12.8 million and $16.4 million against our net deferred tax assets associated with our U.S. operations at April 29, 2012 and May 1, 2011, respectively. At April 29, 2012 and May 1, 2011, no valuation allowance was recorded against our net deferred tax assets associated with our operations located in China and Poland.
Refer to Note 10 located in the notes to the consolidated statements for disclosures regarding our assessment of our recorded valuation allowance as of April 29, 2012 and May 1, 2011, respectively.
In accordance with ASC Topic 740, we must recognize the tax impact from an uncertain tax position only if it is more likely than not that the tax position will be sustained on examination by the taxing authorities, based on the technical merits of the position. The tax impact recognized in the financial statements from such a position is measured based on the largest benefit that has a greater than 50% likelihood of being realized upon ultimate resolution. Penalties and interest related to uncertain tax positions are recorded as tax expense. Significant judgment is required in the identification of uncertain tax positions and in the estimation of penalties and interest on uncertain tax positions.
At April 29, 2012, we had $12.5 million of total gross unrecognized tax benefits, of which $8.3 million and $4.2 million were classified as net non-current deferred income taxes and income taxes payable – long-term, respectively, in the accompanying consolidated balance sheets.
Adoption of New Accounting Pronouncements
Refer to Note 1 located in the notes to the consolidated statements for recently adopted accounting pronouncements for fiscal 2012.
Recently Issued Accounting Standards
Refer to Note 1 located in the notes to the consolidated statements for recently issued accounting pronouncements for fiscal 2013.
46
We are exposed to market risk from changes in interest rates on our revolving credit lines. At April 29, 2012, our U.S. revolving credit agreement provides for a pricing matrix to determine the interest rate payable on loans made under this agreement. Our revolving credit line associated with our China subsidiaries bears interest at a rate determined by the Chinese government. At April 29, 2012, there were no borrowings outstanding under our U.S. and China revolving credit lines. On January 17, 2012, we entered into an unsecured credit agreement associated with our operations located in Poland that bears interest at WIBOR (Warsaw Interbank Offered Rate) plus 2%. At April 29, 2012, $889,000 was outstanding under this agreement and this amount is required to be paid in full by January 15, 2013, when this agreement expires.
We are not exposed to market risk from changes in interest rates on our long-term debt. Our unsecured term notes have a fixed interest rate of 8.01% and the loan associated with the Government of Quebec is non-interest bearing.
We are exposed to market risk from changes in the value of foreign currencies for our subsidiaries domiciled in China, Canada, and Poland. We try to maintain a natural hedge by keeping a balance of our assets and liabilities denominated in the local currencies of our subsidiaries domiciled in Canada and Europe, although there is no assurance that we will be able to continually maintain this natural hedge. Our foreign subsidiaries use the U.S. dollars as their functional currency. A substantial portion of the company’s imports purchased outside the U.S. are denominated in U.S. dollars. A 10% change in the above exchange rates at April 29, 2012, would not have had a significant impact on our results of operations or financial position.
47
AND SUPPLEMENTARY DATA
REPORT OF INDEPENDENT REGISTERED PUBLIC ACCOUNTING FIRM
Board of Directors and Shareholders of
Culp, Inc.:
We have audited the accompanying consolidated balance sheets of
Culp, Inc.
(a North Carolina corporation)
and Subsidiaries
(the “Company”) as of April 29, 2012, and May 1, 2011, and the related consolidated statements of operations, shareholders’ equity and cash flows for each of the three years in the period ended April 29, 2012. These financial statements are the responsibility of the Company’s management. Our responsibility is to express an opinion on these financial statements based on our audits.
We conducted our audits in accordance with the standards of the Public Company Accounting Oversight Board (United States). Those standards require that we plan and perform the audit to obtain reasonable assurance about whether the financial statements are free of material misstatement. An audit includes examining, on a test basis, evidence supporting the amounts and disclosures in the financial statements. An audit also includes assessing the accounting principles used and significant estimates made by management, as well as evaluating the overall financial statement presentation. We believe that our audits provide a reasonable basis for our opinion.
In our opinion, the consolidated financial statements referred to above present fairly, in all material respects, the financial position of Culp, Inc. and Subsidiaries as of April 29, 2012 and May 1, 2011, and the results of their operations and their cash flows for each of the three years in the period ended April 29, 2012, in conformity with accounting principles generally accepted in the United States of America.
We also have audited, in accordance with the standards of the Public Company Accounting Oversight Board (United States), the Company’s internal control over financial reporting as of April 29, 2012, based on criteria established in Internal Control—Integrated Framework issued by the Committee of Sponsoring Organizations of the Treadway Commission (COSO) and our report dated July 12, 2012 expressed an unqualified opinion.
/s/ GRANT THORNTON LLP
Charlotte, North Carolina
July 12, 2012
48
|
|
||||||||
|
April 29, 2012 and May 1, 2011 (dollars in thousands)
|
2012
|
2011
|
||||||
|
ASSETS
|
||||||||
|
current assets:
|
||||||||
|
cash and cash equivalents
|
$ | 25,023 | $ | 23,181 | ||||
|
short-term investments
|
5,941 | 7,699 | ||||||
|
accounts receivable, net
|
25,055 | 20,209 | ||||||
|
inventories
|
36,373 | 28,723 | ||||||
|
deferred income taxes
|
2,467 | 293 | ||||||
|
assets held for sale
|
15 | 75 | ||||||
|
income taxes receivable
|
- | 79 | ||||||
|
other current assets
|
1,989 | 2,376 | ||||||
|
total current assets
|
96,863 | 82,635 | ||||||
|
property, plant and equipment, net
|
31,279 | 30,296 | ||||||
|
goodwill
|
11,462 | 11,462 | ||||||
|
deferred income taxes
|
3,205 | 3,606 | ||||||
|
other assets
|
1,907 | 2,052 | ||||||
|
total assets
|
$ | 144,716 | $ | 130,051 | ||||
|
LIABILITIES AND SHAREHOLDERS' EQUITY
|
||||||||
|
current liabilities:
|
||||||||
|
current maturities of long-term debt
|
$ | 2,404 | $ | 2,412 | ||||
|
line of credit
|
889 | - | ||||||
|
accounts payable - trade
|
30,663 | 24,871 | ||||||
|
accounts payable - capital expenditures
|
169 | 140 | ||||||
|
accrued expenses
|
9,321 | 7,617 | ||||||
|
accrued restructuring costs
|
40 | 44 | ||||||
|
deferred income taxes
|
- | 82 | ||||||
|
income taxes payable
|
642 | 646 | ||||||
|
total current liabilities
|
44,128 | 35,812 | ||||||
|
income taxes payable - long-term
|
4,164 | 4,167 | ||||||
|
deferred income taxes
|
705 | 596 | ||||||
|
long-term debt, less current maturities
|
6,719 | 9,135 | ||||||
|
total liabilities
|
55,716 | 49,710 | ||||||
|
commitments and contingencies (notes 11 and 12)
|
||||||||
|
shareholders' equity:
|
||||||||
|
preferred stock, $.05 par value, authorized 10,000,000
|
||||||||
|
shares
|
- | - | ||||||
|
common stock, $.05 par value, authorized 40,000,000
|
||||||||
|
shares, issued and outstanding 12,702,806 at
|
||||||||
|
April 29, 2012 and 13,264,458 at May 1, 2011
|
635 | 663 | ||||||
|
capital contributed in excess of par value
|
46,056 | 50,681 | ||||||
|
accumulated earnings
|
42,293 | 28,997 | ||||||
|
accumulated other comprehensive income
|
16 | - | ||||||
|
total shareholders' equity
|
89,000 | 80,341 | ||||||
|
total liabilities and shareholders' equity
|
$ | 144,716 | $ | 130,051 | ||||
|
The accompanying notes are an integral part of these consolidated financial statements.
|
||||||||
49
|
CONSOLIDATED STATEMENTS OF NET INCOME
|
||||||||||||
|
For the years ended Aprl 29, 2012, May 1, 2011 and May 2, 2010
|
||||||||||||
|
(dollars in thousands, except per share data)
|
2012
|
2011
|
2010
|
|||||||||
|
net sales
|
$ | 254,443 | $ | 216,806 | $ | 206,416 | ||||||
|
cost of sales
|
214,711 | 179,966 | 167,639 | |||||||||
|
gross profit
|
39,732 | 36,840 | 38,777 | |||||||||
|
selling, general and administrative expenses
|
25,026 | 21,069 | 22,805 | |||||||||
|
restructuring expense (credit) (note 2)
|
- | 28 | (370 | ) | ||||||||
|
income from operations
|
14,706 | 15,743 | 16,342 | |||||||||
|
interest expense
|
780 | 881 | 1,314 | |||||||||
|
interest income
|
(508 | ) | (240 | ) | (116 | ) | ||||||
|
other expense, net
|
236 | 40 | 828 | |||||||||
|
income before income taxes
|
14,198 | 15,062 | 14,316 | |||||||||
|
income tax expense (benefit) (note 10)
|
902 | (1,102 | ) | 1,128 | ||||||||
|
net income
|
$ | 13,296 | $ | 16,164 | $ | 13,188 | ||||||
|
net income per share-basic
|
$ | 1.05 | $ | 1.25 | $ | 1.04 | ||||||
|
net income per share-diluted
|
$ | 1.03 | $ | 1.22 | $ | 1.01 | ||||||
|
The accompanying notes are an integral part of these consolidated financial statements.
|
||||||||||||
50
|
CONSOLIDATED STATEMENTS OF SHAREHOLDERS' EQUITY
|
||||||||||||||||||||||||
|
(dollars in thousands, except common stock shares)
|
capital
|
accumulated |
|
|||||||||||||||||||||
|
common
|
common
|
contributed
|
Accumulated
|
other
|
total
|
|||||||||||||||||||
|
For the years ended April 29, 2012
|
stock
|
stock
|
in excess of
|
(deficit)
|
comprehensive
|
shareholders'
|
||||||||||||||||||
|
May 1, 2011 and May 2, 2010
|
shares
|
amount
|
par value
|
earnings
|
income
|
equity
|
||||||||||||||||||
|
balance, May 3, 2009
|
12,767,527 | $ | 638 | $ | 47,728 | $ | (355 | ) | $ | 20 | $ | 48,031 | ||||||||||||
|
net income
|
- | - | - | 13,188 | - | 13,188 | ||||||||||||||||||
|
stock-based compensation
|
- | - | 834 | - | - | 834 | ||||||||||||||||||
|
gain on cash flow hedge, net of taxes
|
- | - | - | - | 83 | 83 | ||||||||||||||||||
|
restricted stock granted
|
80,000 | 4 | (4 | ) | - | - | - | |||||||||||||||||
|
common stock issued in connection
|
||||||||||||||||||||||||
|
with performance based units
|
80,000 | 4 | (4 | ) | - | - | - | |||||||||||||||||
|
common stock surrendered for withholding
|
||||||||||||||||||||||||
|
taxes payable and cost of option exercises
|
(20,658 | ) | (1 | ) | (190 | ) | - | - | (191 | ) | ||||||||||||||
|
excess tax benefit related to stock options
|
||||||||||||||||||||||||
|
exercised
|
- | - | 429 | - | - | 429 | ||||||||||||||||||
|
common stock issued in connection
|
||||||||||||||||||||||||
|
with stock option plans
|
144,916 | 7 | 666 | - | - | 673 | ||||||||||||||||||
|
balance, May 2, 2010
|
13,051,785 | 652 | 49,459 | 12,833 | 103 | 63,047 | ||||||||||||||||||
|
net income
|
- | - | - | 16,164 | - | 16,164 | ||||||||||||||||||
|
stock-based compensation
|
- | - | 360 | - | - | 360 | ||||||||||||||||||
|
loss on cash flow hedge, net of taxes
|
- | - | - | - | (103 | ) | (103 | ) | ||||||||||||||||
|
common stock issued in connection
|
||||||||||||||||||||||||
|
with performance based units
|
40,000 | 2 | (2 | ) | - | - | - | |||||||||||||||||
|
common stock surrendered for withholding
|
||||||||||||||||||||||||
|
taxes payable and cost of option exercises
|
(60,415 | ) | (3 | ) | (560 | ) | - | - | (563 | ) | ||||||||||||||
|
excess tax benefit related to stock options
|
||||||||||||||||||||||||
|
exercised
|
- | - | 339 | - | - | 339 | ||||||||||||||||||
|
fully vested common stock award
|
3,114 | - | - | - | - | - | ||||||||||||||||||
|
common stock issued in connection
|
||||||||||||||||||||||||
|
with stock option plans
|
229,974 | 12 | 1,085 | - | - | 1,097 | ||||||||||||||||||
|
balance, May 1, 2011
|
13,264,458 | 663 | 50,681 | 28,997 | - | 80,341 | ||||||||||||||||||
|
net income
|
- | - | - | 13,296 | - | 13,296 | ||||||||||||||||||
|
stock-based compensation
|
- | - | 349 | - | - | 349 | ||||||||||||||||||
|
unrealized gain on short-term investments
|
- | 16 | 16 | |||||||||||||||||||||
|
excess tax benefit related to stock options
|
||||||||||||||||||||||||
|
exercised
|
- | - | 64 | - | - | 64 | ||||||||||||||||||
|
common stock repurchased
|
(624,127 | ) | (31 | ) | (5,353 | ) | - | - | (5,384 | ) | ||||||||||||||
|
fully vested common stock award
|
3,075 | - | - | - | - | - | ||||||||||||||||||
|
common stock issued in connection
|
||||||||||||||||||||||||
|
with stock option plans
|
59,400 | 3 | 315 | - | - | 318 | ||||||||||||||||||
|
balance, April 29, 2012
|
12,702,806 | $ | 635 | $ | 46,056 | $ | 42,293 | $ | 16 | $ | 89,000 | |||||||||||||
|
The accompanying notes are an integral part of these consolidated financial statements.
|
||||||||||||||||||||||||
51
|
|
||||||||||||
|
For the years ended April 29, 2012, May 1, 2011 and May 2, 2010
|
||||||||||||
|
(dollars in thousands)
|
2012
|
2011
|
2010
|
|||||||||
|
cash flows from operating activities:
|
||||||||||||
|
net income
|
$ | 13,296 | 16,164 | 13,188 | ||||||||
|
adjustments to reconcile net income to net cash
|
||||||||||||
|
provided by operating activities:
|
||||||||||||
|
depreciation
|
4,865 | 4,372 | 4,010 | |||||||||
|
amortization of other assets
|
243 | 442 | 548 | |||||||||
|
stock-based compensation
|
349 | 360 | 834 | |||||||||
|
excess tax benefit related to stock options exercised
|
(64 | ) | (339 | ) | (429 | ) | ||||||
|
deferred income taxes
|
(1,682 | ) | (3,390 | ) | (148 | ) | ||||||
|
gain on sale of equipment
|
(168 | ) | (22 | ) | (65 | ) | ||||||
|
restructuring expenses, net of gain on sale of related assets
|
- | 28 | (170 | ) | ||||||||
|
foreign currency exchange (gains) losses
|
(215 | ) | (115 | ) | 688 | |||||||
|
changes in assets and liabilities, net of effects of acquisition of assets:
|
||||||||||||
|
accounts receivable
|
(4,792 | ) | (199 | ) | (1,684 | ) | ||||||
|
inventories
|
(7,497 | ) | (2,579 | ) | (2,020 | ) | ||||||
|
other current assets
|
395 | (621 | ) | (418 | ) | |||||||
|
other assets
|
(61 | ) | (3 | ) | (67 | ) | ||||||
|
accounts payable-trade
|
5,426 | 2,110 | 5,157 | |||||||||
|
accrued expenses
|
1,710 | (2,286 | ) | 2,853 | ||||||||
|
accrued restructuring
|
(4 | ) | (280 | ) | (529 | ) | ||||||
|
income taxes
|
202 | 1,179 | (171 | ) | ||||||||
|
net cash provided by operating activities
|
12,003 | 14,821 | 21,577 | |||||||||
|
cash flows from investing activities:
|
||||||||||||
|
capital expenditures
|
(5,890 | ) | (6,352 | ) | (7,431 | ) | ||||||
|
purchase of short-term investments
|
(4,797 | ) | (6,713 | ) | (3,023 | ) | ||||||
|
proceeds from the sale of short-term investments
|
6,707 | 2,037 | - | |||||||||
|
proceeds from the sale of buildings and equipment
|
299 | 79 | 583 | |||||||||
|
net cash used in investing activities
|
(3,681 | ) | (10,949 | ) | (9,871 | ) | ||||||
|
cash flows from financing activities:
|
||||||||||||
|
proceeds from lines of credit
|
6,323 | - | - | |||||||||
|
payments on lines of credit
|
(5,500 | ) | - | - | ||||||||
|
payments on vendor-financed capital expenditures
|
- | (377 | ) | (985 | ) | |||||||
|
payments on a capital lease obligation
|
- | - | (626 | ) | ||||||||
|
payments on long-term debt
|
(2,404 | ) | (179 | ) | (4,789 | ) | ||||||
|
debt issuance costs
|
(37 | ) | (27 | ) | (15 | ) | ||||||
|
repurchases of common stock
|
(5,384 | ) | - | - | ||||||||
|
proceeds from common stock issued
|
318 | 769 | 673 | |||||||||
|
excess tax benefit related to stock options exercised
|
64 | 339 | 429 | |||||||||
|
net cash (used in) provided by financing activities
|
(6,620 | ) | 525 | (5,313 | ) | |||||||
|
effect of exchange rate changes on cash and cash equivalents
|
140 | 489 | 105 | |||||||||
|
|
||||||||||||
|
increase in cash and cash equivalents
|
1,842 | 4,886 | 6,498 | |||||||||
|
|
||||||||||||
|
cash and cash equivalents at beginning of year
|
23,181 | 18,295 | 11,797 | |||||||||
|
|
||||||||||||
|
cash and cash equivalents at end of year
|
$ | 25,023 | 23,181 | 18,295 | ||||||||
|
The accompanying notes are an integral part of these consolidated financial statements.
|
||||||||||||
52
NOTES TO CONSOLIDATED FINANCIAL STATEMENTS
|
1.
|
GENERAL AND SUMMARY OF SIGNIFICANT ACCOUNTING POLICIES
|
Description of Business
– Culp, Inc. manufactures and markets mattress fabrics and upholstery fabrics primarily for the furniture and bedding industries, with the majority of its revenues derived in North America. The company has mattress fabric operations located in Stokesdale, NC, High Point, NC, and Quebec, Canada. The company has upholstery fabric operations located in Shanghai, China, Poznan, Poland, Burlington, NC and Anderson, SC.
During the third quarter of fiscal 2011, we formed a new wholly-owned subsidiary in Poland, called Culp Europe. This operation sells and distributes upholstery fabrics and makes and sells cut and sewn kits in Europe, using fabrics sourced primarily from our operations located in China. Our sales and marketing efforts in Europe also include a program for shipping containers of fabric and cut and sewn kits directly from our operations located in China to customers in Europe. Sales activities in Culp Europe commenced during the fourth quarter of fiscal 2011.
Basis of Presentation
– The consolidated financial statements of the company have been prepared in accordance with U.S. generally accepted accounting principles.
Principles of Consolidation
– The consolidated financial statements include the accounts of the company and its subsidiaries, which are wholly-owned. All significant intercompany balances and transactions have been eliminated in consolidation. The accounts of our subsidiaries located in Shanghai, China and Poznan, Poland are consolidated as of April 30, a calendar month end, which year end is required by the Chinese and Polish governments, respectively. No events occurred related to the difference between our fiscal year end on the Sunday closest to April 30 and our China and Polish subsidiaries year end of April 30 that materially affected the company’s financial position, results of operations, or cash flows for fiscal years 2012, 2011, and 2010.
Fiscal Year
– Our fiscal year is the 52 or 53 week period ending on the Sunday closest to April 30. Fiscal 2012, 2011 and 2010 each included 52 weeks.
Use of Estimates –
The preparation of financial statements in conformity with U.S. generally accepted accounting principles requires management to make estimates and assumptions that affect the reported amounts of assets and liabilities and disclosure of contingent assets and liabilities at the date of the financial statements and the reported amounts of revenues and expenses during the reporting period. Actual results could differ from those estimates.
Cash and Cash Equivalents
– Cash and cash equivalents include demand deposit and money market accounts. We consider all highly liquid instruments with original maturities of three months or less to be cash equivalents. Our Chinese subsidiaries had cash and cash equivalents of $15.6 million and $12.9 million at April 29, 2012 and May 1, 2011, respectively. Our Canadian subsidiary had cash and cash equivalents of $5.6 million and $7.6 million at April 29, 2012 and May 1, 2011, respectively. Our Polish subsidiary had cash and cash equivalents of $158,000 and $111,000 at April 29, 2012 and May 1, 2011, respectively. Throughout the year, we have cash balances regarding our U.S. operations in excess of federally insured amounts on deposit with a financial institution.
53
Short-Term Investments
– Short-term investments include short-term bond funds and a savings account that has a maturity of less than one year. Our short-term bond funds are classified as available-for-sale. Our short term bonds funds had unrealized gains totaling $16,000 in fiscal 2012 and were immaterial for fiscal 2011. Our short-term bond funds were recorded at its fair value of $5.1 million and $1.0 million at April 29, 2012 and May 1, 2011, respectively. The fair value of this investment approximates its cost basis.
Our Chinese subsidiaries had short-term investments of $796,000 and $3.5 million at April 29, 2012 and May 1, 2011, respectively. Our Canadian subsidiary had short-term investments of $4.1 million and $2.1 million at April 29, 2012 and May 1, 2011, respectively. Our U.S. operations held short-term investments of $1.0 million and $2.1 million at April 29, 2012 and May 1, 2011, respectively.
Accounts Receivable
– Substantially all of our accounts receivable are due from manufacturers in the bedding and furniture industries. We grant credit to customers, a substantial number of which are located in North America and generally do not require collateral. We record an allowance for doubtful accounts that reflects estimates of probable credit losses. Management continuously performs credit evaluations of our customers, considering numerous inputs including financial position, past payment history, cash flows, management ability, historical loss experience and economic conditions and prospects. We do not have any off-balance sheet credit exposure related to our customers.
Inventories
– We account for inventories at the lower of first-in, first-out (FIFO) cost or market. Management continually examines inventory to determine if there are indicators that the carrying value exceeds its net realizable value. Experience has shown that the most significant indicators of the need for inventory markdowns are the age of the inventory and the planned discontinuance of certain patterns. As a result, we provide inventory valuation write-downs based upon established percentages based on the age of the inventory that are continually evaluated as events and market conditions require. Our inventory aging categories are six, nine, twelve, and fifteen months. We also provide inventory valuation write-downs based on the planned discontinuance of certain products based on the current market values at that time as compared to their current carrying values.
Property, Plant and Equipment
– Property, plant and equipment are recorded at cost and depreciated over their estimated useful lives using the straight-line method. Major renewals and betterments are capitalized. Maintenance, repairs and minor renewals are expensed as incurred. When properties or equipment are retired or otherwise disposed of, the related cost and accumulated depreciation are removed from the accounts. Amounts received on disposal less the book value of assets sold are charged or credited to income (loss) from operations.
Management reviews long-lived assets, which consist principally of property, plant and equipment, for impairment whenever events or changes in circumstances indicate that the carrying value of the asset may not be recovered. Recoverability of long-lived assets to be held and used is measured by a comparison of the carrying amount of the asset to future net undiscounted cash flows expected to be generated by the asset. If the carrying amount of an asset exceeds its estimated future cash flows, the related cost and accumulated depreciation are removed from the accounts and an impairment charge is recognized for the excess of the carrying amount over the fair value of the asset. After the impairment loss is recognized, the adjusted carrying amount is the new accounting basis. Assets to be disposed of by sale are reported at the lower of the carrying value or fair value less cost to sell when the company has committed to a disposal plan, and are reported separately as assets held for sale in the consolidated balance sheets.
Interest costs of $17,000 and $34,000 for the construction of qualifying fixed assets were capitalized and are being amortized over the related assets’ estimated useful lives for the fiscal years ended 2011 and 2010, respectively. No interest costs were capitalized for the construction of qualifying fixed assets for fiscal 2012.
54
Foreign Operations –
Our future operations and earnings will be significantly impacted by the results of our operations in China, Poland, and Canada. There can be no assurance that we will be able to successfully conduct such operations, and a failure to do so could have a material adverse effect on our financial position, results of operations, and cash flows. Also, the success of our operations will be subject to numerous contingencies, some of which may be beyond management’s control. These contingencies include general and regional economic conditions, prices for the company’s products, competition, changes in regulation, and various additional political, economic, governmental, and other uncertainties. Among other risks, our operations will be subject to the risks of restrictions on transfer of funds, export duties, quotas and embargoes, domestic and international customs and tariffs, changing taxation policies, and foreign exchange fluctuations and restrictions.
Foreign Currency Adjustments
– The United States dollar is the functional currency for the company’s Canadian, Chinese, and Polish subsidiaries. All foreign currency asset and liability accounts are remeasured into U.S. dollars at year-end exchange rates, except for property, plant, and equipment, and other long-term assets and liabilities which are recorded at historical exchange rates. Foreign currency revenues and expenses are remeasured at average exchange rates in effect during the year, except for certain expenses related to balance sheet amounts remeasured at historical exchange rates. Exchange gains and losses from remeasurement of foreign currency denominated monetary assets and liabilities are recorded in the other expense, net line item in the Consolidated Statements of Operations in the period in which they occur.
Our Canadian subsidiary reported a foreign currency exchange loss of $19,000, $24,000, and $542,000 for fiscal 2012, 2011, and 2010, respectively. Our Chinese subsidiaries reported a foreign exchange gain of $320,000 and $222,000 for fiscal 2012 and 2011, respectively. Our Chinese subsidiaries reported a foreign currency exchange loss of $23,000 for fiscal 2010. Our Polish subsidiary reported a foreign exchange loss of $145,000 in fiscal 2012 and a foreign exchange gain of $26,000 in fiscal 2011. Our Polish subsidiary did not report a foreign exchange gain or loss in fiscal 2010 as operations commenced in the third quarter of fiscal 2011.
Goodwill
– Management assesses goodwill for impairment at the end of each fiscal year or between annual tests if an event that occurs or circumstances change that would more likely than not reduce the fair value of a reporting unit below its carrying values. During the fourth quarter of fiscal 2012, we early adopted ASU No. 2011-08, Intangibles – Goodwill and Other (ASC Topic 350) – Testing Goodwill for Impairment when we performed our annual impairment test. ASU No. 2011-08 provides companies with a new option to determine whether or not it is necessary to apply the traditional two-step quantitative goodwill impairment test in ASC Topic 350. Under ASU No. 2011-08, companies are no longer required to calculate the fair value of the reporting unit (mattress fabrics segment) unless it determines, on the basis of qualitative information, that it is more likely than not (i.e. greater than 50%) that the fair value of a reporting unit is less than its carrying amount. Based on our qualitative assessment, we determined that our goodwill is not impaired using a more likely than not standard.
Our goodwill at April 29, 2012, of $11.5 million relates to the mattress fabrics segment.
Income Taxes
– Income taxes are accounted for under the asset and liability method. Deferred income taxes are recognized for temporary differences between the financial statement carrying amounts and the tax bases of our assets and liabilities and operating loss and tax credit carryforwards at income tax rates expected to be in effect when such amounts are realized or settled. The effect on deferred income taxes of a change in tax rates is recognized in income (loss) in the period that includes the enactment date.
55
We have not recorded deferred income taxes applicable to undistributed earnings of our subsidiary located in Canada and China. Generally, such earnings become subject to U.S. income tax upon the remittance of dividends from undistributed earnings of a company’s foreign subsidiaries. It is the present intention of management to reinvest the undistributed earnings of our subsidiary located in Canada indefinitely. At April 29, 2012, our subsidiary located in Canada had undistributed earnings totaling $42.6 million. If these undistributed earnings were not indefinitely reinvested, an additional deferred tax liability of approximately $15.7 million would have been required at April 29, 2012, prior to consideration of the related valuation allowance. At April 29, 2012, our subsidiaries located in China had undistributed earnings totaling $12.3 million. It is the present intention of management to reinvest these undistributed earnings and, therefore a deferred tax liability has not been recorded. If these undistributed earnings were not indefinitely reinvested, an additional deferred tax liability of approximately $4.5 million would have been required at April 29, 2012, prior to consideration of the related valuation allowance.
Revenue Recognition
– Revenue is recognized upon shipment, when title and risk of loss pass to the customer. Provision is currently made for estimated product returns, claims and allowances. Management considers historical claims and return experience, among other things, when establishing the allowance for returns and allowances.
Shipping and Handling Costs
– Revenue received for shipping and handling costs, which is immaterial for all periods presented, is included in net sales. Shipping costs, principally freight, that comprise payments to third-party shippers are classified as cost of sales. Handling costs represent finished goods warehousing costs incurred to store, move, and prepare products for shipment in the company’s various distribution facilities. Handling costs were $2.6 million, $2.4 million and $2.2 million in fiscal 2012, 2011, and 2010, respectively, and are included in selling, general and administrative expenses.
Sales and Other Taxes –
Sales and other taxes collected from customers and remitted to governmental authorities are presented on a net basis and, as such, are excluded from revenues.
Stock-Based Compensation
– Our equity incentive plans are described more fully in Note 13. ASC 718, “Compensation – Stock Compensation” (formerly known as SFAS No. 123(R)), requires that all stock-based compensation be recognized as compensation expense in the financial statements and that such cost be measured at the grant date for awards issued to employees and the company’s board of directors. Equity awards issued to non-employees are measured at the earlier date of when the performance criteria are met or the end of each reporting period. Compensation expense for unvested stock options and time vested restricted stock awards are amortized on a straight-line basis over the remaining vesting periods. Compensation expense for performance based restricted stock units were recorded based on an assessment each reporting period of the probability if certain performance goals were to be met during the contingent vesting period. If performance goals were not probable of occurrence, no compensation expense was recognized and any previously recognized compensation cost was reversed. Excess tax benefits related to our equity incentive plans are reflected as financing cash inflows on the Statement of Cash Flows. We have elected to record the additional excess tax benefits associated with our equity incentive awards as a reduction in current income tax payable prior to utilizing any net operating loss carryforwards.
Fair Value of Financial Instruments
– The accompanying consolidated financial statements include certain financial instruments, and the fair market value of such instruments may differ from amounts reflected on a historical basis. These financial instruments include our long-term debt and short-term bond funds. The fair value measurement of these financial instruments are described more fully in Note 14.
The carrying amount of cash and cash equivalents, short-term investments, accounts receivable, other current assets, accounts payable and accrued expenses approximates fair value because of the short maturity of these financial instruments.
56
Recently Adopted Accounting Pronouncements
ASC Topic 605
In October 2009, the FASB issued ASU No. 2009-13, which amends ASC Topic 605, “Revenue Recognition”, to revise accounting guidance related to revenue arrangements with multiple deliverables. The guidance relates to the determination of when the individual deliverables included in a multiple-element arrangement may be treated as separate units of accounting and modifies the manner in which the transaction consideration is allocated across the individual deliverables. This guidance was effective as of May 2, 2011 (the beginning of our fiscal 2012) and did not have an impact on our consolidated results of operations.
ASC Topic 350
In September 2011, ASU No. 2011-08, Intangibles – Goodwill and Other (ASC Topic 350) – Testing Goodwill for Impairment was issued. ASU No. 2011-08 provides companies with a new option to determine whether or not it is necessary to apply the traditional two-step quantitative goodwill impairment test in ASC Topic 350. Under ASU No. 2011-08 companies are no longer required to calculate the fair value of the reporting unit unless it determines, on the basis of qualitative information, that it is more likely than not (i.e. greater than 50%) that the fair value of a reporting unit is less than its carrying amount. ASU No. 2011-08 is effective for periods ending after December 15, 2011; however, early adoption is permitted for periods ending after September 15, 2011. We early adopted ASU No. 2011-08 in our fourth quarter of fiscal 2012 when we performed our annual impairment test. The adoption of ASU No. 2011-08 did not have an impact on our Consolidated Financial Statements.
Recently Issued Accounting Pronouncements
ASC Topic 220
In June of 2011, the FASB issued ASU No. 2011-05, which amends ASC Topic 220, “Comprehensive Income”, to revise accounting guidance related to the presentation of comprehensive income in an entity’s financial statements. The guidance allows an entity the option to present the total comprehensive income, the components of net income, and the components of other comprehensive income either in a single continuous statement of comprehensive income or two separate but consecutive statements. In both choices, an entity is required to present each component of net income along with a total net income, each component of other comprehensive income along with a total for other comprehensive income, and a total amount of comprehensive income. ASU 2011-05 eliminates the option to present the components of other comprehensive income as part of the statement of changes in stockholders’ equity or notes to the financial statements. This revised guidance does not change the items that must be reported in other comprehensive income or when an item of other comprehensive income must be reclassified to net income. This guidance is effective for fiscal years, and interim periods within those years, beginning after December 15, 2011. As a result, this guidance is effective for our first quarter of fiscal 2013. The FASB amended this guidance in December 2011 to postpone a requirement to present items that are reclassified from other comprehensive income to net income on the face of the financial statement where the components of net income and other comprehensive income are presented and reinstate previous guidance related to such reclassifications. This guidance will change how we present comprehensive income in our consolidated financial statements as we currently present the components of other comprehensive income and total comprehensive income as part of our notes to the consolidated financial statements (see Note 20).
57
|
2.
|
RESTRUCTURING AND ASSET IMPAIRMENTS
|
Accrued restructuring costs were $40,000 and $44,000 at April 29, 2012 and May 1, 2011, respectively. Our accrued restructuring costs related to our upholstery fabrics segment.
The following summarizes the activity in the restructuring accrual (dollars in thousands):
|
Employee
Termination Benefits
|
Lease Termination
and Other Exit Costs
|
Total
|
||||||||||
|
balance, May 3, 2009
|
$ | 389 | 464 | 853 | ||||||||
|
adjustments in fiscal 2010
|
(186 | ) | (14 | ) | (200 | ) | ||||||
|
paid in fiscal 2010
|
(190 | ) | (139 | ) | (329 | ) | ||||||
|
balance, May 2, 2010
|
$ | 13 | 311 | 324 | ||||||||
|
adjustments in fiscal 2011
|
(14 | ) | 24 | 10 | ||||||||
|
paid in fiscal 2011
|
1 | (291 | ) | (290 | ) | |||||||
|
balance, May 1, 2011
|
$ | - | 44 | 44 | ||||||||
|
adjustments in fiscal 2012
|
- | - | - | |||||||||
|
paid in fiscal 2012
|
- | (4 | ) | (4 | ) | |||||||
|
balance, April 29, 2012
|
$ | - | 40 | 40 | ||||||||
Fiscal 2012
No restructuring and related charges or credits were recorded in fiscal 2012.
Fiscal 2011
During fiscal 2011, we recorded a $28,000 restructuring charge, of which $28,000 related to an impairment charge on equipment classified as held for sale (see Note 3), a charge of $24,000 for lease termination and other exit costs, offset by a credit of $14,000 for employee termination benefits, and a credit of $10,000 for sales proceeds received on equipment with no carrying value. This $28,000 restructuring charge was recorded in restructuring expense in the 2011 Consolidated Statement of Net Income and relates to the upholstery fabrics segment.
Fiscal 2010
During fiscal 2010, we recorded a restructuring and related credit of $312,000, of which a credit of $186,000 was for employee termination benefits, a credit of $170,000 for sales proceeds received on equipment with no carrying value, a credit of $50,000 was inventory markdowns, a credit of $14,000 for lease termination and other exit costs, offset by a charge of $108,000 for other operating costs associated with closed plant facilities. Of this total credit, a charge of $58,000 was recorded to cost of sales and a credit of $370,000 was recorded to restructuring credit in the 2010 Consolidated Statement of Net Income and relates to the upholstery fabrics segment.
|
3
.
|
ASSETS HELD FOR SALE AND RELATED IMPAIRMENTS
|
A summary of assets held for sale follows:
|
(dollars in thousands)
|
April 29, 2012
|
May 1, 2011
|
||||||
| U.S. upholstery fabrics | $ | - | $ | 60 | ||||
|
Mattress fabrics
|
15 | 15 | ||||||
| $ | 15 | $ | 75 | |||||
The carrying value of these assets held for sale are presented separately in the April 29, 2012 and May 1, 2011 consolidated balance sheets and are no longer being depreciated.
58
U.S. Upholstery Fabrics
During fiscal 2012, we received proceeds of $63,000 associated with the sale of equipment classified as held for sale and recorded a gain on the sale of equipment of $3,000 which was recorded in cost of sales in the 2012 Consolidated Statement of Net Income.
During the fourth quarter of fiscal 2011, we determined that the carrying value of equipment classified as held for sale exceeded its fair value (based on quoted market prices form a used equipment dealer). Consequently, we recorded an impairment loss of $28,000 in restructuring expense in the 2011 Consolidated Statement of Operations.
Mattress Fabrics
During fiscal 2011, we determined that the carrying value of equipment classified as held for sale exceeded its fair value (based on quoted market prices). Consequently, we recorded an impairment loss of $10,000 in cost of sales in the 2011 Consolidated Statement of Net Income. During fiscal 2011, we received proceeds of $10,000 associated with sale of equipment classified as held for sale.
|
4.
|
ACCOUNTS RECEIVABLE
|
A summary of accounts receivable follows:
|
April 29,
2012
|
May 1,
2011
|
|||||||
|
(dollars in thousands)
|
$ | 26,100 | 21,562 | |||||
| customers | (567 | ) | (776 | ) | ||||
| allowance for doubtful accounts | (478 | ) | (577 | ) | ||||
|
reserve for returns and allowances and discounts
|
$ | 25,055 | 20,209 | |||||
A summary of the activity in the allowance for doubtful accounts follows:
|
(dollars in thousands)
|
2012
|
2011
|
2010
|
|||||||||
|
beginning balance
|
$ | (776 | ) | (1,322 | ) | (1,535 | ) | |||||
|
provision for bad debts
|
(67 | ) | 273 | (292 | ) | |||||||
|
write-offs, net of recoveries
|
276 | 273 | 505 | |||||||||
|
ending balance
|
$ | (567 | ) | (776 | ) | (1,322 | ) | |||||
A summary of the activity in the allowance for returns and allowances and discounts follows:
|
(dollars in thousands)
|
2012
|
2011
|
2010
|
|||||||||
|
beginning balance
|
$ | (577 | ) | (534 | ) | (442 | ) | |||||
|
provision for returns and allowances and discounts
|
(2,694 | ) | (2,236 | ) | (2,987 | ) | ||||||
|
credits issued
|
2,793 | 2,193 | 2,895 | |||||||||
|
ending balance
|
$ | (478 | ) | (577 | ) | (534 | ) | |||||
|
5.
|
INVENTORIES
|
A summary of inventories follows:
|
|
April 29,
|
May 1,
|
||||||
|
(dollars in thousands)
|
2012
|
2011
|
||||||
|
raw materials
|
$ | 5,534 | 6,130 | |||||
|
work-in-process
|
3,631 | 2,421 | ||||||
|
finished goods
|
27,208 | 20,172 | ||||||
| $ | 36,373 | 28,723 | ||||||
59
|
6.
|
PROPERTY, PLANT AND EQUIPMENT
|
A summary of property, plant and equipment follows:
|
depreciable lives
|
April 29,
|
May 1,
|
||||||||||
|
(dollars in thousands)
|
(in years)
|
2012
|
2011
|
|||||||||
|
land and improvements
|
0-10 | $ | 741 | 741 | ||||||||
|
buildings and improvements
|
7-40 | 12,566 | 11,966 | |||||||||
|
leasehold improvements
|
** | 801 | 451 | |||||||||
|
machinery and equipment
|
3-12 | 51,267 | 48,031 | |||||||||
|
office furniture and equipment
|
3-10 | 5,869 | 5,393 | |||||||||
|
capital projects in progress
|
1,062 | 786 | ||||||||||
| 72,306 | 67,368 | |||||||||||
|
accumulated depreciation and amortization
|
(41,027 | ) | (37,072 | ) | ||||||||
| $ | 31,279 | 30,296 | ||||||||||
** Shorter of life of lease or useful life.
At April 29, 2012, we had total amounts due regarding capital expenditures totaling $169,000, which pertain to outstanding vendor invoices, none of which are financed. The total outstanding amount of $169,000 is required to be paid in full in fiscal 2013.
At May 1, 2011, we had total amounts due regarding capital expenditures totaling $140,000, which pertain to outstanding vendor invoices, none of which are financed.
We did not finance any of our capital expenditures in fiscal 2012, 2011, and 2010.
We financed a $2.4 million equipment purchase with a capital lease obligation totaling $1.4 million in fiscal 2009. This capital lease was paid in full in fiscal 2010. The $1.4 million in equipment under capital leases is reflected in property, plant, and equipment in the accompanying consolidated balance sheets as of April 29, 2012 and May 1, 2011, respectively. Depreciation expense on the carrying value of $2.4 million associated with this capital lease obligation was $208,000 in each of fiscal 2012, 2011 and 2010, respectively.
7. GOODWILL
A summary of the change in the carrying amount of goodwill follows:
|
(dollars in thousands)
|
2012
|
2011
|
2010
|
|||||||||
|
beginning balance
|
$ | 11,462 | 11,462 | 11,593 | ||||||||
|
Bodet & Horst acquisition
|
- | - | (131 | ) | ||||||||
|
ending balance
|
$ | 11,462 | 11,462 | 11,462 | ||||||||
The goodwill balance relates to the mattress fabrics segment.
During the first quarter of fiscal 2010, we finalized our valuation of the fair values for the assets acquired and liabilities assumed regarding the purchase of the Bodet & Horst USA, LP and Bodet & Horst GMBH & Co. KG's (collectively "Bodet & Horst") knitted mattress fabric operation located in High Point, NC. As a result of this final valuation, we recorded an adjustment to increase the fair value of the non-compete agreement and reduce the fair value of the goodwill by $131,000.
60
|
8.
|
OTHER ASSETS
|
A summary of other assets follows:
|
April 29,
|
May 1,
|
|||||||
|
(dollars in thousands)
|
2012
|
2011
|
||||||
|
cash surrender value – life insurance
|
$ | 1,327 | 1,323 | |||||
|
non-compete agreements, net
|
333 | 480 | ||||||
|
other
|
247 | 249 | ||||||
| $ | 1,907 | 2,052 | ||||||
We recorded non-compete agreements in connection with the company’s asset purchase agreements with International Textile Group, Inc. (ITG) and Bodet & Horst at their fair values based on valuation techniques. These non-compete agreements pertain to our mattress fabrics segment. The non-compete agreement associated with ITG was amortized on a straight line basis over the four year life of the agreement that expired at the end of the third quarter of fiscal 2011. The non-compete agreement associated with Bodet & Horst is amortized on a straight-line basis over the six year life of the agreement and requires quarterly payments of $12,500 over the life of the agreement. As of April 29, 2012, the total remaining non-compete payments were $112,500.
At April 29, 2012 and May 1, 2011, the gross carrying amount of the non-compete agreements were $1.1 million and $1.0 million, respectively. At April 29, 2012 and May 1, 2011, accumulated amortization for these non-compete agreements was $741,000 and $544,000, respectively. Amortization expense for these non-compete agreements was $197,000, $413,000 and $501,000 in fiscal 2012, 2011 and 2010, respectively. The remaining amortization expense (which includes the total remaining Bodet & Horst non-compete payments of $112,500) for the next three fiscal years follows: FY 2013 – $198,000; FY 2014 – $198,000; and FY 2015 - $49,000. The weighted average amortization period for these non-compete agreements is 2.2 years as of April 29, 2012.
At April 29, 2012, and May 1, 2011, we had four life insurance contracts with death benefits to the respective insured totaling $12.9 million. Our cash surrender value – life insurance balances of $1.3 million at April 29, 2012, and May 1, 2011, respectively, are collectible upon death of the respective insured.
|
9.
|
ACCRUED EXPENSES
|
A summary of accrued expenses follows:
|
April 29,
|
May 1,
|
|||||||
|
(dollars in thousands)
|
2012
|
2011
|
||||||
|
compensation, commissions and related benefits
|
$ | 7,293 | 6,032 | |||||
|
interest
|
147 | 184 | ||||||
|
other
|
1,881 | 1,401 | ||||||
| $ | 9,321 | 7,617 | ||||||
|
10.
|
INCOME TAXES
|
Income Tax Expense and Effective Income Tax Rate
Total income tax expense (benefit) was allocated as follows:
|
(dollars in thousands)
|
2012
|
2011
|
2010
|
|||||||||
|
income from operations
|
$ | 902 | (1,102 | ) | 1,128 | |||||||
|
shareholders’ equity, related to
|
||||||||||||
|
the tax benefit arising from the
|
||||||||||||
|
exercise of stock options
|
(64 | ) | (339 | ) | (429 | ) | ||||||
| $ | 838 | (1,441 | ) | 699 | ||||||||
61
Income tax expense (benefit) attributable to income from operations consists of:
|
(dollars in thousands)
|
2012
|
2011
|
2010
|
|||||||||
|
current
|
||||||||||||
|
federal
|
$ | 79 | (79 | ) | (83 | ) | ||||||
|
state
|
- | - | - | |||||||||
|
foreign
|
2,505 | 2,367 | 1,359 | |||||||||
| 2,584 | 2,288 | 1,276 | ||||||||||
|
deferred
|
||||||||||||
|
federal
|
727 | 1,805 | 1,625 | |||||||||
|
state
|
55 | 142 | 129 | |||||||||
|
U.S. operating loss carryforwards
|
1,102 | 1,241 | 2,722 | |||||||||
|
foreign
|
143 | 89 | 138 | |||||||||
|
USD election for Canadian returns
|
- | (315 | ) | - | ||||||||
|
valuation allowance
|
(3,709 | ) | (6,352 | ) | (4,762 | ) | ||||||
| (1,682 | ) | (3,390 | ) | (148 | ) | |||||||
| $ | 902 | (1,102 | ) | 1,128 | ||||||||
Income before income taxes related to the company’s foreign operations for the years ended April 29, 2012, May 1, 2011, and May 2, 2010 was $10.5 million, $9.9 million, and $11.3 million, respectively. Income before income taxes related to the company’s domestic operations for the years ended April 29, 2012, May 1, 2011, and May 2, 2010 was $3.7 million, $5.2 million, and $3.0 million, respectively.
The following schedule summarizes the principal differences between the income tax expense (benefit) at the federal income tax rate and the effective income tax rate reflected in the consolidated financial statements:
|
2012
|
2011
|
2010
|
||||||||||
|
federal income tax rate
|
34.0 | % | 34.0 | % | 34.0 | % | ||||||
|
foreign tax rate differential
|
(8.8 | ) | (6.5 | ) | (6.4 | ) | ||||||
|
increase in tax reserves
|
6.1 | 8.8 | 9.7 | |||||||||
|
tax effects of Canadian fx gain (loss)
|
- | - | (11.6 | ) | ||||||||
|
undistributed earnings from foreign subsidiaries
|
- | - | 12.3 | |||||||||
|
non-deductible stock option expense
|
- | 1.0 | 0.9 | |||||||||
|
USD election for Canadian returns
|
- | (2.1 | ) | - | ||||||||
|
change in valuation allowance
|
(26.1 | ) | (42.2 | ) | (33.3 | ) | ||||||
|
other
|
1.2 | (0.3 | ) | 2.3 | ||||||||
| 6.4 | % | (7.3 | )% | 7.9 | % | |||||||
62
Deferred Income Taxes
The tax effects of temporary differences that give rise to significant portions of the deferred tax assets and liabilities consist of the following:
|
(dollars in thousands)
|
2012
|
2011
|
||||||
|
deferred tax assets:
|
||||||||
|
accounts receivable
|
$ | 301 | 425 | |||||
|
inventories
|
1,738 | 1,753 | ||||||
|
compensation
|
2,107 | 1,594 | ||||||
|
liabilities and other
|
523 | 509 | ||||||
|
alternative minimum tax credit
|
1,320 | 1,241 | ||||||
|
property, plant and equipment (1)
|
1,001 | 1,262 | ||||||
|
loss carryforwards – U.S.
|
23,472 | 23,303 | ||||||
|
loss carryforwards – foreign
|
115 | 28 | ||||||
|
unrecognized tax benefits – U.S.
|
(8,298 | ) | (7,572 | ) | ||||
|
valuation allowances
|
(12,797 | ) | (16,438 | ) | ||||
|
total deferred tax assets
|
9,482 | 6,105 | ||||||
|
deferred tax liabilities:
|
||||||||
|
property, plant and equipment (2)
|
(3,715 | ) | (2,225 | ) | ||||
|
other
|
(800 | ) | (659 | ) | ||||
|
total deferred tax liabilities
|
(4,515 | ) | (2,884 | ) | ||||
|
Net deferred tax asset
|
$ | 4,967 | 3,221 | |||||
|
(1)
|
Pertains to the company’s operations located in China.
|
|
(2)
|
Pertains to the company’s operations located in the U.S. and Canada.
|
Federal and state net operating loss carryforwards were $59.9 million with related future tax benefits of $23.5 million at April 29, 2012. These carryforwards principally expire in 14-17 years, fiscal 2025 through fiscal 2028. The company also has an alternative minimum tax credit carryforward of approximately $1.3 million for federal income tax purposes that does not expire.
At April 29, 2012, the current deferred tax asset of $2.5 million represents $2.1 million and $405,000 from our operations located in the U.S. and China, respectively. At April 29, 2012, the non-current deferred tax asset of $3.2 million represents $2.1 million, $1.0 million, and $115,000 from our operations located in the U.S., China, and Poland, respectively. At April 29, 2012, the non-current deferred tax liability of $705,000 pertains to our operations located in Canada.
At May 1, 2011, the current deferred tax asset of $293,000 pertains to our operations located in China. At May 1, 2011, the current deferred tax liability of $82,000 pertains to our operations located in Canada. At May 1, 2011, the non-current deferred tax asset of $3.6 million represents $2.3 million and $1.3 million from our operations located in the U.S. and China, respectively. At May 1, 2011, the non-current deferred tax liability of $596,000 pertains to our operations located in Canada.
Deferred Income Taxes – Valuation Allowance
Summary
In accordance with ASC Topic 740, we evaluate our deferred income taxes to determine if a valuation allowance is required. ASC Topic 740 requires that companies assess whether a valuation allowance should be established based on the consideration of all available evidence using a “more likely than not” standard with significant weight being given to evidence that can be objectively verified. Since the company operates in multiple jurisdictions, we assess the need for a valuation allowance on a jurisdiction-by-jurisdiction basis, taking into account the effects of local tax law. Based on this assessment, we recorded a partial valuation allowance of $12.8 million and $16.4 million against our net deferred tax assets associated with our U.S. operations at April 29, 2012 and May 1, 2011, respectively. At April 29, 2012 and May 1, 2011, no valuation allowance was recorded against our net deferred tax assets associated with our operations located in China and Poland.
63
United States
Our net deferred tax asset regarding our U.S. operations primarily pertain to incurring significant U.S. pre-tax losses over the last several years, with U.S. loss carryforwards totaling $59.9 million and $60.0 million at April 29, 2012 and May 1, 2011, respectively.
Fiscal 2011
Due to the favorable results of our multi-year restructuring process in our upholstery fabric operations and key acquisitions and capital investments made for our mattress fabric segment, on a cumulative three-year basis ending May 1, 2011, our U.S. operations earned a pre-tax income of $4.2 million. In addition, our U.S. operations reported a pre-tax income over fiscal years 2011 and 2010 totaling $8.2 million. We believed that fiscal years 2011 and 2010 were a more indicative measure of future pre-tax income as these fiscal years reflect operating performance after the cost savings of the profit-improvement and restructuring plans were realized and the full operational effects of the acquisitions associated with the company’s mattress fabric operations located in the U.S.
Although the financial results of our U.S. operations improved, the significant uncertainty in the overall economic climate made it very difficult to forecast medium and long-term financial results associated with our U.S. operations. Based on these economic conditions, we believed it was too uncertain to project pre-tax income associated with our U.S. operations after fiscal 2012.
Based on this significant positive and negative evidence, we recorded a partial valuation allowance of $16.4 million against our net deferred tax assets associated with our U.S. operations that was expected to reverse beyond fiscal 2012 and we recognized an income tax benefit of $2.3 million in the fourth quarter of fiscal 2011 for the reduction in this valuation allowance for projected U.S. taxable income in fiscal 2012 that was expected to reduce our U.S. loss carryforwards.
Fiscal 2012
This improvement in the U.S. operations' financial results continued through fiscal 2012. Our U.S. operations earned a cumulative pretax income through the second quarter of fiscal 2012 and fiscal years 2011 and 2010 totaling $10.0 million. This continued earnings improvement from our U.S. operations was driven by our mattress fabrics operations (which primarily resides in the U.S.). During the second quarter of fiscal 2012, our mattress fabrics operations had net sales totaling $35.2 million compared with $28.3 million in the second quarter of fiscal 2011. In addition, our mattress fabrics operations had operating income totaling $3.8 million in the second quarter of fiscal 2012 compared with $3.3 million in the second quarter of fiscal 2011. These improved results in the second quarter of fiscal 2012, which were better than expected, can be attributed to increased sales from our sales and marketing initiatives and new programs with customers who are leading suppliers in the bedding industry. Collectively these developments increased our confidence in forecasting U.S. taxable income through fiscal 2014 in the second quarter of fiscal 2012.
Although our U.S. operations' financial results continued to improve through the second quarter of fiscal 2012, the significant uncertainty in the overall economic climate also continued. As a result, to forecast medium and long-term financial results associated with our U.S. operations remained difficult. Since it will take a significant period of time for our U.S. operations to realize its U.S. net deferred income tax assets based on earned and forecasted U.S. pre-tax income levels, we believe it was too uncertain to project U.S. pre-tax income levels associated with our U.S. operations after fiscal 2014 that support a "more likely than not" assertion at the end of our second quarter of fiscal 2012.
64
These trends continued through the fourth quarter of fiscal 2012 and, as a result, we maintain our position that we can forecast U.S. taxable income through fiscal 2014. Our mattress fabric operations had net sales totaling $145.5 million in fiscal 2012 compared with $122.4 million in fiscal 2011. In addition our mattress fabric operations reported operating income of $15.8 million in fiscal 2012 compared with $15.4 million in fiscal 2011.
Based on this positive and negative evidence noted above, we recorded a partial valuation allowance of $12.8 million at April 29, 2012, against the net deferred tax assets associated with our U.S. operations that are expected to reverse beyond fiscal 2014. Accordingly, we recognized an income tax benefit of $4.4 million in the second quarter of fiscal 2012 for the reduction in this valuation allowance for estimated U.S. taxable income in fiscal years 2013 and 2014 that is expected reduce our U.S. loss carryfowards. In the fourth quarter of fiscal 2012, we booked an income tax charge of $211,000 due to a change in our estimate of U.S. taxable income in fiscal years 2013 and 2014 that was made in the second quarter of fiscal 2012.
China
Our net deferred tax asset regarding our China operations primarily pertains to the book versus tax basis difference associated with our China operation’s fixed assets. This book versus tax basis difference resulted from our impairment losses and fixed asset write-downs associated with our September 2008 upholstery fabrics restructuring plan. In order for this net deferred tax asset to have been realized, our China operations must have had sufficient pre-tax income levels to utilize its tax over book depreciation expense. During fiscal 2011, management assessed both positive and negative evidence and concluded that there was sufficient positive evidence that our net deferred tax assets regarding our China operations will more likely than not be realized. Due to the favorable results from our restructuring activities and profit improvement plan initiated in the second quarter of fiscal 2009, our China operations became profitable, reporting pre-tax income of $7.9 million in fiscal 2011 and fiscal 2010. In addition, our China operations earned pre-tax income of $10.2 million over a cumulative three-year period ending May 1, 2011. As a result of the improvement of our China operations’ pre-tax income levels that have been demonstrated over a cumulative period of three years, there was sufficient positive evidence that our China operations can provide sufficient pre-tax income levels to utilize its tax over book depreciation expense. Based on this significant positive evidence, we do not have a valuation allowance against our China net deferred tax assets at April 29, 2012 and May 1, 2011, respectively. During fiscal 2011 we recognized an income tax benefit of $1.3 million to reduce the valuation allowance of $1.3 million recorded at May 2, 2010 (the beginning of fiscal 2011).
Change in Valuation Allowance
In fiscal 2010, we recorded an income tax benefit of $4.8 million for the reduction of our valuation allowance. This $4.8 million decrease results from the realization of U.S. loss carryforwards associated with fiscal 2010 pre-tax income from our U.S. operations and the realization and projected realization of tax versus book depreciation associated with our China operations, as discussed above.
In fiscal 2011, we recorded an income tax benefit of $6.4 million for the reduction of our valuation allowance. This $6.4 million decrease represents a $2.8 million realization of U.S. loss carryforwards associated with fiscal 2011 pre-tax income, a $2.3 million adjustment pertaining to a change in judgment about the future realization of our U.S. net deferred tax assets, and a $1.3 million adjustment pertaining to a change in judgment about the future realization of our China net deferred tax assets.
65
In fiscal 2012, we recorded an income tax benefit of $3.7 million for the reduction of our valuation allowance. This $3.7 million decrease represents a $4.2 million income tax benefit pertaining to a change in judgment about the future realization of our U.S. net deferred tax assets, offset by an income tax charge of $447,000 associated with the realization of our U.S. loss carryforwards from fiscal 2012 pre-tax income.
Overall
The recorded valuation allowance of $12.8 million has no effect on our operations, compensation, loan covenant compliance, or the possible realization of the U.S. income tax loss carryforwards in the future. If it is determined that it is more-likely-than-not that we will realize any of these U.S. income tax loss carryforwards, an income tax benefit would be recognized at that time.
Uncertainty in Income Taxes
The following table sets forth the change in the company’s unrecognized tax benefit:
|
(dollars in thousands)
|
2012
|
2011
|
2010
|
|||||||||
|
beginning balance
|
$ | 11,739 | 10,135 | 8,254 | ||||||||
|
increases from prior period tax positions
|
852 | 1,799 | 1,940 | |||||||||
|
decreases from prior period tax positions
|
(129 | ) | (195 | ) | (59 | ) | ||||||
|
increases from current period tax positions
|
- | - | - | |||||||||
|
ending balance
|
$ | 12,462 | 11,739 | 10,135 | ||||||||
At April 29, 2012, we had $12.5 million of total gross unrecognized tax benefits, of which $4.2 million would favorably affect the income tax rate in future periods. At May 1, 2011, we had $11.7 million of total gross unrecognized tax benefits, of which $4.2 million would favorably affect the income tax rate in future periods.
As of April 29, 2012, we had $12.5 million of total gross unrecognized tax benefits, of which $8.3 million and $4.2 million were classified as net non-current deferred income taxes and income taxes payable-long-term, respectively, in the accompanying consolidated balance sheets. As of May 1, 2011, we had $11.7 million of total gross unrecognized tax benefits, of which $7.5 million and $4.2 million were classified as net non-current deferred income taxes and income taxes payable- long-term, respectively, in the accompanying consolidated balance sheets.
We elected to classify interest and penalties as part of income tax expense. At April 29, 2012 and May 1, 2011, the gross amount of interest and penalties due to unrecognized tax benefits was $485,000 and $498,000, respectively.
The liability for uncertain tax positions at April 29, 2012, includes $12.5 million related to tax positions for which significant change is reasonably possible in fiscal 2013. This amount relates to double taxation under applicable tax treaties with foreign tax jurisdictions. United States federal and state income tax returns filed by the company remain subject to examination for tax years 2002 and subsequent due to loss carryforwards. Canadian federal returns remain subject to examination for tax years 2005 and subsequent. Canadian provincial (Quebec) returns remain subject to examination for tax years 2009 and subsequent. Income tax returns for the company’s China subsidiaries are subject to examination for tax years 2007 and subsequent.
Income Taxes Paid
Income tax payments, net of income tax refunds, were $2.4 million in fiscal 2012, $1.2 million in 2011, and $1.3 million in 2010.
66
|
11.
|
|
A summary of long-term debt follows:
|
|
April 29,
|
May 1, | ||||||
|
(dollars in thousands)
|
2012
|
2011
|
||||||
|
unsecured senior term notes
|
$ | 8,800 | 11,000 | |||||
|
canadian government loan
|
323 | 547 | ||||||
| 9,123 | 11,547 | |||||||
|
current maturities of long-term debt
|
(2,404 | ) | (2,412 | ) | ||||
|
long-term debt, less current maturities
|
$ | 6,719 | 9,135 | |||||
Unsecured Term Notes
In connection with the Bodet & Horst acquisition, we entered into a note agreement dated August 11, 2008. This agreement provided for the issuance of $11.0 million of unsecured term notes with a fixed interest rate of 8.01% and a term of seven years. Principal payments of $2.2 million per year are due on the notes beginning August 11, 2011. The principal payments are payable over an average term of 3.3 years through August 11, 2015. Any principal prepayments will be assessed a penalty as defined in the agreement. The agreement contains customary financial and other covenants as defined in the agreement.
We made our first principal payment of $2.2 million associated with this note agreement on August 11, 2011.
Government of Quebec Loan
We have an agreement with the Government of Quebec for a term loan that is non-interest bearing and is payable in 48 equal monthly installments (denominated in Canadian dollars) that commenced on December 1, 2009. The proceeds were used to partially finance capital expenditures at our Rayonese facility located in Quebec, Canada.
Revolving Credit Agreement –United States
At May 1, 2011, we had an unsecured Amended and Restated Credit Agreement that provided for a revolving loan commitment of $6.5 million, including letters of credit up to $3.0 million. This agreement was set to expire August 15, 2012. On August 25, 2011, we entered into a seventeenth amendment to the Amended and Restated Credit Agreement, amending the agreement effective May 1, 2011 (end of our fiscal 2011). This amendment extends the expiration date of the line of credit through August 25, 2013, increasing the revolving loan commitment from $6.5 million to $10.0 million, and decreases the capital expenditure limit for fiscal years 2012 and 2013 from $10.0 million to $6.0 million. On January 17, 2012, and in connection with the Culp Europe Credit Agreement discussed below, we entered into an eighteenth amendment to decrease our revolving loan commitment from $10.0 million to $7.6 million.
The amended agreement provides for a pricing matrix to determine the interest rate payable on loans made under the agreement (applicable interest rate of 2.24% at April 29, 2012). As of April 29, 2012, there were no outstanding letters of credit. As of April 29, 2012 and May 1, 2011, there were no borrowings outstanding under the agreement.
67
Revolving Credit Agreement - China
We have an unsecured credit agreement for our Chinese operations that provides for a line of credit up to 40 million RMB (approximately $6.4 million USD at April 29, 2012). This agreement expires on September 2, 2012 and has an interest rate determined by the Chinese government. There were no borrowings under this agreement as of April 29, 2012 and May 1, 2011.
Revolving Credit Agreement - Europe
On January 17, 2012, we entered into an unsecured credit agreement associated with our operations in Poland that provides for a line of credit up to 6.8 million Polish Zloty (approximately $2.2 million in USD at April 29, 2012). This agreement expires on January 15, 2013 and bears interest at WIBOR (Warsaw Interbank Offered Rate) plus 2% (applicable interest rate of 6.85% interest rate at April 29, 2012). At April 29, 2012, $889,000 (2.8 million Polish Zloty) was outstanding under this agreement.
Overall
Our loan agreements require, among other things, that we maintain compliance with certain financial covenants. At April 29, 2012, the company was in compliance with these financial covenants.
The principal payment requirements for long-term debt during the next four fiscal years are: 2013 – $2.4 million; 2014 – $2.3 million; 2015 - $2.2 million; and 2016 – $2.2 million.
Interest paid during 2012, 2011, and 2010 totaled $817,000, $901,000, and $1.3 million, respectively.
|
12.
|
COMMITMENTS AND CONTINGENCIES
|
Operating Leases
We lease certain office, manufacturing and warehouse facilities and equipment under noncancellable operating leases. Lease terms related to real estate range from one to four years with renewal options for additional periods ranging up to nine years. The leases generally require the company to pay real estate taxes, maintenance, insurance and other expenses. Rental expense for operating leases was $2.2 million in fiscal 2012, $2.1 million in fiscal 2011, and $2.2 million in fiscal 2010. Future minimum rental commitments for noncancellable operating leases are $1.7 million in fiscal 2013; $1.0 million in fiscal 2014; $764,000 in fiscal 2015, $449,000 in fiscal 2016, and $24,000 in fiscal 2017. Management expects that in the normal course of business, these leases will be renewed or replaced by other operating leases.
On June 1, 2011, we amended our lease associated with our corporate headquarters building located in High Point, North Carolina. This amendment requires monthly payments of $29,706 from April 1, 2012 through March 31, 2016, plus a percentage of the building’s normal occupancy costs as defined in the agreement. This amendment contains renewal options as defined in the agreement for the periods from April 1, 2016 through March 31, 2019, April 1, 2019 through March 31, 2022, and April 1, 2022 through March 31, 2025.
In connection with the Bodet & Horst acquisition, we assumed the lease of the building where the operation was located. The lease is with a partnership owned by certain shareholders and officers of the company and their immediate families. This lease agreement is currently being negotiated and is payable at $12,704 per month until the agreement is finalized. Rents paid to entities owned by certain shareholders and officers of the company and their immediate families totaled $152,000 in each of fiscal 2012, 2011 and 2010.
68
Chattanooga, TN Lease Agreement
We leased a manufacturing facility in Chattanooga, Tennessee from Joseph E. Proctor d/b/a Jepco Industrial Warehouses (the “Landlord’) for a term of 10 years. This lease expired on April 30, 2008. We closed this facility approximately eight years ago and had not occupied the facility except to provide supervision and security. A $1.4 million lawsuit was filed by the Landlord on April 10, 2008, in the Circuit Court for Hamilton County, Tennessee to collect certain amounts due under the lease. During the third quarter of fiscal 2011, this lawsuit was concluded, which did not have a material impact on our results of operations and financial condition.
Chromatex Environmental Claim
A lawsuit was filed against us and other defendants (Chromatex, Inc., Rossville Industries, Inc., Rossville Companies, Inc. and Rossville Investments, Inc.) on February 5, 2008 in United States District Court for the Middle District of Pennsylvania. The plaintiffs are Alan Shulman, Stanley Siegel, Ruth Cherenson as Personal Representative of Estate of Alan Cherenson, and Adrienne Rolla and M.F. Rolla as Executors of the Estate of Joseph Byrnes. The plaintiffs were partners in a general partnership that formerly owned a manufacturing plant in West Hazleton, Pennsylvania (the “Site”). Approximately two years after this general partnership sold the Site to defendants Chromatex, Inc. and Rossville Industries, Inc., we leased and operated the Site as part of our Rossville/Chromatex division. The lawsuit involves court judgments that have been entered against the plaintiffs and against defendant Chromatex, Inc. requiring them to pay costs incurred by the United States Environmental Protection Agency (“USEPA”) responding to environmental contamination at the Site, in amounts approximating $8.6 million, plus unspecified future environmental costs. We understand that the USEPA’s costs now exceed $13 million, but are not expected to increase significantly in the future. Neither USEPA nor any other governmental authority has asserted any claim against us on account of these matters. The plaintiffs seek contribution from us and other defendants and a declaration that the company and the other defendants are responsible for environmental response costs under environmental laws and certain agreements. The plaintiffs also assert that we tortiously interfered with contracts between them and other defendants in the case and diverted assets to prevent the plaintiffs from being paid monies owed to them. We do not believe we have any liability for the matters described in this litigation and intend to defend ourselves vigorously. In addition, we have an indemnification agreement with certain other defendants in the litigation pursuant to which the other defendants agreed to indemnify us for any damages we incur as a result of the environmental matters that are the subject of this litigation, although it is unclear whether the indemnitors have significant assets at this time. Since the loss is not probable and cannot be estimated, no reserve has been recorded.
Other Litigation
The company is involved in legal proceedings and claims which have arisen in the ordinary course of business. These actions, when ultimately concluded and settled, will not, in the opinion of management, have a material adverse effect upon the financial position, results of operations or cash flows of the company.
Purchase Commitments
At April 29, 2012, and May 1, 2011, we had open purchase commitments to acquire equipment for our mattress fabrics segment totaling $1.2 million and $980,000, respectively.
69
|
13.
|
STOCK-BASED COMPENSATION
|
Equity Incentive Plan Description
On September 20, 2007, our shareholders approved an equity incentive plan entitled the Culp, Inc. 2007 Equity Incentive Plan (the “2007 Plan”). The types of equity based awards available for grant under the 2007 Plan include stock options, stock appreciation rights, restricted stock and restricted stock units, performance units, and other discretionary awards as determined by our Compensation Committee. An aggregate of 1,200,000 shares of common stock were authorized for issuance under the 2007 Plan. In conjunction with the approval of the 2007 Plan, our 2002 Stock Option Plan was terminated (with the exception of currently outstanding options) and no additional options will be granted under the 2002 Stock Plan. At April 29, 2012 there were 795,811 shares available for future equity based grants under the company’s 2007 Plan.
Stock Options
Under our 2007 Plan, employees, directors, and others associated with the company may be granted options to purchase shares of common stock at the fair market value on the date of grant. No options were granted to employees in fiscal 2012, 2011 or 2010, respectively.
No options were granted to outside directors during fiscal 2012 or 2011. During fiscal 2010, outside directors were granted 6,000 option shares. Options granted to outside directors vest immediately on the date of grant (October each fiscal year) and expire ten years after the date of grant.
The company recorded compensation expense of $134,000, $145,000, and $338,000 within selling, general, and administrative expense for incentive stock options in fiscal 2012, 2011, and 2010, respectively.
The fair value of stock options granted to outside directors at each grant date during fiscal 2010 was $4.44, using the following assumptions:
|
2012
|
2011
|
2010
|
||||||||||
|
Risk-free interest rate
|
- | - | 3.21 | % | ||||||||
|
Dividend yield
|
- | - | 0.00 | % | ||||||||
|
Expected volatility
|
- | - | 69.06 | % | ||||||||
|
Expected term (in years)
|
- | - | 10 | |||||||||
The fair value of the above option award was estimated on the date of grant using a Black-Scholes option-pricing model. The assumptions utilized in the model are evaluated and revised, as necessary, to reflect market conditions, actual historical experience, and groups of participants that have similar exercise patterns that are considered separately for valuation purposes. The risk-free interest rate for periods within the contractual life of the option was based on the U.S. Treasury yield curve in effect at the time of grant. The dividend yield is calculated based on the company’s annual dividend as of the option grant date. The expected volatility is derived using a term structure based on historical volatility and the volatility implied by exchange-traded options on the company’s common stock. The expected term of the options is based on the contractual term of the stock options, expected participant exercise and post-vesting employment termination trends.
70
The following table summarizes stock option activity for fiscal 2012, 2011, and 2010:
|
2012
|
2011
|
2010
|
||||||||||||||||||||||
|
Weighted-
|
Weighted-
|
Weighted-
|
||||||||||||||||||||||
|
Average
|
Average
|
Average
|
||||||||||||||||||||||
|
Exercise
|
Exercise
|
Exercise
|
||||||||||||||||||||||
|
Shares
|
Price
|
Shares
|
Price
|
Shares
|
Price
|
|||||||||||||||||||
|
outstanding at beginning
of year
|
268,875 | $ | 6.81 | 498,849 | $ | 5.87 | 735,765 | $ | 5.85 | |||||||||||||||
|
granted
|
- | - | - | - | 6,000 | 5.79 | ||||||||||||||||||
|
exercised
|
(59,400 | ) | 5.50 | (229,974 | ) | 4.77 | (144,916 | ) | 4.64 | |||||||||||||||
|
canceled/expired
|
- | - | - | - | (98,000 | ) | 7.56 | |||||||||||||||||
|
outstanding at end of year
|
209,475 | 7.22 | 268,875 | 6.81 | 498,849 | 5.87 | ||||||||||||||||||
|
Options Outstanding
|
Options Exercisable
|
|||||||||||||||||||||
|
Number
|
Weighted-Avg.
|
|
Number
|
|
||||||||||||||||||
|
Range of
|
Outstanding
|
Remaining
|
Weighted-Avg.
|
Exercisable
|
Weighted-Avg.
|
|||||||||||||||||
|
Exercise Prices
|
at 4/29/12
|
Contractual Life
|
Exercise Price
|
at 4/29/12
|
Exercise Price
|
|||||||||||||||||
| $ | 1.88 - $ 1.88 | 40,000 |
7.0
|
years | $ | 1.88 | 24,000 | $ | 1.88 | |||||||||||||
| $ | 4.59 - $ 5.41 | 6,000 | 3.8 | $ | 4.86 | 6,000 | $ | 4.86 | ||||||||||||||
| $ | 7.08 - $ 7.27 | 27,125 | 5.4 | $ | 7.12 | 17,125 | $ | 7.14 | ||||||||||||||
| $ | 8.75 - $ 10.11 | 136,350 | 4.6 | $ | 8.91 | 111,150 | $ | 8.94 | ||||||||||||||
| 209,475 | 5.1 | $ | 7.22 | 158,275 | $ | 7.52 | ||||||||||||||||
At April 29, 2012, outstanding options to purchase 158,275 shares were exercisable, had a weighted average exercise price of $7.52 per share, an aggregate intrinsic value of $558,000, and a weighted average contractual term of 4.8 years. At April 29, 2012, the aggregate intrinsic value for options outstanding was $802,000 with a weighted average contractual term of 5.1 years.
The aggregate intrinsic value for options exercised was $220,000, $1.1 million, and $982,000 in fiscal 2012, 2011, and 2010, respectively.
The remaining unrecognized compensation costs related to unvested awards at April 29, 2012 was $62,000 which is expected to be recognized over a weighted average period of 1 year.
Time Vested Restricted Stock Awards
On July 1, 2009 (fiscal 2010), two executive officers were granted 80,000 shares of time vested restricted common stock. This time vested restricted stock award vests in equal one-third installments on July 1, 2012, 2013, and 2014. The fair value (the closing price of the company’s common stock) of this restricted stock award is measured at the date of grant (July 1, 2009) and was $5.08 per share.
On January 7, 2009 (fiscal 2009), certain key management employees and a non-employee were granted 115,000 shares of time vested restricted common stock. Of these 115,000 shares, 105,000 and 10,000 were granted to employees and a non-employee, respectively. This time vested restricted stock award vests in equal one-third installments on May 1, 2012, 2013, and 2014. The fair value of this restricted stock award for key management employees is measured at the date of grant (January 7, 2009) and was $1.88 per share. The fair value of this restricted stock award for the non-employee is measured at the end of each reporting period and was $11.05 per share at April 29, 2012.
71
The following table summarizes the time vested restricted stock activity for fiscal 2012, 2011, and 2010:
|
|
2012
|
2011
|
2010
|
|||||||||
|
Shares
|
Shares
|
Shares
|
||||||||||
|
outstanding at beginning
of year
|
195,000 | 195,000 | 115,000 | |||||||||
|
granted
|
- | - | 80,000 | |||||||||
|
vested
|
(10,000 | ) | - | - | ||||||||
|
outstanding at end of year
|
185,000 | 195,000 | 195,000 | |||||||||
During fiscal 2012, 10,000 shares of time vested restricted stock were vested due to disability and had a weighted average fair value of $18,800 or $1.88 per share.
At April 29, 2012, there were 185,000 shares of time vested restricted stock and unvested. Of the 185,000 shares outstanding and unvested, 105,000 shares were granted on January 7, 2009 and 80,000 shares were granted on July 1, 2009. At April 29, 2012, the weighted average fair value of these outstanding and unvested shares was $3.76 per share. At May 1, 2011, there were 195,000 shares of time vested restricted stock outstanding and unvested. Of the 195,000 shares outstanding and unvested, 115,000 shares were granted on January 7, 2009 and 80,000 shares were granted on July 1, 2009. At May 1, 2011, the weighted average fair value of these outstanding and unvested shares was $3.61 per share.
At April 29, 2012, the remaining unrecognized compensation cost related to the unvested restricted stock awards was $164,000, which is expected to be recognized over a weighted average vesting period of 1.6 years.
We recorded compensation expense of $189,000, $172,000 and $174,000 within selling, general, and administrative expense for time vested restricted stock awards in fiscal 2012, 2011 and fiscal 2010, respectively.
Performance Based Restricted Stock Units
We did not grant any performance based restricted stock units during fiscal 2012, 2011, and 2010 respectively.
On January 7, 2009 (fiscal 2009), certain key management employees and a non-employee were granted 120,000 shares of performance based restricted stock units. This award contingently vested in one third increments, if in any discrete period of two consecutive quarters from February 2, 2009 through April 30, 2012, certain performance goals were met, as defined in the agreement. As of August 1, 2010 (our fiscal 2011), the performance goals as defined in the agreement were met and as a result, all of the performance based restricted stock units were vested.
The fair value (the closing price of the company’s common stock) of the performance based restricted stock units granted to key management employees was measured at the date of grant (January 7, 2009) and was $1.88 per share. The fair value (the closing price of the company’s common stock) of the performance based restricted stock units granted to a non-employee was measured at the earlier date of when the performance criteria was met or the end of the respective reporting period. The performance based restricted stock units granted to the non-employee vested in one-third increments on August 2, 2009, January 31, 2010, and August 1, 2010, and were measured at $6.59, $13.01, and $10.42 per share, respectively, which represented the closing price of the company’s common stock at the date on which the performance criteria was met.
72
We recorded compensation expense of $12,000 and $322,000 within selling, general, and administrative expense for performance based restricted stock units in fiscal 2011 and fiscal 2010 respectively. No compensation expense was recorded for performance based restricted stock units in fiscal 2012 as the performance based restricted stock units granted in fiscal 2009 were fully vested in fiscal 2011 and no performance based restricted stock units were granted in fiscal years 2010 through 2012.
Of the 120,000 vested shares, 105,000 and 15,000 shares pertained to key management employees and a non-employee, respectively. Of the 120,000 vested shares, 40,000 and 80,000 shares were vested in fiscal 2011 and 2010, respectively. The total fair value of the 40,000 performance based restricted stock units that vested during fiscal 2011 was $117,900 and had a weighted average grant date fair value of $2.95 per share. The total fair value of the 80,000 performance based restricted stock units that vested during fiscal 2010 was $230,000 and had a weighted average grant date fair value of $2.97 per share.
Common Stock Awards
On October 1, 2011, we granted a total of 3,075 shares of common stock to our board of directors. These shares of common stock vested immediately and were measured at $8.45 per share, which represents the closing price of the company’s common stock at the date of grant.
On October 1, 2010, we granted a total of 3,114 shares of common stock to our board of directors. These shares of common stock vested immediately and were measured at a fair value of $10.02 per share, which represents the closing price of our common stock at the date of grant.
We recorded $26,000 and $31,000 of compensation expense within selling, general, and administrative expense for these common stock awards for fiscal 2012 and 2011, respectively. There were not any common stock awards for fiscal 2010 and, therefore, no compensation was recorded for fully vested common stock awards for this fiscal year.
Other Share-Based Arrangements
The company had a stock-based compensation agreement with a non-employee that required us to settle in cash and was indexed by shares of our common stock as defined in the agreement. The cash settlement was based on a 30-day average closing price of our common stock at the time of payment. During fiscal 2011, this agreement was terminated and settled for a cash payment of $644,000 that was indexed on 68,260 shares of our common stock at $9.44 per share. The $9.44 per share represents the closing price of our common stock on the date this agreement was settled.
Effective May 2, 2011, we entered into an agreement in which we granted a non-employee a stock appreciation right that is indexed on 70,000 shares of our common stock. This agreement requires us to settle in cash an amount equal to $35,000, plus the excess, if any, over a stock appreciation right value of $700,000 at May 2, 2011. This stock appreciation right value of $700,000 represents the 70,000 indexed shares of common stock noted above measured at the closing price per share of $10.00 at May 2, 2011. The cash settlement in connection with the stock appreciation right value would represent the difference between a stock appreciation right value that is indexed on the 70,000 shares of common stock noted above and based on the highest closing price per share of our common stock for the period May 2, 2011 through June 30, 2012 (limited to $12.00 per share) and the $700,000 stock appreciate right value at May 2, 2011. This award will vest over the period May 2, 2011 through June 30, 2012 as this represents the non-employee’s required service period.
The fair value of this agreement was included in accrued expenses and was $134,000 at April 29, 2012. We recorded $134,000 of compensation expense within selling, general, and administrative expense for this agreement during fiscal 2012.
73
14. Fair Value of Financial Instruments
ASC Topic 820 establishes a fair value hierarchy that distinguishes between assumptions based on market data (observable inputs) and the company’s assumptions (unobservable inputs). Determining where an asset or liability falls within that hierarchy depends on the lowest level input that is significant to the fair value measurement as a whole. An adjustment to the pricing method used within either level 1 or level 2 inputs could generate a fair value measurement that effectively falls in a lower level in the hierarchy. The hierarchy consists of three broad levels as follows:
Level 1 – Quoted market prices in active markets for identical assets or liabilities;
Level 2 – Inputs other than level 1 inputs that are either directly or indirectly observable, and
Level 3 – Unobservable inputs developed using the company’s estimates and assumptions, which reflect those that market participants would use.
The following table presents information about assets and liabilities measured at fair value on a recurring basis:
|
Fair value measurements at April 29, 2012 using:
|
||||||||||||||||
|
Quoted prices in
active markets
for identical
assets
|
Significant other
observable inputs
|
Significant
unobservable
inputs
|
||||||||||||||
|
(amounts in thousands)
|
Level 1
|
Level 2
|
Level 3
|
Total
|
||||||||||||
|
Assets:
|
||||||||||||||||
|
Limited Term Bond Fund
|
$ | 2,049 | N/A | N/A | $ | 2,049 | ||||||||||
|
Low Duration Bond Fund
|
2,037 | N/A | N/A | 2,037 | ||||||||||||
|
Intermediate Term Bond Fund
|
1,058 | N/A | N/A | 1,058 | ||||||||||||
|
Fair value measurements at May 1, 2011 using:
|
||||
|
Quoted prices in
active markets
for identical
assets
|
Significant other
observable inputs
|
Significant
unobservable
inputs
|
||
|
(amounts in thousands)
|
Level 1
|
Level 2
|
Level 3
|
Total
|
|
Assets:
|
||||
|
Low Duration Bond Fund
|
$ 1,003
|
N/A
|
N/A
|
$ 1,003
|
The determination of where an asset or liability falls in the hierarchy requires significant judgment. We evaluate our hierarchy disclosures each quarter based on various factors and it is possible that an asset or liability may be classified differently from quarter to quarter. However, we expect that changes in classifications between different levels will be rare.
The fair value of the company’s long-term debt is estimated by discounting the future cash flows at rates currently offered to the company for similar debt instruments of comparable maturities. At April 29, 2012, the carrying value of the company’s long-term debt was $9.1 million and the fair value was $8.1 million. At May 1, 2011, the carrying value of the company’s long-term debt was $11.5 million and the fair value was $10.2 million.
74
|
15.
|
DERIVATIVES
|
In accordance with the provisions of ASC Topic 815, Derivatives and Hedging, our Canadian dollar foreign exchange contract was designated as a cash flow hedge, with the fair value of these financial instruments recorded in other assets and changes in fair value recorded in accumulated other comprehensive income. ASC Topic 815 requires disclosure of gains and losses on derivative instruments in the following tabular format.
| (Amounts in Thousands) | ||||||||||
|
Fair Values of Derivative Instruments As of,
|
||||||||||
|
April 29, 2012
|
May 1, 2011
|
|||||||||
|
Derivatives designated as hedging instruments under ASC Topic 815
|
Balance
Sheet
Location
|
Fair
Value
|
Balance
Sheet
Location
|
Fair
Value
|
||||||
|
None
|
Other Assets
|
$-
|
Other Assets
|
$-
|
||||||
|
Derivatives in ASC Topic 815 Net Investment Hedging Relationships
|
Amt of Gain (Loss) (net of tax) Recognized in OCI on Derivative (Effective Portion) and recorded in Other assets and Accrued Expenses at Fair Value
|
Location of Gain or (Loss) Reclassified from Accumulated OCI into Income
(Effective Portion)
|
Amount of Gain or (Loss) Reclassified from Accumulated OCI into Income (Effective Portion)
|
Location of Gain or (Loss) Recognized in Income on Derivative (Ineffective Portion and Amount Excluded from Effectiveness Testing)
|
Amount of Gain (loss) (net of tax) Recognized in Income on Derivative (Ineffective Portion and Amount Excluded from Effectiveness Testing)
|
|||||||||||||||||||||||||||||||||
|
2012
|
2011
|
2010
|
2012
|
2011
|
2010
|
2012
|
2011
|
2010
|
||||||||||||||||||||||||||||||
|
|
||||||||||||||||||||||||||||||||||||||
|
Canadian Dollar Foreign Exchange Contract
|
$ | - | $ | (103 | ) | $ | 83 |
Other Exp
|
$ | - | $ | 5 | $ | 15 |
Other Exp
|
$ | - | $ | 79 | $ | - | |||||||||||||||||
Canadian Dollar Foreign Exchange Rate
On January 21, 2009, we entered into a Canadian dollar foreign exchange contract to mitigate the risk of foreign exchange rate fluctuations associated with our loan from the Government of Quebec. The agreement effectively converted the Canadian dollar principal payments at a fixed Canadian dollar foreign exchange rate compared with the United States dollar of 1.218 and was due to expire on November 1, 2013. During the first quarter of fiscal 2011, we elected to terminate this contract due to the favorable Canadian dollar foreign exchange rates in comparison to the fixed contractual rate noted above.
75
|
16.
|
NET INCOME PER SHARE
|
Basic net income per share is computed using the weighted-average number of shares outstanding during the period. Diluted net income per share uses the weighted-average number of shares outstanding during the period plus the dilutive effect of stock-based compensation calculated using the treasury stock method. Weighted average shares used in the computation of basic and diluted net income per share are as follows:
|
(in thousands)
|
2012
|
2011
|
2010
|
|||||||||
|
weighted-average common
shares outstanding, basic
|
12,711 | 12,959 | 12,709 | |||||||||
|
dilutive effect of stock-based compensation
|
155 | 259 | 348 | |||||||||
|
weighted-average common
shares outstanding, diluted
|
12,866 | 13,218 | 13,057 | |||||||||
Options to purchase 24,750 shares of common stock were not included in the computation of diluted net loss per share for fiscal 2012 as the exercise price of the options were greater than the average market price of the common shares.
All options to purchase shares of common stock were included in the computation of diluted net income for fiscal 2011 and 2010, as the exercise price of the options was less than the average market price of common shares.
|
17.
|
BENEFIT PLANS
|
The company has defined contribution plans which cover substantially all employees and provides for participant contributions on a pre-tax basis and matching contributions by the company for its U.S. and Canadian operations. Our contributions to the plan were $606,000, $543,000, and $515,000 in fiscal 2012, 2011, and 2010, respectively.
In addition to the defined contribution plan, we have a nonqualified deferred compensation plan covering officers and certain other associates. The plan provides for participant deferrals on a pre-tax basis and non-elective contributions made by the company. Our contributions to the plan were $132,000 for fiscal 2012, $120,000 for fiscal 2011, and $68,000 for fiscal 2010, respectively. Our nonqualified deferred compensation plan liability of $1.7 million and $1.4 million at April 29, 2012, and May 1, 2011, respectively, and is included in accrued expenses in the Consolidated Balance Sheets.
76
|
18.
|
SEGMENT INFORMATION
|
The company’s operations are classified into two business segments: mattress fabrics and upholstery fabrics. The mattress fabrics segment manufactures and sells fabrics to bedding manufacturers. The upholstery fabrics segment manufactures and sells fabrics primarily to residential and commercial (contract) furniture manufacturers.
Net sales denominated in U.S. dollars accounted for 86%, 83% and 84% of total consolidated net sales in 2012, 2011, and 2010, respectively. International sales accounted for 21%, 22% and 22% of net sales in 2012, 2011, and 2010, respectively, and are summarized by geographic area as follows:
|
(dollars in thousands)
|
2012
|
2011
|
2010
|
|||||||||
|
north america (excluding USA)
|
$ | 10,417 | 10,505 | 11,654 | ||||||||
|
far east and asia
|
38,279 | 36,587 | 31,856 | |||||||||
|
all other areas
|
5,353 | 1,502 | 2,546 | |||||||||
| $ | 54,049 | 48,594 | 46,056 | |||||||||
The company evaluates the operating performance of its segments based upon income from operations before restructuring and related charges (credits), certain unallocated corporate expenses, and other non-recurring items. Cost of sales in both segments include costs to manufacture or source our products, including costs such as raw material and finished goods purchases, direct and indirect labor, overhead and incoming freight charges. Unallocated corporate expenses primarily represent compensation and benefits for certain executive officers and all costs related to being a public company. Segment assets include assets used in operations of each segment and primarily consist of accounts receivable, inventories, and property, plant, and equipment. The mattress fabrics segment also includes in segment assets, assets held for sale, goodwill, and non-compete agreements associated with certain acquisitions. The upholstery fabrics segment also includes assets held for sale in segment assets.
77
Statements of operations for the company’s operating segments are as follows:
|
(dollars in thousands)
|
2012
|
2011
|
2010
|
|||||||||
|
net sales:
|
||||||||||||
|
upholstery fabrics
|
$ | 108,924 | 94,375 | 91,568 | ||||||||
|
mattress fabrics
|
145,519 | 122,431 | 114,848 | |||||||||
| $ | 254,443 | 216,806 | 206,416 | |||||||||
|
gross profit:
|
||||||||||||
|
upholstery fabrics
|
$ | 14,984 | 13,592 | 15,183 | ||||||||
|
mattress fabrics
|
24,825 | 23,248 | 23,652 | |||||||||
|
total segment gross profit
|
39,809 | 36,840 | 38,835 | |||||||||
|
other non-recurring charges
|
(77 | ) (1) | - | (58 | ) (3) | |||||||
| $ | 39,732 | 36,840 | 38,777 | |||||||||
|
(dollars in thousands)
|
2012 | 2011 | 2010 | |||||||||
|
selling, general, and administrative expenses:
|
||||||||||||
|
upholstery fabrics
|
$ | 11,453 | 9,233 | 9,227 | ||||||||
|
mattress fabrics
|
9,061 | 7,875 | 8,178 | |||||||||
|
unallocated corporate
|
4,512 | 3,961 | 5,400 | |||||||||
|
total selling, general, and administrative
|
||||||||||||
|
expenses
|
$ | 25,026 | 21,069 | 22,805 | ||||||||
|
Income from operations:
|
||||||||||||
|
upholstery fabrics
|
$ | 3,531 | 4,359 | 5,956 | ||||||||
|
mattress fabrics
|
15,764 | 15,373 | 15,474 | |||||||||
|
total segment income from operations
|
19,295 | 19,732 | 21,430 | |||||||||
|
unallocated corporate expenses
|
(4,512 | ) | (3,961 | ) | (5,400 | ) | ||||||
|
other non-recurring charges
|
(77 | ) (1) | (28 | ) (2) | 312 | (4) | ||||||
|
total income from operations
|
14,706 | 15,743 | 16,342 | |||||||||
|
interest expense
|
(780 | ) | (881 | ) | (1,314 | ) | ||||||
|
interest income
|
508 | 240 | 116 | |||||||||
|
other expense
|
(236 | ) | (40 | ) | (828 | ) | ||||||
|
income before income taxes
|
$ | 14,198 | 15,062 | 14,316 | ||||||||
|
(1)
|
The $77 represents employee termination benefits associated with our Anderson, SC plant facility. This charge was recorded in cost of sales in the 2012 Consolidated Statement of Net Income and relates to the upholstery fabrics segment.
|
|
(2)
|
The $28 represents an impairment charge related to equipment that is classified as held for sale, a charge of $24 for lease termination and other exit costs, offset by a credit of $14 for employee termination benefits, and a credit of $10 for sales proceeds received on equipment with no carrying value. This charge was recorded in restructuring expense in the 2011 Consolidated Statement of Net Income and relates to the upholstery fabrics segment.
|
|
(3)
|
The $58 represents a restructuring related charge of $108 for other operating costs associated with closed plant facilities, offset by a credit of $50 for the sale of inventory previously reserved for. This charge was recorded in cost of sales in the 2010 Consolidated Statement of Net Income and relates to the upholstery fabrics segment.
|
|
(4)
|
The $312 represents a restructuring credit of $186 for employee termination benefits, a credit of $170 for sales proceeds received on equipment with no carrying value, a credit of $50 for the sale of inventory previously reserved for, a credit of $14 for lease termination and other exit costs, offset by a charge of $108 for other operating costs associated with closed plant facilities. Of this total credit, a charge of $58 was recorded to cost of sales and a credit of $370 was recorded in restructuring credit in the 2010 Consolidated Statement of Net Income. This credit relates to the upholstery fabrics segment.
|
78
One customer within the upholstery fabrics segment represented 13%, 12%, and 12% of consolidated net sales in each of fiscal 2012, 2011, and 2010, respectively. Two customers within the mattress fabrics segment represented 22%, 23%, and 22% of consolidated net sales in fiscal 2012, 2011 and 2010, respectively. One customer within the upholstery fabrics segment represented 12% and 13% of net accounts receivable at April 29, 2012 and May 1, 2011, respectively. No customers within the mattress fabrics accounted for 10% or more of net accounts receivable as of April 29, 2012 or May 1, 2011.
Balance sheet information for the company’s operating segments follow:
|
(dollars in thousands)
|
2012
|
2011
|
2010
|
|||||||||
|
segment assets
|
||||||||||||
|
mattress fabrics
|
||||||||||||
|
current assets (5)
|
$ | 29,909 | 25,455 | 22,307 | ||||||||
|
assets held for sale
|
15 | 15 | 34 | |||||||||
|
non-compete agreements, net
|
333 | 480 | 843 | |||||||||
|
goodwill
|
11,462 | 11,462 | 11,462 | |||||||||
|
property, plant, and equipment
|
29,237 | (6) | 28,581 | (7) | 26,720 | (8) | ||||||
|
total mattress fabrics assets
|
$ | 70,956 | 65,993 | 61,366 | ||||||||
|
upholstery fabrics
|
||||||||||||
|
current assets (5)
|
$ | 31,519 | 23,477 | 23,517 | ||||||||
|
assets held for sale
|
- | 60 | 89 | |||||||||
|
property, plant, and equipment
|
1,124 | (9) | 967 | (10) | 989 | (11) | ||||||
|
total upholstery fabrics assets
|
$ | 32,643 | 24,504 | 24,595 | ||||||||
|
total segment assets
|
103,599 | 90,497 | 85,961 | |||||||||
|
non-segment assets
|
||||||||||||
|
cash and cash equivalents
|
25,023 | 23,181 | 18,295 | |||||||||
|
short-term investments
|
5,941 | 7,699 | 3,023 | |||||||||
|
income taxes receivable
|
- | 79 | 728 | |||||||||
|
deferred income taxes
|
5,672 | 3,899 | 474 | |||||||||
|
other current assets
|
1,989 | 2,376 | 1,698 | |||||||||
|
property, plant, and equipment
|
918 | (12) | 748 | (12) | 694 | (12) | ||||||
|
other assets
|
1,574 | 1,572 | 1,725 | |||||||||
|
total assets
|
$ | 144,716 | 130,051 | 112,598 | ||||||||
|
capital expenditures (13):
|
||||||||||||
|
mattress fabrics
|
$ | 4,875 | 5,714 | 6,600 | ||||||||
|
upholstery fabrics
|
512 | 311 | 481 | |||||||||
|
unallocated corporate
|
532 | 277 | 316 | |||||||||
| $ | 5,919 | 6,302 | 7,397 | |||||||||
|
depreciation expense
|
||||||||||||
|
mattress fabrics
|
$ | 4,275 | 3,820 | 3,458 | ||||||||
|
upholstery fabrics
|
590 | 552 | 552 | |||||||||
|
total segment depreciation expense
|
$ | 4,865 | 4,372 | 4,010 | ||||||||
|
(5)
|
Current assets represent accounts receivable and inventory.
|
|
(6)
|
The $29.2 million at April 29, 2012 represents property, plant, and equipment located in the U.S. of $21.2 million and located in Canada of $8.0 million. The increase in this segment’s property, plant, and equipment balance at April 29, 2012, compared with May 1, 2011 is primarily due to fiscal 2011 capital spending of $4.9 million, offset by depreciation expense of $4.3 million.
|
79
|
(7)
|
The $28.6 million at May 1, 2011, represents property, plant, and equipment located in the U.S. of $20.0 million and located in Canada of $8.6 million. The increase in this segment’s property, plant, and equipment balance at May 1, 2011 compared with May 2, 2010 is primarily due to fiscal 2011 capital spending of $5.7 million, offset by depreciation expense of $3.8 million.
|
|
(8)
|
The $26.7 million at May 2, 2010, represents property, plant, and equipment located in the U.S. of $18.8 million and located in Canada of $7.9 million.
|
|
(9)
|
The $1.1 million at April 29, 2012, represents property, plant, and equipment located in the U.S. of $837, located in China of $183, and located in Poland of $104.
|
|
(10)
|
The $967 at May 1, 2011, represents property, plant, and equipment located in the U.S. of $727, located in China of $184, and located in Poland of $56.
|
|
(11)
|
The $989 at May 2, 2010 represents property, plant, and equipment located in the U.S. of $887 and China of $102.
|
|
(12)
|
The $918, $748 and $694 balance at April 29, 2012, May 1, 2011 and May 2, 2010, represent property, plant, and equipment associated with unallocated corporate departments and corporate departments shared by both the mattress and upholstery fabric segments.
|
|
(13)
|
Capital expenditure amounts are stated on an accrual basis. See Consolidated Statement of Cash Flows for capital expenditure amounts on a cash basis.
|
|
19.
|
STATUTORY RESERVES
|
The company’s subsidiaries located in China are required to transfer 10% of their net income, as determined in accordance with the People’s Republic of China (PRC) accounting rules and regulations, to a statutory surplus reserve fund until such reserve balance reaches 50% of the company’s registered capital.
The transfer to this reserve must be made before distributions of any dividend to shareholders. As of April 29, 2012, the company’s statutory surplus reserve was $3.2 million, representing 10% of accumulated earnings and profits determined in accordance with PRC accounting rules and regulations. The surplus reserve fund is non-distributable other than during liquidation and can be used to fund previous years’ losses, if any, and may be utilized for business expansion or converted into share capital by issuing new shares to existing shareholders in proportion to their shareholding or by increasing the par value of the shares currently held by them provided that the remaining reserve balance after such issue is not less than 25% of the registered capital.
The company’s subsidiaries located in China can transfer funds to the parent company with the exception of the statutory surplus reserve of $3.2 million to assist with debt repayment, capital expenditures, and other expenses of the company’s business.
|
20.
|
COMPREHENSIVE INCOME
|
Comprehensive income is the total of net income and other changes in equity, except those resulting from investments by shareholders and distributions to shareholders not reflected in net income.
A summary of comprehensive income follows:
|
(dollars in thousands)
|
2012
|
2011
|
2010
|
|||||||||
|
net income
|
$ | 13,296 | 16,164 | 13,188 | ||||||||
|
unrealized gain on short-term investments
|
16 | - | - | |||||||||
|
(loss) gain on cash flow hedges, net of taxes
|
- | (103 | ) | 83 | ||||||||
| $ | 13,312 | 16,061 | 13,271 | |||||||||
80
21. CASH FLOW INFORMATION
During fiscal 2012, we did not have any non-cash investing and financing activities.
During fiscal 2011, 60,415 shares of common stock were surrendered to satisfy withholding tax liabilities and the cost of stock options exercised totaling $563,000. The shares surrendered to satisfy withholding tax liabilities were in connection with 110,500 and 40,000 shares of common stock issued related to the vesting of performance based units and stock option exercises, respectively.
During fiscal 2010, 20,658 shares of common stock were surrendered to satisfy withholding tax liabilities totaling $191,000 in connection with 80,000 shares of common stock issued and related to the vesting of performance based restricted stock units.
22. COMMON STOCK REPURCHASE PROGRAM
Fiscal 2012
On June 16, 2011, our board of directors authorized the expenditure of up to $5.0 million for the repurchase of shares of our common stock. Under the common stock repurchase program, shares may be purchased from time to time in open market transactions, block trades, and through plans established under the Securities Exchange Act Rule 10b5-1. The amount of shares purchased and the timing of such purchases will be based on working capital requirements, market and general business conditions and other factors including alternative investment opportunities. On August 29, 2011, our board of directors authorized the expenditure of an additional $2.0 million for a total authorization of $7.0 million, for the repurchase of shares of our common stock.
During fiscal 2012, we purchased 624,127 shares of our common stock at a cost of $5.4 million.
Fiscal 2013
On June 13, 2012, we announced that our board of directors approved a new authorization for us to acquire up to $5.0 million of our common stock. This action replaces the authorization to acquire up to $7.0 million of our common stock noted above.
23. QUARTERLY DIVIDEND PROGRAM
On June 13, 2012, we announced that our board of directors approved the payment of a quarterly cash dividend of $0.03 per share, to be paid on or about July 16, 2012, to shareholders of record as of the close of business on July 2, 2012. We anticipate paying a cash dividend each quarter, with expected payment dates in October, January, April, and July. Future dividend payments are subject to Board approval and may be adjusted at the Board’s discretion as business needs or market conditions change.
81
24. SUBSEQUENT EVENT
In order to expand our product offerings and keep pace with the changing customer demand trends within the bedding industry, we entered into a joint product development, sales and marketing agreement with A. Lava & Son Co. (Lava) on May 21, 2012. This agreement forms a new business named Culp-Lava Applied Sewn Solutions and will provide us the opportunity to enter the business of designing, producing, and marketing sewn mattress covers. As we enter the business of sewn mattress covers, we will be able to leverage our design capabilities and expand our product offerings from mattress fabrics to finished covers. In connection with this agreement, Lava will provide us with technical assistance and know-how for the start-up of the business and will work with us on the design, sales and marketing of sewn mattress covers.
As part of the agreement, the new business will be fully funded and 100% owned by us. We plan to establish a manufacturing facility located in the Southeastern U.S. that will be selected by us. As a result, we will have two mirrored manufacturing facilities to better serve our customer base and meet current and expected demand trends in the bedding industry. We will have responsibility for all operating control of the new business, including capital expenditures and production and operating costs. We are projecting capital expenditures to start the business to be approximately $500,000 for fiscal 2013, as sewn products are a different business than our current normal operations and do not require large investments in plant and equipment. Lava is not required to invest capital into the Company.
We are expecting production to start in the second quarter of fiscal 2013 with approximately 35 employees. Our plan is to let the market dictate our growth strategy and we feel it is important to enter this business gradually to protect our investment as we learn what types of products and volume meet demand trends.
82
|
SELECTED QUARTERLY DATA (UNAUDITED)
|
||||||||||||||||||||||||||||||||
|
fiscal
|
fiscal
|
fiscal
|
fiscal
|
fiscal
|
fiscal
|
fiscal
|
fiscal
|
|||||||||||||||||||||||||
|
2012
|
2012
|
2012
|
2012
|
2011
|
2011
|
2011
|
2011
|
|||||||||||||||||||||||||
|
(amounts in thousands)
|
4th
quarter
|
3rd
quarter
|
2nd
quarter
|
1st
quarter
|
4th
quarter
|
3rd
quarter
|
2nd
quarter
|
1st
quarter
|
||||||||||||||||||||||||
|
INCOME STATEMENT DATA
|
||||||||||||||||||||||||||||||||
|
net sales
|
$ | 75,711 | 60,450 | 58,013 | 60,270 | 60,363 | 51,652 | 48,879 | 55,912 | |||||||||||||||||||||||
|
cost of sales
|
62,013 | 51,939 | 49,367 | 51,392 | 49,080 | 43,413 | 41,270 | 46,203 | ||||||||||||||||||||||||
|
gross profit
|
13,698 | 8,511 | 8,646 | 8,878 | 11,283 | 8,239 | 7,609 | 9,709 | ||||||||||||||||||||||||
|
selling, general and administrative expenses
|
8,031 | 5,518 | 5,720 | 5,757 | 6,525 | 5,129 | 4,202 | 5,212 | ||||||||||||||||||||||||
|
restructuring expense (credit)
|
- | - | - | - | 28 | 7 | - | (6 | ) | |||||||||||||||||||||||
|
income from operations
|
5,667 | 2,993 | 2,926 | 3,121 | 4,730 | 3,103 | 3,407 | 4,503 | ||||||||||||||||||||||||
|
interest expense
|
190 | 181 | 188 | 220 | 222 | 224 | 225 | 210 | ||||||||||||||||||||||||
|
interest income
|
(121 | ) | (148 | ) | (110 | ) | (129 | ) | (96 | ) | (57 | ) | (49 | ) | (38 | ) | ||||||||||||||||
|
other expense (income)
|
104 | 83 | (15 | ) | 65 | (71 | ) | 28 | 30 | 53 | ||||||||||||||||||||||
|
income before income taxes
|
5,494 | 2,877 | 2,863 | 2,965 | 4,675 | 2,908 | 3,201 | 4,278 | ||||||||||||||||||||||||
|
income taxes
|
2,071 | 1,075 | (3,389 | ) | 1,145 | (1,315 | ) | 483 | (801 | ) | 531 | |||||||||||||||||||||
|
net income
|
$ | 3,423 | 1,802 | 6,252 | 1,820 | 5,990 | 2,425 | 4,002 | 3,747 | |||||||||||||||||||||||
|
depreciation
|
$ | 1,264 | 1,214 | 1,200 | 1,187 | 1,167 | 1,108 | 1,083 | 1,014 | |||||||||||||||||||||||
|
weighted average shares outstanding
|
12,513 | 12,536 | 12,733 | 13,061 | 13,030 | 13,005 | 12,932 | 12,870 | ||||||||||||||||||||||||
|
weighted average shares outstanding,
|
||||||||||||||||||||||||||||||||
|
assuming dilution
|
12,695 | 12,677 | 12,871 | 13,205 | 13,217 | 13,228 | 13,167 | 13,199 | ||||||||||||||||||||||||
|
PER SHARE DATA
|
||||||||||||||||||||||||||||||||
|
net income per share - basic
|
$ | 0.27 | 0.14 | 0.49 | 0.14 | 0.46 | 0.19 | 0.31 | 0.29 | |||||||||||||||||||||||
|
net income per share - diluted
|
0.27 | 0.14 | 0.49 | 0.14 | 0.45 | 0.18 | 0.30 | 0.28 | ||||||||||||||||||||||||
|
book value
|
7.00 | 6.73 | 6.59 | 6.17 | 6.06 | 5.61 | 5.42 | 5.13 | ||||||||||||||||||||||||
|
BALANCE SHEET DATA
|
||||||||||||||||||||||||||||||||
|
operating working capital (3)
|
$ | 30,596 | 31,418 | 28,216 | 28,399 | 23,921 | 25,992 | 26,000 | 24,710 | |||||||||||||||||||||||
|
property, plant and equipment, net
|
31,279 | 30,285 | 30,431 | 30,615 | 30,296 | 30,571 | 31,225 | 30,471 | ||||||||||||||||||||||||
|
total assets
|
144,716 | 131,457 | 127,124 | 129,307 | 130,051 | 113,877 | 111,908 | 113,097 | ||||||||||||||||||||||||
|
capital expenditures
|
2,326 | 1,068 | 1,019 | 1,506 | 899 | 453 | 1,868 | 3,082 | ||||||||||||||||||||||||
|
long-term debt, current maturities of long-term debt, and line of credit (1)
|
10,012 | 9,166 | 9,219 | 11,488 | 11,547 | 11,566 | 11,605 | 11,647 | ||||||||||||||||||||||||
|
shareholders' equity
|
89,000 | 85,371 | 84,097 | 81,351 | 80,341 | 74,100 | 71,504 | 67,126 | ||||||||||||||||||||||||
|
capital employed (2)
|
67,887 | 70,042 | 66,889 | 69,520 | 62,521 | 65,709 | 66,370 | 64,493 | ||||||||||||||||||||||||
|
RATIOS & OTHER DATA
|
||||||||||||||||||||||||||||||||
|
gross profit margin
|
18.1 | % | 14.1 | % | 14.9 | % | 14.7 | % | 18.7 | % | 16.0 | % | 15.6 | % | 17.4 | % | ||||||||||||||||
|
operating income margin
|
7.5 | 5.0 | 5.0 | 5.2 | 7.8 | 6.0 | 7.0 | 8.1 | ||||||||||||||||||||||||
|
net income margin
|
4.5 | 3.0 | 10.8 | 3.0 | 9.9 | 4.7 | 8.2 | 6.7 | ||||||||||||||||||||||||
|
effective income tax rate
|
37.7 | 37.4 | (118.4 | ) | 38.6 | (28.1 | ) | 16.6 | (25.0 | ) | 12.4 | |||||||||||||||||||||
|
Debt-to-total capital employed ratio (1)
|
14.7 | 13.1 | 13.8 | 16.5 | 18.5 | 17.6 | 17.5 | 18.1 | ||||||||||||||||||||||||
|
operating working capital turnover (3)
|
8.9 | 8.7 | 8.7 | 8.6 | 8.8 | 8.5 | 8.9 | 9.4 | ||||||||||||||||||||||||
|
days sales in receivables
|
29 | 31 | 25 | 26 | 30 | 28 | 28 | 28 | ||||||||||||||||||||||||
|
inventory turnover
|
7.5 | 6.2 | 6.0 | 6.0 | 7.3 | 6.2 | 5.5 | 6.4 | ||||||||||||||||||||||||
|
STOCK DATA
|
||||||||||||||||||||||||||||||||
|
stock price
|
||||||||||||||||||||||||||||||||
|
high
|
$ | 11.81 | 9.18 | 9.75 | 10.78 | 10.22 | 11.43 | 11.59 | 14.10 | |||||||||||||||||||||||
|
low
|
8.90 | 7.67 | 7.05 | 7.30 | 8.43 | 9.54 | 8.86 | 6.56 | ||||||||||||||||||||||||
|
close
|
11.05 | 9.10 | 8.65 | 8.92 | 10.08 | 9.79 | 10.14 | 10.42 | ||||||||||||||||||||||||
|
daily average trading volume (shares)
|
12.1 | 10.2 | 26.7 | 72.6 | 27.5 | 29.0 | 64.1 | 111.0 | ||||||||||||||||||||||||
|
(1)
|
Debt includes long-term debt, current maturities of long-term debt, and line of credit.
|
|
(2)
|
Capital employed represents long-term and current maturities of long-term debt, lines of credit, current and noncurrent deferred income tax liabilities, current and long-term income taxes payable, stockholders' equity, offset by cash and cash equivalents, short-term investments, current and noncurrent deferred income tax assets, and income taxes receivable.
|
|
(3)
|
Operating working capital for this calculation is accounts receivable and inventories, offset by accounts payable-trade and capital expenditures
|
83
ON ACCOUNTING AND FINANCIAL DISCLOSURE
During the three years ended April 29, 2012, there were no disagreements on any matters of accounting principles or practices or financial statement disclosures.
Evaluation of Disclosure Controls and Procedures
We have conducted an evaluation of the effectiveness of our disclosure controls and procedures as of April 29, 2012. This evaluation was conducted under the supervision and with the participation of management, including our Chief Executive Officer and Chief Financial Officer. Based upon that evaluation, we have concluded that these disclosure controls and procedures were effective, in all material respects, to ensure that information required to be disclosed in the reports filed by us and submitted under the Securities Exchange Act of 1934, as amended (the “Exchange Act”) is recorded, processed, summarized and reported as and when required. Further we concluded that our disclosure controls and procedures have been designed to ensure that information required to be disclosed in reports filed by us under the Exchange Act is accumulated and communicated to management, including our Chief Executive Officer and Chief Financial Officer, in a manner to allow timely decisions regarding the required disclosure.
Management’s Annual Report on Internal Control over Financial Reporting
Our management is responsible for establishing and maintaining adequate internal control over financial reporting. Internal control over financial reporting is a process to provide reasonable assurance regarding the reliability of our financial reporting for external purposes in accordance with generally accepted accounting principles. Internal control over financial reporting includes: (1) maintaining records that in reasonable detail accurately and fairly reflect the transactions and disposition of assets; (2) providing reasonable assurance that the transactions are recorded as necessary for preparation of financial statements, and that receipts and expenditures are made in accordance with authorizations of management and directors; and (3) providing reasonable assurance that unauthorized acquisition, use or disposition of assets that could have a material effect on financial statements would be prevented or detected on a timely basis. Because of its inherent limitations, internal control over financial reporting is not intended to provide absolute assurance that a misstatement of financial statements would be prevented or detected. Also, projections of any evaluation of effectiveness to future periods are subject to the risk that controls may become inadequate because of changes in conditions, or that the degree of compliance with the policies or procedures may deteriorate.
Management assessed the effectiveness of our internal control over financial reporting based on the criteria set forth by the Committee of Sponsoring Organizations of the Treadway Commission in Internal Control – Integrated Framework. Based on this assessment, management concluded that our internal control over financial reporting was effective at April 29, 2012.
Grant Thornton LLP, an independent registered public accounting firm, has audited the consolidated financial statements as of and for the years ended April 29, 2012, May 1, 2011 and May 2, 2010 and has audited the company’s effectiveness of internal controls over financial reporting as of April 29, 2012, as stated in their report, which is included in Item 8 hereof. During the quarter ended April 29, 2012, there were no changes in our internal control over financial reporting that have materially affected, or are reasonably likely to materially affect, our internal control over financial reporting.
84
REPORT OF INDEPENDENT REGISTERED PUBLIC ACCOUNTING FIRM
Board of Directors and Shareholders
Culp, Inc.
We have audited
Culp, Inc.’s (a North Carolina corporation)
internal control over financial reporting as of April 29, 2012, based on criteria established in Internal Control—Integrated Framework issued by the Committee of Sponsoring Organizations of the Treadway Commission (COSO). Culp, Inc.’s management is responsible for maintaining effective internal control over financial reporting and for its assessment of the effectiveness of internal control over financial reporting, included in the accompanying management’s annual report on internal control over financial reporting. Our responsibility is to express an opinion on Culp, Inc.’s internal control over financial reporting based on our audit.
We conducted our audit in accordance with the standards of the Public Company Accounting Oversight Board (United States). Those standards require that we plan and perform the audit to obtain reasonable assurance about whether effective internal control over financial reporting was maintained in all material respects. Our audit included obtaining an understanding of internal control over financial reporting, assessing the risk that a material weakness exists, testing and evaluating the design and operating effectiveness of internal control based on the assessed risk, and performing such other procedures as we considered necessary in the circumstances. We believe that our audit provides a reasonable basis for our opinion.
A company’s internal control over financial reporting is a process designed to provide reasonable assurance regarding the reliability of financial reporting and the preparation of financial statements for external purposes in accordance with generally accepted accounting principles. A company’s internal control over financial reporting includes those policies and procedures that (1) pertain to the maintenance of records that, in reasonable detail, accurately and fairly reflect the transactions and dispositions of the assets of the company; (2) provide reasonable assurance that transactions are recorded as necessary to permit preparation of financial statements in accordance with generally accepted accounting principles, and that receipts and expenditures of the company are being made only in accordance with authorizations of management and directors of the company; and (3) provide reasonable assurance regarding prevention or timely detection of unauthorized acquisition, use, or disposition of the company’s assets that could have a material effect on the financial statements.
Because of its inherent limitations, internal control over financial reporting may not prevent or detect misstatements. Also, projections of any evaluation of effectiveness to future periods are subject to the risk that controls may become inadequate because of changes in conditions, or that the degree of compliance with the policies or procedures may deteriorate.
In our opinion, Culp, Inc. maintained, in all material respects, effective internal control over financial reporting as of April 29, 2012, based on criteria established in Internal Control—Integrated Framework issued by COSO.
We also have audited, in accordance with the standards of the Public Company Accounting Oversight Board (United States), the consolidated balance sheets of Culp, Inc. and Subsidiaries as of April 29, 2012, and May 1, 2011, and the related consolidated statements of operations, shareholders’ equity and cash flows for each of the three years in the period ended April 29, 2012 and our report dated July 12, 2012 expressed an unqualified opinion.
/s/ GRANT THORNTON LLP
Charlotte, North Carolina
July 12, 2012
85
Pursuant to the Culp, Inc. 2007 Equity Incentive Plan (the “Plan”), on July 11, 2012, the Compensation Committee of our Board of Directors approved equity-based awards consisting of an aggregate of 60,000 restricted stock units, with each unit consisting of the right to receive one share of the common stock of the company based on attainment of certain performance targets, which could become two shares of stock if certain maximum performance targets are attained. These units will vest in an amount that depends upon the aggregate operating income excluding certain one-time or unusual items, of the company, or the division that employs the award recipient, during our next three fiscal years, and may vest in any amount from zero to twice the number of units awarded, depending on the amount of operating income earned in the three year period. The units will also vest in the target amounts for each award recipient upon a change in control or the termination of the recipient’s employment without cause or by reason of his death or disability. The number of units (and number of shares of common stock that would vest upon attainment of target operating income levels) include a grant of 21,840 units (maximum level of 43,680 shares) to Franklin N. Saxon, President and Chief Executive Officer, a grant of 17,160 units (maximum level of 34,320 shares) to Robert G. Culp, III, Chairman, and a grant of 11,200 units (maximum level of 22,400 shares) to Robert G. Culp, IV, President, Culp Home Fashions Division. The effective date of the grants is July 11, 2012. These awards are subject to a clawback feature providing that amounts earned pursuant to the awards be repaid to the company if reported financial results are subject to a material negative restatement such that the amount earned or vested would have been lower using the restated financial results. The grants are being made subject to the terms of the Plan and to the terms of Restricted Stock Agreements between Culp and each of the recipients.
Information with respect to executive officers and directors of the company is included in the company’s definitive Proxy Statement to be filed within 120 days after the end of the company’s fiscal year pursuant to Regulation 14A of the Securities and Exchange Commission, under the captions “Nominees, Directors and Executive Officers,” “Section 16(a) Beneficial Ownership Reporting Compliance,” “Corporate Governance – Code of Business Conduct and Ethics,” “Board Committees and Attendance – Audit Committee” which information is herein incorporated by reference.
Information with respect to executive compensation is included in the company’s definitive Proxy Statement to be filed within 120 days after the end of the company’s fiscal year pursuant to Regulation 14A of the Securities and Exchange Commission, under the captions “Executive Compensation” and “Compensation Committee Interlocks and Insider Participation” which information is herein incorporated by reference.
OWNERS AND MANAGEMENT AND RELATED STOCKHOLDER
MATTERS
Information with respect to the security ownership of certain beneficial owners and management is included in the company’s definitive Proxy Statement to be filed within 120 days after the end of the company’s fiscal year pursuant to Regulation 14A of the Securities and Exchange Commission, under the captions “Executive Compensation Plan Information” and “Voting Securities,” which information is herein incorporated by reference.
86
The following table sets forth information as of the end of fiscal 2012 regarding shares of the Company’s common stock that may be issued upon the exercise of equity awards previously granted and currently outstanding equity awards under the company’s equity incentive and stock option plans, as well as the number of shares available for the grant of equity awards that had not been granted as of that date.
EQUITY COMPENSATION PLAN INFORMATION
|
Plan Category
|
Number of securities to be
issued upon exercise of
outstanding options,
warrants and rights
|
Weighted-average exercise
price of outstanding
options, warrants and
rights
|
Number of securities
remaining available for
future issuance under
equity compensation plan
(excluding securities
reflected in column (a))
|
|
(a)
|
(b)
|
(c)
|
|
|
Equity compensation
plans approved by security
holders
|
209,475
|
$7.22
|
795,811
|
|
Equity compensation
plans not approved by
security holders
|
-
|
-
|
-
|
|
Total
|
209,475
|
$7.22
|
795,811
|
Information with respect to certain relationships and related transactions is included in the company’s definitive Proxy Statement to be filed within 120 days after the end of the company’s fiscal year pursuant to Regulation 14A of the Securities and Exchange Commission, under the captions “Corporate Governance – Director Independence” and “Certain Relationships and Related Transactions” which information is herein incorporated by reference.
Information with respect to accountants fees and services is included in the company’s definitive Proxy Statement to be filed within 120 days after the end of the company’s fiscal year pursuant to Regulation 14A of the Securities and Exchange Commission, under the caption “Fees Paid to Independent Registered Public Accounting Firm,” which information is herein incorporated by reference.
87
1. Consolidated Financial Statements
The following consolidated financial statements of Culp, Inc. and its subsidiaries are filed as part of this report.
|
Page of Annual
|
|
|
Report on
|
|
|
Item
|
Form 10-K
|
|
Reports of Independent Registered Public Accounting Firms
|
48
|
|
Consolidated Balance Sheets – April 29, 2012 and
|
|
|
May 1, 2011
|
49
|
|
Consolidated Statements of Net Income -
|
|
|
for the years ended April 29, 2012,
|
|
|
May 1, 2011 and May 2, 2010
|
50
|
|
Consolidated Statements of Shareholders’ Equity -
|
|
|
for the years ended April 29, 2012,
|
|
|
May 1, 2011 and May 2, 2010
|
51
|
|
Consolidated Statements of Cash Flows -
|
|
|
for the years ended April 29, 2012,
|
|
|
May 1, 2011 and May 2, 2010
|
52
|
|
Notes to Consolidated Financial Statements
|
53
|
All financial statement schedules are omitted because they are not applicable, or not required, or because the required information is included in the consolidated financial statements or notes thereto.
The following exhibits are attached at the end of this report, or incorporated by reference herein. Management contracts, compensatory plans, and arrangements are marked with an asterisk (*).
|
3(i)
|
Articles of Incorporation of the company, as amended, were filed as Exhibit 3(i) to the company’s Form 10-Q for the quarter ended July 28, 2002, filed September 11, 2002 (Commission File No. 001-12597), and are incorporated herein by reference.
|
|
3(ii)
|
Restated and Amended Bylaws of the company, as amended November 12, 2007 (Commission File No. 001-12597), were filed as Exhibit 3.1 to the company’s Form 8-K dated November 12, 2007, and are incorporated herein by reference.
|
|
10.1
|
2002 Stock Option Plan was filed as Exhibit 10(a) to the company’s Form 10-Q for the quarter ended January 26, 2003, filed on March 12, 2003 (Commission File No. 001-12597), and is incorporated herein by reference. (*)
|
88
|
10.2
|
Amended and Restated Credit Agreement dated as of August 23, 2002 among Culp, Inc. and Wachovia Bank, National Association, as Agent and as Bank, was filed as Exhibit 10(a) to the company’s Form10-Q for the quarter ended July 28, 2002, filed September 11, 2002 (Commission File No. 001-12597), and is incorporated herein by reference.
|
|
10.3
|
First Amendment to Amended and Restated Credit Agreement dated as of March 17, 2003 among Culp, Inc. and Wachovia Bank, National Association, as Agent and as Bank, was filed as exhibit 10(p) to the company’s Form 10-K for the year ended April 27, 2003, filed on July 28, 2003 (Commission File No. 001-12597), and is incorporated here by reference.
|
|
10.4
|
Second Amendment to Amended and Restated Credit Agreement dated as of June 3, 2003 among Culp, Inc. and Wachovia Bank, National Association, as Agent and as Bank, was filed as exhibit 10(q) to the company’s Form 10-K for the year ended April 27, 2003, filed on July 28, 2003 (Commission File No. 001-12597), and is incorporated here by reference.
|
|
10.5
|
Third Amendment to Amended and Restated Credit Agreement dated as of August 23, 2004 among Culp, Inc. and Wachovia Bank, National Association, as Agent and as Bank, was filed as Exhibit 10 to the Current Report on Form 8-K dated August 26, 2004 (Commission File No. 001-12597), and is incorporated herein by reference.
|
|
10.6
|
Fourth Amendment to Amended and Restated Credit Agreement dated as of December 7, 2004 among Culp, Inc. and Wachovia Bank, National Association, as Agent and as Bank, was filed as Exhibit 10(b) to the company’s Form 10-Q for the quarter ended October 31, 2004 (Commission File No. 001-12597), filed on December 9, 2004, and is incorporated here by reference.
|
|
10.7
|
Fifth Amendment to Amended and Restated Credit Agreement dated as of February 18, 2005 among Culp, Inc. and Wachovia Bank, National Association, as Agent and as Bank, was filed as Exhibit 99(c) to Current Report on Form 8-K dated February 18, 2005 (Commission File No. 001-12597), and is incorporated herein by reference.
|
|
10.8
|
Sixth Amendment to Amended and Restated Credit Agreement dated as of August 30, 2005 among Culp, Inc. and Wachovia Bank, National Association, as Agent and as Bank, was filed as Exhibit 99(c) to Current Report on Form 8-K dated August 30, 2005 (Commission File No. 001-12597), and is incorporated herein by reference.
|
|
10.9
|
Seventh Amendment to Amended and Restated Credit Agreement dated as of December 7, 2005 among Culp, Inc. and Wachovia Bank, National Association, as Agent and as Bank., was filed as Exhibit 10(c) to the company’s Form 10-Q for the quarter ended October 30, 2005, filed December 9, 2005 (Commission File No. 001-12597), and is incorporated herein by reference.
|
|
10.10
|
Eighth Amendment to Amended and Restated Credit Agreement dated as of January 29, 2006 among Culp, Inc. and Wachovia Bank, National Association, as Agent and as Bank., was filed as Exhibit 10(a) to the company’s Form 10-Q for the quarter ended January 29, 2006, filed March 10, 2006 (Commission File No. 001-12597), and is incorporated herein by reference.
|
|
10.11
|
Ninth Amendment to Amended and Restated Credit Agreement dated as of July 20, 2006 among Culp, Inc. and Wachovia Bank, National Association, as Agent and as Bank, was filed as Exhibit 10.1 to the company’s Form 8-K filed July 25, 2006, and is incorporated herein by reference.
|
|
10.12
|
Tenth Amendment to Amended and Restated Credit Agreement dated as of January 22, 2007 among Culp, Inc. and Wachovia Bank, National Association, as Agent and as Bank, was filed as Exhibit 10.3 to the company’s Form 8-K filed January 26, 2007, and is incorporated herein by reference.
|
|
10.13
|
Written description of compensation arrangement for non-employee directors.
|
89
|
10.14
|
Form of stock option agreement for options granted to executive officers pursuant to 2002 Stock Option Plan. This agreement was filed as Exhibit 10.1 to the company’s Form 10-Q for the quarter ended July 29, 2007, and is incorporated herein by reference. (*)
|
|
10.15
|
2007 Equity Incentive Plan was filed as Annex A to the company’s 2007 Proxy Statement, filed on August 14, 2007, and is incorporated herein by reference. (*)
|
|
10.16
|
Form of stock option agreement for options granted to non-employee directors pursuant to the 2007 Equity Incentive Plan. This agreement was filed as Exhibit 10.2 to the company’s Form 10-Q for the quarter ended October 28, 2007, and incorporated herein by reference. (*)
|
|
10.17
|
Form of change in control and noncompetition agreement. This agreement was filed as Exhibit 10.3 to the company’s Form 10-Q for the quarter ended October 28, 2007, and incorporated herein by reference. (*)
|
|
10.18
|
Twelfth Amendment to Amended and Restated Credit Agreement dated as of December 27, 2007 among Culp, Inc. and Wachovia Bank, National Association as Agent and as Bank, filed as Exhibit 10.1 to the company’s Form 8-K dated December 27, 2007, and incorporated herein by reference.
|
|
10.19
|
Form of stock option agreement for options granted to executive officers pursuant to the 2007 Equity Incentive Plan, filed as Exhibit 10.1 to the company’s Form 10-Q dated September 10, 2008, and incorporated herein by reference. (*)
|
|
10.20
|
Note Purchase Agreement among Culp, Inc., Mutual of Omaha Insurance Company and United Omaha Insurance Company dated August 11, 2008, filed as Exhibit 10.2 to the company’s Form 8-K dated August 11, 2008, and incorporated herein by reference.
|
|
10.21
|
Thirteenth Amendment to Amended and Restated Credit Agreement dated as of November 3, 2008 among Culp, Inc. and Wachovia Bank, National Association as Agent and as Bank, filed as Exhibit 10.1 to the company’s Form 8-K dated November 6, 2008, and incorporated herein by reference.
|
|
10.22
|
Restricted Stock Agreement between the company and Franklin N. Saxon on January 7, 2009 pursuant to the 2007 Equity Incentive Plan, filed as Exhibit 10.6 to the company’s Form 10-Q dated March 13, 2009, and incorporated herein by reference. (*)
|
|
10.23
|
Restricted Stock Agreement between the company and Robert G. Culp, IV on January 7, 2009 pursuant to the 2007 Equity Incentive Plan, filed as Exhibit 10.7 to the company’s Form 10-Q dated March 13, 2009, and incorporated herein by reference. (*)
|
|
10.24
|
Restricted Stock Agreement between the company and Kenneth R. Bowling on January 7, 2009 pursuant to the 2007 Equity Incentive Plan, filed as Exhibit 10.8 to the company’s Form 10-Q dated March 13, 2009, and incorporated herein by reference. (*)
|
|
10.25
|
Culp, Inc. Deferred Compensation Plan Scheduled for Selected Key Employees , filed as Exhibit 10.36 to the company’s Form 10-K dated July 16, 2009, and incorporated herein by reference. (*) |
|
10.26
|
Fourteenth Amendment to Amended and Restated Credit Agreement dated as of July 15, 2009 among Culp, Inc. and Wachovia Bank, National Association as Agent and as Bank, filed as Exhibit 10.37 to the company’s Form 10-K dated July 16, 2009, and incorporated herein by reference.
|
|
10.27
|
Sixteenth Amendment to Amended and Restated Credit Agreement dated August 13, 2010 among Culp, Inc. and Wells Fargo Bank, N.A., as Agent and Bank, was filed as Exhibit 10.1 to Current Report on Form 8-K dated August 19, 2010, and is incorporated herein by reference.
|
90
|
10.28
|
Seventeenth Amendment and Restated Credit Agreement dated as August 25, 2011 among Culp, Inc. and Wells Fargo Bank, N.A. was filed as Exhibit 10.1 to the company’s Form 10-Q for the quarter ended July 31, 2011 dated September 9, 2011, and is incorporated herein by reference.
|
| 10.29 | Written description of annual incentive plan |
|
21
|
List of subsidiaries of the company
|
|
23
|
Consent of Independent Registered Public Accounting Firm in connection with the registration statements of Culp, Inc. on Form S-8 (File Nos. 33-13310, 33-37027, 33-80206, 33-62843, 333-27519, 333-59512, 333-59514, 333-101805, 333-147663), dated March 20, 1987, September 18, 1990, June 13, 1994, September 22, 1995, May 21, 1997, April 26, 2001, April 25, 2001, December 12, 2002, and November 27, 2007 and on Form S-3 and S-3/A (File No. 333-141346).
|
|
24(a)
|
Power of Attorney of Patrick B. Flavin, dated July 12, 2012
|
|
24(b)
|
Power of Attorney of Kenneth R. Larson, dated July 12, 2012
|
|
24(c)
|
Power of Attorney of Kenneth W. McAllister, dated July12, 2012
|
|
31(a)
|
Certification of Principal Executive Officer Pursuant to Section 302 of Sarbanes-Oxley Act of 2002.
|
|
31(b)
|
Certification of Principal Financial Officer Pursuant to Section 302 of Sarbanes-Oxley Act of 2002.
|
|
32(a)
|
Certification of Chief Executive Officer Pursuant to Section 906 of Sarbanes-Oxley Act of 2002.
|
|
32(b)
|
Certification of Chief Financial Officer Pursuant to Section 906 of Sarbanes-Oxley Act of 2002.
|
|
101.INS
|
XBRL Instance Document
|
|
101.SCH
|
XBRL Taxonomy Extension Schema Document
|
|
101.CAL
|
XBRL Taxonomy Extension Calculation Linkbase Document
|
|
101.DEF
|
XBRL Taxonomy Extension Definition Linkbase Document
|
|
101.LAB
|
XBRL Taxonomy Extension Label Linkbase Document
|
|
101.PRE
|
XBRL Taxonomy Extension Presentation Linkbase Document
|
b) Exhibits:
The exhibits to this Form 10-K are filed at the end of this Form 10-K immediately preceded by an index. A list of the exhibits begins on page 93 under the subheading “Exhibit Index.”
c) Financial Statement Schedules:
None
91
Pursuant to the requirements of Section 13 of the Securities Exchange Act of 1934, CULP, INC. has caused this report to be signed on its behalf by the undersigned, thereunto duly authorized, on the 12
th
day of July 2012.
|
CULP, INC.
|
||
|
By /s/
|
Franklin N. Saxon
|
|
|
Franklin N. Saxon
|
||
|
Chief Executive Officer
|
||
|
(principal executive officer)
|
||
Pursuant to the requirements of the Securities Exchange Act of 1934, this report has been signed below by the following persons on behalf of the registrant and in the capacities indicated on the 12
h
day of July 2012.
|
/s/
|
Robert G. Culp, III
|
/s/
|
Kenneth R. Larson
*
|
|
Robert G. Culp, III
|
Kenneth R. Larson
|
||
|
(Chairman of the Board of Directors)
|
(Director)
|
||
|
/s/
|
Franklin N. Saxon
|
/s/
|
Kenneth R. Bowling
|
|
Franklin N. Saxon
|
Kenneth R. Bowling
|
||
|
Chief Executive Officer
|
Chief Financial Officer
|
||
|
(principal executive officer)
|
(principal financial officer)
|
||
|
(Director)
|
|||
|
/s/
|
Patrick B. Flavin
*
|
/s/
|
Thomas B. Gallagher, Jr.
|
|
Patrick B. Flavin
|
Thomas B. Gallagher, Jr.
|
||
|
(Director)
|
Corporate Controller
|
||
|
(principal accounting officer)
|
|||
|
/s/
|
Kenneth W. McAllister
*
|
||
|
Kenneth W. McAllister
|
|||
|
(Director)
|
|
*
|
By Kenneth R. Bowling, Attorney-in-Fact, pursuant to Powers of Attorney filed with the Securities and Exchange Commission.
|
92
| Exhibit Number |
Exhibit
|
|
| 10.13 |
Written description of Non-Employee Director Compensation
|
|
| 10.29 | Written description of annual incentive plan. | |
|
21
|
List of subsidiaries of the company
|
|
|
23
|
Consent of Independent Registered Public Accounting Firm in connection with the registration statements of Culp, Inc. on Form S-8 (File Nos. 33-13310, 33-37027, 33-80206, 33-62843, 333-27519, 333-59512, 333-59514, 333-101805, 333-147663), dated March 20, 1987, September 18, 1990, June 13, 1994, September 22, 1995, May 21, 1997, April 26, 2001, April 25, 2001, December 12, 2002, and November 27, 2007 and on Form S-3 and S-3/A (File No. 333-141346).
|
|
|
24(a)
|
Power of Attorney of Patrick B. Flavin, dated July 12, 2012
|
|
|
24(b)
|
Power of Attorney of Kenneth R. Larson, dated July 12, 2012
|
|
|
24(c)
|
Power of Attorney of Kenneth W. McAllister, dated July 12, 2012
|
|
|
31(a)
|
Certification of Principal Executive Officer Pursuant to Section 302 of Sarbanes-Oxley Act of 2002.
|
|
|
31(b)
|
Certification of Principal Financial Officer Pursuant to Section 302 of Sarbanes-Oxley Act of 2002.
|
|
|
32(a)
|
Certification of Chief Executive Officer Pursuant to Section 906 of Sarbanes-Oxley Act of 2002.
|
|
|
32(b)
|
Certification of Chief Financial Officer Pursuant to Section 906 of Sarbanes-Oxley Act of 2002.
|
|
|
101.INS
|
XBRL Instance Document
|
|
|
101.SCH
|
XBRL Taxonomy Extension Schema Document
|
|
|
101.CAL
|
XBRL Taxonomy Extension Calculation Linkbase Document
|
|
|
101.DEF
|
XBRL Taxonomy Extension Definition Linkbase Document
|
|
|
101.LAB
|
XBRL Taxonomy Extension Label Linkbase Document
|
|
|
101.PRE
|
XBRL Taxonomy Extension Presentation Linkbase Document
|
|
| 93 |
TABLE OF CONTENTS
Part 1Item 1. BusinessItem 1A. Risk FactorsItem 1B. Unresolved Staff CommentsItem 2. PropertiesItem 3. Legal ProceedingsItem 4. Mine Safety DisclosurePart IIItem 5. Market For The Registrant S Common Equity, RelatedItem 6. Selected Financial DataItem 7. Management S Discussion and Analysis OfItem 7A. Quantitative and Qualitative DisclosuresItem 8. Consolidated Financial StatementsItem 9. Changes in and Disagreements with AccountantsItem 9a(t). Controls and ProceduresItem 9B. Other InformationPart IIIItem 10. Directors, Executive Officers, and Corporate GovernanceItem 11. Executive CompensationItem 12. Security Ownership Of Certain BeneficialItem 13. Certain Relationships, Related Transactions, and Director IndependenceItem 14. Principal Accountant Fees and ServicesPart IVItem 15. Exhibits and Financial Statement SchedulesItem Form 10-k