CULP INC
10-Ks and 10-Qs
|
|
|
|
|
|
|
|
|
|
|
|
|
|
|
|
|
|
|
|
|
|
|
|
|
|
|
|
|
|
|
|
|
|
|
|
|
|
|
|
|
|
|
|
|
|
|
|
|
|
|
|
|
|
|
|
|
|
|
UNITED STATES
SECURITIES AND EXCHANGE COMMISSION
Washington, D.C. 20549
FORM 1O-K
ANNUAL REPORT PURSUANT TO SECTION 13 OR 15(d) OF
THE SECURITIES EXCHANGE ACT OF 1934
For the fiscal year ended April 29, 2018
Commission File No. 1-12597
CULP, INC.
(Exact name of registrant as specified in its charter)
|
NORTH CAROLINA
(State or other jurisdiction of
incorporation or other organization)
|
56-1001967
(I.R.S. Employer Identification No.)
|
|
1823 Eastchester Drive, High Point, North Carolina
(Address of principal executive offices)
|
27265
(zip code)
|
(336) 889-5161
(Registrant’s telephone number, including area code)
Securities registered pursuant to Section 12(b) of the Act:
|
Title of Each Class
|
Name of Each Exchange
On Which Registered
|
|
Common Stock, par value $.05/ Share
|
New York Stock Exchange
|
Securities registered pursuant to Section 12(g) of the Act: None
Indicate by check mark if the registrant is a well-known seasoned issuer, as defined in Rule 405 of the Securities Act. YES ☐ NO ☒
Indicate by check mark if the registrant is not required to file reports pursuant to Section 13 or Section 15(d) of the Securities Exchange Act of 1934. YES ☐ NO ☒
Indicate by check mark whether the registrant (1) has filed all reports required to be filed by Section 13 or 15(d) of the Securities Exchange Act of 1934 during the preceding 12 months and (2) has been subject to the filing requirements for at least the past 90 days. YES ☒ NO ☐
Indicate by check mark whether the registrant has submitted electronically and posted on its corporate Web site, if any, every Interactive Data File required to be submitted and posted pursuant to Rule 405 of Regulation S-T during the preceding 12 months (or for such shorter period that the registrant was required to submit and post such files). YES ☒ NO ☐
Indicate by check mark if disclosure of delinquent filers pursuant to Item 405 of Regulation S-K is not contained herein, and will not be contained, to the best of registrant’s knowledge, in definitive proxy or information statements incorporated by reference in Part III of this Form 10-K or any amendment to this Form 10-K. ☑
Indicate by check mark whether the registrant is a large accelerated filer, an accelerated filer, a non-accelerated filer, smaller reporting company, or an emerging growth company. See definition of “large accelerated filer, accelerated filer, smaller reporting company, and emerging growth company” in Rule 12b-2 of the Exchange Act. (Check one):
|
|
Large Accelerated Filer ☐
|
Accelerated Filer ☒
|
Non-Accelerated Filer ☐
|
|
|
Smaller Reporting Company ☐
|
Emerging Growth Company ☐
|
|
Indicate by check mark whether the registrant is a shell company (as defined in Rule 12b-2 of the Act). YES ☐ NO ☒
As of April 29, 2018, 12,450,276 shares of common stock were outstanding. As of October 29, 2017, the aggregate market value of the voting stock held by non-affiliates of the registrant on that date was $351,475,688 based on the closing sales price of such stock as quoted on the New York Stock Exchange (NYSE), assuming, for purposes of this report, that all executive officers and directors of the registrant are affiliates.
DOCUMENTS INCORPORATED BY REFERENCE
Portions of the registrant’s Proxy Statement to be filed pursuant to Regulation 14A of the Securities and Exchange Commission in connection with its Annual Meeting of Shareholders to be held on September 19, 2018 are incorporated by reference into Part III of this Form 10-K.
CULP, INC.
FORM 10-K REPORT
TABLE OF CONTENTS
|
Item No.
|
Page
|
||
|
PART I
|
|||
|
2
|
|||
|
4
|
|||
|
4
|
|||
|
6
|
|||
|
7
|
|||
|
7
|
|||
|
8
|
|||
|
9
|
|||
|
10
|
|||
|
11
|
|||
|
12
|
|||
|
12
|
|||
|
13
|
|||
|
13
|
|||
|
14
|
|||
|
14
|
|||
|
15
|
|||
|
15
|
|||
| 17 | |||
| 21 | |||
| 22 | |||
| 23 | |||
| 23 | |||
|
PART II
|
|||
| 23 | |||
| 26 | |||
| 27 | |||
| 53 | |||
| 54 | |||
| 95 | |||
| 95 | |||
| 97 | |||
|
Item No.
|
Page
|
|
|
PART III
|
||
|
97
|
||
|
97
|
||
|
97
|
||
|
98
|
||
|
98
|
||
|
PART IV
|
||
|
99
|
||
|
99
|
||
|
101
|
||
|
101
|
||
|
102
|
||
|
103
|
||
| 16. | Form 10-K Summary |
101
|
CAUTIONARY STATEMENT CONCERNING FORWARD-LOOKING INFORMATION
Parts I and II of this report contain “forward-looking statements” within the meaning of the federal securities laws, including the Private Securities Litigation Reform Act of 1995 (Section 27A of the Securities Act of 1933 and Section 27A of the Securities and Exchange Act of 1934). Such statements are inherently subject to risks and uncertainties. Further, forward-looking statements are intended to speak only as of the date on which they are made, and we disclaim any duty to update or alter such statements due to new information, future events or otherwise. Forward-looking statements are statements that include projections, expectations or beliefs about future events or results or otherwise are not statements of historical fact. Such statements are often but not always characterized by qualifying words such as “expect,” “believe,” “estimate,” “plan,” “project,” and their derivatives, and include but are not limited to statements about expectations for our future operations, production levels, sales, profit margins, profitability, operating income, capital expenditures, working capital levels, income taxes, SG&A or other expenses, pre-tax income, earnings, cash flow, and other performance measures, as well as any statements regarding potential acquisitions, future economic or industry trends or future developments. Factors that could influence the matters discussed in such statements include the level of housing starts and sales of existing homes, consumer confidence, trends in disposable income, general economic conditions, as well as our success in finalizing acquisition negotiations and integrating acquired businesses. Decreases in these economic indicators could have a negative effect on our business and prospects. Likewise, increases in interest rates, particularly home mortgage rates, and increases in consumer debt or the general rate of inflation, could affect us adversely. Changes in consumer tastes or preferences toward products not produced by us could erode demand for our products. Changes in the value of the U.S. dollar versus other currencies could affect our financial results because a significant portion of our operations are located outside the United States. Strengthening of the U.S. dollar against other currencies could make our products less competitive on the basis of price in markets outside the United States and strengthening of currencies in Canada and China can have a negative impact on our sales in the U.S. of products produced in those places. Also, economic and political instability in international areas could affect our operations or sources of goods in those areas, as well as demand for our products in international markets. Further information about these factors, as well as other factors that could affect our future operations or financial results and the matters discussed in forward-looking statements are included in the “Risk Factors” section of this report in Item 1A. A forward-looking statement is neither a prediction nor a guarantee of future events or circumstances, and those future events or circumstances may not occur.
PART 1
Culp, Inc. manufacturers, sources, and markets mattress fabrics and sewn covers used for covering mattresses and foundations and other bedding products; and upholstery fabrics, including cut and sewn kits, primarily used in production of upholstered furniture. The company competes in a fashion-driven business, and we strive to differentiate ourselves by placing sustained focus on product innovation and creativity. In addition, Culp places great emphasis on providing creative designs, along with excellent and dependable service to our customers. Our focused efforts to protect our financial strength have allowed us to maintain our position as a financially stable and trusted supplier of innovative fabrics to bedding and furniture manufacturers.
We believe Culp is the largest producer of mattress fabrics in North America and one of the largest marketers of upholstery fabrics for furniture in North America, measured by total sales. We have two operating segments — mattress fabrics and upholstery fabrics. The mattress fabrics business markets primarily knitted and woven fabrics, and sewn covers made from those fabrics, which are used in the production of bedding products, including mattresses, foundations, and mattress sets. The upholstery fabrics business markets a variety of fabric products that are used principally in the production of residential and commercial upholstered furniture, including sofas, recliners, chairs, loveseats, sectionals, sofa-beds and office seating, with the recent addition of window treatment products and installation services.
Culp markets a variety of fabrics in different categories to a global customer base, including fabrics produced at our manufacturing facilities and fabrics produced by other suppliers. As of the end of fiscal 2018, we had active production facilities located in North Carolina, Tennessee, and South Carolina; Quebec, Canada; Shanghai, China; and a joint venture facility in Haiti. We also source fabrics from other manufacturers, located primarily in China and Turkey, with almost all of those fabrics produced specifically for Culp and created by Culp designers. We operate distribution centers in North Carolina, Canada, and China to facilitate distribution of our products. Over the past decade, the portion of total company sales represented by fabrics produced outside of the U.S. and Canada has increased, while sales of goods produced in the U.S. have decreased. This trend is related primarily to the upholstery fabrics segment, where 94% of our sales in fiscal 2018 consisted of fabrics produced in Asia, while the mattress fabrics business remains mostly based in North America.
Total net sales in fiscal 2018 were $323.7 million. The mattress fabrics segment had net sales of $192.6 million (60% of total net sales), while the upholstery fabrics segment had net sales of $131.1 million (40% of total net sales).
During fiscal 2018, both segments continued to build upon strategic initiatives and structural changes that were implemented over the last several years. A number of steps were taken to consolidate and streamline operations, while adding capacity where necessary. The flexible manufacturing and sourcing platform created through these changes has allowed Culp to place a greater emphasis on product innovation and the introduction of new designs to keep current with industry trends. At the same time, it allows us to differentiate our products and respond to shifting demand trends. These efforts helped lead to an overall increase in net sales during fiscal 2018, even in the face of challenging industry conditions, with both business segments experiencing higher revenues for the year.
2
In addition to internal strategic actions, both business segments have made acquisitions to expand our product offering and enhance our ability to reach new customers and markets. The upholstery segment acquired Read Window Products, a window treatment company late in fiscal 2018, providing expanded capacity and additional capabilities for our growing hospitality business. Since the end of the fiscal year, our mattress fabrics division announced a definitive agreement to acquire a majority interest in eLuxury, an e-commerce company offering bedding accessories and home products direct to consumers. These acquisitions represent a continuation of our efforts to diversify our product offerings and expand the markets into which we sell those products, as industry demand from our traditional markets has been inconsistent during the past several years.
We have continued to experience positive responses from customers to our innovative designs and new products introduced during these years. An increasing percentage of our sales are now based on new product introductions. In 2018 the mattress fabrics segment launched Comfort Supply Company by Culp, a new marketing effort focusing on direct sales to retailers and providing products to the bedding accessories market. The upholstery fabrics segment has experienced strong demand for its new LiveSmart brand of performance fabrics.
In fiscal 2018, the mattress fabrics segment completed a number of strategic investments in capital projects and expansion initiatives that have been underway for several years. Investments have been targeted at expanding capacity, continuing improvements in service capabilities, maintaining a flexible approach to fabric sourcing, and dealing with challenging industry conditions. These expenditures included expansion projects to provide increased manufacturing capacity and more efficient equipment for this segment, following earlier successful acquisitions. The mattress fabrics segment significantly enhanced its efficiency and its distribution capabilities in both the U.S. and Canada during early fiscal 2018. This segment has also continued to expand its design capabilities with additional personnel, product software, and a new system for cataloguing designs to enhance innovation. Finally, the addition of eLuxury in fiscal 2019 is expected to expand the addressable market and add an important new sales channel for the mattress fabrics business.
The upholstery fabrics segment operates on a flexible variable cost model, with most of its fabrics now sourced in Asia. This division has focused its efforts in recent years on innovation in its products and exploration of new markets. This strategic focus helped lead to a 10% sales increase for upholstery fabrics in fiscal 2018, reversing a multi-year trend of sales declines. The acquisition of Read Window Products is another step in expanding our products and enhancing our capabilities, building upon an emphasis over the past several years to grow sales in the hospitality market. Our new line of performance fabrics has continued to perform very well, adding to our growth in upholstery fabric sales.
Additional information about trends and developments in each of our business segments is provided in the “Segments” discussion below.
3
Culp, Inc. was organized as a North Carolina corporation in 1972 and made its initial public offering in 1983. Since 1997, our stock has been listed on the New York Stock Exchange and traded under the symbol “CFI” until July 13, 2017, at which time the Company’s ticker symbol changed to “CULP.” Our fiscal year is the 52 or 53-week period ending on the Sunday closest to April 30. Our executive offices are located in High Point, North Carolina. References in this document to “Culp,” the “company,” “we,” “our,” and “us” refer to Culp, Inc. and its consolidated subsidiaries.
Culp maintains an internet website at www.culp.com. We will make this annual report and our other annual reports on Form 10-K, quarterly reports on Form 10-Q, current reports on Form 8-K and amendments to these reports available free of charge on our internet site as soon as reasonably practicable after such material is electronically filed with, or furnished to, the Securities and Exchange Commission. Information included on our website is not incorporated by reference into this annual report.
Our two operating segments are mattress fabrics and upholstery fabrics. The following table sets forth certain information for each of our segments.
|
Sales by Fiscal Year ($ in Millions) and Percentage of Total Company Sales
|
||||||||||||||||||||||||
|
Segment
|
Fiscal 2018
|
Fiscal 2017
|
Fiscal 2016
|
|||||||||||||||||||||
|
Mattress Fabrics
|
192.6
|
(60
|
%)
|
190.8
|
(62
|
%)
|
$
|
186.4
|
(60
|
%)
|
||||||||||||||
|
Upholstery Fabrics
|
||||||||||||||||||||||||
|
Non-U.S.-Produced
|
122.6
|
(38
|
%)
|
109.0
|
(35
|
%)
|
$
|
115.3
|
(37
|
%)
|
||||||||||||||
|
U.S.-Produced
|
8.5
|
(2
|
%)
|
9.7
|
(3
|
%)
|
$
|
11.2
|
(3
|
%)
|
||||||||||||||
|
Total Upholstery
|
131.1
|
(40
|
%)
|
118.7
|
(38
|
%)
|
$
|
126.5
|
(40
|
%)
|
||||||||||||||
|
Total company
|
323.7
|
(100
|
%)
|
309.5
|
(100
|
%)
|
$
|
312.9
|
(100
|
%)
|
||||||||||||||
Additional financial information about our operating segments can be found in Note 18 to the Consolidated Financial Statements included in Item 8 of this report.
Mattress Fabrics.
The mattress fabrics segment, also known as Culp Home Fashions, manufactures and markets mattress fabrics and mattress covers to bedding manufacturers. These products include woven jacquard fabrics, knitted fabrics, and some converted fabrics. Culp Home Fashions has manufacturing facilities located in Stokesdale and High Point, North Carolina, and St. Jerome, Quebec, Canada. The division also has a joint venture mattress cover facility in Haiti. The Stokesdale plant and the St. Jerome plant manufacture and finish knitted and jacquard (damask) fabric. Both of these facilities now offer finished goods distribution capabilities, with a new distribution facility in Canada added during fiscal 2017. The Stokesdale plant continues to house the division offices.
Culp Home Fashions had capital expenditures totaling $74 million during the past ten years with especially high spending levels during the past four fiscal years. These expenditures provided for increased knit machine capacity, faster and more efficient weaving machines, and the initial capital required for our sewn cover business, while also allowing us to maintain our leading edge technology through modernization and expansion projects. These capital expenditures also provided high technology finishing equipment for woven and knitted fabric and a much improved U.S. platform for warehousing and distribution, along with the new distribution facility in Canada noted above.
4
Asset acquisition transactions in fiscal 2009 and fiscal 2014 allowed us to enhance and secure our competitive position and to expand our mattress fabrics business. Taken together, the two transactions allowed us to secure our supply for knitted mattress fabrics, an important and growing product category, while also gaining control of product development and improving customer service. The transactions also involved consulting and non-compete agreements that enhanced our mattress fabrics product development and helped to secure our end-markets. In addition to these transactions, we have continued to make further investments in knitting machines and finishing equipment, increasing our internal production capacity.
Our sewn mattress cover business, established during fiscal 2013, participates in a joint marketing agreement for the production and marketing of sewn mattress covers and represents a further step in our efforts to respond to industry demands. The marketing venture is known as Culp-Lava Applied Sewn Solutions (CLASS) and is a joint marketing effort with A. Lava & Son Co. of Chicago (A Lava), a leading provider of mattress covers. This manufacturing operation, located near our other plants in North Carolina, involves leased space and a limited capital investment in equipment. Teaming with A Lava has allowed us to have two mirrored manufacturing facilities and greater flexibility in meeting demand for mattress covers from bedding producers. In fiscal 2017, in response to continued growth in mattress cover demand, we entered into a joint venture with A Lava to construct a second location for CLASS in Haiti, and that facility began production of mattress covers during the second quarter of 2018.
As noted above, fiscal 2018 marked the completion of several multi-year capital projects for the mattress fabrics business, including consolidating certain operations, expanding capacity, improving efficiency and customer service, and maintaining our flexible approach to fabric sourcing. The mattress fabrics division also established Comfort Supply Company by Culp during fiscal 2018, which focuses on sales of mattress pads and protectors, and related products. This platform provides a new outlet for direct sales to retailers for our bedding accessory products. In early fiscal 2019, we announced a majority interest investment in eLuxury, an online retailer of bedding accessories and home goods. The eLuxury investment represents our first foray into direct-to-consumer sales, adding a new sales channel and an expanded addressable market for our products. After completing significant projects to become more cost-effective and efficient in our traditional mattress fabrics business, these latest initiatives have increased the potential customer base and range of products we can sell compared to one year earlier.
Upholstery Fabrics.
The upholstery fabrics segment markets fabrics for residential and commercial furniture, including jacquard woven fabrics, velvets, micro denier suedes, woven dobbies, knitted fabrics, piece-dyed woven products, and polyurethane “leather look” fabrics. This segment currently operates fabric manufacturing facilities in Anderson, South Carolina; Knoxville, Tennessee; and Shanghai, China. We market fabrics produced in these three locations, as well as a variety of upholstery fabrics sourced from third party producers, mostly in China. In the past fiscal year, sales of non-U.S. produced upholstery accounted for approximately 94% of our upholstery fabric sales. Our China facilities near Shanghai include fabric sourcing, finishing, warehousing, quality control and inspection operations, as well as a plant where sourced fabrics are cut and sewn into “kits” made to specifications of furniture manufacturing customers. We continue to expand our marketing efforts to sell our China products in countries other than the U.S., including the Chinese local market. The U.S. facility in South Carolina produces a variety of woven upholstery fabrics, including velvets and certain decorative fabrics.
5
Our upholstery fabrics business has moved from one that relied on a large fixed capital base that is difficult to adjust to a more flexible and scalable marketer of upholstery fabrics that meets changing levels of customer demand and tastes. At the same time, we have maintained control of the most important “value added” aspects of our business, such as design, finishing, quality control, and logistics. This strategic approach has allowed us to limit our investment of capital in fixed assets and control the costs of our products, while continuing to leverage our design and finishing expertise, industry knowledge, and important relationships.
After six consecutive years of sales growth, sales declined in fiscal 2016 and 2017, mainly as a result of challenging demand conditions for upholstered furniture, before increasing by 10% in fiscal 2018. Our higher sales in fiscal 2018 were supported by our efforts to expand the breadth of this segment’s customer base to include more residential furniture manufacturers, including customers in international markets, as well as the growing success of our line of performance fabrics, such as LiveSmart. We believe our success over the longer term is due largely to a business strategy that has included: 1) innovation in a low- cost environment, 2) speed-to-market execution, 3) consistent quality, 4) reliable service and lead times, and 5) increased recognition of and reliance on the Culp brand.
Our progress has been achieved through a unique business model that has enabled the upholstery fabrics segment to execute a strategy that we believe is clearly differentiated from our competitors. In this way, we have maintained our ability to provide furniture manufacturers with products from every category of fabric used to cover upholstered furniture and meet continually changing demand levels and consumer preferences. In recent years, we have implemented additional steps to grow net sales, including an emphasis on markets beyond residential furniture, such as the hospitality market. One result of these efforts was the acquisition during fiscal 2018 of Read Window Products, a supplier of window treatments and other products for the hospitality and commercial industries. This acquisition represents a significant expansion of our production capabilities in the hospitality market, along with the addition of window treatment installation services.
Culp markets products primarily to manufacturers that operate in three principal markets. The mattress fabrics segment supplies the bedding industry, which produces mattress sets (mattresses, box springs, foundations and top of bed components). The upholstery fabrics segment supplies the residential furniture industry and, to a lesser extent, the commercial furniture industry. The residential furniture market includes upholstered furniture sold to consumers for household use, including sofas, sofa-beds, chairs, recliners, and sectionals. The commercial furniture and fabrics market includes fabrics used in the hospitality industry (primarily hotels and motels), upholstered office seating and modular office systems sold primarily for use in offices and other institutional settings, and commercial textile wall coverings. The principal industries into which the company sells products are described below. Currently, a great majority of our products are sold to manufacturers for end use in the U.S., and thus the discussions below are focused on that market.
6
The bedding industry has contracted and expanded in recent years in accordance with the general economy, although traditionally the industry has been relatively mature and stable. This is due in part to the fact that a majority of bedding industry sales are replacement purchases, which are less volatile than sales based on economic growth and new household formations. Until recently, the U.S. bedding industry has largely remained a North American-based business, with limited competition from imports. This dynamic has mainly been due to short lead times demanded by mattress manufacturers and retailers, the customized nature of product lines, the relatively low direct labor content in mattresses, and strong brand recognition. Imports of bedding into the U.S. had been increasing gradually in recent years, but this trend has significantly accelerated over the past year, especially for lower priced bedding. The result has been a decline in sales for the major U.S. bedding manufacturers, which has affected major suppliers, including Culp, to those manufacturers.
A key trend driving the bedding industry is increased awareness among consumers about the health benefits of better sleep, which has caused an increased focus on the quality of bedding products and an apparent willingness on the part of consumers to upgrade their bedding. Another important trend is the strong and growing emphasis on the design knitted or woven into mattress fabrics to appeal to the customer’s visual attraction and perceived value of the mattress on the retail floor. Mattress fabric design efforts are based on current trends in home decor and fashion. Another trend has been the growth in non- traditional sources for retail mattress sales such as internet and “bed in a box” sales, as well as wholesale warehouse clubs. These sales channels have the potential to increase overall consumption of goods due to convenience and high traffic volume, which in turn results in higher turnover of product. Among fabric types, knitted fabrics have continued to increase in popularity. Knitted fabric was initially used primarily on premium mattresses, but these products are now being placed increasingly on mattresses at mid-range to lower retail price points.
Sales of residential and commercial furniture were both severely affected by the global economic downturn in fiscal years 2008 and 2009 and have now been in recovery for several years along with the overall economy. The pace of recovery, however, has been uneven and often weak in recent years. In general, sales of residential furniture are influenced significantly by the housing industry and by trends in home sales and household formations, while demand for commercial furniture generally reflects economic trends affecting businesses.
The sourcing of components and fully assembled furniture from overseas continues to play a major role in the furniture industry. By far, the largest source for these imports continues to be China. Imports of upholstery fabric, both in roll and in “kit” form, have also had a significant impact on the market for upholstery fabrics in recent years. Fabrics entering the U.S. from China and other low labor cost countries have resulted in increased price competition in the upholstery fabric and upholstered furniture markets.
In general, the residential furniture industry has been consolidating for several years. The result of this trend is fewer, but larger, customers for marketers of upholstery fabrics. Intense price competition continues to be an important consideration for both residential and commercial furniture.
7
As described above, our products include mattress fabrics and upholstery fabrics, which are our identified operating segments. These fabrics are sold in roll form and as sewn mattress covers by the mattress fabrics segment, and in roll form and as cut and sewn kits by the upholstery fabrics segment.
Mattress Fabrics Segment
Mattress fabrics segment sales constituted 60% to 62% of our total net sales in each of the past three fiscal years. The company has emphasized fabrics that have broad appeal at prices generally ranging from $1.50 to more than $10.00 per yard.
Upholstery Fabrics Segment
Upholstery fabrics segment sales totaled 38% to 40% of our sales for each of the past three fiscal years. The company has emphasized fabrics that have broad appeal at “good” and “better” prices, generally ranging from $3.00 to $10.00 per yard.
Culp Product Categories by Segment
We market products in most categories of fabric that manufacturers currently use for bedding and furniture. The following table indicates the product lines within each segment, and a brief description of their characteristics.
Mattress Fabrics
|
Woven jacquards
|
Various patterns and intricate designs. Woven on complex looms using a variety of synthetic and natural yarns.
|
|
Converted
|
Suedes, pile and embroidered fabrics, and other specialty type products are sourced to offer diversity for higher end mattresses.
|
|
Knitted fabric
|
Various patterns and intricate designs produced on special-width circular knit machines utilizing a variety of synthetic and natural yarns. Knitted mattress fabrics have inherent stretching properties and spongy softness, which conforms well with layered foam packages.
|
|
Sewn mattress covers
|
Covers for bedding (primarily specialty beds), sewn from mattress fabrics produced by our facilities or sourced from others.
|
8
Upholstery Fabrics
|
Woven jacquards
|
Elaborate, complex designs such as florals and tapestries in traditional, transitional, and contemporary styles. Woven on intricate looms using a wide variety of synthetic and natural yarns.
|
|
Woven dobbies
|
Fabrics that use straight lines to produce geometric designs such as plaids, stripes, and solids in traditional and country styles. Woven on less complicated looms using a variety of weaving constructions and primarily synthetic yarns.
|
|
Velvets
|
Soft fabrics with a plush feel. Woven or knitted in basic designs, using synthetic yarns that are yarn dyed or piece dyed.
|
|
Suedes
|
Fabrics woven or knitted using microdenier polyester yarns, which are piece dyed and finished, usually by sanding. The fabrics are typically plain or small jacquard designs, with some being printed. These are sometimes referred to as microdenier suedes.
|
|
Faux leathers
|
Sueded or knitted base cloths which are overprinted with polyurethane, and composite products consisting of a base fabric that is coated with a top layer of polyurethane, which simulates the look and feel of leather.
|
|
Cut and sewn kits
|
Covers made from various types of upholstery fabrics and cut and sewn to specifications of furniture manufacturing customers for use on specific furniture frames.
|
Mattress Fabrics Segment
Our mattress fabrics segment operates four manufacturing plants, with two located in North Carolina, one in St. Jerome, Quebec, Canada and a joint venture facility in Haiti. Over the past ten fiscal years, we made capital expenditures of approximately $74 million to consolidate our production facilities and to modernize both knit and weaving equipment, enhance and provide knit and woven finishing capabilities, and expand capacity. The result has been an increase in manufacturing efficiency and reductions in operating costs, as well as expanded product offerings and capacity.
Jacquard mattress fabrics and knitted fabrics are produced at both our Stokesdale facility and our St. Jerome plant. The majority of finishing and inspection processes for mattress fabrics are conducted at the Stokesdale plant, with the St. Jerome plant providing additional capacity for knit finishing and inspection, along with distribution capabilities. We have a joint marketing arrangement with a producer of sewn mattress covers for bedding. This arrangement includes an additional manufacturing facility to produce and market sewn mattress covers. The mattress cover operation has been further expanded through a joint venture mattress cover facility in Haiti, which began production during the second quarter of fiscal 2018. In early fiscal 2019, we added an e-commerce manufacturing facility and distribution location in connection with our acquisition of eLuxury.
In addition to the mattress fabrics we manufacture, we have important supply arrangements in place that allow us to source mattress fabric from strategic suppliers. A portion of our woven jacquard fabric and knitted fabric is obtained from a supplier located in Turkey, based on designs and a production schedule created by Culp. We are also sourcing some Culp-designed knitted fabrics, certain converted fabric products, and sewn mattress covers using our Culp China platform.
9
Upholstery Fabrics Segment
The upholstery fabrics division currently operates two manufacturing facilities in the U.S. and three in China. One of the U.S. plants is our recently acquired window treatments production facility in Knoxville, Tennessee. The other U.S. plant is located in Anderson, South Carolina, and mainly produces velvet upholstery fabrics with some production of certain decorative fabrics. The company announced in early fiscal 2019 that the Anderson plant would be phased out and closed during the first half of the current fiscal year.
Our upholstery manufacturing facilities in China are all located within the same industrial area near Shanghai. At these facilities, we apply value-added finishing processes to fabrics sourced from a limited number of strategic suppliers in China, and we inspect sourced fabric there as well. In addition, the Shanghai operations include facilities where sourced fabric is cut and sewn to provide “kits” that are designed to be placed on specific furniture frames designated by our customers.
A large portion of our upholstery fabric products, as well as certain elements of our production processes, are being sourced from outside suppliers. Our facilities in China provide a base from which to access a variety of products, including certain fabrics (such as micro denier suedes and polyurethane fabrics) that are not produced anywhere within the U.S. We have found opportunities to develop significant relationships with key overseas suppliers in China that allow us to source products on a cost-effective basis, while limiting our investment of capital in manufacturing assets. We source unfinished and finished fabrics, as well as a portion of our cut and sewn kits, from a limited number of strategic suppliers in China who are willing to commit significant capacity to meet our needs while working with our product development team to meet the demands of our customers. We also source a portion of our yarns for our U.S. operation through our China facilities. The remainder of our yarn is obtained from other suppliers around the world.
Consumer tastes and preferences related to bedding and upholstered furniture change over time. The use of new fabrics and creative designs remains an important consideration for manufacturers to distinguish their products at retail and to capitalize on changes in preferred colors, patterns and textures. Culp’s success is largely dependent on our ability to market fabrics with appealing designs and patterns. The process of developing new designs involves maintaining an awareness of broad fashion and color trends both in the United States and internationally.
Mattress Fabrics Segment
Design innovation is a very important element of producing mattress fabrics. We invest significant resources to stay ahead of current design trends, including maintaining a trained and active design staff, investing in research and development activities such as participation in international design shows, and implementing systems for creating and cataloguing new designs. Price point delineation is accomplished through fabric quality as well as variation in design. Additionally, consumers are drawn to the mattress that is the most visually appealing when walking into a retail showroom. Fiber differentiation also plays an important part in design. For example, rayon, organic cotton, and other special fibers are incorporated into the design process to allow the retailer to offer consumers additional benefits related to their sleeping experience. Similarly, many fabrics contain special production finishes that enhance fabric performance.
10
Mattress fabric designs are not routinely introduced on a scheduled season. Designs are typically introduced upon the request of the customer as they plan introductions to retailers. Additionally, we work closely with our customers on new design offerings around the major furniture markets such as Las Vegas, Nevada, and High Point, North Carolina.
Upholstery Fabrics Segment
The company has developed an upholstery fabrics design and product development team (with staff located in the U.S. and in China) with a primary focus on value in designing body cloths, while promoting style leadership with pillow fabrics and color. Our design staff travels regularly to international trade and design shows to maintain familiarity with current design and fashion trends. The team searches continually for new ideas and for the best sources of raw materials, yarns, and fabrics, utilizing a supply network located mostly in China. Using these design elements, they develop product offerings using ideas and materials that take both fashion trends and cost considerations into account to offer products designed to meet the needs of furniture manufacturers and ultimately the desires of consumers.
Upholstery fabric designs are introduced at major fabric trade conferences that occur twice a year in the United States (June and December). In recent years we have become more aggressive in registering copyrights for popular fabric patterns and taking steps to discourage the illegal copying of our proprietary designs.
Mattress Fabrics Segment
The vast majority of our shipments of mattress fabrics originate from our facilities in Stokesdale, North Carolina, and we have additional distribution capabilities in Canada and China. Through arrangements with major customers and in accordance with industry practice, we maintain a significant inventory of mattress fabrics at our distribution facility in Stokesdale (“make to stock”), so that products may be shipped to customers with short lead times and on a “just in time” basis.
Upholstery Fabrics Segment
A majority of our upholstery fabrics are marketed on a “make to order” basis and are shipped directly from our distribution facilities in Burlington, North Carolina, and Shanghai, China. In addition to “make to order” distribution, an inventory of a limited number of fabric patterns is held at our distribution facilities in Burlington and Shanghai from which our customers can obtain quick delivery of sourced fabrics through a program known as “Culp Express.”
11
Mattress Fabrics Segment
Raw materials account for approximately 60%-70% of mattress fabric production costs. The mattress fabrics segment purchases primarily synthetic yarns (polyester, polypropylene, and rayon), certain greige (unfinished) goods, latex adhesives, laminates, dyes, and other chemicals. Most of these materials are available from several suppliers, and prices fluctuate based on supply and demand, the general rate of inflation, and particularly on the price of petrochemical products. The mattress fabrics segment has generally not had significant difficulty in obtaining raw materials.
Upholstery Fabrics Segment
Raw materials account for approximately 60%-70% of upholstery fabric manufacturing costs for products the company manufactures. This segment purchases synthetic yarns (polyester, acrylic, rayon, and polypropylene), latex adhesives, dyes, and other chemicals from various suppliers.
Increased reliance by both our U.S. and China upholstery operations on outside suppliers for basic production needs such as base fabrics, yarns, and finishing services has caused the upholstery fabrics segment to become more vulnerable to price increases, delays, or production interruptions caused by problems within businesses that we do not control.
Both Segments
Many of our basic raw materials are petrochemical products or are produced from such products. For this reason, our material costs can be sensitive to changes in prices for petrochemicals and the underlying price of oil. From fiscal 2015 and continuing into fiscal 2018, our profitability was aided by lower raw material prices due to lower oil prices, among other factors. Later in fiscal 2018, we began to experience higher raw material prices.
Mattress Fabrics Segment
The mattress fabrics business and the bedding industry in general are slightly seasonal, with sales being the highest in early spring and late summer, with another peak in mid-winter.
Upholstery Fabrics Segment
The upholstery fabrics business today is less seasonal than it once was. In the past, seasonality resulted from one-week closings of our manufacturing facilities and the facilities of most of our customers in the United States during our first and third fiscal quarters for the holiday weeks of July 4th and Christmas. This effect has become much less pronounced as a larger portion of our fabrics are produced or sold in locations outside of the U.S. The timing of the Chinese National Holiday in October and, to a larger extent, the Chinese New Year (which occurs in January or February each year) now have a more significant impact on upholstery sales than the effects of U.S. holiday periods, often causing sales to be higher in advance of these holiday periods and sometimes lower during or immediately following the same periods.
12
Competition for our products is high and is based primarily on price, design, quality, timing of delivery, and service.
Mattress Fabrics Segment
The mattress fabrics market is concentrated in a few relatively large suppliers. We believe our principal mattress fabric competitors are BekaertDeslee Textiles, Global Textile Alliance, and several smaller companies producing knitted and other fabric. In addition, our bedding customers are facing increasing competition from imports of finished beds, which indirectly compete with our mattress fabrics by replacing potential sales of our fabrics to those customers.
Upholstery Fabrics Segment
In the upholstery fabrics market, we compete against a large number of companies, ranging from a few large manufacturers comparable in size to the company to small producers, and a growing number of “converters” of fabrics (companies who buy and re-sell, but do not manufacture fabrics). We believe our principal upholstery fabric competitors are Dorell Fabrics Co., Merrimack Fabrics, Morgan Fabrics, Richloom Fabrics and Specialty Textile, Inc. (or STI), plus a large number of smaller competitors (both manufacturers and converters).
The trend in the upholstery fabrics industry to greater overseas competition and the entry of more converters has caused the upholstery fabrics industry to become substantially more fragmented in recent years, with lower barriers to entry. This has resulted in a larger number of competitors selling upholstery fabrics, with an increase in competition based on price.
We are subject to various federal and state laws and regulations, including the Occupational Safety and Health Act (“OSHA”) and federal and state environmental laws, as well as similar laws governing our manufacturing facilities in China and Canada. We periodically review our compliance with these laws and regulations in an attempt to minimize the risk of violations.
Our operations involve a variety of materials and processes that are subject to environmental regulation. Under current law, environmental liability can arise from previously owned properties, leased properties and properties owned by third parties, as well as from properties currently owned and leased by the company. Environmental liabilities can also be asserted by adjacent landowners or other third parties in toxic tort litigation.
In addition, under the Comprehensive Environmental Response, Compensation, and Liability Act of 1980, as amended (“CERCLA”), and analogous state statutes, liability can be imposed for the disposal of waste at sites targeted for cleanup by federal and state regulatory authorities. Liability under CERCLA is strict as well as joint and several.
The U.S. Congress is considering legislation to address climate change that is intended to reduce overall greenhouse gas emissions, including carbon dioxide. In addition, the U.S. Environmental Protection Agency has made a determination that greenhouse gas emissions may be a threat to human health and the environment. International agreements may also result in new regulations on greenhouse gas emissions. It is uncertain if, when, and in what form, a mandatory carbon dioxide emissions reduction program may be enacted either through legislation or regulation. However, if enacted, this type of program could materially increase our operating costs, including costs of raw materials, transportation, and electricity. It is difficult to predict the extent to which any new rules or regulations would affect our business, but we would expect the effect on our operations to be similar to that for other manufacturers, particularly those in our industry.
13
We are periodically involved in environmental claims or litigation and requests for information from environmental regulators. Each of these matters is carefully evaluated, and the company provides for environmental matters based on information presently available. Based on this information, we do not currently believe that environmental matters will have a material adverse effect on either the company’s financial condition or results of operations. However, there can be no assurance that the costs associated with environmental matters will not increase in the future.
As of April 29, 2018, we had 1,392 employees, compared to 1,325 at April 30, 2017. Overall, our total number of employees has increased steadily over the past five years primarily due to the growth in our mattress fabrics segment. The increase in the number of employees in our upholstery fabrics segment can be attributed to the acquisition of Read Window Products, LLC.
The hourly employees at our manufacturing facility in Canada (approximately 12% of the company’s workforce) are represented by a local, unaffiliated union. The collective bargaining agreement for these employees expires on February 1, 2020. We are not aware of any efforts to organize any more of our employees, and we believe our relations with our employees are good.
The following table illustrates the changes in the location of our workforce and number of employees, as of year-end, over the past five fiscal years.
|
Number of Employees
|
||||||||||||||||||||
|
Fiscal 2018
|
Fiscal 2017
|
Fiscal 2016
|
Fiscal 2015
|
Fiscal 2014
|
||||||||||||||||
|
Mattress Fabrics Segment
|
847
|
793
|
682
|
631
|
592
|
|||||||||||||||
|
Upholstery Fabrics Segment
|
||||||||||||||||||||
|
United States
|
188
|
148
|
134
|
129
|
129
|
|||||||||||||||
|
Poland
|
-
|
-
|
-
|
-
|
4
|
|||||||||||||||
|
China
|
353
|
380
|
397
|
424
|
438
|
|||||||||||||||
|
Total Upholstery Fabrics Segment
|
541
|
528
|
531
|
553
|
571
|
|||||||||||||||
|
Unallocated corporate
|
4
|
4
|
4
|
4
|
4
|
|||||||||||||||
|
Total
|
1,392
|
1,325
|
1,217
|
1,188
|
1,167
|
|||||||||||||||
Mattress Fabrics Segment
Major customers for our mattress fabrics include the leading bedding manufacturers: Serta-Simmons Bedding (SSB), Tempur + Sealy International (TSI), and Corsicana Bedding. Our largest customer in the mattress fabrics segment is Serta Simmons Holdings, LLC, accounting for approximately 25% of the company’s overall sales in fiscal 2018. Our mattress fabrics customers also include many small and medium-size bedding manufacturers.
14
Upholstery Fabrics Segment
Our major customers for upholstery fabrics are leading manufacturers of upholstered furniture, including Ashley, Flexsteel, Franklin Fusion, Jonathan Louis, and La-Z-Boy (La-Z-Boy Residential and England). Major customers for the company’s fabrics for commercial furniture include Irwin Seating and HON Industries.
Our largest customer in the upholstery fabrics segment is La-Z-Boy Incorporated, which accounted for 12% of the company’s consolidated sales in fiscal 2018.
The following table sets forth our net sales by geographic area by amount and percentage of total net sales for the three most recent fiscal years.
(dollars in thousands)
|
Fiscal 2018
|
Fiscal 2017
|
Fiscal 2016
|
||||||||||||||||||||||
|
United States
|
$
|
249,529
|
77.0
|
%
|
$
|
241,236
|
77.9
|
%
|
$
|
244,930
|
78.3
|
%
|
||||||||||||
|
North America
|
$
|
27,844
|
8.6
|
%
|
$
|
29,995
|
9.7
|
%
|
$
|
31,667
|
10.1
|
%
|
||||||||||||
|
(Excluding USA)
(1)
|
||||||||||||||||||||||||
|
Far East and Asia
(2)
|
40,671
|
12.6
|
%
|
34,695
|
11.2
|
%
|
31,927
|
10.2
|
%
|
|||||||||||||||
|
All other areas
|
5,681
|
1.8
|
%
|
3,618
|
1.2
|
%
|
4,336
|
1.4
|
%
|
|||||||||||||||
|
Subtotal (International)
|
$
|
74,196
|
23.0
|
%
|
$
|
68,308
|
22.1
|
%
|
$
|
67,930
|
21.7
|
%
|
||||||||||||
|
Total
|
$
|
323,725
|
100
|
%
|
$
|
309,544
|
100
|
%
|
$
|
312,860
|
100
|
%
|
||||||||||||
(1)
Of this amount, $21.9 million, $22.3 million, and $24.2 million are attributable to shipments to Mexico in fiscal 2018, 2017, and 2016, respectively.
(2)
Of this amount, $32.6 million, $26.6 million, and $23.1 million are attributable to shipments to China in fiscal 2018, 2017, and 2016, respectively.
Sales are attributed to individual countries based upon the location that the company ships its products to for delivery to customers.
For additional segment information, including the geographic location of long-lived assets, see Note 18 in the consolidated financial statements.
Mattress Fabrics Segment
The backlog for mattress fabric is not a reliable predictor of future shipments because the majority of sales are on a just-in-time basis.
15
Upholstery Fabrics Segment
Although it is difficult to predict the amount of backlog that is “firm,” we have reported the portion of the upholstery fabric backlog from customers with confirmed shipping dates within five weeks of the end of the fiscal year. On April 29, 2018, the portion of the upholstery fabric backlog with confirmed shipping dates prior to June 4, 2018 was $9.4 million, all of which are expected to be filled during the first quarter of fiscal 2019, compared with $9.2 million as of the end of fiscal 2017 (for confirmed shipping dates prior to June 5, 2017).
16
Our business is subject to risks and uncertainties. In addition to the matters described above under “Cautionary Statement Concerning Forward-Looking Information,” set forth below are some of the risks and uncertainties that could cause a material adverse change in our results of operations or financial condition. The risks described below are not the only risks we face. Additional risks and uncertainties not presently known to us or not presently deemed material by us also may materially adversely affect our business, financial condition or results of operations in future periods.
Continued economic uncertainty could negatively affect our sales and earnings.
Overall demand for our products depends upon consumer demand for furniture and bedding, which is subject to variations in the general economy. Because purchases of furniture or bedding are discretionary purchases for most individuals and businesses, demand for these products is sometimes more easily influenced by economic trends than demand for other products. Economic downturns can affect consumer spending habits and demand for home furnishings, which reduces the demand for our products and therefore can cause a decrease in our sales and earnings. Economic uncertainty has caused a decrease in consumer spending and demand for home furnishings, including goods that incorporate our products. If these conditions persist, our business will be negatively affected.
It has been challenging to maintain and increase sales levels in the upholstery fabrics segment.
Increased competition and fragmentation of the upholstery fabrics business, including a dramatic shift to imported fabrics and resulting price deflation for upholstery fabrics, have led to a significant reduction in the size of our upholstery business. Opportunities for growth and profitability gains for this segment are encouraging, but there is no assurance that we will be able to maintain or consistently grow this business in the future.
Greater reliance on offshore operations and foreign sources of products or raw materials increases the likelihood of disruptions to our supply chain or our ability to deliver products to our customers on a timely basis.
We rely significantly on operations in distant locations, especially China, and in addition we have been purchasing a significant share of our products and raw materials from offshore sources, particularly Asia and Turkey. At the same time, our domestic manufacturing capacity for the upholstery fabrics segment has been greatly reduced. These changes have caused us to rely on a much longer supply chain and on a larger number of suppliers that we do not control, both of which are inherently subject to greater risks of delay or disruption. In addition, operations and sourcing in foreign areas are subject to the risk of changing local governmental rules, taxes, changes in import rules or customs, tariffs, potential political unrest, or other threats that could disrupt or increase the costs of operating in foreign areas or sourcing products overseas. Changes in the value of the U.S. dollar versus other currencies can affect our financial results because a significant portion of our operations are located outside the United States. Strengthening of the U.S. dollar against other currencies can have a negative impact on our sales of products produced in those countries. Any of the risks associated with foreign operations and sources could cause unanticipated increases in operating costs or disruptions in business, which could negatively impact our ultimate financial results.
17
Our business faces several risks associated with doing business in China
We source a variety of fabrics from a limited number of strategic suppliers in China, and we operate five upholstery manufacturing facilities in Shanghai, China. The Chinese economy is characterized by extensive state ownership, control, and regulation. Therefore, our business is continually subject to the risk of changes in Chinese laws and regulations that could have an adverse effect on our suppliers and manufacturing operations. Any changes in policies governing tariffs, imports and exports, taxation, inflation, environmental regulations, foreign currency exchange rates, the labor market, property, and financial regulations could have an adverse effect on our business. Further, the Chinese legal system is continuing to develop and evolve, and the enforcement of rules and regulations is not always consistent or uniform. Moreover, any potential civil unrest, natural disasters, or other threats could disrupt or increase the costs of operating in China. The Chinese economy poses additional risks to our business, including fluctuating rates of inflation and currency exchange rates, a declining labor force participation rate, and rising employee wages. In addition, changes in the political climate or trade policy of the United States, such as increased duties or tariffs on Chinese imports, may adversely affect our business. Any of the risks associated with our Chinese operations and sources could cause unanticipated increases in operating costs or disruptions in business, which could negatively impact our ultimate financial results.
We may have difficulty managing the outsourcing arrangements being used for products and services.
We rely on outside sources for various products and services, including yarn and other raw materials, greige (unfinished) fabrics, finished fabrics, and services such as weaving and finishing. Increased reliance on outsourcing lowers our capital investment and fixed costs, but it decreases the amount of control that we have over certain elements of our production capacity. Interruptions in our ability to obtain raw materials or other required products or services from our outside suppliers on a timely and cost effective basis, especially if alternative suppliers cannot be immediately obtained, could disrupt our production and damage our financial results.
Write-offs or write-downs of assets would result in a decrease in our earnings and shareholders’ equity.
The company has long-lived assets, primarily consisting of property, plant and equipment, goodwill, and to a lesser extent other intangible assets. ASC Topic 360 establishes an impairment accounting model for long-lived assets such as property, plant, and equipment and requires the company to assess for impairment whenever events or changes in circumstances indicate that the carrying value of the asset may not be recovered. ASC Topic 350 requires that goodwill and other intangible assets be tested at least annually for impairment or whenever events or changes in circumstances indicate that the carrying value of the asset may not be recovered.
Although no material write-downs were experienced in the past several fiscal years, we recently announced the closure of our Anderson, SC upholstery fabrics facility during the first quarter fiscal 2019. Currently, management estimates that the fair market value of our property, plant, and equipment exceeds its carrying value by approximately $400,000, and for this reason, no charge for impairment is expected to be recorded in connection with this decision. However, we are currently working with our customers to fulfill any outstanding or future orders, and through this process, we will be able to determine a good faith estimate of any inventory write-downs.
18
Our goodwill has increased during fiscal 2018 in connection with our acquisition of Read Window Products, LLC and is expected to increase further due our recent acquisition of eLuxury in the first quarter of fiscal 2019.
There is no assurance that future write-downs of fixed assets, goodwill, or other intangible assets will not occur if business conditions were to deteriorate.
Changes in the price, availability, and quality of raw materials could increase our costs or cause production delays and sales interruptions, which would result in decreased earnings.
We depend upon outside suppliers for most of our raw material needs, and we rely upon outside suppliers for component materials such as yarn and unfinished fabrics, as well as for certain services such as finishing and weaving. Fluctuations in the price, availability, and quality of these goods and services could have a negative effect on our production costs and ability to meet the demands of our customers, which would affect our ability to generate sales and earnings. In many cases, we are not able to pass through increased costs of raw materials or increased production costs to our customers through price increases. In particular, many of our basic raw materials are petrochemical products or are produced from such products. For this reason, our material costs are especially sensitive to changes in prices for petrochemicals and the underlying price of oil. Increases in prices for oil, petrochemical products or other raw materials and services provided by outside suppliers can significantly increase our costs and negatively affect earnings. Late in fiscal 2018, we began to experience higher raw material prices and resulting impacts on our profits. A continuation of this trend would result in continuing downward pressure on our profit margins and earnings.
Increases in energy costs would increase our operating costs and could adversely affect earnings.
Higher prices for electricity, natural gas, and fuel increase our production and shipping costs. A significant shortage, increased prices, or interruptions in the availability of these energy sources would increase the costs of producing and delivering products to our customers, and would be likely to adversely affect our earnings. In many cases, we are not able to pass along the full extent of increases in our production costs to customers through price increases. Energy costs have varied significantly during recent fiscal years, and remain a volatile element of our costs. Increases in energy costs could have a negative effect on our earnings.
Business difficulties or failures of large customers could result in a decrease in our sales and earnings.
We currently have several customers that account for a substantial portion of our sales. In the mattress fabrics segment, several large bedding manufacturers have large market shares and comprise a significant portion of our mattress fabric sales, with Serta Simmons Holdings, LLC accounting for approximately 25% of consolidated net sales in fiscal 2018. In the upholstery fabrics segment, La-Z-Boy Incorporated accounted for approximately 12% of consolidated net sales during fiscal 2018, and several other large furniture manufacturers comprised a significant portion of sales. A business failure or other significant financial difficulty by one or more of our major customers, or the loss of one or more of these customers, could cause a significant loss in sales, an adverse effect on our earnings, and difficulty in collection of our trade accounts receivable.
19
Loss of market share due to competition would result in declines in sales and could result in losses or decreases in earnings.
Our business is highly competitive, and we face significant competition from a large number of competitors, both foreign and domestic. We compete with many other manufacturers of fabric, as well as converters who source fabrics from various producers and market them to manufacturers of furniture and bedding. In many cases, these fabrics are sourced from foreign suppliers who have a lower cost structure than the company. The highly competitive nature of our business in both segments means we are constantly subject to the risk of losing market share. As a result of increased competition, there have been deflationary pressures on the prices for many of our products, which make it more difficult to pass along increased operating costs such as raw materials, energy or labor in the form of price increases and puts downward pressure on our profit margins. Also, the wide range of product offerings in our business can make it more difficult to differentiate our products through design, styling, finish, and other techniques.
If we fail to anticipate and respond to changes in consumer tastes and fashion trends, our sales and earnings may decline.
Demand for various types of upholstery fabrics and mattress coverings changes over time due to fashion trends and changing consumer tastes for furniture and bedding. Our success in marketing our fabrics depends upon our ability to anticipate and respond in a timely manner to fashion trends in home furnishings. If we fail to identify and respond to these changes, our sales of these products may decline. In addition, incorrect projections about the demand for certain products could cause the accumulation of excess raw material or finished goods inventory, which could lead to inventory mark-downs and decreases in earnings.
Increasing dependence on information technology systems comes with specific risks, including cybersecurity breaches and data leaks, which could have an adverse effect on our business.
We increasingly rely on technology systems and infrastructure. In fiscal 2018, we launched a new platform for direct sales to retailers of bedding accessory products, and in fiscal 2019 we acquired a majority interest in an e-commerce retailer of bedding accessories and other home goods. Greater dependence on technology systems and e-commerce heightens the risk of potential vulnerabilities from system failure and malfunction, breakdowns due to natural disasters, human error, unauthorized access, power loss, and other unforeseen events. Data privacy breaches by employees and others with or without authorized access to our systems poses risks that sensitive data may be permanently lost or leaked to the public or other unauthorized persons. With the growing use and rapid evolution of technology, including internet selling, cloud-based computing and mobile devices, there are additional risks of unintentional data leaks. There is also the risk of our exposure to theft of confidential information, intentional vandalism, industrial espionage, and a variety of cyber-attacks that could compromise our internal technology system, infrastructure, or result in data leakage in-house or at our third-party providers and business partners. Failures of technology or related systems, or an improper release of confidential information, could damage our business or subject us to unexpected liabilities.
20
We are subject to litigation and environmental regulations that could adversely impact our sales and earnings.
We have been, and in the future may be, a party to legal proceedings and claims, including environmental matters, product liability, and employment disputes, some of which claim significant damages. We face the continual business risk of exposure to claims that our operations have caused personal injury or property damage. We maintain insurance against product liability claims and in some cases have indemnification agreements with regard to environmental claims, but there can be no assurance that these arrangements will continue to be available on acceptable terms or that such arrangements will be adequate for liabilities actually incurred. Given the inherent uncertainty of litigation, there can be no assurance that claims against the company will not have a material adverse impact on our earnings or financial condition. We are also subject to various laws and regulations in our business, including those relating to environmental protection and the discharge of materials into the environment. We could incur substantial costs as a result of noncompliance with or liability for cleanup or other costs or damages under environmental laws or other regulations.
We must comply with a number of governmental regulations applicable to our business, and changes in those regulations could adversely affect our business.
Our products and raw materials are and will continue to be subject to regulation in the United States by various federal, state, and local regulatory authorities. In addition, other governments and agencies in other jurisdictions regulate the manufacture, sale, and distribution of our products and raw materials. Also, rules and restrictions regarding the importation of fabrics and other materials, including custom duties, tariffs, quotas and other regulations, are continually changing. Environmental laws, labor laws, tax regulations, and other regulations continually affect our business. All of these rules and regulations can and do change from time to time, which can increase our costs or require us to make changes in our manufacturing processes, product mix, sources of products and raw materials, or distribution. Changes in the rules and regulations applicable to our business may negatively impact our sales and earnings.
None.
21
Our corporate headquarters are located in High Point, North Carolina. As of the end of fiscal 2018 (April 29, 2018), we leased our corporate headquarters and owned or leased sixteen facilities associated with our mattress and upholstery fabric operations. The following is a list of our principal administrative and production facilities. Our facilities listed below are organized by business segment.
|
|
Approx.
|
|||
|
|
|
Total Area
|
Expiration
|
|
|
Location
|
Principal Use
|
(
Sq. Ft.)
|
of Lease
(1)
|
|
|
·
Administrative:
|
|
|
|
|
|
High Point, North Carolina
|
Upholstery fabric division
|
29,812
|
2025
|
|
|
offices and corporate
|
||||
|
headquarters
|
||||
|
·
Mattress Fabrics:
|
|
|
|
|
|
Stokesdale, North Carolina
|
Manufacturing and
|
299,163
|
Owned
|
|
|
headquarters office
|
||||
|
Stokesdale, North Carolina
|
Distribution center
|
220,222
|
Owned
|
|
|
High Point, North Carolina
|
Manufacturing
|
63,522
|
(2)
|
|
|
High Point, North Carolina
|
Warehouse and offices
|
65,886
|
2020
|
|
|
St. Jerome, Quebec, Canada
|
Manufacturing
|
202,500
|
Owned
|
|
|
Ouanaminthe, Haiti (3)
|
Manufacturing
|
80,000
|
2025
|
|
|
·
Upholstery Fabrics:
|
|
|
|
|
|
Anderson, South Carolina
|
Manufacturing
|
99,000
|
Owned
|
|
|
Burlington, North Carolina
|
Finished goods distribution
|
132,000
|
2019
|
|
|
Burlington, North Carolina
|
Design center
|
15,000
|
2021
|
|
|
Knoxville, Tennessee
|
Manufacturing and offices
|
36,700
|
2033
|
|
|
Shanghai, China
|
Manufacturing and offices
|
27,900 | 2019 | |
|
Shanghai, China
|
Manufacturing and offices
|
68,677
|
2021
|
|
|
Shanghai, China
|
Manufacturing and offices
|
89,857
|
2020
|
|
|
Shanghai, China
|
Manufacturing and warehousing
|
89,861
|
2021
|
|
|
Shanghai, China
|
Warehouse and offices
|
64,583
|
2020
|
|
|
Shanghai, China
|
Warehouse
|
48,610
|
2021
|
|
____________________________________________________
|
(1)
|
Includes all options to renew.
|
|
(2)
|
This lease agreement is currently on a month to month basis.
|
|
(3)
|
This leased facility pertains to our 50% owned joint venture associated with Class International Holdings, Ltd (See note 7 in the notes to the consolidated financial statements for further details).
|
We believe that our facilities are in good condition, well-maintained and suitable and adequate for present utilization. In the upholstery fabrics segment, we have the ability to source upholstery fabric from outside suppliers to meet current and expected demand trends and further increase our output of finished goods. This ability to source upholstery fabric is part of our long-term strategy to have a low-cost platform that is scalable, but not capital intensive. In the mattress fabrics segment, management has estimated that it is currently performing at near capacity. Also, we have the ability to source additional mattress fabric from outside suppliers to further increase our ultimate output of finished goods.
22
There are no legal proceedings to which the company, or its subsidiaries, is a party to or of which any of their property is the subject that are required to be disclosed under this item.
Not applicable.
PART II
AND ISSUER PURCHASES OF EQUITY SECURITIES
Registrar and Transfer Agent
Computershare Trust Company, N.A.
Correspondence should be mailed to:
Computershare
P.O. Box 505000
Louisville, KY 40233
Overnight correspondence should be sent to:
Computershare
462 South 4
th
Street, Suite 1600
Louisville, KY 40202
(800) 254-5196
(781) 575-2879 (Foreign shareholders)
www.computershare.com/investor
Stock Listing
Prior to July 13, 2017, Culp Inc. common stock was traded on the New York Stock Exchange (NYSE) under the symbol CFI. Effective July 13, 2017, Culp, Inc. common stock commenced trading on the NYSE under the symbol CULP. As of April 29, 2018, Culp, Inc. had approximately 4,532 shareholders based on the number of holders of record and an estimate of individual participants represented by security position listings.
Analyst Coverage
These analysts cover Culp, Inc.:
Raymond, James & Associates - Budd Bugatch, CFA
Value Line – Simon R. Shoucair
Stifel Financial Corp - John A. Baugh, CFA
Stonegate Capital Partners, Inc. – Marco Rodriguez, CFA
23
Dividends and Share Repurchases; Sales of Unregistered Securities
Share Repurchases
ISSUER PURCHASES OF EQUITY SECURITIES
|
Period
|
(a)
Total Number of
Shares Purchased
|
(b)
Average Price
Paid per Share
|
(c)
Total Number of Shares
Purchased as Part of Publicly
Announced Plans or Programs
|
(d)
Approximate Dollar Value
of Shares that May Yet Be
Purchased Under the Plans
or Programs (1)
|
||||||||||||
|
January 29, 2018 to March 4, 2018
|
-
|
$
|
-
|
-
|
$
|
5,000,000
|
||||||||||
|
March 5, 2018 to April 1, 2018
|
-
|
$
|
-
|
-
|
$
|
5,000,000
|
||||||||||
|
April 2, 2018 to April 29, 2018
|
-
|
$
|
-
|
-
|
$
|
5,000,000
|
||||||||||
|
Total
|
-
|
$
|
-
|
-
|
$
|
5,000,000
|
||||||||||
|
(1)
|
On June 15, 2016, we announced that our board of directors increased the authorization for us to acquire up to $5.0 million of our common stock.
|
Dividends
On June 13, 2018, we announced that our board of directors approved a regular quarterly cash dividend payment of $0.09 per share. These dividend payments are payable on July 16, 2018, to shareholders of record as of July 2, 2018.
During fiscal 2018, dividend payments totaled $6.8 million, of which $2.6 million represented a special cash dividend payment of $0.21 per share, and $4.2 million represented our regular quarterly cash dividend payments ranging from $0.08 to $0.09 per share.
During fiscal 2017, dividend payments totaled $6.3 million, of which $2.6 million represented a special cash dividend payment in the first quarter of $0.21 per share, and $3.7 million represented our regular quarterly cash dividend payments ranging from $0.07 to $0.08 per share.
During fiscal 2016, dividend payments totaled $8.1 million, of which $5.0 million represented a special cash dividend payment in the first quarter of $0.40 per share, and $3.1 million represented our regular quarterly cash dividend payments ranging from $0.06 to $0.07 per share.
Sales of Unregistered Securities
There were no sales of unregistered securities during fiscal 2018, 2017, or 2016.
Performance Comparison
The following graph shows changes over the five fiscal years ending April 29, 2018 in the value of $100 invested in (1) the common stock of the company, (2) the Hemscott Textile Manufacturing Group Index reported by Standard and Poor’s, consisting of four companies (including the company) in the textile industry, and (3) the Standard & Poor’s 500 Index.
24
The graph assumes an initial investment of $100 at the end of fiscal 2013 and the reinvestment of all dividends during the periods identified.
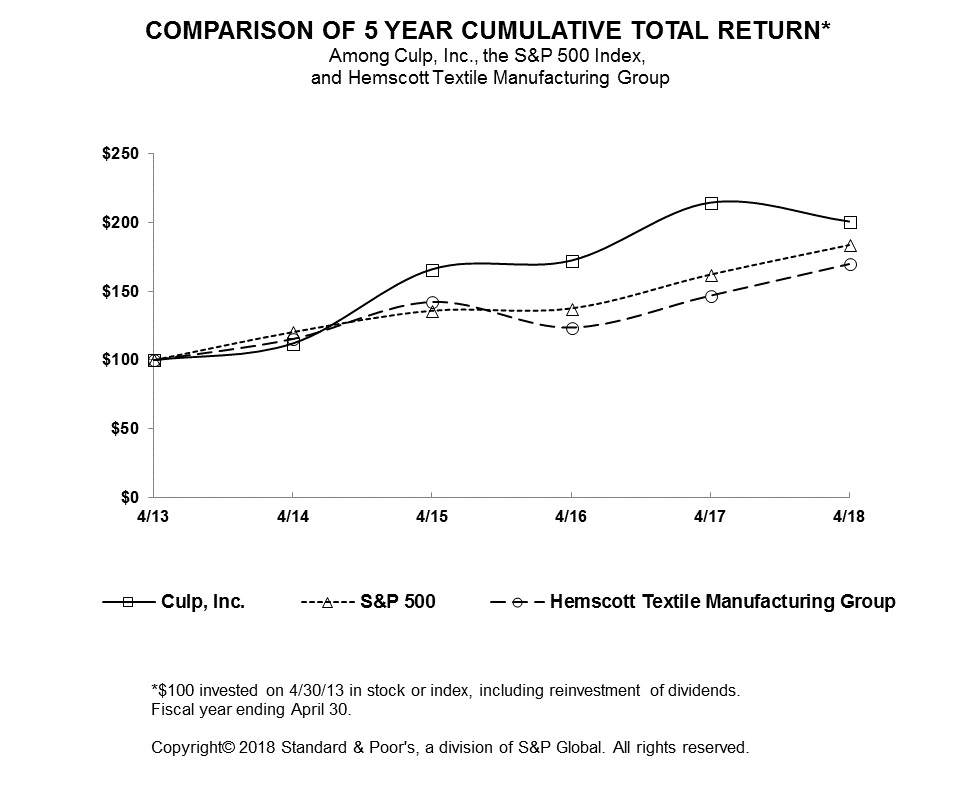
Market Information
See Item 6, Selected Financial Data, and Selected Quarterly Data in Item 8, for market information regarding the company’s common stock.
25
|
|
||||||||||||||||||||||||
|
percent
|
||||||||||||||||||||||||
|
fiscal
|
fiscal
|
fiscal
|
fiscal
|
fiscal
|
change
|
|||||||||||||||||||
|
(amounts in thousands, except per share, ratios & other, stock data)
|
2018
|
2017
|
2016
|
2015
|
2014
|
2018/2017
|
||||||||||||||||||
|
INCOME STATEMENT DATA
|
||||||||||||||||||||||||
|
net sales
|
$
|
323,725
|
309,544
|
312,860
|
310,166
|
287,162
|
4.6
|
%
|
||||||||||||||||
|
cost of sales
|
259,092
|
240,309
|
247,749
|
254,599
|
238,256
|
7.8
|
%
|
|||||||||||||||||
|
gross profit
|
64,633
|
69,235
|
65,111
|
55,567
|
48,906
|
-6.6
|
%
|
|||||||||||||||||
|
selling, general, and administrative expenses
|
37,172
|
39,157
|
36,773
|
32,778
|
28,657
|
-5.1
|
%
|
|||||||||||||||||
|
income from operations
|
27,461
|
30,078
|
28,338
|
22,789
|
20,249
|
-8.7
|
%
|
|||||||||||||||||
|
interest expense
|
94
|
-
|
-
|
64
|
427
|
100.0
|
%
|
|||||||||||||||||
|
interest income
|
(534
|
)
|
(299
|
)
|
(176
|
)
|
(622
|
)
|
(482
|
)
|
78.6
|
%
|
||||||||||||
|
other expense
|
1,018
|
681
|
616
|
391
|
1,261
|
49.5
|
%
|
|||||||||||||||||
|
income before income taxes
|
26,883
|
29,696
|
27,898
|
22,956
|
19,043
|
-9.5
|
%
|
|||||||||||||||||
|
income taxes
|
5,740
|
7,339
|
10,963
|
7,885
|
1,596
|
-21.8
|
%
|
|||||||||||||||||
|
loss from investment in unconsolidated joint venture
|
266
|
23
|
-
|
-
|
-
|
1056.5
|
%
|
|||||||||||||||||
|
net income
|
$
|
20,877
|
22,334
|
16,935
|
15,071
|
17,447
|
-6.5
|
%
|
||||||||||||||||
|
depreciation
|
$
|
7,672
|
7,085
|
6,671
|
5,773
|
5,312
|
8.3
|
%
|
||||||||||||||||
|
weighted average shares outstanding
|
12,431
|
12,312
|
12,302
|
12,217
|
12,177
|
1.0
|
%
|
|||||||||||||||||
|
weighted average shares outstanding, assuming dilution
|
12,633
|
12,518
|
12,475
|
12,422
|
12,414
|
0.9
|
%
|
|||||||||||||||||
|
PER SHARE DATA
|
||||||||||||||||||||||||
|
net income per share - basic
|
$
|
1.68
|
1.81
|
1.38
|
1.23
|
1.43
|
-7.2
|
%
|
||||||||||||||||
|
net income per share - diluted
|
1.65
|
1.78
|
1.36
|
1.21
|
1.41
|
-7.3
|
%
|
|||||||||||||||||
|
dividends per share
|
$
|
0.55
|
0.51
|
0.66
|
0.62
|
0.18
|
7.8
|
%
|
||||||||||||||||
|
book value
|
$
|
13.12
|
12.03
|
10.50
|
9.77
|
9.12
|
9.1
|
%
|
||||||||||||||||
|
BALANCE SHEET DATA
|
||||||||||||||||||||||||
|
operating working capital (4)
|
$
|
49,939
|
40,869
|
45,794
|
41,829
|
41,120
|
22.2
|
%
|
||||||||||||||||
|
property, plant and equipment, net
|
51,794
|
51,651
|
39,973
|
36,078
|
31,376
|
0.3
|
%
|
|||||||||||||||||
|
total assets
|
217,984
|
205,634
|
175,142
|
171,300
|
160,935
|
6.0
|
%
|
|||||||||||||||||
|
capital expenditures
|
7,439
|
18,771
|
10,708
|
11,174
|
5,310
|
-60.4
|
%
|
|||||||||||||||||
|
dividends paid
|
6,843
|
6,280
|
8,140
|
7,579
|
2,204
|
9.0
|
%
|
|||||||||||||||||
|
long-term debt, current maturities of long-term debt and line of credit
|
-
|
-
|
-
|
2,200
|
4,986
|
0.0
|
%
|
|||||||||||||||||
|
shareholders' equity
|
163,376
|
148,630
|
128,812
|
119,427
|
111,744
|
9.9
|
%
|
|||||||||||||||||
|
capital employed (3)
|
114,817
|
98,429
|
90,357
|
83,225
|
80,038
|
16.6
|
%
|
|||||||||||||||||
|
RATIOS & OTHER DATA
|
||||||||||||||||||||||||
|
gross profit margin
|
20.0
|
%
|
22.4
|
%
|
20.8
|
%
|
17.9
|
%
|
17.0
|
%
|
||||||||||||||
|
operating income margin
|
8.5
|
%
|
9.7
|
%
|
9.1
|
%
|
7.3
|
%
|
7.1
|
%
|
||||||||||||||
|
net income margin
|
6.4
|
%
|
7.2
|
%
|
5.4
|
%
|
4.9
|
%
|
6.1
|
%
|
||||||||||||||
|
effective income tax rate
|
21.4
|
%
|
24.7
|
%
|
39.3
|
%
|
34.3
|
%
|
8.4
|
%
|
||||||||||||||
|
debt to total capital employed ratio (1) (3)
|
0.0
|
%
|
0.0
|
%
|
0.0
|
%
|
2.6
|
%
|
6.2
|
%
|
||||||||||||||
|
operating working capital turnover (4)
|
7.1
|
7.3
|
7.0
|
7.7
|
7.0
|
|||||||||||||||||||
|
days sales in receivables
|
29
|
29
|
27
|
34
|
35
|
|||||||||||||||||||
|
inventory turnover
|
4.9
|
5.0
|
5.6
|
6.1
|
6.0
|
|||||||||||||||||||
|
STOCK DATA
|
||||||||||||||||||||||||
|
stock price
|
||||||||||||||||||||||||
|
high
|
$
|
34.05
|
37.80
|
35.23
|
29.19
|
21.10
|
||||||||||||||||||
|
low
|
26.15
|
25.57
|
22.72
|
16.60
|
14.93
|
|||||||||||||||||||
|
close
|
30.10
|
32.10
|
26.24
|
26.02
|
18.61
|
|||||||||||||||||||
|
P/E ratio (2)
|
||||||||||||||||||||||||
|
high
|
21
|
21
|
26
|
24
|
15
|
|||||||||||||||||||
|
low
|
16
|
14
|
17
|
14
|
11
|
|||||||||||||||||||
|
daily average trading volume (shares)
|
22.1
|
42.1
|
67.3
|
38.6
|
27.5
|
|||||||||||||||||||
|
(1)
|
Debt includes long-term and current maturities of long-term debt and line of credit.
|
|
(2)
|
P/E ratios based on trailing 12-month diluted net income per share.
|
|
(3)
|
Capital employed does not include cash and cash equivalents, short-term investments (available for sale), short-term investments (held-to-maturity), long-term investments (held-to-maturity), long-term investments (rabbi trust), current maturities of long-term debt, long-term debt, line of credit, noncurrent deferred tax assets and liabilities, income taxes receivable and payable, and deferred compensation.
|
|
(4)
|
Operating working capital for this calculation is accounts receivable and inventories, offset by accounts payable-trade, account payable - capital expenditures, and deferred revenue.
|
26
The following analysis of the financial condition and results of operations should be read in conjunction with the consolidated financial statements and notes and other exhibits included elsewhere in this report.
General
Our fiscal year is the 52 or 53-week period ending on the Sunday closest to April 30. Fiscal 2018, 2017, and 2016 each included 52 weeks. Our operations are classified into two business segments: mattress fabrics and upholstery fabrics. The mattress fabrics segment manufactures, sources and primarily sells fabrics and mattress covers to bedding manufacturers. The upholstery fabrics segment sources, manufactures, and sells fabrics primarily to residential and commercial furniture manufacturers and with the recent acquisition of Read Window Products we now provide window treatment products and related installation services.
We evaluate the operating performance of our segments based upon income from operations before certain unallocated corporate expenses, and other non-recurring items. Cost of sales in both segments include costs to manufacture or source our products, including costs such as raw material and finished good purchases, direct and indirect labor, overhead and incoming freight charges.
Executive Summary
Results of Operations
|
Twelve Months Ended
|
||||||||||||
|
(dollars in thousands)
|
April 29,2018
|
April 30, 2017
|
Change
|
|||||||||
|
Net sales
|
$
|
323,725
|
$
|
309,544
|
4.6
|
%
|
||||||
|
Gross profit
|
64,633
|
69,235
|
(6.6
|
)%
|
||||||||
|
Gross profit margin
|
20.0
|
%
|
22.4
|
%
|
(240
|
)bp
|
||||||
|
SG&A expenses
|
37,172
|
39,157
|
(5.1
|
)%
|
||||||||
|
Income from operations
|
27,461
|
30,078
|
(8.7
|
)%
|
||||||||
|
Operating margin
|
8.5
|
%
|
9.7
|
%
|
(120
|
)bp
|
||||||
|
Income before income taxes
|
26,883
|
29,696
|
(9.5
|
)%
|
||||||||
|
Income taxes
|
5,740
|
7,339
|
(21.8
|
)%
|
||||||||
|
Net income
|
20,877
|
22,334
|
(6.5
|
)%
|
||||||||
Net Sales
Overall, our net sales increased in fiscal 2018 compared with a year ago, with mattress fabric net sales increasing slightly by 1% and upholstery fabric net sales increasing 10%. These results reflect our strategic focus on product innovation and creativity and ability to provide a diverse product mix that meets the changing demands of our customers in both business segments.
27
Income Before Income Taxes
Despite the increase in net sales noted above, income before income taxes decreased 9.5% compared to the same period a year ago. This decrease was primarily due to higher operating costs associated with our upholstery fabric operations located in China resulting from unfavorable foreign currency exchange rates that mostly occurred in the second half of fiscal 2018, a decline in profitability in our U.S. upholstery fabric operation located in Anderson, South Carolina, resulting from changing consumer style preferences and reduced customer demand, and disruptions from the consolidation of our U.S. mattress fabric production facilities that occurred during the first half of fiscal 2018. Profits were also affected by lower demand form bedding customers late in fiscal 2018 due to a significant increase in lower priced imported mattresses.
Income Taxes
We recorded income tax expense of $5.7 million, or 21.4% of income before income tax expense, in fiscal 2018 compared with income tax expense of $7.3 million, or 24.7% of income before income tax expense, in fiscal 2017. Our income tax expense of $5.7 million in fiscal 2018 includes an income tax benefit totaling $2.1 million associated with the 2017 Tax Cuts and Jobs Act, which represents an income tax benefit of $4.3 million that pertains to the one-time mandatory repatriation tax, partially offset by a $2.2 million income tax charge for the re-measurement of our U.S. deferred income taxes resulting from the reduction in the U.S. federal corporate income tax rate. Our income tax expense of $7.3 million in fiscal 2017 included an income tax benefit totaling $3.4 million pertaining to the reversal of an uncertain income tax position associated with a foreign jurisdiction in which the statute of limitations expired.
See the Segment Analysis section located in the Results of Operations for further details.
Liquidity
At April 29, 2018, our cash and cash equivalents, short-term investments (available for sale), and short-term and long-term investments (held-to-maturity) totaled $54.5 million compared with $54.2 million at April 30, 2017. The slight increase from the end of fiscal 2017 was primarily due to net cash provided by operating activities of $27.5 million, mostly offset by $11.8 million in capital expenditures (of which $3.8 million was vendor financed) that were mostly associated with our mattress fabric segment, $4.5 million used for the acquisition of Read Window Products, LLC, and $661,000 for our investment in a joint venture located in Haiti, $6.8 million to our shareholders in the form of regular quarterly and special dividend payments, $1.9 million in contributions to our Rabbi Trust that funds our deferred compensation plan, and $1.5 million in employee withholding tax payments associated with the vesting of certain stock-based compensation awards.
Our net cash provided by operating activities of $27.5 million in fiscal 2018 decreased $6.6 million compared with $34.1 million in fiscal 2017. The decrease is primarily due to decreased income from operations noted above.
At April 29, 2018, we did not have any borrowings outstanding under our revolving credit agreements.
Dividend Program
On June 13, 2018, we announced that our board of directors approved a regular quarterly cash dividend payment of $0.09 per share. These dividend payments are payable on July 16, 2018, to shareholders of record as of July 2, 2018.
During fiscal 2018, dividend payments totaled $6.8 million, of which $2.6 million represented a special cash dividend payment of $0.21 per share, and $4.2 million represented our regular quarterly cash dividend payments ranging from $0.08 to $0.09 per share.
28
During fiscal 2017, dividend payments totaled $6.3 million, of which $2.6 million represented a special cash dividend payment in the first quarter of $0.21 per share, and $3.7 million represented our regular quarterly cash dividend payments ranging from $0.07 to $0.08 per share.
During fiscal 2016, dividend payments totaled $8.1 million, of which $5.0 million represented a special cash dividend payment in the first quarter of $0.40 per share, and $3.1 million represented our regular quarterly cash dividend payments ranging from $0.06 to $0.07 per share.
Future dividend payments are subject to board approval and may be adjusted at the board’s discretion as business needs or market conditions change.
Common Stock Repurchases
On June 15, 2016, we announced that our board of directors approved an authorization for us to acquire up to $5.0 million of our common stock. Under the common stock repurchase program, shares may be purchased from time to time in open market transactions, block trades, through plans established under Securities Exchange Act Rule 10b5-1, or otherwise. The amount of shares purchased and the timing of such purchases will be based on working capital requirements, market and general business conditions, and other factors including alternative investment opportunities.
During fiscal 2018 and 2017, there were no repurchases of our common stock. During fiscal 2016, we purchased 100,776 shares of our common stock at a cost of $2.4 million, all of which was purchased during the third quarter.
At April 29, 2018, we had $5.0 million available for additional repurchases of our common stock
Results of Operations
The following table sets forth certain items in our consolidated statements of net income as a percentage of net sales.
|
Fiscal
|
Fiscal
|
Fiscal
|
||||||||||
|
2018
|
2017
|
2016
|
||||||||||
|
Net sales
|
100.0
|
%
|
100.0
|
%
|
100.0
|
%
|
||||||
|
Cost of sales
|
80.0
|
77.6
|
79.2
|
|||||||||
|
Gross profit
|
20.0
|
22.4
|
20.8
|
|||||||||
|
Selling, general and administrative expenses
|
11.5
|
12.7
|
11.7
|
|||||||||
|
Income from operations
|
8.5
|
9.7
|
9.1
|
|||||||||
|
Interest income, net
|
0.1
|
0.1
|
0.0
|
|||||||||
|
Other expense
|
(0.3
|
)
|
(0.2
|
)
|
(0.2
|
)
|
||||||
|
Income before income taxes
|
8.3
|
9.6
|
8.9
|
|||||||||
|
Income taxes *
|
21.4
|
24.7
|
39.3
|
|||||||||
|
Loss from investment in unconsolidated joint venture
|
0.1
|
0.0
|
0.0
|
|||||||||
|
Net income
|
6.4
|
%
|
7.2
|
%
|
5.4
|
%
|
||||||
* Calculated as a percentage of income before income taxes.
29
2018 compared with 2017
Segment Analysis
Mattress Fabrics Segment
|
Twelve Months Ended
|
||||||||||||
|
(dollars in thousands)
|
April 29,2018
|
April 30, 2017
|
Change
|
|||||||||
|
Net sales
|
$
|
192,597
|
$
|
190,805
|
0.9
|
%
|
||||||
|
Gross profit
|
38,797
|
43,065
|
(9.9
|
)%
|
||||||||
|
Gross profit margin
|
20.1
|
%
|
22.6
|
%
|
(250
|
)bp
|
||||||
|
SG&A expenses
|
12,935
|
13,685
|
(5.5
|
)%
|
||||||||
|
Income from operations
|
25,861
|
29,380
|
(12.0
|
)%
|
||||||||
|
Operating margin
|
13.4
|
%
|
15.4
|
%
|
(200
|
)bp
|
||||||
Net Sales
Although overall mattress fabrics sales increased slightly in fiscal 2018 compared to the prior year, our sales decreased 4.7% during the fourth quarter of fiscal 2018 compared to the fourth quarter of fiscal 2017. Our mattress fabrics net sales reflected more challenging market conditions with soft demand trends across the bedding industry and the impact of lower-priced imported mattresses that occurred during the fourth quarter.
Our strategic focus on product innovation and creativity allows us to provide a diverse product mix that meets the changing demands of our customers across most price points. Importantly, our net sales for fiscal 2018 reflected continued growth in our mattress cover business known as CLASS. The growth in CLASS has allowed us to develop new products with existing customers and reach new customers and additional market segments, particularly the boxed bedding space.
Currently, we expect the soft demand trends and the impact of lower-priced imported mattresses to continue into our first half of fiscal 2019.
Gross Profit and Operating Income
Overall
The decrease in mattress fabrics profitability primarily reflects higher operating costs that were incurred in the first half of fiscal 2018 and were associated with production disruptions during a transition period of substantial capital investment and supply chain enhancements designed to improve our operations and product delivery performance.
Below is a summary of our significant capital projects and improvements that were ongoing in fiscal 2017 and were completed as of the second quarter of fiscal 2018:
30
|
·
|
Our building expansion projects in North Carolina, including a new distribution center and knitted fabric plant consolidation, were completed during the first quarter of fiscal 2018
|
|
·
|
All of our knitting and other fabric forming equipment was relocated into our expanded facility located in North Carolina and placed into service as of the end of our second quarter of fiscal 2018.
|
|
·
|
We completed the relocation of our CLASS production platform to an existing facility in High Point, North Carolina, as of the end of our second quarter of fiscal 2018. We believe this relocation will provide a more efficient and streamlined production flow and access to a larger labor pool. Additionally, this facility includes expanded showroom and production development space.
|
|
·
|
We completed expansion of our Canadian operations in the fourth quarter of fiscal 2017, with additional finishing equipment and a new distribution center that will allow us to ship directly to our customers in Canada.
|
With these operational improvements behind us, we are now focused on further refinement of our overall inspection and quality processes to support our continuous improvement initiatives. We expect to realize greater operating efficiencies from these changes going forward.
Business Combination - eLuxury, LLC
Effective June 22, 2018, after the end of the fiscal year, we acquired a majority interest in eLuxury, an internet company offering bedding accessories and home goods directly to consumers. The company's primary products include a line of mattress pads manufactured at eLuxury’s facility in Evansville, Indiana. eLuxury also offers handmade platform beds,
cotton bed sheets,
and other bedding items. Their products are available on eLuxury’s own branded website,
eLuxury.com
, Amazon and other leading online retailers for specialty home goods.
We believe this acquisition will provide a new sales channel for the bedding accessory category and will expand our opportunity to participate in the rapidly growing e-commerce direct-to-consumer space. This business combination brings together eLuxury’s experience in e-commerce, online brand building, and direct-to-consumer shopping and fulfillment expertise with our global production, sourcing and distribution capabilities. We also have an opportunity to market our new line of bedding accessories, marketed under the brand name, 'Comfort Supply Company by Culp', as well as other finished products that we may develop, including items made from upholstery fabrics, through this e‑commerce platform.
The estimated purchase price for this acquisition is $12.5 million, of which $11.6 million was paid at closing, with the remaining $874,000 amount to be paid based on hold back provisions defined in the purchase agreement. The agreement contains a contingent consideration arrangement that requires us to pay the seller based on adjusted EBITDA to be determined over a three-year period in relation to a pre-established adjusted EBITDA target. We are currently performing our preliminary valuation of the allocation of the purchase price among the assets and equity interest acquired and liabilities assumed.
Joint Venture
Effective January 1, 2017, Culp International Holdings, Ltd. (Culp), a wholly-owned subsidiary of Culp, Inc., entered into a joint venture agreement, pursuant to which Culp owns fifty percent of CLASS International Holdings, Ltd (CLIH). CLIH produces cut and sewn mattress covers, and its operations are located in a modern industrial park on the northeast border of Haiti, which borders the Dominican Republic. CLIH commenced production in the second quarter of fiscal 2018 and complements our mattress fabric operations with a mirrored platform that enhances our ability to meet customer demand while adding a lower cost operation to our platform (see note 7 located in the notes to the consolidated financial statements for further details).
31
Segment Assets
Segment assets consist of accounts receivable, inventory, property, plant and equipment, investment in an unconsolidated joint venture, goodwill, a non-compete agreement and customer relationships associated with an acquisition.
|
(dollars in thousands)
|
April 29,2018
|
April 30, 2017
|
% Change
|
|||||||||
|
Accounts receivable and inventory
|
$
|
43,935
|
$
|
47,038
|
(6.6
|
)%
|
||||||
|
Property, plant & equipment
|
48,797
|
48,916
|
(0.2
|
)%
|
||||||||
| Goodwill | 11,462 | 11,462 | 0.0 | % | ||||||||
|
Investment in unconsolidated joint venture
|
1,501
|
1,106
|
35.7
|
%
|
||||||||
|
Non-compete agreement
|
753
|
828
|
(9.1
|
)%
|
||||||||
|
Customer Relationships
|
613
|
664
|
(7.7
|
)%
|
||||||||
Accounts Receivable & Inventory
As of April 29, 2018, accounts receivable and inventory decreased $3.1 million or 6.6%, compared with April 30, 2017. This decrease is primarily due to the decrease in sales volume during the fourth quarter of fiscal 2018 compared with the fourth quarter of fiscal 2017 noted above.
Property, Plant & Equipment
The $48.8 million at April 29, 2018, represents property, plant and equipment of $35.4 million and $13.4 million located in the U.S. and Canada, respectively. The $48.9 million at April 30, 2017, represents property, plant, and equipment of $34.0 million and $14.9 million located in the U.S. and Canada, respectively.
As of April 29, 2018, property, plant, and equipment was flat compared with April 30, 2017. The mattress fabric segment incurred depreciation expense of $6.8 million and had capital spending of $6.7 million in fiscal 2018.
Investment in Unconsolidated Joint Venture
Our investment in unconsolidated joint venture represents our fifty percent ownership of CLIH noted above.
Non-Compete Agreement and Customer Relationships
The decreases in carrying values of our non-compete agreement and customer relationships at April 29, 2018, compared with April 30, 2017, are primarily due to amortization expense in fiscal 2018.
32
Upholstery Fabrics Segment
Net Sales
|
Twelve Months Ended
|
||||||||||||||||||||
|
(dollars in thousands)
|
April 29, 2018
|
April 30, 2017
|
% Change
|
|||||||||||||||||
|
Non-U.S. Produced
|
$
|
122,635
|
94
|
%
|
$
|
109,012
|
92
|
%
|
12.5
|
%
|
||||||||||
|
U.S Produced
|
8,493
|
6
|
%
|
9,727
|
8
|
%
|
(12.6
|
)%
|
||||||||||||
|
Total
|
$
|
131,128
|
100
|
%
|
$
|
118,739
|
100
|
%
|
10.4
|
%
|
||||||||||
The increase in upholstery fabric net sales reflects our product-driven strategy with a sustained focus on innovation and creative designs, supported by our manufacturing platform located in China. Our ability to provide a diverse product offering has allowed us to reach new market segments. Our results reflect the success of this strategy, highlighted by expanded sales of LiveSmart®, our popular “performance” line of highly durable stain-resistant fabric. We have recently launched a new website specifically to promote this innovative product line, along with a more aggressive marketing campaign.
Also, we achieved continued sales growth in fabrics designed for the hospitality market. In order to take advantage of the growth opportunities in the hospitality market, we completed the acquisition of Read Window Products, LLC during the fourth quarter of fiscal 2018 (see below for further details).
Gross Profit and Operating Income
|
Twelve Months Ended
|
||||||||||||
|
(dollars in thousands)
|
April 29,2018
|
April 30, 2017
|
Change
|
|||||||||
|
Gross profit
|
$
|
25,836
|
$
|
26,170
|
(1.3
|
)%
|
||||||
|
Gross profit margin
|
19.7
|
%
|
22.0
|
%
|
(230
|
)bp
|
||||||
|
SG&A expenses
|
14,881
|
15,079
|
(1.3
|
)%
|
||||||||
|
Income from operations
|
10,956
|
11,091
|
(1.2
|
)%
|
||||||||
|
Operating margin
|
8.4
|
%
|
9.3
|
%
|
(90
|
)bp
|
||||||
Despite the increase in net sales noted above, our profitability in upholstery fabrics decreased in fiscal 2018 compared with the same period a year ago. The decrease in profitability was primarily due to higher operating costs associated with our operations located in China resulting from unfavorable foreign exchange rates experienced in the second half of fiscal 2018, and a decline in profitability associated with our U.S. upholstery fabric operation located in Anderson, South Carolina, resulting from changing consumer style preferences and reduced customer demand for products made in this facility. (see below for further details regarding closure of our Anderson, South Carolina plant facility).
Business Combination - Read Window Products, LLC
Effective April 1, 2018, we entered into an Asset Purchase Agreement (Agreement) to acquire certain assets and assume certain liabilities of Read Window Products, Inc. (Read), a source of custom window treatments for the hospitality and commercial industries. Based in Knoxville, Tennessee, Read is a turn-key provider of window treatments offering measuring, sourcing, fabrication and installation services. Read’s custom product line includes motorization, shades, drapery, upholstered headboards and shower curtains. In addition, Read supplies soft goods such as decorative top sheets, coverlets, duvet covers, bed skirts, bolsters and pillows, for leading hospitality brands worldwide. The addition of window treatments and other soft goods to our product line will allow us to be a more complete source of fabrics for the hospitality market, in which we believe there are significant growth opportunities.
33
The purchase price for the net assets acquired was $5.7 million, of which $4.5 million was paid at closing on Apri1 1, 2018, $375,000 was paid in May 2018, and $763,000 is to be paid in June in 2019, subject to certain conditions as defined in the Agreement.
The Agreement contains a contingent consideration arrangement that requires us to pay the former shareholder of Read based on adjusted EBITDA as defined in the agreement for calendar year 2018 in excess of fifty percent of a pre-established adjusted EBITDA target. Based on historical and projected financial results in relation to the pre-established adjusted EBITDA target, we currently believe a contingent payment will not be made, and therefore, no contingent liability has been recorded.
The following table presents the final allocation of the acquisition cost to the assets acquired and liabilities assumed based on their fair values.
|
dollars in thousands)
|
Fair Value
|
|||
|
Customer relationships (Note 8)
|
$
|
2,247
|
||
|
Goodwill (Note 6)
|
2,107
|
|||
|
Inventory
|
1,128
|
|||
|
Accounts receivable
|
897
|
|||
|
Tradename (Note 8)
|
683
|
|||
|
Property, plant & equipment
|
379
|
|||
|
Other assets
|
35
|
|||
|
Deferred revenue
|
(903
|
)
|
||
|
Accounts payable
|
(719
|
)
|
||
|
Accrued expenses
|
(174
|
)
|
||
|
$
|
5,680
|
|||
We recorded customer relationships at fair market value based on a multi-period excess earnings valuation model. These customer relationships will be amortized on a straight-line basis over their nine-year useful life. We recorded the tradename at fair market based on the relief from royalty method. This tradename was determined to have an indefinite useful life and, therefore, is not being amortized. Equipment will be depreciated on a straight-line basis over useful lives ranging from three to ten years. Goodwill is deductible for income tax purposes over the statutory period of fifteen years.
Acquisition costs totaling $339,000 were included in selling, general, and administrative expenses in our fiscal 2018 Consolidated Statement of Net Income.
34
The following unaudited pro forma consolidated results of operations for the years ending April 29, 2018 and April 30, 2017 have been prepared as if the acquisition of Read had occurred at May 2, 2016.
|
Years ended
|
||||||||
|
(dollars in thousands, except per share data)
|
April 29, 2018
|
April 30, 2017
|
||||||
|
Net Sales
|
$
|
334,953
|
$
|
321,398
|
||||
|
Income from operations
|
26,799
|
30,441
|
||||||
|
Net income
|
20,455
|
22,552
|
||||||
|
Net income per share, basic
|
1.65
|
1.83
|
||||||
|
Net income per share, diluted
|
1.62
|
1.80
|
||||||
The unaudited pro forma information is presented for informational purposes only and is not necessarily indicative of the results of operations that actually would have been achieved had the acquisition been consummated as of that time, nor is it intended to be a projection of future results.
Actual revenue and net income for the month of April 2018 were included in our Consolidated Statement of Net Income and totaled $880,000 and $5,000, respectively.
Exit and Disposal Activity
On June 12, 2018, our board of directors decided to close our upholstery fabrics manufacturing facility in Anderson, South Carolina. This closure is due to a continued decline in demand for the products manufactured at this facility, reflecting a change in consumer style preferences. We expect to close the facility by October 30, 2018. This action is expected to result in estimated cash charges of approximately $450,000 for employee termination costs, and an undetermined non-cash charge associated with write-downs of inventory. During this transition period, we will be working with our customers to fulfill any outstanding and future orders, and through this process we will be able to determine a good faith estimate of any write-downs of inventory. Currently, management estimates that the fair market value of the long-lived assets at this facility exceeds their carrying amount of approximately $400,000, and for this reason no charge for impairment of long-lived assets is expected to be recorded in connection with this decision.
Segment assets consist of accounts receivable, inventory, property, plant, and equipment, and goodwill, customer relationships, and tradename in connection with the acquisition of Read.
|
(dollars in thousands)
|
April 29,2018
|
April 30, 2017
|
% Change
|
|||||||||
|
Accounts receivable and inventory
|
$
|
35,826
|
$
|
29,021
|
23.4
|
%
|
||||||
|
Customer relationships
|
2,226
|
-
|
100.0
|
%
|
||||||||
|
Goodwill
|
2,107
|
-
|
100.0
|
%
|
||||||||
|
Tradename
|
683
|
-
|
100.0
|
%
|
||||||||
|
Property, plant & equipment
|
2,445
|
1,879
|
30.1
|
%
|
||||||||
Accounts Receivable & Inventory
As of April 29, 2018, accounts receivable and inventory increased $6.8 million, or 23%, or compared with April 30, 2017. This increase is primarily due to the increased sales volume during the fourth quarter of fiscal 2018 compared with the fourth quarter of fiscal 2017 and accounts receivable and inventory totaling $2.0 million that was acquired from Read as noted above.
35
Property, Plant & Equipment
The $2.4 million at April 29, 2018, represents property, plant, and equipment located in the U.S. of $1.8 million and located in China of $661,000. The $1.9 million at April 30, 2017, represents property, plant, and equipment located in the U.S. of $1.2 million and located in China of $655,000.
Customer Relationships, Goodwill, and Tradenname
Our customer relationships, goodwill, and tradename intangible assets were acquired in connection with the acquisition of Read as noted above.
Other Income Statement Categories
|
Twelve Months Ended
|
||||||||||||
|
(dollars in thousands)
|
April 29,2018
|
April 30, 2017
|
% Change
|
|||||||||
|
SG&A expenses
|
$
|
37,172
|
$
|
39,157
|
(5.1
|
)%
|
||||||
|
Interest expense
|
94
|
-
|
100.0
|
%
|
||||||||
|
Interest income
|
534
|
299
|
78.6
|
%
|
||||||||
|
Other expense
|
1,018
|
681
|
49.5
|
%
|
||||||||
Selling, General and Administrative Expenses
SG&A expenses for fiscal 2018 compared with the fiscal 2017 included lower incentive compensation expense reflecting weaker financial results in relation to pre-established financial targets, partially offset by the following items that increased SG&A expenses:
|
·
|
Non-recurring charges associated with the consolidation of our mattress production facilities that were primarily incurred during the first half of fiscal 2018.
|
|
·
|
Non-recurring legal and other professional fees incurred that relate to acquisition activity.
|
Interest Expense
Interest costs incurred were $194,000 during fiscal 2018 compared with $158,000 for the same period a year ago. Our interest costs during fiscal 2018 and 2017 pertain to borrowings associated with our U.S. revolving line of credit and with the construction of a new building associated with our mattress fabrics segment (Refer to Notes 11 and 12 located in the notes to the consolidated financial statements for further details).
The interest costs incurred during fiscal 2018 were partially offset by interest costs totaling $100,000 for the construction of qualifying fixed assets that were capitalized through the second quarter. Interest costs incurred during fiscal 2017 were fully offset by interest costs for the construction of qualifying fixed assets that were capitalized. Interest costs that have been capitalized will be amortized over the related assets’ useful lives.
36
Interest Income
Interest income increased during fiscal 2018 compared with the same period a year ago. The increase in interest income was due to management's decision at the end of the second quarter of fiscal 2017 to invest approximately $31.0 million in investment grade U.S. Corporate bonds with maturities that primarily ranged from 2 to 2.5 years. The purpose of this investment was to earn a higher rate of return on our excess cash located in the Cayman Islands.
Other Expense
Other expense increased during fiscal 2018 compared with the same period a year ago. This increase was mostly due to unfavorable foreign currency exchange rates associated with our operations located in China.
Income Taxes
Effective Income Tax Rate
We recorded income tax expense of $5.7 million, or 21.4% of income before income tax expense, in fiscal 2018 compared with income tax expense of $7.3 million, or 24.7% of income before income tax expense, in fiscal 2017. The following schedule summarizes the principal differences between income tax expense at the federal income tax rate and the effective income tax rate reflected in the consolidated financial statements:
|
|
2018
|
2017 | ||||||
|
federal income tax rate
|
30.4
|
%
|
34.0
|
%
|
||||
|
tax effects of the 2017 Tax Cuts and Jobs Act
|
(7.6
|
)
|
-
|
|||||
|
tax effects of Chinese foreign exchange (losses) gains
|
(2.8
|
)
|
1.6
|
|||||
|
reversal of foreign uncertain income tax position
|
-
|
(11.6
|
)
|
|||||
|
tax effects of stock-based compensation
|
(1.8
|
)
|
-
|
|||||
|
undistributed earnings from foreign subsidiaries
|
3.7
|
-
|
||||||
|
other
|
(0.5
|
)
|
0.7
|
|||||
|
21.4
|
%
|
24.7
|
%
|
|||||
2017 Tax Cuts and Jobs Act
On December 22, 2017 (the “Enactment Date”), the Tax Cuts and Jobs Act (H.R.1) (the “Tax Act”) was signed into law. The Tax Act contains significant changes to corporate taxation, including (i) the reduction of the corporate income tax rate to 21%, (ii) the acceleration of expensing certain business assets, (iii) a one-time mandatory repatriation tax (the “Transition Tax”) related to the transition of U.S. international tax from a worldwide tax system to a territorial tax system, (iv) limitations on the use of foreign tax credits to reduce the U.S. income tax liability, (v) the repeal of the domestic production activities deduction, (vi) additional limitations on the deductibility of interest expense and executive compensation, and (vii) the creation of new minimum taxes such as the base erosion anti-abuse tax and Global Intangible Low Taxed Income tax.
The corporate income tax rate reduction is effective as of January 1, 2018. Since we have a fiscal year rather than a calendar year, we are subject to IRS rules relating to transitional income tax rates. As a result, our fiscal 2018 federal statutory rate is a blended income tax rate of 30.4%. For fiscal 2019 and beyond, we will utilize the enacted U.S. federal corporate income tax rate of 21%.
The key impacts of the Tax Act on our financial statements for fiscal 2018 were the re-measurement of our U.S. deferred income tax balances to the new U.S. federal corporate income tax rate and the determination of the income tax effects of the Transition Tax on our accumulated earnings and profits associated with our foreign subsidiaries. While we have not yet completed our assessment of the effects of the Tax Act, we were able to determine reasonable estimates for the impacts of the key items specified above, and thus we reported provisional amounts for these items under guidance provided by SEC Staff Accounting Bulletin No. 118 (“SAB 118”). Our estimates may change and revisions to these estimates will be recorded during the measurement period allowed by SAB 118, which is not to extend beyond one year from the Enactment Date.
37
Refer to Note 10 located in the notes to the consolidated financial statements for disclosures regarding our assessments and provisional estimates recorded with regard to the Tax Act during fiscal 2018.
Deferred Income Taxes – Valuation Allowance
Summary
In accordance with ASC Topic 740, we evaluate our deferred income taxes to determine if a valuation allowance is required. ASC Topic 740 requires that companies assess whether a valuation allowance should be established based on the consideration of all available evidence using a “more likely than not” standard with significant weight being given to evidence that can be objectively verified. Since the company operates in multiple jurisdictions, we assess the need for a valuation allowance on a jurisdiction-by-jurisdiction basis, taking into account the effects of local tax law.
Refer to Note 10 located in the notes to the consolidated financial statements for disclosures regarding our assessments of our recorded valuation allowance as of April 29, 2018 and April 30, 2017, respectively.
Deferred Income Taxes – Undistributed Earnings from Foreign Subsidiaries
In accordance with ASC Topic 740, we assess whether the undistributed earnings from our foreign subsidiaries will be reinvested indefinitely or eventually distributed to our U.S. parent company. ASC Topic 740 requires that a deferred tax liability should be recorded for undistributed earnings from foreign subsidiaries that will not be reinvested indefinitely. Also, we assess the recognition of U.S. foreign income tax credits associated with foreign withholding and income tax payments and whether it is more-likely-than-not that our foreign income tax credits will not be realized. If it is determined that any foreign income tax credits need to be recognized or it is more-likely-than-not our foreign income tax credits will not be realized, an adjustment to our provision for income taxes will be recognized at that time.
Refer to Note 10 located in the notes to the consolidated financial statements for disclosures regarding our assessments of our recorded deferred income tax liability balances associated with our undistributed earnings from our foreign subsidiaries as of April 29, 2018 and April 30, 2017, respectively.
Uncertainty in Income Taxes
At April 29, 2018, we had a $844,000 total gross unrecognized income tax benefit, of which $379,000 and $465,000 were classified as net non-current deferred income taxes and income taxes payable – long-term, respectively, in the accompanying consolidated balance sheets. Our gross unrecognized income tax benefit of $844,000 relates to double taxation under applicable income tax treaties with foreign tax jurisdictions, in which currently, significant change is not expected within the next fiscal year.
United States federal income tax returns filed by us remain subject to examination for income tax years 2017 and subsequent. Canadian federal income tax returns filed by us remain subject to examination for income tax years 2014 and subsequent. Canadian provincial (Quebec) income tax returns filed by us remain subject to examination for income tax years 2016 and subsequent. Income tax returns associated with our operations located in China are subject to examination for income tax year 2013 and subsequent.
38
During the third quarter of fiscal 2017, Revenue Quebec commenced an examination of our Canadian provincial (Quebec) income tax returns for fiscal years 2013 through 2015. This examination was completed during the fourth quarter of fiscal 2018 with final adjustments totaling $4,000.
During the fourth quarter of fiscal 2016, the Internal Revenue Service commenced and examination of our U.S. Federal income tax returns for fiscal years 2014 through 2016. This examination was effectively settled during the fourth quarter of fiscal 2018 with no adjustment.
In accordance with ASC Topic 740, an unrecognized income tax benefit for an uncertain income tax position can be recognized in the first interim period if the more-likely-than-not recognition threshold is met by the reporting period, or is effectively settled through examination, negotiation, or litigation, or the statute of limitations for the relevant taxing authority to examine and challenge the tax position has expired. If it is determined that any of the above conditions occur regarding our uncertain income tax positions, an adjustment to our unrecognized income tax benefit will be recorded at that time.
Refer to Note 10 located in the notes to the consolidated financial statements for disclosures and additional information regarding our uncertain income tax positions.
Income Taxes Paid
We reported income tax expense of $5.7 million and $7.3 million in fiscal 2018 and 2017, respectively. However, our income tax payments totaled $4.0 million and $5.5 million for fiscal 2018 and 2017, respectively. These income tax payments primarily relate to our subsidiaries located in China and Canada.
As a result of the Tax Act noted above, we do expect to start making income tax payments associated with the Transition Tax in fiscal 2019. Taxpayers can elect to pay the Transition Tax over a period of eight years, and we intend to make this election. Additionally, as part of the Tax Act, we expect to elect out of using U.S. federal net loss operating carryforwards to offset the Transition Tax in order to fully utilize our foreign tax credits. As a result, we have $7.4 million of U.S. federal net operating loss carryforwards to apply against fiscal 2019 taxable income. This fact, coupled with the lower U.S. corporate income tax rate and the immediate expensing of U.S. capital expenditures next year, is currently expected to result in minimal U.S. cash income taxes paid in fiscal 2019.
39
2017 compared with 2016
Segment Analysis
Mattress Fabrics Segment
|
Twelve Months Ended
|
||||||||||||
|
(dollars in thousands)
|
April 30, 2017
|
May 1, 2016
|
Change
|
|||||||||
|
Net sales
|
$
|
190,805
|
$
|
186,419
|
2.4
|
%
|
||||||
|
Gross profit
|
43,065
|
38,718
|
11.2
|
%
|
||||||||
|
Gross profit margin
|
22.6
|
%
|
20.8
|
%
|
180
|
bp
|
||||||
|
SG&A expenses
|
13,685
|
12,223
|
12.0
|
%
|
||||||||
|
Income from operations
|
29,380
|
26,496
|
10.9
|
%
|
||||||||
|
Operating margin
|
15.4
|
%
|
14.2
|
%
|
120
|
bp
|
||||||
Net Sales
During fiscal 2017, mattress fabrics segment reported year-over-year improvement in net sales, in spite of the ongoing issues that surrounded the mattress industry and a soft retail sales environment. Our focus on design and innovation were a top priority and allowed us to have a favorable product mix of mattress fabrics and cut and sew covers across most price points and style trends. Our mattress cover business, known as CLASS, continued to perform well. The growth in CLASS allowed us to develop new products with existing customers and reach new customers and additional market segments, especially the growing Internet ‘bed in a box’ space.
Gross Profit and Operating Income
Overall
Our mattress fabric gross profit and operating income increased in fiscal 2017 compared to fiscal 2016. The increase in operating income reflected lower raw material costs and benefits from our capital investments. Additionally, operating income for mattress fabrics was negatively affected by SG&A expenses relating to higher inventory warehousing costs, design and sales expenses, and plant facility consolidation charges totaling $560,000 in fiscal 2017.
40
Segment Assets
Segment assets consist of accounts receivable, inventory, property, plant and equipment, investment in an unconsolidated joint venture, goodwill, a non-compete agreement and customer relationships associated with an acquisition.
|
(dollars in thousands)
|
April 30, 2017
|
May 1, 2016
|
% Change
|
|||||||||
|
Accounts receivable and inventory
|
$
|
47,038
|
$
|
43,472
|
8.2
|
%
|
||||||
|
Property, plant & equipment
|
48,916
|
37,480
|
30.5
|
%
|
||||||||
| Goodwill | 11,462 | 11,462 | 0.0 | % | ||||||||
|
Investment in unconsolidated joint venture
|
1,106
|
-
|
100
|
%
|
||||||||
|
Non-compete agreement
|
828
|
903
|
(8.3
|
)%
|
||||||||
|
Customer Relationships
|
664
|
715
|
(7.1
|
)%
|
||||||||
Accounts Receivable & Inventory
As of April 30, 2017, accounts receivable and inventory increased $3.6 million compared with May 1, 2016. This increase was due to an increase in inventory of $2.5 million, as a result of having higher inventory levels to meet expected demand trends for new production introductions, and a $1.1 million increase in accounts receivable due to the extension of discount credit terms with certain key customers that occurred in the fourth quarter of fiscal 2017.
Property, Plant & Equipment
The $48.9 million at April 30, 2017, represented property, plant and equipment of $34.0 million and $14.9 million located in the U.S. and Canada, respectively. The $37.5 million at May 1, 2016, represented property, plant, and equipment of $24.8 million and $12.7 million located in the U.S. and Canada, respectively.
As of April 30, 2017, property, plant, and equipment increased $11.4 million compared with May 1, 2016. This increase was due to capital expenditures of $17.6 million that primarily relate to the construction of a new building (see Note 12 of the consolidated financial statements for further details) and purchases and installation of machinery and equipment, partially offset by depreciation expense of $6.2 million for fiscal 2017.
Investment in Unconsolidated Joint Venture
Our investment in unconsolidated joint venture represents our fifty percent ownership of CLIH noted above.
Non-Compete Agreement and Customer Relationships
The decreases in carrying values of our non-compete agreement and customer relationships at April 30, 2017 compared with May 1, 2016, are primarily due to amortization expense in fiscal 2017.
41
Upholstery Fabrics Segment
Net Sales
|
Twelve Months Ended
|
||||||||||||||||||||
|
(dollars in thousands)
|
April 30, 2017
|
May 1, 2016
|
% Change
|
|||||||||||||||||
|
Non U.S. Produced
|
$
|
109,012
|
92
|
%
|
$
|
115,167
|
91
|
%
|
(5.3
|
)%
|
||||||||||
|
U.S Produced
|
9,727
|
8
|
%
|
11,274
|
9
|
%
|
(13.7
|
)%
|
||||||||||||
|
Total
|
$
|
118,739
|
100
|
%
|
$
|
126,441
|
100
|
%
|
(6.1
|
)%
|
||||||||||
Our decrease in net sales reflected the soft retail environment for residential furniture that persisted for most of fiscal 2017 and our strategy to enhance both our customer and product mix to improve our profitability with a focus on design and innovation.
Gross Profit and Operating Income
|
Twelve Months Ended
|
||||||||||||
|
(dollars in thousands)
|
April 30, 2017
|
May 1, 2016
|
Change
|
|||||||||
|
Gross profit
|
$
|
26,170
|
$
|
26,393
|
(0.8
|
)%
|
||||||
|
Gross profit margin
|
22.0
|
%
|
20.9
|
%
|
110
|
bp
|
||||||
|
SG&A expenses
|
15,079
|
15,094
|
(0.1
|
)%
|
||||||||
|
Income from operations
|
11,091
|
11,298
|
(1.8
|
)%
|
||||||||
|
Operating margin
|
9.3
|
%
|
8.9
|
%
|
40
|
bp
|
||||||
Despite the decrease in net sales noted above, our gross profit and operating margins increased in fiscal 2017 compared with the same period a year earlier. This trend reflected our strategy to enhance both our customer and product mix to improve our profitability, and lower operating expenses associated with our operations located in China resulting from more favorable currency exchange rates.
Segment Assets
Segment assets consist of accounts receivable, inventory, and property, plant, and equipment.
|
(dollars in thousands)
|
April 30, 2017
|
May 1, 2016
|
% Change
|
|||||||||
|
Accounts receivable and inventory
|
$
|
29,021
|
$
|
26,540
|
9.4
|
%
|
||||||
|
Property, plant & equipment
|
1,879
|
1,564
|
20.1
|
%
|
||||||||
Accounts Receivable & Inventory
As of April 30, 2017, accounts receivable and inventory increased $2.5 million compared with May 1, 2016. This increase was due to an increase in inventory of $2.5 million, as a result of customers requiring us to hold higher inventory levels of key products.
42
Property, Plant & Equipment
The $1.9 million at April 30, 2017, represented property, plant, and equipment located in the U.S. of $1.2 million and located in China of $655,000. The $1.6 million at May 1, 2016, represented property, plant, and equipment located in the U.S. of $893,000 and located in China of $671,000.
Other Income Statement Categories
|
Twelve Months Ended
|
||||||||||||
|
(dollars in thousands)
|
April 30, 2017
|
May 1, 2016
|
% Change
|
|||||||||
|
SG&A expenses
|
$
|
39,157
|
$
|
36,773
|
6.5
|
%
|
||||||
|
Interest income
|
299
|
176
|
69.9
|
%
|
||||||||
|
Other expense
|
681
|
616
|
10.6
|
%
|
||||||||
Selling, General and Administrative Expenses
The increase in SG&A expenses for fiscal 2017 compared with fiscal 2016, was primarily due to higher incentive compensation expense reflecting stronger financial results in relation to pre-established performance targets. This increase was also due to higher inventory warehousing costs, design and sales expenses, and non-recurring plant facility consolidation charges totaling $560,000 for fiscal 2017 that were associated with our mattress fabrics segment.
Interest Expense
Interest costs incurred were $158,000 and $58,000 during fiscal 2017 and 2016, respectively. The interest costs incurred we
re fully offset by interest costs for the construction of qualifying fixed assets that were capitalized and will be amortized over the related assets’ useful lives.
Interest Income
Interest income increased during fiscal 2017 compared with fiscal 2016. Th
e increase was due to management’s decision at the end of the second quarter of fiscal 2017 to invest approximately $31.0 million in investment grade U.S. Corporate bonds with maturities
that ranged from 2 to 2.5 years. The purpose of this investment was to earn a higher rate of return on our excess cash located in the Cayman Islands.
Other Expense
Other expense for fiscal 2017 was comparable to fiscal 2016.
43
Income Taxes
Effective Income Tax Rate
We recorded income tax expense of $7.3 million, or 24.7% of income before income tax expense, in fiscal 2017 compared with income tax expense of $11.0 million, or 39.3% of income before income tax expense, in fiscal 2016. The following schedule summarizes the principal differences between income tax expense at the federal income tax rate and the effective income tax rate reflected in the consolidated financial statements:
|
2017
|
2016
|
|||||||
|
federal income tax rate
|
34.0
|
%
|
34.0
|
%
|
||||
|
tax effects of Chinese foreign exchange gains
|
1.6
|
4.4
|
||||||
|
reversal of foreign uncertain income tax position
|
(11.6
|
)
|
-
|
|||||
|
other
|
0.7
|
0.9
|
||||||
|
24.7
|
%
|
39.3
|
%
|
|||||
Liquidity and Capital Resources
Liquidity
Overall
Currently, our sources of liquidity include cash and cash equivalents, short-term investments (available for sale), cash flow from operations, and amounts available under our revolving credit lines. These sources have been adequate for day-to-day operations, capital expenditures, debt payments, common stock repurchases, and dividend payments. We believe our present cash and cash equivalents and short-term investment balance (available for sale) totaling $23.7 million at April 29,2018, cash flow from operations, and current availability under our revolving credit lines will be sufficient to fund our business needs and our contractual obligations (see commitments table below).
At April 29, 2018, our cash and cash equivalents, short-term investments (available for sale), and short-term and long-term investments (held-to-maturity) totaled $54.5 million compared with $54.2 million at April 30, 2017. The slight increase from the end of fiscal 2017 was primarily due to net cash provided by operating activities of $27.5 million, mostly offset by $11.8 million in capital expenditures (of which $3.8 million was vendor financed) that were mostly associated with our mattress fabric segment, $4.5 million used for the acquisition of Read Window Products, LLC, and $661,000 for our investment in a joint venture located in Haiti, $6.8 million to our shareholders in the form of regular quarterly and special dividend payments, $1.9 million in contributions to our Rabbi Trust that funds our deferred compensation plan, and $1.5 million in employee withholding tax payments associated with the vesting of certain stock-based compensation awards.
Our net cash provided by operating activities of $27.5 million in fiscal 2018 decreased $6.6 million compared with $34.1 million in fiscal 2017. The decrease is primarily due to decreased income from operations.
At April 29, 2018, we did not have any borrowings outstanding under our credit agreements.
Our cash and cash equivalents and short-term investments may be adversely affected by factors beyond our control, such as weakening industry demand and delays in receipt of payments on accounts receivable.
44
By Geographic Area
We currently hold cash and cash equivalents, short-term investments (available for sale), and short-term and long-term investments (held-to-maturity) in the U.S. and our foreign jurisdictions to support operational requirements, potential acquisitions, to mitigate our risk related to foreign exchange rate fluctuations, and for U.S. and foreign income tax planning purposes.
A summary of our cash and cash equivalents, short-term investments (available for sale), and short-term and long-term investments (held-to-maturity) by geographic area follows:
|
April 29,
|
April 30,
|
|||||||
|
(dollars in thousands)
|
2018
|
2017
|
||||||
|
Cayman Islands
|
$
|
31,000
|
$
|
34,965
|
||||
|
United States
|
10,537
|
2,228
|
||||||
|
China
|
9,221
|
12,722
|
||||||
|
Canada
|
3,715
|
4,268
|
||||||
|
$
|
54,473
|
$
|
54,183
|
|||||
Currently, we are holding a significant amount of our cash and investments with our international holding company located in the Cayman Islands. Our cash and investments located in this jurisdiction stemmed from accumulated earnings and profits (totaling $50.4 million as of April 29, 2018) that were distributed from our subsidiaries located in China. Our cash and investments held in the Cayman Islands are currently expected to be used for the following business purposes:
|
·
|
Mitigate our risk related to foreign exchange rate fluctuations for assets and liabilities denominated in Chinese Yuan Renminbi by holding more cash and investments denominated in U.S. dollars.
|
|
·
|
Fund any potential acquisitions.
|
|
·
|
Repatriate earnings and profits generated from our China operations to the U.S. parent for various strategic purposes. Currently, we have repatriated accumulated earnings and profits residing in the Cayman Islands totaling $19.9 million as of April 29, 2018.
|
During the second quarter of fiscal 2017, management decided to invest approximately $31.0 million in investment grade U.S. Corporate bonds with maturities that ranged from 2 to 2.5 years. The purpose of this investment was to earn a higher rate of return on our excess cash located in the Cayman Islands.
Dividend Program
On June 13, 2018, we announced that our board of directors approved a regular quarterly cash dividend payment of $0.09 per share. These dividend payments are payable on July 16, 2018, to shareholders of record as of July 2, 2018.
During fiscal 2018, dividend payments totaled $6.8 million, of which $2.6 million represented a special cash dividend payment of $0.21 per share, and $4.2 million represented our regular quarterly cash dividend payments ranging from $0.08 to $0.09 per share.
During fiscal 2017, dividend payments totaled $6.3 million, of which $2.6 million represented a special cash dividend payment in the first quarter of $0.21 per share, and $3.7 million represented our regular quarterly cash dividend payments ranging from $0.07 to $0.08 per share.
45
During fiscal 2016, dividend payments totaled $8.1 million, of which $5.0 million represented a special cash dividend payment in the first quarter of $0.40 per share, and $3.1 million represented our regular quarterly cash dividend payments ranging from $0.06 to $0.07 per share.
Future dividend payments are subject to board approval and may be adjusted at the board’s discretion as business needs or market conditions change.
Common Stock Repurchases
On June 15, 2016, we announced that our board of directors approved an authorization for us to acquire up to $5.0 million of our common stock. Under the common stock repurchase program, shares may be purchased from time to time in open market transactions, block trades, through plans established under the Securities Exchange Act Rule 10b5-1, or otherwise. The amount of shares purchased and the timing of such purchases will be based on working capital requirements, market and general business conditions, and other factors including alternative investment opportunities.
During fiscal 2018 and 2017, there were no repurchases of our common stock.
At April 29, 2018, we had $5.0 million available for additional repurchases of our common stock.
Working Capital
Accounts receivable at April 29, 2018, were $26.3 million, an increase of $1.7 million or 7%, compared with $24.6 million at April 30, 2017. This increase in our accounts receivable primarily related to our upholstery fabrics segment and resulted from an increase in net sales in the fourth quarter of fiscal 2018 compared with the fourth quarter of fiscal 2017, as well as accounts receivable totaling $897,000 that were acquired from Read. Days’ sales in receivable were 30 days and 29 days during the fourth quarters of fiscal 2018 and 2017, respectively.
Inventories at April 29, 2018 were $53.5 million, an increase of 4%, compared with $51.5 million at April 30, 2017. This increase was primarily due to an increase in the upholstery fabric segment’s inventory of $4.8 million, resulting from increased sales volume in the fourth quarter of fiscal 2018 compared with the fourth quarter of fiscal 2017, as well as inventory totaling $1.1 million that was acquired from Read. The increase in the upholstery fabrics segment’s inventory was partially offset by a decrease in the mattress fabric segment’s inventory of $2.8 million, resulting from decreased sales volume in the fourth quarter of fiscal 2018 compared with the fourth quarter of fiscal 2017. Inventory turns were 4.8 and 5.0 during the fourth quarters of fiscal 2018 and 2017, respectively.
Accounts payable-trade at April 29, 2018, were $27.2 million, a decrease of 6% compared with $29.1 million at April 30, 2017. This decrease was primarily due to a decrease in the mattress fabric segment’s accounts payable of $2.7 million, resulting from decreased sales volume in the fourth quarter of fiscal 2018 compared with fiscal 2017, partially offset by accounts payable totaling $719,000 that was assumed from Read.
Operating working capital (accounts receivable and inventories, less deferred revenue and accounts payable –trade and capital expenditures) was $49.9 million at April 29, 2018, compared with $40.9 million at April 30, 2017. Operating working capital turnover was 7.1 in fiscal 2018 compared to 7.3 in fiscal 2017.
46
Financing Arrangements
Currently, we have revolving credit agreements with banks for our U.S parent company and our operations located in China. The purposes of our revolving credit lines of credit are to support potential short-term cash needs in different jurisdictions, mitigate our risk related to foreign currency exchange rate fluctuations, and ultimately repatriate earnings and profits from our foreign subsidiaries to the U.S. for various strategic purposes. Our revolving credit agreements require us to maintain compliance with certain financial covenants as defined in the respective agreements. At April 29, 2018, we were in compliance with all of our financial covenants.
Refer to Note 11 located in the notes to the consolidated financial statements for further details of our revolving credit agreements.
Commitments
The following table summarizes our contractual payment obligations and commitments for each of the next five fiscal years (in thousands):
|
2019
|
2020
|
2021
|
2022
|
2023
|
Thereafter
|
Total
|
||||||||||||||||||||||
|
Capital expenditures
|
$
|
2,003
|
-
|
-
|
-
|
-
|
-
|
$
|
2,003
|
|||||||||||||||||||
|
Accounts payable -
|
||||||||||||||||||||||||||||
|
capital expenditures
|
1,776
|
-
|
-
|
-
|
-
|
-
|
1,776
|
|||||||||||||||||||||
|
Operating leases
|
2,640
|
1,893
|
1,061
|
181
|
10
|
-
|
5,785
|
|||||||||||||||||||||
|
Interest expense
|
19
|
-
|
-
|
-
|
-
|
-
|
19
|
|||||||||||||||||||||
|
Total (1)
|
$
|
6,438
|
1,893
|
1,061
|
181
|
10
|
-
|
$
|
9,583
|
|||||||||||||||||||
Note: Payment Obligations by End of Each Fiscal Year
| (1) |
At April 29, 2018, we had $844,000 of total gross unrecognized tax benefits, of which $379,000 and $465,000 were classified as net non-current deferred income taxes and income taxes payable – long-term, respectively. The final outcome of these tax uncertainties is dependent upon various matters including tax examinations, legal proceedings, competent authority proceedings, changes in regulatory tax laws or interpretations of those tax laws, or expiration of statutes of limitation. As a result of these inherent uncertainties, the company cannot reasonably estimate the timing of payment of these amounts. Of the $844,000 in total gross unrecognized tax benefits, $379,000 would not be subject to cash payments due to the company’s U.S. federal net operating loss carryforwards.
|
Capital Expenditures
Capital expenditures on a cash basis were $11.8 million (of which $3.8 million was vendor financed) for fiscal 2018, compared with $12.9 million (of which $1.1 million was vendor financed) for fiscal 2017. Capital expenditures for fiscal 2018 and 2017 mostly related to our mattress fabrics segment.
Depreciation expense was $7.7 million for fiscal 2018 compared with $7.1 million for fiscal 2017. Depreciation expense for fiscal 2018 and 2017 mostly related to our mattress fabrics segment.
For fiscal 2018, we are currently projecting capital expenditures to be in the range of $6 million to $7 million. Depreciation expense for the company as a whole is projected to be $8.0 million for fiscal 2018. The estimated capital expenditures and depreciation expense for fiscal 2018 primarily relate to our mattress fabrics segment. These are management’s current expectations only, and changes in our business could cause changes in plans for capital expenditures and expectations for related depreciation expense. Funding for capital expenditures is expected to be primarily from cash provided by operating activities.
47
Accounts Payable – Capital Expenditures
At April 29, 2018, we had total amounts due regarding capital expenditures totaling $1.8 million, of which $1.4 million is financed and pertains to completed work for the construction of a new building (see below). The total $1.8 million amount is required to be paid in full in fiscal 2019.
At April 30, 2017, we had total amounts due regarding capital expenditures totaling $6.1 million, of which $5.1 million was financed and pertained to completed work for the construction of a new building (see below). Of the total $6.1 million, $4.8 million and $1.3 million were required to be paid in fiscal 2018 and 2019, respectively.
Purchase Commitments - Capital Expenditures
At April 29, 2018, we had open purchase commitments to construct a building and equipment for our mattress fabrics segment totaling $3.4 million. The 3.4 million includes $1.4 million (all of which represents completed work) associated with the construction of a new building noted below.
Effective May 16, 2016, we entered into an agreement with a contractor to construct a new building located in North Carolina that expands our distribution capabilities and office space at a current cost of $11.3 million. This agreement required an installment payment of $1.9 million in April 2016, $4.3 million in fiscal 2017, $3.7 million in fiscal 2018, and $1.4 million in fiscal 2019 (which was paid in May 2018). Interest was charged on the outstanding installment payments at a rate of $2.25% plus the current 30 day LIBOR rate. Also, we were required to issue a letter of a credit totaling $5.0 million with the contractor being the beneficiary. In addition to the interest that was charged on the outstanding installment payments, there was a 0.1% unused fee calculated on the balance of the $5.0 million letter of credit less the amount outstanding per month.
This new building was placed into service July 2017 (our first quarter of fiscal 2018).
Handling Costs
We record warehousing costs in SG&A expenses. These costs were $4.6 million, $4.6 million, and $4.2 million, in fiscal 2018, 2017, and 2016, respectively. Warehousing costs include the operating expenses of our various finished goods distribution centers, such as personnel costs, utilities, building rent and material handling equipment, and lease expense. Had these costs been included in cost of sales, gross profit would have been $60.0 million or 18.5% of net sales, in fiscal 2018, $64.6 million or 20.9% of net sales, in fiscal 2017, and $60.9 million, or 19.5% of net sales, in fiscal 2016.
Inflation
Any significant increase in our raw material costs, utility/energy costs and general economic inflation could have a material adverse impact on the company, because competitive conditions have limited our ability to pass significant operating increases on to customers.
Critical Accounting Policies
U.S. generally accepted accounting principles require us to make estimates and assumptions that affect our reported amounts in the consolidated financial statements and accompanying notes. Some of these estimates require difficult, subjective and/or complex judgments about matters that are inherently uncertain, and as a result actual results could differ significantly from those estimates. Due to the estimation processes involved, management considers the following summarized accounting policies and their application to be critical to understanding the company’s business operations, financial condition and results of operations.
48
Accounts Receivable
-
Allowance for Doubtful Accounts
Substantially all of our accounts receivable are due from residential and commercial furniture and bedding manufacturers. As of April 29, 2018, accounts receivable from furniture manufacturers totaled $11.1 million, and accounts receivable from bedding manufacturers totaled 15.2 million. Additionally, as of April 29, 2018, the aggregate accounts receivable balance of our ten largest customers was $13.8 million, or 52% of trade accounts receivable. One customer within the upholstery fabrics segment accounted for 13% of consolidated accounts receivable at April 29, 2018. Two customers within the mattress fabrics segment represented 20% of consolidated accounts receivable at April 29, 2018.
We continuously perform credit evaluations of our customers, considering numerous inputs including customers’ financial position, past payment history, cash flows and management capability; historical loss experience; and economic conditions and prospects. Once evaluated, each customer is assigned a credit grade. Credit grades are adjusted as warranted. Significant management judgment and estimates must be used in connection with establishing the reserve for allowance for doubtful accounts. While management believes that adequate allowances for doubtful accounts have been provided in the consolidated financial statements, it is possible that we could experience additional unexpected credit losses.
The reserve balance for doubtful accounts was $357,000 and $414,000 at April 29, 2018, and April 30, 2017, respectively.
Inventory Valuation
We operate as a “make-to-order” and “make-to-stock” business. Although management closely monitors demand in each product area to decide which patterns and styles to hold in inventory, the increasing availability of low cost imports and the gradual shifts in consumer preferences expose the company to markdowns of inventory.
Management continually examines inventory to determine if there are indicators that the carrying value exceeds its net realizable value. Experience has shown that the most significant indicator of the need for inventory markdowns is the age of the inventory and the planned discontinuance of certain patterns. As a result, the company provides inventory valuation markdowns based upon set percentages for inventory aging categories, generally using six, nine, twelve and fifteen-month categories. We also provide inventory valuation write-downs based on the planned discontinuance of certain products based on the current market values at that time as compared to their current carrying values. While management believes that adequate markdowns for excess and obsolete inventory have been made in the consolidated financial statements, significant unanticipated changes in demand or changes in consumer tastes and preferences could result in additional excess and obsolete inventory in the future.
The reserve for inventory markdowns was $4.1 million and $3.4 million at April 29, 2018, and April 30, 2017, respectively.
Goodwill
Management assesses goodwill for impairment at the end of each fiscal year or between annual tests if an event occurs or circumstances change that would more likely than not reduce the fair value of a reporting unit below its carrying values. In accordance with ASU No. 2011-08, Intangibles – Goodwill and Other, we performed our annual impairment test on a qualitative basis. Based on our qualitative assessment, we determined that our goodwill is not impaired using a more likely than not standard.
49
At April 29, 2018, our goodwill totaled $13.6 million, of which $11.5 million and $2.1 million related to the mattress fabrics and upholstery fabrics segments, respectively.
Although we believe we have based the impairment testing on reasonable estimates and assumptions, the use of different estimates and assumptions could result in materially different results.
Income Taxes
Income taxes are accounted for under the asset and liability method. Deferred income taxes are recognized for temporary differences between the financial statement carrying amounts and the tax bases of the company’s assets and liabilities and operating loss and tax credit carryforwards at income tax rates expected to be in effect when such amounts are realized or settled. The effect on deferred income taxes of a change in tax rates is recognized in income (loss) in the period that includes the enactment date.
Deferred Income Taxes – Valuation Allowance
In accordance with ASC Topic 740, we evaluate our deferred income taxes to determine if a valuation allowance is required. ASC Topic 740 requires that we assess whether a valuation allowance should be established based on the consideration of all available evidence using a “more likely than not” standard with significant weight being given to evidence that can be objectively verified. Since the company operates in multiple jurisdictions, we assess the need for a valuation allowance on a jurisdiction-by-jurisdiction basis, taking into account the effects of local tax law.
Refer to Note 10 located in the notes to the consolidated financial statements for disclosures regarding our assessments of our recorded valuation allowance as of April 29, 2018 and April 30, 2017.
Deferred Income Taxes – Undistributed Earnings from Foreign Subsidiaries
In accordance with ASC Topic 740, we assess whether the undistributed earnings from our foreign subsidiaries will be reinvested indefinitely or eventually distributed to our U.S. parent company. ASC Topic 740 requires that a deferred tax liability should be recorded for undistributed earnings from foreign subsidiaries that will not be reinvested indefinitely. Also, we assess the recognition of U.S. foreign income tax credits associated with foreign withholding and income tax payments and whether it is more-likely-than-not that our foreign income tax credits will not be realized. If it is determined that any foreign income tax credits need to be recognized or it is more-likely-than-not our foreign income tax credits will not be realized, an adjustment to our provision for income taxes will be recognized at that time.
For fiscal 2019 and beyond, the Tax Act allows a U.S. corporation a 100% dividend received deduction for accumulated earnings and profits from a 10% owned foreign corporation. Therefore, a deferred tax liability will only be required for withholding taxes that are incurred by foreign subsidiaries at the time their accumulated earnings and profits are distributed.
Refer to Note 10 located in the notes to the consolidated financial statements for disclosures regarding our assessments of our recorded deferred income tax liability balances associated with our undistributed earnings from our foreign subsidiaries as of April 29, 2018 and April 30, 2017, respectively.
Uncertainty In Income Taxes
In accordance with ASC Topic 740, we must recognize the income tax impact from an uncertain income tax position only if it is more likely than not that the income tax position will be sustained on examination by the taxing authorities, based on the technical merits of the position. The income tax impact recognized in the financial statements from such a position is measured based on the largest benefit that has a greater than 50% likelihood of being realized upon ultimate resolution. Penalties and interest related to uncertain income tax positions are recorded as income tax expense. Significant judgment is required in the identification of uncertain income tax positions and in the estimation of penalties and interest on uncertain income tax positions.
50
Refer to Note 10 located in the notes to the consolidated financial statements for disclosures and additional information regarding our uncertain income tax positions.
Stock-Based Compensation
ASC Topic 718, “Compensation-Stock Compensation”, requires that all stock-based compensation be recognized as compensation expense in the financial statements and that such cost be measured at the grant date for awards issued to employees and our board of directors. Equity awards issued to non-employees are measured at the earlier date of when the performance criteria are met or at the end of each reporting period.
Compensation expense for unvested incentive stock options and time vested restricted stock awards are amortized on a straight-line basis over the remaining vesting periods. At April 29, 2018, there were 1,200 shares of time vested restricted stock awards that were unvested and no unvested incentive stock options. Our common stock awards issued to our board of directors vest immediately, and therefore, compensation cost was measured at the closing price of our common stock on the date of grant and recognized in full at that time. Compensation expense for performance based restricted stock units is recorded based on an assessment each reporting period of the probability that certain performance goals will be met during the contingent vesting period. If performance goals are not probable of occurrence, no compensation expense will be recognized. Performance goals that were previously deemed probable and subsequently were not or are not expected to be met, previously recognized compensation cost will be reversed. At April 29, 2018, the remaining compensation cost related to our performance based restricted stock units was $1.3 million.
We recorded $2.2 million, $3.4 million, and $2.7 million of compensation expense within selling, general, and administrative expense for our equity-based awards in fiscal 2018, 2017, and 2016, respectively.
In March 2016, the FASB issued ASU No. 2016-09, "Compensation - Stock Compensation (Topic 718): Improvements to Employee Share-Based Payment Accounting". ASU No. 2016-09 was effective for fiscal years and interim periods within those fiscal years, beginning after December 15, 2016. Accordingly, we adopted this guidance during the first quarter of fiscal 2018. ASU No. 2016-09 aims to simplify several aspects of accounting and financial reporting for share-based payment transactions. One provision within this pronouncement requires that excess income tax benefits and deficiencies related to share-based payments be recognized within income tax expense as a discrete event in the period in which they occur, rather than within additional paid-in capital on our Consolidated Balance Sheet on a prospective basis. The impact to our results of operations related to this provision during fiscal 2018 was a reduction to income tax expense of $497,000. The impact of this provision on our future results of operations will depend in part on the market prices for the shares of our common stock on the dates there are taxable events related to the share-based awards, and therefore, the impact is difficult to predict. In connection with another provision within ASU No. 2016-09, we have elected to account for forfeitures of share-based awards as an estimate of the number of awards that are expected to vest, which is consistent with our accounting policy prior to adoption.
Also, we adopted the provisions of ASU No. 2016-09 related to changes on the Consolidated Statements of Cash Flows on a retrospective basis. As a result, we no longer classify excess income tax benefits as a financing activity, which increased net cash provided by operating activities and reduced net cash provided by financing activities by $657,000 and $841,000 for fiscal 2017 and 2016, respectively. Additionally, we no longer classify payments for employee taxes when common stock shares are withheld to satisfy the employer’s statutory income tax withholding obligation as an operating activity, which increased net cash provided by operating activities and reduced net cash provided by financing activities by $429,000 and $747,000 for fiscal 2017 and 2016, respectively.
51
Our equity incentive plans are described more fully in Note 13 in the notes to the consolidated financial statements.
Adoption of New Accounting Pronouncements
Refer to Note 1 located in the notes to the consolidated statements for recently adopted accounting pronouncements for fiscal 2018.
Recently Issued Accounting Standards
Refer to Note 1 located in the notes to the consolidated statements for recently issued accounting pronouncements for fiscal 2019 and beyond.
52
ABOUT MARKET RISK
We are exposed to market risk from changes in interest rates on our revolving credit lines.
At April 29, 2018, our U.S. revolving credit agreement requires interest to be charged at a rate (applicable interest rate of 3.36% at April 29, 2018) as a variable spread over LIBOR based on our ratio of debt to EBITDA as defined in the agreement. Our revolving credit line associated with our China subsidiaries bears interest at a rate determined by the Chinese government. At April 29, 2018, there were no borrowings outstanding under any of our revolving credit lines.
We are exposed to market risk from changes in the value of foreign currencies for our subsidiaries domiciled in Canada and China. We try to maintain a natural hedge by keeping a balance of our assets and liabilities denominated in the local currency of our subsidiaries domiciled in Canada and China, although there is no assurance that we will be able to continually maintain this natural hedge. Our foreign subsidiaries use the United States dollar as their functional currency. A substantial portion of the company’s imports purchased outside the United States are denominated in U.S. dollars. A 10% change in the above exchange rates at April 29, 2018, would not have had a significant impact on our results of operations or financial position.
53
AND SUPPLEMENTARY DATA
REPORT OF INDEPENDENT REGISTERED PUBLIC ACCOUNTING FIRM
Board of Directors and Shareholders
Culp, Inc.:
Opinion on the financial statements
We have audited the accompanying consolidated balance sheets of
Culp, Inc
. (a North Carolina Corporation) and Subsidiaries (the “Company”) as of April 29, 2018 and April 30, 2017, the related consolidated statements of net income, comprehensive income, shareholders’ equity, and cash flows for each of the three years in the period ended April 29, 2018, and the related notes (collectively referred to as the “financial statements”). In our opinion, the consolidated financial statements present fairly, in all material respects, the financial position of the Company as of April 29, 2018 and April 30, 2017, and the results of its operations and its cash flows for each of the three years in the period ended April 29, 2018, in conformity with accounting principles generally accepted in the United States of America.
We also have audited, in accordance with the standards of the Public Company Accounting Oversight Board (United States) (“PCAOB”), the Company’s internal control over financial reporting as of April 29, 2018, based on criteria established in the 2013
Internal Control—Integrated Framework
issued by the Committee of Sponsoring Organizations of the Treadway Commission (“COSO”), and our report dated July 13, 2018 expressed an unqualified opinion.
Basis for opinion
These financial statements are the responsibility of the Company’s management. Our responsibility is to express an opinion on the Company’s financial statements based on our audits. We are a public accounting firm registered with the PCAOB and are required to be independent with respect to the Company in accordance with the U.S. federal securities laws and the applicable rules and regulations of the Securities and Exchange Commission and the PCAOB.
We conducted our audits in accordance with the standards of the PCAOB. Those standards require that we plan and perform the audit to obtain reasonable assurance about whether the financial statements are free of material misstatement, whether due to error or fraud. Our audits included performing procedures to assess the risks of material misstatement of the financial statements, whether due to error or fraud, and performing procedures that respond to those risks. Such procedures included examining, on a test basis, evidence supporting the amounts and disclosures in the financial statements. Our audits also included evaluating the accounting principles used and significant estimates made by management, as well as evaluating the overall presentation of the financial statements. We believe that our audits provide a reasonable basis for our opinion.
/s/ GRANT THORNTON LLP
We have served as the Company’s auditor since fiscal 2008.
Charlotte, North Carolina
July 13, 2018
54
|
CONSOLIDATED BALANCE SHEETS
|
||||||||
|
(dollars in thousands, except per share data and preferred and common stock shares)
|
||||||||
|
April 29, 2018 and April 30, 2017
|
2018
|
2017
|
||||||
|
ASSETS
|
||||||||
|
current assets:
|
||||||||
|
cash and cash equivalents
|
$
|
21,228
|
$
|
20,795
|
||||
|
short-term investments - available for sale
|
2,451
|
2,443
|
||||||
|
short-term investments - held to maturity
|
25,759
|
-
|
||||||
|
accounts receivable, net
|
26,307
|
24,577
|
||||||
|
inventories
|
53,454
|
51,482
|
||||||
|
other current assets
|
2,870
|
2,894
|
||||||
|
total current assets
|
132,069
|
102,191
|
||||||
|
property, plant and equipment, net
|
51,794
|
51,651
|
||||||
|
goodwill
|
13,569
|
11,462
|
||||||
|
deferred income taxes
|
1,458
|
419
|
||||||
|
long-term investments - held-to-maturity
|
5,035
|
30,945
|
||||||
|
long-term investments - rabbi trust
|
7,326
|
5,466
|
||||||
|
investment in unconsolidated joint venture
|
1,501
|
1,106
|
||||||
|
other assets
|
5,232
|
2,394
|
||||||
|
total assets
|
$
|
217,984
|
$
|
205,634
|
||||
|
LIABILITIES AND SHAREHOLDERS' EQUITY
|
||||||||
|
current liabilities:
|
||||||||
|
accounts payable - trade
|
$
|
27,237
|
$
|
29,101
|
||||
|
accounts payable - capital expenditures
|
1,776
|
4,767
|
||||||
|
deferred revenue
|
809
|
-
|
||||||
|
accrued expenses
|
9,325
|
11,947
|
||||||
|
income taxes payable
|
1,437
|
287
|
||||||
|
total current liabilities
|
40,584
|
46,102
|
||||||
|
accounts payable - capital expenditures
|
-
|
1,322
|
||||||
|
accrued expenses - long-term
|
763
|
-
|
||||||
|
income taxes payable - long-term
|
3,758
|
467
|
||||||
|
deferred income taxes
|
2,150
|
3,593
|
||||||
|
deferred compensation
|
7,353
|
5,520
|
||||||
|
total liabilities
|
54,608
|
57,004
|
||||||
|
commitments and contingencies (notes 11 and 12)
|
||||||||
|
shareholders' equity:
|
||||||||
|
preferred stock, $.05 par value, authorized 10,000,000 shares
|
-
|
-
|
||||||
|
common stock, $.05 par value, authorized 40,000,000
|
||||||||
|
shares, issued and outstanding 12,450,276 at
|
||||||||
|
April 29, 2018 and 12,356,631 at April 30, 2017
|
623
|
618
|
||||||
|
capital contributed in excess of par value
|
48,203
|
47,415
|
||||||
|
accumulated earnings
|
114,635
|
100,601
|
||||||
|
accumulated other comprehensive loss
|
(85
|
)
|
(4
|
)
|
||||
|
total shareholders' equity
|
163,376
|
148,630
|
||||||
|
total liabilities and shareholders' equity
|
$
|
217,984
|
$
|
205,634
|
||||
The accompanying notes are an integral part of these consolidated financial statements.
55
|
CONSOLIDATED STATEMENTS OF NET INCOME
|
||||||||||||
|
For the years ended April 29, 2018, April 30, 2017 and May 1, 2016
|
||||||||||||
|
(dollars in thousands, except per share data)
|
2018
|
2017
|
2016
|
|||||||||
|
net sales
|
$
|
323,725
|
$
|
309,544
|
$
|
312,860
|
||||||
|
cost of sales
|
259,092
|
240,309
|
247,749
|
|||||||||
|
gross profit
|
64,633
|
69,235
|
65,111
|
|||||||||
|
selling, general and administrative expenses
|
37,172
|
39,157
|
36,773
|
|||||||||
|
income from operations
|
27,461
|
30,078
|
28,338
|
|||||||||
|
interest expense
|
94
|
-
|
-
|
|||||||||
|
interest income
|
(534
|
)
|
(299
|
)
|
(176
|
)
|
||||||
|
other expense
|
1,018
|
681
|
616
|
|||||||||
|
income before income taxes
|
26,883
|
29,696
|
27,898
|
|||||||||
|
income tax expense (note 10)
|
5,740
|
7,339
|
10,963
|
|||||||||
|
loss from investment in unconsolidated joint venture (note 7)
|
266
|
23
|
-
|
|||||||||
|
net income
|
$
|
20,877
|
$
|
22,334
|
$
|
16,935
|
||||||
|
net income per share-basic
|
$
|
1.68
|
$
|
1.81
|
$
|
1.38
|
||||||
|
net income per share-diluted
|
$
|
1.65
|
$
|
1.78
|
$
|
1.36
|
||||||
The accompanying notes are an integral part of these consolidated financial statements.
56
|
CONSOLIDATED STATEMENTS OF COMPREHENSIVE INCOME
|
||||||||||||
|
For the years ended April 29, 2018, April 30, 2017 and May 1, 2016
|
||||||||||||
|
2018
|
2017
|
2016
|
||||||||||
|
Net income
|
$
|
20,877
|
$
|
22,334
|
$
|
16,935
|
||||||
|
Other comprehensive (loss) income
|
||||||||||||
|
Loss on foreign currency cash flow hedge instrument, net of tax
|
(55
|
)
|
-
|
-
|
||||||||
|
Unrealized (losses) gains on investments
|
||||||||||||
|
Unrealized holding (losses) gains on investments, net of tax
|
(26
|
)
|
128
|
(176
|
)
|
|||||||
|
Reclassification adjustment for realized loss included in net income
|
-
|
12
|
127
|
|||||||||
|
(26
|
)
|
140
|
(49
|
)
|
||||||||
|
Total other comprehensive (loss) income
|
(81
|
)
|
140
|
(49
|
)
|
|||||||
|
Comprehensive income
|
$
|
20,796
|
$
|
22,474
|
$
|
16,886
|
||||||
The accompanying notes are an integral part of the consolidated financial statements.
57
|
CONSOLIDATED STATEMENTS OF SHAREHOLDERS' EQUITY
|
||||||||||||||||||||||||
|
(dollars in thousands, except common stock shares)
|
capital
|
accumulated
|
|
|||||||||||||||||||||
|
common
|
common
|
contributed
|
other
|
total
|
||||||||||||||||||||
|
For the years ended April 29, 2018,
|
stock
|
stock
|
in excess of
|
accumulated
|
comprehensive
|
shareholders'
|
||||||||||||||||||
|
April 30, 2017 and May 1, 2016
|
shares
|
amount
|
par value
|
earnings
|
loss
|
equity
|
||||||||||||||||||
|
balance, May 3, 2015
|
12,219,121
|
$
|
611
|
$
|
43,159
|
$
|
75,752
|
$
|
(95
|
)
|
$
|
119,427
|
||||||||||||
|
net income
|
-
|
-
|
-
|
16,935
|
-
|
16,935
|
||||||||||||||||||
|
stock-based compensation
|
-
|
-
|
2,742
|
-
|
-
|
2,742
|
||||||||||||||||||
|
unrealized loss on investments
|
-
|
-
|
-
|
-
|
(49
|
)
|
(49
|
)
|
||||||||||||||||
|
excess tax benefit related to stock-based
|
||||||||||||||||||||||||
|
compensation
|
-
|
-
|
841
|
-
|
-
|
841
|
||||||||||||||||||
|
common stock repurchased
|
(100,776
|
)
|
(5
|
)
|
(2,392
|
)
|
-
|
-
|
(2,397
|
)
|
||||||||||||||
|
common stock issued in connection with vesting
|
||||||||||||||||||||||||
|
of performance-based restricted stock units
|
115,855
|
6
|
(6
|
)
|
-
|
|||||||||||||||||||
|
fully vested common stock award
|
3,000
|
-
|
-
|
-
|
-
|
-
|
||||||||||||||||||
|
common stock issued in connection
|
||||||||||||||||||||||||
|
with exercise of stock options
|
54,500
|
3
|
197
|
-
|
-
|
200
|
||||||||||||||||||
|
common stock issued surrendered for
|
||||||||||||||||||||||||
|
withholding taxes payable
|
(26,211
|
)
|
(1
|
)
|
(746
|
)
|
-
|
-
|
(747
|
)
|
||||||||||||||
|
dividends paid
|
-
|
-
|
-
|
(8,140
|
)
|
-
|
(8,140
|
)
|
||||||||||||||||
|
balance, May 1, 2016
|
12,265,489
|
614
|
43,795
|
84,547
|
(144
|
)
|
128,812
|
|||||||||||||||||
|
net income
|
-
|
-
|
-
|
22,334
|
-
|
22,334
|
||||||||||||||||||
|
stock-based compensation
|
-
|
-
|
3,358
|
-
|
-
|
3,358
|
||||||||||||||||||
|
unrealized gain on investments
|
-
|
-
|
-
|
-
|
140
|
140
|
||||||||||||||||||
|
excess tax benefit related to stock-based
|
||||||||||||||||||||||||
|
compensation
|
-
|
-
|
657
|
-
|
-
|
657
|
||||||||||||||||||
|
common stock issued in connection with vesting
|
||||||||||||||||||||||||
|
of performance-based restricted stock units
|
49,192
|
2
|
(2
|
)
|
-
|
-
|
-
|
|||||||||||||||||
|
fully vested common stock award
|
4,800
|
-
|
-
|
-
|
-
|
-
|
||||||||||||||||||
|
common stock issued in connection
|
||||||||||||||||||||||||
|
with exercise of stock options
|
68,000
|
3
|
585
|
-
|
-
|
588
|
||||||||||||||||||
|
common stock surrendered for the cost of stock option
|
||||||||||||||||||||||||
|
excercises and withholding taxes payable
|
(30,850
|
)
|
(1
|
)
|
(978
|
)
|
-
|
-
|
(979
|
)
|
||||||||||||||
|
dividends paid
|
-
|
-
|
-
|
(6,280
|
)
|
-
|
(6,280
|
)
|
||||||||||||||||
|
balance, April 30, 2017
|
12,356,631
|
618
|
47,415
|
100,601
|
(4
|
)
|
148,630
|
|||||||||||||||||
|
net income
|
-
|
-
|
-
|
20,877
|
-
|
20,877
|
||||||||||||||||||
|
stock-based compensation
|
-
|
-
|
2,212
|
-
|
-
|
2,212
|
||||||||||||||||||
|
loss on foreign currency cash flow hedge instrument
|
(55
|
)
|
(55
|
)
|
||||||||||||||||||||
|
unrealized loss on investments
|
-
|
-
|
-
|
-
|
(26
|
)
|
(26
|
)
|
||||||||||||||||
|
common stock issued in connection with vesting
|
||||||||||||||||||||||||
|
of performance-based restricted stock units
|
118,845
|
6
|
(6
|
)
|
-
|
-
|
-
|
|||||||||||||||||
|
fully vested common stock award
|
4,800
|
-
|
-
|
-
|
-
|
-
|
||||||||||||||||||
|
common stock issued in connection with vesting
|
||||||||||||||||||||||||
|
of time-based restricted stock units
|
1,200
|
-
|
-
|
-
|
||||||||||||||||||||
|
common stock issued in connection
|
||||||||||||||||||||||||
|
with exercise of stock options
|
15,600
|
1
|
110
|
-
|
-
|
111
|
||||||||||||||||||
|
common stock issued surrendered for
|
||||||||||||||||||||||||
|
withholding taxes payable
|
(46,800
|
)
|
(2
|
)
|
(1,528
|
)
|
-
|
-
|
(1,530
|
)
|
||||||||||||||
|
dividends paid
|
(6,843
|
)
|
(6,843
|
)
|
||||||||||||||||||||
|
balance, April 29, 2018
|
12,450,276
|
$
|
623
|
$
|
48,203
|
$
|
114,635
|
$
|
(85
|
)
|
$
|
163,376
|
||||||||||||
The accompanying notes are an integral part of these consolidated financial statements.
58
|
CONSOLIDATED STATEMENTS OF CASH FLOWS
|
||||||||||||
|
For the years ended April 29, 2018, April 30, 2017, and May 1, 2016
|
||||||||||||
|
(dollars in thousands)
|
2018
|
2017
|
2016
|
|||||||||
|
cash flows from operating activities:
|
||||||||||||
|
net income
|
$
|
20,877
|
$
|
22,334
|
$
|
16,935
|
||||||
|
adjustments to reconcile net income to net cash
|
||||||||||||
|
provided by operating activities:
|
||||||||||||
|
depreciation
|
7,672
|
7,085
|
6,671
|
|||||||||
|
amortization of other assets
|
351
|
244
|
170
|
|||||||||
|
stock-based compensation
|
2,212
|
3,358
|
2,742
|
|||||||||
|
deferred income taxes
|
(2,482
|
)
|
4,667
|
4,192
|
||||||||
|
gain on sale of equipment
|
-
|
(131
|
)
|
(35
|
)
|
|||||||
|
loss from investment in unconsolidated joint venture
|
266
|
23
|
-
|
|||||||||
|
realized loss on sale of short-term investments
|
-
|
12
|
127
|
|||||||||
|
foreign currency exchange losses (gains)
|
66
|
78
|
(40
|
)
|
||||||||
|
changes in assets and liabilities, net of effects of acquisition of assets:
|
||||||||||||
|
accounts receivable
|
(299
|
)
|
(1,555
|
)
|
4,476
|
|||||||
|
inventories
|
(24
|
)
|
(5,437
|
)
|
(4,407
|
)
|
||||||
|
other current assets
|
226
|
(495
|
)
|
(206
|
)
|
|||||||
|
other assets
|
(81
|
)
|
30
|
(46
|
)
|
|||||||
|
accounts payable-trade
|
(4,028
|
)
|
5,828
|
(3,785
|
)
|
|||||||
|
accrued expenses and deferred compensation
|
(1,562
|
)
|
992
|
1,498
|
||||||||
|
deferred revenue
|
(94
|
)
|
-
|
-
|
||||||||
|
income taxes
|
4,373
|
(2,966
|
)
|
91
|
||||||||
|
net cash provided by operating activities
|
27,473
|
34,067
|
28,383
|
|||||||||
|
cash flows from investing activities:
|
||||||||||||
|
capital expenditures
|
(8,005
|
)
|
(11,858
|
)
|
(11,475
|
)
|
||||||
|
net cash paid for acquisition of assets
|
(4,541
|
)
|
-
|
-
|
||||||||
|
investment in unconsolidated joint venture
|
(661
|
)
|
(1,129
|
)
|
-
|
|||||||
|
purchase of short-term investments
|
(49
|
)
|
(44
|
)
|
(104
|
)
|
||||||
|
proceeds from the sale of short-term investments
|
-
|
2,000
|
5,612
|
|||||||||
|
purchase of long-term investments (held-to-maturity)
|
-
|
(31,020
|
)
|
-
|
||||||||
|
purchase of long-term investments (rabbi trust)
|
(1,902
|
)
|
(1,351
|
)
|
(1,649
|
)
|
||||||
|
proceeds from the sale of long-term investments (rabbi trust)
|
57
|
-
|
-
|
|||||||||
|
payments on life insurance policies
|
(18
|
)
|
(18
|
)
|
(18
|
)
|
||||||
|
proceeds from the sale of equipment
|
6
|
141
|
233
|
|||||||||
|
net cash used in investing activities
|
(15,113
|
)
|
(43,279
|
)
|
(7,401
|
)
|
||||||
|
cash flows from financing activities:
|
||||||||||||
|
proceeds from lines of credit
|
19,000
|
9,000
|
7,000
|
|||||||||
|
payments on lines of credit
|
(19,000
|
)
|
(9,000
|
)
|
(7,000
|
)
|
||||||
|
payments on vendor-financed capital expenditures
|
(3,750
|
)
|
(1,050
|
)
|
-
|
|||||||
|
payments on long-term debt
|
-
|
-
|
(2,200
|
)
|
||||||||
|
debt issuance costs
|
-
|
(2
|
)
|
(134
|
)
|
|||||||
|
repurchases of common stock
|
-
|
-
|
(2,397
|
)
|
||||||||
|
dividends paid
|
(6,843
|
)
|
(6,280
|
)
|
(8,140
|
)
|
||||||
|
common stock surrendered for withholding taxes payable
|
(1,530
|
)
|
(429
|
)
|
(747
|
)
|
||||||
|
proceeds from common stock issued
|
111
|
37
|
200
|
|||||||||
|
net cash used in financing activities
|
(12,012
|
)
|
(7,724
|
)
|
(13,418
|
)
|
||||||
|
effect of exchange rate changes on cash and cash equivalents
|
85
|
(56
|
)
|
498
|
||||||||
|
increase (decrease) in cash and cash equivalents
|
433
|
(16,992
|
)
|
8,062
|
||||||||
|
cash and cash equivalents at beginning of year
|
20,795
|
37,787
|
29,725
|
|||||||||
|
cash and cash equivalents at end of year
|
$
|
21,228
|
$
|
20,795
|
$
|
37,787
|
||||||
The accompanying notes are an integral part of these consolidated financial statements.
59
NOTES TO CONSOLIDATED FINANCIAL STATEMENTS
1. GENERAL AND SUMMARY OF SIGNIFICANT ACCOUNTING POLICIES
Description of Business
– Our operations are classified into two business segments: mattress fabrics and upholstery fabrics, in which the majority of our revenues are derived in North America.
The mattress fabrics segment manufacturers, sources, and sells fabrics and mattress covers to bedding manufacturers. At April 29, 2018, we had wholly-owned mattress fabric operations located in Stokesdale, NC, High Point, NC, Quebec, Canada, and a fifty percent owned cut and sew mattress cover operation located in Haiti. On June 22, 2018, we acquired a majority interest in eLuxury, LLC (eLuxury), an internet company offering bedding accessories and home goods directly to consumers, whose primary products include a line of mattress pads manufactured at eLuxury’s facility in Evansville, Indiana (see Note 2 for further details regarding our business combinations).
The upholstery fabrics segment sources, manufacturers, and sells fabrics to residential and commercial furniture manufacturers. At April 29, 2018, we had wholly-owned upholstery fabric operations located in Shanghai, China, Burlington, NC, and a recently acquired business located in Knoxville, TN, (see Note 2 for further details regarding our business combinations), and Anderson, SC. On June 12, 2018, our board of directors decided to close our upholstery fabrics manufacturing facility in Anderson, South Carolina, due to continued decline in demand for the products manufactured at that facility (see note 22 for further details regarding this exit and disposal activity).
Basis of Presentation
– The consolidated financial statements of the company have been prepared in accordance with U.S. generally accepted accounting principles.
Principles of Consolidation
– The consolidated financial statements include the accounts of the company and its subsidiaries. All significant intercompany balances and transactions have been eliminated in consolidation. The accounts of our subsidiaries located in Shanghai, China and Poznan, Poland are consolidated as of April 30, a calendar month end, which is required by the Chinese and Polish governments, respectively. No events occurred related to the difference between our fiscal year end on the Sunday closest to April 30 and our China and Polish subsidiaries year end of April 30 that materially affected the company’s financial position, results of operations, or cash flows for fiscal years 2018, 2017, and 2016.
Effective January 1, 2017, Culp International Holdings, Ltd. (Culp), a wholly-owned subsidiary of Culp, Inc., entered into a joint venture agreement, pursuant to which Culp owns fifty percent of CLASS International Holdings, Ltd (CLIH).
Culp’s investment in CLIH will be accounted for under the equity method of accounting in accordance with
ASC Topic 823 – Investments – Equity Method and Joint Ventures.
The equity method of accounting is required for an investee entity (i.e. CLIH) that is not consolidated but over which the reporting entity (i.e. Culp Inc.) exercises significant influence. Whether or not a reporting entity exercises significant influence with respect to an investee depends on an evaluation of several factors including, representation on the investee’s board of directors, voting rights, and ownership level. Under the equity method of accounting, CLIH’s accounts are not reflected within our Consolidated Balance Sheets and Statements of Net Income. Our share of earnings and losses from CLIH will be reflected in the caption “Income (loss) from investment in unconsolidated joint venture” in the Consolidated Statements of Net Income. Our carrying value in CLIH is reflected in the caption “Investment in unconsolidated joint venture” in our Consolidated Balance Sheets.
If our carrying value in CLIH is reduced to zero, no further losses will be recorded in our consolidated financial statements. However, if CLIH subsequently reports income, we will not record our share of such income until it equals the amount of its share of losses previously recognized.
60
Fiscal Year
– Our fiscal year is the 52 or 53-week period ending on the Sunday closest to April 30. Fiscal 2018, 2017, and 2016 each included 52 weeks.
Use of Estimates –
The preparation of financial statements in conformity with U.S. generally accepted accounting principles requires management to make estimates and assumptions that affect the reported amounts of assets and liabilities and disclosure of contingent assets and liabilities at the date of the financial statements and the reported amounts of revenues and expenses during the reporting period. Actual results could differ from those estimates.
Cash and Cash Equivalents
– Cash and cash equivalents include demand deposit and money market accounts. We consider all highly liquid instruments with original maturities of three months or less to be cash equivalents.
A summary of our cash and cash equivalents by geographic area follows:
|
April 29,
|
April 30, | |||||||
|
(dollars in thousands)
|
2018
|
2017
|
||||||
|
United States
|
$
|
9,452
|
1,147
|
|||||
|
China
|
9,221
|
12,722
|
||||||
|
Canada
|
2,349
|
2,906
|
||||||
|
Cayman Islands
|
206
|
4,020
|
||||||
|
$
|
21,228
|
20,795
|
||||||
Throughout the year, we have cash balances regarding our U.S. operations in excess of federally insured amounts on deposit with a financial institution. We have not experienced any losses in such accounts. Management believes we are not exposed to any significant credit risk related to cash and cash equivalents.
Short-Term Investments
– Our short-term investments consist of bond funds that are classified as available-for-sale. Our short-term investments had an accumulated unrealized loss totaling $91,000 and $47,000 at April 29, 2018 and April 30, 2017, respectively. Our short-term investments were recorded at its fair value of $2.5 million and $2.4 million at April 29, 2018 and April 30, 2017, respectively. The fair value of our short-term investments approximates its cost basis.
A summary of our short-term investments by geographic area follows:
|
April 29,
|
April 30, | |||||||
|
(dollars in thousands)
|
2018
|
2017
|
||||||
|
Canada
|
$
|
1,366
|
1,362
|
|||||
|
United States
|
1,085
|
1,081
|
||||||
|
$
|
2,451
|
2,443
|
||||||
Long-Term Investments (Rabbi Trust)
– We have a Rabbi Trust to set aside funds for participants of our deferred compensation plan (the “Plan”) and enable the participants to credit their contributions to various investment options of the Plan. The investments associated with the Rabbi Trust consist of investments in a money market fund and various mutual funds that are classified as available for sale.
Our long-term investments are classified as available for sale and were recorded at its fair value of $7.3 million and $5.5 million at April 29, 2018 and April 30, 2017, respectively. Our long-term investments had an accumulated unrealized gain totaling $61,000 and $43,000 at April 29, 2018, and April 30, 2017, respectively. The fair value of our long-term investments associated with our Rabbi Trust approximates its cost basis.
Investments (Held-To-Maturity)
– During the second quarter of fiscal 2017, management invested approximately $31.0 million in investment grade U.S. Corporate bonds with maturities ranging from 2 to 2.5 years. The purpose of this investment was to earn a higher rate of return on our excess cash located in the Cayman Islands. These investments are classified as held-to-maturity as we have the positive intent and ability to hold these investments until maturity. Our held-to-maturity will be recorded as either current or noncurrent on our Consolidated Balance Sheets, based on the contractual maturity dated and stated at amortized cost.
61
At April 29, 2018, the amortized cost of our held-to-maturity investments was $30.8 million and the fair value was $30.6 million. At April 30, 2017, the amortized cost of our held-to-maturity investments $30.9 million and the fair value was $30.8 million.
Our U.S. corporate bonds were classified as level 2 as they are traded over the counter within a broker network and not on an active market. The fair value of our U.S. corporate bonds is determined based on a published source that provides an average bid price. The average bid price is based on various broker prices that are determined based on market conditions, interest rates, and the rating of the respective U.S. corporate bond.
Accounts Receivable
– Substantially all of our accounts receivable are due from manufacturers in the bedding and furniture industries. We grant credit to customers, a substantial number of which are located in North America, and generally do not require collateral. We record an allowance for doubtful accounts that reflects estimates of probable credit losses. Management continuously performs credit evaluations of our customers, considering numerous inputs including financial position, past payment history, cash flows, management ability, historical loss experience and economic conditions and prospects. We do not have any off-balance sheet credit exposure related to our customers.
Inventories
– We account for inventories at the lower of first-in, first-out (FIFO) cost or net realizable value. Management continually examines inventory to determine if there are indicators that the carrying value exceeds its net realizable value. Experience has shown that the most significant indicators of the need for inventory markdowns are the age of the inventory and the planned discontinuance of certain patterns. As a result, we provide inventory valuation write-downs based upon established percentages based on the age of the inventory that are continually evaluated as events and market conditions require. Our inventory aging categories are six, nine, twelve, and fifteen months. We also provide inventory valuation write-downs based on the planned discontinuance of certain products based on the current market values at that time as compared to their current carrying values.
Property, Plant and Equipment
– Property, plant and equipment are recorded at cost and depreciated over their estimated useful lives using the straight-line method. Major renewals and betterments are capitalized. Maintenance, repairs and minor renewals are expensed as incurred. When properties or equipment are retired or otherwise disposed of, the related cost and accumulated depreciation are removed from the accounts. Amounts received on disposal less the book value of assets sold are charged or credited to income from operations.
Management reviews long-lived assets, which consist principally of property, plant and equipment, for impairment whenever events or changes in circumstances indicate that the carrying value of the asset may not be recovered. Recoverability of long-lived assets to be held and used is measured by a comparison of the carrying amount of the asset to future net undiscounted cash flows expected to be generated by the asset. If the carrying amount of an asset exceeds its estimated future cash flows, the related cost and accumulated depreciation are removed from the accounts and an impairment charge is recognized for the excess of the carrying amount over the fair value of the asset. After the impairment loss is recognized, the adjusted carrying amount is the new accounting basis. Assets to be disposed of by sale are reported at the lower of the carrying value or fair value less cost to sell when the company has committed to a disposal plan, and would be reported separately as assets held for sale in the Consolidated Balance Sheets.
Interest Costs –
Interest costs incurred were $194,000, $158,000, and $58,000 in fiscal years 2018, 2017, and 2016, respectively.
62
We capitalize interest costs incurred on funds used to construct property, plant, and equipment. The capitalized interest is recorded as part of the asset to which it relates and is amortized over the asset’s estimated useful life. Interest costs of $100,000, $158,000, and $58,000 were capitalized for the construction of qualifying fixed assets for fiscal 2018, 2017, and 2016, respectively.
Foreign Currency Adjustments
– The United States dollar is the functional currency for the company’s Canadian and Chinese subsidiaries. All monetary foreign currency asset and liability accounts are remeasured into U.S. dollars at year-end exchange rates. Non-monetary asset and liabilities such as property, plant, and equipment are recorded at historical exchange rates. Foreign currency revenues and expenses are remeasured at average exchange rates in effect during the year, except for certain expenses related to balance sheet amounts remeasured at historical exchange rates. Exchange gains and losses from remeasurement of foreign currency denominated monetary assets and liabilities are recorded in the other expense line item in the Consolidated Statements of Net Income in the period in which they occur.
A summary of our foreign currency exchange (losses) gains by geographic area follows:
|
(dollars in thousands)
|
2018
|
2017
|
2016 | |||||||||
|
China
|
$
|
(298
|
)
|
111
|
(70
|
)
|
||||||
|
Canada
|
(8
|
)
|
(120
|
)
|
76
|
|||||||
|
$
|
(306
|
)
|
(9
|
)
|
6
|
|||||||
Goodwill
– Management assesses goodwill for impairment at the end of each fiscal year or between annual tests if an event occurs or circumstances change that would more likely than not reduce the fair value of a reporting unit below its carrying values. In accordance with ASU No. 2011-08, Intangibles-Goodwill and Other (ASC Topic 350), we performed our annual impairment test on a qualitative basis. Based on our qualitative assessments as of April 29, 2018 and April 30, 2017, we determined that our goodwill was not impaired using a more likely than not standard.
Income Taxes
– Income taxes are accounted for under the asset and liability method. Deferred income taxes are recognized for temporary differences between the financial statement carrying amounts and the tax bases of our assets and liabilities and operating loss and tax credit carryforwards at income tax rates expected to be in effect when such amounts are realized or settled. The effect on deferred income taxes of a change in tax rates is recognized in income (loss) in the period that includes the enactment date.
Deferred Income Taxes – Valuation Allowance
We evaluate our deferred income taxes to determine if a valuation allowance is required. We assess whether a valuation allowance should be established based on the consideration of all available evidence using a “more likely than not” standard with significant weight being given to evidence that can be objectively verified. Since we operate in multiple jurisdictions, we assess the need for a valuation allowance on a jurisdiction-by-jurisdiction basis, taking into account the effects of local tax law.
Deferred Income Taxes – Undistributed Earnings from Foreign Subsidiaries
We assess whether the undistributed earnings from our foreign subsidiaries will be reinvested indefinitely or eventually distributed to our U.S. parent company. We are required to record a deferred tax liability for undistributed earnings from foreign subsidiaries that will not be reinvested indefinitely. Also, we assess the recognition of U.S. foreign income tax credits associated with foreign withholding and income tax payments and whether it is more-likely-than-not that our foreign income tax credits will not be realized. If it is determined that any foreign income tax credits need to be recognized or it is more-likely-than-not our foreign income tax credits will not be realized, an adjustment to our provision for income taxes will be recognized at that time.
For fiscal 2019 and beyond, the 2017 Tax Cuts and Jobs Act allows a U.S. corporation a 100% dividend received deduction for earnings and profits received from a 10% owned foreign corporation. Therefore, a deferred tax liability will only be required for withholding taxes that are incurred by our foreign subsidiaries at the time E&P is distributed.
63
Uncertainty in Income Taxes
We recognize the tax impact from an uncertain tax position only if it is more likely than not that the tax position will be sustained on examination by the taxing authorities, based on the technical merits of the position. The tax impact recognized in the financial statements from such a position is measured based on the largest benefit that has a greater than 50% likelihood of being realized upon ultimate resolution. Penalties and interest related to uncertain tax positions are recorded as income tax expense. Significant judgment is required in the identification of uncertain tax positions and in the estimation of penalties and interest on uncertain tax positions.
Revenue Recognition
– Revenue associated with the sale of our upholstery and mattress fabric products are primarily recognized upon shipment of inventory and when title and risk of loss pass to the customer. Provision is currently made for estimated product returns, claims and allowances. Management considers historical claims and return experience, among other things, when establishing the allowance for returns and allowances.
On April 1, 2018, we acquired Read Windows Products, LLC, a source of custom window treatments for the hospitality and commercial industries, which involves the sale of certain products and installation services. Revenue associated with the sale of products are recognized upon shipment of inventory and when title and risk of loss pass to the customer. We
recognize revenue on installation services as services are rendered. Amounts billed and collected before the services are performed are included in deferred revenues
(see Note 2 for further details regarding our business combinations).
Shipping and Handling Costs
– Revenue received for shipping and handling costs, which is immaterial for all periods presented, is included in net sales. Shipping costs, principally freight, that comprise payments to third-party shippers are classified as cost of sales. Handling costs represent finished goods warehousing costs incurred to store, move, and prepare products for shipment in the company’s various distribution facilities. Handling costs were $4.6 million, $4.6 million and $4.2 million in fiscal 2018, 2017, and 2016, respectively, and are included in selling, general and administrative expenses.
Sales and Other Taxes –
Sales and other taxes collected from customers and remitted to governmental authorities are presented on a net basis and, as such, are excluded from revenues.
Stock-Based Compensation
– Our equity incentive plans are described more fully in Note 13. ASC 718, “Compensation – Stock Compensation”, requires that all stock-based compensation be recognized as compensation expense in the financial statements and that such cost be measured at the grant date for awards issued to employees and the company’s board of directors. Equity awards issued to non-employees are measured at the earlier date of when the performance criteria are met or at the end of each reporting period. Compensation expense for time vested restricted stock awards are amortized on a straight-line basis over the remaining vesting periods. Compensation expense for performance based restricted stock units were recorded based on an assessment each reporting period of the probability if certain performance goals were to be met during the contingent vesting period. If performance goals were not probable of occurrence, no compensation expense was recognized. Compensation cost recognized on performance goals that were previously deemed probable and subsequently, were not or expected to be met, previously recognized compensation cost was reversed.
Fair Value of Financial Instruments
– The accompanying consolidated financial statements include certain financial instruments, and the fair market value of such instruments may differ from amounts reflected on a historical basis. These financial instruments include our short-term and long-term investments. The fair value measurements of our financial instruments are described more fully in Note 14.
64
The carrying amount of cash and cash equivalents, short-term investments, accounts receivable, other current assets, line of credit, accounts payable and accrued expenses approximates fair value because of the short maturity of these financial instruments.
Recently Adopted Accounting Pronouncements
Measurement of Inventory
In July 2015, the FASB issued ASU No. 2015-11, “Simplifying the Measurement of Inventory”, which changed the measurement principle for inventory from the lower of cost or market to lower of cost and net realizable value. ASU No. 2015-11 was effective for fiscal years and interim periods within those fiscal years, beginning after December 15, 2016. As a result, we adopted ASU No. 2015-11 in the first quarter of fiscal 2018 and the adoption of this guidance did not have a significant impact on our consolidated financial statements.
Stock-Based Compensation
In March 2016, the FASB issued ASU No. 2016-09, "Compensation - Stock Compensation (Topic 718): Improvements to Employee Share-Based Payment Accounting". ASU No. 2016-09 was effective for fiscal years and interim periods within those fiscal years, beginning after December 15, 2016. Accordingly, we adopted this guidance during the first quarter of fiscal 2018. ASU No. 2016-09 aims to simplify several aspects of accounting and financial reporting for share-based payment transactions. One provision within this pronouncement requires that excess income tax benefits and deficiencies related to share-based payments be recognized within income tax expense as a discrete event in the period in which they occur, rather than within additional paid-in capital on our Consolidated Balance Sheet on a prospective basis. The impact to our results of operations related to this provision during fiscal 2018 was a reduction to income tax expense of $497,000. The impact of this provision on our future results of operations will depend in part on the market prices for the shares of our common stock on the dates there are taxable events related to the share-based awards, and therefore, the impact is difficult to predict. In connection with another provision within ASU No. 2016-09, we have elected to account for forfeitures of share-based awards as an estimate of the number of awards that are expected to vest, which is consistent with our accounting policy prior to adoption.
Also, we adopted the provisions of ASU No. 2016-09 related to changes on the Consolidated Statements of Cash Flows on a retrospective basis. As a result, we no longer classify excess income tax benefits as a financing activity, which increased net cash provided by operating activities and reduced net cash provided by financing activities by $657,000 and $841,000 for fiscal 2017 and 2016, respectively. Additionally, we no longer classify payments for employee taxes when common stock shares are withheld to satisfy the employer’s statutory income tax withholding obligation as an operating activity, which increased net cash provided by operating activities and reduced net cash provided by financing activities by $429,000 and $747,000 for fiscal 2017 and 2016, respectively.
Recently Issued Accounting Pronouncements
In May 2014, the FASB issued ASU No. 2014-09, as amended,
Revenue from Contracts with Customers.
The amendments in this ASU are intended to enhance the comparability of revenue recognition practices and will be applied to all contracts with customers. Improved disclosures related to the nature, amount, timing, and uncertainty of revenue that is recognized are requirements under the amended guidance. The new revenue standard will be effective for fiscal years, and interim periods within those fiscal years, beginning after December 15, 2017. We are therefore required to apply the new revenue guidance in our fiscal 2019 interim and annual financial statements. This ASU can be adopted either retrospectively or as a cumulative-effect adjustment as of the date of adoption. Currently, we are evaluating the impact this guidance may have with regards to our recent acquisition of Read Window Products, LLC. However, we do not expect this guidance to have a material impact on our results of operations and financial position, but we do expect this guidance to have a material impact on the disclosures required in our notes to the consolidated financial statements.
65
In February 2016, the FASB issued ASU No. 2016-02,
Leases (Topic 842),
which increases transparency and comparability among companies accounting for lease transactions. The most significant change of this update will require the recognition of lease assets and liabilities on the balance sheet for operating lease arrangements with lease terms greater than twelve months for lessees. This update will require a modified retrospective application which includes a number of optional practical expedients related to the identification and classification of leases commenced before the effective date. This ASU is effective for fiscal years and interim periods within those fiscal years, beginning after December 15, 2018. We are therefore required to apply this guidance in our fiscal 2020 interim and annual financial statements. We are currently assessing the impact that this guidance will have on our consolidated financial statements, but we expect this guidance to have a material impact on our financial position as a result of the requirement to recognize right-of-use assets and lease liabilities on our Consolidated Balance Sheets.
In August 2016, the FASB issued ASU No. 2016-15,
Statement of Cash Flows (Topic 230): Classification of Certain Cash Receipts and Cash Payments
, to address the diversity in how certain cash receipts and cash payments are presented in the statement of cash flows. This new guidance provides clarity around the cash flow classification for eight specific issues in an effort to reduce the current and potential future diversity in practice. This standard, which is to be applied retrospectively, will be effective for the first interim period within annual reporting periods beginning after December 15, 2017, and early adoption is permitted. We are therefore required to apply this new guidance in our fiscal 2019 interim and annual financial statements. We are currently assessing the impact that this guidance will have on our statement of cash flows, but we do expect this guidance to be applicable in determining how we classify our contingent consideration payments associated with our business combinations (see note 2) as either investing or financing activities. This guidance requires cash payments not made soon after the acquisition date of a business combination by an acquirer to settle a contingent consideration liability should be separated and classified as cash outflows from financing activities. In comparison, cash payments made soon after the acquisition date should be separated and classified as cash outflows from investing activities.
In October 2016, the FASB issued ASU No. 2016-16, Income Taxes (Topic 740):
Intra-Entity Transfers of Assets Other Than Inventory,
to reduce the diversity in practice and complexity associated with accounting for the income tax consequences of intra-entity transfers of assets other than inventory. Current GAAP prohibits recognition of deferred income taxes for an intra-entity transfer until the asset has been sold to an outside party. The new pronouncement stipulates that an entity should recognize the income tax consequences of an intra-entity transfer of an asset other than inventory when the transfer occurs. This new guidance will be effective for annual reporting periods beginning after December 15, 2017, including interim periods within those annual reporting periods, with early adoption permitted in the first interim period only. We are therefore required to apply this new guidance in our fiscal 2019 interim and annual financial statements. The amendments are to be applied on a modified retrospective basis through a cumulative-effect adjustment directly to retained earnings as of the beginning of the period of adoption. Currently, we do not expect that this guidance will have a material impact on our results of operations and financial position,
There are no other new accounting pronouncements that are expected to have a significant impact on our consolidated financial statements.
66
2. BUSINESS COMBINATIONS
Read Window Products, LLC
Effective April 1, 2018, we entered into an Asset Purchase Agreement (Agreement) to acquire certain assets and assume certain liabilities of Read Window Products, Inc. (Read), a source of custom window treatments for the hospitality and commercial industries. Based in Knoxville, Tennessee, Read is a turn-key provider of window treatments offering measuring, sourcing, fabrication and installation services. Read’s custom product line includes motorization, shades, drapery, upholstered headboards and shower curtains. In addition, Read supplies soft goods such as decorative top sheets, coverlets, duvet covers, bed skirts, bolsters and pillows, for leading hospitality brands worldwide. The addition of window treatments and other soft goods to our product line will allow us to be a more complete source of fabrics for the hospitality market, in which we believe there are significant growth opportunities.
The purchase price for the net assets acquired was $5.7 million, of which $4.5 million was paid at closing on Apri1 1, 2018, $375,000 was paid in May 2018, and $763,000 is to be paid in June in 2019, subject to certain conditions as defined in the Agreement.
The Agreement contains a contingent consideration arrangement that requires us to pay a former shareholder of Read based on adjusted EBITDA as defined in the agreement for calendar year 2018 in excess of fifty percent of a pre-established adjusted EBITDA target as defined in the agreement. Based on historical and projected financial results in relation to the pre-established adjusted EBITDA target, we currently believe a contingent payment will not be made, and therefore, no contingent liability has been recorded.
The following table presents the final allocation of the acquisition cost to the assets acquired and liabilities assumed based on their fair values.
|
(dollars in thousands)
|
Fair Value
|
|||
|
Customer relationships (Note 8)
|
$
|
2,247
|
||
|
Goodwill (Note 6)
|
2,107
|
|||
|
Inventory
|
1,128
|
|||
|
Accounts receivable
|
897
|
|||
|
Tradename (Note 8)
|
683
|
|||
|
Property, plant & equipment
|
379
|
|||
|
Other assets
|
35
|
|||
|
Deferred revenue
|
(903
|
)
|
||
|
Accounts payable
|
(719
|
)
|
||
|
Accrued expenses
|
(174
|
)
|
||
|
$
|
5,680
|
|||
We recorded customer relationships at fair market value based on a multi-period excess earnings valuation model. These customer relationships will be amortized on a straight-line basis over their nine-year useful life. We recorded the tradename at fair market based on the relief from royalty method. This tradename was determined to have an indefinite useful life and, therefore, is not being amortized. Equipment will be depreciated on a straight-line basis over useful lives ranging from three to ten years.
The goodwill related to this acquisition is attributable to Read’s reputation with the products and services they provide and the collective experience of management with regards to its operations, customers, and industry. Goodwill is deductible for income tax purposes over the statutory period of fifteen years.
Acquisition costs totaling $339,000 were included in selling, general, and administrative expenses in our fiscal 2018 Consolidated Statement of Net Income.
67
The following unaudited pro forma consolidated results of operations for the years ending April 29, 2018 and April 30, 2017 have been prepared as if the acquisition of Read had occurred at May 2, 2016.
|
Years ended
|
||||||||
|
(dollars in thousands, except per share data)
|
April 29, 2018
|
April 30, 2017
|
||||||
|
Net Sales
|
$
|
334,953
|
$
|
321,398
|
||||
|
Income from operations
|
26,799
|
30,441
|
||||||
|
Net income
|
20,455
|
22,552
|
||||||
|
Net income per share, basic
|
1.65
|
1.83
|
||||||
|
Net income per share, diluted
|
1.62
|
1.80
|
||||||
The unaudited pro forma information is presented for informational purposes only and is not necessarily indicative of the results of operations that actually would have been achieved had the acquisition been consummated as of that time, nor is it intended to be a projection of future results.
Actual revenue and net income for the month of April 2018 were included in our Consolidated Statement of Net Income and totaled $880,000 and $5,000, respectively.
eLuxury
Effective June 22, 2018, after the end of the fiscal year, we acquired a majority interest in eLuxury, an internet company offering bedding accessories and home goods directly to consumers. The company's primary products include a line of mattress pads manufactured at eLuxury’s facility in Evansville, Indiana. eLuxury also offers handmade platform beds,
cotton bed sheets,
and other bedding items. The compny's products are available on eLuxury’s own branded website,
eLuxury.com
, Amazon and other leading online retailers for specialty home goods.
We believe this acquisition will provide a new sales channel for the bedding accessory category and will expand our opportunity to participate in the rapidly growing e-commerce direct-to-consumer space. This business combination brings together eLuxury’s experience in e-commerce, online brand building, and direct-to-consumer shopping and fulfillment expertise with our global production, sourcing and distribution capabilities. We also have an opportunity to market our new line of bedding accessories, marketed in the brand name, 'Comfort Supply Company by Culp', as well as other finished products that we may develop, including items made from upholstery fabrics, through this e‑commerce platform.
The estimated purchase price for this acquisition is $12.5 million, of which $11.6 million was paid at closing, with the remaining $874,000 amount to be paid based on holdback provisions defined in the purchase agreement. The agreement contains a contingent consideration arrangement that requires us to pay the seller based on adjusted EBITDA to be determined over a three-year period in relation to a pre-established adjusted EBITDA target. We are currently performing our preliminary valuation of the allocation of the purchase price among the assets and equity interest acquired and liabilities assumed.
68
3. ACCOUNTS RECEIVABLE
A summary of accounts receivable follows:
|
April 29,
|
April 30, | |||||||
|
(dollars in thousands)
|
2018
|
2017
|
||||||
|
customers
|
$
|
28,097
|
26,211
|
|||||
|
allowance for doubtful accounts
|
(357
|
)
|
(414
|
)
|
||||
|
reserve for returns and allowances and discounts
|
(1,433
|
)
|
(1,220
|
)
|
||||
|
$
|
26,307
|
24,577
|
||||||
A summary of the activity in the allowance for doubtful accounts follows:
|
(dollars in thousands)
|
2018
|
2017
|
2016 | |||||||||
|
beginning balance
|
$
|
(414
|
)
|
(1,088
|
)
|
(851
|
)
|
|||||
|
provision for bad debts
|
57
|
222
|
(363
|
)
|
||||||||
|
write-offs, net of recoveries
|
-
|
452
|
126
|
|||||||||
|
ending balance
|
$
|
(357
|
)
|
(414
|
)
|
(1,088
|
)
|
|||||
A summary of the activity in the allowance for returns and allowances and discounts follows:
|
(dollars in thousands)
|
2018
|
2017
|
2016 | |||||||||
|
beginning balance
|
$
|
(1,220
|
)
|
(962
|
)
|
(738
|
)
|
|||||
|
provision for returns and allowances
|
(3,295
|
)
|
(3,061
|
)
|
(2,825
|
)
|
||||||
|
and discounts
|
||||||||||||
|
credits issued
|
3,082
|
2,803
|
2,601
|
|||||||||
|
ending balance
|
$
|
(1,433
|
)
|
(1,220
|
)
|
(962
|
)
|
|||||
4. INVENTORIES
A summary of inventories follows:
|
|
April 29 , | April 30, | ||||||
|
(dollars in thousands)
|
2018
|
2017
|
||||||
|
raw materials
|
$
|
6,024
|
6,456
|
|||||
|
work-in-process
|
3,264
|
3,095
|
||||||
|
finished goods
|
44,166
|
41,931
|
||||||
|
$
|
53,454
|
51,482
|
||||||
5. PROPERTY, PLANT AND EQUIPMENT
A summary of property, plant and equipment follows:
|
depreciable lives
|
April 29,
|
April 30,
|
||||||||||
|
(dollars in thousands)
|
(in years)
|
2018
|
2017
|
|||||||||
|
land and improvements
|
0-10
|
$
|
963
|
836
|
||||||||
|
buildings and improvements
|
7-40
|
31,022
|
19,071
|
|||||||||
|
leasehold improvements
|
** |
|
1,993
|
1,541
|
||||||||
|
machinery and equipment
|
3-12
|
72,924
|
67,709
|
|||||||||
|
office furniture and equipment
|
3-10
|
9,514
|
8,936
|
|||||||||
|
capital projects in progress
|
2,086
|
12,901
|
||||||||||
|
118,502
|
110,994
|
|||||||||||
|
accumulated depreciation and amortization
|
|
|
(66,708
|
)
|
(59,343
|
) | ||||||
| $ |
51,794
|
51,651 | ||||||||||
** Shorter of life of lease or useful life.
69
6.
GOODWILL
A summary of the change in the carrying amount of goodwill follows:
|
(dollars in thousands)
|
2018
|
2017
|
2016
|
|||||||||
|
beginning balance
|
$
|
11,462
|
11,462
|
11,462
|
||||||||
|
acquisition of assets (note 2)
|
2,107
|
-
|
-
|
|||||||||
|
loss on impairment
|
-
|
-
|
-
|
|||||||||
|
ending balance
|
$
|
13,569
|
11,462
|
11,462
|
||||||||
7. INVESTMENT IN UNCONSOLIDATED JOINT VENTURE
Effective January 1, 2017, Culp International Holdings, Ltd. (Culp), a wholly-owned subsidiary of Culp, Inc., entered into a joint venture agreement, pursuant to which Culp owns fifty percent of CLASS International Holdings, Ltd (CLIH). CLIH produces cut and sewn mattress covers, and its operations are located in a modern industrial park on the northeast border of Haiti, which borders the Dominican Republic. CLIH commenced production in the second quarter of fiscal 2018 and complements our mattress fabric operations with a mirrored platform that enhances our ability to meet customer demand while adding a lower cost operation to our platform.
CLIH incurred a net loss of $532,000 and $46,000 in fiscal 2018 and 2017, respectively. CLIH’s net loss in fiscal 2017 pertained to initial start up operating expenses incurred during the fourth quarter. Culp’s equity interests in these net losses were $266,000 and $23,000 in fiscal 2018 and 2017, respectively.
The following table summarizes information of assets, liabilities and members’ equity of our equity method investment in CLIH:
|
April 29,
|
April 30,
|
|||||||
|
(dollars in thousands)
|
2018
|
2017
|
||||||
|
total assets
|
$
|
3,130
|
$
|
2,258
|
||||
|
total liabilities
|
$
|
128
|
$
|
46
|
||||
|
total members’ equity
|
$
|
3,002
|
$
|
2,212
|
||||
8. OTHER ASSETS
A summary of other assets follows:
|
April 29,
|
April 30,
|
|||||||
|
(dollars in thousands)
|
2018
|
2017
|
||||||
|
customer relationships, net
|
$
|
2,839
|
664
|
|||||
|
tradename
|
683
|
-
|
||||||
|
non-compete agreement, net
|
753
|
828
|
||||||
|
cash surrender value – life
|
393
|
376
|
||||||
|
other
|
564
|
526
|
||||||
|
$
|
5,232
|
2,394
|
||||||
70
Customer Relationships
A summary of the change in the carrying amount of our customer relationships follows:
|
(dollars in thousands)
|
2018
|
2017
|
2016
|
|||||||||
|
beginning balance
|
$
|
664
|
715
|
766
|
||||||||
|
acquisition of assets (note 2)
|
2,247
|
-
|
-
|
|||||||||
|
amortization expense
|
(72
|
)
|
(51
|
)
|
(51
|
)
|
||||||
|
loss on impairment
|
-
|
-
|
-
|
|||||||||
|
ending balance
|
$
|
2,839
|
664
|
715
|
||||||||
In connection with our asset purchase agreement with Read (see note 2) on April 1, 2018, we purchased certain customer relationships. We recorded these customer relationships at fair market value totaling $2.2 million based on a multi-period excess earnings valuation model. These customer relationships will be amortized on a straight-line basis over their nine-year useful life.
Additionally, we have customer relationships from a prior acquisition with a carrying amount of $613,000 at April 29, 2018. These customer relationships are being amortized on a straight-line basis over their seventeen-year useful life.
The gross carrying amount of our customer relationships was $3.1 million and $868,000 at April 29, 2018 and April 30, 2017, respectively. Accumulated amortization for these customer relationships was $276,000 and $204,000 at April 29, 2018 and April 30, 2017, respectively.
The remaining amortization expense for the next five fiscal years and thereafter follows: FY 2019 - $301,000; FY 2020 - $301,000; FY 2021 - $301,000; FY 2022 - $301,000; FY 2023 - $301,000; and Thereafter - $1,334,000.
The weighted average amortization period for our customer relationships is 9.6 years as of April 29, 2018.
Tradename
In connection with the asset purchase agreement noted above, we purchased the tradename associated with Read. We recorded this tradename at fair market value totaling $683,000 based on the relief from royalty method. This tradename was determined to have an indefinite useful life and, therefore, is not being amortized.
Non-Compete Agreement
A summary of the change in the carrying amount of our non-compete agreement follows:
|
(dollars in thousands)
|
2018
|
2017
|
2016
|
|||||||||
|
beginning balance
|
$
|
828
|
903
|
978
|
||||||||
|
amortization expense
|
(75
|
)
|
(75
|
)
|
(75
|
)
|
||||||
|
loss on impairment
|
-
|
-
|
-
|
|||||||||
|
ending balance
|
$
|
753
|
828
|
903
|
||||||||
We have a non-compete agreement from a prior acquisition that is being amortized on a straight line basis over the fifteen year life of the agreement.
The gross carrying amount of this non-compete agreement was $2.0 million at April 29, 2018 and April 30, 2017, respectively. Accumulated amortization for this non-compete agreement was $1.3 million and $1.2 million at April 29, 2018 and April 30, 2017, respectively.
71
The remaining amortization expense for the next five years and thereafter follows: FY 2019 - $75,000; FY 2020 - $75,000; FY 2021 - $75,000; FY 2022 - $75,000; FY 2023 - $75,000, and Thereafter - $378,000.
The weighted average amortization period for the non-compete agreement is 10 years as of April 29, 2018.
Cash Surrender Value - Life Insurance
We had one life insurance contract with a death benefit of $1.4 million at April 29, 2018 and April 30, 2017, respectively. Our cash surrender value - life insurance balance of $393,000 and $376,000 at April 29, 2018 and April 30, 2017, respectively, are collectible upon death of the respective insured.
9. ACCRUED EXPENSES
A summary of accrued expenses follows:
|
April 29,
|
April 30,
|
|||||||
|
(dollars in thousands)
|
2018
|
2017
|
||||||
|
compensation, commissions and related benefits
|
$
|
6,918
|
10,188
|
|||||
|
advertising rebates
|
750
|
468
|
||||||
|
interest
|
20
|
51
|
||||||
|
other
|
2,400
|
1,240
|
||||||
|
$
|
10,088
|
11,947
|
||||||
At April 29, 2018, we had accrued expenses totaling $10.1 million, of which $9.3 million and $763,000 were classified as current accrued expenses and long-term accrued expenses, respectively, in the accompanying Consolidated Balance Sheets. As of April 30, 2017, we had accrued expense totaling $11.9 million, all of which were classified as current accrued expenses, in the accompanying Consolidated Balance Sheets.
10. INCOME TAXES
Income Tax Expense and Effective Income Tax Rate
Total income tax expense was allocated as follows:
|
(dollars in thousands)
|
2018
|
2017
|
2016
|
|||||||||
|
income from operations
|
$
|
5,740
|
7,339
|
10,963
|
||||||||
|
shareholders’ equity, related to
|
||||||||||||
|
the tax benefit arising from stock
|
||||||||||||
|
based compensation
|
-
|
(657
|
)
|
(841
|
)
|
|||||||
|
$
|
5,740
|
6,682
|
10,122
|
|||||||||
72
Income tax expense attributable to income from operations consists of:
|
(dollars in thousands)
|
2018
|
2017
|
2016
|
|||||||||
|
current
|
||||||||||||
|
federal
|
$
|
(1,367
|
)
|
109
|
-
|
|||||||
|
state
|
9
|
13
|
6
|
|||||||||
|
2017 Tax Cuts and Jobs Act
|
4,854
|
- |
-
|
|||||||||
|
foreign
|
4,726
|
5,981
|
6,765
|
|||||||||
|
foreign – reversal of uncertain tax position
|
-
|
(3,431
|
)
|
-
|
||||||||
|
8,222
|
2,672
|
6,771
|
||||||||||
|
deferred
|
||||||||||||
|
federal
|
4,295
|
404
|
(1,205
|
)
|
||||||||
|
state
|
112
|
54
|
305
|
|||||||||
|
2017 Tax Cuts and Jobs Act (1)
|
(6,903
|
)
|
-
|
-
|
||||||||
|
undistributed earnings – foreign subsidiaries
|
(195
|
)
|
(101
|
)
|
(1,129
|
)
|
||||||
|
U.S. operating loss carryforwards
|
-
|
3,630
|
5,467
|
|||||||||
|
foreign
|
93
|
734
|
1,086
|
|||||||||
|
valuation allowance (1)
|
116
|
(54
|
)
|
(332
|
)
|
|||||||
|
(2,482
|
)
|
4,667
|
4,192
|
|||||||||
|
$
|
5,740
|
7,339
|
10,963
|
|||||||||
|
(1)
|
The income tax benefit of $6,903 includes a charge of $4,550 for the establishment of a valuation allowance against U.S. foreign tax credits that are more-likely-than not to be realized as a result of the 2017 Tax Cuts and Jobs Act.
|
Income (loss) before income taxes related to our foreign and U.S. operations consists of:
|
(dollars in thousands)
|
2018
|
2017
|
2016
|
|||||||||
|
Foreign
|
||||||||||||
|
China
|
$
|
11,036
|
13,650
|
14,130
|
||||||||
|
Canada
|
5,985
|
4,918
|
3,647
|
|||||||||
|
Poland
|
-
|
(19
|
)
|
(62
|
)
|
|||||||
|
Cayman Islands
|
339
|
154
|
-
|
|||||||||
|
Total Foreign
|
17,360
|
18,703
|
17,715
|
|||||||||
|
United States
|
9,523
|
10,993
|
10,183
|
|||||||||
|
$
|
26,883
|
29,696
|
27,898
|
|||||||||
The following schedule summarizes the principal differences between the income tax expense at the federal income tax rate and the effective income tax rate reflected in the consolidated financial statements:
|
2018
|
2017
|
2016
|
||||||||||
|
federal income tax rate
|
30.4
|
%
|
34.0
|
%
|
34.0
|
%
|
||||||
|
tax effects of the 2017 Tax Cuts and Jobs Act
|
(7.6
|
)
|
-
|
-
|
||||||||
|
tax effects of Chinese foreign exchange (losses) gains
|
(2.8
|
)
|
1.6
|
4.4
|
||||||||
|
reversal of foreign uncertain income tax position
|
-
|
(11.6
|
)
|
-
|
||||||||
|
tax effects of stock-based compensation
|
(1.8
|
)
|
-
|
-
|
||||||||
|
undistributed earnings from foreign subsidiaries
|
3.7
|
-
|
-
|
|||||||||
|
other
|
(0.5
|
)
|
0.7
|
0.9
|
||||||||
|
21.4
|
%
|
24.7
|
%
|
39.3
|
%
|
|||||||
73
Deferred Income Taxes - Overall
The tax effects of temporary differences that give rise to significant portions of the deferred tax assets and liabilities consist of the following:
|
(dollars in thousands)
|
2018
|
2017
|
||||||
|
deferred tax assets:
|
||||||||
|
accounts receivable
|
$
|
316
|
447
|
|||||
|
inventories
|
2,217
|
2,196
|
||||||
|
compensation
|
3,438
|
6,222
|
||||||
|
liabilities and other
|
117
|
890
|
||||||
|
foreign income tax credits - U.S.
|
5,720
|
44,917
|
||||||
|
alternative minimum tax credit - U.S.
|
-
|
1,428
|
||||||
|
property, plant and equipment (1)
|
226
|
245
|
||||||
|
loss carryforwards – U.S.
|
2,513
|
3,842
|
||||||
|
loss carryforwards – foreign
|
76
|
73
|
||||||
|
unrecognized tax benefits – U.S.
|
-
|
(3,842
|
)
|
|||||
|
valuation allowances
|
(5,204
|
)
|
(536
|
)
|
||||
|
total deferred tax assets
|
9,419
|
55,882
|
||||||
|
deferred tax liabilities:
|
||||||||
|
undistributed earnings on foreign subsidiaries
|
(4,256
|
)
|
(43,978
|
)
|
||||
|
unrecognized tax benefits – U.S.
|
(380
|
)
|
(7,936
|
)
|
||||
|
property, plant and equipment (2)
|
(4,352
|
)
|
(5,546
|
)
|
||||
|
goodwill
|
(1,046
|
)
|
(1,478
|
)
|
||||
|
other
|
(77
|
) |
(118
|
)
|
||||
|
total deferred tax liabilities
|
(10,111
|
)
|
(59,056
|
)
|
||||
|
Net deferred liabilities
|
$
|
(692
|
)
|
(3,174
|
)
|
|||
|
(1)
|
Pertains to the company’s operations located in China.
|
|
(2)
|
Pertains to the company’s operations located in the U.S. and Canada.
|
Federal and state net operating loss carryforwards were approximately $11.5 million with related future tax benefits of $2.5 million at April 29, 2018. These carryforwards principally expire in fiscal years 2027 through fiscal 2035. Our U.S. foreign income tax credits of $5.7 million will expire 10 years from when the associated earnings and profits from our foreign subsidiaries are repatriated to the U.S.
2017 Tax Cuts and Jobs Act
On December 22, 2017 (the “Enactment Date”), the Tax Cuts and Jobs Act (H.R.1) (the “Tax Act”) was signed into law. The Tax Act contains significant changes to corporate taxation, including (i) the reduction of the corporate income tax rate to 21%, (ii) the acceleration of expensing certain business assets, (iii) a one-time mandatory repatriation tax (the “Transition Tax”) related to the transition of U.S. international tax from a worldwide tax system to a territorial tax system, (iv) limitations on the use of foreign tax credits to reduce the U.S. income tax liability, (v) the repeal of the domestic production activities deduction, (vi) additional limitations on the deductibility of interest expense and executive compensation, and (vii) the creation of new minimum taxes such as the base erosion anti-abuse tax (“BEAT”) and Global Intangible Low Taxed Income (“GILTI”) tax.
The corporate income tax rate reduction is effective as of January 1, 2018. Since we have a fiscal year rather than a calendar year, we are subject to IRS rules relating to transitional income tax rates. As a result, our fiscal 2018 federal statutory rate is a blended income tax rate of 30.4%. For fiscal 2019 and beyond, we will utilize the enacted U.S. federal corporate income tax rate of 21%.
74
The key impacts of the Tax Act on our financial statements for fiscal 2018 were the re-measurement of our U.S. deferred income tax balances to the new U.S. federal corporate income tax rate and the determination of the income tax effects of the Transition Tax on our accumulated earnings and profits associated with our foreign subsidiaries. While we have not yet completed our assessment of the effects of the Tax Act, we were able to determine reasonable estimates for the impacts of the key items specified above, and thus we reported provisional amounts for these items under guidance provided by SEC Staff Accounting Bulletin No. 118 (“SAB 118”). Our estimates may change and revisions to these estimates will be recorded during the measurement period allowed by SAB 118, which is not to extend beyond one year from the Enactment Date.
The provisional estimates related to our U.S. deferred income tax balances and Transition Tax may change due to a variety of factors that include, (i) actual versus estimates of accumulated earnings and profits associated with our foreign subsidiaries, (ii) utilization of our foreign income tax credits, (iii) anticipated guidance from the U.S. Department of Treasury about implementing the Tax Act and (iv) potential guidance from the Securities and Exchange Commission and Financial Accounting Standards Board related to the Tax Act.
In order to determine the effects of the new U.S. federal corporate income tax rate on our U.S. deferred income tax balances, ASC Topic 740 “Income Taxes” (ASC Topic 740), requires the re-measurement of our U.S. deferred income tax balances as of the Enactment Date of the Tax Act, based on income tax rates at which our U.S. deferred income tax balances are expected to reverse in the future. The provisional amount determined for the re-measurement of our U.S. net deferred income taxes was an income tax charge of $2.2 million during fiscal 2018.
The Transition tax is based on our total post-1986 foreign earnings and profits (“E&P”) that were previously deferred from U.S. income tax and applicable income tax rates associated with E&P held in cash and other specified assets (the “aggregate foreign cash position”). Also, E&P was not permanently reinvested prior to the Tax Act. The provisional amount determined for the income tax effects of the Transition Tax was an income tax benefit of $4.3 million during fiscal 2018. This $4.3 million income tax benefit relates to an income tax benefit of $18.0 million for the release of deferred income tax liabilities related to E&P, an income tax benefit of $11.7 million that relates to the reduction in our U.S. Federal income tax rate pursuant to the Tax Act on the effective settlement on an IRS exam related to E&P, partially offset by an income tax charge for the write-off and the establishment of a valuation allowance against our unused foreign tax credits totaling $25.4 million. The Transition Tax may be paid over a period of eight years at the election of the taxpayer and we intend to make this election.
In addition to the above mentioned key impacts of the Tax Act on fiscal 2018, the Tax Act also establishes new tax laws that will be effective for our fiscal 2019 which include the creation of new minimum taxes such as the BEAT and GILTI taxes. We have not yet made a policy election with respect to the accounting treatment of these taxes. We can either account for these taxes as expensed when incurred or factor such amounts in the measurement of our U.S. deferred income taxes. We are currently evaluating our selection of an accounting policy, which will depend, in part, on analyzing our facts to determine what the impact is expected to be under each method.
Deferred Income Taxes – Valuation Allowance
Summary
In accordance with ASC Topic 740, we evaluate our deferred income taxes to determine if a valuation allowance is required. ASC Topic 740 requires that companies assess whether a valuation allowance should be established based on the consideration of all available evidence using a “more likely than not” standard with significant weight being given to evidence that can be objectively verified. Since the company operates in multiple jurisdictions, we assess the need for a valuation allowance on a jurisdiction-by-jurisdiction basis, taking into account the effects of local tax law.
75
Based on our assessments at April 29, 2018 and April 30, 2017, valuation allowances against our deferred income taxes pertain to the following jurisdictions:
|
April 29,
|
April 30,
|
|||||||
|
(dollars in thousands)
|
2018
|
2017
|
||||||
|
U.S. foreign income tax credits
|
$
|
4,550
|
-
|
|||||
|
U.S. state loss carryforwards and credits
|
578
|
464
|
||||||
|
Polish loss carryforwards
|
76
|
72
|
||||||
|
$
|
5,204
|
536
|
||||||
A summary of the change in the valuation allowances against our deferred income taxes follows:
|
(dollars in thousands)
|
2018
|
2017
|
2016
|
|||||||||
|
beginning balance
|
$
|
536
|
590
|
922
|
||||||||
|
establishment of valuation allowance (1)
|
4,550
|
-
|
-
|
|||||||||
|
change in estimate (2)
|
118
|
(54
|
)
|
(332
|
)
|
|||||||
|
ending balance
|
$
|
5,204
|
536
|
590
|
||||||||
|
(1)
|
The establishment of this valuation allowance pertains to U.S. foreign tax credits that are more-likely-than not to be realized as a result of the Tax Act.
|
|
(2)
|
Amounts pertain to a change in estimate of the recoverability of certain deferred income tax assets as of the end of the respective prior fiscal year.
|
Deferred Income Taxes – Undistributed Earnings from Foreign Subsidiaries
In accordance with ASC Topic 740, we assess whether the undistributed earnings from our foreign subsidiaries will be reinvested indefinitely or eventually distributed to our U.S. parent company. ASC Topic 740 requires that a deferred tax liability should be recorded for undistributed earnings from foreign subsidiaries that will not be reinvested indefinitely. Also, we assess the recognition of U.S. foreign income tax credits associated with foreign withholding and income tax payments and whether it is more-likely-than-not that our foreign income tax credits will not be realized. If it is determined that any foreign income tax credits need to be recognized or it is more-likely-than-not our foreign income tax credits will not be realized, an adjustment to our provision for income taxes will be recognized at that time.
During the fiscal 2018, the Tax Act imposed a Transition Tax on our undistributed E&P associated with our foreign subsidiaries. The Tax Act required us to determine E&P as of November 2, 2017 and December 31, 2017 (the “Measurement Dates”), in which the greater E&P amount of the Measurement Dates is subject to the Transition Tax. As a result, we had provisional estimates of E&P prior to participation exemption totaling $156.7 million subject to the Transition Tax and provisional estimates totaling $42.2 million for foreign tax credits that could be used to reduce the Transition Tax subject to certain limitations as defined in the Tax Act.
For fiscal 2019 and beyond, the Tax Act allows a U.S. corporation a 100% dividend received deduction for E&P received from a 10% owned foreign corporation. Therefore, a deferred tax liability will only be required for withholding taxes that are incurred by our foreign subsidiaries at the time E&P is distributed. As a result, at April 29, 2018, we recorded a deferred tax liability of $4.3 million for withholding taxes on undistributed E&P from our foreign subsidiaries.
76
Uncertainty in Income Taxes
Overall
In accordance with ASC Topic 740, an unrecognized income tax benefit for an uncertain income tax position can be recognized in the first interim period if the more-likely-than-not recognition threshold is met by the reporting period, or is effectively settled through examination, negotiation, or litigation, or the statute of limitations for the relevant taxing authority to examine and challenge the tax position has expired. If it is determined that any of the above conditions occur regarding our uncertain income tax positions, an adjustment to our unrecognized income tax benefit will be recorded at that time.
The following table sets forth the change in the company’s unrecognized income tax benefit:
|
(dollars in thousands)
|
2018
|
2017
|
2016 | |||||||||
|
beginning balance
|
$
|
12,245
|
14,897
|
14,141
|
||||||||
|
increases from prior period tax positions
|
350
|
854
|
454
|
|||||||||
|
decreases from prior period tax positions (1)
|
(11,751
|
)
|
(3,506
|
)
|
(77
|
)
|
||||||
|
increases from current period tax positions
|
-
|
-
|
379
|
|||||||||
|
ending balance
|
$
|
844
|
12,245
|
14,897
|
||||||||
|
(1)
|
The $11.8 million reduction in our unrecognized income tax benefits during fiscal 2018 is mostly associated with the reduction in our U.S. Federal income tax rate pursuant to the Tax Act on the effective settlement on an IRS exam. The $3.5 million reduction in our unrecognized income tax benefits during fiscal 2017 is due to a lapse of applicable statute of limitations in a foreign jurisdiction.
|
At April 29, 2018, we had $844,000 of total gross unrecognized tax benefits, of which $465,000 would favorably affect the income tax rate in future periods. At April 30, 2017, we had $12.2 million of total gross unrecognized tax benefits, of which $467,000 would favorably affect the income tax rate in future periods.
At April 29, 2018, we had $844,000 of total gross unrecognized tax benefits, of which $379,000 and $465,000 were classified as net non-current deferred income taxes and income taxes payable-long-term, respectively, in the accompanying Consolidated Balance Sheets. At April 30, 2017 we had $12.2 million of total gross unrecognized tax benefits, of which $11.8 million and $467,000 were classified as net non-current deferred income taxes and income taxes payable- long-term, respectively, in the accompanying Consolidated Balance Sheets.
We elected to classify interest and penalties as part of income tax expense. At April 29, 2018 and April 30, 2017, the gross amount of interest and penalties due to unrecognized tax benefits was $40,000 and $50,000, respectively.
Our gross unrecognized income tax benefit of $844,000 at April 29, 2018, relates to income tax positions for which significant change is currently not expected within the next year. This amount primarily relates to double taxation under applicable income tax treaties with foreign tax jurisdictions. United States federal income tax returns filed by us remain subject to examination for income tax years 2017 and subsequent. Canadian federal income tax returns filed by us remain subject to examination for income tax years 2014 and subsequent. Canadian provincial (Quebec) income tax returns filed by us remain subject to examination for income tax years 2016 and subsequent. Income tax returns associated with our operations located in China are subject to examination for income tax year 2013 and subsequent.
77
Income Tax Exams
During the third quarter of fiscal 2017, Revenue Quebec commenced an examination of our Canadian provincial (Quebec) income tax returns for fiscal years 2013 through 2015. This examination was completed during the fourth quarter of fiscal 2018 with final adjustments totaling $4,000.
During the fourth quarter of fiscal 2016, the Internal Revenue Service commenced and examination of our U.S. Federal income tax returns for fiscal years 2014 through 2016. This examination was effectively settled during the fourth quarter of fiscal 2018 with no adjustment.
Income Taxes Paid
Income tax payments, net of income tax refunds, were $4.0 million, $5.5 million, and $6.7 million during fiscal years 2018, 2017, and 2016, respectively.
11. LINES OF CREDIT
Revolving Credit Agreement –United States
Our credit agreement with Wells Fargo Bank N.A. (“Wells Fargo”) provides a revolving loan commitment of $30 million. Interest was charged at a rate (applicable interest rate of 3.36% and 2.45% at April 29, 2018 and April 30, 2017, respectively) as a variable spread over LIBOR based on our ratio of debt to EBITDA. The Credit Agreement contains certain financial and other covenants as defined in the agreement and is set to expire on August 15, 2018.
The purpose of our revolving credit line is to support potential short term cash needs in different jurisdictions within our global operations, mitigate our risk associated with foreign currency exchange rate fluctuations, and support repatriation of earnings and profits from our foreign subsidiaries to the U.S. for various strategic purposes.
Outstanding borrowings are secured by a pledge of 65% of the common stock of Culp International Holdings, Ltd. (our subsidiary located in the Cayman Islands), as required by the Credit Agreement. There were no borrowings outstanding under the Credit Agreement at April 29, 2018 and April 30, 2017, respectively.
At April 29, 2018 and April 30, 2017, there were $250,000 in outstanding letters of credit (all of which related workers compensation) provided by the Credit Agreement.
Effective August 1, 2016, we entered into a Third Amendment to our Credit Agreement which allows us to issue letters of credit not to exceed $7.5 million. On August 3, 2016, we issued a $5.0 million letter of credit ($1.25 million was outstanding at April 29, 2018 in addition to the $250,000 letter of credit noted above) for the construction of a new building associated with our mattress fabrics segment (see Note 12 for further details). This $1.25 million outstanding letter of credit automatically expired on May 15, 2018.
Revolving Credit Agreement - China
We have an unsecured credit agreement associated with our operations in China that provides for a line of credit up to 40 million RMB ($6.3 million USD at April 29, 2018) and is set to expire on March 2, 2019. This agreement has an interest rate determined by the Chinese government and there were no outstanding borrowings as of April 29, 2018 and April 30, 2017.
78
Overall
Our loan agreements require, among other things, that we maintain compliance with certain financial covenants. At April 29, 2018, the company was in compliance with these financial covenants.
Interest paid during fiscal years 2018, 2017, and 2016 totaled $181,000, $114,000, and $95,000, respectively.
12.
COMMITMENTS AND CONTINGENCIES
Operating Leases- Overall
We lease certain office, manufacturing and warehouse facilities and equipment under noncancellable operating leases. Lease terms related to real estate primarily range from one to five years with renewal options for additional periods ranging up to twelve years. The leases generally require the company to pay real estate taxes, maintenance, insurance and other expenses. Rental expense for operating leases was $3.0 million in fiscal 2018, $2.9 million in fiscal 2017, and $3.0 million in fiscal 2016. Future minimum rental commitments for noncancellable operating leases are $2.6 million in fiscal 2019; $1.9 million in fiscal 2020; $1.1 million in fiscal 2021; $181,000 in fiscal 2022; and $10,000 in fiscal 2023. Management expects that in the normal course of business, these leases will be renewed or replaced by other operating leases.
Operating Leases- Related Parties
In connection with an asset purchase agreement with Read (see note 2) on April 1, 2018, we assumed the lease of the building where the operation is located. This lease is with an executive of Read. The lease agreement requires monthly payments of $18,000 per month for a term of 3 years, expiring on March 31, 2021. The lease contains four successive options to renew the lease with each renewal period being three years at prices determined at the date of renewal as defined in the agreement. Rents paid to the executive of Read totaled $18,000 during fiscal 2018.
Additionally, we lease a plant facility associated with our mattress fabrics segment from a partnership owned by certain shareholders and officers of the company and their immediate families. Currently, this facility is being leased on a month to month basis at an amount of $13,000 per month. Rents paid to entities owned by certain shareholders and officers of the company and their immediate families totaled $156,000 in fiscal 2018, 2017, and 2016, respectively.
Other Litigation
The company is involved in legal proceedings and claims which have arisen in the ordinary course of business. Management has determined that it is not reasonably possible that these actions, when ultimately concluded and settled, will have a material adverse effect upon the financial position, results of operations, or cash flows of the company.
Accounts Payable – Capital Expenditures
At April 29, 2018, we had total amounts due regarding capital expenditures totaling $1.8 million, of which $1.4 million is financed and pertains to completed work for the construction of a new building (see below). The total $1.8 million amount is required to be paid in full in fiscal 2019.
At April 30, 2017, we had total amounts due regarding capital expenditures totaling $6.1 million, of which $5.1 million was financed and pertained to completed work for the construction of a new building (see below). Of the total $6.1 million, $4.8 million and $1.3 million were required to be paid in fiscal 2018 and 2019, respectively.
79
Purchase Commitments - Capital Expenditures
At April 29, 2018, we had open purchase commitments to construct a building and equipment for our mattress fabrics segment totaling $3.4 million. The $3.4 million includes $1.4 million (all of which represents completed work) associated with the construction of a new building noted below.
Effective May 16, 2016, we entered into an agreement with a contractor to construct a new building located in North Carolina that expands our distribution capabilities and office space at a cost of $11.3 million. This agreement required an installment payment of $1.9 million in April 2016, $4.3 million in fiscal 2017, $3.7 million in fiscal 2018, and $1.4 million in fiscal 2019 (which was paid in May 2018). Interest was charged on the outstanding installment payments at a rate of $2.25% plus the current 30 day LIBOR rate. Also, we were required to issue a letter of a credit totaling $5.0 million with the contractor being the beneficiary.
In addition to the interest that was charged on the outstanding installment payments, there was a 0.1% unused fee calculated on the balance of the $5.0 million letter of credit less the amount outstanding per month (see note 11 for further details).
This new building was placed into service July 2017 (our first quarter of fiscal 2018).
13.
STOCK-BASED COMPENSATION
Equity Incentive Plan Description
On September 16, 2015, our shareholders approved an equity incentive plan entitled the Culp, Inc. 2015 Equity Incentive Plan (the “2015 Plan”). The 2015 Plan updated and replaced our 2007 Equity Incentive Plan (the “2007 Plan”) as the vehicle for granting new equity based awards substantially similar to those authorized under the 2007 Plan. In general, the 2015 Plan authorizes the grant of stock options intended to qualify as incentive stock options, nonqualified stock options, stock appreciation rights, restricted stock, restricted stock units, performance units, and other equity and cash related awards as determined by our Compensation Committee. An aggregate of 1,200,000 shares of common stock were authorized for issuance under the 2015 Plan, with certain sub-limits that would apply with respect to specific types of awards that may be issued as defined in the 2015 Plan. In connection with the approval of the 2015 Plan, no further awards will be granted under the 2007 Plan, but outstanding awards under the 2007 Plan will be settled in accordance with their terms.
At April 29, 2018, there were 978,908 shares available for future equity based grants under the company’s 2015 Plan.
Stock Options
Under our 2007 Plan, employees, outside directors, and others associated with the company were granted options to purchase shares of common stock at the fair market value on the date of grant.
80
The following tables summarize stock option activity during fiscal 2018, 2017, and 2016:
|
2018
|
2017
|
2016
|
||||||||||||||||||||||
|
|
Weighted-
|
|
Weighted-
|
|
Weighted-
|
|||||||||||||||||||
|
|
Average
|
|
Average
|
|
Average
|
|||||||||||||||||||
|
|
Exercise
|
|
Exercise
|
|
Exercise
|
|||||||||||||||||||
|
Shares
|
Price
|
Shares
|
Price
|
Shares
|
Price
|
|||||||||||||||||||
|
outstanding at beginning
|
||||||||||||||||||||||||
|
of year
|
15,600
|
$
|
7.14
|
83,600
|
$
|
8.37
|
140,100
|
$
|
6.49
|
|||||||||||||||
|
granted
|
-
|
- |
-
|
-
|
- |
-
|
||||||||||||||||||
|
exercised
|
(15,600
|
)
|
7.14
|
(68,000
|
)
|
8.65
|
(54,500
|
)
|
3.68
|
|||||||||||||||
|
canceled/expired
|
-
|
-
|
- |
-
|
(2,000
|
) |
4.59
|
|||||||||||||||||
|
outstanding at end of year
|
-
|
-
|
15,600
|
7.14
|
83,600
|
8.37
|
||||||||||||||||||
At April 29, 2018, there were no option shares of common stock outstanding and exercisable. Therefore, there was no unrecognized compensation cost related to incentive stock option awards at April 29, 2018. No compensation expense was recorded for incentive or non-qualified stock options in fiscal 2018, 2017 and 2016 as all stock option awards were fully vested prior to fiscal 2016.
The aggregate intrinsic value for options exercised was $393,000, $1.7 million, and $1.3 million, in fiscal 2018, 2017, and 2016, respectively.
Time-Based Restricted Stock Awards
The following table summarizes the time vested restricted stock activity during fiscal years 2018, 2017, and 2016:
|
2018
|
2017
|
2016
|
||||||||||
|
Shares
|
Shares
|
Shares
|
||||||||||
|
outstanding at beginning of year
|
1,200
|
-
|
-
|
|||||||||
|
granted
|
1,200
|
1,200
|
- | |||||||||
|
vested
|
(1,200
|
)
|
-
|
-
|
||||||||
|
outstanding at end of year
|
1,200
|
1,200
|
-
|
|||||||||
The following table summarizes information related to our grants of time-based restricted stock awards associated with a key member of management during fiscal years 2018 and 2017:
|
|
(1) |
|
(2)
|
|||||||
|
Restricted Stock
|
Price Per
|
Vesting
|
||||||||
|
Date of Grant
|
Awarded
|
Share
|
Period | |||||||
|
July 13, 2017
|
|
1,200
|
$ | 32.50 |
11 months
|
|||||
|
June 14, 2016
|
1,200
|
$
|
28.00
|
11 months
|
||||||
During the first quarter of fiscal 2018, 1,200 shares of common stock associated with the June 14, 2016 grant vested and had a weighted average fair value of $34,000 or $28 per share.
At April 29, 2018, the remaining unrecognized compensation cost related to our time vested restricted common stock units was $5,000, which is expected to be recognized over the next 1.5 months.
We recorded compensation expense of $38,000 and $29,000 within selling, general, and administrative expense for time vested restricted stock units in fiscal 2018 and 2017, respectively. No compensation expense was recorded for time vested restricted stock awards in fiscal 2016 as all time vested restricted stock awards granted prior to fiscal 2016 were fully vested at the end of fiscal 2015.
81
Performance Based Restricted Stock Units
We have granted performance based restricted stock units to executives and other key members of management and a non-employee which could earn up to a certain number of shares of common stock if certain performance targets are met as defined in the related restricted stock unit agreements. Our performance based restricted stock units granted to key members of management were measured based on the fair market value on the date of grant. Our performance based restricted stock units granted to a non-employee were measured based on the fair market value at the earlier date of when the performance criteria are met or the end of the reporting period.
Executive Management
On July 13, 2017, we granted performance-based restricted stock units to members of executive management (NEOs) which could earn up to a certain number of shares of common stock if certain performance targets are met over a three-fiscal year performance period as defined in the related restricted stock unit agreements. The number of shares of common stock that are earned based on the performance targets that have been achieved will be adjusted based on a market-based total shareholder return component as defined in the related restricted stock unit agreements.
Compensation cost is measured based on the fair market value on the date of grant (July 13, 2017). The fair market value per share was determined using the Monte Carlo simulation model for the market-based total shareholder return component and the closing price of our common stock for the performance-based components.
The following table provides assumptions used to determine the fair market value of the market-based total shareholder return component using the Monte Carlo simulation model on the date of grant of July 13, 2017:
|
Closing price of our common stock
|
$
|
32.50
|
||
|
Expected volatility of our common stock
|
31.0
|
%
|
||
|
Expected volatility of peer companies
|
16.5
|
%
|
||
|
Risk-free interest rate
|
1.56
|
%
|
||
|
Dividend yield
|
1.66
|
%
|
||
|
Correlation coefficient of peer companies
|
0.46
|
On July 14, 2016 and July 15, 2015, we granted performance-based restricted stock units to NEOs which could earn up to a certain number of shares of common stock if certain performance targets were met over a three-fiscal year performance period as defined in the related restricted stock unit agreements. These awards were measured based on the fair market value (closing price of our common stock) on the date of grant. No market-based total shareholder return component was included in these awards.
Other Key Employees and a Non-Employee
We granted performance-based restricted stock units which could earn up to a certain number of shares of common stock if certain performance targets are met over a three-fiscal year performance period as defined in the related restricted stock unit agreements. Our performance based restricted stock units granted to other key employees were measured based on the fair market value (the closing price of our common stock) on the date of grant. Our performance based restricted stock units granted to a non-employee were measured based on the fair market value (the closing price of our common stock) at the earlier date of when the performance criteria are met or the end of the reporting period. No market-based total shareholder return component was included in these awards.
82
Overall
The following table summarizes information related to our grants of performance based restricted stock units associated with NEOs and key employees that are currently unvested:
| (3) |
|
||||||||
|
Restricted Stock
|
Price Per
|
Vesting
|
|||||||
|
Date of Grant
|
Units Awarded
|
Share
|
Period
|
||||||
|
July 13, 2017 (1)
|
78,195
|
$
|
31.85(4)
|
|
3 years
|
||||
|
July 13, 2017 (2)
|
44,000
|
$
|
32.50(5)
|
|
3 years
|
||||
|
July 14, 2016 (1) (2)
|
107,880
|
$
|
28.00(5)
|
|
3 years
|
||||
|
July 15, 2015 (1) (2)
|
107,554
|
$
|
32.23(5)
|
|
3 years
|
||||
(1) Performance-based restricted stock units awarded to NEOs.
(2) Performance-based restricted stock units awarded to key employees.
(3) Amounts represent the maximum number of common stock shares that could be earned if certain performance targets are met as defined in the related restricted stock unit agreements.
(4) Price per share represents the fair market value per share ($0.98 per $1 or a reduction of $0.65 to the closing price of the our common stock) determined using the Monte Carlo simulation model for the market-based total shareholder return component and the closing price of our common stock ($32.50) for the performance-based components of the performance-based restricted stock units granted to our NEOs on July 13, 2017.
(5) Price per share represents the closing price of our common stock on the date of grant.
The following table summarizes information related to our grants of performance-based restricted stock units associated with a non-employee that are currently unvested:
| (1) |
|
||||||||
|
Restricted Stock
|
Price Per
|
Vesting
|
|||||||
|
Date of Grant
|
Units Awarded
|
Share
|
Period
|
||||||
|
July 13, 2017
|
10,200
|
$
|
30.10(2)
|
|
3 years
|
||||
|
July 14, 2016
|
11,549
|
$
|
30.10(2)
|
|
3 years
|
||||
|
July 15, 2015
|
10,364
|
$
|
30.10(2)
|
|
3 years
|
||||
(1) Amounts represent the maximum number of common stock shares that could be earned if certain performance targets are met as defined in the related restricted stock unit agreements.
(2) The respective grant was unvested at the end of our reporting period. Accordingly, the price per share represents the closing price of our common stock on April 29, 2018, the end of our reporting period.
83
The following table summarizes information related to our performance based restricted stock units that vested during the fiscal 2018, 2017, and 2016:
| (3) |
|
|||||||||||
|
Common Stock
|
Weighted Average
|
Price
|
||||||||||
|
Fiscal Year
|
Shares Vested
|
Fair Value
|
Per Share
|
|||||||||
|
Fiscal 2018 (1)
|
102,845
|
$
|
1,820
|
$
|
17.70(4)
|
|
||||||
|
Fiscal 2018 (2)
|
16,000
|
$
|
520
|
$
|
32.50(5)
|
|
||||||
|
Fiscal 2017 (1)
|
37,192
|
$
|
637
|
$
|
17.12(4)
|
|
||||||
|
Fiscal 2017 (2)
|
12,000
|
$
|
345
|
$
|
28.77(5)
|
|
||||||
|
Fiscal 2016 (1)
|
115,855
|
$
|
1,183
|
$
|
10.21(4)
|
|
||||||
(1) NEOs and key employees.
(2) Non-employee
(3) Dollar amounts are in thousands.
(4) Price per share represents closing price of our common stock on the date of grant.
(5) The respective grants vested during the first quarter of fiscal 2018 or 2017, respectively. Accordingly, the price per share represents the closing price of our common stock on the date the award vested.
We recorded compensation expense of $2.0 million, $3.2 million and $2.6 million within selling, general, and administrative expense associated with our performance based restricted stock units for fiscal 2018, 2017, and 2016, respectively. Compensation cost is recorded based on an assessment each reporting period of the probability that certain performance goals will be met during the vesting period. If performance goals are not probable of occurrence, no compensation cost will be recognized and any recognized compensation cost would be reversed.
At April 29, 2018, the remaining unrecognized compensation cost related to the performance based restricted stock units was $1.3 million, which is expected to be recognized over a weighted average vesting period of 1.3 years.
Common Stock Awards
The following table summarizes information related to our grants of common stock to our outside directors during fiscal 2018, 2017, and 2016:
| (1) |
|
||||||||
|
Common Stock
|
Price Per
|
Vesting
|
|||||||
|
Date of Grant
|
Awarded
|
Share
|
Period
|
||||||
|
October 2, 2017
|
4,800
|
$
|
33.20
|
Immediate
|
|||||
|
October 3, 2016
|
4,800
|
$
|
29.80
|
Immediate
|
|||||
|
October 1, 2015
|
3,000
|
$
|
31.77
|
Immediate
|
|||||
(1) Price per share represents closing price of our common stock on the date of grant.
We recorded $159,000, $143,000, and $95,000, of compensation expense within selling, general, and administrative expense for these common stock awards for fiscal 2018, 2017, and 2016, respectively.
84
14. FAIR VALUE OF FINANCIAL INSTRUMENTS
ASC Topic 820 establishes a fair value hierarchy that distinguishes between assumptions based on market data (observable inputs) and the company’s assumptions (unobservable inputs). Determining where an asset or liability falls within that hierarchy depends on the lowest level input that is significant to the fair value measurement as a whole. An adjustment to the pricing method used within either level 1 or level 2 inputs could generate a fair value measurement that effectively falls in a lower level in the hierarchy. The hierarchy consists of three broad levels as follows:
Level 1 – Quoted market prices in active markets for identical assets or liabilities;
Level 2 – Inputs other than level 1 inputs that are either directly or indirectly observable, and
Level 3 – Unobservable inputs developed using the company’s estimates and assumptions, which reflect those that market participants would use.
Recurring Basis
The following table presents information about assets and liabilities measured at fair value on a recurring basis:
|
|
Fair value measurements at April 29, 2018 using:
|
|||||||||||||||
|
|
Quoted prices in
active markets
for identical
assets
|
Significant other
observable inputs
|
Significant
unobservable
inputs
|
|||||||||||||
|
(amounts in thousands)
|
Level 1
|
Level 2
|
Level 3
|
Total
|
||||||||||||
|
Assets:
|
||||||||||||||||
|
Premier Money Market Fund
|
$
|
6,492
|
N/A
|
N/A
|
$
|
6,492
|
||||||||||
|
Low Duration Bond Fund
|
1,085
|
N/A
|
N/A
|
1,085
|
||||||||||||
|
Intermediate Term Bond Fund
|
747
|
N/A
|
N/A
|
747
|
||||||||||||
|
Strategic Income Fund
|
619
|
N/A
|
N/A
|
619
|
||||||||||||
|
Large Blend Fund
|
402
|
N/A
|
N/A
|
402
|
||||||||||||
|
Growth Allocation Fund
|
169
|
N/A
|
N/A
|
169
|
||||||||||||
|
Moderate Allocation Fund
|
113
|
N/A
|
N/A
|
113
|
||||||||||||
|
Other
|
150
|
N/A
|
N/A
|
150
|
||||||||||||
|
Liabilities:
|
||||||||||||||||
|
EURO Foreign Exchange Contract
|
N/A
|
$
|
55
|
N/A
|
$
|
55
|
||||||||||
85
|
|
Fair value measurements at April 30, 2017 using:
|
|||||||||||||||
|
|
Quoted prices in
active markets
for identical
assets
|
Significant other
observable inputs
|
Significant
unobservable
inputs
|
|||||||||||||
|
(amounts in thousands)
|
Level 1
|
Level 2
|
Level 3
|
Total
|
||||||||||||
|
Assets:
|
||||||||||||||||
|
Premier Money Market Fund
|
$
|
4,811
|
N/A
|
N/A
|
$
|
4,811
|
||||||||||
|
Low Duration Bond Fund
|
1,081
|
N/A
|
N/A
|
1,081
|
||||||||||||
|
Intermediate Term Bond Fund
|
751
|
N/A
|
N/A
|
751
|
||||||||||||
|
Strategic Income Fund
|
611
|
N/A
|
N/A
|
611
|
||||||||||||
|
Large Blend Fund
|
365
|
N/A
|
N/A
|
365
|
||||||||||||
|
Growth Allocation Fund
|
126
|
N/A
|
N/A
|
126
|
||||||||||||
|
Moderate Allocation Fund
|
88
|
N/A
|
N/A
|
88
|
||||||||||||
|
Other
|
76
|
N/A
|
N/A
|
76
|
||||||||||||
|
Liabilities:
|
||||||||||||||||
|
None
|
N/A
|
N/A
|
N/A
|
N/A
|
||||||||||||
Our EURO foreign exchange contract was recorded at a fair value provided by our bank and is classified within level 2 of the fair value hierarchy. Most derivative contracts are not listed on an exchange and require the use of valuation models. In accordance with ASC Topic 820, we attempted to maximize the use of observable inputs used in the valuation models used to determine the fair value of this contract. Derivative contracts valued based on valuation models with significant unobservable inputs and that are not actively traded, are classified within level 3 of the fair value hierarchy.
The determination of where an asset or liability falls in the hierarchy requires significant judgment. We evaluate our hierarchy disclosures each quarter based on various factors and it is possible that an asset or liability may be classified differently from quarter to quarter. However, we expect that changes in classifications between different levels will be rare.
Nonrecurring Basis
At April 29, 2018, we had no assets that were required to be measured at fair value on a nonrecurring basis other than the assets acquired from Read (see note 2) that were acquired at fair value:
|
|
Fair value measurements at April 29, 2018 using:
|
|||||||||||||||
|
|
Quoted prices in
active markets
for identical
assets
|
Significant other
observable inputs
|
Significant
unobservable
inputs
|
|||||||||||||
|
(amounts in thousands)
|
Level 1
|
Level 2
|
Level 3
|
Total
|
||||||||||||
|
Assets:
|
||||||||||||||||
|
Customer Relationships
|
N/A
|
N/A
|
$
|
2,247
|
$
|
2,247
|
||||||||||
|
Goodwill
|
N/A
|
N/A
|
2,107
|
2,107
|
||||||||||||
|
Inventory
|
N/A
|
N/A
|
1,128
|
1,128
|
||||||||||||
|
Tradename
|
N/A
|
N/A
|
683
|
683
|
||||||||||||
|
Equipment
|
N/A
|
N/A
|
379
|
379
|
||||||||||||
|
Liabilities:
|
||||||||||||||||
|
None
|
N/A
|
N/A
|
N/A
|
N/A
|
||||||||||||
86
These customer relationships were recorded at fair market value using a multi-period excess earnings valuation model that used significant unobservable inputs and were classified as level 3. The tradename was recorded at fair market value using the royalty from relief method that used significant unobservable inputs and were classified as level 3.
Additionally, we acquired certain current assets such as accounts receivable and other assets and assumed certain liabilities such as deferred revenue, accounts payable and accrued expenses. Based on the nature of these items and their short maturity, the carrying amount of these items approximated their fair values. See note 2 for the allocation of the acquisition cost to the assets acquired and liabilities assumed based on their fair values.
15. DERIVATIVES
During the fourth quarter, we entered into a EURO foreign exchange contract to mitigate the risk of foreign exchange rate fluctuations associated with certain capital expenditures. The contract effectively converts our EURO capital expenditures at a fixed EURO foreign exchange rate compared with the United States dollar of 1.263 and is due to expire in August 2018.
In accordance with the provisions of ASC Topic 815, Derivatives and Hedging, our EURO foreign exchange contract was designated as a cash flow hedge, with the fair value of these financial instruments recorded in other assets and changes in fair value recorded in accumulated other comprehensive income. ASC Topic 815 requires disclosure of gains and losses on derivative instruments in the following tabular format.
| (Amounts in Thousands) | ||||
|
|
Fair Values of Derivative Instruments
|
|||
|
|
April 29, 2018
|
April 30,2017
|
||
|
|
|
|
||
|
Derivatives designated as hedging instruments under ASC Topic 815
|
Balance
Sheet
Location
|
Fair
Value
|
Balance
Sheet
Location
|
Fair
Value
|
|
Euro Foreign Exchange Contract
|
Accrued Expenses
|
$55
|
N/A
|
$-
|
|
Derivatives in ASC Topic 815 Net Investment Hedging Relationships
|
Amt of Gain (Loss) (net of tax) Recognized in OCI on Derivative (Effective Portion) and recorded in Accrued Expenses at Fair Value
|
Location of Gain or (Loss) Reclassified from Accumulated OCI into Income
(Effective Portion)
|
Amount of Gain or (Loss) Reclassified from Accumulated OCI into Income (Effective Portion)
|
Location of Gain or (Loss) Recognized in Income on Derivative (Ineffective Portion and Amount Excluded from Effectiveness Testing)
|
Amount of Gain (loss) (net of tax) Recognized in Income on Derivative (Ineffective Portion and Amount Excluded from Effectiveness Testing)
|
|||||||||||||||||||||||||||||||||
|
|
|
|
||||||||||||||||||||||||||||||||||||
|
|
2018
|
2017
|
2016
|
|
2018
|
2017
|
2016
|
|
2018
|
2017
|
2016
|
|||||||||||||||||||||||||||
|
|
|
|
||||||||||||||||||||||||||||||||||||
|
EURO Foreign Exchange Contract
|
$
|
(55
|
)
|
$
|
-
|
$
|
-
|
Other Exp
|
$
|
-
|
$
|
-
|
$
|
-
|
Other Exp
|
$
|
-
|
$
|
-
|
$
|
-
|
|||||||||||||||||
87
16. NET INCOME PER SHARE
Basic net income per share is computed using the weighted-average number of shares outstanding during the period. Diluted net income per share uses the weighted-average number of shares outstanding during the period plus the dilutive effect of stock-based compensation calculated using the treasury stock method. Weighted average shares used in the computation of basic and diluted net income per share are as follows:
|
(in thousands)
|
2018
|
2017
|
2016
|
|||||||||
|
weighted-average common
|
||||||||||||
|
shares outstanding, basic
|
12,431
|
12,312
|
12,302
|
|||||||||
|
dilutive effect of stock-based compensation
|
202
|
206
|
173
|
|||||||||
|
weighted-average common
|
||||||||||||
|
shares outstanding, diluted
|
12,633
|
12,518
|
12,475
|
|||||||||
All options to purchase shares of common stock were included in the computation of diluted net income for fiscal years 2018, 2017, and 2016, as the exercise price of the options was less than the average market price of common shares.
17. BENEFIT PLANS
Defined Contribution Plans
The company has defined contribution plans which cover substantially all employees and provides for participant contributions on a pre-tax basis and matching contributions by the company for its U.S. and Canadian operations. Our contributions to the plan were $1.1 million, $924,000, and $843,000 during fiscal years 2018, 2017, and 2016, respectively.
Deferred Compensation Plan
We have a nonqualified deferred compensation plan (the “Plan”) covering officers and certain key members of management. The Plan provides for participant deferrals on a pre-tax basis that are subject to annual deferral limits by the IRS and non-elective contributions made by the company. Participant deferrals and non-elective contributions made by the company are immediately vested.
Our contributions to the Plan were $192,000, $185,000 and $180,000 in fiscal years 2018, 2017, and 2016, respectively. Our nonqualified deferred compensation plan liability of $7.4 million and $5.5 million at April 29, 2018 and April 30, 2017, were recorded in deferred compensation in the 2018 and 2017 Consolidated Balance Sheets, respectively.
We have a Rabbi Trust (the “Trust”) to set aside funds for the participants of the Plan and enable the participants to direct their contributions to various investment options in the Plan. The investment options of the Plan consist of a money market fund and various mutual funds. The funds set aside in the Trust are subject to the claims of our general creditors in the event of the company’s insolvency as defined in the Plan.
The investment assets of the Trust are recorded at their fair value of $7.3 million and $5.5 million at April 29, 2018 and April 30, 2017, and were recorded in long-term investments-rabbi trust in the 2018 and 2017 Consolidated Balance Sheets, respectively. The investment assets of the Trust are classified as available for sale and accordingly, changes in their fair values are recorded in other comprehensive income (loss).
88
18. SEGMENT INFORMATION
The company’s operations are classified into two business segments: mattress fabrics and upholstery fabrics. The mattress fabrics segment manufacturers, sources, and primarily sells fabrics and mattress covers to bedding manufacturers. The upholstery fabrics segment manufacturers, sources, and sells fabrics primarily to residential and commercial furniture manufacturers.
Net sales denominated in U.S. dollars accounted for 90%, 92% and 93% of total consolidated net sales in fiscal 2018, 2017, and 2016, respectively. International sales accounted for 23% of net sales in fiscal 2018 and 22% of net sales in fiscal years 2017 and 2016, and are summarized by geographic area as follows:
|
(dollars in thousands)
|
2018
|
2017
|
2016
|
|||||||||
|
north america (excluding USA) (1)
|
$
|
27,844
|
29,995
|
31,667
|
||||||||
|
far east and asia (2)
|
40,671
|
34,695
|
31,927
|
|||||||||
|
all other areas
|
5,681
|
3,618
|
4,336
|
|||||||||
|
$
|
74,196
|
68,308
|
67,930
|
|||||||||
|
(1)
|
Of this amount, $21.9 million, $22.3 million, and $24.2 million are attributable to shipments to Mexico in fiscal 2018, 2017, and 2016, respectively.
|
|
(2)
|
Of this amount $32.6 million, $26.6 million, and $23.1 million are attributable to shipments to China in fiscal 2018, 2017, and 2016, respectively.
|
Sales are attributed to individual countries based upon location that the company ships its products to for delivery to customers.
The company evaluates the operating performance of its segments based upon income from operations before certain unallocated corporate expenses, and other non-recurring items. Cost of sales in both segments include costs to manufacture or source our products, including costs such as raw material and finished goods purchases, direct and indirect labor, overhead and incoming freight charges. Unallocated corporate expenses primarily represent compensation and benefits for certain executive officers, all costs related to being a public company, and other miscellaneous expenses. Segment assets include assets used in operations of each segment and primarily consist of accounts receivable, inventories, and property, plant, and equipment. The mattress fabrics segment also includes in segment assets, goodwill, an investment in an unconsolidated joint venture, a non-compete agreement and customer relationships
associated with an acquisition. The upholstery fabrics segment also includes in segment assets goodwill, customer relationships, and tradename associated with the acquisition of Read Window Products, LLC. (see note 2 for further details).
89
Statements of operations for the company’s operating segments are as follows:
|
(dollars in thousands)
|
2018
|
2017
|
2016
|
|||||||||
|
net sales:
|
||||||||||||
|
upholstery fabrics
|
$
|
131,128
|
118,739
|
126,441
|
||||||||
|
mattress fabrics
|
192,597
|
190,805
|
186,419
|
|||||||||
|
$
|
323,725
|
309,544
|
312,860
|
|||||||||
|
gross profit:
|
||||||||||||
|
upholstery fabrics
|
$
|
25,836
|
26,170
|
26,393
|
||||||||
|
mattress fabrics
|
38,797
|
43,065
|
38,718
|
|||||||||
|
$
|
64,633
|
69,235
|
65,111
|
|||||||||
|
(dollars in thousands)
|
2018
|
2017
|
2016
|
|||||||||
|
selling, general, and administrative expenses:
|
||||||||||||
|
upholstery fabrics
|
$
|
14,881
|
15,079
|
15,094
|
||||||||
|
mattress fabrics
|
12,935
|
13,685
|
12,223
|
|||||||||
|
unallocated corporate
|
9,356
|
10,393
|
9,456
|
|||||||||
|
total selling, general, and administrative expenses
|
$
|
37,172
|
39,157
|
36,773
|
||||||||
|
Income from operations:
|
||||||||||||
|
upholstery fabrics
|
$
|
10,956
|
11,091
|
11,298
|
||||||||
|
mattress fabrics
|
25,861
|
29,380
|
26,496
|
|||||||||
|
total segment income from operations
|
36,817
|
40,471
|
37,794
|
|||||||||
|
unallocated corporate expenses
|
(9,356
|
)
|
(10,393
|
)
|
(9,456
|
)
|
||||||
|
total income from operations
|
27,461
|
30,078
|
28,338
|
|||||||||
|
interest expense
|
(94
|
)
|
-
|
-
|
||||||||
|
interest income
|
534
|
299
|
176
|
|||||||||
|
other expense
|
(1,018
|
)
|
(681
|
)
|
(616
|
)
|
||||||
|
income before income taxes
|
$
|
26,883
|
29,696
|
27,898
|
||||||||
One customer within the upholstery fabrics segment represented 12%, 11%, and 13% of consolidated net sales in fiscal 2018, 2017 and 2016, respectively. One customer within the mattress fabrics segment represented 13% of consolidated net sales in fiscal 2018, 2017, and 2016, respectively. One customer within the upholstery fabrics segment accounted for 13% of the net accounts receivable balance as of April 29, 2018 and no customers within the upholstery fabrics segment accounted for 10% or more of net accounts receivable as of April 30, 2017. Two customers within the mattress fabrics segment accounted for 20% and 22% of the net accounts receivable balance as of April 29, 2018 and April 30, 2017, respectively.
The hourly employees at our manufacturing facility in Canada (approximately 12% of our workforce) are represented by a local, unaffiliated union. The collective bargaining agreement for these employees expires on February 1, 2020. We are not aware of any efforts to organize any more of our employees, and we believe our relations with our employees are good.
90
Balance sheet information for the company’s operating segments follow:
|
(dollars in thousands)
|
2018
|
2017
|
2016
|
|||||||||
|
segment assets
|
||||||||||||
|
mattress fabrics
|
||||||||||||
|
current assets (1)
|
$
|
43,935
|
47,038
|
43,472
|
||||||||
|
non-compete agreements, net
|
753
|
828
|
903
|
|||||||||
|
customer relationships
|
613
|
664
|
715
|
|||||||||
|
goodwill
|
11,462
|
11,462
|
11,462
|
|||||||||
|
investment in unconsolidated joint venture
|
1,501
|
1,106
|
-
|
|||||||||
|
property, plant, and equipment
|
48,797
|
(2)
|
48,916
|
(3)
|
37,480
|
(4)
|
||||||
|
total mattress fabrics assets
|
$
|
107,061
|
110,014
|
94,032
|
||||||||
|
upholstery fabrics
|
||||||||||||
|
current assets (1)
|
$
|
35,826
|
29,021
|
26,540
|
||||||||
|
customer relationships
|
2,226
|
-
|
-
|
|||||||||
|
tradename
|
683
|
-
|
-
|
|||||||||
|
goodwill
|
2,107
|
-
|
-
|
|||||||||
|
property, plant, and equipment
|
2,445
|
(5)
|
1,879
|
(6)
|
1,564
|
(7)
|
||||||
|
total upholstery fabrics assets
|
$
|
43,287
|
30,900
|
28,104
|
||||||||
|
total segment assets
|
150,348
|
140,914
|
122,136
|
|||||||||
|
non-segment assets
|
||||||||||||
|
cash and cash equivalents
|
21,228
|
20,795
|
37,787
|
|||||||||
|
short-term investments – available for sale
|
2,451
|
2,443
|
4,359
|
|||||||||
|
short-term investments – held-to-maturity
|
25,759
|
-
|
-
|
|||||||||
|
income taxes receivable
|
-
|
-
|
155
|
|||||||||
|
deferred income taxes
|
1,458
|
419
|
2,319
|
|||||||||
|
other current assets
|
2,870
|
2,894
|
2,477
|
|||||||||
|
property, plant, and equipment
|
552
|
(8)
|
856
|
(8)
|
929
|
(8)
|
||||||
|
long-term investments - held-to-maturity
|
5,035
|
30,945
|
-
|
|||||||||
|
long-term investments - rabbi trust
|
7,326
|
5,466
|
4,025
|
|||||||||
|
other assets
|
957
|
902
|
955
|
|||||||||
|
total assets
|
$
|
217,984
|
205,634
|
175,142
|
||||||||
|
capital expenditures (9):
|
||||||||||||
|
mattress fabrics
|
$
|
6,713
|
17,689
|
9,666
|
||||||||
|
upholstery fabrics
|
488
|
822
|
626
|
|||||||||
|
unallocated corporate
|
238
|
260
|
416
|
|||||||||
|
$
|
7,439
|
18,771
|
10,708
|
|||||||||
|
depreciation expense
|
||||||||||||
|
mattress fabrics
|
$
|
6,850
|
6,245
|
5,837
|
||||||||
|
upholstery fabrics
|
822
|
840
|
834
|
|||||||||
|
total segment depreciation expense
|
$
|
7,672
|
7,085
|
6,671
|
||||||||
|
(1)
|
Current assets represent accounts receivable and inventory.
|
|
(2)
|
The $48.8 million at April 29, 2018, represents property, plant, and equipment located in the U.S. of $35.4 million and located in Canada of $13.4 million.
|
|
(3)
|
The $48.9 million at April 30, 2017, represents property, plant, and equipment located in the U.S. of $34.0 million and located in Canada of $14.9 million.
|
|
(4)
|
The $37.5 million at May 1, 2016, represents property, plant, and equipment located in the U.S. of $24.8 million and located in Canada of $12.7 million.
|
|
(5)
|
The $2.4 million at April 29, 2018, represents property, plant, and equipment located in the U.S. of $1.8 million and located in China of $661.
|
|
(6)
|
The $1.9 million at April 30, 2017, represents property, plant, and equipment located in the U.S. of $1.2 million and located in China of $655.
|
|
(7)
|
The $1.6 million at May 1, 2016, represents property, plant, and equipment located in the U.S. of $893 and located in China of $671.
|
|
(8)
|
The $552, $856, and $929 balance at April 29, 2018, April 30, 2017, and May 1, 2016, represent property, plant, and equipment associated with unallocated corporate departments and corporate departments shared by both the mattress and upholstery fabric segments located in the U.S.
|
|
(9)
|
Capital expenditure amounts are stated on an accrual basis. See Consolidated Statement of Cash Flows for capital expenditure amounts on a cash basis.
|
91
19. STATUTORY RESERVES
The company’s subsidiaries located in China are required to transfer 10% of their net income, as determined in accordance with the People’s Republic of China (PRC) accounting rules and regulations, to a statutory surplus reserve fund until such reserve balance reaches 50% of the company’s registered capital.
The transfer to this reserve must be made before distributions of any dividend to shareholders. As of April 29, 2018, the company’s statutory surplus reserve was $4.6 million, representing 10% of accumulated earnings and profits determined in accordance with PRC accounting rules and regulations. The surplus reserve fund is non-distributable other than during liquidation and can be used to fund previous years’ losses, if any, and may be utilized for business expansion or converted into share capital by issuing new shares to existing shareholders in proportion to their shareholding or by increasing the par value of the shares currently held by them provided that the remaining reserve balance after such issue is not less than 25% of the registered capital.
The company’s subsidiaries located in China can transfer funds to the parent company with the exception of the statutory surplus reserve of $4.6 million to assist with debt repayment, capital expenditures, and other expenses of the company’s business.
20.
COMMON STOCK REPURCHASE PROGRAM
On June 15, 2016, we announced that our board of directors approved an authorization for us to acquire up to $5.0 million of our common stock. Under the common stock repurchase program, shares may be purchased from time to time in open market transactions, block trades, through plans established under the Securities Exchange Act Rule 10b5-1, or otherwise. The amount of shares purchased and the timing of such purchases will be based on working capital requirements, market and general business conditions, and other factors including alternative investment opportunities.
During fiscal 2018 and 2017, there were no repurchases of our common stock. During fiscal 2016, we purchased 100,776 shares of our common stock at a cost of $2.4 million, all of which was purchased during the third quarter.
At April 29, 2018, we had $5.0 million available for additional repurchases of our common stock.
92
21.
DIVIDEND PROGRAM
On June 13, 2018, we announced that our board of directors approved a regular quarterly cash dividend payment of $0.09 per share. These dividend payments are payable on July 16, 2018, to shareholders of record as of July 2, 2018.
During fiscal 2018, dividend payments totaled $6.8 million, of which $2.6 million represented a special cash dividend payment of $0.21 per share, and $4.2 million represented our regular quarterly cash dividend payments ranging from $0.08 to $0.09 per share.
During fiscal 2017, dividend payments totaled $6.3 million, of which $2.6 million represented a special cash dividend payment in the first quarter of $0.21 per share, and $3.7 million represented our regular quarterly cash dividend payments ranging from $0.07 to $0.08 per share.
During fiscal 2016, dividend payments totaled $8.1 million, of which $5.0 million represented a special cash dividend payment in the first quarter of $0.40 per share, and $3.1 million represented our regular quarterly cash dividend payments ranging from $0.06 to $0.07 per share.
Future dividend payments are subject to Board approval and may be adjusted at the Board’s discretion as business needs or market conditions change.
22.
EXIT AND DISPOSAL ACTIVITIES
On June 12, 2018, our board of directors decided to close our upholstery fabrics manufacturing facility in Anderson, South Carolina. This closure is due to a continued decline in demand for the products manufactured at this facility, reflecting a change in consumer style preferences. We expect to close the facility by October 30, 2018. This action is expected to result in estimated cash charges of approximately $450,000 for employee termination costs, and an undetermined non-cash charge associated with write-downs of inventory. During this transition period, we will be working with our customers to fulfill any outstanding and future orders, and through this process, we will be able to determine a good faith estimate of any write-downs of inventory. Currently, management estimates that the fair market value of the long-lived assets at this facility exceeds their carrying amount of approximately $400,000, and for this reason no charge for impairment of long-lived assets is expected to be recorded in connection with this decision.
93
|
SELECTED QUARTERLY DATA (UNAUDITED)
|
||||||||||||||||||||||||||||||||
|
fiscal
|
fiscal
|
fiscal
|
fiscal
|
fiscal
|
fiscal
|
fiscal
|
fiscal
|
|||||||||||||||||||||||||
|
2018
|
2018
|
2018
|
2018
|
2017
|
2017
|
2017
|
2017
|
|||||||||||||||||||||||||
|
(amounts in thousands except per share, ratios & other, stock data)
|
4th quarter
|
3rd quarter
|
2nd quarter
|
1st quarter
|
4th quarter
|
3rd quarter
|
2nd quarter
|
1st quarter
|
||||||||||||||||||||||||
|
INCOME STATEMENT DATA
|
||||||||||||||||||||||||||||||||
|
net sales
|
$
|
78,184
|
85,310
|
80,698
|
79,533
|
77,350
|
76,169
|
75,343
|
80,682
|
|||||||||||||||||||||||
|
cost of sales
|
63,424
|
67,707
|
64,894
|
63,068
|
60,194
|
59,410
|
58,442
|
62,263
|
||||||||||||||||||||||||
|
gross profit
|
14,760
|
17,603
|
15,804
|
16,465
|
17,156
|
16,759
|
16,901
|
18,419
|
||||||||||||||||||||||||
|
selling, general and administrative expenses
|
8,296
|
9,959
|
9,415
|
9,501
|
9,986
|
9,824
|
9,602
|
9,746
|
||||||||||||||||||||||||
|
income from operations
|
6,464
|
7,644
|
6,389
|
6,964
|
7,170
|
6,935
|
7,299
|
8,673
|
||||||||||||||||||||||||
|
interest expense
|
26
|
31
|
37
|
-
|
-
|
-
|
-
|
-
|
||||||||||||||||||||||||
|
interest income
|
(143
|
)
|
(132
|
)
|
(128
|
)
|
(131
|
)
|
(134
|
)
|
(124
|
)
|
(15
|
)
|
(25
|
)
|
||||||||||||||||
|
other expense
|
115
|
229
|
321
|
353
|
305
|
69
|
155
|
152
|
||||||||||||||||||||||||
|
income before income taxes
|
6,466
|
7,516
|
6,159
|
6,742
|
6,999
|
6,990
|
7,159
|
8,546
|
||||||||||||||||||||||||
|
income taxes
|
(6,217
|
)
|
8,208
|
2,108
|
1,640
|
778
|
643
|
2,684
|
3,233
|
|||||||||||||||||||||||
|
loss from investment in unconsolidated joint venture
|
17
|
56
|
75
|
118
|
23
|
-
|
-
|
-
|
||||||||||||||||||||||||
|
net income (loss)
|
$
|
12,666
|
(748
|
)
|
3,976
|
4,984
|
6,198
|
6,347
|
4,475
|
5,313
|
||||||||||||||||||||||
|
depreciation
|
$
|
1,992
|
1,966
|
1,905
|
1,807
|
1,781
|
1,793
|
1,751
|
1,761
|
|||||||||||||||||||||||
|
weighted average shares outstanding
|
12,450
|
12,436
|
12,440
|
12,399
|
12,340
|
12,313
|
12,308
|
12,286
|
||||||||||||||||||||||||
|
weighted average shares outstanding, assuming dilution
|
12,611
|
12,436
|
12,580
|
12,590
|
12,567
|
12,544
|
12,507
|
12,463
|
||||||||||||||||||||||||
|
PER SHARE DATA
|
||||||||||||||||||||||||||||||||
|
net income (loss) per share - basic
|
$
|
1.02
|
(0.06
|
)
|
0.32
|
0.40
|
0.50
|
0.52
|
0.36
|
0.43
|
||||||||||||||||||||||
|
net income (loss) per share - diluted
|
1.00
|
(0.06
|
)
|
0.32
|
0.40
|
0.49
|
0.51
|
0.36
|
0.43
|
|||||||||||||||||||||||
|
dividends per share
|
0.09
|
0.09
|
0.08
|
0.29
|
0.08
|
0.08
|
0.07
|
0.28
|
||||||||||||||||||||||||
|
book value
|
13.12
|
12.22
|
12.31
|
12.03
|
12.03
|
11.56
|
11.04
|
10.68
|
||||||||||||||||||||||||
|
BALANCE SHEET DATA
|
||||||||||||||||||||||||||||||||
|
operating working capital (3)
|
$
|
49,939
|
47,760
|
46,620
|
42,608
|
40,869
|
40,973
|
41,810
|
43,486
|
|||||||||||||||||||||||
|
property, plant and equipment, net
|
51,794
|
51,838
|
52,530
|
52,912
|
51,651
|
50,333
|
45,537
|
41,745
|
||||||||||||||||||||||||
|
total assets
|
217,984
|
216,844
|
201,043
|
207,904
|
205,634
|
191,056
|
179,127
|
183,360
|
||||||||||||||||||||||||
|
capital expenditures
|
1,568
|
1,274
|
1,529
|
3,068
|
3,097
|
6,590
|
5,541
|
3,543
|
||||||||||||||||||||||||
|
dividends paid
|
1,121
|
1,119
|
995
|
3,608
|
988
|
985
|
862
|
3,445
|
||||||||||||||||||||||||
|
lines of credit (1)
|
-
|
-
|
-
|
5,000
|
-
|
-
|
-
|
7,000
|
||||||||||||||||||||||||
|
shareholders' equity
|
163,376
|
152,182
|
153,080
|
149,677
|
148,630
|
142,314
|
135,949
|
131,435
|
||||||||||||||||||||||||
|
capital employed (2)
|
114,817
|
109,165
|
109,373
|
108,222
|
98,429
|
97,788
|
94,101
|
94,599
|
||||||||||||||||||||||||
|
RATIOS & OTHER DATA
|
||||||||||||||||||||||||||||||||
|
gross profit margin
|
18.9
|
%
|
20.6
|
%
|
19.6
|
%
|
20.7
|
%
|
22.2
|
%
|
22.0
|
%
|
22.4
|
%
|
22.8
|
%
|
||||||||||||||||
|
operating income margin
|
8.3
|
9.0
|
7.9
|
8.8
|
9.3
|
9.1
|
9.7
|
10.7
|
||||||||||||||||||||||||
|
net income (loss) margin
|
16.2
|
(0.9
|
)
|
4.9
|
6.3
|
8.0
|
8.3
|
5.9
|
6.6
|
|||||||||||||||||||||||
|
effective income tax rate
|
(96.1
|
)
|
109.2
|
34.2
|
24.3
|
11.1
|
9.2
|
37.5
|
37.8
|
|||||||||||||||||||||||
|
Debt-to-total capital employed ratio (1) (2)
|
0.0
|
0.0
|
0.0
|
4.6
|
0.0
|
0.0
|
0.0
|
7.4
|
||||||||||||||||||||||||
|
operating working capital turnover (3)
|
7.1
|
7.4
|
7.4
|
7.4
|
7.3
|
7.0
|
7.0
|
7.0
|
||||||||||||||||||||||||
|
days sales in receivables
|
30
|
28
|
27
|
25
|
29
|
27
|
23
|
26
|
||||||||||||||||||||||||
|
inventory turnover
|
4.8
|
5.2
|
5.2
|
4.7
|
5.0
|
5.2
|
5.2
|
5.3
|
||||||||||||||||||||||||
|
STOCK DATA
|
||||||||||||||||||||||||||||||||
|
stock price
|
||||||||||||||||||||||||||||||||
|
high
|
$
|
32.29
|
34.05
|
33.25
|
34.00
|
34.50
|
37.80
|
34.30
|
30.11
|
|||||||||||||||||||||||
|
low
|
27.40
|
26.15
|
27.00
|
30.60
|
30.25
|
26.80
|
26.72
|
25.57
|
||||||||||||||||||||||||
|
close
|
30.10
|
31.35
|
31.95
|
30.65
|
32.10
|
33.80
|
28.15
|
28.53
|
||||||||||||||||||||||||
|
daily average trading volume (shares)
|
18.3
|
17.4
|
24.4
|
27.9
|
37.7
|
43.5
|
45.9
|
40.9
|
||||||||||||||||||||||||
|
(1)
|
Debt represents outstanding borrowings on our lines of credit.
|
|
(2)
|
Capital employed does not include cash and cash equivalents, short-term investments (available-for-sale), short-term investments (held-to-maturity), long-term investments (held-to-maturity), long-term investments (rabbi trust), lines of credit, noncurrent deferred tax assets and liabilities, income taxes receivable and payable, and deferred compensation.
|
|
(3)
|
Operating working capital for this calculation is accounts receivable and inventories, offset by accounts payable-trade, accounts payable - capital expenditures, and deferred revenue.
|
94
ON ACCOUNTING AND FINANCIAL DISCLOSURE
During the three years ended April 29, 2018, there were no disagreements on any matters of accounting principles or practices or financial statement disclosures.
Evaluation of Disclosure Controls and Procedures
We have conducted an evaluation of the effectiveness of our disclosure controls and procedures as of April 29, 2018. This evaluation was conducted under the supervision and with the participation of management, including our Chief Executive Officer and Chief Financial Officer. Based upon that evaluation, we have concluded that these disclosure controls and procedures were effective, in all material respects, to ensure that information required to be disclosed in the reports filed by us and submitted under the Securities Exchange Act of 1934, as amended (the “Exchange Act”) is recorded, processed, summarized, and reported as and when required. Further we concluded that our disclosure controls and procedures have been designed to ensure that information required to be disclosed in reports filed by us under the Exchange Act is accumulated and communicated to management, including our Chief Executive Officer and Chief Financial Officer, in a manner to allow timely decisions regarding the required disclosure.
Management’s Annual Report on Internal Control over Financial Reporting
Our management is responsible for establishing and maintaining adequate internal control over financial reporting. Internal control over financial reporting is a process to provide reasonable assurance regarding the reliability of our financial reporting for external purposes in accordance with generally accepted accounting principles. Internal control over financial reporting includes: (1) maintaining records that in reasonable detail accurately and fairly reflect the transactions and disposition of assets; (2) providing reasonable assurance that the transactions are recorded as necessary for preparation of financial statements, and that receipts and expenditures are made in accordance with authorizations of management and directors; and (3) providing reasonable assurance that unauthorized acquisition, use, disposition of assets that could have a material effect on financial statements would be prevented or detected on a timely basis. Because of its inherent limitations, internal control over financial reporting is not intended to provide absolute assurance that a misstatement of financial statements would be prevented or detected. Also, projections of any evaluation of effectiveness to future periods are subject to the risk that controls may become inadequate because of changes in conditions, or that the degree of compliance with the policies or procedures may deteriorate.
Management assessed the effectiveness of our internal control over financial reporting based on the criteria set forth by the Committee of Sponsoring Organizations of the Treadway Commission in the 2013 Internal Control – Integrated Framework. Based on this assessment, management concluded that our internal control over financial reporting was effective at April 29, 2018.
Grant Thornton LLP, an independent registered public accounting firm, has audited the consolidated financial statements as of and for the years ended April 29, 2018, April 30, 2017 and May 1, 2016 and has audited the company’s effectiveness of internal controls over financial reporting as of April 29, 2018, as stated in their report, which is included in Item 8 hereof.
During the quarter ended April 29, 2018, there were no changes in our internal control over financial reporting that have materially affected, or are reasonably likely to materially affect, our internal control over financial reporting.
95
REPORT OF INDEPENDENT REGISTERED PUBLIC ACCOUNTING FIRM
Board of Directors and Shareholders
Culp, Inc.:
We have audited the internal control over financial reporting of Culp, Inc. (a North Carolina corporation) and Subsidiaries (the “Company”) as of April 29, 2018, based on criteria established in the 2013 Internal Control—Integrated Framework issued by the Committee of Sponsoring Organizations of the Treadway Commission (“COSO”). In our opinion, the Company maintained, in all material respects, effective internal control over financial reporting as of April 29, 2018, based on criteria established in the 2013 Internal Control—Integrated Framework issued by COSO.
We also have audited, in accordance with the standards of the Public Company Accounting Oversight Board (United States) (“PCAOB”), the consolidated financial statements of the Company as of and for the year ended April 29, 2018, and our report dated July 13, 2018 expressed “an unqualified opinion” on those financial statements.
Basis for opinion
The Company’s management is responsible for maintaining effective internal control over financial reporting and for its assessment of the effectiveness of internal control over financial reporting, included in the accompanying on internal control over financial reporting. Our responsibility is to express an opinion on the Company’s internal control over financial reporting based on our audit. We are a public accounting firm registered with the PCAOB and are required to be independent with respect to the Company in accordance with the U.S. federal securities laws and the applicable rules and regulations of the Securities and Exchange Commission and the PCAOB.
We conducted our audit in accordance with the standards of the PCAOB. Those standards require that we plan and perform the audit to obtain reasonable assurance about whether effective internal control over financial reporting was maintained in all material respects. Our audit included obtaining an understanding of internal control over financial reporting, assessing the risk that a material weakness exists, testing and evaluating the design and operating effectiveness of internal control based on the assessed risk, and performing such other procedures as we considered necessary in the circumstances. We believe that our audit provides a reasonable basis for our opinion.
Definition and limitations of internal control over financial reporting
A company’s internal control over financial reporting is a process designed to provide reasonable assurance regarding the reliability of financial reporting and the preparation of financial statements for external purposes in accordance with generally accepted accounting principles. A company’s internal control over financial reporting includes those policies and procedures that (1) pertain to the maintenance of records that, in reasonable detail, accurately and fairly reflect the transactions and dispositions of the assets of the company; (2) provide reasonable assurance that transactions are recorded as necessary to permit preparation of financial statements in accordance with generally accepted accounting principles, and that receipts and expenditures of the company are being made only in accordance with authorizations of management and directors of the company; and (3) provide reasonable assurance regarding prevention or timely detection of unauthorized acquisition, use, or disposition of the company’s assets that could have a material effect on the financial statements.
Because of its inherent limitations, internal control over financial reporting may not prevent or detect misstatements. Also, projections of any evaluation of effectiveness to future periods are subject to the risk that controls may become inadequate because of changes in conditions, or that the degree of compliance with the policies or procedures may deteriorate.
/s/ GRANT THORNTON LLP
Charlotte, North Carolina
July 13, 2018
96
None
PART III
Information with respect to executive officers and directors of the company is included in the company’s definitive Proxy Statement to be filed within 120 days after the end of the company’s fiscal year pursuant to Regulation 14A of the Securities and Exchange Commission, under the captions “Nominees, Directors and Executive Officers,” “Section 16(a) Beneficial Ownership Reporting Compliance,” “Corporate Governance – Code of Business Conduct and Ethics,” “Board Committees and Attendance – Audit Committee” which information is herein incorporated by reference.
Information with respect to executive compensation is included in the company’s definitive Proxy Statement to be filed within 120 days after the end of the company’s fiscal year pursuant to Regulation 14A of the Securities and Exchange Commission, under the captions “Executive Compensation” and “Compensation Committee Interlocks and Insider Participation” which information is herein incorporated by reference.
OWNERS AND MANAGEMENT AND RELATED STOCKHOLDER
MATTERS
Information with respect to the security ownership of certain beneficial owners and management is included in the company’s definitive Proxy Statement to be filed within 120 days after the end of the company’s fiscal year pursuant to Regulation 14A of the Securities and Exchange Commission, under the captions “Executive Compensation Plan Information” and “Voting Securities,” which information is herein incorporated by reference.
97
The following table sets forth information as of the end of fiscal 2018 regarding shares of our common stock that may be issued upon the exercise of equity awards previously granted and currently outstanding equity awards under the company’s equity incentive and stock option plans, as well as the number of shares available for the grant of equity awards that had not been granted as of that date.
EQUITY COMPENSATION PLAN INFORMATION
|
Plan Category
|
Number of securities to be issued upon exercise of outstanding options, warrants and rights
|
Weighted-average exercise price of outstanding options, warrants and rights
|
Number of securities remaining available for future issuance under equity compensation plan (excluding securities reflected in column (a))
|
||||||
|
(a)
|
(b)
|
(c)
|
|||||||
|
Equity compensation plans approved by security holders
|
-
|
$-
|
978,908
|
||||||
|
Equity compensation plans not approved by security holders
|
-
|
-
|
-
|
||||||
|
Total
|
-
|
$-
|
978,908
|
Information with respect to certain relationships and related transactions is included in the company’s definitive Proxy Statement to be filed within 120 days after the end of the company’s fiscal year pursuant to Regulation 14A of the Securities and Exchange Commission, under the captions “Corporate Governance – Director Independence” and “Certain Relationships and Related Transactions” which information is herein incorporated by reference.
Information with respect to accountants fees and services is included in the company’s definitive Proxy Statement to be filed within 120 days after the end of the company’s fiscal year pursuant to Regulation 14A of the Securities and Exchange Commission, under the caption “Fees Paid to Independent Registered Public Accounting Firm” which information is herein incorporated by reference.
98
PART IV
1.
Consolidated Financial Statements
The following consolidated financial statements of Culp, Inc. and its subsidiaries are filed as part of this report.
|
Page of Annual
|
|
|
Report on
|
|
|
Item
|
Form 10-K
|
|
Report of Independent Registered Public Accounting Firm
|
54 |
| Consolidated Balance Sheets – | |
|
April 29, 2018 and April 30, 2017
|
55 |
| Consolidated Statements of Net Income - | |
|
for the years ended April 29, 2018, April 30, 2017 and May 1, 2016
|
56 |
|
Consolidated Statements of Comprehensive Income -
|
|
|
for the years ended April 29, 2018,
|
|
|
April 30, 2017 and May 1, 2016
|
57 |
|
Consolidated Statements of Shareholders’ Equity -
|
|
|
for the years ended April 29, 2018,
|
|
|
April 30, 2017 and May 1, 2016
|
58 |
|
Consolidated Statements of Cash Flows -
|
|
|
for the years ended April 29, 2018,
|
|
|
April 30, 2017 and May 1, 2016
|
59 |
|
Notes to Consolidated Financial Statements
|
60 |
2.
Financial Statement Schedules
All financial statement schedules are omitted because they are not applicable, or not required, or because the required information is included in the consolidated financial statements or notes thereto.
3.
Exhibits
The following exhibits are attached at the end of this report, or incorporated by reference herein. Management contracts, compensatory plans, and arrangements are marked with an asterisk (*).
| 3(i) | ||
| 3(ii) |
99
| 10.9 | ||
| 10.10 | ||
| 10.11 | ||
| 10.12 | ||
| 10.13 | ||
100
|
101.INS
|
XBRL Instance Document
|
|
|
101.SCH
|
XBRL Taxonomy Extension Schema Document
|
|
|
101.CAL
|
XBRL Taxonomy Extension Calculation Linkbase Document
|
|
|
101.DEF
|
XBRL Taxonomy Extension Definition Linkbase Document
|
|
|
101.LAB
|
XBRL Taxonomy Extension Label Linkbase Document
|
|
|
101.PRE
|
XBRL Taxonomy Extension Presentation Linkbase Document
|
The exhibits to this Form 10-K are filed at the end of this Form 10-K immediately preceded by an index. A list of the exhibits begins on page 103 under the subheading “Exhibit Index.”
None
None
101
Pursuant to the requirements of Section 13 of the Securities Exchange Act of 1934, CULP, INC. has caused this report to be signed on its behalf by the undersigned, thereunto duly authorized, on the 13
th
day of July 2018.
|
CULP, INC.
|
||
| By: /s/ |
Franklin N. Saxon
|
|
|
Franklin N. Saxon
|
||
|
Chief Executive Officer
|
||
|
(principal executive officer)
|
||
Pursuant to the requirements of the Securities Exchange Act of 1934, this report has been signed below by the following persons on behalf of the registrant and in the capacities indicated on the 13
th
day of July 2018.
|
/s/
|
Robert G. Culp, III
|
/s/
|
Kenneth R. Larson
*
|
|
Robert G. Culp, III
|
Kenneth R. Larson
|
||
|
(Chairman of the Board of Directors)
|
(Director)
|
||
|
/s/
|
Franklin N. Saxon
|
/s/
|
Fred A. Jackson
|
|
Franklin N. Saxon
|
Fred A. Jackson
|
||
|
Chief Executive Officer
|
(Director)
|
||
|
(principal executive officer)
|
|||
|
(Director)
|
|||
|
/s/
|
Patrick B. Flavin*
|
/s/
|
Kenneth R. Bowling
|
|
Patrick B. Flavin
|
Kenneth R. Bowling
|
||
|
(Director)
|
Chief Financial Officer
|
||
|
(principal financial officer)
|
|||
|
/s/
|
Kenneth W. McAllister
*
|
/s/
|
Thomas B. Gallagher, Jr.
|
|
Kenneth W. McAllister
|
Thomas B. Gallagher, Jr.
|
||
|
(Director)
|
Corporate Controller
|
| * |
By Kenneth R. Bowling, Attorney-in-Fact, pursuant to Powers of Attorney filed with the Securities and Exchange Commission.
|
102
| Exhibit Number |
Exhibit
|
|
|
101.INS
|
XBRL Instance Document
|
|
|
101.SCH
|
XBRL Taxonomy Extension Schema Document
|
|
|
101.CAL
|
XBRL Taxonomy Extension Calculation Linkbase Document
|
|
|
101.DEF
|
XBRL Taxonomy Extension Definition Linkbase Document
|
|
|
101.LAB
|
XBRL Taxonomy Extension Label Linkbase Document
|
|
|
101.PRE
|
XBRL Taxonomy Extension Presentation Linkbase Document
|
|
103
TABLE OF CONTENTS
Part 1Item 1. BusinessItem 1A. Risk FactorsItem 1B. Unresolved Staff CommentsItem 2. PropertiesItem 3. Legal ProceedingsItem 4. Mine Safety DisclosurePart IIItem 5. Market For The Registrant S Common Equity, Related Stockholder Matters,Item 6. Selected Financial DataItem 7. Management S Discussion and Analysis Of Financial Condition and Results Of OperationsItem 7A. Quantitative and Qualitative DisclosuresItem 8. Consolidated Financial StatementsItem 9. Changes in and Disagreements with AccountantsItem 9A. Controls and ProceduresItem 9B. Other InformationPart IIIItem 10. Directors, Executive Officers, and Corporate GovernanceItem 11. Executive CompensationItem 12. Security Ownership Of Certain BeneficialItem 13. Certain Relationships and Related Transactions, and Director IndependenceItem 14. Principal Accountant Fees and ServicesPart IVItem 15. Exhibits and Financial Statement SchedulesItem Form 10-kItem 16. Form 10-k Summary