COMMERCIAL VEHICLE GROUP, INC.
10-Ks and 10-Qs
|
|
|
|
|
|
|
|
|
|
|
|
|
|
|
|
|
|
|
|
|
|
|
|
|
|
|
|
|
|
|
|
|
|
|
|
|
|
|
|
|
|
|
|
|
|
|
|
|
|
|
|
|
|
|
|
UNITED STATES SECURITIES AND EXCHANGE COMMISSION
Washington, D.C. 20549
Form 10-K
|
þ
|
Annual Report Pursuant to Section 13 or 15(d) of the Securities Exchange Act of 1934
|
or
|
¨
|
Transition report Pursuant to Section 13 or 15(d) of the Securities Exchange Act of 1934
|
|
For the fiscal year ended December 31, 2018
|
|
Commission file number:
001-34365
|
COMMERCIAL VEHICLE GROUP, INC.
(Exact name of Registrant as specified in its charter)
|
Delaware
|
|
41-1990662
|
|
(State of Incorporation)
|
|
(I.R.S. Employer Identification No.)
|
|
7800 Walton Parkway
|
|
43054
|
|
New Albany, Ohio
|
|
(Zip Code)
|
|
(Address of Principal Executive Offices)
|
|
|
Registrant’s telephone number, including area code:
(614) 289-5360
Securities registered pursuant to Section 12(b) of the Act:
|
Title of Each Class
|
|
Name of exchange on which registered
|
|
Common Stock, par value $.01 per share
|
|
The NASDAQ Global Select Market
|
Securities registered pursuant to Section 12(g) of the Act:
None
Indicate by check mark if the registrant is a well-known seasoned issuer, as defined in Rule 405 of the Securities Act. Yes
¨
No
þ
Indicate by check mark if the registrant is not required to file reports pursuant to Section 13 or Schedule 15(d) of the Act. Yes
¨
No
þ
Indicate by check mark whether the Registrant (1) has filed all reports required to be filed by Section 13 or 15(d) of the Securities Exchange Act of 1934 during the preceding 12 months (or for such shorter period that the registrant was required to file such reports), and (2) has been subject to such filing requirements for the past 90 days. Yes
þ
No
¨
Indicate by check mark whether the registrant has submitted electronically and posted on its corporate Website, if any, every Interactive Data File required to be submitted and posted pursuant to Rule 405 of Regulation S-T during the preceding 12 months (or for such shorter period that the registrant was required to submit and post such files). Yes
þ
No
¨
Indicate by check mark if disclosure of delinquent filers pursuant to Item 405 of Regulation S-K is not contained herein, and will not be contained, to the best of Registrant’s knowledge, in definitive proxy or information statements incorporated by reference in Part III of this Form 10-K or any amendment to this Form 10-K.
¨
Indicate by check mark whether the registrant is a large accelerated filer, an accelerated filer, a non-accelerated filer, or a smaller reporting company. See the definitions of “large accelerated filer,” “accelerated filer,” and “smaller reporting company” in Rule 12b-2 of the Exchange Act. (Check one):
Large accelerated filer
¨
Accelerated filer
þ
Non-accelerated filer
¨
Smaller reporting company
¨
If an emerging growth company, indicate by check mark if the registrant has elected not to use the extended transition period for complying with any new or revised financial accounting standards provided pursuant to Section 13(a) of the Exchange Act.
¨
Indicate by check mark whether the registrant is a shell company (as defined in Rule 12b-2 of the Exchange Act). Yes
¨
No
þ
The aggregate market value of the voting and non-voting common equity held by non-affiliates computed by reference to the price at which the common equity was last sold on
June 30, 2018
, was
$218,398,015
.
As of
March 11, 2019
,
31,273,393
shares of Common Stock of the Registrant were outstanding.
Documents Incorporated by Reference
Information required by Items 10, 11, 12, 13 and 14 of Part III of this Annual Report on Form 10-K is incorporated by reference from the Registrant’s Proxy Statement for its annual meeting to be held May 16, 2019 (the “
2019
Proxy Statement”).
COMMERCIAL VEHICLE GROUP, INC.
Annual Report on Form 10-K
Table of Contents
|
|
|
Page
|
|
PART I
|
||
|
Item 1.
|
||
|
Item 1A.
|
||
|
Item 1B.
|
||
|
Item 2.
|
||
|
Item 3.
|
||
|
Item 4.
|
||
|
PART II
|
||
|
Item 5.
|
||
|
Item 6.
|
||
|
Item 7.
|
||
|
Item 7A.
|
||
|
Item 8.
|
||
|
Item 9.
|
||
|
Item 9A.
|
||
|
Item 9B.
|
||
|
PART III
|
||
|
Item 10.
|
||
|
Item 11.
|
||
|
Item 12.
|
||
|
Item 13.
|
||
|
Item 14.
|
||
|
PART IV
|
||
|
Item 15.
|
||
i
CERTAIN DEFINITIONS
All references in this Annual Report on Form 10-K to the “Company”, “Commercial Vehicle Group”, “CVG”, “we”,“us”, and “our” refer to Commercial Vehicle Group, Inc. and its consolidated subsidiaries (unless the context otherwise requires).
FORWARD-LOOKING INFORMATION
This Annual Report on Form 10-K contains forward-looking statements within the meaning of Section 21E of the Securities Exchange Act of 1934, as amended, and Section 27A of the Securities Act of 1933, as amended. For this purpose, any statements contained herein that are not statements of historical fact, including without limitation, certain statements under “Item 1 - Business” and “Item 7 - Management’s Discussion and Analysis of Financial Condition and Results of Operations” and located elsewhere herein regarding industry outlook, financial covenant compliance, anticipated effects of acquisitions, production of new products, plans for capital expenditures and our results of operations or financial position and liquidity, may be deemed to be forward-looking statements. Without limiting the foregoing, the words “believe”, “anticipate”, “plan”, “expect”, “intend”, “will”, “should”, “could”, “would”, “project”, “continue”, “likely”, and similar expressions, as they relate to us, are intended to identify forward-looking statements. The important factors discussed in “Item 1A - Risk Factors”, among others, could cause actual results to differ materially from those indicated by forward-looking statements made herein and presented elsewhere by management from time to time. Such forward-looking statements represent management’s current expectations and are inherently uncertain. Investors are warned that actual results may differ from management’s expectations. Additionally, various economic and competitive factors could cause actual results to differ materially from those discussed in such forward-looking statements, including, but not limited to, factors which are outside our control, such as risks relating to (i) general economic or business conditions affecting the markets in which the Company serves; (ii) the Company's ability to develop or successfully introduce new products; (iii) risks associated with conducting business in foreign countries and currencies; (iv) increased competition in the medium- and heavy-duty truck markets, construction, agriculture, aftermarket, military, bus and other markets; (v) the Company’s failure to complete or successfully integrate strategic acquisitions; (vi) the Company’s ability to recognize synergies from the reorganization of the segments; (vii) the Company’s failure to successfully manage any divestitures; (viii) the impact of changes in governmental regulations on the Company's customers or on its business; (ix) the loss of business from a major customer, a collection of smaller customers or the discontinuation of particular commercial vehicle platforms; (x) the Company’s ability to obtain future financing due to changes in the lending markets or its financial position; (xi) the Company’s ability to comply with the financial covenants in its debt facilities; (xii) fluctuation in interest rates relating to the Company’s debt facilities; (xiii) the Company’s ability to realize the benefits of its cost reduction and strategic initiatives; (xiv) a material weakness in our internal control over financial reporting which could, if not remediated, result in material misstatements in our financial statements; (xv) volatility and cyclicality in the commercial vehicle market adversely affecting us; (xvi) the geographic profile of our taxable income and changes in valuation of our deferred tax assets and liabilities impacting our effective tax rate; (xvii) changes to domestic manufacturing initiatives; and (xviii) implementation of tax or other changes, by the United States or other international jurisdictions, related to products manufactured in one or more jurisdictions where the Company does business. Any forward-looking statement that we make in this report speaks only as of the date of such statement, and we undertake no obligation to update any forward-looking statement or to publicly announce the results of any revision to any of those statements to reflect future events or developments. Comparisons of results for current and any prior periods are not intended to express any future trends or indications of future performance, unless specifically expressed as such, and should only be viewed as historical data.
ii
PART I
|
Item 1.
|
Business
|
C
OMPANY
O
VERVIEW
Commercial Vehicle Group, Inc. (through its subsidiaries) is a leading supplier of electrical wire harnesses, seating systems, and a full range of other cab related products for the global commercial vehicle markets, including the medium- and heavy-duty truck, medium-and heavy-construction vehicle, military, bus, agriculture, specialty transportation, mining, industrial equipment and off-road recreational markets.
We have manufacturing operations in the United States, Mexico, China, United Kingdom, Czech Republic, Ukraine, Thailand, India and Australia. Our products are primarily sold in North America, Europe, and the Asia-Pacific region.
In February 2019, the Company announced a strategic reorganization of its operations into two reportable segments, Electrical Systems Segment and Global Seating Segment. The Electrical Systems Segment, includes electrical wire harnesses and panel assemblies, trim systems and components ("Trim"), cab structures and sleeper boxes, mirrors, wipers and controls. The Global Seating Segment, includes seats and seating systems ("Seats"), office seating, and aftermarket seats and components. This reorganization will allow the Company to better focus its business along product lines, as opposed to end markets, which the Company believes will enhance the effectiveness of seeking out growth opportunities and shareholder value. With respect to the Electrical Systems segment, we believe there may be opportunities to realize certain synergies amongst the products in this segment, especially with respect to electrical wire harnesses and panel assemblies, trim systems and components, and mirrors, wipers, and controls. With respect to the Seating Segment, we believe combining the seating operations would provide us opportunities to leverage resources and best practices in engineering, product development, and manufacturing, while eliminating redundancies and providing a global, more scalable platform for effective and efficient operations.
We are differentiated from automotive industry suppliers by our ability to manufacture low volume, customized products on a sequenced basis to meet the requirements of our customers. We believe our products are used by a majority of the North America MD/HD Truck and many medium- and heavy-duty construction vehicle original equipment manufacturers (“OEMs”), and to a lesser extent other makers of industrial equipment.
Our Long-term Strategy
Refer to Item 7, Management's Discussion and Analysis of Financial Condition and Results of Operations.
S
EGMENTS
In the quarter ended December 31, 2018, we completed a strategic reorganization of our operations into two business segments, Electrical Systems and Global Seating. The reorganization will allow the Company to better focus its business along product lines, as opposed to end markets, which the company believes will enhance the effectiveness of seeking out growth opportunities and enhancing shareholder value. As a result of the strategic reorganization, we restated prior period segment information to conform to the current period segment presentation. See Note 10 of the Consolidated Financial Statements for more information.
Operating segments are defined as components of an enterprise that are evaluated regularly by the Company’s chief operating decision maker (“CODM”), which is our President and Chief Executive Officer. Each of these segments consists of a number of manufacturing facilities. Certain of our facilities manufacture and sell products through both of our segments. Each manufacturing facility that sells products through both segments is reflected in the financial results of the segment that has the greatest amount of revenues from that manufacturing facility. Our segments are more specifically described below.
The Electrical Systems Segment manufactures and sells the following products:
|
•
|
Wire harness assemblies primarily for construction, agricultural, industrial, automotive, truck, mining and military industries in North America, Europe and Asia-Pacific;
|
|
•
|
Trim primarily for the North America MD/HD Truck market;
|
|
•
|
Mirrors, wipers and controls primarily for the truck, bus, agriculture, construction, rail and military markets in North America and Europe;
|
|
•
|
Cab structures for the North American MD/HD Truck market; and
|
|
•
|
Aftermarket components in North America.
|
The Global Seating Segment manufactures and sells Seats as follows:
1
|
•
|
Seats primarily to the MD/HD Truck, construction, agriculture and mining markets in North America, Asia-Pacific and Europe;
|
|
•
|
Office seating in Europe and Asia-Pacific; and
|
|
•
|
Aftermarket seats and components in North America, Europe and Asia-Pacific.
|
See Note 10 of the Consolidated Financial Statements under Item 8
Financial Statements and Supplementary Data
for financial information presented by segment for each of the three years ended
December 31, 2018
,
2017
and
2016
, including information on sales and long-lived assets by geographic area.
E
LECTRICAL
S
YSTEMS
S
EGMENT
O
VERVIEW
Electrical Systems Segment Products
Set forth below is a description of our products manufactured in the Electrical Systems Segment and their applications.
Electrical Wire Harnesses and Panel Assemblies
. We produce a wide range of electrical wire harnesses and electrical distribution systems, and related assemblies primarily for construction, agriculture, industrial, automotive, truck, mining and military industries. Our principal products in this category include:
Electrical Wire Harnesses.
We offer a broad range of electrical wire harness assemblies that function as the primary electric current carrying devices used to provide electrical interconnections for gauges, lights, control functions, power circuits, powertrain and transmission sensors, emissions systems and other electronic applications on commercial and other vehicles. Our wire harnesses are customized to fit specific end-user requirements, and can be complex.
Panel Assemblies.
We assemble integrated components such as panel assemblies and cabinets that are installed in a vehicle or unit of equipment and may be integrated with our wire harness assemblies. These components provide the user control over multiple operational functions and features.
Trim Systems and Components
.
We design, engineer and produce Trim primarily for MD/HD Truck, and recreational and specialty vehicle applications. Our Trim products are used mostly for the interior of cabs and are designed to provide a comfortable and durable interior along with a variety of functional and safety features for the vehicle occupant. Our principal products in the Trim category include:
Trim Products.
Our trim products include door panels and other interior trim panels. Specific components include vinyl or cloth-covered appliqués ranging from a traditional cut and sew approach to a contemporary molded styling theme, armrests, map pocket compartments, and sound-reducing insulation.
Instrument Panels.
We produce and assemble instrument panels that can be integrated with the rest of the interior trim. The instrument panel is a complex system of coverings and foam, plastic and metal parts designed to house various components and act as a safety device for the vehicle occupant.
Headliners/Wall Panels.
Headliners and wall panels consist of a substrate and a finished interior layer made of fabrics and other materials. While headliners and wall panels are an important contributor to interior aesthetics, they also provide insulation from road noise and can serve as carriers for a variety of other components, such as visors, overhead consoles, grab handles, coat hooks, electrical wiring, speakers, lighting and other electronic and electrical products.
Storage Systems
. Our modular storage units and custom cabinetry are designed to improve comfort and optimize space for the operator. These storage systems are designed to be integrated with the interior trim.
Floor Covering Systems.
We have an extensive and comprehensive portfolio of floor covering systems and dash insulators. Carpet flooring systems generally consist of tufted or non-woven carpet with a thermoplastic backcoating. Non-carpeted flooring systems, used primarily in commercial and fleet vehicles, offer improved wear and maintenance characteristics.
Sleeper Bunks.
We offer a wide array of design choices for upper and lower sleeper bunks for heavy-duty trucks. All parts of our sleeper bunks can be integrated to match the rest of the interior trim.
Grab Handles and Armrests
. Our grab handles and armrests are designed and engineered with specific attention to aesthetics, ergonomics and strength.
Privacy Curtains
. We produce privacy curtains for use in sleeper cabs.
2
Plastics Decorating and Finishing
. We offer customers a wide variety of cost-effective finishes in paint, ultra violet, hard coating and customized industrial hydrographic films (simulated appearance of wood grain, carbon fiber, brushed metal, marbles, camouflage and custom patterns), paints and other interior and exterior finishes.
Cab Structures and Sleeper Boxes
.
We design, engineer and produce complete cab structures and sleeper boxes MD/HD Trucks. Our principal products in this category include:
Cab Structures.
We design, manufacture and assemble complete cab structures. Our cab structures, which are manufactured from both steel and aluminum, are delivered fully assembled and primed for paint.
Sleeper Boxes.
We design, manufacture and assemble sleeper boxes that can be part of the overall cab structure or standalone assemblies depending on the customer application.
Mirrors, Wipers and Controls.
We design, engineer and produce a variety of mirrors, wipers and controls used in commercial, military and specialty recreational vehicles. Our principal products in this category include:
Mirrors
. We offer a range of round, rectangular, motorized and heated mirrors and related hardware, including brackets, braces and side bars. We have introduced both road and outside temperature devices that can be mounted on the cab, integrated into the mirror face and the vehicle’s dashboard through our RoadWatch
™
family of products.
Wiper Systems.
We offer application-specific windshield wiper systems and individual windshield wiper components.
Controls
. We offer a range of controls and control systems for window lifts, door locks and electric switch products.
Electrical Systems Segment’s Customers
The following is a summary of the Electrical Systems Segment’s significant revenues (figures are shown as a percentage of total Electrical Systems Segment revenue) by end market for each of the three years ended
December 31:
|
2018
|
2017
|
2016
|
|||
|
Truck
|
49%
|
44%
|
44%
|
||
|
Construction
|
19
|
20
|
16
|
||
|
Aftermarket and OE Service
|
11
|
10
|
11
|
||
|
Automotive
|
9
|
10
|
10
|
||
|
Military
|
4
|
4
|
3
|
||
|
Agriculture
|
2
|
3
|
3
|
||
|
Other
|
6
|
9
|
13
|
||
|
Total
|
100%
|
100%
|
100%
|
||
We believe we are a successful long-term supplier because of our comprehensive product offerings and product innovation services. Our principal customers include A.B. Volvo, Daimler, John Deere, PACCAR, and Caterpillar, constituting a combined total of 70%, 67% and 64% of Electrical Systems Segment revenue for the years ended
December 31, 2018
,
2017
and
2016
, respectively.
Our European and Asia-Pacific operations collectively contributed approximately 13%, 13% and 11% of our revenues for the years ended
December 31, 2018
,
2017
and
2016
, respectively.
G
LOBAL
S
EATING
S
EGMENT
O
VERVIEW
Global Seating Segment Products
Set forth below is a brief description of our products manufactured in the Global Seating Segment and their applications.
Seats and Seating Systems
.
We design, engineer and produce Seats for MD/HD Truck, bus, construction, agriculture and military markets. For the most part, our Seats are fully-assembled and ready for installation when they are delivered to the OEM. We offer a wide range of seats that include mechanical and air suspension seats, static seats, bus seats and military seats. As a result of our product design and product technology, we believe we are a leader in designing seats with convenience and safety features. Our Seats are designed to achieve a high level of operator comfort by adding a wide range of manual and power features such as lumbar support, cushion and back bolsters, and leg and thigh support. Our Seats are built to meet customer requirements in low volumes and produced in numerous feature combinations to form a full-range product line with a wide level of price points. We also manufacture seats, and parts and components for the aftermarket.
3
Office Seating.
We design, engineer and produce office seating products. Our office seating was developed as a result of our experience supplying seats for commercial vehicles and is fully adjustable to achieve a high comfort level. Our office seating is designed to suit different office environments including heavy usage environments, such as emergency services, call centers, reception areas, studios and general office environments.
Global Seating Segment Customers
The following is a summary of the Global Seating Segment’s significant revenues (figures are shown as a percentage of total Global Seating Segment revenue) by end market for each of the three years ended
December 31:
|
2018
|
2017
|
2016
|
|||
|
Medium- and Heavy-duty Truck OEMs
|
43%
|
39%
|
39%
|
||
|
Construction OEMs
|
24
|
25
|
23
|
||
|
Aftermarket and OE Service
|
21
|
24
|
26
|
||
|
Bus OEMs
|
8
|
9
|
10
|
||
|
Other
|
4
|
3
|
2
|
||
|
Total
|
100%
|
100%
|
100%
|
||
We believe we are a successful long-term supplier because of our comprehensive product offerings, leading brand names and product innovation. Our principal customers include Daimler, A.B. Volvo, Navistar, PACCAR and Caterpillar, constituting a combined total of 59%, 57% and 57% of Global Seating Segment revenue for the years ended
December 31, 2018
,
2017
and
2016
, respectively.
Our European and Asia-Pacific operations collectively contributed approximately 43%, 45% and 45% of the Global Seating Segment’s revenues for the years ended
December 31, 2018
,
2017
and
2016
, respectively.
O
UR
C
ONSOLIDATED
O
PERATIONS
Industries Served
Commercial Vehicle Market.
Commercial vehicles are used in a wide variety of end markets, including local and long-haul commercial trucking, bus, construction, mining, agricultural, military, industrial, municipal, off-road recreation and specialty vehicle markets. The commercial vehicle supply industry can generally be separated into two categories: (1) sales to OEMs, in which products are sold in relatively large quantities directly for use by OEMs in new commercial and construction vehicles; and (2) aftermarket sales, in which products are sold as replacements to a wide range of original equipment service organizations, wholesalers, retailers and installers. In the OEM market, suppliers are generally divided into tiers - “Tier 1” suppliers that provide products directly to OEMs, and “Tier 2” and “Tier 3” suppliers that sell products principally to other suppliers for integration into those suppliers’ own product offerings. We are generally a Tier I supplier.
The commercial vehicle supplier industry is fragmented and comprised of several large companies and many smaller companies. In addition, the commercial vehicle supplier industry is characterized by relatively low production volumes and can have considerable barriers to entry, including the following: (1) specific technical and manufacturing requirements, (2) high transition costs to shift production to new suppliers, (3) just-in-time delivery requirements and (4) strong brand name recognition.
Although OEM demand for our products is directly correlated with new vehicle production, suppliers like us can grow by increasing sales by further penetrating existing customers’ businesses, gaining new customers, expanding into new geographic markets, developing new content in our products to meet changing customer needs and by increasing aftermarket sales. We believe that companies with a global presence, advanced technology, engineering and manufacturing and support capabilities, such as our company, are well positioned to take advantage of these opportunities.
North American Commercial Truck Market.
Purchasers of commercial trucks include fleet operators, owner operators, governmental agencies and industrial end users. Commercial vehicles used for local and long-haul commercial trucking are generally classified by gross vehicle weight. Class 8 vehicles are trucks with gross vehicle weight in excess of 33,000 lbs. and Classes 5 through 7 vehicles are trucks with gross vehicle weight from 16,001 lbs. to 33,000 lbs. The following table shows production levels (in thousands of units) of commercial vehicles used for local and long-haul commercial trucking from 2014 through 2018 in North America:
4
|
2014
|
2015
|
2016
|
2017
|
2018
|
|||||
|
Class 8 trucks
|
297
|
323
|
228
|
256
|
324
|
||||
|
Class 5-7 trucks
|
226
|
237
|
233
|
249
|
272
|
||||
Source:
ACT N.A.
(February 2019)
.
The following describes the major markets within the commercial vehicle market in which the Global Seating Segment competes:
Class 8 Truck Market.
The global Class 8 ("Class 8" or "heavy-duty") truck manufacturing market is concentrated in three primary regions: North America, Europe and Asia-Pacific. The global Class 8 truck market is localized in nature due to the following factors: (1) the prohibitive costs of shipping components from one region to another, (2) the high degree of customization to meet the region-specific demands of end-users, and (3) the ability to meet just-in-time delivery requirements. According to ACT Research four companies represented approximately 98% of the market share for North American Class 8 truck production in 2018. The percentages of North American heavy-duty production represented by Daimler, PACCAR, A.B. Volvo, and Navistar were approximately 37%, 30%, 17%, and 14%, respectively, in 2018. We supply products to all of these OEMs.
New Class 8 truck demand is cyclical and is particularly sensitive to economic factors that generate a significant portion of the freight tonnage hauled by commercial vehicles.
The following table illustrates North American Class 8 truck build for the years 2016 to 2023:
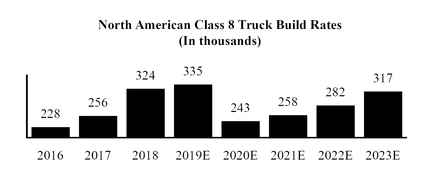
“E” — Estimated
Source:
ACT
(February 2019).
We believe the following factors are primarily responsible for driving the North American Class 8 truck market:
Economic Conditions.
The North American truck industry is influenced by overall economic conditions and consumer spending. Since heavy-duty truck OEMs supply the fleet operators, their production levels generally reflect the demand for freight and the fleet operators' purchase of new vehicles.
Truck Replacement Cycle and Fleet Aging.
The average age of the U.S. Class 8 truck population is approximately 11.2 years in
2018
. The average fleet age tends to run in cycles as freight companies permit their truck fleets to age during periods of lagging demand and then replenish those fleets during periods of increasing demand. As truck fleets age, maintenance costs typically increase. Freight companies evaluate the economics between repair and replacement as well as the potential to utilize more cost-effective technology in vehicles. The chart below illustrates the approximate average age of the U.S. Class 8 truck population:
5
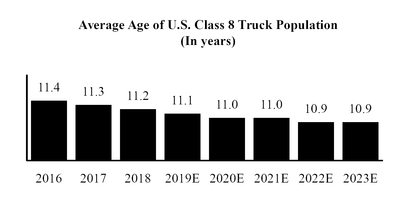
“E” — Estimated
Source:
ACT
(February 2019).
Class 5-7 Truck Market.
North American Class 5-7 ("Class 5-7" or "medium-duty") includes recreational vehicles, buses and medium-duty trucks. We primarily participate in the Class 6 and 7 medium-duty truck market. The medium-duty truck market is influenced by overall economic conditions but has historically been less cyclical than the North American Class 8 truck market, with highs and lows generally not as pronounced as the Class 8 truck market. As the North American truck fleet companies move to a distribution center model, requiring less long-haul freight vehicles, the demand for medium-duty trucks may increase.
The following table illustrates the North American Class 5-7 truck build for the years 2016 through 2023:
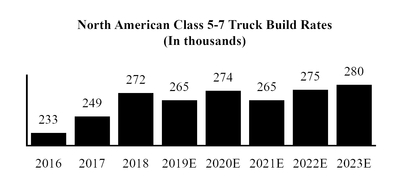
“E” — Estimated
Source:
ACT
(February 2019).
Commercial Truck Aftermarket.
Demand for aftermarket products is driven by the quality of OEM parts, the number of vehicles in operation, the average age of the vehicle fleet, the content and value per vehicle, vehicle usage and the average useful life of vehicle parts. Aftermarket sales tend to be at a higher margin. The recurring nature of aftermarket revenue can be expected to provide some insulation to the overall cyclical nature of the industry as it tends to provide a more stable stream of revenues. Brand equity and the extent of a company’s distribution network also contribute to the level of aftermarket sales. We believe CVG has a widely recognized brand portfolio and participates in most retail sales channels including Original Equipment Dealer networks and independent distributors.
Commercial Construction Equipment Market.
New vehicle demand in the global construction equipment market generally follows certain economic conditions including GDP, infrastructure investment, housing starts, business investment, oil and energy investment and industrial production around the world. Within the construction market, there are two classes of construction equipment markets: the medium and heavy construction equipment market (weighing over 12 metric tons) and the light construction equipment market (weighing below 12 metric tons). Our construction equipment products are primarily used in the medium and heavy construction equipment markets. The platforms that we generally participate in include: cranes, pavers, planers and profilers, dozers, loaders, graders, haulers, tractors, excavators, backhoes, material handling and compactors. Demand in the medium and heavy construction equipment market is typically
6
related to the level of larger-scale infrastructure development projects such as highways, dams, harbors, hospitals, airports and industrial development as well as activity in the mining, forestry and other commodities industries.
Purchasers of medium and heavy construction equipment include construction companies, municipalities, local governments, rental fleet owners, quarrying and mining companies and forestry related industries. Purchasers of light construction equipment include contractors, rental fleet owners, landscapers, logistics companies and farmers. In the medium and heavy construction equipment market, we primarily supply OEMs with our wire harness and seating products.
Agricultural Equipment Market.
We market most of our products for small, medium and large agricultural equipment across a spectrum of machines including tractors, sprayers, bailers, farm telehandler equipment and harvesters. Sales and production of these vehicles can be influenced by rising or falling farm commodity prices, land values, profitability, and other factors such as increased mechanization in emerging economies and new uses for crop materials such as biofuels and other factors. In the medium to longer term, a combination of factors create the need for more productive agricultural equipment, such as: (1) population growth, (2) an evolving sophistication of dietary habits, and (3) constraints on arable land and other macroeconomic and demographic factors.
Military Equipment Market.
We supply products for heavy- and medium-payload tactical trucks that are used by various military customers. Military equipment production is particularly sensitive to political and governmental budgetary considerations.
Raw Materials and Suppliers
A description of the principal raw materials we utilize in principal product categories are:
Electrical Wire Harnesses and Panel Assemblies
.
The principal raw materials used to manufacture our electrical wire harnesses are wire and cable, connectors, terminals, switches, relays and various covering techniques involving braided yarn, braided copper, slit and non-slit conduit and molded foam. These raw materials are obtained from multiple suppliers and are generally available, although we have experienced and continue to experience a shortage of certain of these raw materials.
Trim Systems and Components
.
The principal raw materials used in our Trim are resin and chemical products, foam, vinyl and fabric which are formed and assembled into end products. These raw materials are generally readily available from multiple suppliers.
Cab Structures and Sleeper Boxes
.
The principal raw materials and components used in our cab structures and sleeper boxes are steel and aluminum. These raw materials are generally readily available and obtained from multiple suppliers.
Mirrors, Wipers and Controls
.
The principal raw materials used to manufacture our mirrors, wipers and controls are steel, stainless steel, aluminum and rubber, which are generally readily available and obtained from multiple suppliers. We also purchase sub-assembled products, such as motors, for our mirrors, wipers and controls.
Seats and Seating Systems
.
The principal raw materials used in our seats include steel, aluminum, resin-based products and foam products and are generally readily available and obtained from multiple suppliers under various supply agreements. Leather, vinyl, fabric and certain other components are also purchased from multiple suppliers.
Our Supply Agreements
Our supply agreements generally provide for fixed pricing but do not require us to purchase any specified quantities. Normally we do not carry inventories of raw materials or finished products in excess of what is reasonably required to meet production and shipping schedules, as well as service requirements. Steel, aluminum, petroleum-based products, copper, resin, foam, fabrics, wire and wire components comprise the most significant portion of our raw material costs. We typically purchase steel, copper and petroleum-based products at market prices that are fixed over varying periods of time. Due to the volatility in pricing over the last several years, we use methods such as market index pricing and competitive bidding to assist in reducing our overall cost. The recent imposition of tariffs on steel and aluminum have impacted the prices of certain of our materials. Implementation of Brexit may result in supply disruptions. We strive to align our customer pricing and material costs to minimize the impact of steel, copper and petrochemical price fluctuations. Certain component purchases and suppliers are directed by our customers, so we generally will pass through directly to the customer cost changes from these components. We generally are not dependent on a single supplier or limited group of suppliers for our raw materials.
Research and Development
7
Our research and development capabilities offer quality and technologically advanced products to our customers at competitive prices. We offer product styling, product design, specialized simulation and testing and evaluation services that are necessary in today’s global markets. Our capabilities in acoustics, thermal efficiency, benchmarking, multi-axis durability, biomechanics, comfort, prototyping and process prove-out allow us to provide complete integrated solutions to the end-user.
We engage in global engineering, and research and development activities that improve the reliability, performance and cost-effectiveness of our existing products and support the design and development and testing of new products for existing and new applications. We have test and validation engineering centers in North America, Europe and Asia. We have a global engineering support center in India to provide a cost-effective global engineering resource to our seat facilities.
We believe we are staffed with experienced engineers and have equipment and technology to support early design involvement that results in products that timely meet or exceed the customer’s design and performance requirements, and are more efficient to manufacture. Our ability to support our products and customers with extensive on site involvement enhances our position for bidding on such business. We work aggressively to ensure that our quality and delivery metrics distinguish us from our competitors.
Generally, we work with our customers’ engineering and development teams at the beginning of the design process for new components and assemblies and systems, or the re-engineering process for existing components and assemblies, in order to leverage production efficiency and quality. Our customers are continuously searching for advanced products while maintaining cost, quality and performance deliverables.
Research and development costs for the years ended
December 31, 2018
,
2017
and
2016
totaled
$9.5 million
,
$7.7 million
and
$7.0 million
, respectively.
Intellectual Property
Our principal intellectual property consists of product and process technology and a limited number of U.S. and foreign patents, trade secrets, trademarks and copyrights. Although our intellectual property is important to our business operations and in the aggregate constitutes a valuable asset, we do not believe that any single patent, trade secret, trademark or copyright, or group of patents, trade secrets, trademarks or copyrights is critical to the success of our business. Our policy is to seek statutory protection for all significant intellectual property embodied in patents, trademarks and copyrights.
Our major brands include CVG
™
, Sprague Devices
®
, Moto Mirror
®
, RoadWatch
®
, KAB Seating
™
, National Seating
™
, Bostrom Seating
®
, Stratos
™
and FinishTEK
™
. We believe that our brands are valuable but that our business is not dependent on any one brand. We own U.S. federal trademark registrations for several of our products.
Manufacturing Processes
A description of the manufacturing processes we utilize for each of our principal product categories is set forth below:
Electrical Wire Harnesses and Panel Assemblies
.
We utilize several manufacturing techniques to produce our electrical wire harnesses and panel assemblies. Our processes, manual and automated, are designed to produce a wide range of wire harnesses and panel assemblies in short time frames. Our wire harnesses and panel assemblies are electronically and hand tested.
Trim Systems and Components
.
Our Trim capabilities include injection molding, low-pressure injection molding, urethane molding and foaming processes, compression molding, heavy-gauge thermoforming and vacuum forming as well as various cutting, sewing, trimming and finishing methods.
Cab Structures and Sleeper Boxes
.
We utilize a wide range of manufacturing processes to produce our cab structures and sleeper boxes and utilize robotic and manual welding techniques in the assembly of these products. Large capacity, fully automated E-coat paint priming systems allow us to provide our customers with a paint-ready cab product. Due to their high cost, full body E-coat systems, such as ours, are rarely found outside of the manufacturing operations of the major OEMs.
Mirrors, Wipers and Controls
.
We manufacture our mirrors, wipers and controls utilizing a variety of manufacturing processes and techniques. Our mirrors, wipers and controls are primarily assembled utilizing semi-automatic work cells and are electronically tested.
Seats and Seating Systems
.
Our seats utilize a variety of manufacturing techniques whereby foam and various other components along with fabric, vinyl or leather are affixed to an underlying seat frame. We also manufacture and assemble seat frames.
8
We have a broad array of processes to enable us to meet our OEM customers’ styling and cost requirements. The vehicle cab is the most significant and appealing aspect to the operator of the vehicle. Each commercial vehicle OEM therefore has unique requirements as to feel, appearance and features.
The end markets for our products can be highly specialized and our customers frequently request modified products in low volumes within an expedited delivery timeframe. As a result, we primarily utilize flexible manufacturing cells at our production facilities. Manufacturing cells are clusters of individual manufacturing operations and work stations. This provides flexibility by allowing efficient changes to the number of operations each operator performs. When compared to the more traditional, less flexible assembly line process, cell manufacturing allows us to better maintain our product output consistent with our OEM customers’ requirements and minimize the level of inventory.
When an end-user buys a commercial vehicle, the end-user may specify the seat and other features for that vehicle. Because our Seats are unique, our manufacturing facilities have significant complexity which we manage by building in sequence. We build our Seats as orders are received, and the Seats are delivered to our customers in the sequence in which vehicles come down the assembly line. We have systems in place that allow us to provide complete customized interior kits in boxes that are delivered in sequence. Sequencing reduces our cost of production because it eliminates warehousing costs and reduces waste and obsolescence, thereby offsetting increased labor costs. Several of our manufacturing facilities are strategically located near our customers’ assembly facilities, which facilitates this process and minimizes shipping costs.
We employ just-in-time manufacturing and sourcing in our operations to meet customer requirements for faster deliveries and to minimize our need to carry significant inventory levels. We utilize material systems to manage inventory levels and, in certain locations, we have inventory delivered as often as two times per day from a nearby facility based on the previous day’s order, which reduces the need to carry excess inventory at our facilities.
Within our cyclical industries, we strive to maintain a certain portion of temporary labor to improve our ability to flex our costs and throughput as required by fluctuating customer demand. We engage our core employees to assist in making our processes efficient.
Seasonality
OEMs close their production facilities around holidays or when demand drops, reducing work days. Our cost structure, to the extent it is variable, provides us with some flexibility during these periods.
Our Customer Contracts, and Sales and Marketing
Our OEM customers generally source business to us pursuant to written contracts, purchase orders or other commitments (“Commercial Arrangements”) with terms of price, quality, technology and delivery. Awarded business generally covers the supply of all or a portion of a customer’s production and service requirements for a particular product program rather than the supply of a specific quantity of products. In general, these Commercial Arrangements provide that the customer can terminate them if we do not meet specified quality, delivery and cost requirements. Although these Commercial Arrangements may be terminated at any time by our customers (but not by us), such terminations have historically been minimal and have not had a material impact on our results of operations. Because we produce products for a broad cross section of vehicle models, we are not overly reliant on any one vehicle model.
Our Commercial Arrangements with our OEM customers may provide for an annual prospective productivity price reduction. These productivity price reductions are generally calculated on an annual basis as a percentage of the previous year’s purchases by each customer. Historically, most of these price reductions have been offset by internal cost reductions and through the assistance of our supply base, although no assurances can be given that we will be able to achieve such reductions in the future. The cost reduction is achieved through engineering changes, material cost reductions, logistics savings, reductions in packaging cost, labor efficiencies and other productivity actions.
Our sales and marketing efforts are designed to create customer awareness of our engineering, design and manufacturing capabilities. Our sales and marketing staff work closely with our design and engineering personnel to prepare the materials used for bidding on new business, as well as to provide an interface between us and our key customers. We have sales and marketing personnel located in every major region in which we operate. From time to time, we participate in industry trade shows and advertise in industry publications.
Our principal customers for our aftermarket sales include OEM dealers and independent wholesale or retail distributors. Our sales and marketing efforts are focused on supporting these two distribution channels, as well as participation in industry trade shows and direct contact with major fleets.
Competition
9
Within each of our principal product categories we compete with a variety of independent suppliers and with OEMs’ in-house operations, primarily on the basis of price, breadth of product offerings, product quality, technical expertise, development capability, product delivery and product service. A summary of our primary competitors is set forth below:
Electrical Wire Harnesses and Panel Assemblies.
We supply a wide range of electrical wire harnesses and panel assemblies used in various commercial and other vehicles. Our primary competitors for wire harnesses include large diversified suppliers such as Delphi Automotive PLC, Leoni, Nexans SA, Motherson-Sumi, St. Clair and Electrical Components International as well as many smaller companies.
Trim Systems and Components.
We believe we have a good position supplying Trim products to the North American MD/HD Truck market. We compete with a number of competitors with respect to each of our trim system products and components. Our primary competitors are ConMet, International Automotive Components, Superior, Blachford Ltd. and Grupo Antolin.
Cab Structures and Sleeper Boxes.
We are a supplier of cab structures and sleeper boxes to the North American MD/HD Truck market. Our primary competitors in this category are Magna, International Equipment Solutions (formerly Crenlo), Worthington Industries (formerly Angus Palm), McLaughlin Body Company and Defiance Metal Products.
Mirrors, Wipers and Controls.
We are a supplier of mirrors, wipers and controls to the truck, bus, agriculture, construction, rail and military markets in North America and Europe. We compete with various competitors in this category. Our principal competitors for mirrors are Hadley, Retrac, and Lang-Mekra and our principal competitors for wiper systems are Doga, Wexco, Trico and Valeo.
Seats and Seating Systems.
We believe we have a strong market position supplying Seats to the North American MD/HD Truck market. Our primary competitors in the North American commercial vehicle market include Sears Manufacturing Company, Isringhausen, Grammer AG and Seats, Inc. Our primary competitors in the European commercial vehicle market include Grammer AG and Isringhausen; and in the Asia-Pacific region include Isrihuatai and Tiancheng (in China); and Harita and Pinnacle (in India).
Competitive Strengths
Generally, the barriers to entry in our business include investment, specific engineering requirements, transition costs for OEMs to shift production to new suppliers, just-in-time delivery requirements and brand name recognition. Our competitive strengths include the following:
Market Positions and Brands.
We believe we have a strong market position supplying Seats and a good market position supplying Trim products to the North American MD/HD Truck market. Our market position in the North American MD/HD Truck market leads us to believe we have processes in place to design, manufacture and introduce products that meet customers’ expectations in that market. We also believe we are competitive as a global supplier of construction vehicle Seats. Our major product brands include CVG
™
, Sprague Devices
®
, Moto Mirror
®
, RoadWatch
®
, KAB Seating
™
, National Seating
™
, Bostrom Seating
®
, Stratos
™
and FinishTEK
™
.
Commercial Vehicle Solutions.
We manufacture a broad base of products utilized in the interior and the exterior of commercial vehicles. We believe the breadth of our product offerings provide us with a potential opportunity for further customer penetration by bundling our products to provide complete system solutions.
End-User Focused Product Innovation.
Commercial vehicle OEMs focus on interior and exterior product design features that better serve the vehicle operator and therefore seek suppliers that can provide product innovation. Accordingly, we have engineering, and research and development capabilities to assist OEMs in meeting those needs. We believe this helps us secure content on new as well as current platforms and models.
Flexible Manufacturing Capabilities.
Because commercial vehicle OEMs permit their customers to select from an extensive menu of cab options, our end users frequently request modified products in low volumes within a limited time frame. We can leverage our flexible manufacturing capabilities to provide low volume, customized products to meet styling, cost and just-in-time delivery requirements. We manufacture or assemble our products in facilities in North America, Europe and in the Asia-Pacific region.
Lean Manufacturing.
We began what we refer to as our "Operational Excellence" program, which is based on Lean Six-Sigma concepts, in 2015. The program has trained approximately 2,300 CVG employees to achievement levels ranging from yellow belt to black belt in the Lean Six-Sigma concepts. We believe the Lean or Six-Sigma projects make significant and sustainable improvement in processes, products or services leading to sizable contributions that help off-set inflation and enhance margins.
10
CVG Digital.
We began a digital transformation in 2017 as a part of a multi-year plan. As a part of this program, we have standardized our real-time production data collection and electronic display methods. We have also standardized our downtime detection and problem solving systems based on the use of electronic alerts. This type of real-time production floor monitoring and data-driven problem solving approach improves accountability, drives ownership, and enhances employee engagement leading to tangible improvement in asset utilization, labor efficiency, quality, and employee retention.
Global Capabilities.
We have sales, engineering, manufacturing and assembly capabilities in North America, Europe and the Asia-Pacific region that provide a high level of service to our customers who manufacture and sell their products on a global basis.
Relationships with Leading Customers and Major North American Fleets.
We have comprehensive product offerings, brand names and product features that enable us to be a global supplier to many of the leading MD/HD Truck, construction and specialty commercial vehicle manufacturers such as PACCAR, Caterpillar, Volvo/Mack, Navistar, Daimler Trucks, John Deere, Oshkosh Corporation, Komatsu and Škoda (part of the Volkswagen Group). In addition, we maintain relationships with the major MD/HD Truck fleets that are end-users of our products such as Schneider National, Werner, Walmart, FedEx and JB Hunt.
Management Team.
We believe that our management team has substantial knowledge of our customer needs and expertise in critical operational areas, and has a demonstrated ability to manage costs, improve processes and expand revenue through product, market, geography and customer diversification.
Backlog
Our customers may place annual blanket purchase orders that do not obligate them to purchase any specific or minimum amount of products from us until a release is issued by the customer under the blanket purchase order. Releases are typically placed 30 to 90 days prior to required delivery and may be canceled within agreed terms. We do not believe that our backlog of expected product sales covered by firm purchase orders is a meaningful indicator of future sales since orders may be rescheduled or canceled.
Employees
As of
December 31, 2018
, we had approximately 8,355 permanent employees, of whom approximately 15% were salaried and the remainder were hourly. As of
December 31, 2018
, approximately 53% of the employees in our North American operations were unionized, with the majority of union-represented personnel based in Mexico. Approximately 68% of our European, Asian and Australian operations were represented by shop steward committees.
We did not experience any material strikes, lockouts or work stoppages during 2018 and consider our relationship with our employees to be satisfactory. On an as-needed basis during peak periods we utilize contract and temporary employees. During periods of weak demand, we respond to reduced volumes through flexible scheduling, furloughs and/or reductions in force as necessary.
Environmental Matters
We are subject to foreign, federal, state and local laws and regulations governing the protection of the environment and occupational health and safety, including laws regulating air emissions, wastewater discharges, and the generation, storage, handling, use and transportation of hazardous materials; the emission and discharge of hazardous materials into the soil, ground or air; and the health and safety of our colleagues. We are also required to obtain permits from governmental authorities for certain of our operations. We are also subject to laws imposing liability for the cleanup of contaminated property. Under these laws, we could be held liable for costs and damages relating to contamination at our past or present facilities and at third-party sites to which we sent waste containing hazardous substances.
Government Regulations
New emissions regulations were approved in 2016 by US regulators impacting MD/HD Truck manufacturers. The regulations require manufacturers to cut greenhouse gas emissions by 25 percent by 2027. Other countries are implementing clean air measures to reduce air pollution. For example, China's Ministry of Environment implemented new standards applicable beginning in 2017 for Stage V vehicles, including light gasoline-powered vehicles, diesel-powered passenger vehicles and heavy diesel-powered vehicles manufactured and sold in China.
Under a California law known as Proposition 65, if the state has determined that a substance causes cancer or harms human reproduction, a warning must appear on any product sold in the state that exposes consumers to that substance. The state maintains
11
lists of these substances and periodically adds other substances to them. Certain of our products are subject to Proposition 65, which does not provide for any generally applicable quantitative threshold below which the presence of a listed substance is exempt from the warning requirement. Consequently, the detection of even a trace amount of a listed substance can subject an affected product to the requirement of a warning label. We provide warnings on our products in California.
To the extent that current or future governmental regulation has a negative impact on the demand for commercial vehicles, our business, financial condition or results of operations could be adversely affected.
A
VAILABLE
I
NFORMATION
We maintain a website on the Internet at www.cvgrp.com. We make available free of charge through our website, by way of a hyperlink to a third-party Securities Exchange Commission ("SEC") filing website, our Annual Reports on Form 10-K, quarterly reports on Form 10-Q, current reports on Form 8-K and amendments to those reports electronically filed or furnished pursuant to Section 13(a) or 15(d) of the Exchange Act of 1934. Such information is available as soon as such reports are filed with the SEC. Additionally, our Code of Ethics may be accessed within the Investor Relations section of our website. Information found on our website is not part of this Annual Report on Form 10-K or any other report filed with the SEC.
E
XECUTIVE
O
FFICERS
OF
R
EGISTRANT
The following table sets forth certain information with respect to our executive officers as of
March 11, 2019
:
|
Name
|
Age
|
Principal Position(s)
|
|
|
Patrick E. Miller
|
51
|
President, Chief Executive Officer, Director
|
|
|
C. Timothy Trenary
|
62
|
Executive Vice President and Chief Financial Officer
|
|
|
Dale M. McKillop
|
61
|
Senior Vice President and Managing Director of Trim, Wipers and Structures
|
|
The following biographies describe the business experience of our executive officers:
Patrick E. Miller
has served as President and Chief Executive Officer and Director since November 2015. Prior to being appointed President and Chief Executive Officer, Mr. Miller, was President of the Company’s Global Truck & Bus Segment. Prior to that, he served in the capacity of Senior Vice President & General Manager of Aftermarket; Senior Vice President of Global Purchasing; Vice President of Global Sales; Vice President & General Manager of North American Truck and Vice President & General Manager of Structures. Prior to joining the Company, Mr. Miller held engineering, sales, and operational leadership positions with Hayes Lemmerz International, Alcoa, Inc. and ArvinMeritor. In December 2018, Mr. Miller was appointed to the board of directors of Federal Signal Corporation. He holds a Bachelor of Science in Industrial Engineering from Purdue University and a Masters of Business Administration from the Harvard University Graduate School of Business.
C. Timothy Trenary
has served as Executive Vice President and Chief Financial Officer since October 2013. Mr. Trenary served as Executive Vice President and Chief Financial Officer of ProBuild Holdings LLC, a privately held North American supplier of building materials, from 2010 to 2013. Prior to that, Mr. Trenary served as Senior Vice President & Chief Financial Officer of EMCON Technologies Holdings Limited, a privately held global automotive parts supplier, from 2008 to 2010; and as Vice President and Chief Financial Officer of DURA Automotive Systems, Inc., a publicly held global automotive parts supplier, from 2007 to 2008. In November 2017, Mr. Trenary became an organizer and in March 2018 became a member of the board of directors of Mi Bank, a de novo community bank in organization. He holds a Bachelor of Accounting with Honors from Michigan State University and a Masters of Business Administration with Honors from the University of Detroit Mercy. Mr. Trenary is a certified public accountant with registered status in Michigan.
Dale M. McKillop
has served as Senior Vice President and Managing Director of Trim, Wipers and Structures since 2016. He has been with the Company since 2005 when he joined the Company with the acquisition of Mayflower Vehicle Systems. Mr. McKillop has held positions of increasing responsibility with the company including Managing Director - Structures and Aftermarket, Managing Director - Structures, Director of Operations Trim and Structures, and Plant Manager. Prior to joining Mayflower Vehicle Systems, Mr. McKillop held engineering positions with Pullman Standard from 1978 to 1982. Mr. McKillop holds a Bachelor of Science degree in Business Administration from Gardner Webb University.
|
Item 1A.
|
Risk Factors
|
You should carefully consider the risks described below before making an investment decision. These are not the only risks we face.
12
If any of these risks and uncertainties were to actually occur, our business, financial condition or results of operations could be materially and adversely affected. In such case, the trading price of our common stock could decline and you may lose all or part of your investment.
Risks Related to Our Business and Industry
Our results of operations could be materially and adversely affected by downturns in the U.S. and global economy which are naturally accompanied by related declines in freight tonnage hauled and in infrastructure development and other construction projects.
Our results of operations are directly impacted by changes in the U.S. and global economic conditions which are accompanied by related declines in freight tonnage hauled and in infrastructure development and other construction projects because, among other things:
|
•
|
Demand for our MD/HD Truck products is generally dependent on the number of new MD/HD Truck commercial vehicles manufactured in North America. Historically, the demand for MD/HD Truck commercial vehicles has declined during periods of weakness in the North American economy.
|
|
•
|
Demand for our construction equipment products is dependent on vehicle demand for new commercial vehicles in the global construction equipment market.
|
|
•
|
Demand in the medium and heavy construction vehicle market, which is where our products are primarily used, is typically related to the level of larger-scale infrastructure development projects.
|
If we experience periods of low demand for our products in the future, it could have a negative impact on our revenues, operating results and financial position.
Volatility and cyclicality in the commercial vehicle market could adversely affect us.
Our profitability depends in part on the varying conditions in the commercial vehicle market. This market is subject to considerable volatility as it moves in response to cycles in the overall business environment and is particularly sensitive to the industrial sector of the economy, which generates a significant portion of the freight tonnage hauled. Sales of commercial vehicles have historically been cyclical, with demand affected by such economic factors as industrial production, construction levels, demand for consumer durable goods, interest rates and fuel costs.
Historically, general weakness in the global economy, but especially the North American economy, and corresponding decline in the need for commercial vehicles has contributed to a downturn in commercial vehicle production. Demand for commercial vehicles depends to some extent on economic and other conditions in a given market and the introduction of new vehicles and technologies. The yearly demand for commercial vehicles may increase or decrease more than overall gross domestic product in markets we serve. Downturns historically have had a material adverse effect on our business. If unit production of commercial vehicles declines in the future it may materially and adversely affect our business and results of operations. Conversely, upswings in the global economy may result in a sharp acceleration in commercial vehicle production. A sharp acceleration in commercial vehicle production may adversely affect our ability to convert the incremental revenue into operating income efficiently.
Natural disasters may also disrupt the commercial vehicle market and materially and adversely affect global production levels in our industry. The impact from disasters resulting in wide-spread destruction may not be immediately apparent. It is particularly difficult to assess the impact of catastrophic losses on our suppliers and end customers, who themselves may not fully understand the impact of such events on their businesses. Accordingly, there is no assurance our results of operations will not be materially affected as a result of the impact of future disasters.
We may be unable to successfully implement our business strategy and, as a result, our businesses and financial position and results of operations could be materially and adversely affected.
Our ability to achieve our business and financial objectives is subject to a variety of factors, many of which are beyond our control. For example, we may not be successful in implementing our strategy if unforeseen factors emerge diminishing the expected growth in the commercial vehicle markets we supply, or we experience increased pressure on our margins. In addition, we may not succeed in integrating strategic acquisitions, and our pursuit of additional strategic acquisitions may lead to resource constraints, which could have a negative impact on our ability to meet customers’ demands, thereby adversely affecting our relationships with those customers. Similarly, strategic divestitures involve special risks and could have an adverse effect on our results of operations and financial condition. As a result of such business or competitive factors, we may decide to alter or discontinue aspects of our business strategy and may adopt alternative or additional strategies. Any failure to successfully implement our business strategy could materially and adversely affect our business, results of operations and growth potential.
13
We may be unable to complete strategic acquisitions or we may encounter unforeseen difficulties in integrating acquisitions.
We may pursue acquisition targets that will allow us to continue to expand into new geographic markets, add new customers, provide new products, manufacturing and service capabilities and increase penetration with existing customers. However, we expect to face competition for acquisition candidates, which may limit the number of our acquisition opportunities and may lead to higher acquisition prices. Moreover, acquisition of businesses may require additional debt and/or equity financing, perhaps resulting in additional leverage and/or shareholder dilution. The covenants relating to our debt instruments may further limit our ability to complete acquisitions. There can be no assurance we will find attractive acquisition candidates or successfully integrate acquired businesses into our existing business. If the expected synergies from acquisitions do not materialize or we fail to successfully integrate such new businesses into our existing businesses, our results of operations could also be materially and adversely affected.
Circumstances associated with our acquisition and divestiture strategy could adversely affect our results of operations and financial condition.
From time to time, we pursue acquisition targets to expand or compliment our business. Acquisitions involve risks, including the risk that we may overpay for a business or are unable to obtain in a timely manner, or at all, the synergies and other expected benefits from acquiring a business. Integrating acquired businesses also involves a number of special risks, including the following:
|
•
|
the possibility that management’s attention may be diverted from regular business concerns by the need to integrate operations;
|
|
•
|
problems assimilating and retaining the management or employees of the acquired company or the Company’s employees following an acquisition;
|
|
•
|
accounting issues that could arise in connection with, or as a result of, the acquisition of the acquired company, including issues related to internal control over financial reporting;
|
|
•
|
regulatory or compliance issues that could exist for an acquired company or business;
|
|
•
|
challenges in retaining the customers of the combined businesses;
|
|
•
|
the potential of lawsuits challenging the Company’s decisions; and
|
|
•
|
potential adverse short-term effects on results of operations through increased costs or otherwise.
|
If the Company is unable to successfully complete and integrate strategic acquisitions in a timely manner, its results of operations and financial condition could be adversely affected.
With respect to divestitures, from time to time we evaluate the performance and strategic fit of our businesses and may decide to sell a business or product line based on such an evaluation. Any divestitures may result in significant write-offs, including those related to goodwill and other tangible and intangible assets, which could have an adverse effect on our results of operations and financial condition. Divestitures could involve additional risks, including the following:
|
•
|
difficulties in the separation of operations, services, products and personnel;
|
|
•
|
the diversion of management’s attention from other business concerns;
|
|
•
|
the assumption of certain current or future liabilities in order to induce a buyer to complete the divestiture;
|
|
•
|
the disruption of our business;
|
|
•
|
the potential of lawsuits challenging the Company's decisions;
|
|
•
|
the potential loss of key employees; and
|
|
•
|
the proper allocation of shared costs.
|
The Company may not be successful in managing these or any other significant risks that it may encounter in divesting a business or product line and its results of operations and financial condition may be adversely affected.
Our customer base is concentrated and the loss of business from a major customer or the discontinuation of particular commercial vehicle platforms could reduce our revenues.
Sales to A.B. Volvo, Daimler and PACCAR accounted for approximately 19%, 16% and 11%, respectively, of our revenue in 2018, and our ten largest customers accounted for approximately 76% of our revenue in 2018. Even though we may be selected as the supplier of a product by an OEM for a particular vehicle, our OEM customers issue blanket purchase orders, which generally provide for the supply of that customer’s annual requirements for that vehicle, rather than for a specific number of our products. If the OEM’s requirements are less than estimated, the number of products we sell to that OEM will be accordingly reduced. In addition, the OEM may terminate its purchase orders with us at any time. The loss of any of our largest customers or the loss of significant business from any of these customers could have a material adverse effect on our business, financial condition and results of operations.
14
Our profitability could be adversely affected if the actual production volumes for our customers’ vehicles are significantly lower than expected.
We incur costs and make capital expenditures based in part upon estimates of production volumes for our customers’ vehicles. While we attempt to establish a price for our components and systems that will compensate for variances in production volumes, if the actual production of these vehicles is significantly less than anticipated, our gross margin on these products would be adversely affected. We enter into agreements with our customers at the beginning of a given platform’s life to supply products for that platform. Once we enter into such agreements, fulfillment of the supply requirements is our obligation for the entire production life of the platform, with terms generally ranging from five to seven years, and we have limited provisions to terminate such contracts. We may become committed to supply products to our customers at selling prices that are not sufficient to cover the direct cost to produce such products. We cannot predict our customers’ demands for our products. If customers representing a significant amount of our revenues were to purchase materially lower volumes than expected, or if we are unable to keep our commitment under the agreements, it would have a material adverse effect on our business, financial condition and results of operations.
Our major OEM customers may exert significant influence over us.
The commercial vehicle component supply industry has traditionally been highly fragmented and serves a limited number of large OEMs. As a result, OEMs have historically had a significant amount of leverage over their outside suppliers. Generally, our contracts with major OEM customers provide for an annual productivity price reduction. Historically, we have been able to generally mitigate these customer-imposed price reduction requirements through product design changes, increased productivity and similar programs with our suppliers. However, if we are unable to generate sufficient production cost savings in the future to offset these price reductions, our gross margin and profitability would be adversely affected. Additionally, we generally do not have clauses in our customer agreements that guarantee that we will recoup the design and development costs that we incurred to develop a product. In other cases, we share the design costs with the customer and thereby have some risk that not all the costs will be covered if the project does not go forward or if it is not as profitable as expected.
In addition, changes in OEMs’ purchasing policies or payment practices could have an adverse effect on our business. Furthermore, due to the cost focus of our major customers, we have been, and expect to continue to be, requested to reduce prices as part of our initial business quotations and over the life of vehicle platforms we have been awarded. We cannot be certain that we will be able to generate cost savings and operational improvements in the future that are sufficient to offset price reductions requested by existing customers and necessary to win additional business.
Demand for our products could also be materially reduced if our customers vertically integrate their operations in a significant manner, which would have a material and adverse impact on our business and results of operations.
We are subject to certain risks associated with our foreign operations.
We have operations in the Mexico, China, United Kingdom, Czech Republic, Ukraine, Belgium, Australia, India and Thailand, which accounted for approximately
25%
,
26%
and
25%
of our total revenues for the years ended
December 31, 2018
,
2017
and
2016
, respectively. There are certain risks inherent in our international business activities including, but not limited to:
|
•
|
the difficulty of enforcing agreements and collecting receivables through certain foreign legal systems;
|
|
•
|
foreign customers, who may have longer payment cycles than customers in the U.S.;
|
|
•
|
foreign currency exchange rate fluctuations affecting our ability to match revenue received with costs;
|
|
•
|
tax rates in certain foreign countries, which may exceed those in the U.S., withholding requirements or the imposition of tariffs, exchange controls or other restrictions, including restrictions on repatriation, on foreign earnings;
|
|
•
|
intellectual property protection difficulties;
|
|
•
|
general economic and political conditions, along with major differences in business culture and practices, including the challenges of dealing with business practices that may impact the company’s compliance efforts, in countries where we operate;
|
|
•
|
exposure to local social unrest, including any resultant acts of war, terrorism or similar events;
|
|
•
|
the difficulties associated with managing a large organization spread throughout various countries; and
|
|
•
|
complications in complying with a variety of laws and regulations related to doing business with and in foreign countries, some of which may conflict with U.S. law or may be vague or difficult to comply with.
|
Additionally, our international business activities are also subject to risks arising from violations of U.S. laws such as the U.S. Foreign Corrupt Practices Act and similar anti-bribery laws in other jurisdictions, and various export control and trade embargo laws and regulations, including those which may require licenses or other authorizations for transactions relating to certain countries
15
and/or with certain individuals identified by the U.S. government. If we fail to comply with applicable laws and regulations, we could suffer civil and criminal penalties that could materially and adversely affect our results of operations and financial condition.
As we expand our business on a global basis, we are increasingly exposed to these risks. Our success will be dependent, in part, on our ability to anticipate and effectively manage these and other risks associated with foreign operations. These and other factors may have a material adverse effect on our international operations, business, financial condition and results of operations.
The uncertainty surrounding the implementation and effect of Brexit may cause increased economic volatility, affecting our operations and business.
On June 23, 2016, voters in the United Kingdom (UK) approved an advisory referendum to withdraw membership from the EU, which proposed exit (referred to as Brexit) could cause disruptions to, and create uncertainty surrounding, our business in the UK and EU, including affecting our relationships with our existing and future customers, suppliers and employees. As a result, Brexit could have an adverse effect on our future business, financial results and operations. The formal process for the UK leaving the EU began in March 2017, when the UK served notice to the European Council under Article 50 of the Treaty of Lisbon. The long-term nature of the UK’s relationship with the EU is unclear and there is considerable uncertainty when any relationship will be agreed and implemented. The political and economic instability created by Brexit has caused and may continue to cause significant volatility in global financial markets and uncertainty regarding the regulation of data protection in the UK. Brexit could also have the effect of disrupting the free movement of goods, services, and people between the UK, EU, and elsewhere. The effects of Brexit will depend on any agreements the UK makes to retain access to the EU markets either during a transitional period or more permanently. Brexit could lead to legal uncertainty and potentially divergent national laws and regulations as the UK determines which EU laws to replace or replicate. Further, uncertainty around these and related issues could lead to adverse effects on the economy of the UK and the other economies in which we operate. There can be no assurance that any or all of these events will not have a material adverse effect on our business operations, results of operations and financial condition.
We are subject to certain risks associated with our Mexican operations
In December 2018, the newly elected Mexican government announced new minimum wage requirements per the Mexican labor laws. Under the new requirements, Mexico will have two minimum wages: one rate applicable to municipalities located on the border with the United States, which were included in a newly created Northern Border Free Trade Zone, and a different rate applicable to the rest of Mexico.
Along with the new requirements, the Mexican National Minimum Wage Commission announced the following new minimum wages, which have been in effect since January 1, 2019: Pesos. 176.72 Per day for municipalities in the Northern Border Free Trade Zone, a 100% increase from the minimum wage of Pesos. 88.36 Per day in effect prior to January 1, 2019, and Pesos. 102.68 Per day for the rest of Mexico, a 16.2% increase from the prior minimum wage. We have facilities in the Northern Border Free Trade Zone that are affected by the 100% increase in minimum wage and we have complied with the new requirements. We are uncertain if the increase in the affected employee’s minimum wage will flow through the entire compensation structure of our employees in our facilities in Mexico creating additional costs and any labor shortages resulting from our failure to adjust the entire compensation structure over and above the incremental minimum wage. Additionally, we are uncertain if we will be successful in passing through the related incremental cost to our customers and there can be no assurance our results of operations will not be materially affected as a result of the impact of such incremental cost.
Significant changes to international trade regulations could adversely affect our results of operations.
Our business benefits from current free trade agreements and other duty preference programs, including the North American Free Trade Agreement (“NAFTA”). The U.S. government has negotiated the US-Mexico-Canada Agreement (the "USMCA") as a replacement for NAFTA, which has to be ratified by the legislature in each of the signatory countries before it becomes binding. The U.S. government has indicated that it may propose significant changes to other international trade agreements, import and export regulations, and tariffs and customs duties, which have increased uncertainty regarding the future of existing international trade regulations. The imposition of tariffs on the products we manufacture and sell could have a material and adverse impact on our business, financial condition and results of operations. Additionally, if the U.S. President or Congress takes action to withdraw from or materially modify NAFTA or USMCA, our business, financial condition and results of operations could be adversely affected.
Decreased availability or increased costs of materials could increase our costs of producing our products.
We purchase raw materials, fabricated components, assemblies and services from a variety of suppliers. Steel, aluminum, petroleum-based products, copper, resin, foam, fabrics, wire and wire components account for the most significant portion of our raw material costs. Although we currently maintain alternative sources for most raw materials, from time to time, however, the prices and
16
availability of these materials fluctuate due to global market demands and other considerations, which could impair the Company's ability to procure necessary materials, or increase the cost of such materials. We may be assessed surcharges on certain purchases of steel, copper and other raw materials. Inflationary and other increases in costs of these materials have occurred in the past and may recur from time to time. In addition, freight costs associated with shipping and receiving product are impacted by fluctuations in freight tonnage, freight hauler capacity and the cost of oil and gas. If we are unable to purchase certain raw materials required for our operations, our operations would be disrupted, and our results of operations would be adversely affected. In addition, if we are unable to pass on the increased costs of raw materials to our customers, this could adversely affect our results of operations and financial condition.
The recent imposition of tariffs on steel and aluminum have impacted the prices of certain of our materials. The continuation or expansion of the tariffs could result in material increases in our costs.
We have invested substantial resources in markets where we expect growth and we may be unable to timely alter our strategies should such expectations not be realized.
Our future growth is dependent in part on our making the right investments at the right time to support product development and manufacturing capacity in areas where we can support our customer base. We have identified the Asia-Pacific region, specifically China and India, as key markets likely to experience substantial growth in our market share, and accordingly have made and expect to continue to make substantial investments, both directly and through participation in various partnerships and joint ventures, in numerous manufacturing operations, technical centers and other infrastructure to support anticipated growth in those regions. If we are unable to maintain, deepen existing and develop additional customer relationships in these regions, we may not only fail to realize expected rates of return on our existing investments, we may also incur losses on such investments and be unable to timely redeploy the invested capital to take advantage of other markets, potentially resulting in lost market share to our competitors. We cannot guarantee that we will be successful in leveraging our capabilities into new markets and thus, in meeting the needs of these new customers and competing favorably in these new markets. Our results will also suffer if these regions do not grow as quickly as we anticipate.
Our inability to compete effectively in the highly competitive commercial vehicle component supply industry could result in lower prices for our products, loss of market share and reduced gross margins, which could have an adverse effect on our revenues and operating results.
The commercial vehicle component supply industry is highly competitive. Some of our competitors are companies that are larger and have greater financial and other resources than we do. In some cases, we compete with divisions of our OEM customers. Our products primarily compete on the basis of price, breadth of product offerings, product quality, technical expertise and development capability, product delivery and product service. Increased competition may lead to price reductions resulting in reduced gross margins and loss of market share.
Current and future competitors may make strategic acquisitions or establish cooperative relationships among themselves or with others, foresee the course of market development more accurately than we do, develop products that are superior to our products, produce similar products at lower cost than we can, or adapt more quickly to new technologies, industry or customer requirements. By doing so, they may enhance their ability to meet the needs of our customers or potential future customers more competitively. These developments could limit our ability to obtain revenues from new customers or maintain existing revenues from our customer base. We may not be able to compete successfully against current and future competitors and our failure to do so may have a material adverse effect on our business, operating results and financial condition.
We may be unable to successfully introduce new product and, as a result, our businesses and financial position and results of operations could be materially and adversely affected.
Product innovations have been and will continue to be a part of our business strategy. We believe it is important we continue to meet our customers’ demands for product innovation, improvement and enhancement, including the continued development of new-generation products, and design improvements and innovations that improve the quality and efficiency of our products. However, such development will require us to continue to invest in research and development and sales and marketing. We are also subject to the risks generally associated with product development, including lack of market acceptance, delays in product development and failure of products to operate properly. In addition, our competitors may develop new products before us or may produce similar products that compete with our new products. We may, as a result of these factors, be unable to meaningfully focus on product innovation as a strategy and may therefore be unable to meet our customers’ demands for product innovation, which could have a material adverse effect on our business, operating results and financial condition.
Our products may be rendered less attractive by changes in competitive technologies, including the introduction of autonomous vehicles.
17
Changes in competitive technologies, including the introduction of autonomous vehicles, may render certain of our products less attractive. Our ability to anticipate changes in technology and to successfully develop and introduce new and enhanced products on a timely basis will be a significant factor in our ability to remain competitive. There can be no assurance that we will be able to achieve the technological advances that may be necessary for us to remain competitive. We are also subject to the risks generally associated with new product introductions and applications, including lack of market acceptance, delays in product development and failure of products to operate properly, all of which could adversely affect our business, results of operations and growth potential.
We could experience disruption in our supply or delivery chain, which could cause one or more of our customers to halt or delay production.
We, as with other component manufactures in the commercial vehicle industry, sometimes ship products to the customers throughout the world so they are delivered on a “just-in-time” basis in order to maintain low inventory levels. Our suppliers (external suppliers as well as our own production sites) also sometimes use a similar method. This just-in-time method makes the logistics supply chain in our industry very complex and very vulnerable to disruptions.
The potential loss of one of our suppliers or our own production sites could be caused by a myriad of potential problems, such as closures of one of our own or one of our suppliers’ plants or critical manufacturing lines due to strikes, mechanical breakdowns, equipment failure, electrical outages, fires, explosions, political upheaval, as well as logistical complications due to weather, volcanic eruptions, earthquakes, flooding or other natural disasters, Acts of God, mechanical failures, delayed customs processing and more. Additionally, as we expand in growth markets, the risk for such disruptions is heightened. The lack of even a small single subcomponent necessary to manufacture one of our products, for whatever reason, could force us to cease production, possibly for a prolonged period. In the event of a reduction or stoppage in production at any of our facilities, even if only temporary, or if we experience delays as a result of events that are beyond our control, delivery times to our customers could be severely affected. Any significant delay in deliveries to our customers could lead to increased returns or cancellations. Similarly, a potential quality issue could force us to halt deliveries. Even where products are ready to be shipped or have been shipped, delays may arise before they reach our customer. Our customers may halt or delay their production for the same reason if one of their other suppliers fails to deliver necessary components. This may cause our customers to suspend their orders or instruct us to suspend delivery of our products, which may adversely affect our financial performance.
When we cease timely deliveries, we have to absorb our own costs for identifying and solving the root cause problem as well as expeditiously producing replacement components or products. Generally, we must also carry the costs associated with “catching up,” such as overtime and premium freight.
Additionally, if we are the cause for a customer being forced to halt production the customer may seek to recoup all of its losses and expenses from us. These losses and expenses could be very significant and may include consequential losses such as lost profits. Thus, any supply chain disruption, however small, could potentially cause the complete shutdown of an assembly line of one of our customers, and any such shutdown could expose us to material claims for compensation. Where a customer halts production because of another supplier failing to deliver on time, we may not be fully compensated, if at all, and therefore our business and financial results could be materially and adversely affected.
Security breaches and other disruptions could compromise our information systems and expose us to liability, which could cause our business and reputation to suffer.
In the ordinary course of our business, we collect and store sensitive data, including intellectual property, financial information, our proprietary business information and that of our customers, suppliers and business partners, and personally identifiable information of our customers and employees, in our data centers and on our networks. The secure processing, maintenance and transmission of this information is critical to our operations and business strategy. Despite our security measures, our information technology and infrastructure may be vulnerable to attacks by hackers or breached due to employee error, malfunction, malfeasance or other disruptions. Like most companies, our systems are under attack on a routine basis. At times there are breaches of our security measures. While past breaches have not been material, there is no guarantee that future breaches could not have a material impact. Any such access, disclosure or other loss of information could result in legal claims or proceedings, liability under laws that protect the privacy of personal information, regulatory penalties, disrupt our operations and the services we provide to customers, damage our reputation, and cause a loss of confidence in our products and services, which could adversely affect our business and our results of operations.
If we are unable to recruit or retain senior management and other skilled personnel, our business, operating results and financial condition could be materially and adversely affected.
Our operations depend to a large extent on the efforts of our senior management team as well as our ability to attract, train, integrate and retain highly skilled personnel. We seek to develop and retain an effective management team through the proper positioning
18
of existing key employees and the addition of new management personnel where necessary. Retaining personnel with the right skills at competitive wages can be difficult in certain markets in which we are doing business, particularly those locations that are seeing much inbound investment and have highly mobile workforces. Additionally, attracting sufficiently well-educated and talented management, especially middle-management employees, in certain markets can be challenging.
We may not be able to retain our current senior management and other skilled personnel or attain similarly skilled personnel in the future. If we lose senior management or the services of our skilled workforce, or if we are unable to attract, train, integrate and retain the highly skilled personnel we need, our business, operating results and financial condition could be materially and adversely affected.
We may be adversely impacted by labor strikes, work stoppages and other matters.
As of December 31, 2018, approximately 53% of the employees in our North American operations were unionized, with the majority of union-represented personnel based in Mexico. We have experienced limited unionization efforts at certain of our other North American facilities from time to time. In addition, approximately 68% of our employees of our European, Asian and Australian operations were represented by a shop steward committee, which may limit our flexibility in our relationship with these employees. We may encounter future unionization efforts or other types of conflicts with labor unions or our employees.
Many of our OEM customers and their suppliers also have unionized work forces. Work stoppages or slow-downs experienced by OEMs or their other suppliers could result in slow-downs or closures of assembly plants where our products are included in assembled commercial vehicles. In the event that one or more of our customers or their suppliers experience a material work stoppage, such work stoppage could have a material adverse effect on our business.
Our earnings may be adversely affected by changes to the carrying values of our tangible and intangible assets as a result of recording any impairment charges deemed necessary.
We are required to perform impairment tests whenever events and circumstances indicate the carrying value of certain assets may not be recoverable. Significant or unanticipated changes in circumstances, such as the general economic environment, changes or downturns in our industry as a whole, termination of any of our customer contracts, restructuring efforts and general workforce reductions, may result in a charge for impairment that can materially and adversely affect our reported net income and our stockholders’ equity.
We have taken, are taking, and may take future restructuring actions to realign and resize our production capacity and cost structure to meet current and projected operational and market requirements. Charges related to these actions or any further restructuring actions may have a material adverse effect on our results of operations and financial condition. There can be no assurance that any current or future restructuring will be completed as planned or achieve the desired results. The failure to complete restructuring as planned could materially and adversely affect our results of operations.
We have established and may establish in the future valuation allowances on deferred tax assets. These changes may have a material adverse effect on our results of operations and financial position.
Additionally, from time to time in the past, we have recorded asset impairment losses relating to specific plants and operations. Generally, we record asset impairment losses when we determine that our estimates of the future undiscounted cash flows from an operation will not be sufficient to recover the carrying value of that facility’s building, fixed assets and production tooling. For goodwill, we perform a qualitative assessment of whether it is more likely than not that the reporting unit’s fair value is less than its carrying amount. If the fair value of the reporting unit is less than its carrying amount, we compare its implied fair value of goodwill to its carrying amount. If the carrying amount of goodwill exceeds its implied fair value, the reporting unit would recognize an impairment loss for that excess amount. There can be no assurance that we will not incur such charges in the future as changes in economic or operating conditions impacting the estimates and assumptions could result in additional impairment. Any future impairments may materially and adversely affect our results of operations.
Our inability to successfully achieve operational efficiencies could result in the incurrence of additional costs and expenses that could adversely affect our reported earnings.
As part of our business strategy, we continuously seek ways to lower costs, improve manufacturing efficiencies and increase productivity in our existing operations and intend to apply this strategy to those operations acquired through acquisitions. In addition, we incur restructuring charges periodically to close facilities, such as, lease termination charges, severance charges and impairment charges of leasehold improvements and/or machinery and equipment, as we continue to evaluate our manufacturing footprint to improve our cost structure and remove excess, underperforming assets, or assets that no longer fit our goals. If we decide to close or consolidate facilities, we may face execution risks which could adversely affect our ability to serve our customers. Further, we may be unsuccessful in achieving these objectives which could adversely affect our operating results and financial condition.
19
Additionally, aspects of the data upon which the company’s business strategy is based may be incomplete or unreliable, which could lead to errors in the strategy, which in turn could adversely affect the company’s performance. Also, not all business strategy can be based on data, and to the extent that it is based on assumptions and judgments that are untested, then it could be unsound and thereby lead to performance below expectations.
Tax legislation initiatives or challenges to our tax positions could adversely affect our results of operations and financial condition.
We are a multinational corporation with operations in the United States and international jurisdictions. As such, we are subject to the tax laws and regulations of the U.S. federal, state and local governments and various international jurisdictions. From time to time, various legislative initiatives may be proposed that could adversely affect our tax positions. There can be no assurance that our effective tax rate or tax payments will not be adversely affected by these initiatives. In addition, U.S. federal, state and local, as well as international, tax laws and regulations are extremely complex and subject to varying interpretations. There can be no assurance that our tax position will not be challenged by relevant tax authorities or that we would be successful in any such challenge.
On December 22, 2017, the U.S. Tax Cuts and Jobs Act of 2017 ("U.S. Tax Reform") was signed into law, enacting sweeping changes to U.S. federal tax law. At the time of the enactment of the U.S. Tax Reform, it was necessary for U.S. multinational corporations to prepare complex calculations not previously undertaken and make judgments on how to interpret and implement the U.S. Tax Reform due to the significant complexity of, and uncertainty surrounding, its various provisions. As a result, it was necessary for the Company to make reasonable estimates in providing for the U.S. federal income tax impact of certain provisions of the U.S. Tax Reform in its financial statements for the year ended December 31, 2017. Specifically, a $4.0 million tax provision was recorded for the estimated impact of the one-time tax on the deemed repatriation of accumulated untaxed earnings of the Company’s foreign subsidiaries in the year ended December 31, 2017. After performing additional data gathering and analysis and interpreting subsequently issued guidance from the Internal Revenue Service (“IRS”), we recorded a $4.2 million tax benefit during the year ended December 31, 2018 which represented our final adjustment to the provisional $4.0 million tax expense recorded during the year ended December 31, 2017. Although we believe the Company has properly accounted for the impact of the U.S. Tax Reform, the IRS has not yet issued final regulations governing how the various provisions should be interpreted so it is possible that we could be challenged by the IRS or need to file an amended U.S. consolidated federal income tax return for the tax year ended December 31, 2017, which may have a material impact on our financial statements in a future period.
The geographic profile of our taxable income could adversely impact our tax provision and therefore our results of operations.
Our future tax provision could be adversely affected by the geographic profile of our taxable income and by changes in the valuation of our deferred tax assets and liabilities. Our results could be materially impacted by significant changes in our effective tax rate. Additionally, any changes to manufacturing activities could result in significant changes to our effective tax rate related to products manufactured either in the United States or in international jurisdictions. If the United States or another international jurisdiction implements a tax change related to products manufactured in a particular jurisdiction where we do business, our results could be materially and adversely affected.
Exposure to currency exchange rate fluctuations on cross border transactions and translation of local currency results into United States dollars could materially impact our results of operations.
Cross border transactions, both with external parties and intercompany relationships, result in increased exposure to foreign currency fluctuations. The strengthening or weakening of the United States dollar may result in favorable or unfavorable foreign currency translation effects in as much as the results of our foreign locations are translated into United States dollars. This could materially impact our results of operations.
Litigation against us could be costly and time consuming to defend, as a result, our businesses and financial position could be materially and adversely affected.
We are regularly subject to legal proceedings and claims that arise in the ordinary course of business, such as workers’ compensation claims, Occupational Safety and Health Administration investigations, employment disputes, unfair labor practice charges, examination by the Internal Revenue Service, customer and supplier disputes, contractual disputes, intellectual property disputes, environmental claims and product liability claims arising out of the conduct of our business. Litigation may result in substantial costs and may divert management’s attention and resources from the operation of our business, which could have a material adverse effect on our business, results of operations or financial condition.
20
We have only limited protection for our proprietary rights in our intellectual property, which makes it difficult to prevent third parties from infringing upon our rights.
Our success depends to a certain degree on our ability to protect our intellectual property and to operate without infringing on the proprietary rights of third parties. While we have been issued patents and have registered trademarks with respect to many of our products, our competitors could independently develop similar or superior products or technologies, duplicate our designs, trademarks, processes or other intellectual property or design around any processes or designs on which we have or may obtain patents or trademark protection. In addition, it is possible third parties may have or acquire licenses for other technology or designs that we may use or desire to use, requiring us to acquire licenses to, or to contest the validity of, such patents or trademarks of third parties. Such licenses may not be made available to us on acceptable terms, if at all, or we may not prevail in contesting the validity of third party rights.
In addition to patent and trademark protection, we also protect trade secrets, “know-how” and other confidential information against unauthorized use or disclosure by persons who have access to them, such as our employees and others, through contractual arrangements. These arrangements may not provide meaningful protection for our trade secrets, know-how or other confidential information in the event of any unauthorized use, misappropriation or disclosure. If we are unable to maintain the proprietary nature of our technologies, trade secrets, know-how, or other confidential information, our revenues could be materially and adversely affected.
As we diversify and globalize our geographic footprint, we may encounter laws and practices in emerging markets that are not as stringent or enforceable as those present in developed markets, and thus incur a higher risk of intellectual property infringement, which could materially and adversely affect our results of operations.
Our products may be susceptible to claims by third parties that our products infringe upon their proprietary rights.
As the number of products in our target markets increases and the functionality of these products further overlaps, we may become increasingly subject to claims by a third party that our technology infringes such party’s proprietary rights. Regardless of their merit, any such claims could be time consuming and expensive to defend, may divert management’s attention and resources, could cause product shipment delays and could require us to enter into costly royalty or licensing agreements. If successful, a claim of infringement against us and our inability to license the infringed or similar technology and/or product could have a material adverse effect on our business, operating results and financial condition.
We may be subject to product liability claims, recalls or warranty claims, which could be expensive, damage our reputation and result in a diversion of management resources.
As a supplier of products and systems to commercial and construction vehicle OEMs and markets, we face an inherent business risk of exposure to product liability claims in the event that our products, or the equipment into which our products are incorporated, malfunction and result in personal injury or death. Product liability claims could result in significant losses as a result of expenses incurred in defending claims or the award of damages.
In addition, we may be required to participate in recalls involving systems or components sold by us if any prove to be defective, or we may voluntarily initiate a recall or make payments related to such claims as a result of various industry or business practices or the need to maintain good customer relationships. Such a recall would result in a diversion of management resources. While we maintain product liability insurance generally with a self-insured retention amount, we cannot assure you that it will be sufficient to cover all product liability claims, that such claims will not exceed our insurance coverage limits or that such insurance will continue to be available on commercially reasonable terms, if at all. Any product liability claim brought against us could have a material adverse effect on our results of operations.
We warrant the workmanship and materials of many of our products under limited warranties and have entered into warranty agreements with certain OEMs that warranty certain of our products in the hands of these OEMs’ customers, in some cases for many years. From time to time, we receive product warranty claims from our customers, pursuant to which we may be required to bear costs of repair or replacement of certain of our products. Accordingly, we are subject to risk of warranty claims in the event that our products do not conform to our customers’ specifications or, in some cases in the event that our products do not conform to their customers’ expectations. It is possible for warranty claims to result in costly product recalls, significant repair costs and damage to our reputation, all of which would materially and adversely affect our results of operations.
Our businesses are subject to statutory environmental and safety regulations in multiple jurisdictions, and the impact of any changes in regulation and/or the violation of any applicable laws and regulations by our businesses could result in a material adverse effect on our financial condition and results of operations.
We are subject to foreign, federal, state, and local laws and regulations governing the protection of the environment and occupational health and safety, including laws regulating air emissions, wastewater discharges, generation, storage, handling, use and transportation of hazardous materials; the emission and discharge of hazardous materials into the soil, ground or air; and the health
21
and safety of our colleagues. We are also required to obtain permits from governmental authorities for certain of our operations. We cannot assure you that we are, or have been, in complete compliance with such environmental and safety laws, and regulations. Certain of our operations generate hazardous substances and wastes. If a release of such substances or wastes occurs at or from our properties, or at or from any offsite disposal location to which substances or wastes from our current or former operations were taken, or if contamination is discovered at any of our current or former properties, we may be held liable for the costs of cleanup and for any other response by governmental authorities or private parties, together with any associated fines, penalties or damages. In most jurisdictions, this liability would arise whether or not we had complied with environmental laws governing the handling of hazardous substances or wastes.
Several of our facilities are either certified as, or are in the process of being certified as ISO 9001, 14000, 14001 or TS16949 (the international environmental management standard) compliant or are developing similar environmental management systems. We have made, and will continue to make, capital and other expenditures to implement such environmental programs and comply with environmental requirements.
The environmental laws to which we are subject have become more stringent over time, and we could incur material costs or expenses in the future to comply with environmental laws. If we violate or fail to comply with these laws and regulations or do not have the requisite permits, we could be fined or otherwise sanctioned by regulators. In some instances, such a fine or sanction could have a material adverse effect on our financial condition and results of operations.
We may be adversely affected by the impact of government regulations on our OEM customers.
Although the products we manufacture and supply to commercial vehicle OEMs are not subject to significant government regulation, our business is indirectly impacted by the extensive governmental regulation applicable to commercial vehicle OEMs. These regulations primarily relate to emissions and noise standards imposed by the EPA, state regulatory agencies in North America, such as CARB, and other regulatory agencies around the world. Commercial vehicle OEMs are also subject to the National Traffic and Motor Vehicle Safety Act and Federal Motor Vehicle Safety Standards promulgated by NHTSA in the U.S. Changes in emission standards and other proposed governmental regulations could impact the demand for commercial vehicles and, as a result, indirectly impact our operations. For example, new emission standards for truck engines used in Class 5 to 8 trucks imposed by the EPA and CARB became effective in 2010. In 2011, the EPA and NHTSA adopted a program to reduce greenhouse gas emissions and improve the fuel efficiency of medium-and heavy-duty vehicles. To the extent that current or future governmental regulation has a negative impact on the demand for commercial vehicles, our business, financial condition or results of operations could be adversely affected.
Risks Related to Our Indebtedness
The agreement governing our senior secured revolving credit facility and the agreement governing our senior secured term loan credit facility contain covenants that may restrict our current and future operations, particularly our ability to respond to changes in our business or to take certain actions. If we are unable to comply with these covenants, our business, results of operations and liquidity could be materially and adversely affected.
Our senior secured revolving and term loan credit facilities require us to maintain certain financial ratios and to comply with various operational and other covenants. If we do not comply with those covenants we would be precluded from borrowing under the revolving credit facility, which could have a material adverse effect on our business, financial condition and liquidity. If we are unable to borrow under our revolving credit facility, we will need to meet our capital requirements using other sources; however, alternative sources of liquidity may not be available on acceptable terms. In addition, if we fail to comply with the covenants set forth in our credit facilities the lenders thereunder could declare an event of default and cause all amounts outstanding thereunder to be due and payable immediately. We cannot assure you that our assets or cash flow would be sufficient to fully repay borrowings under our outstanding credit facilities or other debt instruments we may have in place from time to time, either upon maturity or if accelerated, upon an event of default, or that we would be able to refinance or restructure the payments on the credit facilities or such other debt instruments on acceptable terms.
In addition, the agreements governing the revolving and term loan credit facilities contain covenants that, among other things, restrict our ability to:
|
•
|
incur liens;
|
|
•
|
incur or assume additional debt or guarantees or issue preferred stock;
|
|
•
|
pay dividends or repurchases with respect to capital stock;
|
|
•
|
prepay, or make redemptions and repurchases of, subordinated debt;
|
|
•
|
make loans and investments;
|
|
•
|
engage in mergers, acquisitions, asset sales, sale/leaseback transactions and transactions with affiliates;
|
|
•
|
place restrictions on the ability of subsidiaries to pay dividends or make other payments to the issuer;
|
22
|
•
|
change the business conducted by us or our subsidiaries; and
|
|
•
|
amend the terms of subordinated debt.
|
Our indebtedness may adversely affect our cash flow and our ability to operate our business, remain in compliance with debt covenants and make payments on our indebtedness.
Our indebtedness, combined with our lease and other financial obligations and contractual commitments could have other important consequences to our stockholders, including:
|
•
|
making it more difficult for us to satisfy our obligations with respect to our indebtedness, including the revolving credit facility, term loan and our other debt instruments, and any failure to comply with the obligations of any of our debt instruments, including financial and other restrictive covenants, could result in an event of default under the revolving credit facility or term loan and the governing documents of our debt instruments;
|
|
•
|
the possibility that we may be unable to generate cash sufficient to pay, when due, the principal of, interest on or other amounts due in respect of our indebtedness;
|
|
•
|
making us more vulnerable to adverse changes in general economic, industry and competitive conditions;
|
|
•
|
require us to dedicate a substantial portion of our cash flow from operations to payments on our indebtedness, thereby reducing the availability of our cash flows to fund working capital, capital expenditures, acquisitions and other general corporate purposes;
|
|
•
|
limiting our flexibility in planning for, or reacting to, changes in our business and the industry in which we operate;
|
|
•
|
placing us at a competitive disadvantage compared to our competitors that have less debt; and
|
|
•
|
limiting our ability to borrow additional amounts for working capital, capital expenditures, acquisitions, debt service requirements, or execution of our business strategy or other purposes.
|
Any of these factors could materially and adversely affect our business, financial condition and results of operations. Our ability to make payments on our indebtedness depends on our ability to generate cash in the future. If we do not generate sufficient cash flow to meet our debt service and working capital requirements, we may need to seek additional financing or sell assets. This may make it more difficult for us to obtain financing on terms that are acceptable to us, or at all. Without any such financing, we could be forced to sell assets to make up for any shortfall in our payment obligations under unfavorable circumstances. If necessary, we may not be able to sell assets quickly enough or for sufficient amounts to enable us to meet our obligations.
Risks Related to Our Common Stock
Our operating results, revenues and expenses may fluctuate significantly from quarter-to-quarter or year-to-year, which could have an adverse effect on the market price of our common stock.
Our operating results, revenues and expenses have in the past varied and may in the future vary significantly from quarter-to-quarter or year-to-year. These fluctuations could have an adverse effect on the market price of our common stock.
Our operating results may fluctuate as a result of these and other events and factors:
|
•
|
the size, timing, volume and execution of significant orders and shipments;
|
|
•
|
changes in the terms of our sales contracts;
|
|
•
|
the timing of new product announcements by us and our competitors;
|
|
•
|
changes in our pricing policies or those of our competitors;
|
|
•
|
changes in supply and pricing of raw materials and components;
|
|
•
|
market acceptance of new and enhanced products;
|
|
•
|
announcement of technological innovations or new products by us or our competitors;
|
|
•
|
the length of our sales cycles;
|
|
•
|
conditions in the commercial vehicle industry;
|
|
•
|
changes in our operating expenses;
|
|
•
|
personnel changes;
|
|
•
|
new business acquisitions;
|
|
•
|
uncertainty in geographic regions;
|
|
•
|
cyber attacks;
|
|
•
|
currency and interest rate fluctuations;
|
|
•
|
uncertainty with respect to the North American Free Trade Agreement, USMCA and other international trade agreements;
|
|
•
|
Brexit
|
|
•
|
union actions; and
|
|
•
|
seasonal factors.
|
23
We base our operating expense budgets in large part on expected revenue trends. However, certain of our expenses are relatively fixed and as such we may be unable to adjust expenses quickly enough to offset any unexpected revenue shortfall. Accordingly, any significant change in revenue may cause significant variation in operating results in any quarter or year.
It is possible that in one or more future quarters or years, our operating results may be below the expectations of public market analysts and investors and may result in changes in analysts’ estimates. In such events, the trading price of our common stock may be adversely affected.
In the past, companies that have experienced volatility in the market price of their stock have been the subject of securities class action litigation. If we become involved in securities class action litigation in the future, it could result in substantial costs and diversion of management attention and resources, thus harming our business.
Our common stock has historically had a low trading volume with limited analyst coverage and, as a result, any sale of a significant number of shares may depress the trading price of our stock; shareholders may be unable to sell their shares above the purchase price.
Our common stock is traded on the NASDAQ Global Select Market under the symbol “CVGI.” The trading volume and analyst coverage of our common stock has historically been limited as compared to common stock of an issuer that has a large and steady volume of trading activity that will generally support continuous sales without an adverse effect on share prices. Because of the limited trading volume, holders of our securities may not be able to sell quickly any significant number of such shares, and any attempted sale of a large number of our shares may have a material adverse impact on the price of our common stock. Additionally, because of the limited number of shares being traded, and changes in stock market analyst recommendations regarding our common stock or lack of analyst coverage, the price per share of our common stock is subject to volatility and may continue to be subject to rapid price swings in the future that may result in shareholders’ inability to sell their common stock at or above purchase price.
Provisions in our charter documents and Delaware law could discourage potential acquisition proposals, could delay, deter or prevent a change in control and could limit the price certain investors might be willing to pay for our stock.
Certain provisions of our certificate of incorporation and by-laws may inhibit changes in control of our company not approved by our board of directors. These provisions include:
|
•
|
a prohibition on stockholder action through written consents;
|
|
•
|
a requirement that special meetings of stockholders be called only by the board of directors;
|
|
•
|
advance notice requirements for stockholder proposals and director nominations;
|
|
•
|
limitations on the ability of stockholders to amend, alter or repeal the by-laws; and
|
|
•
|
the authority of the board of directors to issue, without stockholder approval, preferred stock and common stock with such terms as the board of directors may determine.
|
We are also afforded the protections of Section 203 of the Delaware General Corporation Law, which would prevent us from engaging in a business combination with a person who becomes a 15% or greater stockholder for a period of three years from the date such person acquired such status unless certain board or stockholder approvals were obtained. These provisions could limit the price that certain investors might be willing to pay in the future for shares of our common stock.
|
Item 1B.
|
Unresolved Staff Comments
|
None.
24
|
Item 2.
|
Properties
|
Our corporate office is located in New Albany, Ohio. Several of our facilities are located near our OEM customers to reduce distribution costs, reduce risk of interruptions in our delivery schedule, further improve customer service and provide our customers with reliable delivery of products and services. The following table provides selected information regarding our principal facilities as of
December 31, 2018
:
|
Location
|
Primary Product/Function
|
Ownership Interest
|
||
|
Piedmont, Alabama
|
Aftermarket Distribution
|
Owned
|
||
|
Douglas, Arizona
|
Warehouse
|
Leased
|
||
|
Dalton, Georgia
|
Trim & Warehouse
|
Leased
|
||
|
Monona, Iowa
|
Wire Harness
|
Owned
|
||
|
Michigan City, Indiana
|
Wipers, Switches
|
Leased
|
||
|
Kings Mountain, North Carolina
|
Cab, Sleeper Box
|
Owned
|
||
|
Concord, North Carolina
|
Injection Molding
|
Leased
|
||
|
Chillicothe, Ohio
|
Trim, Mirrors & Warehouse
|
Owned / Leased
|
||
|
New Albany, Ohio
|
Corporate Headquarters / R&D
|
Leased
|
||
|
Vonore, Tennessee
|
Seats, Flooring & Warehouse
|
Owned / Leased
|
||
|
Dublin, Virginia
|
Trim & Warehouse
|
Owned / Leased
|
||
|
Agua Prieta, Mexico
|
|
Wire Harness
|
Leased
|
|
|
Esqueda, Mexico
|
Wire Harness
|
Leased
|
||
|
Morelos, Mexico
|
Wire Harness
|
Leased
|
||
|
Saltillo, Mexico
|
Trim & Seats
|
Leased
|
||
|
Northampton, United Kingdom
|
Seats
|
Leased
|
||
|
Brisbane, Australia
|
Seats
|
Leased
|
||
|
Sydney, Australia
|
Seats
|
Leased
|
||
|
Mackay, Australia
|
Distribution
|
Leased
|
||
|
Melbourne, Australia
|
Distribution
|
Leased
|
||
|
Perth, Australia
|
Distribution
|
Leased
|
||
|
Jiading, China
|
Seats and Wire Harness / R&D
|
Leased
|
||
|
Bangkok, Thailand
|
Seats
|
Leased
|
||
|
Brandys nad Orlici, Czech Republic
|
Seats
|
Owned
|
||
|
Liberec, Czech Republic
|
Wire Harness
|
Leased
|
||
|
Baska (State of Gujarat) India
|
Seats
|
Leased
|
||
|
Pune (State of Maharashtra), India
|
Seats / R&D
|
Leased
|
||
|
Dharwad (State of Karnataka), India
|
Seats
|
Leased
|
||
|
L’viv, Ukraine
|
Wire Harness
|
Leased
|
||
We also have leased sales and service offices in the Belgium, Australia, and Czech Republic and a sales office in Sweden. Our owned domestic facilities are subject to liens securing our obligations under our revolving credit facility and senior secured term loan credit facility as described in Note 7 of the Consolidated Financial Statements.
Utilization of our facilities varies with North American, European, Asian and Australian commercial vehicle production and general economic conditions in the regions. All locations are principally used for manufacturing, assembly, distribution or warehousing, except for our New Albany, Ohio facility, which is an administrative office.
|
Item 3.
|
Legal Proceedings
|
We are subject to various legal proceedings and claims arising in the ordinary course of business, including, but not limited to, workers’ compensation claims, OSHA investigations, employment disputes, unfair labor practice charges, customer and supplier disputes, service provider disputes, product liability claims, intellectual property disputes, and environmental claims arising out of the conduct of our businesses and examinations by the Internal Revenue Service. Based upon the information available to management and discussions with legal counsel, it is the opinion of management that the ultimate outcome of the various legal
25
actions and claims that are incidental to our business are not expected to have a material adverse impact on the consolidated financial position, results of operations, stockholders' equity or cash flows; however, such matters are subject to many uncertainties and the outcomes of individual matters are not predictable with any degree of assurance.
|
Item 4.
|
Mine Safety Disclosures
|
Not applicable.
26
PART II
|
Item 5.
|
Market for Registrant’s Common Equity, Related Stockholder Matters and Issuer Purchases of Equity Securities
|
Our common stock is traded on the NASDAQ Global Select Market under the symbol “CVGI.”
As of
March 11, 2019
, there were 169 holders of record of our outstanding common stock.
We have not declared or paid any dividends to the holders of our common stock in the past and do not anticipate paying dividends in the foreseeable future. Any future payment of dividends is within the discretion of the Board of Directors and will depend upon, among other factors, the capital requirements, operating results and financial condition of CVG. In addition, our ability to pay cash dividends is limited under the terms of the Third Amended and Restated Loan and Security Agreement and the Term Loan and Security Agreement, as described in more detail under “Management’s Discussion and Analysis - Liquidity and Capital Resources - Debt and Credit Facilities.”
The following graph compares the cumulative five-year total return to holders of CVG’s common stock to the cumulative total returns of the NASDAQ Composite Index and a Peer Group that includes a legacy group through October 31, 2016 and the new group from November 1, 2016 onward. The legacy group is Accuride Corporation, Altra Industrial Motion Corp, Core Molding Technologies, EnPro Industries, Fuel Systems Solutions, L.B. Foster Company, Modine Manufacturing, Meritor Inc. Stoneridge Inc., Titan International and Wabco Holdings. In 2016, Accuride Corporation was purchased by Crestview Partners, and Fuel Systems Solutions merged with Westport Innovations. Both members are reported as part of the legacy peer group only through 2015. The new peer group is Altra Industrial Motion Corp., American Railcar Industries Inc., ASTEC Industries Inc., Columbus McKinnon Corp., Dorman Products Inc., EnPro Industries, Federal Signal Corp., Freightcar America Inc., Gentherm Inc., L.B. Foster Company, LCI Industries, Modine Manufacturing, Shiloh Industries, Spartan Motors Inc., Standard Motor Products Inc., Stoneridge Inc., and Supreme Industries. Supreme Industries was purchased by Wabash National Corporation and is reported as part of the new peer group only through 2017. The graph assumes that the value of the investment in the Company’s common stock in the peer group and the index (including reinvestment of dividends) was $100 on December 31, 2013 and tracks it through
December 31, 2018
.
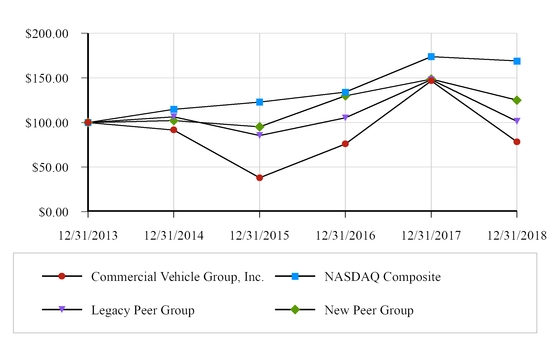
|
12/31/13
|
12/31/14
|
12/31/15
|
12/31/16
|
12/31/17
|
12/31/18
|
|||||||
|
Commercial Vehicle Group, Inc.
|
100.00
|
|
91.61
|
|
37.96
|
|
75.92
|
|
146.76
|
|
78.26
|
|
|
NASDAQ Composite
|
100.00
|
|
114.83
|
|
122.99
|
|
134.02
|
|
173.86
|
|
168.98
|
|
|
Legacy Peer Group
|
100.00
|
|
106.39
|
|
85.46
|
|
105.23
|
|
148.06
|
|
101.39
|
|
|
New Peer Group
|
100.00
|
|
102.02
|
|
95.16
|
|
129.85
|
|
148.54
|
|
124.97
|
|
The information in the graph and table above is not “solicitation material”, is not deemed “filed” with the Securities and Exchange Commission and is not to be incorporated by reference in any of our filings under the Securities Act of 1933, as amended, or the
27
Securities Exchange Act of 1934, as amended, whether made before or after the date of this annual report, except to the extent that we specifically incorporate such information by reference.
We did not repurchase any of our common stock on the open market as part of a stock repurchase program during
2018
. Our employees surrendered
158,456
shares of our common stock in
2018
to satisfy tax withholding obligations on the vesting of restricted stock awards issued under our Fourth Amended and Restated Equity Incentive Plan and the 2014 Equity Incentive Plan. The following table sets forth information in connection with purchases made by, or on behalf of, us or any affiliated purchaser, of shares of our common stock during the period ended
December 31, 2018
:
|
Total Number of
Shares (or Units) Surrendered |
Average
Price Paid per Share (or Unit) |
Total Number
of Shares (or Units) Purchased as Part of Publicly Announced Plans or Programs |
Maximum Number
(or Approximate Dollar Value) of Shares (or Units) that May Yet Be Purchased Under the Plans or Programs |
|||||||||
|
October 1, 2018 through October 31, 2018
|
158,456
|
|
$
|
7.14
|
|
—
|
|
—
|
|
|||
No other shares were surrendered during the quarter ended December 31, 2018.
Unregistered Sales of Equity Securities
We did not sell any equity securities during
2018
that were not registered under the Securities Act of 1933, as amended.
28
|
Item 6.
|
Selected Financial Data
|
The following table sets forth selected consolidated financial data regarding our business and certain industry information and should be read in conjunction with “Management’s Discussion and Analysis of Financial Condition and Results of Operations”, and our consolidated financial statements and notes thereto included elsewhere in this Annual Report on Form 10-K.
Material Events Affecting Financial Statement Comparability
There are no material events affecting financial statement comparability of our consolidated financial statements contained in Item 8 of our Annual Report on Form 10-K for the year ended
December 31, 2018
.
The table below sets forth certain operating revenues for the periods indicated (in thousands, except per share data):
|
|
Years Ended December 31,
|
||||||||||||||||||
|
|
2018
|
2017
|
2016
|
2015
|
2014
|
||||||||||||||
|
Statements of Operations Data:
|
|||||||||||||||||||
|
Revenues
|
$
|
897,737
|
|
$
|
755,231
|
|
$
|
662,112
|
|
$
|
825,341
|
|
$
|
839,743
|
|
||||
|
Cost of revenues
|
768,885
|
|
663,513
|
|
575,409
|
|
714,986
|
|
732,647
|
|
|||||||||
|
Gross profit
|
128,852
|
|
91,718
|
|
86,703
|
|
110,355
|
|
107,096
|
|
|||||||||
|
Selling, general and administrative expenses
|
60,679
|
|
59,547
|
|
60,482
|
|
71,321
|
|
72,364
|
|
|||||||||
|
Amortization expense
|
1,300
|
|
1,320
|
|
1,305
|
|
1,327
|
|
1,515
|
|
|||||||||
|
Operating income
|
66,873
|
|
30,851
|
|
24,916
|
|
37,707
|
|
33,217
|
|
|||||||||
|
Other income
|
1,311
|
|
1,943
|
|
1,236
|
|
471
|
|
261
|
|
|||||||||
|
Interest expense
|
14,676
|
|
19,149
|
|
19,318
|
|
21,359
|
|
20,716
|
|
|||||||||
|
Income before provision for income taxes
|
53,508
|
|
13,645
|
|
6,834
|
|
16,819
|
|
12,762
|
|
|||||||||
|
Provision for income taxes
|
8,996
|
|
15,350
|
|
49
|
|
9,758
|
|
5,131
|
|
|||||||||
|
Net income (loss)
|
44,512
|
|
(1,705
|
)
|
6,785
|
|
7,061
|
|
7,631
|
|
|||||||||
|
Less: Non-controlling interest in subsidiary’s income (loss)
|
—
|
|
—
|
|
—
|
|
1
|
|
1
|
|
|||||||||
|
Net income (loss) attributable to CVG stockholders
|
$
|
44,512
|
|
$
|
(1,705
|
)
|
$
|
6,785
|
|
$
|
7,060
|
|
$
|
7,630
|
|
||||
|
Income (loss) per share attributable to common stockholders:
|
|||||||||||||||||||
|
Basic
|
$
|
1.47
|
|
$
|
(0.06
|
)
|
$
|
0.23
|
|
$
|
0.24
|
|
$
|
0.26
|
|
||||
|
Diluted
|
$
|
1.46
|
|
$
|
(0.06
|
)
|
$
|
0.23
|
|
$
|
0.24
|
|
$
|
0.26
|
|
||||
|
Weighted average common shares outstanding:
|
|||||||||||||||||||
|
Basic
|
30,277
|
|
29,942
|
|
29,530
|
|
29,209
|
|
28,926
|
|
|||||||||
|
Diluted
|
30,587
|
|
29,942
|
|
29,878
|
|
29,399
|
|
29,117
|
|
|||||||||
29
|
|
Years Ended December 31,
|
||||||||||||||||||
|
|
2018
|
2017
|
2016
|
2015
|
2014
|
||||||||||||||
|
Balance Sheet Data (at end of each period):
|
|||||||||||||||||||
|
Working capital (current assets less current liabilities)
|
$
|
182,008
|
|
$
|
150,903
|
|
$
|
202,693
|
|
$
|
193,424
|
|
$
|
192,618
|
|
||||
|
Total assets
|
418,130
|
|
384,388
|
|
428,765
|
|
436,679
|
|
442,927
|
|
|||||||||
|
Total liabilities, excluding debt
|
139,334
|
|
142,697
|
|
127,921
|
|
133,112
|
|
133,177
|
|
|||||||||
|
Total debt, net of prepaid debt financing costs and discount
|
163,758
|
|
166,949
|
|
233,154
|
|
235,000
|
|
250,000
|
|
|||||||||
|
Total CVG stockholders’ equity
|
115,038
|
|
74,742
|
|
67,690
|
|
65,930
|
|
58,801
|
|
|||||||||
|
Total non-controlling interest
|
—
|
|
—
|
|
—
|
|
—
|
|
35
|
|
|||||||||
|
Total stockholders’ equity
|
115,038
|
|
74,742
|
|
67,690
|
|
65,930
|
|
58,836
|
|
|||||||||
|
Other Data:
|
|||||||||||||||||||
|
Net cash provided by (used in):
|
|||||||||||||||||||
|
Operating activities
|
$
|
40,992
|
|
$
|
2,257
|
|
$
|
49,365
|
|
$
|
55,299
|
|
$
|
9,519
|
|
||||
|
Investing activities
|
(14,101
|
)
|
(10,776
|
)
|
(8,903
|
)
|
(14,506
|
)
|
(12,289
|
)
|
|||||||||
|
Financing activities
|
(5,835
|
)
|
(72,848
|
)
|
(714
|
)
|
(16,008
|
)
|
514
|
|
|||||||||
|
Depreciation and amortization
|
15,418
|
|
15,344
|
|
16,451
|
|
17,710
|
|
18,247
|
|
|||||||||
|
Capital expenditures
|
14,550
|
|
13,567
|
|
11,917
|
|
15,590
|
|
14,568
|
|
|||||||||
|
North American Class 8 Production (units)
1
|
324,000
|
|
256,000
|
|
228,000
|
|
323,000
|
|
297,000
|
|
|||||||||
|
North America Class 5-7 Production (units)
1
|
272,000
|
|
249,000
|
|
233,000
|
|
237,000
|
|
226,000
|
|
|||||||||
|
(1)
|
Source:
ACT
(February 2019).
|
30
|
Item 7.
|
Management’s Discussion and Analysis of Financial Condition and Results of Operations
|
You should read the following discussion and analysis in conjunction with the information set forth under “Item 6 - Selected Financial Data” and our consolidated financial statements and the notes thereto included in Item 8 in this Annual Report on Form 10-K. The statements in this discussion regarding industry outlook, our long-term strategy, our expectations regarding our future performance, liquidity and capital resources and other non-historical statements in this discussion are forward-looking statements. See “Forward-Looking Information” on page ii of this Annual Report on Form 10-K. These forward-looking statements are subject to numerous risks and uncertainties, including, but not limited to, the risks and uncertainties described under “Item 1A - Risk Factors.” Our actual results may differ materially from those contained in or implied by any forward-looking statements.
31
Company Overview
Commercial Vehicle Group, Inc. (through its subsidiaries) is a leading supplier of electrical wire harnesses, seating systems, and a full range of other cab related products for the global commercial vehicle markets, including the medium- and heavy-duty truck, medium-and heavy-construction vehicle, military, bus, agriculture, specialty transportation, mining, industrial equipment and off-road recreational markets.
We have manufacturing operations in the United States, Mexico, China, United Kingdom, Czech Republic, Ukraine, Thailand, India and Australia. Our products are primarily sold in North America, Europe, and the Asia-Pacific region.
We are differentiated from automotive industry suppliers by our ability to manufacture low volume, customized products on a sequenced basis to meet the requirements of our customers. We believe our products are used by a majority of the North American MD/HD Truck and many medium- and heavy-duty construction vehicle original equipment manufacturers (“OEMs”), and to a lesser extent other makers of industrial equipment.
In February 2019, the Company announced a strategic reorganization of its operations into two reportable segments, the Electrical Systems Segment and the Global Seating Segment. The Electrical Systems Segment, includes electrical wire harnesses and panel assemblies, trim systems and components ("Trim"), cab structures and sleeper boxes, mirrors, wipers and controls. The Global Seating Segment, includes seats and seating systems ("Seats"), office seating, and aftermarket seats and components. This reorganization will allow the Company to better focus its business along product lines, as opposed to end markets, which the Company believes will enhance the effectiveness of seeking out growth opportunities and shareholder value. With respect to the Electrical Systems segment, we believe there may be opportunities to realize certain synergies amongst the products in this segment, especially with respect to electrical wire harnesses and panel assemblies, trim systems and components, and mirrors, wipers, and controls. With respect to the Seating Segment, we believe combining the seating operations would provide us opportunities to leverage resources and best practices in engineering, product development, and manufacturing, while eliminating redundancies and providing a global, more scalable platform for effective and efficient operations.
Business Overview
For the
year ended December 31, 2018
, approximately 46% of our revenue was generated from sales to North American MD/HD Truck OEMs. Our remaining revenue was primarily derived from sales to OEMs in the global construction equipment market, aftermarket, OE service organizations, military market and other specialty markets.
Demand for our products is driven to a significant degree by preferences of the end-user of the vehicle, particularly with respect to heavy-duty trucks. Unlike the automotive industry, heavy-duty truck OEMs generally afford the end-user the ability to specify many of the component parts that will be used to manufacture the vehicle, including a wide variety of cab interior styles and colors, brand and type of seats, type of seat fabric and color, and specific interior styling. In addition, certain of our products are only utilized in heavy-duty trucks, such as our storage systems, sleeper boxes and privacy curtains. To the extent that demand for higher content vehicles increases or decreases, our revenues and gross profit will be impacted positively or negatively.
We generally compete for new business at the beginning of the development of a new vehicle platform and upon the redesign of existing programs. New platform development generally begins one to three years before the marketing of such models by our customers. Contract durations for commercial vehicle products generally extend for the entire life of the platform. Several of the major truck makers have upgraded their truck platforms and we believe we have maintained our share of content in these platforms. We continue to pursue opportunities to expand our content.
Demand for our heavy-duty (or "Class 8") truck products is generally dependent on the number of new heavy-duty trucks manufactured in North America, which in turn is a function of general economic conditions, interest rates, changes in government regulations, consumer spending, fuel costs, freight costs, fleet operators' financial health and access to capital, used truck prices and our customers’ inventory levels. New heavy-duty truck demand has historically been cyclical and is particularly sensitive to the industrial sector of the economy, which generates a significant portion of the freight tonnage hauled by commercial vehicles. According to a February 2019 report by ACT Research, a publisher of industry market research, North American Class 8 production levels are expected to increase to 335,000 units in 2019, decrease to 243,000 units in 2020, and then increase to 317,000 units in 2023. We believe the demand for North American Class 8 vehicles in 2019 will be between 330,000 to 350,000 units. ACT Research estimated that the average age of active North American Class 8 trucks was 11.2 and 11.3 years in 2018 and 2017, respectively. As vehicles age, their maintenance costs typically increase. ACT Research forecasts that the vehicle age will decline as aging fleets are replaced.
North American medium-duty (or "Class 5-7") truck production steadily increased from
233,000
units in 2016 to
272,000
units in 2018. We believe the demand for Class 5-7 vehicles in 2019 will be stable. According to a February 2019 report by ACT Research, North American Class 5-7 truck production is expected to gradually increase to 280,000 units in 2023.
32
Demand for our construction and agricultural equipment products is dependent on vehicle production. Demand for new vehicles in the global construction and agricultural equipment market generally follows certain economic conditions around the world. Our products are primarily used in the medium- and heavy-duty construction equipment markets (vehicles weighing over 12 metric tons). Demand in the medium- and heavy-duty construction equipment market is typically related to the level of large scale infrastructure development projects such as highways, dams, harbors, hospitals, airports and industrial development, as well as activity in the mining, forestry and commodities industries. We believe the construction markets we serve in Europe, Asia, and North America have improved.
Our Long-term Strategy
Our long-term strategy is to grow revenue by product, geography and end market. Our products include electrical wire harnesses assemblies; Trim; mirrors, wipers and controls; cab structures and sleeper boxes; and Seats. We intend to allocate resources consistent with our strategy; more specifically, consistent with our product portfolio, geographic region and end market diversification objectives. We periodically evaluate our long-term strategy in response to significant changes in our business environment and other factors.
As part of our long-term strategy, we have considered and will consider acquisitions and divestitures to enhance our return to our shareholders and our service to customers.
Recently Issued Accounting Pronouncements
Recently issued accounting pronouncements described in Note 2 of the Consolidated Financial Statements is incorporated in this section by reference.
Consolidated Results of Operations
The table below sets forth certain operating data expressed as a percentage of revenues for the periods indicated (dollars are in thousands):
|
|
2018
|
2017
|
2016
|
|||||||||||||||||
|
Revenues
|
$
|
897,737
|
|
100.0
|
%
|
$
|
755,231
|
|
100.0
|
%
|
$
|
662,112
|
|
100.0
|
%
|
|||||
|
Cost of revenues
|
768,885
|
|
85.6
|
|
663,513
|
|
87.9
|
|
575,409
|
|
86.9
|
|
||||||||
|
Gross profit
|
128,852
|
|
14.4
|
|
91,718
|
|
12.1
|
|
86,703
|
|
13.1
|
|
||||||||
|
Selling, general and administrative expenses
|
60,679
|
|
6.8
|
|
59,547
|
|
7.9
|
|
60,482
|
|
9.1
|
|
||||||||
|
Amortization expense
|
1,300
|
|
0.1
|
|
1,320
|
|
0.2
|
|
1,305
|
|
0.2
|
|
||||||||
|
Operating income
|
66,873
|
|
7.4
|
|
30,851
|
|
4.1
|
|
24,916
|
|
3.8
|
|
||||||||
|
Other income
|
1,311
|
|
0.1
|
|
1,943
|
|
(0.1
|
)
|
1,236
|
|
(0.1
|
)
|
||||||||
|
Interest expense
|
14,676
|
|
1.6
|
|
19,149
|
|
2.5
|
|
19,318
|
|
2.9
|
|
||||||||
|
Income before provision for income taxes
|
53,508
|
|
6.0
|
|
13,645
|
|
1.8
|
|
6,834
|
|
1.0
|
|
||||||||
|
Provision for income taxes
|
8,996
|
|
1.0
|
|
15,350
|
|
2.0
|
|
49
|
|
—
|
|
||||||||
|
Net income (loss)
|
$
|
44,512
|
|
5.0
|
%
|
$
|
(1,705
|
)
|
(0.2
|
)%
|
$
|
6,785
|
|
1.0
|
%
|
|||||
Year Ended December 31, 2018
Compared to
Year Ended December 31, 2017
C
ONSOLIDATED
R
ESULTS
The table below sets forth certain consolidated operating data for the periods indicated (dollars are in thousands):
33
|
|
2018
|
2017
|
Dollar Change
|
% Change
|
||||||||||
|
Revenues
|
$
|
897,737
|
|
$
|
755,231
|
|
$
|
142,506
|
|
18.9
|
%
|
|||
|
Gross profit
|
128,852
|
|
91,718
|
|
37,134
|
|
40.5
|
|
||||||
|
Selling, general and administrative expenses
|
60,679
|
|
59,547
|
|
1,132
|
|
1.9
|
|
||||||
|
Interest expense
|
14,676
|
|
19,149
|
|
(4,473
|
)
|
(23.4
|
)
|
||||||
|
Provision for income taxes
|
8,996
|
|
15,350
|
|
(6,354
|
)
|
(41.4
|
)
|
||||||
|
Net income (loss)
|
44,512
|
|
(1,705
|
)
|
46,217
|
|
(2,710.7
|
)
|
||||||
Revenues.
The increase in revenues for the year ended December 31, 2018 compared to the year ended December 31, 2017 primarily resulted from increased heavy-duty truck production volumes in North America and an improvement in the global construction equipment markets. More specifically, the
increase
resulted from:
|
•
|
a $106.4 million, or 33%, increase in OEM North American MD/HD Truck revenues;
|
|
•
|
a $24.9 million, or 15%, increase in construction equipment revenues;
|
|
•
|
a $17.2 million, or 14%, increase in aftermarket revenues; and
|
|
•
|
a $6.0 million, or 4%, decrease in other revenues.
|
2018
revenues were favorably impacted by foreign currency exchange translation of $8.1 million, which is reflected in the change in revenue above.
Gross Profit.
The increase in gross profit is primarily attributable to an increase in sales volume. Included in gross profit is cost of revenues, which consists primarily of raw materials and purchased components for our products, wages and benefits for our employees and overhead expenses such as manufacturing supplies, facility rent and utilities costs related to our operations. Cost of revenues
increased
$105.4 million
, or
15.9%
, resulting from an
increase
in raw material and purchased component costs of $
82.5 million
, wages and benefits of $
9.7 million
and overhead expenses of $
13.2 million
. Commodity and other material inflationary pressures and difficult labor markets adversely affected cost of revenues. Cost control and cost recovery initiatives, including pricing adjustments, reduced the impact of these cost pressures on gross profit. Also benefiting gross profit was the completion of facility restructuring in late 2017. The year ended December 31, 2017 included costs of approximately $10.0 million arising from a labor shortage in our North American wire harness business and $1.9 million in charges relating to facility restructuring and related costs. There were no facility restructuring and related costs in 2018. As a percentage of revenues, gross profit was
14.4%
for the
year ended December 31, 2018
compared to
12.1%
for the
year ended December 31, 2017
.
Selling, General and Administrative Expenses.
Selling, general and administrative expenses consist primarily of wages and benefits and other overhead expenses such as marketing, travel, legal, audit, rent and utilities costs, which are not directly or indirectly associated with the manufacturing of our products. Selling, general and administrative expenses increased modestly notwithstanding increased heavy-duty production volumes in North America and improvement in the global construction markets, reflecting a focus on cost discipline. The year ended December 31, 2017 includes $2.4 million of litigation settlement costs.
Interest Expense.
The decrease is the result of less outstanding debt and the favorable impact of the mark-to-market of the interest rate swap agreement due to rising interest rates. Included in interest expense for the
year ended December 31, 2017
is a non-cash write-off of deferred financing fees of $1.6 million and interest of $1.5 million paid to bondholders during the 30-day notification period associated with the redemption of the 7.875% notes in 2017.
Provision for Income Taxes.
The decrease in the tax provision is primarily attributable to $11.2 million in non-recurring tax expense recorded during the year ended December 31, 2017 for the impact of the Tax Cuts and Jobs Act of 2017 (“U.S. Tax Reform”). The $11.2 million tax provision consisted of $7.2 million tax expense associated with the decrease in value of the Company’s deferred tax assets resulting from the reduced 21% U.S. corporate income tax rate and $4.0 million tax expense estimated for the deemed repatriation of accumulated untaxed earnings of the Company’s foreign subsidiaries. Moreover, results for the year ended December 31, 2018 include a $4.2 million tax benefit recorded as an adjustment to the $4.0 million provisional tax expense accrued during the year ended December 31, 2017 for the estimated impact of the deemed repatriation of accumulated untaxed earnings of the Company’s foreign subsidiaries. The $4.2 million tax benefit is primarily attributable to foreign tax credits that were generated as a result of the deemed repatriation of accumulated untaxed earnings of the Company's foreign subsidiaries which were not provided for in the provisional $4.0 million tax expense recorded during the year ended December 31, 2017 due to the lack of regulatory guidance on how certain provisions of the U.S. Tax Reform should be implemented.
Excluding the non-recurring impact of the U.S. Tax Reform, our provision for income taxes would have been $13.2 million for the year ended December 31, 2018 compared to $4.2 million for the year ended December 31, 2017. The year over year change
34
in tax provision, excluding the impact of the U.S. Tax Reform, was primarily attributable to the increase in worldwide pre-tax earnings during the year ended December 31, 2018 and unfavorable impact of the new Global Intangible Low-Taxed Income (“GILTI”) rules enacted under the U.S. Tax Reform. For additional information regarding the income tax provision refer to Note 9 to our consolidated financial statements in Item 8 in this Annual Report on Form 10-K.
S
EGMENT
R
ESULTS
In the quarter ended December 31, 2018, we completed a strategic reorganization of our operations into two business segments, Electrical Systems and Global Seating. As a result of the strategic reorganization, we restated prior period segment information to conform to the current period segment presentation. See Note 10 of the Consolidated Financial Statements for more information.
Electrical Systems Segment Results
The table below sets forth certain Electrical Systems Segment operating data for the periods indicated (dollars are in thousands):
|
|
2018
|
2017
|
Dollar Change
|
% Change
|
||||||||||
|
Revenues
|
$
|
512,754
|
|
$
|
434,398
|
|
$
|
78,356
|
|
18.0
|
%
|
|||
|
Gross profit
|
75,184
|
|
52,011
|
|
23,173
|
|
44.6
|
|
||||||
|
Selling, general & administrative expenses
|
15,390
|
|
15,757
|
|
(367
|
)
|
(2.3
|
)
|
||||||
|
Operating income
|
59,047
|
|
35,508
|
|
23,539
|
|
66.3
|
|
||||||
Revenues.
The
increase
in Electrical Systems Segment 2018 revenues is primarily a result of:
|
•
|
a $63.0 million, or 33%, increase in OEM North American MD/HD Truck revenues;
|
|
•
|
a $11.0 million, or 13%, increase in OEM construction equipment revenues;
|
|
•
|
a $10.0 million, or 23%, increase in aftermarket revenues;
|
|
•
|
a $3.6 million, or 4%, increase in other revenue; and
|
|
•
|
a $9.2 million, or 41%, decrease in OEM recreational and specialty revenues.
|
Electrical Systems Segment
2018
revenues were favorably impacted by foreign currency exchange translation of $4.5 million, which is reflected in the changes in revenue above.
Gross Profit.
The
increase
in gross profit was primarily the result of the increase in sales volume. Included in gross profit is cost of revenues, which
increased
$55.2 million
, or
14.4%
, as a result of an
increase
in raw material and purchased component costs of $
44.4 million
, wages and benefits of $
4.9 million
and overhead expenses of $
5.9 million
. Commodity and other material inflationary pressures and difficult labor markets adversely affected cost of revenues. Cost control and cost recovery initiatives, including pricing adjustments, reduced the impact of these cost pressures on gross profit. The year ended December 31, 2017, included costs of approximately $10.0 million arising from a labor shortage in our North American wire harness business. Also benefiting gross profit was the completion of facility restructuring in late 2017 which included $1.8 million in charges relating to facility restructuring and related costs. There were no facility restructuring and related costs in 2018. As a percentage of revenues, gross profit for the
year ended December 31, 2018
was
14.7%
compared to
12.0%
for the
year ended December 31, 2017
.
Selling, General and Administrative Expenses.
Electrical Systems Segment selling, general and administrative expenses
decreased
modestly in 2018 compared to 2017, notwithstanding the increase in revenues, reflecting a focus on cost discipline.
Global Seating Segment Results
The table below sets forth certain Global Seating Segment operating data for the periods indicated (dollars are in thousands):
|
|
2018
|
2017
|
Dollar Change
|
% Change
|
||||||||||
|
Revenues
|
$
|
397,501
|
|
$
|
329,516
|
|
$
|
67,985
|
|
20.6
|
%
|
|||
|
Gross profit
|
54,231
|
|
40,722
|
|
13,509
|
|
33.2
|
|
||||||
|
Selling, general & administrative expenses
|
22,433
|
|
21,585
|
|
848
|
|
3.9
|
|
||||||
|
Operating income
|
31,245
|
|
18,563
|
|
12,682
|
|
68.3
|
|
||||||
Revenues.
The
increase
in Global Seating Segment 2018 revenues is primarily a result of:
35
|
•
|
a $43.4 million, or 34%, increase in OEM North American MD/HD Truck revenues;
|
|
•
|
a $13.9 million, or 17%, increase in OEM construction equipment revenues;
|
|
•
|
a $7.2 million, or 9%, increase in aftermarket revenues; and
|
•
a $3.5 million, or 9%, increase in revenues other revenues.
Global Seating Segment
2018
revenues were favorably impacted by foreign currency exchange translation of $3.6 million, which is reflected in the changes in revenue above.
Gross Profit.
The
increase
in gross profit was primarily attributable to the increase in sales volume. Included in gross profit is cost of revenues, which
increased
$54.5 million
, or
18.9%
, as a result of an
increase
in raw material and purchased component costs of $
41.9 million
, wages and benefits of $
4.8 million
and overhead expenses of $
7.7 million
. Commodity and other material inflationary pressures and difficult labor markets adversely affected cost of revenues. Cost control and cost recovery initiatives, including pricing adjustments, reduced the impact of these cost pressures on gross profit. As a percentage of revenues, gross profit was
13.6%
for the
year ended December 31, 2018
compared to
12.4%
for the
year ended December 31, 2017
.
Selling, General and Administrative Expenses.
Global Seating Segment selling, general and administrative expenses increased modestly in 2018 compared to 2017, notwithstanding the increase in revenues, reflecting a focus on cost discipline.
Year Ended December 31, 2017
Compared to
Year Ended December 31, 2016
Consolidated Results
The table below sets forth certain consolidated operating data for the periods indicated (dollars are in thousands):
|
2017
|
2016
|
Dollar Change
|
% Change
|
|||||||||||
|
Revenues
|
$
|
755,231
|
|
$
|
662,112
|
|
$
|
93,119
|
|
14.1
|
%
|
|||
|
Gross profit
|
91,718
|
|
86,703
|
|
5,015
|
|
5.8
|
|
||||||
|
Selling, general & administrative expenses
|
59,547
|
|
60,482
|
|
(935
|
)
|
(1.5
|
)
|
||||||
|
Interest expense
|
19,149
|
|
19,318
|
|
(169
|
)
|
(0.9
|
)
|
||||||
|
Provision for income taxes
|
15,350
|
|
49
|
|
15,301
|
|
31,226.5
|
|
||||||
|
Net (loss) income
|
(1,705
|
)
|
6,785
|
|
(8,490
|
)
|
(125.1
|
)
|
||||||
Revenues.
The increase in consolidated revenues for the year ended December 31, 2017 compared to the year ended December 31, 2016 primarily resulted from increased heavy-duty truck production volumes in North America and an improvement in the global construction equipment markets. More specifically, the increase resulted from:
|
•
|
a $41.6 million, or 15%, increase in OEM North American MD/HD Truck revenues;
|
|
•
|
a $40.9 million, or 32%, increase in construction equipment revenues;
|
|
•
|
a $4.6 million, or 4%, increase in aftermarket revenues; and
|
|
•
|
a $6.0 million, or 4%, increase in other revenues.
|
2017
revenues were favorably impacted by foreign currency exchange translation of $0.5 million, which is reflected in the change in revenue above.
Gross Profit.
The increase in gross profit is attributable to the increase in sales volume. Cost of revenues
increased
$88.1 million
, or
15.3%
, resulting from an increase in raw material and purchased component costs of $60.6 million, wages and benefits of $12.1 million and overhead expenses of $15.4 million. Commodity and other material inflationary pressures and difficult labor markets adversely affected cost of revenues. The labor shortage in our North American wire harness business adversely impacted cost of revenue by approximately $10 million in 2017. Additionally, 2017 results included $1.9 million in charges relating to facility restructuring and related costs compared to $3.4 million in the prior year period. As a percentage of revenues, gross profit was 12.1% for the year ended December 31, 2017 compared to 13.1% for the year ended December 31, 2016.
Selling, General and Administrative Expenses.
The decrease in selling, general and administrative expenses, notwithstanding the increase in revenues, reflects the benefit of cost reduction and restructuring initiatives announced in late 2015 partially offset by
36
$2.4 million of litigation settlement costs for the year ended December 31, 2017. In addition, the year ended December 31, 2016 included a $0.6 million impairment of an asset held for sale.
Interest Expense.
Included in interest expense for the year ended December 31, 2017 is a non-cash write-off of deferred financing fees of $1.6 million and interest paid of $1.5 million to bondholders during the 30-day notification period associated with the redemption of the 7.875% notes in 2017. These expenses were offset by lower interest expense resulting from less outstanding debt.
Provision for Income Taxes.
Our provision for income taxes was $15.4 million for the year ended December 31, 2017 compared to $49 thousand for the year ended December 31, 2016. Results for the year ended December 31, 2017 were unfavorably impacted by an estimated $11.2 million attributable to the passage of the U.S. Tax Reform. This includes a $7.2 million provision for the decrease in value of our net deferred tax assets due to a reduction of the U.S. corporate tax rate from 35% to 21% effective January 1, 2018, and a $4.0 million provision related to the deemed repatriation of accumulated untaxed earnings of certain foreign subsidiaries.
Electrical Systems Segment Results
The table below sets forth certain Electrical Systems Segment operating data for the periods indicated (dollars are in thousands):
|
|
2017
|
2016
|
Dollar Change
|
% Change
|
|||||||||
|
Revenues
|
$
|
434,398
|
|
$
|
376,061
|
|
58,337
|
|
15.5
|
%
|
|||
|
Gross profit
|
52,011
|
|
54,611
|
|
(2,600
|
)
|
(4.8
|
)
|
|||||
|
Selling, general & administrative expenses
|
15,757
|
|
17,443
|
|
(1,686
|
)
|
(9.7
|
)
|
|||||
|
Operating income
|
35,508
|
|
36,422
|
|
(914
|
)
|
(2.5
|
)
|
|||||
Revenues.
The
increase
in Electrical Systems Segment revenues in 2017 compared to 2016 is primarily a result of:
|
•
|
a $25.6 million, or 42%, increase in OEM construction equipment revenues;
|
|
•
|
a $25.6 million, or 16%, increase in OEM North American MD/HD Truck revenues; and
|
|
•
|
a $7.1 million, or 5%, increase in revenues from other markets.
|
Electrical Systems Segment
2017
revenues were favorably impacted by foreign currency exchange translation of $2.5 million, which is reflected in the changes in revenue above.
Gross Profit.
The decrease in gross profit is attributable to the NA Footprint Adjustment. If not for the NA Footprint Adjustment, gross profit would have increased as a result of the increased sales volume. Included in gross profit is cost of revenues, which increased $60.9 million, or 18.9%, as a result of an increase in raw material and purchased component parts of $43.7 million, wages and benefits of $7.7 million and overhead expenses of $9.5 million. Commodity and other material inflationary pressures and difficult labor markets adversely affected cost of revenues. Additionally,
2017
results included $1.8 million in charges relating to facility restructuring costs compared to $2.5 million in the prior year period. As a percentage of revenues, gross profit was
12.0%
for the
year ended December 31, 2017
compared to
14.5%
for the
year ended December 31, 2016
.
Selling, General and Administrative Expenses.
Electrical Systems Segment selling, general and administrative expenses decreased in 2017 compared to 2016, notwithstanding the increase in revenues, reflecting a focus on cost discipline.
Global Seating Segment Results
The table below sets forth certain Global Seating Segment operating data for the periods indicated (dollars are in thousands):
|
|
2017
|
2016
|
Dollar Change
|
% Change
|
|||||||||
|
Revenues
|
$
|
329,516
|
|
$
|
290,913
|
|
38,603
|
|
13.3
|
%
|
|||
|
Gross profit
|
40,722
|
|
33,090
|
|
7,632
|
|
23.1
|
|
|||||
|
Selling, general & administrative expenses
|
21,585
|
|
22,697
|
|
(1,112
|
)
|
(4.9
|
)
|
|||||
|
Operating income
|
18,563
|
|
9,834
|
|
8,729
|
|
88.8
|
|
|||||
37
Revenues.
The
increase
in Global Seating Segment revenue is primarily a result of:
|
•
|
a $16.8 million, or 26%, increase in OEM construction equipment revenues;
|
|
•
|
a $15.4 million, or 14%, increase in OEM North American MD/HD Truck revenues;
|
|
•
|
a $2.3 million, or 3%, increase in aftermarket revenues; and
|
|
•
|
a $4.1 million, or 11%, increase in revenues from various other markets.
|
Global Seating Segment
2017
revenues were adversely impacted by foreign currency exchange translation of $2.0 million, which is reflected in the changes in revenue above.
Gross Profit.
The
increase
in gross profit was primarily the result of the increase in sales volume. Included in gross profit is cost of revenues, which
increased
$31.0 million
, or
12.0%
, as a result of an increase in raw material and purchased component costs of $20.7 million, wages and benefits of $4.6 million and overhead expenses of $5.7 million. Commodity and other material inflationary pressures and difficult labor markets adversely affected cost of revenues. Additionally,
2017
results included $0.3 million in charges relating to facility restructuring and other related costs compared to $0.9 million in the prior year period. As a percentage of revenues, gross profit was
12.4%
for the
year ended December 31, 2017
compared to
11.4%
for the
year ended December 31, 2016
.
Selling, General and Administrative Expenses.
Global Seating Segment selling, general and administrative expenses
decreased
in 2017 compared to 2016, notwithstanding the increase in revenues, reflecting a focus on cost discipline.
Liquidity and Capital Resources
During the
year ended December 31, 2018
, the Company borrowed under its asset-based revolver; however, as of year end the Company did not have any outstanding borrowings. At
December 31, 2018
, the Company had liquidity of
$134 million
;
$71 million
of cash and $
63 million
availability from its asset-based revolver.
We intend to allocate resources consistent with the following priorities: (1) to provide liquidity; (2) to invest in growth; (3) to reduce debt; and (4) to return capital to our shareholders.
Cash Flows
Our primary source of liquidity during the
year ended December 31, 2018
was cash and availability under our revolving credit facility. We believe that these sources of liquidity will provide adequate funds for our working capital needs, planned capital expenditures and servicing of our debt through the next twelve months. However, no assurance can be given that this will be the case. We had no borrowings under our revolving credit facility at December 31, 2018.
For the
year ended December 31, 2018
, cash provided by operations was
$41.0 million
compared to
$2.3 million
in the
year ended December 31, 2017
and
$49.4 million
in the
year ended December 31, 2016
. The increase in cash provided by operations for the
year ended December 31, 2018
compared to
2017
was primarily due to an increase in net income. The decrease in cash provided by operations for the
year ended December 31, 2017
compared to
2016
was primarily due to an increase in the investment in working capital in 2017.
Net cash used in investing activities was
$14.1 million
for the
year ended December 31, 2018
compared to
$10.8 million
for the
year ended December 31, 2017
, and
$8.9 million
for the
year ended December 31, 2016
. The increase in cash used in investing activities for the
year ended December 31, 2018
compared to
2017
was due to a gain on the sale of a building as a part of the restructuring in 2017. The increase in cash used in investing activities for the
year ended December 31, 2017
compared to
2016
was due to an increase in capital expenditures in 2017. In
2019
, we expect capital expenditures to be in the range of $16 million to $19 million.
Net cash used in financing activities was
$5.8 million
for the
year ended December 31, 2018
compared to
$72.8 million
for the
year ended December 31, 2017
, and
$0.7 million
for the
year ended December 31, 2016
. The decrease in net cash used in financing activities for the
year ended December 31, 2018
and the increase in net cash used for financing activities for the year ended December 31, 2017 is attributable to the debt refinancing completed in the second quarter of 2017.
As of
December 31, 2018
, cash of
$48.7 million
was held by foreign subsidiaries. Historically, the Company has asserted that it would indefinitely reinvest the undistributed earnings of the Company's foreign subsidiaries to the extent a distribution thereof would result in income tax expense. The Company has now developed a plan to repatriate a portion of this cash to the U.S. to fund other initiatives. Specifically, the Company plans to repatriate approximately $16.0 million from its Chinese and Luxembourg
38
subsidiaries which resulted in a $0.5 million deferred tax liability being recorded during the year ended December 31, 2018 for the expected future income tax implications.
Debt and Credit Facilities
The debt and credit facility summaries described in Note 7 of the Consolidated Financial Statements are incorporated in this section by reference.
Contractual Obligations and Commercial Commitments
The following table reflects our contractual obligations as of
December 31, 2018
(in thousands):
|
|
Payments Due by Period
|
||||||||||||||||||
|
|
Total
|
1 Year |
2-3 Years
|
4-5 Years
|
More than
5 Years |
||||||||||||||
|
Debt obligations
|
$
|
168,438
|
|
$
|
10,252
|
|
$
|
8,750
|
|
$
|
149,436
|
|
$
|
—
|
|
||||
|
Estimated interest payments
|
57,000
|
|
14,020
|
|
26,711
|
|
16,269
|
|
—
|
|
|||||||||
|
Leasing obligations
|
29,473
|
|
7,558
|
|
12,452
|
|
6,962
|
|
2,501
|
|
|||||||||
|
Non-U.S. pension funding
|
14,653
|
|
801
|
|
1,700
|
|
1,838
|
|
10,314
|
|
|||||||||
|
Total
|
$
|
269,564
|
|
$
|
32,631
|
|
$
|
49,613
|
|
$
|
174,505
|
|
$
|
12,815
|
|
||||
We estimated future interest payments based on the effective interest rate as of
December 31, 2018
. Since
December 31, 2018
, there have been no material changes outside the ordinary course of business to our contractual obligations as set forth above.
We expect to contribute approximately
$2.3 million
to our U.S. pension plans and our other post-retirement benefit plans in
2019
.
We enter into agreements with our customers at the beginning of a given vehicle platform’s life to supply products for the entire life of that vehicle platform. These agreements generally provide for the supply of a customer’s production requirements for a particular platform, rather than for the purchase of a specific quantity of products. Additionally, we have recorded a liability of
$0.5 million
for unrecognized tax benefits as we are uncertain as to if or when this amount may be settled. The $0.5 million liability is inclusive of $0.3 million in potential penalties and interest that may become due as a result of settling the underlying uncertain tax positions. The obligations under these agreements and regulations are not reflected in the contractual obligations table above.
As of
December 31, 2018
, we were not a party to significant purchase obligations for goods or services.
Off-Balance Sheet Arrangements
We use standby letters of credit to guarantee our performance under various contracts and arrangements, principally in connection with our workers’ compensation liabilities. These letter of credit contracts are usually extended on a year-to-year basis. As of
December 31, 2018
, we had outstanding letters of credit of
$1.7 million
. We do not believe that these letters of credit will be drawn.
We currently have no non-consolidated special purpose entity arrangements.
Critical Accounting Policies and Estimates
Our consolidated financial statements are prepared in conformity with accounting principles generally accepted in the United States of America (“U.S. GAAP”). For a comprehensive discussion of our significant accounting policies, see Note 2 to our consolidated financial statements in Item 8 in this Annual Report on Form 10-K.
The preparation of our consolidated financial statements requires us to make estimates and assumptions that affect the reported amounts of assets and liabilities and disclosure of contingent assets and liabilities at the date of the financial statements and the reported amounts of revenues and expenses during the reporting period. We evaluate our estimates and assumptions on an ongoing basis, particularly relating to accounts receivable reserves, inventory reserves, goodwill, intangible and long-lived assets, income taxes, warranty reserves, litigation reserves and pension and other post-retirement benefit plans. We base our estimates on historical experience and other assumptions that we believe are reasonable under the circumstances, the results of which form the basis for making judgments about the carrying value of assets, liabilities and equity that are not readily apparent from other sources. Actual results and outcomes could differ materially from these estimates and assumptions. See Item 1A -
Risk Factors
in this Annual Report on Form 10-K for additional information regarding risk factors that may impact our estimates.
Revenue Recognition —
We recognize revenue when our performance obligation has been satisfied and control of products has been transferred to a customer, which typically occurs upon shipment. Revenue is measured based on the amount of consideration we expect to receive in exchange for the transfer of goods or services. We enter into agreements with our customers at the beginning
39
of a given vehicle platform’s life to supply products for that vehicle platform. Once we enter into such agreements, fulfillment of our requirements is our obligation for the entire production life of the platform and we have no provisions to terminate such contracts. At the time of revenue recognition, we also record estimates for provision for doubtful accounts based on historical trends and current market conditions. Management judgments and estimates must be made in estimating sales returns and allowances relating to revenue recognized in a given period.
Inventory
— Inventories are valued at the lower of first-in, first-out cost or market. Cost includes applicable material, labor and overhead. We value our finished goods inventory at a standard cost that is periodically adjusted to approximate actual cost. Inventory quantities on-hand are regularly reviewed, and where necessary, provisions for excess and obsolete inventory are recorded based primarily on our estimated production requirements driven by expected market volumes.
Income Taxes —
We recognize deferred tax assets and liabilities for the expected future tax consequences of events that have been included in our financial statements or tax returns. Deferred tax assets and liabilities are determined based on the difference between the financial statements and tax basis of assets and liabilities using enacted tax laws and rates expected to be in place when the deferred tax items are realized. We recognize tax positions initially in the financial statements when it is more likely than not the position will be sustained upon examination by the tax authorities. We provide a valuation allowance for deferred tax assets when it is more likely than not that a portion of such deferred tax assets will not be realized.
On December 22, 2017, the U.S. Tax Cuts and Jobs Act of 2017 was signed into law. The U.S. Tax Reform significantly revised the U.S. corporate income tax regime by, among other things, lowering the U.S. corporate tax rate from 35% to 21% effective January 1, 2018, establishing a quasi-territorial tax system and imposing a one-time tax on the deemed repatriation of earnings of foreign subsidiaries. The SEC issued the Staff Accounting Bulletin No. 118 ("SAB 118") to address the accounting implications of the U.S. Tax Reform. The effects of the U.S. Tax Reform are recognized upon enactment, however, SAB 118 permits a company to recognize provisional amounts when it does not have the necessary information available. The measurement period to finalize our calculations was one year from the enactment date. During the year ended December 31, 2017, the Company recorded $4.0 million tax expense for the estimated impact of the deemed repatriation of accumulated untaxed earnings of its foreign subsidiaries. After performing additional data gathering and analysis and interpreting subsequently issued guidance from the Internal Revenue Service (“IRS”), we recorded a $4.2 million tax benefit during the year ended December 31, 2018 which represented our final adjustment to the provisional $4.0 million tax expense recorded during the year ended December 31, 2017. The $4.2 million tax benefit primarily consisted of foreign tax credits the Company was able to claim as a result of the U.S. Tax Reform. Therefore, the final impact of the deemed repatriation of the accumulated untaxed earnings of the Company’s foreign subsidiaries was an income tax benefit of $0.2 million.
Pursuant to SAB 118, a company must make an accounting policy of either (1) treating taxes due on future U.S. taxable income inclusions related to Global Intangible Low-Taxed Income ("GILTI") as a current-period expense when incurred (the "period cost method") or (2) factoring such amounts into the measurement of the Company's deferred taxes (the "deferred method") during the one year measurement period. The Company has analyzed the implications of recording the implications of GILTI under the two alternatives and has decided to account for GILTI under the period cost method.
Item 7A.
Quantitative and Qualitative Disclosures About Market Risk
We are exposed to various market risks, including changes in foreign currency exchange rates and interest rates. Market risk is the potential loss arising from adverse changes in market rates and prices, such as foreign currency exchange and interest rates. We do not enter into derivatives or other financial instruments for trading or speculative purposes. We enter into financial instruments, from time to time, to manage the impact of changes in foreign currency exchange rates and interest rates and to hedge a portion of future anticipated currency transactions. The counterparties are primarily major financial institutions.
Interest Rate Risk
We manage our interest rate risk by balancing the amount of our fixed rate and variable rate debt. To manage its exposure to variable interest rates in a cost-efficient manner, the Company enters into interest rate swaps in which the Company agrees to exchange, at specified intervals, the difference between fixed and variable interest amounts calculated by reference to an agreed-upon notional principal amount. The Company entered into an interest rate swap contract to fix the interest rate on an initial aggregate amount of $80.0 million of its initial $175.0 million of variable rate debt thereby reducing exposure to interest rate changes. Interest rate changes affect the fair market value of such debt but do not impact earnings or cash flows. Conversely for variable rate debt, interest rate changes generally do not affect the fair market value of such debt, but do impact future earnings and cash flows, assuming other factors are held constant. The interest on the Term Loan Facility is variable and is comprised of 1) an Applicable Margin of either (i) 5.00% for Base Rate Loans or (ii) 6.00% for LIBOR loans, and 2) LIBOR as quoted two business days prior to the commencement of an interest period provided that LIBOR at no time falls below 1.00%.
40
At
December 31, 2018
, the interest rate swap agreement was not designated as a hedging instrument; therefore, it has been marked-to-market and the fair value recorded in the Consolidated Balance Sheets with the offsetting gain or loss recorded in interest and other expense in our Consolidated Statements of Operations.
The interest rate swap agreement is more fully described in Note 4 of the Consolidated Financial Statements in Item 8 of this Annual Report on Form 10-K. The fair value of the agreement at
December 31, 2018
amounted to long-term derivative asset of
$0.7 million
, which was included in other long-term assets in our Consolidated Balance Sheets, and a current derivative asset of
$0.4 million
, which was included in other current assets in our Consolidated Balance Sheets.
Foreign Currency Risk
Foreign currency risk is the risk that we will incur economic losses due to adverse changes in foreign currency exchange rates. We use forward exchange contracts to hedge certain foreign currency transaction exposures. We estimate our projected revenues and purchases in certain foreign currencies and locations and will hedge a portion or all of the anticipated long or short position. The contracts typically run from one month up to eighteen months. To mitigate our exposure to Mexican Pesos, where we have our greatest exposure, we have entered into multiple monthly forward exchange contracts that have been designated as cash flow hedge instruments which are recorded in the Consolidated Balance Sheets at fair value. Noncash gains and losses are deferred in accumulated other comprehensive loss and recognized when settled in our Consolidated Statements of Operations. All other existing forward foreign exchange contracts have been marked-to-market and the fair value of contracts recorded in the Consolidated Balance Sheets with the offsetting noncash gain or loss recorded in our Consolidated Statements of Operations. We do not hold or issue foreign exchange options or forward contracts for trading purposes.
Outstanding foreign currency forward exchange contracts at
December 31, 2018
are more fully described in Note 4 to our consolidated financial statements in Item 8 of this Annual Report on Form 10-K. The fair value of our contracts at
December 31, 2018
amounted to a derivative asset of
$0.5 million
, which was included in other current assets in our Consolidated Balance Sheets. The fair value of our contracts at
December 31, 2017
amounted to a derivative liability of
$0.6 million
, which was included in other current liabilities in our Consolidated Balance Sheets. We have a deferred gain of
$0.5 million
which was included in accumulated other comprehensive loss in our Consolidated Balance Sheets and recognized a gain of
$0.6 million
in our Consolidated Statements of Operations.
At
December 31, 2018
and
2017
, the potential reduction in earnings from a hypothetical instantaneous 10% adverse change in quoted foreign currency spot rates applied to foreign currency sensitive instruments would have been immaterial.
Foreign Currency Transactions
A portion of our revenues during the year ended
December 31, 2018
were derived from manufacturing operations outside of the U.S. The results of operations and the financial position of our operations in these other countries are primarily measured in their respective currency and translated into U.S. Dollars. A portion of the expenses incurred in these countries is in currencies different from which revenue is generated. As discussed above, from time to time, we enter into forward exchange contracts to mitigate a portion of this currency risk. The reported income of these operations will be higher or lower depending on a weakening or strengthening of the U.S. Dollar against the respective foreign currency.
A portion of our long-term assets and liabilities at
December 31, 2018
are based in our foreign operations and are translated into U.S. Dollars at foreign currency exchange rates in effect as of the end of each period with the effect of such translation reflected as a separate component of stockholders’ equity. Accordingly, our stockholders’ investment will fluctuate depending upon the weakening or strengthening of the U.S. Dollar against the respective foreign currency. The principal currencies of exposure are the Mexican Peso, Chinese Yuan, British Pound, Euro, Czech Koruna, Australian Dollar, Japanese Yen, Indan Rupee, Thai Baht, and Ukrainian Hryvnia. Foreign currency translation favorably impacted fiscal year
2018
revenues by $8.1 million, or 1.1 percent.
Effects of Inflation
Inflation potentially affects us in two principal ways. First, any borrowings under our revolving credit facility is tied to prevailing short-term interest rates that may change as a result of inflation rates, translating into changes in interest expense. Second, general inflation can impact material purchases, labor and other costs. In many cases, we have limited ability to pass through inflation-related cost increases due to the competitive nature of the markets that we serve. Although general inflation has not had a significant impact in the past few years, the significant rise in certain commodity prices negatively impacted our margins in 2018 and 2017.
41
|
Item 8.
|
Financial Statements and Supplementary Data
|
INDEX TO CONSOLIDATED FINANCIAL STATEMENTS
Documents Filed as Part of this Annual Report on Form 10-K
|
Page
|
|
42
REPORT OF INDEPENDENT REGISTERED PUBLIC ACCOUNTING FIRM
To the Stockholders and Board of Directors
Commercial Vehicle Group, Inc.:
Opinion on the Consolidated Financial Statements
We have audited the accompanying consolidated balance sheets of Commercial Vehicle Group, Inc. and subsidiaries (the Company) as of December 31, 2018 and 2017, the related consolidated statements of operations, comprehensive income (loss), stockholders’ equity, and cash flows for each of the years in the three year period ended December 31, 2018, and the related notes and financial statement schedule II: Valuation of Qualifying Accounts (collectively, the consolidated financial statements). In our opinion, the
consolidated financial statements present fairly, in all material respects, the financial position of the Company as of December 31, 2018 and 2017, and the results of its operations and its cash flows for each of the years in the three year period ended December 31, 2018, in conformity with U.S. generally accepted accounting principles.
We also have audited, in accordance with the standards of the Public Company Accounting Oversight Board (United States) (PCAOB), the Company’s internal control over financial reporting as of December 31, 2018, based on criteria established in
Internal Control – Integrated Framework (2013)
issued by the Committee of Sponsoring Organizations of the Treadway Commission, and our report dated March 11, 2019 expressed an unqualified opinion on the effectiveness of the Company’s internal control over financial reporting.
Basis for Opinion
These consolidated financial statements are the responsibility of the Company’s management. Our responsibility is to express an opinion on these consolidated financial statements based on our audits. We are a public accounting firm registered with the PCAOB and are required to be independent with respect to the Company in accordance with the U.S. federal securities laws and the applicable rules and regulations of the Securities and Exchange Commission and the PCAOB.
We conducted our audits in accordance with the standards of the PCAOB. Those standards require that we plan and perform the audit to obtain reasonable assurance about whether the consolidated financial statements are free of material misstatement, whether due to error or fraud. Our audits included performing procedures to assess the risks of material misstatement of the consolidated financial statements, whether due to error or fraud, and performing procedures that respond to those risks. Such procedures included examining, on a test basis, evidence regarding the amounts and disclosures in the consolidated financial statements. Our audits also included evaluating the accounting principles used and significant estimates made by management, as well as evaluating the overall presentation of the consolidated financial statements. We believe that our audits provide a reasonable basis for our opinion.
/s/ KPMG LLP
We have served as the Company’s auditor since 2012.
Columbus, Ohio
March 11, 2019
43
COMMERCIAL VEHICLE GROUP, INC. AND SUBSIDIARIES
CONSOLIDATED BALANCE SHEETS
December 31, 2018
and
2017
|
2018
|
2017
|
||||||
|
|
(In thousands, except share amounts)
|
||||||
|
ASSETS
|
|||||||
|
Current Assets:
|
|||||||
|
Cash
|
$
|
70,913
|
|
$
|
52,244
|
|
|
|
Accounts receivable, net of allowances of $5,139 and $5,242, respectively
|
134,624
|
|
108,595
|
|
|||
|
Inventories
|
92,359
|
|
99,015
|
|
|||
|
Other current assets
|
16,828
|
|
14,792
|
|
|||
|
Total current assets
|
314,724
|
|
274,646
|
|
|||
|
Property, Plant and Equipment:
|
|||||||
|
Land and buildings
|
26,240
|
|
25,942
|
|
|||
|
Machinery and equipment
|
175,990
|
|
183,556
|
|
|||
|
Construction in progress
|
6,650
|
|
2,685
|
|
|||
|
Less accumulated depreciation
|
(143,781
|
)
|
(147,553
|
)
|
|||
|
Property, plant and equipment, net
|
65,099
|
|
64,630
|
|
|||
|
Goodwill
|
7,576
|
|
8,045
|
|
|||
|
Intangible assets, net of accumulated amortization of $9,568 and $8,533, respectively
|
12,800
|
|
14,548
|
|
|||
|
Deferred income taxes, net
|
15,348
|
|
20,273
|
|
|||
|
Other assets
|
2,583
|
|
2,246
|
|
|||
|
TOTAL ASSETS
|
$
|
418,130
|
|
$
|
384,388
|
|
|
|
LIABILITIES AND STOCKHOLDERS’ EQUITY
|
|||||||
|
Current Liabilities:
|
|||||||
|
Accounts payable
|
$
|
86,645
|
|
$
|
86,608
|
|
|
|
Accrued liabilities and other
|
36,969
|
|
33,944
|
|
|||
|
Current portion of long-term debt
|
9,102
|
|
3,191
|
|
|||
|
Total current liabilities
|
132,716
|
|
123,743
|
|
|||
|
Long-term debt
|
154,656
|
|
163,758
|
|
|||
|
Pension and other post-retirement liabilities
|
12,065
|
|
15,450
|
|
|||
|
Other long-term liabilities
|
3,655
|
|
6,695
|
|
|||
|
Total liabilities
|
303,092
|
|
309,646
|
|
|||
|
Commitments and contingencies (Note 11)
|
|
|
|
|
|||
|
Stockholders’ Equity:
|
|||||||
|
Preferred stock, $.01 par value (5,000,000 shares authorized; no shares issued and outstanding)
|
—
|
|
—
|
|
|||
|
Common stock, $.01 par value (60,000,000 shares authorized; 30,512,843 and 30,219,278 shares issued and outstanding, respectively);
|
318
|
|
304
|
|
|||
|
Treasury stock, at cost: 1,334,251 and 1,175,795 shares, respectively
|
(10,245
|
)
|
(9,114
|
)
|
|||
|
Additional paid-in capital
|
243,007
|
|
239,870
|
|
|||
|
Retained deficit
|
(70,571
|
)
|
(115,083
|
)
|
|||
|
Accumulated other comprehensive loss
|
(47,471
|
)
|
(41,235
|
)
|
|||
|
Total stockholders’ equity
|
115,038
|
|
74,742
|
|
|||
|
TOTAL LIABILITIES AND STOCKHOLDERS' EQUITY
|
$
|
418,130
|
|
$
|
384,388
|
|
|
The accompanying notes are an integral part of these consolidated financial statements.
44
COMMERCIAL VEHICLE GROUP, INC. AND SUBSIDIARIES
CONSOLIDATED STATEMENTS OF OPERATIONS
Years Ended December 31,
2018
,
2017
and
2016
|
2018
|
2017
|
2016
|
|||||||||
|
|
(In thousands, except per share amounts)
|
||||||||||
|
Revenues
|
$
|
897,737
|
|
$
|
755,231
|
|
$
|
662,112
|
|
||
|
Cost of revenues
|
768,885
|
|
663,513
|
|
575,409
|
|
|||||
|
Gross Profit
|
128,852
|
|
91,718
|
|
86,703
|
|
|||||
|
Selling, general and administrative expenses
|
60,679
|
|
59,547
|
|
60,482
|
|
|||||
|
Amortization expense
|
1,300
|
|
1,320
|
|
1,305
|
|
|||||
|
Operating Income
|
66,873
|
|
30,851
|
|
24,916
|
|
|||||
|
Other income
|
1,311
|
|
1,943
|
|
1,236
|
|
|||||
|
Interest expense
|
14,676
|
|
19,149
|
|
19,318
|
|
|||||
|
Income Before Provision for Income Taxes
|
53,508
|
|
13,645
|
|
6,834
|
|
|||||
|
Provision for income taxes
|
8,996
|
|
15,350
|
|
49
|
|
|||||
|
Net income (loss)
|
$
|
44,512
|
|
$
|
(1,705
|
)
|
$
|
6,785
|
|
||
|
Earnings (loss) per common share
|
|||||||||||
|
Basic
|
$
|
1.47
|
|
$
|
(0.06
|
)
|
$
|
0.23
|
|
||
|
Diluted
|
$
|
1.46
|
|
$
|
(0.06
|
)
|
$
|
0.23
|
|
||
|
Weighted average shares outstanding
|
|||||||||||
|
Basic
|
30,277
|
|
29,942
|
|
29,530
|
|
|||||
|
Diluted
|
30,587
|
|
29,942
|
|
29,878
|
|
|||||
The accompanying notes are an integral part of these consolidated financial statements.
45
COMMERCIAL VEHICLE GROUP, INC. AND SUBSIDIARIES
CONSOLIDATED STATEMENTS OF COMPREHENSIVE INCOME (LOSS)
Years Ended December 31,
2018
,
2017
and
2016
|
2018
|
2017
|
2016
|
||||||||||
|
|
(In thousands)
|
|||||||||||
|
Net income (loss)
|
$
|
44,512
|
|
$
|
(1,705
|
)
|
$
|
6,785
|
|
|||
|
Other comprehensive (loss) income:
|
||||||||||||
|
Foreign currency translation adjustments
|
(5,675
|
)
|
7,141
|
|
(3,234
|
)
|
||||||
|
Minimum pension liability, net of tax
|
(1,057
|
)
|
469
|
|
(5,957
|
)
|
||||||
|
Derivative instrument
|
496
|
|
—
|
|
—
|
|
||||||
|
Other comprehensive (loss) income
|
(6,236
|
)
|
7,610
|
|
(9,191
|
)
|
||||||
|
Comprehensive income (loss)
|
$
|
38,276
|
|
$
|
5,905
|
|
$
|
(2,406
|
)
|
|||
The accompanying notes are an integral part of these consolidated financial statements.
46
COMMERCIAL VEHICLE GROUP, INC. AND SUBSIDIARIES
CONSOLIDATED STATEMENTS OF STOCKHOLDERS’ EQUITY
Years Ended December 31,
2018
,
2017
and
2016
|
|
Common Stock
|
Treasury
Stock |
Additional
Paid-In Capital |
Retained
Deficit |
Accum.
Other Comp. Loss |
Total CVG
Stockholders’ Equity |
||||||||||||||
|
|
Shares
|
Amount
|
||||||||||||||||||
|
|
(In thousands, except share data )
|
|||||||||||||||||||
|
BALANCE - December 31, 2015
|
29,448,779
|
|
$
|
294
|
|
$
|
(7,039
|
)
|
$
|
234,760
|
|
$
|
(122,431
|
)
|
$
|
(39,654
|
)
|
$
|
65,930
|
|
|
Issuance of restricted stock
|
557,584
|
|
5
|
|
—
|
|
—
|
|
—
|
|
—
|
|
5
|
|
||||||
|
Surrender of common stock by employees
|
(135,009
|
)
|
—
|
|
(714
|
)
|
—
|
|
—
|
|
—
|
|
(714
|
)
|
||||||
|
Share-based compensation expense
|
—
|
|
—
|
|
—
|
|
2,607
|
|
—
|
|
—
|
|
2,607
|
|
||||||
|
Recognition of excess tax benefits on share-based compensation expense
|
—
|
|
—
|
|
—
|
|
—
|
|
2,268
|
|
—
|
|
2,268
|
|
||||||
|
Total comprehensive loss
|
—
|
|
—
|
|
—
|
|
—
|
|
6,785
|
|
(9,191
|
)
|
(2,406
|
)
|
||||||
|
BALANCE - December 31, 2016
|
29,871,354
|
|
$
|
299
|
|
$
|
(7,753
|
)
|
$
|
237,367
|
|
$
|
(113,378
|
)
|
$
|
(48,845
|
)
|
$
|
67,690
|
|
|
Issuance of restricted stock
|
509,306
|
|
5
|
|
—
|
|
—
|
|
—
|
|
—
|
|
5
|
|
||||||
|
Surrender of common stock by employees
|
(161,382
|
)
|
—
|
|
(1,361
|
)
|
—
|
|
—
|
|
—
|
|
(1,361
|
)
|
||||||
|
Share-based compensation expense
|
—
|
|
—
|
|
—
|
|
2,503
|
|
—
|
|
—
|
|
2,503
|
|
||||||
|
Total comprehensive income
|
—
|
|
—
|
|
—
|
|
—
|
|
(1,705
|
)
|
7,610
|
|
5,905
|
|
||||||
|
BALANCE - December 31, 2017
|
30,219,278
|
|
$
|
304
|
|
$
|
(9,114
|
)
|
$
|
239,870
|
|
$
|
(115,083
|
)
|
$
|
(41,235
|
)
|
$
|
74,742
|
|
|
Issuance of restricted stock
|
452,021
|
|
14
|
|
|
|
—
|
|
—
|
|
—
|
|
14
|
|
||||||
|
Surrender of common stock by employees
|
(158,456
|
)
|
—
|
|
(1,131
|
)
|
—
|
|
—
|
|
—
|
|
(1,131
|
)
|
||||||
|
Share-based compensation expense
|
—
|
|
—
|
|
—
|
|
3,137
|
|
—
|
|
—
|
|
3,137
|
|
||||||
|
Total comprehensive income
|
—
|
|
—
|
|
—
|
|
—
|
|
44,512
|
|
(6,236
|
)
|
38,276
|
|
||||||
|
BALANCE - December 31, 2018
|
30,512,843
|
|
$
|
318
|
|
$
|
(10,245
|
)
|
$
|
243,007
|
|
$
|
(70,571
|
)
|
$
|
(47,471
|
)
|
$
|
115,038
|
|
The accompanying notes are an integral part of these consolidated financial statements.
47
COMMERCIAL VEHICLE GROUP, INC. AND SUBSIDIARIES
CONSOLIDATED STATEMENTS OF CASH FLOWS
Years Ended December 31,
2018
,
2017
and
2016
|
2018
|
2017
|
2016
|
|||||||||
|
|
(In thousands)
|
||||||||||
|
CASH FLOWS FROM OPERATING ACTIVITIES:
|
|||||||||||
|
Net (loss) income
|
$
|
44,512
|
|
$
|
(1,705
|
)
|
$
|
6,785
|
|
||
|
Adjustments to reconcile net (loss) income to net cash provided by operating activities:
|
|||||||||||
|
Depreciation and amortization
|
15,418
|
|
15,344
|
|
16,451
|
|
|||||
|
Provision for doubtful accounts
|
7,607
|
|
5,622
|
|
5,552
|
|
|||||
|
Noncash amortization of debt financing costs
|
1,404
|
|
1,251
|
|
840
|
|
|||||
|
Shared-based compensation expense
|
3,137
|
|
2,503
|
|
2,607
|
|
|||||
|
Deferred income taxes
|
5,940
|
|
7,992
|
|
(2,525
|
)
|
|||||
|
Noncash (gain) loss on forward exchange contracts
|
(1,468
|
)
|
(726
|
)
|
603
|
|
|||||
|
Impairment of equipment held for sale
|
—
|
|
—
|
|
616
|
|
|||||
|
Change in other operating items:
|
|||||||||||
|
Accounts receivable
|
(35,674
|
)
|
(13,794
|
)
|
25,501
|
|
|||||
|
Inventories
|
4,836
|
|
(25,104
|
)
|
2,993
|
|
|||||
|
Prepaid expenses
|
(5,685
|
)
|
(814
|
)
|
(978
|
)
|
|||||
|
Accounts payable
|
1,451
|
|
23,250
|
|
(4,263
|
)
|
|||||
|
Accrued liabilities
|
2,631
|
|
(12,284
|
)
|
(1,997
|
)
|
|||||
|
Other operating activities, net
|
(3,117
|
)
|
722
|
|
(2,820
|
)
|
|||||
|
Net cash provided by operating activities
|
40,992
|
|
2,257
|
|
49,365
|
|
|||||
|
CASH FLOWS FROM INVESTING ACTIVITIES:
|
|||||||||||
|
Purchases of property, plant and equipment
|
(14,150
|
)
|
(13,458
|
)
|
(11,429
|
)
|
|||||
|
Proceeds from disposal/sale of property, plant and equipment
|
49
|
|
2,682
|
|
37
|
|
|||||
|
Proceeds from corporate-owned life insurance policies
|
—
|
|
—
|
|
2,489
|
|
|||||
|
Net cash used in investing activities
|
(14,101
|
)
|
(10,776
|
)
|
(8,903
|
)
|
|||||
|
CASH FLOWS FROM FINANCING ACTIVITIES:
|
|||||||||||
|
Borrowings of Revolving Credit Facility
|
80,500
|
|
—
|
|
—
|
|
|||||
|
Repayment of Revolving Credit Facility
|
(80,500
|
)
|
—
|
|
—
|
|
|||||
|
Borrowings of Term Loan Facility
|
—
|
|
|
175,000
|
|
—
|
|
||||
|
Repayment of Term Loan Facility principal
|
(4,375
|
)
|
|
(2,188
|
)
|
—
|
|
||||
|
Surrender of common stock by employees
|
(1,131
|
)
|
(1,361
|
)
|
(714
|
)
|
|||||
|
Redemption of Notes
|
—
|
|
(235,000
|
)
|
—
|
|
|||||
|
Prepayment charge for redemption of 7.875% Notes
|
—
|
|
(1,543
|
)
|
—
|
|
|||||
|
Payment of Term Loan Facility discount
|
—
|
|
(3,500
|
)
|
—
|
|
|||||
|
Payment of debt issuance costs
|
—
|
|
(4,256
|
)
|
—
|
|
|||||
|
Other financing activities, net
|
(329
|
)
|
—
|
|
—
|
|
|||||
|
Net cash used in financing activities
|
(5,835
|
)
|
(72,848
|
)
|
(714
|
)
|
|||||
|
EFFECT OF CURRENCY EXCHANGE RATE CHANGES ON CASH
|
(2,387
|
)
|
3,451
|
|
(1,782
|
)
|
|||||
|
NET INCREASE (DECREASE) IN CASH
|
18,669
|
|
(77,916
|
)
|
37,966
|
|
|||||
|
CASH:
|
|||||||||||
|
Beginning of period
|
52,244
|
|
130,160
|
|
92,194
|
|
|||||
|
End of period
|
$
|
70,913
|
|
$
|
52,244
|
|
$
|
130,160
|
|
||
|
SUPPLEMENTAL CASH FLOW INFORMATION:
|
|||||||||||
|
Cash paid for interest
|
$
|
14,046
|
|
$
|
18,572
|
|
$
|
18,684
|
|
||
|
Cash paid for income taxes, net
|
$
|
3,143
|
|
$
|
3,276
|
|
$
|
2,495
|
|
||
|
Unpaid purchases of property and equipment included in accounts payable
|
$
|
509
|
|
$
|
109
|
|
$
|
488
|
|
||
The accompanying notes are an integral part of these consolidated financial statements.
48
COMMERCIAL VEHICLE GROUP, INC. AND SUBSIDIARIES
NOTES TO CONSOLIDATED FINANCIAL STATEMENTS
Years Ended December 31,
2018
,
2017
and
2016
|
1.
|
Organization
|
Commercial Vehicle Group, Inc. (through its subsidiaries) is a leading supplier of electrical wire harnesses, seating systems, and a full range of other cab related products for the global commercial vehicle markets, including the medium- and heavy-duty truck, medium-and heavy-construction vehicle, military, bus, agriculture, specialty transportation, mining, industrial equipment and off-road recreational markets.
We are differentiated from automotive industry suppliers by our ability to manufacture low volume, customized products on a sequenced basis to meet the requirements of our customers. We believe our products are used by a majority of the North American MD/HD Truck and many medium- and heavy-duty construction vehicle original equipment manufacturers (“OEMs”), and to a lesser extent other makers of industrial equipment.
We have manufacturing operations in the United States, Mexico, China, United Kingdom, Czech Republic, Ukraine, Thailand, India and Australia. Our products are primarily sold in North America, Europe, and the Asia-Pacific region.
In the quarter ended December 31, 2018, we completed a strategic reorganization of our operations into two business segments, Electrical Systems and Global Seating. The Company’s Chief Operating Decision Maker (“CODM”), its President and Chief Executive Officer, reviews financial information for these
two
reportable segments and makes decisions regarding the allocation of resources based on these segments. See Note 10 of the Notes to Consolidated Financial Statements for more information.
Unless otherwise indicated, all amounts are in thousands, except share and per share amounts.
|
2.
|
Significant Accounting Policies
|
Principles of Consolidation
- The accompanying consolidated financial statements include the accounts of our wholly-owned or controlled subsidiaries. All intercompany accounts and transactions have been eliminated in consolidation.
Use of Estimates
- The preparation of financial statements in conformity with accounting principles generally accepted in the United States of America (“U.S. GAAP”) requires management to make estimates and assumptions that affect the reported amounts of assets and liabilities and disclosure of contingent assets and liabilities at the date of the consolidated financial statements and the reported amounts of revenues and expenses during the reporting period. Significant estimates include allowance for doubtful accounts, inventory reserves, goodwill, intangible and long-lived assets, pension and other post-retirement benefits, product warranty reserves, litigation reserves, and income tax valuation allowances. Actual results may differ materially from those estimates.
Reclassifications
- Certain reclassifications to the Consolidated Statement of Operations and the Consolidated Cash Flows have been made to prior year amounts to conform to current year presentation.
Cash
- Cash consists of deposits with high credit-quality financial institutions.
Accounts Receivable
- Trade accounts receivable are stated at current value less allowances, which approximates fair value. We review our receivables on an ongoing basis to ensure that they are properly valued and collectible.
Returns and allowances are used to record estimates of returns or allowances resulting from quality, delivery, discounts or other issues affecting the value of receivables. This amount is estimated based on historical trends and current market conditions, with the offset to revenues.
The allowance for doubtful accounts is used to record the estimated risk of loss related to our customers’ inability to pay. This allowance is maintained at a level that we consider appropriate based on factors that affect collectability, such as the financial health of our customers, historical trends of charge-offs and recoveries and current economic market conditions. As we monitor our receivables, we identify customers that may have payment problems, and we adjust the allowance accordingly, with the offset to selling, general and administrative expense. Account balances are charged off against the allowance when recovery is considered remote.
49
Inventories
- Inventories are valued at the lower of first-in, first-out cost or market. Inventory quantities on-hand are regularly reviewed and when necessary provisions for excess and obsolete inventory are recorded based primarily on our estimated production requirements, taking into consideration expected market volumes and future potential use.
Property, Plant and Equipment
- Property, plant and equipment are stated at cost, net of accumulated depreciation. For financial reporting purposes, depreciation is computed using the straight-line method over the following estimated useful lives:
|
Buildings and improvements
|
15 to 40 years
|
|
Machinery and equipment
|
3 to 20 years
|
|
Tools and dies
|
3 to 7 years
|
|
Computer hardware and software
|
3 to 5 years
|
Expenditures for maintenance and repairs are charged to expense as incurred. Expenditures for major betterments and renewals that extend the useful lives of property, plant and equipment are capitalized and depreciated over the remaining useful lives of the asset. When assets are retired or sold, the cost and related accumulated depreciation are removed from the accounts and any resulting gain or loss is recognized in the results of operations. Leasehold improvements are amortized using the straight-line method over the estimated useful lives of the improvements or the term of the lease, whichever is shorter. Accelerated depreciation methods are used for tax reporting purposes. Depreciation expense for each of the years ended
December 31, 2018
,
2017
and
2016
was
$14.1 million
,
$14.0 million
and
$15.1 million
, respectively.
We review long-lived assets for recoverability whenever events or changes in circumstances indicate that carrying amounts of an asset group may not be recoverable. Our asset groups are established by determining the lowest level of cash flows available. If the estimated undiscounted cash flows are less than the carrying amounts of such assets, we recognize an impairment loss in an amount necessary to write down the assets to fair value as estimated from expected future discounted cash flows. Estimating the fair value of these assets is judgmental in nature and involves the use of significant estimates and assumptions. We base our fair value estimates on assumptions we believe to be reasonable, but that are inherently uncertain.
Revenue Recognition
- We recognize revenue when our performance obligation has been satisfied and control of products has been transferred to a customer, which typically occurs upon shipment. Revenue is measured based on the amount of consideration we expect to receive in exchange for the transfer of goods or services.
Income Taxes
- We recognize deferred tax assets and liabilities for the expected future tax consequences of events that have been included in our financial statements or tax returns. Deferred tax assets and liabilities are determined based on the difference between the financial statements and tax basis of assets and liabilities based on enacted tax laws and rates expected to be in place when the deferred tax items are realized. In assessing the realizability of deferred tax assets, we consider whether it is more likely than not that a portion of the deferred tax assets will not be realized. We provide a valuation allowance for deferred tax assets when it is more likely than not that a portion of such deferred tax assets will not be realized.
We evaluate tax positions for recognition by determining, based on the weight of available evidence, whether it is more likely than not the position will be sustained upon audit. Any interest and penalties related to our uncertain tax positions are recognized in income tax expense.
On December 22, 2017, the U.S. Tax Cuts and Jobs Act of 2017 was signed into law. The U.S. Tax Reform significantly revised the U.S. corporate income tax regime by, among other things, lowering the U.S. corporate tax rate from 35% to 21% effective January 1, 2018, establishing a quasi-territorial tax system and imposing a one-time tax on the deemed repatriation of earnings of foreign subsidiaries. The SEC issued the Staff Accounting Bulletin No. 118 to address the accounting implications of the U.S. Tax Reform. The effects of the U.S. Tax Reform are recognized upon enactment; however, SAB 118 permits the recognition of provisional amounts when the necessary information is not available. The measurement period to finalize the calculations was one year from the date of enactment. During the year ended December 31, 2017, the Company recorded
$4.0 million
tax expense for the estimated impact of the deemed repatriation of accumulated untaxed earnings of its foreign subsidiaries. After performing additional data gathering and analysis and interpreting subsequently issued guidance from the Internal Revenue Service, we recorded a
$4.2 million
tax benefit during the year ended December 31, 2018 which represented our final adjustment to the provisional
$4.0 million
tax expense recorded during the year ended December 31, 2017. The
$4.2 million
tax benefit primarily consisted of foreign tax credits the Company was able to claim as a result of the U.S. Tax Reform. Therefore, the final impact of the deemed repatriation of the accumulated untaxed earnings of the Company’s foreign subsidiaries was an income tax benefit of
$0.2 million
.
Pursuant to SAB 118, the Company must make an accounting policy of either (1) treating taxes due on future U.S. taxable income inclusions related to GILTI as a current-period expense when incurred (the "period cost method") or (2) factoring such
50
amounts into the measurement of the Company's deferred taxes (the "deferred method") during the one year measurement period. The Company has elected to account for GILTI under the period cost method.
Comprehensive Income (Loss)
- Comprehensive income (loss) reflects the change in equity of a business enterprise during a period from transactions and other events and circumstances from non-owner sources including foreign currency translation, derivative instruments and pension and other post-retirement adjustments. See Note 16 for a rollforward of activity in accumulated comprehensive loss.
Fair Value of Financial Instruments
- The fair value framework requires the categorization of assets and liabilities into three levels based upon the assumptions (i.e., inputs) used to price the assets or liabilities. Level 1 provides the most reliable measure of fair value, whereas Level 3 generally requires significant management judgment. The three levels are defined as follows:
Level 1 - Unadjusted quoted prices in active markets for identical assets and liabilities.
Level 2 - Observable inputs other than those included in Level 1. For example, quoted prices for similar assets or liabilities in active markets and inactive markets.
Level 3 - Significant unobservable inputs reflecting management’s own assumptions about the inputs used in pricing the asset or liability.
Concentrations of Credit Risk
- Financial instruments that potentially subject us to concentrations of credit risk consist primarily of accounts receivable. We sell products to various companies throughout the world in the ordinary course of business. We routinely assess the financial strength of our customers and maintain allowances for anticipated losses. As of
December 31, 2018
and
2017
, receivables from our largest customers, A.B. Volvo, Daimler Trucks, Caterpillar, Navistar, John Deere and PACCAR, represented approximately
66%
and
59%
of total receivables, respectively.
Foreign Currency Translation
- Our functional currency is the local currency. Accordingly, all assets and liabilities of our foreign subsidiaries are translated using exchange rates in effect at the end of the period; revenue and costs are translated using average exchange rates for the period. The related translation adjustments are reported in accumulated other comprehensive loss in stockholders’ equity. Translation gains and losses arising from transactions denominated in a currency other than the functional currency of the entity are included in the results of operations.
Foreign Currency Forward Exchange Contracts
- We use forward exchange contracts to hedge certain of the foreign currency transaction exposures. We estimate our projected revenues and purchases in certain foreign currencies or locations and hedge a portion of the anticipated long or short position. The contracts typically run from
one
month to
eighteen
months. All forward foreign exchange contracts that are not designated as hedging instruments have been marked-to-market and the fair value of contracts recorded in the Consolidated Balance Sheets with the offsetting non-cash gain or loss recorded in our Consolidated Statements of Operations. For forward contracts that are designated as hedging instruments, the gains and losses are recorded in accumulated other comprehensive income and (loss) and recognized in the Consolidated Statement of Operations when the contracts are settled. We do not hold or issue foreign exchange options or forward contracts for trading purposes.
Interest Rate Swap Agreement -
We use an interest rate swap agreement to fix the interest rate on variable interest debt thereby reducing exposure to interest rate changes. The interest rate swap contract was not designated as a hedging instrument; therefore, our interest rate swap contract has been marked-to-market and the fair value of the contract recorded in the Consolidated Balance Sheets with the offsetting gain or loss recorded in interest and other expense in our Consolidated Statements of Operations.
Recently Issued Accounting Pronouncements
In October 2018, the Financial Accounting Standards Board ("FASB") issued Accounting Standards Update ("ASU") No. 2018-16, "Derivatives and Hedging (Topic 815): Inclusion of the Secured Overnight Financing Rate (SOFR) Overnight Index Swap (OIS) Rate as a Benchmark Interest Rate for Hedge Accounting Purposes". ASU 2018-16 permits the use of the OIS rate based on SOFR in addition to other various rates to facilitate the transition away from LIBOR. The Company has early adopted ASU 2017-12 "Targeted Improvements to Accounting for Hedging Activities", which is effective for fiscal years beginning after December 15, 2018. The Company reported unrealized gains on its foreign currency hedges of
$0.5 million
in Accumulated Other Comprehensive Income (Loss) for the year ended December 31, 2018.
Lease Accounting Guidance
In February 2016, the FASB issued ASU No. 2016-02, "Leases (Topic 842)" followed by ASU No. 2018-11, "Leases (Topic 842): Targeted Improvements" in July 2018. ASU 2016-02 is intended to increase transparency and comparability among companies by recognizing lease assets and liabilities and disclosing key information about leasing arrangements. ASU 2016-02 is effective for fiscal years beginning after December 15, 2018.
51
In accordance with ASU 2016-02, we plan to elect not to recognize lease assets and lease liabilities for leases with a term of twelve months or less. The ASU requires a modified retrospective transition method, or a transition method option under ASU 2018-11, with the option to elect a package of practical expedients that permits the Company to: (a) not reassess whether expired or existing contracts contain leases, (b) not reassess lease classification for existing or expired leases and (c) not consider whether previously capitalized initial direct costs would be appropriate under the new standard. The Company will elect to apply the package of practical expedients.
ASU 2018-11 provides another transition method option by allowing entities to apply the new leasing standard on the date of adoption and recognizing a cumulative-effect transition adjustment to the opening balance of retained earnings in the period of adoption. The Company expects to implement the transition method option in ASU 2018-11.
The Company has evaluated the pronouncement and anticipates it will impact the presentation of our lease assets and liabilities and associated disclosures by the recognition of lease assets and liabilities that are not included in the Consolidated Balance Sheets under existing accounting guidance. Based on our evaluation, we expect to record a right of use asset of approximately
$22 million
and a lease liability of approximately
$23 million
upon adoption. The standard is not expected to have a material impact on the Company's results of operations or cash flows.
Accounting Pronouncements Implemented During the Year Ended December 31, 2018
In August 2018, the FASB issued ASU No. 2018-15, "Customer’s Accounting for Implementation Costs Incurred in a Cloud Computing Arrangement That Is a Service Contract". ASU 2018-15 aligns the capitalization of implementation costs incurred in a hosting arrangement that is a service contract consistent with the capitalization of implementation costs incurred to develop internal-use software. The Company elected to early adopt ASU 2018-15 as of the fourth quarter of 2018 on a prospective basis and did not experience a material impact as a result.
In August 2018, the FASB issued ASU No. 2018-14, "Disclosure Framework - Changes to the Disclosure Requirements for Defined Benefit Plans", which modifies disclosure requirements for employers that sponsor defined benefit pension or other postretirement benefit plans. The Company elected to early adopt this ASU 2018-14 as of December 31, 2018 and did not experience a material impact as a result.
In August 2018, the FASB issued ASU No. 2018-13, "Disclosure Framework - Changes to the Disclosure Requirements for Fair Value Measurement", which modifies disclosure requirements on fair value measurements by removing some disclosures around transfers within Level 1 and 2 assets, modifications to disclosures pertaining to investments that calculate net asset value and additional disclosures pertaining to Level 3 investments. The Company elected to early adopt ASU 2018-13 as of December 31, 2018 and did not experience a material impact as a result.
In July 2018, the FASB issued ASU No. 2018-09, "Codification Improvements", which clarified reporting of comprehensive income, extinguishment of debt when the fair value option is elected, accounting for freestanding derivatives, recognition of excess tax benefits for compensation expense, allocation of the consolidated tax provision to an acquired entity post-acquisition, offsetting of derivatives and clarifications in measurement of fair value. In accordance with ASU 2018-09, the Company adopted portions of the guidance immediately and other portions as of January 1, 2019. We were not materially impacted by the implementation of this pronouncement.
In August 2017, the FASB issued ASU No. 2017-12, "Targeted Improvements to Accounting for Hedging Activities", which simplifies hedge accounting to better align risk management activities and financial reporting for hedging relationships and clarifies the presentation of recognized gains and losses from derivatives. The Company early adopted ASU 2017-12 as of the fourth quarter of 2018. We recognized gains in Accumulated Other Comprehensive Income totaling
$0.5 million
and an asset of
$0.5 million
. We will recognize the gains and losses in Cost of Revenues as the derivatives settle. There was no material impact to the results from operations from the implementation of this pronouncement.
In May 2017, the FASB issued ASU No. 2017-09, "Compensation - Stock Compensation (Topic 718): Scope of Modification Accounting". ASU 2017-09 provides clarity of accounting for modifications of share-based awards. ASU 2017-09 is effective for fiscal years beginning after December 15, 2017. The Company did not experience a material impact on share-based compensation as a result of the implementation of this pronouncement.
In March 2017, the FASB issued ASU No. 2017-07, "Compensation - Retirement Benefits (Topic 715): Improving the Presentation of Net Periodic Pension Cost and Net Periodic Postretirement Benefit Cost". ASU 2017-07 requires employers to report service costs in the same line item as compensation costs arising from services rendered by associated employees during the period. ASU 2017-07 is effective for fiscal years beginning after December 15, 2017. The Company reclassified
$0.6 million
of pension benefit from Cost of Revenues and Selling, General and Administrative Expenses to Other Income in 2017 and
$0.5 million
in 2016 to conform with current year presentation. The Company elected to use the practical expedient which allows use of the amounts
52
disclosed in the pension and other postretirement benefit plan footnote for the prior comparative periods as the estimation basis for applying the retrospective presentation.
In January 2017, the FASB issued ASU No. 2017-01, "Business Combinations (Topic 805): Clarifying the Definition of a Business". ASU 2017-01 provides additional guidance to clarify acquisition transactions and whether they should be accounted for as an acquisition of a business or assets. ASU 2017-01 is effective for fiscal years beginning after December 15, 2017. The Company will only be impacted to the extent we execute a business combination in the future.
In August 2016, the FASB issued ASU No. 2016-15 Statement of Cash Flows (Topic 230): Classification of Certain Cash Receipts and Cash Payments, which clarified the classification of multiple issues related to the Statement of Cash Flows. The ASU specifically clarified, among other things, certain issues impacting the Company regarding the appropriate classification of insurance settlements to be consistent with the loss incurred and corporate owned life insurance policy proceeds as investing activity. To the extent ASU 2016-15 applies to the Company, (for example clarification of the classification of corporate owned life insurance policy proceeds), our presentation is consistent with the ASU. We did not experience a material impact to the presentation of the Statement of Cash Flows as a result of this implementation.
Revenue Recognition Guidance
In May 2014, the FASB issued ASU No. 2014-09, “Revenue from Contracts with Customers,” followed by a series of standards and clarifications, including: ASU No. 2016-08, "Principal Versus Agent Considerations (Reporting Revenue Gross versus Net)", ASU No. 2016-10, "Identifying Performance Obligations and Licensing" and ASU No. 2016-12, "Narrow-Scope Improvements and Practical Expedients". These ASUs supersede the revenue recognition requirements in Topic 605, Revenue Recognition, including most industry-specific revenue recognition guidance throughout the Industry Topics of the Codification.
Under previous and current guidance, we typically recognize revenue when products are shipped and control has transferred to the customer. We assessed the timing of revenue recognition in light of the customized nature of some of our products and provisions of some of our customer contracts and generally did not note an enforceable right to payment that would require us to recognize revenue prior to the product being shipped to the customer. We assessed certain pricing provisions contained in some of our customer contracts and determined they do not represent a material right to the customer. We evaluated how we account for customer owned tooling, engineering and design services, and pre-production costs and determined this accounting should not change under the new guidance. Finally, we evaluated our standard warranties and determined they did not represent a material right to the customer. We did not record a transition adjustment as a result of the implementation and there was no impact on the year ending December 31, 2018. We adopted ASC 2014-09, Revenue from Contracts with Customers, with an effective date of January 1, 2018. As a result, the Company expanded its disclosure regarding our accounting policy for revenue recognition and disaggregation of revenue as detailed in Note 3.
Income Tax Guidance
In March 2018, the FASB issued ASU No. 2018-05, "Income Taxes (Topic 740): Amendments to SEC Paragraphs Pursuant to SEC Staff Accounting Bulletin No. 118." ASU No. 2018-05 amends Topic 740 for income tax accounting implications resulting from the Tax Cuts and Jobs Act as discussed in SAB 118. ASU 2018-05, which was effective December 22, 2017, requires companies to recognize the impacts of U.S. Tax Reform in the period of enactment. SAB 118 permitted companies to recognize provisional amounts when the necessary information was not available but required such estimates to be finalized within the measurement period which was one year from the enactment date of the U.S. Tax Reform. During the year ended December 31, 2017, we recorded
$4.0 million
tax expense for the estimated impact of the one-time deemed repatriation of accumulated untaxed earnings of the Company’s foreign subsidiaries. After performing additional data gathering and analysis and interpreting subsequently issued guidance from the Internal Revenue Service (“IRS”), we recorded a
$4.2 million
tax benefit during the year ended December 31, 2018 which represented our final adjustment to the provisional
$4.0 million
tax expense recorded during the year ended December 31, 2017. The
$4.2 million
tax benefit was primarily attributable to foreign tax credits generated as a result of the one-time deemed repatriation of accumulated untaxed earnings of the Company’s foreign subsidiaries which had not been included in the above discussed provisional
$4.0 million
tax expense previously recorded due to the lack of guidance on, and uncertainty surrounding, how to implement the relevant provisions of the U.S. Tax Reform.
3. Revenue Recognition
Contractual Arrangements
Revenue is measured based on terms and considerations specified in contracts with customers. We have long-term contracts with some customers that govern overall terms and conditions accompanied by individual purchase orders that define specific order quantities and/or price. We have many customers that operate under terms outlined in purchase orders without a long-term contract. We generally do not have customer contracts with minimum order quantity requirements.
53
Amount and Timing of Revenue Recognition
The transaction price is based on the consideration to which the Company will be entitled in exchange for transferring control of a product to the customer. This is defined in a purchase order or in a separate pricing arrangement and represents the stand-alone selling price. Our payment terms vary by the type and location of our customer and the products offered. None of the Company's contracts as of
December 31, 2018
, contained a significant financing component. We typically do not have multiple performance obligations requiring us to allocate a transaction price.
We recognize revenue at the point in time when we satisfy a performance obligation by transferring control of a product to a customer, usually at a designated shipping point and in accordance with customer specifications. We make estimates for potential customer returns or adjustments based on historical experience, which reduce revenues.
Other Matters
Shipping and handling costs billed to customers are recorded in revenues and costs associated with outbound freight are generally accounted for as a fulfillment cost and are included in cost of revenues. We generally do not provide for extended warranties or material customer incentives. Our customers typically do not have a general right of return for our products.
We had outstanding customer accounts receivable, net of allowances totaling
$134.6 million
as of
December 31, 2018
and
$108.6 million
as of
December 31, 2017
. We generally do not have other assets or liabilities associated with customer contracts. In general, we do not make significant judgments or have variable consideration that impact our recognition of revenue.
Our products include electrical wire harness and panel assemblies; trim systems and components ("Trim"); cab structures and sleeper boxes; mirrors, wipers and controls; and seats and seating systems ("Seats"). We sell these products into multiple geographic regions including North America, Europe and Asia-Pacific and to multiple customer end markets including medium- and heavy-duty Truck OEMs, Bus OEMs, Construction OEMs, the aftermarket and other markets. The nature, timing and uncertainty of our recognition of revenue and associated cash flows across the varying product lines, geographic regions and customer end markets are substantially consistent. Refer to Note 10 for revenue disclosures by reportable segments.
|
4.
|
Fair Value Measurement
|
At
December 31, 2018
, our financial instruments consisted of cash, accounts receivable, accounts payable, accrued liabilities and our revolving credit facility. The carrying value of these instruments approximates fair value as a result of the short duration of such instruments or due to the variability of the interest cost associated with such instruments.
Foreign Currency Forward Exchange Contracts.
Our derivative assets and liabilities represent foreign exchange contracts that are measured at fair value using observable market inputs such as forward rates, interest rates, our own credit risk and counterparty credit risk. Based on the utilization of these inputs, the derivative assets and liabilities are classified as Level 2.
To manage our risk for Mexican Pesos, we have entered into a forward exchange contract that has been designated as a cash flow hedge instrument, which is recorded in the Consolidated Balance Sheets at fair value. The gains and losses as a result of the changes in fair value of the hedge contract is deferred in accumulated other comprehensive loss and recognized as an adjustment to Cost of Revenues in the period the related hedge contract is recognized.
Interest Rate Swap Agreement.
To manage its exposure to variable interest rates in a cost-efficient manner, the Company enters into interest rate swaps in which the Company agrees to exchange, at specified intervals, the difference between fixed and variable interest amounts calculated by reference to an agreed-upon notional principal amount. These swaps are designed to mitigate changes in the interest rate of a portion of the outstanding borrowings. The Company entered into a series of interest rate swaps to initially cover
$80 million
of its outstanding debt under the senior secured term loan facility. The Company expects these derivatives to remain effective during the remaining term of the swaps and will record the impact in interest expense in the Consolidated Statements of Operations.
The fair values of our derivative instruments measured on a recurring basis as of
December 31
and are categorized as follows:
54
|
|
2018
|
2017
|
||||||||||||||||||||||||||||||
|
|
Total
|
Level 1
|
Level 2
|
Level 3
|
Total
|
Level 1
|
Level 2
|
Level 3
|
||||||||||||||||||||||||
|
Derivative assets
|
Foreign exchange contract
1
|
$
|
496
|
|
$
|
—
|
|
$
|
496
|
|
$
|
—
|
|
$
|
20
|
|
$
|
—
|
|
$
|
20
|
|
$
|
—
|
|
|||||||
|
Interest rate swap agreement
2
|
$
|
1,131
|
|
$
|
—
|
|
$
|
1,131
|
|
$
|
—
|
|
$
|
515
|
|
$
|
—
|
|
$
|
515
|
|
$
|
—
|
|
||||||||
|
Derivative liabilities
|
Foreign exchange contract
3
|
$
|
—
|
|
$
|
—
|
|
$
|
—
|
|
$
|
—
|
|
$
|
627
|
|
$
|
—
|
|
$
|
627
|
|
$
|
—
|
|
|||||||
|
Interest rate swap agreement
4
|
$
|
—
|
|
$
|
—
|
|
$
|
—
|
|
$
|
—
|
|
$
|
246
|
|
$
|
—
|
|
$
|
246
|
|
$
|
—
|
|
||||||||
|
Derivative equity
|
Foreign exchange contract
5
|
$
|
496
|
|
$
|
—
|
|
$
|
496
|
|
$
|
—
|
|
$
|
—
|
|
$
|
—
|
|
$
|
—
|
|
$
|
—
|
|
|||||||
|
1
|
Presented in the Consolidated Balance Sheets in other current assets and based on observable market transactions of spot and forward rates.
|
|
2
|
Presented in Consolidated Balance Sheets in other assets and based on observable market transactions of forward rates.
|
|
3
|
Presented in the Consolidated Balance Sheets in accrued liabilities and other, and based on observable market transactions of spot and forward rates.
|
|
4
|
Presented in Consolidated Balance Sheets in accrued liabilities and other, and based on observable market transactions of forward rates.
|
|
5
|
Presented in Consolidated Balance Sheets in accumulated other comprehensive loss and based on observable market transactions of forward rates.
|
The following table summarizes the notional amount of our open foreign exchange contracts at
December 31
:
|
2018
|
2017
|
||||||||||||||
|
U.S. $
Equivalent |
U.S. $
Equivalent Fair Value |
U.S. $
Equivalent |
U.S. $
Equivalent Fair Value |
||||||||||||
|
Commitments to buy or sell currencies
|
$
|
22,371
|
|
$
|
22,867
|
|
$
|
17,491
|
|
$
|
16,838
|
|
|||
We consider the impact of our credit risk on the fair value of the contracts, as well as the ability to execute obligations under the contract.
The following table summarizes the effect of derivative instruments on the Consolidated Statements of Operations for derivatives not designated as hedging instruments at
December 31
:
|
2018
|
2017
|
||||||||
|
Location of Gain
Recognized in Income on Derivatives |
Amount of Gain
Recognized in Income on Derivatives |
||||||||
|
Foreign exchange contracts
|
Cost of Revenues
|
$
|
607
|
|
$
|
457
|
|
||
|
Interest rate swap agreement
|
Interest and Other Expense
|
$
|
785
|
|
$
|
269
|
|
||
Long-term Debt
. The fair value of long-term debt obligations is based on a fair value model utilizing observable inputs. Based on the use of these inputs, our long-term debt is classified as Level 2. The carrying amounts and fair values of our long-term debt at
December 31
are as follows:
|
2018
|
2017
|
||||||||||||||
|
Carrying
Amount |
Fair Value
|
Carrying
Amount |
Fair Value
|
||||||||||||
|
Term loan and security agreement
1
|
$
|
163,758
|
|
$
|
161,759
|
|
$
|
166,949
|
|
$
|
169,972
|
|
|||
|
1
|
Presented in the Consolidated Balance Sheets as the current portion of long-term debt (net of current prepaid debt financing costs of
$0.6 million
and current original issue discount of
$0.6 million
) of
$9.1 million
and long-term debt (net of long-term prepaid debt financing costs of
$1.7 million
and long-term original issue discount of
$1.8 million
) of
$154.7 million
.
|
Long-lived Assets.
There are no fair value measurements of our long-lived assets and definite-lived intangible assets measured on a non-recurring basis as of
December 31, 2018
and
December 31, 2017
.
|
5.
|
Inventories
|
55
Inventories consisted of the following as of
December 31
:
|
2018
|
2017
|
||||||
|
Raw materials
|
$
|
66,965
|
|
$
|
73,026
|
|
|
|
Work in process
|
12,333
|
|
10,136
|
|
|||
|
Finished goods
|
13,061
|
|
15,853
|
|
|||
|
$
|
92,359
|
|
$
|
99,015
|
|
||
|
6.
|
Accrued and Other Liabilities
|
Accrued and other liabilities consisted of the following as of
December 31
:
|
2018
|
2017
|
||||||
|
Compensation and benefits
|
$
|
12,893
|
|
$
|
12,904
|
|
|
|
Taxes payable
|
5,275
|
|
3,564
|
|
|||
|
Warranty costs
|
3,911
|
|
3,490
|
|
|||
|
Insurance
|
2,485
|
|
2,432
|
|
|||
|
Legal and professional fees
|
1,710
|
|
1,588
|
|
|||
|
Accrued freight
|
1,559
|
|
1,544
|
|
|||
|
Deferred tooling revenue
|
1,466
|
|
806
|
|
|||
|
Accrued services
|
1,106
|
|
1,207
|
|
|||
|
Other
|
6,564
|
|
6,409
|
|
|||
|
|
$
|
36,969
|
|
$
|
33,944
|
|
|
7. Debt
Debt consisted of the following at
December 31
:
|
2018
|
2017
|
||||||
|
Term loan and security agreement
1
|
$
|
163,758
|
|
|
$
|
166,949
|
|
|
1
|
Presented in the Consolidated Balance Sheets as the current portion of long-term debt (net of current prepaid debt financing costs of
$0.6 million
and current original issue discount of
$0.6 million
) of
$9.1 million
and long-term debt (net of long-term prepaid debt financing costs of
$1.7 million
and long-term original issue discount of $
1.8 million
) of
$154.7 million
.
|
Term Loan and Security Agreement
On April 12, 2017, the Company entered into a
$175.0 million
senior secured term loan credit facility (the “Term Loan Facility”), maturing on April 12, 2023, pursuant to a term loan and security agreement (the “TLS Agreement”) with the Company and certain subsidiaries of the Company party thereto as guarantors, Bank of America, N.A., as administrative agent, and other lender parties thereto. Concurrent with the closing of the TLS Agreement, the proceeds of the Term Loan Facility were used, together with cash on hand in the amount of
$74.0 million
, to (a) fund the redemption, satisfaction and discharge of all of the Company’s outstanding
7.875%
notes along with accrued interest; and (b) pay related transaction costs, fees and expenses. In conjunction with the redemption of the
7.875%
notes, the Company recognized a non-cash charge of
$1.6 million
in the second quarter of 2017 to write-off deferred financing fees and a charge for interest of
$1.5 million
paid to bondholders during the 30-day notification period associated with the redemption of the
7.875%
notes.
The interest on the Term Loan Facility is variable and is comprised of 1) an Applicable Margin of either (i)
5.00%
for Base Rate Loans or (ii)
6.00%
for LIBOR loans, and 2) LIBOR as quoted two business days prior to the commencement of an interest period provided that LIBOR at no time falls below
1.00%
. There was
$0.1 million
in accrued interest as of
December 31, 2018
. The unamortized deferred financing fees of
$2.3 million
and original issue discount of
$2.4 million
are netted against the aggregate book value of the outstanding debt to arrive at a balance of
$163.8 million
as of
December 31, 2018
and are being amortized over the remaining life of the agreement. The weighted average interest rate was
8.09%
as of
December 31, 2018
.
The Term Loan Facility is a senior secured obligation of the Company. Our obligations under the TLS Agreement are guaranteed by the Company and certain subsidiaries of the Company. The obligations of the Company and the guarantors under the TLS Agreement are secured (subject to certain permitted liens) by a first-priority lien on substantially all of the non-current assets (and
56
a second priority lien on substantially all of the current assets) of the Company and the guarantors, including a first priority pledge of certain capital stock of the domestic and foreign subsidiaries directly owned by the Company and the guarantors. The liens, the security interests and all of the obligations of the Company and the guarantors and all provisions regarding remedies in an event of default are subject to an intercreditor agreement among the Company, the guarantors, the agent for the lenders party to the Company’s revolving credit facility and the collateral agent under the TLS Agreement.
Terms, Covenants and Compliance Status
The TLS Agreement contains customary restrictive covenants, including limitations on our ability and the ability of our subsidiaries to: incur additional debt; pay dividends or other restricted payments; make investments; engage in transactions with affiliates; create liens on assets; and consolidate, merge or transfer all or substantially all of our assets and the assets of our subsidiaries. In addition, the TLS Agreement contains a financial maintenance covenant requiring the Company to maintain a total leverage ratio as of the last day of any fiscal quarter not to exceed the ratios set forth in the applicable table within the TLS Agreement.
The TLS Agreement also contains customary reporting and other affirmative covenants. We were in compliance with the covenants as of
December 31, 2018
.
The TLS Agreement requires the Company to repay principal of approximately
$1.1 million
on the last day of each quarter commencing with the quarter ending September 30, 2017 with the remaining outstanding principal due at maturity on April 12, 2023.
Voluntary prepayments of amounts outstanding under the TLS Agreement are permitted at any time, without premium or penalty.In addition, to the extent applicable, customary LIBOR breakage charges may be payable in connection with any prepayment.
The TLS Agreement requires the Company to make mandatory prepayments with excess cash flow, the proceeds of certain asset dispositions and upon the receipt of insurance or condemnation proceeds, and in the case of an asset disposition or insurance or condemnation event, to the extent the Company does not reinvest the proceeds within the periods set forth in the TLS Agreement.
The TLS Agreement includes customary events of default (subject in certain cases to customary grace and cure periods) which include, among others:
• nonpayment of obligations when due;
• breach of covenants or other agreements in the TLS Agreement; and
• defaults in payment of certain other indebtedness.
Revolving Credit Facility
On April 12, 2017, Commercial Vehicle Group Inc. and certain subsidiaries, collectively the "borrowers", entered into the Third Amended and Restated Loan and Security Agreement ("Third ARLS Agreement") increasing its senior secured revolving credit facility to
$65 million
from
$40 million
and setting the maturity date to April 12, 2022. Up to an aggregate of
$10.0 million
is available to the borrowers for the issuance of letters of credit, which reduces availability under the Third ARLS Agreement.
The Third ARLS Agreement included amendments to certain definitions and covenants including, but not limited to, amendments to (i) permitted debt, (ii) permitted distributions, (iii) distribution of assets, and (iv) the calculation of EBITDA. The Third ARLS Agreement contains a fixed charge coverage ratio maintenance covenant of
1.00
:1.00 and amended the availability threshold for triggering compliance with the fixed charge coverage ratio.
The borrowers’ obligations under the revolving credit facility are secured (subject to certain permitted liens) by a first-priority lien on substantially all of the current assets (and a second priority lien on substantially all of the non-current assets) of the borrowers. Each of the Company and each other borrower is jointly and severally liable for the obligations under the revolving credit facility and unconditionally guarantees the prompt payment and performance thereof. The liens, the security interests and all of the obligations of the Company and each other borrower and all provisions regarding remedies in an event of default are subject to an intercreditor agreement among the Company, certain of its subsidiaries, the agent under the Third ARLS Agreement and the collateral agent for the lenders party to the Company’s term loan credit facility.
The applicable margin is based on average daily availability under the revolving credit facility as follows:
57
|
Level
|
Average Daily
Availability
|
Domestic Base
Rate Loans
|
LIBOR
Revolver Loans
|
|||
|
III
|
≥ to $24,000,000
|
0.50%
|
1.50%
|
|||
|
II
|
> $12,000,000 but < $24,000,000
|
0.75%
|
1.75%
|
|||
|
I
|
≤ to $12,000,000
|
1.00%
|
2.00%
|
|||
The applicable margin is subject to increase or decrease by the agent on the first day of the calendar month following each fiscal quarter end. If the agent is unable to calculate average daily availability for a fiscal quarter due to the borrowers' failure to deliver a borrowing base certificate when required, the applicable margin will be set at Level I until the first day of the calendar month following receipt of a borrowing base certificate. As of
December 31, 2018
, the applicable margin was set at Level III.
The unamortized deferred financing fees associated with our revolving credit facility of
$0.7 million
and
$0.9 million
as of
December 31, 2018
and
December 31, 2017
, respectively, are being amortized over the remaining life of the agreement. As of
December 31, 2018
and
December 31, 2017
, we did not have borrowings under the revolving credit facility and had outstanding letters of credit of
$1.7 million
and
$2.1 million
, respectively. We had borrowing availability of
$63.3 million
at
December 31, 2018
.
The Company pays a commitment fee to the lenders equal to
0.25%
per annum of the unused amounts under the revolving credit facility.
Terms, Covenants and Compliance Status
The Third ARLS Agreement requires the maintenance of a minimum fixed charge coverage ratio. The borrowers are not required to comply with the fixed charge coverage ratio requirement for so long as the borrowers maintain borrowing availability under the revolving credit facility at the greater of (i)
$5,000,000
or (ii) ten percent (
10%
) of the revolving commitments. If borrowing availability falls below this threshold at any time, the borrowers would be required to comply with the fixed charge coverage ratio of
1.00
:1.00 as of the end of each relevant fiscal quarter and would be required to continue to comply with these requirements until the borrowers have borrowing availability in excess of this threshold for
60
consecutive days. Since the Company had borrowing availability in excess of this threshold from
December 31, 2017
through
December 31, 2018
, the Company was not required to comply with the minimum fixed charge coverage ratio covenant during the
year ended December 31, 2018
.
The Third ARLS Agreement contains customary restrictive covenants, including limitations on our ability and the ability of our subsidiaries to: incur additional debt; pay dividends or other restricted payments; make investments; engage in transactions with affiliates; create liens on assets; and consolidate, merge or transfer all or substantially all of our assets and the assets of our subsidiaries. The Third ARLS Agreement also contains customary reporting and other affirmative covenants. The Company was in compliance with these covenants as of
December 31, 2018
.
Voluntary prepayments of amounts outstanding under the revolving credit facility are permitted at any time, without premium or penalty, other than (to the extent applicable) customary LIBOR breakage charges.
The Third ARLS Agreement requires the borrowers to make mandatory prepayments upon the receipt of insurance or condemnation proceeds in respect of the revolving credit facility’s priority collateral.
The Third ARLS Agreement includes customary events of default (subject in certain cases to customary grace and cure periods) which include, among others:
•
nonpayment of obligations when due;
•
breach of covenants or other agreements in the Third ARLS Agreement;
•
a change of control; and
•
defaults in payment of certain other indebtedness, including the term loan credit facility.
8. Goodwill and Intangible Assets
Our intangible assets as of
December 31
were comprised of the following:
58
|
December 31, 2018
|
|||||||||||||
|
Weighted-
Average Amortization Period |
Gross
Carrying Amount |
Accumulated
Amortization |
Net
Carrying Amount |
||||||||||
|
Definite-lived intangible assets:
|
|||||||||||||
|
Trademarks/Tradenames
|
23 years
|
$
|
8,346
|
|
$
|
(3,888
|
)
|
$
|
4,458
|
|
|||
|
Customer relationships
|
15 years
|
14,022
|
|
(5,680
|
)
|
8,342
|
|
||||||
|
$
|
22,368
|
|
$
|
(9,568
|
)
|
$
|
12,800
|
|
|||||
|
December 31, 2017
|
|||||||||||||
|
Weighted-
Average Amortization Period |
Gross
Carrying Amount |
Accumulated
Amortization |
Net
Carrying Amount |
||||||||||
|
Definite-lived intangible assets:
|
|||||||||||||
|
Trademarks/Tradenames
|
23 years
|
$
|
8,472
|
|
$
|
(3,585
|
)
|
$
|
4,887
|
|
|||
|
Customer relationships
|
15 years
|
14,609
|
|
(4,948
|
)
|
9,661
|
|
||||||
|
$
|
23,081
|
|
$
|
(8,533
|
)
|
$
|
14,548
|
|
|||||
The aggregate intangible asset amortization expense was
$1.3 million
for each of the fiscal years ended
December 31, 2018
,
2017
and
2016
. Intangible assets accumulated amortization was positively impacted by foreign currency translation of
$0.3 million
for the
year ended December 31, 2018
. The estimated intangible asset amortization expense for each of the five succeeding fiscal years ending after
December 31, 2018
is
$1.3 million
per year through December 31, 2019 and
$1.2 million
in 2020 through 2023.
The changes in the carrying amounts of goodwill for the years ended
December 31
are as follows:
|
2018
|
2017
|
||||||
|
Balance - Beginning of the year
|
$
|
8,045
|
|
$
|
7,703
|
|
|
|
Currency translation adjustment
|
(469
|
)
|
342
|
|
|||
|
Balance - End of the year
|
$
|
7,576
|
|
$
|
8,045
|
|
|
|
9.
|
Income Taxes
|
Pre-tax income (loss) consisted of the following for the years ended
December 31
:
|
2018
|
2017
|
2016
|
|||||||||
|
Domestic
|
$
|
27,024
|
|
$
|
(2,093
|
)
|
$
|
(13,928
|
)
|
||
|
Foreign
|
26,484
|
|
15,738
|
|
20,762
|
|
|||||
|
Total
|
$
|
53,508
|
|
$
|
13,645
|
|
$
|
6,834
|
|
||
A reconciliation of income taxes computed at the statutory rates to the reported income tax provision for the years ended
December 31
follows:
59
|
2018
|
2017
|
2016
|
|||||||||
|
Federal provision at statutory rate
|
$
|
11,237
|
|
$
|
4,776
|
|
$
|
2,392
|
|
||
|
U.S./Foreign tax rate differential
|
731
|
|
(919
|
)
|
(1,842
|
)
|
|||||
|
Foreign non-deductible expenses
|
(1,759
|
)
|
(2,006
|
)
|
743
|
|
|||||
|
Foreign tax provision
|
1,253
|
|
615
|
|
336
|
|
|||||
|
State taxes, net of federal benefit
|
733
|
|
73
|
|
(171
|
)
|
|||||
|
State tax rate change, net of federal benefit
|
(32
|
)
|
(264
|
)
|
541
|
|
|||||
|
Change in uncertain tax positions
|
45
|
|
81
|
|
114
|
|
|||||
|
Change in valuation allowance
|
597
|
|
2,475
|
|
(1,858
|
)
|
|||||
|
Tax credits
|
(2,076
|
)
|
(152
|
)
|
(104
|
)
|
|||||
|
Share-based compensation
|
(50
|
)
|
(657
|
)
|
(108
|
)
|
|||||
|
Change in U.S. corporate tax rate
|
—
|
|
7,214
|
|
—
|
|
|||||
|
Repatriation of foreign earnings
|
(3,670
|
)
|
3,964
|
|
—
|
|
|||||
|
GILTI, net of related foreign tax credit
|
1,194
|
|
—
|
|
—
|
|
|||||
|
Other
|
793
|
|
150
|
|
6
|
|
|||||
|
Provision for income taxes
|
$
|
8,996
|
|
$
|
15,350
|
|
$
|
49
|
|
||
The provision (benefit) for income taxes for the years ended
December 31
follows:
|
2018
|
2017
|
2016
|
|||||||||||||||||||||||||||||||||
|
Current
|
Deferred
|
Total
|
Current
|
Deferred
|
Total
|
Current
|
Deferred
|
Total
|
|||||||||||||||||||||||||||
|
Federal
|
$
|
(3,432
|
)
|
$
|
5,243
|
|
$
|
1,811
|
|
$
|
2,954
|
|
$
|
7,716
|
|
$
|
10,670
|
|
$
|
(4
|
)
|
$
|
(1,801
|
)
|
$
|
(1,805
|
)
|
||||||||
|
State and local
|
123
|
|
179
|
|
302
|
|
362
|
|
(371
|
)
|
(9
|
)
|
(27
|
)
|
1,021
|
|
994
|
|
|||||||||||||||||
|
Foreign
|
6,365
|
|
518
|
|
6,883
|
|
4,042
|
|
647
|
|
4,689
|
|
2,605
|
|
(1,745
|
)
|
860
|
|
|||||||||||||||||
|
Total
|
$
|
3,056
|
|
$
|
5,940
|
|
$
|
8,996
|
|
$
|
7,358
|
|
$
|
7,992
|
|
$
|
15,350
|
|
$
|
2,574
|
|
$
|
(2,525
|
)
|
$
|
49
|
|
||||||||
A summary of deferred income tax assets and liabilities as of
December 31
follows:
60
|
2018
|
2017
|
||||||
|
Noncurrent deferred tax assets:
|
|||||||
|
Amortization and fixed assets
|
$
|
1,899
|
|
$
|
1,835
|
|
|
|
Accounts receivable
|
166
|
|
396
|
|
|||
|
Inventories
|
2,226
|
|
2,254
|
|
|||
|
Pension obligations
|
2,375
|
|
2,903
|
|
|||
|
Warranty obligations
|
827
|
|
973
|
|
|||
|
Accrued benefits
|
382
|
|
787
|
|
|||
|
Foreign exchange contracts
|
(367
|
)
|
89
|
|
|||
|
Restricted stock
|
106
|
|
73
|
|
|||
|
Tax credits carryforwards
|
3,784
|
|
1,611
|
|
|||
|
Net operating loss carryforwards
|
16,801
|
|
24,784
|
|
|||
|
Other temporary differences not currently available for tax purposes
|
1,814
|
|
(411
|
)
|
|||
|
Total noncurrent deferred tax assets
|
$
|
30,013
|
|
$
|
35,294
|
|
|
|
Valuation allowance
|
(14,665
|
)
|
(15,021
|
)
|
|||
|
Net noncurrent deferred tax assets
|
$
|
15,348
|
|
$
|
20,273
|
|
|
|
Noncurrent deferred tax liabilities:
|
|||||||
|
Amortization and fixed assets
|
$
|
(2,960
|
)
|
$
|
(100
|
)
|
|
|
Net operating loss carryforwards
|
2,272
|
|
—
|
|
|||
|
Other temporary differences not currently available for tax purposes
|
(106
|
)
|
60
|
|
|||
|
Total noncurrent tax liabilities
|
(794
|
)
|
(40
|
)
|
|||
|
Total net deferred tax asset
|
$
|
14,554
|
|
$
|
20,233
|
|
|
Our overall deferred tax position was a net deferred tax asset of
$14.6 million
.
During the year ended December 31, 2017, the Company recorded
$11.2 million
in non-recurring tax expense for the estimated impact of the U.S. Tax Reform. The
$11.2 million
tax provision consisted of
$7.2 million
tax expense associated with the decrease in the value of the Company’s deferred tax assets resulting from the reduced 21% U.S. corporate income tax rate and
$4.0 million
tax expense estimated for the deemed repatriation of accumulated untaxed earnings of the Company’s foreign subsidiaries. Pursuant to SAB 118, the Company was granted a one year period from the December 22, 2017 enactment date of the U.S. Tax Reform to finalize its assessment of provisional estimates related to the U.S. Tax Reform. After performing additional data gathering and analysis and interpreting subsequently issued guidance from the IRS, the Company finalized its assessment and recorded a
$4.2 million
tax benefit during the year ended December 31, 2018 which represented the Company's final adjustment to the provisional
$4.0 million
tax expense recorded during the year ended December 31, 2017 for the impact of the one-time deemed repatriation of accumulated untaxed earnings of the Company’s foreign subsidiaries.
We assess whether valuation allowances should be established against deferred tax assets based on consideration of all available evidence using a “more likely than not” standard. This assessment considers, among other matters, the nature, frequency and severity of recent losses, forecasts of future profitability, the duration of statutory carryforward periods, our experience with unused tax attributes expiring and tax planning alternatives. In making such judgments, significant weight is given to evidence that can be objectively verified.
During 2018, we recorded additional valuation allowance of
$0.9 million
on the deferred tax assets of our Luxembourg subsidiaries and released
$1.2 million
in valuation allowances related to the deferred tax assets of our United Kingdom subsidiary and certain U.S. state tax net operating loss carryforwards. We expect to be able to realize the benefits of all of our deferred tax assets that are not currently offset by a valuation allowance, as discussed above. In the event that our actual results differ from our estimates or we adjust these estimates in future periods, the effects of these adjustments could materially impact our financial position and results of operations.
As of
December 31, 2018
, the Company had net operating loss carryforwards of
$130.1 million
, of which
$71.0 million
related to foreign jurisdictions and
$59.1 million
related to U.S. state jurisdictions. The carryforward periods for these net operating losses range from five years to indefinite. Utilization of these losses is subject to the tax laws of the applicable tax jurisdiction and may be limited by the ability of certain subsidiaries to generate taxable income in the associated tax jurisdiction. We have established valuation allowances for all net operating losses that we believe are more likely than not to expire before they can be utilized.
61
As of December 31, 2018, we had
$1.6 million
of U.S. foreign tax credits carried forward primarily attributable to the deemed repatriation of the accumulated untaxed earnings of our foreign subsidiaries resulting from the U.S. Tax Reform. Utilization of these credits may be limited if the Company does not continue to generate U.S. federal taxable income in future years; the credits begin to expire in 2027.
As of
December 31, 2018
, we had
$1.8 million
of research and development tax credits being carried forward related to our U.S. operations. Utilization of these credits may be limited if the Company does not continue to generate U.S. federal taxable income in future years; the credits will expire between
2026
and
2038
.
As of
December 31, 2018
, cash of
$48.7 million
was held by foreign subsidiaries. Historically, the Company has asserted that it would indefinitely reinvest the undistributed earnings of the Company's foreign subsidiaries to the extent a distribution thereof would result in income tax expense. The Company has now developed a plan to repatriate a portion of this cash to the U.S. to fund other initiatives. Specifically, the Company plans to repatriate approximately
$16.0 million
from its Chinese and Luxembourg subsidiaries which resulted in a
$0.5 million
deferred tax liability being recording during the year ended December 31, 2018 for the expected future income tax implications.
We file federal income tax returns in the U.S. and income tax returns in various states and foreign jurisdictions. In the U.S., we are generally no longer subject to tax assessment for tax years prior to 2014. In our major non-U.S. jurisdictions including China, Czech Republic, Mexico and the United Kingdom, tax years are typically subject to examination for three to five years.
As of December 31, 2018, and 2017, we provided a liability of
$0.5 million
and
$0.5 million
, respectively, for unrecognized tax benefits related to U.S. federal and state, and foreign jurisdictions. These unrecognized tax benefits are netted against their related noncurrent deferred tax assets.
We accrue interest and penalties related to unrecognized tax benefits through income tax expense. We had
$0.3 million
and
$0.3 million
accrued for the payment of interest and penalties as of December 31, 2018 and December 31, 2017, respectively. Accrued interest and penalties are included in the
$0.5 million
of unrecognized tax benefits.
A reconciliation of the beginning and ending amount of unrecognized tax benefits (including interest and penalties) at
December 31
follows:
|
2018
|
2017
|
2016
|
|||||||||
|
Balance - Beginning of the year
|
$
|
485
|
|
$
|
628
|
|
$
|
489
|
|
||
|
Gross increase - tax positions in prior periods
|
63
|
|
68
|
|
40
|
|
|||||
|
Gross decreases - tax positions in prior periods
|
(14
|
)
|
(38
|
)
|
—
|
|
|||||
|
Gross increases - current period tax positions
|
24
|
|
29
|
|
103
|
|
|||||
|
Lapse of statute of limitations
|
(12
|
)
|
(221
|
)
|
(4
|
)
|
|||||
|
Currency translation adjustment
|
(16
|
)
|
19
|
|
—
|
|
|||||
|
Balance - End of the year
|
$
|
530
|
|
$
|
485
|
|
$
|
628
|
|
||
62
|
10.
|
Segment Reporting and Geographic Locations
|
In the quarter ended December 31, 2018, we completed a strategic reorganization of our operations into
two
business segments, Electrical Systems and Global Seating. As a result of the strategic reorganization, we restated prior period segment information to conform to the current period segment presentation.
Operating segments are defined as components of an enterprise that are evaluated regularly by the Company’s CODM, which is our President and Chief Executive Officer. Prior period segment information has been restated to conform to the current period segment presentation. Each of these segments consists of a number of manufacturing facilities. Certain of our facilities manufacture and sell products through both of our segments. Each manufacturing facility that sells products through both segments is reflected in the financial results of the segment that has the greatest amount of sales from that manufacturing facility. Our segments are more specifically described below.
The Electrical Systems Segment manufactures and sells the following products:
|
•
|
Wire harness assemblies primarily for construction, agricultural, industrial, automotive, truck, mining and military industries in North America, Europe and Asia-Pacific;
|
|
•
|
Trim primarily for the North America MD/HD Truck market;
|
|
•
|
Mirrors, wipers and controls primarily for the truck, bus, agriculture, construction, rail and military markets in North America and Europe;
|
|
•
|
Cab structures for the North American MD/HD Truck market; and
|
|
•
|
Aftermarket components in North America.
|
The Global Seating Segment manufactures and sells Seats as follows:
|
•
|
Seats primarily to the MD/HD Truck, construction, agriculture and mining markets in North America, Asia-Pacific and Europe;
|
|
•
|
Office seating in Europe and Asia-Pacific; and
|
|
•
|
Aftermarket seats and components in North America, Europe and Asia-Pacific.
|
Corporate expenses consist of certain overhead and shared costs that are not directly attributable to the operations of a segment. For purposes of business segment performance measurement, some of these costs that are for the benefit of the operations are allocated based on a combination of methodologies. The costs that are not allocated to a segment are considered stewardship costs and remain at corporate in our segment reporting.
The following table presents segment revenues, gross profit, amortization expense, selling, general and administrative expenses, operating income, capital expenditures and depreciation expense for the year ended
December 31, 2018
.
|
For the year ended December 31, 2018
|
|||||||||||||||
|
Electrical Systems
|
Global Seating
|
Corporate/
Other |
Total
|
||||||||||||
|
Revenues
|
|||||||||||||||
|
External revenues
|
$
|
503,717
|
|
$
|
394,020
|
|
$
|
—
|
|
$
|
897,737
|
|
|||
|
Intersegment revenues
|
9,037
|
|
3,481
|
|
(12,518
|
)
|
—
|
|
|||||||
|
Total revenues
|
$
|
512,754
|
|
$
|
397,501
|
|
$
|
(12,518
|
)
|
$
|
897,737
|
|
|||
|
Gross profit
|
$
|
75,184
|
|
$
|
54,231
|
|
$
|
(563
|
)
|
$
|
128,852
|
|
|||
|
Selling, general & administrative expenses
|
15,390
|
|
22,433
|
|
22,856
|
|
60,679
|
|
|||||||
|
Amortization Expense
|
747
|
|
553
|
|
—
|
|
1,300
|
|
|||||||
|
Operating income
|
$
|
59,047
|
|
$
|
31,245
|
|
$
|
(23,419
|
)
|
$
|
66,873
|
|
|||
|
Capital Expenditures and Depreciation Expense:
|
|||||||||||||||
|
Capital expenditures
|
$
|
8,831
|
|
$
|
3,579
|
|
$
|
2,140
|
|
$
|
14,550
|
|
|||
|
Depreciation Expense
|
$
|
6,919
|
|
$
|
4,604
|
|
$
|
2,595
|
|
$
|
14,118
|
|
|||
63
The following table presents segment revenues, gross profit, amortization expense, selling, general and administrative expenses, operating income, capital expenditures, depreciation expense and other items for the year ended
December 31, 2017
. The table does not include assets as the CODM does not review assets by segment.
|
For the year ended December 31, 2017
|
|||||||||||||||
|
Electrical Systems
|
Global Seating
|
Corporate/
Other |
Total
|
||||||||||||
|
Revenues
|
|||||||||||||||
|
External revenues
|
$
|
427,476
|
|
$
|
327,755
|
|
$
|
—
|
|
$
|
755,231
|
|
|||
|
Intersegment revenues
|
6,922
|
|
1,761
|
|
(8,683
|
)
|
—
|
|
|||||||
|
Total revenues
|
$
|
434,398
|
|
$
|
329,516
|
|
$
|
(8,683
|
)
|
$
|
755,231
|
|
|||
|
Gross profit
|
$
|
52,011
|
|
$
|
40,722
|
|
$
|
(1,015
|
)
|
$
|
91,718
|
|
|||
|
Selling, general & administrative expenses
|
15,757
|
|
21,585
|
|
22,205
|
|
59,547
|
|
|||||||
|
Amortization Expense
|
746
|
|
574
|
|
—
|
|
1,320
|
|
|||||||
|
Operating income
|
$
|
35,508
|
|
$
|
18,563
|
|
$
|
(23,220
|
)
|
$
|
30,851
|
|
|||
|
Capital Expenditures and Depreciation Expense:
|
|||||||||||||||
|
Capital expenditures
|
$
|
6,744
|
|
|
$
|
4,870
|
|
|
$
|
1,953
|
|
|
$
|
13,567
|
|
|
Depreciation Expense
|
$
|
7,381
|
|
$
|
3,910
|
|
$
|
2,733
|
|
$
|
14,024
|
|
|||
|
Other Items
1
|
$
|
1,835
|
|
$
|
88
|
|
$
|
2,377
|
|
$
|
4,300
|
|
|||
1
Other items include costs associated with restructuring activities, including employee severance and retention costs, lease cancellation costs, building repairs, costs to transfer equipment, and litigation settlement costs associated with a consulting contract.
The following table presents segment revenues, gross profit, amortization expense, selling, general and administrative expenses, operating income, capital expenditures, depreciation expense and other items as of and for the year ended
December 31, 2016
. The table does not include assets as the CODM does not review assets by segment.
|
For the year ended December 31, 2016
|
|||||||||||||||
|
Electrical Systems
|
Global Seating
|
Corporate/
Other |
Total
|
||||||||||||
|
Revenues
|
|||||||||||||||
|
External revenues
|
$
|
371,537
|
|
$
|
290,575
|
|
$
|
—
|
|
$
|
662,112
|
|
|||
|
Intersegment revenues
|
4,524
|
|
338
|
|
(4,862
|
)
|
—
|
|
|||||||
|
Total revenues
|
$
|
376,061
|
|
$
|
290,913
|
|
$
|
(4,862
|
)
|
$
|
662,112
|
|
|||
|
Gross profit
|
$
|
54,611
|
|
$
|
33,090
|
|
$
|
(998
|
)
|
$
|
86,703
|
|
|||
|
Selling, general & administrative expenses
|
17,443
|
|
22,697
|
|
20,342
|
|
60,482
|
|
|||||||
|
Amortization Expense
|
746
|
|
559
|
|
—
|
|
1,305
|
|
|||||||
|
Operating income
|
$
|
36,422
|
|
$
|
9,834
|
|
$
|
(21,340
|
)
|
$
|
24,916
|
|
|||
|
Capital Expenditures and Depreciation Expense:
|
|||||||||||||||
|
Capital expenditures
|
$
|
5,940
|
|
$
|
5,053
|
|
$
|
924
|
|
$
|
11,917
|
|
|||
|
Depreciation Expense
|
$
|
7,747
|
|
$
|
5,074
|
|
$
|
2,325
|
|
$
|
15,146
|
|
|||
|
Other Items
1
|
$
|
2,505
|
|
$
|
930
|
|
$
|
688
|
|
$
|
4,123
|
|
|||
1
Other items include costs associated with restructuring activities, including employee severance and retention costs, lease cancellation costs, building repairs, costs to transfer equipment, and the write down of an asset held for sale.
The following table presents revenues and long-lived assets for the geographic areas in which we operate:
64
|
Years Ended December 31,
|
|||||||||||||||||||||||
|
2018
|
2017
|
2016
|
|||||||||||||||||||||
|
Revenues
|
Long-lived
Assets |
Revenues
|
Long-lived
Assets |
Revenues
|
Long-lived
Assets |
||||||||||||||||||
|
United States
|
$
|
670,075
|
|
$
|
50,872
|
|
$
|
560,412
|
|
$
|
50,207
|
|
$
|
496,473
|
|
$
|
54,334
|
|
|||||
|
All other countries
|
227,662
|
|
14,227
|
|
194,819
|
|
14,423
|
|
165,639
|
|
11,707
|
|
|||||||||||
|
$
|
897,737
|
|
$
|
65,099
|
|
$
|
755,231
|
|
$
|
64,630
|
|
$
|
662,112
|
|
$
|
66,041
|
|
||||||
Revenues are attributed to geographic locations based on the geography from which the legal entity operates.
The following is the composition, by product category, of our revenues:
|
Years Ended December 31,
|
||||||||||||||||||||
|
2018
|
2017
|
2016
|
||||||||||||||||||
|
Revenues
|
%
|
Revenues
|
%
|
Revenues
|
%
|
|||||||||||||||
|
Seats and seating systems
|
$
|
369,337
|
|
41
|
%
|
$
|
314,717
|
|
42
|
%
|
$
|
280,575
|
|
42
|
%
|
|||||
|
Electrical wire harnesses and panel assemblies
|
196,411
|
|
22
|
|
189,154
|
|
25
|
|
149,417
|
|
23
|
|
||||||||
|
Trim systems and components
|
195,427
|
|
22
|
|
150,228
|
|
20
|
|
132,623
|
|
20
|
|
||||||||
|
Cab structures and sleeper boxes
|
76,380
|
|
9
|
|
56,417
|
|
7
|
|
57,605
|
|
9
|
|
||||||||
|
Mirrors, wipers and controls
|
60,182
|
|
6
|
|
44,715
|
|
6
|
|
41,892
|
|
6
|
|
||||||||
|
$
|
897,737
|
|
100
|
|
$
|
755,231
|
|
100
|
|
$
|
662,112
|
|
100
|
|
||||||
|
11.
|
Commitments and Contingencies
|
Leases
- We lease office, warehouse and manufacturing space, and certain equipment under non-cancelable lease agreements that require us to pay maintenance, insurance, taxes and other expenses in addition to annual rentals. Lease expense under these arrangements was
$13.2 million
,
$12.0 million
and
$10.6 million
in
2018
,
2017
and
2016
, respectively. Capital lease agreements are immaterial. Anticipated future lease costs, which are based in part on certain assumptions to approximate minimum annual rental commitments under non-cancelable leases at
December 31, 2018
, are as follows:
|
Year Ending December 31,
|
||||
|
2019
|
$
|
7,558
|
|
|
|
2020
|
$
|
6,492
|
|
|
|
2021
|
$
|
5,960
|
|
|
|
2022
|
$
|
5,286
|
|
|
|
2023
|
$
|
1,676
|
|
|
|
Thereafter
|
$
|
2,501
|
|
|
Guarantees
- Costs associated with guarantees are accrued when it is probable that a liability has been incurred and the amount can be reasonably estimated. The most likely cost to be incurred is accrued based on an evaluation of available facts; where no amount within a range of estimates is more likely, the minimum is accrued. As of
December 31, 2018
and
2017
, we had no such guarantees.
Litigation
- We are subject to various legal proceedings and claims arising in the ordinary course of business, including but not limited to workers' compensation claims, OSHA investigations, employment disputes, unfair labor practice charges, customer and supplier disputes, service provider disputes, product liability claims, intellectual property disputes, and environmental claims arising out of the conduct of our businesses and examinations by the Internal Revenue Service.
Management believes that the Company maintains adequate insurance and that we have established reserves for issues that are probable and estimable in amounts that are adequate to cover reasonable adverse judgments not covered by insurance. Based upon the information available to management and discussions with legal counsel, it is the opinion of management that the ultimate outcome of the various legal actions and claims that are incidental to our business are not expected to have a material adverse impact on the consolidated financial position, results of operations, equity or cash flows; however, such matters are subject to many uncertainties and the outcomes of individual matters are not predictable with any degree of assurance.
Warranty
- We are subject to warranty claims for products that fail to perform as expected due to design or manufacturing deficiencies. Depending on the terms under which we supply products to our customers, a customer may hold us responsible for
65
some or all of the repair or replacement costs of defective products when the product supplied did not perform as represented. Our policy is to record provisions for estimated future customer warranty costs based on historical trends and for specific claims. These amounts, as they relate to the years ended
December 31, 2018
and
2017
are included within accrued liabilities and other in the accompanying Consolidated Balance Sheets. The following presents a summary of the warranty provision for the years ended
December 31
:
|
2018
|
2017
|
||||||
|
Balance - Beginning of the year
|
$
|
3,490
|
|
$
|
5,552
|
|
|
|
Provision for new warranty claims
|
2,435
|
|
3,461
|
|
|||
|
Change in provision for preexisting warranty claims
|
932
|
|
(1,065
|
)
|
|||
|
Deduction for payments made
|
(2,803
|
)
|
(4,579
|
)
|
|||
|
Currency translation adjustment
|
(143
|
)
|
121
|
|
|||
|
Balance - End of year
|
$
|
3,911
|
|
$
|
3,490
|
|
|
Debt Payments -
As disclosed in Note 7, the TLS Agreement requires the Company to repay a fixed amount of principal on a quarterly basis, make mandatory prepayments of excess cash flows and make voluntary prepayments that coincide with certain events.
The following table provides future minimum principal payments and mandatory prepayment of excess cash flows due on long-term debt for the next five years. The amount shown for 2019 includes a mandatory prepayment of
$5.9 million
pursuant to the excess free cash flow sweep provision of the TLS agreement. The existing long-term debt agreements mature in 2023; no payments are due thereafter:
|
Year Ending December 31,
|
||||
|
2019
|
$
|
10,252
|
|
|
|
2020
|
$
|
4,375
|
|
|
|
2021
|
$
|
4,375
|
|
|
|
2022
|
$
|
4,375
|
|
|
|
2023
|
$
|
145,061
|
|
|
|
Thereafter
|
$
|
—
|
|
|
|
12.
|
Stockholders’ Equity
|
Common Stock
- Our authorized capital stock includes common stock of
60,000,000
shares with a par value of
$0.01
per share, with
30,512,843
and
30,219,278
shares outstanding as of
December 31, 2018
and
2017
, respectively.
Preferred Stock
- Our authorized capital stock includes preferred stock of
5,000,000
shares with a par value of
$0.01
per share, with
no
shares outstanding as of
December 31, 2018
and
2017
.
Earnings (Loss) Per Share
- Basic earnings (loss) per share is determined by dividing net income by the weighted average number of common shares outstanding during the year. Diluted earnings (loss) per share presented is determined by dividing net income by the weighted average number of common shares and potential common shares outstanding during the period as determined by the Treasury Stock Method. Potential common shares are included in the diluted earnings per share calculation when dilutive.
Diluted earnings (loss) per share for years ended
December 31, 2018
,
2017
and
2016
includes the effects of potential common shares when dilutive and is as follows:
|
2018
|
2017
|
2016
|
|||||||||
|
Net income (loss) attributable to common stockholders
|
$
|
44,512
|
|
$
|
(1,705
|
)
|
$
|
6,785
|
|
||
|
Weighted average number of common shares outstanding
|
30,277
|
|
29,942
|
|
29,530
|
|
|||||
|
Dilutive effect of restricted stock grants after application of the treasury stock method
|
310
|
|
—
|
|
348
|
|
|||||
|
Dilutive shares outstanding
|
30,587
|
|
29,942
|
|
29,878
|
|
|||||
|
Basic earnings (loss) per share attributable to common stockholders
|
$
|
1.47
|
|
$
|
(0.06
|
)
|
$
|
0.23
|
|
||
|
Diluted earnings (loss) per share attributable to common stockholders
|
$
|
1.46
|
|
$
|
(0.06
|
)
|
$
|
0.23
|
|
||
66
For the years ended
December 31, 2018
and
2017
, diluted earnings (loss) per share excludes
55 thousand
shares and
787 thousand
shares, respectively, of nonvested restricted stock as the effect would have been anti-dilutive.
Dividends
— We have not declared or paid any cash dividends in the past. The terms of the Third ARLS Agreement and the Term Loan Facility restrict the payment or distribution of our cash or other assets, including cash dividend payments.
|
13.
|
Performance Awards
|
Awards, defined as cash, shares or other awards, may be granted to employees under the Commercial Vehicle Group, Inc. 2014 Equity Incentive Plan (the “2014 EIP”). The cash award is earned and payable based upon the Company’s relative total shareholder return in terms of ranking as compared to the peer group over a
three
-year period (the “Performance Period”). Total shareholder return is determined by the percentage change in value (positive or negative) over the applicable measurement period as measured by dividing (A) the sum of the cumulative value of dividends and other distributions paid on the Common Stock for the applicable measurement period and the difference (positive or negative) between each such company’s starting stock price and ending stock price, by (B) the starting stock price. The award is payable at the end of the Performance Period in cash if the employee is employed through the end of the Performance Period. If the employee is not employed during the entire Performance Period, the award is forfeited. These grants are accounted for as cash settlement awards for which the fair value of the award fluctuates based on the change in total shareholder return in relation to the peer group.
The following table summarizes performance awards granted in the form of cash awards under the 2014 EIP in November
2018
,
2017
, and
2016
:
|
Grant Date
|
Grant Amount
|
Adjustments
|
Forfeitures
|
Payments
|
Adjusted Award Value at December 31, 2018
|
Vesting Schedule
|
Remaining Periods (in Months) to Vesting
|
|||||||||||||||||
|
November 2015
|
$
|
1,487
|
|
—
|
|
$
|
(197
|
)
|
$
|
(1,290
|
)
|
$
|
—
|
|
November 2018
|
0
|
||||||||
|
November 2016
|
1,434
|
|
(27
|
)
|
(37
|
)
|
$
|
—
|
|
1,370
|
|
November 2019
|
10
|
|||||||||||
|
November 2017
|
1,584
|
|
(66
|
)
|
—
|
|
—
|
|
1,518
|
|
November 2020
|
22
|
||||||||||||
|
November 2018
|
1,590
|
|
(103
|
)
|
—
|
|
—
|
|
1,487
|
|
November 2021
|
34
|
||||||||||||
|
$
|
6,095
|
|
$
|
(196
|
)
|
$
|
(234
|
)
|
$
|
(1,290
|
)
|
$
|
4,375
|
|
||||||||||
Unrecognized compensation expense was
$2.6 million
and
$2.0 million
as of
December 31, 2018
and
2017
, respectively.
|
14.
|
Share-Based Compensation
|
The compensation expense for our share-based compensation arrangements (see Restricted Stock Awards below) was
$3.1 million
,
$2.5 million
and
$2.6 million
for the years ended
December 31, 2018
,
2017
and
2016
, respectively. Share-based compensation expense is included in selling, general and administrative expenses in the Consolidated Statements of Operations.
Restricted Stock Awards
- Restricted stock is a grant of shares of common stock that may not be sold, encumbered or disposed of and that may be forfeited in the event of certain terminations of employment or in the case of the board of directors, a separation for cause, prior to the end of a restricted period set by the compensation committee of the board of directors. A participant granted restricted stock generally has all of the rights of a stockholder, unless the compensation committee determines otherwise.
The following table summarizes information about unvested restricted stock grants (in thousands):
|
Grant
|
Shares
|
Vesting Schedule
|
Unearned
Compensation |
Remaining
Period (in months) |
|||||||
|
October 2016
|
411
|
|
3 equal annual installments commencing on October 20, 2017
|
$
|
528.1
|
|
10
|
||||
|
July 2017
|
6
|
|
3 equal annual installments commencing on October 20, 2017
|
$
|
13.3
|
|
10
|
||||
|
October 2017
|
303
|
|
3 equal annual installments commencing on October 20, 2018
|
$
|
1,673.7
|
|
22
|
||||
|
May 2018
|
64
|
|
Shares granted to outside board members that fully vest as of May 16, 2019
|
$
|
180.0
|
|
4
|
||||
|
October 2018
|
382
|
|
3 equal annual installments commencing on October 20, 2019
|
$
|
2,444.9
|
|
34
|
||||
67
As of
December 31, 2018
, there was approximately
$4.8 million
of unrecognized compensation expense related to non-vested share-based compensation arrangements granted under our equity incentive plans. This expense is subject to future adjustments and forfeitures and will be recognized on a straight-line basis over the remaining period listed above for each grant.
A summary of the status of our restricted stock awards as of
December 31, 2018
and changes during the twelve-month period ending
December 31, 2018
,
2017
and
2016
is presented below:
|
|
2018
|
2017
|
2016
|
|||||||||||||||||
|
|
Shares
(000’s) |
Weighted-
Average Grant-Date Fair Value |
Shares
(000’s) |
Weighted-
Average Grant-Date Fair Value |
Shares
(000’s) |
Weighted-
Average Grant-Date Fair Value |
||||||||||||||
|
Nonvested - beginning of year
|
787
|
|
$
|
6.84
|
|
981
|
|
$
|
4.70
|
|
1,128
|
|
$
|
4.24
|
|
|||||
|
Granted
|
446
|
|
$
|
7.20
|
|
354
|
|
$
|
9.77
|
|
571
|
|
$
|
5.05
|
|
|||||
|
Vested
|
(452
|
)
|
$
|
5.97
|
|
(509
|
)
|
$
|
4.90
|
|
(558
|
)
|
$
|
4.68
|
|
|||||
|
Forfeited
|
(21
|
)
|
$
|
7.31
|
|
(39
|
)
|
$
|
4.84
|
|
(160
|
)
|
$
|
4.35
|
|
|||||
|
Nonvested - end of year
|
760
|
|
$
|
7.56
|
|
787
|
|
$
|
6.84
|
|
981
|
|
$
|
4.70
|
|
|||||
As of
December 31, 2018
, a total of
2.1 million
shares were available for future grants from the shares authorized for award under our 2014 Equity Incentive Plan, including cumulative forfeitures.
Repurchase of Common Stock
- We did not repurchase any of our common stock on the open market as part of a stock repurchase program during
2018
; however, our employees surrendered
158 thousand
shares of our common stock to satisfy tax withholding obligations on the vesting of the restricted stock awards.
|
15.
|
Defined Contribution Plans, Pension and Other Post-Retirement Benefit Plans
|
Defined Contribution Plans
- We sponsor various defined contribution plans covering eligible employees. Eligible employees can contribute on a pre-tax basis to the plan. In accordance with the terms of the 401(k) plans, we elect to match a certain percentage of the participants’ contributions to the plans, as defined. We recognized expense associated with these plans of
$3.6 million
in
2018
,
$3.0 million
in
2017
and
$2.7 million
in
2016
.
Pension and Other Post-Retirement Benefit Plans
- We sponsor pension and other post-retirement benefit plans that cover certain hourly and salaried employees in the U.S. and United Kingdom. Each of the plans are frozen to new participants and to additional service credits earned. In December 2018, we consolidated the U.S. plans. Our policy is to make annual contributions to the plans to fund the minimum contributions as required by local regulations.
The change in benefit obligation, plan assets and funded status as of
December 31
is as follows:
68
|
|
U.S. Pension and Other Post-Retirement Benefit Plans
|
Non-U.S. Pension Plans
|
|||||||||||||
|
|
2018
|
2017
|
2018
|
2017
|
|||||||||||
|
Change in benefit obligation:
|
|||||||||||||||
|
Benefit obligation — Beginning of the year
|
$
|
50,072
|
|
$
|
47,512
|
|
$
|
45,737
|
|
$
|
40,820
|
|
|||
|
Service cost
|
—
|
|
116
|
|
788
|
|
—
|
|
|||||||
|
Interest cost
|
1,664
|
|
1,810
|
|
1,030
|
|
1,138
|
|
|||||||
|
Participant contributions
|
9
|
|
8
|
|
—
|
|
—
|
|
|||||||
|
Benefits paid
|
(2,360
|
)
|
(2,188
|
)
|
(1,816
|
)
|
(1,309
|
)
|
|||||||
|
Actuarial (gain) loss
|
(4,147
|
)
|
2,814
|
|
(2,772
|
)
|
1,099
|
|
|||||||
|
Exchange rate changes
|
—
|
|
—
|
|
(2,702
|
)
|
3,989
|
|
|||||||
|
Benefit obligation at end of the year
|
45,238
|
|
50,072
|
|
40,265
|
|
45,737
|
|
|||||||
|
Change in plan assets:
|
|||||||||||||||
|
Fair value of plan assets — Beginning of the year
|
45,046
|
|
38,390
|
|
35,377
|
|
31,080
|
|
|||||||
|
Actual return on plan assets
|
(2,259
|
)
|
6,584
|
|
(1,808
|
)
|
1,798
|
|
|||||||
|
Employer contributions
|
2,526
|
|
2,252
|
|
763
|
|
747
|
|
|||||||
|
Participant contributions
|
9
|
|
8
|
|
—
|
|
—
|
|
|||||||
|
Benefits paid
|
(2,360
|
)
|
(2,188
|
)
|
(1,816
|
)
|
(1,309
|
)
|
|||||||
|
Exchange rate changes
|
—
|
|
—
|
|
(2,092
|
)
|
3,061
|
|
|||||||
|
Fair value of plan assets at end of the year
|
42,962
|
|
45,046
|
|
30,424
|
|
35,377
|
|
|||||||
|
Funded status
|
$
|
(2,276
|
)
|
$
|
(5,026
|
)
|
$
|
(9,841
|
)
|
$
|
(10,360
|
)
|
|||
Significant Obligation Gains -
The projected U.S. benefit obligation includes a net gain of
$4.1 million
for the
year ended December 31, 2018
. The gain is a result of changes in key actuarial assumptions, including an increase in the discount rate and a change in the mortality table. The projected Non-U.S. benefit obligation includes a net gain of
$2.8 million
for the
year ended December 31, 2018
driven primarily by an increase in the discount rate assumption.
As a result of pension legislation in the United Kingdom that was effective October 2018, the Company was required to amend its pension plan to equalize benefits between male and female pensioners. This resulted in additional pension obligation and a reduction to accumulated other comprehensive income of
$0.8 million
.
Amounts recognized in the Consolidated Balance Sheets at
December 31
consisted of:
|
|
U.S. Pension and Other Post-Retirement Benefit Plans
|
Non-U.S. Pension Plans
|
|||||||||||||
|
|
2018
|
2017
|
2018
|
2017
|
|||||||||||
|
Current liabilities
|
$
|
28
|
|
$
|
52
|
|
$
|
—
|
|
$
|
—
|
|
|||
|
Noncurrent liabilities
|
2,248
|
|
4,974
|
|
9,841
|
|
10,360
|
|
|||||||
|
Amount recognized
|
$
|
2,276
|
|
$
|
5,026
|
|
$
|
9,841
|
|
$
|
10,360
|
|
|||
The components of net periodic (benefit) cost for the years ended
December 31
were as follows:
|
|
U.S. Pension and Other Post-Retirement Benefit Plans
|
Non-U.S. Pension Plans
|
|||||||||||||||||||||
|
|
2018
|
2017
|
2016
|
2018
|
2017
|
2016
|
|||||||||||||||||
|
Service cost
|
$
|
—
|
|
$
|
116
|
|
$
|
126
|
|
$
|
—
|
|
$
|
—
|
|
$
|
—
|
|
|||||
|
Interest cost
|
1,664
|
|
1,810
|
|
1,878
|
|
1,030
|
|
1,138
|
|
1,370
|
|
|||||||||||
|
Expected return on plan assets
|
(3,151
|
)
|
(2,684
|
)
|
(2,719
|
)
|
(1,210
|
)
|
(1,196
|
)
|
(1,520
|
)
|
|||||||||||
|
Amortization of prior service cost
|
6
|
|
6
|
|
6
|
|
—
|
|
—
|
|
—
|
|
|||||||||||
|
Recognized actuarial loss (gain)
|
263
|
|
21
|
|
308
|
|
496
|
|
312
|
|
210
|
|
|||||||||||
|
Net periodic (benefit) cost
|
$
|
(1,218
|
)
|
$
|
(731
|
)
|
$
|
(401
|
)
|
$
|
316
|
|
$
|
254
|
|
$
|
60
|
|
|||||
69
Net periodic (benefit) cost components, not inclusive of service costs, are recognized in Other Income within the Consolidated Statements of Operations.
Amounts Recognized in Accumulated Other Comprehensive Income (Loss) -
Amounts recognized in accumulated other comprehensive income (loss), before taking into account income tax effects, at
December 31
are as follows:
|
|
U.S. Pension and Other Post-Retirement Benefit Plans
|
Non-U.S. Pension Plans
|
|||||||||||||||||||||
|
|
2018
|
2017
|
2016
|
2018
|
2017
|
2016
|
|||||||||||||||||
|
Net actuarial loss
|
$
|
14,767
|
|
$
|
13,765
|
|
$
|
15,219
|
|
$
|
12,972
|
|
$
|
13,454
|
|
$
|
14,134
|
|
|||||
|
Prior service cost
|
51
|
|
57
|
|
63
|
|
788
|
|
—
|
|
—
|
|
|||||||||||
|
$
|
14,818
|
|
$
|
13,822
|
|
$
|
15,282
|
|
$
|
13,760
|
|
$
|
13,454
|
|
$
|
14,134
|
|
||||||
Other Changes in Plan Assets and Benefit Obligations Recognized in Other Comprehensive (Loss) Income
— Amounts recognized as other changes in plan assets and benefit obligations in other comprehensive income (loss), before taking into account income tax effects, for the year ended
December 31
are as follows:
|
|
U.S. Pension and Other Post-Retirement Plans
|
Non-U.S. Pension Plans
|
|||||||||||||
|
|
2018
|
2017
|
2018
|
2017
|
|||||||||||
|
Actuarial loss (gain)
|
$
|
1,266
|
|
$
|
(1,087
|
)
|
$
|
245
|
|
$
|
519
|
|
|||
|
Amortization of actuarial (gain) loss
|
(263
|
)
|
(367
|
)
|
781
|
|
(504
|
)
|
|||||||
|
Prior service credit
|
(6
|
)
|
(6
|
)
|
(491
|
)
|
—
|
|
|||||||
|
Total recognized in other comprehensive income (loss)
|
$
|
997
|
|
$
|
(1,460
|
)
|
$
|
535
|
|
$
|
15
|
|
|||
Weighted-average assumptions used to determine benefit obligations at
December 31
were as follows:
|
|
U.S. Pension and Other Post-Retirement Benefit Plans
|
Non-U.S. Pension
Plans |
|||||||||
|
|
2018
|
2017
|
2018
|
2017
|
|||||||
|
Discount rate
|
4.06
|
%
|
3.42
|
%
|
2.80
|
%
|
2.45
|
%
|
|||
Weighted-average assumptions used to determine net periodic benefit cost at
December 31
were as follows:
|
|
U.S. Pension and Other Post-Retirement Plans
|
Non-U.S. Pension Plans
|
|||||||||||||||
|
|
2018
|
2017
|
2016
|
2018
|
2017
|
2016
|
|||||||||||
|
Discount rate
|
3.42
|
%
|
3.87
|
%
|
4.05
|
%
|
2.45
|
%
|
2.70
|
%
|
3.90
|
%
|
|||||
|
Expected return on plan assets
|
7.00
|
%
|
7.00
|
%
|
7.50
|
%
|
3.70
|
%
|
3.70
|
%
|
5.00
|
%
|
|||||
The rate of return assumptions are based on projected long-term market returns for the various asset classes in which the plans are invested, weighted by the target asset allocations. An incremental amount for active plan asset management and diversification, where appropriate, is included in the rate of return assumption. Our pension plan investment strategy is reviewed periodically, but no less frequently than annually.
We employ a total return investment approach whereby a mix of equities, fixed income and real estate investments are used to maximize the long-term return of plan assets taking into consideration a prudent level of risk. The intent of this strategy is to minimize plan expenses by outperforming plan liabilities over the long run. Risk tolerance is established through consideration of plan liabilities, plan funded status and corporate financial condition. The investment portfolio contains a diversified blend of equity, balanced, fixed income and real estate investments. Furthermore, equity investments are diversified across U.S. and non-U.S. stocks, as well as growth, value and large and small capitalizations. Other assets, such as real estate, are used judiciously to enhance long-term returns and to improve portfolio diversification. Derivatives may be used to gain market exposure in an efficient and timely manner; however, derivatives may not be used to leverage the portfolio beyond the market value of the underlying investments. Investment risk is measured and monitored on an ongoing basis in light of annual liability measurements, periodic asset/liability studies and quarterly investment portfolio reviews. We expect to contribute approximately
$3.1 million
to our pension plans and our other post-retirement benefit plans in
2019
.
Our current investment allocation target for our pension plans for
2018
and our weighted-average asset allocations of our pension assets for the years ended
December 31
, by asset category, are as follows:
70
|
Target Allocation
|
Actual Allocations as of December 31,
|
||||||||||||||
|
|
2018
|
2017
|
U.S. Pension Plans
|
Non-U.S. Pension Plans
|
|||||||||||
|
|
U.S.
|
Non-U.S.
|
U.S.
|
Non-U.S.
|
2018
|
2017
|
2018
|
2017
|
|||||||
|
Cash and cash equivalents
|
—
|
—
|
—
|
—
|
1
|
—
|
1
|
—
|
|||||||
|
Equity/Balanced securities
|
55
|
55
|
55
|
55
|
52
|
57
|
59
|
58
|
|||||||
|
Fixed income securities
|
25
|
45
|
25
|
45
|
22
|
20
|
40
|
42
|
|||||||
|
Real estate
|
20
|
—
|
20
|
—
|
25
|
23
|
—
|
—
|
|||||||
|
100%
|
100%
|
100%
|
100%
|
100%
|
100%
|
100%
|
100%
|
||||||||
Our plan assets can be described as follows:
Equity Securities
- Includes common stocks issued by U.S., United Kingdom and other international companies, equity funds that invest in common stocks and unit linked insurance policies. Equity investments generally allow near-term (within
90
days of the measurement date) liquidity and are held in issues that are actively traded to facilitate transactions at minimum cost.
Balanced
Securities
- Includes funds primarily invested in a mix of equity and fixed income securities where the allocations are at the discretion of the investment manager. Investments generally allow near-term (within
90
days of the measurement date) liquidity and are held in issues that are actively traded to facilitate transactions at minimum cost.
Fixed Income Securities
- Includes U.S. dollar-denominated and United Kingdom and other international marketable bonds and convertible debt securities as well as fixed income funds that invest in these instruments. Investments generally allow near-term liquidity and are held in issues that are actively traded to facilitate transactions at minimum cost.
The fair value of fixed income securities is determined by either direct or indirect quoted market prices. When the value of assets held in separate accounts is not published, the value is based on the underlying holdings, which are primarily direct quoted market prices on regulated financial exchanges.
Real Estate
- Real estate provides an indirect investment into a diversified and multi-sector portfolio of property assets. The fair value of real estate investments is valued by the fund managers. The fund managers value the real estate investments via independent third-party appraisals on a periodic basis. Assumptions used to revalue the properties are updated every quarter.
The fair values of our pension plan assets by asset category and by level as described in Note 2 for the years ended
December 31, 2018
and
2017
are as follows:
71
|
|
December 31, 2018
|
||||||||||||||
|
|
|
Quoted Prices in
Active Markets for Identical Assets |
Significant
Observable Inputs |
Significant
Unobservable Inputs |
|||||||||||
|
|
Total
|
Level 1
|
Level 2
|
Level 3
|
|||||||||||
|
Cash and cash equivalents
|
$
|
623
|
|
$
|
623
|
|
$
|
—
|
|
$
|
—
|
|
|||
|
Equities:
|
|||||||||||||||
|
U.S. large value
|
4,815
|
|
4,815
|
|
—
|
|
—
|
|
|||||||
|
U.S. large growth
|
5,270
|
|
5,270
|
|
—
|
|
—
|
|
|||||||
|
International blend
|
9,134
|
|
—
|
|
9,134
|
|
—
|
|
|||||||
|
International growth
|
3,093
|
|
3,093
|
|
—
|
|
—
|
|
|||||||
|
Emerging markets
|
—
|
|
—
|
|
—
|
|
—
|
|
|||||||
|
Balanced
|
17,952
|
|
—
|
|
17,952
|
|
—
|
|
|||||||
|
Fixed income securities:
|
|||||||||||||||
|
Government bonds
|
10,240
|
|
—
|
|
10,240
|
|
—
|
|
|||||||
|
Corporate bonds
|
11,297
|
|
—
|
|
11,297
|
|
—
|
|
|||||||
|
Real Estate:
|
|
||||||||||||||
|
U.S. property
|
10,962
|
|
—
|
|
—
|
|
10,962
|
|
|||||||
|
Total pension fund assets
|
$
|
73,386
|
|
$
|
13,801
|
|
$
|
48,623
|
|
$
|
10,962
|
|
|||
|
|
December 31, 2017
|
||||||||||||||
|
|
|
Quoted Prices in
Active Markets for Identical Assets |
Significant
Observable Inputs |
Significant
Unobservable Inputs |
|||||||||||
|
|
Total
|
Level 1
|
Level 2
|
Level 3
|
|||||||||||
|
Cash and cash equivalents
|
$
|
264
|
|
$
|
264
|
|
$
|
—
|
|
$
|
—
|
|
|||
|
Equities:
|
|||||||||||||||
|
U.S. large value
|
5,499
|
|
5,499
|
|
—
|
|
—
|
|
|||||||
|
U.S. large growth
|
5,792
|
|
5,792
|
|
—
|
|
—
|
|
|||||||
|
International blend
|
10,734
|
|
—
|
|
10,734
|
|
—
|
|
|||||||
|
Emerging markets
|
3,613
|
|
3,613
|
|
—
|
|
—
|
|
|||||||
|
Balanced
|
21,895
|
|
—
|
|
21,895
|
|
—
|
|
|||||||
|
Fixed income securities:
|
|||||||||||||||
|
Government bonds
|
9,806
|
|
—
|
|
9,806
|
|
—
|
|
|||||||
|
Corporate bonds
|
12,667
|
|
—
|
|
12,667
|
|
—
|
|
|||||||
|
Real Estate:
|
|
||||||||||||||
|
U.S. property
|
10,153
|
|
—
|
|
—
|
|
10,153
|
|
|||||||
|
Total pension fund assets
|
$
|
80,423
|
|
$
|
15,168
|
|
$
|
55,102
|
|
$
|
10,153
|
|
|||
The fair value of our pension plan assets measured using significant unobservable inputs (Level 3) at
December 31
are as follows:
|
2018
|
2017
|
||||||
|
Beginning balance
|
$
|
10,153
|
|
$
|
9,409
|
|
|
|
Actual return on assets held at reporting date
|
809
|
|
744
|
|
|||
|
Ending balance
|
$
|
10,962
|
|
$
|
10,153
|
|
|
The following table summarizes our expected future benefit payments of our pension and other post-retirement benefit plans:
72
|
Year Ending December 31,
|
Pension Plans
|
||
|
2019
|
$
|
4,293
|
|
|
2020
|
$
|
4,370
|
|
|
2021
|
$
|
4,475
|
|
|
2022
|
$
|
4,481
|
|
|
2023
|
$
|
4,602
|
|
|
2024 to 2028
|
$
|
23,922
|
|
|
16.
|
Accumulated Other Comprehensive Loss
|
The activity for each item of accumulated other comprehensive loss is as follows:
|
Foreign
currency items |
Derivative Instruments
|
Pension and Other Post-Retirement Benefit Plans
|
Accumulated other
comprehensive loss |
||||||||||||
|
Ending balance, December 31, 2016
|
$
|
(24,313
|
)
|
$
|
—
|
|
$
|
(24,532
|
)
|
$
|
(48,845
|
)
|
|||
|
Net current period change
|
7,141
|
|
—
|
|
814
|
|
7,955
|
|
|||||||
|
Reclassification adjustments for losses reclassified into income
|
—
|
|
—
|
|
(345
|
)
|
(345
|
)
|
|||||||
|
Ending balance, December 31, 2017
|
$
|
(17,172
|
)
|
$
|
—
|
|
$
|
(24,063
|
)
|
$
|
(41,235
|
)
|
|||
|
Net current period change
|
$
|
(5,675
|
)
|
$
|
—
|
|
$
|
(1,290
|
)
|
$
|
(6,965
|
)
|
|||
|
Derivative instruments
|
—
|
|
496
|
|
—
|
|
$
|
496
|
|
||||||
|
Reclassification adjustments for losses reclassified into income
|
—
|
|
—
|
|
233
|
|
233
|
|
|||||||
|
Ending balance, December 31, 2018
|
$
|
(22,847
|
)
|
$
|
496
|
|
$
|
(25,120
|
)
|
$
|
(47,471
|
)
|
|||
The related tax effects allocated to each component of other comprehensive income for the years ended
December 31, 2018
and
2017
are as follows:
|
2018
|
Before Tax
Amount |
Tax Expense
|
After Tax Amount
|
||||||||
|
Retirement benefits adjustment:
|
|||||||||||
|
Net actuarial gain and prior service credit
|
$
|
1,531
|
|
$
|
(241
|
)
|
$
|
1,290
|
|
||
|
Reclassification of actuarial loss and prior service cost to net income
|
(233
|
)
|
—
|
|
(233
|
)
|
|||||
|
Net unrealized gain
|
1,298
|
|
(241
|
)
|
1,057
|
|
|||||
|
Cumulative translation adjustment
|
5,675
|
|
—
|
|
5,675
|
|
|||||
|
Derivative instruments
|
(496
|
)
|
—
|
|
(496
|
)
|
|||||
|
Total other comprehensive income
|
$
|
6,477
|
|
$
|
(241
|
)
|
$
|
6,236
|
|
||
|
2017
|
Before Tax
Amount |
Tax Expense
|
After Tax Amount
|
||||||||
|
Retirement benefits adjustment:
|
|||||||||||
|
Net actuarial gain and prior service credit
|
$
|
1,072
|
|
$
|
(258
|
)
|
$
|
814
|
|
||
|
Reclassification of actuarial loss and prior service cost to net income
|
(257
|
)
|
(88
|
)
|
(345
|
)
|
|||||
|
Net unrealized loss
|
815
|
|
(346
|
)
|
469
|
|
|||||
|
Cumulative translation adjustment
|
7,141
|
|
—
|
|
7,141
|
|
|||||
|
Total other comprehensive income
|
$
|
7,956
|
|
$
|
(346
|
)
|
$
|
7,610
|
|
||
|
17.
|
Quarterly Financial Data (Unaudited)
|
The following is a condensed summary of quarterly results of operations for
2018
and
2017
:
73
|
Revenues
|
Gross Profit
|
Operating
Income |
Net Income (Loss)
|
Basic
Earnings (Loss) Per Share |
Dilutive
Earnings (Loss) Per Share 1 |
||||||||||||||||||
|
2018:
|
|||||||||||||||||||||||
|
First
|
$
|
215,734
|
|
$
|
30,823
|
|
$
|
15,276
|
|
$
|
9,853
|
|
$
|
0.33
|
|
$
|
0.32
|
|
|||||
|
Second
|
$
|
233,391
|
|
$
|
35,585
|
|
$
|
20,909
|
|
$
|
13,195
|
|
$
|
0.44
|
|
$
|
0.43
|
|
|||||
|
Third
|
$
|
225,010
|
|
$
|
32,177
|
|
$
|
16,243
|
|
$
|
12,583
|
|
$
|
0.42
|
|
$
|
0.41
|
|
|||||
|
Fourth
|
$
|
223,602
|
|
$
|
30,267
|
|
$
|
14,445
|
|
$
|
8,881
|
|
$
|
0.29
|
|
$
|
0.29
|
|
|||||
|
2017:
|
|||||||||||||||||||||||
|
First
|
$
|
173,416
|
|
$
|
21,405
|
|
$
|
4,560
|
|
$
|
628
|
|
$
|
0.02
|
|
$
|
0.02
|
|
|||||
|
Second
|
$
|
195,127
|
|
$
|
22,603
|
|
$
|
7,578
|
|
$
|
131
|
|
$
|
—
|
|
—
|
|
||||||
|
Third
|
$
|
198,349
|
|
$
|
25,052
|
|
$
|
10,693
|
|
$
|
4,763
|
|
$
|
0.16
|
|
0.16
|
|
||||||
|
Fourth
|
$
|
188,339
|
|
$
|
22,658
|
|
$
|
8,020
|
|
$
|
(7,227
|
)
|
$
|
(0.24
|
)
|
(0.24
|
)
|
||||||
|
(1)
|
See Note 12 for discussion on the computation of diluted shares outstanding.
|
74
|
Item 9.
|
Changes in and Disagreements with Accountants on Accounting and Financial Disclosure
|
There were no disagreements with our independent accountants on matters of accounting and financial disclosures or reportable events.
|
Item 9A.
|
Controls and Procedures
|
We maintain disclosure controls and procedures that are designed to provide reasonable assurance that information required to be disclosed in our Exchange Act reports is recorded, processed, summarized and reported within the time periods specified in the SEC’s rules and forms, and that such information is accumulated and communicated to our management, including our President and Chief Executive Officer and Chief Financial Officer, as appropriate, to allow timely decisions regarding required disclosure. Management necessarily applied its judgment in assessing the costs and benefits of such controls and procedures, which, by their nature, can provide only reasonable assurance regarding management’s disclosure control objectives.
Evaluation of Disclosure Controls and Procedures
We evaluated, with the participation of our principal executive officer and principal financial officer, the effectiveness of our disclosure controls and procedures (as defined in Rule 13a-15(e) under the Securities Exchange Act of 1934 (the “Exchange Act”)) as of
December 31, 2018
. Based on this evaluation, our principal executive officer and principal financial officer have concluded that our disclosure controls and procedures were effective as of
December 31, 2018
to provide reasonable assurance that information required to be disclosed in our reports under the Exchange Act is recorded, processed, summarized and reported within the time periods specified in the SEC rules and forms and that such information is accumulated and communicated to management as appropriate to allow timely decisions regarding required disclosure.
Management’s Report on Internal Control Over Financial Reporting
Management is responsible for establishing and maintaining adequate internal control over financial reporting as defined in Rule 13a-15(f) under the Exchange Act. Our internal control system is designed to provide reasonable assurance regarding the reliability of financial reporting and the preparation of financial statements for external purposes in accordance with generally accepted accounting principles. Because of its inherent limitations, internal control over financial reporting may not prevent or detect misstatements. Also, controls deemed effective now may become inadequate in the future because of changes in conditions, or because compliance with the policies or procedures has deteriorated or been circumvented. Management assessed the effectiveness of our internal control over financial reporting as of
December 31, 2018
. In making this assessment, management used the criteria established in the Internal Control-Integrated Framework issued by the Committee of Sponsoring Organizations of the Treadway Commission (2013 framework) (the “COSO criteria”). Based on management’s assessment and the COSO criteria, management believes that our internal control over financial reporting was effective as of
December 31, 2018
.
Our independent registered public accounting firm, KPMG LLP, has issued a report on our internal control over financial reporting. KPMG LLP’s report appears following Item 9A and expresses an unqualified opinion on the effectiveness of our internal control over financial reporting.
Changes in Internal Control Over Financial Reporting
There were no changes in our internal control over financial reporting during the year ended
December 31, 2018
that have materially affected, or are reasonably likely to materially affect, our internal control over financial reporting.
75
REPORT OF INDEPENDENT REGISTERED PUBLIC ACCOUNTING FIRM
To the Stockholders and Board of Directors
Commercial Vehicle Group, Inc.:
Opinion on Internal Control Over Financial Reporting
We have audited Commercial Vehicle Group, Inc. and subsidiaries’ (the Company) internal control over financial reporting as of December 31, 2018, based on criteria established in
Internal Control - Integrated Framework (2013)
issued by the Committee of Sponsoring Organizations of the Treadway Commission. In our opinion, the Company maintained, in all material respects, effective internal control over financial reporting as of December 31, 2018, based on criteria established in
Internal Control - Integrated Framework (2013)
issued by the Committee of Sponsoring Organizations of the Treadway Commission.
We also have audited, in accordance with the standards of the Public Company Accounting Oversight Board (United States) (PCAOB), the consolidated balance sheets of the Company as of December 31, 2018 and 2017, the related consolidated statements of operations, comprehensive income (loss), stockholders’ equity, and cash flows for each of the years in the three-year period ended December 31, 2018, and the related notes and financial statement schedule II; Valuation of Qualifying Accounts (collectively, the consolidated financial statements), and our report dated March 11, 2019 expressed an unqualified opinion on those consolidated financial statements.
Basis for Opinion
The Company’s management is responsible for maintaining effective internal control over financial reporting and for its assessment of the effectiveness of internal control over financial reporting, included in the accompanying Management’s Report on Internal Control Over Financial Reporting. Our responsibility is to express an opinion on the Company’s internal control over financial reporting based on our audit. We are a public accounting firm registered with the PCAOB and are required to be independent with respect to the Company in accordance with the U.S. federal securities laws and the applicable rules and regulations of the Securities and Exchange Commission and the PCAOB.
We conducted our audit in accordance with the standards of the PCAOB. Those standards require that we plan and perform the audit to obtain reasonable assurance about whether effective internal control over financial reporting was maintained in all material respects. Our audit of internal control over financial reporting included obtaining an understanding of internal control over financial reporting, assessing the risk that a material weakness exists, and testing and evaluating the design and operating effectiveness of internal control based on the assessed risk. Our audit also included performing such other procedures as we considered necessary in the circumstances. We believe that our audit provides a reasonable basis for our opinion.
Definition and Limitations of Internal Control Over Financial Reporting
A company’s internal control over financial reporting is a process designed to provide reasonable assurance regarding the reliability of financial reporting and the preparation of financial statements for external purposes in accordance with generally accepted accounting principles. A company’s internal control over financial reporting includes those policies and procedures that (1) pertain to the maintenance of records that, in reasonable detail, accurately and fairly reflect the transactions and dispositions of the assets of the company; (2) provide reasonable assurance that transactions are recorded as necessary to permit preparation of financial statements in accordance with generally accepted accounting principles, and that receipts and expenditures of the company are being made only in accordance with authorizations of management and directors of the company; and (3) provide reasonable assurance regarding prevention or timely detection of unauthorized acquisition, use, or disposition of the company’s assets that could have a material effect on the financial statements.
Because of its inherent limitations, internal control over financial reporting may not prevent or detect misstatements. Also, projections of any evaluation of effectiveness to future periods are subject to the risk that controls may become inadequate because of changes in conditions, or that the degree of compliance with the policies or procedures may deteriorate.
/s/ KPMG LLP
Columbus, Ohio
March 11, 2019
76
|
Item 9B.
|
Other Information
|
None.
PART III
|
Item 10.
|
Directors, Executive Officers and Corporate Governance
|
|
A.
|
Directors of the Registrant
|
The following table sets forth certain information with respect to our directors as of
March 11, 2019
:
|
Name
|
Age
|
|
Principal Position(s)
|
||
|
Scott C. Arves
|
61
|
|
Chairman and Director
|
||
|
Patrick E. Miller
|
51
|
|
President, Chief Executive Officer and Director
|
||
|
Harold C. Bevis
|
59
|
|
Director
|
||
|
Roger L. Fix
|
64
|
|
Director
|
||
|
Robert C. Griffin
|
71
|
|
Director
|
||
|
Wayne M. Rancourt
|
56
|
|
Director
|
||
|
Richard A. Snell
|
76
|
|
Director
|
||
|
Janice E. Stipp
|
59
|
|
Director
|
||
The following biographies describe the business experience of our directors:
Scott C. Arves
has served as a Director since July 2005 and as Chairman since May 2018. From January 2007 to June 2015, Mr. Arves served as President and Chief Executive Officer of Transport America, a truckload, intermodal and logistics provider. Prior to joining Transport America, Mr. Arves was President of Transportation for Schneider National, Inc., a provider of transportation, logistics and related services, from May 2000 to July 2006. Mr. Arves brings over 30 years of transportation experience to his role as Director, including 19 years of P&L experience and 16 years as a Division President or Chief Executive Officer.
Patrick E. Miller
has served as President and Chief Executive Officer and a Director since November 2015. Mr. Miller, who most recently was President of the Company’s Global Truck & Bus Segment, has been with the Company since 2005. During this time, he served in the capacity of Senior Vice President & General Manager of Aftermarket; Senior Vice President of Global Purchasing; Vice President of Global Sales; Vice President & General Manager of North American Truck and Vice President & General Manager of Structures. As of December 2018, Mr. Miller was appointed to the board of directors for Federal Signal Corporation. Prior to joining the Company, Mr. Miller held engineering, sales, and operational leadership positions with Hayes Lemmerz International, Alcoa, Inc. and ArvinMeritor. He holds a Bachelor of Science in Industrial Engineering from Purdue University and a Masters of Business Administration from the Harvard University Graduate School of Business.
Harold C. Bevis
has served as a Director since June 2014. He has 25 years of business leadership experience, including 15 years as a CEO. He was a business leader at both GE and Emerson Electric. He has led or directed 8 businesses in 6 industries, 148 plants in 22 countries, 12 new business/new plant startups, 11 acquisitions, and 24 business/plant expansions. Mr. Bevis is currently President of OmniMax International, a portfolio of building products businesses, since October 2017. Mr. Bevis earned a BS degree in industrial engineering from Iowa State University and an MBA degree from Columbia Business School. He is a member of the National Association of Corporate Directors and has served on 5 Boards of Directors.
Roger L. Fix
has served as a Director since June 2014. He served as a member of the board of directors of Standex International Corporation from 2001 until 2017, when he retired from the Standex board. He served as Non-Executive Chairman from 2014 - 2016, and President and Chief Executive Officer of Standex from 2003 to 2014. He was Standex’s President and Chief Operating Officer from 2001 to 2003. Prior to joining Standex, Mr. Fix held a number of general management positions at Emerson Electric, the TI Group, plc and TRW over a period of more than 20 years. Mr. Fix has served as a Director of Flowserve Corporation since 2006 and as Chairman of the Corporate Nominating and Governance Committee and a member of the Audit Committee. Mr. Fix currently serves as the Chairman of the Board of Flowserve Corporation. Mr. Fix earned a master’s degree in mechanical engineering from the University of Texas and a bachelor-of-science degree in mechanical engineering from the University of Nebraska.
Robert C. Griffin
has served as a Director since July 2005. His career spanned over 25 years in the financial sector, including Head of Investment Banking Americas and Management Committee Member for Barclay’s Capital from 2000 to 2002. Prior to that, Mr. Griffin served as the Global Head of Financial Sponsor Coverage for Banc of America Securities and served in a number of executive management roles at Banc of America. Mr. Griffin served as a Director of GSE Holdings, Inc., from December 2011 to
77
August 2014 where he was Chairman of the Board and a member of the Compensation Committee and the Nominating and Corporate Governance Committee. Mr. Griffin served as a Director of The J.G. Wentworth Company where he was Chairman of the Audit Committee from October 2013 to January 2018. Mr. Griffin serves as a Director of Builders FirstSource, Inc., where he is Chairman of the Audit Committee, a member of the Compensation Committee and the Nominating Committee and was Chairman of their Special Committee in 2009 and 2015. Mr. Griffin brings strong financial and management expertise to our Board through his experience as an officer and director of a public company, service on other boards and his senior leadership tenure within the financial industry.
Wayne M. Rancourt
has served as a Director since July 2016. Mr. Rancourt has served as Executive Vice President, Chief Financial Officer & Treasurer of Boise Cascade Company since August 2009, a $4.4 billion in revenues North American based manufacturing and distribution company. Mr. Rancourt has over 30 years of experience in various finance roles including chief financial officer, treasurer, investor relations, strategic planning, as well as internal audit. Mr. Rancourt received a bachelor of science degree in Accounting from Central Washington University. Mr. Rancourt brings strong financial expertise to the Board through his experience in various finance roles.
Richard A. Snell
has served as a Director since August 2004. He served as Chairman and Chief Executive Officer of Qualitor, Inc. from May 2005 until April 2015 and as an Operating Partner at HCI Partners from 2003 to December 2015. Mr. Snell served as Chairman and Chief Executive Officer of Federal-Mogul Corporation, an automotive parts manufacturer, where he served from 1996 to 2000, and as Chief Executive Officer at Tenneco Automotive, also an automotive parts manufacturer, where he was employed from 1987 to 1996. Mr. Snell served as a Director of Schneider National, Inc., a multi-national trucking company, and as a member of their Compensation and Governance Committees from 1996 to 2011. Mr. Snell has informed the Company that he will be retiring from the Board, without standing for re-election at the 2019 annual meeting of stockholders, effective May 16, 2019.
Janice E. Stipp
has served as a Director since February 2019. Ms. Stipp has over 35 years of financial and accounting experience including as chief financial officer of both public and private companies. Ms. Stipp currently serves as a Director of ArcBest Corporation, NN, Inc., and is on the Michigan State University Foundation Board. Ms. Stipp graduated from Michigan State University in 1981 with a B.A. in accounting, and from Wayne State University in 1987 with an M.B.A., and received her Certified Public Accountant certification in 1983 and Chartered Global Management Accountant certification in 2014.
|
B.
|
Executive Officers
|
Information regarding our executive officers is set forth in Item 1 of Part I of this Annual Report on Form 10-K under the heading “Executive Officers of the Registrant.”
There are no family relationships between any of our directors or executive officers.
|
C.
|
Section 16(a) Beneficial Ownership Reporting Compliance and Corporate Governance
|
The information required by Item 10 with respect to compliance with reporting requirements is incorporated herein by reference to the sections labeled “Section 16(a) Beneficial Ownership Reporting Compliance” and “Proposal No. 1 - Election of Directors - Corporate Governance,” which appear in CVG’s 2019 Proxy Statement.
|
Item 11.
|
Executive Compensation
|
The information required by Item 11 is incorporated herein by reference to the sections labeled “Executive Compensation - 2018 Director Compensation Table” and “Executive Compensation” and “Proposal No. 1 - Election of Directors - Corporate Governance,” which appear in CVG’s 2019 Proxy Statement, including information under the heading “Compensation Discussion and Analysis.”
|
Item 12.
|
Security Ownership of Certain Beneficial Owners and Management and Related Stockholder Matters
|
Options to purchase common shares of our common stock were granted to certain of our executives and key employees under our 2014 Equity Incentive Plan. There are no outstanding options, warrants or rights associated with the Company's Equity Incentive Plans. The following table summarizes the number of securities remaining to be issued under the outstanding equity compensation plan as of
December 31, 2018
:
78
|
Number of Securities to be
Issued upon Exercise of
Outstanding Options,
Warrants and Rights
|
Weighted-average
Exercise Price of
Outstanding
Options, Warrants
and Rights
|
Number of
Securities
Remaining Available
for Future Issuance
Under Equity
Compensation Plans
|
|||||||
|
2014 Equity Incentive Plan approved by security holders
|
—
|
|
$
|
—
|
|
2,128,359
|
|
||
The information required by Item 12 is incorporated herein by reference to the section labeled “Security Ownership of Certain Beneficial Owners and Management,” which appears in CVG’s 2019 Proxy Statement.
|
Item 13
|
Certain Relationships, Related Transactions and Director Independence
|
The information required by Item 13 is incorporated herein by reference to the sections labeled “Certain Relationships and Related Transactions” and “Proposal No. 1 - Election of Directors - Corporate Governance,” which appear in CVG’s 2019 Proxy Statement.
|
Item 14.
|
Principal Accountant Fees and Services
|
The information required by Item 14 is incorporated herein by reference to the section labeled “Proposal No. 3 - Ratification of Appointment of the Independent Registered Public Accounting Firm,” which appears in CVG’s 2019 Proxy Statement.
79
PART IV
|
Item 15.
|
Exhibits, Financial Statements Schedules
|
(1)
LIST OF FINANCIAL STATEMENT SCHEDULES
The following financial statement schedule of the Corporation and its subsidiaries is included herein:
Schedule II - Valuation and Qualifying Accounts and Reserves.
COMMERCIAL VEHICLE GROUP, INC. AND SUBSIDIARIES
SCHEDULE II: VALUATION AND QUALIFYING ACCOUNTS
December 31, 2018
,
2017
and
2016
Accounts Receivable Allowances:
Activity for the years ended
December 31
is as follows (in thousands):
|
2018
|
2017
|
2016
|
|||||||||
|
Balance - Beginning of the year
|
$
|
5,242
|
|
$
|
3,881
|
|
$
|
4,539
|
|
||
|
Provisions
|
7,327
|
|
5,488
|
|
5,547
|
|
|||||
|
Utilizations
|
(7,392
|
)
|
(4,264
|
)
|
(6,063
|
)
|
|||||
|
Currency translation adjustment
|
(38
|
)
|
137
|
|
(142
|
)
|
|||||
|
Balance - End of the year
|
$
|
5,139
|
|
$
|
5,242
|
|
$
|
3,881
|
|
||
Income Tax Valuation Allowance:
Activity for the years ended
December 31
is as follows (in thousands):
|
2018
|
2017
|
2016
|
||||||||
|
Balance - Beginning of the year
|
15,021
|
|
$
|
12,546
|
|
$
|
14,404
|
|
||
|
Provisions
|
874
|
|
2,506
|
|
2,917
|
|
||||
|
Utilizations
|
(1,230
|
)
|
(31
|
)
|
(4,775
|
)
|
||||
|
Balance - End of the year
|
14,665
|
|
$
|
15,021
|
|
$
|
12,546
|
|
||
All other schedules for which provision is made in the applicable accounting regulations of the SEC are not required under the related instructions or are inapplicable and, therefore, have been omitted.
|
(2)
|
LIST OF EXHIBITS
|
The following exhibits are either included in this report or incorporated herein by reference as indicated below:
80
EXHIBIT INDEX
|
Exhibit No.
|
|
Description
|
|
|
Asset Purchase Agreement, dated as of January 28, 2011, by and among CVG Alabama LLC and Bostrom Seating, Inc., (incorporated by reference to the Company’s annual report on Form 10-K (File No. 000-34365), filed on March 15, 2011).
|
|
|
|
Amended and Restated Certificate of Incorporation of the Company (incorporated by reference to the Company’s quarterly report on Form 10-Q (File No. 000-50890), filed on September 17, 2004).
|
|
|
|
Certificate of Amendment to the Amended and Restated Certificate of Incorporation of the Company, dated as of May 12, 2011 (incorporated by reference to the Company’s current report on Form 8-K (File No. 001-34365), filed on May 13, 2011).
|
|
|
|
Certificate of Amendment to the Amended and Restated Certificate of Incorporation of the Company, dated as of May 15, 2015 (incorporated by reference to the Company’s current report on Form 8-K (File No. 001-34365), filed on May 15, 2015).
|
|
|
Certificate of Amendment to the Amended and Restated Certificate of Incorporation of the Company, dated as of May 17, 2018 (incorporated by reference to the Company’s current report on Form 8-K (File No. 001-34365), filed on May 18, 2018).
|
||
|
Amended and Restated By-laws of the Company (incorporated by reference to the Company’s quarterly report on Form 10-Q (File No. 000-50890), filed on September 17, 2004).
|
||
|
|
Certificate of Designations of Series A Preferred Stock (included as Exhibit A to the Rights Agreement incorporated by reference to Exhibit 4.8) (incorporated by reference to the Company’s current report on Form 8-K (File No. 000-50890), filed on May 22, 2009.
|
|
|
|
Registration Rights Agreement, dated July 6, 2005, among the Company, the subsidiary guarantors party thereto and the purchasers named therein (incorporated herein by reference to the Company’s current report on Form 8-K (File No. 000-50890), filed on July 8, 2005).
|
|
|
|
Commercial Vehicle Group, Inc. Rights Agreement, dated as of May 21, 2009, by and between the Company and Computershare Trust Company, N.A. (incorporated by reference to the Company’s current report on Form 8-K (File No. 000-50890), filed on May 22, 2009).
|
|
|
|
Form of Rights Certificate (included as Exhibit B to the Rights Agreement) (incorporated by reference to the Company’s current report on Form 8-K (File No. 000-50890), filed on May 22, 2009).
|
|
|
|
Form of Summary of Rights to Purchase (included as Exhibit C to the Rights Agreement) (incorporated by reference to the Company’s current report on Form 8-K (File No. 000-50890), filed on May 22, 2009).
|
|
|
|
Commercial Vehicle Group, Inc. Amendment No. 1 to Rights Agreement, dated as of March 9, 2011, by and between the Company and Computershare Trust Company, N.A. (incorporated by reference to the Company’s current report on Form 8-K (File No. 001-34365), filed on March 9, 2011).
|
|
|
|
Form of Certificate of Common Stock of the Company (incorporated by reference to the Company’s registration statement on Form S-1/A (File No. 333-115708), filed August 3, 2004).
|
|
|
|
Amended and Restated Loan and Security Agreement, dated as of April 26, 2011, by and among the Company, certain of the Company’s subsidiaries, as borrowers, and Bank of America, N.A. as agent and lender (incorporated by reference to the Company’s current report on Form 8-K (File No. 001-34365), filed on April 28, 2011.
|
|
|
|
Second Amended and Restated Loan and Security Agreement, dated as of November 15, 2013, by and among the Company, certain of the Company’s subsidiaries, as borrowers, and Bank of America, N.A. as agent and lender, (incorporated by reference to the Company’s current report on Form 8-K (File No. 001-34365), filed on November 21, 2013).
|
|
|
|
Third Amended and Restated Loan and Security Agreement, dated as of April 12, 2017, by and among the Company, certain of the Company’s subsidiaries, as borrowers, and Bank of America, N.A. as agent and other lender parties thereto (incorporated by reference to the Company’s current report on Form 8-K (File No. 001-34365), filed on April 13, 2017).
|
|
|
|
Term Loan Agreement, dated as of April 12, 2017, by and among the Company, Bank of America, N.A., as administrative agent, and other lender parties thereto (incorporated by reference to the Company’s current report on Form 8-K (File No. 001-34365), filed on April 13, 2017).
|
|
81
|
Exhibit No.
|
|
Description
|
|
|
Commercial Vehicle Group, Inc. Fourth Amended and Restated Equity Incentive Plan (incorporated by reference to the Company’s current report on Form 8-K (File No. 001-34365), filed on May 13, 2011).
|
|
|
|
Commercial Vehicle Group, Inc. 2014 Equity Incentive Plan (incorporated by reference from the Company proxy statement on Form Schedule 14A (File No. 001-34365), filed on April 11, 2014).
|
|
|
|
Amended and Restated Commercial Vehicle Group, Inc. 2014 Equity Incentive Plan (incorporated by reference from the Company's current report on Form 8-K (File No. 001-34365), filed on May 17, 2017).
|
|
|
|
Commercial Vehicle Group, Inc. 2017 Annual Incentive Plan (incorporated by reference from the Company current report on Form 10-Q (File No. 001-34365), filed on May 5, 2017).
|
|
|
Commercial Vehicle Group, Inc. Annual Incentive Plan (incorporated by reference to the Company’s current report on Form 8-K (File No. 001-34365), filed on March 14, 2018).
|
||
|
|
Registration Agreement, dated October 5, 2000, by and among Bostrom Holding, Inc. and the investors listed on Schedule A attached thereto (incorporated by reference to the Company’s registration statement on Form S-1 (File No. 333-115708), filed on May 21, 2004).
|
|
|
|
Joinder to the Registration Agreement, dated as of May 20, 2004, by and among Commercial Vehicle Group, Inc. and the prior stockholders of Trim Systems (incorporated by reference to the Company’s quarterly report on Form 10-Q (File No. 000-50890), filed on September 17, 2004).
|
|
|
|
Assignment and Assumption Agreement, dated as of June 1, 2004, between Mayflower Vehicle Systems PLC and Mayflower Vehicle Systems, Inc. (incorporated by reference to the Company’s registration statement on Form S-1 (File No. 333-125626), filed on June 8, 2005).
|
|
|
|
Form of Cash Performance Award pursuant to the Commercial Vehicle Group, Inc. Fourth Amended and Restated Equity Incentive Plan (incorporated by reference to the Company’s Annual Report on Form 10-K (File No. 001-34365), filed on March 11, 2013).
|
|
|
|
Form of Restricted Stock Agreement pursuant to the Commercial Vehicle Group, Inc. 2014 Equity Incentive Plan (incorporated by reference from the Company quarterly report on Form 10-Q (File No. 001-34365), filed on November 7, 2014).
|
|
|
|
Offer letter, dated September 27, 2013, to C. Timothy Trenary (incorporated by reference to the Company’s current report on Form 8-K (File No. 001-34365), filed on September 30, 2013).
|
|
|
|
Change in Control & Non-Competition Agreement dated January 23, 2014 with C. Timothy Trenary (incorporated by reference to the Company’s current report on Form 8-K (File No. 001-34365), filed on January 24, 2014).
|
|
|
|
||
|
|
Amended and Restated Deferred Compensation Plan dated November 5, 2008 (incorporated by reference to the Company’s annual report on Form 10-K (File No. 000-50890), filed on March 16, 2009).
|
|
|
|
||
|
|
Form of indemnification agreement with directors and executive officers (incorporated by reference to the Company’s annual report on Form 10-K (File No. 000-50890), filed on March 14, 2008).
|
|
|
|
||
|
|
Change in Control & Non-Competition Agreement dated October 24, 2014 with Patrick Miller (incorporated by reference to the Company’s current report on Form 8-K (File No. 001-34365), filed on October 28, 2014).
|
|
|
|
||
|
|
Employment Agreement, dated as of March 22, 2016, between the Company and Patrick E. Miller (incorporated by reference to the company’s current report on form 8-K (File No. 001-34365), filed on March 24, 2016).
|
|
|
|
Change in Control & Non-Competition Agreement dated October 24, 2014 with Stacie Fleming (incorporated by reference to the Company’s current report on Form 8-K (File No. 001-34365), filed on October 28, 2014).
|
|
|
|
Change in Control & Non-Competition Agreement dated February 1, 2016 with Dale McKillop (incorporated by reference to the Company's Annual Report on Form 10-K (File No. 001-34365), filed on March 12, 2018).
|
|
|
|
Retention Bonus Agreement between the Company and Mr. Trenary effective March 22, 2016 (incorporated by reference to the Company’s quarterly report on Form 10-Q (File No. 001-34365), filed on August 3, 2016).
|
|
|
|
Contract for Purchase and Sale of Real Property between Mayflower Vehicle Systems, LLC and Warren Distribution, Inc. dated July 24, 2017 (incorporated by reference from the Company quarterly report on Form 10-Q (File No. 001-34365), filed on November 7, 2017).
|
|
82
|
Exhibit No.
|
|
Description
|
|
|
Subsidiaries of Commercial Vehicle Group, Inc.
|
|
|
|
Consent of KPMG LLP.
|
|
|
|
302 Certification by Patrick E. Miller, President and Chief Executive Officer.
|
|
|
|
302 Certification by C. Timothy Trenary, Executive Vice President and Chief Financial Officer.
|
|
|
|
906 Certification by Patrick E. Miller pursuant to 18 U.S.C. Section 1350, as adopted pursuant to the Sarbanes-Oxley Act of 2002.
|
|
|
|
906 Certification by C. Timothy Trenary pursuant to 18 U.S.C. Section 1350, as adopted pursuant to the Sarbanes-Oxley Act of 2002.
|
|
|
101.INS
|
|
XBRL Instance Document
|
|
101.SCH
|
|
XBRL Schema Document
|
|
101.CAL
|
|
XBRL Calculation Linkbase Document
|
|
101.LAB
|
|
XBRL Label Linkbase Document
|
|
101.PRE
|
|
XBRL Presentation Linkbase Document
|
|
101.DEF
|
|
XBRL Definition Linkbase Document
|
|
*
|
Management contract or compensatory plan or arrangement required to be filed as an exhibit to this annual report on Form 10-K.
|
|
**
|
The schedules and exhibits to the Asset Purchase Agreement have been omitted from this filing pursuant to Item 601(b)(2) of Regulation S—K. The Company will furnish supplementally a copy of any such omitted schedules or exhibits to the SEC upon request.
|
All other items included in an Annual Report on Form 10-K are omitted because they are not applicable or the answers thereto are none.
83
SIGNATURES
Pursuant to the requirements of Section 13 of the Securities Exchange Act of 1934, the Registrant has duly caused this report to be signed on its behalf by the undersigned, thereunto duly authorized.
|
COMMERCIAL VEHICLE GROUP, INC.
|
|
|
By:
|
/s/ Patrick E. Miller
|
|
Patrick E. Miller
|
|
|
President and Chief Executive Officer
|
|
Date:
March 11, 2019
Pursuant to the requirements of the Securities Act of 1934, this report has been signed below by the following persons on behalf of the Registrant and in the capacities indicated on
March 11, 2019
.
|
Signature
|
|
Title
|
|
/s/ Scott C. Arves
|
|
Chairman and Director
|
|
Scott C. Arves
|
||
|
/s/ Patrick E. Miller
|
|
President, Chief Executive Officer
|
|
Patrick E. Miller
|
(Principal Executive Officer) and Director
|
|
|
/s/ Harold C. Bevis
|
|
Director
|
|
Harold C. Bevis
|
||
|
/s/ Roger L. Fix
|
Director
|
|
|
Roger L. Fix
|
||
|
/s/ Robert C. Griffin
|
|
Director
|
|
Robert C. Griffin
|
||
|
/s/ Wayne M. Rancourt
|
|
Director
|
|
Wayne M. Rancourt
|
||
|
/s/ Richard A. Snell
|
Director
|
|
|
Richard A. Snell
|
||
|
/s/ Janice E. Stipp
|
Director
|
|
|
Janice E. Stipp
|
||
|
/s/ C. Timothy Trenary
|
|
Chief Financial Officer
|
|
C. Timothy Trenary
|
(Principal Financial Officer)
|
|
|
/s/ Stacie N. Fleming
|
|
Chief Accounting Officer
|
|
Stacie N. Fleming
|
(Principal Accounting Officer)
|
|
84
TABLE OF CONTENTS
Part IItem 1. BusinessItem 1A. Risk FactorsItem 1B. Unresolved Staff CommentsItem 2. PropertiesItem 3. Legal ProceedingsItem 4. Mine Safety DisclosuresPart IIItem 5. Market For Registrant S Common Equity, Related Stockholder Matters and Issuer Purchases Of Equity SecuritiesItem 6. Selected Financial DataItem 7. Management S Discussion and Analysis Of Financial Condition and Results Of OperationsItem 7A. Quantitative and Qualitative Disclosures About Market RiskItem 8. Financial Statements and Supplementary DataItem 9. Changes in and Disagreements with Accountants on Accounting and Financial DisclosureItem 9A. Controls and ProceduresItem 9B. Other InformationPart IIIItem 10. Directors, Executive Officers and Corporate GovernanceItem 11. Executive CompensationItem 12. Security Ownership Of Certain Beneficial Owners and Management and Related Stockholder MattersItem 13certain Relationships, Related Transactions and Director IndependenceItem 14. Principal Accountant Fees and ServicesPart IVItem 15. Exhibits, Financial Statements Schedules