COVENANT LOGISTICS GROUP, INC.
10-Ks and 10-Qs
|
|
|
|
|
|
|
|
|
|
|
|
|
|
|
|
|
|
|
|
|
|
|
|
|
|
|
|
|
|
|
|
|
|
|
|
|
|
|
|
|
|
|
|
|
|
|
|
|
|
|
|
|
|
|
|
|
|
|
UNITED STATES
SECURITIES AND EXCHANGE COMMISSION
Washington, D.C. 20549
FORM 10-K
(Mark One)
|
[X]
|
ANNUAL REPORT PURSUANT TO SECTION 13 OR 15(d) OF THE SECURITIES EXCHANGE ACT OF 1934
|
|
|
For the fiscal year ended
December 31, 2018
|
OR
|
[ ]
|
TRANSITION REPORT PURSUANT TO SECTION 13 OR 15(d) OF THE SECURITIES EXCHANGE ACT OF 1934
|
|
|
For the transition period from to
|
Commission file number
0-24960

COVENANT TRANSPORTATION GROUP, INC.
(Exact name of registrant as specified in its charter)
|
Nevada
|
88-0320154
|
|
(State / other jurisdiction of incorporation or organization)
|
(I.R.S. Employer Identification No.)
|
|
400 Birmingham Hwy.
|
|
|
Chattanooga, TN
|
37419
|
|
(Address of principal executive offices)
|
(Zip Code)
|
|
Registrant's telephone number, including area code:
|
423 - 821-1212
|
|
|
|
|
Securities registered pursuant to Section 12(b) of the Act:
|
$0.01 Par Value Class A Common Stock – The NASDAQ Global Select Market
|
|
|
(Title of class)
|
|
Securities registered pursuant to Section 12(g) of the Act:
|
None
|
Indicate by check mark if the registrant is a well-known seasoned issuer, as defined in Rule 405 of the Securities Act.
[ ] Yes [X] No
Indicate by check mark if the registrant is not required to file reports pursuant to Section 13 or 15(d) of the Act.
[ ] Yes [X] No
Indicate by check mark whether the registrant (1) has filed all reports required to be filed by Section 13 or 15(d) of the Securities Exchange Act of 1934 during the preceding 12 months (or for such shorter period that the registrant was required to file such reports), and (2) has been subject to such filing requirements for the past 90 days.
[X] Yes [ ] No
Indicate by check mark whether the registrant has submitted electronically every Interactive Data File required to be submitted pursuant to Rule 405 of Regulation S-T (§ 232.405 of this chapter) during the preceding 12 months (or for such shorter period that the registrant was required to submit and post such files).
[X] Yes [ ] No
Indicate by check mark if disclosure of delinquent filers pursuant to Item 405 of Regulation S-K (§ 229.405 of this chapter) is not contained herein, and will not be contained, to the best of registrant's knowledge, in definitive proxy or information statements incorporated by reference in Part III of this Form 10-K or any amendments to this Form 10-K. [X]
1
Indicate by check mark whether the registrant is a large accelerated filer, an accelerated filer, a non-accelerated filer, a smaller reporting company, or emerging growth company. See the definitions of “large accelerated filer,” “accelerated filer,” “smaller reporting company,” and “emerging growth company” in Rule 12b-2 of the Exchange Act.
|
Large accelerated filer
|
[ ]
|
Accelerated filer
|
[X]
|
|
Non-accelerated filer
|
[ ]
|
Smaller reporting company
|
[ ]
|
|
|
|
Emerging growth company
|
[ ]
|
If an emerging growth company, indicate by check mark if the registrant has elected not to use the extending transition period for complying with any new or revised financial accounting standards provided pursuant to Section 13(a) of the Exchange Act. [ ]
Indicate by check mark whether the registrant is a shell company (as defined in Rule 12b-2 of the Exchange Act).
[ ] Yes [X] No
The aggregate market value of the common equity held by non-affiliates of the registrant as of June 29,
2018, the last business day of the registrant’s most recently completed second fiscal quarter, was approximately
$413.4 million (based upon the
$31.50 per share closing price on that date as reported by NASDAQ). In making this calculation the registrant has assumed, without admitting for any purpose, that all executive officers, directors, and affiliated holders of more than 10% of a class of outstanding common stock, and no other persons, are affiliates.
As of
March 12, 2019, the registrant had
16,018,513 shares of Class A common stock and 2,350,000 shares of Class B common stock outstanding.
Portions of the materials from the registrant's definitive proxy statement for the
2019 Annual Meeting of Stockholders to be held on
May 8, 2019, have been incorporated by reference into Part III of this Form 10-K.
2
|
Part I
|
|
|
|
|
|
Item 1.
|
4
|
|
|
|
Item 1A.
|
16
|
|
|
|
Item 1B.
|
32
|
|
|
|
Item 2.
|
32
|
|
|
|
Item 3.
|
32
|
|
|
|
Item 4.
|
33
|
|
|
|
|
|
|
|
Part II
|
|
|
|
|
|
Item 5.
|
34
|
|
|
|
Item 6.
|
35
|
|
|
|
Item 7.
|
36
|
|
|
|
Item 7A.
|
54
|
|
|
|
Item 8.
|
55
|
|
|
|
Item 9.
|
55
|
|
|
|
Item 9A.
|
55
|
|
|
|
Item 9B.
|
57
|
|
|
|
|
|
|
|
Part III
|
|
|
|
|
|
Item 10.
|
58
|
|
|
|
Item 11.
|
58
|
|
|
|
Item 12.
|
58
|
|
|
|
Item 13.
|
59
|
|
|
|
Item 14.
|
59
|
|
|
|
|
|
|
|
Part IV
|
|
|
|
|
|
Item 15.
|
60
|
|
|
|
Item 16.
|
62
|
|
|
|
|
||
|
63
|
|||
|
|
|
||
|
64
|
|||
|
|
|
||
| Report of Independent Registered Public Accounting Firm - Opinion on Internal Control Over Financial Reporting | 65 | ||
|
Financial Data
|
|
||
|
|
67
|
||
|
|
68
|
||
|
|
69
|
||
|
|
70
|
||
|
|
71
|
||
|
|
72
|
||
PART I
|
ITEM 1.
|
This Annual Report on Form 10-K contains certain statements that may be considered forward-looking statements within the meaning of Section 27A of the Securities Act of 1933, as amended and Section 21E of the Securities Exchange Act of 1934, as amended and such statements are subject to the safe harbor created by those sections and the Private Securities Litigation Reform Act of 1995, as amended. All statements, other than statements of historical or current fact, are statements that could be deemed forward-looking statements, including without limitation: any projections of earnings, revenues, or other financial items; any statement of plans, strategies, and objectives of management for future operations; any statements concerning proposed new services or developments; any statements regarding future economic conditions or performance; and any statements of belief and any statements of assumptions underlying any of the foregoing. In this Annual Report, statements relating to our ability to achieve our strategic plan, future improvement opportunities, our ability to recruit and retain qualified independent contractors and qualified driver and non-driver employees, our ability to react to market conditions, our ability to gain market share, future demand for and supply of new and used tractors and trailers (including expected prices of such equipment), expected functioning and effectiveness of our information systems and other technology we implement, expected sources and adequacy of working capital and liquidity, future relationships, use, classification, compensation, and availability with respect to third-party service providers, future driver market conditions, future allocation of capital, including equipment purchases and upgrades, expected settlement of operating lease obligations, future asset sales and acquisitions, future insurance, litigation, and claims levels and expenses, future tax rates, expense, and deductions, future fuel management, expense, and the future effectiveness of fuel surcharge programs, future interest rates and effectiveness of interest rate swaps, future investments in and the growth of individual segments and services, expected capital expenditures (including the future mix of lease and purchase obligations), future asset utilization and efficiency, future trucking capacity, expected freight demand and volumes, future rates, future depreciation and amortization, future compliance with and impact of existing and proposed federal and state laws and regulations, future salaries, wages, and other employee benefit expenses, future earnings from and value of our investments, future customer relationships, future defaults under debt agreements, future payment of financing and lease liabilities, future unforeseen events such as strikes, work stoppages, and weather catastrophes, future acquisitions, future credit availability, future stock prices, future goodwill impairment, including expected borrowing base increases in our credit facility, and the future incurrence of other debt, future performance of our subsidiaries, expected transition to and effect of new accounting standards, future remediation of material weaknesses, future misstatements of financial statements, expected integration of systems, expected effect of remeasured deferred tax assets, future service standards, electronic logging installation and related impact on capacity and demand, additional compensation increases, our mix of single and team operations, the effect of safety ratings, hours-of-service expectations, and future operating and maintenance expenses, among others, are forward-looking statements. Such statements may be identified by their use of terms or phrases such as "believe," "may," "could," "expects," "estimates," "projects," "anticipates," "plans," "intends," and similar terms and phrases. Forward-looking statements are based on currently available operating, financial, and competitive information. Forward-looking statements are inherently subject to risks and uncertainties, some of which cannot be predicted or quantified, which could cause future events and actual results to differ materially from those set forth in, contemplated by, or underlying the forward-looking statements. Factors that could cause or contribute to such differences include, but are not limited to, those discussed in the section entitled "Item 1A. Risk Factors," set forth below. Readers should review and consider the factors discussed in "Item 1A. Risk Factors," along with various disclosures in our press releases, stockholder reports, and other filings with the Securities and Exchange Commission (“SEC”).
All such forward-looking statements speak only as of the date of this Annual Report. You are cautioned not to place undue reliance on such forward-looking statements. We expressly disclaim any obligation or undertaking to release publicly any updates or revisions to any forward-looking statements contained herein to reflect any change in our expectations with regard thereto or any change in the events, conditions, or circumstances on which any such statement is based.
References in this Annual Report to "we," "us," "our," or the "Company" or similar terms refer to Covenant Transportation Group, Inc. and its subsidiaries.
GENERAL
Background and Strategy
We were founded in 1986 as a provider of expedited freight transportation, primarily using two-person driver teams in transcontinental lanes. Since that time, we have grown from 25 tractors to approximately
3,150 tractors and expanded our services from predominantly expedited to include dedicated, temperature-controlled, brokerage, and other services. The expansion of our fleet and service offerings have placed us among the nation's
twenty-five largest truckload transportation companies based on
2017 revenue. On July 3, 2018, we acquired Landair Holdings, Inc., Landair Transport, Inc., Landair Logistics, Inc., and Landair Leasing, Inc., (“Landair Acquisition”), a leading for-hire truckload carrier and supplier of transportation management, warehousing, and logistics inventory management systems, which further integrates us into the supply chain of our customers and reduces our seasonal and cyclical volatility.
Generally, we transport full trailer loads of freight from origin to destination without intermediate stops or handling. We provide truckload transportation services throughout the continental United States and into and out of Mexico and into and out of portions of Canada. Our truckload freight services utilize equipment we own or lease or equipment owned by independent contractors for the pick-up and delivery of freight. In our one-way truckload business, we transport freight over nonroutine routes. Our dedicated freight service offering provides similar transportation services, but does so pursuant to agreements whereby we make our equipment available to a specific customer for shipments over particular routes at specified times. To complement our truckload operations, we provide freight brokerage/logistics services, warehousing, and accounts receivable factoring services. Through our asset based and non-asset based capabilities, we transport many types of freight for a diverse customer base.
We concentrate on
service offerings where we believe our capacity in relation to sector size and our operating proficiency can make a meaningful difference to customers. The primary offerings we provide are as follows:
●
Expedited
: In our expedited business, we operate approximately
860 tractors, approximately
692 of which are driven by two-person driver teams. Our expedited operations primarily involve high service freight with delivery standards, such as 1,000 miles in 22 hours, or 15-minute delivery windows that are difficult for competitors to satisfy with solo-driven tractors. Our expedited services often involve high value, high security, or time-definite loads for integrated global freight companies, less-than-truckload carriers, manufacturers, and retailers. We believe we are one of the five largest team expedited providers, and that growth in omni-channel, organic food, manufacturing, and e-commerce freight make this an attractive sector.
●
Dedicated
: In our dedicated contract business, we operate approximately
1,583 tractors, approximately
146 of which are driven by two-person driver teams, primarily for manufacturers located across the United States. The dedicated sector typically involves longer-term contracts that allocate a specified number of tractors and trailers to a specific customer, with fixed and variable compensation. Many of our dedicated contract customers are automotive companies or shippers of produce, where the nature of the product we ship requires high service standards. We believe these sectors are growing because of an improved manufacturing environment in the United States, growth in organic produce, customer concerns about trucking capacity, and a need for dependable service.
●
Temperature-Controlled
: In our temperature-controlled business, we operate approximately
618 tractors, approximately
29 of which are driven by two-person driver teams, and have also offered intermodal service in longer haul lanes; however, this service was discontinued during the fourth quarter of 2017. The temperature-controlled sector includes fresh and frozen foods, pharmaceuticals, cosmetics, and other freight where extreme heat or cold could cause damage. We believe we are among the fifteen largest temperature-controlled providers, and that factors such as United States population growth, increasing consumer preference for fresh and organic produce, and demographic trends requiring more pharmaceuticals make this an attractive sector.
●
Brokerage
: In our brokerage business, we provide logistics capacity to customers who prefer to handle their freight needs on a more transactional basis or when the freight does not fit our truckload network or profitability requirements.
●
Other
: Our other service offerings include over-the-road ("OTR") truckload services in the southeastern United States, as well as warehousing, transportation management services, and
shuttle and switching services
. We also assist current and potential capacity providers with improving their cash flows through secured invoice factoring services. We believe this suite of services links our interests with those of our customers and current and potential third party capacity providers.
Additionally, we participate in the market for used equipment sales and leasing through our 49% ownership of Transport Enterprise Leasing, LLC (“TEL”).
As our fleet has grown over three decades and our service platform matured, several important trends dramatically affected the truckload industry and our business. First, supply chain patterns became more fluid in response to dynamic changes in labor and transportation costs, ocean freight and rail-intermodal service standards, retail distribution center networks, governmental regulations, and other industry-wide factors. Second, the cost structure of the truckload business rose dramatically, particularly equipment, driver wages, and, at times, fuel prices, impacting us and our customers' freight decisions. Third, customers used technology to constantly optimize their supply chains, which necessitated expanding our own technological capability to optimize our asset allocation, manage yields, and drive operational efficiency. Fourth, a confluence of regulatory constraints, safety and security demands, and scarcity of qualified driver applicants, negatively impacted our asset productivity and reinforced what a precious resource professional truck drivers are (and we believe increasingly will be) in our industry.
Results for 2018 were robust, providing the highest annual earnings in the company's 32-year history, following strong, but comparatively weaker years in 2016 and 2017, after excluding the $40.1 million reduction in income tax expense as a result of the Tax Cuts and Jobs Act of 2017 (the "Tax Act"). We are proud of the operational improvements we have made, particularly at Southern Refrigerated Transport, Inc. ("SRT"), especially in light of certain headwinds we faced. We believe our return to profitability on a consistent basis since 2012 is the result of redefining and retooling our business model, and as the result of our strategic planning process, whereby we annually focus on six initiatives that fall under the following key tenets:
●
Organizational Excellence and Entrepreneurial Spirit.
Beginning in 2013, we re-aligned our management team, added talent, and implemented best practices to bring a new focus to metrics, accountability, and incentive compensation. Through multiple programs recognizing individual initiative, we have also been instilling an ownership culture throughout our company. We also implemented a single enterprise management system across all subsidiaries to improve visibility and coordination of customers, operations, and financial activities.
●
Focus on the Driver.
Drivers are the lifeblood of our company and our industry. We employ a broad range of safety, lifestyle, compensation, equipment technology, and personal recognition methods to convey our respect and appreciation for our drivers and to improve their careers. A portion of these techniques involve sophisticated analytics to identify likely candidates, match teams, evaluate recruiting spending, deliver training content to drivers, and design tractor specifications.
●
Focus on the Customer Experience.
We offer premium service in sectors where we can make a difference, and we use our brokerage subsidiary, Covenant Transport Solutions, LLC ("Solutions"), to cover loads that cannot be as efficiently serviced through our Truckload segment. With each interaction, we seek to enhance the value we bring to the customer relationship.
●
Rigorous Capital Allocation Process and Reduce Leverage.
Our senior management annually ranks capital investment opportunities against available capital and acceptable leverage levels, and material investments must pass return on investment and capital investment committee approval processes. In addition, reducing our leverage ratio has been a primary strategic goal. Our leverage ratio decreased in both
2018 and
2017 as compared to the respective prior years, as we remain focused on investing capital when we can obtain acceptable returns and reducing our leverage. We believe our disciplined investment review has contributed to our improved results by allocating capital to more profitable business units and downsizing other units into greater profitability.
●
Risk Management—Assess and Mitigate.
We evaluate risk areas with significant volatility, as well as the costs and benefits associated with mitigating the volatility. Diesel fuel prices, insurance and claims cost, and used equipment prices are all areas where we identified significant risk and volatility for our business. To manage these risks,
we have at times employed fuel hedging contracts on a portion of our fuel usage not covered by customer fuel surcharges, lowered our self-insured accident liability retention, and expanded our ability to sell our used equipment to increase bargaining power with the tractor and trailer manufacturers.
●
Technology
. We purchase and deploy technology that we believe will allow us to operate more safely, securely, and efficiently. Our information systems are integrated into a single platform that represents a multi-year investment to upgrade the hardware and software of our information systems, with the exception of our recent Landair Acquisition, which we also plan to integrate. This technology was purchased off the shelf, which minimizes our fixed cost investment and enables us to stay current with the latest developments.
We believe the ongoing execution of our strategic plan has contributed to the substantial improvement in operating results and profitability we have generated over the past several years. Some of the significant successes resulting from our strategic planning efforts include the Landair Acquisition in 2018; completion of a follow-on stock offering in 2014 that helped significantly deleverage our balance sheet; consolidation of our sales force and back-office operations; enhancements to recruiting, retention, and business intelligence; upgraded information technology; and focus on service and on time delivery. Each of these accomplishments positively impacted the success of the key initiatives identified above, our overarching financial goals, and ultimately, the Company.
However, we still have significant work ahead to achieve our goals, deliver a strong and stable product for our customers, provide a bright future for our employees and independent contractors, and create meaningful value for our stockholders.
The Company
We operate a relatively new tractor fleet and employ sophisticated tractor technology that enhances our operational efficiencies and our drivers' safety. Our company-owned tractor fleet has an average age of approximately
2.2 years, which compares favorably to an average U.S. Class 8 tractor age of approximately
7 years in
2018. Some of the technologies we employ include the following: (1) freight optimization software that can perform sophisticated analyses of profitability and other measures on each customer, route, and load; (2) routing software that selects the best route, identifies fuel stops, and warns of deviations from routing instructions; (3) a tracking and communications system that permits direct communication between drivers and fleet managers, as well as constant location and delivery updates; (4) automatic on board recording devices (“AOBRs”) in all of our tractors; (5) aerodynamics and other fuel efficiency systems that have significantly improved fuel mileage; and (6) safety technology, including rollover stability control, collision mitigation, adaptive cruise control, and lane-change warning. We believe our modern fleet lowers maintenance costs, improves fuel mileage, improves safety, contributes to better customer service, and assists with driver retention.
Business Units
We have two reportable segments, our truckload services ("Truckload") and freight brokerage, transportation management services, and
shuttle and switching services
(“Managed Freight”).
The Truckload segment consists of four service offerings that are aggregated because they have similar economic characteristics and meet the aggregation criteria. The four service offerings that comprise our Truckload segment are as follows: (i) Expedited; (ii) Dedicated; (iii) Temperature-Controlled; and (iv) OTR.
Managed Freight is comprised primarily of freight brokerage, transportation management services ("TMS"), and
shuttle and switching services
. Included in Managed Freight are our accounts receivable factoring and warehousing businesses, which do not meet the aggregation criteria, but only accounted for
$5.0 million and
$23.6 million of our revenue, respectively, during the year ended December 31, 2018.
The following charts reflect the size of each of our service offerings measured by 2018 total revenue, net of fuel surcharge revenue, which we refer to as "freight revenue":
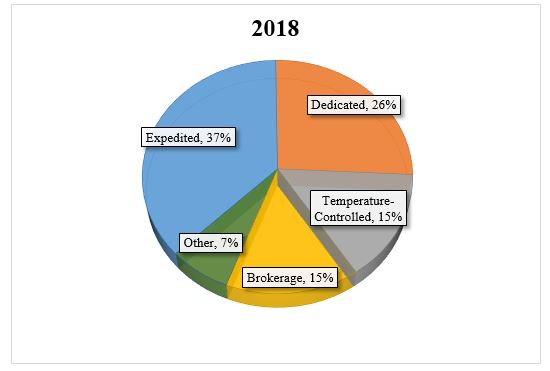
|
Distribution of Freight Revenue
Among Service Offerings
|
||||
|
Expedited
|
|
|
37
|
%
|
|
Dedicated
|
|
|
26
|
%
|
|
Temperature-Controlled
|
|
|
15
|
%
|
|
Brokerage
|
|
|
15
|
%
|
|
Other
|
|
|
7
|
%
|
Our Truckload segment comprised approximately
80%,
85%, and
89% of our total freight revenue in
2018,
2017, and
2016, respectively.
In our Truckload segment, we primarily generate revenue by transporting freight for our customers. Generally, we are paid a predetermined rate per mile for our truckload services. We enhance our truckload revenue by charging for tractor and trailer detention, loading and unloading activities, and other specialized services, as well as through the collection of fuel surcharges to mitigate the impact of increases in the cost of fuel. The main factors that could affect our Truckload revenue are the revenue per mile we receive from our customers, the percentage of miles for which we are compensated, and the number of shipments and miles we generate. These factors relate, among other things, to the general level of economic activity in the United States, inventory levels, specific customer demand, the level of capacity in the trucking industry, and driver availability.
The main expenses that impact the profitability of our Truckload segment are the variable costs of transporting freight for our customers. These costs include fuel expenses, driver-related expenses, such as wages, benefits, training, and recruitment, and purchased transportation expenses, which primarily include compensating independent contractors. Expenses that have both fixed and variable components include maintenance and tire expense and our total cost of insurance and claims. These expenses generally vary with the miles we travel, but also have a controllable component based on safety, self-insured retention versus insurance premiums, fleet age, efficiency, and other factors. Historically, our main fixed costs include rentals and depreciation of long-term assets, such as revenue equipment and terminal facilities, and the compensation of non-driver personnel.
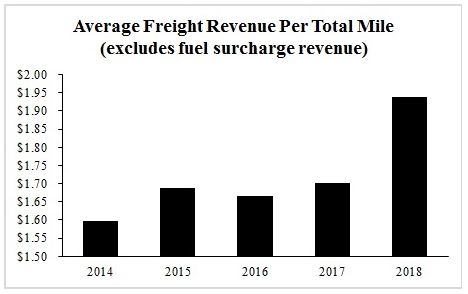
We measure the productivity of our Truckload segment with three key performance metrics: average freight revenue per total mile (excluding fuel surcharges), average miles per tractor, and average freight revenue per tractor per week (excluding fuel surcharges). A description of each follows:
|
Average Freight Revenue Per Total Mile.
Our average freight revenue per total mile is primarily a function of 1) the allocation of assets among our subsidiaries and 2) the macro U.S. economic environment including supply/demand of freight and carriers. The year-over-year increase from 2014 to 2015 is a result of allocating more tractors to our niche/specialized service offerings that provide higher rates (including expedited/critical freight, high-value/constant security, and temperature-controlled). The 2017 recovery of the weaker 2016 pricing environment, due to the more favorable supply and demand balance, resulted in the slight increase in 2017. A strong economic environment, as well as the Landair Acquisition, contributed to the increases in
2018.
|
|
|
2014
|
|
|
2015
|
|
|
2016
|
|
|
2017
|
|
|
2018
|
|
|
$1.60
|
|
|
$1.69
|
|
|
$1.67
|
|
|
$1.70
|
|
|
$1.94
|
|
|
Average Miles Per Tractor.
Average miles per tractor reflect economic demand, driver availability, regulatory constraints, and the allocation of tractors among the service offerings. Utilization declined gradually from 2014 to 2017 primarily due to a softer freight market and the increase in certain e-commerce freight that has a shorter length of haul, partially offset by the increase in the portion of tractors operated by teams during that time. In 2018, our increased emphasis on shorter-haul dedicated freight, a reduction in tractors operated by teams, as well as the Landair Acquisition, reduced ou
r average miles per tractor to the lowest we have seen in our recent history.
|

|
|
2014
|
|
|
2015
|
|
|
2016
|
|
|
2017
|
|
|
2018
|
|
|
123,275
|
|
|
122,508
|
|
|
121,782
|
|
|
120,043
|
|
|
112,736
|
|
|
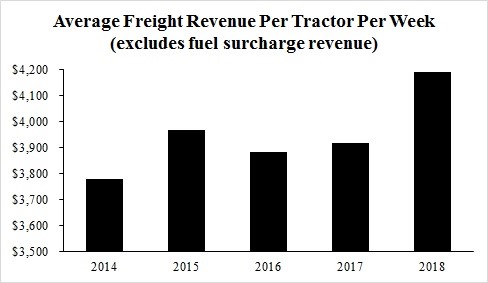
Average Freight Revenue Per Tractor Per Week.
We use average freight revenue per tractor per week as our main measure of asset productivity. This operating metric takes into account the effects of freight rates, non-revenue miles, and miles per tractor. In addition, because we calculate average freight revenue per tractor using all of our tractors, it takes into account the percentage of our fleet that is unproductive due to lack of drivers, repairs, and other factors. The changes in average freight revenue per tractor per week from 2015 to 2017 are primarily due to the 2016 deterioration and 2017 recovery of the percentage of our unseated tractors, specifically at SRT, and the increase in 2018 is primarily due to the aforementioned increase in rates, partially offset by the decrease in utilization.
|
|
|
2014
|
|
|
2015
|
|
|
2016
|
|
|
2017
|
|
|
2018
|
|
|
$3,777
|
|
|
$3,967
|
|
|
$3,881
|
|
|
$3,917
|
|
|
$4,191
|
|
Our Managed Freight segment comprised approximately
20%,
15%, and
11% of our total operating revenue in
2018,
2017, and
2016, respectively. Within our Managed Freight segment, we derive revenue from providing freight brokerage, transportation management services, and
shuttle and switching services
, particularly arranging transportation services for customers directly and through relationships with thousands of third-party carriers and integration with our Truckload segment. We provide freight brokerage services directly and through freight brokerage agents, who are paid a commission for the freight brokerage service they provide, as well as providing warehousing and accounts receivable factoring services. The main factors that impact profitability in terms of expenses are the variable costs of outsourcing the transportation freight for our customers and managing fixed costs, including salaries, facility warehousing costs, and selling, general, and administrative expenses. Our brokerage loads increased to
76,866 in 2018, from
71,455 in 2017, while average revenue per load increased approximately
20% to $
1,494 in 2018, from $
1,246 in 2017, primarily due to improved spot market rates, growth with existing customers, and the impact of the Landair Acquisition, compared with the same 2017 periods. Additionally, revenue from accounts receivable factoring improved by approximately
61% year-over-year to
$5.0 million in 2018 from
$3.1 million in 2017.
In May 2011, we acquired a 49.0% interest in TEL. TEL is a tractor and trailer equipment leasing company and used equipment reseller. We have accounted for our investment in TEL using the equity method of accounting and thus our financial results include our proportionate share of TEL's net income since May 2011, or
$7.7 million in 2018,
$3.4 million in 2017, and
$3.0 million in 2016. As a result, TEL's results and growth are significant to our current year results and, in our estimation, to our longer-term vision.
Refer to Note 16, "Segment Information," of the accompanying consolidated financial statements for further information about our reporting segment's operating and financial results for 2018, 2017, and 2016.
Customers and Operations
We focus on targeted markets throughout the United States where we believe our service standards can provide a competitive advantage. We are a major carrier for transportation companies such as parcel freight forwarders, less-than-truckload carriers, and third-party logistics providers that require a high level of service to support their businesses, as well as for traditional truckload customers such as manufacturers, retailers, and food and beverage shippers. Our four service offerings within the Truckload segment are primarily truckload based and as such we generally dedicate an entire trailer to one customer from origin to destination. We also generate revenue through providing ancillary services, including freight brokerage and logistics services, warehousing, and accounts receivable factoring.
Walmart accounted for more than 10% of our consolidated revenue in
2018, 2017, and 2016 with
$112.4 million,
$70.7 million, and
$69.4 million of total revenue in each respective year. Additionally, UPS accounted for more than 10% of our consolidated revenue in
2017 with
$72.2 million of total revenue in that year. Both customers were serviced by both our Truckload segment and our Managed Freight segment. Our top five customers accounted for approximately
34%,
34%, and
39% of our total revenue in 2018, 2017, and 2016, respectively.
We operate tractors driven by a single driver and also tractors assigned to two-person driver teams. Our single driver tractors generally operate in shorter lengths of haul, generate fewer miles per tractor, and experience more non-revenue miles, but the lower productive miles are expected to be offset by generally higher revenue per loaded mile and the reduced employee expense of compensating only one driver. In contrast, our two-person driver tractors generally operate in longer lengths of haul, generate greater miles per tractor, and experience fewer non-revenue miles, but we typically receive lower revenue per loaded mile and incur higher employee expenses of compensating both drivers. We expect operating statistics and expenses to shift with the mix of single and team operations.
All of our operating subsidiaries operate on a uniform operational and financial system, except for the recently-acquired Landair subsidiary, which we plan to integrate into our existing systems over the next two years, as we have historically gained efficiencies from our subsidiaries operating on the same platform. We continue moving data into the cloud versus storing on local servers when possible. We expect to continue to evaluate where we can leverage technology to add further efficiencies across the Company and for our customers.
Drivers and Other Personnel
Driver recruitment, retention, and satisfaction are essential to our success, and we have made each of these factors a primary element of our strategy. We recruit both experienced and student drivers as well as independent contractor drivers who own and drive their own tractor and provide their services to us under contract. We conduct recruiting and/or driver orientation efforts from
six of our locations, and we offer ongoing training throughout our terminal network. We emphasize driver-friendly operations throughout our organization. We have implemented automated programs to signal when a driver is scheduled to be routed toward home, and we assign fleet managers specific tractor units, regardless of geographic region, to foster positive relationships between the drivers and their principal contact with us.
The truckload industry has experienced difficulty in attracting and retaining enough qualified truck drivers. It is also common for the driver turnover rate of individual carriers to exceed 100% in a year. At times, there are driver shortages in the trucking industry. In past years, when there were driver shortages, the number of qualified drivers had not kept pace with freight growth because of (i) changes in the demographic composition of the workforce; (ii) alternative employment opportunities other than truck driving that became available in a growing economy; (iii) individual drivers' desire to be home more often; and (iv) regulatory requirements that limit the available pool of drivers.
Driver retention remained challenging in 2018, as economic growth provided more employment opportunities that attracted professional drivers. Although our number of drivers increased due to the Landair Acquisition, our average number of teams as a percentage of our fleet decreased at
December 31, 2018 as compared to the 2017 year. Our average open tractors, including wrecked units,
decreased slightly to
4.5% for the year ended
December 31, 2018, from approximately
4.8% for the year ended
December 31, 2017.
We believe having a happy, healthy, and safe driver is the key to our success, both in the short term and over a longer period. As a result, we are actively working to enhance our drivers' experience in an effort to recruit and retain more drivers.
Independent contractors provide a tractor and a driver and are responsible for all operating expenses in exchange for a fixed payment per mile. We do not have the capital outlay of purchasing the tractor. The payments to independent contractors are recorded in revenue equipment rentals and purchased transportation. When independent contractor tractors are utilized, we avoid expenses generally associated with company-owned equipment, such as driver compensation, fuel, interest, and depreciation. Obtaining equipment from independent contractors and under operating leases effectively shifts financing expenses from interest to "above the line" operating expenses.
We continue to educate our drivers and non-driver personnel regarding the Federal Motor Carrier Safety Administration ("FMCSA") Compliance Safety Accountability program ("CSA") to ensure we keep our top talent and challenge those drivers that need improvement. We believe CSA, in conjunction with other U.S. Department of Transportation ("DOT") regulations, including those related to hours-of-service and electronic logging devices (“ELDs”), has reduced and will likely continue to impact effective capacity in our industry as well as negatively impact equipment utilization. Nevertheless, for carriers that are able to successfully manage this regulation-laden environment with driver-friendly equipment, compensation, and operations, we believe opportunities to increase market share may be available. Driver pay may increase as a result of regulation and economic expansion, which could provide more alternative employment opportunities. If economic growth is sustained, however, we expect the supply/demand environment to be favorable enough for us to offset expected compensation increases with better freight pricing.
We use driver teams in a substantial portion of our tractors. Driver teams permit us to provide expedited service on selected long haul lanes because teams are able to handle longer routes and drive more miles while remaining within DOT hours-of-service rules. The use of teams contributes to greater equipment utilization of the tractors they drive than obtained with single drivers. The use of teams, however, increases the accumulation of miles on tractors and trailers as well as personnel costs as a percentage of revenue and the number of drivers we must recruit.
We are not a party to any collective bargaining agreement. At
December 31, 2018, we employed approximately
4,100 drivers and averaged approximately
1,400 non-driver personnel. At December 31, 2018, we had active contracts with approximately
319 independent contractor drivers.
Revenue Equipment
At
December 31, 2018
, we operated 3,154 tractors and
6,950 trailers. Of these tractors,
2,311 were owned,
524 were financed under operating leases, and
319 were provided by independent contractors, who own and drive their own tractors. Of these trailers,
4,908 were owned,
415 were financed under operating leases, and
1,627 were financed under capital leases. Furthermore, at
December 31, 2018, approximately
68.2% of our trailers were dry vans, and the remaining trailers were refrigerated vans.
We believe that operating high quality, late-model equipment contributes to operating efficiency, helps us recruit and retain drivers, and is an important part of providing excellent service to customers. We operate a modern fleet of tractors, with the majority of units under warranty, to minimize repair and maintenance costs and reduce service interruptions caused by breakdowns. We also order most of our equipment with uniform specifications to reduce our parts inventory and facilitate maintenance. At
December 31, 2018, our tractor fleet had an average age of approximately
2.2 years, and our trailer fleet had an average age of approximately
3.8 years.
As of
December 31, 2018, 100% of our tractor fleet had engines compliant with stricter regulations regarding emissions that became effective in 2007 and 99.8% of our tractor fleet had engines compliant with stricter regulations regarding emissions that became effective in 2010. We equip our tractors with a satellite-based tracking and communications system that permits direct communication between drivers and fleet managers. We believe that this system enhances our operating efficiency and improves customer service and fleet management. This system also updates the tractor's position approximately every fifteen minutes, which allows us and our customers to locate freight and accurately estimate pick-up and delivery times. We also use the system to monitor engine idling time, speed, performance, and other factors that affect operating efficiency. At
December 31, 2018, all of our tractors were equipped with AOBRs, which, similar to ELDs, electronically monitor tractor miles and facilitate enforcement of hours-of-service regulations.
Over the past decade, the price of new tractors has risen dramatically and there has been significant volatility in the used equipment market. This has substantially increased our costs of operation.
Industry and Competition
Truckload is the largest segment of the for-hire ground freight transportation market based on revenue, surpassing the combined market size of less-than-truckload, railroad, intermodal, and parcel delivery combined. The truckload market is further segmented into sectors such as regional dry van, temperature-controlled van, flatbed, dedicated contract, expedited, and irregular route.
The U.S. trucking industry is highly competitive and includes thousands of "for-hire" motor carriers, none of which dominate the market. Service and price are the principal means of competition in the trucking industry. We compete to some extent with railroads and rail-truck intermodal service but attempt to differentiate ourselves from our competition on the basis of service. Rail and rail-truck intermodal movements are more often subject to delays and disruptions arising from rail yard congestion, which reduce the effectiveness of such service to customers with time-definite pick-up and delivery schedules. Historically, in times of high fuel prices or decreased consumer demand, however, rail-intermodal competition has been more significant.
Our industry is subject to dynamic factors that significantly affect our operating results. These factors include the availability of qualified truck drivers, the volume of freight in the sectors we serve, the price of diesel fuel, and government regulations that impact productivity and costs. Recently, our industry has experienced softened freight demand, scarcity of qualified truck drivers, decreased fuel costs, a depressed used tractor market, and regulations that limit productivity. In 2018, the supply dynamics drove rate improvements over 2017, although costs such as driver pay for many trucking companies, including us, remained higher than pre-2016 periods. Based on our assessment of future regulatory changes, driver demographics, and expected growth rates of our major customers and sectors, we expect a relatively balanced freight environment in
2019, as increased rates are offset in part by higher driver pay and other inflationary costs. We believe large and diversified companies, like ourselves, are best positioned to capitalize on the current industry environment, because we can offer significant capacity commitments to major customers, safe and comfortable new equipment to drivers, and optimized routing and other business analytics to make the most of our drivers' federally limited operating hours.
We believe that the cost and complexity of operating trucking fleets are increasing and that economic and competitive pressures are likely to force many smaller competitors and private fleets to consolidate or exit the industry. As a result, we believe that larger, better-capitalized companies, like us, will have opportunities to increase profit margins and gain market share. In the market for dedicated services, we believe that truckload carriers, like us, have a competitive advantage over truck lessors, which are the other major participants in the market, because we expect to be able to offer lower prices by utilizing back-haul freight within our network that traditional lessors may not have.
Regulation
Our operations are regulated and licensed by various U.S. agencies. Our limited Canadian business activities are subject to similar requirements imposed by the laws and regulations of Canada, as well as its provincial laws and regulations. We operate within Mexico by utilizing third-party carriers within that country. Our company drivers and independent contractors also must comply with the safety and fitness regulations of the DOT, including those relating to drug and alcohol testing and hours-of-service. Such matters as weight and equipment dimensions are also subject to U.S. regulations. We also may become subject to new or more restrictive regulations relating to fuel emissions, drivers' hours-of-service, ergonomics, or other matters affecting safety or operating methods. Other agencies, such as the Environmental Protection Agency ("EPA") and the Department of Homeland Security ("DHS") also regulate our equipment, operations, and drivers.
The DOT, through the FMCSA, imposes safety and fitness regulations on us and our drivers, including rules that restrict driver hours-of-service. Changes to such hours-of-service rules can negatively impact our productivity and affect our operations and profitability by reducing the number of hours per day or week our drivers may operate and/or disrupting our network. While the FMCSA has proposed and implemented such changes in the past, no such changes are currently formally proposed. However, the FMCSA recently indicated it may soon be soliciting feedback from industry stakeholders regarding future hours-of-service changes. Any future changes to hours-of-service rules could materially and adversely affect our operations and profitability.
The DOT uses two methods of evaluating the safety and fitness of carriers. The first method is the application of a safety rating that is based on an onsite investigation and affects a carrier’s ability to operate in interstate commerce. All of our subsidiaries with operating authority currently have a satisfactory DOT safety rating under this method, which is the highest available rating under the current safety rating scale. If we received a conditional or unsatisfactory DOT safety rating, it could adversely affect our business, as some of our existing customer contracts require a satisfactory DOT safety rating. In January 2016, the FMCSA published a Notice of Proposed Rulemaking outlining a revised safety rating measurement system which would replace the current methodology. Under the proposed rule, the current three safety ratings of "satisfactory," "conditional," and "unsatisfactory" would be replaced with a single safety rating of "unfit." Thus, a carrier with no rating would be deemed fit. Moreover, data from roadside inspections and the results of all investigations would be used to determine a carrier’s fitness on a monthly basis. This would replace the current methodology of determining a carrier’s fitness based solely on infrequent comprehensive onsite reviews. The proposed rule underwent a public comment period that ended in June 2016 and several industry groups and lawmakers expressed their disagreement with the proposed rule, arguing that it violates the requirements of the FAST Act (as defined below) and that the FMCSA must first finalize its review of the CSA scoring system, described in further detail below. Based on this feedback and other concerns raised by industry stakeholders, in March 2017, the FMCSA withdrew the Notice of Proposed Rulemaking related to the new safety rating system. In its notice of withdrawal, the FMCSA noted that a new rulemaking related to a similar process may be initiated in the future. Therefore, it is uncertain if, when, or under what form any such rule could be implemented.
In addition to the safety rating system, the FMCSA has adopted the CSA program as an additional safety enforcement and compliance model that evaluates and ranks fleets on certain safety-related standards. The CSA program analyzes data from roadside inspections, moving violations, crash reports from the last two years, and investigation results. The data is organized into seven categories. Carriers are grouped by category with other carriers that have a similar number of safety events (e.g., crashes, inspections, or violations) and carriers are ranked and assigned a rating percentile to prioritize them for interventions if they are above a certain threshold. Currently, these scores do not have a direct impact on a carrier’s safety rating. However, the occurrence of unfavorable scores in one or more categories may (i) affect driver recruiting and retention by causing high-quality drivers to seek employment with other carriers, (ii) cause our customers to direct their business away from us and to carriers with higher fleet rankings, (iii) subject us to an increase in compliance reviews and roadside inspections, or (iv) cause us to incur greater than expected expenses in our attempts to improve unfavorable scores, any of which could adversely affect our results of operations and profitability.
During this period of review by the FMCSA, we will continue to have access to our own scores and will still be subject to intervention by the FMCSA when such scores are above the intervention thresholds. A study was conducted and delivered to the FMCSA in June 2017 with several recommendations to make the CSA program more fair, accurate, and reliable. In June 2018, the FMCSA provided a report to Congress outlining the changes it may make to the CSA program in response to the study. Such changes include the testing and possible adoption of a revised risk modeling theory, potential collection and dissemination of additional carrier data and revised measures for intervention thresholds. The adoption of such changes is contingent on the results of the new modeling theory and additional public feedback. Therefore, it is unclear if, when and to what extent such changes to the CSA program will occur. However, any changes that increase the likelihood of us receiving unfavorable scores could adversely affect our results of operations and profitability.
Currently, certain of our subsidiaries are exceeding the established intervention thresholds in one or more of the seven categories of CSA, in comparison to their peer groups; however, they all continue to maintain a satisfactory rating with the DOT. We will continue to promote improvement of these scores in all seven categories with ongoing reviews of all safety-related policies, programs, and procedures for their effectiveness.
The FMCSA published a final rule in December 2015 that required the use of ELDs or AOBRs by nearly all carriers by December 2017 (the "2015 ELD Rule"). Enforcement of the 2015 ELD Rule was phased in, as states did not begin putting tractors out of service for non-compliance until April 1, 2018. However, carriers were subject to citations, on a state-by-state basis, for non-compliance with the rule after the December 2017 compliance deadline. Use of AOBRs is permitted until December 2019, at which time use of ELDs is required. Since we had proactively installed AOBRs on nearly 100% of our tractor fleet, implementation of the 2015 ELD Rule did not impact our operations or profitability or our use of AOBRs.
We expect to have ELDs (not AOBRs) installed on 100% of our fleet by the December 2019 deadline. We believe that more effective hours-of-service enforcement under the 2015 ELD Rule may improve our competitive position by causing all carriers to adhere more closely to hours-of-service requirements and may further reduce industry capacity.
In the aftermath of the September 11, 2001 terrorist attacks, the DHS and other federal, state, and municipal authorities implemented and continue to implement various security measures, including checkpoints and travel restrictions on large tractors. The U.S. Transportation Security Administration ("TSA") adopted regulations that require a determination by the TSA that each driver who applies for or renews his or her license for carrying hazardous materials is not a security threat. This could reduce the pool of qualified drivers who are permitted to transport hazardous waste, which could require us to increase driver compensation, limit our fleet growth, or allow tractors to sit idle. These regulations also could complicate the matching of available equipment with hazardous material shipments, thereby increasing our response time on customer orders and our non-revenue miles. As a result, it is possible we could fail to meet the needs of our customers or could incur increased expenses to do so.
In December 2016, the FMCSA issued a final rule establishing a national clearinghouse for drug and alcohol testing results and requiring motor carriers and medical review officers to provide records of violations by commercial drivers of FMCSA drug and alcohol testing requirements. Motor carriers will be required to query the clearinghouse to ensure drivers and driver applicants do not have violations of federal drug and alcohol testing regulations that prohibit them from operating commercial motor vehicles. This rule is scheduled for implementation in early 2020 and may reduce the number of available drivers in an already constrained driver market.
In November 2015, the FMCSA published its final rule related to driver coercion, which took effect in January 2016. Under this rule, carriers, shippers, receivers, or transportation intermediaries that are found to have coerced drivers to violate certain FMCSA regulations (including hours-of-service rules) may be fined up to $16,000 for each offense. In addition, other rules have been recently proposed or made final by the FMCSA, including (i) a rule requiring the use of speed limiting devices on heavy duty tractors to restrict maximum speeds, which was proposed in 2016, and (ii) a rule setting forth minimum driver training standards for new drivers applying for commercial driver’s licenses for the first time and to experienced drivers upgrading their licenses or seeking a hazardous materials endorsement, which was made final in December 2016, with a compliance date in February 2020. In July 2017, the DOT announced that it would no longer pursue a speed limiter rule, but left open the possibility that it could resume such a pursuit in the future. The effect of these rules, to the extent they become effective, could result in a decrease in fleet production and driver availability, either of which could adversely affect our business or operations.
In March 2014, the Ninth Circuit Court of Appeals held that California state wage and hour laws are not preempted by federal law. The case was appealed to the Supreme Court of the United States, which in May 2015 refused to review the case, and accordingly, the Ninth Circuit Court of Appeals decision stood. However, in December 2018, the FMCSA granted a petition filed by the ATA and in doing so determined that federal law does preempt California’s wage and hour laws, and interstate truck drivers are not subject to such laws. The FMCSA’s decision has been appealed by labor groups and multiple lawsuits have been filed in federal courts seeking to overturn the decision, and thus it’s uncertain whether it will stand. Other current and future state and local laws, including laws related to employee meal breaks and rest periods, may also vary significantly from federal law. As a result, we, along with other companies in the industry, could become subject to an uneven patchwork of laws throughout the United States. In the past, certain legislators have proposed federal legislation to preempt certain state and local laws; however, passage of such legislation is uncertain. If federal legislation is not passed, we will either need to comply with the most restrictive state and local laws across our entire network, or overhaul our management systems to comply with varying state and local laws. Either solution could result in increased compliance and labor costs, driver turnover, and decreased efficiency.
Tax and other regulatory authorities, as well as independent contractors themselves, have increasingly asserted that independent contractors in the trucking industry are employees rather than independent contractors, for a variety of purposes, including income tax withholding, workers' compensation, wage and hour compensation, unemployment, and other issues. Federal legislators have introduced legislation in the past to make it easier for tax and other authorities to reclassify independent contractors as employees, including legislation to increase the recordkeeping requirements for those that engage independent contractors and to heighten the penalties of companies who misclassify their employees and are found to have violated employees' overtime and/or wage requirements. Additionally, federal legislators have sought to abolish the current safe harbor allowing taxpayers meeting certain criteria to treat individuals as independent contractors if they are following a long-standing, recognized practice, extend the Fair Labor Standards Act to independent contractors, and impose notice requirements based upon employment or independent contractor status and fines for failure to comply. Some states have put initiatives in place to increase their revenues from items such as unemployment, workers' compensation, and income taxes, and a reclassification of independent contractors as employees would help states with these initiatives. Recently, courts in certain states have issued decisions that could result in a greater likelihood that independent contractors would be judicially classified as employees in such states. Further, class actions and other lawsuits have been filed against certain members of our industry seeking to reclassify independent contractors as employees for a variety of purposes, including workers' compensation and health care coverage. In addition, companies that utilize lease-purchase independent contractor programs, such as us, have been more susceptible to reclassification lawsuits and several recent decisions have been made in favor of those seeking to classify as employees certain independent contractors that participated in lease-purchase programs. Taxing and other regulatory authorities and courts apply a variety of standards in their determination of independent contractor status. Our classification of independent contractors has been the subject of audits by such authorities from time to time. While we have been successful in continuing to classify our independent contractor drivers as independent contractors and not employees, we may be unsuccessful in defending that position in the future. If our independent contractors are determined to be our employees, we would incur additional exposure under federal and state tax, workers' compensation, unemployment benefits, labor, employment, and tort laws, including for prior periods, as well as potential liability for employee benefits and tax withholdings.
We are subject to various environmental laws and regulations dealing with the hauling and handling of hazardous materials, fuel storage tanks, air emissions from our vehicles and facilities, engine idling, and discharge and retention of storm water. Our tractor terminals often are located in industrial areas where groundwater or other forms of environmental contamination could occur. Our operations involve the risks of fuel spillage or seepage, environmental damage, and hazardous waste disposal, among others. Certain of our facilities have waste oil or fuel storage tanks, and fueling islands. A small percentage of our freight consists of low-grade hazardous substances, which subjects us to a wide array of regulations. Additionally, increasing efforts to control emissions of greenhouse gases may have an adverse effect on us. Although we have instituted programs to monitor and control environmental risks and promote compliance with applicable environmental laws and regulations, if we are involved in a spill or other accident involving hazardous substances, if there are releases of hazardous substances we transport, if soil or groundwater contamination is found at our facilities or results from our operations, or if we are found to be in violation of applicable laws or regulations, we could be subject to cleanup costs and liabilities, including substantial fines or penalties or civil and criminal liability, any of which could have a materially adverse effect on our business and operating results.
EPA regulations limiting exhaust emissions became more restrictive in 2010. In August 2011, the National Highway Traffic Safety Administration ("NHTSA") and the EPA adopted final rules that established the first-ever fuel economy and greenhouse gas standards for medium-and heavy-duty vehicles, including the tractors we employ (the "Phase 1 Standards"). The Phase 1 Standards apply to tractor model years 2014 to 2018 and require the achievement of an approximate 20 percent reduction in fuel consumption by the 2018 model year, which equates to approximately four gallons of fuel for every 100 miles traveled. In addition, in February 2014, President Obama announced that his administration would begin developing the next phase of tighter fuel efficiency and greenhouse gas standards for medium-and heavy-duty tractors and trailers (the "Phase 2 Standards"). In October 2016, the EPA and NHTSA published the final rule mandating that the Phase 2 Standards will apply to trailers beginning with model year 2018 and tractors beginning with model year 2021. The Phase 2 Standards require nine percent and 25 percent reductions in emissions and fuel consumption for trailers and tractors, respectively, by 2027. We believe these requirements will result in additional increases in new tractor and trailer prices and additional parts and maintenance costs incurred to retrofit our tractors and trailers with technology to achieve compliance with such standards, which could adversely affect our operating results and profitability, particularly if such costs are not offset by potential fuel savings. We cannot predict, however, the extent to which our operations and productivity will be impacted. In October 2017, the EPA announced a proposal to repeal the Phase 2 Standards as they relate to gliders (which mix refurbished older components, including transmissions and pre-emission-rule engines, with a new frame, cab, steer axle, wheels, and other standard equipment). The outcome of such proposal is still undetermined as the EPA continues to consider Congressionally requested investigations into the legality of the proposal and the merits of an anti-glider study that was published shortly after the proposal became official. Additionally, implementation of the Phase 2 Standards as they relate to trailers has been delayed due to a provisional stay granted in October 2017 by the U.S. Court of Appeals for the District of Columbia, which is overseeing a case against the EPA by the Truck Trailer Manufacturers Association, Inc. regarding the Phase 2 Standards.
The California Air Resources Board ("CARB") also adopted emission control regulations that will be applicable to all heavy-duty tractors that pull 53-foot or longer box-type trailers within the state of California. The tractors and trailers subject to these CARB regulations must be either EPA SmartWay certified or equipped with low-rolling, resistance tires and retrofitted with SmartWay-approved aerodynamic technologies. Enforcement of these CARB regulations for model year 2011 equipment began in January 2010 and have been phased in over several years for older equipment. We currently purchase Smart Way certified equipment in our new tractor and trailer acquisitions. In addition, in February 2017 CARB proposed California Phase 2 standards that generally align with the federal Phase 2 Standards, with some minor additional requirements, and as proposed would stay in place even if the federal Phase 2 Standards are affected by action from President Trump’s administration.
In February 2019, the California Phase 2 standards became final. Thus, even if the trailer provisions of the Phase 2 Standards are permanently removed, we would still need to ensure the majority of our fleet is compliant with the California Phase 2 standards, which may result in increased equipment costs and could adversely affect our operating results and profitability.
Federal and state lawmakers also have proposed a variety of other regulatory limits on carbon emissions and fuel consumption. Compliance with these regulations could increase the cost of new tractors and trailers, impair equipment productivity, and increase operating expenses. These effects, combined with the uncertainty as to the operating results that will be produced by the newly designed diesel engines and the residual values of these vehicles, could increase our costs or otherwise adversely affect our business or operations.
In order to reduce exhaust emissions, some states and municipalities have begun to restrict the locations and amount of time where diesel-powered tractors may idle. These restrictions could force us to purchase on-board power units that do not require the engine to idle or to alter our drivers' behavior, which could result in a decrease in productivity or increase in driver turnover.
In April 2016, the Food and Drug Administration published a final rule establishing requirements for shippers, loaders, carriers by motor vehicle and rail vehicle, and receivers engaged in the transportation of food, to use sanitary transportation practices to ensure the safety of the food they transport as part of the Food Safety Modernization Act of 2011 (the "FSMA"). This rule sets forth requirements related to (i) the design and maintenance of equipment used to transport food, (ii) the measures taken during food transportation to ensure food safety, (iii) the training of carrier personnel in sanitary food transportation practices, and (iv) maintenance and retention of records of written procedures, agreements, and training related to the foregoing items. These requirements took effect for larger carriers such as us in April 2017 and are applicable when we perform as a carrier or as a broker. We believe we have been in compliance with these requirements since that time. However, if we are found to be in violation of applicable laws or regulations related to the FSMA, we could be subject to substantial fines, penalties and/or criminal liability, any of which could have a material adverse effect on our business, financial condition, and results of operations.
The regulatory environment has changed under the administration of President Trump. In January 2017, the President signed an executive order requiring federal agencies to repeal two regulations for each new one they propose and imposing a regulatory budget, which would limit the amount of new regulatory costs federal agencies can impose on individuals and businesses each year. We do not believe the order has had a significant impact on our industry. However, the order, and other anti-regulatory action by the President and/or Congress, may inhibit future new regulations and/or lead to the repeal or delayed effectiveness of existing regulations. Therefore, it is uncertain how we may be impacted in the future by existing, proposed, or repealed regulations.
Fuel Availability and Cost
The cost of fuel trended higher from
2017 to
2018, as demonstrated by an increase in the Department of Energy ("DOE") national average for diesel to approximately
$3.18 per gallon for 2018 compared to
$2.65 per gallon for 2017. These increases in fuel costs were offset by fuel hedging
gains in 2018 of
$1.6 million compared to
losses of
$4.1 million in 2017 as a result of fuel prices increasing above the hedged rates, as well as contracts contributing to hedging losses in 2017 expiring and not being replaced.
We actively manage our fuel costs by routing our drivers through fuel centers with which we have negotiated volume discounts and through jurisdictions with lower fuel taxes, where possible. We have also reduced the maximum speed of many of our trucks, implemented strict idling guidelines for our drivers, purchased technology to enhance our management and monitoring of out-of-route miles, encouraged the use of shore power units in truck stops, and imposed standards for accepting broker freight that includes minimum rates and fuel surcharges. These initiatives have contributed to significant improvements in fleet wide average fuel mileage. Moreover, we have a fuel surcharge program in place with the majority of our customers, which has historically enabled us to recover some of the higher fuel costs. However, even with the fuel surcharges, the price of fuel can affect our profitability. Our fuel surcharges are billed on a lagging basis, meaning we typically bill customers in the current week based on a previous week's applicable index. Therefore, in times of increasing fuel prices, we do not recover as much as we are currently paying for fuel. In periods of declining prices, the opposite is true. In addition, we incur additional costs when fuel prices rise that cannot be fully recovered due to our engines being idled during cold or warm weather, empty or out-of-route miles, and for fuel used by refrigerated trailer units that generally is not billed to customers. In addition, from time-to-time customers attempt to modify their surcharge programs, some successfully, which can result in recovery of a smaller portion of fuel price increases. Rapid increases in fuel costs or shortages of fuel could have a materially adverse effect on our operations or future profitability.
To reduce the variability of the ultimate cash flows associated with fluctuations in diesel fuel prices, we have periodically entered into various derivative instruments, including forward futures swap contracts. We have historically entered into hedging contracts with respect to ultra-low sulfur diesel ("ULSD"). Under these contracts, we would pay a fixed rate per gallon of ULSD and receive the monthly average price of Gulf Coast ULSD. Because the fixed price is determined based on market prices at the time we enter into the hedge, in times of increasing fuel prices the hedge contracts become more valuable, whereas in times of decreasing fuel prices the opposite is true. At
December 31, 2018, there are no remaining fuel hedge contracts.
Seasonality
In the trucking industry, revenue has historically decreased as customers reduce shipments following the winter holiday season and as inclement weather impedes operations. At the same time, operating expenses have generally increased, with fuel efficiency declining because of engine idling and weather, causing more equipment repairs resulting from physical damage. For the reasons stated, first quarter results historically have been lower than results in each of the other three quarters of the year, excluding charges. Over the past several years, we have seen increases in demand at varying times, primarily related to restocking required to replenish inventories that have been held significantly lower than historical averages. Additionally, we have seen surges between Thanksgiving and Christmas resulting from holiday shopping trends toward delivery of gifts purchased over the internet. As logistics needs continue to evolve related to e-commerce and omnichannel growth, the duration of what is considered peak season has shortened over the last few years and now is approximately a five-week period beginning the week of Thanksgiving and ending on Christmas Eve, and we have seen our customers’ networks adjust accordingly.
Additional Information
At
December 31, 2018, our corporate structure included Covenant Transportation Group, Inc., a Nevada corporation and holding company organized in May 1994, and its wholly owned subsidiaries: Covenant Transport, Inc., a Tennessee corporation; Southern Refrigerated Transport, Inc., an Arkansas corporation; Star Transportation, Inc., a Tennessee corporation, each d/b/a Covenant Transport Services; Covenant Transport Solutions, LLC, a Nevada limited liability company, d/b/a Transport Financial Services; Covenant Logistics, Inc., a Nevada corporation; Covenant Asset Management, LLC, a Nevada limited liability company; CTG Leasing Company, a Nevada corporation; IQS Insurance Risk Retention Group, Inc., a Vermont corporation; Driven Analytic Solutions, LLC, a Nevada limited liability company, Heritage Insurance, Inc., a Tennessee corporation; Landair Holdings, Inc., a Tennessee corporation; Landair Transport, Inc., a Tennessee corporation; Landair Logistics, Inc., a Tennessee corporation; Landair Leasing, Inc., a Tennessee corporation; and Transport Management Services, LLC, a Tennessee limited liability company.
Our headquarters is located at 400 Birmingham Highway, Chattanooga, Tennessee 37419, and our website address is
www.covenanttransport.com
. Our Annual Report on Form 10-K, quarterly reports on Form 10-Q, current reports on Form 8-K, and all other reports we file or furnish with the SEC pursuant to Section 13(a) or 15(d) of the Securities Exchange Act of 1934, as amended (the "Exchange Act") are available free of charge through our website. Information contained in or available through our website is not incorporated by reference into, and you should not consider such information to be part of, this Annual Report on Form 10-K.
Additionally, you may read all of the materials that we file with the SEC by visiting the SEC's website at
www.sec.gov
. This site contains reports, proxy and information statements and other information regarding the Company and other companies that file electronically with the SEC.
|
ITEM 1A.
|
Our future results may be affected by a number of factors over which we have little or no control. The following discussion of risk factors contains forward-looking statements as discussed in Item 1 above. The following issues, uncertainties, and risks, among others, should be considered in evaluating our business and growth outlook.
Our business is subject to general economic, credit, business, and regulatory factors affecting the truckload industry that are largely beyond our control, any of which could have a materially adverse effect on our operating results.
The truckload industry is highly cyclical, and our business is dependent on a number of factors that may have a materially adverse effect on our results of operations, many of which are beyond our control. We believe that some of the most significant of these factors include (i) excess tractor and trailer capacity in the trucking industry in comparison with shipping demand; (ii) declines in the resale value of used equipment; (iii) recruiting and retaining qualified drivers; (iv) strikes, work stoppages, or work slowdowns at our facilities or at customer, port, border crossing, or other shipping-related facilities; (v) increases in interest rates, fuel taxes, tolls, and license and registration fees; (vi) rising costs of healthcare; and (vii) industry compliance with ongoing regulatory requirements; and (viii) fluctuations in foreign exchange rates.
We are also affected by (i) recessionary economic cycles, such as the period from 2007 through 2009 freight environment, which was characterized by weak demand and downward pressure on rates; (ii) changes in customers’ inventory levels and practices, including shrinking product/package sizes, and in the availability of funding for their working capital; (iii) changes in the way our customers choose to utilize our services; and (iv) downturns in our customers’ business cycles, particularly in market segments and industries, such as retail and manufacturing, where we have significant customer concentration. Economic conditions may adversely affect our customers and their demand for and ability to pay for our services. Customers encountering adverse economic conditions represent a greater potential for loss and we may be required to increase our allowance for doubtful accounts.
Economic conditions that decrease shipping demand or increase the supply of available tractors and trailers can exert downward pressure on rates and equipment utilization, thereby decreasing asset productivity. The risks associated with these factors are heightened when the United States economy is weakened, such as the period from 2007 through 2009. Some of the principal risks during such times, which risks we have experienced during prior recessionary periods, are as follows:
|
|
●
|
we may experience a reduction in overall freight levels, which may impair our asset utilization;
|
|
|
●
|
certain of our customers may face credit issues and could experience cash flow problems that may lead to payment delays, increased credit risk, bankruptcies, and other financial hardships that could result in even lower freight demand and may require us to increase our allowance for doubtful accounts;
|
|
|
●
|
freight patterns may change as supply chains are redesigned, resulting in an imbalance between our capacity and our customers' freight demand;
|
|
|
●
|
customers may solicit bids for freight from multiple trucking companies or select competitors that offer lower rates from among existing choices in an attempt to lower their costs, and we might be forced to lower our rates or lose freight;
|
|
|
●
|
we may be forced to accept more freight from freight brokers, where freight rates are typically lower, or may be forced to incur more non-revenue miles to obtain loads; and
|
|
|
●
|
lack of access to current sources of credit or lack of lender access to capital, leading to an inability to secure credit financing on satisfactory terms, or at all.
|
We are also subject to potential increases in various costs and other events that are outside our control that could materially reduce our profitability if we are unable to increase our rates sufficiently. Such cost increases include, but are not limited to, fuel and energy prices, driver and non-driver wages, purchased transportation costs, taxes, interest rates, tolls, license and registration fees, insurance premiums and claims, revenue equipment and related maintenance costs, tires and other components, and healthcare and other benefits for our employees. We could be affected by strikes or other work stoppages at our terminals, or at customer, port, border, or other shipping locations. Further, we may not be able to appropriately adjust our costs and staffing levels to changing market demands. In periods of rapid change, it is more difficult to match our staffing level to our business needs.
Changing impacts of regulatory measures could impair our operating efficiency and productivity, decrease our operating revenues and profitability, and result in higher operating costs. In addition, declines in the resale value of revenue equipment can also affect our profitability and cash flows. From time to time, various U.S. federal, state, or local taxes are also increased, including taxes on fuels. We cannot predict whether, or in what form, any such increase applicable to us will be enacted, but such an increase could adversely affect our results of operations and profitability.
In addition, we cannot predict future economic conditions, fuel price fluctuations, or how consumer confidence could be affected by actual or threatened armed conflicts or terrorist attacks, government efforts to combat terrorism, military action against a foreign state or group located in a foreign state, or heightened security requirements. Enhanced security measures in connection with such events could impair our operating efficiency and productivity and result in higher operating costs.
We may not be successful in achieving our strategic plan.
Several of our initiatives include growing our dedicated and Managed Freight service offerings, effectively managing the attraction, development, and retention of qualified drivers, and continuing to improve the operating performance of SRT. Such initiatives will require time, management and financial resources, changes in our operations and sales functions, and monitoring and implementation of technology. We may be unable to effectively and successfully implement, or achieve sustainable improvement from, our strategic plan and initiatives or achieve these objectives. In addition, our operating margins could
be adversely affected by future changes in and expansion of our business, including whether we are able to expand our expedited team operations. Further, our operating results may be negatively affected by a failure to further penetrate our existing customer base, cross-sell our services, pursue new customer opportunities, or manage the operations and expenses of new or growing services. There is no assurance that we will be successful in achieving our strategic plan and initiatives. Even if we are successful in achieving our strategic plan and initiatives, we still may not achieve our goals. If we are unsuccessful in implementing our strategic plan and initiatives, our financial condition, results of operations, and cash flows could be adversely affected.
We operate in a highly competitive and fragmented industry, and numerous competitive factors could impair our ability to improve our profitability, limit growth opportunities, and could have a materially adverse effect on our results of operations.
Numerous competitive factors present in our industry could impair our ability to maintain or improve our current profitability, limit our prospects for growth, and could have a materially adverse effect on our results of operations. These factors include the following:
|
|
●
|
we compete with many other truckload carriers of varying sizes and, to a lesser extent, with (i) less-than-truckload carriers, (ii) railroads, intermodal companies, and (iii) other transportation and logistics companies, many of which have access to more equipment and greater capital resources than we do;
|
|
|
●
|
many of our competitors periodically reduce their freight rates to gain business, especially during times of reduced growth in the economy, which may limit our ability to maintain or increase freight rates or to maintain or expand our business or may require us to reduce our freight rates in order to maintain business and keep our equipment productive;
|
|
|
●
|
many of our customers, including several in our top ten, are other transportation companies or also operate their own private trucking fleets, and they may decide to transport more of their own freight;
|
|
|
●
|
we may increase the size of our fleet during periods of high freight demand during which our competitors also increase their capacity, and we may experience losses in greater amounts than such competitors during subsequent cycles of softened freight demand if we are required to dispose of assets at a loss to match reduced customer demand;
|
|
|
●
|
a significant portion of our business is in the retail industry, which continues to undergo a shift away from the traditional brick and mortar model towards e-commerce, and this shift could impact the manner in which our customers source or utilize our services;
|
|
|
●
|
many customers reduce the number of carriers they use by selecting so-called "core carriers" as approved service providers or by engaging dedicated providers, and we may not be selected;
|
|
|
●
|
many customers periodically accept bids from multiple carriers for their shipping needs, and this process may depress freight rates or result in the loss of some of our business to competitors;
|
|
|
●
|
the trend toward consolidation in the trucking industry may create large carriers with greater financial resources and other competitive advantages relating to their size, and we may have difficulty competing with these larger carriers;
|
|
|
●
|
the market for qualified drivers is increasingly competitive, and our inability to attract and retain drivers could reduce our equipment utilization or cause us to increase compensation to our drivers and independent contractors we engage, both of which would adversely affect our profitability;
|
|
|
●
|
competition from freight logistics and freight brokerage companies may adversely affect our customer relationships and freight rates;
|
|
|
●
|
economies of scale that procurement aggregation providers may pass on to smaller carriers may improve such carriers’ ability to compete with us;
|
|
|
●
|
advances in technology may require us to increase investments in order to remain competitive, and our customers may not be willing to accept higher freight rates to cover the cost of these investments;
|
|
|
●
|
the Covenant brand name is a valuable asset that is subject to the risk of adverse publicity (whether or not justified),which could result in the loss of value attributable to our brand and reduced demand for our services; and
|
|
|
●
|
higher fuel prices and, in turn, higher fuel surcharges to our customers may cause some of our customers to consider freight transportation alternatives, including rail transportation.
|
We may not grow substantially in the future and we may not be successful in improving our profitability.
We may not be able to sustain or increase profitability in the future. Achieving profitability depends upon numerous factors, including our ability to effectively and successfully implement other strategic initiatives, increase our average revenue per tractor, improve driver retention, and control expenses. If we are unable to improve our profitability, then our liquidity, financial position, and results of operations may be adversely affected.
There is no assurance that in the future, our business will grow substantially or without volatility, nor can we assure you that we will be able to effectively adapt our management, administrative, and operational systems to respond to any future growth. Furthermore, there is no assurance that our operating margins will not be adversely affected by future changes in and expansion of our business.
We have terminals throughout the United States that serve markets in various regions. These operations require the commitment of additional personnel and revenue equipment, as well as management resources, for future development. Should the growth in our operations stagnate or decline, our results of operations could be adversely affected. We may encounter operating conditions in new markets, as well as our current markets, that differ substantially from our current operations, and customer relationships and appropriate freight rates in new markets could be challenging to attain.
In the future, we may need to obtain additional financing that may not be available or, if it is available, may result in a reduction in the percentage ownership of our stockholders.
We may need to raise additional funds in order to:
|
|
●
|
finance working capital requirements, capital investments, or refinance existing indebtedness;
|
|
|
●
|
develop or enhance our technological infrastructure and our existing products and services;
|
|
|
●
|
fund strategic relationships;
|
|
|
●
|
respond to competitive pressures; and
|
|
|
●
|
acquire complementary businesses, technologies, products, or services.
|
If the economy and/or the credit markets weaken, or we are unable to enter into capital or operating leases to acquire revenue equipment on terms favorable to us, our business, financial results, and results of operations could be materially adversely affected, especially if consumer confidence declines and domestic spending decreases.
If adequate funds are not available or are not available on acceptable terms, our ability to fund our strategic initiatives, take advantage of unanticipated opportunities, develop or enhance technology or services, or otherwise respond to competitive pressures or market changes could be significantly limited. If we raise additional funds by issuing equity or convertible debt securities, the percentage ownership of our stockholders may be reduced, and holders of these securities may have rights, preferences, or privileges senior to those of our stockholders.
We self-insure for a significant portion of our claims exposure, which could significantly increase the volatility of, and decrease the amount of, our earnings.
Our business results in a substantial number of claims and litigation related to personal injuries, property damage, workers’ compensation, employment issues, health care, and other issues. We self-insure a significant portion of our claims exposure, which could increase the volatility of, and decrease the amount of, our earnings, and could have a materially adverse effect on our results of operations. See Note 1, "Summary of Significant Accounting Policies," of the accompanying consolidated financial statements for more information regarding our self-insured retention amounts. Our future insurance and claims expenses may exceed historical levels, which could reduce our earnings. We currently accrue amounts for liabilities based on our assessment of claims that arise and our insurance coverage for the periods in which the claims arise, and we evaluate and revise these accruals from time to time based on additional information. Actual settlement of such liabilities could differ from our estimates due to a number of uncertainties, including evaluation of severity, legal costs, and claims that have been incurred but not reported. Due to our significant self-insured amounts, we have significant exposure to fluctuations in the number and severity of claims and the risk of being required to accrue or pay additional amounts if our estimates are revised or the claims ultimately prove to be more severe than originally assessed. Historically, we have had to significantly adjust our reserves on several occasions, and future significant adjustments may occur. Further, our self-insured retention levels could change and result in more volatility than in recent years. If we are required to accrue or pay additional amounts because our estimates are revised or the claims ultimately prove to be more severe than originally assessed or if our self-insured retention levels change, our financial condition and results of operations may be materially adversely affected.
We maintain insurance for most risks above the amounts for which we self-insure with licensed insurance carriers. If any claim were to exceed our coverage, or fall outside the aggregate coverage limit, we would bear the excess or uncovered amount, in addition to our other self-insured amounts. Although we believe our aggregate insurance limits are sufficient to cover reasonably expected claims, it is possible that one or more claims could exceed those limits. Insurance carriers have recently raised premiums for our industry. Our insurance and claims expense could increase if we have a similar experience at renewal, or we could find it necessary to raise our self-insured retention or decrease our aggregate coverage limits when our policies are renewed or replaced. Additionally, with respect to our insurance carriers, the industry is experiencing a decline in the number of carriers and underwriters that offer certain insurance policies or that are willing to provide insurance for trucking companies, and the necessity to go off-shore for insurance needs has increased. This may materially adversely affect our insurance costs or make insurance in excess of our self-insured retention more difficult to find, as well as increase our collateral requirements for policies that require security. Should these expenses increase, we become unable to find excess coverage in amounts we deem sufficient, we experience a claim in excess of our coverage limits, we experience a claim for which we do not have coverage, or we have to increase our reserves or collateral, there could be a materially adverse effect on our results of operations and financial condition.
Healthcare legislation and inflationary cost increases also could negatively impact financial results by increasing annual employee healthcare costs going forward. We cannot presently determine the extent of the impact healthcare costs will have on our financial performance. In addition, rising healthcare costs could force us to make changes to existing benefits program, which could negatively impact our ability to attract and retain employees.
Our auto liability insurance policy contains a provision under which we have the option, on a retroactive basis, to assume responsibility for the entire cost of covered claims during the policy period in exchange for a refund of a portion of the premiums we paid for the policy. This is referred to as "commuting" the policy. We have elected to commute policies in three of the past eight years. In exchange, we have assumed the risk for all claims during the years for the policies commuted. Our subsequent payouts for the claims assumed have been less than the refunds. We expect the total refunds to exceed the total payouts; however, not all of the claims have been finally resolved and we cannot assure you of the result. We may continue to commute policies for certain years in the future. To the extent we do so, and one or more claims result in large payouts, we will not have insurance, and our financial condition, results of operation, and liquidity could be materially and adversely affected.
Our self-insurance for auto liability at one of our subsidiaries and our use of captive insurance companies could adversely impact our operations.
Covenant Transport, Inc. has been approved to self-insure for auto liability by the FMCSA. We believe this status, along with the use of captive insurance companies, allows us to post substantially lower aggregate letters of credit and restricted cash than we would be required to post without this status or the use of captive insurance companies. We have two wholly owned captive insurance subsidiaries which are regulated insurance companies through which we insure a portion of our auto liability claims in certain states. An increase in the number or severity of auto liability claims for which we self-insure through the captive insurance companies or pressure in the insurance and reinsurance markets could adversely impact our earnings and results of operations. Further, both arrangements increase the possibility that our expenses will be volatile.
To comply with certain state insurance regulatory requirements, cash and cash equivalents must be paid to our captive insurance subsidiaries as capital investments and insurance premiums, which are restricted as collateral for anticipated losses. Significant future increases in the amount of collateral required by third-party insurance carriers and regulators would reduce our liquidity and could adversely affect our results of operations and capital resources.
Our captive insurance companies are subject to substantial government regulation.
Our captive insurance companies are regulated by state authorities. State regulations generally provide protection to policy holders, rather than stockholders, and generally involve:
|
|
●
|
approval of premium rates for insurance;
|
|
|
●
|
standards of solvency;
|
|
|
●
|
minimum amounts of statutory capital surplus that must be maintained;
|
|
|
●
|
limitations on types and amounts of investments;
|
|
|
●
|
regulation of dividend payments and other transactions between affiliates;
|
|
|
●
|
regulation of reinsurance;
|
|
|
●
|
regulation of underwriting and marketing practices;
|
|
|
●
|
approval of policy forms;
|
|
|
●
|
methods of accounting; and
|
|
|
●
|
filing of annual and other reports with respect to financial condition and other matters.
|
These regulations may increase our costs, limit our ability to change premiums, restrict our ability to access cash held by these subsidiaries, and otherwise impede our ability to take actions we deem advisable.
Fluctuations in the price or availability of fuel, the volume and terms of diesel fuel purchase commitments, surcharge collection, and hedging activities may increase our costs of operation, which could have a materially adverse effect on our profitability.
Fuel is one of our largest operating expenses. Diesel fuel prices fluctuate greatly due to factors beyond our control, such as political events, terrorist activities, armed conflicts, commodity futures trading, devaluation of the dollar against other currencies, and hurricanes and other natural or man-made disasters, each of which may lead to an increase in the cost of fuel. Fuel prices also are affected by the rising demand for fuel in developing countries and could be materially adversely affected by the use of crude oil and oil reserves for purposes other than fuel production and by diminished drilling activity. Such events may lead not only to increases in fuel prices, but also to fuel shortages and disruptions in the fuel supply chain. Because our operations are dependent upon diesel fuel, significant diesel fuel cost increases, shortages, rationings, or supply disruptions would materially and adversely affect our business, financial condition and results of operations.
Fuel also is subject to regional pricing differences and is often more expensive in certain areas where we operate. Increases in fuel costs, to the extent not offset by rate per mile increases or fuel surcharges, have a materially adverse effect on our operations and profitability. While we have fuel surcharge programs in place with a majority of our customers, which historically have helped us offset the majority of the negative impact of rising fuel prices associated with loaded or billed miles, we also incur fuel costs that cannot be recovered even with respect to customers with which we maintain fuel surcharge programs, such as those associated with non-revenue generating miles, time when our engines are idling, and fuel for refrigeration units on our refrigerated trailers. Moreover, the terms of each customer’s fuel surcharge program vary, and certain customers have sought to modify the terms of their fuel surcharge programs to minimize recoverability for fuel price increases. In addition, because our fuel surcharge recovery lags behind changes in fuel prices, our fuel surcharge recovery may not capture the increased costs we pay for fuel, especially when prices are rising. This could lead to fluctuations in our levels of reimbursement, which have occurred in the past. During periods of low freight volumes, shippers can use their negotiating leverage to impose fuel surcharge policies that provide a lower reimbursement of our fuel costs. There is no assurance that our fuel surcharge programs can be maintained indefinitely or will be sufficiently effective. Our results of operations would be negatively affected to the extent we cannot recover higher fuel costs or fail to improve our fuel price protection through our fuel surcharge program.
From time to time, we use hedging contracts and volume purchase arrangements to attempt to limit the effect of price fluctuations. We may be forced to make cash payments under the hedging contracts or volume purchase arrangements. Our hedging and volume purchase arrangements effectively allow us to pay a fixed rate for fuel on a specified number of gallons that is determined based on the market rate at the time we enter into the arrangement. In times of falling diesel fuel prices, our costs will not be reduced to the same extent they would have reduced if we had not entered into the hedging contracts or volume purchase arrangements and we may incur significant expense in connection with our obligation to make cash payments under such contracts. Accordingly, in times of falling diesel fuel prices, our profitability and cash flows may be negatively impacted to a greater extent than if we had not entered into the hedging contracts.
We depend on the proper functioning and availability of our management information and communication systems and other information technology assets (including the data contained therein) and a system failure or unavailability, including those caused by cybersecurity breaches, or an inability to effectively upgrade such systems and assets could cause a significant disruption to our business and have a materially adverse effect on our results of operations.
We depend heavily on the proper functioning, availability, and security of our management information and communication systems and other information technology assets, including financial reporting and operating systems and the data contained in such systems and assets, in operating our business. Our operating system is critical to understanding customer demands, accepting and planning loads, dispatching equipment and drivers, and billing and collecting for our services. Our financial reporting system is critical to producing accurate and timely financial statements and analyzing business information to help us manage effectively.
Our operations and those of our technology and communications service providers are vulnerable to interruption by fire, earthquake, power loss, telecommunications failure, cyberattacks, terrorist attacks, Internet failures, computer viruses, and other events beyond our control. More sophisticated and frequent cyberattacks in recent years have also increased security risks associated with information technology systems. We also maintain information security policies to protect our systems, networks, and other information technology assets (and the data contained therein) from cybersecurity breaches and threats, such as hackers, malware and viruses; however, such policies cannot ensure the protection of our systems, networks, and other information technology assets (and the data contained therein). In addition, although we attempt to reduce the risk of disruption to our business operations should a disaster occur through redundant computer systems and networks and backup systems, there can be no assurance that such measures will be effective. If any of our critical information systems fail or become otherwise unavailable, whether as a result of a system upgrade project or otherwise, we would have to perform the functions manually, which could temporarily impact our ability to manage our fleet efficiently, to respond to customers' requests effectively, to maintain billing and other records reliably, and to bill for services and prepare financial statements accurately or in a timely manner. Our business interruption insurance may be inadequate to protect us in the event of an unforeseeable and extreme catastrophe. Any significant system failure, upgrade complication, security breach (including cyberattacks), or other system disruption could interrupt or delay our operations, damage our reputation, cause us to lose customers, or impact our ability to manage our operations and report our financial performance, any of which could have a materially adverse effect on our business. In addition, we are currently dependent on a single vendor to support several information technology functions. If the stability or capability of such vendor became compromised and we were forced to migrate such functions to a new platform, it could adversely affect our business, financial condition, and results of operations.
We receive and transmit confidential data with and among our customers, drivers, vendors, employees, and service providers in the normal course of business. Despite our implementation of secure transmission techniques, internal data security measures, and monitoring tools, our information and communication systems are vulnerable to disruption of communications with our customers, drivers, vendors, employees, and service providers and access, viewing, misappropriation, altering, or deleting information in our systems, including customer, driver, vendor, employee, and service provider information and our proprietary business information. A security breach (including cyberattacks) could damage our business operations and reputation and could cause us to incur costs associated with repairing our systems, increased security, customer notifications, lost operating revenue, litigation, regulatory action, and reputational damage.
Our Third Amended and Restated Credit Agreement (our "Credit Facility") and other financing arrangements contain certain covenants, restrictions, and requirements, and we may be unable to comply with such covenants, restrictions, and requirements. A default could result in the acceleration of all or part of our outstanding indebtedness, which could have an adverse effect on our financial condition, liquidity, results of operations, and the market price of our Class A common stock.
We have a $95.0 million Credit Facility and numerous other financing arrangements. Our Credit Facility contains certain restrictions and covenants relating to, among other things, dividends, liens, acquisitions and dispositions outside of the ordinary course of business, affiliate transactions, and a fixed charge coverage ratio, if availability is below a certain threshold. We have had difficulty meeting budgeted results and have had to request amendments or waivers in the past. If we are unable to meet budgeted results or otherwise comply with our Credit Facility, we may be unable to obtain amendments or waivers under our Credit Facility, or we may incur fees in doing so.
Certain other financing arrangements contain certain restrictions and non-financial covenants, in addition to those contained in our Credit Facility. In addition, certain of our fuel hedging contracts are with lenders under our Credit Facility and could be terminated by such lenders if the Credit Facility is terminated or replaced. If we fail to comply with any of our financing arrangement covenants, restrictions, and requirements, we will be in default under the relevant agreement, which could cause cross-defaults under our other financing arrangements. In the event of any such default, if we failed to obtain replacement financing, amendments to, or waivers under the applicable financing arrangements, our lenders could cease making further advances, declare our debt to be immediately due and payable, fail to renew letters of credit, impose significant restrictions and requirements on our operations, institute foreclosure procedures against their collateral, or impose significant fees and transaction costs. If acceleration occurs, economic conditions such as the recent credit market crisis may make it difficult or expensive to refinance the accelerated debt or we may have to issue equity securities, which would dilute stock ownership. Even if new financing is made available to us, credit may not be available to us on acceptable terms. A default under our financing arrangements could result in a materially adverse effect on our liquidity, financial condition, and results of operations.
Our substantial indebtedness and capital and operating lease obligations could adversely affect our ability to respond to changes in our industry or business.
As a result of our level of debt, capital leases, operating leases, and encumbered assets, we believe:
|
|
●
|
our vulnerability to adverse economic and industry conditions and competitive pressures is heightened;
|
|
|
●
|
we will continue to be required to dedicate a substantial portion of our cash flows from operations to lease payments and repayment of debt, limiting the availability of cash for our operations, capital expenditures, and future business opportunities;
|
|
|
●
|
our flexibility in planning for, or reacting to, changes in our business and industry will be limited;
|
|
|
●
|
our profitability is sensitive to fluctuations in interest rates because some of our debt obligations are subject to variable interest rates, and future borrowings and lease financing arrangements will be affected by any such fluctuations;
|
|
|
●
|
our ability to obtain additional financing in the future for working capital, capital expenditures, debt service requirements, acquisitions, or other purposes may be limited;
|
|
|
●
|
it may be difficult for us to comply with the multitude of financial covenants, borrowing conditions, or other obligations contained in our debt agreements, thereby increasing the risk that we trigger certain cross-default provisions; and
|
|
|
●
|
we may be required to issue additional equity securities to raise funds, which would dilute the ownership position of our stockholders.
|
Our financing obligations could negatively impact our future operations, ability to satisfy our capital needs, or ability to engage in other business activities. We also cannot assure you that additional financing will be available to us when required or, if available, will be on terms satisfactory to us.
We may be unsuccessful in maintaining or increasing profitability.
Maintaining and improving profitability depends upon numerous factors, including the ability to increase average revenue per tractor, increase velocity, improve driver retention, and control operating expenses. We may not be able to improve profitability in the future, which could negatively impact our liquidity, financial position, and results of operations.
We have significant ongoing capital requirements that could affect our profitability if we are unable to generate sufficient cash from operations and obtain financing on favorable terms.
The truckload industry is capital intensive, and our policy of operating newer equipment requires us to expend significant amounts annually. We expect to pay for projected capital expenditures with cash flows from operations, borrowings under our Credit Facility, proceeds from the sale of our used revenue equipment, proceeds under other financing facilities, and leases of revenue equipment. If we are unable to generate sufficient cash from operations and obtain financing on favorable terms in the future, we may have to limit our fleet size, enter into less favorable financing arrangements, or operate our revenue equipment for longer periods, any of which could have a materially adverse effect on our profitability.
Credit markets may weaken at some point in the future, which would make it difficult for us to access our current sources of credit and difficult for our lenders to find the capital to fund us. We may need to incur additional debt, or issue debt or equity securities in the future, to refinance existing debt, fund working capital requirements, make investments, or support other business activities. Declines in consumer confidence, decreases in domestic spending, economic contractions, rating agency actions, and other trends in the credit market may impair our future ability to secure financing on satisfactory terms, or at all.
Our profitability may be materially adversely impacted if our capital investments do not match customer demand for invested resources or if there is a decline in the availability of funding sources for these investments.
Our operations require significant capital investments. The amount and timing of such investments depend on various factors, including anticipated freight demand and the price and availability of assets. If anticipated demand differs materially from actual usage, we may have too many or too few assets. Moreover, resource requirements vary based on customer demand, which may be subject to seasonal or general economic conditions. Our ability to select profitable freight and adapt to changes in customer transportation requirements is important to efficiently deploy resources and make capital investments in tractors and trailers (with respect to our truckload operations) or obtain qualified third-party capacity at a reasonable price (with respect to our Managed Freight segment). Although our business volume is not highly concentrated, our customers’ financial failures or loss of customer business may also affect us.
Our engagement of independent contractors to provide a portion of our capacity exposes us to different risks than we face with our tractors driven by company drivers.
Pursuant to our fuel surcharge program with independent contractors, we pay independent contractors we contract with a fuel surcharge that increases with the increase in fuel prices. A significant increase or rapid fluctuation in fuel prices could cause our costs under this program to be higher than the revenue we receive under our customer fuel surcharge programs.
Our agreements with the independent contractors we engage are governed by the federal leasing regulations, which impose specific requirements on us and the independent contractors. If more stringent federal leasing regulations are adopted, independent contractors could be deterred from becoming independent contractor drivers, which could materially adversely affect our goal of growing our current fleet levels of independent contractors.
Independent contractors are third-party service providers, as compared with company drivers, who are employed by us. As independent business owners, they may make business or personal decisions that may conflict with our best interests. For example, if a load is unprofitable, route distance is too far from home, personal scheduling conflicts arise, or for other reasons, independent contractors may deny loads of freight from time to time. In these circumstances, we must be able to deliver the freight timely in order to maintain relationships with customers, and if we fail to meet certain customer needs or incur increased expenses to do so, this could materially adversely affect our business, financial condition, and results of operations.
Developments in labor and employment law and any unionizing efforts by employees could have a materially adverse effect on our results of operations.
We face the risk that Congress, federal agencies or one or more states could approve legislation or regulations significantly affecting our businesses and our relationship with our employees, such as the previously proposed federal legislation referred to as the Employee Free Choice Act, which would have substantially liberalized the procedures for union organization. None of our domestic employees are currently covered by a collective bargaining agreement, but any attempt by our employees to organize a labor union could result in increased legal and other associated costs. Additionally, given the National Labor Relations Board’s “speedy election” rule, our ability to timely and effectively address any unionizing efforts would be difficult. If we entered into a collective bargaining agreement with our domestic employees, the terms could materially adversely affect our costs, efficiency, and ability to generate acceptable returns on the affected operations.
Additionally, the Department of Labor issued a final rule in 2016 raising the minimum salary basis for executive, administrative and professional exemptions from overtime payment. The rule increases the minimum salary from the current amount of $23,660 to $47,476 and up to 10% of non-discretionary bonus, commission and other incentive payments can be counted towards the minimum salary requirement. The rule was scheduled to go into effect on December 1, 2016. However, the rule was temporarily enjoined from going into effect in November 2016, and later invalidated in August 2017, after several states and business groups filed separate lawsuits against the DOL challenging the rule. However, any future rule similar to this rule that impacts the way we classify certain positions, increases our payment of overtime wages or increases the salaries we pay to currently exempt employees to maintain their exempt status, may have a material adverse effect on our business, financial condition, and results of operations.
We derive a significant portion of our revenues from our major customers, and the loss of, or a significant reduction of business with, one or more of which could have a materially adverse effect on our business.
In
2017, there were two customers which accounted for more than 10% of our consolidated revenue. However, in each of
2018 and
2016, there was one such customer. Our top five customers collectively accounted for approximately
34%,
34%, and
39% of our total revenue in 2018, 2017, and 2016, respectively. Generally, we do not have long-term contracts with our major customers. A substantial portion of our freight is from customers in the retail industry. As such, our volumes are largely dependent on consumer spending and retail sales, and our results may be more susceptible to trends in unemployment and retail sales than carriers that do not have this concentration. In addition, our major customers engage in bid processes and other activities periodically (including currently) in an attempt to lower their costs of transportation. We may not choose to participate in these bids or, if we participate, may not be awarded the freight, either of which could result in a reduction of our freight volumes with these customers. In this event, we could be required to replace the volumes elsewhere at uncertain rates and volumes, suffer reduced equipment utilization, or reduce the size of our fleet. Failure to retain our existing customers, or enter into relationships with new customers, each on acceptable terms, could materially impact our business, financial condition, results of operations, and ability to meet our current and long-term financial forecasts.
Generally, we do not have contractual relationships that guarantee any minimum volumes with our customers, and there can be no assurance that our customer relationships will continue as presently in effect. Our dedicated service offering is typically subject to longer term written contracts than our non-dedicated truckload offering. However, certain of these contracts contain cancellation clauses, including our “evergreen” contracts, which automatically renew for one year terms but that can be terminated more easily. There is no assurance any of our customers, including our dedicated customers, will continue to utilize our services, renew our existing contracts, or continue at the same volume levels. For our multi-year and dedicated contracts, the rates we charge may not remain advantageous. Further, despite the existence of contractual arrangements, certain of our customers may nonetheless engage in competitive bidding processes that could negatively impact our contractual relationship. In addition, certain of our major customers may increasingly use their own truckload and delivery fleets, which would reduce our freight volumes. A reduction in or termination of our services by one or more of our major customers, including our dedicated customers, could have a material adverse effect on our business, financial condition, and results of operations.
Economic conditions and capital markets may materially adversely affect our customers and their ability to remain solvent. While we review and monitor the financial condition of our key customers on an ongoing basis to determine whether to provide services on credit, our customers' financial difficulties could nevertheless negatively impact our results of operations and financial condition, especially if these customers were to delay or default on payments to us.
We depend on third-party providers, particularly in our Managed Freight segment where we offer brokerage and other logistics services, and service instability from these providers could increase our operating costs and reduce our ability to offer such services, which could adversely affect our revenue, results of operations, and customer relationships.
Our Managed Freight segment is dependent upon the services of third-party capacity providers, including other truckload carriers. For this business, we do not own or control the transportation assets that deliver our customers' freight, and we do not employ the people directly involved in delivering the freight. This reliance could also cause delays in reporting certain events, including recognizing revenue and claims. These third-party providers may seek other freight opportunities and may require increased compensation in times of improved freight demand or tight truckload capacity. If we are unable to secure the services of these third parties or if we become subject to increases in the prices we must pay to secure such services, our business, financial condition, and results of operations may be materially adversely affected, and we may be unable to serve our customers on competitive terms. Our ability to secure sufficient equipment or other transportation services may be affected by many risks beyond our control, including equipment shortages in the transportation industry, particularly among contracted truckload carriers, interruptions in service due to labor disputes, driver shortages, changes in regulations impacting transportation, and changes in transportation rates.
Increases in driver compensation or difficulties attracting and retaining qualified drivers could have a materially adverse effect on our profitability and the ability to maintain or grow our fleet.
Like many truckload carriers, we experience substantial difficulty in attracting and retaining sufficient numbers of qualified drivers, which includes the engagement of independent contractors. The truckload industry periodically experiences a shortage of qualified drivers, particularly during periods of economic expansion, in which alternative employment opportunities, including in the construction and manufacturing industries, are more plentiful and freight demand increases, or during periods of economic downturns, in which unemployment benefits might be extended and financing is limited for independent contractors who seek to purchase equipment or for students who seek financial aid for driving school. Regulatory requirements, including those related to safety ratings, ELDs and hours-of-service changes, and an improved economy could further reduce the number of eligible drivers or force us to increase driver compensation to attract and retain drivers. We have seen evidence that stricter hours-of-service regulations adopted by the DOT in the past have tightened, and, to the extent new regulations are enacted, may continue to tighten, the market for eligible drivers. The lack of adequate tractor parking along some U.S. highways and congestion caused by inadequate highway funding may make it more difficult for drivers to comply with hours-of-service regulations and cause added stress for drivers, further reducing the pool of eligible drivers. We believe the required implementation of ELDs in December 2017 has and may further tighten the market. We believe the shortage of qualified drivers and intense competition for drivers from other trucking companies will create difficulties in maintaining or increasing the number of drivers and may restrain our ability to engage a sufficient number of drivers and independent contractors, and our inability to do so may negatively impact our operations. Further, the compensation we offer our drivers and independent contractor expenses are subject to market conditions, and we may find it necessary to increase driver and independent contractor compensation in future periods.
In addition, we and many other truckload carriers suffer from a high turnover rate of drivers and independent contractors, and our turnover rate is higher than the industry average and compared to our peers. This high turnover rate requires us to spend significant resources recruiting a substantial number of drivers and independent contractors in order to operate existing revenue equipment and maintain our current level of capacity and subjects us to a higher degree of risk with respect to driver and independent contractor shortages than our competitors. We also employ driver hiring standards that we believe are more rigorous than the hiring standards employed in general in our industry and could further reduce the pool of available drivers from which we would hire. Our use of team-driven tractors in our expedited business requires two drivers per tractor, which further increases the number of drivers we must recruit and retain in comparison to operations that require one driver per tractor. If we are unable to continue to attract and retain a sufficient number of drivers, we could be forced to, among other things, adjust our compensation packages, increase the number of our tractors without drivers, or operate with fewer trucks and face difficulty meeting shipper demands, any of which could adversely affect our growth and profitability.
If our independent contractor drivers are deemed by regulators or judicial process to be employees, our business, financial condition and results of operations could be adversely affected.
Tax and other regulatory authorities, as well as independent contractors themselves, have increasingly asserted that independent contractor drivers in the trucking industry are employees rather than independent contractors, for a variety of purposes, including income tax withholding, workers' compensation, wage and hour compensation, unemployment, and other issues. Federal legislators have introduced legislation in the past to make it easier for tax and other authorities to reclassify independent contractor drivers as employees, including legislation to increase the recordkeeping requirements for those that engage independent contractors and to heighten the penalties of companies who misclassify their employees and are found to have violated employees' overtime and/or wage requirements. Additionally, federal legislators have sought to abolish the current safe harbor allowing taxpayers meeting certain criteria to treat individuals as independent contractors if they are following a long-standing, recognized practice, extend the Fair Labor Standards Act to independent contractors, and impose notice requirements based upon employment or independent contractor status and fines for failure to comply. Some states have put initiatives in place to increase their revenues from items such as unemployment, workers' compensation, and income taxes, and a reclassification of independent contractors as employees would help states with these initiatives. Additionally, courts in certain states have issued recent decisions that could result in a greater likelihood that independent contractors would be judicially classified as employees in such states. Further, class actions and other lawsuits have been filed against certain members of our industry seeking to reclassify independent contractors as employees for a variety of purposes, including workers' compensation and health care coverage. In addition, companies that utilize lease-purchase independent contractor programs, such as us, have been more susceptible to reclassification lawsuits and several recent court decisions have been made in favor of those seeking to classify as employees certain independent contractors that participated in lease-purchase programs. Taxing and other regulatory authorities and courts apply a variety of standards in their determination of independent contractor status. Our classification of independent contractors has been the subject of audits by such authorities from time to time. While we have been successful in continuing to classify our independent contractor drivers as independent contractors and not employees, we may be unsuccessful in defending that position in the future. If our independent contractors are determined to be our employees, we would incur additional exposure under federal and state tax, workers' compensation, unemployment benefits, labor, employment, and tort laws, including for prior periods, as well as potential liability for employee benefits and tax withholdings.
We operate in a highly regulated industry, and changes in existing regulations or violations of existing or future regulations could have a materially adverse effect on our operations and profitability.
We operate in the United States pursuant to operating authority granted by the DOT and in various Canadian provinces pursuant to operating authority granted by the Ministries of Transportation and Communications in such provinces. We operate within Mexico by utilizing third-party carriers within that country. Our company drivers and independent contractors also must comply with the safety and fitness regulations of the DOT, including those relating to drug and alcohol testing, driver safety performance, and hours-of-service. Matters such as weight, equipment dimensions, exhaust emissions, and fuel efficiency are also subject to government regulations. We also may become subject to new or more restrictive regulations relating to fuel efficiency, exhaust emissions, hours-of-service, ergonomics, on-board reporting of operations, collective bargaining, security at ports, speed limiters, driver training, and other matters affecting safety or operating methods. Future laws and regulations may be more stringent, require changes in our operating practices, influence the demand for transportation services, or require us to incur significant additional costs. Higher costs we incur, or higher costs incurred by suppliers who pass the costs on to us, could adversely affect our results of operations. In addition, the Trump administration has indicated a desire to reduce regulatory burdens that constrain growth and productivity, and also to introduce legislation such as infrastructure spending, that could improve growth and productivity. Changes in regulations, such as those related to trailer size and gross vehicle weight limits, hours-of-service, drug and alcohol testing, and mandating ELDs, could increase capacity in the industry or improve the position of certain competitors, either of which could negatively impact pricing and volumes, or require additional investments by us. The short and long term impacts of changes in legislation or regulations are difficult to predict and could materially adversely affect our operations. The Regulation section in Item 1 of Part I of this Annual Report on Form 10-K discusses several proposed, pending, suspended, and final regulations that could materially impact our business and operations.
The CSA program adopted by the FMCSA could adversely affect our profitability and operations, our ability to maintain or grow our fleet, and our customer relationships.
Under CSA, fleets are evaluated and ranked against their peers based on certain safety-related standards. As a result, our fleet could be ranked poorly as compared to peer carriers. We recruit and retain first-time drivers to be part of our fleet, and these drivers may have a higher likelihood of creating adverse safety events under CSA. The occurrence of future deficiencies could affect driver recruitment by causing high-quality drivers to seek employment with other carriers, limit the pool of available drivers, or could cause our customers to direct their business away from us and to carriers with higher fleet safety rankings, either of which would adversely affect our results of operations. Additionally, competition for drivers with favorable safety backgrounds may increase and thus could necessitate increases in driver-related compensation costs. Further, we may incur greater than expected expenses in our attempts to improve unfavorable scores.
Certain of our subsidiaries are currently exceeding the established intervention thresholds in one or more of the seven CSA safety-related categories. Based on these unfavorable ratings, we may be prioritized for an intervention action or roadside inspection, either of which could adversely affect our results of operations. In addition, customers may be less likely to assign loads to us. We have put procedures in place in an attempt to address areas where we are exceeding and have in the past exceeded the thresholds. However, we cannot assure you these measures will be effective.
In December 2015, Congress passed the FAST Act, which directs the FMCSA to conduct studies of the scoring system used to generate CSA rankings to determine if it is effective in identifying high-risk carriers and predicting future crash risk. This study was conducted and delivered to the FMCSA in June 2017 with several recommendations to make the CSA program more fair, accurate and reliable. In June 2018, the FMCSA provided a report to Congress outlining the changes it may make to the CSA program in response to the study. Such changes include the testing and possible adoption of a revised risk modeling theory, potential collection and dissemination of additional carrier data, and revised measures for intervention thresholds. The adoption of such changes is contingent on the results of the new modeling theory and additional public feedback. Therefore, it is unclear if, when and to what extent such changes to the CSA program will occur. However, any changes that increase the likelihood of us receiving unfavorable scores could materially adversely affect our results of operations and profitability.
Receipt of an unfavorable DOT safety rating could have a materially adverse effect on our operations and profitability.
We currently have a satisfactory DOT rating, which is the highest available rating under the current safety rating scale. If we were to receive a conditional or unsatisfactory DOT safety rating, it could materially adversely affect our business, financial condition, and results of operations as customer contracts may require a satisfactory DOT safety rating, and a conditional or unsatisfactory rating could materially adversely affect or restrict our operations.
The FMCSA has proposed regulations that would modify the existing rating system and the safety labels assigned to motor carriers evaluated by the DOT. Under regulations that were proposed in 2016, the methodology for determining a carrier’s DOT safety rating would be expanded to include the on-road safety performance of the carrier’s drivers and equipment, as well as results obtained from investigations. Exceeding certain thresholds based on such performance or results would cause a carrier to receive an unfit safety rating. The proposed regulations were withdrawn in March 2017, but the FMCSA noted that a similar process may be initiated in the future. If similar regulations were enacted and we were to receive an unfit or other negative safety rating, our business would be materially adversely affected in the same manner as if we received a conditional or unsatisfactory safety rating under the current regulations. In addition, poor safety performance could lead to increased risk of liability, increased insurance, maintenance and equipment costs and potential loss of customers, which could materially adversely affect our business, financial condition and results of operations.
Properties with environmental problems may create liabilities for us.
Under various federal, state, and local environmental laws, statutes, ordinances, rules, and regulations, as an owner of real property, we may be liable for the costs of removal or remediation of certain hazardous or toxic substances at, on, in, or under our properties, as well as certain other potential costs relating to hazardous or toxic substances (including government fines and penalties and damages for injuries to persons and adjacent property). These laws may impose liability without regard to whether we knew of, or were responsible for, the presence or disposal of those substances. This liability may be imposed on us in connection with the activities of an operator of, or tenant at, the property. The cost of any required remediation, removal, fines, or personal or property damages and our liability therefore could exceed the value of the property and/or our aggregate assets. In addition, the presence of those substances, or the failure to properly dispose of or remove those substances, may adversely affect our ability to sell or rent that property or to borrow using that property as collateral, which, in turn, would reduce our liquidity and adversely affect our operations.
Increased prices for new revenue equipment, design changes of new engines, volatility in the used equipment market, decreased availability of new revenue equipment, and the failure of manufacturers to meet their sale or trade-back obligations to us could have a materially adverse effect on our business, financial condition, results of operations, and profitability.
We are subject to risk with respect to higher prices for new tractors. We have experienced an increase in prices for new tractors over the past few years, and the resale value of the tractors has not increased to the same extent. Prices have increased and may continue to increase, due, in part, to government regulations applicable to newly manufactured tractors and diesel engines, higher commodity prices, and the pricing discretion of equipment manufacturers. In addition, we have recently equipped our tractors with safety, aerodynamic, and other options that increase the price of new equipment. More restrictive regulations related to emissions and fuel efficiency standards have required vendors to introduce new engines and will require more fuel-efficient trailers. Compliance with such regulations has increased the cost of our new tractors, may increase the cost of new trailers, could impair equipment productivity, in some cases, result in lower fuel mileage, and increase our operating expenses. Our business could be harmed if we are unable to continue to obtain an adequate supply of new tractors and trailers for these or other reasons. As a result, we expect to continue to pay increased prices for equipment and incur additional expenses and related financing costs for the foreseeable future. Furthermore, reduced equipment efficiency may result from new engines designed to reduce emissions, thereby increasing our operating expenses.
A depressed market for used equipment could require us to trade our revenue equipment at depressed values or to record losses on disposal or impairments of the carrying values of our revenue equipment that is not protected by residual value arrangements. Used equipment prices are subject to substantial fluctuations based on freight demand, the supply of used tractors, the availability of financing, the presence of buyers for export to foreign countries, and commodity prices for scrap metal. If there is a deterioration of resale prices, it could have a material adverse effect on our business, financial condition and results of operations. Trades at depressed values and decreases in proceeds under equipment disposals and impairments of the carrying values of our revenue equipment could materially adversely affect our business, financial condition and results of operations.
Tractor and trailer vendors may reduce their manufacturing output in response to lower demand for their products in economic downturns or shortages of component parts. A decrease in vendor output may have a materially adverse effect on our ability to purchase a quantity of new revenue equipment that is sufficient to sustain our desired growth rate and to maintain a late-model fleet. Moreover, an inability to obtain an adequate supply of new tractors or trailers could have a materially adverse effect on our business, financial condition, and results of operation.
Certain of our revenue equipment financing arrangements have balloon payments at the end of the finance terms equal to the values we expect to be able to obtain in the used market. To the extent the used market values are lower than that, we may be forced to sell the equipment at a loss and our results of operations would be materially adversely affected.
If we are unable to retain our key employees, our business, financial condition, and results of operations could be harmed.
We are highly dependent upon the services of our executive management team and other key personnel, including David R. Parker, our Chairman of the Board and Chief Executive Officer and Joey B. Hogan, our President and Chief Operating Officer. We currently do not have employment agreements with Messrs. Parker or Hogan or other key personnel. Turnover, planned or otherwise, in these or other key leadership positions may materially adversely affect our ability to manage our business efficiently and effectively, and such turnover can be disruptive and distracting to management, may lead to additional departures of existing personnel, and could have a material adverse effect on our operations and future profitability. We must continue to develop and retain a core group of managers and attract, develop, and retain sufficient additional managers if we are to continue to improve our profitability and have appropriate succession planning for key management personnel.
We may not make acquisitions in the future, or if we do, we may not be successful in our acquisition strategy.
We made eleven acquisitions since 1996. Accordingly, acquisitions have provided a substantial portion of our growth. We may not have the financial capacity or be successful in identifying, negotiating, or consummating any future acquisitions. If we fail to make any future acquisitions, our historical growth rate could be materially and adversely affected. Any acquisitions we undertake could involve the dilutive issuance of equity securities and/or incurring indebtedness.
In addition, in July 2018, we completed the Landair Acquisition. Refer to Note 15, “Acquisition of Landair Holdings, Inc.” of the accompanying consolidated financial statements for further information about the Landair Acquisition. The Landair Acquisition and any future acquisitions we may consummate involve numerous risks, any of which could have a materially adverse effect on our business, financial condition and results of operations, including:
|
|
•
|
some of the acquired businesses may not achieve anticipated revenue, earnings or cash flows;
|
|
|
•
|
we may assume liabilities that were not disclosed to us or otherwise exceed our estimates;
|
|
|
•
|
we may be unable to integrate acquired businesses successfully, or at all, and realize anticipated economic, operational and other benefits in a timely manner, which could result in substantial costs and delays or other operational, technical, or financial problems;
|
|
|
•
|
transaction costs and acquisition-related integration costs could adversely affect our results of operations in the period in which such charges are recorded;
|
|
|
•
|
we may incur future impairment charges, write-offs, write-downs, or restructuring charges that could adversely impact our results of operations;
|
|
|
•
|
acquisitions could disrupt our ongoing business, distract our management and divert our resources;
|
|
|
•
|
we may experience difficulties operating in markets in which we have had no or only limited direct experience;
|
|
|
•
|
we could lose customers, employees and drivers of any acquired company; and
|
|
|
•
|
we may incur additional indebtedness.
|
Our 49% owned subsidiary, TEL, faces certain additional risks particular to its operations, any one of which could adversely affect our operating results.
In May 2011, we acquired a 49% interest in TEL, a used equipment leasing company and reseller. We account for our investment in TEL using the equity method of accounting. TEL faces several risks similar to those we face and additional risks particular to its business and operations. TEL has significant ongoing capital requirements and carries significant debt. The ability to secure financing and market fluctuations in interest rates could impact TEL's ability to grow its leasing business and its margins on leases. Adverse economic activity may restrict the number of used equipment buyers and their ability to pay prices for used equipment that we find acceptable. In addition, TEL's leasing customers are typically small trucking companies without substantial financial resources, and TEL is subject to risk of loss should those customers be unable to make their lease payments. A portion of TEL’s business includes leasing equipment to individual independent contractors who are generally not required to provide significant amounts to secure their obligations under the lease agreements with TEL. Such independent contractors generally have few assets and are at a heightened risk of defaulting under such lease agreements, which may cause TEL to incur unreimbursed costs related to the recovery of equipment, equipment maintenance and repair, missed lease payments, and the reletting of the equipment. In addition, the shrinking independent contractor market may decrease the number of drivers available to utilize such portion of TEL’s business and could decrease TEL’s revenues. Further, we believe the used equipment market will significantly impact TEL's results of operations and such market has been volatile in the past. There can be no assurance that TEL will experience gains on sale similar to those it has experienced in the past and it may incur losses on sale. As regulations change, the market for used equipment may be impacted as such regulatory changes may make used equipment costly to upgrade to comply with such regulations or we may be forced to scrap equipment if such regulations eliminate the market for particular used equipment. Further, there is an overlap in providers of equipment financing to TEL and our wholly owned operations and those providers may consider the combined exposure and limit the amount of credit available to us.
In May 2016, the operating agreement with TEL was amended to, among other things, remove the previously agreed to fixed date purchase options. Our option to acquire up to the remaining 51% of TEL would have expired May 31, 2016, and TEL's majority owners would have received the option to purchase our ownership in TEL. The options previously in effect were eliminated as part of the amendment. TEL's majority owners are generally restricted from transferring their interests in TEL, other than to certain permitted transferees, without our consent. There is no assurance that we will be able to agree on a revised formula or that TEL's ownership incentives will not be changed as a result of this process.
Finally, we do not control TEL's ownership or management. Our investment in TEL is subject to the risk that TEL's management and controlling members may make business, financial, or management decisions with which we do not agree or that the management or controlling members may take risks or otherwise act in a manner that does not serve our interests. If any of the foregoing were to occur, the value of our investment in TEL could decrease, and our financial condition, results of operations, and cash flow could suffer as a result.
We are exposed to risks related to our receivables factoring arrangements.
We engage in receivables factoring arrangements pursuant to which our clients, consisting of smaller trucking companies, factor their receivables to us for a fee to facilitate faster cash flow. We advance 85% to 95% of each receivable factored and retain the remainder as collateral for collection issues that might arise. The retained amounts are returned to the clients after the related receivable has been collected, net of any interest and fees on the amount advanced. We evaluate each client's customer base under predefined criteria. These factored receivables are generally unsecured trade obligations, except when personal guarantees are received. While we have procedures to monitor and limit exposure to credit risk on these receivables, there can be no assurance such procedures will continue to effectively limit collection risk and avoid losses. We periodically assess the credit risk of our client's customers and regularly monitor the timeliness of payments. Slowdowns, bankruptcies, or financial difficulties within the markets our clients serve may impair the financial condition of one or more of our client's customers and may hinder such customers' ability to pay the factored receivables on a timely basis or at all. If any of these difficulties are encountered, our cash flows and results of operations could be adversely impacted.
Our Chairman of the Board and Chief Executive Officer and his wife control a large portion of our stock and have substantial control over us, which could limit other stockholders' ability to influence the outcome of key transactions, including changes of control.
Our Chairman of the Board and Chief Executive Officer, David Parker, and his wife, Jacqueline Parker, beneficially own or have sole voting and dispositive power over approximately
17% of our outstanding Class A common stock and
100% of our Class B common stock. On all matters with respect to which our stockholders have a right to vote, including the election of directors, each share of Class A common stock is entitled to one vote, while each share of Class B common stock is entitled to two votes. All outstanding shares of Class B common stock are owned by the Parkers and are convertible to Class A common stock on a share-for-share basis at the election of the Parkers or automatically upon transfer to someone outside of the Parker family. This voting structure gives the Parkers approximately
35% of the voting power of all of our outstanding stock. As such, the Parkers are able to substantially influence decisions requiring stockholder approval, including the election of our entire board of directors, the adoption or extension of anti-takeover provisions, mergers, and other business combinations. This concentration of ownership could limit the price that some investors might be willing to pay for the Class A common stock, and could allow the Parkers to prevent or could discourage or delay a change of control, which other stockholders may favor. The interests of the Parkers may conflict with the interests of other holders of Class A common stock, and they may take actions affecting us with which other stockholders disagree.
The market price of our Class A common stock may be volatile.
The price of our Class A common stock may fluctuate widely, depending upon a number of factors, many of which are beyond our control. These factors include, among other items: the perceived prospects of our business and our industry as a whole; differences between our actual financial and operating results and those expected by investors and analysts; changes in analysts’ recommendations or projections, including such analysts’ outlook on our industry as a whole; actions or announcements by our competitors; changes in the regulatory environment in which we operate; significant sales or hedging of shares by a principal stockholder; actions taken by stockholders that may be contrary to the Board of Director’s recommendations; and changes in general economic or market conditions. In addition, stock markets generally experience significant price and volume volatility from time to time which may adversely affect the market price of our Class A common stock for reasons unrelated to our performance.
Compliance with various environmental laws and regulations upon which our operations are subject may increase our costs of operations and non-compliance with such laws and regulations could result in substantial fines or penalties.
In addition to direct regulation under the DOT and related agencies, we are subject to various environmental laws and regulations dealing with the hauling and handling of hazardous materials, fuel storage tanks, air emissions from our vehicles and facilities, and discharge and retention of storm water. Our tractor terminals often are located in industrial areas where groundwater or other forms of environmental contamination may have occurred or could occur. Our operations involve the risks of fuel spillage or seepage, environmental damage, and hazardous waste disposal, among others. We also maintain above-ground bulk fuel storage tanks and fueling islands at several of our facilities and one leased facility has below-ground bulk fuel storage tanks. A small percentage of our freight consists of low-grade hazardous substances, which subjects us to a wide array of regulations. Although we have instituted programs to monitor and control environmental risks and promote compliance with applicable environmental laws and regulations, if we are involved in a spill or other accident involving hazardous substances, if there are releases of hazardous substances we transport, if soil or groundwater contamination is found at our facilities or results from our operations, or if we are found to be in violation of applicable laws or regulations, we could be subject to cleanup costs and liabilities, including substantial fines or penalties or civil and criminal liability, any of which could have a materially adverse effect on our business and operating results.
EPA regulations limiting exhaust emissions became more restrictive in 2010 when an executive memorandum was signed directing the NHTSA and the EPA to develop new, stricter fuel efficiency standards for heavy tractors. In 2011, the NHTSA and the EPA adopted final rules that established the Phase 1 Standards. The Phase 1 Standards apply to tractor model years 2014 to 2018, which are required to achieve an approximate 20 percent reduction in fuel consumption by 2018, and equates to approximately four gallons of fuel for every 100 miles traveled. In addition, in October 2016, the EPA and NHTSA published the final rule establishing the Phase 2 Standards that will apply to trailers beginning with model year 2018 and tractors beginning with model year 2021. The Phase 2 Standards require nine percent and 25 percent reductions in emissions and fuel consumption for trailers and tractors, respectively, by 2027. We believe these requirements will result in additional increases in new tractor and trailer prices and additional parts and maintenance costs incurred to retrofit our tractors and trailers with technology to achieve compliance with such standards, which could adversely affect our operating results and profitability, particularly if such costs are not offset by potential fuel savings. We cannot predict, however, the extent to which our operations and productivity will be impacted. In October 2017, the EPA announced a proposal to repeal the Phase 2 Standards as they relate to gliders (which mix refurbished older components, including transmissions and pre-emission-rule engines, with a new frame, cab, steer axle, wheels, and other standard equipment). The outcome of such proposal is still undetermined as the EPA continues to consider Congressionally requested investigations into the legality of the proposal and the merits of an anti-glider study that was published shortly after the proposal became official. Additionally, implementation of the Phase 2 Standards as they relate to trailers has been delayed due to a provisional stay granted in October 2017 by the U.S. Court of Appeals for the District of Columbia, which is overseeing a case against the EPA by the Truck Trailer Manufacturers Association, Inc. regarding the Phase 2 Standards. In addition, future additional emission regulations are possible. In addition, in February 2017, CARB proposed California Phase 2 standards that would generally align with the federal Phase 2 Standards, with some minor additional requirements.
In February 2019, the California Phase 2 standards became final. Thus, even if the trailer provisions of the Phase 2 Standards are permanently removed, we would still need to ensure the majority of our fleet is compliant with the California Phase 2 standards, which may result in increased equipment costs and could adversely affect our operating results and profitability.
Any federal, state, or local regulations that impose restrictions, caps, taxes, or other controls on emissions of greenhouse gases could adversely affect our operations and financial results. Until the timing, scope, and extent of any future regulation becomes known, we cannot predict its effect on our cost structure or our operating results; however, any future regulation could impair our operating efficiency and productivity and result in higher operating costs.
If we cannot effectively manage the challenges associated with doing business internationally, our operating revenue and profitability may suffer.
A component of our operations is the business we conduct in Mexico and to a lesser extent Canada, and we are subject to risks of doing business internationally, including fluctuations in foreign currencies, changes in the economic strength of Mexico and Canada, difficulties in enforcing contractual obligations and intellectual property rights, burdens of complying with a wide variety of international and United States export and import laws, theft or vandalism of our revenue equipment, and social, political, and economic instability.
In addition, if we are unable to maintain our Free and Secure Trade ("FAST"), Business Alliance for Secure Commerce ("BASC"), and Customs-Trade Partnership Against Terrorism ("C-TPAT") status, we may have significant border delays. This could cause our Mexican and Canadian operations to be less efficient than those of competing capacity providers that have FAST, BASC, and C-TPAT status and operate in Mexico or Canada. We also face additional risks associated with our foreign operations, including restrictive trade policies and duties, taxes, or government royalties imposed by the Mexican or Canadian governments, to the extent not preempted by the terms of the North American Free Trade Agreement (“NAFTA”), or its proposed replacement, the United-States-Mexico-Canada Agreement (“USMCA”), which is waiting for Congressional approval. In addition, changes to NAFTA, USMCA (if enacted), or other treaties governing our business could materially adversely affect our international business. It is also uncertain how the USMCA, if enacted, will impact foreign trade and our Mexican operations.
Litigation may adversely affect our business, financial condition, and results of operations.
Our business is subject to the risk of litigation by employees, independent contractors, customers, vendors, government agencies, stockholders, and other parties through private actions, class actions, administrative proceedings, regulatory actions, and other processes. Recently, trucking companies, including us, have been and currently are subject to lawsuits, including class action lawsuits, alleging violations of various federal and state wage and hour laws regarding, among other things, employee meal breaks, rest periods, overtime eligibility, and failure to pay for all hours worked. A number of these lawsuits have resulted in the payment of substantial settlements or damages by the defendants.
These types of cases have increased since March 2014 when the Ninth Circuit Court of Appeals held that the application of California state wage and hour laws to interstate truck drivers is not preempted by federal law. The case was appealed to the Supreme Court of the United States, which denied certiorari in May 2015, and accordingly, the Ninth Circuit Court of Appeals decision stood. However, in December 2018, the FMCSA granted a petition filed by the American Trucking Associations and in doing so determined that federal law does preempt California’s wage and hour laws, and interstate truck drivers are not subject to such laws. The FMCSA’s decision has been appealed by labor groups and multiple lawsuits have been filed in federal courts seeking to overturn the decision, and thus it’s uncertain whether it will stand. Other current and future state and local wage and hour laws, including laws related to employee meal breaks and rest periods, may also vary significantly from federal law. As a result, we, along with other companies in the industry, are subject to an uneven patchwork of state and local laws throughout the United States. In the past, federal legislation has been proposed to solidify the preemption of certain state and local laws applied to interstate truck drivers; however, passage of such legislation is uncertain. If such federal legislation is not passed, we may either need to comply with the most restrictive state and local laws across our entire fleet, or overhaul our management systems to comply with varying state and local laws. Either solution could result in increased compliance and labor costs, driver turnover, and decreased efficiency.
The outcome of litigation, particularly class action lawsuits and regulatory actions, is difficult to assess or quantify, and the magnitude of the potential loss relating to such lawsuits may remain unknown for substantial periods of time. The cost to defend litigation may also be significant. Not all claims are covered by our insurance, and there can be no assurance that our coverage limits will be adequate to cover all amounts in dispute. To the extent we experience claims that are uninsured, exceed our coverage limits, involve significant aggregate use of our self-insured retention amounts, or cause increases in future premiums, the resulting expenses could have a materially adverse effect on our business, results of operations, financial condition, or cash flows.
In addition, we may be subject, and have been subject in the past, to litigation resulting from trucking accidents. The number and severity of litigation claims may be worsened by distracted driving by both truck drivers and other motorists. These lawsuits have resulted, and may result in the future, in the payment of substantial settlements or damages and increases of our insurance costs.
Seasonality and the impact of weather and other catastrophic events affect our operations and profitability.
Our tractor productivity decreases during the winter season because inclement weather impedes operations, and some shippers reduce their shipments after the winter holiday season. Our expedited operations, historically have experienced a greater reduction in first quarter demand than our other operations. Revenue also can be affected by bad weather and holidays, since revenue is directly related to available working days of shippers. At the same time, operating expenses increase and fuel efficiency declines because of engine idling and harsh weather creating higher accident frequency, increased claims, and more equipment repairs. In addition, many of our customers, particularly those in the retail industry where we have a large presence, demand additional capacity during the fourth quarter, which limits our ability to take advantage of more attractive spot market rates that generally exist during such periods. Further, despite our efforts to meet such demands, we may fail to do so, which may result in lost future business opportunities with such customers, which could have a materially adverse effect on our operations. Recently, the duration of this increased period of demand in the fourth quarter has shortened, with certain customers requiring the same volume of shipments over a more condensed timeframe, resulting in increased stress and demand on our network, people, and systems. If this trend continues, it could make satisfying our customers and maintaining the quality of our service during the fourth quarter increasingly difficult. We may also suffer from weather-related or other unforeseen events such as tornadoes, hurricanes, blizzards, ice storms, floods, fires, earthquakes, and explosions. These events may disrupt fuel supplies, increase fuel costs, disrupt freight shipments or routes, affect regional economies, destroy our assets, or adversely affect the business or financial condition of our customers, any of which could have a materially adverse effect on our results of operations or make our results of operations more volatile. Weather and other seasonal events could adversely affect our operating results.
We have identified a material weakness in our internal control over financial reporting, and if we are unable to remediate such material weakness and to maintain effective internal control over financial reporting in the future, there could be an elevated possibility of a material misstatement, and such a misstatement could cause investors to lose confidence in our financial statements, which could have a material adverse effect on our stock price.
We are required, pursuant to Section 404 of the Sarbanes-Oxley Act, to furnish a report by management on the effectiveness of our internal control over financial reporting. In addition, our independent registered public accounting firm must report on its evaluation of our internal control over financial reporting. As disclosed in Item 9A of this report, we have identified a material weakness as of December 31, 2018 in our internal control over financial reporting due to information technology general controls. As a result of this material weakness, our external auditors have issued an adverse opinion indicating that we have not maintained effective internal control over financial reporting as of December 31, 2018. Our management team has taken action to develop a remediation plan for this material weakness, but we cannot be certain when the remediation will be completed. In addition, prior to the Landair Acquisition, Landair was not subject to the requirements of Section 404 of the Sarbanes-Oxley Act. Therefore, we may be unable to establish and maintain effective internal controls over Landair’s financial reporting. If we fail to fully remediate our identified material weakness or fail to maintain effective internal controls in the future, including in connection with the Landair Acquisition or any future acquisitions, it could result in a material misstatement of our financial statements, which could cause investors to lose confidence in our financial statements or cause our stock price to decline.
We could determine that our goodwill and other intangible assets are impaired, thus recognizing a related loss.
As of December 31, 2018, we had goodwill of
$41.6 million and other intangible assets of
$32.5 million, solely from the Landair Acquisition. We evaluate our goodwill and other intangible assets for impairment. We could recognize impairments in the future, and we may never realize the full value of our intangible assets. If these events occur, our profitability and financial condition will suffer.
Uncertainties in the interpretation and application of the Tax Act could materially affect our tax obligations and effective tax rate.
On December 2017, the U.S. enacted comprehensive tax legislation, commonly referred to as the Tax Act. The new law requires complex computations not previously required by U.S. tax law. As such, the application of accounting guidance for such items is currently uncertain. Further, compliance with the new law and the accounting for such provisions require preparation and analysis of information not previously required or regularly produced. In addition, the U.S. Department of Treasury has broad authority to issue regulations and interpretative guidance that may significantly impact how we will apply the law and impact our results of operations in future periods. Accordingly, while we have provided a provisional estimate on the effect of the new law in our accompanying audited financial statements, further regulatory or U.S. generally accepted accounting principles (“GAAP”) accounting guidance for the law, our further analysis on the application of the law, and refinement of our initial estimates and calculations could materially change our current provisional estimates, which could in turn materially affect our tax obligations and effective tax rate. There are also likely to be significant future impacts that these tax reforms will have on our future financial results and our business strategies. In addition, there is a risk that states or foreign jurisdictions may amend their tax laws in response to these tax reforms, which could have a material impact on our future results.
|
ITEM 1B.
|
None.
|
ITEM 2.
|
Our corporate headquarters and main terminal are located on approximately 180 acres of property in Chattanooga, Tennessee. This facility includes an office building of approximately 182,000 square feet, a maintenance facility of approximately 65,000 square feet, a body shop of approximately 60,000 square feet, and a tractor wash. Our Managed Freight segment is managed out of Chattanooga and Greeneville, TN facilities and includes operations of four warehouses totaling approximately 600,000 square feet. We maintain nine terminals, which are utilized by our Truckload segment located on our major traffic lanes in or near the cities listed below. These terminals provide a base for drivers in proximity to their homes, a transfer location for trailer relays on transcontinental routes, parking space for equipment dispatch, and the other uses indicated below. All of the properties noted below are subject to mortgages or deeds of trust under our Credit Facility, with the exception of our Chattanooga headquarters, which is subject to a deed of trust under a separate financing.
|
Locations
|
|
Terminal
|
|
Recruiting/
Orientation
|
|
Sales
|
|
Warehouse
|
|
Ownership
|
|
|
Chattanooga, Tennessee
|
|
x
|
|
x
|
|
x
|
|
|
|
Owned
|
|
|
Texarkana, Arkansas
|
|
x
|
|
x
|
|
x
|
|
|
|
Owned
|
|
|
Hutchins, Texas
|
|
x
|
|
x
|
|
|
|
|
|
Owned
|
|
|
Pomona, California
|
|
x
|
|
x
|
|
|
|
|
|
Owned
|
|
|
Allentown, Pennsylvania
|
|
x
|
|
|
|
|
|
|
|
Owned
|
|
|
LaVergne, Tennessee
|
|
x
|
|
x
|
|
x
|
|
|
|
Owned
|
|
|
Orlando, Florida
|
|
x
|
|
|
|
|
|
|
|
Owned
|
|
|
Fayetteville, North Carolina
|
|
|
|
|
|
|
|
x
|
|
Leased
|
|
|
Greeneville, Tennessee
|
|
x
|
|
x
|
|
x
|
|
x
|
|
Leased
|
|
|
Rancho Cucamonga, California
|
|
|
|
|
|
|
|
x
|
|
Leased
|
|
|
Warsaw, North Carolina
|
|
|
|
|
|
|
|
x
|
|
Leased
|
|
|
Hartsville, South Carolina
|
|
x
|
|
|
|
|
|
|
|
Leased
|
|
|
ITEM 3.
|
From time-to-time, we are a party to ordinary, routine litigation arising in the ordinary course of business, most of which involves claims for personal injury and/or property damage incurred in connection with the transportation of freight.
We maintain insurance to cover liabilities arising from the transportation of freight for amounts in excess of certain self-insured retentions. In management's opinion, our potential exposure under pending legal proceedings is adequately provided for in the accompanying consolidated financial statements.
Our Covenant Transport subsidiary is a defendant in a lawsuit filed on November 9, 2018 in the Superior Court of Los Angeles, California. The lawsuit was filed on behalf of Richard Tabizon (a California resident and former driver), who is seeking to have the lawsuit certified as a class action case wherein he alleges violation of multiple California wage and hour statutes from October 31, 2014 to present, including failure to pay drivers separately for rest breaks, failure to provide itemized wage statements, failure to pay minimum wage (for on-duty not driving time), waiting time penalties, and failure to reimburse for business expenses. Tabizon is also seeking Private Attorney General Act (“PAGA”) penalties based on these claims from September 11, 2017 through the present. The case was removed from state court on December 6, 2018 to the U.S. Federal District Court in the Central District of California.
Based on our present knowledge of the facts and, in certain cases, advice of outside counsel, management believes the resolution of open claims and pending litigation, taking into account existing reserves, is not likely to have a materially adverse effect on our consolidated financial statements.
|
ITEM 4.
|
None.
PART II
ITEM 5.
MARKET FOR REGISTRANT'S COMMON EQUITY, RELATED STOCKHOLDER MATTERS AND ISSUER PURCHASES OF EQUITY SECURITIES
Price Range of Common Stock
Our Class A common stock is traded on the NASDAQ Global Select Market, under the symbol "CVTI."
As of March 8, 2019, we had approximately 90
stockholders of record of our Class A common stock; however, we estimate our actual number of stockholders is much higher because a substantial number of our shares are held of record by brokers or dealers for their customers in street names. As of
March 12, 2019, Mr. Parker, together with certain of his family members, owned all of the outstanding Class B common stock.
Dividend Policy
We have never declared and paid a cash dividend on our Class A or Class B common stock. It is the current intention of our Board of Directors to continue to retain earnings to finance our business and reduce our indebtedness rather than to pay dividends. The payment of cash dividends is currently limited by our financing arrangements. Future payments of cash dividends will depend upon our financial condition, results of operations, capital commitments, restrictions under then-existing agreements, and other factors deemed relevant by our Board of Directors.
See "Equity Compensation Plan Information" under Item 12 in Part III of this Annual Report on Form 10-K for certain information concerning shares of our Class A common stock authorized for issuance under our equity compensation plans.
|
ITEM 6.
|
(In thousands, except per share and operating data amounts)
|
|
Years Ended December 31,
|
|||||||||||||||||||
|
|
2018
|
2017
|
2016
|
2015
|
2014
|
|||||||||||||||
|
Statement of Operations Data:
|
||||||||||||||||||||
|
Freight revenue
|
$
|
779,729
|
$
|
626,809
|
$
|
610,845
|
$
|
640,120
|
$
|
578,204
|
||||||||||
|
Fuel surcharge revenue
|
105,726
|
78,198
|
59,806
|
84,120
|
140,776
|
|||||||||||||||
|
Total revenue
|
$
|
885,455
|
$
|
705,007
|
$
|
670,651
|
$
|
724,240
|
$
|
718,980
|
||||||||||
|
|
||||||||||||||||||||
|
Operating expenses:
|
||||||||||||||||||||
|
Salaries, wages, and related expenses
|
304,447
|
241,784
|
234,526
|
244,779
|
231,761
|
|||||||||||||||
|
Fuel expense
|
121,264
|
103,139
|
103,108
|
122,160
|
168,856
|
|||||||||||||||
|
Operations and maintenance
|
55,505
|
48,774
|
45,864
|
46,458
|
47,251
|
|||||||||||||||
|
Revenue equipment rentals and purchased transportation
|
183,645
|
141,954
|
117,472
|
118,583
|
111,772
|
|||||||||||||||
|
Operating taxes and licenses
|
11,831
|
9,878
|
11,712
|
11,016
|
10,960
|
|||||||||||||||
|
Insurance and claims (1)
|
43,333
|
33,155
|
32,596
|
31,909
|
39,594
|
|||||||||||||||
|
Communications and utilities
|
7,061
|
6,938
|
6,057
|
6,162
|
5,806
|
|||||||||||||||
|
General supplies and expenses
|
23,227
|
14,783
|
14,413
|
14,007
|
16,950
|
|||||||||||||||
|
Depreciation and amortization, including gains and losses on disposition of equipment and impairment of assets
|
76,156
|
76,447
|
72,456
|
61,384
|
46,384
|
|||||||||||||||
|
Total operating expenses
|
826,469
|
676,852
|
638,204
|
656,458
|
679,334
|
|||||||||||||||
|
Operating income
|
58,986
|
28,155
|
32,447
|
67,782
|
39,646
|
|||||||||||||||
|
Interest expense, net
|
8,708
|
8,258
|
8,226
|
8,445
|
10,794
|
|||||||||||||||
|
Income from equity method investment
|
(7,732
|
)
|
(3,400
|
)
|
(3,000
|
)
|
(4,570
|
)
|
(3,730
|
)
|
||||||||||
|
Income before income taxes
|
58,010
|
23,297
|
27,221
|
63,907
|
32,582
|
|||||||||||||||
|
Income tax expense (benefit)
|
15,507
|
(32,142
|
)
|
10,386
|
21,822
|
14,774
|
||||||||||||||
|
Net income
|
$
|
42,503
|
$
|
55,439
|
$
|
16,835
|
$
|
42,085
|
$
|
17,808
|
||||||||||
|
|
||||||||||||||||||||
|
Basic income per share
|
$
|
2.32
|
$
|
3.03
|
$
|
0.93
|
$
|
2.32
|
$
|
1.17
|
||||||||||
|
|
||||||||||||||||||||
|
Diluted income per share
|
$
|
2.30
|
$
|
3.02
|
$
|
0.92
|
$
|
2.30
|
$
|
1.15
|
||||||||||
|
|
||||||||||||||||||||
|
Basic weighted average common shares outstanding
|
18,340
|
18,279
|
18,182
|
18,145
|
15,250
|
|||||||||||||||
|
|
||||||||||||||||||||
|
Diluted weighted average common shares outstanding
|
18,469
|
18,372
|
18,266
|
18,311
|
15,517
|
|||||||||||||||
|
|
Years Ended December 31,
|
|||||||||||||||||||
|
|
2018
|
2017
|
2016
|
2015
|
2014
|
|||||||||||||||
|
Selected Balance Sheet Data:
|
||||||||||||||||||||
|
Net property and equipment
|
$
|
450,595
|
$
|
464,072
|
$
|
465,471
|
$
|
454,049
|
$
|
382,491
|
||||||||||
|
Total assets (2)
|
$
|
773,524
|
$
|
649,668
|
$
|
620,538
|
$
|
646,717
|
$
|
539,304
|
||||||||||
|
Long-term debt and capital lease obligations, less current maturities
|
$
|
201,754
|
$
|
186,242
|
$
|
188,437
|
$
|
206,604
|
$
|
172,903
|
||||||||||
|
Total stockholders' equity
|
$
|
343,142
|
$
|
295,201
|
$
|
236,414
|
$
|
202,160
|
$
|
169,204
|
||||||||||
|
|
||||||||||||||||||||
|
Selected Operating Data:
|
||||||||||||||||||||
|
Capital expenditures (proceeds), net (3)
|
$
|
33,093
|
$
|
72,006
|
$
|
59,052
|
$
|
148,994
|
$
|
89,455
|
||||||||||
|
Average freight revenue per loaded mile (4)
|
$
|
2.13
|
$
|
1.89
|
$
|
1.86
|
$
|
1.89
|
$
|
1.77
|
||||||||||
|
Average freight revenue per total mile (4)
|
$
|
1.94
|
$
|
1.70
|
$
|
1.67
|
$
|
1.69
|
$
|
1.60
|
||||||||||
|
Average freight revenue per tractor per week (4)
|
$
|
4,191
|
$
|
3,917
|
$
|
3,881
|
$
|
3,967
|
$
|
3,777
|
||||||||||
|
Average miles per tractor per year
|
112,736
|
120,043
|
121,782
|
122,508
|
123,275
|
|||||||||||||||
|
Weighted average tractors for year (5)
|
2,843
|
2,557
|
2,593
|
2,700
|
2,609
|
|||||||||||||||
|
Total tractors at end of period (5)
|
3,154
|
2,559
|
2,535
|
2,656
|
2,665
|
|||||||||||||||
|
Total trailers at end of period (6)
|
6,950
|
6,846
|
7,389
|
6,978
|
6,722
|
|||||||||||||||
|
Team-driven tractors as percentage of fleet
|
30.8
|
%
|
38.1
|
%
|
38.7
|
%
|
35.3
|
%
|
32.1
|
%
|
||||||||||
|
(1)
|
2017 and 2014 insurance and claims expense includes $0.9 million and $7.5 million of additional reserves for 2008 cargo claim, respectively.
|
|
(2)
|
Adjusted for retrospective adoption of ASU 2015-17.
|
|
(3)
|
Includes equipment purchased under capital leases.
|
|
(4)
|
Excludes fuel surcharge revenue.
|
|
(5)
|
Includes monthly rental tractors and tractors provided by independent contractors.
|
|
(6)
|
Excludes monthly rental trailers.
|
The information set forth above should be read in conjunction with "Management's Discussion and Analysis of Financial Condition and Results of Operations" and the Company's consolidated financial statements and notes thereto included in Items 7 and 8, respectively, of this Form 10-K.
|
ITEM 7.
|
Cautionary Note Regarding Forward-Looking Statements
Item 7, as well as other items of this Annual Report on Form 10-K, contains certain statements that may be considered forward-looking statements within the meaning of Section 27A of the Securities Act of 1933, as amended, and Section 21E of the Securities Exchange Act of 1934, as amended, and such statements are subject to the safe harbor created by those sections and the Private Securities Litigation Reform Act of 1995, as amended. All statements, other than statements of historical or current fact, are statements that could be deemed forward-looking statements, including without limitation: any projections of earnings, revenues, or other financial items; any statement of plans, strategies, and objectives of management for future operations; any statements concerning proposed new services or developments; any statements regarding future economic conditions or performance; any statements of belief; and any statements of assumptions underlying any of the foregoing. In this Item 7, statements relating to future demand for and supply of new and used tractors and trailers (including expected prices of such equipment), future improvement opportunities, expected sources and adequacy of working capital and liquidity, future relationships, use, compensation, and availability with respect to third-party service providers, future driver market conditions, future allocation of capital, expected settlement of operating lease obligations, future asset sales and acquisitions, future insurance, litigation, and claims levels and expenses, future tax rates, expense, and deductions, future fuel management, expense, and the future effectiveness of fuel surcharge programs, future interest rates and effectiveness of interest rate swaps, expected capital expenditures (including the future mix of lease and purchase obligations), future trucking capacity, expected freight demand and volumes, future investments in and the growth of individual segments and services, future rates, future depreciation and amortization, future compliance with and impact of existing and proposed federal and state laws and regulations, future salaries, wages, and other employee benefit expenses, future earnings from and value of our investments, future customer relationships, future defaults under debt agreements, future payment of financing and lease liabilities, future performance of our subsidiaries, future credit availability, including expected borrowing base increases in our Credit Facility, expected transition to and effect of new accounting standards, expected effect of remeasured deferred tax assets, and future operating and maintenance expenses, among others, are forward-looking statements. Such statements may be identified by their use of terms or phrases such as "believe," "may," "could," "expects," "estimates," "projects," "anticipates," "plans," "intends," and similar terms and phrases. Forward-looking statements are based on currently available operating, financial, and competitive information. Forward-looking statements are inherently subject to risks and uncertainties, some of which cannot be predicted or quantified, which could cause future events and actual results to differ materially from those set forth in, contemplated by, or underlying the forward-looking statements. Factors that could cause or contribute to such differences include, but are not limited to, those discussed in the section entitled "
Item 1A. Risk Factors
,
" set forth above. Readers should review and consider the factors discussed in "
Item 1A. Risk Factors
," along with various disclosures in our press releases, stockholder reports, and other filings with the Securities and Exchange Commission.
All such forward-looking statements speak only as of the date of this Annual Report. You are cautioned not to place undue reliance on such forward-looking statements. We expressly disclaim any obligation or undertaking to release publicly any updates or revisions to any forward-looking statements contained herein to reflect any change in our expectations with regard thereto or any change in the events, conditions, or circumstances on which any such statement is based.
EXECUTIVE OVERVIEW
With continued economic growth in the U.S. we are encouraged by the year-over-year improvement in our operating margins and strategic growth in
2018. Our successful addition of Landair met our stated objective of entering into closer relationships with our customers and getting deeper in the supply chain. We believe we have improved our revenue mix and reduced our exposure to seasonal and cyclical volatility by growing around our most capital-intensive service offerings with longer-term contractual business in the dedicated, logistics, and warehousing markets.
Our excellent package of service offerings and a supportive freight environment throughout 2018 contributed to a higher revenue per mile across all business units. We are encouraged by our improved profitability, as our annual operating ratio
improved
270 basis points to
93.3%. Our adjusted operating ratio (as defined below), a key measure of profitability in our industry, also
improved
330 basis points to
92.2%. These favorable changes were primarily the result of
higher freight revenue per tractor at each of our three historical truckload businesses, the addition of Landair, a favorable impact from our minority investment in Transport Enterprise Leasing, and strong growth and improved margins in our brokerage offering, compared to
2017.
While we experienced increased operating costs, with higher employee wages and increased casualty insurance claims costs, our strong overall performance contributed to the highest annual earnings in the Company's 32-year history, after excluding the $40.1 million reduction in 2017 income tax expense as a result of the Tax Act. Our consolidated financial results are summarized as follows:
|
|
●
|
Total revenue was
$885.5 million, compared with
$705.0 million for 2017, and freight revenue (which excludes revenue from fuel surcharges) was
$779.7 million, compared with
$626.8 million for 2017;
|
|
|
●
|
Operating income was
$59.0 million, compared with operating income of
$28.2 million for 2017;
|
|
|
●
|
Net income was
$42.5 million, or
$2.30 per diluted share, compared with net income of
$55.4 million, or
$3.02 per diluted share, for 2017. Net income for 2017 included
$40.1 million, or $2.18 per diluted share, of income tax benefit resulting primarily from the reevaluation of our net deferred tax balances at December 31, 2017 as a result of the enactment of the Tax Act, signed into law on December 22, 2017;
|
|
●
|
With available borrowing capacity of $54.8 million under our Credit Facility as of December 31, 2018, we do not expect to be required to test our fixed charge covenant in the foreseeable future;
|
|
|
●
|
Our equity investment in TEL provided
$7.7 million of pre-tax earnings in
2018, compared to
$3.4 million for 2017;
|
|
|
●
|
Since December 31, 2017, aggregate lease adjusted indebtedness (which includes the present value of off-balance sheet lease obligations), net of cash, increased by $35.5 million to $255.7 million; and
|
|
|
●
|
Stockholders' equity at
December 31, 2018 was
$343.1 million, and tangible book value was
$269.0 million, or
$14.65 per basic share.
|
In addition to operating ratio, we use "adjusted operating ratio" as a key measure of profitability. Adjusted operating ratio means operating expenses, net of fuel surcharge revenue and intangibles, expressed as a percentage of revenue, excluding fuel surcharge revenue. Adjusted operating ratio is not a substitute for operating ratio measured in accordance with GAAP. There are limitations to using non-GAAP financial measures. We believe the use of adjusted operating ratio allows us to more effectively compare periods, while excluding the potentially volatile effect of changes in fuel prices. Our Board and management focus on our adjusted operating ratio as an indicator of our performance from period to period. We believe our presentation of adjusted operating ratio is useful because it provides investors and securities analysts the same information that we use internally to assess our core operating performance. Although we believe that adjusted operating ratio improves comparability in analyzing our period-to-period performance, it could limit comparability to other companies in our industry, if those companies define adjusted operating ratio differently. Because of these limitations, adjusted operating ratio should not be considered a measure of income generated by our business or discretionary cash available to us to invest in the growth of our business. Management compensates for these limitations by primarily relying on GAAP results and using non-GAAP financial measures on a supplemental basis.
Operating Ratio
Operating Ratio (“OR”) From
2016 to
2018
|
GAAP Operating Ratio:
|
2018
|
OR %
|
2017
|
OR %
|
2016
|
OR %
|
||||||||||||||||||
|
Total revenue
|
$
|
885,455
|
$
|
705,007
|
$
|
670,651
|
||||||||||||||||||
|
Total operating expenses
|
826,469
|
93.3
|
%
|
676,852
|
96.0
|
%
|
638,204
|
95.2
|
%
|
|||||||||||||||
|
Operating income
|
$
|
58,986
|
$
|
28,155
|
$
|
32,447
|
||||||||||||||||||
| Adjusted Operating Ratio: | 2018 | Adj. OR % | 2017 | Adj. OR % | 2016 | Adj. OR % | ||||||||||||||||||
|
Total revenue
|
885,455 | 705,007 | 670,651 | |||||||||||||||||||||
| Fuel surcharge revenue | (105,726 | ) | (78,198 | ) | (59,806 | ) | ||||||||||||||||||
| Freight revenue (total revenue, excluding fuel surcharge) | 779,729 | 626,809 | 610,845 | |||||||||||||||||||||
| Total operating expenses | 826,469 | 676,852 | 638,204 | |||||||||||||||||||||
| Adjusted for: | ||||||||||||||||||||||||
| Fuel surcharge revenue | (105,726 | ) | (78,198 | ) | (59,806 | ) | ||||||||||||||||||
| Amortization of intangibles | (1,462 | ) | - | (169 | ) | |||||||||||||||||||
| Adjusted operating expenses | 719,281 | 92.2 | % | 598,654 | 95.5 | % | 578,229 | 94.7 | % | |||||||||||||||
| Adjusted operating income | 60,448 | 28,155 | 32,447 | |||||||||||||||||||||
Outlook
Our earnings outlook for 2019 is positive. We expect to deliver earnings improvement for the first quarter of 2019 as compared to the first quarter of 2018. For the full year, we expect adjusted earnings per diluted share to increase modestly over 2018, based on the favorable impact of a full year of earnings contribution from Landair’s service offerings, partially offset by investment in growing the Managed Freight segment. From a balance sheet perspective, with net capital expenditures scheduled at normal replacement cycle, along with positive operating cash flows, we expect to reduce combined balance sheet and off-balance sheet debt over the course of fiscal 2019.
Our outlook is based on our expectation of a relatively balanced freight environment measured over the entire 2019 year, with the potential for intra-period volatility in response to national and global events. We believe these conditions are consistent with U.S. economic growth of 2.0% to 2.5%, modestly growing industrial production, balanced inventories, and mid-single digit percentage increases in revenue per total mile across our truckload business. The freight market in January has thus far been consistent with our expectations, but not as strong as January 2018, nor the majority of 2018. Beyond the general freight environment, we believe company-specific improvement opportunities exist as we continue to execute on our strategic direction to grow our contract logistics service offerings including dedicated contract truckload, warehousing and transportation management services (“TMS”). We expect that the growth of our dedicated contract truckload service offering will come somewhat from a re-allocation of capital from our transactional OTR truckload service offering, most specifically from the less profitable solo-driven refrigerated OTR service. In addition, we expect to continue to invest in the organic growth of our freight brokerage services, which could pressure Managed Freight profit margins until revenue growth catches up with the investments. Even with these changes, attracting and retaining highly qualified, professional truck drivers will remain a significant challenge, and we will continue to work actively with our customers to improve driver compensation, efficiency, and working conditions while providing a high level of service. In the aggregate, the goals of our capital allocation strategy are to become increasingly embedded in our customers’ supply chains, to reduce the cyclicality and seasonality of our business and financial results, and to enhance our long-term earnings power and return on invested capital.
RESULTS OF CONSOLIDATED OPERATIONS
The following table sets forth total revenue and freight revenue (total revenue less fuel surcharge revenue) for the periods indicated:
Revenue
|
|
Year ended December 31,
|
|||||||||||
|
(in thousands)
|
2018
|
2017
|
2016
|
|||||||||
|
Revenue:
|
||||||||||||
|
Freight revenue
|
$
|
779,729
|
$
|
626,809
|
$
|
610,845
|
||||||
|
Fuel surcharge revenue
|
105,726
|
78,198
|
59,806
|
|||||||||
|
Total revenue
|
$
|
885,455
|
$
|
705,007
|
$
|
670,651
|
||||||
For
2018, total revenue
increased
$180.5 million, or
25.6%, to
$885.5 million from
$705.0 million in
2017. Freight revenue
increased
$152.9 million or
24.4%, to
$779.7 million for 2018, from
$626.8 million in 2017, while fuel surcharge revenue
increased
$27.5 million year-over-year. The increase in freight revenue resulted from an
$86.7 million
increase in freight revenue from our Truckload segment and a
$66.2 million
increase in revenues from our Managed Freight segment.
The
increase in 2018 Truckload revenue relates to a
286 (or
11.2%) average tractor
increase and an
increase in average freight revenue per tractor per week of
7.0% compared to 2017, partially offset by a
$10.9 million
decrease in freight revenue contributed by our temperature-controlled intermodal service offering as compared to 2017, as we effectively discontinued this consistently unprofitable service offering within our solo-driver refrigerated truckload unit during December 2017. Landair contributed
$43.3 million of freight revenue to consolidated truckload operations in 2018,
and the acquisition was primarily responsible for the increase in average tractors. The
increase in average freight revenue per tractor per week is the result of a
13.9%
increase, or
23.7 cents per mile, in average rate per total mile, partially offset by a
6.1%
decrease in average miles per unit when compared to 2017. Team driven units
decreased approximately
10.2% to an average of
875 teams in 2018 from
974 teams in 2017. The increase in revenue per mile and decrease in utilization are primarily due to the impact of the Landair operations on the combined truckload division. Landair's shorter average length of haul and dedicated contract, solo-driven tractor operations generally produce higher revenue per total mile and fewer miles per tractor than our other truckload business units.
The increase in Managed Freight revenue is primarily the result of Landair's contribution of
$41.9 million of revenue to combined Managed Freight operations, in addition to growth with existing customers and certain internal strategic growth initiatives during 2018, compared with 2017.
For 2017, total revenue increased $34.4 million, or 5.1%, to $705.0 million from $670.7 million in 2016. Freight revenue increased $16.0 million, or 2.6%, to $626.8 million for 2017, from $610.8 million in 2016, while fuel surcharge revenue increased $18.4 million year-over-year. The increase in freight revenue resulted from a $22.8 million increase in revenues from Managed Freight, partially offset by a $6.8 million decrease in freight revenue from our Truckload segment.
The decrease in 2017 Truckload revenue relates to a $4.2 million decrease in freight revenue contributed by our temperature-controlled intermodal service offering, a decrease in our average tractor fleet of 1.4% from 2016, partially offset by an increase in average freight revenue per tractor per week of 0.9% compared to 2016. The increase in average freight revenue per tractor per week is the result of a 2.1% increase, or 3.6 cents per mile, in average rate per total mile, partially offset by a 1.4% decrease in average miles per unit when compared to 2016. Team driven units decreased approximately 11.6% to an average of 912 teams in 2017 from 1,032 teams in 2016.
The increase in Managed Freight revenue is primarily as a result of spot market opportunities related to the hurricane-affected regions during 2017 and growth with existing customers compared with 2016.
For comparison purposes in the discussion below, we use total revenue and freight revenue (total revenue less fuel surcharge revenue) when discussing changes as a percentage of revenue. As it relates to the comparison of expenses to freight revenue, we believe removing fuel surcharge revenue, which is sometimes a volatile source of revenue, affords a more consistent basis for comparing the results of operations from period-to-period. Nonetheless, freight revenue is a non-GAAP financial measure and is not a substitute for revenue measured in accordance with GAAP. There are limitations to using non-GAAP financial measures. Our Board and management focus on our freight revenue as an indicator of our performance from period to period. We believe our presentation of freight revenue is useful because it provides investors and securities analysts the same information that we use internally to assess our core operating performance. Although we believe that freight revenue improves comparability in analyzing our period-to-period performance, it could limit comparability to other companies in our industry, if those companies define freight revenue differently. Because of these limitations, freight revenue should not be considered a measure of total revenue generated by or available to our business. Management compensates for these limitations by primarily relying on GAAP results and using non-GAAP financial measures on a supplemental basis.
Salaries, wages, and related expenses
|
|
Year ended December 31,
|
|||||||||||
|
(dollars in thousands)
|
2018
|
2017
|
2016
|
|||||||||
|
Salaries, wages, and related expenses
|
$
|
304,447
|
$
|
241,784
|
$
|
234,526
|
||||||
|
% of total revenue
|
34.4
|
%
|
34.3
|
%
|
35.0
|
%
|
||||||
|
% of freight revenue
|
39.0
|
%
|
38.6
|
%
|
38.4
|
%
|
||||||
Salaries, wages, and related expenses
increased approximately
$62.6 million, or
25.9%, for the year ended December 31, 2018, compared with 2017. As a percentage of total revenue, salaries, wages, and related expenses
increased slightly to
34.4% of total revenue for the year ended December 31, 2018, as compared to
34.3% in 2017. As a percentage of freight revenue, salaries, wages, and related expenses
increased to
39.0% of freight revenue for the year ended December 31, 2018, from
38.6% in 2017. The change in salaries, wages, and related expenses is primarily due to increased headcount from the Landair Acquisition,
pay adjustments for both driver and non-drivers since 2017, an increase in performance-based incentive compensation expense, and a
$5.1 million
increase in group insurance costs, compared to 2017. These adjustments were partially offset by a
decrease in workers’ compensation costs of approximately
0.5 cents per mile, a
decrease of
$2.4 million in fees paid to third party agents in our Managed Freight segment, and a lower percentage of our fleet comprised of team-driven tractors, which carry the costs of two drivers, as compared to 2017.
Salaries, wages, and related expenses increased approximately $7.3 million, or 3.1%, for the year ended December 31, 2017, compared with 2016. As a percentage of total revenue, salaries, wages, and related expenses decreased to 34.3% of total revenue for the year ended December 31, 2017, as compared to 35.0% in 2016. As a percentage of freight revenue, salaries, wages, and related expenses increased slightly to 38.6% of freight revenue for the year ended December 31, 2017, from 38.4% in 2016. The change in salaries, wages, and related expenses is primarily due to pay adjustments for both driver and non-drivers since 2016 and an increase in non-driver incentive compensation. Additionally, fees paid to third party agents increased $1.1 million as a result of improved Managed Freight revenue and workers’ compensation costs increased approximately 0.4 cents per mile as compared to the historic lows of 2016.
When compared to periods prior to the Landair Acquisition, we expect salaries, wages and related expenses will be higher as a result of the increased headcount resulting from the Landair Acquisition. We believe salaries, wages, and related expenses will increase going forward as a result of a tight driver market, which continues to offer significant challenges, wage inflation, higher healthcare costs, and, in certain periods, increased incentive compensation due to better performance. In particular, we expect driver pay to increase as we look to reduce the number of unseated tractors in our fleet in a tight market for drivers. Additionally, as freight market rates continue to increase, we would expect to, as we have historically, pass a portion of those rate increases on to our professional drivers. Salaries, wages, and related expenses will fluctuate to some extent based on the percentage of revenue generated by independent contractors and our Managed Freight segment, for which payments are reflected in the purchased transportation line item.
Fuel expense
|
|
Year ended December 31,
|
|||||||||||
|
(dollars in thousands)
|
2018
|
2017
|
2016
|
|||||||||
|
Fuel expense
|
$
|
121,264
|
$
|
103,139
|
$
|
103,108
|
||||||
|
% of total revenue
|
13.7
|
%
|
14.6
|
%
|
15.4
|
%
|
||||||
We receive a fuel surcharge on our loaded miles from most shippers; however, this does not cover the entire increase in fuel prices for several reasons, including the following: surcharges cover only loaded miles we operate; surcharges do not cover miles driven out-of-route by our drivers; and surcharges typically do not cover refrigeration unit fuel usage or fuel burned by tractors while idling. Moreover, most of our business relating to shipments obtained from freight brokers does not carry a fuel surcharge. Finally, fuel surcharges vary in the percentage of reimbursement offered, and not all surcharges fully compensate for fuel price increases even on loaded miles.
The rate of fuel price changes also can have an impact on results. Most fuel surcharges are based on the average fuel price as published by the DOE for the week prior to the shipment, meaning we typically bill customers in the current week based on the previous week's applicable index. Therefore, in times of increasing fuel prices, we do not recover as much as we are currently paying for fuel. In periods of declining prices, the opposite is true. Fuel prices as measured by the DOE averaged approximately
$0.53 cents per gallon
higher in 2018 than 2017 and
$0.35 cents per gallon
higher in 2017 than
2016.
Additionally,
$1.6 million,
$4.1 million, and
$16.7 million were reclassified from accumulated other comprehensive income (loss) to our results of operations for the years ended December 31, 2018, 2017, and 2016, respectively, as a reduction to fuel expense for 2018 and as additional fuel expense for 2017 and 2016, related to gains and losses on fuel hedge contracts that expired. As of December 31, 2018, we have no remaining fuel hedge contracts.
To measure the effectiveness of our fuel surcharge program, we subtract fuel surcharge revenue (other than the fuel surcharge revenue we reimburse to independent contractors and other third parties, which is included in purchased transportation) from our fuel expense. The result is referred to as net fuel expense. Our net fuel expense as a percentage of freight revenue is affected by the cost of diesel fuel net of fuel surcharge revenue, the percentage of miles driven by company tractors, our fuel economy, and our percentage of deadhead miles, for which we do not receive material fuel surcharge revenues. Net fuel expense is shown below:
|
|
Year ended December 31,
|
|||||||||||
|
(dollars in thousands)
|
2018
|
2017
|
2016
|
|||||||||
|
Total fuel surcharge
|
$
|
105,726
|
$
|
78,198
|
$
|
59,806
|
||||||
|
Less: Fuel surcharge revenue reimbursed to independent contractors and other third parties
|
12,635
|
7,997
|
6,250
|
|||||||||
|
Company fuel surcharge revenue
|
$
|
93,091
|
$
|
70,201
|
$
|
53,556
|
||||||
|
Total fuel expense
|
$
|
121,264
|
$
|
103,139
|
$
|
103,108
|
||||||
|
Less: Company fuel surcharge revenue
|
93,091
|
70,201
|
53,556
|
|||||||||
|
Net fuel expense
|
$
|
28,173
|
$
|
32,938
|
$
|
49,552
|
||||||
|
% of freight revenue
|
3.6
|
%
|
5.3
|
%
|
8.1
|
%
|
||||||
Total fuel expense
increased
$18.2 million for the year ended December 31, 2018, compared with 2017. As a percentage of total revenue, total fuel expense
decreased
13.7% for the year ended December 31, 2018, as compared to 2017. As a percentage of freight revenue, total fuel expense
decreased to
15.6% of freight revenue for the year ended December 31, 2018, from
16.5% in 2017. These changes primarily related to a
4.4%
increase in total miles and
higher fuel prices in 2018, offset by net
gains from fuel hedging transactions of
$1.6 million in 2018 compared to
losses of
$4.1 million in 2017.
Net fuel expense
decreased
$4.7 million, or
14.5%, for the year ended December 31, 2018 compared to 2017. As a percentage of freight revenue, net fuel expense
decreased
1.7% for the year ended December 31, 2018, compared to 2017. These decreases primarily resulted from higher fuel surcharge recovery as a result of brokering less freight and the tiered reimbursement structure of certain fuel surcharge agreements. The decreases were partially offset by a greater percentage of miles driven by independent contractors, where we pay a rate that reflects then-existing fuel prices and we do not have the natural hedge created by fuel surcharges.
Total fuel expense remained flat for the year ended December 31, 2017, compared with 2016. As a percentage of total revenue, total fuel expense decreased to 14.6% for the year ended December 31, 2017, from 15.4% in 2016. As a percentage of freight revenue, total fuel expense decreased to 16.5% of freight revenue for the year ended December 31, 2017, from 16.9% in 2016. These decreases primarily related to net losses from fuel hedging transactions of $4.1 million in 2017 compared to $16.7 million in 2016, offset by higher fuel prices in 2017.
Net fuel expense decreased $16.6 million, or 33.5%, for the year ended December 31, 2017 compared to 2016. As a percentage of freight revenue, net fuel expense decreased 2.9% for the year ended December 31, 2017 compared to 2016. These decreases primarily resulted from higher fuel surcharge recovery as a result of decreased broker freight and the tiered reimbursement structure of certain fuel surcharge agreements. The decreases were partially offset by a greater percentage of miles driven by independent contractors, where we pay a rate that reflects then-existing fuel prices and we do not have the natural hedge created by fuel surcharge.
We expect to continue managing our idle time and tractor speeds, investing in more fuel-efficient tractors to improve our miles per gallon, locking in fuel hedges when deemed appropriate, and partnering with customers to adjust fuel surcharge programs that are inadequate to recover a fair portion of fuel costs. Going forward, our net fuel expense is expected to fluctuate as a percentage of revenue
based on factors such as diesel fuel prices, percentage recovered from fuel surcharge programs, percentage of uncompensated miles, percentage of revenue generated by team-driven tractors (which tend to generate higher miles and lower revenue per mile, thus proportionately more fuel cost as a percentage of revenue), percentage of revenue generated by refrigerated operation (which uses diesel fuel for refrigeration, but usually does not recover fuel surcharges on refrigeration fuel), percentage of revenue generated from independent contractors, and the success of fuel efficiency initiatives.
Given recent historical lows, we would expect diesel fuel prices to increase over the next few years.
Our fuel surcharge recovery was more effective during 2018, and we expect to continue to experience improved fuel economy as we upgrade our tractor fleet. We do not currently have fuel hedging contracts for periods beyond
2018.
We expect fuel surcharge recovery to moderate during 2019, with the possibility of further improvements if efforts to grow our dedicated business are successful.
Operations and maintenance
|
|
Year ended December 31,
|
|||||||||||
|
(dollars in thousands)
|
2018
|
2017
|
2016
|
|||||||||
|
Operations and maintenance
|
$
|
55,505
|
$
|
48,774
|
$
|
45,864
|
||||||
|
% of total revenue
|
6.3
|
%
|
6.9
|
%
|
6.8
|
%
|
||||||
|
% of freight revenue
|
7.1
|
%
|
7.8
|
%
|
7.5
|
%
|
||||||
Operations and maintenance
increased
$6.7 million, or
13.8%, for the year ended December 31, 2018, compared with 2017. As a percentage of total revenue, operations and maintenance
decreased to
6.3% of total revenue in 2018, compared with
6.9% in 2017. As a percentage of freight revenue, operations and maintenance
decreased to
7.1% of freight revenue for 2018, from
7.8% in 2017. The increases in dollar amount were primarily due to the addition of the Landair business and its comparatively older tractor fleet, as well as unloading and other operational costs associated with our increase in dedicated freight that was added since the first quarter of 2017 and
extending the trade cycle of our tractors in the second half of 2017. The decreases in percentage are the result of increased rates and increased revenue from the Landair Acquisition.
Operations and maintenance increased $2.9 million, or 6.3%, for the year ended December 31, 2017, compared with 2016. As a percentage of total revenue, operations and maintenance remained relatively flat at 6.9% of total revenue in 2017, compared with 6.8% in 2016. As a percentage of freight revenue, operations and maintenance increased to 7.8% of freight revenue for 2017, from 7.5% in 2016, primarily due to extending the trade cycle of our tractors in the second half of 2016, as well as unloading and other operational costs associated with our increase in dedicated freight that was added since the first quarter of 2016.
Going forward, we believe this category will fluctuate based on several factors, including expected upgrades to Landair’s fleet, our continued ability to maintain a relatively young fleet in our other operating companies, accident severity and frequency, weather, and the reliability of new and untested revenue equipment models.
Revenue equipment rentals and purchased transportation
|
|
Year ended December 31,
|
|||||||||||
|
(dollars in thousands)
|
2018
|
2017
|
2016
|
|||||||||
|
Revenue equipment rentals and purchased transportation
|
$
|
183,645
|
$
|
141,954
|
$
|
117,472
|
||||||
|
% of total revenue
|
20.7
|
%
|
20.1
|
%
|
17.5
|
%
|
||||||
|
% of freight revenue
|
23.6
|
%
|
22.6
|
%
|
19.2
|
%
|
||||||
Revenue equipment rentals and purchased transportation
increased approximately
$41.6 million, or
29.4%, for the year ended December 31, 2018, compared with 2017. As a percentage of total revenue, revenue equipment rentals and purchased transportation
increased to
20.7% of total revenue for the year ended December 31, 2018, from
20.1% in 2017. As a percentage of freight revenue, revenue equipment rentals and purchased transportation
increased to
23.6% of freight revenue for the year ended December 31, 2018, from
22.6% in 2017. These increases were primarily the result of the acquisition of Landair's managed freight business, which added to overall purchased transportation cost but is less reliant on purchased transportation to generate revenue, compared to our existing brokerage and logistics services. Additionally, we experienced increases due to a more competitive market for sourcing third-party capacity in our existing Managed Freight segment, as well as an increased need for outside capacity to meet the demands of peak season for our Truckload services. Additionally, the percentage of the total miles run by independent contractors
increased from
10.3% for 2017 to
11.9% for 2018. These increases were partially offset by reduced expenses resulting from a reduction and subsequent elimination of our temperature-controlled intermodal service offering.
Revenue equipment rentals and purchased transportation increased approximately $24.5 million, or 20.8%, for the year ended December 31, 2017, compared with 2016. As a percentage of total revenue, revenue equipment rentals and purchased transportation increased to 20.1% of total revenue for the year ended December 31, 2017, from 17.5% in 2016. As a percentage of freight revenue, revenue equipment rentals and purchased transportation increased to 22.6% of freight revenue for the year ended December 31, 2017, from 19.2% in 2016. These changes were primarily the result of a $19.8 million increase in payments to third-party transportation providers primarily related to increased revenues for our Managed Freight segment and the increased need for outside capacity to meet the demands of peak season for our Truckload services. Additionally, the percentage of the total miles run by independent contractors increased from 9.7% for 2016 to 10.3% for 2017. These increases were partially offset by reduced expenses resulting from a reduction related to the aforementioned elimination of our temperature-controlled intermodal service offering.
We expect revenue equipment rentals to decrease going forward as a result of our increase in acquisition of revenue equipment through financed purchases or capital leases rather than operating leases, particularly as we transition Landair from operating leases to owned equipment. As discussed below, this decrease may be partially or fully offset by an increase in purchased transportation, as we expect to continue to grow our Managed Freight segment, as well as a result of reduced capacity.
We expect purchased transportation to increase as we seek to grow our Managed Freight segment. In addition, if fuel prices continue to increase, it would result in a further increase in what we pay third party carriers and independent contractors. However, this expense category will fluctuate with the number and percentage of loads hauled by independent contractors, loads handled by Managed Freight, and tractors, trailers, and other assets financed with operating leases. In addition, factors such as the cost to obtain third party transportation services and the amount of fuel surcharge revenue passed through to the third party carriers and independent contractors will affect this expense category. If industry-wide trucking capacity were to tighten in relation to freight demand, we may need to increase the amounts we pay to third-party transportation providers and independent contractors, which could increase this expense category on an absolute basis and as a percentage of freight revenue absent an offsetting increase in revenue. We continue to actively recruit independent contractors and, if we are successful, we would expect this line item to increase as a percentage of revenue. Further, we exited the temperature-controlled intermodal business in the fourth quarter of 2017 in order to focus on our objective to continue improvements at SRT. As a result, we expect purchased transportation costs at SRT to moderate going forward.
Operating taxes and licenses
|
|
Year ended December 31,
|
|||||||||||
|
(dollars in thousands)
|
2018
|
2017
|
2016
|
|||||||||
|
Operating taxes and licenses
|
$
|
11,831
|
$
|
9,878
|
$
|
11,712
|
||||||
|
% of total revenue
|
1.3
|
%
|
1.4
|
%
|
1.7
|
%
|
||||||
|
% of freight revenue
|
1.5
|
%
|
1.6
|
%
|
1.9
|
%
|
||||||
Operating taxes and licenses
increased approximately
$1.9 million, or
19.8%, for the year ended December 31, 2018, compared with 2017. As a percentage of total revenue, operating taxes and licenses
decreased slightly to
1.3% of total revenue for the year ended December 31, 2018, from
1.4% in 2017. As a percentage of freight revenue, operating taxes and licenses
decreased slightly to
1.5% of freight revenue for the year ended December 31, 2018, from
1.6% in 2017. The increase in operating taxes and licenses is primarily due to a
$1.1 million increase in property taxes in 2018, compared to the prior year.
Operating taxes and licenses decreased approximately $1.8 million, or 15.7%, for the year ended December 31, 2017, compared with 2016. As a percentage of total revenue, operating taxes and licenses decreased to 1.4% of total revenue for the year ended December 31, 2017, from 1.7% in 2016. As a percentage of freight revenue, operating taxes and licenses decreased to 1.6% of freight revenue for the year ended December 31, 2017, from 1.9% in 2016. The decrease in operating taxes and licenses, including as a percentage of total revenue and freight revenue, is primarily due to the settlement of a property tax matter that resulted in a decrease of a prior year’s assessment and related refund, as well as a lower truck count.
Insurance and claims
|
|
Year ended December 31,
|
|||||||||||
|
(dollars in thousands)
|
2018
|
2017
|
2016
|
|||||||||
|
Insurance and claims
|
$
|
43,333
|
$
|
33,155
|
$
|
32,596
|
||||||
|
% of total revenue
|
4.9
|
%
|
4.7
|
%
|
4.9
|
%
|
||||||
|
% of freight revenue
|
5.6
|
%
|
5.3
|
%
|
5.3
|
%
|
||||||
Insurance and claims, consisting primarily of premiums and deductible amounts for liability, physical damage, and cargo damage insurance and claims,
increased approximately
$10.1 million, or
30.7%, for the year ended December 31, 2018, compared to 2017. As a percentage of total revenue, insurance and claims
increased to
4.9% of total revenue for the year ended December 31, 2018, from
4.7% in 2017. As a percentage of freight revenue, insurance and claims
increased to
5.6% of freight revenue for the years ended December 31, 2018, compared to
5.3% in 2017. The change in total revenue resulted from a
15.0%
increase in DOT reportable accidents per million miles driven for 2018, compared to 2017, while critical accidents remained flat year over year. Total insurance cost
increased to
13.3 cents per mile for 2018 from
10.7 cents per mile in 2017.
Insurance and claims increased approximately $0.6 million, or 1.7%, for year ended December 31, 2017, compared to 2016. As a percentage of total revenue, insurance and claims decreased to 4.7% of total revenue for the year ended December 31, 2017, from 4.9% in 2016. As a percentage of freight revenue, insurance and claims remained flat at 5.3% of freight revenue for the years ended December 31, 2017 and 2016. The change in total revenue resulted from increased accident severity early in 2017, partially offset by an 8.2% improvement in DOT reportable accidents per million miles driven for the 2017 year. Total insurance cost increased to 10.7 cents per mile for 2017 from 10.3 cents per mile in 2016.
Our auto liability (personal injury and property damage), cargo, and general liability insurance programs include significant self-insured retention amounts. We are also self-insured for physical damage to our equipment. Because of these significant self-insured exposures, insurance and claims expense may fluctuate significantly from period-to-period. Any increase in frequency or severity of claims, or any increases to then-existing reserves, could adversely affect our financial condition and results of operations. We periodically evaluate strategies to efficiently reduce our insurance and claims expense. The auto liability policy contains a feature whereby we are able to retroactively obtain a partial refund of the premium in exchange for taking on the liability for incidents that occurred during the period and releasing the insurers. This is referred to as "commuting" the policy or "policy commutation." In several past periods we have commuted the policy, which has lowered our insurance and claims expense. We intend to evaluate our ability to commute the current policy and any such commutation could significantly impact insurance and claims expense.
Our prior auto liability policy that ran from October 1, 2014 through March 31, 2018, included a commutation provision if we were to commute the policy for the entire 42 months. Based on claims paid to date the policy premium release refund could range from zero to $4.9 million, depending on actual claims settlements in the future.
Effective April 2018, we entered into new auto liability policies with a three-year term. The policy includes a limit for a single loss of $9.0 million, an aggregate of $18.0 million for each policy year, and a $30.0 million aggregate for the 36 month term ended March 31, 2021. The policy included a policy release premium refund or commutation option of up to $14.0 million, less any future amounts paid on claims by the insurer. A decision with respect to commutation of the policy could be made before April 1, 2021.
Management cannot predict whether or not future claims or the development of existing claims will justify a commutation of either policy period, and accordingly, no related amounts were recorded at December 31, 2018.
Communications and utilities
|
|
Year ended December 31,
|
|||||||||||
|
(dollars in thousands)
|
2018
|
2017
|
2016
|
|||||||||
|
Communications and utilities
|
$
|
7,061
|
$
|
6,938
|
$
|
6,057
|
||||||
|
% of total revenue
|
0.8
|
%
|
1.0
|
%
|
0.9
|
%
|
||||||
|
% of freight revenue
|
0.9
|
%
|
1.1
|
%
|
1.0
|
%
|
||||||
For the periods presented, the changes in communications and utilities were not significant as either a percentage of total revenue or freight revenue.
General supplies and expenses
|
|
Year ended December 31,
|
|||||||||||
|
(dollars in thousands)
|
2018
|
2017
|
2016
|
|||||||||
|
General supplies and expenses
|
$
|
23,227
|
$
|
14,783
|
$
|
14,413
|
||||||
|
% of total revenue
|
2.6
|
%
|
2.1
|
%
|
2.1
|
%
|
||||||
|
% of freight revenue
|
3.0
|
%
|
2.4
|
%
|
2.4
|
%
|
||||||
For the year ended December 31, 2018, general supplies and expenses increased approximately
$8.4 million, or
57.1%, compared with 2017. As a percentage of total revenue, general supplies and expenses
increased to
2.6% of total revenue and
3.0% of freight revenue for the year ended December 31, 2018, compared to
2.1% and
2.4%, respectively, in 2017. These increases include
$1.5 million of legal and professional fees incurred in the second quarter leading up to the Landair Acquisition,
$0.3 million of previously capitalized in-process software investment costs that were deemed redundant in connection with the acquisition, and
$4.3 million of additional general supplies and expenses generated by Landair's ongoing business subsequent to the acquisition.
For the year ended December 31, 2017, general supplies and expenses increased approximately $0.4 million, or 2.6%, compared with 2016. As a percentage of total revenue, general supplies and expenses remained relatively flat at approximately 2.1% of total revenue and 2.4% of freight revenue for the year ended December 31, 2017, compared to 2016.
Depreciation and amortization
|
|
Year ended December 31,
|
|||||||||||
|
(dollars in thousands)
|
2018
|
2017
|
2016
|
|||||||||
|
Depreciation and amortization
|
$
|
76,156
|
$
|
76,447
|
$
|
72,456
|
||||||
|
% of total revenue
|
8.6
|
%
|
10.8
|
%
|
10.8
|
%
|
||||||
|
% of freight revenue
|
9.8
|
%
|
12.2
|
%
|
11.9
|
%
|
||||||
Depreciation and amortization consists primarily of depreciation of tractors, trailers and other capital assets offset or increased, as applicable, by gains or losses on dispositions of capital assets, as well as amortization of intangible assets. Depreciation and amortization in 2018
decreased
$0.2 million, or
0.4%, compared with 2017. As a percentage of total revenue, depreciation and amortization
decreased to
8.6% of total revenue for the year ended December 31, 2018, from
10.8% in 2017. As a percentage of freight revenue, depreciation and amortization
decreased to
9.8% of freight revenue for the year ended December 31, 2018, from
12.2% in 2017. Depreciation, consisting primarily of depreciation of revenue equipment and excluding gains and losses,
increased
$2.0 million in 2018 from 2017, primarily due to increased tractor and trailer counts from the Landair Acquisition. Additionally, the used truck market stabilized in 2018, resulting in
losses of
$0.3 million, compared to
losses of
$4.0 million in 2017. Amortization of intangible assets increased to $1.5 million in 2018 from zero in 2017, due to the Landair Acquisition.
For the year ended December 31, 2017, depreciation and amortization increased $4.0 million, or 5.5%, compared with 2016. As a percentage of total revenue, depreciation and amortization remained flat at 10.8% of total revenue for the years ended December 31, 2017 and 2016. As a percentage of freight revenue, depreciation and amortization increased to 12.2% of freight revenue for the year ended December 31, 2017, from 11.9% in 2016. Depreciation, consisting primarily of depreciation of revenue equipment and excluding gains and losses, increased $0.8 million in 2017 from 2016, primarily as a result of the full year effect of the decreased salvage values implemented in 2016. Additionally, the soft used truck market contributed to losses on the sale of property and equipment of $4.0 million in 2017 compared to losses of $0.8 million in 2016.
We expect depreciation and amortization, including amortization of intangible assets, to more closely resemble the second half of 2018 going forward. If the used tractor market were to decline, we could have to adjust residual values and increase depreciation or experience increased losses on sale.
Interest expense, net
|
|
Year ended December 31,
|
|||||||||||
|
(dollars in thousands)
|
2018
|
2017
|
2016
|
|||||||||
|
Interest expense, net
|
$
|
8,708
|
$
|
8,258
|
$
|
8,226
|
||||||
|
% of total revenue
|
1.0
|
%
|
1.2
|
%
|
1.2
|
%
|
||||||
|
% of freight revenue
|
1.1
|
%
|
1.3
|
%
|
1.3
|
%
|
||||||
For the periods presented, the change in interest expense, net was not significant as either a percentage of total revenue or freight revenue.
This line item will fluctuate based on our decision with respect to purchasing revenue equipment with balance sheet debt versus operating leases as well as our ability to continue to generate profitable results and reduce our leverage. Going forward, we expect this line item to decrease if we are able to reduce our debt as planned.
Income from equity method investment
|
|
Year ended December 31,
|
|||||||||||
|
(in thousands)
|
2018
|
2017
|
2016
|
|||||||||
|
Income from equity method investment
|
$
|
7,732
|
$
|
3,400
|
$
|
3,000
|
||||||
We have accounted for our investment in TEL using the equity method of accounting and thus our financial results include our proportionate share of TEL's net income. Given TEL's growth during the years preceding 2016 and volatility in the used and leased equipment markets in which TEL operates, including the softening of the used tractor market, the impact on our earnings resulting from our investment and TEL's profitability was relatively moderate in 2017 and 2016. For the years ended December 31, 2018 and 2017, our earnings resulting from our investment in TEL increased to
$7.7 million and
$3.4 million, respectively primarily as a result of increased growth in TEL’s lease offerings.
We expect the impact on our earnings resulting from our investment in TEL to improve year-over-year, based on the fixed nature of lease revenue and expenses and the growth experienced during 2018.
Income tax (benefit) expense
|
|
Year ended December 31,
|
|||||||||||
|
(dollars in thousands)
|
2018
|
2017
|
2016
|
|||||||||
|
Income tax expense (benefit)
|
$
|
15,507
|
$
|
(32,142
|
)
|
$
|
10,386
|
|||||
|
% of total revenue
|
1.8
|
%
|
(4.6
|
%)
|
1.5
|
%
|
||||||
|
% of freight revenue
|
2.0
|
%
|
(5.1
|
%)
|
1.7
|
%
|
||||||
Income tax expense fluctuated approximately
$47.6 million, or
148.2%, for the year ended December 31, 2018, compared with the benefit in 2017. As a percentage of total revenue, income tax expense
increased to
1.8% of total revenue for 2018 from
(4.6%) in 2017. As a percentage of freight revenue, income tax expense
increased to
2.0% of freight revenue for 2018 compared to
(5.1%) in 2017. These increases were primarily related to the $40.1 million remeasurement of deferred taxes due to the Tax Act, as well a
$30.8 million
increase in operating income for 2018, compared to 2017.
Income tax (benefit) expense fluctuated approximately $42.5 million, or 409.5%, for the year ended December 31, 2017, compared with 2016. As a percentage of total revenue, income tax (benefit) expense decreased to (4.6%) of total revenue for 2017 from 1.5% in 2016. As a percentage of freight revenue, income tax (benefit) expense decreased to (5.1%) of freight revenue for 2017 compared to 1.7% in 2016. These decreases were primarily related to the $40.1 million remeasurement of deferred taxes due to the Tax Act. Additionally, primarily as a result of tax-planning strategies implemented during the fourth quarter of 2017, we were able to remove valuation allowances on certain state tax net operating losses providing for additional favorable impact of $1.2 million. These decreases were partially offset by the $3.9 million decrease in pre-tax income in 2017 compared to 2016, resulting from the declines in operating income noted above.
The effective tax rate is different from the expected combined tax rate due primarily to permanent differences related to our per diem pay structure for drivers. Due to the partial nondeductible effect of the per diem payments, our tax rate will fluctuate in future periods as income fluctuates. Our effective tax rate for 2017 was an anomaly due to the nonrecurring remeasurement of deferred taxes noted above related to the Tax Act.
We are currently estimating our 2019 effective income tax rate to be approximately
27.2%.
RESULTS OF SEGMENT OPERATIONS
We have two reportable segments, truckload services, which we refer to as Truckload and Managed Freight. In addition, our Managed Freight segment has service offerings ancillary to our Truckload services, including: freight brokerage service provided both directly and through freight brokerage agents, who are paid a commission for the freight they provide, transportation management services, and
shuttle and switching services
. These operations consist of several operating segments, which are aggregated due to similar margins and customers. Included within Managed Freight are our accounts receivable factoring and warehousing businesses, which do not meet the aggregation criteria, but only account for
$5.0 million and
$23.6 million of our revenue, respectively. Included in Truckload and Managed Freight revenue during the year ended December 31, 2018 is
$3.9 million and
$0.9 million, respectively, classified as lease revenue resulting from embedded leases for certain tractors and warehouse space.
The operation of each of these businesses is described in our notes to Item 1 of Part 1 of this Annual Report on Form 10-K.
The following table summarizes financial and operating data by segment:
|
|
Year ended
|
|||||||||||
|
|
December 31,
|
|||||||||||
|
(in thousands)
|
2018
|
2017
|
2016
|
|||||||||
|
Revenues:
|
||||||||||||
|
Truckload
|
$
|
727,046
|
$
|
612,834
|
$
|
601,226
|
||||||
|
Managed Freight
|
158,409
|
92,173
|
69,425
|
|||||||||
|
Total
|
$
|
885,455
|
$
|
705,007
|
$
|
670,651
|
||||||
|
Operating Income:
|
||||||||||||
|
Truckload
|
$
|
45,392
|
$
|
19,567
|
$
|
24,816
|
||||||
|
Managed Freight
|
13,594
|
8,588
|
7,631
|
|||||||||
|
Total
|
$
|
58,986
|
$
|
28,155
|
$
|
32,447
|
||||||
Comparison of Year Ended December 31,
2018 to Year Ended December 31,
2017
Our Truckload revenue
increased
$114.2 million, as freight revenue
increased
$86.7 million and fuel surcharge revenue
increased
$27.5 million. The
increase in freight revenue relates to a 286 (or 11.2%) average tractor increase and an increase in average freight revenue per tractor per week of 7.0% compared to 2017, partially offset by a $10.9 million decrease in freight revenue contributed by our temperature-controlled intermodal service offering as compared to 2017. Landair contributed $43.3 million of freight revenue to consolidated truckload operations in 2018, and the acquisition was primarily responsible for the increase in average tractors. The increase in average freight revenue per tractor per week is the result of a 13.9% increase, or 23.7 cents per mile, in average rate per total mile, partially offset by a 6.1% decrease in average miles per unit when compared to 2017. Team driven units decreased approximately 10.2% to an average of 875 teams in 2018 from 974 teams in 2017.
The increase in revenue per mile and decrease in utilization are primarily due to the impact of the Landair operations on the combined truckload division.
Our Truckload operating income was
$25.8 million
higher in 2018 than 2017 primarily
as a result of the aforementioned increases in revenue, partially offset by increased salaries, wages and related expenses, insurance and claims expenses, and other increased operating costs related to the Landair Acquisition.
Managed Freight total revenue
increased
$66.2 million in 2018 compared to 2017 and Managed Freight operating income
increased
$5.0 million in 2018 compared to 2017. These improvements are primarily as a result of Landair's contribution of $41.9 million of revenue to combined Managed Freight operations, in addition to growth with existing customers and certain internal strategic growth initiatives during 2018, compared with 2017, partially offset by increased purchased transportation costs due to a more competitive market for sourcing third-party capacity.
Comparison of Year Ended December 31, 2017 to Year Ended December 31, 2016
Our Truckload revenue increased $11.6 million, as fuel surcharge revenue increased $18.4 million, offset by a decrease in freight revenue of $6.8 million. The decrease in freight revenue relates to a $4.2 million decrease in freight revenue contributed by our temperature-controlled intermodal service offering, a decrease in our average tractor fleet of 1.4% from 2016, partially offset by an increase in average freight revenue per tractor per week of 0.9% compared to 2016. The increase in average freight revenue per tractor per week is the result of a 2.1% increase, or 3.6 cents per mile, in average rate per total mile, partially offset by a 1.4% decrease in average miles per unit when compared to 2016. Team driven units decreased approximately 11.6% to an average of 912 teams in 2017 from 1,032 teams in 2016.
Our Truckload operating income was $5.2 million lower in 2017 than 2016 primarily as a result of increased salaries and wages, including workers’ compensation expense, compared to the historic lows for workers’ compensation in 2016, non-driver headcount increases since 2016 and increased non-driver incentive compensation, as well as increased purchased transportation expenses, depreciation and amortization expense, and operations and maintenance expense, partially offset by a decrease in operating costs per mile, net of fuel surcharge revenue, due primarily to decreased net fuel expense. Non-driver headcount increased in 2017 due to strategic initiatives in information technology.
Managed Freight total revenue increased $22.8 million in 2017 compared to 2016 and Managed Freight operating income increased $1.0 million in 2017 compared to 2016. These improvements are primarily the result of spot market opportunities related to the hurricane-affected regions during 2017 and growth with existing customers compared to 2016.
LIQUIDITY AND CAPITAL RESOURCES
Our business requires significant capital investments over the short-term and the long-term. Recently, we have financed our capital requirements with borrowings under our Credit Facility, cash flows from operations, long-term operating leases, capital leases, secured installment notes with finance companies, and proceeds from the sale of our used revenue equipment. Going forward, we expect revenue equipment acquisitions through purchases and capital leases to increase as a percentage of our fleet as we decrease our use of operating leases. Further, we expect to increase our capital allocation toward dedicated, transportation management services, and other managed freight solutions to become the go-to partner for our customers’ most critical transportation and logistics needs. We had working capital (total current assets less total current liabilities) of
$84.3 million and
$81.1 million at
December 31, 2018 and
2017, respectively. Our working capital on any particular day can vary significantly due to the timing of collections and cash disbursements. Based on our expected financial condition, net capital expenditures, results of operations, related net cash flows, installment notes, and other sources of financing, we believe our working capital and sources of liquidity will be adequate to meet our current and projected needs and we do not expect to experience material liquidity constraints in the foreseeable future.
As of December 31,
2018, we had
$3.9 million of borrowings outstanding, undrawn letters of credit outstanding of approximately
$36.3 million, and available borrowing capacity of
$54.8 million under the Credit Facility. Fluctuations in the outstanding balance and related availability under our Credit Facility are driven primarily by cash flows from operations and the timing and nature of property and equipment additions that are not funded through notes payable, as well as the nature and timing of collection of accounts receivable, payments of accrued expenses, and receipt of proceeds from disposals of property and equipment. Unless we decide to make any strategic investments during the year, we anticipate paying off an aggregate of approximately
$40.0 to
$60.0 million of financing and lease liabilities, comprised of both on and off balance sheet obligations, during
2019. Refer to Note 6, “Debt” of the accompanying consolidated financial statements for further information about material debt agreements.
With an average tractor fleet age of
2.2 years, we believe we have flexibility to manage our fleet and we plan to regularly evaluate our tractor replacement cycle, new tractor purchase requirements, and financing options.
Cash Flows
Net cash flows provided by operating activities were
$124.8 million in 2018 compared with
$82.9 million in
2017, primarily due to the
$30.8 million
increase in operating income relating to
increased profitability in both of our operating segments, the impact of the Landair Acquisition, as well as $36.9 million of changes in deferred income tax expense relating to the 2017 benefit of the Tax Act, as compared to a more typical expense pattern in 2018. The
improvements also related to fluctuations from accounts payable and accrued expenses, which are primarily the result of timing of payments on our accrued expenses and trade accounts in 2018 compared to 2017.
Net cash flows used by investing activities were
$120.9 million in 2018 compared with
$62.1 million in 2017. The change in net investing activities was primarily the result of the Landair Acquisition, as well as the timing of our trade cycle, whereby we took delivery of approximately
775 new company tractors and disposed of approximately 831 used tractors in 2018, compared to delivery and disposal of 635 and
615 tractors, respectively, in 2017. We expect net capital expenditures to increase in
2019 compared to 2018, primarily due to anticipated upgrades to Landair's revenue equipment.
Net cash flows provided by financing activities were
$3.9 million in 2018 compared to net cash flows used in financing activities of
$13.2 million in 2017. The changes were primarily a function of reduced net borrowings related to the trade cycle of our revenue equipment, whereby we have taken delivery of fewer new company tractors and disposed of more used tractors in 2018, compared to 2017.
Going forward, our cash flows may fluctuate depending on capital expenditures, future stock repurchases, strategic investments or divestitures, and the extent of future income tax obligations and refunds.
Contractual Obligations and Commercial Commitments
The following table sets forth our contractual cash obligations and commitments as of December 31,
2018:
|
Payments due by period:
|
2019
|
2020
|
2021
|
2022
|
2023
|
More than
|
||||||||||||||||||||||
|
(in thousands)
|
Total
|
(less than
1 year)
|
(1-3 years)
|
(1-3 years)
|
(3-5 years)
|
(3-5 years)
|
5 years
|
|||||||||||||||||||||
|
Credit Facility (1)
|
$
|
3,911
|
$
|
-
|
$
|
-
|
$
|
3,911
|
$
|
-
|
$
|
-
|
$
|
-
|
||||||||||||||
|
Revenue equipment and property installment notes, including interest (2)
|
$
|
215,405
|
$
|
35,554
|
$
|
44,688
|
$
|
60,777
|
$
|
45,085
|
$
|
5,069
|
$
|
24,232
|
||||||||||||||
|
Operating leases (3)
|
$
|
42,545
|
$
|
16,331
|
$
|
11,726
|
$
|
7,973
|
$
|
6,272
|
$
|
208
|
$
|
35
|
||||||||||||||
|
Capital leases (4)
|
$
|
44,035
|
$
|
6,511
|
$
|
9,748
|
$
|
7,721
|
$
|
9,487
|
$
|
9,148
|
$
|
1,420
|
||||||||||||||
|
Lease residual value guarantees
|
$
|
1,007
|
$
|
1,007
|
$
|
-
|
$
|
-
|
$
|
-
|
$
|
-
|
$
|
-
|
||||||||||||||
|
Purchase obligations (5)
|
$
|
156,338
|
$
|
156,338
|
$
|
-
|
$
|
-
|
$
|
-
|
$
|
-
|
$
|
-
|
||||||||||||||
|
Total contractual cash obligations (6)
|
$
|
463,241
|
$
|
215,741
|
$
|
66,162
|
$
|
80,382
|
$
|
60,844
|
$
|
14,425
|
$
|
25,687
|
||||||||||||||
|
(1)
|
Represents principal owed at
December 31, 2018 and interest on such principal amount through maturity. The borrowings consist of draws under our Credit Facility, with fluctuating borrowing amounts and variable interest rates. In determining future contractual interest and principal obligations, for variable interest rate debt, the interest rate and principal amount in place at
December 31, 2018, was utilized. The table assumes long-term debt is held to maturity. Refer to Note 6, "Debt" of the accompanying consolidated financial statements for further information.
|
|
(2)
|
Represents principal and interest payments owed at
December 31, 2018. The borrowings consist of installment notes with finance companies, with fixed borrowing amounts and fixed interest rates, except for a variable rate real estate note, for which the interest rate is effectively fixed through an interest rate swap. The table assumes these installment notes are held to maturity. Refer to Note 6, "Debt" of the accompanying consolidated financial statements for further information.
|
|
(3)
|
Represents future monthly rental payment obligations under operating leases for tractors, trailers, and terminal properties, and computer and office equipment. Substantially all lease agreements for revenue equipment have fixed payment terms based on the passage of time. The tractor lease agreements generally stipulate maximum miles and provide for mileage penalties for excess miles. These leases generally run for a period of three to five years for tractors and five to seven years for trailers. Refer to Note 7, "Leases" of the accompanying consolidated financial statements for further information.
|
|
(4)
|
Represents principal and interest payments owed at
December 31, 2018. The borrowings consist of capital leases with one finance company, with fixed borrowing amounts and fixed interest rates or rates that are floating but effectively fixed through related interest rate swaps. Borrowings in 2019 and thereafter include the residual value guarantees on the related equipment as balloon payments. Refer to Note 6, "Debt" of the accompanying consolidated financial statements for further information.
|
|
(5)
|
Represents purchase obligations for revenue equipment totaling approximately
$156.3 million in
2018. These commitments are cancelable, subject to certain adjustments in the underlying obligations and benefits. These purchase commitments are expected to be financed by operating leases, capital leases, long-term debt, proceeds from sales of existing equipment, and/or cash flows from operations. Refer to Notes 6 and 7, "Debt" and "Leases," respectively, of the accompanying consolidated financial statements for further information.
|
|
(6)
|
Excludes any amounts accrued for unrecognized tax benefits as we are unable to reasonably predict the ultimate amount or timing of settlement of such unrecognized tax benefits.
|
Off-Balance Sheet Arrangements
Operating leases are an important source of financing for our revenue equipment and certain real estate. At
December 31, 2018, we had financed
524 tractors and
415 trailers under operating leases. Vehicles held under operating leases are not carried on our consolidated balance sheets, and lease payments, in respect of such vehicles, are reflected in our consolidated statements of operations in the line item "Revenue equipment rentals and purchased transportation." Our revenue equipment rental expense was
$14.7 million in 2018, compared with
$12.1 million in
2017. The total value of remaining payments under operating leases as of
December 31, 2018, was approximately
$44.6 million. In connection with various operating leases, we issued residual value guarantees, which provide that if we do not purchase the leased equipment from the lessor at the end of the lease term, we are liable to the lessor for an amount equal to the shortage (if any) between the proceeds from the sale of the equipment and an agreed value. The residual guarantees expire between
January 2019 and
February 2019 and had an undiscounted value of approximately
$1.0 million at
December 31, 2018. The discounted present value of the total remaining lease payments and residual value guarantees were approximately
$43.0 million at
December 31, 2018. We expect our residual guarantees to approximate the market value at the end of the lease term.
We believe that proceeds from the sale of equipment under operating leases would equal or exceed the payment obligation on substantially all operating leases. In February 2016, FASB issued ASU 2016-02, which requires lessees to recognize a right-to-use asset and a lease obligation for all leases. We believe the adoption will not have a material impact to net income and will add approximately
$43.0 million to our assets and liabilities for the related right-to-use asset and lease obligation for our existing operating leases.
CRITICAL ACCOUNTING POLICIES AND ESTIMATES
The preparation of financial statements in conformity with GAAP requires us to make decisions based upon estimates, assumptions, and factors we consider as relevant to the circumstances. Such decisions include the selection of applicable accounting principles and the use of judgment in their application, the results of which impact reported amounts and disclosures. Changes in future economic conditions or other business circumstances may affect the outcomes of our estimates and assumptions. Accordingly, actual results could differ from those anticipated. A summary of the significant accounting policies followed in preparation of the financial statements is contained in Note 1, "Summary of Significant Accounting Policies," of the consolidated financial statements attached hereto. The following discussion addresses our most critical accounting policies, which are those that are both important to the portrayal of our financial condition and results of operations and that require significant judgment or use of complex estimates.
Revenue Recognition
Revenue, drivers' wages, and other direct operating expenses generated by our Truckload reportable segment are recognized proportionally as the transportation service is performed based on the percentage of miles completed as of the period end, as opposed to recognizing revenue upon the completion of the load, which was our historic practice prior to the adoption of ASU 2014-09 on January 1, 2018. Revenue is recognized on a gross basis at amounts charged to our customers because we control and are primarily responsible for the fulfillment of the promised service. Revenue includes transportation revenue, fuel surcharges, loading and unloading activities, equipment detention, and other accessorial services.
Revenue generated by our Managed Freight segment is recognized upon completion of the services provided. Revenue is recorded on a gross basis, without deducting third party purchased transportation costs, as we act as a principal with substantial risks as primary obligor, except for transactions whereby equipment from our Truckload segment perform the related services, which we record on a net basis in accordance with the related authoritative guidance. Managed Freight revenue includes
$5.0 million,
$3.1 million, and
$2.6 million of revenue in
2018,
2017, and
2016, respectively, related to an accounts receivable factoring business started in 2013 to supplement several aspects of our non-asset operations, as well as
$23.6 million of revenue in 2018 for a warehousing business, which is part of the Landair operation and thus was not part of 2017 or 2016 revenues. Included in Truckload and Managed Freight revenue during the year ended
December 31, 2018 is $3.9 million and $0.9 million, respectively, classified as lease revenue resulting from embedded leases for certain tractors and warehouse space. Revenue for the factoring business is recognized on a net basis after giving effect to receivables payments we make to the factoring client, given we are acting as an agent and are not the primary generator of the factored receivables in these transactions. Revenue for the warehousing business is generally, recognized as the service is performed based upon a weekly rate.
Depreciation of Revenue Equipment
Property and equipment is stated at cost less accumulated depreciation. Depreciation for book purposes is determined using the straight-line method over the estimated useful lives of the assets, while depreciation for tax purposes is generally recorded using an accelerated method. Depreciation of revenue equipment is our largest item of depreciation.
We generally depreciate new tractors (excluding day cabs) over five years to salvage values of approximately 15% of their cost. We generally depreciate new trailers over seven years for refrigerated trailers and ten years for dry van trailers to salvage values of approximately 25% of their cost.
We expect depreciation levels to increase moderately in
2019 over
2018 if we are able to execute plans to grow our fleet by 1–4%. We annually review the reasonableness of our estimates regarding useful lives and salvage values of our revenue equipment and other long-lived assets based upon, among other things, our experience with similar assets, conditions in the used revenue equipment market, and prevailing industry practice. Changes in the useful life or salvage value estimates, or fluctuations in market values that are not reflected in our estimates, could have a material effect on our results of operations. Gains and losses on the disposal of revenue equipment are included in depreciation expense in the consolidated statements of operations.
In 2018, 2017, and
2016 we had net losses on revenue equipment of
$0.3 million,
$4.0 million, and
$0.8 million, respectively. We review salvage values of our revenue equipment annually and make adjustments periodically, based on trends in the used equipment market, to reflect updated estimates of fair value at disposal.
We lease certain revenue equipment under capital leases with terms of approximately 60 to 84 months. Amortization of leased assets is included in depreciation and amortization expense.
Pursuant to applicable accounting standards, revenue equipment and other long-lived assets are tested for impairment whenever an event occurs that indicates impairment may exist. Expected future cash flows are used to analyze whether an impairment has occurred. If the sum of expected undiscounted cash flows is less than the carrying value of the long-lived asset, then an impairment loss is recognized. We measure the impairment loss by comparing the fair value of the asset to its carrying value. Fair value is determined based on a discounted cash flow analysis or the appraised value of the assets, as appropriate.
Although a portion of our tractors are protected by non-binding indicative trade-in values or binding trade-back agreements with the manufacturers, some tractors and substantially all of our owned trailers continue to be subject to fluctuations in market prices for used revenue equipment. Moreover, our trade-back agreements are contingent upon reaching acceptable terms for the purchase of new equipment. Further declines in the price of used revenue equipment or failure to reach agreement for the purchase of new tractors with the manufacturers issuing trade-back agreements could result in impairment of, or losses on the sale of, revenue equipment. Historically, only a de minimis percentage of our equipment has been sold back to the dealers pursuant to the trade back agreements as we have generally found that market prices exceeded the trade back allowances, although in recent years, trade back allowances have increased as a result of the increasing cost of the underlying equipment.
Assets Held For Sale
Assets held for sale include property and revenue equipment no longer utilized in continuing operations which are available and held for sale. Assets held for sale are no longer subject to depreciation, and are recorded at the lower of depreciated book value or fair market value less selling costs. We periodically review the carrying value of these assets for possible impairment. We expect to sell these assets within twelve months.
Goodwill and Other Intangible Assets
We classify intangible assets into two categories: (i) intangible assets with finite lives subject to amortization and (ii) goodwill. As a result of the Landair Acquisition, we have goodwill of $41.6 million on our consolidated balance sheet for the year ended December 31, 2018, while we had none for the year ended December 31, 2017. We test goodwill for impairment annually and whenever events or changes in circumstances indicate that impairment may have occurred. We test intangible assets with finite lives for impairment if conditions exist that indicate the carrying value may not be recoverable. Such conditions may include an economic downturn in a geographic market or a change in the assessment of future operations. We record an impairment charge when the carrying value of the finite lived intangible asset is not recoverable by the cash flows generated from the use of the asset.
We determine the useful lives of our identifiable intangible assets after considering the specific facts and circumstances related to each intangible asset. Factors we consider when determining useful lives include the contractual term of any agreement, the history of the asset, our long-term strategy for the use of the asset, any laws or other local regulations which could impact the useful life of the asset, and other economic factors, including competition and specific market conditions. Intangible assets that are deemed to have finite lives are amortized, generally on a straight-line basis, over their useful lives, ranging from 5 to 15 years. We have $32.5 million of identifiable intangible assets on our consolidated balance sheets at December 31, 2018, net of accumulated amortization, and none for the year ended December 31, 2017.
Insurance and Other Claims
The primary claims arising against us consist of auto liability (personal injury and property damage), workers' compensation, cargo, commercial liability, and employee medical expenses. Our insurance program involves self-insurance with the following risk retention levels (before giving effect to any commutation of an auto liability policy):
|
|
●
|
auto liability - $1.0 million
|
|
|
●
|
workers' compensation - $1.3 million
|
|
|
●
|
cargo - $0.3 million
|
|
|
●
|
employee medical - $0.4 million
|
|
|
●
|
physical damage - 100%
|
Due to our significant self-insured retention amounts, we have exposure to fluctuations in the number and severity of claims and to variations between our estimated and actual ultimate payouts. We accrue the estimated cost of the uninsured portion of pending claims and an estimate for allocated loss adjustment expenses including legal and other direct costs associated with a claim. Estimates require judgments concerning the nature and severity of the claim, historical trends, advice from third-party administrators and insurers, the size of any potential damage award based on factors such as the specific facts of individual cases, the jurisdictions involved, the prospect of punitive damages, future medical costs, and inflation estimates of future claims development, and the legal and other costs to settle or defend the claims. We have significant exposure to fluctuations in the number and severity of claims. If there is an increase in the frequency and severity of claims, or we are required to accrue or pay additional amounts if the claims prove to be more severe than originally assessed, or any of the claims would exceed the limits of our insurance coverage, our profitability could be adversely affected.
In addition to estimates within our self-insured retention layers, we also must make judgments concerning claims where we have third party insurance and for claims outside our coverage limits. Upon settling claims and expenses associated with claims where we have third party coverage, we are generally required to initially fund payment to the claimant and seek reimbursement from the insurer. Receivables from insurers for claims and expenses we have paid on behalf of insurers were
$3.0 million and
$1.1 million at December 31,
2018 and
2017, respectively, and are included in drivers' advances and other receivables on our consolidated balance sheet. Additionally, we accrue claims above our self-insured retention and record a corresponding receivable for amounts we expect to collect from insurers upon settlement of such claims. We have
$5.1 million
and
$2.1 million at December 31, 2018 and 2017, respectively, as a receivable in other assets and as a corresponding accrual in the long-term portion of insurance and claims accruals on our consolidated balance sheet for claims above our self-insured retention for which we believe it is reasonably assured that the insurers will provide their portion of such claims. We evaluate collectability of the receivables based on the credit worthiness and surplus of the insurers, along with our prior experience and contractual terms with each. If any claim occurrence were to exceed our aggregate coverage limits, we would have to accrue for the excess amount. Our critical estimates include evaluating whether a claim may exceed such limits and, if so, by how much. If one or more claims were to exceed our then effective coverage limits, our financial condition and results of operations could be materially and adversely affected.
We also make judgments regarding the ultimate benefit versus risk of commuting certain periods within our auto liability policy. If we commute a policy, we assume 100% risk for covered claims in exchange for a policy refund.
Effective April 2018, we entered into new auto liability policies with a three-year term. The policy includes a limit for a single loss of $9.0 million, an aggregate of $18.0 million for each policy year, and a $30.0 million aggregate for the 36 month term ended March 31, 2021. The policy included a policy release premium refund or commutation option of up to $14.0 million, less any future amounts paid on claims by the insurer. A decision with respect to commutation of the policy could be made before April 1, 2021. Additionally, our prior auto liability policy that ran from October 1, 2014 through March 31, 2018, included a commutation provision if we were to commute the policy for the entire 42 months. Based on claims paid to date the policy premium release refund could range from zero to $4.9 million, depending on actual claims settlements in the future. Management cannot predict whether or not future claims or the development of existing claims will justify a commutation of either policy period, and accordingly, no related amounts were recorded at December 31, 2018.
If claims development factors that are based upon historical experience change by 10%, our claims accrual as of
December 31, 2018, would change by approximately $0.8 million.
Lease Accounting and Off-Balance Sheet Transactions
We issue residual value guarantees in connection with the operating leases we enter into for certain of our revenue equipment. These leases provide that if we do not purchase the leased equipment from the lessor at the end of the lease term, then we are liable to the lessor for an amount equal to the shortage (if any) between the proceeds from the sale of the equipment and an agreed value. To the extent the expected value at the lease termination date is lower than the residual value guarantee, we would accrue for the difference over the remaining lease term. We believe that proceeds from the sale of equipment under operating leases would equal or exceed the payment obligation on substantially all operating leases. The estimated values at lease termination involve management judgments. As leases are entered into, determination as to the classification as an operating or capital lease involves management judgments on residual values and useful lives.
Accounting for Income Taxes
Deferred tax assets and liabilities are recognized for the future tax consequences attributable to differences between the financial statement carrying amounts of existing assets and liabilities and their respective tax basis. Deferred tax assets and liabilities are measured using enacted tax rates expected to apply to taxable income in the years in which those temporary differences are expected to be recovered or settled. The effect on deferred tax assets and liabilities of a change in tax rates is recognized in income in the period that includes the enactment date. We believe the future tax deductions will be realized principally through future reversals of existing taxable temporary differences and future taxable income, except for when a valuation allowance has been provided.
In the ordinary course of business there is inherent uncertainty in quantifying our income tax positions. We assess our income tax positions and record tax benefits for all years subject to examination based upon management's evaluation of the facts, circumstances, and information available at the reporting dates. For those tax positions where it is more likely than not that a tax benefit will be sustained, we have recorded the largest amount of tax benefit with a greater than 50% likelihood of being realized upon ultimate settlement with a taxing authority that has full knowledge of all relevant information. For those income tax positions where it is not more likely than not that a tax benefit will be sustained, no tax benefit has been recognized in the financial statements. Potential accrued interest and penalties related to unrecognized tax benefits are recognized as a component of income tax expense.
Stock-Based Employee Compensation
We issue several types of stock-based compensation, including awards that vest based on service and performance conditions or a combination of the conditions. Performance-based awards vest contingent upon meeting certain performance criteria established by the Compensation Committee of our Board of Directors. For performance-based awards, determining the appropriate amount to expense in each period is based on likelihood and timing of achieving the stated targets and requires judgment, including forecasting future financial results. The estimates are revised periodically based on the probability and timing of achieving the required performance targets and adjustments are made as appropriate. Awards that are only subject to time vesting provisions are amortized using the straight-line method.
Recent Accounting Pronouncements
Accounting Standards adopted
In May 2014 the Financial Accounting Standards Board (“FASB”) issued Accounting Standards Update ("ASU") 2014-09, which supersedes virtually all existing revenue guidance. The new standard introduces a five-step model to determine when and how revenue is recognized. The premise of the new model is that an entity recognizes revenue to depict the transfer of promised goods or services to customers in an amount that reflects the consideration to which the entity expects to be entitled in exchange for those goods or services. The guidance also requires enhanced disclosures regarding the nature, timing and uncertainty of revenue and cash flows arising from an entity’s contracts with customers. The new standard became effective for us for our annual and interim reporting periods beginning January 1, 2018. The guidance permits the use of either a full retrospective or modified retrospective adoption approach with a cumulative effect adjustment recorded in either scenario as necessary upon transition.
As permitted by the guidance, we elected the modified retrospective approach and thus recognized the cumulative effect of adoption of $0.6 million, net of tax, as a positive adjustment to retained earnings in the first quarter of 2018 as a result of the initial recording of in process revenue and associated direct expenses.
Based on our review of our customer shipping arrangements and the related guidance, we have concluded that we will recognize revenue from loads proportionally as the transportation service is performed based on the percentage of miles completed as of the period end, as opposed to recognizing revenue upon the completion of the load, which was our historic practice. Revenue will be recognized on a gross basis at amounts charged to our customers because we control and are primarily responsible for the fulfillment of the promised service. Our recognition of revenue under the new standard approximates our recognition of revenue under the prior standard, as there will generally be a consistent amount of freight in process at the beginning and end of the period; however, seasonality and the day on which the period ends may cause minor differences.
The following table summarizes the impacts of adopting ASC 606 on the Company’s consolidated financial statements for the year ended December 31, 2018.
|
|
Twelve Months Ended December 31, 2018
|
|||||||||||
|
|
Balances without
|
|||||||||||
|
|
adoption of Topic
|
|||||||||||
|
Financial Statement Line Item (in thousands)
|
As reported
|
Adjustments
|
606 | |||||||||
|
Consolidated Balance Sheet
|
||||||||||||
|
Accounts receivable, net of allowances
|
$
|
151,093
|
$
|
(1,244
|
)
|
$
|
149,849
|
|||||
|
Total assets
|
773,524
|
(1,244
|
)
|
772,280
|
||||||||
|
Accrued expenses
|
49,503
|
(277
|
)
|
49,226
|
||||||||
|
Deferred income taxes
|
77,467
|
(266
|
)
|
77,201
|
||||||||
|
Total liabilities
|
430,382
|
(543
|
)
|
429,839
|
||||||||
|
Retained earnings
|
200,566
|
(701
|
)
|
199,865
|
||||||||
|
Total stockholders’ equity
|
343,142
|
(701
|
)
|
342,441
|
||||||||
|
Total liabilities and stockholders’ equity
|
773,524
|
(1,244
|
)
|
772,280
|
||||||||
|
Consolidated Statement of Operations
|
||||||||||||
|
Freight revenue
|
779,729
|
(234
|
)
|
779,495
|
||||||||
|
Total revenue
|
885,455
|
(234
|
)
|
885,221
|
||||||||
|
Salaries, wages and related expenses
|
304,447
|
13
|
304,460
|
|||||||||
|
Revenue equipment rentals and purchased transportation
|
183,645
|
(95
|
)
|
183,550
|
||||||||
|
Total operating expenses
|
826,469
|
(82
|
)
|
826,387
|
||||||||
|
Income tax expense (benefit)
|
15,507
|
(41
|
)
|
15,466
|
||||||||
|
Net income
|
42,503
|
(111
|
)
|
42,392
|
||||||||
|
Consolidated Statement of Comprehensive Income
|
||||||||||||
|
Net income
|
42,503
|
(111
|
)
|
42,392
|
||||||||
|
Comprehensive income
|
42,414
|
(111
|
)
|
42,303
|
||||||||
|
Consolidated Statement of Cash Flows
|
||||||||||||
|
Operating Cash Flows
|
||||||||||||
|
Net income
|
42,503
|
(111
|
)
|
42,392
|
||||||||
|
Deferred income tax expense (benefit)
|
13,840
|
(41
|
)
|
13,799
|
||||||||
|
Change in: Receivables and advances
|
(27,199
|
)
|
234
|
(26,965
|
)
|
|||||||
|
Change in: Accounts payable and accrued expenses
|
19,232
|
(82
|
)
|
19,150
|
||||||||
|
Net cash flows provided by operating activities
|
124,800
|
-
|
124,800
|
|||||||||
Accounting Standards not yet adopted
In February 2016, FASB issued ASU 2016-02, which requires lessees to recognize a right-to-use asset and a lease obligation for all leases. Lessees are permitted to make an accounting policy election to not recognize an asset and liability for leases with a term of twelve months or less. Lessor accounting under the new standard is substantially unchanged. Additional qualitative and quantitative disclosures, including significant judgments made by management, will be required. This new standard will become effective for us in our annual reporting period beginning January 1, 2019, including interim periods within that reporting period and requires a modified retrospective transition approach. We believe the adoption will not have a material impact to net income and will add approximately
$43.0 million to our assets and liabilities for the related right-to-use asset and lease obligation for our existing operating leases. We plan to finalize our evaluation during the first quarter of 2019, including an assessment of the new expanded disclosure requirements and a final determination of the impact to adoption and related changes required to internal controls.
INFLATION, NEW EMISSIONS CONTROL REGULATIONS, AND FUEL COSTS
Most of our operating expenses are inflation-sensitive, with inflation generally producing increased costs of operations. In recent years, the most significant effects of inflation have been on revenue equipment prices and the related depreciation, health care, and driver and non-driver wages. New emissions control regulations and increases in wages of manufacturing workers and other items have resulted in higher tractor prices, while the decline in the market value of used equipment significantly reduced the residual values of units in fiscal 2015 through 2017. The cost of fuel has been extremely volatile over the last several years, with costs increasing in 2017
and 2018 after significant decreases in both 2016 and 2015. We believe at least some of this volatility reflects the fluctuations in the U.S. dollar and global demand for petroleum products, unrest in certain oil-producing countries, improved fuel efficiency due to technological advancements, and an increase in domestic supply. Health care prices have increased faster than general inflation, primarily due to the rapid increase in prescription drug costs and more people on our health plan in order to comply with the individual healthcare mandate. The nationwide shortage of qualified drivers has caused us to raise driver wages per mile at a rate faster than general inflation for the past four years, and this trend may continue as additional government regulations constrain industry capacity. Additionally, competition and the related cost to employ non-drivers have increased, especially for the more skilled or technical positions, including mechanics, those with information technology related skills, and degreed professionals.
Geographic Areas
We operate throughout the U.S. and in parts of Mexico and Canada, with substantially all of our revenue generated from within the U.S. All of our tractors are domiciled in the U.S., and we have generated less than two percent of our revenue in Canada and Mexico in 2018, 2017, and 2016. We do not separately track domestic and foreign revenue from customers, and providing such information would not be meaningful. Excluding a de minimis number of trailers, all of our long-lived assets are, and have been for the last three fiscal years, located within the United States.
SEASONALITY
In 2015, we experienced marked surges in business and profitability during the fourth quarter holiday season, due to our team drivers and customer base. This occurred again in 2016, 2017, and 2018, though not to the same extent as in the past. After this surge, revenue generally decreases as customers reduce shipments following the holiday season and as inclement weather impedes operations. At the same time, operating expenses generally increase, with fuel efficiency declining because of engine idling and weather, creating more physical damage equipment repairs. For the reasons stated, first quarter results historically have been lower than results in each of the other three quarters of the year, excluding charges. The duration of what is considered peak season has shortened over the last few years and now is approximately a five-week period beginning the week of Thanksgiving and ending on Christmas Eve, and we have seen our customers’ networks adjust accordingly. If this trend continues, our ability to take advantage of this surge in business and our fourth quarter profitability could be negatively affected.
|
ITEM 7A.
|
We experience various market risks, including changes in interest rates and fuel prices. We do not enter into derivatives or other financial instruments for trading or speculative purposes, or when there are no underlying related exposures. Because our operations are mostly confined to the United States, we are not subject to a material amount of foreign currency risk.
COMMODITY PRICE RISK
We engage in activities that expose us to market risks, including the effects of changes in fuel prices and in interest rates. Financial exposures are evaluated as an integral part of our risk management program, which seeks, from time-to-time, to reduce the potentially adverse effects that the volatility of fuel markets and interest rate risk may have on operating results.
In an effort to seek to reduce the variability of the ultimate cash flows associated with fluctuations in diesel fuel prices, we have periodically entered into various derivative instruments, including forward futures swap contracts. We have historically entered into hedging contracts with respect to ULSD. Under these contracts, we paid a fixed rate per gallon of ULSD and received the monthly average price of Gulf Coast ULSD. The retrospective and prospective regression analyses provided that changes in the prices of diesel fuel and ULSD were deemed to be highly effective based on the relevant authoritative guidance. At
December 31, 2018, there are no remaining fuel hedge contracts. We do not engage in speculative transactions, nor do we hold or issue financial instruments for trading purposes.
A one dollar increase in the price of diesel per gallon would decrease our net income by
$5.4 million. This sensitivity analysis considers that we expect to purchase approximately
53.8 million gallons of diesel annually, with an assumed fuel surcharge recovery rate of 86.1% of the cost (which was our fuel surcharge recovery rate during the year ended
December 31, 2018).
INTEREST RATE RISK
In August 2015, we entered into an interest rate swap agreement with a notional amount of $28.0 million, which was designated as a hedge against the variability in future interest payments due on the debt associated with the purchase of our corporate headquarters. The terms of the swap agreement effectively convert the variable rate interest payments on this note to a fixed rate of 4.2% through maturity on August 1, 2035. In 2016, we also entered into several interest rate swaps, which were designated to hedge against the variability in future interest rate payments due on rent associated with the purchase of certain trailers. Because the critical terms of the swap and hedged item coincide, in accordance with the requirements of ASC 815, the change in the fair value of the derivative is expected to exactly offset changes in the expected cash flows due to fluctuations in the LIBOR rate over the term of the debt instrument, and therefore no ongoing assessment of effectiveness is required. The fair value of the swap agreements that were in effect at
December 31, 2018 and
2017, of approximately
$0.3 million and
$0.4 million, respectively, is included in other assets and other liabilities, as appropriate, in the consolidated balance sheet, and is included in accumulated other comprehensive income (loss), net of tax. Additionally,
$0.1 million and
$0.4 million was reclassified from accumulated other comprehensive income (loss) into our results of operations as additional interest expense for the year ended
December 31, 2018 and 2017, respectively, related to changes in interest rates during such periods. Based on the amounts in accumulated other comprehensive income as of
December 31, 2018, we expect to reclassify losses of approximately
less than $0.1 million, net of tax, on derivative instruments from accumulated other comprehensive income into our results of operations during the next twelve months due to changes in interest rates. The amounts actually realized will depend on the fair values as of the date of settlement.
Our market risk is also affected by changes in interest rates. Historically, we have used a combination of fixed-rate and variable-rate obligations to manage our interest rate exposure. Fixed-rate obligations expose us to the risk that interest rates might fall. Variable-rate obligations expose us to the risk that interest rates might rise. Of our total
$235.8 million of debt and capital leases, we had
$37.4 million of variable rate debt outstanding at December 31, 2018, including our Credit Facility, a real-estate note and certain equipment notes, of which the real-estate note of
$24.8 million was hedged with the interest rate swap agreement noted above at 4.2% and certain of our equipment notes totaling
$8.7 million were hedged at a weighted average interest rate of 2.0%. Our earnings would be affected by changes in these short-term interest rates. Risk can be quantified by measuring the financial impact of a near-term adverse increase in short-term interest rates. At our
December 31, 2018 level of borrowing on our non-hedged variable rate debt, a 1% increase in our applicable rate would reduce annual net income by
less than $0.1 million. Our remaining debt is fixed rate debt, and therefore changes in market interest rates do not directly impact our interest expense.
|
ITEM 8.
|
The consolidated financial statements of Covenant Transportation Group, Inc. and subsidiaries, including the consolidated balance sheets as of
December 31, 2018 and
2017, and the related statements of operations, statements of comprehensive income, statements of stockholders' equity, and statements of cash flows for each of the years in the three-year period ended
December 31, 2018, together with the related notes, and the report of KPMG LLP, our independent registered public accounting firm as of
December 31, 2018 and 2017, and for each of the years in the three year period ended
December 31, 2018 are set forth at pages 67 through 97 elsewhere in this report.
|
ITEM 9.
|
There has been no change in or disagreement with accountants on accounting or financial disclosure during our two most recent fiscal years.
|
ITEM 9A.
|
We have established disclosure controls and procedures to ensure that material information relating to us, including our consolidated subsidiaries, is made known to the officers who certify our financial reports and to other members of senior management and the Board of Directors.
As of the end of the period covered by this report, we carried out an evaluation, under the supervision and with the participation of our management, including the Chief Executive Officer and Chief Financial Officer, of the effectiveness of the design and operations of our disclosure controls and procedures (as defined in Rule 13a-15(e) and 15d-15(e) under the Exchange Act). Based upon that evaluation, our Chief Executive Officer and Chief Financial Officer concluded that due to material weaknesses in our internal control over financial reporting described below in Management’s Annual Report on Internal Control Over Financial Reporting, our disclosure controls and procedures were not effective as of December 31, 2018.
Following identification of the material weakness and prior to filing this Annual Report on Form 10-K, we completed substantive procedures for the year ended December 31, 2018. Based on these procedures, management believes that our consolidated financial statements included in this Form 10-K have been prepared in accordance with GAAP. Our Chief Executive Officer and Chief Financial Officer have certified that, based on their knowledge, the financial statements, and other financial information included in this Form 10-K, fairly present in all material respects the financial condition, results of operations, and cash flows of the Company as of, and for, the period ended December 31, 2018. KPMG LLP has issued an unqualified opinion on our financial statements, which is included herein.
Management's Annual Report on Internal Control Over Financial Reporting
Management is responsible for establishing and maintaining adequate internal control over financial reporting (as defined in Rules 13a-15(f) and 15d-15(f) under the Exchange Act). Management, including our Chief Executive Officer and Chief Financial Officer under the oversight of our Board of Directors, assessed the effectiveness of our internal control over financial reporting as of December 31, 2018. In making this assessment, our management used the criteria for effective internal control over financial reporting described in “Internal Control-Integrated Framework (2013),” issued by the Committee of Sponsoring Organizations of the Treadway Commission (COSO).
A company’s internal control over financial reporting is a process designed to provide reasonable assurance regarding the reliability of financial reporting for external purposes in accordance with GAAP. A company’s internal control over financial reporting includes those policies and procedures that:
|
|
●
|
pertain to the maintenance of records that, in reasonable detail, accurately and fairly reflect the transactions and dispositions of the assets of the company;
|
|||
| ● |
provide reasonable assurance that transactions are recorded as necessary to permit preparation of financial statements in accordance with GAAP, and that receipts and expenditures of the company are being made only in accordance with authorizations of management and directors of the company; and
|
||||
| ● | provide reasonable assurance regarding prevention or timely detection of unauthorized acquisition, use, or disposition of the company’s assets that could have a material effect on the financial statements. | ||||
Because of its inherent limitations, internal control over financial reporting may not prevent or detect misstatements. Also, projections of any evaluation of effectiveness to future periods are subject to the risk that controls may become inadequate because of changes in conditions, or that the degree of compliance with the policies or procedures may deteriorate. Accordingly, even effective internal control over financial reporting can only provide reasonable assurance of achieving its control objectives.
An internal control system, no matter how well-conceived and operated, can provide only reasonable, not absolute, assurance that the objectives of such internal controls are met. Further, the design of an internal control system must reflect the fact that there are resource constraints, and the benefits of controls must be considered relative to their costs. As a result of the inherent limitations in all internal control systems, no evaluation of controls can provide absolute assurance that all our control issues and instances of fraud, if any, have been detected.
A material weakness is a deficiency, or combination of deficiencies, in internal control over financial reporting, such that there is a reasonable possibility that a material misstatement of the Company’s annual or interim financial statements will not be prevented or detected on a timely basis.
We acquired Landair on July 3, 2018 and management excluded from its assessment of the effectiveness of internal control over financial reporting as the December 31, 2018, Landair total assets and total revenues representing approximately 15.1% and 9.6%, respectively, of our consolidated financial statements as of and for the year ended December 31, 2018.
In connection with our evaluation of internal control over financial reporting, we noted the following deficiencies that we consider to be a material weakness:
We did not design and maintain effective program change management controls over certain of our information technology (“IT”) operating systems, databases and IT applications that support the Company’s financial reporting processes. As a result, process level automated controls and manual controls that are dependent on the completeness and accuracy of information derived from the affected IT systems were also ineffective because they could have been adversely impacted. This material weakness was a result of: ineffective change-management processes to identify and assess changes in IT systems that could impact internal control over financial reporting; insufficient documentation of IT control processes such that the successful operation of information technology general controls (ITGCs) was overly dependent upon knowledge and actions of certain individuals with IT expertise; insufficient training of IT personnel on the importance of ITGCs; ineffective process to implement changes in control activities on a timely basis; and ineffective oversight and monitoring of changes necessary to address identified deficiencies.
The
material weakness did not result in any identified misstatements to the financial statements, and there were no changes to previously released financial results. Based on this material weakness, the Company’s management concluded that at December 31, 2018, the Company’s internal control over financial reporting was not effective.
The Company’s independent registered public accounting firm, KPMG LLP, has issued an adverse audit opinion on the effectiveness of the Company’s internal control over financial reporting as of December 31, 2018, which is included herein on p. 65.
Remediation
Management has been implementing and continues to implement measures designed to ensure that control deficiencies contributing to the material weakness are remediated, such that these controls are designed, implemented, and operating effectively. The remediation actions include: (i) developing a training program addressing ITGCs and policies, including educating control owners concerning the principles and requirements of each control, with a focus on those related to change-management over IT systems impacting financial reporting; (ii) implementing controls to address and maintain documentation of completeness and accuracy of system generated information used to support the operation of the controls; (iii) developing enhanced change-management intake procedures and controls related to changes in IT systems; (iv) implementing an IT management review and testing plan to monitor ITGCs with a specific focus on systems supporting our financial reporting processes; and (v) enhanced monthly reporting on the remediation measures to the Audit Committee of our Board of Directors.
We believe that these actions will remediate the material weakness. The material weakness will not be considered remediated, however, until the applicable controls operate for a sufficient period of time and management has concluded, through testing, that these controls are operating effectively. We expect that the remediation of this material weakness will be completed prior to the end of fiscal 2019.
Changes in Internal Control Over Financial Reporting
Other than the material weakness identified during the quarter, the remediation process described above, and the implementation of controls that may materially affect internal control related to the Landair Acquisition, as of December 31, 2018, there have been no other changes in our internal control over financial reporting (as defined in Rules 13a-15(f) or 15d-15(f) of the Exchange Act) that occurred during the fourth quarter of fiscal 2018 that have materially affected, or are reasonably likely to materially affect, the Company’s internal control over financial reporting.
|
ITEM 9B.
|
None.
PART III
| ITEM 10. |
We incorporate by reference the information respecting executive officers and directors set forth under the captions "Proposal 1 - Election of Directors", "Corporate Governance – Section 16(a) Beneficial Ownership Reporting Compliance", "Corporate Governance – Our Executive Officers", "Corporate Governance – Code of Conduct and Ethics", “Corporate Governance – Committees of the Board of Directors – The Nominating and Corporate Governance Committee”, and "Corporate Governance – Committees of the Board of Directors – The Audit Committee" in our Proxy Statement for the
2019 annual meeting of stockholders, which will be filed with the Securities and Exchange Commission in accordance with Rule 14a-6 promulgated under the Securities Exchange Act of 1934, as amended (the "Proxy Statement"); provided, that the section entitled "Corporate Governance – Committees of the Board of Directors – The Audit Committee – Report of the Audit Committee" contained in the Proxy Statement is not incorporated by reference.
|
ITEM 11.
|
We incorporate by reference the information set forth under the sections entitled "Executive Compensation", "Corporate Governance – Committees of the Board of Directors – The Compensation Committee – Compensation Committee Interlocks and Insider Participation", and "Corporate Governance – Committees of the Board of Directors – The Compensation Committee" in the Proxy Statement; provided, that the section entitled "Corporate Governance – Committees of the Board of Directors – The Compensation Committee – Report of the Compensation Committee" contained in the Proxy Statement is not incorporated by reference.
|
ITEM 12.
|
The following table provides certain information, as of
December 31, 2018, with respect to our compensation plans and other arrangements under which shares of our Class A common stock are authorized for issuance.
Equity Compensation Plan Information
|
Plan category
|
Number of securities to be issued upon exercise
of outstanding options,
warrants and rights
|
Weighted average
exercise price of
outstanding options,
warrants and rights
|
Number of securities
remaining eligible for
future issuance under
equity compensation
plans (excluding
securities reflected in
column (a))
|
||||||||||
|
|
(a)
|
(b)
|
(c)
|
||||||||||
|
Equity compensation plans approved by security holders
|
675,437
|
(1) |
0
|
50,960
|
|||||||||
|
Equity compensation plans not approved by security holders
|
0
|
0
|
0
|
||||||||||
|
Total
|
675,437
|
0
|
50,960
|
||||||||||
|
(1)
|
Represents unvested restricted shares granted under the 2006 Omnibus Incentive Plan, as amended. The weighted average stock price on the date of grant for outstanding restricted stock awards was
$ 20.08, which is not reflected in column (b), because restricted stock awards do not have an exercise price.
|
We incorporate by reference the information set forth under the section entitled "Security Ownership of Certain Beneficial Owners and Management" in the Proxy Statement.
|
ITEM 13.
|
We incorporate by reference the information set forth under the sections entitled "Corporate Governance – The Board of Directors and Its Committees" and "Certain Relationships and Related Transactions" in the Proxy Statement.
|
ITEM 14.
|
We incorporate by reference the information set forth under the section entitled "Relationships with Independent Registered Public Accounting Firm – Principal Accountant Fees and Services" in the Proxy Statement.
PART IV
|
ITEM 15.
|
|
||
|
|
|
|
|
|
(a)
|
1.
|
Financial Statements.
|
|
|
|
|
|
|
|
|
|
Our audited consolidated financial statements are set forth at the following pages of this report:
|
|
|
|
|
64
|
|
| Report of Independent Registered Public Accounting Firm - Opinion on Internal Control Over Financial Reporting | 65 | ||
|
|
|
67
|
|
|
|
|
68
|
|
|
|
|
69
|
|
|
|
|
70
|
|
|
|
|
71
|
|
|
|
|
72
|
|
|
|
|
|
|
|
|
2.
|
Financial Statement Schedules.
|
|
|
|
|
|
|
|
|
|
Financial statement schedules are not required because all required information is included in the financial statements or is not applicable.
|
|
|
|
|
|
|
|
|
3.
|
Exhibits.
|
|
|
|
|
|
|
|
|
|
The exhibits required to be filed by Item 601 of Regulation S-K are listed under paragraph (b) below and on the Exhibit Index appearing at the end of this report. Management contracts and compensatory plans or arrangements are indicated by an asterisk.
|
|
|
|
|
|
|
|
(b)
|
|
Exhibits.
|
|
|
|
|
The following exhibits are filed with this Form 10-K or incorporated by reference to the document set forth next to the exhibit listed below.
|
|
|
Exhibit Number
|
Reference
|
Description
|
|
|
Stock Purchase Agreement, dated July 3, 2018, by and among Landair Holdings, Inc., the Stockholders of Landair Holdings, Inc. and Covenant Transportation Group, Inc. (Incorporated by reference to Exhibit 2.1 to the Company's Form 10-Q, filed November 9, 2018)
|
|
|
|
Amended and Restated Articles of Incorporation (Incorporated by reference to Exhibit 99.2 to the Company's Report on Form 8-K, filed May 29, 2007)
|
|
|
|
Second Amended and Restated Bylaws (Incorporated by reference to Exhibit 3.2 to the Company's Form 10-Q, filed May 13, 2011)
|
|
|
|
Amended and Restated Articles of Incorporation (Incorporated by reference to Exhibit 99.2 to the Company's Report on Form 8-K, filed May 29, 2007)
|
|
|
|
Second Amended and Restated Bylaws (Incorporated by reference to Exhibit 3.2 to the Company's Form 10-Q, filed May 13, 2011)
|
|
|
*
|
Form of Indemnification Agreement between Covenant Transport, Inc. and each officer and director, effective May 1, 2004 (Incorporated by reference to Exhibit 10.2 to the Company's Form 10-Q, filed August 5, 2004)
|
|
|
*
|
Form of Restricted Stock Award Notice under the 2006 Omnibus Incentive Plan (Incorporated by reference to Exhibit 10.22 to the Company's Form 10-Q, filed August 9, 2006)
|
|
|
*
|
Form of Restricted Stock Special Award Notice under the 2006 Omnibus Incentive Plan (Incorporated by reference to Exhibit 10.23 to the Company's Form 10-Q, filed August 9, 2006)
|
|
|
|
Third Amended and Restated Credit Agreement, dated September 23, 2008, among Covenant Transportation Group, Inc., Covenant Transport, Inc., CTG Leasing Company, Covenant Asset Management, Inc., Southern Refrigerated Transport, Inc., Covenant Transport Solutions, Inc., Star Transportation, Inc., Bank of America, N.A., JPMorgan Chase Bank, N.A., and Textron Financial Corporation (Incorporated by reference to Exhibit 10.14 to the Company's Form 10-K, filed March 30, 2010)
|
|
|
*
|
Covenant Transportation Group, Inc. Third Amended and Restated 2006 Omnibus Incentive Plan (Incorporated by reference to Appendix A to the Company's Schedule 14A, filed April 19, 2013)
|
|
|
|
Amendment No. 1 to Third Amended and Restated Credit Agreement, dated March 27, 2009, among Covenant Transportation Group, Inc., Covenant Transport, Inc., CTG Leasing Company, Covenant Asset Management, Inc., Southern Refrigerated Transport, Inc., Covenant Transport Solutions, Inc., Star Transportation, Inc., Bank of America, N.A., JPMorgan Chase Bank, N.A., and Textron Financial Corporation (Incorporated by reference to Exhibit 10.1 to the Company's Form 10-Q, filed May 15, 2009)
|
|
|
Second Amendment to Third Amended and Restated Credit Agreement, dated February 25, 2010, among Covenant Transportation Group, Inc., Covenant Transport, Inc., CTG Leasing Company, Covenant Asset Management, Inc., Southern Refrigerated Transport, Inc., Covenant Transport Solutions, Inc., Star Transportation, Inc., Bank of America, N.A., JPMorgan Chase Bank, N.A., and Textron Financial Corporation (Incorporated by reference to Exhibit 10.1 to the Company's Form 10-Q, filed May 17, 2010)
|
|
|
|
Third Amendment to Third Amended and Restated Credit Agreement, dated July 30, 2010, among Covenant Transportation Group, Inc., Covenant Transport, Inc., CTG Leasing Company, Covenant Asset Management, Inc., Southern Refrigerated Transport, Inc., Covenant Transport Solutions, Inc., Star Transportation, Inc., Bank of America, N.A., and JP Morgan Chase Bank, N.A. (Incorporated by reference to Exhibit 10.1 to the Company's Form 10-Q, filed November 9, 2010)
|
|
|
|
Fourth Amendment to Third Amended and Restated Credit Agreement, dated August 31, 2010, among Covenant Transportation Group, Inc., Covenant Transport, Inc., CTG Leasing Company, Covenant Asset Management, Inc., Southern Refrigerated Transport, Inc., Covenant Transport Solutions, Inc., Star Transportation, Inc., Bank of America, N.A., and JP Morgan Chase Bank, N.A. (Incorporated by reference to Exhibit 10.2 to the Company's Form 10-Q, filed November 9, 2010)
|
|
|
|
Fifth Amendment to Third Amended and Restated Credit Agreement, dated September 1, 2011, among Covenant Transportation Group, Inc., Covenant Transport, Inc., CTG Leasing Company, Covenant Asset Management, Inc., Southern Refrigerated Transport, Inc., Covenant Transport Solutions, Inc., Star Transportation, Inc., Bank of America, N.A., and JP Morgan Chase Bank, N.A. (Incorporated by reference to Exhibit 10.1 to the Company's Report on Form 8-K, filed October 28, 2011)
|
|
|
|
Sixth Amendment to Third Amended and Restated Credit Agreement, dated effective as of October 24, 2011, among Covenant Transportation Group, Inc., Covenant Transport, Inc., CTG Leasing Company, Covenant Asset Management, Inc., Southern Refrigerated Transport, Inc., Covenant Transport Solutions, Inc., Star Transportation, Inc., Bank of America, N.A., and JP Morgan Chase Bank, N.A. (Incorporated by reference to Exhibit 10.2 to the Company's Report on Form 8-K, filed October 28, 2011)
|
|
|
|
Seventh Amendment to Third Amended and Restated Credit Agreement, dated effective as of March 29, 2012, among Covenant Transportation Group, Inc., Covenant Transport, Inc., CTG Leasing Company, Covenant Asset Management, Inc., Southern Refrigerated Transport, Inc., Covenant Transport Solutions, Inc., Star Transportation, Inc., Bank of America, N.A., and JP Morgan Chase Bank, N.A. (Incorporated by reference to Exhibit 10.1 to the Company's Report on Form 8-K, filed April 2, 2012)
|
|
|
|
Eighth Amendment to Third Amended and Restated Credit Agreement, dated effective as of December 31, 2012, among Covenant Transportation Group, Inc., Covenant Transport, Inc., CTG Leasing Company, Covenant Asset Management, Inc., Southern Refrigerated Transport, Inc., Covenant Transport Solutions, Inc., Star Transportation, Inc., Bank of America, N.A., and JP Morgan Chase Bank, N.A. (Incorporated by reference to Exhibit 10.1 to the Company's Report on Form 8-K, filed January 31, 2013)
|
|
|
|
Ninth Amendment to Third Amended and Restated Credit Agreement and Related Security Documents, dated effective as of August 6, 2014, among Covenant Transportation Group, Inc., Covenant Transport, Inc., CTG Leasing Company, Covenant Asset Management, Inc., Southern Refrigerated Transport, Inc., Covenant Transport Solutions, Inc., Star Transportation, Inc., Bank of America, N.A., and JPMorgan Chase Bank, N.A. (Incorporated by reference to Exhibit 10.1 to the Company's Form 10-Q, filed November 13, 2014)
|
|
|
|
Tenth Amendment to Third Amended and Restated Credit Agreement and Related Security Documents, dated effective as of September 8, 2014, among Covenant Transportation Group, Inc., Covenant Transport, Inc., CTG Leasing Company, Covenant Asset Management, Inc., Southern Refrigerated Transport, Inc., Covenant Transport Solutions, Inc., Star Transportation, Inc., Bank of America, N.A., and JPMorgan Chase Bank, N.A. (Incorporated by reference to Exhibit 10.2 to the Company's Form 10-Q, filed November 13, 2014)
|
|
|
*
|
Consulting Agreement (Incorporated by reference to Exhibit 10.1 to the Company's Form 10-Q, filed November 9, 2016)
|
|
|
|
Joinder, Supplement and Eleventh Amendment to Third Amended and Restated Credit Agreement, dated effective as of August 6, 2015, among Covenant Transportation Group, Inc., Covenant Transport, Inc., CTG Leasing Company, Covenant Asset Management, LLC, Southern Refrigerated Transport, Inc., Covenant Transport Solutions, Inc., Star Transportation, Inc., Driven Analytic Solutions, LLC, Covenant Properties, LLC, Bank of America, N.A., and JPMorgan Chase Bank, N.A. (Incorporated by reference to Exhibit 10.1 to the Company's Form 10-Q, filed November 9, 2015)
|
|
|
|
Twelfth Amendment to Third Amended and Restated Credit Agreement, dated effective as of February 25, 2016, among Covenant Transportation Group, Inc., Covenant Transport, Inc., CTG Leasing Company, Covenant Asset Management, LLC, Southern Refrigerated Transport, Inc., Covenant Transport Solutions, Inc., Star Transportation, Inc., Driven Analytic Solutions, LLC, Covenant Properties, LLC, Bank of America, N.A., and JPMorgan Chase Bank, N.A. (Incorporated by reference to Exhibit 10.2 to the Company's Form 10-Q, filed May 10, 2016)
|
|
|
|
Thirteenth Amendment to Third Amended and Restated Credit Agreement, dated effective as of December 16, 2016, among Covenant Transportation Group, Inc., Covenant Transport, Inc., CTG Leasing Company, Covenant Asset Management, LLC, Southern Refrigerated Transport, Inc., Covenant Transport Solutions, Inc., Star Transportation, Inc., Driven Analytic Solutions, LLC, Bank of America, N.A., and JPMorgan Chase Bank, N.A. (Incorporated by reference to Exhibit 10.26 to the Company's Form 10-K, filed March 14, 2017)
|
|
*
|
First Amendment to Consulting Agreement (Incorporated by reference to Exhibit 10.27 to the Company's Form 10-K, filed March 14, 2017)
|
|
|
|
Fourteenth Amendment to Third Amended and Restated Credit Agreement, dated effective as of November 28, 2017, among Covenant Transportation Group, Inc., Covenant Transport, Inc., CTG Leasing Company, Covenant Asset Management, LLC, Southern Refrigerated Transport, Inc., Covenant Transport Solutions, Inc., Star Transportation, Inc., Driven Analytic Solutions, LLC, Transport Management Services, LLC, Bank of America, N.A., and JPMorgan Chase Bank, N.A. (Incorporated by reference to Exhibit 10.27 to the Company's Form 10-K, filed February 28, 2018)
|
|
|
|
Fifteenth Amendment to Third Amended and Restated Credit Agreement, dated effective as of June 19, 2018, among Covenant Transportation Group, Inc., Covenant Transport, Inc., CTG Leasing Company, Covenant Asset Management, LLC, Southern Refrigerated Transport, Inc., Covenant Transport Solutions, LLC, Star Transportation, Inc., Covenant Logistics, Inc., Driven Analytic Solutions, LLC, Transport Management Services, LLC, Bank of America, N.A., and JPMorgan Chase Bank, N.A. (Incorporated by reference to Exhibit 10.1 to the Company's Form 10-Q, filed August 8, 2018)
|
|
|
|
Sixteenth Amendment to Third Amended and Restated Credit Agreement, dated effective as of July 3, 2018, among Covenant Transportation Group, Inc., Covenant Transport, Inc., CTG Leasing Company, Covenant Asset Management, LLC, Southern Refrigerated Transport, Inc., Covenant Transport Solutions, LLC, Star Transportation, Inc., Covenant Logistics, Inc., Driven Analytic Solutions, LLC, Transport Management Services, LLC, Landair Holdings, Inc., Landair Transport, Inc., Landair Logistics, Inc., Landair Leasing, Inc., Bank of America, N.A., and JPMorgan Chase Bank, N.A. (Incorporated by reference to Exhibit 10.1 to the Company's Form 10-Q, filed November 9, 2018)
|
|
|
#
|
List of Subsidiaries
|
|
|
#
|
Consent of Independent Registered Public Accounting Firm – KPMG LLP
|
|
|
#
|
Certification pursuant to Item 601(b)(31) of Regulation S-K, as adopted pursuant to Section 302 of the Sarbanes-Oxley Act of 2002, by David R. Parker, the Company's Principal Executive Officer
|
|
|
#
|
Certification pursuant to Item 601(b)(31) of Regulation S-K, as adopted pursuant to Section 302 of the Sarbanes-Oxley Act of 2002, by Richard B. Cribbs, the Company's Principal Financial Officer
|
|
|
#
|
Certification pursuant to 18 U.S.C. Section 1350, as adopted pursuant to Section 906 of the Sarbanes-Oxley Act of 2002, by David R. Parker, the Company's Chief Executive Officer
|
|
|
#
|
Certification pursuant to 18 U.S.C. Section 1350, as adopted pursuant to Section 906 of the Sarbanes-Oxley Act of 2002, by Richard B. Cribbs, the Company's Chief Financial Officer
|
|
|
101.INS
|
|
XBRL Instance Document
|
|
101.SCH
|
|
XBRL Taxonomy Extension Schema Document
|
|
101.CAL
|
|
XBRL Taxonomy Extension Calculation Linkbase Document
|
|
101.DEF
|
|
XBRL Taxonomy Extension Definition Linkbase Document
|
|
101.LAB
|
|
XBRL Taxonomy Extension Labels Linkbase Document
|
|
101.PRE
|
|
XBRL Taxonomy Extension Presentation Linkbase Document
|
References:
|
#
|
Filed herewith.
|
|
*
|
Management contract or compensatory plan or arrangement.
|
|
ITEM 16.
|
None.
Pursuant to the requirements of Section 13 or 15(d) of the Securities Exchange Act of 1934, the registrant has duly caused this report to be signed on its behalf by the undersigned, thereunto duly authorized.
|
|
COVENANT TRANSPORTATION GROUP, INC.
|
|
|
|
|
|
|
|
|
|
|
|
|
|
Date:
March 13, 2019
|
By:
|
/s/ Richard B. Cribbs
|
|
|
|
|
Richard B. Cribbs
|
|
|
|
|
Executive Vice President and Chief Financial Officer in his capacity as such and on behalf of the issuer.
|
|
Pursuant to the requirements of the Securities Exchange Act of 1934, this report has been signed below by the following persons on behalf of the registrant and in the capacities and on the dates indicated.
|
Signature and Title
|
|
Date
|
|
|
|
|
|
/s/ David R. Parker
|
|
March 13, 2019
|
|
David R. Parker
|
|
|
|
Chairman of the Board and Chief Executive Officer
(principal executive officer)
|
|
|
|
|
|
|
|
/s/ Richard B. Cribbs
|
|
March 13, 2019
|
|
Richard B. Cribbs
|
|
|
|
Executive Vice President and Chief Financial Officer
(principal financial officer)
|
|
|
|
|
|
|
|
/s/ M. Paul Bunn
|
|
March 13, 2019
|
|
M. Paul Bunn
|
|
|
|
Chief Accounting Officer
(principal accounting officer)
|
|
|
|
|
|
|
|
/s/ Bradley A. Moline
|
|
March 13, 2019
|
|
Bradley A. Moline
|
|
|
|
Director
|
|
|
|
|
|
|
|
/s/ William T. Alt
|
|
March 13, 2019
|
|
William T. Alt
|
|
|
|
Director
|
|
|
|
|
|
|
|
/s/ Robert E. Bosworth
|
|
March 13, 2019
|
|
Robert E. Bosworth
|
|
|
|
Director
|
|
|
|
|
|
|
|
/s/ Herbert J. Schmidt
|
|
March 13, 2019
|
|
Herbert J. Schmidt
|
|
|
|
Director
|
|
|
|
|
|
|
|
/s/ W. Miller Welborn
|
|
March 13, 2019
|
|
W. Miller Welborn
|
|
|
|
Director
|
|
|
To the Stockholders and Board of Directors
Covenant Transportation Group, Inc.:
Covenant Transportation Group, Inc.:
Opinion on the Consolidated Financial Statements
We have audited the accompanying consolidated balance sheets of Covenant Transportation Group, Inc. and subsidiaries (the Company) as of December 31, 2018 and 2017, the related consolidated statements of operations, comprehensive income, stockholders’ equity, and cash flows for each of the years in the three‑year period ended December 31, 2018, and the related notes (collectively, the consolidated financial statements). In our opinion, the consolidated financial statements present fairly, in all material respects, the financial position of the Company as of December 31, 2018 and 2017, and the results of its operations and its cash flows for each of the years in the three‑year period ended December 31, 2018, in conformity with U.S. generally accepted accounting principles.
We also have audited, in accordance with the standards of the Public Company Accounting Oversight Board (United States) (PCAOB), the Company’s internal control over financial reporting as of December 31, 2018, based on criteria established in
Internal Control – Integrated Framework (2013)
issued by the Committee of Sponsoring Organizations of the Treadway Commission, and our report dated March 13, 2019,
expressed an adverse opinion on the effectiveness of the Company’s internal control over financial reporting.
Basis for Opinion
These consolidated financial statements are the responsibility of the Company’s management. Our responsibility is to express an opinion on these consolidated financial statements based on our audits. We are a public accounting firm registered with the PCAOB and are required to be independent with respect to the Company in accordance with the U.S. federal securities laws and the applicable rules and regulations of the Securities and Exchange Commission and the PCAOB.
We conducted our audits in accordance with the standards of the PCAOB. Those standards require that we plan and perform the audit to obtain reasonable assurance about whether the consolidated financial statements are free of material misstatement, whether due to error or fraud. Our audits included performing procedures to assess the risks of material misstatement of the consolidated financial statements, whether due to error or fraud, and performing procedures that respond to those risks. Such procedures included examining, on a test basis, evidence regarding the amounts and disclosures in the consolidated financial statements. Our audits also included evaluating the accounting principles used and significant estimates made by management, as well as evaluating the overall presentation of the consolidated financial statements. We believe that our audits provide a reasonable basis for our opinion.
We have served as the Company’s auditor since 2001.
/s/ KPMG LLP
Nashville, Tennessee
March 13, 2019
To the Stockholders and Board of Directors
Covenant Transporation Group, Inc.:
Covenant Transporation Group, Inc.:
Opinion on Internal Control Over Financial Reporting
We have audited Covenant Transporation Group, Inc.and subsidiaries
(the Company) internal control over financial reporting as of December 31, 2018, based on criteria established in
Internal Control – Integrated Framework (2013)
issued by the Committee of Sponsoring Organizations of the Treadway Commission. In our opinion, because of the effect of the material weakness, described below, on the achievement of the objectives of the control criteria, the Company has not maintained effective internal control over financial reporting as of December 31, 2018, based on criteria established in
Internal Control – Integrated Framework (2013)
issued by the Committee of Sponsoring Organizations of the Treadway Commission.
We also have audited, in accordance with the standards of the Public Company Accounting Oversight Board (United States) (PCAOB), the consolidated balance sheets of the Company as of December 31, 2018 and 2017, the related
consolidated
statements of operations, comprehensive income, stockholders’ equity, and cash flows for each of the years in the three-year period ended December 31, 2018, and the related notes (collectively, the consolidated financial statements), and our report dated March 13, 2019 expressed an unqualified opinion on those
consolidated
financial statements.
A material weakness is a deficiency, or a combination of deficiencies, in internal control over financial reporting, such that there is a reasonable possibility that a material misstatement of the company’s annual or interim financial statements will not be prevented or detected on a timely basis. A material weakness was identified related to the design and maintenance of
effective program change management controls over certain information technology (“IT”) operating systems, databases and IT applications that support the Company’s financial reporting processes
.
As a result, process level automated controls and manual controls that are dependent on the completeness and accuracy of information derived from the affected IT systems were also ineffective because they could have been adversely impacted. This material weakness was a result of: ineffective change-management processes to identify and assess changes in IT systems that could impact internal control over financial reporting; insufficient documentation of IT control processes such that the successful operation of information technology general controls (ITGCs) was overly dependent upon knowledge and actions of certain individuals with IT expertise; insufficient training of IT personnel on the importance of ITGCs; ineffective process to implement changes in control activities on a timely basis; and ineffective oversight and monitoring of changes necessary to address identified deficiencies. The material weakness has been identified and included in management’s assessment.
The material weakness was considered in determining the nature, timing, and extent of audit tests applied in our audit of the 2018 consolidated financial statements, and this report does not affect our report on those consolidated financial statements.
The Company acquired Landair Holdings, Inc. (Landair) on July 3, 2018, and management excluded from its assessment of the effectiveness of the Company’s internal control over financial reporting as of December 31, 2018, Landair’s internal control over financial reporting associated with total assets and total revenues representing approximately 15.1% and 9.6%, respectively, of the consolidated financial statements as of and for the year ended December 31, 2018. Our audit of internal control over financial reporting of the Company also excluded an evaluation of the internal control over financial reporting of Landair.
Basis for Opinion
The Company’s management is responsible for maintaining effective internal control over financial reporting and for its assessment of the effectiveness of internal control over financial reporting, included in the accompanying Management's Annual Report on Internal Control Over Financial Reporting. Our responsibility is to express an opinion on the Company’s internal control over financial reporting based on our audit. We are a public accounting firm registered with the PCAOB and are required to be independent with respect to the Company in accordance with the U.S. federal securities laws and the applicable rules and regulations of the Securities and Exchange Commission and the PCAOB.
We conducted our audit in accordance with the standards of the PCAOB. Those standards require that we plan and perform the audit to obtain reasonable assurance about whether effective internal control over financial reporting was maintained in all material respects. Our audit of internal control over financial reporting included obtaining an understanding of internal control over financial reporting, assessing the risk that a material weakness exists, and testing and evaluating the design and operating effectiveness of internal control based on the assessed risk. Our audit also included performing such other procedures as we considered necessary in the circumstances. We believe that our audit provides a reasonable basis for our opinion.
Definition and Limitations of Internal Control Over Financial Reporting
A company’s internal control over financial reporting is a process designed to provide reasonable assurance regarding the reliability of financial reporting and the preparation of financial statements for external purposes in accordance with generally accepted accounting principles. A company’s internal control over financial reporting includes those policies and procedures that (1) pertain to the maintenance of records that, in reasonable detail, accurately and fairly reflect the transactions and dispositions of the assets of the company; (2) provide reasonable assurance that transactions are recorded as necessary to permit preparation of financial statements in accordance with generally accepted accounting principles, and that receipts and expenditures of the company are being made only in accordance with authorizations of management and directors of the company; and (3) provide reasonable assurance regarding prevention or timely detection of unauthorized acquisition, use, or disposition of the company’s assets that could have a material effect on the financial statements.
Because of its inherent limitations, internal control over financial reporting may not prevent or detect misstatements. Also, projections of any evaluation of effectiveness to future periods are subject to the risk that controls may become inadequate because of changes in conditions, or that the degree of compliance with the policies or procedures may deteriorate.
/s/ KPMG LLP
Nashville, Tennessee
March 13, 2019
March 13, 2019
|
CONSOLIDATED BALANCE SHEETS
|
|
DECEMBER 31, 2018 AND 2017
|
|
(In thousands, except share data)
|
|
|
2018
|
2017
|
||||||
|
ASSETS
|
||||||||
|
Current assets:
|
||||||||
|
Cash and cash equivalents
|
$
|
23,127
|
$
|
15,356
|
||||
|
Accounts receivable, net of allowance of $1,985 in 2018 and $1,456 in 2017
|
151,093
|
104,153
|
||||||
|
Drivers' advances and other receivables, net of allowance of $626 in 2018 and $556 in 2017
|
16,675
|
15,062
|
||||||
|
Inventory and supplies
|
4,067
|
4,232
|
||||||
|
Prepaid expenses
|
11,579
|
8,699
|
||||||
|
Assets held for sale
|
2,559
|
1,444
|
||||||
|
Income taxes receivable
|
1,109
|
11,551
|
||||||
|
Other short-term assets
|
1,435
|
1,817
|
||||||
|
Total current assets
|
211,644
|
162,314
|
||||||
|
|
||||||||
|
Property and equipment, at cost
|
638,770
|
650,988
|
||||||
|
Less: accumulated depreciation and amortization
|
(188,175
|
)
|
(186,916
|
)
|
||||
|
Net property and equipment
|
450,595
|
464,072
|
||||||
|
|
||||||||
|
Goodwill
|
41,598
|
-
|
||||||
|
Other intangibles, net
|
32,538
|
-
|
||||||
|
Other assets, net
|
37,149
|
23,282
|
||||||
|
|
||||||||
|
Total assets
|
$
|
773,524
|
$
|
649,668
|
||||
|
LIABILITIES AND STOCKHOLDERS' EQUITY
|
||||||||
|
Current liabilities:
|
||||||||
|
Checks outstanding in excess of bank balances
|
$
|
1,857
|
$
|
-
|
||||
|
Accounts payable
|
22,101
|
11,857
|
||||||
|
Accrued expenses
|
49,503
|
26,520
|
||||||
|
Current maturities of long-term debt
|
28,710
|
24,596
|
||||||
|
Current portion of capital lease obligations
|
5,374
|
2,962
|
||||||
|
Current portion of insurance and claims accrual
|
19,787
|
15,042
|
||||||
|
Other short-term liabilities
|
-
|
243
|
||||||
|
Total current liabilities
|
127,332
|
81,220
|
||||||
|
|
||||||||
|
Long-term debt
|
166,635
|
164,465
|
||||||
|
Long-term portion of capital lease obligations
|
35,119
|
21,777
|
||||||
|
Insurance and claims accrual
|
22,193
|
21,836
|
||||||
|
Deferred income taxes
|
77,467
|
63,344
|
||||||
|
Other long-term liabilities
|
1,636
|
1,825
|
||||||
|
Total liabilities
|
430,382
|
354,467
|
||||||
|
Commitments and contingent liabilities
|
-
|
-
|
||||||
|
Stockholders' equity:
|
||||||||
|
Class A common stock, $.01 par value; 20,000,000 shares authorized; 16,015,708 shares issued and outstanding as of December 31, 2018; and 15,979,703 shares issued and outstanding as of December 31, 2017
|
171
|
171
|
||||||
|
Class B common stock, $.01 par value; 5,000,000 shares authorized; 2,350,000 shares issued and outstanding
|
24
|
24
|
||||||
|
Additional paid-in-capital
|
142,177
|
137,242
|
||||||
|
Accumulated other comprehensive income
|
204
|
293
|
||||||
|
Retained earnings
|
200,566
|
157,471
|
||||||
|
Total stockholders' equity
|
343,142
|
295,201
|
||||||
|
Total liabilities and stockholders' equity
|
$
|
773,524
|
$
|
649,668
|
||||
The accompanying notes are an integral part of these consolidated financial statements.
CONSOLIDATED STATEMENTS OF OPERATIONS
YEARS ENDED DECEMBER 31, 2018, 2017, AND 2016
YEARS ENDED DECEMBER 31, 2018, 2017, AND 2016
(In thousands, except per share data)
|
|
2018
|
2017
|
2016
|
|||||||||
|
Revenues
|
||||||||||||
|
Freight revenue
|
$
|
779,729
|
$
|
626,809
|
$
|
610,845
|
||||||
|
Fuel surcharge revenue
|
105,726
|
78,198
|
59,806
|
|||||||||
|
Total revenue
|
$
|
885,455
|
$
|
705,007
|
$
|
670,651
|
||||||
|
|
||||||||||||
|
Operating expenses:
|
||||||||||||
|
Salaries, wages, and related expenses
|
304,447
|
241,784
|
234,526
|
|||||||||
|
Fuel expense
|
121,264
|
103,139
|
103,108
|
|||||||||
|
Operations and maintenance
|
55,505
|
48,774
|
45,864
|
|||||||||
|
Revenue equipment rentals and purchased transportation
|
183,645
|
141,954
|
117,472
|
|||||||||
|
Operating taxes and licenses
|
11,831
|
9,878
|
11,712
|
|||||||||
|
Insurance and claims
|
43,333
|
33,155
|
32,596
|
|||||||||
|
Communications and utilities
|
7,061
|
6,938
|
6,057
|
|||||||||
|
General supplies and expenses
|
23,227
|
14,783
|
14,413
|
|||||||||
|
Depreciation and amortization, including gains and losses on disposition of property and equipment
|
76,156
|
76,447
|
72,456
|
|||||||||
|
Total operating expenses
|
826,469
|
676,852
|
638,204
|
|||||||||
|
Operating income
|
58,986
|
28,155
|
32,447
|
|||||||||
|
Interest expense, net
|
8,708
|
8,258
|
8,226
|
|||||||||
|
Income from equity method investment
|
(7,732
|
)
|
(3,400
|
)
|
(3,000
|
)
|
||||||
|
Income before income taxes
|
58,010
|
23,297
|
27,221
|
|||||||||
|
Income tax expense (benefit)
|
15,507
|
(32,142
|
)
|
10,386
|
||||||||
|
Net income
|
$
|
42,503
|
$
|
55,439
|
$
|
16,835
|
||||||
|
|
||||||||||||
|
Income per share:
|
||||||||||||
|
Basic income per share
|
$
|
2.32
|
$
|
3.03
|
$
|
0.93
|
||||||
|
|
||||||||||||
|
Diluted income per share
|
$
|
2.30
|
$
|
3.02
|
$
|
0.92
|
||||||
|
|
||||||||||||
|
Basic weighted average shares outstanding
|
18,340
|
18,279
|
18,182
|
|||||||||
|
|
||||||||||||
|
Diluted weighted average shares outstanding
|
18,469
|
18,372
|
18,266
|
|||||||||
The accompanying notes are an integral part of these consolidated financial statements
CONSOLIDATED STATEMENTS OF COMPREHENSIVE INCOME
FOR THE YEARS ENDED DECEMBER 31, 2018, 2017, AND 2016
(In thousands)
|
|
2018
|
2017
|
2016
|
|||||||||
|
|
||||||||||||
|
Net income
|
$
|
42,503
|
$
|
55,439
|
$
|
16,835
|
||||||
|
|
||||||||||||
|
Other comprehensive (loss) income:
|
||||||||||||
|
|
||||||||||||
|
Unrealized gain on effective portion of cash flow hedges, net of tax of $377, $51, and $2,696 in 2018, 2017 and 2016, respectively
|
993
|
149
|
4,307
|
|||||||||
|
|
||||||||||||
|
Reclassification of cash flow hedge (gains) losses into statement of operations, net of tax of $408, $1,719, and $6,634 in 2018, 2017 and 2016, respectively
|
(1,076
|
)
|
2,784
|
10,597
|
||||||||
|
|
||||||||||||
|
Unrealized holding loss on investments classified as available-for-sale
|
(6
|
)
|
-
|
-
|
||||||||
|
Total other comprehensive (loss) income
|
(89
|
)
|
2,933
|
14,904
|
||||||||
|
|
||||||||||||
|
Comprehensive income
|
$
|
42,414
|
$
|
58,372
|
$
|
31,739
|
||||||
The accompanying notes are an integral part of these consolidated financial statements.
CONSOLIDATED STATEMENTS OF STOCKHOLDERS' EQUITY
FOR THE YEARS ENDED DECEMBER 31, 2018, 2017, AND 2016
(In thousands)
|
|
Accumulated
|
|||||||||||||||||||||||||||
|
|
Additional
|
Other
|
Total
|
|||||||||||||||||||||||||
|
|
Common Stock
|
Paid-In
|
Treasury
|
Comprehensive
|
Retained
|
Stockholders
|
||||||||||||||||||||||
|
|
Class A
|
Class B
|
Capital
|
Stock
|
Income
|
Earnings
|
Equity
|
|||||||||||||||||||||
|
|
||||||||||||||||||||||||||||
|
Balances at December 31, 2015
|
$
|
170
|
$
|
24
|
$
|
139,968
|
$
|
(3,408
|
)
|
$
|
(17,544
|
)
|
$
|
82,950
|
$
|
202,160
|
||||||||||||
|
Net income
|
-
|
-
|
-
|
-
|
-
|
16,835
|
16,835
|
|||||||||||||||||||||
|
Other comprehensive income
|
-
|
-
|
-
|
-
|
14,904
|
-
|
14,904
|
|||||||||||||||||||||
|
Effect of adoption of ASU 2016-09
|
-
|
-
|
-
|
-
|
-
|
2,247
|
2,247
|
|||||||||||||||||||||
|
Stock-based employee compensation expense
|
-
|
-
|
1,178
|
-
|
-
|
-
|
1,178
|
|||||||||||||||||||||
|
Exercise of stock options
|
-
|
-
|
(27
|
)
|
59
|
-
|
-
|
32
|
||||||||||||||||||||
|
Issuance of restricted shares, net
|
-
|
-
|
(3,207
|
)
|
2,265
|
-
|
-
|
(942
|
)
|
|||||||||||||||||||
|
Balances at December 31, 2016
|
$
|
170
|
$
|
24
|
$
|
137,912
|
$
|
(1,084
|
)
|
$
|
(2,640
|
)
|
$
|
102,032
|
$
|
236,414
|
||||||||||||
|
Net income
|
-
|
-
|
-
|
-
|
-
|
55,439
|
55,439
|
|||||||||||||||||||||
|
Other comprehensive income
|
-
|
-
|
-
|
-
|
2,933
|
-
|
2,933
|
|||||||||||||||||||||
|
Stock-based employee compensation expense
|
-
|
-
|
951
|
-
|
-
|
-
|
951
|
|||||||||||||||||||||
|
Issuance of restricted shares, net
|
1
|
-
|
(1,621
|
)
|
1,084
|
-
|
-
|
(536
|
)
|
|||||||||||||||||||
|
Balances at December 31, 2017
|
$
|
171
|
$
|
24
|
$
|
137,242
|
$
|
-
|
$
|
293
|
$
|
157,471
|
$
|
295,201
|
||||||||||||||
|
Net income
|
-
|
-
|
-
|
-
|
-
|
42,503
|
42,503
|
|||||||||||||||||||||
|
Effect of adoption of ASU 2014-09
|
-
|
-
|
-
|
-
|
-
|
592
|
592
|
|||||||||||||||||||||
|
Other comprehensive income
|
-
|
-
|
-
|
-
|
(89
|
)
|
-
|
(89
|
)
|
|||||||||||||||||||
|
Stock-based employee compensation expense
|
-
|
-
|
4,802
|
-
|
-
|
-
|
4,802
|
|||||||||||||||||||||
|
Issuance of restricted shares, net
|
-
|
-
|
133
|
-
|
-
|
-
|
133
|
|||||||||||||||||||||
|
Balances at December 31, 2018
|
$
|
171
|
$
|
24
|
$
|
142,177
|
$
|
-
|
$
|
204
|
$
|
200,566
|
$
|
343,142
|
||||||||||||||
The accompanying notes are an integral part of these consolidated financial statements.
CONSOLIDATED STATEMENTS OF CASH FLOWS
FOR THE YEARS ENDED DECEMBER 31, 2018, 2017, AND 2016
(In thousands)
|
|
2018
|
2017
|
2016
|
|||||||||
|
Cash flows from operating activities:
|
||||||||||||
|
Net income
|
$
|
42,503
|
$
|
55,439
|
$
|
16,835
|
||||||
|
Adjustments to reconcile net income to net cash provided by operating activities:
|
||||||||||||
|
Provision (reversal) for losses on accounts receivable
|
507
|
454
|
(241
|
)
|
||||||||
|
Reversal of gain on sales to equity method investee
|
(189
|
)
|
(179
|
)
|
(207
|
)
|
||||||
|
Depreciation and amortization
|
75,859
|
72,422
|
71,647
|
|||||||||
|
Amortization of deferred financing fees
|
148
|
242
|
293
|
|||||||||
|
Deferred income tax expense (benefit)
|
13,840
|
(23,023
|
)
|
(922
|
)
|
|||||||
|
Income tax (expense) benefit arising from restricted share vesting and stock options exercised
|
(44
|
)
|
457
|
1,108
|
||||||||
|
Stock-based compensation expense
|
5,177
|
1,201
|
1,378
|
|||||||||
|
Equity in income of affiliate
|
(7,732
|
)
|
(3,400
|
)
|
(3,000
|
)
|
||||||
|
Return on investment in affiliated company
|
1,960
|
1,960
|
1,470
|
|||||||||
|
Loss (gain) on disposition of property and equipment
|
298
|
4,024
|
808
|
|||||||||
|
Return on investment in available-for-sale securities
|
(13
|
)
|
-
|
-
|
||||||||
|
Changes in operating assets and liabilities:
|
||||||||||||
|
Receivables and advances
|
(27,199
|
)
|
(23,670
|
)
|
21,207
|
|||||||
|
Prepaid expenses and other assets
|
(2,127
|
)
|
1,768
|
(1,464
|
)
|
|||||||
|
Inventory and supplies
|
168
|
(252
|
)
|
24
|
||||||||
|
Insurance and claims accrual
|
2,412
|
(1,165
|
)
|
(1,390
|
)
|
|||||||
|
Accounts payable and accrued expenses
|
19,232
|
(3,425
|
)
|
(5,116
|
)
|
|||||||
|
Net cash flows provided by operating activities
|
124,800
|
82,853
|
102,430
|
|||||||||
|
|
||||||||||||
|
Cash flows from investing activities:
|
||||||||||||
|
Acquisition of Landair Holdings, Inc., net of cash acquired
|
(105,946
|
)
|
-
|
-
|
||||||||
|
Purchase of available-for-sale securities
|
(1,496
|
)
|
-
|
-
|
||||||||
|
Acquisition of property and equipment
|
(75,142
|
)
|
(110,802
|
)
|
(112,794
|
)
|
||||||
|
Proceeds from disposition of property and equipment
|
61,687
|
48,749
|
65,507
|
|||||||||
|
Net cash flows used by investing activities
|
(120,897
|
)
|
(62,053
|
)
|
(47,287
|
)
|
||||||
|
|
||||||||||||
|
Cash flows from financing activities:
|
||||||||||||
|
Change in checks outstanding in excess of bank balances
|
1,857
|
(189
|
)
|
(4,509
|
)
|
|||||||
|
Proceeds from issuance of notes payable
|
100,811
|
121,210
|
69,432
|
|||||||||
|
Proceeds from exercise of stock options
|
-
|
-
|
32
|
|||||||||
|
Repayments of notes payable
|
(89,569
|
)
|
(122,676
|
)
|
(120,630
|
)
|
||||||
|
Repayments of capital lease obligations
|
(3,883
|
)
|
(7,416
|
)
|
(4,140
|
)
|
||||||
|
Proceeds under revolving credit facility
|
1,598,213
|
1,271,669
|
1,023,978
|
|||||||||
|
Repayments under revolving credit facility
|
(1,603,309
|
)
|
(1,274,847
|
)
|
(1,014,796
|
)
|
||||||
|
Payment of minimum tax withholdings on stock compensation
|
(242
|
)
|
(785
|
)
|
(1,142
|
)
|
||||||
|
Debt refinancing costs
|
(10
|
)
|
(160
|
)
|
(108
|
)
|
||||||
|
Net cash flows provided by (used in) financing activities
|
3,868
|
(13,194
|
)
|
(51,883
|
)
|
|||||||
|
|
||||||||||||
|
Net change in cash and cash equivalents
|
7,771
|
7,606
|
3,260
|
|||||||||
|
|
||||||||||||
|
Cash and cash equivalents at beginning of year
|
15,356
|
7,750
|
4,490
|
|||||||||
|
Cash and cash equivalents at end of year
|
$
|
23,127
|
$
|
15,356
|
$
|
7,750
|
||||||
|
|
||||||||||||
|
Supplemental disclosure of cash flow information:
|
||||||||||||
|
Cash paid (received) during the year for:
|
||||||||||||
|
Interest, net of capitalized interest
|
$
|
8,568
|
$
|
8,268
|
$
|
8,453
|
||||||
|
Income taxes
|
$
|
(5,388
|
)
|
$
|
(2,222
|
)
|
$
|
6,412
|
||||
|
Equipment purchased under capital leases
|
$
|
19,638
|
$
|
9,953
|
$
|
11,765
|
||||||
The accompanying notes are an integral part of these consolidated financial statements.
NOTES TO CONSOLIDATED FINANCIAL STATEMENTS
DECEMBER 31, 2018, 2017, AND 2016
|
1.
|
SUMMARY OF SIGNIFICANT ACCOUNTING POLICIES
|
Nature of Business and Segments
Covenant Transportation Group, Inc., a Nevada holding company, together with its wholly owned subsidiaries offers truckload transportation and brokerage services to customers throughout the continental United States.
We have two reportable segments, our truckload services ("Truckload") and Managed Freight which provides freight brokerage and logistics services.
The Truckload segment consists of four service offerings that are aggregated because they have similar economic characteristics and meet the aggregation criteria. The four service offerings that comprise our Truckload segment are as follows: (i) Expedited, provided primarily by Covenant Transport, our historical flagship operation; (ii) Dedicated, provided by all of our operating fleets; (iii) Refrigerated, provided primarily through our Southern Refrigerated Transport, Inc. ("SRT") subsidiary; and (iv) over-the-road ("OTR"), provided primarily by our Landair Transport, Inc. subsidiary.
In addition, our Managed Freight segment has service offerings ancillary to our Truckload services, including: freight brokerage, transportation management services ("TMS"), and shuttle and switching services. The operations consist of several operating segments, which are aggregated due to similar margins and customers. Included within Managed Freight are our accounts receivable factoring and warehousing businesses, neither of which meets the quantitative or qualitative reporting thresholds individually or in the aggregate.
The following table summarizes our revenue by our two reportable segments, Truckload and Managed Freight, disaggregated to the operating fleet level as used by our chief operating decision maker in making decisions regarding allocation of resources, etc., organized first by reportable segment (i.e. Truckload and Managed Freight) and then by operating fleet for the year ended
December 31, 2018:
|
(in thousands)
|
Twelve Months Ended
|
|||||||||||
|
|
December 31,
|
|||||||||||
|
|
2018
|
2017
|
2016
|
|||||||||
|
Total Revenues:
|
||||||||||||
|
|
||||||||||||
|
Truckload Segment:
|
||||||||||||
|
Expedited
|
$
|
334,118
|
$
|
332,930
|
$
|
370,689
|
||||||
|
Dedicated
|
247,877
|
144,845
|
60,154
|
|||||||||
|
Refrigerated
|
135,189
|
135,059
|
170,383
|
|||||||||
|
OTR
|
9,862
|
-
|
-
|
|||||||||
|
Truckload Revenues
|
727,046
|
612,834
|
601,226
|
|||||||||
|
|
||||||||||||
|
Managed Freight Segment:
|
||||||||||||
|
Brokerage
|
114,827
|
89,042
|
66,867
|
|||||||||
|
Warehouse
|
16,480
|
-
|
-
|
|||||||||
|
TMS
|
14,940
|
-
|
-
|
|||||||||
|
Shuttle & Switching
|
7,100
|
-
|
-
|
|||||||||
|
Factoring
|
5,062
|
3,131
|
2,558
|
|||||||||
|
Managed Freight Revenues
|
158,409
|
92,173
|
69,425
|
|||||||||
|
|
||||||||||||
|
Total
|
$
|
885,455
|
$
|
705,007
|
$
|
670,651
|
||||||
Principles of Consolidation
The consolidated financial statements include the accounts of Covenant Transportation Group, Inc., a holding company incorporated in the state of Nevada in 1994, and its wholly owned subsidiaries: Covenant Transport, Inc., a Tennessee corporation; Southern Refrigerated Transport, Inc., an Arkansas corporation; Star Transportation, Inc., a Tennessee corporation, each d/b/a Covenant Transport Services; Covenant Transport Solutions, LLC., a Nevada limited liablity company, d/b/a Transport Financial Services; Covenant Logistics, Inc., a Nevada corporation; Covenant Asset Management, LLC., a Nevada limited liability corporation; CTG Leasing Company, a Nevada corporation; IQS Insurance Risk Retention Group, Inc., a Vermont corporation; Driven Analytic Solutions, LLC, a Nevada limited liability company; Heritage Insurance, Inc., a Tennessee corporation; Landair Holdings, Inc., a Tennessee corporation; Landair Transport, Inc., a Tennessee corporation; Landair Logistics, Inc., a Tennessee corporation; Landair Leasing, Inc., a Tennessee corporation; and Transport Management Services, LLC, a Tennessee limited liability company.
References in this report to "it," "we," "us," "our," the "Company," and similar expressions refer to Covenant Transportation Group, Inc. and its subsidiaries. All significant intercompany balances and transactions have been eliminated in consolidation.
Investment in Transport Enterprise Leasing, LLC
Transport Enterprise Leasing, LLC ("TEL") is a tractor and trailer equipment leasing company and used equipment reseller. We evaluated our investment in TEL to determine whether it should be recorded on a consolidated basis. Our percentage of ownership interest (49%), an evaluation of control, and whether a variable interest entity ("VIE") existed were all considered in our consolidation assessment. The analysis provided that we do not control TEL and that TEL is not deemed a VIE. We have accounted for our investment in TEL using the equity method of accounting given our 49% ownership interest and ability to exercise significant influence over operating and financial policies. Under the equity method, the cost of our investment is adjusted for our share of equity in the earnings of TEL and reduced by distributions received and our proportionate share of TEL's net income is included in our earnings.
On a periodic basis, we assess whether there are any indicators that the fair value of our investment in TEL may be impaired. The investment is impaired only if the estimate of the fair value of the investment is less than the carrying value of the investment, and such decline in value is deemed to be other than temporary. To the extent impairment has occurred, the loss would be measured as the excess of the carrying amount of the investment over the fair value of the investment. As a result of TEL's earnings, no impairment indicators were noted that would provide for impairment of our investment.
Revenue Recognition
Revenue, drivers' wages, and other direct operating expenses generated by our Truckload reportable segment are recognized proportionally as the transportation service is performed based on the percentage of miles completed as of the period end, as opposed to recognizing revenue upon the completion of the load, which was our historic practice prior to the adoption of ASU 2014-09 on January 1, 2018. Revenue is recognized on a gross basis at amounts charged to our customers because we control and are primarily responsible for the fulfillment of the promised service. Revenue includes transportation revenue, fuel surcharges, loading and unloading activities, equipment detention, and other accessorial services.
Revenue generated by our Managed Freight segment is recognized upon completion of the services provided. Revenue is recorded on a gross basis, without deducting third party purchased transportation costs, as we act as a principal with substantial risks as primary obligor, except for transactions whereby equipment from our Truckload segment perform the related services, which we record on a net basis in accordance with the related authoritative guidance. Managed Freight revenue includes $5.0 million, $3.1 million, and $2.6 million of revenue in 2018, 2017, and 2016, respectively, related to an accounts receivable factoring business started in 2013 to supplement several aspects of our non-asset operations, as well as $23.6 million of revenue in 2018 for a warehousing business, which is part of the Landair operation and thus was not part of 2017 or 2016 revenues. Included in Truckload and Managed Freight revenue during the year ended
December 31, 2018 is $3.9 million and $0.9 million, respectively, classified as lease revenue resulting from embedded leases for certain tractors and warehouse space. Revenue for the factoring business is recognized on a net basis after giving effect to receivables payments we make to the factoring client, given we are acting as an agent and are not the primary generator of the factored receivables in these transactions. Revenue for the warehousing business is generally recognized as the service is performed, based upon a weekly rate.
Estimates
The preparation of financial statements in conformity with accounting principles generally accepted in the United States of America requires us to make decisions based upon estimates, assumptions, and factors we consider as relevant to the circumstances. Such decisions include the selection of applicable accounting principles and the use of judgment in their application, the results of which impact reported amounts and disclosures. Changes in future economic conditions or other business circumstances may affect the outcomes of our estimates and assumptions. Accordingly, actual results could differ from those anticipated.
Cash and Cash Equivalents
We consider all highly liquid investments with a maturity of three months or less at acquisition to be cash equivalents. Additionally, we are also subject to concentrations of credit risk related to deposits in banks in excess of the Federal Deposit Insurance Corporation limits.
Accounts Receivable and Concentration of Credit Risk
We extend credit to our customers in the normal course of business. We perform ongoing credit evaluations and generally do not require collateral. Trade accounts receivable are recorded at their invoiced amounts, net of allowance for doubtful accounts. We evaluate the adequacy of our allowance for doubtful accounts quarterly. Accounts outstanding longer than contractual payment terms are considered past due and are reviewed individually for collectability. We maintain reserves for potential credit losses based upon its loss history and specific receivables aging analysis. Receivable balances are written off when collection is deemed unlikely.
Accounts receivable are comprised of a diversified customer base that results in a lack of concentration of credit risk. During 2018, 2017, and 2016, our top ten customers generated
49%,
49%, and
53% of total revenue, respectively. In 2018 and 2016, one customer accounted for more than 10% of our consolidated revenue in each year. In 2017, there were two such customers. The carrying amount reported in the consolidated balance sheet for accounts receivable approximates fair value based on the fact that the receivables collection averaged approximately
32 and
33 days in 2018 and 2017, respectively.
Included in accounts receivable is
$53.6 million and
$31.9 million of factoring receivables at December 31, 2018 and 2017, respectively, net of allowances for bad debts of
$0.4 million and
$0.2 million in those years. We advance approximately 85% to 95% of each receivable factored and retain the remainder as collateral for collection issues that might arise. The retained amounts are returned to the clients after the related receivable has been collected, net of interest and fees on the amount we advanced. At
December 31, 2018, the retained amounts related to factored receivables totaled
$1.9 million and were included in accounts payable in the consolidated balance sheet. Our clients are smaller trucking companies that factor their receivables to us for a fee to facilitate faster cash flow. We evaluate each client's customer base under predefined criteria. The carrying value of the factored receivables approximates the fair value, as the receivables are generally repaid directly to us by the client's customer within 30–40 days due to the combination of the short-term nature of the financing transaction and the underlying quality of the receivables.
The following table provides a summary (in thousands) of the activity in the accounts for 2018, 2017, and 2016:
|
Years ended December 31:
|
Beginning balance January 1,
|
Additional provisions to (reversal of) allowance
|
Write-offs and other adjustments
|
Ending balance December 31,
|
||||||||||||
|
|
||||||||||||||||
|
2018
|
$
|
1,456
|
$
|
507
|
$
|
22
|
$
|
1,985
|
||||||||
|
|
||||||||||||||||
|
2017
|
$
|
1,345
|
$
|
454
|
$
|
(343
|
)
|
$
|
1,456
|
|||||||
|
|
||||||||||||||||
|
2016
|
$
|
1,857
|
$
|
(241
|
)
|
$
|
(271
|
)
|
$
|
1,345
|
||||||
Inventories and Supplies
Inventories and supplies consist of parts, tires, fuel, and supplies. Tires on new revenue equipment are capitalized as a component of the related equipment cost when the tractor or trailer is placed in service and recovered through depreciation over the life of the vehicle. Replacement tires and parts on hand at year end are recorded at the lower of cost or net realizable value with cost determined using the first-in, first-out (FIFO) method. Replacement tires are expensed when placed in service.
Assets Held for Sale
Assets held for sale include property and revenue equipment no longer utilized in continuing operations which are available and held for sale. Assets held for sale are no longer subject to depreciation, and are recorded at the lower of depreciated book value or fair market value less selling costs. We periodically review the carrying value of these assets for possible impairment. We expect to sell these assets within twelve months.
Property and Equipment
Property and equipment is stated at cost less accumulated depreciation. Depreciation for book purposes is determined using the straight-line method over the estimated useful lives of the assets. Depreciation of revenue equipment is our largest item of depreciation. We generally depreciate new tractors (excluding day cabs) over five years to salvage values of approximately 15% of their cost. We generally depreciate new trailers over seven years for refrigerated trailers and ten years for dry van trailers to salvage values of approximately 25% of their cost. We annually review the reasonableness of our estimates regarding useful lives and salvage values of our revenue equipment and other long-lived assets based upon, among other things, our experience with similar assets, conditions in the used revenue equipment market, and prevailing industry practice. Changes in the useful life or salvage value estimates, or fluctuations in market values that are not reflected in our estimates, could have a material effect on our results of operations. Gains and losses on the disposal of revenue equipment are included in depreciation expense in the consolidated statements of operations.
We lease certain revenue equipment under capital leases with terms of approximately
60 to 84 months. Amortization of leased assets is included in depreciation and amortization expense.
Although a portion of our tractors are protected by non-binding indicative trade-in values or binding trade-back agreements with the manufacturers, substantially all of our owned trailers are subject to fluctuations in market prices for used revenue equipment. Moreover, our trade-back agreements are contingent upon reaching acceptable terms for the purchase of new equipment. Declines in the price of used revenue equipment or failure to reach agreement for the purchase of new tractors with the manufacturers issuing trade-back agreements could result in impairment of, or losses on the sale of, revenue equipment.
Impairment of Long-Lived Assets
Pursuant to applicable accounting standards, revenue equipment and other long-lived assets are tested for impairment whenever an event occurs that indicates an impairment may exist. Expected future cash flows are used to analyze whether an impairment has occurred. If the sum of expected undiscounted cash flows is less than the carrying value of the long-lived asset, then an impairment loss is recognized. We measure the impairment loss by comparing the fair value of the asset to its carrying value. Fair value is determined based on a discounted cash flow analysis or the appraised value of the assets, as appropriate.
Goodwill and Other Intangible Assets
We classify intangible assets into two categories: (i) intangible assets with finite lives subject to amortization and (ii) goodwill. As a result of the Landair Acquisition, we have goodwill of
$41.6 million on our consolidated balance sheet for the year ended
December 31, 2018, while we had
none for the year ended
December 31, 2017. We test goodwill for impairment annually and whenever events or changes in circumstances indicate that impairment may have occurred. We test intangible assets with finite lives for impairment if conditions exist that indicate the carrying value may not be recoverable. Such conditions may include an economic downturn in a geographic market or a change in the assessment of future operations. We record an impairment charge when the carrying value of the finite lived intangible asset is not recoverable by the cash flows generated from the use of the asset.
We determine the useful lives of our identifiable intangible assets after considering the specific facts and circumstances related to each intangible asset. Factors we consider when determining useful lives include the contractual term of any agreement, the history of the asset, our long-term strategy for the use of the asset, any laws or other local regulations which could impact the useful life of the asset, and other economic factors, including competition and specific market conditions. Intangible assets that are deemed to have finite lives are amortized, generally on a straight-line basis, over their useful lives, ranging from
5 to 15 years. We have
$32.5 million of identifiable intangible assets on our consolidated balance sheets at December 31, 2018, net of accumulated amortization, and
none for the year ended December 31, 2017.
Insurance and Other Claims
The primary claims arising against us consist of auto liability (personal injury and property damage), workers' compensation, cargo, commercial liability, and employee medical expenses. Our insurance program involves self-insurance with the following risk retention levels (before giving effect to any commutation of an auto liability policy):
|
|
●
|
auto liability -
$1.0 million
|
|
|
●
|
workers' compensation - $1.3 million
|
|
|
●
|
cargo - $0.3 million
|
|
|
●
|
employee medical - $0.4 million
|
|
|
●
|
physical damage - 100%
|
Due to our significant self-insured retention amounts, we have exposure to fluctuations in the number and severity of claims and to variations between our estimated and actual ultimate payouts. We accrue the estimated cost of the uninsured portion of pending claims and an estimate for allocated loss adjustment expenses including legal and other direct costs associated with a claim. Estimates require judgments concerning the nature and severity of the claim, historical trends, advice from third-party administrators and insurers, the size of any potential damage award based on factors such as the specific facts of individual cases, the jurisdictions involved, the prospect of punitive damages, future medical costs, and inflation estimates of future claims development, and the legal and other costs to settle or defend the claims. We have significant exposure to fluctuations in the number and severity of claims. If there is an increase in the frequency and severity of claims, or we are required to accrue or pay additional amounts if the claims prove to be more severe than originally assessed, or any of the claims would exceed the limits of our insurance coverage, our profitability could be adversely affected.
In addition to estimates within our self-insured retention layers, we also must make judgments concerning claims where we have third party insurance and for claims outside our coverage limits. Upon settling claims and expenses associated with claims where we have third party coverage, we are generally required to initially fund payment to the claimant and seek reimbursement from the insurer. Receivables from insurers for claims and expenses we have paid on behalf of insurers were $3.0 million and $1.1 million at December 31, 2018 and 2017, respectively, and are included in drivers' advances and other receivables on our consolidated balance sheet. Additionally, we accrue claims above our self-insured retention and record a corresponding receivable for amounts we expect to collect from insurers upon settlement of such claims. We have $5.1 million and $2.1 million at December 31, 2018 and 2017, respectively, as a receivable in other assets and as a corresponding accrual in the long-term portion of insurance and claims accruals on our consolidated balance sheet for claims above our self-insured retention for which we believe it is reasonably assured that the insurers will provide their portion of such claims. We evaluate collectability of the receivables based on the credit worthiness and surplus of the insurers, along with our prior experience and contractual terms with each. If any claim occurrence were to exceed our aggregate coverage limits, we would have to accrue for the excess amount. Our critical estimates include evaluating whether a claim may exceed such limits and, if so, by how much. If one or more claims were to exceed our then effective coverage limits, our financial condition and results of operations could be materially and adversely affected.
We also make judgments regarding the ultimate benefit versus risk of commuting certain periods within our auto liability policy. If we commute a policy, we assume 100% risk for covered claims in exchange for a policy refund.
Effective April 2018, we entered into new auto liability policies with a three-year term. The policy includes a limit for a single loss of $9.0 million, an aggregate of $18.0 million for each policy year, and a $30.0 million aggregate for the 36 month term ended March 31, 2021. The policy included a policy release premium refund or commutation option of up to $14.0 million, less any future amounts paid on claims by the insurer. A decision with respect to commutation of the policy could be made before April 1, 2021. Additionally, our prior auto liability policy that ran from October 1, 2014 through March 31, 2018, included a commutation provision if we were to commute the policy for the entire 42 months. Based on claims paid to date the policy premium release refund could range from zero to $4.9 million, depending on actual claims settlements in the future. Management cannot predict whether or not future claims or the development of existing claims will justify a commutation of either policy period, and accordingly, no related amounts were recorded at December 31, 2018.
Interest
We capitalize interest on major projects during construction. Interest is capitalized based on the average interest rate on related debt. Capitalized interest was
less than $0.1 million in 2018, 2017, and 2016.
Fair Value of Financial Instruments
Our financial instruments consist primarily of cash and cash equivalents, accounts receivable, available-for-sale securities, accounts payable, debt, and interest rate swaps. The carrying amount of cash and cash equivalents, accounts receivable, accounts payable, and current debt approximates their fair value because of the short-term maturity of these instruments. The carrying value of the factored receivables approximates the fair value, as the receivables are generally repaid directly to us by the client's customer within 30–40 days due to the combination of the short-term nature of the financing transaction and the underlying quality of the receivables. Interest rates that are currently available to us for issuance of long-term debt with similar terms and remaining maturities are used to estimate the fair value of our long-term debt, which primarily consists of revenue equipment installment notes. The fair value of our revenue equipment installment notes approximated the carrying value at December 31, 2018, as the weighted average interest rate on these notes approximates the market rate for similar debt. Borrowings under our revolving Credit Facility approximate fair value due to the variable interest rate on the facility. Additionally, certain investments intended to serve the purposes of capital preservation and to fund insurance losses are designated as available-for-sale as discussed in Note 14 and are valued based on quoted prices in active markets. The fair value of our interest rate swap agreements is determined using the market-standard methodology of netting the discounted future fixed-cash payments and the discounted expected variable-cash receipts. The variable-cash receipts are based on an expectation of future interest rates (forward curves) derived from observable market interest rate curves. These analyses reflect the contractual terms of the swap, including the period to maturity, and use observable market-based inputs, including interest rate curves and implied volatilities. The fair value calculation also includes an amount for risk of non-performance of our counterparties using "significant unobservable inputs" such as estimates of current credit spreads to evaluate the likelihood of default, which we have determined to be insignificant to the overall fair value of our interest rate swap agreements.
Income Taxes
Deferred tax assets and liabilities are recognized for the future tax consequences attributable to differences between the financial statement carrying amounts of existing assets and liabilities and their respective tax basis. Deferred tax assets and liabilities are measured using enacted tax rates expected to apply to taxable income in the years in which those temporary differences are expected to be recovered or settled. The effect on deferred tax assets and liabilities of a change in tax rates is recognized in income in the period that includes the enactment date. We have reflected the net liability after offsetting our deferred tax assets and liabilities in the deferred income taxes line in the accompanying consolidated balance sheets. We believe the future tax deductions will be realized principally through future reversals of existing taxable temporary differences and future taxable income, except for when a valuation allowance has been provided as discussed in Note 8.
In the ordinary course of business there is inherent uncertainty in quantifying our income tax positions. We assess our income tax positions and record tax benefits for all years subject to examination based upon management's evaluation of the facts, circumstances, and information available at the reporting dates. For those tax positions where it is more likely than not that a tax benefit will be sustained, we have recorded the largest amount of tax benefit with a greater than 50% likelihood of being realized upon ultimate settlement with a taxing authority that has full knowledge of all relevant information. For those income tax positions where it is not more likely than not that a tax benefit will be sustained, no tax benefit has been recognized in the financial statements. Potential accrued interest and penalties related to unrecognized tax benefits are recognized as a component of income tax expense.
Our policy is to recognize income tax benefit arising from the exercise of stock options and restricted share vesting based on the ordering provisions of the tax law as prescribed by the Internal Revenue Code, including indirect tax effects, if any.
Lease Accounting and Off-Balance Sheet Transactions
We issue residual value guarantees in connection with the operating leases we enter into for certain of our revenue equipment. These leases provide that if we do not purchase the leased equipment from the lessor at the end of the lease term, then we are liable to the lessor for an amount equal to the shortage (if any) between the proceeds from the sale of the equipment and an agreed value. To the extent the expected value at the lease termination date is lower than the residual value guarantee, we would accrue for the difference over the remaining lease term. We believe that proceeds from the sale of equipment under operating leases would equal or exceed the payment obligation on substantially all operating leases. The estimated values at lease termination involve management judgments. As leases are entered into, determination as to the classification as an operating or capital lease involves management judgments on residual values and useful lives.
Capital Structure
The shares of Class A and B common stock are substantially identical except that the Class B shares are entitled to two votes per share and immediately convert to Class A shares if beneficially owned by anyone other than our Chief Executive Officer or certain members of his immediate family, while Class A shares are entitled to one vote per share. The terms of any future issuances of preferred shares will be set by our Board of Directors.
Income Per Share
Basic income per share excludes dilution and is computed by dividing earnings available to common stockholders by the weighted-average number of common shares outstanding for the period. Diluted income per share reflects the dilution that could occur if securities or other contracts to issue common stock were exercised or converted into common stock or resulted in the issuance of common stock that then shared in our earnings. The calculation of diluted earnings per share includes approximately
0.1 million unvested shares. A de minimis number of unvested shares have been excluded from the calculation of diluted earnings per share since the effect of any assumed exercise of the related awards would be anti-dilutive for the years ended December 31,
2018,
2017, and
2016, respectively. Income per share is the same for both Class A and Class B shares.
The following table sets forth the calculation of net income per share included in the consolidated statements of operations for each of the three years ended December 31:
|
(in thousands except per share data)
|
||||||||||||
|
|
2018
|
2017
|
2016
|
|||||||||
|
Numerator:
|
||||||||||||
|
|
||||||||||||
|
Net income
|
$
|
42,503
|
$
|
55,439
|
$
|
16,835
|
||||||
|
|
||||||||||||
|
Denominator:
|
||||||||||||
|
|
||||||||||||
|
Denominator for basic income per share – weighted-average shares
|
18,340
|
18,279
|
18,182
|
|||||||||
|
Effect of dilutive securities:
|
||||||||||||
|
Equivalent shares issuable upon conversion of unvested restricted shares
|
129
|
93
|
84
|
|||||||||
|
Denominator for diluted income per share adjusted weighted-average shares and assumed conversions
|
18,469
|
18,372
|
18,266
|
|||||||||
|
|
||||||||||||
|
Net income per share:
|
||||||||||||
|
Basic income per share
|
$
|
2.32
|
$
|
3.03
|
$
|
0.93
|
||||||
|
Diluted income per share
|
$
|
2.30
|
$
|
3.02
|
$
|
0.92
|
||||||
Stock-Based Employee Compensation
We issue several types of stock-based compensation, including awards that vest based on service and performance conditions or a combination of the conditions. Performance-based awards vest contingent upon meeting certain performance criteria established by the Compensation Committee of the Board of Directors. All awards require future service. For performance-based awards, determining the appropriate amount to expense in each period is based on likelihood and timing of achieving the stated targets for performance-based awards and requires judgment, including forecasting future financial results. The estimates are revised periodically based on the probability and timing of achieving the required performance and adjustments are made as appropriate. Awards that are only subject to time vesting provisions are amortized using the straight-line method.
Recent Accounting Pronouncements
Accounting Standards adopted
In May 2014 the Financial Accounting Standards Board (“FASB”) issued Accounting Standards Update ("ASU") 2014-09, which supersedes virtually all existing revenue guidance. The new standard introduces a five-step model to determine when and how revenue is recognized. The premise of the new model is that an entity recognizes revenue to depict the transfer of promised goods or services to customers in an amount that reflects the consideration to which the entity expects to be entitled in exchange for those goods or services. The guidance also requires enhanced disclosures regarding the nature, timing and uncertainty of revenue and cash flows arising from an entity’s contracts with customers. The new standard became effective for us for our annual and interim reporting periods beginning January 1, 2018. The guidance permits the use of either a full retrospective or modified retrospective adoption approach with a cumulative effect adjustment recorded in either scenario as necessary upon transition.
As permitted by the guidance, we elected the modified retrospective approach and thus recognized the cumulative effect of adoption of $0.6 million, net of tax, as a positive adjustment to retained earnings in the first quarter of 2018 as a result of the initial recording of in process revenue and associated direct expenses.
Based on our review of our customer shipping arrangements and the related guidance, we have concluded that we will recognize revenue from loads proportionally as the transportation service is performed based on the percentage of miles completed as of the period end, as opposed to recognizing revenue upon the completion of the load, which was our historic practice. Revenue will be recognized on a gross basis at amounts charged to our customers because we control and are primarily responsible for the fulfillment of the promised service. Our recognition of revenue under the new standard approximates our recognition of revenue under the prior standard, as there will generally be a consistent amount of freight in process at the beginning and end of the period; however, seasonality and the day on which the period ends may cause minor differences.
The following table summarizes the impacts of adopting ASC 606 on the Company’s consolidated financial statements for the year ended December 31, 2018.
|
|
Twelve Months Ended December 31, 2018
|
|||||||||||
|
|
Balances without
|
|||||||||||
|
|
adoption of Topic
|
|||||||||||
|
Financial Statement Line Item (in thousands)
|
As reported
|
Adjustments
|
606 | |||||||||
|
Consolidated Balance Sheet
|
||||||||||||
|
Accounts receivable, net of allowances
|
$
|
151,093
|
$
|
(1,244
|
)
|
$
|
149,849
|
|||||
|
Total assets
|
773,524
|
(1,244
|
)
|
772,280
|
||||||||
|
Accrued expenses
|
49,503
|
(277
|
)
|
49,226
|
||||||||
|
Deferred income taxes
|
77,467
|
(266
|
)
|
77,201
|
||||||||
|
Total liabilities
|
430,382
|
(543
|
)
|
429,839
|
||||||||
|
Retained earnings
|
200,566
|
(701
|
)
|
199,865
|
||||||||
|
Total stockholders’ equity
|
343,142
|
(701
|
)
|
342,441
|
||||||||
|
Total liabilities and stockholders’ equity
|
773,524
|
(1,244
|
)
|
772,280
|
||||||||
|
Consolidated Statement of Operations
|
||||||||||||
|
Freight revenue
|
779,729
|
(234
|
)
|
779,495
|
||||||||
|
Total revenue
|
885,455
|
(234
|
)
|
885,221
|
||||||||
|
Salaries, wages and related expenses
|
304,447
|
13
|
304,460
|
|||||||||
|
Revenue equipment rentals and purchased transportation
|
183,645
|
(95
|
)
|
183,550
|
||||||||
|
Total operating expenses
|
826,469
|
(82
|
)
|
826,387
|
||||||||
|
Income tax expense (benefit)
|
15,507
|
(41
|
)
|
15,466
|
||||||||
|
Net income
|
42,503
|
(111
|
)
|
42,392
|
||||||||
|
Consolidated Statement of Comprehensive Income
|
||||||||||||
|
Net income
|
42,503
|
(111
|
)
|
42,392
|
||||||||
|
Comprehensive income
|
42,414
|
(111
|
)
|
42,303
|
||||||||
|
Consolidated Statement of Cash Flows
|
||||||||||||
|
Operating Cash Flows
|
||||||||||||
|
Net income
|
42,503
|
(111
|
)
|
42,392
|
||||||||
|
Deferred income tax expense (benefit)
|
13,840
|
(41
|
)
|
13,799
|
||||||||
|
Change in: Receivables and advances
|
(27,199
|
)
|
234
|
(26,965
|
)
|
|||||||
|
Change in: Accounts payable and accrued expenses
|
19,232
|
(82
|
)
|
19,150
|
||||||||
|
Net cash flows provided by operating activities
|
124,800
|
-
|
124,800
|
|||||||||
Accounting Standards not yet adopted
In February 2016, FASB issued ASU 2016-02, which requires lessees to recognize a right-to-use asset and a lease obligation for all leases. Lessees are permitted to make an accounting policy election to not recognize an asset and liability for leases with a term of twelve months or less. Lessor accounting under the new standard is substantially unchanged. Additional qualitative and quantitative disclosures, including significant judgments made by management, will be required. This new standard will become effective for us in our annual reporting period beginning January 1, 2019, including interim periods within that reporting period and requires a modified retrospective transition approach. We believe the adoption will not have a material impact to net income and will add approximately
$43.0 million to our assets and liabilities for the related right-to-use asset and lease obligation for our existing operating leases. We plan to finalize our evaluation during the first quarter of 2019, including an assessment of the new expanded disclosure requirements and a final determination of the impact to adoption and related changes required to internal controls.
|
2.
|
LIQUIDITY
|
Our business requires significant capital investments over the short-term and the long-term. We generally finance our capital requirements with borrowings under our Credit Facility, cash flows from operations, long-term operating leases, capital leases, secured installment notes with finance companies, and proceeds from the sale of our used revenue equipment. We had working capital (total current assets less total current liabilities) of
$84.3 million and
$81.1 million at December 31,
2018 and
2017, respectively. Based on our expected financial condition, net capital expenditures, and results of operations and related net cash flows, we believe our working capital and sources of liquidity will be adequate to meet our current and projected needs for at least the next year.
As of
December 31, 2018, we had
$3.9 million of borrowings outstanding, undrawn letters of credit outstanding of approximately
$36.3 million, and available borrowing capacity of
$54.8 million under the Credit Facility. Fluctuations in the outstanding balance and related availability under our Credit Facility are driven primarily by cash flows from operations and the timing and nature of property and equipment additions that are not funded through notes payable, as well as the nature and timing of collection of accounts receivable, payments of accrued expenses, and receipt of proceeds from disposals of property and equipment.
|
3.
|
STOCK-BASED COMPENSATION
|
On February 21, 2013, the Compensation Committee of our Board of Directors approved, subject to stockholder approval, a third amendment (the "Third Amendment") to the 2006 Omnibus Incentive Plan (the "Incentive Plan"). The Third Amendment (i) provides that the maximum aggregate number of shares of Class A common stock available for grant of awards under the Incentive Plan from and after May 29, 2013, shall not exceed 750,000, plus any remaining available shares of the 800,000 shares previously made available under the second amendment to the Incentive Plan (the "Second Amendment"), and any expirations, forfeitures, cancellations, or certain other terminations of shares approved for grant under the Third Amendment or the Second Amendment previously reserved, plus any remaining expirations, forfeitures, cancellations, or certain other terminations of such shares, and (ii) re-sets the term of the Incentive Plan to expire with respect to the ability to grant new awards on March 31, 2023.
The Incentive Plan permits annual awards of shares of our Class A common stock to executives, other key employees, non-employee directors, and eligible participants under various types of options, restricted share awards, or other equity instruments. At December 31,
2018,
50,960 of the
1,550,000 shares noted above were available for award under the amended Incentive Plan. No participant in the Incentive Plan may receive awards of any type of equity instruments in any calendar-year that relates to more than 200,000 shares of our Class A common stock. No awards may be made under the Incentive Plan after March 31, 2023. To the extent available, we have issued treasury stock to satisfy all share-based incentive plans.
Included in salaries, wages, and related expenses within the consolidated statements of operations is stock-based compensation expense of
$4.8 million,
$1.0 million, and
$1.2 million in
2018,
2017, and
2016, respectively. Included in general supplies and expenses within the consolidated statements of operations is stock-based compensation expenses for non-employee directors of
$0.4 million in 2018,
$0.3 million in 2017, and
$0.2 million in 2016, respectively. All stock compensation expense recorded in 2018, 2017, and 2016 relates to restricted shares granted, as no options were granted during these periods. Associated with stock compensation expense was
less than $0.1 million, of income tax expense in 2018, as well as income tax benefit of
$0.3 million and
$0.2 million in 2017 and 2016, respectively, related to the exercise of stock options and restricted share vesting.
The Incentive Plan allows participants to pay the federal and state minimum statutory tax withholding requirements related to awards that vest or allows the participant to deliver to us shares of Class A common stock having a fair market value equal to the minimum amount of such required withholding taxes. To satisfy withholding requirements for shares that vested, certain participants elected to deliver to us
11,052,
31,297, and
55,429 Class A common stock shares, which were withheld at weighted average per share prices of
$21.89,
$25.09, and
$20.61, respectively, based on the closing prices of our Class A common stock on the dates the shares vested in 2018, 2017, and 2016, respectively, in lieu of the federal and state minimum statutory tax withholding requirements. We remitted
$0.2 million,
$0.8 million, and
$1.1 million in 2018, 2017, and 2016, respectively, to the proper taxing authorities in satisfaction of the employees' minimum statutory withholding requirements. The payment of minimum tax withholdings on stock compensation are reflected within the issuances of restricted shares from treasury stock in the accompanying consolidated statement of stockholders' equity.
The following table summarizes our restricted share award activity for the fiscal years ended December 31, 2018, 2017, and 2016:
|
|
Number of
stock
awards
(in thousands)
|
Weighted
|
||||||
|
|
average grant
|
|||||||
|
|
date fair
|
|||||||
|
|
value
|
|||||||
|
|
||||||||
|
Unvested at December 31, 2015
|
330
|
$
|
12.43
|
|||||
|
|
||||||||
|
Granted
|
120
|
$
|
18.92
|
|||||
|
Vested
|
(169
|
)
|
$
|
5.28
|
||||
|
Forfeited
|
(16
|
)
|
$
|
16.53
|
||||
|
Unvested at December 31, 2016
|
265
|
$
|
18.63
|
|||||
|
|
||||||||
|
Granted
|
434
|
$
|
16.69
|
|||||
|
Vested
|
(96
|
)
|
$
|
12.78
|
||||
|
Forfeited
|
(16
|
)
|
$
|
19.25
|
||||
|
Unvested at December 31, 2017
|
587
|
$
|
18.14
|
|||||
|
|
||||||||
|
Granted
|
153
|
$
|
30.32
|
|||||
|
Vested
|
(35
|
)
|
$
|
25.97
|
||||
|
Forfeited
|
(30
|
)
|
$
|
27.58
|
||||
|
Unvested at December 31, 2018
|
675
|
$
|
20.08
|
|||||
The unvested shares at
December 31, 2018 will vest based on when and if the related vesting criteria are met for each award. All awards require continued service to vest, and
242,862 of these awards vest solely based on continued service, in varying increments between
2019 and
2022. Performance based awards account for
432,575 of the unvested shares at December 31, 2018, of which
123,744 shares have no unrecognized compensation cost
as vesting is not probable,
85,326 shares have no unrecognized compensation cost
based on the performance goals having been achieved for the year ended December 31, 2018, and
223,505 shares relate to performance for the years ended December 31,
2019 through
2022 and have
$2.3 million of unrecognized compensation cost.
The fair value of restricted share awards that vested in 2018, 2017, and 2016 was approximately
$0.7 million,
$2.4 million, and
$3.5 million, respectively. As of December 31, 2018, we had approximately
$5.9 million of unrecognized compensation expense related to 242,862 service-based shares and 223,505 performance-based share awards with 2019 through 2022 performance periods, which is probable to be recognized over a weighted average period of approximately
28 months. All restricted shares awarded to executives and other key employees pursuant to the Incentive Plan provide the holder with voting and other stockholder-type rights, but will not be issued until the relevant restrictions are satisfied.
There were no outstanding stock options for the fiscal years ended December 31, 2018, 2017, and 2016.
|
4.
|
PROPERTY AND EQUIPMENT
|
A summary of property and equipment, at cost, as of December 31,
2018 and
2017 is as follows:
|
(in thousands)
|
Estimated Useful Lives
|
2018
|
2017
|
|||||||||
|
Revenue equipment
|
3-10 years
|
$
|
504,192
|
$
|
519,797
|
|||||||
|
Communications equipment
|
5-10 years
|
3,850
|
4,585
|
|||||||||
|
Land and improvements
|
0-15 years
|
25,240
|
25,061
|
|||||||||
|
Buildings and leasehold improvements
|
7-40 years
|
75,134
|
74,513
|
|||||||||
|
Construction in-progress
|
-
|
3,121
|
2,023
|
|||||||||
|
Other
|
2-10 years
|
27,233
|
25,009
|
|||||||||
|
|
$
|
638,770
|
$
|
650,988
|
||||||||
Depreciation expense was
$74.4 million,
$72.4 million, and
$71.4 million, in 2018, 2017, and
2016, respectively. This depreciation expense excludes net losses on the sale of property and equipment totaling
$0.3 million,
$4.0 million, and
$0.8 million in 2018, 2017, and 2016, respectively, which are presented net of gains on sale in depreciation and amortization expense in the consolidated statements of operations.
We lease certain revenue equipment under capital leases with terms of approximately 60 to 84 months. At December 31, 2018 and 2017, property and equipment included capitalized leases, which had capitalized costs of
$55.4 million and
$30.5 million and accumulated amortization of
$15.6 million and
$5.4 million, respectively. Amortization of these leased assets is included in depreciation and amortization expense in the consolidated statement of operations and totaled
$5.4 million,
$2.6 million, and
$1.6 million during 2018, 2017, and 2016, respectively.
|
5.
|
GOODWILL AND OTHER ASSETS
|
Effective in March
2018, we entered into domestic certificates of deposit totaling
$0.8 million, which are set to mature in
February 2019.
A summary of other assets as of December 31, 2018 and
2017 is as follows:
|
(in thousands)
|
2018
|
2017
|
||||||
|
Investment in TEL
|
$
|
26,106
|
$
|
20,145
|
||||
|
Other assets, net
|
11,043
|
3,137
|
||||||
|
Total other assets
|
$
|
37,149
|
$
|
23,282
|
||||
A summary of other intangible assets as of December 31, 2018 is as follows:
|
(in thousands)
|
December 31, 2018
|
|||||||||||||||
|
|
Gross intangible assets
|
Accumulated amortization
|
Net intangible assets
|
Life (months)
|
||||||||||||
|
Trade name
|
$
|
4,400
|
$
|
(147
|
)
|
$
|
4,253
|
180
|
||||||||
|
Non-Compete agreement
|
1,400
|
$
|
(140
|
)
|
1,260
|
60
|
||||||||||
|
Customer relationships
|
28,200
|
$
|
(1,175
|
)
|
27,025
|
144
|
||||||||||
|
Total
|
$
|
34,000
|
$
|
(1,462
|
)
|
$
|
32,538
|
|||||||||
Amortization expenses of intangible assets were $1.5 million, zero, and $0.2 million for 2018, 2017 and 2016, respectively. Approximate intangible amortization expense for the next five years is as follows:
|
|
(In thousands)
|
|||
|
2019
|
$
|
2,923
|
||
|
2020
|
2,923
|
|||
|
2021
|
2,923
|
|||
|
2022
|
2,923
|
|||
|
2023
|
2,783
|
|||
|
Thereafter
|
18,063
|
|||
|
6.
|
DEBT
|
Current and long-term debt consisted of the following at December 31,
2018 and
2017:
|
(in thousands)
|
December 31, 2018
|
December 31, 2017
|
||||||||||||||
|
|
Current
|
Long-Term
|
Current
|
Long-Term
|
||||||||||||
|
Borrowings under Credit Facility
|
$
|
-
|
$
|
3,911
|
$
|
-
|
$
|
9,007
|
||||||||
|
Revenue equipment installment notes; weighted average interest rate of 3.7% at December 31, 2018, and 3.3% December 31, 2017, due in monthly installments with final maturities at various dates ranging from January 2019 to July 2023, secured by related revenue equipment
|
27,809
|
139,115
|
23,732
|
130,946
|
||||||||||||
|
|
||||||||||||||||
|
Real estate notes; interest rate of 4.1% at December 31, 2018 due in monthly installments with a fixed maturity at August 2035 and weighted average interest rate of 3.1% at December 31, 2017 due in monthly installments with fixed maturities at December 2018 and August 2035, secured by related real estate
|
1,048
|
23,763
|
1,004
|
24,810
|
||||||||||||
|
Deferred loan costs
|
(147
|
)
|
(154
|
)
|
(140
|
)
|
(298
|
)
|
||||||||
|
Total debt
|
28,710
|
166,635
|
24,596
|
164,465
|
||||||||||||
|
Principal portion of capital lease obligations, secured by related revenue equipment
|
5,374
|
35,119
|
2,962
|
21,777
|
||||||||||||
|
|
||||||||||||||||
|
Total debt and capital lease obligations
|
$
|
34,084
|
$
|
201,754
|
$
|
27,558
|
$
|
186,242
|
||||||||
We and substantially all of our subsidiaries (collectively, the "Borrowers") are parties to the Credit Facility with Bank of America, N.A., as agent (the "Agent") and JPMorgan Chase Bank, N.A. ("JPM," and together with the Agent, the "Lenders"). The Credit Facility is a $95.0 million revolving credit facility, with an uncommitted accordion feature that, so long as no event of default exists, allows us to request an increase in the revolving credit facility of up to $50.0 million subject to Lender acceptance of the additional funding commitment. The Credit Facility includes, within our $95.0 million revolving credit facility, a letter of credit sub facility in an aggregate amount of $95.0 million and a swing line sub facility in an aggregate amount equal to the greater of $10.0 million or 10% of the Lenders' aggregate commitments under the Credit Facility from time-to-time. The Credit Facility matures in September 2021.
Borrowings under the Credit Facility are classified as either "base rate loans" or "LIBOR loans." Base rate loans accrue interest at a base rate equal to the greater of the Agent’s prime rate, the federal funds rate plus 0.5%, or LIBOR plus 1.0%, plus an applicable margin ranging from 0.5% to 1.0%; while LIBOR loans accrue interest at LIBOR, plus an applicable margin ranging from 1.5% to 2.0%. The applicable rates are adjusted quarterly based on average pricing availability. The unused line fee is the product of 0.25% times the average daily amount by which the Lenders' aggregate revolving commitments under the Credit Facility exceed the outstanding principal amount of revolver loans and the aggregate undrawn amount of all outstanding letters of credit issued under the Credit Facility. The obligations under the Credit Facility are guaranteed by us and secured by a pledge of substantially all of our assets, with the notable exclusion of any real estate or revenue equipment pledged under other financing agreements, including revenue equipment installment notes and capital leases.
Borrowings under the Credit Facility are subject to a borrowing base limited to the lesser of (A) $95.0 million, minus the sum of the stated amount of all outstanding letters of credit; or (B) the sum of (i) 85% of eligible accounts receivable, plus (ii) the lesser of (a) 85% of the appraised net orderly liquidation value of eligible revenue equipment, (b) 95% of the net book value of eligible revenue equipment, or (c) 35% of the Lenders' aggregate revolving commitments under the Credit Facility, plus (iii) the lesser of (a) $25.0 million or (b) 75% of the appraised fair market value of eligible real estate, as reduced by a periodic amortization amount. We had
$3.9 million of borrowings outstanding under the Credit Facility as of
December 31, 2018, undrawn letters of credit outstanding of approximately
$36.3 million, and available borrowing capacity of
$54.8 million. The interest rate on outstanding borrowings as of December 31, 2018, was
6.0% on
$3.9 million of base rate loans and there were
no outstanding LIBOR loans. Based on availability as of December 31, 2018 and
2017, there was no fixed charge coverage requirement.
The Credit Facility includes usual and customary events of default for a facility of this nature and provides that, upon the occurrence and continuation of an event of default, payment of all amounts payable under the Credit Facility may be accelerated, and the Lenders' commitments may be terminated. If an event of default occurs under the Credit Facility and the Lenders cause all of the outstanding debt obligations under the Credit Facility to become due and payable, this could result in a default under other debt instruments that contain acceleration or cross-default provisions. The Credit Facility contains certain restrictions and covenants relating to, among other things, debt, dividends, liens, acquisitions and dispositions outside of the ordinary course of business, and affiliate transactions. Failure to comply with the covenants and restrictions set forth in the Credit Facility could result in an event of default.
Capital lease obligations are utilized to finance a portion of our revenue equipment and are entered into with certain finance companies who are not parties to our Credit Facility. The leases in effect at December 31,
2018 terminate in
January 2019 through
November 2024 and contain guarantees of the residual value of the related equipment by us. As such, the residual guarantees are included in the related debt balance as a balloon payment at the end of the related term as well as included in the future minimum capital lease payments. These lease agreements require us to pay personal property taxes, maintenance, and operating expenses.
Pricing for the revenue equipment installment notes is quoted by the respective financial affiliates of our primary revenue equipment suppliers and other lenders at the funding of each group of equipment acquired and include fixed annual rates for new equipment under retail installment contracts. The notes included in the funding are due in monthly installments with final maturities at various dates ranging from
January 2019 to
July 2023. The notes contain certain requirements regarding payment, insuring of collateral, and other matters, but do not have any financial or other material covenants or events of default except certain notes totaling
$135.2 million are cross-defaulted with the Credit Facility. Additional borrowings from the financial affiliates of our primary revenue equipment suppliers and other lenders are expected to be available to fund new tractors expected to be delivered in
2019, while any other property and equipment purchases, including trailers, are expected to be funded with a combination of available cash, notes, operating leases, capital leases, and/or from the Credit Facility.
In August 2015, we financed a portion of the purchase of our corporate headquarters, a maintenance facility, and certain surrounding property in Chattanooga, Tennessee by entering into a $28.0 million variable rate note with a third party lender. Concurrently with entering into the note, we entered into an interest rate swap to effectively fix the related interest rate to 4.2%.
As of December 31,
2018, the scheduled principal payments of debt, excluding capital leases for which future payments are discussed in Note 7 are as follows:
|
|
(in thousands)
|
|||
|
2019
|
$
|
28,857
|
||
|
2020
|
39,121
|
|||
|
2021
|
61,058
|
|||
|
2022
|
43,324
|
|||
|
2023
|
4,185
|
|||
|
Thereafter
|
$
|
19,100
|
||
|
7.
|
LEASES
|
We have operating lease commitments for office and terminal properties, revenue equipment, and computer and office equipment, and we have capital lease commitments for revenue equipment, in each case excluding owner/operator rentals and month-to-month equipment rentals, summarized for the following fiscal years (in thousands):
|
|
Operating
|
Capital
|
||||||
|
2019
|
$
|
16,331
|
$
|
6,511
|
||||
|
2020
|
11,726
|
9,748
|
||||||
|
2021
|
7,973
|
7,721
|
||||||
|
2022
|
6,272
|
9,487
|
||||||
|
2023
|
208
|
9,148
|
||||||
|
Thereafter
|
35
|
1,420
|
||||||
|
Total minimum lease payments
|
$
|
42,545
|
$
|
44,035
|
||||
|
Less: amount representing interest
|
(3,542
|
)
|
||||||
|
Present value of minimum lease payments
|
40,493
|
|||||||
|
Less: current portion
|
(5,374
|
)
|
||||||
|
Capital lease obligations, long-term
|
$
|
35,119
|
||||||
A portion of our operating leases of tractors and trailers contain residual value guarantees under which we guarantee a certain minimum cash value payment to the leasing company at the expiration of the lease. We estimate that the undiscounted value of the residual guarantees is approximately
$1.0 million and
$4.0 million at December 31,
2018 and
2017, respectively. The residual guarantees at December 31, 2018 expire between January and
February 2019. We expect our residual guarantees to approximate the market value at the end of the lease term. Additionally, certain leases contain cross-default provisions with other financing agreements and additional charges if the unit's mileage exceeds certain thresholds defined in the lease agreement.
Rental expense is summarized as follows for each of the three years ended December 31:
|
(in thousands)
|
2018
|
2017
|
2016
|
|||||||||
|
Revenue equipment rentals
|
$
|
14,682
|
$
|
12,055
|
$
|
10,773
|
||||||
|
Building and lot rentals
|
1,339
|
448
|
708
|
|||||||||
|
Other equipment rentals
|
881
|
261
|
254
|
|||||||||
|
|
$
|
16,902
|
$
|
12,764
|
$
|
11,735
|
||||||
|
8.
|
INCOME TAXES
|
Income tax expense (benefit) for the years ended December 31,
2018,
2017, and
2016 is comprised of:
|
(in thousands)
|
2018
|
2017
|
2016
|
|||||||||
|
Federal, current
|
$
|
-
|
|
$
|
(7,780
|
)
|
$
|
11,951
|
||||
|
Federal, deferred
|
14,117
|
(28,055
|
)
|
(2,925
|
)
|
|||||||
|
State, current
|
1,410
|
|
(1,737
|
)
|
1,811
|
|||||||
|
State, deferred
|
(20
|
) |
5,430
|
(451
|
)
|
|||||||
|
Actual income tax expense
|
$
|
15,507
|
$
|
(32,142
|
)
|
$
|
10,386
|
|||||
Income tax expense for the years ended December 31, 2018, 2017, and 2016 is summarized below:
|
(in thousands)
|
2018
|
2017
|
2016
|
|||||||||
|
Computed "expected" income tax expense
|
$
|
12,182
|
$
|
8,154
|
$
|
9,527
|
||||||
|
State income taxes, net of federal income tax effect
|
2,610
|
862
|
953
|
|||||||||
|
Per diem allowances
|
1,446
|
2,145
|
2,205
|
|||||||||
|
Tax contingency accruals
|
(57
|
)
|
(43
|
)
|
(273
|
)
|
||||||
|
Valuation allowance, net
|
-
|
(1,167
|
)
|
-
|
||||||||
|
Tax credits
|
(1,042
|
)
|
(1,084
|
)
|
(694
|
)
|
||||||
|
Impact of Tax Act remeasurement
|
-
|
(40,123
|
)
|
-
|
||||||||
|
Excess tax benefits on share-based compensation
|
50
|
(457
|
)
|
-
|
||||||||
|
Other, net
|
318
|
(429
|
)
|
(1,332
|
)
|
|||||||
|
Income tax expense (benefit)
|
$
|
15,507
|
$
|
(32,142
|
)
|
$
|
10,386
|
|||||
Income tax expense varies from the amount computed by applying the applicable federal corporate income tax rate for 2016 through 2017 of
35%, and
21% for 2018, to income before income taxes primarily due to state income taxes, net of federal income tax effect, adjusted for permanent differences, the most significant of which is the effect of the per diem pay structure for drivers and the impacts of tax reform discussed below. Drivers who meet the requirements to receive per diem receive non-taxable per diem pay in lieu of a portion of their taxable wages. This per diem program increases our drivers' net pay per mile, after taxes, while decreasing gross pay, before taxes. As a result, salaries, wages, and employee benefits are slightly lower and our effective income tax rate is higher than the statutory rate. Generally, as pre-tax income increases, the impact of the driver per diem program on our effective tax rate decreases, because aggregate per diem pay becomes smaller in relation to pre-tax income, while in periods where earnings are at or near breakeven, the impact of the per diem program on our effective tax rate is significant. Due to the partially nondeductible effect of per diem pay, our tax rate will fluctuate in future periods based on fluctuations in earnings.
On December 22, 2017, the U.S. government enacted comprehensive tax legislation commonly referred to as the Tax Act. The Tax Act makes broad and complex changes to the U.S. tax code, including, but not limited to, the following that impact us: (1) reducing the U.S. federal corporate income tax rate from 35 percent to 21 percent; (2) eliminating the corporate alternative minimum tax; (3) creating a new limitation on deductible interest expense; (4) 100% expensing of qualified fixed assets; (5) repeal of the like-kind exchange program property other than real property; (6) removal of the performance-based exception on executive compensation over $1 million; and (7) limiting certain other deductions.
The SEC staff issued Staff Accounting Bulletin No. 118 ("SAB 118"), which provides guidance on accounting for the tax effects of the Tax Act. SAB 118 provides for a measurement period that should not extend beyond one year from the Tax Act enactment date for companies to complete the accounting relating to the Tax Act under ASC 740. In accordance with SAB 118, a company must reflect the income tax effects of those aspects of the Tax Act for which the accounting under ASC 740 is complete. To the extent that a company's accounting for certain income tax effects of the Tax Act is incomplete but it is able to determine a reasonable estimate, it must record a provisional estimate in its financial statements. If a company cannot determine a provisional estimate to be included in its financial statements, it should continue to apply ASC 740 on the basis of the provisions of the tax laws that were in effect immediately before the enactment of the Tax Act.
As the result of our initial analysis of the impact of the Tax Act, we recorded a provisional amount of net tax benefit of
$40.1 million in 2017 related to the remeasurement of our deferred tax balances and other effects. We completed our accounting for the income tax effects of the Tax Act in 2018, and no material adjustments were required to the provisional amounts initially recorded.
The temporary differences and the approximate tax effects that give rise to our net deferred tax liability at December 31, 2018 and 2017 are as follows:
|
(in thousands)
|
2018
|
2017
|
||||||
|
Deferred tax assets:
|
||||||||
|
Insurance and claims
|
$
|
9,593
|
$
|
8,797
|
||||
|
Net operating loss carryovers
|
10,260
|
4,755
|
||||||
|
Tax credits
|
11,985
|
11,875
|
||||||
|
Other
|
8,350
|
4,414
|
||||||
|
Valuation allowance
|
(63
|
)
|
(63
|
)
|
||||
|
Total deferred tax assets
|
40,125
|
29,778
|
||||||
|
|
||||||||
|
Deferred tax liabilities:
|
||||||||
|
Property and equipment
|
(87,939
|
)
|
(76,325
|
)
|
||||
|
Investment in partnership
|
(26,066
|
)
|
(14,197
|
)
|
||||
|
Deferred fuel hedge
|
(73
|
)
|
(99
|
)
|
||||
|
Other
|
(569
|
)
|
-
|
|||||
|
Prepaid expenses
|
(2,945
|
)
|
(2,501
|
)
|
||||
|
Total deferred tax liabilities
|
(117,592
|
)
|
(93,122
|
)
|
||||
|
|
||||||||
|
Net deferred tax liability
|
$
|
(77,467
|
)
|
$
|
(63,344
|
)
|
||
The net deferred tax liability of
$77.5 million primarily relates to differences in cumulative book versus tax depreciation of property and equipment, partially off-set by tax credit carryovers and insurance claims that have been reserved but not paid. The carrying value of our deferred tax assets assumes that we will be able to generate, based on certain estimates and assumptions, sufficient future taxable income in certain tax jurisdictions to utilize these deferred tax benefits. If these estimates and related assumptions change in the future, we may be required to establish a valuation allowance against the carrying value of the deferred tax assets, which would result in additional income tax expense. On a periodic basis, we assess the need for adjustment of the valuation allowance. Based on forecasted taxable income resulting from the reversal of deferred tax liabilities, primarily generated by accelerated depreciation for tax purposes in prior periods, and tax planning strategies available to us, no valuation allowance has been established at December 31, 2018 or 2017, except for approximately
$0.1 million in each year related to certain state net operating loss carry forwards. If these estimates and related assumptions change in the future, we may be required to modify our valuation allowance against the carrying value of the deferred tax assets.
As of December 31, 2018, we had a
$2.7 million liability recorded for unrecognized tax benefits, which includes interest and penalties of
$0.9 million. We recognize interest and penalties accrued related to unrecognized tax benefits in tax expense. As of December 31, 2017, we had a
$2.8 million liability recorded for unrecognized tax benefits, which included interest and penalties of
$0.8 million. Interest and penalties recognized for uncertain tax positions provided for a
$0.1 million
expense in each of 2018 and 2016 and a
$0.1 million
benefit in 2017.
The following tables summarize the annual activity related to our gross unrecognized tax benefits (in thousands) for the years ended December 31, 2018, 2017, and 2016:
|
|
2018
|
2017
|
2016
|
|||||||||
|
Balance as of January 1,
|
$
|
1,924
|
$
|
2,051
|
$
|
2,394
|
||||||
|
Increases related to prior year tax positions
|
4
|
19
|
-
|
|||||||||
|
Decreases related to prior year positions
|
(9
|
)
|
(10
|
)
|
-
|
|||||||
|
Increases related to current year tax positions
|
-
|
-
|
-
|
|||||||||
|
Decreases related to settlements with taxing authorities
|
-
|
-
|
(88
|
)
|
||||||||
|
Decreases related to lapsing of statute of limitations
|
(123
|
)
|
(136
|
)
|
(255
|
)
|
||||||
|
Balance as of December 31,
|
$
|
1,796
|
$
|
1,924
|
$
|
2,051
|
||||||
If recognized, approximately
$2.5 million of unrecognized tax benefits would impact our effective tax rate as of both December 31, 2018 and 2017. Any prospective adjustments to our reserves for income taxes will be recorded as an increase or decrease to our provision for income taxes and would impact our effective tax rate.
Our 2013 and 2015 through 2018 tax years remain subject to examination by the IRS for U.S. federal tax purposes, our major taxing jurisdiction. We have one tax position taken on our 2013 federal return that is under audit by the Internal Revenue Service. The position relates to a non-recurring tax credit of approximately
$6.5 million. In the normal course of business, we are also subject to audits by state and local tax authorities. While it is often difficult to predict the final outcome or the timing of resolution of any particular tax matter, we believe that our reserves reflect the more likely than not outcome of known tax contingencies. We adjust these reserves, as well as the related interest, in light of changing facts and circumstances. Settlement of any particular issue would usually require the use of cash. Favorable resolution would be recognized as a reduction to our annual tax rate in the year of resolution. We do not expect any significant increases or decreases for uncertain income tax positions during the next year.
Our federal tax credits of
$12.0 million are available to offset future federal taxable income, if any, through
2038. We have a federal alternative minimum tax credit carryforward of $1.0 million that, under the Tax Act, will be fully refundable by tax year 2021. Our state net operating loss carryforwards and state tax credits of
$75.7 million and
$0.7 million, respectively expire over various periods through 2038 based on jurisdiction.
9. EQUITY METHOD INVESTMENT
We own a 49.0% interest in TEL, a tractor and trailer equipment leasing company and used equipment reseller. We have not guaranteed any of TEL's debt and have no obligation to provide funding, services, or assets. In May 2016, the operating agreement with TEL was amended to, among other things, remove the previously agreed to fixed date purchase options. Our option to acquire up to the remaining 51% of TEL would have expired May 31, 2016, and TEL’s majority owners would have received the option to purchase our ownership in TEL. There are no current put rights to purchase or sell with any owners. TEL’s majority owners are generally restricted from transferring their interests in TEL, other than to certain permitted transferees, without our consent. For the years ended December 31,
2018 and
2017, we sold tractors and trailers to TEL for
less than $0.1 million and
$0.1 million, respectively, and received
$8.2 million and
$5.9 million, respectively, for providing various maintenance services, certain back-office functions, and for miscellaneous equipment.
We also purchased equipment from TEL for $1.8 million in 2018. Additionally, we paid $0.9 million and $0.5 million to TEL for leases of revenue equipment in 2018 and 2017, respectively.
We reversed previously deferred gains of
$0.2 million for each of the years ending December 31, 2018 and 2017, representing 49% of the gains on units sold to TEL less any gains previously deferred and recognized when the equipment was sold to a third party. Deferred gains totaling
$0.2 million and
$0.4 million at December 31, 2018 and 2017, respectively, are being carried as a reduction in our investment in TEL. At December 31, 2018 and 2017, we had accounts receivable from TEL of
$7.2 million and
$8.6 million, respectively, related to cash disbursements made pursuant to our performance of certain back-office and maintenance functions on TEL's behalf.
We have accounted for our investment in TEL using the equity method of accounting and thus our financial results include our proportionate share of TEL's net income, which amounted to
$7.7 million in 2018,
$3.4 million in 2017, and
$3.0 million in
2016. We received an equity distribution from TEL for
$2.0 million in each of 2018 and 2017, and
$1.5 million in 2016, which was distributed to each member based on its respective ownership percentage. Our investment in TEL, totaling
$26.1 million and
$20.1 million at December 31, 2018 and 2017, respectively, is included in other assets in the accompanying consolidated balance sheet. Our investment in TEL is comprised of the $4.9 million cash investment noted above and our equity in TEL's earnings since our investment, partially offset by dividends received since our investment for minimum tax withholdings as noted above and the abovementioned deferred gains on sales of equipment to TEL.
See TEL's summarized financial information below.
|
(in thousands)
|
As of the years ended December 31,
|
|||||||
|
|
2018
|
2017
|
||||||
|
Current Assets
|
$
|
25,877
|
$
|
19,660
|
||||
|
Non-current Assets
|
273,987
|
183,905
|
||||||
|
Current Liabilities
|
78,530
|
53,981
|
||||||
|
Non-current Liabilities
|
176,389
|
117,135
|
||||||
|
Total Equity
|
$
|
44,945
|
$
|
32,449
|
||||
|
(in thousands)
|
As of the years ended December 31,
|
|||||||||||
|
|
2018
|
2017
|
2016
|
|||||||||
|
Revenue
|
$
|
108,801
|
$
|
84,865
|
$
|
94,432
|
||||||
|
Operating Expenses
|
84,588
|
72,868
|
83,475
|
|||||||||
|
Operating Income
|
24,213
|
11,997
|
10,957
|
|||||||||
|
Net Income
|
$
|
16,496
|
$
|
6,954
|
$
|
6,598
|
||||||
|
10.
|
DEFERRED PROFIT SHARING EMPLOYEE BENEFIT PLAN
|
We have a deferred profit sharing and savings plan under which all of our employees with at least six months of service are eligible to participate. Employees may contribute a percentage of their annual compensation up to the maximum amount allowed by the Internal Revenue Code. We may make discretionary contributions as determined by a committee of our Board of Directors. We made contributions of
$1.7 million in
2018,
$0.9 million in
2017, and
$0.7 million in
2016 to the profit sharing and savings plan.
|
11.
|
RELATED PARTY TRANSACTIONS
|
Other than those associated with TEL, there are no material related party transactions. See Note 9 for discussions of the related party transactions associated with TEL.
|
12.
|
OTHER COMPREHENSIVE INCOME ("OCI")
|
OCI is comprised of net income and other adjustments, including changes in the fair value of certain derivative financial instruments qualifying as cash flow hedges.
The following tables summarize the change in the components of our OCI balance for the periods presented (in thousands; presented net of tax):
|
|
Amount Reclassified from OCI for the years ended
|
|
|||||||||||
|
Details about OCI Components
|
December 31,
|
Affected Line Item in the Statement of Operations
|
|||||||||||
|
|
2018
|
2017
|
2016
|
|
|||||||||
|
Gains (losses) on cash flow hedges
|
|
||||||||||||
|
Commodity derivative contracts
|
$
|
1,600
|
$
|
(4,065
|
)
|
$
|
(16,674
|
)
|
Fuel expense
|
||||
|
|
(440
|
)
|
1,554
|
6,419
|
Income tax expense
|
||||||||
|
|
$
|
1,160
|
$
|
(2,511
|
)
|
$
|
(10,255
|
)
|
Net of tax
|
||||
|
Interest rate swap contracts
|
$
|
(115
|
)
|
$
|
(438
|
)
|
$
|
(557
|
)
|
Interest expense
|
|||
|
|
32
|
165
|
215
|
Income tax expense
|
|||||||||
|
|
$
|
(83
|
)
|
$
|
(273
|
)
|
$
|
(342
|
)
|
Net of tax
|
|||
|
13.
|
COMMITMENTS AND CONTINGENT LIABILITIES
|
From time-to-time, we are a party to ordinary, routine litigation arising in the ordinary course of business, most of which involves claims for personal injury and/or property damage incurred in connection with the transportation of freight.
We maintain insurance to cover liabilities arising from the transportation of freight for amounts in excess of certain self-insured retentions. In management's opinion, our potential exposure under pending legal proceedings is adequately provided for in the accompanying consolidated financial statements.
Our Covenant Transport subsidiary is a defendant in a lawsuit filed on November 9, 2018 in the Superior Court of Los Angeles, California. The lawsuit was filed on behalf of Richard Tabizon (a California resident and former driver), who is seeking to have the lawsuit certified as a class action case wherein he alleges violation of multiple California wage and hour statutes from October 31, 2014 to present, including failure to pay drivers separately for rest breaks, failure to provide itemized wage statements, failure to pay minimum wage (for on-duty not driving time), waiting time penalties, and failure to reimburse for business expenses. Tabizon is also seeking Private Attorney General Act (“PAGA”) penalties based on these claims from September 11, 2017 through the present. The case was removed from state court on December 6, 2018 to the U.S. Federal District Court in the Central District of California.
Based on our present knowledge of the facts and, in certain cases, advice of outside counsel, management believes the resolution of open claims and pending litigation, taking into account existing reserves, is not likely to have a materially adverse effect on our consolidated financial statements.
We had
$36.3 million and $32.9 million of outstanding and undrawn letters of credit as of December 31,
2018 and
2017, respectively. The letters of credit are maintained primarily to support our insurance programs.
We had commitments outstanding at December 31, 2018, to acquire revenue equipment totaling approximately
$156.3 million in
2019 versus commitments at December 31, 2017 of approximately $51.7 million. These commitments are cancelable upon stated notice periods, subject to certain adjustments in the underlying obligations and benefits. These purchase commitments are expected to be financed by operating leases, capital leases, long-term debt, proceeds from sales of existing equipment, and/or cash flows from operations.
|
14.
|
AVAILABLE-FOR-SALE SECURITIES
|
We have purchased certain investments to meet dual objectives of capital preservation and maintenance of sufficient resources to fund insurance losses. As such, the investments are not held for the purpose of trading. Furthermore, due to the uncertain nature of insurance losses, the investments are not held-to-maturity, and are thus classified as available-for-sale securities. Unrealized holding gains and losses on these investments are excluded from earnings and reported in other comprehensive income until realized. Unrealized holding losses below, which are comprised of
10 investments in an unrealized loss position, are not considered other-than-temporary, as both the duration and amount of unrealized losses have been insignificant.
|
(in thousands)
|
December 31, 2018
|
|||||||||||
|
|
Amortized cost basis
|
Gross unrealized losses (less than 12 months)
|
Fair value
|
|||||||||
|
US corporate securities, maturing within one to five years
|
$
|
396
|
$
|
(3
|
)
|
$
|
393
|
|||||
|
Certificates of deposit, maturing in less than one year
|
600
|
(1
|
)
|
599
|
||||||||
|
Certificates of deposit, maturing within one to five years
|
500
|
(3
|
)
|
497
|
||||||||
|
Total available-for-sale securities
|
$
|
1,496
|
$
|
(7
|
)
|
$
|
1,489
|
|||||
|
15.
|
ACQUISITION OF LANDAIR HOLDINGS, INC.
|
On July 3, 2018, we acquired 100% of the outstanding stock of Landair Holdings, Inc., a Tennessee corporation (“Landair”). The total cash paid was $106.7 million, including (i) $83.0 million in cash to Landair's former owners, (ii) $3.2 million reimbursement to Landair's former owners and $5.0 million in state taxes paid by Landair after the acquisition related to our Internal Revenue Code Section 338(h)(10) election, which is still subject to finalization, and (iii) approximately $15.5 million for the debt of Landair, which we have paid in full, but not considering approximately $0.8 million of cash balances acquired. The Stock Purchase Agreement contains customary representations, warranties, covenants, and indemnification provisions.
Landair is a dedicated and for-hire truckload carrier, as well as a supplier of transportation management, warehousing and logistics inventory management services. Landair’s results have been included in the consolidated financial statements since the date of acquisition. Landair’s trucking operations’ results are reported within our Truckload segment, while Landair’s logistics operations’ results are reported within our Managed Freight segment.
The allocation of the preliminary purchase price detailed below as of the fiscal year ended December 31, 2018 is subject to change based on finalization of the valuation of long-lived and intangible assets and self-insurance reserves, as well as our ongoing evaluation of Landair’s accounting principles for consistency with ours. The assignment of goodwill and intangible assets to our reportable segments has not been completed as of December 31, 2018.
|
December 31, 2018
|
||||||||
|
(in thousands)
|
||||||||
|
Cash paid
|
$
|
106,700
|
||||||
|
|
||||||||
|
Allocated to:
|
||||||||
|
Historical book value of Landair’s assets and liabilities
|
$
|
25,589
|
||||||
|
Adjustments to recognize assets and liabilities at acquisition-date fair value:
|
||||||||
|
Property, plant, and equipment
|
(7,450
|
)
|
||||||
|
Other assets
|
(1,094
|
)
|
||||||
|
Liabilities
|
(829
|
)
|
||||||
|
Fair value of tangible net assets acquired
|
16,216
|
|||||||
|
Post-acquisition goodwill adjustments
|
(626
|
)
|
||||||
|
Identifiable intangibles at acquisition-date fair value
|
34,000
|
|||||||
|
Debt paid at closing
|
15,512
|
|||||||
|
Excess of consideration transferred over the net amount of assets and liabilities recognized
|
$
|
41,598
|
||||||
|
|
||||||||
|
Cash paid pursuant to Stock Purchase Agreement
|
$
|
106,700
|
||||||
|
Cash acquired included in historical book value of Landair assets and liabilities
|
(754
|
)
|
||||||
|
Net purchase price
|
$
|
105,946
|
||||||
Because of our 338(h)(10) election, all goodwill related to the acquisition is deductible for tax purposes, and deferred income taxes arising from the acquisition are immaterial.
The following table summarizes the preliminary fair values of the assets acquired and liabilities assumed at the acquisition date.
|
|
July 3, 2018
|
|||
|
Cash and cash equivalents
|
$
|
754
|
||
|
Accounts receivable
|
16,339
|
|||
|
Driver advances and other receivables
|
566
|
|||
|
Inventory and supplies
|
3
|
|||
|
Prepaid expenses
|
1,010
|
|||
|
Assets held for sale
|
128
|
|||
|
Net property and equipment
|
26,164
|
|||
|
Other assets, net
|
22
|
|||
|
Other intangibles, net
|
34,000
|
|||
|
Total identifiable assets acquired
|
78,986
|
|||
|
|
||||
|
Accounts payable
|
(5,475
|
)
|
||
|
Accrued expenses
|
(5,015
|
)
|
||
|
Insurance and claims accrual
|
(2,645
|
)
|
||
|
Other short-term liabilities
|
(123
|
)
|
||
|
Total liabilities assumed
|
(13,258
|
)
|
||
|
Net identifiable assets acquired
|
65,728
|
|||
|
Goodwill
|
40,972
|
|||
|
Net assets acquired
|
$
|
106,700
|
||
The goodwill recognized is attributable primarily to expected cost synergies in the areas of insurance and claims, workers’ compensation, fuel, and purchases of revenue equipment. Additionally, Landair and the historical Company have limited customer overlap, and as such we expect to be able to cross-sell services between historical customers and those of Landair.
The amounts of revenue and earnings of Landair included in the Company’s consolidated results of operations from the acquisition date to the period ended
December 31, 2018 are as follows:
|
(in thousands)
|
Year Ended
|
|||
|
|
December 31, 2018
|
|||
|
Total revenue
|
$
|
85,124
|
||
|
Net income
|
$
|
7,418
|
||
The following unaudited pro forma consolidated results of operations for the years ended December 31, 2018 and 2017 assume that the acquisition of Landair occurred as of January 1, 2017:
|
(in thousands)
|
Year Ended
|
|||||||
|
|
December 31,
|
|||||||
|
|
2018
|
2017
|
||||||
|
Total revenue
|
$
|
960,205
|
$
|
825,850
|
||||
|
Net income
|
$
|
45,387
|
$
|
56,440
|
||||
|
Basic net income per share
|
$
|
2.49
|
$
|
3.09
|
||||
|
Diluted net income per share
|
$
|
2.46
|
$
|
3.07
|
||||
For the year ended December 31, 2018, the pro forma results include an immaterial amount of adjustments to conform Landair to the accounting policies of the Company related to operations and maintenance and insurance and claims. In addition, salaries, wages, and related expenses decreased by a net of $2.1 million related to sale bonuses and non-recurring compensation paid to a prior owner of Landair, partially offset by restricted shares granted to key retained employees. General supplies and expenses decreased by $3.4 million related to non-recurring acquisition-related expenses. Depreciation and amortization increased by $1.1 million due to the amortization of intangible assets as detailed in Note 5, partially offset by a net decrease resulting from the depreciation of property, plant, and equipment using useful lives consistent with those utilized by the Company. Interest expense, net increased by approximately $2.0 million as a result of the financing obtained by the Company to fund the Landair Acquisition. Income tax expense was adjusted by approximately $1.7 million for the effect of each of the aforementioned adjustments. Results for the year ended December 31, 2018 exclude two days of Landair’s operations that occurred between the period ended June 30, 2018 and our acquisition on July 3, 2018, but this effect is immaterial.
For the year ended December 31, 2017, the pro forma results include an immaterial amount of adjustments to conform Landair to the accounting policies of the Company related to operations and maintenance and insurance and claims. Depreciation and amortization increased by approximately $2.2 million due to the amortization of intangible assets as detailed in Note 5, partially offset by a net decrease resulting from the depreciation of property, plant, and equipment using useful lives consistent with those utilized by the Company. Interest expense, net increased $4.0 million as a result of the financing obtained by the Company to fund the Landair Acquisition. Income tax expense was adjusted by an immaterial amount for the effect of each of the aforementioned adjustments.
The pro forma adjustments have been made solely for informational purposes. The actual results reported by the consolidated company in periods following the acquisition may differ significantly from that reflected in the unaudited pro forma consolidated results of operations for a number of reasons, including but not limited to cost savings from operating efficiencies, synergies and the impact of the incremental costs incurred in integrating the two companies. As a result, the unaudited pro forma consolidated results of operations are not intended to represent and does not purport to be indicative of what the combined company’s results of operations would have been had the acquisition been completed on the applicable dates of this unaudited pro forma consolidated results of operations. In addition, the unaudited pro forma consolidated results of operations do not purport to project the future results of operations of the consolidated company.
|
16.
|
SEGMENT INFORMATION
|
As previously discussed, we have two reportable segments, our truckload services or Truckload and Managed Freight, which offer freight brokerage, transportation management services, and
shuttle and switching services
. Included within Managed Freight are our accounts receivable factoring and warehousing businesses, which do not meet the aggregation criteria, but only accounted for $5.0 million and $23.6 million of our revenue, respectively, for the year ended December 31, 2018. Included in Truckload and Managed Freight revenue during the year ended December 31, 2018 is $3.9 million and $0.9 million, respectively, classified as lease revenue resulting from embedded leases for certain tractors and warehouse space.
The accounting policies of the segments are the same as those described in the summary of significant accounting policies. Substantially all intersegment sales prices are market based. We evaluate performance based on operating income of the respective business units.
The following tables summarize our segment information:
|
|
(in thousands)
|
|||||||||||
|
Year Ended December 31, 2018
|
Truckload
|
Managed Freight
|
Consolidated
|
|||||||||
|
Revenue
|
$
|
727,046
|
$
|
165,707
|
$
|
892,753
|
||||||
|
Intersegment revenue
|
-
|
(7,298
|
)
|
(7,298
|
)
|
|||||||
|
Operating income
|
45,392
|
13,594
|
58,986
|
|||||||||
|
Depreciation and amortization (1)
|
75,446
|
710
|
76,156
|
|||||||||
|
Total assets
|
699,266
|
74,258
|
773,524
|
|||||||||
|
Capital expenditures, net
|
(12,864
|
)
|
(591
|
)
|
(13,455
|
)
|
||||||
|
|
||||||||||||
|
Year Ended December 31, 2017
|
||||||||||||
|
Revenue
|
$
|
612,834
|
$
|
98,182
|
$
|
711,016
|
||||||
|
Intersegment revenue
|
-
|
(6,009
|
)
|
(6,009
|
)
|
|||||||
|
Operating income
|
19,567
|
8,588
|
28,155
|
|||||||||
|
Depreciation and amortization (1)
|
76,423
|
24
|
76,447
|
|||||||||
|
Total assets
|
607,189
|
42,479
|
649,668
|
|||||||||
|
Capital expenditures, net (2)
|
71,196
|
810
|
72,006
|
|||||||||
|
|
||||||||||||
|
Year Ended December 31, 2016
|
||||||||||||
|
Revenue
|
$
|
601,226
|
$
|
73,602
|
$
|
674,828
|
||||||
|
Intersegment revenue
|
-
|
(4,177
|
)
|
(4,177
|
)
|
|||||||
|
Operating income
|
24,816
|
7,631
|
32,447
|
|||||||||
|
Depreciation and amortization (1)
|
72,434
|
22
|
72,456
|
|||||||||
|
Total assets
|
589,249
|
31,289
|
620,538
|
|||||||||
|
Capital expenditures, net (2)
|
59,009
|
43
|
59,052
|
|||||||||
|
|
(1)
|
Includes gains and losses on disposition of equipment.
|
|
|
(2)
|
Includes equipment purchased under capital leases.
|
|
17.
|
QUARTERLY RESULTS OF OPERATIONS (UNAUDITED)
|
|
|
(in thousands except per share amounts)
|
|||||||||||||||
|
|
||||||||||||||||
|
|
Mar. 31,
|
June 30,
|
Sep. 30,
|
Dec. 31,
|
||||||||||||
|
Quarters ended
|
2018
|
2018
|
2018
|
2018
|
||||||||||||
|
|
||||||||||||||||
|
Total revenue
|
$
|
173,566
|
$
|
196,318
|
$
|
243,303
|
$
|
272,268
|
||||||||
|
Operating income
|
6,425
|
14,065
|
16,181
|
22,315
|
||||||||||||
|
Net income
|
4,417
|
9,971
|
11,614
|
16,501
|
||||||||||||
|
Basic income per share
|
0.24
|
0.54
|
0.63
|
0.91
|
||||||||||||
|
Diluted income per share
|
0.24
|
0.54
|
0.63
|
0.89
|
||||||||||||
|
|
(in thousands except per share amounts)
|
|||||||||||||||
|
|
||||||||||||||||
|
|
Mar. 31,
|
June 30,
|
Sep. 30,
|
Dec. 31,
|
||||||||||||
|
Quarters ended
|
2017
|
2017
|
2017
|
2017 (1)
|
||||||||||||
|
|
||||||||||||||||
|
Total revenue
|
$
|
158,744
|
$
|
164,326
|
$
|
178,631
|
$
|
203,306
|
||||||||
|
Operating income
|
309
|
3,962
|
9,041
|
14,843
|
||||||||||||
|
Net income
|
(39
|
)
|
1,548
|
4,632
|
49,298
|
|||||||||||
|
Basic income per share
|
(0.00
|
)
|
0.08
|
0.25
|
2.70
|
|||||||||||
|
Diluted income per share
|
(0.00
|
)
|
0.08
|
0.25
|
2.69
|
|||||||||||
|
(1)
|
Includes $40.1 million one-time benefit related to the Tax Act.
|
92
TABLE OF CONTENTS
Part IItem 1. BusinessItem 1A. Risk FactorsItem 1B. Unresolved Staff CommentsItem 2. PropertiesItem 3. Legal ProceedingsItem 4. Mine Safety DisclosuresPart IIItem 5. Market For Registrant's Common Equity, Related Stockholder Matters and Issuer Purchases Of Equity SecuritiesItem 6. Selected Financial DataItem 7. Management's Discussion and Analysis Of Financial Condition and Results Of OperationsItem 7A. Quantitative and Qualitative Disclosures About Market RiskItem 8. Financial Statements and Supplementary DataItem 9. Changes in and Disagreements with Accountants on Accounting and Financial DisclosureItem 9A. Controls and ProceduresItem 9B. Other InformationPart IIIItem 10. Directors, Executive Officers, and Corporate GovernanceItem 11. Executive CompensationItem 12. Security Ownership Of Certain Beneficial Owners and Management and Related Stockholder MattersItem 13. Certain Relationships and Related Transactions, and Director IndependenceItem 14. Principal Accounting Fees and ServicesPart IVItem 16. Form 10-k Summary