COMMVAULT SYSTEMS INC
10-Ks and 10-Qs
|
|
|
|
|
|
|
|
|
|
|
|
|
|
|
|
|
|
|
|
|
|
|
|
|
|
|
|
|
|
|
|
|
|
|
|
|
|
|
|
|
|
|
|
|
|
|
|
|
|
UNITED STATES SECURITIES AND EXCHANGE COMMISSION
Washington, D.C. 20549
Form 10-K
ANNUAL REPORT PURSUANT TO SECTION 13 OR 15(d)
OF THE SECURITIES EXCHANGE ACT OF 1934
For the fiscal year ended
March 31, 2018
Commission File Number: 1-33026

Commvault Systems, Inc.
(Exact name of registrant as specified in its charter)
|
Delaware
|
|
22-3447504
|
|
(State or other jurisdiction of
incorporation or organization)
|
|
(I.R.S. Employer
Identification No.)
|
|
1 Commvault Way
Tinton Falls, New Jersey
|
|
07724
|
|
(Address of principal executive offices)
|
|
(Zip Code)
|
(732) 870-4000
(Registrant’s telephone number, including area code)
Securities registered pursuant to Section 12(b) of the Act: None
Securities registered pursuant to Section 12(g) of the Act:
|
Title of each class
|
|
Name of each exchange on which registered
|
|
Common Stock, $0.01 par value
|
|
The NASDAQ Stock Market
|
Indicate by check mark if the registrant is a well-known seasoned issuer, as defined in Rule 405 of the Securities Act. Yes
þ
No
¨
Indicate by check mark if the registrant is not required to file reports pursuant to Section 13 or Section 15(d) of the Act. Yes
¨
No
þ
Indicate by check mark whether the registrant (1) has filed all reports required to be filed by the Section 13 or 15(d) of the Securities Exchange Act of 1934 during the preceding 12 months (or for such shorter period that the Registrant was required to file such reports), and (2) has been subject to such filing requirements for the past 90 days. Yes
þ
No
¨
Indicate by check mark whether the registrant has submitted electronically and posted on its corporate Web site, if any, every Interactive Data File required to be submitted and posted pursuant to Rule 405 of Regulation S-T (§232.405 of this chapter) during the preceding 12 months (or for such shorter period that registrant was required to submit and post such files.) Yes
þ
No
¨
Indicate by check mark if disclosure of delinquent filers pursuant to Item 405 of Regulation S-K is not contained herein, and will not be contained, to the best of the registrant’s knowledge, in definitive proxy or information statements incorporated by reference in Part III of this Form 10-K or any amendment to this Form 10-K.
þ
Indicate by check mark whether the registrant is a large accelerated filer, an accelerated filer, a non-accelerated filer, or a smaller reporting company. See definition of “large accelerated filer,” “accelerated filer” and “emerging growth company” in rule 12b-2 of the Exchange Act.
|
Large accelerated filer
þ
|
Accelerated filer
o
|
Non-accelerated filer
o
|
Smaller reporting company
o
|
|
Emerging growth company
o
|
|||
If an emerging growth company, indicate by check mark if the registrant has elected not to use the extended transition period for complying with any new or revised financial accounting standards provided pursuant to Section 13 (a) of the Exchange Act
o
Indicate by check mark whether the registrant is a shell company (as defined in Rule 12b-2 of the Exchange Act). Yes
¨
No
þ
As of September 30, 2017, the last business day of the Registrant’s most recently completed second fiscal quarter; the aggregate market value of voting and non-voting common stock held by non-affiliates of the registrant (based upon the closing price of the common stock as reported by The NASDAQ Stock Market) was approximately
$2.6 billion
.
As of
May 1, 2018
, there were 45,482,346 shares of the registrant’s common stock ($0.01 par value) outstanding.
DOCUMENTS INCORPORATED BY REFERENCE
Information required by Part III (Items 10, 11, 12, 13 and 14) is incorporated by reference to portions of the registrant’s definitive Proxy Statement for its
2018
Annual Meeting of Stockholders (the “Proxy Statement”), which is expected to be filed not later than 120 days after the registrant’s fiscal year ended
March 31, 2018
. Except as expressly incorporated by reference, the Proxy Statement shall not be deemed to be part of this report on Form 10-K.
COMMVAULT SYSTEMS, INC.
FORM 10-K
FISCAL YEAR ENDED MARCH 31,
2018
TABLE OF CONTENTS
|
|
|
Page
|
|
PART I
|
||
|
Item 1.
|
||
|
Item 1A.
|
||
|
Item 1B.
|
||
|
Item 2.
|
||
|
Item 3.
|
||
|
Item 4.
|
||
|
PART II
|
||
|
Item 5.
|
||
|
Item 6.
|
||
|
Item 7.
|
||
|
Item 7A.
|
||
|
Item 8.
|
||
|
Item 9.
|
||
|
Item 9A.
|
||
|
Item 9B.
|
||
|
PART III
|
||
|
Item 10.
|
||
|
Item 11.
|
||
|
Item 12.
|
||
|
Item 13.
|
||
|
Item 14.
|
||
|
PART IV
|
||
|
Item 15.
|
||
|
Item 16.
|
||
2
FORWARD-LOOKING STATEMENTS
The discussion throughout this Annual Report on Form 10-K contains forward-looking statements. In some cases, you can identify these statements by our use of forward-looking words such as “may,” “will,” “should,” “anticipate,” “estimate,” “expect,” “plan,” “believe,” “predict,” “potential,” “project,” “intend,” “could” or similar expressions. In particular, statements regarding our plans, strategies, prospects and expectations regarding our business are forward-looking statements within the meaning of Section 21E of the Securities Exchange Act of 1934, as amended (the "Exchange Act"). You should be aware that these statements and any other forward-looking statements in this document reflect only our expectations and are not guarantees of performance. These statements involve risks, uncertainties and assumptions. Many of these risks, uncertainties and assumptions are beyond our control and may cause actual results and performance to differ materially from our expectations. Important factors that could cause our actual results to be materially different from our expectations include the risks and uncertainties set forth under the heading “Risk Factors.” Accordingly, you should not place undue reliance on the forward-looking statements contained in this Annual Report on Form 10-K. These forward-looking statements speak only as of the date on which the statements were made. We undertake no obligation to update or revise publicly any forward-looking statements, whether as a result of new information, future events or otherwise, except as required by law.
3
|
Item 1.
|
Business
|
Company Overview
Commvault is a leading provider of data protection and information management software applications and related services. Commvault was incorporated in 1996 as a Delaware corporation. The Commvault software platform is an enterprise level, integrated protection data and information management solution, built from the ground up on a single platform and unified code base. All software functionality shares the same back-end technologies to deliver the benefits of a holistic approach to protecting, managing, and accessing data. The software addresses many aspects of data management in the enterprise, while providing scalability and control of data and information. We also provide our customers with a broad range of professional services that are delivered by our worldwide support and field operations.
Key features of our software platform include:
|
•
|
Data protection solutions supporting all major operating systems, applications, and databases on virtual and physical servers, network-attached storage, cloud-based infrastructures, and mobile devices;
|
|
•
|
Management through a single console; view, manage, and access all functions and all data and information across the enterprise;
|
|
•
|
Multiple protection methods including backup and archive, snapshot management, replication, and content indexing for eDiscovery;
|
|
•
|
Efficient storage management using deduplication for disk, tape and cloud;
|
|
•
|
Integration with the industry's top storage arrays to automate the creation of indexed, application-aware hardware snapshot copies across multi-vendor storage environments;
|
|
•
|
Complete virtual infrastructure management supporting multiple hypervisors, including VMware and Hyper-V;
|
|
•
|
Security capabilities to limit access to critical data, provide granular management capabilities, and provide single sign on access for Active Directory users;
|
|
•
|
Policy based data management, allowing users to manage data based on business needs and not physical location; and
|
|
•
|
An end-user experience that allows them to protect, find and recover their own data using common tools such as web browsers, Microsoft Outlook and File Explorer.
|
Commvault software is built upon an innovative single platform architecture. We refer to the single, unified code base underlying each of our applications as our Single Platform. Our Single Platform is unique and differentiates us from our competitors, some of whom address market needs by offering multiple and disparate point products that have come together as a collection often as a result of acquisition strategies. We believe that the disparate and point product approach forces users to install and maintain separate products requiring their own infrastructure, training, maintenance and management which can result in a complex and costly environment for customers who are looking for a single solution that will improve operations, minimize risk and reduce overall costs.
Commvault software enables customers to simply and cost effectively protect and manage their enterprise data throughout its lifecycle, from the mobile worker to the remote office, to the data center, covering the leading operating systems, relational databases, virtualized environments and applications. In addition to addressing today’s data and information management challenges, our customers can realize lower capital costs through more efficient use of their enterprise-wide storage infrastructure assets. This includes the automated movement of data from higher cost to lower cost storage devices, and through sharing and better utilization of storage resources across the enterprise. We can also provide our customers with reduced operating costs through a variety of methods, including fast application deployment, reduced training time, lower cost of storage media consumables, proactive monitoring and analysis, and lower administrative overhead.
In fiscal 2018, we started selling appliances that integrate our software with hardware and address a wide-range of business needs and use cases, ranging from support for remote or branch offices with limited IT staff up to large corporate data centers. These appliances, based on Commvault’s innovative HyperScale software architecture are targeted for ease of procurement, installation, and operation for mid market and small enterprise customers. The same HyperScale software architecture is extensible to multiple petabytes when deployed in Commvault’s Reference Design Program and integrated with our Alliance partners’ x86 server architecture.
4
We have established a worldwide, multi-channel distribution network to sell our software and products, and services to large global enterprises, small and medium sized businesses and government agencies, both directly through our sales force and indirectly through our global network of value-added reseller partners, systems integrators, corporate resellers and original equipment manufacturers. As of
March 31, 2018
, we had licensed our data and information management software to over
26,000
registered customers.
Our internet address is www.commvault.com. On this website, we post the following filings as soon as reasonably practicable after they are electronically filed with or furnished to the U.S. Securities and Exchange Commission (SEC): our Annual Reports on Form 10-K, our quarterly reports on Form 10-Q, our current reports on Form 8-K, our proxy statements related to our annual stockholders’ meetings and any amendment to those reports or statements filed or furnished pursuant to Section 13(a) or 15(d) of the Securities Exchange Act of 1934, as amended. All such filings are available on the Investors Relations portion of our web site free of charge. The contents of our web site are not incorporated by reference into this Form 10-K or in any other report, statement or document we file with the SEC.
Industry Background
The driving force behind the growth of the data and information management software industry is the rapid growth of data, coupled with the need to reliably protect and quickly access that data, while maintaining the ability to effectively manage the emerging regulations around compliance and e-discovery.
The increasing reliance on critical enterprise software applications such as e-mail, relational databases, enterprise resource planning, customer relationship management and workgroup collaboration tools is resulting in the rapid growth of data across all enterprises. This data is widely considered to be one of an organization’s most valued and strategic assets. Given the need for actionable and intelligent insights into data sets and file systems, organizations increasingly must scale and store information at unprecedented levels. Big data initiatives leverage new approaches and technologies to store, index and analyze huge data sets, while minimizing storage requirements and driving faster outcomes.
Ensuring the security, availability and integrity of the data has become a critical task as regulatory compliance and corporate governance objectives affecting many organizations mandate the creation of multiple copies of data with longer and more complex retention requirements. Government regulations, such as those issued under the Sarbanes-Oxley Act, the Health Insurance Portability and Accountability Act (HIPAA), Government Paper Elimination Act (GPEA), Homeland Security, the Patriot Act, Freedom of Information Act (FOIA), the Basel Committee on Banking Supervision ("The Basel Accords"), the Dodd-Frank Wall Street Reform and Consumer Protection Act, GDPR, as well as company policies requiring data access, protection and preservation, are expanding the proportion of data that must be archived and easily accessible for future use.
In addition to rapid data growth, data storage has transitioned from being server-attached to becoming widely distributed across local and global networked storage systems. Data previously stored on primary disk and backed up on tape is increasingly being backed up, managed and stored on a broader array of storage tiers ranging from high-cost, high-performance disk systems, to lower-cost mid-range and low-end disk systems, to tape libraries and both public and private cloud storage services. This transition has been driven by the growth of data, the pervasive use of distributed critical enterprise software applications, the decrease in disk cost, and the demand for 24/7 business continuity.
The innovations in storage and networking technologies, coupled with the rapid growth of data, have caused information technology managers to redesign their data and storage infrastructures to deliver greater efficiency, broaden access to data and reduce costs. The result has been the wide adoption of virtualized environments with larger and more complex networked data and storage solutions. We also believe the cloud will continue to significantly impact the way that applications are delivered, data is stored and information is retrieved.
The rapid growth of data and the need to securely protect, manage and access this data is driving substantial opportunities for managed service providers ("MSPs") to help organizations deploy and manage solutions that deliver data management capabilities. The result is reduced long-term management costs with increased offerings to customers, which we believe represents a long-term industry trend in the way that services are offered.
We believe that these trends are increasing the demand for software applications that can simplify data and information management, provide secure and reliable access to all data across a broad spectrum of tiered storage and computing systems and seamlessly scale to accommodate growth, while reducing the total cost of ownership to the customer.
5
Our Software and Products
Historically, the vast majority of our software licenses provided for a perpetual right to use our software and are sold on a per terabyte capacity basis, per-copy, as site licenses or as a solution set. In recent years, most of our software and products revenue has been sold on a capacity basis. Software licenses sold on a capacity basis provide the customer with unlimited licenses of specified software products based on a defined level of terabytes of data under management. As a result, when we sell our software via a capacity license, certain of the various functionalities discussed below are bundled into one capacity based price. Site licenses give the customer the additional right to deploy the software on a limited basis during a specified term.
Our solution sets are generally sold on a per unit basis such as per virtual machine for our virtual machine backup, recovery and cloud management solution set; per mailbox for our email archive solution set, and per user for our endpoint data protection solution set. These solution sets are purpose-built offerings designed to accelerate private, public and hybrid cloud adoption that seamlessly integrate with our single platform software, offering a path towards holistic data management while allowing customers to utilize functionality that addresses the point solution requirements their business dictates. We primarily sell solution sets for virtual machine backup, recovery and cloud management; endpoint data protection; and email archive.
Prior to fiscal 2018, an insignificant amount of our revenue was sold under subscription, or term based, license arrangements. Any of our licensing models (capacity, solution set, etc.) can be sold via a subscription arrangement. In these arrangements the customer has the right to use the software over a designated period of time. The capacity of the license is fixed and the customer has made an unconditional commitment to pay. Software revenue in these arrangements is recognized when the software is delivered. In fiscal 2018, we started to introduce more subscription arrangements into the market. We expect revenue from these types of arrangements as a percentage of our total revenue to increase in the next few years. We also sell to some customers, primarily managed service providers, via utility, or pay-as-you-go models. In these arrangements actual usage is regularly measured and billed. Revenue in these utility arrangements is recognized as the software is used.
Commvault Software Solutions
The Commvault software suite contains solutions that are all built on a single unified code base and platform to protect, manage and access data and information. Within the platform, tightly integrated, powerful software features deliver functionality throughout physical and virtual environments to help protect and recover data, manage costs and complexity and gain better insight into information. Our primary software solutions are Data Protection, Backup and Recovery; Cloud and Infrastructure Management; and Retention and Compliance.
Data Protection, Backup and Recovery
Our Data Protection, Backup and Recovery software solutions provide enterprise-level backup and recovery from a single, centralized management console. It covers the full range of data sources, file types, storage media and backup modes - from snapshots to streaming. Our integrated, automated data protection approach provides a single, complete view of all stored data no matter if it is on premises or in the cloud. Our software solution allows for the backup of databases, files, applications, endpoints and virtual machines (VMs) with maximum efficiency according to data type and recovery profile. It also helps to optimize storage with deduplication, recover data rapidly and easily and leverage reports to continually improve backup and recovery processes.
Virtual Machines (VMs) and Cloud Platforms
Our software solution for VM backup, recovery and cloud management delivers a number of benefits such as: VM recovery with live recovery options; backup to and in the cloud; custom-fit data protection for SLAs; broad hardware snapshot management; and workload portability across physical, virtual and cloud platforms. We offer a cloud management solution across multiple VM and cloud platforms, including Amazon Web Services (AWS), Microsoft Azure, Google Cloud and VMware.
Databases
We provide a simple way to protect and recover business-critical databases through automatic discovery, push-button recovery, intuitive deduplication, cloning/replication, and by hardware snapshots through built-in application integration. We believe we eliminate the need for multiple, costly backup tools and complex scripting, while improving database performance. Our objective is to accelerate recovery and shrink backup windows, while providing granular, table-level recovery.
6
Email and Enterprise Applications
Email along with enterprise applications are critical to a business. We believe a significant portion of business-critical information is stored in email so reliable backup and recovery is essential. Commvault Data Protection, Backup and Recovery gives users self-service access to search and restore messages without IT intervention. Our solution provides an enterprise a single solution to backup, restore and archive their important messaging applications. In addition, we provide our customers the ability to protect a wide range of applications, such as SharePoint, Exchange, Oracle, Office 365, and SAP enterprise software solutions.
File Protection and Recovery
Our software solution brings unstructured data into management. Our File Protection and Recovery solution make it easy to find, recover and restore lost or damaged files at any level of granularity, from single files to whole file systems. In addition, business files stored in third-party file sharing applications can be protected in a secure, searchable and centralized virtual repository. Our integrated snapshot management indexes snapshots to make them searchable, making file recovery an easy process.
Endpoint Data Protection
Our Endpoint Data Protection solution enables data created and stored on laptops and desktops to be accessible anytime with a self-service recovery portal accessible from any web browser or mobile device. Our solution covers endpoint data on laptops, desktops and other devices with source-side deduplication, opportunistic scheduling and bandwidth throttling. This solution is offered both on-premises (customer operated) and "as-a-service" (Commvault operated).
Source-side Deduplication
Our software solutions integrate deduplication functionality directly into our software for a backup and recovery approach that is scalable and cost effective. Source-side deduplication can boost backup speeds while decreasing storage and network resource consumption whether protecting data in private or public clouds, remote office servers, laptops or critical applications in the data center.
Cloud and Infrastructure Management
Our Cloud and Infrastructure Management software solutions provide an efficient way to manage storage hardware and virtual infrastructure as data volumes grow and more applications move to the cloud.
VM and Cloud Management
Our holistic approach to cloud management allows companies to manage a virtual infrastructure across multiple hypervisors and cloud platforms. Our VM and Cloud Management solution can streamline operations over the entire VM lifecycle, from provisioning to protection to decommissioning. With our software solution, companies can manage VMware, Microsoft Hyper-V, Amazon Web Services EC2, Google Cloud and Microsoft Azure hypervisors through a single solution to get the most out of all their technologies.
Snapshot Management
Our software solutions can simplify snapshot management with a single console for many hardware storage vendors. Our built-in reporting and alerting lets users perform more detailed utilization and capacity planning for hardware snapshots. With our Snapshot Management software solution, hardware snapshots can be managed across a wide selection of vendors such as DataCore, Dell-EMC, Fujitsu, HPE, Hitachi Vantara, Huawei, IBM, INFINIDAT, NetApp, Nimble Storage, Nutanix, Oracle ZFS and Pure Storage. Our underlying IntelliSnap™ technology provides the multi-vendor flexibility.
Orchestration
Our software solutions automate repetitive or highly complex data management tasks by combining individual process sets in a specific order or decision tree. Configuring our software to meet company specific IT needs can be achieved whether using our pre-built workflows or design or a company’s own with our graphical user interface.
7
Retention and Compliance
Our single virtual content repository makes it easier to index, archive and search managed data using our Retention and Compliance software solutions.
Content Based Retention
Our Content Based Retention solution provides for user-defined retention policies to automatically organize, classify and store information based on relevant and usable criteria, such as file name, type, content, tags and keywords which can reduce complexity and risk of storing massive volumes of data.
Enterprise Search and E-Discovery
Our Enterprise Search and E-Discovery solution allows users to find information needed to satisfy internal search requirements or respond to external eDiscovery requests. We believe our software solution can minimize risk and exposure by providing a single, integrated platform for enterprise search and eDiscovery across the full range of devices, apps and file types.
Email Archiving
Our single, unified data management platform supports detailed archiving policies for email environments, including cloud email solutions like Microsoft Office 365. Users can classify data by application and automate email data management, even as volumes continue to grow. We also streamline eDiscovery across data silos, making email data accessible via a single, comprehensive platform.
Data Loss Prevention
Our software solutions include a number of built-in endpoint data protection and security features to help prevent unauthorized access and, if necessary, quickly restore files or applications to a new device. We believe our comprehensive approach to data loss prevention makes it easy to minimize compliance and litigation risks associated with losing critical business data.
Secure File Sharing
Our enterprise file-sharing capabilities allow for anytime access to data through a private cloud that is more secure than email or consumer file-sharing services. End-users can collaborate and still remain compliant with data-governance requirements while reducing the risk of exposing sensitive corporate data to unauthorized access.
Commvault HyperScale™ Technology
Introduced in fiscal 2018, Commvault HyperScale™ Technology is a cloud-ready, on premises data management solution that transforms a significant portion of enterprise infrastructure to provide cloud-like simplicity, elasticity, resiliency, flexibility and scale for secondary use cases in a modern scale-out approach. The software includes active copy management, hardware snapshot integration, support for all enterprise applications and physical, virtual and cloud platforms and SLA based polices and plans. Software defined services running on general purpose server based nodes, eliminate the need for dedicated media servers and expensive controller based storage, with the potential for reducing infrastructure costs significantly. A sophisticated orchestration engine, programmable API and direct data access through standard interfaces allow enterprises to embed these data management services, seamlessly into a broader cloud framework. This modern approach to data protection is available in two form factors - an all-in-one, preconfigured appliance form factor, and as reference architecture software version to be configured with the customers’ hardware of choice.
Commvault HyperScale™ Software
Commvault HyperScale Software is a unique scale-out infrastructure based on customer hardware preferences, enabling organizations to choose hardware configuration sizes and models from leading technology companies, including these initial program participants: Fujitsu, Cisco, Lenovo, HPE, Super Micro Computer, Huawei and Dell-EMC. Through the consumption of Commvault HyperScale Software, customers receive tested configurations that provide validated designs complemented by best-practice configurations. This simplified approach helps enterprises match hardware configurations and capacity to their secondary storage needs, while accelerating return on investment, reducing complexity and adding greater customer value.
8
Commvault HyperScale™ Appliance
In fiscal 2018, we started selling appliances that integrate the Company's software with hardware and address a wide-range of business needs and use cases, ranging from support for remote or branch offices with limited IT staff up to large corporate data centers. For customers wanting an all-in-one solution from acquisition to deployment, Commvault has introduced Commvault HyperScale Appliance, a highly differentiated data infrastructure solution that tightly integrates compute, storage, networking, virtualization, backup and recovery, full lifecycle data management and analytics into a single platform across the data center and in the cloud. Built on Commvault's technology, it enables customers to significantly decrease complexity and cost while increasing both scalability and IT agility. Because this solution is pre-designed, built, sold and supported by Commvault, customers save time in hardware acquisition, installation and integration, daily management and patching and updating.
Scale Protect with Cisco UCS
Consistent with Commvault’s strategy to extend strategic alliances relationships to grow markets and expand selling opportunities, Commvault extended its partnership with Cisco, and together the two companies released a uniquely-branded offering of Commvault HyperScale Software, combined with leading data center technology from the Cisco UCS offering. Known as Scale Protect with Cisco UCS, the scale out solution with Commvault HyperScale Software is available on the Cisco price list, from Cisco sales personnel, and through the Cisco reseller channel.
Services
A comprehensive global offering of customer support and other professional services is critical to the successful marketing, sale and deployment of our software. From planning, to deployment, to operations, we offer a complete set of technical services, training and support options that maximize the operational benefits of our suite of software applications. Our commitment to superior customer support is reflected in the breadth and depth of our service offerings as well as in our ongoing initiatives to engineer resiliency, automation and serviceability features directly into our products.
We have established a global customer support organization built specifically to handle our expanding customer base. We offer multiple levels of customer support that can be tailored to the customer’s response needs and business sensitivities. Our customer support services consist of:
|
•
|
Real-Time Support.
Our support staff is available 24/7 by telephone to provide first response and manage the resolution of customer issues. In addition to phone support, our customers have access to an online product support database for help with troubleshooting and operational questions. Innovative use of web-based diagnostic tools provides problem analysis and resolution. Our software design is also an important element in our comprehensive customer support, including “root cause” problem analysis, intelligent alerting and troubleshooting assistance. Our software is directly linked to our online support database allowing customers to analyze problems without engaging our technical support personnel.
|
|
•
|
Significant Network and Hardware Expertise.
Our support engineers have extensive knowledge of complex applications, servers and networks. We proactively take ownership of the customer’s problem, regardless of whether the issue is directly related to our products or to those of another vendor. We have also developed and maintain a knowledge library of storage systems and software products to further enable our support organization to quickly and effectively resolve customer problems.
|
|
•
|
Global Operations.
Our global customer support headquarters is located at our state-of-the-art technical support center in Tinton Falls, New Jersey. We also have established support operations in Reading, United Kingdom; Sydney, Australia; and Shanghai, China, which are complemented by regional support centers in other worldwide locations. Our cloud-based support system creates a virtual global support center combining these locations to allow for the fastest possible resolution times for customer incidents. We have designed our support infrastructure to be able to scale with the increasing globalization of our customers.
|
|
•
|
Enhanced Support Options
. We offer several enhanced customer support services such as Enterprise Support. Our Enterprise Support service is for customers with critical support needs and builds on our 24/7 real-time support deliverables and includes various levels of enhanced services to ensure dedicated support and customized reporting. Enterprise Support adds a specialized team of technical support engineers, an assigned support account manager and innovative tools to achieve our customers’ mission.
|
9
Our technology consultants ensure that our customers' software environment is designed for optimal results and will continue to deliver over the long term. This same team of experts can install, configure, personalize and validate that environment so customers can achieve a better return on investment, faster and with more confidence.
|
•
|
Technology Consulting Services.
Our technology consulting ensure that a customer’s software environment is designed for optimal results and will continue to deliver over the long term. We offer services such as architecture design; implementation; personalization; data migration; and health assessment. In addition, our residency services offer customers staff-augmentation options to assist with the rapid expert deployment of the Commvault software suite.
|
|
•
|
Business Consulting Services.
Our business consultants provide transformational insights that align to how specific businesses gather, retain and employ data. We offer services such as disaster recovery readiness and policy implementation; private cloud services design; data classification and archive policy implementation; and operational efficiency assessment.
|
|
•
|
Education Services.
We provide global onsite training, offsite training and self-paced online alternatives for our products. Packaged or customized customer training courses are available in instructor-led or computer-based formats. We offer in-depth training and certification for our resellers in pre- and post-sales support methodologies, including web access to customizable documentation and training materials. In addition, we offer a Commvault Certification Program that validates expertise and advanced knowledge in topics, including Commvault Core Fundamentals, Implementation and Maintenance. We also offer more advanced Specialist, Engineer and Master technologies certifications. We believe certified personnel can increase a company's productivity and reduce operating costs.
|
|
•
|
Remote Managed Services.
Commvault Remote Managed Services provides remote monitoring and management of the Commvault data management platform deployed on a customer's environment. Our engineers configure, maintain and optimize a customer's Commvault software environment remotely via a secure connection.
|
|
•
|
Commvault Software-as-a-Service.
In fiscal 2018, we fully launched Commvault Endpoint Data Protection as a Service to simplify and streamline the backup and recovery of corporate data stored on laptops, desktops and other devices in one flexible, easy-to-use software as a service (SaaS) offering. Fully managed by Commvault in the cloud with 24/7 customer support, Commvault Endpoint Data Protection as a Service eliminates the need for in-house infrastructure installation and reduces application management resources. We anticipate expanding Commvault Software-as-a-Service to additional use cases in the future.
|
Strategic Relationships
An important element of Commvault’s strategy is to establish relationships with third parties that assist us in developing, marketing, selling and implementing our software and services. We believe that strategic and technology-based relationships with industry leaders are fundamental to our success. We have forged numerous relationships with software application and hardware vendors to enhance our combined capabilities and to create the optimal combination of data and information management applications. This approach enhances our ability to expand our product offerings and customer base and to enter new markets. We have established the following types of strategic relationships:
Technology Alliance Partners
. We maintain strategic product and technology relationships with major industry leaders to ensure that our software applications are integrated with, supported by and add value to our partners’ hardware and software products. Collaboration with these market leaders allows us to provide applications that enable our customers to improve data and information management efficiency. Our significant strategic relationships include Atos, Cisco, Citrix, Fujitsu, Hewlett Packard Enterprise (HPE), Infinidat, Microsoft, Oracle, SAP, and VMware. In addition to these relationships, we maintain relationships with a broad range of industry operating system, application and infrastructure vendors to verify and demonstrate the interoperability of our software applications with their equipment and technologies.
Distributors, Value-Added Reseller, Systems Integrator, Corporate Reseller and Original Equipment Manufacturer Relationships.
Our corporate resellers bundle or sell our software applications together with their own products, and our value-added resellers resell our software applications independently. As of
March 31, 2018
, we had more than 500 reseller partners and systems integrators that have distributed our software worldwide.
In order to broaden our market coverage, we work closely with our Global Original Equipment Manufacturer (OEM) Partners, investing significant time and resources to deliver unique, joint solutions incorporating Commvault software. These partners team with our technical, engineering, marketing and sales force on helping to enhance integration, tuning, operational management, implementation and vision for solutions that are designed to meet current and future data and information
10
management needs. Our alliance managers work directly with Global OEM Partners to design, deliver and support field activities that make it easier for customers to locate, learn about, and purchase these differentiated solutions. Our most significant OEM partner is Hitachi Vantara (Hitachi). Hitachi has no obligation to recommend or offer our software applications exclusively or at all, and they have no minimum sales requirements and can terminate our relationship at any time. Sales through our original equipment manufacturer agreements, accounted for
12%
of our total revenues in
fiscal 2018
and
15%
of our total revenues for
fiscal 2017
.
Additionally, we have a non-exclusive distribution agreements covering our North American commercial markets and our U.S. Federal Government markets with Arrow Enterprise Computing Solutions, Inc. (Arrow), a subsidiary of Arrow Electronics, Inc. Pursuant to these distribution agreements, Arrow's primary role is to enable a more efficient and effective distribution channel for our products and services by managing our reseller partners and leveraging their own industry experience. Sales generated through our distribution agreement with Arrow accounted for approximately
36%
of our total revenue in
fiscal 2018
and
fiscal 2017
.
Service Provider Partners.
Our software is the data protection platform for over 200 service providers, which provide cloud-based solutions to client systems worldwide. As companies of all sizes and markets rapidly adopt cloud infrastructures for improved costs, speed and agility, we remain committed to these strategic relationships to address this growing trend. Customers looking to move IT operations into the cloud depend on service providers to help them migrate, manage and protect their cloud infrastructures. We have partnered with a broad ecosystem of managed service provider and cloud partners so they can effectively deliver data management-as-a-service solutions based on Commvault software across geographies, vertical markets and offerings. Leading providers who have integrated Commvault software into their solution portfolios include Microsoft Windows Azure, AWS, Dimension Data, NetApp, and Rackspace.
Customers
We sell Commvault software applications and related services directly to large global enterprises, small and medium sized businesses and government agencies, and indirectly through value-added resellers, systems integrators, corporate resellers and original equipment manufacturer partners. As of
March 31, 2018
, we had licensed our software applications to over
26,000
registered customers in a broad range of industries, including banking, insurance and financial services, government, healthcare, pharmaceuticals and medical services, technology, legal, manufacturing, utilities and energy.
Technology
We believe our Single Platform serves as a major differentiator versus our competitors’ data and information management software products. Our Single Platform’s unique indexing, cataloging, data movement, media management and policy technologies are the source of the performance, scale, management, cost of ownership benefits and seamless interoperability inherent in all of our data and information management software applications. Additional options enable content search, data encryption and auditing features to support data discovery and compliance requirements. Each of these solutions share a common architecture consisting of three core components: intelligent agent software, data movement software and command and control software. These components may be installed on a single host server, or each may be distributed over many servers in a global network. Additionally, the modularity of our software provides deployment flexibility. The ability to share storage resources across multiple data and information management applications provides easier data and information management and lower total cost of ownership. We participate in industry standards groups and activities that we believe will have a direct bearing on the data and information management software market.
Sales and Marketing
We sell our data and information management software applications and related services to large global enterprises, small and medium sized businesses, and government agencies. We sell through our worldwide direct sales force and our global network of distributors, value-added resellers, systems integrators, corporate resellers and original equipment manufacturer partners. As of
March 31, 2018
, we had
944
employees in sales and marketing. These employees are primarily located in North America, Europe, Australia and Asia.
We have a variety of marketing programs designed to create brand awareness and market recognition for our product offerings and for sales lead generation. Our marketing efforts include our annual customer conference (Commvault GO), active participation at trade shows, technical conferences and technology seminars; advertising; content development and distribution; public relations; social media; industry analyst relations; publication of technical and educational articles in industry journals; sales training; and preparation of competitive analyses. In addition, our strategic partners augment our marketing and sales campaigns through seminars, trade shows and joint public relations and advertising campaigns. Our customers and strategic partners provide references and recommendations that we often feature in external marketing activities.
11
Research and Development
Our research and development organization is responsible for the design, development, testing and certification of our data and information management software applications. As of
March 31, 2018
, we had
638
employees in our research and development group, of which 230 are located in our Hyderabad and Bangalore development centers in India. Our engineering efforts support product development across all major operating systems, databases, applications and network storage devices. A substantial amount of our development effort goes into certification, integration and support of our applications to ensure interoperability with our strategic partners’ hardware and software products. We have also made substantial investments in the automation of our product test and quality assurance laboratories. We spent
$94.2 million
on research and development activities in
fiscal 2018
,
$83.5 million
in
fiscal 2017
and
$69.3 million
in
fiscal 2016
.
Competition
The data storage management market is intensely competitive, highly fragmented and characterized by rapidly changing technology and evolving standards. We currently compete with other providers of data and information management software as well as large and emerging storage hardware manufacturers that have developed or acquired their own data and information management software products. These manufacturers have the resources and capabilities to develop their own data and information management software applications, and many have been making acquisitions and broadening their efforts to include broader data and information management and storage products. These manufacturers and/or our other current and potential competitors may establish cooperative relationships among themselves or with third parties, creating new competitors or alliances. Large operating system and application vendors have introduced products or functionality that includes some of the same functions offered by our software applications. In the future, further development by these vendors could cause some features of our software applications to become redundant.
Our primary competitors in the data and information management software applications market, each of which has one or more products that compete with a part of or our entire software suite, are Dell EMC, IBM, Veritas, Veeam, Rubrik and Cohesity.
The principal competitive factors in our industry include product functionality, product performance, product integration, platform coverage, ability to scale, price, worldwide sales infrastructure, global technical support, name recognition and reputation. The ability of major system vendors to bundle hardware and software solutions is also a significant competitive factor in our industry. Although some of our competitors have greater resources, a larger installed customer base and greater name recognition, we believe we compete favorably on the basis of these competitive factors.
Our unique product architecture is one of the primary reasons why we compete so successfully. Whereas other competitive solutions in the market are based on multiple, disparate products, our modular offering is based on a single, unified, underlying code base resulting in favorable efficiencies in functionality, integration, scalability and support. Our focused approach to data and information management and our ability to respond to customer feedback also drives the functionality and features of our products, which we believe lead the industry in terms of performance and usability, as evidenced by numerous industry awards we have received.
From a customer perspective, highly integrated products such as ours, which are based on a single, unified, underlying code base, are easier and less expensive to deploy, operate and manage. This flexibility, in turn, makes it significantly easier to scale our products over a customer’s entire IT environment. Supporting and enhancing our products is made more efficient due to this single, unified, underlying code base, unlike our competitors who are required to support and enhance multiple, disparate products, most of which are based on differing underlying software code. Supporting multiple, disparate products places more onerous and costly demands on our competitors’ internal human and operational capital. We believe that Commvault software, because of its unique architecture, creates a compelling functional, integration, scalability and support advantage. We continue to expand our worldwide sales infrastructure and increase our distribution throughout the Americas, Europe, Middle East, Africa, Australia and Asia to meet the needs of our business.
12
Some of our competitors have greater financial resources and may have the ability to offer their products at lower prices than ours. In addition, some of our competitors have greater name recognition than us, which could provide them a competitive advantage with some customers. Some of our competitors also have longer operating histories, have substantially greater technical, sales, marketing and other global resources than we do, as well as a larger installed customer base and broader product offerings, including hardware. As a result, these competitors can devote greater resources to the development, promotion, sale and support of their products than we can.
Intellectual Property and Proprietary Rights
Our success and ability to compete depend on our continued development and protection of our proprietary software and other technologies. We rely primarily on a combination of trade secret, patent, copyright and trademark laws, as well as contractual provisions, to establish and protect our intellectual property rights. We provide our software to customers pursuant to license agreements that impose certain restrictions on use. These license agreements are primarily in the form of shrink-wrap or click-wrap licenses, which are not negotiated with or signed by our end-user customers. These measures may afford only limited protection of our intellectual property and proprietary rights associated with our software. We also enter into confidentiality agreements with employees and consultants involved in product development. We routinely require our employees, customers and potential business partners to enter into confidentiality agreements before we disclose any sensitive aspects of our software, technology or business plans.
As of
March 31, 2018
, we had 586 issued patents and 322 pending patent applications in the United States, as well as 71 issued patents in foreign countries and 26 pending foreign patent applications. No single patent, copyright, trademark, license, or other intellectual property right is solely responsible for protecting our products or services. Moreover, we may lack adequate patent or other intellectual property protection for certain innovations that later turn out to be important to our business. Pending patent applications may receive unfavorable examination and are not guaranteed allowance as issued patents. We may elect to abandon or otherwise not pursue prosecution of certain pending patent applications due to patent examination results, economic considerations, strategic concerns or other factors. We will continue to assess appropriate occasions to seek patent and other intellectual property protection for innovative aspects of our technology that we believe provide us a significant competitive advantage.
Changes to patent laws or regulations in the U.S. and other foreign jurisdictions, or new interpretations of these laws and regulations, could also diminish the value of our patents and patent applications or narrow the scope of our patent protection. For example, changes in patent laws and regulations in the U.S. and new patent laws in Europe may affect the ability of companies, including Commvault, to protect innovations, bring patent infringement claims, and defend against claims of patent infringement. The costs of compliance with these laws and regulations are high and are likely to increase in the future.
Despite our efforts to protect our trade secrets and proprietary rights through patents and license and confidentiality agreements, unauthorized parties may still attempt to copy or otherwise obtain and use our software and technology. In addition, we intend to expand our international operations but effective patent, copyright, trademark and trade secret protection may not be available or may be limited in foreign countries. If we fail to protect our intellectual property and other proprietary rights, our business could be negatively impacted.
We currently resell certain software from Microsoft, including Microsoft SQL Server, used in conjunction with our software applications pursuant to an independent software vendor royalty license and distribution agreement that we have and plan to continue renewing annually. We have also entered into and may enter into agreements with additional third parties, including RedHat, to license their technology for use with our software applications.
Some of the products or technologies acquired, licensed or developed by us may incorporate so-called “open source” software and we may incorporate open source software into other products in the future. The use of such open source software may ultimately subject some products to unintended conditions, such as royalty-free licensing of proprietary portions of our products, disclosing proprietary parts of our source code, or commencing costly product redesigns that could result in a loss of intellectual property rights, product performance degradation, or a delay in shipping products to customers, and which may negatively affect our business, financial condition, operating results, cash flow and ability to commercialize our products or technologies.
From time to time, we are participants or members of various industry standard-setting organizations or other industry technical organizations. Our participation or membership in such organizations may, in some circumstances, require us to enter into royalty or licensing agreements with third parties regarding our intellectual property under terms established by those organizations, which we may find unfavorable.
13
In the United States, we own federal registrations for or have common law trademark rights in the following marks: Commvault, the “C hexagon” logo & Commvault, the “CV” Logo & Commvault, the “C hexagon” logo, the “CV” logo, Commvault Systems, APSS, Commvault GO, Solving Forward, SIM, Singular Information Management, Simpana, Simpana (logo), Commvault Galaxy, Commvault Edge, Unified Data Management, Edge Drive, QiNetix, Quick Recovery, QR, CommNet, GridStor, Vault Tracker, InnerVault, Quick Snap, QSnap, IntelliSnap, Simpana OnePass, Recovery Director, CommServe, CommCell, ROMS, Distinctly Data and CommValue. We also have several other trademarks and have obtained or are actively pursuing trademark registrations in several foreign jurisdictions.
Employees
As of
March 31, 2018
, we had 2,839 employees worldwide, including
944
in sales and marketing,
638
in research and development, 974 in customer services and support and 283 in general and administration.
Executive Officers of the Registrant
The following table presents information with respect to our executive officers as of
May 1, 2018
:
|
Name
|
Age
|
Position
|
||
|
N. Robert Hammer
|
76
|
Chairman, President and Chief Executive Officer
|
||
|
Alan G. Bunte
|
64
|
Executive Vice President, Chief Operating Officer
|
||
|
Brian Carolan
|
47
|
Vice President, Chief Financial Officer
|
||
|
Ron Miiller
|
51
|
Senior Vice President of Worldwide Sales
|
||
N. Robert Hammer
has served as our Chairman, President and Chief Executive Officer since March 1998. Mr. Hammer was also a venture partner from 1997 until December 2003 of the Sprout Group, the venture capital arm of Credit Suisse’s asset management business. Prior to joining the Sprout Group, Mr. Hammer served as the Chairman, President and Chief Executive Officer of Norand Corporation, a portable computer systems manufacturer, from 1988 until its acquisition by Western Atlas, Inc. in 1997. Mr. Hammer led Norand following its leveraged buy-out from Pioneer Hi-Bred International, Inc. and through its initial public offering in 1993. Prior to joining Norand, Mr. Hammer also served as Chairman, President and Chief Executive Officer of publicly-held Telequest Corporation from 1987 until 1988 and of privately-held Material Progress Corporation from 1982 until 1987. Prior to joining Material Progress Corporation, Mr. Hammer spent 15 years in various sales, marketing and management positions with Celanese Corporation, rising to the level of Vice President and General Manager of the structural composites materials business. Mr. Hammer obtained his bachelor’s degree and master’s degree in business administration from Columbia University.
Alan G. Bunte
has served as our Executive Vice President and Chief Operating Officer since October 2003 and served as our Senior Vice President from December 1999 until October 2003. Since January 2008, Mr. Bunte has also served as a Director of Commvault. Prior to joining our company, Mr. Bunte was with Norand Corporation from 1986 to January 1998, serving as its Senior Vice President of planning and business development from 1991 to January 1998. Mr. Bunte obtained his bachelor’s and master’s degrees in business administration from the University of Iowa.
Brian Carolan
has served as our Vice President, Finance and Chief Financial Officer since October 2012. Prior to his current role, Mr. Carolan served as our Vice President, Finance and Chief Accounting Officer from July 2006 until September 2012. He also held the position of Controller from February 2001 until June 2006. Prior to joining our company, Mr. Carolan was with Ernst & Young LLP in its Technology, Communications and Entertainment audit practice from 1993 until January 2001. Mr. Carolan obtained his bachelor’s degree in accounting from Villanova University, his master’s degree in business administration from New York University and is a certified public accountant in the State of New Jersey.
Ron Miiller
has served as our Senior Vice President of Worldwide Sales since April 2011. Prior to his current role, Mr. Miiller served as our Vice President of Sales, Americas from January 2005 to March 2011 and as our Central Region Sales Manager from March 2000 to December 2004. Prior to joining our company, Mr. Miiller served as Director, Central Region Sales for Softworks, Inc., an EMC company, from March 1997 through March 2000, and prior to that Mr. Miiller was with Moore Corporation, a diversified print and electronic communications company from 1989 through March 1997 in various leadership roles. Mr. Miiller received his bachelor of science degree in marketing from Ball State University.
14
|
Item 1A.
|
Risk Factors
|
You should consider each of the following factors as well as the other information in this Annual Report in evaluating our business and our prospects. The risks and uncertainties described below are not the only ones we face. Additional risks and uncertainties not presently known to us or that we currently consider immaterial may also impair our business operations. If any of the following risks actually occurs, our business and financial results could be harmed. In that case, the trading price of our common stock could decline. You should also refer to the other information set forth in this Annual Report, including our financial statements and the related notes.
Risks Related to Our Business
Our industry is intensely competitive, and many of our competitors have greater financial, technical and sales and marketing resources and larger installed customer bases than we do, which could enable them to compete more effectively than we do.
The data and information management software market is intensely competitive, highly fragmented and characterized by rapidly changing technology and evolving standards, changing customer requirements and frequent new product introductions. Competitors vary in size and in the scope and breadth of the products and services offered. Our primary competitors include Dell EMC, IBM, Veritas, Veeam, Rubrik and Cohesity.
The principal competitive factors in our industry include product functionality, product integration, platform coverage, ability to scale, price, worldwide sales infrastructure, global technical support, name recognition and reputation. The ability of major system vendors to bundle hardware and software solutions is also a significant competitive factor in our industry. If we are unable to address these factors, our competitive position could weaken and we could experience a decline in revenues that could adversely affect our business.
Many of our current and potential competitors have longer operating histories and have substantially greater financial, technical, sales, marketing and other resources than we do, as well as larger installed customer bases, greater name recognition and broader product offerings, including hardware. Some of these competitors can devote greater resources to the development, promotion, sale and support of their products than we can and have the ability to bundle their hardware and software products in a combined offering. As a result, these competitors may be able to respond more quickly to new or emerging technologies and changes in customer requirements.
It is also costly and time-consuming to change data and information management systems. Most of our new customers have installed data and information management software, which gives an incumbent competitor an advantage in retaining a customer because it already understands the network infrastructure, user demands and information technology needs of the customer, and also because some customers are reluctant to invest the time and money necessary to change vendors.
Our current and potential competitors may establish cooperative relationships among themselves or with third parties. If so, new competitors or alliances that include our competitors may emerge that could acquire significant market share. In addition, large operating system and application vendors, as well as some hardware manufacturers, have introduced products or functionality that includes some of the same functions offered by our software applications. In the future, further development by these vendors could cause our software applications and services to become redundant, which could seriously harm our sales, results of operations and financial condition.
New competitors entering our markets can have a negative impact on our competitive positioning. In addition, we expect to encounter new competitors as we enter new markets. Furthermore, many of our existing competitors are broadening their operating systems platform coverage. We also expect increased competition from original equipment manufacturers, including those we partner with, and from systems and network management companies, especially those that have historically focused on the mainframe computer market and have been making acquisitions and broadening their efforts to include data and information management and storage products. We expect that competition will increase as a result of future software industry consolidation. Increased competition could harm our business by causing, among other things, price reductions of our products, reduced profitability and loss of market share.
15
We rely on indirect sales channels, such as value-added resellers, systems integrators, corporate resellers, distributors, and original equipment manufacturers, for the distribution of our software applications, and the failure of these channels to effectively sell our software applications could have a material adverse effect on our revenues and results of operations.
We rely significantly on our value-added resellers, systems integrators and corporate resellers, which we collectively refer to as resellers, for the marketing and distribution of our software applications and services. Resellers are our most significant distribution channel. However, our agreements with resellers are generally not exclusive, are generally renewable annually, typically do not contain minimum sales requirements and in many cases may be terminated by either party without cause. Many of our resellers carry software applications that compete with ours. These resellers may give a higher priority to other software applications, including those of our competitors, or may not continue to carry our software applications at all. If a number of resellers were to discontinue or reduce the sales of our products, or were to promote our competitors’ products in lieu of our own, it could have a material adverse effect on our future revenues. Events or occurrences of this nature could seriously harm our sales and results of operations. If we fail to manage our resellers successfully, there may be conflicts between resellers or they could fail to perform as we anticipate, including required compliance with the terms and obligations of our reseller agreement, either of which could reduce our sales or impact our reputation in the market. In addition, we expect that a portion of our sales growth will depend upon our ability to identify and attract new reseller partners. Our competitors also use reseller arrangements and may be more successful in attracting reseller partners and could enter into exclusive relationships with resellers that make it difficult to expand our reseller network. Any failure on our part to maintain and/or expand our network of resellers could impair our ability to grow revenues in the future.
Some of our resellers possess significant resources and advanced technical abilities. These resellers, particularly our corporate resellers, may, either independently or jointly with our competitors, develop and market products and related services that compete with our offerings. If this were to occur, these resellers might discontinue marketing and distributing our software applications and services. In addition, these resellers would have an advantage over us when marketing their competing products and related services because of their existing customer relationships. The occurrence of any of these events could have a material adverse effect on our revenues and results of operations.
In addition, we have a distribution agreement covering our North American commercial markets and our U.S. Federal Government market with Arrow. Pursuant to this distribution agreement, Arrow’s primary role is to enable a more efficient and effective distribution channel for our products and services by managing our reseller partners and leveraging their own industry experience. Many of our North American resellers buy from Arrow. Sales through our distribution agreement with Arrow accounted for approximately
36%
of our total revenues for
fiscal 2018
and
fiscal 2017
. If Arrow was to discontinue or reduce the sales of our products or if our agreement with Arrow was terminated, and if we were unable to take back the management of our reseller channel or find another North American distributor to replace Arrow, then it could have a material adverse effect on our future revenues.
Our original equipment manufacturers sell our software applications and in some cases incorporate our data and information management software into systems that they sell. A material portion of our revenues is generated through these arrangements. However, we have no control over the shipping dates or volumes of systems these original equipment manufacturers ship and they have no obligation to ship systems incorporating our software applications. They also have no obligation to recommend or offer our software applications exclusively or at all, and they have no minimum sales requirements and can terminate our relationship at any time. These original equipment manufacturers also could choose to develop their own data and information management software internally and incorporate those products into their systems instead of our software applications. The original equipment manufacturers that we do business with also compete with one another. If one of our original equipment manufacturer partners views our arrangement with another original equipment manufacturer as competing with its products, it may decide to stop doing business with us. Any material decrease in the volume of sales generated by original equipment manufacturers we do business with, as a result of these factors or otherwise, could have a material adverse effect on our revenues and results of operations in future periods. Sales through our original equipment manufacturer agreements accounted for approximately
12%
of our total revenues for
fiscal 2018
and
15%
of our total revenues for
fiscal 2017
.
16
We may not be able to respond to rapid technological changes with new software applications and services offerings, which could have a material adverse effect on our sales and profitability.
The markets for our software applications are characterized by rapid technological changes, changing customer needs, frequent new product introductions and evolving industry standards. The introduction of software applications embodying new technologies and the emergence of new industry standards could make our existing and future software applications obsolete and unmarketable. As a result, we may not be able to accurately predict the lifecycle of our software applications, and they may become obsolete before we receive the amount of revenues that we anticipate from them. If any of the foregoing events were to occur, our ability to retain or increase market share in the data and information management software market could be materially adversely affected.
We devote significant resources to the development of new products and the enhancement of existing products. To be successful, we need to anticipate, develop and introduce new software applications and services on a timely and cost-effective basis that keep pace with technological developments and emerging industry standards and that address the increasingly sophisticated needs of our customers. We may fail to develop and market software applications and services that respond to technological changes or evolving industry standards, experience difficulties that could delay or prevent the successful development, introduction and marketing of these applications and services or fail to develop applications and services that adequately meet the requirements of the marketplace or achieve market acceptance. Our failure to develop and market such applications and services on a timely basis, or at all, could have a material adverse effect on our sales and profitability.
If the cost for annual maintenance and support agreements with our customers is not competitive in the market or if our customers do not renew their annual maintenance and support agreements either at all, or on terms that are less favorable to us, our business and financial performance might be adversely impacted.
Most of our maintenance agreements are for a one-year term. As the end of the annual period approaches, we pursue the renewal of the agreement with the customer. Historically, maintenance renewals have represented a significant portion of our total revenue. Because of this characteristic of our business, if our customers do not renew their annual maintenance and support agreements either at all, or on terms that are less favorable to us, our business and financial performance might be adversely impacted.
We develop software applications that interoperate with certain software, operating systems and hardware developed by others, and if the developers of those operating systems and hardware do not cooperate with us or we are unable to devote the necessary resources so that our applications interoperate with those systems, our software development efforts may be delayed or foreclosed and our business and results of operations may be adversely affected.
Our software applications operate primarily on the Windows, UNIX, Linux and Novell Netware operating systems; used in conjunction with Microsoft SQL; and on hardware devices of numerous manufacturers. When new or updated versions of these operating systems, software applications, and hardware devices are introduced, it is often necessary for us to develop updated versions of our software applications so that they interoperate properly with these systems and devices. We may not accomplish these development efforts quickly or cost-effectively, and it is not clear what the relative growth rates of these operating systems and hardware will be. These development efforts require the cooperation of the developers of the operating systems, software applications, and hardware, substantial capital investment and the devotion of substantial employee or financial resources. For some operating systems, we must obtain some proprietary application program interfaces from the owner in order to develop software applications that interoperate with the operating system. Operating system and software owners have no obligation to assist in these development efforts. If they do not provide us with assistance, the contractual right, or the necessary proprietary application program interfaces on a timely basis, we may experience delays or be unable to expand our software applications into other areas.
17
We have started selling a backup appliance which integrates our software with hardware. If we fail to accurately predict our manufacturing requirements and manage our supply chain we could incur additional costs or experience manufacturing delays that could harm our business.
We generally provide forecasts of our requirements to our supply chain partners on a rolling basis. If our forecast exceeds our actual requirements, a supply chain partner may assess additional charges or we may incur costs for excess inventory, each of which could negatively affect our gross margins. If our forecast is less than our actual requirements, the applicable supply chain partner may have insufficient time or components to produce or fulfill our product requirements, which could delay or interrupt manufacturing of our products or fulfillment of orders for our products, and result in delays in shipments, customer dissatisfaction, and deferral or loss of revenue. Further, we may be required to purchase sufficient inventory to satisfy our future needs in situations where a component or product is being discontinued. If we fail to accurately predict our requirements, we may be unable to fulfill those orders or we may be required to record charges for excess inventory. Any of the foregoing could adversely affect our business, financial condition or results of operations.
Volatility in the global economy could adversely impact our continued growth, results of operations and our ability to forecast future business.
As our business has expanded globally, we have become increasingly subject to the risks arising from adverse changes in domestic and global economic and political conditions. Uncertainty in the macroeconomic environment and associated global economic conditions have resulted in volatility in credit, equity, debt and foreign currency markets as well as government budgets worldwide.
These global economic conditions can result in slower economic activity, decreased consumer confidence, reduced corporate profits and capital spending, adverse business conditions and liquidity concerns. There has also been increased volatility in foreign exchange markets. These factors make it difficult for our customers, our vendors and us to accurately forecast and plan future business activities. In addition, these factors could cause customers to slow or defer spending on our software products and services, which would delay and lengthen sales cycles and negatively affect our results of operations. If such conditions deteriorate or if the pace of economic recovery is slower or more uneven, our results of operations could be adversely affected, we may not be able to sustain the growth rates we have experienced recently, and we could fail to meet the expectations of stock analysts and investors, which could cause the price of our common stock to decline.
We continue to invest in our business in the Asia-Pacific and Europe, Middle East, and Africa regions. There are significant risks with overseas investments and growth prospects in these regions. Increased volatility or declines in the credit, equity, debt and foreign currency markets in these regions could cause delays in or cancellations of orders. Deterioration of economic conditions in the countries in which we do business could also cause slower or impaired collections on accounts receivable. In addition, we could experience delays in the payment obligations of our worldwide resellers if they experience weakness in the end-user market, which would increase our credit risk exposure and harm our financial condition.
In periods of volatile economic conditions, our exposure to credit risk and payment delinquencies on our accounts receivable significantly increases.
Our outstanding accounts receivables are generally not secured. Our standard terms and conditions permit payment within a specified number of days following the receipt of our product. Volatile economic conditions could result in our customers and resellers facing liquidity concerns leading to them not being able to satisfy their payment obligations to us, which would have a material adverse effect on our financial condition, operating results and cash flows.
In addition, in the future we may transition a more significant percentage of our revenue to subscription, or term based, arrangements. In these arrangements, our customers may pay for software and related services over a period of several years. Due to the potential for extended period of collection, we may be exposed to more significant credit risk.
We are, and may in the future become, involved in litigation that may have a material adverse effect on our business.
From time to time, we may become involved in various other legal proceedings relating to matters incidental to the ordinary course of our business, including patent, commercial, product liability, employment, class action, whistleblower and other litigation and claims, and governmental and other regulatory investigations and proceedings. Such matters can be time-consuming, divert management’s attention and resources and cause us to incur significant expenses. Furthermore, because litigation is inherently uncertain, there can be no assurance that the results of any of these actions will not have a material adverse effect on our business, results of operations or financial condition.
18
We may experience a decline in revenues or volatility in our quarterly operating results, which may adversely affect the market price of our common stock.
We cannot predict our future quarterly revenues or operating results with certainty because of many factors outside of our control. A significant revenue or profit decline, lowered forecasts or volatility in our operating results could cause the market price of our common stock to decline substantially. Factors that could affect our revenues and operating results include the following:
|
•
|
the unpredictability of the timing and magnitude of orders for our software applications, particularly software transactions greater than $100,000 — in recent fiscal years, a majority of our quarterly revenues were earned and recorded near the end of each quarter;
|
|
•
|
the possibility that our customers may cancel, defer or limit purchases as a result of reduced information technology budgets;
|
|
•
|
the possibility that our customers may defer purchases of our software applications in anticipation of new software applications or updates from us or our competitors;
|
|
•
|
the ability of our original equipment manufacturers and resellers to meet their sales objectives;
|
|
•
|
market acceptance of our new applications and enhancements;
|
|
•
|
our ability to control expenses;
|
|
•
|
changes in our pricing, packaging and distribution terms or those of our competitors; and
|
|
•
|
the demands on our management, sales force and services infrastructure as a result of the introduction of new software applications or updates.
|
Our expense levels are relatively fixed and are based, in part, on our expectations of future revenues. If revenue levels fall below our expectations and we are profitable at the time, our net income would decrease because only a small portion of our expenses varies with our revenues. Therefore, any significant decline in revenues for any period could have an immediate adverse impact on our results of operations for that period. We believe that period-to-period comparisons of our results of operations should not be relied upon as an indication of future performance. In addition, our results of operations could be below expectations of public market analysts and investors in future periods, which would likely cause the market price of our common stock to decline.
We encounter long sales and implementation cycles, particularly for our larger customers, which could have an adverse effect on the size, timing and predictability of our revenues.
Potential or existing customers, particularly larger enterprise customers, generally commit significant resources to an evaluation of available software and require us to expend substantial time, effort and money educating them as to the value of our software and services. Sales of our core software products to these larger customers often require an extensive education and marketing effort.
We could expend significant funds and resources during a sales cycle and ultimately fail to win the customer. Our sales cycle for all of our products and services is subject to significant risks and delays over which we have little or no control, including:
|
•
|
our customers’ budgetary constraints;
|
|
•
|
the timing of our customers’ budget cycles and approval processes;
|
|
•
|
our customers’ willingness to replace their current software solutions;
|
|
•
|
our need to educate potential customers about the uses and benefits of our products and services; and
|
|
•
|
the timing of the expiration of our customers’ current license agreements or outsourcing agreements for similar services.
|
If our sales cycles lengthen unexpectedly, they could adversely affect the timing of our revenues or increase costs, which may cause fluctuations in our quarterly revenues and results of operations. Finally, if we are unsuccessful in closing sales of our products after spending significant funds and management resources, our operating margins and results of operations could be adversely impacted, and the price of our common stock could decline.
19
We depend on growth in the data and information management software market, and lack of growth or contraction in this market could have a material adverse effect on our sales and financial condition.
Demand for data and information management software is linked to growth in the amount of data generated and stored, demand for data retention and management (whether as a result of regulatory requirements or otherwise) and demand for and adoption of new storage devices and networking technologies. Because our software applications are concentrated within the data and information management software market, if the demand for storage devices, storage software applications, storage capacity or storage networking devices declines, our sales, profitability and financial condition would be materially adversely affected. Segments of the computer and software industry have in the past experienced significant economic downturns. The occurrence of any of these factors in the data and information management software market could materially adversely affect our sales, profitability and financial condition.
Furthermore, the data and information management software market is dynamic and evolving. Our future financial performance will depend in large part on continued growth in the number of organizations adopting data and information management software for their computing environments. The market for data and information management software may not continue to grow at historic rates, or at all. If this market fails to grow or grows more slowly than we currently anticipate, our sales and profitability could be adversely affected.
Our software applications are complex and may contain undetected errors, which could adversely affect not only our software applications’ performance but also our reputation and the acceptance of our software applications in the market.
Software applications as complex as those we offer contain undetected errors or failures, especially when products are first introduced or new versions are released. Despite extensive testing by us and by our customers, we have in the past discovered errors in our software applications and will do so in the future. As a result of past discovered errors, we experienced delays and lost revenues while we corrected those software applications. In addition, customers in the past have brought to our attention “bugs” in our software created by the customers’ unique operating environments, which are often characterized by a wide variety of both standard and non-standard configurations that make pre-release testing very difficult and time consuming. Although we have been able to fix these software bugs in the past, we may not always be able to do so. Our software products may also be subject to intentional attacks by viruses that seek to take advantage of these bugs, errors or other weaknesses. Any of these events may result in the loss of, or delay in, market acceptance of our software applications and services, which would seriously harm our sales, results of operations and financial condition.
Furthermore, we believe that our reputation and name recognition are critical factors in our ability to compete and generate additional sales. Promotion and enhancement of our name will depend largely on our success in continuing to provide effective software applications and services. The occurrence of errors in our software applications or the detection of bugs by our customers may damage our reputation in the market and our relationships with our existing customers, and as a result, we may be unable to attract or retain customers.
In addition, because our software applications are used to manage data that is often critical to our customers, they may have a greater sensitivity to defects in our products than to defects in other, less critical, applications. As a result, the licensing and support of our software applications involve the risk of product liability claims. Our license agreements with our customers typically contain provisions designed to limit our exposure to potential product liability claims. However, the limitation of liability provisions contained in our license agreements vary and may not be effective as a result of existing or future national, federal, state, or local laws or ordinances or unfavorable judicial decisions. Although we have not experienced any material product liability claims to date, the sale and support of our products entail the risk of such claims, which could be substantial in light of the use of our products in enterprise-wide environments. In addition, our insurance against product liability may not be adequate to cover all potential claims.
We may not receive significant revenues from our current research and development efforts for several years, if at all.
Developing software is expensive, and the investment in product development may involve a long payback cycle. Our research and development expenses were
$94.2 million
, or
13%
of our total revenues in
fiscal 2018
,
$83.5 million
, or
13%
of our total revenues in
fiscal 2017
and
$69.3 million
, or
12%
of our total revenues in
fiscal 2016
. Our future plans include significant investments in software research and development and related product opportunities. We believe that we must continue to dedicate a significant amount of resources to our research and development efforts to maintain our competitive position. However, we may not recognize significant revenues from these investments for several years, if at all.
20
The loss of key personnel or the failure to attract and retain highly qualified personnel could have an adverse effect on our business.
Our future performance depends on the continued service of our key technical, sales, services and management personnel. We rely on our executive officers and senior management to execute our existing business operations and identify and pursue new growth opportunities. The loss of key employees could result in significant disruptions to our business, and the integration and training of replacement personnel could be time consuming, cause additional disruptions to our business and be unsuccessful. We do not carry key person life insurance covering any of our employees.
Our future success also depends on our continued ability to attract and retain highly qualified technical, sales, services and management personnel. Competition for such personnel is intense, and we may fail to retain our key technical, sales, services and management employees or attract or retain other highly qualified technical, sales, services and management personnel in the future.
Furthermore, in the past, we have experienced higher levels of turnover in our sales force compared to other employee groups in our company. Increases in the turnover rate of our sales force may affect our ability to generate license revenue growth. Although we have hired replacements in our sales force and are continuing to hire additional sales personnel to grow our business, we sometimes experience lower productivity from newly hired sales personnel for a period up to twelve months. In addition, we periodically make adjustments to our sales organization in response to a variety of internal and external factors, such as market opportunities, competitive threats, product introductions or enhancements and sales performance. Such adjustments could be temporarily disruptive and result in reduced productivity.
The volatility of our stock price may from time to time adversely affect our ability to attract or retain employees. If we are unable to hire or retain qualified employees across our organization, or conversely, if we fail to manage employee performance or reduce staffing levels when required by market conditions, our personnel costs would be excessive and our business and profitability could be adversely affected.
Our Omnibus Plan has approximately 1.6 million shares left available for grant until we will be required to ask our shareholders for additional shares. If our shareholders do not approve additional shares it could make it difficult to attract, retain and motivate our key personnel.
Our international sales and operations are subject to factors that could have an adverse effect on our results of operations.
We have significant sales and services operations outside the United States, and derive a substantial portion of our revenues from these operations. We also plan to continue to expand our international operations. We generated approximately
46%
of our revenues from outside the United States in
fiscal 2018
and
44%
for
fiscal 2017
. International revenue increased 15% in
fiscal 2018
compared to
fiscal 2017
. Expansion of our international operations will require a significant amount of attention from our management and substantial financial resources and might require us to add qualified management in these markets.
In addition to facing risks similar to the risks faced by our domestic operations, our international operations are also subject to risks related to the differing legal, political, social and regulatory requirements and economic conditions of many countries, including:
|
•
|
difficulties in staffing and managing our international operations;
|
|
•
|
foreign countries may impose additional withholding taxes or otherwise tax our foreign income, impose tariffs or adopt other restrictions on foreign trade or investment, including currency exchange controls;
|
|
•
|
difficulties in coordinating the activities of our geographically dispersed and culturally diverse operations;
|
|
•
|
general economic conditions in the countries in which we operate, including seasonal reductions in business activity in the summer months in Europe and in other periods in other countries, could have an adverse effect on our earnings from operations in those countries;
|
|
•
|
imposition of, or unexpected adverse changes in, foreign laws or regulatory requirements may occur, including those pertaining to export restrictions, privacy and data protection, trade and employment restrictions and intellectual property protections;
|
|
•
|
longer payment cycles for sales in foreign countries and difficulties in collecting accounts receivable;
|
21
|
•
|
competition from local suppliers;
|
|
•
|
greater risk of a failure of our employees and partners to comply with both U.S. and foreign laws, including antitrust regulations, the U.S. Foreign Corrupt Practices Act, the U.K. Bribery Act of 2010, and any trade regulations ensuring fair trade practices;
|
|
•
|
costs and delays associated with developing software in multiple languages; and
|
|
•
|
political unrest, war or acts of terrorism.
|
Our business in emerging markets requires us to respond to rapid changes in market conditions in those markets. Our overall success in international markets depends, in part, upon our ability to succeed in differing legal, regulatory, economic, social and political conditions. We may not continue to succeed in developing and implementing policies and strategies that will be effective in each location where we do business. Furthermore, the occurrence of any of the foregoing factors may have a material adverse effect on our business and results of operations.
We may experience fluctuations in foreign currency exchange rates that could adversely impact our results of operations.
Our international sales are generally denominated in foreign currencies, and this revenue could be materially affected by currency fluctuations. Our primary exposure is to fluctuations in exchange rates for the U.S. dollar versus the Euro and, to a lesser extent, the Australian dollar, British pound sterling, Canadian dollar, Chinese yuan, Indian rupee, Korean won and Singapore dollar. Changes in currency exchange rates could adversely affect our reported revenues and could require us to reduce our prices to remain competitive in foreign markets, which could also have a material adverse effect on our results of operations. An unfavorable change in the exchange rate of foreign currencies against the U.S. dollar would result in lower revenues when translated into U.S. dollars, although operating expenditures would be lower as well.
In recent fiscal years, we have selectively hedged our exposure to changes in foreign currency exchange rates on the balance sheet. In the future, we may enter into additional foreign currency-based hedging contracts to reduce our exposure to significant fluctuations in currency exchange rates on the balance sheet, although there can be no assurances that we will do so. However, as our international operations grow, or if dramatic fluctuations in foreign currency exchange rates continue or increase or if our hedging strategies become ineffective, the effect of changes in the foreign currency exchange rates could become material to revenue, operating expenses, and income.
22
Our ability to sell our software applications is highly dependent on the quality of our service offerings, and our failure to offer high quality support and professional services would have a material adverse effect on our sales of software applications and results of operations.
Our services include the assessment and design of solutions to meet our customers’ storage management requirements and the efficient installation and deployment of our software applications based on specified business objectives. Further, once our software applications are deployed, our customers depend on us to resolve issues relating to our software applications. A high level of service is critical for the successful marketing and sale of our software. If we or our partners do not effectively install or deploy our applications, or succeed in helping our customers quickly resolve post-deployment issues, it would adversely affect our ability to sell software products to existing customers and could harm our reputation with prospective customers. As a result, our failure to maintain high quality support and professional services would have a material adverse effect on our sales of software applications and results of operations.
A portion of our revenue is generated by sales to government entities, which are subject to a number of challenges and risks.
Sales to U.S. and foreign federal, state, and local governmental agency end-customers have accounted for a portion of our revenue, and we may in the future increase sales to government entities. However, government entities have recently announced reductions in, or experienced increased pressure to reduce spending. In particular, such measures have adversely affected European public sector transactions, and U.S. debt issues and budget concerns may adversely impact future U.S. public sector transactions. Such budgetary constraints or shifts in spending priorities of government entities may adversely affect sales of our products and services to such entities. In addition, sales to government entities are subject to a number of risks. Selling to government entities can be highly competitive, expensive and time consuming, often requiring significant upfront time and expense without any assurance that we will successfully sell our products to such governmental entity. Government entities may require contract terms that differ from our standard arrangements. Government contracts may require the maintenance of certain security clearances for facilities and employees which can entail administrative time and effort possibly resulting in additional costs and delays. In addition, government demand for our products may be more volatile as they are affected by public sector budgetary cycles, funding authorizations, and the potential for funding reductions or delays, making the time to close such transactions more difficult to predict. This risk is enhanced as the size of such sales to the government entities increases. If the use of our products expands to more sensitive, secure or mission critical uses by our government customers, we may be subject to increased scrutiny, potential reputational risk, or potential liability should our products fail to perform as expected or should we not comply with the terms of our government contracts or government contracting requirements.
Most of our sales to government entities have been made indirectly through providers that sell our products. Government entities may have contractual or other legal rights to terminate contracts with our providers for convenience or due to a default, and any such termination may adversely impact our future results of operations. Governments routinely audit and investigate government contractors, and we may be subject to such audits and investigations. If an audit or investigation uncovers improper or illegal activities, including any misuse of confidential or classified information by our employees, we may be subject to civil or criminal penalties and administrative sanctions.
We may be subject to information technology system failures, network disruptions and breaches in data security.
Information technology system failures, network disruptions and breaches of data security could disrupt our operations by causing delays or cancellation of customer orders, impeding the shipment of software products, negatively affecting our service offerings, preventing the processing of transactions and reporting of financial results. Information technology system failures, network disruptions and breaches of data security could also result in the unintentional disclosure of customer or our information as well as damage our reputation. There can be no assurance that a system failure, network disruption or data security breach will not have a material adverse effect on our financial condition and operating results.
Protection of our intellectual property is limited, and any misuse of our intellectual property by others could materially adversely affect our sales and results of operations.
Our success depends significantly upon proprietary technology in our software, documentation and other written materials. To protect our proprietary rights, we rely on a combination of:
|
•
|
patents;
|
|
•
|
copyright and trademark laws;
|
|
•
|
trade secrets;
|
|
•
|
confidentiality procedures; and
|
|
•
|
contractual provisions.
|
23
These methods afford only limited protection. Despite this limited protection, any issued patent may not provide us with any competitive advantages or may be challenged by third parties, and the patents of others may seriously impede our ability to conduct our business. Further, our pending patent applications may not result in the issuance of patents, and any patents issued to us may not be timely or broad enough to protect our proprietary rights. We may also develop proprietary products or technologies that cannot be protected under patent law. We also seek to maintain certain intellectual property as trade secrets. The secrecy could be compromised by outside parties, or by our employees, which would cause us to lose the competitive advantage resulting from these trade secrets.
Despite our efforts to protect our proprietary rights, unauthorized parties may attempt to copy aspects of our software applications or to obtain and use information that we regard as proprietary. Policing unauthorized use of our software applications is difficult, and we expect software piracy to continue to be a persistent problem. In licensing our software applications, we typically rely on “shrink wrap” or “click wrap” licenses that are not signed by licensees. We may have difficulty enforcing these licenses in some jurisdictions. In addition, the laws of some foreign countries do not protect our proprietary rights to as great an extent as do the laws of the United States. Our attempts to protect our proprietary rights may not be adequate. Our competitors may independently develop similar technology, duplicate our software applications or design around patents issued to us or other intellectual property rights of ours. Litigation may be necessary in the future to enforce our intellectual property rights, protect our trade secrets or determine the validity and scope of the proprietary rights of others. Litigation could result in substantial costs and diversion of resources and management attention. In addition, from time to time we are participants or members of various industry standard-setting organizations or other industry technical organizations. Our participation or membership in such organizations may, in some circumstances, require us to enter into royalty or licensing agreements with third parties regarding our intellectual property under terms established by those organizations, which we may not find favorable. In addition, many of our agreements with our customers and partners require us to indemnify them for certain intellectual property infringement claims against them, which would increase our costs as a result of defending such claims, and may require that we pay significant damages if there were an adverse ruling in any such claims. Furthermore, such customers and partners may discontinue the use of our products, services, and technologies, as a result of injunctions or otherwise, which could result in loss of revenues and adversely impact our business.
Claims that we misuse the intellectual property of others could subject us to significant liability and disrupt our business, which could have a material adverse effect on our results of operations and financial condition.
Due to the nature of our business, we may become subject to material claims of infringement by competitors and other third parties with respect to current or future software applications, trademarks or other proprietary rights. We expect that software developers will increasingly be subject to infringement claims as the number of software applications and competitors in our industry segment grows and the functionality of software applications in different industry segments overlaps. Future litigation may also involve third parties such as individuals, non-practicing entities, patent holding companies, and/or patent assertion entities that have no relevant product offerings or revenue in the marketplace, and against whom our own patents may provide little or no deterrence or protection. Such parties may purchase or otherwise obtain intellectual property assets for the purpose of monetizing these assets; they often make broad and sweeping claims of infringement against product manufacturing companies such as Commvault and its customers, seeking a percentage of sales as license fees, seeking injunctions to pressure us into taking a license, or a combination thereof. Claims such as these have increased in recent years and may continue to do so. Any such claims, whether meritorious or not, could be time-consuming, result in costly litigation, cause shipment delays or require us to enter into royalty or licensing agreements with third parties, which may not be available on terms that we deem acceptable, if at all. In addition, we may decide to settle a claim or action against us, which settlement could be costly. We may also be liable for any past infringement. If there is an adverse ruling against us in an infringement lawsuit, an injunction could be issued barring production or sale of any infringing product. It could also result in a damage award equal to a reasonable royalty or lost profits or, if there is a finding of willful infringement, treble damages. Any of these claims could disrupt our business and have a material adverse effect on our results of operations and financial condition.
In addition, we license and use software from third parties in our business. These third-party software licenses may not continue to be available to us on acceptable terms or at all, and may expose us to additional liability. This liability, or our inability to use any of this third-party software, could result in shipment delays or other disruptions in our business that could materially and adversely affect our operating results.
24
On February 27, 2017, Realtime Data LLC d/b/a/ IXO (Realtime), a non-practicing entity, sued us and Spectra Logic Corporation in the Eastern District of Texas for alleged infringement of four patents: U.S. Patent Nos. 9,054,728, 7,415,530, 9,116,908, and 8,717,204. Realtime dismissed the case in Texas and refiled this case in the District of Delaware on July 10, 2017. Realtime has sued numerous other companies for infringement of these and other patents. Realtime seeks monetary damages and an injunction. We responded to the complaint by filing a motion to dismiss on the grounds that the patents are directed to patent-ineligible subject matter. The Court has not yet ruled on this motion. Due to the inherent uncertainties of litigation, we cannot accurately predict the ultimate outcome of this matter. We are unable at this time to determine whether the outcome of the litigation will have a material impact on our results of operations, financial condition or cash flows. We intend to defend ourselves vigorously.
Our use of “open source” software could negatively affect our business and subjects us to possible litigation.
Some of the products or technologies acquired, licensed or developed by us may incorporate so-called “open source” software, and we may incorporate open source software into other products in the future. Such open source software is generally licensed by its authors or other third parties under open source licenses, including, for example, the GNU General Public License, the GNU Lesser General Public License, the Common Public License, “Apache-style” licenses, “Berkley Software Distribution or BSD-style” licenses and other open source licenses. We monitor our use of open source software to avoid subjecting our products to conditions we do not intend, but these efforts may not be successful. Although we believe that we have complied with our obligations under the various applicable licenses for open source software that we use, there is little or no legal precedent governing the interpretation of many of the terms of certain of these licenses, and therefore the potential impact of these terms on our business is somewhat unknown and may result in unanticipated obligations regarding our products and technologies. The use of such open source software may ultimately subject some of our products to unintended conditions, which may negatively affect our business, financial condition, operating results, cash flow and ability to commercialize our products or technologies.
Some of these open source licenses may subject us to certain conditions, including requirements that we offer our products that use the open source software for no cost, that we make available source code for modifications or derivative works we create based upon, incorporating or using the open source software and/or that we license such modifications or derivative works under the terms of the particular open source license. If an author or other third-party that distributes such open source software were to allege that we had not complied with the conditions of one or more of these licenses, we could be required to incur significant legal expenses defending against such allegations. If our defenses were not successful, we could be enjoined from the distribution of our products that contained the open source software and required to make the source code for the open source software available to others, to grant third parties certain rights of further use of our software or to remove the open source software from our products, which could disrupt the distribution and sale of some of our products. In addition, if we combine our proprietary software with open source software in a certain manner, under some open source licenses we could be required to release the source code of our proprietary software. If an author or other third-party that distributes open source software were to obtain a judgment against us based on allegations that we had not complied with the terms of any such open source licenses, we could also be subject to liability for copyright infringement damages and breach of contract for our past distribution of such open source software.
Our effective tax rate is difficult to project, and changes in such tax rate or adverse results of tax examinations could adversely affect our operating results.
We are a U.S.-based multinational company subject to tax in multiple U.S. and foreign tax jurisdictions. Our results of operations would be adversely affected to the extent that our geographical mix of income becomes more weighted toward jurisdictions with higher tax rates and would be favorably affected to the extent the relative geographic mix shifts to lower tax jurisdictions. Any change in our mix of earnings is dependent upon many factors and is therefore difficult to predict.
The process of determining our anticipated tax liabilities involves many calculations and estimates that are inherently complex and make the ultimate tax obligation determination uncertain. As part of the process of preparing our consolidated financial statements, we are required to estimate our income taxes in each of the jurisdictions in which we operate prior to the completion and filing of tax returns for such periods. These estimates involve complex issues, require extended periods of time to resolve, and require us to make judgments, such as anticipating the outcomes of audits with tax authorities and the positions that we will take on tax returns prior to our actually preparing the returns.
Furthermore, our overall effective income tax rate and tax expenses may be affected by various factors in our business, including changes in our legal structure, changes in the geographic mix of income and expenses, changes in tax laws and applicable accounting pronouncements and variations in the estimated and actual level of annual profits before income tax.
25
We also determine the need to record deferred tax liabilities and the recoverability of deferred tax assets. A valuation allowance is established to the extent recovery of deferred tax assets is not likely based on our estimation of future taxable income and other factors in each jurisdiction. In assessing the need for a valuation allowance in fiscal 2018, we considered all available objective and verifiable evidence both positive and negative, including historical levels of pre-tax income (loss) both on a consolidated basis and tax reporting entity basis, legislative developments, expectations and risks associated with estimates of future pre-tax income, and prudent and feasible tax planning strategies. As a result of this analysis, we determined that it is more likely than not that it will not realize the benefits of its gross deferred tax assets and therefore has recorded a valuation allowance to reduce the carrying value of these gross deferred tax assets, net of the impact of the reversal of taxable temporary differences, to zero.
The 2017 Tax Cuts and Jobs Act (the Act) was enacted on December 22, 2017, and significantly affected U.S. tax law by changing how the U.S. imposes income tax on multinational corporations. The U.S. Department of Treasury has broad authority to issue regulations and interpretative guidance that may significantly impact how we will apply the law and impact our results of operations in the period issued. The Tax Act requires complex computations not previously provided in U.S. tax law. As such, the application of accounting guidance for such items is currently uncertain. Further, compliance with the Tax Act and the accounting for such provisions require accumulation of information not previously required or regularly produced. As additional regulatory guidance is issued by the applicable taxing authorities and as accounting treatment is clarified, we will perform additional analysis on the application of the law, and refine estimates in calculating the effect which may produce different results and will be reflected in the period the analysis is completed.
Our cash and cash equivalents could be adversely affected if the financial institutions in which we hold our cash and cash equivalents fail.
Our cash and cash equivalents are highly liquid investments with original maturities of three months or less at the time of purchase. We maintain the cash and cash equivalents with major financial institutions. Deposits with these banks exceed the Federal Deposit Insurance Corporation (FDIC) insurance limits or similar limits in foreign jurisdictions. While we monitor daily the cash balances in the operating accounts and adjust the balances as appropriate, these balances could be impacted if one or more of the financial institutions with which we deposit fails or is subject to other adverse conditions in the financial or credit markets. To date, we have experienced no loss or lack of access to our invested cash or cash equivalents; however, we can provide no assurance that access to our invested cash and cash equivalents will not be impacted by adverse conditions in the financial and credit markets.
We cannot predict our future capital needs and we may be unable to obtain financing, which could have a material adverse effect on our business, results of operations and financial condition.
We may need to raise additional funds in the future in order to acquire complementary businesses, technologies, products or services. Any required financing may not be available on terms acceptable to us, or at all. If we raise additional funds by issuing equity securities, you may experience significant dilution of your ownership interest, and the newly-issued securities may have rights senior to those of the holders of our common stock. If we raise additional funds by obtaining loans from third parties, the terms of those financing arrangements may include negative covenants or other restrictions on our business that could impair our operational flexibility, and would also require us to fund additional interest expense. If additional financing is not available when required or is not available on acceptable terms, we may be unable to successfully develop or enhance our software and services through acquisitions in order to take advantage of business opportunities or respond to competitive pressures, which could have a material adverse effect on our software and services offerings, revenues, results of operations and financial condition.
We are subject to the risks of owning real property.
We own our corporate campus headquarters in Tinton Falls, New Jersey. We have limited experience in the ownership and management of real property. In addition, we are subject to the risks of owning real property including the possible need for structural improvements in order to comply with zoning and other legal or regulatory requirements. Furthermore, we are subject to adverse changes in the value of this property due to interest rate changes, changes in the market in which the property is located or other factors. Also, if we decide to sell our real property in the future and are not able to recover all capitalized costs, it could have a material adverse effect on our financial condition and operating results.
26
Many of our key financial systems used for internal purposes are cloud-based solutions provided by third parties.
Our enterprise resource planning system as well as certain other stand-alone internal financial systems are cloud-based solutions provided by third parties. The use of cloud-based systems provided by third parties exposes us to certain risks of those third parties. If a disruption of services by these third party cloud financial system providers were to occur it could have a material adverse effect on our financial position, results of operations and cash flows.
Our reported financial results may be adversely affected by changes in accounting principles generally accepted in the United States.
Generally accepted accounting principles in the United States are subject to interpretation by the Financial Accounting Standards Board, the SEC, and various bodies formed to promulgate and interpret appropriate accounting principles. A change in these principles or interpretations could have a significant effect on our reported financial results, and may even affect the reporting of transactions completed before the announcement or effectiveness of a change.
Risks from investing in growth opportunities could impact our business.
We may invest in growth opportunities, such as high-value market segments of enterprise computing, managed services and cloud computing. Even though we believe cloud computing, in its various forms, represents a long term industry trend in the way that applications are delivered, data is stored and information is retrieved, there can be no assurance that our investment in cloud, and related managed services and infrastructure management will be validated in the marketplace. Similarly, there is no assurance that our investments in high-value market segments will drive revenue growth or market share gains. Customer adoption rates and viable economic models are less certain in high-value and rapidly-growing segments, and new product and services offerings may unfavorably impact demand for our other products or services.
Risks Relating to Ownership of Our Common Stock
The price of our common stock may be highly volatile and may decline regardless of our operating performance.
The market price of our common stock could be subject to significant fluctuations in response to:
|
•
|
variations in our quarterly or annual operating results;
|
|
•
|
changes in financial estimates, treatment of our tax assets or liabilities or investment recommendations by securities analysts following our business or our competitors;
|
|
•
|
the public’s response to our press releases, rumors, our other public announcements and our filings with the SEC;
|
|
•
|
changes in accounting standards, policies, guidance or interpretations or principles;
|
|
•
|
sales of common stock by our directors, officers and significant stockholders;
|
|
•
|
announcements of technological innovations or enhanced or new products by us or our competitors;
|
|
•
|
our failure to achieve operating results consistent with securities analysts’ projections;
|
|
•
|
the operating and stock price performance of other companies that investors may deem comparable to us;
|
|
•
|
broad market and industry factors; and
|
|
•
|
other events or factors, including those resulting from war, incidents of terrorism or responses to such events.
|
The market prices of software companies have been extremely volatile. Stock prices of many software companies have often fluctuated in a manner unrelated or disproportionate to the operating performance of such companies. In the past, following periods of market volatility, stockholders have often instituted securities class action litigation. Securities litigation could have a substantial cost and divert resources and the attention of management from our business.
Future sales of our common stock, or the perception that such future sales may occur, may cause our stock price to decline and impair our ability to obtain capital through future stock offerings.
A substantial number of shares of our common stock are available for sale into the public market. The occurrence of such sales, or the perception that such sales could occur, could materially and adversely affect our stock price and could impair our ability to obtain capital through an offering of equity securities.
27
Certain provisions in our charter documents and agreements and Delaware law, as well as our stockholder rights plan, may inhibit potential acquisition bids for Commvault and prevent changes in our management.
Our certificate of incorporation and bylaws contain provisions that could depress the trading price of our common stock by acting to discourage, delay or prevent a change of control of our company or changes in management that our stockholders might deem advantageous. Specific provisions in our certificate of incorporation include:
|
•
|
our ability to issue preferred stock with terms that the Board of Directors may determine, without stockholder approval;
|
|
•
|
a classified board in which only a third of the total board members will be elected at each annual stockholder meeting;
|
|
•
|
advance notice requirements for stockholder proposals and nominations; and
|
|
•
|
limitations on convening stockholder meetings.
|
In addition to the provision described above, on November 13, 2008, our Board of Directors adopted a stockholders rights plan and declared a dividend distribution of one Right for each outstanding share of our common stock to shareholders of record on November 24, 2008. Each Right, when exercisable, entitles the registered holder to purchase from us one one-thousandth of a share of Series A Junior Participating Preferred Stock, par value $0.01 per share, at a purchase price of $80 per one one-thousandth of a share, subject to adjustment. The Rights may discourage a third-party from making an unsolicited proposal to acquire us, as exercise of the Rights would cause substantial dilution to such third-party attempting to acquire us.
As a result of the provisions in our certificate of incorporation and our stockholder rights plan, the price investors may be willing to pay in the future for shares of our common stock may be limited.
Also, we are subject to Section 203 of the Delaware General Corporation Law, which imposes certain restrictions on mergers and other business combinations between us and any holder of 15% or more of our common stock. Further, certain of our employment agreements and incentive plans provide for vesting of stock options and/or payments to be made to the employees thereunder if their employment is terminated in connection with a change of control, which could discourage, delay or prevent a merger or acquisition at a premium price.
We do not expect to pay any dividends in the foreseeable future.
We do not anticipate paying any cash dividends to holders of our common stock in the foreseeable future. Consequently, investors must rely on sales of their common stock after price appreciation, which may never occur, as the only way to realize any future gains on their investment. Investors seeking cash dividends should not purchase our common stock.
Although we believe we currently have adequate internal control over financial reporting, we are required to assess our internal control over financial reporting on an annual basis, and any future adverse results from such assessment could result in a loss of investor confidence in our financial reports and have an adverse effect on our stock price.
Pursuant to Section 404 of the Sarbanes-Oxley Act of 2002 (SOX 404), and the rules and regulations promulgated by the SEC to implement SOX 404, we are required to furnish a report in our Form 10-K regarding the effectiveness of our internal control over financial reporting. The report’s assessment of our internal control over financial reporting as of the end of our fiscal year must include disclosure of any material weaknesses in our internal control over financial reporting identified by management. Management’s assessment of internal control over financial reporting requires management to make subjective judgments and some of our judgments will be in areas that may be open to interpretation.
28
Although we currently believe our internal control over financial reporting is effective, the effectiveness of our internal controls in future periods is subject to the risk that our controls may become inadequate or may not operate effectively. In future years, if we fail to timely complete this assessment, or if our auditors cannot timely attest, there may be a loss of public confidence in our internal controls, the market price of our stock could decline and we could be subject to regulatory sanctions or investigations by the NASDAQ Stock Market, the Securities and Exchange Commission or other regulatory authorities, which would require additional financial and management resources. In addition, any failure to implement required new or improved controls, or difficulties encountered in their implementation, could harm our operating results or cause us to fail to timely meet our regulatory reporting obligations.
During the past several years, our organizational structure has increased in complexity due to compliance with tax regulations and tax accounting requirements and other regulatory and compliance requirements, including compliance with anti-corruption and anti-bribery laws such as the U.S. Foreign Corrupt Practices Act (the “FCPA”) and the UK Bribery Act of 2010 (the “UK Bribery Act”). Further, we have expanded our presence in the Asia-Pacific region, where business practices can differ from those in other regions of the world and can create internal control risks. We provide business practices training to our employees worldwide. Overall, the combination of increased structural complexity and the ever-increasing regulatory complexity make it more critical for us to attract and retain qualified and technically competent employees.
|
Item 1B.
|
Unresolved Staff Comments
|
None.
|
Item 2.
|
Properties
|
Our principal administrative, sales, marketing, customer support and research and development facility is located at our owned corporate headquarters in Tinton Falls, New Jersey.
In addition, we have offices in the United States in California, Colorado, Illinois, Minnesota, New York, Texas, and Virginia; and outside the United States in Australia, Brazil, Canada, China, France, Germany, India, Israel, Italy, Japan, Malaysia, Mexico, Netherlands, New Zealand, Poland, Russia, Saudi Arabia, Singapore, South Africa, South Korea, Spain, Sweden, Switzerland, Thailand, Turkey, United Arab Emirates, and United Kingdom.
|
Item 3.
|
Legal Proceedings
|
From time to time, we are subject to claims in legal proceedings arising in the normal course of our business. Except as discussed below, we do not believe that we are currently party to any pending legal action that could reasonably be expected to have a material adverse effect on our business or operating results.
On September 10, 2014, a purported class action complaint was filed in the United States District Court for the District of New Jersey against the Company, its Chief Executive Officer and its Chief Financial Officer. The case is captioned In re Commvault Systems, Inc. Securities Litigation (Master File No. 3:14-cv-05628-MAS-LHG). The suit alleges that we made materially false and misleading statements, or failed to disclose material facts, regarding our financial results, business, operations and prospects in violation of Sections 10(b) and 20(a) of the Securities Exchange Act of 1934 and Rule 10b-5 promulgated thereunder. The suit is purportedly brought on behalf of purchasers of our common stock during the period from May 7, 2013 through April 24, 2014, and seeks compensatory damages, costs and expenses, as well as equitable or other relief. Lead plaintiff, the Arkansas Teachers Retirement System, was appointed on January 12, 2015, and on March 18, 2015, an amended complaint was filed by the plaintiffs. On December 17, 2015, the defendant’s motion to dismiss the case was granted and the case dismissed; however, the plaintiffs were permitted to re-file their claim, which they did on February 5, 2016. Defendants filed another motion to dismiss on April 5, 2016, which was denied by the court on September 30, 2016. Thereafter, discovery commenced. On October 2, 2017, the parties entered into an agreement in principle to settle the action for $12.5 million. The parties signed a stipulation of settlement on November 30, 2017. The settlement remains subject to court approval; the court has scheduled a hearing for May 14, 2018 to consider whether to approve the settlement. The settlement amount has been funded solely by our insurers. There can be no assurance that the settlement will ultimately be approved or that it will become final. If the settlement does not occur and litigation against us continues, we believe that we have meritorious defenses and intends to defend the case vigorously. However, due to the inherent uncertainties of litigation, we cannot accurately predict the ultimate outcome of this matter if the litigation continues.
On April 12, 2017, a shareholder derivative complaint was filed in the United States District Court for the District of New Jersey against the Company (nominally), certain of its executive officers and certain members of the board of directors. The complaint is entitled Murashko v. Hammer, et al. (Civ. No. 3:17-cv-02533-PGS-TJB). The plaintiff filed an amended
29
complaint on July 14, 2017. The amended complaint largely repeats the allegations made in the securities litigation also pending in the United States District Court for the District of New Jersey (In re Commvault Systems, Inc. Securities Litigation (Master File No. 3:14-cv-05628-PGS-LHG), claiming that the defendant officers and directors breached their fiduciary duties to the Company by causing, or allowing, the Company to manipulate its financial results and conceal the state of its business prospects. The suit also alleges that certain executive officers engaged in unlawful insider trading in 2013 and/or 2014 based on their knowledge of the information that was supposedly concealed. The allegations asserted in the shareholder derivative action purport to cover a period from 2013 through the present. As a derivative action, the complaint does not seek damages from the Company, but rather seeks to recover from the defendant officers and directors on behalf of the Company compensatory damages, restitution, costs and expenses, as well as equitable or other relief. On August 29, 2017, all of the defendants, including the Company, filed a motion to dismiss the derivative action; that motion was granted on February 22, 2018. The court dismissed the complaint without prejudice for failure to make a demand on the Company’s Board of Directors or to plead facts showing that a demand would be futile. The plaintiff chose not to appeal the dismissal of his complaint. On November 30, 2017, a virtually identical shareholder derivative complaint was filed in state court in New Jersey entitled Lee v. Hammer, et al., Civ. 201-17 (N.J. Super. Ct.). On April 27, 2018, the parties agreed to dismiss the complaint without prejudice. While both derivative cases have been dismissed without prejudice, due to the inherent uncertainties of litigation, these cases or similar cases may be brought again in the future and we cannot accurately predict the ultimate outcome of these matters should they be re-filed.
On February 27, 2017, Realtime Data LLC d/b/a/ IXO (Realtime), a non-practicing entity, sued us and Spectra Logic Corporation in the Eastern District of Texas for alleged infringement of four patents: U.S. Patent Nos. 9,054,728, 7,415,530, 9,116,908, and 8,717,204. Realtime dismissed the case in Texas and refiled this case in the District of Delaware on July 10, 2017. Realtime has sued numerous other companies for infringement of these and other patents. Realtime seeks monetary damages and an injunction. We responded to the complaint by filing a motion to dismiss on the grounds that the patents are directed to patent-ineligible subject matter. The Court has not yet ruled on this motion. Due to the inherent uncertainties of litigation, we cannot accurately predict the ultimate outcome of this matter. We are unable at this time to determine whether the outcome of the litigation will have a material impact on our results of operations, financial condition or cash flows. We intend to defend ourselves vigorously.
|
Item 4.
|
Mine Safety Disclosures
|
Not Applicable
30
|
Item 5.
|
Market for Registrant’s Common Equity, Related Stockholder Matters and Issuer Purchases of Equity Securities
|
Market for our Common Stock
Our common stock is listed and traded on The NASDAQ Global Market under the symbol “CVLT.” The following table sets forth, for the periods indicated, the high and the low closing sales prices of our common stock, as reported on The NASDAQ Global Market.
|
|
Common Stock
|
|||||||||||||||
|
|
2018
|
2017
|
||||||||||||||
|
|
High
|
Low
|
High
|
Low
|
||||||||||||
|
First Quarter
|
$
|
58.50
|
|
$
|
49.75
|
|
$
|
47.25
|
|
$
|
41.15
|
|
||||
|
Second Quarter
|
$
|
63.20
|
|
$
|
55.30
|
|
$
|
53.56
|
|
$
|
42.41
|
|
||||
|
Third Quarter
|
$
|
62.65
|
|
$
|
51.35
|
|
$
|
57.20
|
|
$
|
51.05
|
|
||||
|
Fourth Quarter
|
$
|
58.55
|
|
$
|
49.75
|
|
$
|
56.80
|
|
$
|
48.50
|
|
||||
On
May 1, 2018
, the last reported sale price of our common stock as reported on The NASDAQ Global Market was $67.45 per share.
Stockholders
As of
May 1, 2018
, there were approximately 50 holders of our common stock. The number of record holders does not represent the actual number of beneficial owners of shares of our common stock because shares are frequently held in street name by securities dealers and others for the benefit of individual owners who have the right to vote their shares.
Dividend Policy
We have never paid cash dividends on our common stock, and we intend to retain our future earnings, if any, to fund the growth of our business. We therefore do not anticipate paying any cash dividends on our common stock in the foreseeable future. Our future decisions concerning the payment of dividends on our common stock will depend upon our results of operations, financial condition and capital expenditure plans, as well as any other factors that the Board of Directors, in its sole discretion, may consider relevant.
Stock Performance Graph
The graph set forth below compares the cumulative total stockholder return on our common stock between
March 31, 2013
and
March 31, 2018
, with the cumulative total return of (i) The NASDAQ Computer Index and (ii) The NASDAQ Composite Index, over the same period. This graph assumes the investment of $100,000 on
March 31, 2013
in our common stock, The NASDAQ Composite Index and The NASDAQ Computer Index, and assumes the reinvestment of dividends, if any. The graph assumes the initial value of our common stock on
March 31, 2013
was the closing sales price of $49.64 per share.
The comparisons shown in the graph below are based upon historical data. The stock price performance shown in the graph below is not necessarily indicative of, nor is it intended to forecast, the future performance of our common stock. Information used in the graph was obtained from NASDAQ, a source we believe to be reliable, but we are not responsible for any errors or omissions in such information.
The performance graph shall not be deemed “filed” for purposes of Section 18 of the Exchange Act or otherwise subject to the liabilities under that Section, and shall not be deemed to be incorporated by reference into any filing of Commvault under the Securities Act or the Exchange Act.
31
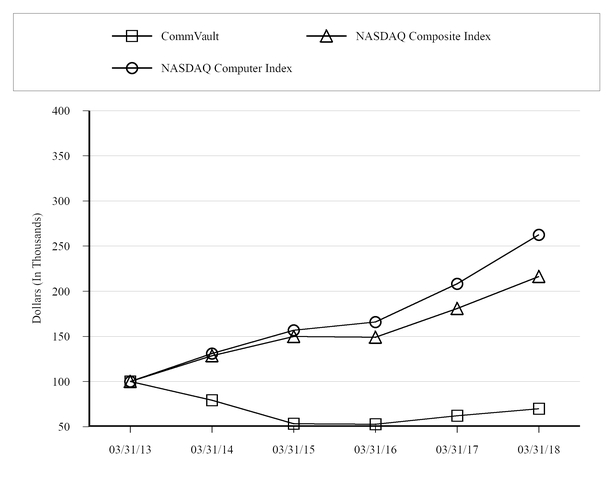
|
3/31/2013
|
3/31/2014
|
3/31/2015
|
3/31/2016
|
3/31/2017
|
3/31/2018
|
|||||||
|
Commvault
|
100.0
|
|
79.2
|
|
53.3
|
|
52.7
|
|
62.0
|
|
69.8
|
|
|
NASDAQ Composite Index
|
100.0
|
|
128.5
|
|
150.0
|
|
149.0
|
|
180.9
|
|
216.2
|
|
|
NASDAQ Computer Index
|
100.0
|
|
131.1
|
|
156.7
|
|
165.8
|
|
208.3
|
|
262.5
|
|
Issuer Purchases of Equity Securities
During the three months ended
March 31, 2018
, we repurchased $
20.9
million of common stock (
0.4
million shares).
|
Period
|
Total number of shares purchased as part of publicly announced programs
|
Average price paid per share
|
Total of Purchases
|
Approximate dollar value of shares that may yet be purchased under the program
|
||||||||||||
|
January 2018
|
|
|
$
|
133,749,434
|
|
|||||||||||
|
February 2018
|
406,745
|
|
$
|
51.41
|
|
$
|
20,909,200
|
|
$
|
112,840,234
|
|
|||||
|
March 2018
|
—
|
|
$
|
—
|
|
—
|
|
$
|
112,840,234
|
|
||||||
|
Three months ended March 31, 2018
|
406,745
|
|
$
|
51.41
|
|
$
|
20,909,200
|
|
||||||||
32
|
Item 6.
|
Selected Financial Data
|
The following selected financial data should be read in conjunction with our financial statements and related notes, “Risk Factors” and “Management’s Discussion and Analysis of Financial Condition and Results of Operations” included elsewhere in this Annual Report on Form 10-K. The selected statements of operations and the selected balance sheet data are derived from our audited financial statements. The historical results presented below are not necessarily indicative of the results to be expected in any future period.
|
|
Year Ended March 31,
|
|||||||||||||||||||
|
|
2018
|
2017
|
2016
|
2015
|
2014
|
|||||||||||||||
|
|
(In thousands, except per share data)
|
|||||||||||||||||||
|
Statement of Operations Data:
|
||||||||||||||||||||
|
Revenues:
|
||||||||||||||||||||
|
Software and products
|
$
|
311,745
|
|
$
|
290,668
|
|
$
|
258,091
|
|
$
|
283,254
|
|
$
|
294,411
|
|
|||||
|
Services
|
387,648
|
|
354,337
|
|
335,676
|
|
324,289
|
|
291,929
|
|
||||||||||
|
Total revenues
|
699,393
|
|
645,005
|
|
593,767
|
|
607,543
|
|
586,340
|
|
||||||||||
|
Cost of revenues:
|
||||||||||||||||||||
|
Software and products
|
7,223
|
|
3,045
|
|
2,385
|
|
2,442
|
|
2,588
|
|
||||||||||
|
Services
|
90,929
|
|
82,147
|
|
80,327
|
|
79,626
|
|
71,713
|
|
||||||||||
|
Total cost of revenues
|
98,152
|
|
85,192
|
|
82,712
|
|
82,068
|
|
74,301
|
|
||||||||||
|
Gross margin
|
601,241
|
|
559,813
|
|
511,055
|
|
525,475
|
|
512,039
|
|
||||||||||
|
Operating expenses:
|
||||||||||||||||||||
|
Sales and marketing
|
410,727
|
|
383,933
|
|
349,199
|
|
335,980
|
|
283,304
|
|
||||||||||
|
Research and development
|
94,164
|
|
83,543
|
|
69,287
|
|
64,143
|
|
55,134
|
|
||||||||||
|
General and administrative
|
87,575
|
|
84,944
|
|
78,848
|
|
78,063
|
|
67,106
|
|
||||||||||
|
Depreciation and amortization
|
9,721
|
|
8,635
|
|
9,611
|
|
8,505
|
|
6,075
|
|
||||||||||
|
Total operating expenses
|
602,187
|
|
561,055
|
|
506,945
|
|
486,691
|
|
411,619
|
|
||||||||||
|
Income (loss) from operations
|
(946
|
)
|
(1,242
|
)
|
4,110
|
|
38,784
|
|
100,420
|
|
||||||||||
|
Interest expense
|
(1,161
|
)
|
(957
|
)
|
(933
|
)
|
(665
|
)
|
—
|
|
||||||||||
|
Interest income
|
2,228
|
|
1,163
|
|
862
|
|
773
|
|
890
|
|
||||||||||
|
Equity in loss of affiliate
|
(3,621
|
)
|
(958
|
)
|
(83
|
)
|
—
|
|
—
|
|
||||||||||
|
Income (loss) before income taxes
|
(3,500
|
)
|
(1,994
|
)
|
3,956
|
|
38,892
|
|
101,310
|
|
||||||||||
|
Income tax expense (benefit)
|
58,400
|
|
(1,486
|
)
|
2,236
|
|
13,242
|
|
37,246
|
|
||||||||||
|
Net income (loss)
|
$
|
(61,900
|
)
|
$
|
(508
|
)
|
$
|
1,720
|
|
$
|
25,650
|
|
$
|
64,064
|
|
|||||
|
Net income (loss) per common share:
|
||||||||||||||||||||
|
Basic
|
$
|
(1.37
|
)
|
$
|
(0.01
|
)
|
$
|
0.04
|
|
$
|
0.56
|
|
$
|
1.36
|
|
|||||
|
Diluted
|
$
|
(1.37
|
)
|
$
|
(0.01
|
)
|
$
|
0.04
|
|
$
|
0.54
|
|
$
|
1.29
|
|
|||||
|
Weighted average shares used in computing per share amounts:
|
||||||||||||||||||||
|
Basic
|
45,242
|
|
44,700
|
|
45,159
|
|
45,464
|
|
46,976
|
|
||||||||||
|
Diluted
|
45,242
|
|
44,700
|
|
46,489
|
|
47,222
|
|
49,642
|
|
||||||||||
Note: Previously reported information for 2017 and 2016 has been restated for the adoption of Accounting Standards Codification (ASC) Topic 606, Revenue from Contracts with Customers, while previously reported information for 2015 and 2014 has not been restated and is, therefore, not comparable to the 2018, 2017 and 2016 information. For further discussion of these two standards, see Note 2 to the Consolidated Financial Statements.
33
|
|
As of March 31,
|
|||||||||||||||||||
|
|
2018
|
2017
|
2016
|
2015
|
2014
|
|||||||||||||||
|
|
(In thousands)
|
|||||||||||||||||||
|
Balance Sheet Data:
|
||||||||||||||||||||
|
Cash and cash equivalents
|
$
|
330,784
|
|
$
|
329,491
|
|
$
|
288,107
|
|
$
|
337,673
|
|
$
|
457,733
|
|
|||||
|
Short-term investments
|
131,637
|
|
120,693
|
|
99,072
|
|
49,936
|
|
24,976
|
|
||||||||||
|
Working capital
|
322,615
|
|
318,142
|
|
252,413
|
|
267,480
|
|
387,004
|
|
||||||||||
|
Total assets
|
818,642
|
|
829,878
|
|
714,573
|
|
713,466
|
|
755,384
|
|
||||||||||
|
Deferred revenue
|
325,774
|
|
279,902
|
|
244,866
|
|
229,735
|
|
209,575
|
|
||||||||||
Note: Previously reported information for 2017 has been restated for the adoption of Accounting Standards Codification (ASC) Topic 606, Revenue from Contracts with Customers, while previously reported information for 2016, 2015 and 2014 has not been restated and is, therefore, not comparable to the 2018, and 2017 information. For further discussion of these two standards, see Note 2 to the Consolidated Financial Statements.
34
|
Item 7.
|
Management’s Discussion and Analysis of Financial Condition and Results of Operations
|
You should read the following discussion and analysis along with our consolidated financial statements and the related notes included elsewhere in this Annual Report on Form 10-K. The statements in this discussion regarding our expectations of our future performance, liquidity and capital resources, and other non-historical statements are forward-looking statements. These forward-looking statements are subject to numerous risks and uncertainties, including, but not limited to, the risks and uncertainties described under “Risk Factors” and elsewhere in this Annual Report on Form 10-K. Our actual results may differ materially from those contained in or implied by any forward-looking statements.
Overview
Commvault is a leading provider of data and information management software products and related services. Commvault was incorporated in 1996 as a Delaware corporation. The Commvault software platform is an enterprise level, integrated data and information management solution, built from the ground up on a single platform and unified code base. All software functionality share the same back-end technologies to deliver the benefits of a holistic approach to protecting, managing, and accessing data. The software addresses many aspects of data management in the enterprise, while providing scalability and control of data and information. In fiscal 2018 the Company also started selling appliances that integrate the Commvault software with hardware and address a wide-range of business needs and use cases, ranging from support for remote or branch offices with limited IT staff up to large corporate data centers. The Company also provides customers with a broad range of professional services that are delivered by our worldwide support and field operations.
Commvault software enables our customers to simply and cost effectively protect and manage their enterprise data throughout its lifecycle, from the mobile worker to the remote office, to the data center, covering the leading operating systems, relational databases, virtualized environments and applications. In addition to addressing today’s data and information management challenges, our customers can realize lower capital costs through more efficient use of their enterprise-wide storage infrastructure assets. This includes the automated movement of data from higher cost to lower cost storage devices throughout its lifecycle, and through sharing and better utilization of storage resources across the enterprise. We can also provide our customers with reduced operating costs through a variety of methods, including fast application deployment, reduced training time, lower cost of storage media consumables, proactive monitoring and analysis, and lower administrative overhead. We also provide our customers with a broad range of professional services that are delivered by our worldwide support and field operations. As of
March 31, 2018
we had licensed our software applications to over
26,000
registered customers.
History and Background
In early 2000, we launched Commvault Galaxy for backup and recovery, a storage industry award winner. In the years since, Commvault has forged numerous alliances with top software application and hardware vendors, such as Hitachi Vantara, Microsoft, Network Appliance, Fujitsu, Novell and Oracle, to enhance capabilities and to create a premiere suite of data and information management solutions. In 2002, we launched our single-platform technology that provides the foundation of our information management approach to storing, managing, and accessing data. In addition to Data Protection - Backup & Recovery, the subsequent release of our other software application technologies has increased our addressable market. Each software technology can be used individually or in combination with other technologies from our single platform suite.
Historically, our software licenses have typically provided for a perpetual right to use our software and were sold on a per terabyte capacity basis, on a per-copy basis, as site licenses or as a solution set. During the fiscal year ended
March 31, 2018
, approximately 63% of software license revenue was sold on a capacity basis. Capacity based software licenses provide our customers with unlimited licenses of specified software products based on a defined level of terabytes of data under management. As a result, when we sell our platform through a capacity license, certain of the various Commvault functionalities are bundled into one capacity based price. Site licenses give the customer the additional right to deploy the software on a limited basis during a specified term.
Our solution sets are generally sold on a per unit basis such as per virtual machine for our virtual machine backup, recovery and cloud management solution set; per mailbox for our email archive solution set, and per user for our endpoint data protection solution set. These solution sets are purpose-built offerings designed to accelerate private, public and hybrid cloud adoption that seamlessly integrate with our single platform software, offering a path towards holistic data management while allowing customers to utilize functionality that addresses the point solution requirements their business dictates. We primarily sell solution sets for virtual machine backup, recovery and cloud management; endpoint data protection; and email archive. We expect that more of our revenue will be generated from sales of solution sets in the next few years.
35
Prior to fiscal 2018, an insignificant amount of our revenue was sold under subscription, or term based, license arrangements. Any of our licensing models (capacity, solution set, etc.) can be sold via a subscription arrangement. In these arrangements the customer has the right to use the software over a designated period of time. The capacity of the license is fixed and the customer has made an unconditional commitment to pay. Software revenue in these arrangements is recognized when the software is delivered. In fiscal 2018 we started to introduce more subscription arrangements into the market. We expect revenue from these types of arrangements as a percentage of our total revenue to increase in the next few years. We also sell to some customers, primarily managed service providers, via utility, or pay-as-you-go models. In these arrangements actual usage is regularly measured and billed. Revenue in these utility arrangements is recognized as the software is used.
The industry in which we currently operate continues to go through accelerating changes as the result of compounding data growth and the introduction of new technologies. We are continuing to pursue an aggressive product development program in both data and information management solutions. Our data management solutions include not only traditional backup, but also new innovations in de-duplication, data movement, virtualization, snap-based backups and enterprise reporting. Our information management innovations are primarily in the areas of archiving, eDiscovery, records management, governance, operational reporting and compliance. We remain focused on both the data and information management trends in the marketplace and, in fact, a material portion of our existing research and development expenses are utilized toward the development of such new technologies discussed above. While we are confident in our ability to meet these changing industry demands with our Commvault suite and potential future releases, the development, release and timing of any features or functionality remain at our sole discretion and our solutions or other technologies may not be widely adopted.
Given the nature of the industry in which we operate, our software applications are subject to obsolescence. We continually develop and introduce updates to our existing software applications in order to keep pace with evolving industry technologies. In addition, we must address evolving industry standards, changing customer requirements and competitive software applications that may render our existing software applications obsolete. In fiscal 2018 we also started selling a backup appliance which integrates our software with hardware. If our forecast exceeds our actual requirements, a supply chain partner may assess additional charges or we may incur costs related to excess inventory, each of which could negatively affect our gross margins.
For each of our software applications, we provide full support for the current generally available release and one prior release. When we declare a product release obsolete, a customer notice is delivered twelve months prior to the effective date of obsolescence announcing continuation of full product support for the first six months. We provide an additional six months of extended assistance support in which we only provide existing workarounds or fixes that do not require additional development activity. We do not have existing plans to make any of our software products permanently obsolete.
Sources of Revenues
We derive a significant portion of our total revenues from sales of licenses of our software applications. We do not customize our software for a specific end-user customer. We sell our software applications and products to end-user customers both directly through our sales force and indirectly through our global network of value-added reseller partners, systems integrators, corporate resellers and original equipment manufacturers. Our software and products revenue was
45%
of our total revenues for
fiscal 2018
,
45%
for
fiscal 2017
and
43%
for
fiscal 2016
.
In recent fiscal years, we generated approximately three-quarters of our software and products revenue from our existing customer base and approximately one-quarter of our software and products revenue from new customers. In addition, our total software and products revenue in any particular period is, to a certain extent, dependent upon our ability to generate revenues from large customer software and products deals, which we refer to as enterprise transactions. Enterprise transactions (transactions greater than $0.1 million) represented approximately
59%
of our software and products revenue in
fiscal 2018
, 56% for
fiscal 2017
and 54% for
fiscal 2016
.
36
Software and products revenue generated through indirect distribution channels was
86%
of total software and products revenue in
fiscal 2018
,
87%
in
fiscal 2017
and
86%
in
fiscal 2016
. Software and products revenue generated through direct distribution channels was
14%
of total software and products revenue in
fiscal 2018
,
13%
in
fiscal 2017
and
14%
in
fiscal 2016
. The dollar value of software and products revenue generated through indirect distribution channels
increased
approximately $
16.1 million
, or
6%
, in
fiscal 2018
compared to
fiscal 2017
. The dollar value of software and products revenue generated through direct distribution
increased
$5.0 million
, or
13%
, in
fiscal 2018
compared to
fiscal 2017
. Deals initiated by our direct sales force are sometimes transacted through indirect channels based on end-user customer requirements, which are not always in our control and can cause this overall percentage split to vary from fiscal year to fiscal year. As such, there may be fluctuations in the dollars and percentage of software and products revenue generated through our direct distribution channels from time to time. We believe that the growth of our software and products revenue, derived from both our indirect channel partners and direct sales force, are key attributes to our long-term growth strategy. We will continue to invest in both our channel relationships and direct sales force in the future, but we continue to expect more revenue to be generated through indirect distribution channels over the long term. The failure of our indirect distribution channels or our direct sales force to effectively sell our software applications could have a material adverse effect on our revenues and results of operations.
Our primary original equipment manufacturer agreement is with Hitachi Vantara (Hitachi) and allows them to market, sell and support our software applications and services on a stand-alone basis and/or incorporate our software applications into their own hardware products. Our OEM partners, including Hitachi, have no obligation to recommend or offer our software applications exclusively or at all, and they have no minimum sales requirements and can terminate our relationship at any time. Sales through our original equipment manufacturer agreements accounted for
12%
of our total revenues for
fiscal 2018
and
15%
of our total revenues for
fiscal 2017
.
We also have non-exclusive distribution agreements covering our North American commercial markets and our U.S. Federal Government market with Arrow Enterprise Computing Solutions, Inc. (Arrow), a subsidiary of Arrow Electronics, Inc. Pursuant to these distribution agreements, these distributors’ primary role is to enable a more efficient and effective distribution channel for our products and services by managing our reseller partners and leveraging their own industry experience. We generated approximately
36%
of our total revenues through Arrow in
fiscal 2018
, approximately
36%
of our total revenues in
fiscal 2017
and approximately
38%
of our total revenues in
fiscal 2016
. If Arrow was to discontinue or reduce the sales of our products or if our agreement with Arrow was terminated, and if we were unable to take back the management of our reseller channel or find another North American distributor to replace Arrow, then it could have a material adverse effect on our future business.
Our services revenue was
55%
of our total revenues for
fiscal 2018
,
55%
for
fiscal 2017
and
57%
for
fiscal 2016
. Our services revenue is made up of fees from the delivery of customer support and other professional services, which are typically sold in connection with the sale of our software applications. Customer support agreements provide technical support and unspecified software updates on a when-and-if-available basis for an annual fee based on licenses purchased and the level of service subscribed. Other professional services include consulting, assessment and design services, implementation and post-deployment services and training, all of which to date have predominantly been sold in connection with the sale of software applications.
Most of our customer support agreements are for a one-year term. As the end of the annual period approaches, we pursue the renewal of the agreement with the customer. Historically, maintenance renewals have represented a significant portion of our total revenue. Because of this characteristic of our business, if our customers choose not to renew their maintenance and support agreements with us on beneficial terms, or at all, our business, operating results and financial condition could be harmed.
The gross margin of our services revenue was
77%
for
fiscal 2018
, and
77%
for
fiscal 2017
and
76%
for
fiscal 2016
. Overall, our services revenue has lower gross margins than our software and products revenue. The gross margin of our software and products revenue was
98%
for
fiscal 2018
, and
99%
for
fiscal 2017
and
fiscal 2016
. An increase in the percentage of total revenues represented by services revenue may adversely affect our overall gross margin percentage. Additionally, we expect sales of our integrated appliances will increase, resulting in a decline of software and products gross margin percentage.
Related Party Transactions
During the first quarter of fiscal 2018, one of our Directors, Joseph F. Eazor, was hired as the CEO of Rackspace, Inc (Rackspace). Rackspace has been a customer of the Company since 2006. Total recognized revenue related to Rackspace in fiscal
2018
was
$10.0 million
. This total includes the renewal of a subscription software license in March 2018 for
$4.8 million
. The outstanding accounts receivable from this customer as of
March 31, 2018
is
$5.7 million
.
37
Description of Costs and Expenses
Our cost of revenues is as follows:
|
•
|
Cost of Software and Products Revenue
, consists primarily of the cost of appliance hardware, third-party royalties and other costs such as media, manuals, translation and distribution costs; and
|
|
•
|
Cost of Services Revenue
, consists primarily of salary and employee benefit costs in providing customer support and other professional services.
|
Our operating expenses are as follows
|
•
|
Sales and Marketing
, consists primarily of salaries, commissions, employee benefits, stock-based compensation and other direct and indirect business expenses, including travel and related expenses, sales promotion expenses, public relations expenses and costs for marketing materials and other marketing events (such as trade shows and advertising);
|
|
•
|
Research and Development
, which is primarily the expense of developing new software applications and modifying existing software applications, consists principally of salaries, stock-based compensation and benefits for research and development personnel and related expenses; contract labor expense and consulting fees as well as other expenses associated with the design, certification and testing of our software applications; and legal costs associated with the patent registration of such software applications;
|
|
•
|
General and Administrative
, consists primarily of salaries, stock-based compensation and benefits for our executive, accounting, human resources, legal, information systems and other administrative personnel. Also included in this category are other general corporate expenses, such as outside legal and accounting services, compliance costs and insurance; and
|
|
•
|
Depreciation and Amortization
, consists of depreciation expense primarily for our owned Corporate Campus Headquarters location and computer equipment we use for information services and in our development and test labs.
|
Foreign Currency Exchange Rates’ Impact on Results of Operations
Sales outside the United States were approximately
46%
of our total revenue for
fiscal 2018
,
44%
for
fiscal 2017
and 42% for
fiscal 2016
. The income statements of our non-U.S. operations are translated into U.S. dollars at the average exchange rates for each applicable month in a period. To the extent the U.S. dollar weakens against foreign currencies, the translation of these foreign currency denominated transactions generally results in increased revenue, operating expenses and income from operations for our non-U.S. operations. Similarly, our revenue, operating expenses and net income will generally decrease for our non-U.S. operations if the U.S. dollar strengthens against foreign currencies.
Using the average foreign currency exchange rates from
fiscal 2017
, our software and products revenue would have been lower by $7.3 million, our services revenue would have been lower by $5.9 million, our cost of sales would have been lower by $2.3 million and our operating expenses would have been lower by $6.3 million from non-U.S. operations for
fiscal 2018
.
Using the average foreign currency exchange rates from
fiscal 2016
, our software and products revenue would have been higher by $5.3 million, our services revenue would have been higher by $4.1 million, our cost of sales would have been higher by $0.3 million and our operating expenses would have been higher by $10.6 million from non-U.S. operations for
fiscal 2017
.
In addition, we are exposed to risks of foreign currency fluctuation primarily from cash balances, accounts receivables and intercompany accounts denominated in foreign currencies and are subject to the resulting transaction gains and losses, which are recorded as a component of general and administrative expenses. We recognized net foreign currency transaction gains of
$0.1 million
in
fiscal 2018
,
$0.6 million
in
fiscal 2017
, and
$0.2 million
in
fiscal 2016
.
38
Critical Accounting Policies
In presenting our consolidated financial statements in conformity with U.S. generally accepted accounting principles, we are required to make estimates and judgments that affect the amounts reported therein. Some of the estimates and assumptions we are required to make relate to matters that are inherently uncertain as they pertain to future events. We base these estimates on historical experience and on various other assumptions that we believe to be reasonable and appropriate. Actual results may differ significantly from these estimates. The following is a description of our accounting policies that we believe require subjective and complex judgments, which could potentially have a material effect on our reported financial condition or results of operations.
Revenue Recognition
We account for revenue in accordance with ASC Topic 606, Revenue from Contracts with Customers. Our revenue recognition policies require us to make significant judgments and estimates. In applying our revenue recognition policy, we must determine which portions of our revenue are recognized currently (generally software and products revenue) and which portions must be deferred and recognized in future periods (generally services revenue). We analyze various factors including, but not limited to, the selling price of undelivered services when sold on a stand-alone basis, our pricing policies, the credit-worthiness of our customers, and contractual terms and conditions in helping us to make such judgments about revenue recognition. Changes in judgment on any of these factors could materially impact the timing and amount of revenue recognized in a given period.
We derive revenue from two primary sources: software and products, and services. Services include customer support (software updates and technical support), consulting, assessment and design services, installation services and customer education. A typical contract includes both licenses and services.
Our software licenses typically provide for a perpetual right to use our software. We also sell term-based software licenses that expire, which are referred to as subscription arrangements. We do not customize our software and installation services are not required. The software is delivered before related services are provided and is functional without professional services, updates and technical support. We have concluded that our software license is functional intellectual property that is distinct as the user can benefit from the software on its own. Software and product revenue is typically recognized when the software is delivered and/or made available for download as this is the point the user of the software can direct the use of, and obtain substantially all of the remaining benefits from the functional intellectual property. We do not recognize software revenue related to the renewal of subscription software licenses earlier than the beginning of the subscription period.
In fiscal 2018, we also started selling appliances that integrate our software with hardware and address a wide-range of business needs and use cases, ranging from support for remote or branch offices with limited IT staff up to large corporate data centers. Revenue related to appliances is recognized when control of the appliances passes to the customer; typically upon delivery. Revenue to date related to appliances has not been significant.
Services revenue includes revenue from customer support and other professional services. Customer support includes software updates on a when-and-if-available basis, telephone support, integrated web-based support and bug fixes or patches. The Company sells its customer support contracts as a percentage of net software purchases the support is related to. Customer support revenue is recognized ratably over the term of the customer support agreement, which is typically one year.
Other professional services include consulting, assessment and design services, installation services and customer education. Customer education services include courses taught by our instructors or third-party contractors. Revenue related to other professional services and customer education services is typically recognized as the services are performed.
Most of our contracts with customers contain multiple performance obligations. For these contracts, we account for individual performance obligations separately if they are distinct. The transaction price is allocated to the separate performance obligations on a relative standalone selling price basis. Standalone selling prices of software and products are typically estimated using the residual approach. Standalone selling prices of services are typically estimated based on observable transactions when these services are sold on a standalone basis.
39
The Company’s typical performance obligations include the following:
|
Performance Obligation
|
When Performance Obligation
is Typically Satisfied
|
When Payment is
Typically Due
|
How Standalone Selling Price is
Typically Estimated
|
|
Software and Products Revenue
|
|||
|
Software Licenses
|
Upon shipment or made available for download (point in time)
|
Within 90 days of shipment except for certain subscription licenses which are paid for over time
|
Residual approach
|
|
Appliances
|
When control of the appliances passes to the customer; typically upon delivery
|
Within 90 days of delivery except for certain subscriptions which are paid for over time
|
Residual approach
|
|
Customer Support Revenue
|
|||
|
Software Updates
|
Ratably over the course of the support contract (over time)
|
At the beginning of the contract period
|
Observable in renewal transactions
|
|
Customer Support
|
Ratably over the course of the support contract (over time)
|
At the beginning of the contract period
|
Observable in renewal transactions
|
|
Professional Services
|
|||
|
Other Professional Services (except for education services)
|
As work is performed (over time)
|
Within 90 days of services being performed
|
Observable in transactions without multiple performance obligations
|
|
Education Services
|
When the class is taught (point in time)
|
Within 90 days of services being performed
|
Observable in transactions without multiple performance obligations
|
Stock-Based Compensation
As of
March 31, 2018
, we maintain two stock incentive plans, which are described more fully in Note 9 of our
“Notes to Consolidated Financial Statements
.” We account for our stock incentive plans based on the grant date fair value recognition provisions in accordance with ASC 718. Compensation for share-based payment awards is generally recognized on a straight-line basis over the requisite service period of the awards, which is generally the vesting period. However, awards granted to senior executives that include market or performance conditions are recognized using the accelerated method. In March 2016, the FASB issued ASU No. 2016-09, Improvements to Employee Share-Based Payment Accounting (Topic 718), which simplified the accounting for share-based payment transactions, including related accounting for income taxes, forfeitures, and classification in the statement of cash flows. In connection with the adoption of this guidance we elected an accounting policy to account for forfeitures as they occur. The guidance also requires excess tax benefits and tax deficiencies to be recorded as income tax benefit or expense in the statement of income when the awards vest or are settled, and eliminates the requirement to reclassify cash flows related to excess tax benefits from operating activities to financing activities on the statement of cash flows.
In fiscal 2018, we granted 107,000 performance restricted stock units (PSU) to certain executives. Vesting of these awards is contingent upon i) the Company meeting certain company-wide revenue and non-GAAP performance goals (performance-based) in fiscal 2018 and ii) the Company's customary service periods. The awards vest over three years and have a maximum potential to vest at 200% (214,000 shares) based on actual fiscal 2018 performance. The related stock-based compensation expense is determined based on the value of the underlying shares on the date of grant and is recognized over the vesting term using the accelerated method. During the interim financial periods, management estimates the probable number of PSUs that would vest until the ultimate achievement of the performance goals is known.
In fiscal 2018, we granted 88,000 market performance stock units to certain executives. The vesting of these awards is contingent upon meeting certain total shareholder return (TSR) levels as compared to a market index over the next
three
years. The awards vest in three annual tranches and have a maximum potential to vest at
200%
(
176
,000 shares) based on TSR performance. The related stock-based compensation expense is determined based on the estimated fair value of the underlying shares on the date of grant and is recognized using the accelerated method over the vesting term. The estimated fair value was calculated using a Monte Carlo simulation model. The weighted average fair value of the awards granted during the year was
$78.28
.
40
Accounting for Income Taxes
Under ASC 740, deferred income taxes arise from temporary differences between the tax basis of assets and liabilities and their reported amounts. Valuation allowances are established when, in the our judgment, it is more likely than not that deferred tax assets will not be realized. In assessing the need for a valuation allowance, we weigh the available positive and negative evidence, including historical levels of pre-tax income, legislative developments, expectations and risks associated with estimates of future pre-tax income, and prudent and feasible tax planning strategies. During the year ended March 31, 2018 we concluded that based on the amount, and trend, of pre-tax loss in recent fiscal years it is more likely than not that we will not realize the benefits of its gross deferred tax assets and therefore have recorded a valuation allowance to reduce the carrying value of these gross deferred tax assets, net of the impact of the reversal of taxable temporary differences, to zero. The valuation allowance is material to our financial statements. In the future, changes to our estimates regarding the realizability of our gross deferred tax assets could materially impact our results of operations.
We conduct business globally and as a result, file income tax returns in the United States and in various state and foreign jurisdictions. In the normal course of business, we are subject to examination by taxing authorities throughout the world, including such major jurisdictions as the United States, Australia, Canada, Germany, Netherlands and United Kingdom.
Software Development Costs
Research and development expenditures are charged to operations as incurred. Based on our software development process, technological feasibility is established upon completion of a working model, which also requires certification and extensive testing. Costs incurred by us between completion of the working model and the point at which the product is ready for general release are immaterial.
Deferred Commissions Cost
Sales commissions and related payroll taxes earned by our employees are considered incremental and recoverable costs of obtaining a contract with a customer. Our typical contracts include performance obligations related to software licenses, software updates, customer support and other professional services. In these contracts, incremental costs of obtaining a contract are allocated to the performance obligations based on the relative estimated standalone selling prices and then recognized on a systematic basis that is consistent with the transfer of the goods or services to which the asset relates. We do not pay commissions on annual renewals of contracts for software updates and customer support for perpetual licenses. The costs allocated to software are expensed at the time of sale, when revenue for the functional software license is recognized. The costs allocated to software updates and customer support for perpetual licenses are amortized ratably over a period of approximately five years, the expected period of benefit of the asset capitalized. We currently estimate a period of five years is appropriate based on consideration of historical average customer life and the estimated useful life of the underlying software sold as part of the transaction. The costs related to professional services are amortized within one quarter following the date of the related software sale, which is typically the period the related professional services are provided and revenue is recognized. If we were to change our estimate of the period of benefit of these deferred costs it would impact our results of operations.
Costs related to software updates and support for term-based, or subscription software licenses, are limited to the contractual period of the arrangement as we intend to pay a commensurate commission upon renewal of the subscription license and related updates and support.
Results of Operations
Fiscal year ended
March 31, 2018
compared to fiscal year ended
March 31, 2017
Revenues
Total revenues
increased
$54.4 million
, or
8%
, from
$645.0 million
in
fiscal 2017
to
$699.4 million
in
fiscal 2018
.
Software and Products Revenue.
Software and products revenue
increased
$21.1 million
, or
7%
, from
$290.7 million
in
fiscal 2017
to
$311.7 million
in
fiscal 2018
. Software and products revenue represented
45%
of our total revenues in
fiscal 2018
and
fiscal 2017
.
41
The overall
increase
in software and products revenue was primarily driven by an increase in the amount of enterprise transaction revenue (transactions greater than $0.1 million), which
increased
by
$21.2 million
, or
13%
in
fiscal 2018
compared to
fiscal 2017
. Enterprise transactions represented approximately
59%
and
56%
of our software and products revenue in
fiscal 2018
and
fiscal 2017
, respectively. The
increase
in enterprise transactions is due to a
1%
increase
in the number of transactions of this type and by a
12%
increase
in the average dollar amount of such transactions. The average dollar amount of enterprise transactions was approximately
$292,000
in
fiscal 2018
and approximately
$261,000
in
fiscal 2017
. Software and products revenue derived from transactions less than $0.1 million
decreased
$0.1 million
, in
fiscal 2018
compared to
fiscal 2017
.
We track software and products revenue on a geographic basis. The geographic regions that are tracked are the Americas (United States, Canada, Latin America), EMEA (Europe, Middle East, Africa) and APAC (Australia, New Zealand, Southeast Asia, China). Americas, EMEA and APAC represented 54%, 32% and 14% of total software and products revenue, respectively, for the fiscal year ended
March 31, 2018
. The year over year increase of Software and Products Revenue in the Americas, EMEA and APAC was flat,
22%
and
9%
, respectively.
|
•
|
The number of enterprise revenue transactions increased in the Americas year over year, resulting in a slight increase in total enterprise transaction revenue. This increase was offset by a decline in non-enterprise transaction revenue.
|
|
•
|
The increase in EMEA software and products revenue was primarily the result of an increase in the number of enterprise transactions. This increase was also caused by the impact of changes in foreign exchange rates as the U.S. dollar weakened against the Euro and British pound sterling. Using average foreign exchange rates from fiscal
2017
, fiscal
2018
EMEA software and products revenue would have increased 15% compared to an actual reported EMEA software and products revenue increase of
22%
.
|
|
•
|
The increase in APAC software and products revenue was the result of an increase in revenue from non-enterprise transactions.
|
Our software and products revenue in EMEA and APAC is subject to changes in foreign exchange rates as more fully discussed above in the
“Foreign Currency Exchange Rates’ Impact on Results of Operations”
section.
Software and products revenue derived from our indirect distribution channel (resellers and original equipment manufacturers)
increased
$16.1 million
, or
6%
in
fiscal 2018
compared to
fiscal 2017
, and software and products revenue through our direct sales force
increased
$5.0 million
, or
13%
in
fiscal 2018
compared to
fiscal 2017
. For additional discussion on software and products revenue derived from our direct sales force see the
“Sources of Revenue”
section.
Services Revenue.
Services revenue
increased
$33.3 million
, or
9%
, from
$354.3 million
in
fiscal 2017
to
$387.6 million
in
fiscal 2018
. Services revenue represented
55%
of our total revenues in
fiscal 2018
and
fiscal 2017
. The net
increase
in services revenue is due to a
$31.2 million
increase in revenue from customer support agreements as a result of software sales to new customers and renewal agreements with our installed software base.
Cost of Revenues
Total cost of revenues
increased
$13.0 million
, or
15%
, from
$85.2 million
in
fiscal 2017
to
$98.2 million
in
fiscal 2018
. Total cost of revenues represented
14%
of our total revenues in
fiscal 2018
compared to 13% in
fiscal 2017
. The increase in cost of revenues as a percentage of total revenue was driven by sales of our Hyperscale Appliances.
Cost of Software and Products Revenue.
Cost of software and products revenue was
$7.2 million
in
fiscal 2018
and
$3.0 million
in
fiscal 2017
, representing approximately 2% of software and products revenue in
fiscal 2018
compared to 1% in
fiscal 2017
. The increase in cost of software and products revenue is primarily related to additional costs associated with appliance product offerings. As sales of our appliances continue to ramp, we expect the cost of software and products as a percentage of software and products revenue will increase.
Cost of Services Revenue.
Cost of services revenue
increased
$8.8 million
, or
11%
, from
$82.1 million
in
fiscal 2017
to
$90.9 million
in
fiscal 2018
. Cost of services revenue represented
23%
of our services revenue in
fiscal 2018
and
fiscal 2017
.
42
Operating Expenses
Sales and Marketing.
Sales and marketing expenses
increased
$26.8 million
, or
7%
, from
$383.9 million
in
fiscal 2017
to
$410.7 million
in
fiscal 2018
. The
increase
is primarily due to a $24.2 million increase in employee compensation and related expenses attributable to the expansion of our sales force from the prior year and a $2.9 million increase in stock-based compensation. Sales and marketing expenses as a percentage of total revenues
decreased
to
59%
in
fiscal 2018
compared to
60%
in
fiscal 2017
.
Research and Development.
Research and development expenses increased
$10.6 million
, or
13%
, from
$83.5 million
in
fiscal 2017
to
$94.2 million
in
fiscal 2018
. The increase is primarily due to an increase in employee compensation and related expenses attributable to the expansion of our engineering group from the prior year. Research and development expenses as a percentage of total revenues remained at
13%
in
fiscal 2018
and
fiscal 2017
. Investing in research and development has been a priority for Commvault, and we anticipate continued spending related to the development of our data and information management software applications.
General and Administrative.
General and administrative expenses
increased
$2.6 million
, or
3%
, from
$84.9 million
in
fiscal 2017
to
$87.6 million
in
fiscal 2018
. This increase is primarily due to increases in employee and related compensation. General and administrative expenses in
fiscal 2018
includes
$0.1 million
of net foreign currency transaction gains compared to
$0.6 million
of net foreign currency transaction gains recognized in general and administrative expenses in
fiscal 2017
. General and administrative expenses as a percentage of total revenues was
13%
in both
fiscal 2018
and
fiscal 2017
.
Depreciation and Amortization.
Depreciation expense
increased
$1.1 million
, from
$8.6 million
in
fiscal 2017
to
$9.7 million
in
fiscal 2018
.
Subsequent Event .
On May 1, 2018 we announced a restructuring plan to increase efficiency in our sales, marketing and distribution functions as well as reduce costs across all functional areas. As part of this strategic initiative, our workforce will be reduced by approximately 4%. We expect to incur total pre-tax charges of approximately $6.0 to $8.0 million, most of which will be recognized in the first quarter of fiscal 2019. These restructuring charges relate primarily to severance and related costs associated with headcount reductions.
Interest Expense
Interest expense of
$1.2 million
in
fiscal 2018
was related to the amortization of debt issuance costs and commitment fees related to our Revolving Credit Facility. Fiscal 2018 includes additional amortization due to the termination of the revolving credit facility in February 2018.
Interest Income
Interest income
increased
$1.1 million
, from
$1.2 million
in
fiscal 2017
to
$2.2 million
in
fiscal 2018
. The increase was the result of an increase in short term investments and increased yield on those investments. Our short term investments are in U.S. Treasury Bills.
Equity in Loss of Affiliate
During fiscal 2018 we identified an indicator of impairment related to our investment in Laitek, Inc. (Laitek), which is accounted for using the equity method. As a result, we impaired the investment to our estimate of fair value, which was zero. We will not provide for additional losses of Laitek as we have not guaranteed any obligations of Laitek or committed to providing financial support.
Income Tax Expense
Income tax expense was
$58.4 million
in
fiscal 2018
compared to a benefit of
$1.5 million
in
fiscal 2017
. The increase in income tax expense was primarily the result of the combined impact of the lower U.S. corporate income tax rate on deferred tax assets and recording a valuation allowance against the remaining value of net deferred tax assets.
Fiscal year ended
March 31, 2017
compared to fiscal year ended
March 31, 2016
Revenues
Total revenues increased $51.2 million, or 9%, from $593.8 million in fiscal 2016 to $645.0 million in fiscal 2017.
Software and Products Revenue.
Software and products revenue increased $32.6 million, or 13%, from $258.1 million in fiscal 2016 to $290.7 million in fiscal 2017. Software and products revenue represented 45% of our total revenues in fiscal 2017 compared to 43% in fiscal 2016.
43
The overall increase in software and products revenue was primarily driven by an increase in the number of enterprise transactions (transactions greater than $0.1 million), which increased by $26.1 million, or 19% in fiscal 2017 compared to fiscal 2016. Enterprise transactions represented approximately 56% and 54% of our software and products revenue in fiscal 2017 and fiscal 2016, respectively. The increase in enterprise transactions is due to a 23% increase in the number of transactions of this type which was partially offset by a 3% decrease in the average dollar amount of such transactions. The average dollar amount of enterprise transactions was approximately $261,000 in fiscal 2017 and approximately $269,000 in fiscal 2016. Software and products revenue derived from transactions less than $0.1 million increased $6.5 million, or 5%, in fiscal 2017 compared to fiscal 2016.
We track software and products revenue on a geographic basis. The geographic regions that are tracked are the Americas (United States, Canada, Latin America), EMEA (Europe, Middle East, Africa) and APAC (Australia, New Zealand, Southeast Asia, China). Americas, EMEA and APAC represented 58%, 28% and 14% of total software and products revenue, respectively, for the fiscal year ended March 31, 2017. The year over year increase of Software and Products Revenue in the Americas, EMEA and APAC was 10%, 9% and 36%, respectively.
|
•
|
The increase in Americas software and products revenue for the fiscal year ended March 31, 2017 was primarily the result of an increase in the number of enterprise revenue transactions and to a lesser extent due to an increase in the average dollar amount of enterprise revenue transactions.
|
|
•
|
The increase in EMEA software and products revenue was also primarily the result of an increase in the number of enterprise transactions. This increase was partially offset by the impact of changes in foreign exchange rates as the U.S. dollar strengthened against the Euro and British pound sterling.
|
|
•
|
The increase in APAC software and products revenue was the result of a significant increase in the number of enterprise revenue transactions and to a lesser extent due to an increase in the average dollar amount of enterprise revenue transactions and revenue related to revenue derived from transactions less than $0.1 million.
|
Our software and products revenue in EMEA and APAC is subject to changes in foreign exchange rates as more fully discussed above in the
“Foreign Currency Exchange Rates’ Impact on Results of Operations”
section.
Services Revenue.
Services revenue increased $18.7 million, or 6%, from $335.7 million in fiscal 2016 to $354.3 million in fiscal 2017. Services revenue represented 55% of our total revenues in fiscal 2017 compared to 57% in fiscal 2016. The net increase in services revenue is due to a $20.5 million increase in revenue from customer support agreements as a result of software sales to new customers and renewal agreements with our installed software base.
Cost of Revenues
Total cost of revenues increased $2.5 million, or 3%, from $82.7 million in fiscal 2016 to $85.2 million in fiscal 2017. Total cost of revenues represented 13% of our total revenues in fiscal 2017 compared to 14% in fiscal 2016. The increase in software and products revenue as a percentage of total revenues has a favorable impact on gross margin percentage.
Cost of Software and Products Revenue.
Cost of software and products revenue was $3.0 million in fiscal 2017 and $2.4 million in fiscal 2016, representing approximately 1% of software and products revenue.
Cost of Services Revenue.
Cost of services revenue increased $1.8 million, or 2%, from $80.3 million in fiscal 2016 to $82.1 million in fiscal 2017. Cost of services revenue represented 23% and 24% of our services revenue in fiscal 2017 and fiscal 2016, respectively.
Operating Expenses
Sales and Marketing.
Sales and marketing expenses increased $34.7 million, or 10%, from $349.2 million in fiscal 2016 to $383.9 million in fiscal 2017. The increase is primarily due to a $20.4 million increase in employee compensation and related expenses attributable to the expansion of our sales force from the prior year, a $5.4 million increase in stock-based compensation, and $4.3 million in incremental marketing expense which included the cost of our inaugural customer conference as well as our first worldwide sales meeting in several years held during the first quarter. Sales and marketing expenses as a percentage of total revenues increased to 60% in fiscal 2017 compared to 59% in fiscal 2016.
44
Research and Development.
Research and development expenses increased $14.3 million, or 21%, from $69.3 million in fiscal 2016 to $83.5 million in fiscal 2017. The increase is primarily due to an increase in employee compensation and related expenses attributable to the expansion of our engineering group from the prior year. Research and development expenses as a percentage of total revenues increased to 13% in fiscal 2017 compared to 12% in fiscal 2016. Investing in research and development has been a priority for Commvault, and we anticipate continued spending related to the development of our data and information management software applications.
General and Administrative.
General and administrative expenses increased $6.1 million, or 8%, from $78.8 million in fiscal 2016 to $84.9 million in fiscal 2017. This increase is primarily due to a $3.5 million increase in employee and related compensation and a $2.9 million increase in stock-based compensation. General and administrative expenses in fiscal 2017 includes $0.6 million of net foreign currency transaction gains compared to $0.2 million of net foreign currency transaction gains recognized in general and administrative expenses in fiscal 2016. General and administrative expenses as a percentage of total revenues was 13% in both fiscal 2017 and fiscal 2016.
Depreciation and Amortization.
Depreciation expense decreased $1.0 million, from $9.6 million in fiscal 2016 to $8.6 million in fiscal 2017.
Interest Expense
Interest expense of $1.0 million in fiscal 2017 was related to the amortization of debt issuance costs and commitment fees related to our Revolving Credit Facility.
Interest Income
Interest income increased $0.3 million, from $0.9 million in fiscal 2016 to $1.2 million in fiscal 2017. The increase was the result of an increase in short term investments and increased yield on those investments. Our short term investments are in U.S. Treasury Bills.
Income Tax Expense
Income tax benefit was $1.5 million in fiscal 2017 compared to expense of $2.2 million in fiscal 2016. The decline in income tax expense is the result of a decline in income before taxes. In fiscal 2017, the effective tax rate is higher than the statutory rate due to the benefit related to research credits slightly offset by unfavorable differences, both on a nominal pre-tax loss.
Liquidity and Capital Resources
As of
March 31, 2018
, our cash and cash equivalents balance was
$330.8 million
. Our
$43.5 million
of cash equivalents consisted of money market funds. In addition, we have approximately
$131.6 million
of short-term investments invested in U.S. Treasury Bills. In recent fiscal years, our principal source of liquidity has been cash provided by operations.
As of
March 31, 2018
, the amount of cash and cash equivalents held outside of the United States by our foreign legal entities was approximately
$206.8 million
. These balances are dispersed across many international locations around the world. We believe that such dispersion meets the current and anticipated future liquidity needs of our foreign legal entities. In addition, it is our intention to indefinitely reinvest undistributed earnings of our foreign legal entities. In the event we needed to repatriate funds from outside of the United States, such repatriation would likely be subject to restrictions by local laws and/or tax consequences including foreign withholding taxes. It is not currently practical to estimate the legal restrictions or tax liability that would arise from such repatriations.
During the year ended
March 31, 2018
, we repurchased $
112.2
million of common stock (2.1 million shares) under our share repurchase program. Our future stock repurchase activity is subject to the business judgment of our management and Board of Directors, taking into consideration our historical and projected results of operations, financial condition, cash flows and other anticipated capital requirements or investment alternatives. Our stock repurchase program reduces the dilutive impact on our common shares outstanding associated with stock option exercises and our previous public and private stock offerings through the repurchase of common stock. As of May 3, 2018, there is $112.8 million remaining in the share repurchase program which expires on March 31, 2019. Our stock repurchase program has been funded by our existing cash and cash equivalent balances as well as cash flows provided by our operations.
45
Our summarized annual cash flow information is as follows (in thousands):
|
|
Year Ended March 31,
|
|||||||||||
|
|
2018
|
2017
|
2016
|
|||||||||
|
Net cash provided by operating activities
|
$
|
84,169
|
|
$
|
100,039
|
|
$
|
84,413
|
|
|||
|
Net cash used in investing activities
|
(17,991
|
)
|
(28,045
|
)
|
(62,189
|
)
|
||||||
|
Net cash used in financing activities
|
(82,104
|
)
|
(22,435
|
)
|
(69,970
|
)
|
||||||
|
Effects of exchange rate — changes in cash
|
17,219
|
|
(8,175
|
)
|
(1,820
|
)
|
||||||
|
Net increase (decrease) in cash and cash equivalents
|
$
|
1,293
|
|
$
|
41,384
|
|
$
|
(49,566
|
)
|
|||
Net cash provided by operating activities was
$84.2 million
in
fiscal 2018
,
$100.0 million
in
fiscal 2017
and
$84.4 million
in
fiscal 2016
. In
fiscal 2018
, cash generated by operating activities was primarily due to net loss adjusted for the impact of non-cash charges and increases in deferred services revenue as a result of customer support agreements from new customers and renewal agreements with our installed customer base, partially offset by an increase in accounts receivable. In fiscal 2017, cash generated by operating activities was primarily due to net loss adjusted for the impact of non-cash charges and increases in deferred services revenue as a result of customer support agreements from new customers and renewal agreements with our installed customer base and an increase in accrued expenses, partially offset by an increase in accounts receivable.
Net cash used in investing activities was
$18.0 million
in
fiscal 2018
,
$28.0 million
in
fiscal 2017
and
$62.2 million
in
fiscal 2016
. In
fiscal 2018
, cash used in investing activities was related to
$10.9 million
of net
purchases
of short-term investments of U.S. Treasury Bills, and
$7.0 million
of capital expenditures as we continue to invest in and enhance our global infrastructure. In fiscal 2017, cash used in investing activities was related to $21.6 million of net purchases of short-term investments of U.S. Treasury Bills, and $6.4 million of capital expenditures as we continue to invest in and enhance our global infrastructure. In fiscal 2016, cash used in investing activities was primarily related to $49.1 million of net purchases of short-term investments of U.S. Treasury Bills, $6.3 million of capital expenditures as we continue to invest in and enhance our global infrastructure and a $4.7 million investment in Laitek, Inc.
Net cash used in financing activities was
$82.1 million
in
fiscal 2018
,
$22.4 million
in
fiscal 2017
and
$70.0 million
in
fiscal 2016
. The cash used in financing activities in
fiscal 2018
was primarily due to $
112.2
million used to repurchase shares of our common stock under our repurchase program, partially offset by
$30.1 million
of proceeds from the exercise of stock options and the employee stock purchase plan. The cash used in financing activities in fiscal 2017 was primarily due to $50.0 million used to repurchase shares of our common stock under our repurchase program, partially offset by $21.3 million of proceeds from the exercise of stock options and the employee stock purchase plan and $6.2 million of excess tax benefits related to employee stock-based compensation. The cash used in financing activities in fiscal 2016 was primarily due to $91.5 million used to repurchase shares of our common stock under our repurchase program, partially offset by $14.8 million of proceeds from the exercise of stock options and the employee stock purchase plan and $6.7 million of excess tax benefits related to employee stock-based compensation.
A summary of the cash used for the stock repurchase program consists of the following:
|
|
Year Ended March 31,
|
|||||||||||
|
|
2018
|
2017
|
2016
|
|||||||||
|
Cash used for repurchases (in thousands)
|
$
|
112,218
|
|
$
|
49,998
|
|
$
|
91,477
|
|
|||
|
Shares repurchased (in thousands)
|
2,098
|
|
982
|
|
2,563
|
|
||||||
|
Average price per share
|
$
|
53.49
|
|
$
|
50.91
|
|
$
|
35.69
|
|
|||
Working capital
increased
$4.5 million
from
$318.1 million
as of
March 31, 2017
to
$322.6 million
as of
March 31, 2018
. The
increase
in working capital is primarily due to cash provided by operating activities partially offset by cash used for share repurchases during the fiscal year.
We believe that our existing cash, cash equivalents and our cash from operations will be sufficient to meet our anticipated cash needs for working capital, capital expenditures and potential stock repurchases for at least the next 12 months. We may seek additional funding through public or private financings or other arrangements during this period. Adequate funds may not be available when needed or may not be available on terms favorable to us, or at all. If additional funds are raised by issuing equity securities, dilution to existing stockholders will result. If we raise additional funds by obtaining loans from third
46
parties, the terms of those financing arrangements may include negative covenants or other restrictions on our business that could impair our operational flexibility, and would also require us to fund additional interest expense. If funding is insufficient at any time in the future, we may be unable to develop or enhance our products or services, take advantage of business opportunities or respond to competitive pressures, any of which could have a material adverse effect on our business, financial condition and results of operations.
Summary Disclosures about Contractual Obligations and Commercial Commitments
Our material capital commitments consist of obligations under facilities and operating leases. Some of these leases have free or escalating rent payment provisions. We recognize rent expense under leases on a straight-line basis. We anticipate that we will experience an increase in our capital expenditures and lease commitments as a result of our anticipated growth in operations, infrastructure, personnel and resources devoted to building our brand name.
The following table summarizes our obligations as of
March 31, 2018
(dollars in thousands):
|
|
Payments Due by Period
|
|||||||||||||||||||
|
|
Total
|
Less Than
1 Year
|
2-3 Years
|
4-5 Years
|
More
Than 5
Years
|
|||||||||||||||
|
Operating lease obligations
|
$
|
32,927
|
|
$
|
9,858
|
|
$
|
14,874
|
|
$
|
6,807
|
|
$
|
1,388
|
|
|||||
|
Purchase obligations
|
27,329
|
|
20,164
|
|
6,866
|
|
299
|
|
—
|
|
||||||||||
|
Total
|
$
|
60,256
|
|
$
|
30,022
|
|
$
|
21,740
|
|
$
|
7,106
|
|
$
|
1,388
|
|
|||||
We generally do not enter into binding purchase obligations. The purchase obligations above relate primarily to marketing and IT services. The contractual obligations table above excludes unrecognized tax benefits, plus related interest and penalties totaling $1.1 million because we cannot reasonably estimate in which future periods these amounts will ultimately be settled.
We have certain software royalty commitments associated with the shipment and licensing of certain products. Royalty expense is generally based on a fixed cost per unit shipped or a fixed fee for unlimited units shipped over a designated period. Royalty expense, included in cost of software and products revenues was
$4.5 million
in
fiscal 2018
and $2.6 million in
fiscal 2017
.
We offer a 90-day limited product warranty for our software. To date, costs relating to this product warranty have not been material.
Off-Balance Sheet Arrangements
As of
March 31, 2018
and
2017
, other than our operating leases, we do not have off-balance sheet financing arrangements, including any relationships with unconsolidated entities or financial partnerships, such as entities often referred to as structured finance or special purpose entities.
Indemnifications
Certain of our software licensing agreements contain certain provisions that indemnify our customers from any claim, suit or proceeding arising from alleged or actual intellectual property infringement. These provisions continue in perpetuity along with our software licensing agreements. We have never incurred a liability relating to one of these indemnification provisions in the past and we believe that the likelihood of any future payout relating to these provisions is remote. Therefore, we have not recorded a liability during any period related to these indemnification provisions.
Impact of Recently Issued Accounting Standards
See Note 2 of the consolidated financial statements for a discussion of the impact of recently issued accounting standards.
47
|
Item 7A.
|
Quantitative and Qualitative Disclosures about Market Risk
|
Interest Rate Risk
As of
March 31, 2018
, our cash, cash equivalent and short-term investment balances consisted primarily of money market funds and U.S. Treasury Bills. Due to the short-term nature of these investments, we are not subject to any material interest rate risk on these balances.
Foreign Currency Risk
Economic Exposure
As a global company, we face exposure to adverse movements in foreign currency exchange rates. Our international sales are generally denominated in foreign currencies and this revenue could be materially affected by currency fluctuations. Approximately
46%
of our sales were outside the United States in
fiscal 2018
and
44%
were outside the United States in
fiscal 2017
. Our primary exposures are to fluctuations in exchange rates for the U.S. dollar versus the Euro, and to a lesser extent, the Australian dollar, British pound sterling, Canadian dollar, Chinese yuan, Indian rupee, Korean won and Singapore dollar. Changes in currency exchange rates could adversely affect our reported revenues and require us to reduce our prices to remain competitive in foreign markets, which could also have a material adverse effect on our results of operations. Historically, we have periodically reviewed and revised the pricing of our products available to our customers in foreign countries and we have not maintained excess cash balances in foreign accounts.
We estimate that a 10% change in all foreign exchange rates would impact our reported operating profit by approximately $7.1 million annually. This sensitivity analysis disregards the possibilities that rates can move in opposite directions and that losses from one geographic area may be offset by gains from another geographic area.
Transaction Exposure
Our exposure to foreign currency transaction gains and losses is primarily the result of certain net receivables due from our foreign subsidiaries and customers being denominated in currencies other than the functional currency of the subsidiary. Our foreign subsidiaries conduct their businesses in local currency and we generally do not maintain excess U.S. dollar cash balances in foreign accounts.
Foreign currency transaction gains and losses are recorded in “General and administrative expenses” in the Consolidated Statements of Operation. We recognized net foreign currency transaction gains of
$0.1 million
,
$0.6 million
and
$0.2 million
in
fiscal 2018
,
fiscal 2017
, and
fiscal 2016
respectively. The net foreign currency transaction gains and losses recorded in “General and administrative expenses” include settlement gains and losses on forward contracts disclosed below.
To date, we have selectively hedged our exposure to foreign currency transaction gains and losses on the balance sheet through the use of forward contracts, which were not designated as hedging instruments. The duration of forward contracts utilized for hedging our balance sheet exposure is generally one to three months. As of
March 31, 2018
and
March 31, 2017
, we did not have any forward contracts outstanding. We recorded net realized gains and losses in general and administrative of approximately $0.1 million in fiscal 2018, 2017 and 2016. In the future, we may enter into additional foreign currency based hedging contracts to reduce our exposure to significant fluctuations in currency exchange rates on the balance sheet.
48
|
Item 8.
|
Financial Statements and Supplementary Data
|
Commvault Systems, Inc.
Consolidated Financial Statements
Fiscal Years Ended March 31,
2018
,
2017
and
2016
Index to Consolidated Financial Statements
|
|
Page
|
49
Report of Independent Registered Public Accounting Firm
To the Board of Directors and Stockholders of Commvault Systems, Inc.
Opinion on the Financial Statements
We have audited the accompanying consolidated balance sheets of Commvault Systems, Inc. (the Company) as of March 31, 2018 and 2017, the related consolidated statements of operations, comprehensive (loss) income, stockholders' equity and cash flows for each of the three years in the period ended March 31, 2018, and the related notes and financial statement schedule listed in the Index at Item 15 (collectively referred to as the “consolidated financial statements”). In our opinion, the consolidated financial statements present fairly, in all material respects, the financial position of the Company at March 31, 2018 and 2017, and the results of its operations and its cash flows for each of the three years in the period ended March 31, 2018, in conformity with U.S. generally accepted accounting principles.
We have also audited, in accordance with the standards of the Public Company Accounting Oversight Board (United States) (PCAOB), the Company’s internal control over financial reporting as of March 31, 2018, based on criteria established in Internal Control-Integrated Framework issued by the Committee of Sponsoring Organization of the Treadway Commission (2013 framework) and our report dated May 3, 2018 expressed an unqualified opinion thereon.
Adoption of ASU No. 2014-09
As discussed in Note 2 to the consolidated financial statements, effective April 1, 2017, the Company changed its method for accounting for revenue due to the adoption of Accounting Standards Update (ASU) No. 2014-09, Revenue from Contracts with Customers (Topic 606), and the amendments in ASUs 2015-14, 2016-08, 2016-10 and 2016-12 using the full retrospective method.
Basis for Opinion
These financial statements are the responsibility of the Company’s management. Our responsibility is to express an opinion on the Company’s financial statements based on our audits. We are a public accounting firm registered with the PCAOB and are required to be independent with respect to the Company in accordance with the U.S. federal securities laws and the applicable rules and regulations of the Securities and Exchange Commission and the PCAOB.
We conducted our audits in accordance with the standards of the PCAOB. Those standards require that we plan and perform the audit to obtain reasonable assurance about whether the financial statements are free of material misstatement, whether due to error or fraud. Our audits included performing procedures to assess the risks of material misstatement of the financial statements, whether due to error or fraud, and performing procedures that respond to those risks. Such procedures included examining, on a test basis, evidence regarding the amounts and disclosures in the financial statements. Our audits also included evaluating the accounting principles used and significant estimates made by management, as well as evaluating the overall presentation of the financial statements. We believe that our audits provide a reasonable basis for our opinion.
We have served as the Company’s auditor since 1998.
/s/ Ernst & Young
Iselin, New Jersey
May 3, 2018
50
Commvault Systems, Inc.
(In thousands, except per share data)
|
|
March 31,
|
|||||||
|
|
2018
|
2017
|
||||||
|
As Adjusted -
|
||||||||
|
See Note 2
|
||||||||
|
ASSETS
|
||||||||
|
Current assets:
|
||||||||
|
Cash and cash equivalents
|
$
|
330,784
|
|
$
|
329,491
|
|
||
|
Short-term investments
|
131,637
|
|
120,693
|
|
||||
|
Trade accounts receivable, net
|
162,119
|
|
140,084
|
|
||||
|
Prepaid expenses and other current assets
|
22,248
|
|
15,791
|
|
||||
|
Total current assets
|
646,788
|
|
606,059
|
|
||||
|
Deferred tax assets, net
|
—
|
|
50,228
|
|
||||
|
Property and equipment, net
|
128,612
|
|
132,319
|
|
||||
|
Equity method investment
|
—
|
|
3,621
|
|
||||
|
Deferred commissions cost
|
33,092
|
|
30,378
|
|
||||
|
Other assets
|
10,150
|
|
7,273
|
|
||||
|
Total assets
|
$
|
818,642
|
|
$
|
829,878
|
|
||
|
LIABILITIES AND STOCKHOLDERS’ EQUITY
|
||||||||
|
Current Liabilities:
|
||||||||
|
Accounts payable
|
$
|
761
|
|
$
|
117
|
|
||
|
Accrued liabilities
|
82,299
|
|
78,701
|
|
||||
|
Deferred revenue
|
241,113
|
|
209,099
|
|
||||
|
Total current liabilities
|
324,173
|
|
287,917
|
|
||||
|
Deferred revenue, less current portion
|
84,661
|
|
70,803
|
|
||||
|
Deferred tax liabilities, net
|
2,430
|
|
—
|
|
||||
|
Other liabilities
|
3,314
|
|
4,226
|
|
||||
|
Commitments and contingencies (Note 6)
|
|
|
||||||
|
Stockholders’ equity:
|
||||||||
|
Preferred stock, $0.01 par value: 50,000 shares authorized, no shares issued and outstanding at March 31, 2018 and 2017
|
—
|
|
—
|
|
||||
|
Common stock, $0.01 par value, 250,000 shares authorized, 45,118 shares and 44,816 shares issued and outstanding at March 31, 2018 and 2017, respectively
|
450
|
|
447
|
|
||||
|
Additional paid-in capital
|
782,764
|
|
694,477
|
|
||||
|
Accumulated deficit
|
(373,678
|
)
|
(215,677
|
)
|
||||
|
Accumulated other comprehensive loss
|
(5,472
|
)
|
(12,315
|
)
|
||||
|
Total stockholders’ equity
|
404,064
|
|
466,932
|
|
||||
|
Total liabilities and stockholders’ equity
|
$
|
818,642
|
|
$
|
829,878
|
|
||
See accompanying notes to consolidated financial statements
51
Commvault Systems, Inc.
(In thousands, except per share data)
|
|
Year Ended March 31,
|
|||||||||||
|
|
2018
|
2017
|
2016
|
|||||||||
|
As Adjusted -
|
As Adjusted -
|
|||||||||||
|
See Note 2
|
See Note 2
|
|||||||||||
|
Revenues:
|
||||||||||||
|
Software and products
|
$
|
311,745
|
|
$
|
290,668
|
|
$
|
258,091
|
|
|||
|
Services
|
387,648
|
|
354,337
|
|
335,676
|
|
||||||
|
Total revenues
|
699,393
|
|
645,005
|
|
593,767
|
|
||||||
|
Cost of revenues:
|
||||||||||||
|
Software and products
|
7,223
|
|
3,045
|
|
2,385
|
|
||||||
|
Services
|
90,929
|
|
82,147
|
|
80,327
|
|
||||||
|
Total cost of revenues
|
98,152
|
|
85,192
|
|
82,712
|
|
||||||
|
Gross margin
|
601,241
|
|
559,813
|
|
511,055
|
|
||||||
|
Operating expenses:
|
||||||||||||
|
Sales and marketing
|
410,727
|
|
383,933
|
|
349,199
|
|
||||||
|
Research and development
|
94,164
|
|
83,543
|
|
69,287
|
|
||||||
|
General and administrative
|
87,575
|
|
84,944
|
|
78,848
|
|
||||||
|
Depreciation and amortization
|
9,721
|
|
8,635
|
|
9,611
|
|
||||||
|
Total operating expenses
|
602,187
|
|
561,055
|
|
506,945
|
|
||||||
|
Income (loss) from operations
|
(946
|
)
|
(1,242
|
)
|
4,110
|
|
||||||
|
Interest expense
|
(1,161
|
)
|
(957
|
)
|
(933
|
)
|
||||||
|
Interest income
|
2,228
|
|
1,163
|
|
862
|
|
||||||
|
Equity in loss of affiliate
|
(3,621
|
)
|
(958
|
)
|
(83
|
)
|
||||||
|
Income (loss) before income taxes
|
(3,500
|
)
|
(1,994
|
)
|
3,956
|
|
||||||
|
Income tax expense (benefit)
|
58,400
|
|
(1,486
|
)
|
2,236
|
|
||||||
|
Net income (loss)
|
$
|
(61,900
|
)
|
$
|
(508
|
)
|
$
|
1,720
|
|
|||
|
Net income (loss) per common share:
|
||||||||||||
|
Basic
|
$
|
(1.37
|
)
|
$
|
(0.01
|
)
|
$
|
0.04
|
|
|||
|
Diluted
|
$
|
(1.37
|
)
|
$
|
(0.01
|
)
|
$
|
0.04
|
|
|||
|
Weighted average common shares outstanding:
|
||||||||||||
|
Basic
|
45,242
|
|
44,700
|
|
45,159
|
|
||||||
|
Diluted
|
45,242
|
|
44,700
|
|
46,489
|
|
||||||
See accompanying notes to consolidated financial statements
52
Commvault Systems, Inc.
Consolidated Statements of Comprehensive Income (Loss)
(In thousands, except per share data)
|
|
Year Ended March 31,
|
|||||||||||
|
|
2018
|
2017
|
2016
|
|||||||||
|
As Adjusted -
|
As Adjusted -
|
|||||||||||
|
See Note 2
|
See Note 2
|
|||||||||||
|
Net income (loss)
|
$
|
(61,900
|
)
|
$
|
(508
|
)
|
$
|
1,720
|
|
|||
|
Other comprehensive income (loss):
|
||||||||||||
|
Foreign currency translation adjustment
|
6,843
|
|
(3,106
|
)
|
(1,705
|
)
|
||||||
|
Comprehensive income (loss)
|
$
|
(55,057
|
)
|
$
|
(3,614
|
)
|
15
|
|
||||
See accompanying notes to consolidated financial statements
53
Commvault Systems, Inc.
Consolidated Statements of Stockholders’ Equity
(In thousands)
|
|
Common Stock
|
Additional
Paid-In
Capital
|
Accumulated
Deficit
|
Accumulated
Other
Comprehensive
Loss
|
Total
|
||||||||||||||||||
|
|
Shares
|
Amount
|
|||||||||||||||||||||
|
As Adjusted -
See Note 2
|
|||||||||||||||||||||||
|
Balance at March 31, 2015
(As Adjusted)
|
45,122
|
|
$
|
451
|
|
$
|
539,565
|
|
$
|
(101,741
|
)
|
$
|
(7,504
|
)
|
$
|
430,771
|
|
||||||
|
Stock-based compensation
|
64,196
|
|
64,196
|
|
|||||||||||||||||||
|
Tax benefits relating to share-based payments
|
3,265
|
|
3,265
|
|
|||||||||||||||||||
|
Share issuances related to stock-based compensation
|
1,575
|
|
15
|
|
14,828
|
|
14,843
|
|
|||||||||||||||
|
Repurchase of common stock
|
(2,563
|
)
|
(26
|
)
|
(18,855
|
)
|
(72,596
|
)
|
(91,477
|
)
|
|||||||||||||
|
Net income
|
1,720
|
|
1,720
|
|
|||||||||||||||||||
|
Other comprehensive loss
|
(1,705
|
)
|
(1,705
|
)
|
|||||||||||||||||||
|
Balance at March 31, 2016
|
44,134
|
|
440
|
|
602,999
|
|
(172,617
|
)
|
(9,209
|
)
|
421,613
|
|
|||||||||||
|
Stock-based compensation
|
73,928
|
|
73,928
|
|
|||||||||||||||||||
|
Tax benefits relating to share-based payments
|
3,682
|
|
3,682
|
|
|||||||||||||||||||
|
Share issuances related to stock-based compensation
|
1,664
|
|
17
|
|
21,304
|
|
21,321
|
|
|||||||||||||||
|
Repurchase of common stock
|
(982
|
)
|
(10
|
)
|
(7,436
|
)
|
(42,552
|
)
|
(49,998
|
)
|
|||||||||||||
|
Net loss
|
(508
|
)
|
(508
|
)
|
|||||||||||||||||||
|
Other comprehensive loss
|
(3,106
|
)
|
(3,106
|
)
|
|||||||||||||||||||
|
Balance at March 31, 2017
|
44,816
|
|
447
|
|
694,477
|
|
(215,677
|
)
|
(12,315
|
)
|
466,932
|
|
|||||||||||
|
Cumulative effect of adoption of ASU 2016-09
|
435
|
|
(271
|
)
|
164
|
|
|||||||||||||||||
|
Stock-based compensation
|
74,129
|
|
74,129
|
|
|||||||||||||||||||
|
Share issuances related to stock-based compensation
|
2,400
|
|
24
|
|
30,090
|
|
30,114
|
|
|||||||||||||||
|
Repurchase of common stock
|
(2,098
|
)
|
(21
|
)
|
(16,367
|
)
|
(95,830
|
)
|
(112,218
|
)
|
|||||||||||||
|
Net loss
|
(61,900
|
)
|
(61,900
|
)
|
|||||||||||||||||||
|
Other comprehensive loss
|
6,843
|
|
6,843
|
|
|||||||||||||||||||
|
Balance at March 31, 2018
|
45,118
|
|
$
|
450
|
|
$
|
782,764
|
|
$
|
(373,678
|
)
|
$
|
(5,472
|
)
|
$
|
404,064
|
|
||||||
See accompanying notes to consolidated financial statements
54
Commvault Systems, Inc.
(In thousands)
|
|
Year Ended March 31,
|
|||||||||||
|
|
2018
|
2017
|
2016
|
|||||||||
|
As Adjusted -
|
As Adjusted -
|
|||||||||||
|
See Note 2
|
See Note 2
|
|||||||||||
|
Cash flows from operating activities
|
||||||||||||
|
Net income (loss)
|
$
|
(61,900
|
)
|
$
|
(508
|
)
|
$
|
1,720
|
|
|||
|
Adjustments to reconcile net income (loss) to net cash provided by operating activities:
|
||||||||||||
|
Depreciation and amortization
|
11,785
|
|
10,232
|
|
11,179
|
|
||||||
|
Noncash stock-based compensation
|
74,129
|
|
73,928
|
|
64,196
|
|
||||||
|
Excess tax benefits from stock-based compensation
|
—
|
|
(6,242
|
)
|
(6,664
|
)
|
||||||
|
Deferred income taxes
|
53,737
|
|
(11,468
|
)
|
(8,805
|
)
|
||||||
|
Equity in loss of affiliate
|
3,621
|
|
958
|
|
83
|
|
||||||
|
Amortization of deferred commissions cost
|
16,587
|
|
16,065
|
|
11,234
|
|
||||||
|
Changes in operating assets and liabilities:
|
||||||||||||
|
Trade accounts receivable
|
(25,082
|
)
|
(16,372
|
)
|
1,760
|
|
||||||
|
Other current assets and Other assets
|
(6,876
|
)
|
(55
|
)
|
3,867
|
|
||||||
|
Deferred commissions cost
|
(17,984
|
)
|
(18,393
|
)
|
(12,868
|
)
|
||||||
|
Accounts payable
|
618
|
|
(190
|
)
|
(454
|
)
|
||||||
|
Accrued liabilities
|
3,496
|
|
15,088
|
|
1,972
|
|
||||||
|
Deferred revenue
|
33,971
|
|
36,666
|
|
16,935
|
|
||||||
|
Other liabilities
|
(1,933
|
)
|
330
|
|
258
|
|
||||||
|
Net cash provided by operating activities
|
84,169
|
|
100,039
|
|
84,413
|
|
||||||
|
Cash flows from investing activities
|
||||||||||||
|
Purchase of short-term investments
|
(142,424
|
)
|
(96,306
|
)
|
(99,071
|
)
|
||||||
|
Proceeds from maturity of short-term investments
|
131,480
|
|
74,685
|
|
49,935
|
|
||||||
|
Purchase of equity method investment
|
—
|
|
—
|
|
(4,662
|
)
|
||||||
|
Purchases for corporate campus headquarters
|
—
|
|
—
|
|
(2,111
|
)
|
||||||
|
Purchase of property and equipment
|
(7,047
|
)
|
(6,424
|
)
|
(6,280
|
)
|
||||||
|
Net cash used in investing activities
|
(17,991
|
)
|
(28,045
|
)
|
(62,189
|
)
|
||||||
|
Cash flows from financing activities
|
||||||||||||
|
Repurchase of common stock
|
(112,218
|
)
|
(49,998
|
)
|
(91,477
|
)
|
||||||
|
Proceeds from stock-based compensation plans
|
30,114
|
|
21,321
|
|
14,843
|
|
||||||
|
Excess tax benefits from stock-based compensation
|
—
|
|
6,242
|
|
6,664
|
|
||||||
|
Net cash used in financing activities
|
(82,104
|
)
|
(22,435
|
)
|
(69,970
|
)
|
||||||
|
Effects of exchange rate — changes in cash
|
17,219
|
|
(8,175
|
)
|
(1,820
|
)
|
||||||
|
Net increase (decrease) in cash and cash equivalents
|
1,293
|
|
41,384
|
|
(49,566
|
)
|
||||||
|
Cash and cash equivalents at beginning of year
|
329,491
|
|
288,107
|
|
337,673
|
|
||||||
|
Cash and cash equivalents at end of year
|
$
|
330,784
|
|
$
|
329,491
|
|
$
|
288,107
|
|
|||
|
Supplemental disclosures of cash flow information
|
||||||||||||
|
Interest paid
|
$
|
592
|
|
$
|
680
|
|
$
|
635
|
|
|||
|
Income taxes paid, net
|
$
|
6,448
|
|
$
|
5,413
|
|
$
|
1,989
|
|
|||
See accompanying notes to consolidated financial statements
55
Commvault Systems, Inc.
Notes to Consolidated Financial Statements
(In thousands, except per share data)
1. Nature of Business
Commvault Systems, Inc. and its subsidiaries (Commvault or the Company) is a provider of data and information management software applications and related services. The Company develops, markets and sells a suite of software applications and services, primarily in North America, Europe, Australia and Asia, that provides its customers with data protection solutions supporting all major operating systems, applications, and databases on virtual and physical servers, NAS shares, cloud-based infrastructures, and mobile devices; management through a single console; multiple protection methods including backup and archive, snapshot management, replication, and content indexing for eDiscovery; efficient storage management using deduplication for disk, tape and cloud; integration with the industry's top storage arrays; complete virtual infrastructure management supporting multiple hypervisors; security capabilities to limit access to critical data; policy based data management; and an end-user experience that allows them to protect, find and recover their own data using common tools such as web browsers, Microsoft Outlook and File Explorer. In fiscal 2018 the Company also started selling appliances that integrate the Company's software with hardware and address a wide-range of business needs and use cases, ranging from support for remote or branch offices with limited IT staff up to large corporate data centers. The Company also provides its customers with a broad range of professional and customer support services.
2. Summary of Significant Accounting Policies
Basis of Presentation
The consolidated financial statements include the accounts of the Company. All intercompany transactions and balances have been eliminated.
Use of Estimates
The preparation of financial statements and related disclosures in conformity with U.S. GAAP requires management to make judgments and estimates that affect the amounts reported in the Company’s consolidated financial statements and the accompanying notes. The Company bases its estimates and judgments on historical experience and on various other assumptions that it believes are reasonable under the circumstances. The amounts of assets and liabilities reported in the Company’s balance sheets and the amounts of revenues and expenses reported for each of its periods presented are affected by estimates and assumptions, which are used for, but not limited to, the accounting for revenue recognition, allowance for doubtful accounts, deferred commissions cost, income taxes and related reserves, stock-based compensation and accounting for research and development costs. Actual results could differ from those estimates.
Revenue
The Company accounts for revenue in accordance with ASC Topic 606, Revenue from Contracts with Customers, which was adopted on April 1, 2017, using the full retrospective method. For further discussion of the Company's accounting policies related to revenue see Note 3.
Net Income per Common Share
Basic net income per common share is computed by dividing net income by the weighted average number of common shares during the period. Diluted net income per share is computed using the weighted average number of common shares and, if dilutive, potential common shares outstanding during the period. Potential common shares consist of the incremental common shares issuable upon the exercise of stock options, vesting of restricted stock units and shares to be purchased under the Employee Stock Purchase Plan. The dilutive effect of such potential common shares is reflected in diluted earnings per share by application of the treasury stock method.
56
Commvault Systems, Inc.
Notes to Consolidated Financial Statements — (Continued)
(In thousands, except per share data)
The following table sets forth the computation of diluted net income per common share:
|
|
Year Ended March 31,
|
|||||||||||
|
|
2018
|
2017
|
2016
|
|||||||||
|
Diluted net income (loss) per common share:
|
||||||||||||
|
Basic weighted average shares outstanding
|
45,242
|
|
44,700
|
|
45,159
|
|
||||||
|
Dilutive effect of stock options, restricted stock units, and employee stock purchase plan
|
—
|
|
—
|
|
1,330
|
|
||||||
|
Diluted weighted average shares outstanding
|
45,242
|
|
44,700
|
|
46,489
|
|
||||||
|
Diluted net income per common share
|
$
|
(1.37
|
)
|
$
|
(0.01
|
)
|
$
|
0.04
|
|
|||
The following table summarizes the potential outstanding common stock equivalents of the Company at the end of each period, which have been excluded from the computation of diluted net income per common share, as its effect is anti-dilutive.
|
|
Year Ended March 31,
|
||||||||
|
|
2018
|
2017
|
2016
|
||||||
|
Stock options, restricted stock units, and shares under the employee stock purchase plan
|
7,312
|
|
8,106
|
|
4,183
|
|
|||
Software Development Costs
Research and development expenditures are charged to operations as incurred. Based on the Company’s software development process, technological feasibility is established upon completion of a working model, which also requires certification and extensive testing. Costs incurred by the Company between completion of the working model and the point at which the product is ready for general release are immaterial.
Trade and Other Receivables
Trade and other receivables are primarily comprised of trade receivables that are recorded at the invoice amount, net of an allowance for doubtful accounts, which is not material. Unbilled receivables represent amounts for which revenue has been recognized but which have not yet been invoiced to the customer. The current portion of unbilled receivables is included in Trade accounts receivable on the consolidated balance sheet. Long term unbilled receivables are included in Other assets.
Accounting for Income Taxes
The Company accounts for income taxes in accordance with ASC Topic 740, “Income Taxes” (ASC 740). The provision for income taxes and effective tax rates are calculated by legal entity and jurisdiction and are based on a number of factors, including the level of pre-tax earnings, income tax planning strategies, differences between tax laws and accounting rules, statutory tax rates and credits, uncertain tax positions and valuation allowances. The Company uses significant judgment and estimates in evaluating tax positions. The effective tax rate in a given financial statement period may be materially impacted by changes in the mix and level of earnings by taxing jurisdiction.
Under ASC 740, deferred income taxes arise from temporary differences between the tax basis of assets and liabilities and their reported amounts. Valuation allowances are established when, in the Company's judgment, it is more likely than not that deferred tax assets will not be realized. In assessing the need for a valuation allowance, the Company weighs the available positive and negative evidence, including historical levels of pre-tax income, legislative developments, expectations and risks associated with estimates of future pre-tax income, and prudent and feasible tax planning strategies.
Cash and Cash Equivalents
The Company considers all highly liquid investments purchased with maturities of three months or less at the date of purchase to be cash equivalents. As of
March 31, 2018
, the Company’s cash and cash equivalents balance consisted primarily of money market funds.
57
Commvault Systems, Inc.
Notes to Consolidated Financial Statements — (Continued)
(In thousands, except per share data)
Short-term Investments
Short-term investments consist of investments with maturities of twelve months or less that do not meet the criteria to be cash equivalents. The company determines classification of the investment as trading, available-for-sale or held-to-maturity at the time of purchase and reevaluates classification whenever changes in circumstances indicate changes in classification may be necessary. The Company’s current short-term investments are classified as held-to-maturity. Held-to-maturity investments consist of securities that the Company has the intent and ability to retain until maturity. Held-to-maturity investments are initially recorded at cost and adjusted for the amortization of discounts from the date of purchase through maturity. Income related to investments is recorded as interest income in the Consolidated Statement of Operations. Cash inflows and outflows related to the sale, maturity and purchase of investments are classified as investing activities in the Company’s Consolidated Statements of Cash Flows.
Concentration of Credit Risk
The Company grants credit to customers in a wide variety of industries worldwide and generally does not require collateral. Credit losses relating to these customers have been minimal.
Sales through the Company’s distribution agreement with Arrow Enterprise Computing Solutions, Inc. (Arrow) totaled approximately
36%
,
36%
and
38%
of total revenues for the years ended
March 31, 2018
,
2017
and
2016
, respectively. Arrow accounted for approximately
38%
and
40%
of total accounts receivable as of
March 31, 2018
and
2017
, respectively.
Fair Value of Financial Instruments
The carrying amounts of the Company’s cash and cash equivalents, accounts receivable and accounts payable approximate their fair values due to the short-term maturity of these instruments. As of
March 31, 2018
and
2017
, the Company’s short-term investments balance consisted of U.S. Treasury Bills.
Fair value is defined as the exchange price that would be received for an asset or paid to transfer a liability (an exit price) in the principal or most advantageous market for such asset or liability in an orderly transaction between market participants on the measurement date. Valuation techniques used to measure fair value should maximize the use of observable inputs and minimize the use of unobservable inputs. To measure fair value, the Company uses the following fair value hierarchy based on three levels of inputs, of which the first two are considered observable and the last unobservable:
Level 1 — Quoted prices in active markets for identical assets or liabilities.
Level 2 — Inputs other than Level 1 that are observable for the asset or liability, either directly or indirectly, such as quoted prices for similar assets and liabilities in active markets; quoted prices for identical or similar assets or liabilities in markets that are not active; or other inputs that are observable or can be corroborated by observable market data by correlation or other means.
Level 3 — Unobservable inputs that are supported by little or no market activity and that are significant to the fair value of the assets or liabilities.
The following table summarizes the composition of the Company’s financial assets measured at fair value on a recurring basis at
March 31, 2018
and
March 31, 2017
:
|
March 31, 2018
|
Level 1
|
Level 2
|
Level 3
|
Total
|
|||||||||||
|
Cash equivalents
|
$
|
43,545
|
|
—
|
|
—
|
|
$
|
43,545
|
|
|||||
|
Short-term investments
|
—
|
|
$
|
132,263
|
|
—
|
|
$
|
132,263
|
|
|||||
|
March 31, 2017
|
Level 1
|
Level 2
|
Level 3
|
Total
|
|||||||||||
|
Cash equivalents
|
$
|
70,190
|
|
—
|
|
—
|
|
$
|
70,190
|
|
|||||
|
Short-term investments
|
—
|
|
$
|
120,989
|
|
—
|
|
$
|
120,989
|
|
|||||
58
Commvault Systems, Inc.
Notes to Consolidated Financial Statements — (Continued)
(In thousands, except per share data)
Property and Equipment
Property and equipment are stated at cost, less accumulated depreciation and amortization. Land is not depreciated. The Company provides for depreciation on a straight-line basis over the estimated useful lives of the assets. The depreciable assets that comprise the Company's owned headquarters classified as Buildings are being depreciated over lives ranging from
ten
to
sixty
years. Computer and related equipment is generally depreciated over
eighteen months
to
three years
and furniture and fixtures are generally depreciated over
three
to
twelve years
. Leasehold improvements are amortized over the shorter of the useful life of the improvement or the term of the related lease. Expenditures for routine maintenance and repairs are charged against operations. Major replacements, improvements and additions are capitalized.
Asset Retirement Obligation
A liability for the fair value of an asset retirement obligation and corresponding increase to the carrying value of the related leasehold improvements are recorded at the time leasehold improvements are acquired. The Company maintains certain office space for which the lease agreement requires that the Company return the office space to its original condition upon vacating the premises. Accordingly, the balance of the asset retirement obligation was
$1,303
as of
March 31, 2018
and
$1,204
as of
March 31, 2017
.
Long-Lived Assets
The Company reviews its long-lived assets for impairment whenever events or changes in circumstances indicate that the carrying amount of the assets may not be fully recoverable. To determine the recoverability of its long-lived assets, the Company evaluates the estimated future undiscounted cash flows that are directly associated with, and that are expected to arise as a direct result of, the use and eventual disposition of the long-lived asset. If the estimated future undiscounted cash flows demonstrate that recoverability is not probable, an impairment loss would be recognized. An impairment loss would be calculated based on the excess carrying amount of the long-lived asset over the long-lived asset’s fair value. The fair value would be determined based on valuation techniques such as a comparison to fair values of similar assets. There were
no
impairment charges recognized during the years ended
March 31, 2018
,
2017
and
2016
.
Equity Method Investment
In fiscal 2016, the Company acquired a
34%
ownership in Laitek, Inc. (Laitek). Laitek develops solutions for acquiring, processing and presenting scientific and medical image information. The Company uses the equity method to account for its investment. In the event that management identifies an other than temporary decline in the estimated fair value of an equity method investment to an amount below its carrying value, such investment is written down to its estimated fair value. The Company also has development and original equipment manufacturing agreements with Laitek to jointly develop healthcare related software products. During fiscal 2018, the Company identified an indicator of impairment related to its investment and impaired the value of the investment to
zero
, which approximated the estimated fair value. This fair value measurement was based on unobservable inputs (Level 3).
Deferred Commissions Cost
Sales commissions and related payroll taxes earned by the Company's employees are considered incremental and recoverable costs of obtaining a contract with a customer. The Company’s typical contracts include performance obligations related to software licenses, software updates, customer support and other professional services. In these contracts, incremental costs of obtaining a contract are allocated to the performance obligations based on the relative estimated standalone selling prices and then recognized on a systematic basis that is consistent with the transfer of the goods or services to which the asset relates. The Company does not pay commissions on annual renewals of contracts for software updates and customer support for perpetual licenses. The costs allocated to software and products are expensed at the time of sale, when revenue for the functional software license or appliance is recognized. The costs allocated to software updates and customer support for perpetual licenses are amortized ratably over a period of approximately five years, the expected period of benefit of the asset capitalized. The Company currently estimates a period of five years is appropriate based on consideration of historical average customer life and the estimated useful life of the underlying software or appliance sold as part of the transaction. The costs related to professional services are amortized within one quarter following the date of the related software or appliance sale, which is typically the period the related professional services are provided and revenue is recognized. Amortization expense related to these costs is included in Sales and marketing expenses in the accompanying condensed consolidated statements of loss.
59
Commvault Systems, Inc.
Notes to Consolidated Financial Statements — (Continued)
(In thousands, except per share data)
Costs related to software updates and support for term-based, or subscription software licenses, are limited to the contractual period of the arrangement as the Company intends to pay a commensurate commission upon renewal of the subscription license and related updates and support.
Deferred Revenue
Deferred revenues represent amounts collected from, or invoiced to, customers in excess of revenues recognized. This results primarily from the billing of annual customer support agreements, and billings for other professional services fees that have not yet been performed by the Company. The value of deferred revenues will increase or decrease based on the timing of invoices and recognition of revenue.
Related Party Transactions
During the first quarter of fiscal 2018, one of our Directors, Joseph F. Eazor, was hired as the CEO of Rackspace, Inc (Rackspace). Rackspace has been a customer of the Company since 2006. Total recognized revenue related to Rackspace in fiscal
2018
was
$10,024
. This total includes the renewal of a subscription software license in March 2018 for
$4,756
. The outstanding accounts receivable from this customer as of
March 31, 2018
is
$5,704
.
Accounting for Stock-Based Compensation
The Company utilizes the Black-Scholes pricing model to determine the fair value of non-qualified stock options on the dates of grant. Restricted stock units without a market condition are measured based on the fair market values of the underlying stock on the date of grant. The Company recognizes stock-based compensation using the straight-line method for all stock awards that don't include a market or performance condition.
Share Repurchases
The Company considers all shares repurchased as canceled shares restored to the status of authorized but unissued shares on the trade date. The aggregate purchase price of the shares of the Company’s common stock repurchased is reflected as a reduction to Stockholders’ Equity. The Company accounts for shares repurchased as an adjustment to common stock (at par value) with the excess repurchase price allocated between Additional Paid-in Capital and Accumulated Deficit.
Sales Tax
The Company records revenue net of sales tax.
Advertising Costs
The Company expenses advertising costs as incurred. Advertising expenses were
$5,704
,
$7,816
, and
$5,083
for the years ended
March 31, 2018
,
2017
and
2016
, respectively.
Shipping and Handling Costs
Shipping and handling costs are included in cost of revenues for all periods presented.
Foreign Currency Translation
The functional currencies of the Company’s foreign operations are deemed to be the local country’s currency. Assets and liabilities of the Company’s international subsidiaries are translated at their respective period-end exchange rates, and revenues and expenses are translated at average currency exchange rates for the period. The resulting balance sheet translation adjustments are included in Other Comprehensive Loss and are reflected as a separate component of Stockholders’ Equity.
Foreign currency transaction gains and losses are recorded in “General and administrative expenses” in the Consolidated Statements of Operations. The Company recognized net foreign currency transaction gains of
$109
,
$644
and
$195
in the years ended
March 31, 2018
, 2016, and 2015, respectively. The net foreign currency transaction gains recorded in “General and administrative expenses” include settlement gains and losses on forward contracts disclosed below.
60
Commvault Systems, Inc.
Notes to Consolidated Financial Statements — (Continued)
(In thousands, except per share data)
Comprehensive Income (Loss)
Comprehensive income (loss) is defined to include all changes in equity, except those resulting from investments by stockholders and distribution to stockholders.
Recently Issued Accounting Standards
Revenue Recognition
As of April 1, 2017 the Company early adopted Accounting Standards Update (ASU) No. 2014-09,
Revenue from Contracts with Customers
(Topic 606), and the amendments in ASUs 2015-14, 2016-08, 2016-10 and 2016-12. This standard replaced existing revenue recognition rules with a comprehensive revenue measurement and recognition standard and expanded disclosure requirements. The ASU also includes guidance regarding the accounting for contract acquisition costs, which includes sales commissions. The Company has early adopted the new standard as of April 1, 2017 using the full retrospective method which required each prior reporting period presented to be adjusted beginning with this issuance of the Company’s financial statements. The most significant impact of adopting the new standard related to the deferral of commission costs. A portion of sales commissions cost is now recorded as an asset and recognized as an operating expense over the time period that the Company expects to recover the costs.
Select adjusted unaudited financial statement information, which reflect the adoption of Topic 606 is below. The Company’s historical net cash flows are not impacted by this accounting change.
|
Year Ended March 31, 2016
|
|||||||||||
|
As Reported
|
Adjustments
|
Recast for Adoption of ASC 606
|
|||||||||
|
Revenues:
|
|||||||||||
|
Software and products
|
$
|
258,793
|
|
$
|
(702
|
)
|
$
|
258,091
|
|
||
|
Services
|
336,333
|
|
(657
|
)
|
335,676
|
|
|||||
|
Total revenues
|
595,126
|
|
(1,359
|
)
|
593,767
|
|
|||||
|
Total cost of revenues
|
82,712
|
|
—
|
|
82,712
|
|
|||||
|
Gross margin
|
512,414
|
|
(1,359
|
)
|
511,055
|
|
|||||
|
Total operating expenses
|
510,415
|
|
(3,470
|
)
|
506,945
|
|
|||||
|
Income from operations
|
1,999
|
|
2,111
|
|
4,110
|
|
|||||
|
Interest expense
|
(933
|
)
|
—
|
|
(933
|
)
|
|||||
|
Interest income
|
862
|
|
—
|
|
862
|
|
|||||
|
Equity in loss of affiliate
|
(83
|
)
|
—
|
|
(83
|
)
|
|||||
|
Income before income taxes
|
1,845
|
|
2,111
|
|
3,956
|
|
|||||
|
Income tax expense
|
1,709
|
|
527
|
|
2,236
|
|
|||||
|
Net income
|
$
|
136
|
|
$
|
1,584
|
|
$
|
1,720
|
|
||
61
Commvault Systems, Inc.
Notes to Consolidated Financial Statements — (Continued)
(In thousands, except per share data)
|
Year Ended March 31, 2017
|
|||||||||||
|
As Reported
|
Adjustments
|
Recast for Adoption of ASC 606
|
|||||||||
|
Revenues:
|
|||||||||||
|
Software and products
|
$
|
296,421
|
|
$
|
(5,753
|
)
|
$
|
290,668
|
|
||
|
Services
|
354,097
|
|
240
|
|
354,337
|
|
|||||
|
Total revenues
|
650,518
|
|
(5,513
|
)
|
645,005
|
|
|||||
|
Total cost of revenues
|
85,192
|
|
—
|
|
85,192
|
|
|||||
|
Gross margin
|
565,326
|
|
(5,513
|
)
|
559,813
|
|
|||||
|
Total operating expenses
|
565,097
|
|
(4,042
|
)
|
561,055
|
|
|||||
|
Income (loss) from operations
|
229
|
|
(1,471
|
)
|
(1,242
|
)
|
|||||
|
Interest expense
|
(957
|
)
|
—
|
|
(957
|
)
|
|||||
|
Interest income
|
1,163
|
|
—
|
|
1,163
|
|
|||||
|
Equity in loss of affiliate
|
(958
|
)
|
—
|
|
(958
|
)
|
|||||
|
Loss before income taxes
|
(523
|
)
|
(1,471
|
)
|
(1,994
|
)
|
|||||
|
Income tax benefit
|
(1,063
|
)
|
(423
|
)
|
(1,486
|
)
|
|||||
|
Net income (loss)
|
$
|
540
|
|
$
|
(1,048
|
)
|
$
|
(508
|
)
|
||
|
March 31, 2017
|
|||||||||||
|
Balance Sheet Data
|
|||||||||||
|
As Reported
|
Adjustments
|
Recast for Adoption of ASC 606
|
|||||||||
|
Current assets:
|
|||||||||||
|
Trade accounts receivable
|
$
|
132,761
|
|
$
|
7,323
|
|
$
|
140,084
|
|
||
|
Total current assets
|
$
|
598,736
|
|
$
|
7,323
|
|
$
|
606,059
|
|
||
|
Deferred tax assets, net
|
$
|
61,018
|
|
$
|
(10,790
|
)
|
$
|
50,228
|
|
||
|
Deferred commissions
|
$
|
—
|
|
$
|
30,378
|
|
$
|
30,378
|
|
||
|
Total assets
|
$
|
802,967
|
|
$
|
26,911
|
|
$
|
829,878
|
|
||
|
Current Liabilities:
|
|
|
|||||||||
|
Deferred revenue
|
$
|
206,777
|
|
$
|
2,322
|
|
$
|
209,099
|
|
||
|
Total current liabilities
|
$
|
285,595
|
|
$
|
2,322
|
|
$
|
287,917
|
|
||
|
Other liabilities
|
$
|
3,934
|
|
$
|
292
|
|
$
|
4,226
|
|
||
|
Accumulated deficit
|
$
|
(239,974
|
)
|
$
|
24,297
|
|
$
|
(215,677
|
)
|
||
|
Total stockholders’ equity
|
$
|
442,635
|
|
$
|
24,297
|
|
$
|
466,932
|
|
||
|
Total liabilities and stockholders’ equity
|
$
|
802,967
|
|
$
|
26,911
|
|
$
|
829,878
|
|
||
62
Commvault Systems, Inc.
Notes to Consolidated Financial Statements — (Continued)
(In thousands, except per share data)
|
Year Ended March 31, 2016
|
|||||||||||
|
As Reported
|
Adjustments
|
Recast for Adoption of ASC 606
|
|||||||||
|
Cash flows from operating activities
|
|||||||||||
|
Net income
|
$
|
136
|
|
$
|
1,584
|
|
$
|
1,720
|
|
||
|
Deferred income taxes
|
$
|
(9,332
|
)
|
$
|
527
|
|
$
|
(8,805
|
)
|
||
|
Amortization of deferred commissions cost
|
$
|
—
|
|
$
|
11,234
|
|
$
|
11,234
|
|
||
|
Changes in operating assets and liabilities:
|
|
|
|||||||||
|
Trade accounts receivable
|
$
|
3,879
|
|
$
|
(2,119
|
)
|
$
|
1,760
|
|
||
|
Other current assets and Other assets
|
$
|
2,843
|
|
$
|
1,024
|
|
$
|
3,867
|
|
||
|
Deferred commissions cost
|
$
|
—
|
|
$
|
(12,868
|
)
|
$
|
(12,868
|
)
|
||
|
Deferred revenue
|
$
|
16,317
|
|
$
|
618
|
|
$
|
16,935
|
|
||
|
Year Ended March 31, 2017
|
|||||||||||
|
As Reported
|
Adjustments
|
Recast for Adoption of ASC 606
|
|||||||||
|
Cash flows from operating activities
|
|||||||||||
|
Net income (loss)
|
$
|
540
|
|
$
|
(1,048
|
)
|
$
|
(508
|
)
|
||
|
Deferred income taxes
|
$
|
(11,045
|
)
|
$
|
(423
|
)
|
$
|
(11,468
|
)
|
||
|
Amortization of deferred commissions cost
|
$
|
—
|
|
$
|
16,065
|
|
$
|
16,065
|
|
||
|
Changes in operating assets and liabilities:
|
|||||||||||
|
Trade accounts receivable
|
$
|
(21,493
|
)
|
$
|
5,121
|
|
$
|
(16,372
|
)
|
||
|
Deferred commissions cost
|
$
|
—
|
|
$
|
(18,393
|
)
|
$
|
(18,393
|
)
|
||
|
Deferred revenue
|
$
|
37,988
|
|
$
|
(1,322
|
)
|
$
|
36,666
|
|
||
Stock-based Compensation
In March 2016, the FASB issued ASU No. 2016-09, Improvements to Employee Share-Based Payment Accounting (Topic 718), which simplifies the accounting for share-based payment transactions, including related accounting for income taxes, forfeitures, and classification in the statement of cash flows. The Company adopted the guidance prospectively effective April 1, 2017.
In March 2016, the FASB issued ASU No. 2016-09, Improvements to Employee Share-Based Payment Accounting (Topic 718), which simplifies the accounting for share-based payment transactions, including related accounting for income taxes, forfeitures, and classification in the statement of cash flows. The Company adopted the guidance prospectively effective April 1, 2017.
The guidance requires excess tax benefits and tax deficiencies to be recorded as income tax benefit or expense in the statement of income when the awards vest or are settled, and eliminates the requirement to reclassify cash flows related to excess tax benefits from operating activities to financing activities on the statement of cash flows. Amounts previously recorded to Additional paid-in capital related to excess tax benefits prior to April 1, 2017 remain in Stockholders' equity. Cash flows related to excess taxes prior to April 1, 2017 remain classified as financing cash flows. In addition, the standard allows the Company to repurchase more of an employee’s vesting shares for tax withholding purposes without triggering liability accounting, and provides an accounting policy election to account for forfeitures as they occur. The Company has elected to account for forfeitures as they occur. The cumulative impact of the election to account for forfeitures as they are incurred is included as an adjustment to accumulated deficit.
Leases
In February 2016, the FASB issued ASU 2016-02 “Leases (Topic 842)” (ASU 2016-02). Under ASU 2016-02, a lessee will recognize in the balance sheet a liability to make lease payments (the lease liability) and a right-to-use asset representing its right to use the underlying asset for the lease term. The amendments of this ASU are effective for the Company's fiscal 2020, with early adoption permitted. The Company is currently assessing the impact the adoption of ASU 2016-02 will have on the financial statements.
In February 2016, the FASB issued ASU 2016-02 “Leases (Topic 842)” (ASU 2016-02). Under ASU 2016-02, a lessee will recognize in the balance sheet a liability to make lease payments (the lease liability) and a right-to-use asset representing its right to use the underlying asset for the lease term. The amendments of this ASU are effective for the Company's fiscal 2020, with early adoption permitted. The Company is currently assessing the impact the adoption of ASU 2016-02 will have on the financial statements.
There have been no other accounting pronouncements issued but not yet adopted by the Company which are expected to have a material impact on the Company’s financial position, results of operations or cash flows.
63
Commvault Systems, Inc.
Notes to Consolidated Financial Statements — (Continued)
(In thousands, except per share data)
3. Revenue
The Company accounts for revenue in accordance with ASC Topic 606, Revenue from Contracts with Customers, which was adopted on April 1, 2017, using the full retrospective method.
The Company derives revenues from
two
primary sources: software and products, and services. Software and products revenue includes the Company's software and integrated appliances that combine the Company's software with hardware. Services include customer support (software updates and technical support), consulting, assessment and design services, installation services and customer education. A typical contract includes both licenses and services.
The Company’s software licenses typically provide for a perpetual right to use the Company’s software. The Company also sells term-based software licenses that expire, which are referred to as subscription arrangements. The Company does not customize its software and installation services are not required. The software is delivered before related services are provided and is functional without professional services, updates and technical support. The Company has concluded that its software license is functional intellectual property that is distinct as the user can benefit from the software on its own. Software revenue is typically recognized when the software is delivered and/or made available for download as this is the point the user of the software can direct the use of, and obtain substantially all of the remaining benefits from the functional intellectual property. The Company does not recognize software revenue related to the renewal of subscription software licenses earlier than the beginning of the subscription period.
In fiscal 2018, the Company also started selling appliances that integrate the Company's software with hardware and address a wide-range of business needs and use cases, ranging from support for remote or branch offices with limited IT staff up to large corporate data centers. Revenue related to appliances is recognized when control of the appliances passes to the customer; typically upon delivery. Revenue to date related to appliances has not been significant.
Services revenue includes revenue from customer support and other professional services. Customer support includes software updates on a when-and-if-available basis, telephone support, integrated web-based support and bug fixes or patches. The Company sells its customer support contracts as a percentage of net software purchases the support is related to. Customer support revenue is recognized ratably over the term of the customer support agreement, which is typically
one
year.
The Company’s other professional services include consulting, assessment and design services, installation services and customer education. Customer education services include courses taught by the Company’s instructors or third-party contractors. Revenue related to other professional services and customer education services is typically recognized as the services are performed.
Most of the Company’s contracts with customers contain multiple performance obligations. For these contracts, the Company accounts for individual performance obligations separately if they are distinct. The transaction price is allocated to the separate performance obligations on a relative standalone selling price basis. Standalone selling prices of software and appliances are typically estimated using the residual approach. Standalone selling prices of services are typically estimated based on observable transactions when these services are sold on a standalone basis.
64
Commvault Systems, Inc.
Notes to Consolidated Financial Statements — (Continued)
(In thousands, except per share data)
The Company’s typical performance obligations include the following:
|
Performance Obligation
|
When Performance Obligation
is Typically Satisfied
|
When Payment is
Typically Due
|
How Standalone Selling Price is
Typically Estimated
|
|
Software and Products Revenue
|
|||
|
Software Licenses
|
Upon shipment or made available for download (point in time)
|
Within 90 days of shipment except for certain subscription licenses which are paid for over time
|
Residual approach
|
|
Appliances
|
When control of the appliances passes to the customer; typically upon delivery
|
Within 90 days of delivery except for certain subscriptions which are paid for over time
|
Residual approach
|
|
Customer Support Revenue
|
|||
|
Software Updates
|
Ratably over the course of the support contract (over time)
|
At the beginning of the contract period
|
Observable in renewal transactions
|
|
Customer Support
|
Ratably over the course of the support contract (over time)
|
At the beginning of the contract period
|
Observable in renewal transactions
|
|
Professional Services
|
|||
|
Other Professional Services (except for education services)
|
As work is performed (over time)
|
Within 90 days of services being performed
|
Observable in transactions without multiple performance obligations
|
|
Education Services
|
When the class is taught (point in time)
|
Within 90 days of services being performed
|
Observable in transactions without multiple performance obligations
|
Disaggregation of Revenue
The Company disaggregates revenue from contracts with customers into the nature of the products and services and geographical regions. The geographic regions that are tracked are the Americas (United States, Canada, Latin America), EMEA (Europe, Middle East, Africa) and APAC (Australia, New Zealand, Southeast Asia, China). The Company operates in
one
segment.
|
Year Ended March 31, 2018
|
||||||||||||
|
Americas
|
EMEA
|
APAC
|
Total
|
|||||||||
|
Software and Products Revenue
|
$
|
167,858
|
|
$
|
100,452
|
|
$
|
43,435
|
|
$
|
311,745
|
|
|
Customer Support Revenue
|
233,991
|
|
75,807
|
|
36,257
|
|
346,055
|
|
||||
|
Professional Services
|
23,453
|
|
11,289
|
|
6,851
|
|
41,593
|
|
||||
|
Total Revenue
|
$
|
425,302
|
|
$
|
187,548
|
|
$
|
86,543
|
|
$
|
699,393
|
|
|
Year Ended March 31, 2017
|
||||||||||||
|
Americas
|
EMEA
|
APAC
|
Total
|
|||||||||
|
Software and Products Revenue
|
$
|
168,243
|
|
$
|
82,393
|
|
$
|
40,032
|
|
$
|
290,668
|
|
|
Customer Support Revenue
|
216,656
|
|
65,732
|
|
32,466
|
|
314,854
|
|
||||
|
Professional Services
|
22,704
|
|
11,364
|
|
5,415
|
|
39,483
|
|
||||
|
Total Revenue
|
$
|
407,603
|
|
$
|
159,489
|
|
$
|
77,913
|
|
$
|
645,005
|
|
65
Commvault Systems, Inc.
Notes to Consolidated Financial Statements — (Continued)
(In thousands, except per share data)
|
Year Ended March 31, 2016
|
||||||||||||
|
Americas
|
EMEA
|
APAC
|
Total
|
|||||||||
|
Software and Products Revenue
|
$
|
153,281
|
|
$
|
75,389
|
|
$
|
29,421
|
|
$
|
258,091
|
|
|
Customer Support Revenue
|
204,223
|
|
61,052
|
|
29,039
|
|
294,314
|
|
||||
|
Professional Services
|
24,391
|
|
11,195
|
|
5,776
|
|
41,362
|
|
||||
|
Total Revenue
|
$
|
381,895
|
|
$
|
147,636
|
|
$
|
64,236
|
|
$
|
593,767
|
|
Information about Contract Balances
Amounts collected in advance of services being provided are accounted for as deferred revenue. Nearly all of the Company's deferred revenue balance is related to services revenue, primarily customer support contracts.
In some arrangements the Company allows customers to pay for term based software licenses and products over the term of the software license. Amounts recognized as revenue in excess of amounts billed are recorded as unbilled receivables. Unbilled receivables which are anticipated to be invoiced in the next twelve months are included in Accounts receivable on the consolidated balance sheet. Long term unbilled receivables are included in Other assets. The opening and closing balances of the Company’s accounts receivable, unbilled receivables, and deferred revenues are as follows:
|
Accounts Receivable
|
Unbilled Receivable
(current)
|
Unbilled Receivable
(long-term)
|
Deferred Revenue
(current)
|
Deferred Revenue
(long-term)
|
|||||||||||
|
Opening Balance as of March 31, 2017
|
$
|
132,711
|
|
$
|
7,373
|
|
$
|
—
|
|
$
|
209,099
|
|
$
|
70,803
|
|
|
Increase, net
|
19,508
|
|
2,527
|
|
4,380
|
|
32,014
|
|
13,858
|
|
|||||
|
Ending Balance as of March 31, 2018
|
$
|
152,219
|
|
$
|
9,900
|
|
$
|
4,380
|
|
$
|
241,113
|
|
$
|
84,661
|
|
The increase in accounts receivable is primarily a result of an increase in software and products revenue relative to the prior year and an increase in subscription software transactions that are recognized as revenue at the time of sale but paid for over time. The increase in deferred revenue is primarily the result of an increase in deferred customer support revenue related to software and products revenue transactions and customer support renewals during fiscal 2018, most of which will be recognized over the course of the next twelve months.
The amount of revenue recognized in the period that was included in the opening deferred revenue balance was
$209,099
for the year ended
March 31, 2018
. The vast majority of this revenue consists of customer support arrangements. The amount of revenue recognized from performance obligations satisfied in prior periods was not material.
Remaining Performance Obligations
In addition to the amounts included in deferred revenue as of
March 31, 2018
, approximately
$20,821
of revenue may be recognized from remaining performance obligations, of which
$320
was related to software and products. The Company expects the software and products revenue to be recognized next quarter. The majority of the services revenue is related to other professional services which may be recognized over the next twelve months but is contingent upon a number of factors, including customers’ needs and schedules.
66
Commvault Systems, Inc.
Notes to Consolidated Financial Statements — (Continued)
(In thousands, except per share data)
4. Property and Equipment
Property and equipment consist of the following:
|
|
March 31,
|
|||||||
|
|
2018
|
2017
|
||||||
|
Land
|
$
|
9,445
|
|
$
|
9,445
|
|
||
|
Buildings
|
103,244
|
|
103,244
|
|
||||
|
Computers, servers and other equipment
|
37,132
|
|
35,274
|
|
||||
|
Furniture and fixtures
|
15,594
|
|
14,912
|
|
||||
|
Leasehold improvements
|
10,143
|
|
7,040
|
|
||||
|
Purchased software
|
1,425
|
|
1,335
|
|
||||
|
Construction in process
|
57
|
|
1,147
|
|
||||
|
177,040
|
|
172,397
|
|
|||||
|
Less: Accumulated depreciation and amortization
|
(48,428
|
)
|
(40,078
|
)
|
||||
|
$
|
128,612
|
|
$
|
132,319
|
|
|||
The Company recorded depreciation and amortization expense of
$11,217
,
$9,980
, and
$10,927
for the years ended
March 31, 2018
,
2017
and
2016
, respectively.
5. Accrued Liabilities
Accrued liabilities consist of the following:
|
|
March 31,
|
|||||||
|
|
2018
|
2017
|
||||||
|
Compensation and related payroll taxes
|
$
|
46,192
|
|
$
|
45,149
|
|
||
|
Other
|
36,107
|
|
33,552
|
|
||||
|
$
|
82,299
|
|
$
|
78,701
|
|
|||
6. Commitments and Contingencies
Leases
The Company leases various office facilities under non-cancelable leases, which expire on various dates through April 2022. Future minimum lease payments under all operating leases at
March 31, 2018
are as follows:
|
Year Ending March 31,
|
|||
|
2019
|
$
|
9,858
|
|
|
2020
|
8,316
|
|
|
|
2021
|
6,558
|
|
|
|
2022
|
4,449
|
|
|
|
2023 and thereafter
|
3,746
|
|
|
|
$
|
32,927
|
|
|
Rent expenses were
$12,215
,
$10,377
, and
$9,856
for the years ended
March 31, 2018
,
2017
and
2016
, respectively.
Rent expense is calculated by amortizing total rental payments (net of any rental abatements, allowances and other rental concessions), on a straight-line basis, over the lease term. Accordingly, rent expense charged to operations differs from rent paid resulting in the Company recording deferred rent.
67
Commvault Systems, Inc.
Notes to Consolidated Financial Statements — (Continued)
(In thousands, except per share data)
Purchase Commitments
The Company, in the normal course of business, enters into various purchase commitments for goods or services. Total non-cancellable purchase commitments as of
March 31, 2018
are approximately
$20,164
for fiscal
2019
,
$5,841
for fiscal
2020
,
$1,025
for fiscal
2021
and
$299
for fiscal
2022
, totaling
$27,329
for all periods through fiscal
2022
. These purchase commitments relate primarily to marketing and IT services.
The Company has certain software royalty commitments associated with the shipment and licensing of certain products. Royalty expense is generally based on a fixed cost per unit shipped or a fixed fee for unlimited units shipped over a designated period. Royalty expense, included in cost of software and products revenues, was
$4,462
in
fiscal 2018
,
$2,646
in
fiscal 2017
and
$1,933
in
fiscal 2016
.
Warranties and Indemnifications
The Company offers a
90
-day limited product warranty for its software. To date, costs related to this product warranty have not been material.
The Company provides certain provisions within its software licensing agreements to indemnify its customers from any claim, suit or proceeding arising from alleged or actual intellectual property infringement. These provisions continue in perpetuity, along with the Company’s software licensing agreements. The Company has never incurred a liability relating to one of these indemnification provisions, and management believes that the likelihood of any future payout relating to these provisions is remote. Therefore, the Company has
no
t recorded a liability during any period for these indemnification provisions.
Legal Proceedings
On September 10, 2014, a purported class action complaint was filed in the United States District Court for the District of New Jersey against the Company, its Chief Executive Officer and its Chief Financial Officer. The case is captioned In re Commvault Systems, Inc. Securities Litigation (Master File No. 3:14-cv-05628-MAS-LHG). The suit alleges that the Company made materially false and misleading statements, or failed to disclose material facts, regarding the Company's financial results, business, operations and prospects in violation of Sections 10(b) and 20(a) of the Securities Exchange Act of 1934 and Rule 10b-5 promulgated thereunder. The suit is purportedly brought on behalf of purchasers of the Company's common stock during the period from May 7, 2013 through April 24, 2014, and seeks compensatory damages, costs and expenses, as well as equitable or other relief. Lead plaintiff, the Arkansas Teachers Retirement System, was appointed on January 12, 2015, and on March 18, 2015, an amended complaint was filed by the plaintiffs. On December 17, 2015, the defendant’s motion to dismiss the case was granted and the case dismissed; however, the plaintiffs were permitted to re-file their claim, which they did on February 5, 2016. Defendants filed another motion to dismiss on April 5, 2016, which was denied by the court on September 30, 2016. Thereafter, discovery commenced. On October 2, 2017, the parties entered into an agreement in principle to settle the action for
$12,500
. The parties signed a stipulation of settlement on November 30, 2017. The settlement remains subject to court approval; the court has scheduled a hearing for May 14, 2018 to consider whether to approve the settlement. The settlement amount has been funded solely by the Company’s insurers. There can be no assurance that the settlement will ultimately be approved or that it will become final. If the settlement does not occur and litigation against the Company continues, the Company believes that it has meritorious defenses and intends to defend the case vigorously. However, due to the inherent uncertainties of litigation, the Company cannot accurately predict the ultimate outcome of this matter if the litigation continues.
On April 12, 2017, a shareholder derivative complaint was filed in the United States District Court for the District of New Jersey against the Company (nominally), certain of its executive officers and certain members of the board of directors. The complaint is entitled Murashko v. Hammer, et al. (Civ. No. 3:17-cv-02533-PGS-TJB). The plaintiff filed an amended complaint on July 14, 2017. The amended complaint largely repeats the allegations made in the securities litigation also pending in the United States District Court for the District of New Jersey (In re Commvault Systems, Inc. Securities Litigation (Master File No. 3:14-cv-05628-PGS-LHG), claiming that the defendant officers and directors breached their fiduciary duties to the Company by causing, or allowing, the Company to manipulate its financial results and conceal the state of its business prospects. The suit also alleges that certain executive officers engaged in unlawful insider trading in 2013 and/or 2014 based on their knowledge of the information that was supposedly concealed. The allegations asserted in the shareholder derivative action purport to cover a period from 2013 through the present. As a derivative action, the complaint does not seek damages from the Company, but rather seeks to recover from the defendant officers and directors on behalf of the Company compensatory damages, restitution, costs and expenses, as well as equitable or other relief. On August 29, 2017, all of the
68
Commvault Systems, Inc.
Notes to Consolidated Financial Statements — (Continued)
(In thousands, except per share data)
defendants, including the Company, filed a motion to dismiss the derivative action; that motion was granted on February 22, 2018. The court dismissed the complaint without prejudice for failure to make a demand on the Company’s Board of Directors or to plead facts showing that a demand would be futile. The plaintiff chose not to appeal the dismissal of his complaint. On November 30, 2017, a virtually identical shareholder derivative complaint was filed in state court in New Jersey entitled Lee v. Hammer, et al., Civ. 201-17 (N.J. Super. Ct.). On April 27, 2018, the parties agreed to dismiss the complaint without prejudice. While both derivative cases have been dismissed without prejudice, due to the inherent uncertainties of litigation, these cases or similar cases may be brought again in the future and the Company cannot accurately predict the ultimate outcome of these matters should they be re-filed.
On February 27, 2017, Realtime Data LLC d/b/a/ IXO (Realtime), a non-practicing entity, sued the Company and Spectra Logic Corporation in the Eastern District of Texas for alleged infringement of
four
patents: U.S. Patent Nos. 9,054,728, 7,415,530, 9,116,908, and 8,717,204. Realtime dismissed the case in Texas and refiled this case in the District of Delaware on July 10, 2017. Realtime has sued numerous other companies for infringement of these and other patents. Realtime seeks monetary damages and an injunction. The Company responded to the complaint by filing a motion to dismiss on the grounds that the patents are directed to patent-ineligible subject matter. The Court has not yet ruled on this motion. Due to the inherent uncertainties of litigation, the Company cannot accurately predict the ultimate outcome of this matter. The Company is unable at this time to determine whether the outcome of the litigation will have a material impact on its results of operations, financial condition or cash flows. The Company intends to defend itself vigorously. As of March 31, 2018, the Company has not recorded an accrual for this matter as it has concluded that the probability of loss is remote.
7. Revolving Credit Facility
The Company had a
five
-year
$250,000
revolving credit facility (the “Credit Facility”) that it terminated on February 9, 2018. Outstanding borrowings under the Credit Facility accrued interest at an annual rate equal to London Interbank Offered Rate plus
1.50%
subject to increases based on the Company's actual leverage. The unused balance on the Credit Facility was also subject to a
0.25%
annual interest charge subject to increases based on the Company's actual leverage.
The Company had deferred the expense related to debt issuance costs, which were classified as Other Assets, and were being amortized into interest expense. The amortization of debt issuance costs was
$568
for year ended
March 31, 2018
(inclusive of costs written off upon termination) and
$252
for the year ended
March 31, 2017
.
8. Capitalization
On November 13, 2008, the Board of Directors of the Company adopted a Rights Plan and declared a dividend distribution of
one
Right for each outstanding share of common stock to shareholders of record on November 24, 2008. Each Right, when exercisable, entitles the registered holder to purchase one one-thousandth of a share of Series A Junior Participating Preferred Stock, par value
$0.01
per share, at a purchase price of
eighty
dollars per one one thousandth of a share, subject to adjustment. Of the
50,000
shares of preferred stock authorized under the Company’s certificate of incorporation,
150
have been designated as Series A Junior Participating Preferred.
The Rights will become exercisable following the tenth business day after (i) a person or group announces the acquisition of
15%
or more of the Company’s common stock or (ii) commencement of a tender or exchange offer, the consummation of which would result in ownership by the person or group of
15%
or more of the Company’s common stock. The Company is also entitled to redeem the Rights at
$0.001
per right under certain circumstances. The Rights expire on
November 14, 2018
, if not exercised or redeemed.
Common Stock
The Company had
45,118
and
44,816
shares of common stock, par value
$0.01
, outstanding at
March 31, 2018
and
March 31, 2017
, respectively.
During fiscal
2018
, the Company repurchased
$112,218
of common stock, or
2,098
shares, under its share repurchase program. As of March 31,
2018
,
$112,840
remained in the current stock repurchase authorization which expires on March 31, 2019.
69
Commvault Systems, Inc.
Notes to Consolidated Financial Statements — (Continued)
(In thousands, except per share data)
Shares Reserved for Issuance
At March 31, 2018 the Company has reserved
3,908
shares in connection with its Stock Plans discussed in Note 9.
9. Stock Plans
As of
March 31, 2018
, the Company maintains
one
stock incentive plan for purposes of granting awards, the Omnibus Incentive Plan as amended by amendment one (the “2016 Incentive Plan”). The Company has
one
additional plan, the 2006 Long-Term Stock Incentive Plan (the “LTIP”), with outstanding options and awards but cannot be used for future grants.
The 2016 Incentive Plan permits the grant of incentive stock options, non-qualified stock options, restricted stock awards, restricted stock units, stock appreciation rights, performance stock awards and stock unit awards based on, or related to, shares of the Company’s common stock. As of
March 31, 2018
, approximately
1,742
shares were available for future issuance under the 2016 Incentive Plan.
As of
March 31, 2018
, the Company has granted non-qualified stock options, restricted stock units and performance stock awards under its stock incentive plans. Historically, equity awards granted by the Company under its stock incentive plans generally vest quarterly over a
four
-year period, except that the shares that would otherwise vest quarterly over the first twelve months do not vest until the first anniversary of the grant. Beginning in October of 2015, the Company began granting its equity awards with a
three
-year vest period, and retained the practice that shares that would otherwise vest quarterly over the first twelve months do not vest until the first anniversary of the grant. However, from time to time the company grants equity awards that vest between
one
and
three
years. The Company anticipates that future grants under its stock incentive plans will be restricted stock units and performance stock awards and does not anticipate that it will grant stock options.
As of
March 31, 2018
, there was approximately
$87,814
of unrecognized stock-based compensation expense related to all of the Company's employee stock plans, net of estimated forfeitures, that is expected to be recognized over a weighted average period of
1.01
years. To the extent the actual forfeiture rate is different from what the Company has anticipated, stock-based compensation related to these awards will be different from the Company’s expectations.
The Company estimated the fair value of stock options granted using the Black-Scholes formula. The Company’s calculation of expected term includes a combination of actual exercise data and an assumption on when the remaining outstanding options with similar characteristics would be exercised based on the Company’s historical data. In determining expected life, the Company separates employees into groups that have historically exhibited similar behavior with regard to option exercises. Expected volatility is calculated based on a blended approach that included the implied volatility of the Company’s traded options with a remaining maturity greater than six months and the historical realized volatility of the Company’s common stock. The risk-free interest rate is determined by reference to U.S. Treasury yield curve rates with a remaining term that is approximately the expected life assumed at the date of grant. Forfeitures are estimated based on the Company’s historical analysis of actual stock option forfeitures.
The assumptions used in the Black-Scholes option-pricing model are as follows:
|
|
Year Ended March 31,
|
|
|
|
2016
|
|
|
Dividend yield
|
None
|
|
|
Expected volatility
|
39% - 43%
|
|
|
Weighted average expected volatility
|
41%
|
|
|
Risk-free interest rates
|
1.29% - 1.75%
|
|
|
Weighted average expected life (in years)
|
4.6
|
|
70
Commvault Systems, Inc.
Notes to Consolidated Financial Statements — (Continued)
(In thousands, except per share data)
The following summarizes the activity for the Company’s stock incentive plans from
March 31, 2015
to
March 31, 2018
:
|
Options
|
Number of
Options |
Weighted-
Average Exercise Price |
Weighted-
Average Remaining Contractual Term (Years) |
Aggregate
Intrinsic Value |
|||||||||
|
Outstanding at March 31, 2015
|
6,853
|
|
$
|
40.91
|
|
||||||||
|
Options granted
|
148
|
|
41.84
|
|
|||||||||
|
Options exercised
|
(764
|
)
|
8.80
|
|
|||||||||
|
Options forfeited
|
(172
|
)
|
59.79
|
|
|||||||||
|
Options expired
|
(126
|
)
|
61.81
|
|
|||||||||
|
Outstanding at March 31, 2016
|
5,939
|
|
44.07
|
|
|||||||||
|
Options granted
|
—
|
|
—
|
|
|||||||||
|
Options exercised
|
(446
|
)
|
28.44
|
|
|||||||||
|
Options forfeited
|
(77
|
)
|
51.55
|
|
|||||||||
|
Options expired
|
(116
|
)
|
68.98
|
|
|||||||||
|
Outstanding at March 31, 2017
|
5,300
|
|
44.74
|
|
|||||||||
|
Options granted
|
—
|
|
—
|
|
|||||||||
|
Options exercised
|
(842
|
)
|
23.57
|
|
|||||||||
|
Options forfeited
|
(26
|
)
|
43.30
|
|
|||||||||
|
Options expired
|
(30
|
)
|
68.27
|
|
|||||||||
|
Outstanding at March 31, 2018
|
4,402
|
|
$
|
48.64
|
|
4.16
|
$
|
65,223
|
|
||||
|
Exercisable at March 31, 2018
|
4,210
|
|
$
|
48.81
|
|
4.05
|
$
|
62,888
|
|
||||
The weighted average fair value of stock options granted was
$15.20
per share during the year ended March 31,
2016
. The total intrinsic value of options exercised was
$26,547
,
$9,896
, and
$23,391
in the years ended
March 31, 2018
,
2017
and
2016
, respectively. The Company’s policy is to issue new shares upon exercise of options as the Company does not hold shares in treasury.
71
Commvault Systems, Inc.
Notes to Consolidated Financial Statements — (Continued)
(In thousands, except per share data)
Restricted stock unit activity is as follows:
|
Non-Vested Restricted Stock Units
|
Number
of Awards |
Weighted
Average Grant Date Fair Value |
|||||
|
Non-vested as of March 31, 2015
|
1,412
|
|
$
|
56.82
|
|
||
|
Granted
|
1,543
|
|
37.27
|
|
|||
|
Vested
|
(547
|
)
|
38.38
|
|
|||
|
Forfeited
|
(196
|
)
|
49.24
|
|
|||
|
Non-vested as of March 31, 2016
|
2,212
|
|
43.43
|
|
|||
|
Granted
|
1,333
|
|
50.66
|
|
|||
|
Vested
|
(975
|
)
|
51.35
|
|
|||
|
Forfeited
|
(174
|
)
|
43.56
|
|
|||
|
Non-vested as of March 31, 2017
|
2,396
|
|
45.53
|
|
|||
|
Granted
|
1,235
|
|
59.71
|
|
|||
|
Vested
|
(1,324
|
)
|
46.74
|
|
|||
|
Forfeited
|
(141
|
)
|
48.24
|
|
|||
|
Non-vested as of March 31, 2018
|
2,166
|
|
$
|
54.13
|
|
||
The total fair value of the restricted stock units that vested during the years ended
March 31, 2018
,
2017
and
2016
was
$76,193
,
$50,051
and
$20,981
, respectively.
The following table presents the stock-based compensation expense included in cost of services revenue, sales and marketing, research and development and general and administrative expenses for the years ended
March 31, 2018
,
2017
and
2016
.
|
|
Year Ended March 31,
|
|||||||||||
|
|
2018
|
2017
|
2016
|
|||||||||
|
Cost of services revenue
|
$
|
3,182
|
|
$
|
3,925
|
|
$
|
3,106
|
|
|||
|
Sales and marketing
|
36,917
|
|
34,005
|
|
28,557
|
|
||||||
|
Research and development
|
8,411
|
|
7,335
|
|
6,722
|
|
||||||
|
General and administrative
|
25,619
|
|
28,663
|
|
25,811
|
|
||||||
|
Stock-based compensation expense
|
$
|
74,129
|
|
$
|
73,928
|
|
$
|
64,196
|
|
|||
Performance Based Awards
In fiscal
2018
, the Company granted
107
performance restricted stock units (PSU) to certain executives. Vesting of these awards is contingent upon i) the Company meeting certain company-wide revenue and non-GAAP performance goals (performance-based) in fiscal 2018 and ii) the Company's customary service periods. The awards vest in
three
annual tranches and have a maximum potential to vest at
200%
(
214
shares) based on actual fiscal 2018 performance. The related stock-based compensation expense is determined based on the value of the underlying shares on the date of grant and is recognized over the vesting term using the accelerated method. During each financial period, management estimates the probable number of PSUs that would vest until the ultimate achievement of the performance goals is known. Based on the Company's results, the PSUs granted in fiscal 2018 will be eligible to vest at
54%
. The awards are included in the restricted stock units table.
72
Commvault Systems, Inc.
Notes to Consolidated Financial Statements — (Continued)
(In thousands, except per share data)
Awards with a Market Condition
In fiscal
2018
, the Company granted
88
market performance stock units to certain executives. The vesting of these awards is contingent upon the Company meeting certain total shareholder return (TSR) levels as compared to a market index over the next
three
years. The awards vest in
three
annual tranches and have a maximum potential to vest at
200%
(
176
shares) based on TSR performance. The related stock-based compensation expense is determined based on the estimated fair value of the underlying shares on the date of grant and is recognized using the accelerated method over the vesting term. The estimated fair value was calculated using a Monte Carlo simulation model. The weighted average fair value of the awards granted during the year was
$78.28
per share. The awards are included in the restricted stock unit table above.
Employee Stock Purchase Plan
The Employee Stock Purchase Plan (the “Purchase Plan”) is a shareholder approved plan under which substantially all employees may purchase the Company’s common stock through payroll deductions at a price equal to
85%
of the lower of the fair market values of the stock as of the beginning or the end of
six
-month offering periods. An employee’s payroll deductions under the Purchase Plan are limited to
10%
of the employee’s salary and employees may not purchase more than
$25
of stock during any calendar year. Employees purchased
234
shares in exchange for
$10,282
of proceeds in fiscal
2018
and
243
shares in exchange for
$8,634
of proceeds in fiscal
2017
. The Purchase Plan is considered compensatory and the fair value of the discount and look back provision are estimated using the Black-Scholes formula and recognized over the
six
month withholding period prior to purchase. The total expense associated with the Purchase Plan for fiscal
2018
,
2017
and
2016
was
$2,848
,
$2,620
and
$2,418
, respectively. As of March 31,
2018
, there was approximately
$1,171
of unrecognized cost related to the current purchase period of our Employee Stock Purchase Plan.
10. Income Taxes
Impact of U.S. Tax Reform
The Tax Cuts and Jobs Act (the Act) was enacted on December 22, 2017. Among the changes to the law, the Act reduces the U.S. federal corporate tax rate from 35% to 21%, requires companies to pay a one-time transition tax on earnings of certain foreign subsidiaries that were previously tax deferred and creates new taxes on certain foreign sourced earnings. As of March 31, 2018, the Company has not completed the accounting for the tax effects of enactment of the Act; however, as described below, it has made a reasonable estimate of the effects on existing deferred tax balances. These amounts are provisional and subject to change. The most significant impact of the legislation for the Company was a
$18,040
reduction of the value of the Company's net deferred tax assets (which represent future tax benefits) as a result of lowering the U.S. corporate income tax rate from 35% to 21%. The Act also includes a requirement to pay a one-time transition tax on the cumulative value of earnings and profits that were previously not repatriated for U.S. income tax purposes. The Company has not made sufficient progress on the transition tax analysis to reasonably estimate the effects, and therefore, has not recorded provisional amounts. However, based on analysis to date the one-time transition tax is not expected to be material. No additional income taxes have been provided for any remaining undistributed foreign earnings not subject to the transition tax, or any additional outside basis difference inherent in these entities, as these amounts continue to be indefinitely reinvested in foreign operations.
The Act also subjects a U.S. shareholder to tax on global intangible low-taxed income (GILTI) earned by certain foreign subsidiaries. The FASB Staff Q&A, Topic 740, No. 5, Accounting for Global Intangible Low-Taxed Income, states that an entity can make an accounting policy election to either recognize deferred taxes for temporary basis differences expected to reverse as GILTI in future years or provide for the tax expense related to GILTI in the year the tax is incurred. Given the complexity of the GILTI provisions, the Company is still evaluating the effects of the GILTI provisions and has not yet determined its accounting policy. At March 31, 2018, because the Company is still evaluating the GILTI provisions and analysis of future taxable income that is subject to GILTI, it is unable to make a reasonable estimate and has not reflected any adjustments related to GILTI in the financial statements.
The Act requires complex computations to be performed that were not previously required in U.S. tax law, judgments to be made in interpretation of the provisions of the Act, estimates in calculations, and the preparation and analysis of information not previously relevant or regularly produced. The U.S. Treasury Department, the Internal Revenue Service ("RS), and other standard-setting bodies could interpret or issue guidance on how provisions of the Tax Act will be applied or otherwise administered that is different from our current interpretation.
73
Commvault Systems, Inc.
Notes to Consolidated Financial Statements — (Continued)
(In thousands, except per share data)
Valuation Allowance
Net deferred tax assets arise due to the recognition of income and expense items for tax purposes, which differ from those used for financial statement purposes. ASC 740, Income Taxes, provides for the recognition of deferred tax assets if realization of such assets is more likely than not. In assessing the need for a valuation allowance in fiscal 2018, the Company considered all available objective and verifiable evidence both positive and negative, including historical levels of pre-tax income (loss) both on a consolidated basis and tax reporting entity basis, legislative developments, expectations and risks associated with estimates of future pre-tax income, and prudent and feasible tax planning strategies. As a result of this analysis, the Company determined that it is more likely than not that it will not realize the benefits of its gross deferred tax assets and therefore has recorded a valuation allowance to reduce the carrying value of these gross deferred tax assets, net of the impact of the reversal of taxable temporary differences, to
zero
.
The components of income (loss) before income taxes were as follows:
|
|
Year Ended March 31,
|
|||||||||||
|
|
2018
|
2017
|
2016
|
|||||||||
|
Domestic
|
$
|
(18,159
|
)
|
$
|
(7,860
|
)
|
$
|
(6,534
|
)
|
|||
|
Foreign
|
14,659
|
|
5,866
|
|
10,490
|
|
||||||
|
$
|
(3,500
|
)
|
$
|
(1,994
|
)
|
$
|
3,956
|
|
||||
The components of income tax expense (benefit) were as follows:
|
|
Year Ended March 31,
|
|||||||||||
|
|
2018
|
2017
|
2016
|
|||||||||
|
Current:
|
||||||||||||
|
Federal
|
$
|
(1,036
|
)
|
$
|
6,360
|
|
$
|
4,983
|
|
|||
|
State
|
(383
|
)
|
(958
|
)
|
1,076
|
|
||||||
|
Foreign
|
7,307
|
|
4,818
|
|
4,982
|
|
||||||
|
Deferred:
|
||||||||||||
|
Federal
|
57,582
|
|
(11,520
|
)
|
(9,137
|
)
|
||||||
|
State
|
(4,601
|
)
|
(80
|
)
|
334
|
|
||||||
|
Foreign
|
(469
|
)
|
(106
|
)
|
(2
|
)
|
||||||
|
$
|
58,400
|
|
$
|
(1,486
|
)
|
$
|
2,236
|
|
||||
74
Commvault Systems, Inc.
Notes to Consolidated Financial Statements — (Continued)
(In thousands, except per share data)
A reconciliation of the statutory tax rates and the effective tax rates for the years ended
March 31, 2018
,
2017
and
2016
are as follows:
|
|
Year Ended March 31,
|
||||||||
|
|
2018
|
2017
|
2016
|
||||||
|
Statutory federal income tax expense (benefit) rate
|
(31.6
|
)%
|
(35.0
|
)%
|
35.0
|
%
|
|||
|
State and local income tax expense, net of federal income tax effect
|
20.5
|
%
|
2.9
|
%
|
5.2
|
%
|
|||
|
Impact of limit on executive compensation
|
—
|
%
|
—
|
%
|
—
|
%
|
|||
|
Foreign earnings taxed at different rates
|
63.0
|
%
|
131.5
|
%
|
31.7
|
%
|
|||
|
Domestic permanent differences
|
65.6
|
%
|
96.6
|
%
|
54.5
|
%
|
|||
|
Foreign tax credits
|
(39.2
|
)%
|
(67.7
|
)%
|
(25.2
|
)%
|
|||
|
Research credits
|
(83.2
|
)%
|
(163.2
|
)%
|
(65.9
|
)%
|
|||
|
Tax reserves
|
(7.0
|
)%
|
4.1
|
%
|
4.1
|
%
|
|||
|
Valuation allowance
|
1,626.5
|
%
|
(31.8
|
)%
|
23.4
|
%
|
|||
|
Statutory tax rate changes
|
451.9
|
%
|
15.9
|
%
|
(9.4
|
)%
|
|||
|
Stock-based compensation
|
(377.6
|
)%
|
—
|
%
|
—
|
%
|
|||
|
Other differences, net
|
(20.3
|
)%
|
(27.8
|
)%
|
3.1
|
%
|
|||
|
Effective income tax expense (benefit)
|
1,668.6
|
%
|
(74.5
|
)%
|
56.5
|
%
|
|||
75
Commvault Systems, Inc.
Notes to Consolidated Financial Statements — (Continued)
(In thousands, except per share data)
The significant components of the Company’s deferred tax assets are as follows:
|
|
March 31,
|
|||||||
|
|
2018
|
2017
|
||||||
|
Deferred tax assets:
|
||||||||
|
Net operating losses
|
$
|
9,015
|
|
$
|
—
|
|
||
|
Equity investment
|
1,162
|
|
—
|
|
||||
|
Stock-based compensation
|
31,077
|
|
45,867
|
|
||||
|
Deferred revenue
|
12,670
|
|
11,810
|
|
||||
|
Tax credits
|
15,240
|
|
12,810
|
|
||||
|
Accrued expenses
|
1,400
|
|
1,249
|
|
||||
|
Allowance for doubtful accounts and other reserves
|
543
|
|
601
|
|
||||
|
Less: valuation allowance
|
(58,350
|
)
|
(1,796
|
)
|
||||
|
Total deferred tax assets
|
12,757
|
|
70,541
|
|
||||
|
Deferred tax liabilities:
|
||||||||
|
Depreciation and amortization
|
(6,172
|
)
|
(9,523
|
)
|
||||
|
Deferred commissions and other
|
(9,015
|
)
|
(10,790
|
)
|
||||
|
Total deferred tax liabilities
|
$
|
(15,187
|
)
|
$
|
(20,313
|
)
|
||
|
Net deferred tax asset (liability)
|
$
|
(2,430
|
)
|
$
|
50,228
|
|
||
It is the Company’s intention to reinvest undistributed earnings of its foreign subsidiaries and thereby infinitely postpone their remittance. In the event it needed to repatriate funds from outside of the United States, such repatriation would likely be subject to restrictions by local laws and/or tax consequences including foreign withholding taxes. It is not currently practical to estimate the legal restrictions or tax liability that would arise from such repatriations.
At
March 31, 2018
, the Company had a
$30,888
federal net operating loss that was generated during fiscal 2018. This net operating loss is allowed to be carryforward indefinitely and has no annual limitations on its utilization to offset future federal taxable income. The Company also had federal and state research tax credit (R&D credits) carryforwards of approximately
$3,468
and
$3,142
, respectively. The federal research tax credit carryforwards expire from
2025
through
2036
, and the state research tax credit carryforwards expire from
2018
through
2023
.
The Company conducts business globally and as a result, files income tax returns in the United States and in various state and foreign jurisdictions. In the normal course of business, the Company is subject to examination by taxing authorities throughout the world, including such major jurisdictions are the United States, Australia, Canada, Germany, Netherlands and United Kingdom. The following table summarizes the tax years in the Company’s major tax jurisdictions that remain subject to income tax examinations by tax authorities as of March 31, 2018. The years subject to income tax examination in the Company’s foreign jurisdictions cover the maximum time period with respect to these jurisdictions. Due to NOL carryforwards, in some cases the tax years continue to remain subject to examination with respect to such NOLs.
|
Tax Jurisdiction
|
Years Subject to Income
Tax Examination |
|
U.S. Federal
|
2014 - Present
|
|
Foreign jurisdictions
|
2013 - Present
|
76
Commvault Systems, Inc.
Notes to Consolidated Financial Statements — (Continued)
(In thousands, except per share data)
The calculation of the Company’s tax liabilities involves dealing with uncertainties in the application of complex tax regulations in each of its tax jurisdictions. The number of years with open tax audits varies depending on the tax jurisdiction. A number of years may lapse before a particular matter is audited and finally resolved. A reconciliation of the amounts of unrecognized tax benefits is as follows:
|
Balance at March 31, 2015
|
$
|
2,005
|
|
|
Additions for tax positions related to fiscal 2016
|
—
|
|
|
|
Additions for tax positions related to prior years
|
170
|
|
|
|
Settlements and effective settlements with tax authorities and remeasurements
|
(171
|
)
|
|
|
Reductions related to the expiration of statutes of limitations
|
(64
|
)
|
|
|
Foreign currency translation adjustment
|
12
|
|
|
|
Balance at March 31, 2016
|
1,952
|
|
|
|
Additions for tax positions related to fiscal 2017
|
—
|
|
|
|
Additions for tax positions related to prior years
|
179
|
|
|
|
Settlements and effective settlements with tax authorities and remeasurements
|
—
|
|
|
|
Reductions related to the expiration of statutes of limitations
|
—
|
|
|
|
Foreign currency translation adjustment
|
(33
|
)
|
|
|
Balance at March 31, 2017
|
2,098
|
|
|
|
Additions for tax positions related to fiscal 2018
|
—
|
|
|
|
Additions for tax positions related to prior years
|
150
|
|
|
|
Settlements and effective settlements with tax authorities and remeasurements
|
—
|
|
|
|
Reductions related to the expiration of statutes of limitations
|
(397
|
)
|
|
|
Foreign currency translation adjustment
|
(111
|
)
|
|
|
Balance at March 31, 2018
|
$
|
1,740
|
|
The Company estimates that
no
significant remaining unrecognized tax benefits will be realized during the fiscal year ending
March 31, 2019
. Interest and penalties related to unrecognized tax benefits are recorded in income tax expense. In the years ended
March 31, 2018
,
2017
and
2016
, the Company recognized
$80
,
$61
and
$52
, respectively, of interest and penalties in the Consolidated Statement of Operations.
11. Employee Benefit Plan
The Company has a defined contribution plan, as allowed under Section 401(k) of the Internal Revenue Code, covering substantially all employees. Effective January 1, 2012, the Company makes contributions equal to a discretionary percentage of the employee’s contributions determined by the Company. During the years ended
March 31, 2018
,
2017
and
2016
, the Company made contributions of
$2,959
,
$2,998
, and
$2,047
, respectively.
12. Segment Information
The Company operates in
one
segment. The Company’s products and services are sold throughout the world, through direct and indirect sales channels. The Company’s chief operating decision maker (the “CODM”) is the chief executive officer. The CODM makes operating performance assessment and resource allocation decisions on a global basis. The CODM does not receive discrete financial information about asset allocation, expense allocation or profitability by product or geography.
77
Commvault Systems, Inc.
Notes to Consolidated Financial Statements — (Continued)
(In thousands, except per share data)
Revenues by geography are based upon the billing address of the customer. All transfers between geographic regions have been eliminated from consolidated revenues. The following table sets forth revenue and long-lived assets by geographic area:
|
|
Year Ended March 31,
|
|||||||||||
|
|
2018
|
2017
|
2016
|
|||||||||
|
Revenue:
|
||||||||||||
|
United States
|
$
|
377,934
|
|
$
|
365,354
|
|
$
|
341,822
|
|
|||
|
Other
|
321,459
|
|
279,651
|
|
251,945
|
|
||||||
|
$
|
699,393
|
|
$
|
645,005
|
|
$
|
593,767
|
|
||||
No individual country other than the United States accounts for
10%
or more of revenues in the years ended
March 31, 2018
,
2017
and
2016
. Revenue included in the “Other” caption above primarily relates to the Company’s operations in Europe, Australia, Canada and Asia.
|
|
March 31,
|
|||||||
|
|
2018
|
2017
|
||||||
|
Long-lived assets:
|
||||||||
|
United States
|
$
|
145,918
|
|
$
|
131,083
|
|
||
|
Other
|
25,936
|
|
8,509
|
|
||||
|
$
|
171,854
|
|
$
|
139,592
|
|
|||
At
March 31, 2018
and
2017
no other individual country, other than the United States, accounts for
10%
or more of long-lived assets.
13. Selected Quarterly Financial Data (unaudited)
|
|
Quarter Ended
|
|||||||||||||||
|
|
June 30
|
September 30
|
December 31
|
March 31
|
||||||||||||
|
Fiscal 2018
|
||||||||||||||||
|
Total revenue
|
$
|
165,972
|
|
$
|
168,140
|
|
$
|
180,366
|
|
$
|
184,915
|
|
||||
|
Gross margin
|
144,311
|
|
144,873
|
|
155,409
|
|
156,648
|
|
||||||||
|
Net income (loss)
|
(284
|
)
|
(1,010
|
)
|
(58,945
|
)
|
(1,661
|
)
|
||||||||
|
Net income (loss) per common share:
|
||||||||||||||||
|
Basic (1)
|
$
|
(0.01
|
)
|
$
|
(0.02
|
)
|
$
|
(1.30
|
)
|
$
|
(0.04
|
)
|
||||
|
Diluted (1)
|
$
|
(0.01
|
)
|
$
|
(0.02
|
)
|
$
|
(1.30
|
)
|
$
|
(0.04
|
)
|
||||
|
|
Quarter Ended
|
|||||||||||||||
|
|
June 30
|
September 30
|
December 31
|
March 31
|
||||||||||||
|
Fiscal 2017
|
As Adjusted
|
|||||||||||||||
|
Total revenue
|
$
|
151,774
|
|
$
|
159,438
|
|
$
|
167,061
|
|
$
|
166,732
|
|
||||
|
Gross margin
|
130,779
|
|
137,781
|
|
145,895
|
|
145,358
|
|
||||||||
|
Net income (loss)
|
(2,610
|
)
|
(54
|
)
|
1,959
|
|
197
|
|
||||||||
|
Net income (loss) per common share:
|
||||||||||||||||
|
Basic (1)
|
$
|
(0.06
|
)
|
$
|
—
|
|
$
|
0.04
|
|
$
|
0.00
|
|
||||
|
Diluted (1)
|
$
|
(0.06
|
)
|
$
|
—
|
|
$
|
0.04
|
|
$
|
0.00
|
|
||||
|
(1)
|
Per common share amounts for the quarters and full year have been calculated separately. Accordingly, quarterly amounts do not add to the annual amount because of differences in the weighted average common shares outstanding during each period used in the basic and diluted calculations.
|
78
Commvault Systems, Inc.
Notes to Consolidated Financial Statements — (Continued)
(In thousands, except per share data)
14. Subsequent Event
On May 1, 2018, the Company announced governance and operational initiatives designed to support its new strategic transformation plan, called
Commvault Advance.
These initiatives included the following actions -
|
•
|
N. Robert Hammer and the Commvault Board of Directors have determined that it is the appropriate time to begin a search for a new CEO to lead the Company through its anticipated next stage of growth. The Commvault Board will appoint a search committee and will retain an executive search firm to assist with the external search. Mr. Hammer will continue to lead Commvault as Chairman, CEO and President until his successor is appointed. It is anticipated that Mr. Hammer will remain as Chairman of the Board after his successor is appointed.
|
|
•
|
The Commvault Board of Directors will appoint
two
new independent directors prior to the 2018 Annual Meeting of Shareholders. Upon these appointments, two existing Board members will resign, resulting in a Board that continues to be comprised of
11
directors.
|
|
•
|
Commvault’s Board has also formed an Operations Committee comprised of
two
existing independent directors and the
two
new directors, which will work closely with the Company’s management team on a comprehensive review of Commvault’s business to identify additional opportunities to further propel Commvault Advance and its profitable growth and value creation objectives. The Company will engage a leading outside consultant to work with the Operations Committee on this review.
|
|
•
|
A restructuring plan to increase efficiency in its sales, marketing and distribution functions as well as reduce costs across all functional areas of the Company. As part of this strategic initiative, the Company’s workforce will be reduced by approximately
4%
. The Company expects to incur total pre-tax charges of approximately
$6,000
to
$8,000
, most of which will be recognized in the first quarter of fiscal 2019. These restructuring charges relate primarily to severance and related costs associated with headcount reductions.
|
79
|
Item 9.
|
Changes In and Disagreements with Accountants on Accounting and Financial Disclosure
|
Not applicable
|
Item 9A.
|
Controls and Procedures
|
|
(a)
|
Evaluation of Disclosure Controls and Procedures
|
Our management, with the participation of the Chief Executive Officer and Chief Financial Officer, has evaluated the effectiveness of our disclosure controls and procedures, as defined in Rules 13a-15(e) and 15d-15(e) of the Securities Exchange Act of 1934, as of
March 31, 2018
. Based on that evaluation, the Chief Executive Officer and Chief Financial Officer concluded that our disclosure controls and procedures were effective as of
March 31, 2018
.
|
(b)
|
Management’s Report on Internal Control over Financial Reporting
|
Our management is responsible for establishing and maintaining adequate internal control over our financial reporting as defined in Rules 13a-15(f) of the Exchange Act. There are inherent limitations in the effectiveness of any internal control, including the possibility of human error and the circumvention or overriding of controls. Accordingly, even an effective internal control can provide only reasonable assurance with respect to financial statement preparation. Further, because of changes in conditions, the effectiveness of any internal control may vary over time.
Our management, with the participation of our principal executive officer and principal financial officer, has evaluated the effectiveness of our internal control over financial reporting as of
March 31, 2018
. In making this assessment, management used the framework set forth by the Committee of Sponsoring Organizations of the Treadway Commission (COSO) in the 2013 Internal Control—Integrated Framework.
Based on our assessment, using those criteria, our management concluded that, as of
March 31, 2018
, our internal control over financial reporting was effective. The effectiveness of our internal control over financial reporting as of
March 31, 2018
has been audited by Ernst & Young LLP, our independent registered public accounting firm, as stated in their report, which is included below in this Annual Report on Form 10-K.
|
(c)
|
Changes in Internal Control over Financial Reporting
|
There was no change in our internal control over financial reporting that occurred during the fourth quarter of fiscal
2018
that has materially affected, or is reasonably likely to materially affect, our internal control over financial reporting.
80
Report of Independent Registered Public Accounting Firm on Internal Control over Financial Reporting
To the Board of Directors and Stockholders of Commvault Systems, Inc.
Opinion on Internal Control over Financial Reporting
We have audited Commvault System, Inc.’s internal control over financial reporting as of March 31, 2018, based on criteria established in Internal Control-Integrated Framework issued by the Committee of Sponsoring Organizations of the Treadway Commission (2013 framework) (the COSO criteria). In our opinion, Commvault Systems, Inc. maintained, in all material respects, effective internal control over financial reporting as of March 31, 2018, based on the COSO criteria.
We have also audited, in accordance with the standards of the Public Company Accounting Oversight Board (United States) (PCAOB), the consolidated balance sheets of the Company as of March 31, 2018 and 2017, the related consolidated statements of operations, comprehensive (loss) income, stockholders' equity and cash flows for each of the three years in the period ended March 31, 2018, and the related notes and financial statement schedule listed in the Index at Item 15 and our report dated May 3, 2018 expressed an unqualified opinion thereon.
Basis for Opinion
The Company’s management is responsible for maintaining effective internal control over financial reporting and for its assessment of the effectiveness of internal control over financial reporting included in the accompanying Management’s Report on Internal Control over Financial Reporting. Our responsibility is to express an opinion on the Company’s internal control over financial reporting based on our audit. We are a public accounting firm registered with the PCAOB and are required to be independent with respect to the Company in accordance with the U.S. federal securities laws and the applicable rules and regulations of the Securities and Exchange Commission and the PCAOB.
We conducted our audit in accordance with the standards of the PCAOB. Those standards require that we plan and perform the audit to obtain reasonable assurance about whether effective internal control over financial reporting was maintained in all material respects.
Our audit included obtaining an understanding of internal control over financial reporting, assessing the risk that a material weakness exists, testing and evaluating the design and operating effectiveness of internal control based on the assessed risk, and performing such other procedures as we considered necessary in the circumstances. We believe that our audit provides a reasonable basis for our opinion.
Definition and Limitations of Internal Control Over Financial Reporting
A company’s internal control over financial reporting is a process designed to provide reasonable assurance regarding the reliability of financial reporting and the preparation of financial statements for external purposes in accordance with generally accepted accounting principles. A company’s internal control over financial reporting includes those policies and procedures that (1) pertain to the maintenance of records that, in reasonable detail, accurately and fairly reflect the transactions and dispositions of the assets of the company; (2) provide reasonable assurance that transactions are recorded as necessary to permit preparation of financial statements in accordance with generally accepted accounting principles, and that receipts and expenditures of the company are being made only in accordance with authorizations of management and directors of the company; and (3) provide reasonable assurance regarding prevention or timely detection of unauthorized acquisition, use, or disposition of the company’s assets that could have a material effect on the financial statements.
Because of its inherent limitations, internal control over financial reporting may not prevent or detect and correct misstatements. Also, projections of any evaluation of effectiveness to future periods are subject to the risk that controls may become inadequate because of changes in conditions, or that the degree of compliance with the policies or procedures may deteriorate.
/s/ Ernst & Young
Iselin, New Jersey
May 3, 2018
81
|
Item 9B.
|
Other Information
|
Not applicable
|
Item 10.
|
Directors, Executive Officers and Corporate Governance
|
We will furnish to the SEC a definitive Proxy Statement not later than 120 days after the close of the fiscal year ended March 31,
2018
. Information with respect to this Item is incorporated herein by reference from our
2018
Proxy Statement, including in the sections captioned, “Our Board of Directors” and “Corporate Governance”.
Our Board of Directors has adopted a code of business ethics and conduct, which applies to all our employees. The code of business ethics and conduct is in addition to our code of ethics for senior financial officers. The full texts of our code of business ethics and conduct and our code of ethics for senior financial officers can be found on our website, www.commvault.com.
|
Item 11.
|
Executive Compensation
|
Information with respect to this Item is incorporated herein by reference from our
2018
Proxy Statement, including in the section captioned “Compensation Discussion and Analysis”.
|
Item 12.
|
Security Ownership of Certain Beneficial Owners and Management and Related Stockholder Matters
|
Information with respect to this Item is incorporated herein by reference from our
2018
Proxy Statement, including in the section captioned “Security Ownership of Certain Beneficial Ownership and Management”.
Securities Authorized for Issuance under Equity Compensation Plans
The following table provides information as of March 31,
2018
with respect to the shares of our common stock that may be issuable upon the exercise of options, warrants and rights under or existing equity compensation plans. The following information is as of March 31,
2018
:
|
Number of Securities to be
Issued Upon Exercise of
Outstanding Options,
Warrants and Rights
(a)
|
Weighted-Average
Exercise Price of
Outstanding
Options, Warrants
and Rights
(b)
|
Number of Securities
Remaining Available for
Future Issuance Under Equity
Compensation Plans (Excluding
Securities Reflected in
Column (a))
(c)
(2)
|
||||||||
|
Equity compensation plans approved by security holders(1)
|
6,568,000
|
|
$
|
50.45
|
|
1,742,000
|
|
|||
|
Equity compensation plans not approved by security holder
|
—
|
|
—
|
|
—
|
|
||||
|
Totals
|
6,568,000
|
|
$
|
50.45
|
|
1,742,000
|
|
|||
|
(1)
|
Consists of shares of common stock to be issued upon exercise of outstanding options and vesting of restricted stock awards under our Omnibus Incentive Plan. These amounts do not include potentially issuable shares under the Employee Stock Purchase Plan. The company has reserved 2,166,000 shares for the future issuance of shares under the Employee Stock Purchase Plan.
|
82
|
Item 13.
|
Certain Relationships and Related Transactions, and Director Independence
|
Information with respect to this Item is incorporated herein by reference from our
2018
Proxy Statement, including in the section captioned, “Transactions with Related Persons”.
|
Item 14.
|
Principal Accountant Fees and Services
|
Information with respect to this Item is incorporated herein by reference from our
2018
Proxy Statement, including in the sections captioned “Audit, Audit-related, Tax and All Other Fees”.
|
Item 15.
|
Exhibits and Financial Statement Schedules
|
Financial Statements
See “Index to Consolidated Financial Statements” set forth in Item 8 for a list of financial statements filed as part of this report.
Financial Statement Schedules
The following financial statement schedule should be read in conjunction with the Consolidated Financial Statements set forth in Item 8 and appears below:
Schedule II — Valuation and Qualifying Accounts for the years ended
March 31, 2016
,
2017
and
2018
.
All other schedules are omitted because they are not required or the required information is shown in the financial statements or notes thereto.
Schedule II — Valuation and Qualifying Accounts
|
Balance at
Beginning of
Year
|
Charged
(Credited) to
Costs and
Expenses
|
Deductions
|
Balance at
End of
Year
|
|||||||||||||
|
|
(In thousands)
|
|||||||||||||||
|
Year Ended March 31, 2016
|
||||||||||||||||
|
Allowance for doubtful accounts
|
$
|
104
|
|
$
|
247
|
|
$
|
36
|
|
$
|
315
|
|
||||
|
Valuation allowance for deferred taxes
|
$
|
1,343
|
|
$
|
1,429
|
|
$
|
—
|
|
$
|
2,772
|
|
||||
|
Year Ended March 31, 2017
|
||||||||||||||||
|
Allowance for doubtful accounts
|
$
|
315
|
|
$
|
(161
|
)
|
$
|
51
|
|
$
|
103
|
|
||||
|
Valuation allowance for deferred taxes
|
$
|
2,772
|
|
$
|
(976
|
)
|
$
|
—
|
|
$
|
1,796
|
|
||||
|
Year Ended March 31, 2018
|
||||||||||||||||
|
Allowance for doubtful accounts
|
$
|
103
|
|
$
|
25
|
|
$
|
24
|
|
$
|
104
|
|
||||
|
Valuation allowance for deferred taxes
|
$
|
1,796
|
|
$
|
56,554
|
|
$
|
—
|
|
$
|
58,350
|
|
||||
83
Exhibits
The following exhibits are incorporated by reference or filed herewith.
|
Exhibit No.
|
Description
|
|
Amended and Restated Certificate of Incorporation of Commvault Systems, Inc. (Incorporated by reference to Exhibit 3.1 to Registrant’s Registration Statement on Form S-1, Commission File No. 333-132550).
|
|
|
Amended and Restated Bylaws of Commvault Systems, Inc. (Incorporated by reference to Exhibit 3.1 to the Registrant’s Form 8-K dated April 25, 2014).
|
|
|
Certification of Designation of Series A Junior Participating Preferred Stock of Commvault Systems, Inc. (Incorporated by reference to Exhibit 3.1 to Registrant’s Form 8-K dated November 14, 2008).
|
|
|
Form of Common Stock Certificate (Incorporated by reference to Exhibit 4.1 to the Registrant’s Registration Statement on Form S-1, Commission File No. 333-132550).
|
|
|
Rights Agreement between Commvault Systems, Inc. and Registrar and Transfer Company (Incorporated by reference to Exhibit 4.1 to Registrant’s Form 8-K dated November 14, 2008).
|
|
|
Form of Voting Trust Agreement (Incorporated by reference to Exhibit 9.1 to the Registrant’s Registration Statement on Form S-1, Commission File No. 333-132550).
|
|
|
Form of Non-Qualified Stock Option Agreement (Incorporated by reference to Exhibit 10.4 to the Registrant’s Registration Statement on Form S-1, Commission File No. 333-132550).
|
|
|
Form of Restricted Stock Unit Agreement (Incorporated by reference to Exhibit 10.5 to the Registrant’s Annual Report on Form 10-K for the year ended March 31, 2007).
|
|
|
Employment Agreement, dated as of February 1, 2004, between Commvault Systems, Inc. and N. Robert Hammer (Incorporated by reference to Exhibit 10.5 to the Registrant’s Registration Statement on Form S-1, Commission File No. 333-132550).
|
|
|
Form of Employment Agreement between Commvault Systems, Inc. and Alan G. Bunte and Louis F. Miceli (Incorporated by reference to Exhibit 10.6 to the Registrant’s Registration Statement on Form S-1, Commission File No. 333-132550).
|
|
|
Form of Corporate Change of Control Agreement between Commvault Systems, Inc. and Alan G. Bunte and Louis F. Miceli (Incorporated by reference to Exhibit 10.7 to the Registrant’s Registration Statement on Form S-1, Commission File No. 333-132550).
|
|
|
Form of Corporate Change of Control Agreement between Commvault Systems, Inc. and Brian Carolan, and Ron Miiller (Incorporated by reference to Exhibit 10.8 to the Registrant’s Registration Statement on Form S-1, Commission File No. 333-132550).
|
|
|
Form of Indemnity Agreement between Commvault Systems, Inc. and each of its current officers and directors (Incorporated by reference to Exhibit 10.9 to the Registrant’s Registration Statement on Form S-1, Commission File No. 333-132550).
|
|
|
Commvault Systems, Inc. Employee Stock Purchase Plan dated December 9, 2013 (Incorporated by reference to Exhibit 10.10 to the Registrant’s Annual Report on Form 10-K for the year ended March 31, 2014).
|
|
|
Commvault Systems, Inc. Omnibus Incentive Plan Commvault Systems, Inc. Omnibus Incentive Plan (Incorporated by reference to Exhibit 10.12 to the Registrant’s Registration Statement on Form S-8, Commission File No. 333-213211).
|
|
|
The Commvault Systems, Inc. Omnibus Incentive Plan (As Amended Through the First Amendment Thereof) (Incorporated by reference to Exhibit 10.1 to the Registrant’s Form 8-K dated August 25, 2017)
|
|
|
*
|
Management contract or compensatory plan or arrangement.
|
84
|
Exhibit No.
|
Description
|
|
List of Subsidiaries of Commvault Systems, Inc.
|
|
|
Consent of Ernst & Young LLP
|
|
|
Certification of Chief Executive Officer Pursuant to Section 302 of the Sarbanes-Oxley Act of 2002
|
|
|
Certification of Chief Financial Officer Pursuant to Section 302 of the Sarbanes-Oxley Act of 2002
|
|
|
Certification of Chief Executive Officer Pursuant to Section 906 of the Sarbanes-Oxley Act of 2002
|
|
|
Certification of Chief Financial Officer Pursuant to Section 906 of the Sarbanes-Oxley Act of 2002
|
|
|
101.INS
|
XBRL Instance Document
|
|
101.SCH
|
XBRL Taxonomy Extension Schema Document
|
|
101.CAL
|
XBRL Taxonomy Extension Calculation Linkbase Document
|
|
101.DEF
|
XBRL Taxonomy Extension Definition Linkbase Document
|
|
101.LAB
|
XBRL Taxonomy Extension Label Linkbase Document
|
|
101.PRE
|
XBRL Taxonomy Extension Presentation Linkbase Document
|
85
|
Item 16.
|
Form 10-K Summary
|
None.
86
SIGNATURES
Pursuant to the requirements of Section 13 or 15(d) of the Securities Act of 1934, the registrant has duly caused this report to be signed on its behalf by the undersigned, thereunto duly authorized, in the city of Tinton Falls, State of New Jersey, on
May 3, 2018
.
|
COMMVAULT SYSTEMS, INC.
|
|
|
By:
|
/s/ N. ROBERT HAMMER
|
|
N. Robert Hammer
|
|
|
Chairman, President and Chief Executive Officer
|
|
Pursuant to the requirements of the Securities Exchange Act of 1934, this report has been signed by the following persons on behalf of the registrant and in the capacities indicated on
May 3, 2018
.
|
Signature
|
|
Title
|
|
/s/ N. ROBERT HAMMER
|
|
Chairman, President and Chief Executive Officer
|
|
N. Robert Hammer
|
||
|
/s/ BRIAN CAROLAN
|
|
Vice President, Chief Financial Officer
|
|
Brian Carolan
|
||
|
/s/ GARY MERRILL
|
|
Vice President, Chief Accounting Officer
|
|
Gary Merrill
|
||
|
/s/ ALAN G. BUNTE
|
|
Director
|
|
Alan G. Bunte
|
||
|
/s/ JOSEPH F. EAZOR
|
|
Director
|
|
Joseph F. Eazor
|
||
|
/s/ FRANK J. FANZILLI, JR.
|
|
Director
|
|
Frank J. Fanzilli, Jr.
|
||
|
/s/ ARMANDO GEDAY
|
|
Director
|
|
Armando Geday
|
||
|
/s/ KEITH GEESLIN
|
|
Director
|
|
Keith Geeslin
|
||
|
/s/ F. ROBERT KURIMSKY
|
|
Director
|
|
F. Robert Kurimsky
|
||
|
/s/ VIVIE LEE
|
|
Director
|
|
Vivie Lee
|
||
|
/s/ DANIEL PULVER
|
|
Director
|
|
Daniel Pulver
|
||
|
/s/ GARY SMITH
|
|
Director
|
|
Gary Smith
|
||
|
/s/ DAVID F. WALKER
|
|
Director
|
|
David F. Walker
|
||
87
TABLE OF CONTENTS
Part IItem 1. BusinessItem 1A. Risk FactorsItem 1B. Unresolved Staff CommentsItem 2. PropertiesItem 3. Legal ProceedingsItem 4. Mine Safety DisclosuresPart IIItem 5. Market For Registrant S Common Equity, Related Stockholder Matters and Issuer Purchases Of Equity SecuritiesItem 6. Selected Financial DataItem 7. Management S Discussion and Analysis Of Financial Condition and Results Of OperationsItem 7A. Quantitative and Qualitative Disclosures About Market RiskItem 8. Financial Statements and Supplementary DataItem 9. Changes in and Disagreements with Accountants on Accounting and Financial DisclosureItem 9A. Controls and ProceduresItem 9B. Other InformationPart IIIItem 10. Directors, Executive Officers and Corporate GovernanceItem 11. Executive CompensationItem 12. Security Ownership Of Certain Beneficial Owners and Management and Related Stockholder MattersItem 13. Certain Relationships and Related Transactions, and Director IndependenceItem 14. Principal Accountant Fees and ServicesPart IVItem 15. Exhibits and Financial Statement SchedulesItem 16. Form 10-k Summary