CEL SCI CORP
10-Ks and 10-Qs
|
|
|
|
|
|
|
|
|
|
|
|
|
|
|
|
|
|
|
|
|
|
|
|
|
|
|
|
|
|
|
|
|
|
|
|
|
|
|
|
|
|
|
|
|
|
|
|
|
|
|
|
|
|
|
|
|
|
|
|
|
|
SECURITIES AND EXCHANGE COMMISSION
Washington, D.C. 20549
FORM 10-K
(Mark One)
þ
ANNUAL REPORT PURSUANT TO SECTION 13 OR 15(d) OF THE SECURITIES EXCHANGE ACT OF 1934
For the fiscal year ended
September 30, 2011.
o
TRANSITION REPORT PURSUANT TO SECTION 13 OR 15(d) OF THE SECURITIES EXCHANGE ACT OF 1934
For the transition period from _________ to __________.
Commission file number
1-11889
CEL-SCI CORPORATION
(Exact name of registrant as specified in its charter)
| COLORADO | 84-0916344 | |
| (State or other jurisdiction of incorporation or organization) | (I.R.S. Employer Identification No.) | |
|
8229 Boone Blvd., Suite 802
Vienna, Virginia
|
22182 | |
| (Address of principal executive offices) | (Zip Code) | |
Registrant's telephone number, including area code: (703) 506-9460
Securities registered pursuant to Section 12(b) of the Act: None
Securities registered pursuant to Section 12(g) of the Act:
Common Stock, $.01 par value
(Title of Class)
Indicate by check mark if the registrant is a well-known seasoned issuer, as defined in Rule 405 of the Securities Act.
o
Indicate by check mark if the registrant is not required to file reports pursuant to Section 13 or Section 15(d) of the Act.
o
Indicate by check mark whether the registrant (1) has filed all reports to be filed by Section 13 or 15(d) of the Securities Exchange Act of 1934 during the preceding 12 months (or for such shorter period that the registrant was required to file such reports), and (2) has been subject to such filing requirements for the past 90 days. Yes
þ
No
o
Indicate by check mark whether the registrant has submitted electronically and posted on its corporate Web site, if any, every Interactive Data File required to be submitted and posted pursuant to Rule 405 of Regulation S-T (§232.405 of this chapter) during the preceding 12 months (or for such shorter period that the registrant was required to submit and post such files). Yes
þ
No
o
Indicate by check mark if disclosure of delinquent filers pursuant to Item 405 of Regulation S-K is not contained herein, and will not be contained, to the best of Registrant's knowledge, in definitive proxy or information statements incorporated by reference in Part III of this Form 10-K or any amendment to this Form 10-K.
þ
Indicate by check mark whether the registrant is a large accelerated filer, an accelerated filer, a non-accelerated filer, or a smaller reporting company. See the definitions of “large accelerated filer,” “accelerated filer” and “smaller reporting company” in Rule 12b-2 of the Exchange Act.
| Large accelerated filer | o | Accelerated filer | o |
| Non-accelerated filer | o | Smaller reporting company | þ |
| (Do not check if a smaller reporting company) |
Indicate by check mark whether the registrant is a shell company (as defined in Rule 12b-2 of the Exchange Act):
o
Yes
þ
No
The aggregate market value of the voting stock held by non-affiliates of the Registrant, based upon the closing sale price of the common stock on March 31, 2011, as quoted on the NYSE Amex, was $127,184,966.
As of December 9, 2011, the Registrant had 229,889,691 issued and outstanding shares of common stock.
Documents Incorporated by Reference: None
CEL-SCI Corporation (CEL-SCI) was formed as a Colorado corporation in 1983. CEL-SCI’s principal office is located at 8229 Boone Boulevard, Suite 802, Vienna, VA 22182. CEL-SCI’s telephone number is 703-506-9460 and its web site is www.cel-sci.com. CEL-SCI makes its electronic filings with the Securities and Exchange Commission (SEC), including its annual reports on Form 10-K, quarterly reports on Form 10-Q, current reports on Form 8-K and amendments to these reports available on its website free of charge as soon as practicable after they are filed or furnished to the SEC.
OVERVIEW
CEL-SCI’s business consists of the following:
|
|
1)
|
Multikine® (Leukocyte Interleukin, Injection) investigational cancer therapy;
|
|
|
2)
|
LEAPS technology, with two products, pandemic flu treatment for hospitalized patients and CEL-2000, a rheumatoid arthritis treatment vaccine, in development.
|
MULTIKINE
CEL-SCI’s lead investigational therapy, Multikine (Leukocyte Interleukin, Injection), is currently being developed as a potential therapeutic agent directed at using the immune system to produce an anti-tumor immune response. Data from Phase I and Phase II clinical trials suggest Multikine has the potential to directly affect the tumor cells. These data also indicate that it appears to activate the patient’s own anti-tumor immune response. Multikine (Leukocyte Interleukin, Injection) is the full name of this investigational therapy, which, for simplicity, is referred to in the remainder of this document as Multikine. Multikine is the trademark that CEL-SCI has registered for this investigational therapy, and this proprietary name is subject to FDA review in connection with our future anticipated regulatory submission for approval. Multikine has not been licensed or approved by the FDA or any other regulatory agency. Neither has its safety or efficacy been established for any use.
CEL-SCI’s lead investigational therapy, Multikine, is cleared for a Phase III clinical trial in advanced primary head and neck cancer. It has received a go-ahead by the US FDA as well as the Canadian, Polish, Hungarian, Russian, Israeli, Indian and Taiwanese regulators.
It is also thought to be the first Phase III study in the world in which immunotherapy is given to cancer patients first, i.e., prior to their receiving any conventional treatment for cancer, including surgery, radiation and/or chemotherapy. This could be shown to be important because conventional therapy may weaken the immune system, and may compromise the potential effect of immunotherapy. Because Multikine is given before conventional cancer therapy, when the immune system may be more intact, we believe the possibility exists for it to have a greater likelihood of activating an anti-tumor immune response under these conditions. This likelihood is one of the clinical aspects being evaluated in the ongoing global Phase III clinical trial.
2
Multikine is a different kind of investigational therapy in the fight against cancer; Multikine is a defined mixture of cytokines. It is a combination immunotherapy, possessing both active and passive properties.
During the early investigational phase, in Phase I and Phase II clinical trials in over 220 subjects who received the investigational therapy Multikine in daily doses of 200 to 3200 IU as IL-2, no serious adverse events were reported as being expressly due to administration of this investigational therapy Multikine. The most frequently reported adverse events included pain at the injection site, local minor bleeding and edema at the injection site, diarrhea, headache, nausea, and constipation. No "abnormal" laboratory results were reported following Multikine treatment - other than those commonly seen by treating physicians in this patient population - regardless of Multikine administration. Similarly, in these early-phase clinical studies in patients, there was no reported increased toxicity of follow-on treatments as a result of Multikine administration. No complications following surgery (such as increased time for wound healing) were reported. No definitive conclusions can be drawn from these data about the safety or efficacy profile of this investigational therapy, and further research is required and the global Phase III study is ongoing in an effort to confirm these results. Potential conclusions could only be drawn if the initial observations in the early-phase studies relating to the potential adverse events associated with Multikine administration and its potential efficacy in treating head and neck cancer are confirmed in the well-controlled Multikine Phase III clinical study, CEL-SCI's Phase III efficacy study is completed successfully, and the FDA licenses the product following their review of all of the data related to Multikine submitted in CEL-SCI's license application.
Currently, Multikine has not yet been licensed or approved for sale, barter or exchange by the FDA or by any other regulatory agency. Similarly, its safety or efficacy has not been established for any use.
The following is a summary of results from CEL-SCI’s last Phase II study conducted with Multikine. This study used the same treatment protocol as will be used in CEL-SCI’s Phase III study:
|
●
|
Phase II clinical trials:
In the final Phase II clinical study, using the same dosages and Multikine treatment regimen as is being used in the Phase III study, head and neck cancer patients with locally advanced primary disease who received the investigational therapy Multikine as first-line therapy followed by surgery and radiotherapy were reported by the clinical investigators to have had a 63.2% overall survival (OS) rate at 3.5 years from surgery. This percentage OS was arrived at as follows: of the 22 subjects enrolled in this final Phase II study, the consent for the survival follow-up portion of the study was received from 19 subjects. One subject did not consent to the follow-up portion of the study. The other 2 subjects did not have squamous cell carcinoma of the oral cavity and were thus not evaluable per the protocol. The overall survival rate of subjects receiving the investigational therapy in this study was compared to the overall survival rate that was calculated based upon a review of 55 clinical trials conducted in the same cancer population with a total of 7294 subjects patients studied, which were reported in the peer reviewed scientific literature between 1987 and 2007. Review of this literature showed an approximate survival rate of 47.5% at 3.5 year from treatment. Therefore, the results of CEL-SCI’s final Phase II study were considered to be potentially favorable in terms of overall survival recognizing the limitations of this early-phase study. It should be noted that an earlier investigational therapy Multikine study appears to lend support to the overall survival findings described above – Feinmesser et al Arch Otolaryngol. Surg. 2003. However, no definitive conclusions can be drawn from these data about the potential efficacy or safety profile of this investigational therapy. Moreover, further research is required, and these results must be confirmed in the well-controlled Phase III clinical trial of this investigational therapy that is currently in progress. Subject to completion of that Phase III trial and FDA's review and acceptance of CEL-SCI's entire data set on this investigational therapy, CEL-SCI believes that these early-stage clinical trial results indicate the potential for this investigational therapy to become a treatment for advanced primary head and neck cancer.
|
3
The primary clinical endpoint in CEL-SCI's ongoing Phase III clinical trial specifies that a 10% improvement in overall survival in the Multikine treatment arm plus the current standard of care (SOC - consists of surgery + radiotherapy or surgery + radiochemotherapy) over that which can be achieved in the SOC arm alone must be achieved in order to meet the primary endpoint of the Phase III study. Based on what is presently known about the current survival statistics for this population, CEL-SCI believes that achievement of this endpoint should enable CEL-SCI, subject to further consultations with FDA, to move forward, prepare and submit a Multikine Biologic License Application for marketing approval to FDA.
|
●
|
Reported average of 50% reduction in tumor cells in Phase II trials:
The clinical investigators who administered the 3 week Multikine treatment regimen used in Phase II studies reported that, as was determined in a controlled pathology study, Multikine administration appeared to have caused, on average, the disappearance of about half of the cancer cells present at surgery (as determined by histopathology assessing the area of Stroma/Tumor (Mean+/- Standard Error of the Mean of the number of cells counted per filed)) even before the start of standard therapy with radiation and chemotherapy (Timar et al JCO 2005).
|
|
●
|
Reported 12% complete response in the final Phase II trial:
The clinical investigators who administered the 3 week Multikine investigational treatment regimen used in the Phase II study reported that, as was determined in a controlled pathology study, the tumor apparently was no longer present in approximately 12 % of patients (2 of 17 evaluable by pathology). This determination was made by three blinded pathologists from the surgical specimen after a 3 week treatment with Multikine (Timar et al JCO 2005).
|
|
●
|
Adverse events reported in clinical trials:
In clinical trials conducted to date with the Multikine investigational therapy, adverse events which have been reported by the clinical investigators as possibly or probably related to Multikine administration included pain at the injection site, local minor bleeding and edema at the injection site, diarrhea, headache, nausea, and constipation.
|
The clinical significance of these and other data, to date, from the multiple Multikine clinical trials is not yet known. These preliminary clinical data do suggest the potential to demonstrate a possible improvement in the clinical outcome for patients treated with Multikine. However, no definitive conclusions can be drawn from these data about the safety or efficacy profile of this investigational therapy, and further research is required and the global Phase III study is ongoing in an effort to confirm these results.
4
Multikine has been cleared for a global Phase III trial in advanced primary head and neck cancer. It has received a go-ahead by the US FDA as well as the Canadian, Polish, Hungarian, Russian, Israeli, Indian and Taiwanese regulators.
The trial will test the hypothesis that Multikine treatment administered prior to the current standard therapy for head and neck cancer patients (surgical resection of the tumor and involved lymph nodes followed by radiotherapy or radiotherapy and concurrent chemotherapy) will extend the overall survival, enhance the local/regional control of the disease and reduce the rate of disease progression in patients with advanced oral squamous cell carcinoma.
In November 2000, CEL-SCI entered into an agreement with Orient Europharma of Taiwan which provides Orient Europharma with the exclusive marketing rights to Multikine for all cancer indications in Taiwan, Singapore, Hong Kong and Malaysia. In December 2008, the agreement was expanded to include South Korea, the Philippines, Australia and New Zealand. The agreement requires Orient Europharma to fund the clinical trials needed to obtain marketing approvals in these countries for head and neck cancer, naso-pharyngeal cancer and potentially cervical cancer.
Pursuant to an agreement dated May 2003, Eastern Biotech is due a royalty equal to 2% of CEL-SCI’s net sales worldwide of Multikine and CEL-1000 prior to May 30, 2033.
In August 2008, CEL-SCI entered into an agreement with Teva Pharmaceutical Industries, Ltd., which provides Teva with the exclusive license to market and distribute CEL-SCI’s cancer drug Multikine in Israel, Turkey, and in August 2011, added Serbia and Croatia. Pursuant to the agreement, Teva will participate in CEL-SCI’s upcoming Phase III clinical trial and will fund a portion of the Phase III trial in Israel.
In March 2009, CEL-SCI entered into a licensing agreement with Byron Biopharma LLC (“Byron”) under which CEL-SCI granted Byron an exclusive license to market and distribute Multikine in the Republic of South Africa.
Pursuant to the agreement, Byron will be responsible for registering the product in South Africa. Once Multikine has been approved for sale, CEL-SCI will be responsible for manufacturing the product, while Byron will be responsible for sales in South Africa. Revenues will be divided equally between CEL-SCI and Byron. To maintain the license Byron, among other requirements, was required to pay $125,000 to CEL-SCI before March 15, 2010. Byron made the $125,000 payment on March 8, 2010.
In August 2011, CEL-SCI entered into an exclusive Sales, Marketing and Distribution agreement with IDC-GP Pharm LLC (“IDC-GP Pharm”) under which CEL-SCI has granted IDC-GP Pharm an exclusive license to market Multikine in the countries of Argentina and Venezuela (the “Territory”). IDC-GP Pharm is a Joint Venture between two groups of experienced pharmaceutical entrepreneurs with expertise in the registration and commercialization of pharmaceutical products in South America, among other regions. One of these two groups represents former employees of a large pharmaceutical company, while the other group is GP Pharm, headquartered in Barcelona, Spain, with operations in each major country in Latin America either directly or through local partners. Pursuant to the agreement, IDC-GP Pharm will be responsible for receiving regulatory approval to use Multikine in the territory. Once Multikine has been approved in either of the two countries, CEL-SCI will be responsible for manufacturing the product, while IDC-GP Pharm will be responsible for sales in the Territory. Revenues will be split 50/50 between CEL-SCI and IDC-GP Pharm after payment to CEL-SCI for the manufacturing costs of Multikine.
5
Before starting the Phase III trial, CEL-SCI needed to build a dedicated manufacturing facility to produce Multikine. This facility has been completed and validated, and has produced several clinical lots for the Phase III clinical trial. CEL-SCI estimates the cost of the Phase III trial, with the exception of the parts that will be paid by its licensees, Teva Pharmaceuticals and Orient Europharma, to be approximately $26,000,000. Out of the planned 48 sites 35 sites have completed their site initiation visits and patients are being screened/enrolled in several places.
Manufacturing Facility
CEL-SCI
completed validation of its new manufacturing facility in January 2010. The state-of-the-art facility is being used to manufacture Multikine for CEL-SCI’s Phase III clinical trial. In addition to using this facility to manufacture Multikine, CEL-SCI, only if the facility is not being used for Multikine, may offer the use of the facility as a service to pharmaceutical companies and others, particularly those that need to “fill and finish” their drugs in a cold environment (4 degrees Celsius, or approximately 39 degrees Fahrenheit), however, priority will always be given to Multikine. Fill and finish is the process of filling injectable drugs in a sterile manner and is a key part of the manufacturing process for many medicines.
The fastest area of growth in the biopharmaceutical and pharmaceutical markets is biologics, and most recently stem cell products. These compounds and therapies are derived from or mimic human cells or proteins and other molecules (e.g., hormones, etc.). Nearly all of the major drugs developed for unmet medical needs (e.g., Avastin
®
, Erbitux
®
, Rituxan
®
, Herceptin
®
, Copaxon
®
, etc.) are biologics. Biologics are usually very sensitive to heat and quickly lose their biological activity if exposed to room or elevated temperature. Room or elevated temperatures may also affect the shelf-life of a biologic with the result that the product cannot be stored for as long as desired. However, these products do not generally lose activity when kept at 4 degrees Celsius.
The FDA and other regulatory agencies require a drug developer to demonstrate the safety, purity and potency of a drug being produced for use in humans. When filling a product at 4 degrees Celsius, minimal to no biological losses occur and therefore the potency of the drug is maintained throughout the final critical step of the drug’s manufacturing process. If the same temperature sensitive drug is instead aseptically filled at room temperature, expensive and time-consuming validation studies must be conducted, first, to be able to obtain a complete understanding of the product’s potency loss during the room temperature fill process, and second, to create solutions to the drug’s potency losses, which require further testing and validation.
CEL-SCI’s unique, cold aseptic filling suite can be operated at temperatures between 2 degrees Celsius and room temperatures, and at various humidity levels. CEL-SCI’s aseptic filling suites are maintained at FDA and EU ISO classifications of 5/6. CEL-SCI also has the capability to formulate, inspect, label and package biologic products at cold temperatures.
CEL-SCI’s lease on the manufacturing facility expires on October 31, 2028. Since October 2008 CEL-SCI has been required to make monthly base rent payments of $131,250. Beginning October 31, 2009, the annual base rent escalates each year at 3%. CEL-SCI is also required to pay all real and personal property taxes, insurance premiums, maintenance expenses, repair costs and utilities associated with the building, which were approximately $33,000 per month as of October 15, 2011.
6
In December 2008, CEL-SCI was not in compliance with certain lease requirements (i.e., failure to pay an installment of rent). However, the landlord did not declare CEL-SCI formally in default under the terms of the lease and renegotiated the lease. In January 2009, as part of an amended lease agreement, CEL-SCI repriced the 3,000,000 warrants issued to the landlord in July 2007 at $1.25 per share and which were to expire on July 12, 2013. These warrants were repriced at $0.75 per share and now expire on January 26, 2014. In addition, 787,500 additional warrants were issued to the landlord. The warrants are exercisable at a price of $0.75 per share and expire on January 26, 2014. In 2009 CEL-SCI issued the landlord an additional 2,296,875 warrants in accordance with the amendment to the lease. In August 2011, CEL-SCI was required to deposit the equivalent of one year’s base rent in accordance with the contract. The $1,670,917 was required to be deposited when CEL-SCI’s cash position fell below the amount stipulated in the lease.
LEAPS
CEL-SCI’s patented T-cell Modulation Process, referred to as LEAPS (Ligand Epitope Antigen Presentation System), uses “heteroconjugates” to direct the body to choose a specific immune response. LEAPS is designed to potentially stimulate the human immune system to more effectively fight bacterial, viral and parasitic infections as well as autoimmune, allergies, transplantation rejection and cancer, when it cannot do so on its own. Administered like vaccines, LEAPS combines T-cell binding ligands with small, disease associated, peptide antigens and may provide a new method to treat and prevent certain diseases.
The ability to generate a specific immune response is important because many diseases are often not combated effectively due to the body’s selection of the “inappropriate” immune response. The capability to specifically reprogram an immune response may offer a more effective approach than existing vaccines and drugs in attacking an underlying disease.
Using the LEAPS technology, CEL-SCI has created a potential peptide treatment for H1N1 (swine flu) hospitalized patients. This LEAPS flu treatment is designed to focus on the conserved, non-changing epitopes of the different strains of Type A Influenza viruses (H1N1, H5N1, H3N1, etc.), including “swine”, “avian or bird”, and “Spanish Influenza”, in order to minimize the chance of viral “escape by mutations” from immune recognition. Therefore one should think of this treatment not really as an H1N1 treatment, but as a pandemic flu treatment. CEL-SCI’s LEAPS flu treatment contains epitopes known to be associated with immune protection against influenza in animal models.
On September 16, 2009, the U.S. Food and Drug Administration advised CEL-SCI that it could proceed with its first clinical trial to evaluate the effect of LEAPS-H1N1 treatment on the white blood cells of hospitalized H1N1 patients. This followed an expedited initial review of CEL-SCI's regulatory submission for this study proposal.
On November 6, 2009, CEL-SCI announced that The Johns Hopkins University School of Medicine had given clearance for CEL-SCI’s first clinical study to proceed using LEAPS-H1N1. Soon after the start of the study, the number of hospitalized H1N1 patients dramatically declined and the study has been unable to complete the enrollment of patients. If the disease reemerges, then CEL-SCI may be able to continue the study.
7
This pandemic flu work is being pursued in collaboration with the National Institute of Allergy and Infectious Diseases (NIAID), part of the National Institutes of Health, USA. In May 2011 NIAID scientists presented data at the Keystone Conference on “Pathogenesis of Influenza: Virus-Host Interactions” in Hong Kong, China, showing the positive results of efficacy studies in mice of L.E.A.P.S. H1N1 activated dendritic cells (DCs) to treat the H1N1 virus. Scientists at the NIAID found that H1N1-infected mice treated with LEAPS-H1N1 DCs showed a survival advantage over mice treated with control DCs. The work was performed in collaboration with scientists led by Kanta Subbarao, M.B.B.S., M.P.H, of the National Institute of Allergy and Infectious Diseases (NIAID), part of the National Institutes of Health, USA.
With its LEAPS technology, CEL-SCI also developed a second peptide named CEL-2000, a potential rheumatoid arthritis vaccine. The data from animal studies of rheumatoid arthritis using the CEL-2000 treatment vaccine demonstrated that CEL-2000 could potentially be an effective treatment against arthritis with fewer administrations than those required by other anti-rheumatoid arthritis treatments, including Enbrel
®
. CEL-2000 is also potentially a more disease type-specific therapy, is calculated to be significantly less expensive and may be useful in patients unable to tolerate or who may not be responsive to existing anti-arthritis therapies.
In February 2010 CEL-SCI announced that its CEL-2000 vaccine demonstrated that it was able to block the progression of rheumatoid arthritis in a mouse model. The results were published in the scientific peer-reviewed Journal of International Immunopharmacology (online edition) in an article titled “CEL-2000: A Therapeutic Vaccine for Rheumatoid Arthritis Arrests Disease Development and Alters Serum Cytokine/Chemokine Patterns in the Bovine Collagen Type II Induced Arthritis in the DBA Mouse Model” with lead author Dr. Daniel Zimmerman. The study was co-authored by scientists from CEL-SCI, Washington Biotech, Northeastern Ohio Universities Colleges of Medicine and Pharmacy and Boulder BioPath.
None of the LEAPS investigational products have been approved for sale, barter or exchange by the FDA or any other regulatory agency for any use to treat disease in animals or humans. The safety or efficacy of these products has not been established for any use. Lastly, no definitive conclusions can be drawn from these early-phase, preclinical-trials data involving these investigational products. Before obtaining marketing approval from the FDA in the United States, and by comparable agencies in most foreign countries, these product candidates must undergo rigorous preclinical and clinical testing which is costly and time consuming and subject to unanticipated delays. There can be no assurance that these approvals will be granted.
8
PATENTS
CEL-SCI currently has eight patents issued in the United States and twenty-nine patent applications pending in Europe, Japan, China, India, Hong Kong, Canada and the United States. Three patents cover certain aspects of Multikine and will expire between 2023 and 2024. The remaining five patents cover CEL-SCI’s LEAPS technology and will expire between December 2014 and April 2022. CEL-SCI believes that the greatest level of protection for Multikine is not based on patents but comes from the confidential and proprietary process relating to the manufacture of Multikine.
RESEARCH AND DEVELOPMENT
Since 1983, and through September 30, 2011, approximately $88,988,600 has been spent on CEL-SCI-sponsored research and development, including $11,745,600, $11,911,600 and $6,011,800 respectively during the three years ended September 30, 2011.
The costs associated with the clinical trials relating to CEL-SCI's technologies, research expenditures and CEL-SCI's administrative expenses have been funded with the public and private sales of CEL-SCI's securities and borrowings from third parties, including affiliates of CEL-SCI. The extent of CEL-SCI’s clinical trials and research programs is primarily based upon the amount of capital available to CEL-SCI and the extent to which CEL-SCI has received regulatory approvals for clinical trials.
GOVERNMENT REGULATION
New drug development and approval process
Regulation by governmental authorities in the United States and other countries is a significant factor in the manufacture and marketing of biological and other drug products and in ongoing research and product development activities. CEL-SCI’s products will require regulatory approval by governmental agencies prior to commercialization. In particular, these products are subject to rigorous preclinical and clinical testing and other premarket approval requirements by the FDA and regulatory authorities in other countries. In the United States, various statutes and regulations also govern or influence the manufacturing, safety, labeling, storage, record keeping and marketing of pharmaceutical and biological drug products. The lengthy process of seeking these approvals, and the subsequent compliance with applicable statutes and regulations, require the expenditure of substantial resources. CEL-SCI believes that it is currently in compliance with applicable statutes and regulations that are relevant to its operations. CEL-SCI has no control, however, over the compliance of its partners.
The FDA’s statutes, regulations, or policies may change and additional statutes or government regulations may be enacted which could prevent or delay regulatory approvals of biological or other drug products. CEL-SCI cannot predict the likelihood, nature or extent of adverse governmental regulation that might arise from future legislative or administrative action, either in the U.S. or abroad.
Regulatory approval, when and if obtained, may be limited in scope. In particular, regulatory approvals will restrict the marketing of a product to specific uses. Further, approved biological and other drugs, as well as their manufacturers, are subject to ongoing review. Discovery of previously unknown problems with these products may result in restrictions on their manufacture, sale or use or in their withdrawal from the market. Failure to comply with regulatory requirements may result in criminal prosecution, civil penalties, recall or seizure of products, total or partial suspension of production or injunction, as well as other actions affecting CEL-SCI. Any failure by CEL-SCI or its partners to obtain and maintain, or any delay in obtaining, regulatory approvals could materially adversely affect CEL-SCI’s business.
The process for new drug approval has many steps, including:
9
Preclinical testing
Once a biological or other drug candidate is identified for development, the drug candidate enters the preclinical testing stage. During preclinical studies, laboratory and animal studies are conducted to show biological activity of the drug candidate in animals, both healthy and with the targeted disease. Also, preclinical tests evaluate the safety of drug candidates. These tests typically take approximately two years to complete. Preclinical tests must be conducted in compliance with good laboratory practice regulations. In some cases, long-term preclinical studies are conducted while clinical studies are ongoing.
Investigational new drug application
When the preclinical testing is considered adequate by the sponsor to demonstrate the safety and the scientific rationale for initial human studies, an investigational new drug application (IND) is filed with the FDA to seek authorization to begin human testing of the biological or other drug candidate. The IND becomes effective if not rejected by the FDA within 30 days after filing. The IND must provide data on previous experiments, how, where and by whom the new studies will be conducted, the chemical structure of the compound, the method by which it is believed to work in the human body, any toxic effects of the compound found in the animal studies and how the compound is manufactured. All clinical trials must be conducted under the supervision of a qualified investigator in accordance with good clinical practice regulations. These regulations include the requirement that all subjects provide informed consent. In addition, an institutional review board (IRB), comprised primarily of physicians and other qualified experts at the hospital or clinic where the proposed studies will be conducted, must review and approve each human study. The IRB also continues to monitor the study and must be kept aware of the study's progress, particularly as to adverse events and changes in the research. Progress reports detailing the results of the clinical trials must be submitted at least annually to the FDA and more frequently if adverse events occur. In addition, the FDA may, at any time during the 30-day period after filing an IND or at any future time, impose a clinical hold on proposed or ongoing clinical trials. If the FDA imposes a clinical hold, clinical trials cannot commence or recommence without FDA authorization, and then only under terms authorized by the FDA. In some instances, the IND process can result in substantial delay and expense.
Some limited human clinical testing may also be done under a physician's IND that allows a single individual to receive the drug, particularly where the individual has not responded to other available therapies. A physician's IND does not replace the more formal IND process, but can provide a preliminary indication as to whether further clinical trials are warranted, and can, on occasion, facilitate the more formal IND process.
Clinical trials are typically conducted in three sequential phases, but the phases may overlap.
10
Phase I clinical trials
Phase I human clinical trials usually involve between 20 and 80 healthy volunteers or patients and typically take one to two years to complete. The tests study a biological or other drug's safety profile, and may seek to establish the safe dosage range. The Phase I clinical trials also determine how a drug candidate is absorbed, distributed, metabolized and excreted by the body, and the duration of its action.
Phase II clinical trials
In Phase II clinical trials, controlled studies are conducted on an expanded population of patients with the targeted disease. The primary purpose of these tests is to evaluate the effectiveness of the drug candidate on the volunteer patients as well as to determine if there are any side effects or other risks associated with the drug. These studies generally take several years and may be conducted concurrently with Phase I clinical trials. In addition, Phase I/II clinical trials may be conducted to evaluate not only the efficacy of the drug candidate on the patient population, but also its safety.
Phase III clinical trials
This phase typically lasts several years and involves an even larger patient population, often with several hundred or even several thousand patients depending on the use for which the drug is being studied. Phase III trials are intended to establish the overall risk-benefit ratio of the drug and provide, if appropriate, an adequate basis for product labeling. During the Phase III clinical trials, physicians monitor the patients to determine efficacy and to observe and report any reactions or other safety risks that may result from use of the drug candidate.
Chemical and formulation development
Concurrent with clinical trials and preclinical studies, companies also must develop information about the chemistry and physical characteristics of the drug and finalize a process for manufacturing the product in accordance with current good manufacturing practice requirements (cGMPs). The manufacturing process must be capable of consistently producing quality batches of the product and the manufacturer must develop methods for testing the quality, purity, and potency of the final drugs. Additionally, appropriate packaging must be selected and tested and chemistry stability studies must be conducted to demonstrate that the product does not undergo unacceptable deterioration over its shelf-life.
New drug application or biological license application
After the completion of the clinical trial phases of development, if the sponsor concludes that there is substantial evidence that the biological or other drug candidate is effective and that the drug is safe for its intended use, a new drug application (NDA) or biologics license application (BLA) may be submitted to the FDA. The application must contain all of the information on the biological or other drug candidate gathered to that date, including data from the clinical trials.
11
The FDA reviews all NDAs and BLAs submitted before it accepts them for filing. It may request additional information rather than accepting an application for filing. In this event, the application must be resubmitted with the additional information. The resubmitted application is also subject to review before the FDA accepts it for filing. Once the submission is accepted for filing, the FDA begins an in-depth review of the application. The FDA may refer the application to an appropriate advisory committee, typically a panel of clinicians, for review, evaluation and a recommendation. The FDA is not bound by the recommendation of an advisory committee. If FDA evaluations of the NDA or BLA and the manufacturing facilities are favorable, the FDA may issue an approval letter authorizing commercial marketing of the drug or biological candidate for specified indications. The FDA could also issue an approvable letter, which usually contains a number of conditions that must be met in order to secure final approval of the NDA or BLA. When and if those conditions have been met to the FDA's satisfaction, the FDA will issue an approval letter. On the other hand, if the FDA's evaluation of the NDA or BLA or manufacturing facilities is not favorable, the FDA may refuse to approve the application or issue a non-approvable letter.
Among the conditions for NDA or BLA approval is the requirement that each prospective manufacturer's quality control and manufacturing procedures conform to current good manufacturing practice standards and requirements (cGMPs). Manufacturing establishments are subject to periodic inspections by the FDA and by other federal, state or local agencies.
COMPETITION AND MARKETING
Many companies, nonprofit organizations and governmental institutions are conducting research on cytokines. Competition in the development of therapeutic agents incorporating cytokines is intense. Large, well-established pharmaceutical companies are engaged in cytokine research and development and have considerably greater resources than CEL-SCI has to develop products. Licensing and other collaborative arrangements between governmental and other nonprofit institutions and commercial enterprises, as well as the seeking of patent protection of inventions by nonprofit institutions and researchers, could result in strong competition for CEL-SCI. Any new developments made by such organizations may render CEL-SCI's licensed technology and know-how obsolete.
Several biotechnology companies are producing compounds that utilize cytokines. However, CEL-SCI believes that its main advantage lies in two areas and that those two areas will allow it to be successful: 1) Multikine is given prior to surgery, radiation and/or chemotherapy, a time when the immune system can be activated more easily. Other companies give their immunotherapy drugs after these cancer treatments. At that time the immune system is already so weakened that it is unlikely to be able to mount a complete immune response. 2) Multikine simulates the activities of a healthy person's immune system, which battles cancer every day. Multikine is a cancer immunotherapy that both affects/kills cancer cells directly and activates the general immune system to destroy the cancer.
In addition, since Multikine is a complex biologic, CEL-SCI believes that it will be extremely difficult for someone to copy Multikine and its manufacturing.
12
EMPLOYEES
As of November 30, 2011, CEL-SCI had 44 employees. Nine employees are involved in administration, 32 employees are involved in manufacturing, and 3 employees are involved in general research and development with respect to CEL-SCI’s products.
Investors should be aware that the risks described below could adversely affect the price of CEL-SCI's common stock and the future prospects of CEL-SCI.
Risks Related to CEL-SCI
Since CEL-SCI has earned only limited revenues and has a history of losses, CEL-SCI will require additional capital to remain in operation,
complete its clinical trials and fund pre-marketing expenses.
CEL-SCI has had only limited revenues since it was formed in 1983. Since the date of its formation and through September 30, 2011, CEL-SCI incurred net losses of approximately $(187,500,000). CEL-SCI has relied principally upon the proceeds of public and private sales of its securities to finance its activities to date.
If CEL-SCI cannot obtain additional capital, CEL-SCI may have to postpone development and research expenditures, which will delay CEL-SCI's ability to produce a competitive product. Delays of this nature may depress the price of CEL-SCI's common stock. In addition, although CEL-SCI is not aware of a direct competitor for Multikine, it is possible that one exists. There are many potential competitors of LEAPS. If competitors develop, any delay in the development of CEL-SCI’s products may provide opportunities to those competitors.
The condition of the overall economy may continue to affect both the availability of capital and CEL-SCI’s stock price. In addition, future capital raises, which will be necessary for CEL-SCI’s survival, will be further dilutive to current shareholders. There can be no assurance that CEL-SCI will be able to raise the capital it will need.
All of CEL-SCI's potential products, with the exception of Multikine, are in the early stages of development, and any commercial sale of these products will be many years away.
Even potential product sales from Multikine are years away, since cancer trials can be lengthy. Accordingly, CEL-SCI expects to incur substantial losses for the foreseeable future.
Since CEL-SCI does not intend to pay dividends on its common stock, any potential return to investors will result only from any increases in the price of CEL-SCI's common stock.
At the present time, CEL-SCI intends to use available funds to finance its operations. Accordingly, while payment of dividends rests within the discretion of CEL-SCI’s Directors, no common stock dividends have been declared or paid by CEL-SCI and CEL-SCI has no intention of paying any common stock dividends in the foreseeable future. Any gains for CEL-SCI’s investors will most likely result from increases in the price of CEL-SCI’s common stock, which has been volatile in the recent past. If CEL-SCI’s stock price does not increase, which likely will depend primarily upon the results of the Multikine clinical trials, an investor is unlikely to receive any return on an investment in CEL-SCI’s common stock.
13
The costs of CEL-SCI’s product development and clinical trials are difficult to estimate and will be very high for many years, preventing CEL-SCI from making a profit for the foreseeable future, if ever.
Clinical and other studies necessary to obtain approval of a new drug can be time consuming and costly, especially in the United States, but also in foreign countries. CEL-SCI's estimates of the costs associated with future clinical trials and research may be substantially lower than what CEL-SCI actually experiences. It is impossible to predict what CEL-SCI will face in the development of a product, such as LEAPS. The purpose of clinical trials is to provide both CEL-SCI and regulatory authorities with safety and efficacy data in humans. It is relatively common to revise a trial or add subjects to a trial in progress. These examples of common vagaries in product development and clinical investigations demonstrate how predicted costs may exceed reasonable expectations. The different and often complex steps necessary to obtain regulatory approval, especially that of the United States Food and Drug Administration (“FDA”) and the European Union’s European Medicine’s Agency (“EMA”), involve significant costs and may require several years to complete. CEL-SCI expects that it will need substantial additional financing over an extended period of time in order to fund the costs of future clinical trials, related research, and general and administrative expenses.
The extent of CEL-SCI's clinical trials and research programs are primarily based upon the amount of capital available to CEL-SCI and the extent to which it receives regulatory approvals for clinical trials. CEL-SCI has established estimates of the future costs of the Phase III clinical trial for Multikine, but, as explained above, that estimate may not prove correct.
Compliance with changing regulations concerning corporate governance and public disclosure may result in additional expenses.
Changing laws, regulations and standards relating to corporate governance and public disclosure may create uncertainty regarding compliance matters. New or changed laws, regulations and standards are subject to varying interpretations in many cases. As a result, their application in practice may evolve over time. CEL-SCI is committed to maintaining high standards of corporate governance and public disclosure. Complying with evolving interpretations of new or changing legal requirements may cause CEL-SCI to incur higher costs as it revises current practices, policies and procedures, and may divert management time and attention from potential revenue-generating activities to compliance matters. If CEL-SCI’s efforts to comply with new or changed laws, regulations and standards differ from the activities intended by regulatory or governing bodies due to ambiguities related to practice, CEL-SCI’s reputation may also be harmed. Further, CEL-SCI’s board members, chief executive officer, president and the other executive officers of CEL-SCI could face an increased risk of personal liability in connection with the performance of their duties. As a result, CEL-SCI may have difficulty attracting and retaining qualified board members and executive officers, which could harm its business.
14
CEL-SCI has not established a definite plan for the marketing of Multikine.
CEL-SCI has not established a definitive plan for marketing nor has it established a price structure for any of its products. However, CEL-SCI intends, if it is in a position to do so, to sell Multikine itself in certain markets and to enter into written marketing agreements with various major pharmaceutical firms with established sales forces. The sales forces in turn would, CEL-SCI believes, target CEL-SCI's products to cancer centers, physicians and clinics involved in head and neck cancer. CEL-SCI has already licensed Multikine to four companies, Teva Pharmaceuticals in Israel, Turkey, Serbia and Croatia, Orient Europharma in Taiwan, Singapore, Hong Kong, Malaysia, South Korea, the Philippines, Australia and New Zealand, Byron BioPharma, LLC in South Africa, and IDC-GP Pharm in Argentina and Venezuela. CEL-SCI believes that these companies have the resources to market Multikine appropriately in their respective territories, but there is no guarantee that they will. There is no assurance that CEL-SCI will find qualified parties willing to market CEL-SCI’s product in other areas.
CEL-SCI may encounter problems, delays and additional expenses in developing marketing plans with outside firms. In addition, even if Multikine is cost effective and proven to increase overall survival, CEL-SCI may experience other limitations involving the proposed sale of Multikine, such as uncertainty of third-party reimbursement. There is no assurance that CEL-SCI can successfully market any products which CEL-SCI may develop.
CEL-SCI hopes to expand its clinical development capabilities in the future, and any difficulties hiring or retaining key personnel or managing this growth could disrupt CEL-SCI’s operations.
CEL-SCI is highly dependent on the principal members of CEL-SCI’s management and development staff. If the Multikine clinical trial is successful, CEL-SCI expects to expand its clinical development and manufacturing capabilities, which will involve hiring additional employees. Future growth will require CEL-SCI to continue to implement and improve CEL-SCI’s managerial, operational and financial systems and to continue to retain, recruit and train additional qualified personnel, which may impose a strain on CEL-SCI’s administrative and operational infrastructure. The competition for qualified personnel in the biopharmaceutical field is intense. CEL-SCI is highly dependent on its ability to attract, retain and motivate highly qualified management and specialized personnel required for clinical development. Due to CEL-SCI’s limited resources, CEL-SCI may not be able to manage effectively the expansion of its operations or recruit and train additional qualified personnel. If CEL-SCI is unable to retain key personnel or manage its growth effectively, CEL-SCI may not be able to implement its business plan.
Future sales of CEL-SCI’s securities may dilute the value of current investors’ holdings.
In order to raise additional capital, CEL-SCI may need to sell shares of its common stock, or securities convertible into common stock, at prices that may be below the prevailing market price of CEL-SCI's common stock at the time of sale. Since CEL-SCI’s stock price has been volatile, even a sale at market price one week may represent a substantial “discount” over the prior week’s price. Future sales of CEL-SCI’s securities will dilute CEL-SCI’s current stockholders and investors and may have a negative effect on the market price of its common stock.
15
Multikine is made from components of human blood, which involves inherent risks that may lead to product destruction or patient injury.
Multikine is made, in part, from components of human blood. There are inherent risks associated with products that involve human blood such as possible contamination with viruses, including Hepatitis or HIV. Any possible contamination could require CEL-SCI to destroy batches of Multikine or cause injuries to patients who receive the product, thereby subjecting CEL-SCI to possible financial losses, lawsuits, and harm to its business.
Although CEL-SCI has product liability insurance for Multikine, the successful prosecution of a product liability case against CEL-SCI could have a materially adverse effect upon its business if the amount of any judgment exceeds CEL-SCI's insurance coverage. Such a suit also could damage the reputation of Multikine and make successful marketing of the product less likely. CEL-SCI commenced the Phase III clinical trial for Multikine in December 2010. Although no claims have been brought to date, participants in CEL-SCI's clinical trials could bring civil actions against CEL-SCI for any unanticipated harmful effects arising from the use of Multikine or any drug or product that CEL-SCI may attempt to develop.
CEL-SCI's directors are allowed to issue shares of preferred stock and warrants with provisions that could be detrimental to the holders of CEL-SCI's common stock.
The provisions in CEL-SCI's Articles of Incorporation relating to CEL-SCI's preferred stock allow CEL-SCI's directors to issue preferred stock with rights to multiple votes per share and dividend rights which would have priority over any dividends paid with respect to CEL-SCI's common stock. The issuance of preferred stock with such rights may make more difficult the removal of management even if such removal would be considered beneficial to shareholders generally, and will have the effect of limiting shareholder participation in certain transactions such as mergers or tender offers if such transactions are not favored by incumbent management. In addition, CEL-SCI has issued warrants in the past and may do so in the future. These warrants, providing a future right to purchase shares of CEL-SCI’s common stock at the established price, may further dilute the ownership of current shareholders.
Our Independent Registered Public Accountants have included in its report on our financial statements a paragraph stating that we may be unable to continue as a going concern.
As a result of our recurring losses from operations, our independent registered public accounting firm, BDO USA, LLP, has issued a report in connection with their audit of our consolidated financial statements for the year ended September 30, 2011, that included an explanatory paragraph referring to our recurring losses from operations and expressing substantial doubt in our ability to continue as a going concern without additional capital becoming available. The doubt about our ability to continue as a going concern could have an adverse impact on our ability to execute our business plan, result in the reluctance on the part of certain suppliers to do business with us, or adversely affect our ability to raise additional debt or equity capital.
16
Risks Related to Government Approvals
CEL-SCI's product candidates must undergo rigorous preclinical and clinical testing and regulatory approvals, which could be costly and time-consuming and subject CEL-SCI to unanticipated delays or prevent CEL-SCI from marketing any products.
Therapeutic agents, drugs and diagnostic products are subject to approval, prior to general marketing, from the FDA in the United States, the EMA in the European Union, and by comparable agencies in most foreign countries. Before obtaining marketing approval, these product candidates must undergo costly and time consuming preclinical and clinical testing which could subject CEL-SCI to unanticipated delays and may prevent CEL-SCI from marketing its product candidates. There can be no assurance that such approvals will be granted.
CEL-SCI cannot be certain when or under what conditions it will undertake clinical trials. A variety of issues may delay or prevent CEL-SCI’s Phase III clinical trial for Multikine or preclinical and early clinical trials for other products. For example, early trials, or the plans for later trials, may not satisfy the requirements of regulatory authorities, such as the FDA. CEL-SCI may fail to find subjects willing to enroll in CEL-SCI’s trials. CEL-SCI manufactures Multikine, but CEL-SCI relies on third party vendors for managing the trial process and other activities, and these vendors may fail to meet appropriate standards. Accordingly, the clinical trials relating to CEL-SCI's product candidates may not be completed on schedule, the FDA or foreign regulatory agencies may order CEL-SCI to stop or modify its research, or these agencies may not ultimately approve any of CEL-SCI's product candidates for commercial sale. Varying interpretations of the data obtained from pre-clinical and clinical testing could delay, limit or prevent regulatory approval of CEL-SCI's product candidates. The data collected from CEL-SCI's clinical trials may not be sufficient to support regulatory approval of its various product candidates, including Multikine. CEL-SCI's failure to adequately demonstrate the safety and efficacy of any of its product candidates would delay or prevent regulatory approval of its product candidates in the United States, which could prevent CEL-SCI from achieving profitability. Although CEL-SCI had positive results in its Phase II trials for Multikine, those results were for a very small sample set, and CEL-SCI will not know definitively how Multikine will perform until CEL-SCI is well into, or completes, its Phase III clinical trial.
The requirements governing the conduct of clinical trials, manufacturing, and marketing of CEL-SCI's product candidates, including Multikine, outside the United States vary from country to country. Foreign approvals may take longer to obtain than FDA approvals and can require, among other things, additional testing and different trial designs. Foreign regulatory approval processes include all of the risks associated with the FDA approval process. Some of those agencies also must approve prices for products approved for marketing. Approval of a product by the FDA or the EMA does not ensure approval of the same product by the health authorities of other countries. In addition, changes in regulatory requirements for product approval in any country during the clinical trial process and regulatory agency review of each submitted new application may cause delays or rejections.
CEL-SCI has only limited experience in filing and pursuing applications necessary to gain regulatory approvals. CEL-SCI’s lack of experience may impede its ability to obtain timely approvals from regulatory agencies, if at all. CEL-SCI will not be able to commercialize Multikine and other product candidates until it has obtained regulatory approval. In addition, regulatory authorities may also limit the types of patients to which CEL-SCI or others may market Multikine or CEL-SCI's other products. Any failure to obtain or any delay in obtaining required regulatory approvals may adversely affect the ability of CEL-SCI or potential licensees to successfully market CEL-SCI’s products.
17
Even if CEL-SCI obtains regulatory approval for its product candidates, CEL-SCI will be subject to stringent, ongoing government regulation.
If CEL-SCI's products receive regulatory approval, either in the United States or internationally, CEL-SCI will continue to be subject to extensive regulatory requirements. These regulations are wide-ranging and govern, among other things:
|
●
|
product design, development and manufacture;
|
|
●
|
product application and use
|
|
●
|
adverse drug experience;
|
|
●
|
product advertising and promotion;
|
|
●
|
product manufacturing, including good manufacturing practices
|
|
●
|
record keeping requirements;
|
|
●
|
registration and listing of CEL-SCI's establishments and products with the FDA, EMA and other state and national agencies;
|
|
●
|
product storage and shipping;
|
|
●
|
drug sampling and distribution requirements;
|
|
●
|
electronic record and signature requirements; and
|
|
●
|
labeling changes or modifications.
|
CEL-SCI and any third-party manufacturers or suppliers must continually adhere to federal regulations setting forth requirements, known as current Good Manufacturing Practices, or cGMPs, and their foreign equivalents, which are enforced by the FDA, the EMA and other national regulatory bodies through their facilities inspection programs. If CEL-SCI's facilities, or the facilities of CEL-SCI’s contract manufacturers or suppliers, cannot pass a pre-approval plant inspection, the FDA, EMA, or other national regulators will not approve the marketing applications of CEL-SCI's product candidates. In complying with cGMP and foreign regulatory requirements, CEL-SCI and any of its potential third-party manufacturers or suppliers will be obligated to expend time, money and effort in production, record-keeping and quality control to ensure that CEL-SCI’s products meet applicable specifications and other requirements. State regulatory authorities and the regulatory authorities of other countries have similar requirements.
18
If CEL-SCI does not comply with regulatory requirements at any stage, whether before or after marketing approval is obtained, CEL-SCI may be subject to license suspension or revocation, criminal prosecution, seizure, injunction, fines, be forced to remove a product from the market or experience other adverse consequences, including restrictions or delays in obtaining regulatory marketing approval for such products or for other products for which it seeks approval. This could materially harm CEL-SCI's financial results, reputation and stock price. Additionally, CEL-SCI may not be able to obtain the labeling claims necessary or desirable for product promotion. CEL-SCI may also be required to undertake post-marketing trials, which will be evaluated by applicable authorities to determine if CEL-SCI’s products may remain on the market. If CEL-SCI or other parties identify adverse effects after any of CEL-SCI's products are on the market, or if manufacturing problems occur, regulatory approval may be suspended or withdrawn. CEL-SCI may be required to reformulate its products, conduct additional clinical trials, make changes in product labeling or indications of use, or submit additional marketing applications to support any changes. If CEL-SCI encounters any of the foregoing problems, its business and results of operations will be harmed and the market price of its common stock may decline.
Also, CEL-SCI cannot predict the extent of adverse government regulations which might arise from future legislative or administrative action. Without government approval, CEL-SCI will be unable to sell any of its products.
Foreign governments often impose strict price controls, which may adversely affect CEL-SCI’s future profitability.
CEL-SCI intends to seek approval to market Multikine in both the United States and foreign jurisdictions. If CEL-SCI obtains approval in one or more foreign jurisdictions, CEL-SCI will be subject to rules and regulations in those jurisdictions relating to Multikine. In some foreign countries, particularly in the European Union, prescription drug pricing is subject to governmental control. In these countries, pricing negotiations with governmental authorities can take considerable time after the receipt of marketing approval for a drug candidate. To obtain reimbursement or pricing approval in some countries, CEL-SCI may be required to conduct a clinical trial that compares the cost-effectiveness of Multikine to other available therapies. If reimbursement of Multikine is unavailable or limited in scope or amount, or if pricing is set at unsatisfactory levels, CEL-SCI may be unable to achieve or sustain profitability.
Risks Related to Intellectual Property
CEL-SCI may not be able to achieve or maintain a competitive position, and other technological developments may result in CEL-SCI's proprietary technologies becoming uneconomical or obsolete.
CEL-SCI is involved in a biomedical field that is undergoing rapid and significant technological change. The pace of change continues to accelerate. The successful development of products from CEL-SCI's compounds, compositions and processes through CEL-SCI-financed research, or as a result of possible licensing arrangements with pharmaceutical or other companies, is not assured.
Many companies are working on drugs designed to cure or treat cancer or cure and treat viruses, such as H1N1. Many of these companies have substantial financial, research and development, and marketing resources, much greater than CEL-SCI’s, and are capable of providing significant long-term competition either by establishing in-house research groups or by forming collaborative ventures with other entities. In addition, smaller companies and non-profit institutions are active in research relating to cancer and infectious diseases. CEL-SCI’s market share will be reduced or eliminated if CEL-SCI’s competitors develop and obtain approval for products that are safer or more effective than CEL-SCI’s products.
19
CEL-SCI's patents might not protect CEL-SCI's technology from competitors, in which case CEL-SCI may not have any advantage over competitors in selling any products which it may develop.
Certain aspects of CEL-SCI's technologies are covered by U.S. and foreign patents. In addition, CEL-SCI has a number of new patent applications pending. There is no assurance that the applications still pending or which may be filed in the future will result in the issuance of any patents. Furthermore, there is no assurance as to the breadth and degree of protection any issued patents might afford CEL-SCI. Disputes may arise between CEL-SCI and others as to the scope and validity of these or other patents. Any defense of the patents could prove costly and time consuming and there can be no assurance that CEL-SCI will be in a position, or will deem it advisable, to carry on such a defense. A suit for patent infringement could result in increasing costs, delaying or halting development, or even forcing CEL-SCI to abandon a product. Other private and public concerns, including universities, may have filed applications for, may have been issued, or may obtain additional patents and other proprietary rights to technology potentially useful or necessary to CEL-SCI. CEL-SCI currently is not aware of any such patents, but the scope and validity of such patents, if any, and the cost and availability of such rights are impossible to predict. Also, as far as CEL-SCI relies upon unpatented proprietary technology, there is no assurance that others may not acquire or independently develop the same or similar technology.
Much of CEL-SCI’s intellectual property is protected as a trade secret, not as a patent.
Much of CEL-SCI’s intellectual property pertains to its manufacturing system, certain aspects of which may not be suitable for patent filing and must be protected as a trade secret. Those trade secrets must be protected diligently by CEL-SCI to protect their disclosure to competitors, since legal protections after disclosure may be minimal or non-existent. Accordingly, much of CEL-SCI’s value is dependent upon its ability to keep its trade secrets confidential. Although CEL-SCI takes measures to ensure confidentiality, CEL-SCI may fail in that attempt. In addition, in some cases a regulator considering CEL-SCI’s application for product approval may require the disclosure of some or all of CEL-SCI’s proprietary information. In such a case, CEL-SCI must decide whether to disclose the information or forego approval in a particular country. If CEL-SCI is unable to market its products in key countries, CEL-SCI’s opportunities and value may suffer.
Risks Related to CEL-SCI’s Common Stock
The market price for CEL-SCI's common stock is volatile, so investors may not be able to sell any of CEL-SCI's shares at a profit.
The market price of CEL-SCI's common stock, as well as the securities of other biopharmaceutical and biotechnology companies, have historically been highly volatile, and the market has from time to time experienced significant price and volume fluctuations that are unrelated to the operating performance of particular companies. During the twelve months ended September 30, 2011, CEL-SCI's stock price has ranged from a low of $0.35 per share to a high of $1.05 per share. Factors such as fluctuations in CEL-SCI's operating results, announcements of technological innovations or new therapeutic products by CEL-SCI or its competitors, governmental regulation, developments in patent or other proprietary rights, public concern as to the safety of products developed by CEL-SCI or other biotechnology and pharmaceutical companies, publications by market analysts, law suits, and general market conditions may have a significant effect on the future market price of CEL-SCI's common stock.
20
Shares issuable upon the conversion of notes or upon the exercise of outstanding warrants and options may substantially increase the number of shares available for sale in the public market and may depress the price of CEL-SCI's common stock.
CEL-SCI has outstanding convertible notes and debt, as well as options and warrants, which as of November 30, 2011, could potentially allow the holders to acquire a substantial number of shares of CEL-SCI’s common stock. Until the convertible notes and debt are repaid, and the options and warrants expire, the holders will have an opportunity to profit from any increase in the market price of CEL-SCI's common stock without assuming the risks of ownership. Holders of convertible notes and debt, options and warrants may convert or exercise these securities at a time when CEL-SCI could obtain additional capital on terms more favorable than those provided by the options or warrants. The conversion of the notes or debt or the exercise of the options and warrants will dilute the voting interest of the current owners of outstanding shares by adding a substantial number of additional shares of common stock.
Substantially all of the shares of common stock that are issuable upon the conversions of the notes or debt, of the exercise of outstanding options and warrants, may be sold in the public market. The sale of common stock described above, or the perception that such sales could occur, may adversely affect the market price of CEL-SCI's common stock.
In December 2010, CEL-SCI entered into a sales agreement with McNicoll Lewis & Vlak, LLC (MLV) relating to shares of common stock which have been registered by means of a shelf registration statement. CEL-SCI may offer and sell shares of its common stock, having an aggregate offering price of up to $30 million from time to time through MLV acting as agent, on a best efforts basis, and/or principal. CEL-SCI is not required to sell any shares to MLV and MLV is not required to sell any shares on CEL-SCI’s behalf or purchase any of shares for its own account. MLV is entitled to a commission in an amount equal to the greater of 3% of the gross proceeds from each sale of the shares, or $0.025 for each share sold, provided, that, in no event will MLV receive a commission greater than 8.0% of the gross proceeds from the sale of the shares. The agreement was terminated in December 2011.
CEL-SCI's outstanding shares will be diluted by the number of shares sold to MLV and CEL-SCI's stock price may decrease as a result of the sale of such shares. Any decline in the price of CEL-SCI's common stock may encourage short sales, which could place further downward pressure on the price of CEL-SCI's common stock. Short selling is a practice of selling shares which are not owned by a seller at that time, with the expectation that the market price of the shares will decline in value after the sale, providing the short seller a profit.
None
21
CEL-SCI leases office space at 8229 Boone Blvd., Suite 802, Vienna, Virginia at a monthly rental of approximately $8,900. The lease on the office space expires in June 2012. CEL-SCI believes this arrangement is adequate for the conduct of its present business.
CEL-SCI has a 17,900 square foot laboratory located in Baltimore, Maryland. The laboratory is leased by CEL-SCI at a cost of approximately $11,000 per month. The laboratory lease expires in February 2014.
In August 2007, CEL-SCI leased a building near Baltimore, Maryland. The building, which consists of approximately 73,000 square feet, has been remodeled in accordance with CEL-SCI’s specifications so that it can be used by CEL-SCI to manufacture Multikine for CEL-SCI’s Phase III clinical trial and sales of the drug if approved by the FDA. The lease expires on October 31, 2028 and requires annual base rent payments of approximately $1,667,000 during the twelve months ending September 30, 2011, in accordance with the lease agreement. The annual base rent escalates each year thereafter at 3% beginning on November 1st. CEL-SCI is also required to pay all real and personal property taxes, insurance premiums, maintenance expenses, repair costs and utilities. The lease allows CEL-SCI, at its election, to extend the lease for two ten-year periods or to purchase the building at the end of the 20-year lease. The lease required CEL-SCI to pay $3,150,000 towards the remodeling costs, which will be recouped by reductions in the annual base rent of $303,228 beginning in 2014. In August 2011, the Company was required to deposit the equivalent of one year of base rent in accordance with the contract. The $1,670,917 is included in non-current assets on September 30, 2011 was required to be deposited when the amount of cash the Company had dropped below the amount stipulated in the lease.
Not Applicable.
ITEM 5.
MARKET FOR CEL-SCI'S COMMON EQUITY AND RELATED STOCKHOLDER MATTERS.
As of September 30, 2011, there were approximately 1,100 record holders of CEL-SCI’s common stock. CEL-SCI’s common stock is traded on the NYSE Amex under the symbol “CVM”. Set forth below are the range of high and low quotations for CEL-SCI’s common stock for the periods indicated as reported on the NYSE Amex. The market quotations reflect inter-dealer prices, without retail mark-up, mark-down or commissions and may not necessarily represent actual transactions.
| Quarter Ending | High | Low | ||||||
| 12/31/08 | $ | 0.50 | $ | 0.18 | ||||
| 3/31/09 | $ | 0.40 | $ | 0.14 | ||||
| 6/30/09 | $ | 0.80 | $ | 0.20 | ||||
| 9/30/09 | $ | 2.10 | $ | 0.38 | ||||
22
| Quarter Ending | High | Low | ||||||
| 12/31/09 | $ | 1.79 | $ | 0.85 | ||||
| 3/31/10 | $ | 1.12 | $ | 0.50 | ||||
| 6/30/10 | $ | 0.76 | $ | 0.45 | ||||
| 9/30/10 | $ | 0.84 | $ | 0.43 | ||||
| 12/31/10 | $ | 1.05 | $ | 0.60 | ||||
| 3/31/11 | $ | 0.86 | $ | 0.51 | ||||
| 6/30/11 | $ | 0.74 | $ | 0.46 | ||||
| 9/30/11 | $ | 0.57 | $ | 0.35 | ||||
Holders of common stock are entitled to receive dividends as may be declared by the Board of Directors out of legally available funds and, in the event of liquidation, to share pro rata in any distribution of CEL-SCI’s assets after payment of liabilities. The Board of Directors is not obligated to declare a dividend. CEL-SCI has not paid any dividends on its common stock and CEL-SCI does not have any current plans to pay any common stock dividends.
The provisions in CEL-SCI’s Articles of Incorporation relating to CEL-SCI’s preferred stock would allow CEL-SCI’s directors to issue preferred stock with rights to multiple votes per share and dividend rights which would have priority over any dividends paid with respect to CEL-SCI’s Common Stock. The issuance of preferred stock with such rights may make more difficult the removal of management even if such removal would be considered beneficial to shareholders generally, and will have the effect of limiting shareholder participation in certain transactions such as mergers or tender offers if such transactions are not favored by incumbent management.
The market price of CEL-SCI’s common stock, as well as the securities of other biopharmaceutical and biotechnology companies, have historically been highly volatile, and the market has from time to time experienced significant price and volume fluctuations that are unrelated to the operating performance of particular companies. Factors such as fluctuations in CEL-SCI’s operating results, announcements of technological innovations or new therapeutic products by CEL-SCI or its competitors, governmental regulation, developments in patent or other proprietary rights, public concern as to the safety of products developed by CEL-SCI or other biotechnology and pharmaceutical companies, and general market conditions may have a significant effect on the market price of CEL-SCI’s common stock.
The graph below matches the cumulative 5-year total return of holders of CEL-SCI’s common stock with the cumulative total returns of the NYSE Amex Composite index and the RDG MicroCap Biotechnology index. The graph assumes that the value of an investment in CEL-SCI's common stock and in each of the indexes (including reinvestment of dividends) was $100 on 9/30/2006 and tracks it through 9/30/2011.
23
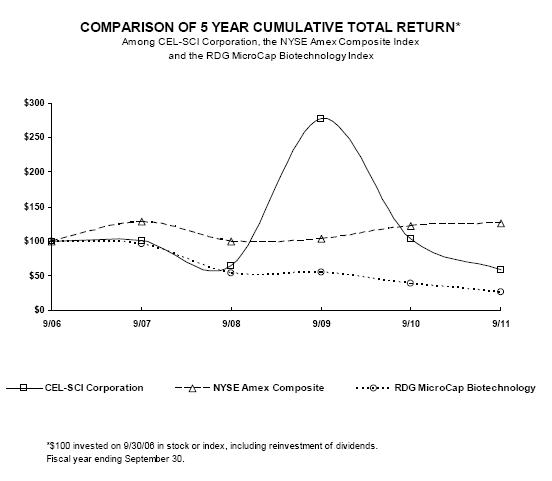
| 9/06 | 9/07 | 9/08 | 9/09 | 9/10 | 9/11 | |||||||||||||||||||
|
CEL-SCI Corporation
|
100.00 | 100.84 | 64.52 | 277.42 | 103.87 | 58.87 | ||||||||||||||||||
|
NYSE Amex Composite
|
100.00 | 127.85 | 99.27 | 103.93 | 122.61 | 125.42 | ||||||||||||||||||
|
RDG MicroCap Biotechnology
|
100.00 | 96.23 | 54.05 | 54.24 | 38.88 | 25.57 |
The stock price performance included in this graph is not necessarily indicative of future stock price performance.
24
The following selected historical consolidated financial data are qualified by reference to, and should be read in conjunction with the consolidated financial statements and the related notes thereto, appearing elsewhere in this report, as well as Item 7 of this report.
|
Statements of Operations
|
2011
|
2010
|
2009
|
2008
|
2007
|
|||||||||||||||
|
Rent and grant revenue and other
|
$ | 956,154 | $ | 153,300 | $ | 80,093 | $ | 5,065 | $ | 57,043 | ||||||||||
|
Operating expenses:
|
||||||||||||||||||||
|
Research and development
|
11,745,629 | 11,911,626 | 6,011,750 | 4,101,563 | 2,528,528 | |||||||||||||||
|
Depreciation and
amortization
|
531,316 | 516,117 | 417,205 | 215,060 | 176,186 | |||||||||||||||
|
General and administrative
|
6,664,883 | 6,285,810 | 5,671,595 | 5,200,735 | 6,704,538 | |||||||||||||||
|
Gain (loss) on derivative instruments
|
4,432,148 | 28,843,772 | (28,491,650 | ) | 1,799,393 | 868,182 | ||||||||||||||
|
Other expenses (3)
|
(12,000,000 | ) | - | - | - | - | ||||||||||||||
|
Interest income
|
164,163 | 362,236 | - | 483,252 | 562,973 | |||||||||||||||
|
Interest expense
|
(322,980 | ) | (162,326 | ) | (397,923 | ) | (473,767 | ) | (1,708,603 | ) | ||||||||||
|
Net income (loss)
|
(25,712,343 | ) | 10,483,429 | (40,910,030 | ) | (7,703,415 | ) | (9,629,657 | ) | |||||||||||
|
Modification of warrants
|
(1,068,369 | ) | (1,532,456 | ) | (490,728 | ) | (424,815 | ) | - | |||||||||||
|
Net income (loss) available to common shareholders
|
$ | (26,780,712 | ) | $ | 8,950,973 | $ | (41,400,758 | ) | $ | (8,128,230 | ) | $ | (9,629,657 | ) | ||||||
Statements of Operations
|
Net income (loss) per common share
|
||||||||||||||||||||
|
Basic
|
$ | (0.13 | ) | $ | 0.04 | $ | (0.31 | ) | $ | (0.07 | ) | $ | (0.10 | ) | ||||||
|
Diluted
|
$ | (0.15 | ) | $ | (0.06 | ) | $ | (0.31 | ) | $ | (0.07 | ) | $ | (0.10 | ) | |||||
|
Weighted average common
shares outstanding
|
||||||||||||||||||||
|
Basic
|
208,488,987 | 202,102,859 | 133,535,050 | 117,060,866 | 97,310,488 | |||||||||||||||
|
Diluted (1)
|
208,488,987 | 202,102,859 | 133,535,050 | 117,060,866 | 97,310,488 | |||||||||||||||
|
|
||||||||||||||||||||
|
2011
|
2010
|
2009
|
2008
|
2007
|
||||||||||||||||
|
Working capital
|
$ | 1,796,349 | $ | 25,799,304 | $ | 34,339,772 | $ | (2,492,555 | ) | $ | 10,257,568 | |||||||||
|
Total assets
|
18,625,440 | 37,804,985 | 46,027,598 | 14,683,672 | 20,730,802 | |||||||||||||||
|
Convertible note and derivative instruments - current (2)
|
5,068,552 | 424,286 | - | 3,018,697 | 782,732 | |||||||||||||||
|
Derivative instruments –
noncurrent (2)
|
2,192,521 | 6,521,765 | 35,113,970 | - | 4,831,252 | |||||||||||||||
|
Total liabilities
|
9,546,616 | 9,950,220 | 37,186,954 | 3,847,637 | 6,060,703 | |||||||||||||||
|
Stockholders' equity
|
9,078,824 | 27,854,765 | 8,840,644 | 10,836,035 | 14,670,099 | |||||||||||||||
____________
(1)
The calculation of diluted earnings per share for the years ended September 30, 2011, 2010, 2009, 2008 and 2007 excluded the potentially dilutive shares because their effect would have been anti-dilutive.
(2) Included in total liabilities.
(3) The $12 million other expense was the cost of the lawsuit settlement. See Financial Statement Footnotes for discussion of the lawsuit settlement.
25
CEL-SCI's net income (losses) available to common shareholders for each fiscal quarter during the two years ended September 30, 2011 were:
| Quarter | Net income | Net income (loss) per share | ||||||||||
| (loss) | Basic | Diluted | ||||||||||
| 12/31/2009 | $ | 19,159,517 | $ | 0.10 | $ | 0.02 | ||||||
| 3/31/2010 | $ | (2,176,975 | ) | $ | (0.01 | ) | $ | (0.03 | ) | |||
| 6/30/2010 | $ | (601,124 | ) | $ | (0.00 | ) | $ | (0.02 | ) | |||
| 9/30/2010 | $ | (7,430,445 | ) | $ | (0.04 | ) | $ | (0.04 | ) | |||
| 12/31/2010 | $ | (6,250,952 | ) | $ | (0.03 | ) | $ | (0.03 | ) | |||
| 3/31/2011 | $ | (15,097,973 | ) | $ | (0.07 | ) | $ | (0.09 | ) | |||
| 6/30/2011 | $ | (3,114,255 | ) | $ | (0.01 | ) | $ | (0.02 | ) | |||
| 9/30/2011 | $ | (2,317,532 | ) | $ | (0.01 | ) | $ | (0.02 | ) | |||
CEL-SCI has experienced large swings in its quarterly gains and losses in 2011 and 2010. These swings are caused by the changes in the fair value of the convertible debt and outstanding warrants accounted for as derivatives each quarter. These changes in the fair value of the convertible debt and warrants are recorded on the consolidated statements of operations. In addition, the cost of options granted to consultants, as discussed in the results of operations in this report, has affected the quarterly losses recorded by CEL-SCI. The settlement of the lawsuit, discussed in Note 11 to the financial statements accompanying this report, resulted in a $12,000,000 charge to earnings in the second quarter of the fiscal year ended September 30, 2011.
ITEM 7.
MANAGEMENT'S DISCUSSION AND ANALYSIS OF FINANCIAL CONDITION AND RESULTS OF OPERATIONS
The following discussion should be read in conjunction with the consolidated financial statements and the related notes thereto appearing elsewhere in this report.
CEL-SCI’s lead investigational therapy, Multikine, is cleared for a Phase III clinical trial in advanced primary head and neck cancer. It has received a go-ahead by the US FDA as well as the Canadian, Polish, Hungarian, Russian, Israeli, Indian and Taiwanese regulators
.
CEL-SCI also owns and is developing a pre-clinical technology called LEAPS (Ligand Epitope Antigen Presentation System).
All of CEL-SCI’s projects are under development. As a result, CEL-SCI cannot predict when it will be able to generate any revenue from the sale of any of its products.
Since inception, CEL-SCI has financed its operations through the issuance of equity securities, convertible notes, loans and certain research grants. CEL-SCI’s expenses will likely exceed its revenues as it continues the development of Multikine and brings other drug candidates into clinical trials. Until such time as CEL-SCI becomes profitable, any or all of these financing vehicles or others may be utilized to assist CEL-SCI’s capital requirements.
26
Results of Operations
Fiscal 2011
During the year ended September 30, 2011, revenue increased by $802,854. In November 2010, CEL-SCI received a $733,437 grant under The Patient Protection and Affordable Care Act of 2010 (PPACA). The grant was related to three of CEL-SCI’s projects, including the Phase III trial of Multikine. The PPACA provides small and mid-sized biotech, pharmaceutical and medical device companies with up to a 50% tax credit for investments in qualified therapeutic discoveries for tax years 2009 and 2010, or a grant for the same amount tax-free. The tax credit/grant program covers research and development costs from 2009 and 2010 for all qualified “therapeutic discovery projects.” CEL-SCI recognizes revenue as the expenses are incurred. Additionally, CEL-SCI has received $221,530 from a Phase III clinical trial partner for participation in the Phase III clinical trial.
During the year ended September 30, 2011, research and development expenses decreased by $165,997 compared to fiscal 2010. CEL-SCI’s research and development expenses will fluctuate based on the activity level of its Phase III clinical trial.
During the year ended September 30, 2011, general and administrative expenses increased by $379,073, compared to fiscal 2010. This increase was primarily due to an increase in legal fees for the lawsuit.
During the year ended September 30, 2011, other expenses increased by $12 million, compared to fiscal 2010. This increase was due to the $12 million settlement of the lawsuit.
The Settlement Agreement, signed in May 2011, between CEL-SCI and thirteen hedge funds (the "plaintiffs") resolved all claims arising from a lawsuit initiated by the plaintiffs in October 2009. As previously disclosed by CEL-SCI in its public filings, in August 2006 the plaintiffs (or their predecessors) purchased from CEL-SCI Series K notes convertible into CEL-SCI’s common stock and Series K warrants to purchase CEL-SCI’s common stock under agreements which provided the Series K notes and warrants with anti-dilution protection if CEL-SCI sold additional shares of common stock, or securities convertible into common stock, at a price below the then applicable conversion price of the notes or the exercise price of the warrants. In their lawsuit, the plaintiffs alleged that a March 2009 drug marketing and distribution agreement in which CEL-SCI sold units of common stock and warrants to an unrelated third party triggered these anti-dilution provisions, and that CEL-SCI failed to give effect to these provisions. The plaintiffs sought $30 million in actual damages, $90 million in punitive damages, the issuance of additional shares of common stock and warrants, and a reduction in the conversion price of the Series K notes and the exercise price of the Series K warrants. CEL-SCI denied the plaintiffs' allegations in the lawsuit and asserted that the 2009 agreement was a strategic transaction which did not trigger the anti-dilution provisions of the 2006 financing agreements.
Although CEL-SCI believed the plaintiffs' claims were without merit, CEL-SCI was of the opinion that a settlement of the lawsuit was in the best interests of its shareholders. The settlement was entered into to avoid the substantial costs of further litigation and the risk and uncertainty that the litigation entails. By ending this dispute, and ending the significant demands on the time and attention of CEL-SCI’s management necessary to respond to the litigation, CEL-SCI is better able to focus on executing its ongoing Phase III clinical trial with its investigational cancer drug Multikine.
Under the terms of the Settlement Agreement and related agreements, the plaintiffs and CEL-SCI terminated the pending litigation and released each other from all claims each may have had against the other, with certain customary exceptions. CEL-SCI agreed to make a $3 million cash payment and issue convertible promissory notes in the principal amount of $4.95 million and 4,050 shares of Series A Preferred Stock. As of September 1, 2011 CEL-SCI had redeemed all of the Series A Preferred shares for approximately $4,080,371. As a result, all Series A Preferred shares have been cancelled and are no longer outstanding.
27
The notes will be redeemed through five monthly installment payments of approximately $1 million each, plus interest at the rate of 8% per annum, with payments beginning on November 1, 2011 and ending on March 1, 2012. The notes are convertible, at the option of the holders, into CEL-SCI’s common stock at a fixed price of $0.67 per share. The first and second payments were made on November 1 and December 1, 2011 per the settlement agreement.
CEL-SCI has pledged all of its assets as collateral for the repayment of the notes. While the notes are outstanding, CEL-SCI is generally prohibited from paying dividends, incurring new debt or making any payments (other than interest) on existing debt, and is subject to certain restrictions on the transfer of its assets.
As of November 30, 2011, the remaining Series K warrants allow the holders to purchase up to 3,091,195 shares of CEL-SCI’s common stock at a price of $0.30 per share at any time prior to February 4, 2012. If CEL-SCI sells any additional shares of common stock or any securities convertible into common stock at a price below $0.30, the warrant exercise price will be lowered to the price at which the shares were sold or the lowest price at which the securities are convertible, as the case may be.
The parties' respective obligations under the Settlement Agreement, including CEL-SCI's obligation to pay cash and issue notes and preferred shares to the plaintiffs, were subject to obtaining court approval of an order exempting the issuance to the plaintiffs of the notes and preferred shares from registration under Section 3(a)(10) of the Securities Act of 1933. This was to permit the notes, and the shares of common stock issuable upon any conversion of the notes, to be freely tradeable.
As a condition of the settlement agreement, all claims against CEL-SCI were dismissed. As a result, the $81,395 overpayment by one of the claimants was dismissed and the liability was written off during the three months ended June 30, 2011.
The foregoing summary of the settlement is qualified in its entirety by the detailed terms of the Settlement Agreement and the related agreements and documents which were filed as exhibits to CEL-SCI’s report on Form 10-Q for the three months ended March 31, 2011.
Interest income during the year ended September 30, 2011 decreased by $198,073, compared to fiscal 2010. The decrease was due to the decrease in the funds available for investment and lower interest rates.
The gain on derivative instruments of $4,432,148 for the year ended September 30, 2011 was the result of the change in fair value of the derivative liabilities during the period.
The interest expense of $322,980 for the year ended September 30, 2011 was interest on the loan from CEL-SCI’s President ($177,109), the dividends paid on the mandatorily redeemable preferred stock ($30,371) that are considered to be interest in accordance with generally accepted accounting principles and accrued interest on the convertible notes ($115,500). The interest expense of $162,326 for the year ended September 30, 2010 was interest on the loan from CEL-SCI’s President, offset by the final $3,282 in amortization of the loan premium in October, 2009.
28
Fiscal 2010
During the year ended September 30, 2010, research and development expenses increased by $5,899,876 compared to the year ended September 30, 2009. This increase was due to continuing expenses relating to the preparation for the Phase III clinical trial on Multikine.
During the year ended September 30, 2010, general and administrative expenses increased by $614,215 compared to the year ended September 30, 2009, primarily due to legal fees caused by the Iroquois lawsuit.
Interest income during the year ended September 30, 2010 increased by $362,236 compared to the year ended September 30, 2009. The increase was due to the greater amount of capital CEL-SCI had for investment in money market funds.
The gain on derivative instruments of $28,843,772 for the year ended September 30, 2010, was the result of the change in the fair value of the derivative liabilities on the balance sheet. The Series A-E warrants issued in conjunction with several financings during the fiscal year ended September 30, 2009, as well as others are considered derivative liabilities and must be valued at the end of each period. The fluctuation of the price of CEL-SCI’s common stock is a major cause of derivative gains or losses.
The interest expense of $162,326 for the year ended September 30, 2010 was interest on the related party loan. Previous years included amortization of the Series K discount and the premium on the related party loan.
Research and Development Expenses
During the five years ended September 30, 2011 CEL-SCI’s research and development efforts involved Multikine and LEAPS. The table below shows the research and development expenses associated with each project during this five-year period.
| 2011 | 2010 | 2009 | 2008 | 2007 | ||||||||||||||||
| MULTIKINE | $ | 11,257,157 | $ | 10,868,046 | $ | 5,281,999 | $ | 3,765,258 | $ | 2,217,108 | ||||||||||
| LEAPS | 488,472 | 1,043,580 | 729,751 | 336,305 | 311,420 | |||||||||||||||
| TOTAL | $ | 11,745,629 | $ | 11,911,626 | $ | 6,011,750 | $ | 4,101,563 | $ | 2,528,528 | ||||||||||
In January 2007, CEL-SCI received a “no objection” letter from the FDA indicating that it could proceed with Phase III trials with Multikine in head & neck cancer patients. CEL-SCI had previously received a “no objection” letter from the Canadian Biologics and Genetic Therapies Directorate which enabled CEL-SCI to begin its Phase III clinical trial in Canada. Subsequently, CEL-SCI received go-ahead from the Polish, Hungarian, Russian, Israeli, Indian and Taiwanese regulators.
29
CEL-SCI’s Phase III clinical trial began in December 2010 after the completion and validation of CEL-SCI’s dedicated manufacturing facility.
As explained in Item 1 of this report, as of November 30, 2011, CEL-SCI was involved in a number of pre-clinical studies with respect to its LEAPS technology. As with Multikine, CEL-SCI does not know what obstacles it will encounter in future pre-clinical and clinical studies involving its LEAPS technology. Consequently, CEL-SCI cannot predict with any certainty the funds required for future research and clinical trials and the timing of future research and development projects.
Clinical and other studies necessary to obtain regulatory approval of a new drug involve significant costs and require several years to complete. The extent of CEL-SCI’s clinical trials and research programs are primarily based upon the amount of capital available to CEL-SCI and the extent to which CEL-SCI has received regulatory approvals for clinical trials. The inability of CEL-SCI to conduct clinical trials or research, whether due to a lack of capital or regulatory approval, will prevent CEL-SCI from completing the studies and research required to obtain regulatory approval for any products which CEL-SCI is developing. Without regulatory approval, CEL-SCI will be unable to sell any of its products.
Liquidity and Capital Resources
CEL-SCI has had only limited revenues from operations since its inception in March 1983. CEL-SCI has relied upon capital generated from the public and private offerings of its common stock and convertible notes. In addition, CEL-SCI has utilized short-term loans to meet its capital requirements. Capital raised by CEL-SCI has been expended primarily to acquire an exclusive worldwide license to use, and later purchase, certain patented and unpatented proprietary technology and know-how relating to the human immunological defense system. Capital has also been used for patent applications, debt repayment, research and development, administrative costs, and the construction of CEL-SCI’s laboratory facilities. CEL-SCI does not anticipate realizing significant revenues until it enters into licensing arrangements regarding its technology and know-how or until it receives regulatory approval to sell its products (which could take a number of years). As a result CEL-SCI has been dependent upon the proceeds from the sale of its securities to meet all of its liquidity and capital requirements and anticipates having to do so in the future.
CEL-SCI will be required to raise additional capital or find additional long-term financing in order to continue with its research efforts. The ability of CEL-SCI to complete the necessary clinical trials and obtain Federal Drug Administration (FDA) approval for the sale of products to be developed on a commercial basis is uncertain. Ultimately, CEL-SCI must complete the development of its products, obtain the appropriate regulatory approvals and obtain sufficient revenues to support its cost structure. CEL-SCI believes that, counting its cash on hand and access to the capital markets established over the years, it will have enough capital to support its operations for more than the next twelve months. The cash required to pay CEL-SCI’s outstanding convertible notes (in the principal amount of $2.97 million as of December 1, 2011), will be dependent on the price of CEL-SCI’s common stock prior to March 1, 2012, the maturity date of the notes. If CEL-SCI’s stock price is above $0.67, which is the conversion price of the notes, the notes may be converted into CEL-SCI common stock, in which case the notes, or part of the notes, will be retired without the payment of cash.
CEL-SCI has two partners who have agreed to participate in and pay for part of the Phase III clinical trial for Multikine. On December 29, 2010, CEL-SCI announced that it had commenced the Phase III clinical trial for Multikine. The net cost to CEL-SCI of the Phase III clinical trial is estimated to be $26 million.
30
In August 2007, CEL-SCI leased a building near Baltimore, Maryland. The building, which consists of approximately 73,000 square feet, has been remodeled in accordance with CEL-SCI’s specifications so that it can be used by CEL-SCI to manufacture Multikine for CEL-SCI’s Phase III clinical trials and sales of the drug if approved by the FDA. The lease expires on October 31, 2028, and requires annual base rent payments of approximately $1,667,000 during the twelve months ending September 30, 2011. See Item 1 of this report for more information concerning the terms of this lease.
On August 18, 2008, CEL-SCI sold 1,383,389 shares of common stock and 2,075,084 warrants in a private financing for $1,037,500. The shares were sold at $0.75, a significant premium over the closing price of CEL-SCI's common stock. In June 2009, an additional 1,166,667 shares and 1,815,698 warrants were issued to the investors as a result of a subsequent financing. In October 2011, an additional 833,333 shares and 1,296,927 warrants were issued to the investors as a result of a subsequent financing. Each warrant entitles the holder to purchase one share of CEL-SCI's common stock at a price of $0.30 per share at any time prior to August 18, 2014.
On March 6, 2009, CEL-SCI sold 3,750,000 Units as further consideration under a licensing agreement with an unrelated third party at a price of $0.20 per Unit, or $750,000 in total. Each Unit consisted of one share of CEL-SCI's common stock and two warrants. Each warrant entitles the holder to purchase one share of CEL-SCI's common stock at a price of $0.25 per share. The warrants are exercisable at any time prior to March 6, 2016.
Between June 23 and July 8, 2009, CEL-SCI sold 15,349,346 shares of its common stock at a price of $0.40 per share totaling $6,139,739. The investors in this offering also received 10,284,060 Series A warrants. Each Series A warrant entitles the holder to purchase one share of CEL-SCI’s common stock. The Series A warrants may be exercised at any time on or after December 24, 2009 and on or prior to December 24, 2014 at a price of $0.50 per share. As of September 30, 2011, 8,813,088 Series A warrants had been exercised. The remaining Series A warrants allow the holders to purchase up to 1,470,972 shares of CEL-SCI’s common stock.
On July 31, 2009, CEL-SCI borrowed $2,000,000 from two institutional investors. The loans were repaid on September 29, 2009. The Series B note holders also received Series B warrants which allow the holders to purchase up to 500,000 shares of CEL-SCI’s common stock at a price of $0.68 per share. The Series B warrants may be exercised at any time on or after March 3, 2010 and on or prior to September 4, 2014.
On August 20, 2009, CEL-SCI sold 10,784,435 shares of its common stock to a group of private investors for $4,852,995 or $0.45 per share. The investors also received Series C warrants which entitle the investors to purchase 5,392,217 shares of CEL-SCI’s common stock. The Series C warrants may be exercised at any time on or after February 20, 2010 and on or prior to February 20, 2015 at a price of $0.55 per share. As of September 30, 2011, 757,331 Series C warrants had been exercised. The remaining Series C warrants allow the holders to purchase up to 4,634,886 shares of CEL-SCI’s common stock.
31
On September 21, 2009, CEL-SCI sold 14,285,715 shares of its common stock to a group of private investors for $20,000,000 or $1.40 per share. The investors also received Series D warrants which entitle the investors to purchase up to 4,714,284 shares of CEL-SCI’s common stock. The Series D warrants may be exercised at any time prior to September 21, 2011, at a price of $1.50 per share. On September 21, 2011, 4,714,284 Series D warrants expired. In addition, the broker for the placement agent received 714,286 Series E warrants. The Series E warrants may be exercised at any time prior to August 12, 2014, at a price of $1.75.
Between December 2008 and June 2009, Maximilian de Clara, CEL-SCI’s President and a director, loaned CEL-SCI $1,104,057. The loan was initially payable at the end of March 2009, but was extended to the end of June 2009. At the time the loan was due, and in accordance with the loan agreement, CEL-SCI issued Mr. de Clara a warrant which entitles Mr. de Clara to purchase 1,648,244 shares of CEL-SCI’s common stock at a price of $0.40 per share. The warrant is exercisable at any time prior to December 24, 2014. Although the loan was to be repaid from the proceeds of CEL-SCI’s recent financing, CEL-SCI’s Directors deemed it beneficial not to repay the loan and negotiated a second extension of the loan with Mr. de Clara on terms similar to the June 2009 financing. Pursuant to the terms of the second extension the note was due on July 6, 2014, but, at Mr. de Clara’s option, the loan can be converted into shares of CEL-SCI’s common stock. Subsequently, on May 13, 2011, to recognize Mr. de Clara’s willingness to agree to subordinate his note to the convertible preferred shares and convertible debt as part of the settlement agreement, the Company extended the maturity date of the note to July 6, 2015. The number of shares which will be issued upon any conversion will be determined by dividing the amount to be converted by $0.40. As further consideration for the second extension, Mr. de Clara received warrants which allow Mr. de Clara to purchase 1,849,295 shares of CEL-SCI’s common stock at a price of $0.50 per share at any time prior to January 6, 2015. The loan from Mr. de Clara bears interest at 15% per year and is secured by a lien on substantially all of CEL-SCI’s assets. CEL-SCI does not have the right to prepay the loan without Mr. de Clara’s consent.
Between July 29, 2009 and September 30, 2011, CEL-SCI received approximately $15,624,400 from the exercise of stock options and other warrants (including a number of CEL-SCI’s Series A, J, K and L warrants) previously issued to private investors.
On December 10, 2010 CEL-SCI entered into a sales agreement with McNicoll Lewis & Vlak LLC relating to the sale of shares of its common stock which have been registered by means of a registration statement CEL-SCI filed with the Securities and Exchange Commission in July 2009. In accordance with the terms of the sales agreement, CEL-SCI may offer and sell shares of its common stock through McNicoll Lewis & Vlak acting as CEL-SCI’s agent. CEL-SCI may also sell its common stock to McNicoll Lewis & Vlak, as principal for its own account, at a price negotiated at the time of sale. On December 5, 2011 CEL-SCI, per the terms of the agreement, exercised its right to terminate the agreement.
Sales of CEL-SCI’s common stock, if any, may be made in sales deemed to be “at-the-market” equity offerings, including sales made directly on or through the NYSE Amex, sales made to or through a market maker other than on an exchange, in negotiated transactions at market prices prevailing at the time of sale or at prices related to prevailing market prices, and/or any other method permitted by law. CEL-SCI is not required to sell any shares to McNicoll Lewis & Vlak and McNicoll Lewis & Vlak is not required to sell any shares on CEL-SCI’s behalf or purchase any of CEL-SCI’s shares for its own account.
McNicoll Lewis & Vlak is entitled to a commission in an amount equal to the greater of 3% of the gross proceeds from each sale of the shares, or $0.025 for each share sold, provided, that, in no event will McNicoll Lewis & Vlak receive a commission greater than 8.0% of the gross proceeds from the sale of the shares.
32
During the year ended September 30, 2011 CEL-SCI sold 7,424,982 shares of its common stock to McNicoll Lewis & Vlak for $4,144,712, net of commissions and fees of $194,694 and attorney fees of $13,735.
Inventory increased by approximately $95,000 in the fiscal year ended September 30, 2011 as CEL-SCI continued to purchase supplies for the manufacturing of Multikine for the Phase III trial. In addition, prepaids increased by approximately $1,730,000 due to prepayment of certain Phase III clinical trial expenses.
In May 2011, CEL-SCI settled a lawsuit which had been filed in October 2009. Pursuant to the terms of the Settlement Agreement, CEL-SCI paid the plaintiffs $3,000,000 in cash and issued securities with a face value of $9,000,000 to the plaintiffs. See the discussion above pertaining to of the results of operation for fiscal 2011 for more information concerning the settlement and CEL-SCI’s obligation to repay notes in the principal amount of $4,950,000 as part of the settlement.
During the year ended September 30, 2011, CEL-SCI’s cash decreased by $22,307,649. Significant components of this decrease include 1) approximately $7.05 million paid towards the settlement of the lawsuit, 2) approximately $1.6 million for the defense of the lawsuit, 3) $1.8 million in prepayments for the Phase III clinical trial which CEL-SCI expects to be used during fiscal year 2012 and 4) research and development expenses of $11.7 million and 5) administrative expenses, excluding the lawsuit settlement, of $5.06 million. During the year ended September 30, 2011 CEL-SCI also received $4.6 million from the sale of stock and exercise of stock options and warrants.
In October 2011, CEL-SCI sold 13,333,334 shares of its common stock to private investors for $4,000,000, or $0.30 per share. The investors also received 12,000,000 Series F warrants. Each Series F warrant entitles the holder to purchase one share of CEL-SCI’s common stock at a price of $0.40 per share at any time prior to October 6, 2014. CEL-SCI paid the placement agent for this offering a commission consisting of $140,000 in cash and 666,667 Series G warrants. Each Series G warrant entitles the holder to purchase one share of CEL-SCI’s common stock at a price of $0.40 per share at any time prior to August 12, 2014.
Future Capital Requirements
CEL-SCI is currently running a large multi-national Phase III clinical trial for head and neck cancer. Head and neck cancer accounts for about 6% of the world’s annual cancer cases. This study, if successful, should address a major unmet medical need of a very large scale. Therefore the positive outcome of this trial carries the potential for a great amount of financial upside for shareholders. It is for this reason that CEL-SCI should have many avenues of funding available to it throughout the Phase III clinical trial. During 2011, CEL-SCI used an At The Market (ATM) transaction to raise money and, separately, raised money in a direct placement of shares and warrants to investors. While CEL-SCI cancelled the ATM in December 2011, management believes, based on current offers, that it could start the ATM again, if needed. CEL-SCI is also offered, on a regular basis, other financings. Management believes that, particularly under the current market conditions, it is imperative to be flexible to achieve the best outcome for the shareholders. Therefore, CEL-SCI expects that it will raise additional capital in fiscal year 2012 in the form of corporate partnerships, debt and/or equity financings to support its operations at its current rate. CEL-SCI believes that it will be able to obtain additional financing since Multikine is a Phase III product designed to treat cancer, an area that pharmaceutical companies are increasingly targeting. However, as stated in the CEL-SCI risk factors, there is no assurance that funds will be available to CEL-SCI. It is important to note that CEL-SCI’s expenditures for fiscal year 2011 included several very large non-recurring expenses that amounted to approximately $10 million dollars, mostly related to the lawsuit and the settlement of the lawsuit. These expenses, with the exception of the settlement payments through March 1, 2012, will not recur in fiscal year 2012, thereby reducing CEL-SCI’s expenditures significantly.
In general, CEL-SCI believes that it will be able to raise sufficient capital in 2012 to 1) expand the Phase III trial and 2) continue operations through December 2012. However, it is possible that CEL-SCI will not be able to generate enough cash to continue operations at its current level. CEL-SCI's registered independent public accounting firm has issued an audit opinion that includes an explanatory paragraph that expresses substantial doubt about CEL-SCI’s ability to continue as a going concern mainly due to continued losses from operations and future liquidity needs of CEL-SCI. CEL-SCI’s management has engaged in fundraising for over 20 years and believes that the manner in which it is proceeding will produce the best possible outcome for the shareholders. There can be no assurances that CEL-SCI will be successful in raising additional funds.
33
Other than funding operating losses, funding its research and development program, and paying its liabilities, CEL-SCI does not have any material capital commitments. Material future liabilities as of September 30, 2011 are as follows:
| Years Ending September 30, | ||||||||||||||||||||||||||||
| Total | 2012 | 2013 | 2014 | 2015 | 2016 | 2017 & thereafter | ||||||||||||||||||||||
| Operating Leases | $ | 33,346,809 | $ | 1,896,205 | $ | 1,855,890 | $ | 1,579,931 | $ | 1,572,839 | $ | 1,629,121 | $ | 24,812,823 | ||||||||||||||
| Employment Contracts | $ | 3,850,862 | $ | 1,282,878 | $ | 1,214,639 | $ | 464,004 | $ | 464,004 | $ | 425,337 | - | |||||||||||||||
| Convertible Notes | $ | 4,950,000 | $ | 4,950,000 | - | - | - | - | - | |||||||||||||||||||
| Interest on Notes | $ | 215,705 | $ | 215,705 | - | - | - | - | - | |||||||||||||||||||
For additional information on employment contracts, see Item 11 of this report.
Further, CEL-SCI has contingent obligations with vendors for work that will be completed in relation to the Phase III trial. The timing of these obligations cannot be determined at this time. The amount of these obligations for the Phase III trial is approximately $26 million.
CEL-SCI will need to raise additional funds, either through its existing warrants/options, through a debt or equity financing or a partnering arrangement, to complete the Phase III trial and bring Multikine to market.
Clinical and other studies necessary to obtain regulatory approval of a new drug involve significant costs and require several years to complete. The extent of CEL-SCI’s clinical trials and research programs are primarily based upon the amount of capital available to CEL-SCI and the extent to which CEL-SCI has received regulatory approvals for clinical trials. The inability of CEL-SCI to conduct clinical trials or research, whether due to a lack of capital or regulatory approval, will prevent CEL-SCI from completing the studies and research required to obtain regulatory approval for any products which CEL-SCI is developing. Without regulatory approval, CEL-SCI will be unable to sell any of its products.
In the absence of revenues, CEL-SCI will be required to raise additional funds through the sale of securities, debt financing or other arrangements in order to continue with its research efforts. However, there can be no assurance that such financing will be available or be available on favorable terms. Ultimately, CEL-SCI must complete the development of its products, obtain appropriate regulatory approvals and obtain sufficient revenues to support its cost structure.
Since all of CEL-SCI’s projects are under development CEL-SCI cannot predict with any certainty the funds required for future research and clinical trials, the timing of future research and development projects, or when it will be able to generate any revenue from the sale of any of its products.
CEL-SCI's cash flow and earnings are subject to fluctuations due to changes in interest rates on its bank accounts, and, to an immaterial extent, foreign currency exchange rates.
34
Critical Accounting Policies
CEL-SCI's significant accounting policies are more fully described in Note 1 to the consolidated financial statements included as part of this report. However, certain accounting policies are particularly important to the portrayal of financial position and results of operations and require the application of significant judgments by management. As a result, the consolidated financial statements are subject to an inherent degree of uncertainty. In applying those policies, management uses its judgment to determine the appropriate assumptions to be used in the determination of certain estimates. These estimates are based on CEL-SCI's historical experience, terms of existing contracts, observance of trends in the industry and information available from outside sources, as appropriate. CEL-SCI’s significant accounting policies include:
Patents —
Patent expenditures are capitalized and amortized using the straight-line method over 17 years. In the event changes in technology or other circumstances impair the value or life of the patent, appropriate adjustment in the asset value and period of amortization is made. An impairment loss is recognized when estimated future undiscounted cash flows expected to result from the use of the asset, and from disposition, is less than the carrying value of the asset. The amount of the impairment loss is the difference between the estimated fair value of the asset and its carrying value.
Stock Options and Warrants
— Effective October 1, 2005, the Company adopted the fair value recognition provisions of ASC 718 using the prospective transition method which requires the Company to apply the provisions of ASC 718 only to awards granted, modified, repurchased or cancelled after October 1, 2005. Compensation cost for all stock-based awards after October 1, 2005 is measured at fair value as of the grant date in accordance with the provisions of ASC 718. The fair value of the stock options is calculated using the Black-Scholes option pricing model. The Black-Scholes model requires various judgmental assumptions including volatility, forfeiture rates and expected option life. The stock-based compensation cost is recognized on the accelerated method as expense over the requisite service or vesting period.
Options to non-employees are accounted for in accordance with Codification 505-50-S99-1 Accounting for Equity Instruments That Are Issued to Other Than Employees for Acquiring, or in Conjunction with Selling, Goods or Services. Accordingly, compensation is recognized when goods or services are received and is measured using the Black-Scholes valuation model. The Black-Scholes model requires CEL-SCI’s management to make assumptions regarding the fair value of the options at the date of grant and the expected life of the options.
Asset Valuations and Review for Potential Impairments
— CEL-SCI reviews its fixed assets, intangibles and deferred rent every fiscal quarter. This review requires that CEL-SCI make assumptions regarding the value of these assets and the changes in circumstances that would affect the carrying value of these assets. If such analysis indicates that a possible impairment may exist, CEL-SCI is then required to estimate the fair value of the asset and, as deemed appropriate, expense all or a portion of the asset. The determination of fair value includes numerous uncertainties, such as the impact of competition on future value. CEL-SCI believes that it has made reasonable estimates and judgments in determining whether its long-lived assets have been impaired; however, if there is a material change in the assumptions used in its determination of fair values or if there is a material change in economic conditions or circumstances influencing fair value, CEL-SCI could be required to recognize certain impairment charges in the future. As a result of the reviews, no changes in asset values were required.
35
Prepaid Expenses and Inventory —
Inventory consists of bulk purchases of laboratory supplies used on a daily basis in the lab and items that will be used for future production. The items in inventory are expensed when used in production or daily activity as Research and Development expenses. These items are disposables and consumables and can be used for both the manufacturing of Multikine for clinical studies and in the laboratory for quality control and bioassay use. They can be used in training, testing and daily laboratory activities. Prepaid expenses are payments for services over a long period and are expensed over the time period for which the service is rendered.
Derivative Instruments —
CEL-SCI enters into financing arrangements that consist of freestanding derivative instruments or hybrid instruments that contain embedded derivative features. CEL-SCI accounts for these arrangement in accordance with Codification 815-10-50, “
Accounting for Derivative Instruments and Hedging Activities
”, “
Accounting for Derivative Financial Instruments Indexed to, and Potentially Settled in, a Company's Own Stock
”, as well as related interpretations of these standards. In accordance with accounting principles generally accepted in the United States (“GAAP”), derivative instruments and hybrid instruments are recognized as either assets or liabilities in the statement of financial position and are measured at fair value with gains or losses recognized in earnings or other comprehensive income depending on the nature of the derivative or hybrid instruments. Embedded derivatives that are not clearly and closely related to the host contract are bifurcated and recognized at fair value with changes in fair value recognized as either a gain or loss in earnings if they can be reliably measured. When the fair value of embedded derivative features cannot be reliably measured, CEL-SCI measures and reports the entire hybrid instrument at fair value with changes in fair value recognized as either a gain or loss in earnings. CEL-SCI determines the fair value of derivative instruments and hybrid instruments based on available market data using appropriate valuation models, giving consideration to all of the rights and obligations of each instrument and precluding the use of “blockage” discounts or premiums in determining the fair value of a large block of financial instruments. Fair value under these conditions does not necessarily represent fair value determined using valuation standards that give consideration to blockage discounts and other factors that may be considered by market participants in establishing fair value.
Accounting Pronouncements
In January 2010, the FASB issued ASU 2010-06, “
Fair Value Measurements and Disclosures”,
which requires new disclosures for transfers in and out of Level 1 and Level 2 and activity in Level 3 of the fair value hierarchy. ASU 2010-06 requires separate disclosure of the amounts of significant transfers in and out of Level 1 and Level 2 fair value measurements and a description of the reasons for the transfers. In the reconciliation for fair value measurements using Level 3 inputs, a reporting entity should present separately information about purchases, sales, issuances and settlements. ASU 2010-06 is effective for new disclosures and clarification of existing disclosures for interim and annual periods beginning after December 15, 2009 except for disclosures about purchases, sales, issuances and settlements in the Level 3 activity rollforward, which are effective for fiscal years beginning after December 15, 2010, and for interim periods within those fiscal years. The adoption of ASU 2010-06 did not have a material impact on its financial statements.
In May 2011, the FASB issued Accounting Standards Update (ASU) No. 2011-04,
“Fair Value Measurement (Topic 820) – Amendments to Achieve Common Fair Value Measurement and Disclosure Requirements in U.S. GAAP and IFRSs”
, which is effective for interim and annual periods beginning after December 15, 2011. The ASU is mainly the result of the joint efforts by the FASB and the International Accounting Standards Board to develop a single, converged fair value framework on how to measure fair value and common disclosure requirements for fair value measurements. The ASU amends various fair value guidance such as requiring the highest-and-best-use and valuation-premise concepts only to measuring the fair value of nonfinancial assets and prohibits the use of blockage factors and control premiums when measuring fair value. In addition, the ASU expands disclosure requirements particularly for Level 3 inputs and requires disclosure of the level in the fair value hierarchy of items that are not measured at fair value in the statement of financial position but whose fair value must be disclosed. The Company does not believe that this amendment will have a material impact on its financial statements.
36
|
ITEM 7A.
|
QUANTITATIVE AND QUALITATIVE DISCLOSURE ABOUT MARKET RISKS
|
Market risk is the potential change in an instrument's value caused by, for example, fluctuations in interest and currency exchange rates. CEL-SCI enters into financing arrangements that are or include freestanding derivative instruments or that are, or include, hybrid instruments that contain embedded derivative features. CEL-SCI does not enter into derivative instruments for trading purposes. Additional information is presented in the notes to consolidated financial statements. The fair value of these instruments is affected primarily by volatility of the trading prices of the CEL-SCI’s common stock. For three years ended September 30, 2011, CEL-SCI recognized a gain or (loss) of $4,432,148, $28,843,772 and $(28,491,650), respectively, resulting from changes in fair value of derivative instruments. CEL-SCI has exposure to risks associated with foreign exchange rate changes because some of the expenses related to the Phase III trial are transacted in a foreign currency. The interest risk on investments on September 30, 2011 was considered immaterial due to the fact that the interest rates at that time were nominal at best and CEL-SCI keeps its cash and cash equivalents in short term maturities.
See the consolidated financial statements included with this Report.
|
ITEM 9.
|
CHANGES IN AND DISAGREEMENTS WITH ACCOUNTANTS ON ACCOUNTING AND FINANCIAL DISCLOSURE
|
Not applicable
Under the direction and with the participation of CEL-SCI’s management, including CEL-SCI’s Chief Executive Officer and Chief Financial Officer, CEL-SCI carried out an evaluation of the effectiveness of the design and operation of its disclosure controls and procedures as of September 30, 2011. CEL-SCI maintains disclosure controls and procedures that are designed to ensure that information required to be disclosed in its periodic reports with the Securities and Exchange Commission is recorded, processed, summarized and reported within the time periods specified in the SEC’s rules and regulations, and that such information is accumulated and communicated to CEL-SCI’s management, including its principal executive officer and principal financial officer, as appropriate, to allow timely decisions regarding required disclosure. CEL-SCI’s disclosure controls and procedures are designed to provide a reasonable level of assurance of reaching its desired disclosure control objectives. Based on the evaluation, the Chief Executive and Principal Financial Officer has concluded that CEL-SCI’s disclosure controls were effective as of September 30, 2011.
Management’s Report on Internal Control Over Financial Reporting
CEL-SCI’s management is responsible for establishing and maintaining adequate internal control over financial reporting and for the assessment of the effectiveness of internal control over financial reporting. As defined by the Securities and Exchange Commission, internal control over financial reporting is a process designed by, or under the supervision of CEL-SCI’s principal executive officer and principal financial officer and implemented by CEL-SCI’s Board of Directors, management and other personnel, to provide reasonable assurance regarding the reliability of financial reporting and the preparation of CEL-SCI’s financial statements in accordance with U.S. generally accepted accounting principles.
Because of its inherent limitations, internal control over financial reporting may not prevent or detect misstatements. Also, projections of any evaluation of effectiveness to future periods are subject to the risk that controls may become inadequate because of changes in conditions, or that the degree of compliance with the policies or procedures may deteriorate.
37
Geert Kersten, CEL-SCI’s Chief Executive and Principal Financial Officer, evaluated the effectiveness of CEL-SCI’s internal control over financial reporting as of September 30, 2011 based on criteria established in Internal Control - Integrated Framework issued by the Committee of Sponsoring Organizations of the Treadway Commission, or the COSO Framework. Management’s assessment included an evaluation of the design of CEL-SCI’s internal control over financial reporting and testing of the operational effectiveness of those controls.
Based on this evaluation, Mr. Kersten concluded that CEL-SCI’s internal control over financial reporting was effective as of September 30, 2011.
There was no change in CEL-SCI’s internal control over financial reporting that occurred during the fiscal year ended September 30, 2011 that has materially affected, or is reasonably likely to materially affect, CEL-SCI’s internal control over financial reporting.
CEL-SCI’s independent registered public accounting firm BDO USA, LLP has issued an attestation report on CEL-SCI’s internal control over financial reporting.
None.
Officers and Directors
| Name | Age | Position | ||
| Maximilian de Clara | 81 | Director and President | ||
| Geert R. Kersten, Esq. | 52 | Director, Chief Executive Officer and Treasurer | ||
| Patricia B. Prichep | 60 | Senior Vice President of Operations and Secretary | ||
| Dr. Eyal Talor | 55 | Chief Scientific Officer | ||
| Dr. Daniel H. Zimmerman | 70 | Senior Vice President of Research, Cellular Immunology | ||
| John Cipriano | 69 | Senior Vice President of Regulatory Affairs | ||
| Alexander G. Esterhazy | 69 | Director | ||
| Dr. C. Richard Kinsolving | 75 | Director | ||
| Dr. Peter R. Young | 66 | Director |
The directors of CEL-SCI serve in such capacity until the next annual meeting of CEL-SCI's shareholders and until their successors have been duly elected and qualified. The officers of CEL-SCI serve at the discretion of CEL-SCI's directors.
Mr. Maximilian de Clara, by virtue of his position as an officer and director of CEL-SCI, may be deemed to be the "parent" and "founder" of CEL-SCI as those terms are defined under applicable rules and regulations of the SEC.
All of CEL-SCI’s directors have served as directors for a significant period of time. Consequently, their long-standing experience with CEL-SCI benefits both CEL-SCI and its shareholders.
The principal occupations of CEL-SCI's officers and directors, during the past several years, are as follows:
38
Maximilian de Clara has been a Director of CEL-SCI since its inception in March l983, and has been President of CEL-SCI since July l983. Prior to his affiliation with CEL-SCI, and since at least l978, Mr. de Clara was involved in the management of his personal investments and personally funding research in the fields of biotechnology and biomedicine. Mr. de Clara attended the medical school of the University of Munich from l949 to l955, but left before he received a medical degree. During the summers of l954 and l955, he worked as a research assistant at the University of Istanbul in the field of cancer research. For his efforts and dedication to research and development in the fight against cancer and AIDS, Mr. de Clara was awarded the "Pour le Merit" honorary medal of the Austrian Military Order "Merito Navale" as well as the honor cross of the Austrian Albert Schweitzer Society.
Geert Kersten has served in his current leadership role at CEL-SCI since 1995. Mr. Kersten has been with CEL-SCI from the early days of its inception since 1987. He has been involved in the pioneering field of cancer immunotherapy for over two decades and has successfully steered CEL-SCI through many challenging cycles in the biotechnology industry. Mr. Kersten also provides CEL-SCI with significant expertise in the fields of finance and law and has a unique vision of how CEL-SCI 's Multikine product could potentially change the way cancer is treated. Prior to CEL-SCI, Mr. Kersten worked at the law firm of Finley & Kumble and worked at Source Capital, an investment banking firm located in McLean, VA. He is a native of Germany, graduated from Millfield School in England, and completed his studies in the US. Mr. Kersten completed his Undergraduate Degree in Accounting, received an M.B.A. from George Washington University, and a law degree (J.D.) from American University in Washington, DC.
Patricia B. Prichep joined CEL-SCI in 1992 and has been CEL-SCI's Senior Vice President of Operations since March 1994. Between December 1992 and March 1994, Ms. Prichep was CEL-SCI's Director of Operations. Ms. Prichep became CEL-SCI's Corporate Secretary in May 2000. She is responsible for all day-to-day operations of CEL-SCI, including human resources and is the liaison with CEL-SCI’s independent registered public accounting firm for financial reporting. From June 1990 to December 1992, Ms. Prichep was the Manager of Quality and Productivity for the NASD’s Management, Systems and Support Department. She was responsible for the internal auditing and work flow analysis of operations. Between 1982 and 1990, Ms. Prichep was Vice President and Operations Manager for Source Capital, Ltd. She handled all operations and compliance for CEL-SCI
and was licensed as a securities broker. Ms. Prichep received her B.A. from the University of Bridgeport in Connecticut
.
Eyal Talor, Ph.D. joined CEL-SCI in October 1993. In October 2009, Dr. Talor was promoted to Chief Scientific Officer. Prior to this promotion he was the Senior Vice President of Research and Manufacturing since March of 1994. He is a clinical immunologist with over 19 years of hands-on management of clinical research and drug development for immunotherapy application; pre-clinical to Phase III, in the biopharmaceutical industry. His expertise includes; biopharmaceutical R&D and Biologics product development, GMP (Good Manufacturing Practices) manufacture, Quality Control testing, and the design and building of GMP manufacturing and testing facilities. He served as Director of Clinical Laboratories (certified by the State of Maryland) and has experience in the design of clinical trials (Phase I – III) and GCP (Good Clinical Practices) requirements. He also has broad experience in the different aspects of biological assay development, analytical methods validation, raw material specifications, and QC (Quality Control) tests development under FDA/GMP, USP, and ICH guidelines. He has extensive experience in the preparation of documentation for IND and other regulatory submissions. His scientific area of expertise encompasses immune response assessment. He is the author of over 25 publications and has published a number of reviews on immune regulations in relation to clinical immunology. Before coming to CEL-SCI, he was Director of R&D and Clinical Development at CBL, Inc., Principal Scientist - Project Director, and Clinical Laboratory Director at SRA Technologies, Inc. Prior to that he was a full time faculty member at The Johns Hopkins University, Medical Intuitions; School of Public Health. He holds two US patents; one on Multikine’s composition of matter and method of use in cancer, and one on a platform Peptide technology (‘Adapt’) for the treatment of autoimmune diseases, asthma, allergy, and transplantation rejection. He also has numerous product and process inventions as well as a number of pending US and PCT patent applications. He received his Ph.D. in Microbiology and Immunology from the University of Ottawa, Ottawa, Ontario, Canada, and had post-doctoral training in clinical and cellular immunology at The John Hopkins University, Baltimore, Maryland, USA. He holds an Adjunct Associate teaching position at the Johns Hopkins University Medical Institutions.
39
Daniel H. Zimmerman, Ph.D., has been CEL-SCI's Senior Vice President of Cellular Immunology between 1996 and December 2008 and again since November 2009. He joined CEL-SCI in January 1996 as the Vice President of Research, Cellular Immunology. Dr. Zimmerman founded CELL-MED, Inc. and was its president from 1987-1995. From 1973-1987, Dr. Zimmerman served in various positions at Electronucleonics, Inc. His positions included: Scientist, Senior Scientist, Technical Director and Program Manager. Dr Zimmerman held various teaching positions at Montgomery College between 1987 and 1995. Dr. Zimmerman holds over a dozen US patents as well as many foreign equivalent patents. He is the author of over 40 scientific publications in the area of immunology and infectious diseases. He has been awarded numerous grants from NIH and DOD. From 1969-1973, Dr. Zimmerman was a Senior Staff Fellow at NIH. For the following 25 years, he continued on at NIH as a guest worker. Dr. Zimmerman received a Ph.D. in Biochemistry in 1969, a Masters in Zoology in 1966 from the University of Florida and a B.S. in Biology from Emory and Henry College in 1963.
John Cipriano, has been CEL-SCI’s Senior Vice President of Regulatory Affairs between March 2004 and December 2008 and again since October 2009. Mr. Cipriano brings to CEL-SCI over 30 years of experience in both biotech and pharmaceutical companies. In addition, he held positions at the United States Food and Drug Administration (FDA) as Deputy Director, Division of Biologics Investigational New Drugs, Office of Biologics Research and Review and was the Deputy Director, IND Branch, Division of Biologics Evaluation, Office of Biologics. Mr. Cipriano completed his B.S. in Pharmacy from the Massachusetts College of Pharmacy in Boston, Massachusetts and his M.S. in Pharmaceutical Chemistry from Purdue University in West Lafayette, Indiana.
Alexander G. Esterhazy has been a Director of CEL-SCI since December 1999 and has been an independent financial advisor since November 1997. Between July 1991 and October 1997, Mr. Esterhazy was a senior partner of Corpofina S.A. Geneva, a firm engaged in mergers, acquisitions and portfolio management. Between January 1988 and July 1991, Mr. Esterhazy was a managing director of DG Bank in Switzerland. During this period Mr. Esterhazy was in charge of the Geneva, Switzerland branch of the DG Bank, founded and served as Vice President of DG Finance (Paris) and was the President and Chief Executive Officer of DG-Bourse, a securities brokerage firm.
C. Richard Kinsolving, Ph.D. has been a Director of CEL-SCI since April 2001. Since February 1999, Dr. Kinsolving has been the Chief Executive Officer of BioPharmacon, a pharmaceutical development company. Between December 1992 and February 1999, Dr. Kinsolving was the President of Immuno-Rx, Inc., a company engaged in immuno-pharmaceutical development. Between December 1991 and September 1995, Dr. Kinsolving was President of Bestechnology, Inc. a nonmedical research and development company producing bacterial preparations for industrial use. Dr. Kinsolving received his Ph.D. in Pharmacology from Emory University (1970), his Masters degree in Physiology/Chemistry from Vanderbilt University (1962), and his Bachelor's degree in Chemistry from Tennessee Tech. University (1957).
Peter R. Young, Ph.D. has been a Director of CEL-SCI since August 2002. Dr. Young has been a senior executive within the pharmaceutical industry in the United States and Canada for most of his career. Over the last 20 years he has primarily held positions of Chief Executive Officer or Chief Financial Officer and has extensive experience with acquisitions and equity financings. Since November 2001, Dr. Young has been the President of Agnus Dei, LLC, which acts as a partner in an organization managing immune system clinics which treat patients with diseases such as cancer, multiple sclerosis and hepatitis. Since January 2003, Dr. Young has been the President and Chief Executive Officer of SRL Technology, Inc., a company involved in the development of pharmaceutical (drug) delivery systems. Between 1998 and 2001, Dr. Young was the Chief Financial Officer of Adams Laboratories, Inc. Dr. Young received his Ph.D. in Organic Chemistry from the University of Bristol, England (1969), and his Bachelor's degree in Honors Chemistry, Mathematics and Economics also from the University of Bristol, England (1966).
All of CEL-SCI's officers devote substantially all of their time to CEL-SCI's business.
40
CEL-SCI’s Board of Directors does not have a “leadership structure”, as such, since each director is entitled to introduce resolutions to be considered by the Board and each director is entitled to one vote on any resolution considered by the Board. CEL-SCI’s Chief Executive Officer is not the Chairman of CEL-SCI’s Board of Directors.
CEL-SCI’s Board of Directors has the ultimate responsibility to evaluate and respond to risks facing CEL-SCI. CEL-SCI’s Board of Directors fulfills its obligations in this regard by meeting on a regular basis and communicating, when necessary, with CEL-SCI’s officers.
Alexander G. Esterhazy, Dr. C. Richard Kinsolving and Dr. Peter R. Young are independent directors as that term is defined in section 803 of the listing standards of the NYSE Amex.
CEL-SCI has adopted a Code of Ethics which is applicable to CEL-SCI’S principal executive, financial, and accounting officers and persons performing similar functions. The Code of Ethics is available on CEL-SCI’s website, located at
www.cel-sci.com.
If a violation of this code of ethics act is discovered or suspected, the Senior Officer must (anonymously, if desired) send a detailed note, with relevant documents, to CEL-SCI’s Audit Committee, c/o Dr. Peter Young, 2500 Marketplace Drive, Unit 431, Waco, TX 76711
.
For purposes of electing directors at its annual meeting CEL-SCI does not have a nominating committee or a committee performing similar functions. CEL-SCI’s Board of Directors does not believe a nominating committee is necessary since CEL-SCI’s Board of Directors is small and the Board of Directors as a whole performs this function. The nominees to the Board of Directors are selected by a majority vote of CEL-SCI’s independent directors.
CEL-SCI does not have any policy regarding the consideration of director candidates recommended by shareholders since a shareholder has never recommended a nominee to the Board of Directors and under Colorado law, any shareholder can nominate a person for election of a director at the annual shareholders’ meeting. However, CEL-SCI’s Board of Directors will consider candidates recommended by shareholders. To submit a candidate for the Board of Directors the shareholder should send the name, address and telephone number of the candidate, together with any relevant background or biographical information, to CEL-SCI’s Chief Executive Officer, at the address shown on the cover page of this proxy statement. The Board has not established any specific qualifications or skills a nominee must meet to serve as a director. Although the Board does not have any process for identifying and evaluating director nominees, the Board does not believe there would be any differences in the manner in which the Board evaluates nominees submitted by shareholders as opposed to nominees submitted by any other person.
CEL-SCI does not have a policy with regard to Board member’s attendance at annual meetings. All Board members, with the exception of Maximilian de Clara and Alexander Esterhazy, attended the last annual shareholder’s meeting held on April 15, 2011.
Holders of CEL-SCI’s common stock can send written communications to CEL-SCI’s entire Board of Directors, or to one or more Board members, by addressing the communication to “the Board of Directors” or to one or more directors, specifying the director or directors by name, and sending the communication to CEL-SCI’s offices in Vienna, Virginia. Communications addressed to the Board of Directors as whole will be delivered to each Board member. Communications addressed to a specific director (or directors) will be delivered to the director (or directors) specified.
Security holder communications not sent to the Board of Directors as a whole or to specified Board members are not relayed to Board members.
41
Compensation Discussion and Analysis
This Compensation Discussion and Analysis (CD&A) outlines CEL-SCI’s compensation philosophy, objectives and process for its executive officers. This CD&A includes information on how compensation decisions are made, the overall objectives of CEL-SCI’s compensation program, a description of the various components of compensation that are provided, and additional information pertinent to understanding CEL-SCI’s executive officer compensation program.
The Compensation Committee determines the compensation of CEL-SCI’s Chief Executive Officer and President and delegates to the Chief Executive Officer the responsibility to determine the base salaries of all officers other than himself under the constraints of an overall limitation on the total amount of compensation to be paid to them.
Compensation Philosophy
CEL-SCI’s compensation philosophy extends to all employees, including executive officers, and is designed to align employee and shareholder interests. The philosophy’s objective is to pay fairly based upon the employee’s position, experience and individual performance. Employees may be rewarded through additional compensation when CEL-SCI meets or exceeds targeted business objectives. Generally, under CEL-SCI’s compensation philosophy, as an employee’s level of responsibility increases, a greater portion of his or her total potential compensation becomes contingent upon annual performance.
A substantial portion of an executive's compensation incorporates performance criteria that support and reward achievement of CEL-SCI’s long term business goals.
The fundamental principles of CEL-SCI’s compensation philosophy are described below:
|
●
|
Market-driven.
Compensation programs are structured to be competitive both in their design and in the total compensation that they offer.
|
|
●
|
Performance-based.
Certain officers have some portion of their incentive compensation linked to CEL-SCI’s performance. The application of performance measures as well as the form of the reward may vary depending on the employee’s position and responsibilities.
|
Based on a review of its compensation programs, CEL-SCI does not believe that such programs encourage any of its employees to take risks that would be likely to have a material adverse effect on CEL-SCI. CEL-SCI reached this conclusion based on the following:
|
●
|
The salaries paid to employees are consistent with the employees’ duties and responsibilities.
|
|
●
|
Employees who have high impact relative to the expectations of their job duties and functions are rewarded.
|
|
●
|
CEL-SCI retains employees who have skills critical to its long term success.
|
42
Review of Executive Officer Compensation
CEL-SCI’s current policy is that the various elements of the compensation package are not interrelated in that gains or losses from past equity incentives are not factored into the determination of other compensation. For instance, if options that are granted in a previous year become underwater the next year, the Committee does not take that into consideration in determining the amount of the options or restricted stock to be granted the next year. Similarly, if the options or restricted shares granted in a previous year become extremely valuable, the Committee does not take that into consideration in determining the options or restricted stock to be awarded for the next year.
CEL-SCI does not have a policy with regard to the adjustment or recovery of awards or payments if relevant performance measures upon which they are based are restated or otherwise adjusted in a manner that would reduce the size of an award or payment.
Components of Compensation—Executive Officers
CEL-SCI’s executive officers are compensated through the following three components:
|
●
|
Base Salary
|
|
●
|
Long-Term Incentives (stock options and/or grants of stock)
|
|
●
|
Benefits
|
These components provide a balanced mix of base compensation and compensation that is contingent upon each executive officer’s individual performance. A goal of the compensation program is to provide executive officers with a reasonable level of security through base salary and benefits. CEL-SCI wants to ensure that the compensation programs are appropriately designed to encourage executive officer retention and motivation to create shareholder value. The Compensation Committee believes that CEL-SCI’s stockholders are best served when CEL-SCI can attract and retain talented executives by providing compensation packages that are competitive but fair.
In past years, base salaries, benefits and incentive compensation opportunities were generally targeted near the median of general survey market data derived from indices covering similar biotech/pharmaceutical companies. The companies included Achillion Pharmaceuticals, Inc., Acura Pharmaceutical, Inc., Alimera Sciences, Inc., Agenus Inc., ARCA biopharma (ARCA Discovery), Cadence Pharmaceuticals, Inc., Chelsea Therapeutics, Inc., Cortex Pharmaceuticals, Inc., EpiCept Corp., IGI Laboratories Inc., Inhibitex, Inc., Medicis Technologies Corp., NeurogesX, Inc., Orexigen Therapeutics Inc., Pharmacyclics, Inc., Resverlogix Corp., SCOLR Pharma, Inc., StemCells, Inc., Psychemedics Corporation, Molecular Insight Pharmaceuticals, Inc., Nabi Biopharmaceuticals, NuPathe Inc. and POZEN, Inc. CEL-SCI has not used third party consultants to provide it with recommendations or reports.
43
Base Salaries
Base salaries generally have been targeted to be competitive when compared to the salary levels of persons holding similar positions in other pharmaceutical companies and other publicly traded companies of comparable size. Each executive officer’s respective responsibilities, experience, expertise and individual performance are considered.
A further consideration in establishing compensation for the senior employees is their long term history with CEL-SCI. Taken into consideration are factors that have helped CEL-SCI survive in times when it was financially extremely weak, such as: willingness to accept salary cuts, willingness not to be paid at all for extended time periods, and in general an attitude that helped CEL-SCI survive during financially difficult times. For example, Geert Kersten, Maximilian de Clara and Patricia Prichep were without any salary between September 2008 and June 2009. Other senior members took substantial salary cuts, all geared towards helping CEL-SCI survive. In all of these cases the officers continued to work without any guarantee of payment.
Long-Term Incentives
Stock grants and option grants help to align the interests of CEL-SCI’s employees with those of its shareholders. Options and stock grants are made under CEL-SCI’s Stock Option, Stock Bonus and Stock Compensation Plans. Options are granted with exercise prices equal to the closing price of CEL-SCI’s common stock on the day immediately preceding the date of grant, with pro rata vesting at the end of each of the following three years.
CEL-SCI believes that grants of equity-based compensation:
|
●
|
Enhance the link between the creation of shareholder value and long-term executive incentive compensation;
|
|
●
|
Provide focus, motivation and retention incentive; and
|
|
●
|
Provide competitive levels of total compensation.
|
CEL-SCI’s management believes that the pricing for biotechnology stocks is highly inefficient until the time of product sales. As such any long term compensation tied to progress as measured by share price is not as efficient as it should be. However, CEL-SCI’s Compensation Committee has not been able to substitute a better measurement and therefore continues to believe that stock grants and option grants best align the needs of the corporation and the employee with those of the shareholders.
Benefits
In addition to cash and equity compensation programs, executive officers participate in the health and welfare benefit programs available to other employees. In a few limited circumstances, CEL-SCI provides other benefits to certain executive officers, such as car allowances.
All executive officers are eligible to participate in CEL-SCI’s 401(k) plan on the same basis as its other employees. CEL-SCI matches 100% of each employee’s contribution up to the first 6% of his or her salary.
44
The following table sets forth in summary form the compensation received by (i) the Chief Executive Officer of CEL-SCI and (ii) by each other executive officer of CEL-SCI who received in excess of $100,000 during the three fiscal years ended September 30, 2011.
|
Restricted Stock
|
Option
|
All Other Annual
|
|||||||||||||||||||||||
|
|
Fiscal
|
Salary
|
Bonus
|
Awards
|
Awards
|
Compensation
|
|||||||||||||||||||
|
Name and Princi
pal Position
|
Year
|
(1) | (2) | (3) | (4) | (5) |
Total
|
||||||||||||||||||
| $ | $ | $ | $ | $ | $ | ||||||||||||||||||||
|
Maximilian de Clara,
|
2011
|
363,000 | -- | -- | 176,709 | 105,226 | 644,935 | ||||||||||||||||||
|
President
|
2010
|
363,000 | -- | -- | 107,424 | 102,186 | 572,610 | ||||||||||||||||||
|
2009
|
334,720 | -- | 205,000 | 531,236 | 83,274 | 1,154,230 | |||||||||||||||||||
|
Geert R. Kersten,
|
2011
|
464,005 | -- | 14,700 | 207,314 | 57,656 | 743,675 | ||||||||||||||||||
|
Chief Executive
Officer and
Treasurer
|
2010
|
454,009 | 220,995 | 11,025 | 128,909 | 55,309 | 870,247 | ||||||||||||||||||
|
|
2009
|
408,691 | -- | 5,000 | 1,735,284 | 34,892 | 2,183,867 | ||||||||||||||||||
|
|
|||||||||||||||||||||||||
|
Patricia B. Prichep
|
2011
|
204,013 | -- | 12,541 | 99,141 | 6,031 | 321,726 | ||||||||||||||||||
|
Senior Vice President
of Operations and
Secretary
|
2010
|
199,898 | -- | 11,790 | 64,455 | 6,027 | 282,170 | ||||||||||||||||||
|
|
2009
|
174,913 | -- | -- | 1,142,155 | 4,225 | 1,321,293 | ||||||||||||||||||
|
|
|||||||||||||||||||||||||
|
Eyal Talor, Ph.D.
|
2011
|
251,861 | -- | 9,600 | 100,362 | 6,031 | 367,854 | ||||||||||||||||||
|
Chief Scientific
Officer
|
2010
|
239,868 | -- | 15,623 | 64,455 | 6,027 | 325,973 | ||||||||||||||||||
|
|
2009
|
212,265 | -- | -- | 1,044,566 | 4,225 | 1,261,056 | ||||||||||||||||||
| Daniel Zimmerman, Ph.D. |
2011
|
193,260 | -- | 11,896 | 98,948 | 6,031 | 310,135 | ||||||||||||||||||
|
Senior Vice President of
Research. Cellular
Immunology (6)
|
2010
|
165,800 | -- | 9,233 | 64,455 | 5,027 | 244,515 | ||||||||||||||||||
|
|
2009
|
47,124 | -- | -- | -- | 875 | 47,999 | ||||||||||||||||||
|
|
|||||||||||||||||||||||||
|
John Cipriano
|
2011
|
178,870 | -- | -- | 91,815 | 31 | 270,716 | ||||||||||||||||||
|
Senior Vice President
of Regulatory Affairs (7)
|
2010
|
175,952 | -- | -- | 240,711 | 27 | 416,690 | ||||||||||||||||||
|
|
2009
|
48,594 | -- | -- | -- | 25 | 48,619 | ||||||||||||||||||
__________
|
(1)
|
The dollar value of base salary (cash and non-cash) earned.
|
|
(2)
|
The dollar value of bonus (cash and non-cash) earned.
|
|
(3)
|
During the periods covered by the table, the value of the shares of restricted stock issued as compensation for services to the persons listed in the table. In the case of Mr. de Clara, during three years ended September 30, 2011, 2010, and 2009, $0, $0 and $200,000, respectively, were paid in restricted shares of CEL-SCI’s common stock which cannot be sold in the public market for a period of three years after the date of issuance. In the case of all other persons listed in the table, the shares were issued as CEL-SCI's contribution on behalf of the named officer to CEL-SCI's 401(k) retirement plan and restricted shares issued at the market price from the Stock Compensation Plan. The value of all stock awarded during the periods covered by the table are calculated according to ASC 718-10-30-3 which represented the grant date fair value.
|
|
(4)
|
The greatest part of the value in FY 2009 was derived from options awarded to employees who did not collect a salary, or reduced or deferred their salary between September 15, 2008 and June 30, 2009. For example, Mr. de Clara, Mr. Kersten and Ms. Prichep did not collect any salary between September 30, 2008 and June 30, 2009. The fair value of all stock options granted during the periods covered by the table are calculated on the grant date in accordance with ASC 718-10-30-3 which represented the grant date fair value
|
45
|
(5)
|
All other compensation received that CEL-SCI could not properly report in any other column of the table including annual contributions or other allocations to vested and unvested defined contribution plans, and the dollar value of any insurance premiums paid by, or on behalf of, CEL-SCI with respect to term life insurance for the benefit of the named executive officer, and the full dollar value of the remainder of the premiums paid by, or on behalf of, CEL-SCI and car allowances paid by CEL-SCI. Includes board of directors fees for Mr. de Clara and Mr. Kersten.
|
|
(6)
|
Dr. Zimmerman was CEL-SCI’s Senior Vice President of Research, Cellular Immunology between January 1996 and December 2008 and since November 2009.
|
|
(7)
|
Mr. Cipriano was CEL-SCI’s Senior Vice President of Regulatory Affairs between March 2004 and December 2008 and since October 2009.
|
|
(8)
|
In 2009, CEL-SCI made performance share awards to the senior management which entitles these employees to receive a specified number of options to purchase the Company's common stock provided that certain milestones are met. One third of the options can be exercised when the first 400 patients are enrolled in CEL-SCI's Phase III head and neck cancer clinical trial. One third of the options can be exercised when all of the patients have been enrolled in the Phase III clinical trial. One third of the options can be exercised when the Phase III trial is completed. The grant-date fair value of these options awarded to the senior management of the Company amounts to $3.3 million in total. A major consideration in the valuation of these options is the likelihood of the CEL-SCI reaching these milestones. CEL-SCI’s management has assumed the likelihood of these milestones being reached to be 100%.
|
Employee Pension, Profit Sharing or Other Retirement Plans
CEL-SCI has a defined contribution retirement plan, qualifying under Section 401(k) of the Internal Revenue Code and covering substantially all CEL-SCI’s employees. CEL-SCI’s contribution to the plan is made in shares of CEL-SCI's common stock. Each participant's contribution is matched by CEL-SCI with shares of common stock which have a value equal to 100% of the participant's contribution, not to exceed the lesser of $1,000 or 6% of the participant's total compensation. CEL-SCI's contribution of common stock is valued each quarter based upon the closing price of its common stock. The fiscal 2011 expenses for this plan were $154,100. Other than the 401(k) Plan, CEL-SCI does not have a defined benefit, pension plan, profit sharing or other retirement plan.
Compensation of Directors During Year Ended September 30, 2011
|
Stock
Awards (1) |
Option
Awards (2) |
|||||||||||||||
|
Name
|
Paid in Cash
|
Total
|
||||||||||||||
|
Maximilian de Clara
|
$ | 40, 000 | $ | - | $ | 176,709 | $ | 216,709 | ||||||||
|
Geert Kersten
|
$ | 40, 000 | $ | - | $ | 207,314 | $ | 247,314 | ||||||||
|
Alexander Esterhazy
|
$ | 44, 000 | $ | - | $ | 91,815 | $ | 135,815 | ||||||||
|
C. Richard Kinsolving
|
$ | 44, 000 | $ | - | $ | 91,815 | $ | 135,815 | ||||||||
|
Peter R. Young
|
$ | 44, 000 | $ | - | $ | 91,815 | $ | 135,815 | ||||||||
|
(1)
|
The fair value of stock issued for services.
|
|
(2)
|
The fair value of options granted computed in accordance with ASC 718-10-30-3 on the date of grant which represents their grant date fair value.
|
Directors’ fees paid to Maximilian de Clara and Geert Kersten are also included in the Executive Compensation table.
46
Employment Contracts
.
Maximilian de Clara
In April 2005, CEL-SCI entered into a three-year employment agreement with Maximilian de Clara, CEL-SCI’s President. The employment agreement provided that CEL-SCI would pay Mr. de Clara an annual salary of $363,000 during the term of the agreement. On September 8, 2006 Mr. de Clara’s Employment Agreement was amended and extended to April 30, 2010. The terms of the amendment to Mr. de Clara’s employment agreement are referenced in a report on Form 8-K filed with the Securities and Exchange Commission on September 8, 2006. On August 30, 2010, Mr. de Clara’s employment agreement, as amended on September 8, 2006, was extended to August 30, 2013.
In the event that there is a material reduction in Mr. de Clara's authority, duties or activities, or in the event there is a change in the control of CEL-SCI, the agreement allows Mr. de Clara to resign from his position at CEL-SCI and receive a lump-sum payment from CEL-SCI equal to 18 months salary ($544,500) and the unvested portion of any stock options would vest immediately ($308,779). For purposes of the employment agreement, a change in the control of CEL-SCI means the sale of more than 50% of the outstanding shares of CEL-SCI's common stock, or a change in a majority of CEL-SCI's directors.
The employment agreement will also terminate upon the death of Mr. de Clara, Mr. de Clara’s physical or mental disability, the conviction of Mr. de Clara for any crime involving fraud, moral turpitude, or CEL-SCI’s property, or a breach of the employment agreement by Mr. de Clara. If the employment agreement is terminated for any of these reasons, Mr. de Clara, or his legal representatives, as the case may be, will be paid the salary provided by the employment agreement through the date of termination.
Geert Kersten
Effective September 1, 2003, CEL-SCI entered into a three-year employment agreement with Mr. Kersten. On September 1, 2006, Mr. Kersten’s employment agreement was extended to September 1, 2011. On September 1, 2011 CEL-SCI extended its employment agreement with Mr. Kersten to August 31, 2016. During the term of the new employment agreement CEL-SCI will pay Mr. Kersten an annual salary of $464,004. Mr. Kersten will receive at least the same salary increases each year as do other senior executives of CEL-SCI. Increases beyond those, if any, shall be made at the sole discretion of CEL-SCI’s directors.
During the employment term, Mr. Kersten will be entitled to receive any other benefits which are provided to CEL-SCI's executive officers or other full time employees in accordance with CEL-SCI's policies and practices and subject to Mr. Kersten’s satisfaction of any applicable condition of eligibility.
If Mr. Kersten resigns within ninety (90) days of the occurrence of any of the following events: (i) a relocation (or demand for relocation) of Mr. Kersten’s place of employment to a location more than thirty-five (35) miles from his current place of employment, (ii) a significant and material reduction in Mr. Kersten’s authority, job duties or level of responsibility or (iii) the imposition of significant and material limitations on the Mr. Kersten’s autonomy in his position, the employment agreement will be terminated.
In the event that there is a material reduction in Mr. Kersten's authority, duties or activities, or in the event there is a change in the control of CEL-SCI, the agreement allows Mr. Kersten to resign from his position at CEL-SCI and receive a lump-sum payment from CEL-SCI equal to 24 months salary ($928,008) and the unvested portion of any stock options would vest immediately ($1,006,809). For purposes of the employment agreement a change in the control of CEL-SCI means: (1) the merger of CEL-SCI with another entity if after such merger the shareholders of CEL-SCI do not own at least 50% of voting capital stock of the surviving corporation; (2) the sale of substantially all of the assets of CEL-SCI; (3) the acquisition by any person of more than 50% of CEL-SCI's common stock; or (4) a change in a majority of CEL-SCI's directors which has not been approved by the incumbent directors.
47
The employment agreement will also terminate upon the death of Mr. Kersten, Mr. Kersten’s physical or mental disability, willful misconduct, an act of fraud against CEL-SCI, or a breach of the employment agreement by Mr. Kersten.
If the employment agreement is terminated for any of the foregoing, Mr. Kersten, or his legal representatives, as the case may be, will be paid the salary provided by the employment agreement through the date of termination, any options or bonus shares of CEL-SCI then held by Mr. Kersten will become fully vested and the expiration date of any options which would expire during the four year period following his termination of employment will be extended to the date which is four years after his termination of employment.
Patricia B. Prichep / Eyal Talor, Ph.D.
On August 30, 2010, CEL-SCI entered into a three-year employment agreement with Patricia B. Prichep, CEL-SCI’s Senior Vice President of Operations. The employment agreement with Ms. Prichep provides that during the term of the agreement CEL-SCI will pay Ms. Prichep an annual salary of $194,298 plus any increases approved by the Board of Directors during the period of the employment agreement.
On August 30, 2010, CEL-SCI also entered into a three-year employment agreement with Eyal Talor, Ph.D., CEL-SCI’s Chief Scientific Officer. The employment agreement with Dr. Talor provides that during the term of the agreement CEL-SCI will pay Dr. Talor an annual salary of $239,868 plus any increases approved by the Board of Directors during the period of the employment agreement.
If Ms. Prichep or Dr. Talor resigns within ninety (90) days of the occurrence of any of the following events: (i) a relocation (or demand for relocation) of employee’s place of employment to a location more than thirty-five (35) miles from the employee’s current place of employment, (ii) a significant and material reduction in the employee’s authority, job duties or level of responsibility or (iii) the imposition of significant and material limitations on the employee’s autonomy in her or his position, the employment agreement will be terminated and the employee will be paid the salary provided by the employment agreement through the date of termination and the unvested portion of any stock options held by the employee will vest immediately.
In the event there is a change in the control of CEL-SCI, the employment agreements with Ms. Prichep and Dr. Talor allow Ms. Prichep and/or Dr. Talor (as the case may be) to resign from her or his position at CEL-SCI and receive a lump-sum payment from CEL-SCI equal to 18 months salary ($306,020 and $377,792 respectively). In addition, the unvested portion of any stock options held by the employee will vest immediately ($690,544 and $690,544 respectively). For purposes of the employment agreements, a change in the control of CEL-SCI means: (1) the merger of CEL-SCI with another entity if after such merger the shareholders of CEL-SCI do not own at least 50% of voting capital stock of the surviving corporation; (2) the sale of substantially all of the assets of CEL-SCI; (3) the acquisition by any person of more than 50% of CEL-SCI's common stock; or (4) a change in a majority of CEL-SCI's directors which has not been approved by the incumbent directors.
The employment agreements with Ms. Prichep and Dr. Talor will also terminate upon the death of the employee, the employee’s physical or mental disability, willful misconduct, an act of fraud against CEL-SCI, or a breach of the employment agreement by the employee. If the employment agreement is terminated for any of these reasons the employee, or her or his legal representatives, as the case may be, will be paid the salary provided by the employment agreement through the date of termination.
Compensation Committee Interlocks and Insider Participation
CEL-SCI has a compensation committee comprised of Alexander Esterhazy, Dr. C. Richard Kinsolving and Dr. Peter Young, all of whom are outside directors.
During the year ended September 30, 2011, no director of CEL-SCI was also an executive officer of another entity, which had an executive officer of CEL-SCI serving as a director of such entity or as a member of the compensation committee of such entity.
48
Loan from Officer and Director
Between December 2008 and June 2009, Maximilian de Clara, CEL-SCI’s President and a director, loaned CEL-SCI $1,104,057. The loan was initially payable at the end of March 2009, but was extended to the end of June 2009. At the time the loan was due, and in accordance with the loan agreement, CEL-SCI issued Mr. de Clara a warrant which entitles Mr. de Clara to purchase 1,648,244 shares of CEL-SCI’s common stock at a price of $0.40 per share. The warrant is exercisable at any time prior to December 24, 2014. Although the loan was to be repaid from the proceeds of CEL-SCI’s recent financing, CEL-SCI’s Directors deemed it beneficial not to repay the loan and negotiated a second extension of the loan with Mr. de Clara on terms similar to the June 2009 financing. Pursuant to the terms of the second extension the note was due on July 6, 2014, but, at Mr. de Clara’s option, the loan can be converted into shares of CEL-SCI’s common stock. Subsequently, on May 13, 2011, the Company extended the maturity date of the note to July 6, 2015 to compensate Mr. de Clara for agreeing to subordinate his note to the convertible preferred shares and convertible debt as part of the settlement agreement. The number of shares which will be issued upon any conversion will be determined by dividing the amount to be converted by $0.40. As further consideration for the second extension, Mr. de Clara received warrants which allow Mr. de Clara to purchase 1,849,295 shares of CEL-SCI’s common stock at a price of $0.50 per share at any time prior to January 6, 2015. The loan from Mr. de Clara bears interest at 15% per year and is secured by a lien on substantially all of CEL-SCI’s assets. CEL-SCI does not have the right to prepay the loan without Mr. de Clara’s consent.
Stock Option, Bonus and Compensation Plans
CEL-SCI has Incentive Stock Option Plans, Non-Qualified Stock Option, Stock Bonus and Stock Compensation Plans. All Stock Option, Bonus and Compensation Plans have been approved by the stockholders. A summary description of these Plans follows. In some cases these Plans are collectively referred to as the "Plans".
Incentive Stock Option Plan
. The Incentive Stock Option Plans authorize the issuance of shares of CEL-SCI's common stock to persons who exercise options granted pursuant to the Plan. Only CEL-SCI’s employees may be granted options pursuant to the Incentive Stock Option Plan.
Options may not be exercised until one year following the date of grant. Options granted to an employee then owning more than 10% of the Common Stock of CEL-SCI may not be exercisable by its terms after five years from the date of grant. Any other option granted pursuant to the Plan may not be exercisable by its terms after ten years from the date of grant.
The purchase price per share of Common Stock purchasable under an option is determined by the Committee but cannot be less than the fair market value of the Common Stock on the date of the grant of the option (or 110% of the fair market value in the case of a person owning more than 10% of CEL-SCI's outstanding shares).
Non-Qualified Stock Option Plans
. The Non-Qualified Stock Option Plans authorize the issuance of shares of CEL-SCI's common stock to persons that exercise options granted pursuant to the Plans. CEL-SCI's employees, directors, officers, consultants and advisors are eligible to be granted options pursuant to the Plans, provided however that bona fide services must be rendered by such consultants or advisors and such services must not be in connection with the offer or sale of securities in a capital-raising transaction. The option exercise price is determined by CEL-SCI’s Board of Directors.
Stock Bonus Plan
. Under the Stock Bonus Plans shares of CEL-SCI’s common stock may be issued to CEL-SCI's employees, directors, officers, consultants and advisors, provided however that bona fide services must be rendered by consultants or advisors and such services must not be in connection with the offer or sale of securities in a capital-raising transaction.
Stock Compensation Plan
. Under the Stock Compensation Plan, shares of CEL-SCI’s common stock may be issued to CEL-SCI’s employees, directors, officers, consultants and advisors in payment of salaries, fees and other compensation owed to these persons. However, bona fide services must be rendered by consultants or advisors and such services must not be in connection with the offer or sale of securities in a capital-raising transaction.
49
Other Information Regarding the Plans
. The Plans are administered by CEL-SCI's Compensation Committee (“the Committee”), each member of which is a director of CEL-SCI. The members of the Committee were selected by CEL-SCI's Board of Directors and serve for a one-year tenure and until their successors are elected. A member of the Committee may be removed at any time by action of the Board of Directors. Any vacancies which may occur on the Committee will be filled by the Board of Directors. The Committee is vested with the authority to interpret the provisions of the Plans and supervise the administration of the Plans. In addition, the Committee is empowered to select those persons to whom shares or options are to be granted, to determine the number of shares subject to each grant of a stock bonus or an option and to determine when, and upon what conditions, shares or options granted under the Plans will vest or otherwise be subject to forfeiture and cancellation.
In the discretion of the Committee, any option granted pursuant to the Plans may include installment exercise terms such that the option becomes fully exercisable in a series of cumulating portions. The Committee may also accelerate the date upon which any option (or any part of any options) is first exercisable. Any shares issued pursuant to the Stock Bonus Plan or Stock Compensation Plan and any options granted pursuant to the Incentive Stock Option Plan or the Non-Qualified Stock Option Plan will be forfeited if the "vesting" schedule established by the Committee administering the Plan at the time of the grant is not met. For this purpose, vesting means the period during which the employee must remain an employee of CEL-SCI or the period of time a non-employee must provide services to CEL-SCI. At the time an employee ceases working for CEL-SCI (or at the time a non-employee ceases to perform services for CEL-SCI), any shares or options not fully vested will be forfeited and cancelled. At the discretion of the Committee payment for the shares of Common Stock underlying options may be paid through the delivery of shares of CEL-SCI's Common Stock having an aggregate fair market value equal to the option price, provided such shares have been owned by the option holder for at least one year prior to such exercise. A combination of cash and shares of Common Stock may also be permitted at the discretion of the Committee.
Options are generally non-transferable except upon death of the option holder. Shares issued pursuant to the Stock Bonus Plan will generally not be transferable until the person receiving the shares satisfies the vesting requirements imposed by the Committee when the shares were issued.
The Board of Directors of CEL-SCI may at any time, and from time to time, amend, terminate, or suspend one or more of the Plans in any manner they deem appropriate, provided that such amendment, termination or suspension will not adversely affect rights or obligations with respect to shares or options previously granted.
Stock Options
The following tables show information concerning the options granted during the fiscal year ended September 30, 2011, to the persons named below.
50
Options Granted
|
|
Exercise
|
|||||||||
|
Grant
|
Options
|
Price Per
|
Expiration
|
|||||||
|
Name
|
Date
|
Granted
|
Share
|
Date
|
||||||
|
Maximilian de Clara
|
4/15/2011
|
250,000 | $ | 0.69 |
4/14/2021
|
|||||
|
Geert Kersten
|
4/15/2011
|
300,000 | $ | 0.69 |
4/14/2021
|
|||||
|
Patricia B. Prichep
|
4/15/2011
|
150,000 | $ | 0.69 |
4/14/2021
|
|||||
|
Eyal Talor, Ph.D.
|
4/15/2011
|
150,000 | $ | 0.69 |
4/14/2021
|
|||||
|
Daniel Zimmerman, Ph.D.
|
4/15/2011
|
150,000 | $ | 0.69 |
4/14/2021
|
|||||
|
John Cipriano
|
4/15/2011
|
150,000 | $ | 0.69 |
4/14/2021
|
|||||
Options Exercised
|
Shares
|
||||||||||||
|
Date of
|
Acquired On
|
Value
|
||||||||||
|
Name
|
Exercise
|
Exercise
|
Realized
|
|||||||||
|
None
|
||||||||||||
The following lists the outstanding options held by the persons named below:
|
Shares Underlying Unexercised
|
|||||||||||||
|
Options Which are:
|
Exercise
|
Expiration
|
|||||||||||
|
Name
|
Exercisable
|
Unexercisable
|
Price
|
Date
|
|||||||||
|
Maximilian de Clara
|
23,333 | 2.87 |
07/31/13
|
||||||||||
| 95,000 | (1) | 1.94 |
08/31/13
|
||||||||||
| 70,000 | 1.05 |
09/25/12
|
|||||||||||
| 56,666 | 1.05 |
05/01/13
|
|||||||||||
| 50,000 | 1.05 |
05/01/13
|
|||||||||||
| 50,000 | 1.05 |
04/12/12
|
|||||||||||
| 60,000 | 1.05 |
04/19/13
|
|||||||||||
| 60,000 | 1.38 |
03/22/14
|
|||||||||||
| 75,000 | 0.54 |
03/14/12
|
|||||||||||
| 50,000 | 0.61 |
09/02/14
|
|||||||||||
| 50,000 | 0.48 |
09/21/15
|
|||||||||||
| 100,000 | 0.58 |
09/12/16
|
|||||||||||
| 200,000 | 0.63 |
09/13/17
|
|||||||||||
| 200,000 | 0.62 |
03/04/18
|
|||||||||||
| 1,436,250 | (2) | 0.25 |
04/23/19
|
||||||||||
| 166,667 | 0.38 |
07/20/19
|
|||||||||||
| 83,334 | 0.48 |
07/20/20
|
|||||||||||
| 2,826,250 | |||||||||||||
| 500,000 | (3) | 0.38 |
07/06/19
|
||||||||||
| 83,333 | 0.38 |
07/20/19
|
|||||||||||
| 166,666 | 0.48 |
07/20/20
|
|||||||||||
| 250,000 | 0.69 |
04/14/21
|
|||||||||||
| 999,999 | |||||||||||||
|
Geert R. Kersten
|
50,000 | 1.05 |
11/01/13
|
||||||||||
| 14,000 | 1.05 |
10/31/13
|
|||||||||||
| 50,000 | 1.05 |
07/31/13
|
|||||||||||
| 224,000 | (1) | 1.05 |
06/10/13
|
||||||||||
| 50,000 | 1.05 |
09/25/12
|
51
|
Shares Underlying Unexercised
|
||||||||||||
|
Options Which are:
|
Exercise
|
Expiration
|
||||||||||
|
Name
|
Exercisable
|
Unexercisable
|
Price
|
Date
|
||||||||
|
Geert Kersten (cont’d)
|
150,000 | 1.05 |
05/01/13
|
|||||||||
| 50,000 | 1.05 |
05/01/13
|
||||||||||
| 50,000 | 1.05 |
04/12/12
|
||||||||||
| 95,000 | (1) | 1.94 |
08/31/13
|
|||||||||
| 60,000 | 1.05 |
04/19/13
|
||||||||||
| 60,000 | 1.38 |
03/22/14
|
||||||||||
| 560,000 | (1) | 1.05 |
10/16/13
|
|||||||||
| 105,000 | 0.54 |
03/14/12
|
||||||||||
| 1,890,000 | 0.22 |
04/01/13
|
||||||||||
| 50,000 | 0.61 |
09/02/14
|
||||||||||
| 50,000 | 0.48 |
09/21/15
|
|||||||||||
| 200,000 | 0.58 |
09/12/16
|
|||||||||||
| 200,000 | 0.63 |
09/13/17
|
|||||||||||
| 200,000 | 0.62 |
03/04/18
|
|||||||||||
| 1,838,609 | (2) | 0.25 |
04/23/19
|
||||||||||
| 200,000 | 0.38 |
07/20/19
|
|||||||||||
| 100,000 | 0.48 |
07/20/20
|
|||||||||||
| 6,246,609 | |||||||||||||
| 4,000,000 | (3) | 0.38 |
07/06/19
|
||||||||||
| 100,000 | 0.38 |
07/20/19
|
|||||||||||
| 200,000 | 0.48 |
07/20/20
|
|||||||||||
| 300,000 | 0.69 |
04/14/21
|
|||||||||||
| 4,600,000 | |||||||||||||
|
Patricia B. Prichep
|
6,000 | 1.05 |
12/01/13
|
||||||||||
| 10,000 | 1.05 |
11/30/13
|
|||||||||||
| 9,500 | 1.05 |
07/31/13
|
|||||||||||
| 3,000 | 1.05 |
12/31/12
|
|||||||||||
| 35,000 | 1.05 |
03/01/13
|
|||||||||||
| 17,000 | 1.05 |
12/01/13
|
|||||||||||
| 15,000 | 1.05 |
04/12/12
|
|||||||||||
| 47,500 | (1) | 1.94 |
08/31/13
|
||||||||||
| 23,000 | 1.05 |
02/02/13
|
|||||||||||
| 25,000 | 1.18 |
12/08/13
|
|||||||||||
| 30,000 | 1.00 |
12/03/14
|
|||||||||||
| 200,000 | (1) | 1.05 |
10/16/13
|
||||||||||
| 10,500 | 0.54 |
03/14/12
|
|||||||||||
| 50,000 | 0.33 |
04/26/12
|
|||||||||||
| 243,000 | 0.22 |
04/01/13
|
|||||||||||
| 337,000 | 0.22 |
04/01/13
|
|||||||||||
| 50,000 | 0.61 |
09/02/14
|
|||||||||||
| 30,000 | 0.48 |
09/21/15
|
|||||||||||
| 90,000 | 0.58 |
09/12/16
|
|||||||||||
| 100,000 | 0.63 |
09/13/17
|
|||||||||||
| 100,000 | 0.62 |
03/04/18
|
|||||||||||
| 717,096 | (2) | 0.25 |
04/23/19
|
||||||||||
| 100,000 | 0.38 |
07/20/19
|
52
|
Shares underlying unexercised
|
|||||||||||||
|
Option which are:
|
Exercise
|
Expiration
|
|||||||||||
|
Name
|
Exercisable
|
Unexercisable
|
Price
|
Date
|
|||||||||
|
Patricia B. Prichep
|
50,000 | 0.48 |
07/20/20
|
||||||||||
| (Cont’d) | 2,298,596 |
|
|||||||||||
| 3,000,000 | (3) | 0.38 |
07/06/19
|
||||||||||
| 50,000 | 0.38 |
07/20/19
|
|||||||||||
| 100,000 | 0.48 |
07/20/20
|
|||||||||||
| 150,000 | 0.69 |
04/14/21
|
|||||||||||
| 3,300,000 | |||||||||||||
|
Eyal Talor, Ph.D.
|
15,500 | 1.05 |
07/31/13
|
||||||||||
| 16,666 | 1.05 |
03/16/13
|
|||||||||||
| 15,000 | 1.05 |
08/03/13
|
|||||||||||
| 10,000 | (1) | 1.94 |
08/31/13
|
||||||||||
| 20,000 | 1.05 |
08/02/12
|
|||||||||||
| 25,000 | 1.76 |
11/10/13
|
|||||||||||
| 35,000 | 1.00 |
12/03/14
|
|||||||||||
| 160,000 | (1) | 1.05 |
10/16/13
|
||||||||||
| 50,000 | 0.33 |
04/26/12
|
|||||||||||
| 374,166 | 0.22 |
04/01/13
|
|||||||||||
| 50,000 | 0.61 |
09/02/14
|
|||||||||||
| 30,000 | 0.48 |
09/21/15
|
|||||||||||
| 80,000 | 0.58 |
09/12/16
|
|||||||||||
| 100,000 | 0.63 |
09/13/17
|
|||||||||||
| 100,000 | 0.62 |
03/04/18
|
|||||||||||
| 240,820 | (2) | 0.25 |
04/23/19
|
||||||||||
| 100,000 | 0.38 |
07/20/19
|
|||||||||||
| 50,000 | 0.48 |
07/20/20
|
|||||||||||
| 1,472,152 | |||||||||||||
| 3,000,000 | (3) | 0.38 |
07/06/19
|
||||||||||
| 50,000 | 0.38 |
07/20/19
|
|||||||||||
| 100,000 | 0.48 |
07/20/20
|
|||||||||||
| 150,000 | 0.69 |
04/14/21
|
|||||||||||
| 3,300,000 | |||||||||||||
|
Daniel Zimmerman, Ph.D.
|
12,000 | 1.05 |
12/31/13
|
||||||||||
| 7,000 | 1.05 |
06/19/13
|
|||||||||||
| 15,000 | 1.05 |
02/19/13
|
|||||||||||
| 30,000 | (1) | 1.94 |
08/31/13
|
||||||||||
| 20,000 | 1.05 |
02/02/13
|
|||||||||||
| 20,000 | 1.85 |
01/26/14
|
|||||||||||
| 120,000 | (1) | 1.05 |
10/16/13
|
||||||||||
| 41,000 | 0.54 |
03/14/12
|
|||||||||||
| 50,000 | 0.33 |
04/16/12
|
|||||||||||
| 392,000 | 0.22 |
04/01/13
|
|||||||||||
| 50,000 | 0.61 |
09/02/14
|
|||||||||||
| 30,000 | 0.48 |
09/21/15
|
|||||||||||
53
|
Shares
Underlying U
nexercised
|
Options Which are:
|
Exercise
|
Expiration
|
||||||||||
|
Name
|
Exercisable
|
Unexercisable
|
Price
|
Date
|
|||||||||
|
Daniel Zimmerman, Ph.D.
|
60,000 | 0.58 |
09/12/16
|
||||||||||
|
(cont’d)
|
75,000 | 0.63 |
09/13/17
|
||||||||||
| 75,000 | 0.62 |
03/04/18
|
|||||||||||
| 200,000 | (4) | 0.38 |
07/15/14
|
||||||||||
| 50,000 | 0.48 |
07/20/20
|
|||||||||||
| 1,247,000 | |||||||||||||
| 100,000 | 0.48 |
07/20/20
|
|||||||||||
| 150,000 | 0.69 |
04/14/21
|
|||||||||||
| 250,000 | |||||||||||||
|
John Cipriano
|
20,000 | 0.61 |
09/02/14
|
||||||||||
| 30,000 | 0.48 |
09/21/15
|
|||||||||||
| 60,000 | 0.58 |
09/12/16
|
|||||||||||
| 75,000 | 0.63 |
09/13/17
|
|||||||||||
| 75,000 | 0.62 |
03/04/18
|
|||||||||||
| 66,667 | 1.93 |
09/30/19
|
|||||||||||
| 50,000 | 0.48 |
07/20/20
|
|||||||||||
| 376,667 | |||||||||||||
| 33,333 | 1.93 |
09/30/19
|
|||||||||||
| 100,000 | 0.48 |
07/20/20
|
|||||||||||
| 150,000 | 0.69 |
04/14/21
|
|||||||||||
| 283,333 | |||||||||||||
____________
|
(1)
|
Options purchased by Employee through the Salary Reduction Plan.
|
|
(2)
|
Options awarded to employees who did not collect a salary, or reduced or deferred their salary between September 15, 2008 and June 30, 2009. For example, Mr. de Clara, Mr. Kersten and Ms. Prichep did not collect any salary between September 30, 2008 and June 30, 2009.
|
|
(3)
|
Long-term performance options: The Board of Directors has identified the successful Phase III clinical trial for Multikine to be the most important corporate event to create shareholder value. Therefore, one third of the options can be exercised when the first 400 patients are enrolled in CEL-SCI's Phase III head and neck cancer clinical trial. One third of the options can be exercised when all of the patients have been enrolled in the Phase III clinical trial. One third of the options can be exercised when the Phase III trial is completed. The grant-date fair value of these options awarded to the senior management of the Company amounts to $3.3 million in total. A major consideration in the valuation of these options is the likelihood of the CEL-SCI reaching these milestones. CEL-SCI’s management has assumed the likelihood of these milestones being reached to be 100%.of these options is the likelihood of the CEL-SCI reaching these milestones.
|
|
(4)
|
Options awarded to employee during the period that he was a consultant to CEL-SCI.
|
54
Summary
. The following shows certain information as of September 30, 2011 concerning the stock options and stock bonuses granted by CEL-SCI. Each option represents the right to purchase one share of CEL-SCI's common stock.
|
Total
|
Shares
|
|||||||||||||||
|
Shares
|
Reserved for
|
Shares
|
Remaining
|
|||||||||||||
|
Reserved
|
Outstanding
|
Issued as
|
Options/Shares
|
|||||||||||||
|
Name of Plan
|
Under Plans
|
Options
|
Stock Bonus
|
Under Plans
|
||||||||||||
|
Incentive Stock Option Plans
|
19,100,000 | 11,168,041 | N/A | 7,320,225 | ||||||||||||
|
Non-Qualified Stock Option Plans
|
35,760,000 | 23,461,240 | N/A | 8,690,510 | ||||||||||||
|
Stock Bonus Plans
|
13,940,000 | N/A | 7,766,340 | 6,171,372 | ||||||||||||
|
Stock Compensation Plan
|
11,500,000 | N/A | 5,386,531 | 6,113,469 | ||||||||||||
Of the shares issued pursuant to CEL-SCI's Stock Bonus Plans 1,748,852 shares were issued as part of CEL-SCI's contribution to its 401(k) plan.
The following table shows the weighted average exercise price of the outstanding options granted pursuant to CEL-SCI’s Incentive and Non-Qualified Stock Option Plans as of September 30, 2011, CEL-SCI’s most recent fiscal year end. CEL-SCI's Incentive and Non-Qualified Stock Option Plans have been approved by CEL-SCI's shareholders.
|
Number of Securities
|
||||||||||||
|
Number
|
Remaining Available
|
|||||||||||
|
of Securities
|
For Future Issuance
|
|||||||||||
|
to be Issued
|
Weighted-Average
|
Under Equity
|
||||||||||
|
Upon Exercise
|
Exercise Price of
|
Compensation Plans,
|
||||||||||
|
of Outstanding
|
of Outstanding
|
Excluding Securities
|
||||||||||
|
Plan category
|
Options (a)
|
Options
|
Reflected in Column (a)
|
|||||||||
|
Incentive Stock
|
11,168,041 | $ | 0.42 | 7,320,225 | ||||||||
|
Option Plans
|
||||||||||||
|
Non-Qualified Stock
|
23,461,240 | $ | 0.51 | 8,690,510 | ||||||||
|
Option Plans
|
||||||||||||
Long Term Incentive Plans - Awards in Last Fiscal Year
See footnote 6 to the financial statements included as part of this report.
55
The following table shows, as of November 30, 2011, information with respect to the only persons owning beneficially 5% or more of CEL-SCI’s outstanding common stock and the number and percentage of outstanding shares owned by each director and officer of CEL-SCI and by the officers and directors as a group. Unless otherwise indicated, each owner has sole voting and investment powers over his shares of common stock.
| Name and Address | Number of Shares (1) | Percent of Class (3) | ||||||
|
Maximilian de Clara
|
6,557,023 | 2.8 | % | |||||
|
Bergstrasse 79
|
||||||||
|
6078 Lungern,
|
||||||||
|
Obwalden, Switzerland
|
||||||||
|
Geert R. Kersten
|
9,308,921 | 3.9 | % | |||||
|
8229 Boone Blvd., Suite 802
|
||||||||
|
Vienna, VA 22182
|
||||||||
|
Patricia B. Prichep
|
3,029,149 | 1.3 | % | |||||
|
8229 Boone Blvd., Suite 802
|
||||||||
|
Vienna, VA 22182
|
||||||||
|
Eyal Talor, Ph.D.
|
1,851,022 | 0.8 | % | |||||
|
8229 Boone Blvd., Suite 802
|
||||||||
|
Vienna, VA 22182
|
||||||||
|
Daniel H. Zimmerman, Ph.D.
|
1,518,522 | 0.7 | % | |||||
|
8229 Boone Blvd., Suite 802
|
||||||||
|
Vienna, VA 22182
|
||||||||
|
John Cipriano
|
559,360 | 0.2 | % | |||||
|
8229 Boone Blvd., Suite 802
|
||||||||
|
Vienna, VA 22182
|
||||||||
|
Alexander G. Esterhazy
|
920,489 | 0.4 | % | |||||
|
20 Chemin du Pre-Poiset
|
||||||||
|
CH- 1253 Vandoeuvres
|
||||||||
|
Geneve, Switzerland
|
||||||||
|
C. Richard Kinsolving, Ph.D.
|
1,096,247 | 0.5 | % | |||||
|
P.O. Box 20193
|
||||||||
|
Bradenton, FL 34204-0193
|
||||||||
|
Peter R. Young, Ph.D.
|
937,757 | 0.4 | % | |||||
|
2500 Marketplace Drive, Unit 431
|
||||||||
|
Waco, TX 76711
|
||||||||
|
All Officers and Directors
|
25,778,490 | 10.3 | % | |||||
|
as a Group (9 persons)
|
||||||||
____________
|
(1)
|
Includes shares issuable prior to February 28, 2012 upon the exercise of options or warrants granted to the following persons:
|
56
|
Options or Warrants Exercisable
|
||||
|
Name
|
Prior to February 28, 2012
|
|||
|
Maximilian de Clara
|
6,205,789 | |||
|
Geert R. Kersten
|
5,933,009 | |||
|
Patricia B. Prichep
|
2,202,296 | |||
|
Eyal Talor, Ph.D.
|
1,402,719 | |||
|
Daniel Zimmerman
|
1,184,000 | |||
|
John Cipriano
|
372,667 | |||
|
Alexander G. Esterhazy
|
687,332 | |||
|
C. Richard Kinsolving, Ph.D.
|
794,000 | |||
|
Peter R. Young, Ph.D.
|
689,999 | |||
_________
|
(2)
|
Amount includes shares held in trust for the benefit of Mr. Kersten's minor children. Geert R. Kersten is the stepson of Maximilian de Clara.
|
|
(3)
|
Amount includes shares referred to in (1) above but excludes shares which may be issued upon the exercise or conversion of other options, warrants and other convertible securities previously issued by CEL-SCI.
|
None.
BDO USA, LLP served as CEL-SCI’s independent registered public accountant for the two years ended September 30, 2011. The following table shows the aggregate fees billed to CEL-SCI for these years by BDO USA, LLP:
|
Year Ended
September 30,
|
||||||||
|
2011
|
2010
|
|||||||
|
Audit Fees
|
$ | 237,835 | $ | 232,725 | ||||
|
Audit-Related Fees
|
-- | -- | ||||||
|
Tax Fees
|
-- | -- | ||||||
|
All Other Fees
|
$ | 4,370 | $ | 44,126 | ||||
Audit fees represent amounts billed for professional services rendered for the audit of the CEL-SCI’s annual financial statements and the reviews of the financial statements included in CEL-SCI’s 10-Q reports for the fiscal year and all regulatory filings. All other fees were for services in connection with the preparation of the application for the PPACA grant. See Note 1 to the financial statements included with this report for more information.
Before BDO USA, LLP was engaged by CEL-SCI to render audit or non-audit services, the engagement was approved by CEL-SCI’s audit committee. CEL-SCI’s Board of Directors is of the opinion that the Audit Related Fees charged by BDO USA, LLP are consistent with BDO USA, LLP maintaining its independence from CEL-SCI.
57
(a) See the Financial Statements attached to this Report.
| Exhibits | ||||
| 3(a) | Articles of Incorporation | Incorporated by reference to Exhibit 3(a) of CEL-SCI's combined Registration Statement on Form S-1 and Post-Effective Amendment ("Registration Statement"), Registration Nos. 2-85547-D and 33-7531. | ||
| 3(b) | Amended Articles | Incorporated by reference to Exhibit 3(a) of CEL-SCI's Registration Statement on Form S-1, Registration Nos. 2-85547-D and 33-7531. | ||
| 3(c) | Amended Articles (Name change only) | Filed as Exhibit 3(c) to CEL-SCI's Registration Statement on Form S-1 Registration Statement (No. 33-34878). | ||
| 3(d) | Bylaws | Incorporated by reference to Exhibit 3(b) of CEL-SCI's Registration Statement on Form S-1, Registration Nos. 2-85547-D and 33-7531. | ||
| 4 | Shareholders Rights Agreement | Incorporated by reference to Exhibit 4 of CEL-SCI’S report on Form 8-K dated November 7, 2007. | ||
| 10(d) | Employment Agreement with Maximilian de Clara | Incorporated by reference to Exhibit 10(d) of CEL-SCI’s report on Form 8-K (dated April 21, 2005) and Exhibit 10(d) to CEL-SCI’s report on Form 8-K dated September 8, 2006. | ||
| 10(f) | Distribution and Royalty Agreement with Eastern Biotech | Incorporated by reference to Exhibit 10(x) to Amendment No. 2 to CEL-SCI’s Registration statement on Form S-3 (Commission File No. 333-106879). | ||
| 10(g) | Securities Purchase Agreement (together with schedule required by Instruction 2 to Item 601 of Regulation S-K) pertaining to Series K notes and warrants, together with The exhibits to the Securities Purchase Agreement. | Incorporated by reference to Exhibit 10 to CEL-SCI’s report on Form 8-K dated August 4, 2006. | ||
| 10(h) | Subscription Agreement (together with Schedule required by Instruction 2 to Item 601 of Regulation S-K) pertaining to April 2007 sale of 20,000,000 shares of CEL-SCI’s common stock, 10,000,000 Series L warrants and 10,000,000 Series M Warrants. | Incorporated by reference to Exhibit 10 of CEL-SCI’s report on Form 8-K dated April 18, 2007. |
58
| 10(i) | Warrant Adjustment Agreement with Laksya Ventures | Incorporated by reference to Exhibit 10(i) of CEL-SCI’s report on Form 8-K dated August 3, 2010. | ||
| 10(j) | Employment Agreement with Patricia Prichep | Incorporated by reference to Exhibit 10(j) of CEL-SCI’s report on Form 8-K dated August 30, 2010. | ||
| 10(k) | Employment Agreement with Eyal Taylor | Incorporated by reference to Exhibit 10(k) of CEL-SCI’s report on Form 8-K dated August 30, 2010. | ||
| 10(l) | Amendment to Employment Agreement with Maximilian de Clara | Incorporated by reference to Exhibit 10(l) of CEL-SCI’s report on Form 8-K dated August 30, 2010. | ||
| 10(m) | Amendment to Development Supply and Distribution Agreement with Orient Europharma. (part of Exhibit 10(m) has been omitted pursuant to a request for confidential treatment). | Incorporated by reference to Exhibit 10(m) filed with CEL-SCI’s 10-K report for the year ended September 30, 2010. | ||
| 10(n) | Licensing Agreement with Teva Pharmaceutical Industries Ltd. (parts of Exhibit 10(n) have been omitted pursuantto a request for confidential treatment.) | Incorporated by reference to Exhibit 10(n) filed with CEL-SCI’s 10-K report for the year ended September 30, 2010. | ||
| 10(o) | Lease Agreement (parts of Exhibit 10(o) have been omitted pursuant to a request for confidential treatment). | Incorporated by reference to Exhibit 10(o) filed with CEL-SCI’s 10-K report for the year ended September 30, 2010. | ||
| 10(p) | Loan Agreements with Maximilian de Clara | Incorporated by reference to Exhibit 10(p) filed with CEL-SCI’s 10-K report for the year ended September 30, 2010. | ||
| 10(q) | Licensing Agreement with Byron Biopharma | Incorporated by reference to Exhibit 10(i) of CEL-SCI’s report on Form 8-K dated March 27, 2009. | ||
| 10(r) | At Market Issuance Sales Agreement with McNicoll, Lewis & Vlak LLC | Incorporated by reference to Exhibit 10(r) filed with CEL-SCI’s 10-K report for the year ended September 30, 2010. |
59
| 10(z) | Development, Supply and Distribution Agreement with Orient Europharma | Incorporated by reference to Exhibit 10(z) filed with CEL-SCI’s report on Form 10-K for the year ended September 30, 2003. | ||
| 10(aa) | Securities Purchase Agreement and form of the Series F warrants, which is and exhibit to the Securities Purchase Agreement. | Incorporated by reference to Exhibit 10(aa) of CEL-SCI’s report on Form 8-K dated October 3, 2011. | ||
| 10(bb) | Employment Agreement with Geert Kersten | Incorporated by reference to Exhibit 10(bb) to CEL-SCI’s report on Form 8-K dated September 1, 2011. | ||
| 23.1 | Consent of BDO USA, LLP | |||
| 31.1 | Rule 13a-14(a) Certifications | |||
| 31.2 | Rule 13a-14(a) Certifications | |||
| 32.1 | Section 1350 Certifications |
60
CEL-SCI CORPORATION
Consolidated Financial Statements for the Years
Ended September 30, 2011, 2010, and 2009, and
Report of Independent Registered Public Accounting Firm
F-1
CEL-SCI CORPORATION
TABLE OF CONTENTS
| PAGE | |
| REPORT OF INDEPENDENT REGISTERED PUBLIC ACCOUNTING FIRM | F-3 |
| CONSOLIDATED FINANCIAL STATEMENTS FOR THE YEARS ENDED SEPTEMBER 30, 2011, 2010, AND 2009: | |
| Consolidated Balance Sheets | F-5 |
| Consolidated Statements of Operations | F-6 |
| Consolidated Statements of Stockholders' Equity | F-7 |
| Consolidated Statements of Cash Flows | F-8 |
| Notes to Consolidated Financial Statements | F-11 |
F-2
Report of Independent Registered Public Accounting Firm
Board of Directors and Stockholders
CEL-SCI Corporation
Vienna, Virginia
We have audited the accompanying consolidated balance sheets of CEL-SCI Corporation as of September 30, 2011 and 2010 and the related consolidated statements of operations, stockholders’ equity, and cash flows for each of the three years in the period ended September 30, 2011. These financial statements are the responsibility of the Company’s management. Our responsibility is to express an opinion on these financial statements based on our audits.
We conducted our audits in accordance with the standards of the Public Company Accounting Oversight Board (United States). Those standards require that we plan and perform the audit to obtain reasonable assurance about whether the financial statements are free of material misstatement. An audit includes examining, on a test basis, evidence supporting the amounts and disclosures in the financial statements, assessing the accounting principles used and significant estimates made by management, as well as evaluating the overall financial statement presentation. We believe that our audits provide a reasonable basis for our opinion.
In our opinion, the consolidated financial statements referred to above present fairly, in all material respects, the financial position of CEL-SCI Corporation at September 30, 2011 and 2010, and the results of its operations and its cash flows for each of the three years in the period ended September 30, 2011, in conformity with accounting principles generally accepted in the United States of America.
The accompanying consolidated financial statements have been prepared assuming that the Company will continue as a going concern. As discussed in Note 3 to the consolidated financial statements, the Company has suffered recurring losses from operations that raise substantial doubt about its ability to continue as a going concern. Management's plans in regard to these matters are also described in Note 3. The consolidated financial statements do not include any adjustments that might result from the outcome of this uncertainty.
We also have audited, in accordance with the standards of the Public Company Accounting Oversight Board (United States), CEL-SCI Corporation’s internal control over financial reporting as of September 30, 2011 based on criteria established in
Internal Control – Integrated Framework
issued by the Committee of Sponsoring Organizations of the Treadway Commission (COSO) and our report dated December 23, 2011 expressed an unqualified opinion thereon.
/s/ BDO USA LLP
Bethesda, Maryland
December 23, 2011
F-3
Report of Independent Registered Public Accounting Firm
Board of Directors and Stockholders
CEL-SCI Corporation
Vienna, Virginia
We have audited CEL-SCI Corporation’s internal control over financial reporting as of September 30, 2011, based on criteria established in
Internal Control – Integrated Framework
issued by the Committee of Sponsoring Organizations of the Treadway Commission (the COSO criteria). CEL-SCI Corporation’s management is responsible for maintaining effective internal control over financial reporting and for its assessment of the effectiveness of internal control over financial reporting, included in the accompanying Item 9A, Management’s Report on Internal Control Over Financial Reporting. Our responsibility is to express an opinion on the company’s internal control over financial reporting based on our audit.
We conducted our audit in accordance with the standards of the Public Company Accounting Oversight Board (United States). Those standards require that we plan and perform the audit to obtain reasonable assurance about whether effective internal control over financial reporting was maintained in all material respects. Our audit included obtaining an understanding of internal control over financial reporting, assessing the risk that a material weakness exists, and testing and evaluating the design and operating effectiveness of internal control based on the assessed risk. Our audit also included performing such other procedures as we considered necessary in the circumstances. We believe that our audit provides a reasonable basis for our opinion.
A company’s internal control over financial reporting is a process designed to provide reasonable assurance regarding the reliability of financial reporting and the preparation of financial statements for external purposes in accordance with generally accepted accounting principles. A company’s internal control over financial reporting includes those policies and procedures that (1) pertain to the maintenance of records that, in reasonable detail, accurately and fairly reflect the transactions and dispositions of the assets of the company; (2) provide reasonable assurance that transactions are recorded as necessary to permit preparation of financial statements in accordance with generally accepted accounting principles, and that receipts and expenditures of the company are being made only in accordance with authorizations of management and directors of the company; and (3) provide reasonable assurance regarding prevention or timely detection of unauthorized acquisition, use, or disposition of the company’s assets that could have a material effect on the financial statements.
Because of its inherent limitations, internal control over financial reporting may not prevent or detect misstatements. Also, projections of any evaluation of effectiveness to future periods are subject to the risk that controls may become inadequate because of changes in conditions, or that the degree of compliance with the policies or procedures may deteriorate.
In our opinion, CEL-SCI Corporation maintained, in all material respects, effective internal control over financial reporting as of September 30, 2011, based on the COSO criteria
.
We also have audited, in accordance with the standards of the Public Company Accounting Oversight Board (United States), the consolidated balance sheets of CEL-SCI Corporation as of September 30, 2011 and 2010 and the related consolidated statements of operations, stockholders’ equity, and cash flows for each of the three years in the period ended September 30, 2011 and our report dated December 23, 2011 expressed an unqualified opinion thereon that included an explanatory paragraph regarding CEL-SCI Corporation’s ability to continue as a going concern.
/s/ BDO USA LLP
Bethesda, Maryland
December 23, 2011
F-4
|
CEL-SCI CORPORATION
|
||||||||
|
CONSOLIDATED BALANCE SHEETS
|
||||||||
|
SEPTEMBER 30, 2011 AND 2010
|
||||||||
|
ASSETS
|
2011
|
2010
|
||||||
|
CURRENT ASSETS:
|
||||||||
|
Cash and cash equivalents
|
$ | 4,260,594 | $ | 26,568,243 | ||||
|
Receivables
|
457,337 | - | ||||||
|
Prepaid expenses
|
2,028,531 | 298,719 | ||||||
|
Inventory used for R&D and manufacturing
|
1,571,182 | 1,476,234 | ||||||
|
Deferred rent - current portion
|
703,274 | 751,338 | ||||||
|
Total current assets
|
9,020,918 | 29,094,534 | ||||||
|
|
||||||||
|
RESEARCH AND OFFICE EQUIPMENT AND
LEASEHOLD IMPROVEMENTS-- less accumulated depreciation and amortization of $3,034,018 and $2,626,759
|
1,032,881 | 1,264,831 | ||||||
|
PATENT COSTS--less accumulated
amortization of $1,287,323 and $1,205,690
|
414,158 | 356,079 | ||||||
|
RESTRICTED CASH
|
- | 21,357 | ||||||
|
DEFERRED RENT - net of current portion
|
6,486,566 | 7,068,184 | ||||||
|
DEPOSITS
|
1,670,917 | - | ||||||
|
TOTAL ASSETS
|
$ | 18,625,440 | $ | 37,804,985 | ||||
|
LIABILITIES AND STOCKHOLDERS' EQUITY
|
||||||||
|
CURRENT LIABILITIES:
|
||||||||
|
Accounts payable
|
738,951 | 1,497,383 | ||||||
|
Accrued expenses
|
290,220 | 223,696 | ||||||
|
Due to employees
|
22,789 | 45,808 | ||||||
|
Related party loan
|
1,104,057 | 1,104,057 | ||||||
|
Convertible note
|
4,999,000 | - | ||||||
|
Derivative instruments - current portion
|
69,552 | 424,286 | ||||||
|
Total current liabilities
|
7,224,569 | 3,295,230 | ||||||
|
Derivative instruments - net of current portion
|
2,192,521 | 6,521,765 | ||||||
|
Deferred revenue
|
125,000 | 125,000 | ||||||
|
Deferred rent
|
4,526 | 8,225 | ||||||
|
Total liabilities
|
9,546,616 | 9,950,220 | ||||||
|
COMMITMENTS AND CONTINGENCIES
|
||||||||
|
STOCKHOLDERS' EQUITY
|
||||||||
|
Preferred stock, $.01 par value--authorized
|
||||||||
|
200,000 shares, issued and outstanding, -0-
|
- | - | ||||||
|
Common stock, $.01 par value--authorized
|
||||||||
|
450,000,000 shares; issued and
|
||||||||
|
outstanding, 214,723,023 and 204,868,853
|
||||||||
|
shares at September 30, 2011 and 2010,
|
||||||||
|
respectively
|
2,147,230 | 2,048,689 | ||||||
|
Additional paid-in capital
|
194,443,905 | 187,606,044 | ||||||
|
Accumulated deficit
|
(187,512,311 | ) | (161,799,968 | ) | ||||
|
Total stockholders' equity
|
9,078,824 | 27,854,765 | ||||||
|
TOTAL LIABILITIES AND
STOCKHOLDERS' EQUITY
|
$ | 18,625,440 | $ | 37,804,985 | ||||
See notes to consolidated financial statements
F-5
|
CEL-SCI CORPORATION
|
||||||||||||
|
|
||||||||||||
|
YEARS ENDED SEPTEMBER 30, 2011, 2010 AND 2009
|
||||||||||||
|
2011
|
2010
|
2009
|
||||||||||
|
GRANT INCOME AND OTHER
|
$ | 956,154 | $ | 153,300 | $ | 80,093 | ||||||
|
OPERATING EXPENSES:
|
||||||||||||
|
Research and development (excluding
|
||||||||||||
|
R&D depreciation of $438,738, $434,030
|
||||||||||||
|
and $329,866 respectively, included below)
|
11,745,629 | 11,911,626 | 6,011,750 | |||||||||
|
Depreciation and amortization
|
531,316 | 516,117 | 417,205 | |||||||||
|
General & administrative
|
6,664,883 | 6,285,810 | 5,671,595 | |||||||||
|
Total operating expenses
|
18,941,828 | 18,713,553 | 12,100,550 | |||||||||
|
OPERATING LOSS
|
(17,985,674 | ) | (18,560,253 | ) | (12,020,457 | ) | ||||||
|
OTHER EXPENSES
|
(12,000,000 | ) | - | - | ||||||||
|
GAIN (LOSS) ON DERIVATIVE INSTRUMENTS
|
4,432,148 | 28,843,772 | (28,491,650 | ) | ||||||||
|
INTEREST INCOME
|
164,163 | 362,236 | - | |||||||||
|
INTEREST EXPENSE
|
(322,980 | ) | (162,326 | ) | (397,923 | ) | ||||||
|
NET (LOSS) INCOME
|
(25,712,343 | ) | 10,483,429 | (40,910,030 | ) | |||||||
|
MODIFICATIONS OF WARRANTS
|
(1,068,369 | ) | (1,532,456 | ) | (490,728 | ) | ||||||
|
NET (LOSS) INCOME AVAILABLE TO COMMON SHAREHOLDERS
|
$ | (26,780,712 | ) | $ | 8,950,973 | $ | (41,400,758 | ) | ||||
|
NET (LOSS) INCOME PER COMMON SHARE
|
||||||||||||
|
BASIC
|
$ | (0.13 | ) | $ | 0.04 | $ | (0.31 | ) | ||||
|
DILUTED
|
$ | (0.15 | ) | $ | (0.06 | ) | $ | (0.31 | ) | |||
|
WEIGHTED AVERAGE COMMON SHARES OUTSTANDING
|
||||||||||||
|
BASIC
|
208,488,987 | 202,102,859 | 133,535,050 | |||||||||
|
DILUTED
|
208,488,987 | 202,102,859 | 133,535,050 | |||||||||
See notes to consolidated financial statements.
F-6
|
CEL-SCI CORPORATION
|
||||||||||||||||||||
|
CONSOLIDATED STATEMENTS OF STOCKHOLDERS' EQUITY
|
||||||||||||||||||||
|
YEARS ENDED SEPTEMBER 30, 2011, 2010 AND 2009
|
||||||||||||||||||||
|
Additional
|
||||||||||||||||||||
|
Common
|
Stock
|
Paid-In
|
Accumulated
|
|||||||||||||||||
|
Shares
|
Amount
|
Capital
|
Deficit
|
Total
|
||||||||||||||||
|
BALANCE, SEPTEMBER 30, 2008
|
120,796,094 | $ | 1,207,961 | $ | 134,324,370 | $ | (124,696,296 | ) | $ | 10,836,035 | ||||||||||
|
Sale of common stock
|
45,451,547 | 454,515 | 31,788,201 | 32,242,716 | ||||||||||||||||
|
401(k) contributions paid
|
||||||||||||||||||||
|
in common stock
|
91,766 | 917 | 56,912 | 57,829 | ||||||||||||||||
|
Exercise of stock options
|
15,659,116 | 156,591 | 8,524,663 | 8,681,254 | ||||||||||||||||
|
Stock issued to nonemployees
|
||||||||||||||||||||
|
for service
|
3,316,438 | 33,164 | 1,528,179 | 1,561,343 | ||||||||||||||||
|
Stock issued to employees
|
1,324,385 | 13,244 | 672,614 | 685,858 | ||||||||||||||||
|
Stock issued for principal payments
|
||||||||||||||||||||
|
on Series K notes
|
972,753 | 9,728 | 275,272 | 285,000 | ||||||||||||||||
|
Stock issued for interest on Series K notes
|
177,403 | 1,774 | 41,111 | 42,885 | ||||||||||||||||
|
Issuance of stock options and warrants
|
||||||||||||||||||||
|
to nonemployees
|
449,641 | 449,641 | ||||||||||||||||||
|
Loss on conversion of convertible stock
|
2,145,754 | 2,145,754 | ||||||||||||||||||
|
Issuance of warrants for short term loan
|
65,796 | 65,796 | ||||||||||||||||||
|
Modification of options
|
6,142 | 6,142 | ||||||||||||||||||
|
Employee option cost
|
1,699,448 | 1,699,448 | ||||||||||||||||||
|
Premium on loan from shareholder
|
489,776 | 489,776 | ||||||||||||||||||
|
Conversion of convertible debt
|
||||||||||||||||||||
|
into common stock
|
3,015,852 | 30,159 | 1,176,182 | 1,206,341 | ||||||||||||||||
|
Cost of derivative liabilities
|
(8,632,217 | ) | (8,632,217 | ) | ||||||||||||||||
|
Financing costs
|
(2,072,927 | ) | (2,072,927 | ) | ||||||||||||||||
|
Dividends
|
1,166,667 | 11,667 | 479,061 | (490,728 | ) | - | ||||||||||||||
|
Net loss
|
(40,910,030 | ) | (40,910,030 | ) | ||||||||||||||||
|
BALANCE, SEPTEMBER 30, 2009
|
191,972,021 | 1,919,720 | 173,017,978 | (166,097,054 | ) | 8,840,644 | ||||||||||||||
|
401(k) contributions paid
|
||||||||||||||||||||
|
in common stock
|
182,233 | 1,822 | 110,503 | 112,325 | ||||||||||||||||
|
Exercise of warrants and stock options
|
12,249,441 | 122,495 | 6,186,379 | 6,308,874 | ||||||||||||||||
|
Stock issued to nonemployees
|
||||||||||||||||||||
|
for service
|
465,158 | 4,652 | 1,236,374 | 1,241,026 | ||||||||||||||||
|
Exercise of derivative liabilities
|
5,510,490 | 5,510,490 | ||||||||||||||||||
|
Modification of stock options and warrants
|
227,921 | 227,921 | ||||||||||||||||||
|
Employee option cost
|
1,316,399 | 1,316,399 | ||||||||||||||||||
|
Adoption of ASC 815-40
|
(6,186,343 | ) | (6,186,343 | ) | ||||||||||||||||
|
Net income
|
10,483,429 | 10,483,429 | ||||||||||||||||||
|
BALANCE, SEPTEMBER 30, 2010
|
204,868,853 | 2,048,689 | 187,606,044 | (161,799,968 | ) | 27,854,765 | ||||||||||||||
|
Sale of stock
|
7,424,982 | 74,250 | 3,862,034 | 3,936,284 | ||||||||||||||||
|
401(k) contributions paid
|
||||||||||||||||||||
|
in common stock
|
294,309 | 2,943 | 147,922 | 150,865 | ||||||||||||||||
|
Exercise of warrants and stock options
|
1,786,599 | 17,866 | 661,722 | 679,588 | ||||||||||||||||
|
Stock issued to nonemployees
|
||||||||||||||||||||
|
for service
|
348,280 | 3,482 | 210,641 | 214,123 | ||||||||||||||||
|
Dismissal of liability for overpayment
|
81,395 | 81,395 | ||||||||||||||||||
|
Exercise of derivative liabilities
|
202,830 | 202,830 | ||||||||||||||||||
|
Modification of stock options and warrants
|
135,988 | 135,988 | ||||||||||||||||||
|
Employee option cost
|
1,535,329 | 1,535,329 | ||||||||||||||||||
|
Net loss
|
(25,712,343 | ) | (25,712,343 | ) | ||||||||||||||||
|
BALANCE, SEPTEMBER 30, 2011
|
214,723,023 | $ | 2,147,230 | $ | 194,443,905 | $ | (187,512,311 | ) | $ | 9,078,824 | ||||||||||
See notes to consolidated financial statements
F-7
|
CEL-SCI CORPORATION
|
||||||||||||
|
|
||||||||||||
|
YEARS ENDED SEPTEMBER 30, 2011, 2010 AND 2009
|
||||||||||||
|
2011
|
2010
|
2009
|
||||||||||
|
CASH FLOWS FROM OPERATING ACTIVITIES:
|
||||||||||||
|
Net (loss) income
|
$ | (25,712,343 | ) | $ | 10,483,429 | $ | (40,910,030 | ) | ||||
|
Adjustments to reconcile net (loss) income to
|
||||||||||||
|
net cash used in operating activities:
|
||||||||||||
|
Depreciation and amortization
|
531,316 | 516,117 | 417,205 | |||||||||
|
Issuance of stock options and warrants to
|
||||||||||||
|
nonemployees for services
|
- | - | 449,641 | |||||||||
|
Issuance of convertible notes and preferred stock in legal settlement
|
9,000,000 | - | - | |||||||||
|
Issuance of common stock for services
|
214,123 | 1,241,026 | 1,561,343 | |||||||||
|
Premium on loan
|
- | - | 341,454 | |||||||||
|
Loan premium adjustment
|
- | - | 489,776 | |||||||||
|
Amortization of loan premium
|
- | (3,282 | ) | (338,172 | ) | |||||||
|
Modification of stock options and warrants
|
135,988 | 227,921 | 6,142 | |||||||||
|
Issuance of stock to employees
|
- | - | 685,858 | |||||||||
|
Loss on conversion of convertible notes
|
- | - | 2,145,754 | |||||||||
|
Employee option cost
|
1,535,329 | 1,316,399 | 1,699,448 | |||||||||
|
Common stock contributed to 401(k) plan
|
150,865 | 112,325 | 57,829 | |||||||||
|
Warrants issued in consideration for loan
|
- | - | 65,796 | |||||||||
|
Impairment loss on abandonment of patents
|
9,016 | 13,877 | 138,525 | |||||||||
|
Loss on retired equipment
|
2,828 | 2,323 | 270 | |||||||||
|
Deferred rent
|
(3,699 | ) | (6,080 | ) | 7,688 | |||||||
|
Amortization of discount on
|
||||||||||||
|
convertible note
|
- | - | 193,980 | |||||||||
|
(Gain)/loss on derivative instruments
|
(4,432,148 | ) | (28,843,772 | ) | 25,514,667 | |||||||
|
Change in assets and liabilities:
|
||||||||||||
|
(Increase)/decrease in deposits
|
(1,670,917 | ) | 1,585,064 | 4,764 | ||||||||
|
Increase in receivables
|
(457,337 | ) | - | - | ||||||||
|
Decrease in deferred rent
|
629,682 | 955,842 | 622,350 | |||||||||
|
Increase in prepaid expenses
|
(1,729,812 | ) | (258,747 | ) | (12,763 | ) | ||||||
|
Increase in inventory used for
|
||||||||||||
|
R&D and manufacturing
|
(94,948 | ) | (1,076,760 | ) | (4,304 | ) | ||||||
|
(Decrease)/increase in accounts payable
|
(788,254 | ) | 693,799 | 343,208 | ||||||||
|
Increase/(decrease) in accrued expenses
|
147,919 | 125,031 | (14,514 | ) | ||||||||
|
Decrease in accrued interest on convertible debt
|
- | - | (2,674 | ) | ||||||||
|
Increase in deferred revenue
|
- | 125,000 | - | |||||||||
|
(Decrease)/increase in due to employees
|
(23,019 | ) | (3,719 | ) | 13,450 | |||||||
|
(Decrease)/increase in deposits held
|
- | (10,000 | ) | 10,000 | ||||||||
|
Net cash used in operating activities
|
(22,555,411 | ) | (12,804,207 | ) | (6,513,309 | ) | ||||||
|
CASH FLOWS FROM INVESTING ACTIVITIES:
|
||||||||||||
|
Additional investment in manufacturing facility
|
- | (32,059 | ) | (505,225 | ) | |||||||
|
Decrease in restricted cash
|
21,357 | 47,195 | 919,100 | |||||||||
|
Sale of investments in available-for-sale securities
|
- | - | 200,000 | |||||||||
|
Purchases of equipment
|
(216,761 | ) | (493,736 | ) | (191,868 | ) | ||||||
|
Expenditures for patent costs
|
(122,706 | ) | (25,340 | ) | (53,290 | ) | ||||||
|
Net cash (used in) provided by investing activities
|
(318,110 | ) | (503,940 | ) | 368,717 | |||||||
|
CASH FLOWS FROM FINANCING ACTIVITIES:
|
||||||||||||
|
Proceeds from issuance of common stock
|
3,936,284 | - | 32,242,716 | |||||||||
|
Proceeds from exercise of warrants and stock options
|
679,588 | 6,308,874 | 8,681,254 | |||||||||
|
Proceeds from short-term loan
|
- | - | 3,104,057 | |||||||||
|
Repayment of short-term loan
|
- | - | (2,200,000 | ) | ||||||||
|
Payments for repurchase of preferred stock
|
(4,050,000 | ) | - | (754,250 | ) | |||||||
|
Costs for equity related transactions
|
- | - | (2,072,927 | ) | ||||||||
|
Net cash provided by financing activities
|
565,872 | 6,308,874 | 39,000,850 | |||||||||
|
NET (DECREASE) INCREASE
IN CASH AND CASH EQUIVALENTS
|
(22,307,649 | ) | (6,999,273 | ) | 32,856,258 | |||||||
|
CASH AND CASH EQUIVALENTS, BEGINNING OF YEAR
|
26,568,243 | 33,567,516 | 711,258 | |||||||||
|
CASH AND CASH EQUIVALENTS, END OF YEAR
|
$ | 4,260,594 | $ | 26,568,243 | $ | 33,567,516 | ||||||
F-8
|
CEL-SCI CORPORATION
|
||||||||||||
|
CONSOLIDATED STATEMENTS OF CASH FLOWS
|
||||||||||||
|
YEARS ENDED SEPTEMBER 30, 2011, 2010 AND 2009
|
||||||||||||
|
2011
|
2010
|
2009
|
||||||||||
|
CONVERSION OF CONVERTIBLE DEBT INTO COMMON STOCK:
|
||||||||||||
|
Decrease in convertible debt
|
$ | - | $ | - | $ | 1,206,341 | ||||||
|
Increase in common stock
|
- | - | (30,159 | ) | ||||||||
|
Increase in additional paid-in capital
|
- | - | (1,176,182 | ) | ||||||||
| $ | - | $ | - | $ | - | |||||||
|
CONVERSION OF INTEREST ON CONVERTIBLE DEBT INTO COMMON STOCK:
|
||||||||||||
|
Decrease in accrued liabilities
|
$ | - | $ | - | $ | 42,885 | ||||||
|
Increase in common stock
|
- | - | (1,774 | ) | ||||||||
|
Increase in additional paid-in capital
|
- | - | (41,111 | ) | ||||||||
| $ | - | $ | - | $ | - | |||||||
|
PAYMENT OF CONVERTIBLE DEBT PRINCIPAL WITH
COMMON STOCK:
|
||||||||||||
|
Decrease in convertible debt
|
$ | - | $ | - | $ | 285,000 | ||||||
|
Increase in common stock
|
- | - | (9,728 | ) | ||||||||
|
Increase in additional paid-in capital
|
- | - | (275,272 | ) | ||||||||
| $ | - | $ | - | $ | - | |||||||
|
ISSUANCE OF WARRANTS:
|
||||||||||||
|
Increase in derivative liabilities
|
$ | - | $ | - | $ | (8,877,217 | ) | |||||
|
Increase in discount on notes payable
|
- | - | 245,000 | |||||||||
|
Decrease in additional paid-in capital
|
- | - | 8,632,217 | |||||||||
| $ | - | $ | - | $ | - | |||||||
|
EXERCISE OF DERIVATIVE LIABILITIES:
|
||||||||||||
|
Decrease in derivative liabilities
|
$ | 202,830 | $ | 5,510,490 | $ | - | ||||||
|
Increase in additional paid-in capital
|
(202,830 | ) | (5,510,490 | ) | - | |||||||
| $ | - | $ | - | $ | - | |||||||
|
MODIFICATION OF WARRANTS:
|
||||||||||||
|
Increase in additional paid-in capital
|
$ | - | $ | (1,532,456 | ) | $ | (24,061 | ) | ||||
|
Decrease in additional paid-in capital
|
- | 1,532,456 | 24,061 | |||||||||
| $ | - | $ | - | $ | - | |||||||
See notes to consolidated financial statements.
F-9
|
CEL-SCI CORPORATION
|
||||||||||||
|
CONSOLIDATED STATEMENTS OF CASH FLOWS
|
||||||||||||
|
YEARS ENDED SEPTEMBER 30, 2011, 2010 AND 2009
|
||||||||||||
|
2011
|
2010
|
2009
|
||||||||||
|
PATENT COSTS INCLUDED IN ACCOUNTS PAYABLE:
|
||||||||||||
|
Increase in patent costs
|
$ | 28,531 | $ | - | $ | 7,285 | ||||||
|
Increase in accounts payable
|
(28,531 | ) | - | (7,285 | ) | |||||||
| $ | - | $ | - | $ | - | |||||||
|
EQUIPMENT COSTS INCLUDED IN ACCOUNTS PAYABLE:
|
||||||||||||
|
Increase in research and office equipment
|
$ | 1,291 | $ | 10,436 | $ | 15,147 | ||||||
|
Increase in accounts payable
|
(1,291 | ) | (10,436 | ) | (15,147 | ) | ||||||
| $ | - | $ | - | $ | - | |||||||
|
WARRANTS ISSUED FOR LOAN:
|
||||||||||||
|
Increase in debt discount
|
$ | - | $ | - | $ | 65,796 | ||||||
|
Increase in additional paid-in capital
|
- | - | (65,796 | ) | ||||||||
| $ | - | $ | - | |||||||||
|
STOCK MODIFICATION RECORDED AS DIVIDEND
|
||||||||||||
|
Increase in common stock
|
$ | - | $ | - | $ | (11,667 | ) | |||||
|
Increase additional paid-in capital
|
- | - | (479,061 | ) | ||||||||
|
Increase accumulated deficit
|
- | - | 490,728 | |||||||||
| $ | - | $ | - | $ | - | |||||||
|
ADOPTION OF ASC 815-40
|
||||||||||||
|
Increase in derivative liabilities
|
$ | - | $ | (6,186,343 | ) | $ | - | |||||
|
Increase in accumulated deficit
|
- | 6,186,343 | - | |||||||||
| $ | - | $ | - | $ | - | |||||||
|
DISMISSAL OF LIABILITY FOR OVERPAYMENT
|
||||||||||||
|
Decrease in accrued expenses
|
$ | 81,395 | $ | - | $ | - | ||||||
|
Increase in additional paid-in capital
|
(81,395 | ) | - | - | ||||||||
| $ | - | $ | - | $ | - | |||||||
|
SUPPLEMENTAL DISCLOSURE OF CASH FLOWS
|
||||||||||||
|
INFORMATION:
|
||||||||||||
|
Cash expenditure for interest expense
|
$ | 195,980 | $ | 162,326 | $ | 115,559 | ||||||
See notes to consolidated financial statements.
F-10
1. ORGANIZATION AND SUMMARY OF SIGNIFICANT ACCOUNTING POLICIES
CEL-SCI Corporation (the "Company") was incorporated on March 22, 1983, in the state of Colorado, to finance research and development in biomedical science and ultimately to engage in marketing and selling products.
The Company’s lead investigational therapy, Multikine (Leukocyte Interleukin, Injection), is currently being developed as a potential therapeutic agent directed at using the immune system to produce an anti-tumor immune response. Data from Phase I and Phase II clinical trials suggest Multikine has the potential to directly affect tumor cells. These data also indicate that it appears to activate the patient’s own anti-tumor immune response. Multikine (Leukocyte Interleukin, Injection) is the full name of this investigational therapy, which, for simplicity, is referred to in the remainder of this document as Multikine. Multikine is the trademark that the Company has registered for this investigational therapy, and this proprietary name is subject to FDA review in connection with the Company’s future anticipated regulatory submission for approval. Multikine has not been licensed or approved by the FDA or any other regulatory agency. Neither has its safety or efficacy been established for any use.
Multikine has been cleared by the regulators in 9 countries around the world, including the U.S. FDA, for a global Phase III clinical trial in advanced primary (not yet treated) head and neck cancer patients.
Significant accounting policies are as follows:
|
a.
|
Principles of Consolidation
-- The consolidated financial statements include the accounts of the Company and its wholly owned subsidiary, Viral Technologies, Inc. (VTI). All significant intercompany transactions have been eliminated upon consolidation.
|
|
b.
|
Cash and Cash Equivalents
-- For purposes of the statements of cash flows, cash and cash equivalents consists principally of unrestricted cash on deposit and short-term money market funds. The Company considers all highly liquid investments with a maturity when purchased of less than three months, as cash and cash equivalents.
|
|
c.
|
Restricted Cash
-- The restricted cash as of September 30, 2010 was money held in escrow pursuant to the lease agreement for the manufacturing facility. The restrictions on the cash were released during the year ended September 30, 2011.
|
|
d.
|
Prepaid Expenses and Inventory
--
Prepaid expenses are payments for services to be rendered over a long period and are expensed over the time period for which the service is rendered. Inventory consists of manufacturing production advances and bulk purchases of laboratory supplies to be consumed in the manufacturing of the Company's product for clinical studies.
|
|
e.
|
Deposits
--
The deposit on September 30, 2011 was for the manufacturing facility required by the lease agreement.
|
F-11
|
f.
|
Research and Office Equipment and Leasehold Improvements
-- Research and office equipment is recorded at cost and depreciated using the straight-line method over estimated useful lives of five to seven years. Leasehold improvements are depreciated over the shorter of the estimated useful life of the asset or the term of the lease. Repairs and maintenance which do not extend the life of the asset are expensed when incurred. The fixed assets are reviewed on a quarterly basis to determine if any of the assets are impaired. Depreciation expense for the years ended September 30, 2011, 2010 and 2009 totaled $447,174, $437,629, and $330,820, respectively. During the years ended September 30, 2011, 2010 and 2009, equipment with a net book value of $2,828, $2,323 and $270, respectively, was retired.
|
|
g.
|
Patents
-- Patent expenditures are capitalized and amortized using the straight-line method over the shorter of the expected useful life or the legal life of the patent (17 years). In the event changes in technology or other circumstances impair the value or life of the patent, appropriate adjustment in the asset value and period of amortization is made. An impairment loss is recognized when estimated future undiscounted cash flows expected to result from the use of the asset, and from disposition, is less than the carrying value of the asset. The amount of the impairment loss is the difference between the estimated fair value of the asset and its carrying value. During the years ended September 30, 2011, 2010 and 2009, the Company recorded patent impairment charges of $9,016, $13,877, and $138,525, respectively, for the net book value of patents abandoned during the year. These amounts are included in general and administrative expenses. Amortization expense for the years ended September 30, 2011, 2010 and 2009 totaled $84,142, $78,488, and $86,385, respectively. The total estimated future amortization is as follows:
|
|
Year ending September 30,
|
||||
| 2012 | $ | 86,409 | ||
| 2013 | 86,409 | |||
| 2014 | 86,409 | |||
| 2015 | 45,231 | |||
| 2016 | 8,896 | |||
| Thereafter | 100,804 | |||
| $ | 414,158 | |||
|
h.
|
Deferred Rent
--
Interest on the deferred rent is calculated at 3% on the funds deposited on the manufacturing facility and is included in the deferred rent. This interest income will be used to offset future rent. On September 30, 2011, the Company has included in deferred rent the following: 1) deposit on the manufacturing facility ($3,150,000); 2) the fair value of the warrants issued to lessor ($1,403,654); 3) additional investment ($2,995,541); 4) deposit on the cost of the leasehold improvements for the manufacturing facility ($1,786,591),; and 5) accrued interest on deposit ($287,668), less amortization of $2,433,614
.
|
|
|
On September 30, 2010, the Company has included in deferred rent the following: 1) deposit on the manufacturing facility ($3,150,000); 2) the fair value of the warrants issued to lessor ($1,403,654); 3) additional investment ($2,976,396; 4) deposit on the cost of the leasehold improvements for the manufacturing facility ($1,786,591); and 5) accrued interest on deposit ($186,194), less amortization of $1,683,313 .
|
F-12
|
i
.
|
Deferred Rent (liability)
--
The deferred rent (liability) is amortized on a straight-line basis over the term of the lease with the offset going against rent expense
.
|
|
j
.
|
Derivative Instruments
-- The Company entered into financing arrangements that consisted of freestanding derivative instruments or were hybrid instruments that contained embedded derivative features. The Company accounted for this arrangement in accordance with Codification 815-10-50, “
Accounting for Derivative Instruments and Hedging Activities
”, “
Accounting for Derivative Financial Instruments Indexed to, and Potentially Settled in, a Company's Own Stock
”. In accordance with accounting principles generally accepted in the United States (“GAAP”), derivative instruments and hybrid instruments are recognized as either assets or liabilities in the Company’s balance sheet and are measured at fair value with gains or losses recognized in earnings or other comprehensive income depending on the nature of the derivative or hybrid instruments. Embedded derivatives that are not clearly and closely related to the host contract are bifurcated and recognized at fair value with changes in fair value recognized as either a gain or loss in earnings if they can be reliably measured. When the fair value of embedded derivative features cannot be reliably measured, the Company measures and reports the entire hybrid instrument at fair value with changes in fair value recognized as either a gain or loss in earnings. The Company determined the fair value of derivative instruments and hybrid instruments based on available market data using appropriate valuation models, giving consideration to all of the rights and obligations of each instrument and precluding the use of “blockage” discounts or premiums in determining the fair value of a large block of financial instruments. Fair value under these conditions does not necessarily represent fair value determined using valuation standards that give consideration to blockage discounts and other factors that may be considered by market participants in establishing fair value.
|
|
k.
|
Research and Development Grant Revenues
-- The Company received a $733,437 grant in November 2010 under The Patient Protection and Affordable Care Act of 2010 (PPACA). The grant was related to three of the Company’s projects, including the Phase III trial of Multikine. The PPACA provides small and mid-sized biotech, pharmaceutical and medical device companies with up to a 50% tax credit for investments in qualified therapeutic discoveries for tax years 2009 and 2010 for all qualified “therapeutic discovery projects”. The Company recognizes revenue as the expenses are incurred. During the fiscal year ended September 30, 2011, the Company has earned $733,437 in PPACA grants and has receivables of $161,297 for grant money earned but not yet received. This payment was received in November 2011.
|
|
l.
|
Research and Development Costs
-- Research and development expenditures are expensed as incurred. Total research and development costs, excluding depreciation, were $11,745,629, $11,911,626, and $6,011,750, respectively, for the years ended September 30, 2011, 2010 and 2009.
|
F-13
|
m.
|
Net (Loss) Income Per Common Share
--
Net (loss) income per common share is computed by dividing the net (loss) income by the weighted average number of common shares outstanding during the period. Potentially dilutive common stock equivalents, including convertible preferred stock, convertible debt and options to purchase common stock, are included in the calculation of diluted net (loss) income per share unless the result is antidilutive.
|
|
n.
|
Concentration of Credit Risk
-- Financial instruments, which potentially subject the Company to concentrations of credit risk, consist of cash and cash equivalents. The Company maintains its cash and cash equivalents with high quality financial institutions. At times, these accounts may exceed federally insured limits. The Company has not experienced any losses in such bank accounts. The Company believes it is not exposed to significant credit risk related to cash and cash equivalents. All of our non-interest bearing cash balances were fully insured at September 30, 2011 due to a temporary federal program in effect from December 31, 2010 through December 31, 2012. Under the program, there is no limit to the amount of insurance for eligible accounts. Beginning 2013, insurance coverage will revert to $250,000 per depositor at each financial institution, and our non-interest bearing cash balances may again exceed federally insured limits. Interest-bearing amounts on deposit in excess of federally insured limits at September 30, 2011 approximated $3,666,000.
|
|
o.
|
Income Taxes
-- The Company uses the asset and liability method of accounting for income taxes. Under the asset and liability method, deferred tax assets and liabilities are recognized for future tax consequences attributable to differences between the financial statement carrying amounts of existing assets and liabilities and their respective tax bases and operating and tax loss carryforwards. Deferred tax assets and liabilities are measured using enacted tax rates expected to apply to taxable income in the years in which those temporary differences are expected to be recovered or settled. The effect on deferred tax assets and liabilities of a change in tax rates is recognized in income in the period that includes the enactment date. The Company records a valuation allowance to reduce the deferred tax assets to the amount that is more likely than not to be recognized.
|
|
p.
|
Use of Estimates
-- The preparation of financial statements in conformity with accounting principles generally accepted in the United States of America requires management to make estimates and assumptions that affect the reported amounts of assets and liabilities and disclosure of contingent assets and liabilities at the date of the financial statements and the reported amounts of revenues and expenses during the reporting period. Actual results could differ from those estimates. Accounting for derivatives is based upon valuations of derivative instruments determined using various valuation techniques including the Black-Scholes and binomial pricing methodologies. The Company considers such valuations to be significant estimates.
|
|
q.
|
Recent Accounting Pronouncements
-- In January 2010, the FASB issued ASU 2010-06, “
Fair Value Measurements and Disclosures”,
which requires new disclosures for transfers in and out of Level 1 and Level 2 and activity in Level 3 of the fair value hierarchy. ASU 2010-06 requires separate disclosure of the amounts of significant transfers in and out of Level 1 and Level 2 fair value measurements and a description of the reasons for the transfers. In the reconciliation for fair value measurements using Level 3 inputs, a reporting entity should present separately information about purchases, sales, issuances and settlements. ASU 2010-06 is effective for new disclosures and clarification of existing disclosures for interim and annual periods beginning after December 15, 2009 except for disclosures about purchases, sales, issuances and settlements in the Level 3 activity rollforward, which are effective for fiscal years beginning after December 15, 2010, and for interim periods within those fiscal years. The adoption of ASU 2010-06 did not have a material impact on its financial statements.
|
F-14
|
|
In May 2011, the FASB Issued Accounting Standards Update (ASU) No. 2011-04,
“Fair Value Measurement (Topic 820) – Amendments to Achieve Common Fair Value Measurement and Disclosure Requirements in U.S. GAAP and IFRSs”,
which is effective for interim and annual periods beginning after December 15, 2011. The ASU is mainly the result of
the joint efforts by the FASB and the International Accounting Standards Board to develop a
single, converged fair value framework on how to measure fair value and common disclosure
requirements for fair value measurements. The ASU amends various fair value guidance such as
requiring the highest-and-best-use and valuation-premise concepts only to measuring the fair
value of nonfinancial assets and prohibits the use of blockage factors and control premiums when
measuring fair value. In addition, the ASU expands disclosure requirements particularly for Level 3
inputs and requires disclosure of the level in the fair value hierarchy of items that are not
measured at fair value in the statement of financial position but whose fair value must be
disclosed
.
The Company does not believe that this amendment will have a material impact on its financial statements
|
|
r.
|
Stock-Based Compensation
-- Compensation cost for all stock-based awards is measured at fair value as of the grant date. The fair value of our stock options is calculated using the Black-Scholes option pricing model. The Black-Scholes model requires various highly judgmental assumptions including volatility, forfeiture rates and expected option life. If any of the assumptions used in the Black-Scholes model change significantly, stock-based compensation expense for new awards may differ materially in the future from that recorded in the current period.
The fair value of each option grant was estimated on the date of grant using the Black-Scholes option-pricing model with the following assumptions:
|
|
2011
|
2010
|
2009
|
|||
|
Expected stock price volatility
|
96.5-97%
|
98.6-104.5%
|
79.5-80.2%
|
||
|
Risk-free interest rate
|
2.97-3.68%
|
2.54-4.01%
|
2.82-3.72%
|
||
|
Expected life of options
|
9.62-9.63 Years
|
9.63-10 Years
|
10 Years
|
||
|
|
|||||
|
Expected dividend yield
|
-
|
-
|
-
|
The Company’s stock options are not transferable, and the actual value of the stock options that an employee may realize, if any, will depend on the excess of the market price on the date of exercise over the exercise price. The Company has based its assumption for stock price volatility on the variance of daily closing prices of the Company's stock. The risk-free rate of return used for fiscal years 2011, 2010 and 2009 equals the yield on ten-year zero-coupon U.S. Treasury issues on the grant date. Historical data was used to estimate option exercise and employee termination within the valuation model. The expected term of options represents the period of time that options granted are expected to be outstanding and has been determined based on an analysis of historical exercise behavior. No discount was applied to the value of the grants for non-transferability or risk of forfeiture.
F-15
The Company recognized expense of $1,535,329 for options issued or vested during the fiscal year ended September 30, 2011, expense of $1,316,399 for options issued or vested during the fiscal year ended September 30, 2010 and expense of $1,699,448 for options issued or vested during the fiscal year ending September 30, 2009. This expense was recorded as general and administrative expense. The Company received a total of $13,056, $36,330 and $282,841 from the exercise of options during the year ended September 30, 2011, 2010 and 2009, respectively. The total intrinsic value of options exercised during the fiscal years 2011, 2010 and 2009 was $10,944, $32,999, and $242,634 respectively.
In fiscal year 2011, the Company issued 2,379,594 stock options to employees and directors at a fair value of $1,458,764, ($0.61 fair value per option). In fiscal year 2010, the Company issued 2,553,450 stock options to employees and directors at a fair value of $1,333,831, ($0.52 fair value per option). In fiscal year 2009, the Company issued 16,878,389 stock options to employees and directors at a fair value of $4,725,949, ($0.28 fair value per option). On September 30, 2011, the Company had 15,115,146 options that were unvested at a fair value of $5,834,830, which is a weighted average fair value of $0.39 per share with a weighted average remaining vesting life of 1.57 years.
Non-Qualified Stock Option Plans
-- At September 30, 2011, the Company has collectively authorized the issuance of 35,760,000 shares of common stock under its Non-Qualified Stock Option Plans. Options typically vest over a three-year period and expire no later than ten years after the grant date. Terms of the options are to be determined by the Company's Compensation Committee, which administers the plans. The Company's employees, directors, officers, and consultants or advisors are eligible to be granted options under the Non-Qualified Stock Option Plans.
Information regarding the activity in the Company's Non-Qualified Stock Option Plans for the year ended September 30, 2011 is summarized as follows:
Non-Qualified Stock Option Plan
| Outstanding | Exercisable | |||||||||||||||||||||||||||||||
| Number of Shares | Weighted Average Exercise Price | Weighted Ave Remaining Contractual Term (Years) | Aggregate Intrinsic Value | Number of Shares | Weighted Average Exercise Price | Weighted Ave Remaining Contractual Term (Years) | Aggregate Intrinsic Value | |||||||||||||||||||||||||
|
Outstanding at October 1, 2010
|
21,720,414 | $ | 0.49 | 7.06 | $ | 4,365,776 | 8,906,473 | $ | 0.60 | 4.34 | $ | 1,291,973 | ||||||||||||||||||||
|
Vested
|
1,059,721 | $ | 0.53 | |||||||||||||||||||||||||||||
|
Granted
|
1,779,594 | $ | 0.69 | 9.58 | $ | - | ||||||||||||||||||||||||||
|
Exercised
|
(29,268 | ) | $ | 0.45 | 5.01 | $ | 10,944 | (29,268 | ) | $ | 0.45 | 5.01 | 10,944 | |||||||||||||||||||
|
Forfeited
|
(2,000 | ) | $ | 0.61 | ||||||||||||||||||||||||||||
|
Expired
|
(7,500 | ) | $ | 1.22 | (7,500 | ) | $ | 1.22 | ||||||||||||||||||||||||
| Outstanding at September 30, 2011 | 23,461,240 | $ | 0.51 | 6.35 | $ | 471,789 | 9,929,426 | $ | 0.62 | 3.93 | $ | 364,539 | ||||||||||||||||||||
F-16
A summary of the status of the Company's non-vested options as of September 30, 2011 is presented below:
Non-qualified Stock Option Plan
:
| Number of Shares |
Weighted
Average
Grant Date
Fair Value
|
|||||||
|
Unvested at September 30, 2010
|
12,813,941 | $ | 0.40 | |||||
|
Vested
|
(1,059,721 | ) | ||||||
|
Granted
|
1,779,594 | $ | 0.61 | |||||
|
Forfeited
|
(2,000 | ) | ||||||
|
Unvested at September 30, 2011
|
13,531,814 | $ | 0.37 | |||||
In April 2009, the Company extended the expiration date on 147,000 options from the Nonqualified Stock Option Plans with exercise prices ranging from $1.05 to $1.87. The options originally would have expired between May 2009 and September 2009 and were extended for three years to expiration dates ranging from May 2012 to September 2012. This extension was considered a new measurement date with respect to the modified options. At the date of modification, the additional cost of the options was $2,904. As of September 30, 2011, all of these options remained outstanding
.
In January 2010, the Company extended the expiration date on 181,666 options from the Nonqualified Stock Option Plans with exercise prices ranging from $1.05 to $1.76. The options originally would have expired between February 2010 and November 2010 and were extended for three years to expiration dates ranging from February 2013 to November 2013. This extension was considered a new measurement date with respect to the modified options. At the date of modification, the additional cost of the options was $72,632. As of September 30, 2011, all of these options remained outstanding
.
In January 2011, the Company extended the expiration date on 146,500 options from the Nonqualified Stock Option Plans with exercise prices ranging from $1.13 to $1.51. The options originally would have expired between March 2011 and October 2011 and were extended for three years to expiration dates ranging from March 2014 to October 2014. This extension was considered a new measurement date with respect to the modified options. At the date of modification, the additional cost of the options was $55,449. As of September 30, 2011, all of these options remained outstanding.
F-17
Incentive Stock Option Plan
--At September 30, 2011, the Company had collectively authorized the issuance of 19,100,000 shares of common stock under its Incentive Stock Option Plans. Options vest over a one-year to three-year period and expire no later than ten years after the grant date. Terms of the options were determined by the Company's Compensation Committee, which administers the plans. Only the Company's employees are eligible to be granted options under the Incentive Stock Option Plans.
Information regarding the activity in the Company's Incentive Stock Option Plans for the year ended September 30, 2011 is summarized as follows:
Incentive Stock Option Plan
| Outstanding | Exercisable | |||||||||||||||||||||||||||||||
|
Number of
Shares
|
Weighted Average
Exercise Price
|
Weighted Ave
Remaining Contractual
Term (Years)
|
Aggregate Intrinsic
Value
|
Number of
Shares
|
Weighted
Average Exercise
Price
|
Weighted
Ave Remaining
Contractual Term
(Years)
|
Aggregate Intrinsic
Value
|
|||||||||||||||||||||||||
|
Outstanding at October 1, 2010
|
10,593,041 | $ | 0.40 | 6.65 | $ | 3,101,582 | 8,893,042 | $ | 0.38 | 6.02 | $ | 2,794,276 | ||||||||||||||||||||
|
Vested
|
716,667 | $ | 0.53 | |||||||||||||||||||||||||||||
|
Granted
|
600,000 | $ | 0.69 | 9.58 | $ | - | ||||||||||||||||||||||||||
|
Expired
|
(25,000 | ) | $ | 1.39 | (25,000 | ) | $ | 1.39 | ||||||||||||||||||||||||
|
Outstanding at September 30, 2011
|
11,168,041 | $ | 0.42 | 5.83 | $ | 1,019,989 | 9,584,709 | $ | 0.38 | 5.29 | $ | 1,017,489 | ||||||||||||||||||||
A summary of the status of the Company's non-vested options as of September 30, 2011 is presented below:
F-18
Incentive Stock Option Plan
:
| Number of Shares |
Weighted Average
Grant Date Fair Value
|
|||||||
|
Unvested at September 30, 2010
|
1,699,999 | $ | 0.54 | |||||
|
Vested
|
(716,667 | ) | ||||||
|
Granted
|
600,000 | $ | 0.61 | |||||
|
Forfeited
|
- | |||||||
|
Unvested at September 30, 2011
|
1,583,332 | $ | 0.54 | |||||
In April 2009, the Company extended the expiration date on 153,000 options from the Incentive Stock Option Plans with an exercise price of $1.05. The options originally would have expired between April 2009 and December 2009 and were extended for three years to expiration dates ranging from April 2012 to December 2012. This extension was considered a new measurement date with respect to the modified options. At the date of modification, the additional cost of the options was $3,238. As of September 30, 2011, all of these options remained outstanding
.
In January 2010, the Company extended the expiration date on 337,166 options from the Incentive Stock Option Plans with exercise prices ranging from $1.05 to $1.18. The options originally would have expired between February 2010 and December 2010 and were extended for three years to expiration dates ranging from February 2013 to December 2013. This extension was considered a new measurement date with respect to the modified options. At the date of modification, the additional cost of the options was $139,812. As of September 30, 2011, all of these options remained outstanding
In January 2011, the Company extended the expiration date on 160,000 options from the Incentive Stock Option Plans with exercise prices ranging from $1.00 to $1.85. The options originally would have expired between January 2011 and December 2011 and were extended for three years to expiration dates ranging from January 2014 to December 2014. This extension was considered a new measurement date with respect to the modified options. At the date of modification, the additional cost of the options was $50,353. As of September 30, 2011, all of these options remained outstanding.
Stock Bonus Plans
-- At September 30, 2011, the Company had been authorized to issue up to 13,940,000 shares of common stock under its Stock Bonus Plans. All employees, directors, officers, consultants, and advisors are eligible to be granted shares. During the year ended September 30, 2009, 91,766 shares were issued to the Company’s 401(k) plan for a cost of $57,829. During the year ended September 30, 2010, 182,233 shares were issued to the Company’s 401(k) plan for a cost of $112,325. During the year ended September 30, 2011, 294,309 shares were issued to the Company's 401(k) plan for a cost of $150,865. During the years ended September 30, 2011, 2010 and 2009, the Company also issued 71,111, 113,520 and 2,826,711 shares respectively to consultants for payment of services at a cost of $31,160, $75,200 and $731,866 respectively.
F-19
Stock Compensation Plan
-- At September 30, 2011, 11,500,000 shares were authorized for use in the Company's stock compensation plan. During the year ended September 30, 2009, 1,324,385 shares were issued at the weighted average of $0.24 per share for a total cost of $312,016. During the year ended September 30, 2010, no shares were issued from the Stock Compensation Plan. During the year ended September 30, 2011, no shares were issued from the Stock Compensation Plan.
2. DERIVATIVES LIABILITIES, WARRANTS AND OTHER OPTIONS
Below is a chart showing the derivative liabilities, the number of warrants and other options outstanding at September 30, 2011:
|
Warrant
|
Issue
Date
|
Shares Issuable upon Exercise of
Warrant
|
Exercise
Price
|
Expiration Date
|
Reference
|
|||||||||
|
Series K
|
8/4/06
|
2,318,396 | $ | 0.40 |
2/4/12
|
1 | ||||||||
|
Series N
|
8/18/08
|
3,890,782 | 0.40 |
8/18/14
|
1 | |||||||||
|
Series A
|
6/24/09
|
1,303,472 | 0.50 |
12/24/14
|
1 | |||||||||
|
C. Schleuning (Series A)
|
7/8/09
|
167,500 | 0.50 |
01/08/15
|
1 | |||||||||
|
Series B
|
9/4/09
|
500,000 | 0.68 |
9/4/14
|
1 | |||||||||
|
Series C
|
8/20/09 – 8/26/09
|
4,634,886 | 0.55 |
2/20/15
|
1 | |||||||||
|
Series E
|
9/21/09
|
714,286 | 1.75 |
8/12/14
|
1 | |||||||||
|
Series L
|
4/18/07
|
951,669 | 0.75 |
4/17/12
|
2 | |||||||||
|
Series L (repriced)
|
4/18/07
|
1,000,000 | 0.56 |
4/17/13
|
2 | |||||||||
|
Series M
|
4/18/07
|
1,221,668 | 2.00 |
4/17/12
|
2 | |||||||||
|
Series M (modified)
|
4/18/07
|
6,000,000 | 0.60 |
7/31/14
|
2 | |||||||||
|
Series O
|
3/6/09
|
6,500,000 | 0.25 |
3/6/16
|
3 | |||||||||
|
Private Investors
|
5/30/03- 6/30/09
|
8,609,375 | 0.47 – 1.25 |
5/30/13 - 7/18/14
|
4 | |||||||||
|
Warrants held by
Officer and Director
|
6/24/09- 7/6/09
|
3,497,539 | 0.40 – 0.50 |
12/24/14 – 1/6/15
|
5 | |||||||||
|
Consultants
|
5/22/03 – 7/16/09
|
837,500 | 0.28 – 2.00 |
8/23/12 - 10/14/15
|
6 | |||||||||
F-20
|
1.
|
Derivative Liabilities
|
See below for details of the balances of derivative instruments at September 30, 2011 and 2010.
|
September 30, 2011
|
September 30, 2010
|
|||||||
|
Series K warrants
|
$ | 69,552 | $ | 1,002,502 | ||||
|
2009 financings warrants
|
||||||||
|
(Series A thru E)
|
1,375,458 | 4,037,066 | ||||||
|
2008 warrants reclassified from equity
|
||||||||
|
to derivative liabilities on
|
||||||||
|
October 1, 2009 (Series N)
|
817,063 | 1,906,483 | ||||||
|
Convertible notes issued in settlement (Note 11)
|
4,999,000 |
-
|
||||||
|
Total derivative liabilities
|
$ | 7,261,073 | $ | 6,946,051 | ||||
On October 1, 2009, the Company reviewed all outstanding warrants in accordance with the requirements of Codification 815-40-15-7, “Determining Whether an Instrument (or Embedded Feature) is Indexed to an Entity’s Own Stock”. This topic provides that an entity should use a two-step approach to evaluate whether an equity-linked financial instrument (or embedded feature) is indexed to its own stock, including evaluating the instrument’s contingent exercise and settlement provisions. The warrant agreements provide for adjustments to the exercise price for certain dilutive events, which includes an adjustment to the number of shares issuable upon the exercise of the warrant in the event that the Company makes certain equity offerings in the future at a price lower than the exercise prices of the warrant instruments. Under the provisions of Codification 815-40-15-7, the warrants are not considered indexed to the Company’s stock because future equity offerings or sales of the Company’s stock are not an input to the fair value of a “fixed-for-fixed” option on equity shares, and equity classification is therefore precluded.
In August 2008, 2,075,084 Series N warrants were issued to two investors in connection with a financing. In June 2009, the 2,075,084 warrants were reset from $0.75 to $0.40. The additional cost of the warrants of $123,013 was recorded as a debit and a credit to additional paid in capital. In addition, the investors were issued 1,815,698 warrants exercisable at $0.40 per share at an initial cost of $404,460. The additional cost of the warrants was recorded as a debit and a credit to additional paid in capital. In accordance with the requirements of Codification 815-40-15-7, effective October 1, 2009, 3,890,782 Series N warrants issued in August 2008 were determined to be subject to the requirements of this topic and were valued using the Black-Scholes formula as of October 1, 2009 at $6,186,343. The Series N warrants were recognized as a liability in the Company’s condensed consolidated balance sheet at fair value with a corresponding adjustment to accumulated deficit and are being marked-to-market each reporting period. The Series N warrants were revalued on September 30, 2011 and 2010 at $817,063 and $1,906,483, respectively, which resulted in a gain on derivatives and a decrease in derivative liabilities of $1,089,420 and $4,279,860, respectively due to the decrease in the Company’s stock price.
F-21
The Company accounted for the Series K and A through E Warrants as derivative liabilities in accordance with Codification 815-10, “Accounting for Derivative Instruments and Hedging Activities”. In accordance with Codification 815-40-15-7, derivative liabilities must be revalued at the end of each interim period and at the end of the fiscal year, as long as they remain outstanding. These warrants do not qualify for equity accounting and must be accounted for as a derivative liability since the Warrant Agreement provides the holder with the right, at its option, to require the Company to a cash settlement of the warrants at Black-Scholes value in the event of a Fundamental Transaction, as defined in the Warrant Agreement. Since the occurrence of a Fundamental Transaction is not entirely within the Company's control, there exist circumstances that would require net-cash settlement of the warrants while holders of shares would not receive a cash settlement.
In August 2006, the Company issued 4,825,581 Series K warrants at $0.95. In connection with the April 2007 financing and issuance of Series L and M warrants, there was a reset of the conversion price of the Series K warrants to $0.75. The Series K note holders received 1,286,819 additional Series K warrants as well. In connection with the June 2009 financing and issuance of the Series A warrants, there was a reset of the conversion price of the Series K notes and the exercise price of the Series K warrants from $0.75 to $0.40. The Series K note holders received 5,348,357 additional Series K warrants as well. The cost of these additional warrants is included in the fair value of the remaining warrants at September 30, 2011. During the year ended September 30, 2011, the Company recorded a gain of $932,950 on the remaining Series K warrants. During the year ended September 30, 2010, the Company recorded a gain of $2,856,355 on the remaining Series K warrants. During the year ended September 30, 2009, the Company recorded a loss of $3,991,910 on the remaining Series K warrants and a loss of $2,145,754 on the conversion of Series K convertible notes.
During the year ended September 30, 2011, no Series K warrants were exercised. During the year ended September 30, 2010, 1,335,221 Series K warrants, on which the Company recognized a gain on exercise of $280,223, were exercised. When the warrants were exercised, the value of these warrants was converted from derivative liabilities to equity. During the year ended September 30, 2009, 3,015,852 Series K warrants were exercised, on which the Company recognized a loss of $413,602.
For the year ended September 30, 2011, the Company recorded a gain of $2,225,887 on the Series A through E derivative instruments. During year ended September 30, 2010, the Company recognized a gain of $12,993,883 on the remaining Series A through E derivative instruments. During the year ended September 30, 2009, the Company recorded a loss of $21,109,155 on the Series A thru E derivative instruments.
In June 2009, the Company issued 10,116,560 Series A warrants exercisable at $0.50 per share in connection with the June financing. The cost of the warrants of $2,775,021 was recorded as a debit to additional paid in capital and a credit to derivative liabilities. As of September 30, 2011, 1,303,472 of these warrants remained outstanding. In accordance with Codification 815-40-15-7, derivative liabilities must be revalued at the end of each interim period and at the end of the fiscal year, as long as they remain outstanding. As of September 30, 2010, the fair value of these derivative liabilities totaled $599,596. As of September 30, 2011, the value of the remaining derivative liabilities totaled $260,694.
During the year ended September 30, 2011, no Series A warrants were exercised. During the year ended September 30, 2010, 8,813,088 Series A warrants, on which the Company recognized a total gain of $8,433,451 were exercised. When the warrants were exercised, the value of these warrants was converted from derivative liabilities to equity. During the year ended September 30, 2009 no Series A warrants were exercised.
F-22
In July 2009, the Company issued warrants to a private investor. The 167,500 warrants were issued with an exercise price of $0.50 per share and valued at $43,550 using the Black Scholes method. The cost of the warrants was accounted for as a debit to additional paid in capital and a credit to derivative liabilities. As of September 30, 2011, 167,500 warrants remained outstanding. In accordance with Codification 815-40-15-7, derivative liabilities must be revalued at the end of each interim period and at the end of the fiscal year, as long as they remain outstanding. As of September 30, 2010, the fair value of these derivative liabilities totaled $77,050. As of September 30, 2011, the value of the remaining derivative liabilities totaled $33,500.
In September 2009, the Company received a $2,000,000 loan. In connection with the loan, the Company issued 500,000 Series B warrants with an exercise price of $0.68 per share. The cost of the warrants of $245,000 was recorded as a debit to discount on note payable and a credit to additional paid in capital. This cost was amortized to interest expense when the loan was repaid. As of September 30, 2011, 500,000 Series B warrants remained outstanding. In accordance with Codification 815-40-15-7, derivative liabilities must be revalued at the end of each interim period and at the end of the fiscal year, as long as they remain outstanding. As of September 30, 2010, the fair value of these derivative liabilities totaled $220,000. As of September 30, 2011, the value of the remaining derivative liabilities totaled $90,000.
In August 2009, the Company received additional financing. In connection with the financing, the Company issued 4,850,501 Series C warrants exercisable at $0.55 per share. The cost of the warrants of $1,455,150 was recorded as a debit to additional paid in capital and a credit to derivative liabilities. As of September 30, 2011, 4,093,169 of these warrants remained outstanding. In accordance with Codification 815-40-15-7, derivative liabilities must be revalued at the end of each interim period and at the end of the fiscal year, as long as they remain outstanding. As of September 30, 2010, the fair value of these derivative liabilities totaled $2,231,230. As of September 30, 2011, the value of the remaining derivative liabilities totaled $818,634.
Also in August 2009, the Company completed an offering to the original Series K investors. Issued with an exercise price of $0.55 per share, the 541,717 Series C warrants were valued at $249,190. The warrants were accounted for as a debit to additional paid in capital and a credit to derivative liabilities. As of September 30, 2011, 541,717 of the Series C warrants remained outstanding. In accordance with Codification 815-40-15-7, derivative liabilities must be revalued at the end of each interim period and at the end of the fiscal year, as long as they remain outstanding. As of September 30, 2010, the fair value of these derivative liabilities totaled $249,190. As of September 30, 2011, the value of the remaining derivative liabilities totaled $108,343.
During the years ended September 30, 2011 and 2010, 757,331 and -0- Series C warrants were exercised, respectively. The Company recognized a gain on exercise of $232,891 and $-0-, respectively. When the warrants were exercised, the value of these warrants was converted from derivative liabilities to equity. Series C warrants transferred to equity totaled $202,830 and $-0-, respectively. No Series C warrants were exercised in the year ended September 30, 2009.
F-23
In September 2009, the Company issued 4,714,284 Series D warrants with an exercise price of $1.50 per share in connection with a financing. The cost of the warrants of $3,488,570 was calculated and was recorded as a debit and a credit to additional paid in capital. In addition, 714,286 Series E warrants were issued with an exercise price of $1.75 per share to the placement agent on the transaction. The cost of $664,286 was accounted for as a debit to additional paid in capital and a credit to derivative liabilities. On September 21, 2011, all 4,714,284 Series D warrants expired. As of September 30, 2011, 714,286 Series E warrants remained outstanding. In accordance with Codification 815-40-15-7, derivative liabilities must be revalued at the end of each interim period and at the end of the fiscal year, as long as they remain outstanding. As of September 30, 2010, the fair value of these derivative liabilities totaled $660,000. As of September 30, 2011, the value of the remaining derivative liabilities totaled $64,287.
Accounting for the Senior Convertible Note and Redeemable Series A Convertible Preferred Stock
– The Senior Secured Convertible Note falls within the scope of ASC 815. Under ASC 815-15-25-4 through 6 or ASC 825-10-10-1, the Company may make an irrevocable election to initially and subsequently measure a hybrid financial instrument in its entirety at fair value. Any change in fair value between the respective reporting dates shall be recognized as a gain or loss. Based on the Company’s analysis of the Senior Secured Convertible Note, the Company identified several embedded derivative features. The Company elected, in accordance with ASC 825-10-10-1, to initially and subsequently carry the instrument at fair value without bifurcating the embedded derivatives. For the year ended September 30, 2011, the Company recorded a loss of $49,000 on the Senior Secured Convertible Notes.
The Series A Convertible Preferred Stock falls within the scope of ASC 480 because the conversion option was considered nonsubstantive. ASC 480-10-30-1 states, “Mandatorily redeemable financial instruments shall be measured initially at fair value.” Therefore, immediately after initially recording Series A Convertible Preferred Stock, the carrying value of the instrument in its entirety must be adjusted to fair value as of the issuance date with the difference recorded as a loss. The Company also elected to adopt the fair value option ASC 825. The Series A Convertible Preferred Stock should be measured in its entirety and reported at fair value at each reporting date for so long as shares remain outstanding. Any change in fair value between the respective reporting dates will be recognized as a gain or loss. During the year ended September 30, 2011, the Company redeemed all of the Series A Convertible Preferred Stock.
See Note 11 for additional discussion on preferred stock and convertible notes.
F-24
|
2.
|
Series L and M Warrants
|
On April 18, 2007, the Company completed a $15 million private financing. Shares were sold at $0.75, a premium over the closing price of the previous two weeks. The financing was accompanied by 10 million warrants with an exercise price of $0.75 and 10 million warrants with an exercise price of $2.00. The warrants are known as Series L and Series M warrants, respectively.
In September 2008, 2,250,000 of the original Series L warrants were repriced at $0.56 and extended for one year to April 17, 2013. The increase in the value of the warrants of $173,187 was recorded as a debit and a credit to additional paid-in capital in accordance with the original accounting for the Series L warrants. As of September 30, 2011, 1,000,000 of the Series L warrants at the reduced exercise price of $0.56 and 951,669 at the original exercise price of $0.75 remained outstanding.
On March 12, 2010, the Company temporarily reduced the exercise price of the Series M warrants, originally issued on April 18, 2007. The exercise price was reduced from $2.00 to $0.75. At any time prior to June 16, 2010 investors could have exercised the Series M warrants at a price of $0.75 per share. For every two Series M warrants exercised prior to June 16, 2010 the investor would have received one Series F warrant. Each Series F warrant would have allowed the holder to purchase one share of the Company’s common stock at a price of $2.50 per share at any time on or before June 15, 2014. After June 15, 2010 the exercise price of the Series M warrants reverted back to $2.00 per share. Any person exercising a Series M warrant after June 15, 2010 would not receive any Series F warrants. The Series M warrants expire on April 17, 2012. An analysis of the modification to the warrants determined that the modification increased the value of the warrants by $1,432,456. This cost was recorded as a debit and a credit to additional paid-in capital and was a deemed dividend. This cost is included in modification of warrants and increased the net loss available to shareholders on the condensed, consolidated statements of operations. There were no ex
ercises of the Series M warrants at the reduced price and the exercise price of the Series M warrants reverted back to $2.00 on June 16, 2010.
F-25
On August 3, 2010, the Company’s Board of Directors approved an amendment to the terms of the Series M warrants held by an investor. The investor was the owner of 8,800,000 warrants priced at $2.00 per share. The investor may now purchase 6,000,000 shares of the Company’s common stock (reduced from 8,800,000) at a price of $0.60 per share. An analysis of the modification to the warrants determined that the modification increased the value of the warrants by $100,000. The adjustment was recorded as a debit and a credit to additional paid-in capital. In addition, 1,221,668 Series M warrants at the original exercise price of $2.00 were outstanding as of September 30, 2011.
On February 1, 2011, 6,000,000 Series M warrants at a price of $0.60 per share, were extended for two years. This cost was recorded as a debit and a credit to additional paid-in capital and was a deemed dividend. This cost is included in modification of warrants and increased the net loss available to shareholders on the consolidated statements of operations. The additional value of $661,457 was calculated using the Black Scholes method using the following assumptions.
|
Original
Warrants
|
Extended
Warrants
|
||
|
Expected stock risk volatility
|
104.00%
|
97.40%
|
|
|
Risk-free interest rate
|
0.61%
|
1.04%
|
|
|
Expected life of warrant
|
1.51 Year
|
3.51 Years
|
As of September 30, 2011, all 6,000,000 of these Series M warrants remained outstanding.
3.
Licensing Agreement Warrants
On March 6, 2009, the Company entered into a licensing agreement with Byron Biopharma LLC (“Byron”) under which the Company granted Byron an exclusive license to market and distribute the Company’s cancer drug Multikine in the Republic of South Africa. Pursuant to the agreement Byron will be responsible for registering the product in South Africa. Once Multikine has been approved for sale, the Company will be responsible for manufacturing the product, while Byron will be responsible for sales in South Africa. Revenues will be divided equally between the Company and Byron. To maintain the license Byron, among other requirements, made a $125,000 payment to the Company on March 8, 2010. On March 30, 2009, and as further consideration for its rights under the licensing agreement, Byron purchased 3,750,000 Units from the Company at a price of $0.20 per Unit. Each Unit consisted of one share of the Company’s common stock and two warrants. Each warrant entitles the holder to purchase one share of the Company’s common stock at a price of $0.25 per share. The warrants expire on March 6, 2016. The Company filed a registration statement to register the shares issuable upon the exercise of the warrants. The Units were accounted for as an equity transaction using the Black Scholes method to value the warrants. The fair value of the warrants was calculated to be $1,015,771. During the year end September 30, 2011, 1,000,000 warrants were exercised for which the Company received $250,000. As of September 30, 2011, 6,500,000 of these warrants remained outstanding.
F-26
|
4.
|
Private Investor Warrants
|
Between May 2003 and April 2006 the Company issued 1,900,000 warrants as part of a financing to a private investor at an exercise price between $0.47 and $1.25. As of September 30, 2011, 1,200,000 warrants remain outstanding.
In January 2009, as part of an amended lease agreement on the manufacturing facility, the Company repriced 3,000,000 warrants issued to the lessor in July 2007 at $1.25 per share and which were to expire on July 12, 2013. These warrants were repriced at $0.75 per share and expire on January 26, 2014. The cost of this repricing and extension of the warrants was $70,515 and was accounted for as a debit to the deferred rent asset and a credit to additional paid-in capital. In addition, 787,500 additional warrants were given to the lessor of the manufacturing facility on the same date, exercisable at a price of $0.75 per share, and will expire on January 26, 2014. The cost of these warrants was $45,207 and was accounted for as a debit to the deferred rent asset and a credit to additional paid-in capital. As of September 30, 2011, 3,787,500 warrants remained outstanding.
Between March 31 and June 30, 2009, 2,296,875 new warrants were issued at $0.75 to the leaseholder on the manufacturing facility in consideration for the deferment of rent payments. The cost of these new warrants of $251,172 was recorded as a debit to research and development and a credit to additional paid in capital. As of September 30, 2011, 2,296,875 warrants remained outstanding.
Between July 2005 and May 2006 1,925,000 warrants were issued to a private investor. In July 2009, 375,000 warrants held by the investor were extended for two years. The additional value of the warrants of $24,061 was calculated using the Black Scholes method using the following assumptions. This cost was accounted for as a debit and a credit to additional paid in capital.
In February 2011, 1,325,000 warrants issued to the investor with an exercise price between $0.56 and $0.82 were extended for three years. The additional value of $406,912 was calculated using the Black Scholes method using the following assumptions. This cost was accounted for as a debit and a credit to additional paid in capital.
|
Original
Warrants
|
Extended
Warrants
|
||
| Expected stock risk volatility |
104.0%
|
97.8-103.7%
|
|
|
Risk-free interest rate
|
0.15%
|
1.04%
|
|
|
Expected life of warrant
|
0.02-0.50 Year
|
3.02-3.50 Years
|
As of September 30, 2011, 1,325,000 warrants remained outstanding.
F-27
|
5.
|
Warrants held by Officer and Director
|
Between December 2008 and June 2009, Maximilian de Clara, the Company’s President and a director, loaned the Company $1,104,057. In June 2009, the Company issued 1,648,244 warrants exercisable at $0.40 per share to the holder of a note from the Company. The warrants are exercisable at any time prior to December 24, 2014. These warrants were valued at $65,796 using the Black Scholes method. In July 2009, as consideration for a further extension of the loan, the Company issued 1,849,295 warrants exercisable at $0.50 per share to the holder of the note that was amended for the second time. These warrants were valued at $341,454 using the Black Scholes method and can be exercised at any time prior to January 6, 2015. The first warrants were recorded as a discount to the loan and a credit to additional paid-in capital. The second warrants were recorded as a debit to derivative loss of $831,230, a premium of $341,454 on the loan and a credit to additional paid in capital of $489,776. The first warrants were amortized as interest expense at the time of the second amendment. On the second amendment, $338,172 of the premium was amortized as a reduction to interest expense as of September 30, 2009. The balance of the premium of $3,282 was amortized as a reduction to interest expense in October 2009. As of September 30, 2011, 3,497,539 warrants remained outstanding. See Note 8 for additional information.
|
6.
|
Options held by Consultants
|
As of September 30, 2011, 837,500 options that were issued to consultants as payment for services provided between May 2003 and July 2009 remained outstanding, of which 742,500 options were issued from the Non-Qualified Stock Option plans.
Between May 2009 and July 2009, 442,500 options were issued with exercise prices between $0.28 and $0.60 per share to three consultants, for past services, at a cost of $74,461 using the Black Scholes method. The options were accounted for as a debit to general and administrative expense and a credit to additional paid in capital. Also in July 2009, the Company issued 200,000 options to a consultant with an exercise price of $0.38 per share. The cost of these options, $43,702, was accounted for as a debit to research and development and a credit to additional paid in capital.
In August 2010, 70,000 options issued to a consultant with an exercise price between $0.63 and $0.70 were extended for two years at a cost of $15,477. This cost was accounted for as a credit to additional paid in capital and a debit to general and administrative expense.
In October 2010, 80,000 options issued to a consultant with an exercise price of $2.00 were extended for five years from the current expiration date. The additional value of $30,186 was accounted for as a credit to additional paid in capital and a debit to general and administrative expense.
F-28
3. OPERATIONS AND FINANCING
The Company has incurred significant costs since its inception in connection with the acquisition of certain patented and unpatented proprietary technology and know-how relating to the human immunological defense system, patent applications, research and development, administrative costs, construction of laboratory facilities, and clinical trials. The Company has funded such costs with proceeds from the public and private sale of its common and preferred stock. The Company will be required to raise additional capital or find additional long-term financing in order to continue with its research efforts. To date, the Company has not generated any revenue from product sales. The ability of the Company to complete the necessary clinical trials and obtain Federal Drug Administration (FDA) approval for the sale of products to be developed on a commercial basis is uncertain. Ultimately, the Company must complete the development of its products, obtain the appropriate regulatory approvals and obtain sufficient revenues to support its cost structure.
The Company is currently running a large multi-national Phase III clinical trial for head and neck cancer. The Company plans to raise additional capital in the form of corporate partnerships, debt and/or equity financings in fiscal year 2012 to 1) expand the Phase III clinical trial and 2) continue operations through December 2012 at its current rate. The Company believes that it will be able to obtain additional financing since Multikine is a Phase III product designed to treat cancer. In addition the Company’s management has engaged in fundraising for over 20 years. However, there can be no assurance that the Company will be successful in raising additional funds or that funds will be available to the Company on acceptable terms or at all. If the Company does not raise the necessary amounts of money, the Company will either have to slow down or delay the Phase III clinical trial or even significantly curtail its operations until such time as it is able to raise the required funding. The Company’s expenditures for fiscal year 2011 included several non-recurring items that amounted to approximately $10 million dollars, mostly related to the lawsuit and the settlement of the lawsuit (see Note 11). These expenses, with the exception of the settlement payments through March 1, 2012, will not recur in fiscal year 2012, thereby reducing the Company’s expenditures. The consolidated financial statements have been prepared assuming that the Company will continue as a going concern, but due to recurring losses from operations and future liquidity needs, there is substantial doubt about the Company’s ability to continue as a going concern. The consolidated financial statements do not include any adjustments that might result from the outcome of this uncertainty.
In addition, the Company has two partners who have agreed to participate in and pay for part of the Phase III clinical trial for Multikine. Since the Company was able to raise substantial capital during 2009, the Company launched and is currently conducting the Phase III trial for Multikine. The total net cost of the clinical trial is estimated to be approximately $26 million.
F-29
4. RESEARCH AND OFFICE EQUIPMENT
Research and office equipment at September 30, 2011 and 2010, consists of the following:
| 2011 | 2010 | |||||||
|
Research equipment
|
$ | 3,823,816 | $ | 3,647,684 | ||||
|
Furniture and equipment
|
116,173 | 116,996 | ||||||
|
Leasehold improvements
|
126,910 | 126,910 | ||||||
| 4,066,899 | 3,891,590 | |||||||
|
Less: Accumulated depreciation and amortization
|
(3,034,018 | ) | (2,626,759 | ) | ||||
|
Net research and office equipment
|
$ | 1,032,881 | $ | 1,264,831 |
5. INCOME TAXES
At September 30, 2011, the Company had a federal net operating loss carryforward of approximately $138 million expiring from 2012 through 2031. In addition, the Company has a general business credit as a result of the credit for increasing research activities of approximately $2,341,000 at September 30, 2011 and 2010. These tax credits begin expiring after twenty years from the year in which the credit was generated. The components of the deferred taxes at September 30, 2011 and 2010 are comprised of the following:
| 2011 | 2010 | |||||||
|
Net operating loss
|
$ | 51,381,945 | $ | 45,940,445 | ||||
|
|
||||||||
|
R&D credit
|
2,340,614 | 2,340,614 | ||||||
|
Stock-based compensation
|
1,597,790 | 1,243,647 | ||||||
|
Vacation and other
|
190,522 | 83,593 | ||||||
|
Deferred rent
|
991,091 | 970,224 | ||||||
|
Litigation liability
|
1,842,297 | - | ||||||
|
Total deferred tax assets
|
58,344,259 | 50,578,523 | ||||||
|
Derivative gain
|
(3,639,050 | ) | (2,133,259 | ) | ||||
|
Depreciation
|
(76,841 | ) | (80,026 | ) | ||||
|
Total deferred tax liabilities
|
(3,715,891 | ) | (2,213,285 | ) | ||||
|
Valuation allowance
|
(54,628,368 | ) | (48,365,238 | ) | ||||
|
Net deferred tax asset
|
$ | - | $ | - |
In assessing the realization of the deferred tax assets, management considered whether it was more likely than not that some portion or all of the deferred tax asset will be realized. The ultimate realization of the deferred tax assets is dependent upon the generation of future taxable income. Management has considered the history of the Company's operating losses and believes that the realization of the benefit of the deferred tax assets cannot be reasonably assured. In addition, under the Internal Revenue Code Section 382, the Company's ability to utilize these net operating loss carryforwards may be limited or eliminated in the event of a change in ownership in the future. Internal Revenue Code Section 382 generally defines a change in ownership as the situation where there has been a more than 50 percent change in ownership within the last three years.
F-30
The Company’s effective tax rate is different from the applicable federal statutory tax rate. The reconciliation of these rates for the three years ended September 30, 2011 is as follows:
| 2011 | 2010 | 2009 | ||||||||||
|
Federal Rate
|
34.00 | % | 34.0 | % | 34.0 | % | ||||||
|
State tax rate, net of federal benefit
|
3.22 | % | 5.91 | % | 3.96 | % | ||||||
| State tax rate change | 12.06 | % | 0 | % | 0 | % | ||||||
|
R&D credit
|
0 | % | 0 | % | 2.01 | % | ||||||
|
R&D credit true-up
|
0 | % | 0 | % | (0.40 | %) | ||||||
|
Other adjustments
|
(0.04 | %) | 0 | % | 0 | % | ||||||
| Nondeductible expenses | (0.48 | %) | 0.02 | % | (0 | %) | ||||||
| Valuation allowance | (24.64 | %) | (39.93 | %) | (39.57 | %) | ||||||
|
Effective tax rate
|
0.00 | % | 0.00 | % | 0.00 | % |
The Company adopted the provisions of Codification 740-10,
“Accounting for Uncertainty in Income Taxes”
on October 1, 2007 which requires financial statement benefits be recognized for positions taken for tax return purposes, when it is more likely than not that the position will be sustained. The Company has concluded that it has properly filed its tax returns and does not believe that any of the positions it has taken would result in a disallowance of any of these tax positions. Therefore, the Company has concluded that adoption of ASC 740-10 had no impact on its financial positions. No interest or penalties have been accrued as a result of adoption of this requirement. In the United States, the Company’s tax returns are open to examination from 2007 forward.
6. EMPLOYEE BENEFIT PLAN
The Company maintains a defined contribution retirement plan, qualifying under Section 401(k) of the Internal Revenue Code, subject to the Employee Retirement Income Security Act of 1974, as amended, and covering substantially all Company employees. Each participant's contribution is matched by the Company with shares of common stock that have a value equal to 100% of the participant's contribution, not to exceed the lesser of $10,000 or 6% of the participant's total compensation. The Company's contribution of common stock is valued each quarter based upon the closing bid price of the Company's common stock. The expense for the years ended September 30, 2011, 2010, and 2009, in connection with this Plan was $154,100, $123,500, and $61,517, respectively.
F-31
7. COMMITMENTS AND CONTINGENCIES
Operating Leases
-The future minimum annual rental payments due under non-cancelable operating leases for office and laboratory space are as follows:
Year Ending September 30,
|
2012
|
$ | 1,896,205 | ||
|
2013
|
1,855,890 | |||
|
2014
|
1,579,931 | |||
|
2015
|
1,572,839 | |||
|
2016
|
1,629,121 | |||
|
2017 and thereafter
|
24,812,823 | |||
|
Total minimum lease payments:
|
$ | 33,346,809 |
Rent expense, including amortization of deferred rent, for the years ended September 30, 2011, 2010, and 2009, was $2,667,296, $3,308,102, and $2,759,332, respectively. The Company’s three leases expire between June 2012 and August 2028.
In August 2007 the Company leased a building near Baltimore, Maryland. The building was be remodeled in accordance with the Company’s specifications so that it can be used by the Company to manufacture Multikine for the Company’s Phase III clinical trial and sales of the drug if approved by the FDA. The Company took possession of the building in October 2008.
The lease is for a term of twenty years and required annual base rent payments of $1,575,000 during the first year of the lease. The annual base rent escalates each year at 3%. The Company is also required to pay all real and personal property taxes, insurance premiums, maintenance expenses, repair costs and utilities. The lease allows the Company, at its election, to extend the lease for two ten-year periods or to purchase the building at the end of the 20-year lease. The lease required the Company to pay $3,150,000 towards the remodeling costs, which will be recouped by reductions in the annual base rent of $303,228 in years six through twenty of the lease, subject to the Company maintaining compliance with the lease covenants. Included on the consolidated balance sheet is an asset of $7,189,840 shown as deferred rent. $6,486,566 of this asset is long term and the balance of $703,274 is in current assets. In August 2011, the Company was required to deposit the equivalent of one year of base rent in accordance with the contract. The $1,670,917 is included in non-current assets on September 30, 2011 and was required to be deposited when the amount of cash the Company had dropped below the amount stipulated in the lease. The Company will recover the deposit once it has the required cash for two consecutive quarters.
F-32
Employment Contracts
-- On August 30, 2010, Mr. de Clara’s employment agreement, as amended on September 8, 2006, was extended to August 30, 2013.
The employment agreement provides that the Company will pay Mr. de Clara an annual salary of $363,000 during the term of the agreement. In the event that there is a material reduction in his authority, duties or activities, or in the event there is a change in the control of the Company, then the agreement allows him to resign from his position at the Company and receive a lump-sum payment from the Company equal to 18 months salary. For purposes of the employment agreement, a
change in the control of the Company means the sale of more than 50% of the outstanding shares of the Company’s Common Stock, or a change in a majority of the Company’s directors.
On September 1, 2011 the Company agreed to extend its employment agreement with Geert R. Kersten, the Company's Chief Executive Officer, to August 31, 2016. During the term of the employment agreement the Company will pay Mr. Kersten an annual salary of $464,004. Mr. Kersten will receive at least the same salary increases each year as do other senior executives of the Company. Increases beyond those, if any, will be made at the sole discretion of the Company's directors.
During the employment term, Mr. Kersten will be entitled to receive any other benefits which are provided to the Company's executive officers or other fulltime employees in accordance with the Company's policies and practices and subject to Mr. Kersten's satisfaction of any applicable condition of eligibility.
If Mr. Kersten resigns within ninety (90) days of the occurrence of any of the following events: (i) a relocation (or demand for relocation) of Mr. Kersten's place of employment to a location more than thirty-five (35) miles from his current place of employment, (ii) a significant and material reduction in Mr. Kersten's authority, job duties or level of responsibility or (iii) the imposition of significant and material limitations on the Mr. Kersten's autonomy in his position, the employment agreement will be terminated.
The employment agreement will also terminate upon the death of Mr. Kersten, Mr. Kersten's physical or mental disability, willful misconduct, an act of fraud against the Company, or a breach of the employment agreement by Mr. Kersten.
If the employment agreement is terminated for any of the foregoing, Mr. Kersten, or his legal representatives, as the case may be, will be paid the salary provided by the employment agreement through the date of termination, any options or bonus shares of the Company then held by Mr. Kersten will become fully vested and the expiration date of any options which would expire during the four year period following his termination of employment will be extended to the date which is four years after his termination of employment.
F-33
In the event there is a change in the control of the Company, the agreement allows Mr. Kersten to resign from his position at the Company and receive a lump-sum payment from the Company equal to 24 months salary, based upon his salary then in effect on the date of his resignation. For purposes of the employment agreement a change in the control of the Company means: (1) the merger of the Company with another entity if after such merger the shareholders of the Company do not own at least 50% of voting capital stock of the surviving corporation; (2) the sale of substantially all of the assets of the Company; (3) the acquisition by any person of more than 50% of the Company’s common stock; or (4) a change in a majority of the Company's directors which has not been approved by the incumbent directors.
On August 30, 2010, the Company entered into a three-year employment agreement with Patricia B. Prichep, the Company’s Senior Vice President of Operations. The employment agreement with Ms. Prichep provides that during the term of the agreement the Company will pay Ms. Prichep an annual salary of $194,298 plus any increases approved by the Board of Directors during the period of the employment agreement.
On August 30, 2010, the Company also entered into a three-year employment agreement with Eyal Talor, Ph.D., the Company’s Chief Scientific Officer. The employment agreement with Dr. Talor provides that during the term of the agreement the Company will pay Dr. Talor an annual salary of $239,868 plus any increases approved by the Board of Directors during the period of the employment agreement.
F-34
In the event there is a change in the control of the Company, the employment agreements with Ms. Prichep and Dr. Talor allow Ms. Prichep and/or Dr. Talor (as the case may be) to resign from her or his position at the Company and receive a lump-sum payment from the Company equal to 18 months salary. For purposes of the employment agreements, a change in the control of the Company means: (1) the merger of the Company with another entity if after such merger the shareholders of the Company do not own at least 50% of voting capital stock of the surviving corporation; (2) the sale of substantially all of the assets of the Company; (3) the acquisition by any person of more than 50% of the Company’s common stock; or (4) a change in a majority of the Company’s directors which has not been approved by the incumbent directors.
The employment agreements with Ms. Prichep and Dr. Talor will also terminate upon the death of the employee, the employee’s physical or mental disability, willful misconduct, an act of fraud against the Company, or a breach of the employment agreement by the employee. If the employment agreement is terminated for any of these reasons the employee, or her or his legal representatives, as the case may be, will be paid the salary provided by the employment agreement through the date of termination.
The Company has an additional contract with a consultant for a nine month period ending in fiscal year 2011. This contract totals approximately $45,000. Further, the Company has contingent obligations with other vendors for work that will be completed in relation to the Phase III trial. The timing of these obligations cannot be determined at this time. The amount of these obligations for the Phase III trial are approximately $26 million.
8
.
LOANS FROM OFFICER AND INVESTOR
Between December 2008 and June 2009, Maximilian de Clara, the Company’s President and a director, loaned the Company $1,104,057. The loan was initially payable at the end of March 2009, but was extended to the end of June 2009. At the time the loan was due, and in accordance with the loan agreement, the Company issued Mr. de Clara warrants which entitle Mr. de Clara to purchase 1,648,244 shares of the Company’s common stock at a price of $0.40 per share. The warrant is exercisable at any time prior to December 24, 2014. Pursuant to Codification paragraph 470-50-40-17, the fair value of the warrants issuable under the first amendment was recorded as a discount on the note payable with a credit recorded to additional paid-in capital. The discount was amortized from April 30, 2009 through June 27, 2009. Although the loan was to be repaid from the proceeds of the Company’s then recent financing, the Company’s Directors deemed it beneficial not to repay the loan and negotiated a second extension of the loan with Mr. de Clara on terms similar to the June 2009 financing. Pursuant to the terms of the second extension the note is now due on July 6, 2014, but, at Mr. de Clara’s option, the loan can be converted into shares of the Company’s common stock. The number of shares which will be issued upon any conversion will be determined by dividing the amount to be converted by $0.40. As further consideration for the second extension, Mr. de Clara received warrants which allow Mr. de Clara to purchase 1,849,295 shares of the Company’s common stock at a price of $0.50 per share at any time prior to January 6, 2015. On May 13, 2011, to recognize Mr. de Clara’s willingness to agree to subordinate his note to the convertible preferred shares and convertible debt as part of the settlement agreement, the Company extended the maturity date of the note to July 6, 2015. The loan from Mr. de Clara bears interest at 15% per year and is secured by a second lien on substantially all of the Company’s assets. Mr. de Clara may request repayment in full or in part at any time on 10 day notice. The Company does not have the right to prepay the loan without Mr. de Clara’s consent.
F-35
In accordance with Codification Subtopic 470-50, the second amendment to the loan was accounted for as an extinguishment of the first amendment debt. The extinguishment of the loan requires that the new loan be recorded at fair value and a gain or loss must be recognized. This resulted in a premium of $341,454, which was amortized over the period from July 6, 2009, the date of the second amendment, to October 1, 2009, the date at which the loan holder may demand payment of the loan. In October 2009, the balance of the remaining premium of $3,282 was amortized to interest expense. Amortization of the premium was $338,172 for the year ended September 30, 2009.
In early September 2009, the Company received a short term loan of $2,000,000, with associated costs of $73,880, from two investors. The Company repaid the loan at the end of September 2009, along with $200,000 in interest. In addition, the Company issued 500,000 warrants at $0.68 at a cost of $245,000 in connection with the loan. This cost was recorded as a debit to discount on note payable and a credit to derivative liabilities. When the loan was repaid, this discount was written off as interest expense. On September 30, 2010, the fair value of the warrants was $220,000. On September 30, 2011, the fair value of the warrants was $90,000, and all of the warrants remained outstanding.
9. STOCKHOLDERS' EQUITY
During the year ended September 30, 2009, the Company issued 3,316,438 shares of common stock in payment of invoices totaling $1,561,343. Common stock was also issued to pay interest and principal on the convertible debt. See Note 2. In addition, the balance of the shares issued to the Company’s President in September 2008 were expensed at a cost of $200,000. An additional 1,030,928 shares were issued to the President in March 2009 at a cost of $200,000. An additional 12,672 shares were issued to an employee for expenses. The shares were expensed at a cost of $3,168.
In November 2008, the Company extended its licensing agreement for Multikine with Orient Europharma. The new agreement extends the Multikine collaboration to also cover South Korea, the Philippines, Australia and New Zealand. The licensing agreement initially focuses on the areas of head and neck cancer, nasopharyngeal cancer and potentially cervical cancer. The agreement expires 15 years after the commencement date which is defined as the date of the first commercial sale of Multikine in any country within the territory. In connection with the agreement, Orient Europharma purchased 1,282,051 shares of common stock at a cost of $0.39 per share, for a total to the Company, after expenses, of $499,982.
On December 30, 2008, the Company entered into an Equity Line of Credit agreement as a source of funding for the Company. For a two-year period, the agreement allows the Company, at its discretion, to sell up to $5 million of the Company’s common stock at the volume weighted average price of the day minus 9%. The Company may request a drawdown once every ten trading days, although the Company is under no obligation to request any draw-downs under the equity line of credit. The equity line of credit expired on January 6, 2011 and no draw-downs were made.
F-36
On March 6, 2009,
the Company entered into a licensing agreement with Byron Biopharma LLC (“Byron”) under which the Company granted Byron an exclusive license to market and distribute the Company’s cancer drug Multikine in the Republic of South Africa. The Company has existing licensing agreements for Multikine with Teva Pharmaceuticals and Orient Europharma. Pursuant to the agreement, Byron will be responsible for registering the product in South Africa. Once Multikine has been approved for sale, the Company will be responsible for manufacturing the product, while Byron will be responsible for sales in South Africa. Revenues will be divided equally between the Company and Byron. To maintain the license Byron, among other requirements, must make milestone payments to the Company totaling $125,000 on or before March 15, 2010. This payment was received in March 2010. On March 30, 2009, and as further consideration for its rights under the licensing agreement, Byron purchased 3,750,000 Units from the Company at a price of $0.20 per Unit. Each Unit consisted of one share of the Company’s common stock and two warrants. Each warrant entitles the holder to purchase one share of the Company’s common stock at a price of $0.25 per share. The warrants are exercisable at any time prior to March 6, 2016. The shares of common stock included as a component of the Units were registered by the Company under the Securities Act of 1933. The Units were accounted for as an equity transaction using the Black Scholes method to value the warrants. The fair value of the warrants was calculated to be $1,015,771 and was recorded as both a debit and a credit to additional paid-in capital. No warrants were exercised during the year ended September 30, 2010. During the year ended September 30, 2011, 1,000,000 warrants were exercised. The Company received $250,000 from the exercise of these warrants. As of September 30, 2011, 6,500,000 warrants remain outstanding.
In late June and early July of 2009, the Company raised $6,139,739, less associated costs of $296,576 from the sale of 15,349,346 shares of common stock, at a price of $0.40 per share, to private investors. The Company also issued 10,284,060 warrants, exercisable at $0.50 per share to the investors at a fair value of $2,775,021. At September 30, 2009, the fair value of the warrants was $15,223,759. During the year ended September 30, 2010 and 2011, 8,813,088 and -0- warrants were exercised, respectively. As of September 30, 2011, the fair value of the 1,470,972 remaining warrants was $294,194 and was shown on the Company’s balance sheet as a derivative liability.
As a result of the June 2009 financing, the conversion price of the Series K notes and the exercise price of the Series K warrants were reduced to $0.40 per share since the shares sold by the Company were below the conversion price of the notes and the exercise price of the warrants. Also in conjunction with the June 2009 financing, the exercise price of warrants issued in a prior financing was reset to $0.40 per share, resulting in the issuance of an additional 1,166,667 shares of common stock. The issuance of these shares was accounted for as a dividend of $466,667 for the year ended September 30, 2009.
F-37
On July 27, 2009, 215,000 shares were issued to employees at $0.39. These shares will vest at specified milestones; 20% of them had vested by September 30, 2009. During the year ended September 30, 2009, $16,770 of the cost was expensed. The remaining 80% of the shares vested during the year ended September 30, 2010, and $67,080 was expensed. In addition, on August 5, 2009, 65,785 shares were issued at $0.38 to the Board of Directors. The cost of $24,998 was expensed during the year ended September 30, 2009.
In late August of 2009, the Company raised $4,852,995, net of associated costs of $248,037 through the sale of 10,784,435 shares at $0.45 per share to private investors. The Company also issued 5,392,217 Series C warrants at $0.55 per share to the investors at a fair value of $1,704,340. As of September 30, 2009, the fair value of these warrants was $8,088,328. On September 30, 2010, these warrants were shown as a derivative liability of $2,480,420. No Series C warrants were exercised during the year ended September 30, 2010. During the year ended September 30, 2011, 757,331 Series C warrants were exercised. The Company received $416,532 from the exercise of these warrants. As of September 30, 2011, 4,634,886 of the Series C warrants remained outstanding. As of September 30, 2011, the fair value of the remaining warrants was $926,977 and is shown on the Company’s balance sheet as a derivative liability.
In September of 2009, the Company raised an additional $20,000,000, net of associated costs of $1,423,743 through the sale of 14,285,715 shares at $1.40 per share to private investors. The Company also issued 4,714,284 Series D warrants, exercisable at $1.50 per share to the investors at a fair value of $3,488,570. The Company also issued 714,286 Series E warrants, exercisable at $1.75 per share to the placement agent at a fair value of $642,857. As of September 30, 2009, the fair value of these warrants was $5,694,285. As of September 30, 2010, the fair value of these warrants is shown as a derivative liability of $660,000. No Series D and E warrants were exercised during the year ended September 30, 2010. On September 21, 2011, all 4,714,284 Series D warrants expired. As of September 30, 2011, all of the Series E warrants remained outstanding, with a fair value of $64,286 which is shown on the Company’s balance sheet as a derivative liability.
During the year ended September 30, 2010, warrants and options were exercised resulting in the issuance of 2,011,174 shares of common stock at prices ranging from $0.56 to $0.75. The Company received a total of $1,413,307 from the exercise of these warrants and options. During the year ended September 30, 2011, options were exercised resulting in the issuance of 29,268 shares of common stock at prices ranging from $0.22 to $0.48. The Company received a total of $13,056 from the exercise of these options.
During the year ended September 30, 2010, 465,158 shares of common stock were issued in payment of invoices totaling $1,241,026. During the year ended September 30, 2011, 348,280 shares of common stock were issued in payment of invoices totaling $214,123.
On March 12, 2010, the Company temporarily reduced the exercise price of the Series M warrants, originally issued on April 18, 2007. The exercise price was reduced from $2.00 to $0.75. At any time prior to June 16, 2010, investors could have exercised the Series M warrants at a price of $0.75 per share. For every two Series M warrants exercised prior to June 16, 2010, the investor would have received one Series F warrant. Each Series F warrant would have allowed the holder to purchase one share of the Company’s common stock at a price of $2.50 per share at any time on or before June 15, 2014. After June 15, 2010 the exercise price of the Series M warrants reverted back to the $2.00 per share. Any person exercising a Series M warrant after June 15, 2010 would not receive any Series F warrants. The Series M warrants expire on April 17, 2012. An analysis of the modification to the warrants determined that the modification increased the value of the warrants by $1,432,456. The adjustment was recorded as a debit and a credit to additional paid-in capital. There were no exercises of the Series M warrants at the reduced price and the exercise price of the Series M warrants reverted back to $2.00 on June 16, 2010.
F-38
On August 3, 2010, the Company’s Board of Directors approved an amendment to the terms of the Series M warrants held by an investor. The investor is the owner of 8,800,000 warrants priced at $2.00 per share. The investor may now purchase 6,000,000 shares of the Company’s common stock (reduced from 8,800,000) at a price of $0.60 per share. In approving the amendment, the Company’s Directors determined that reducing the number of outstanding warrants would be beneficial. An analysis of the modification to the warrants determined that the modification increased the value of the warrants by $100,000. The adjustment was recorded as a debit and a credit to additional paid-in capital. As of September 30, 2011, all of these warrants remained outstanding.
On December 10, 2010, the Company entered into a sales agreement with McNicoll Lewis & Vlak LLC (MLV) relating to shares of common stock which have been registered by means of a shelf registration statement filed in July 2009. The Company may offer and sell shares of its common stock, having an aggregate offering price of up to $30 million from time to time through MLV acting as agent and/or principal. During the fiscal year ended September 30, 2011, the Company sold 7,424,982 shares of common stock for a gross amount of $4,144,712, and the Company received a net amount after commissions and fees of $3,936,284.
Sales of the Company’s common stock, if any, may be made in negotiated transactions at market prices prevailing at the time of sale or at prices related to such prevailing market prices, and/or any other method permitted by law. The Company is not required to sell any shares to McNicoll Lewis & Vlak and McNicoll Lewis & Vlak is not required to sell any shares on the Company’s behalf or purchase any of the Company’s shares for its own account.
McNicoll Lewis & Vlak will be entitled to a commission in an amount equal to the greater of 3% of the gross proceeds from each sale of the shares, or $0.025 for each share sold, provided, that, in no event will McNicoll Lewis & Vlak receive a commission greater than 8.0% of the gross proceeds from the sale of the shares. The agreement was terminated in December 2011.
10. FAIR VALUE MEASUREMENTS
Effective October 1, 2008, the Company adopted the provisions of Codification 820-10, “
Fair Value Measurements
,” which defines fair value, establishes a framework for measuring fair value, and expands disclosures about such measurements that are permitted or required under other accounting pronouncements. While topic 820-10 may change the method of calculating fair value, it does not require any new fair value measurements. The adoption of Codification 820-10 did not have a material impact on the Company’s results of operations, financial position or cash flows.
In accordance with the topic, the Company determines fair value as the price that would be received to sell an asset or paid to transfer a liability in an orderly transaction between market participants at the measurement date. The Company generally applies the income approach to determine fair value. This method uses valuation techniques to convert future amounts to a single present amount. The measurement is based on the value indicated by current market expectations about those future amounts.
F-39
Codification 820-10 establishes a fair value hierarchy that prioritizes the inputs used to measure fair value. The hierarchy gives the highest priority to active markets for identical assets and liabilities (Level 1 measurement) and the lowest priority to unobservable inputs (Level 3 measurement). The Company classifies fair value balances based on the observability of those inputs. The three levels of the fair value hierarchy are as follows:
|
o
|
Level 1 – Observable inputs such as quoted prices in active markets for identical assets or liabilities
|
|
o
|
Level 2 – Inputs other than quoted prices that are observable for the asset or liability, either directly or indirectly. These include quoted prices for similar assets or liabilities in active markets, quoted prices for identical or similar assets or liabilities in markets that are not active and amounts derived from valuation models where all significant inputs are observable in active markets
|
|
o
|
Level 3 – Unobservable inputs that reflect management’s assumptions
|
For disclosure purposes, assets and liabilities are classified in their entirety in the fair value hierarchy level based on the lowest level of input that is significant to the overall fair value measurement. The Company’s assessment of the significance of a particular input to the fair value measurement requires judgment and may affect the placement within the fair value hierarchy levels.
The table below sets forth the assets and liabilities measured at fair value on a recurring basis, by input level, in the condensed consolidated balance sheet at September 30, 2011:
|
Quoted Prices in
Active Markets for
Identical Assets or
Liabilities (Level 1
)
|
Significant
Other
Observable
Inputs (Level 2)
|
Significant
Unobservable
Inputs (Level 3)
|
Total | |||||||||||||
| Derivative Instruments | $ | - | $ | - | $ | 7,261,073 | $ | 7,261,073 | ||||||||
The table below sets forth the assets and liabilities measured at fair value on a recurring basis, by input level, in the condensed consolidated balance sheet at September 30, 2010:
|
Quoted Prices in
Active Markets for
Identical Assets or
Liabilities (Level 1
)
|
Significant
Other
Observable
Inputs (Level 2)
|
Significant
Unobservable
Inputs (Level 3)
|
Total | |||||||||||||
| Derivative Instruments | $ | - | $ | - | $ | 6,946,051 | $ | 6,946,051 | ||||||||
F-40
The following sets forth the reconciliation of beginning and ending balances related to fair value measurements using significant unobservable inputs (Level 3), as of September 30, 2011 and 2010:
|
2011
|
2010
|
|||||||
|
Beginning balance
|
$ | 6,946,051 | $ | 35,113,970 | ||||
|
Issuances
|
9,000,000 | 6,186,343 | ||||||
|
Settlements
|
(4,252,830 | ) | (5,510,490 | ) | ||||
| Realized and unrealized gains recorded in Earnings | ( 4,432,148 | ) | (28,843,772 | ) | ||||
|
Ending balance
|
$ | 7,261,073 | $ | 6,946,051 | ||||
The fair values of the Company’s derivative instruments disclosed above are primarily derived from valuation models where significant inputs such as historical price and volatility of the Company’s stock as well as U.S. Treasury Bill rates are observable in active markets.
11. SETTLEMENT OF LEGAL MATTERS
On May 16, 2011, the Company entered into Settlement Agreement with thirteen hedge funds (the "plaintiffs") to settle all claims arising from a lawsuit initiated by the plaintiffs in October 2009 in the United States District Court for the Southern District of New York (the "Court"). As previously disclosed by the Company in its public filings, in August 2006 the plaintiffs (or their predecessors) purchased from the Company Series K notes convertible into the Company’s common stock and Series K warrants to purchase the Company’s common stock under financing agreements which provided the Series K notes and warrants with anti-dilution protection if the Company sold additional shares of common stock, or securities convertible into common stock, at a price below the then applicable conversion price of the notes or the exercise price of the warrants. In their lawsuit, the plaintiffs alleged that a March 2009 drug marketing and distribution agreement in which the Company sold units of common stock and warrants to an unrelated third party triggered these anti-dilution provisions, and that the Company failed to give effect to these provisions. The plaintiffs sought $30 million in actual damages, $90 million in punitive damages, the issuance of additional shares of common stock and warrants, and a reduction in the conversion price of the Series K notes and the exercise price of the Series K warrants. The Company denied the plaintiffs' allegations in the lawsuit and asserted that the 2009 agreement was a strategic transaction which did not trigger the anti-dilution provisions of the 2006 financing agreements.
F-41
Although the Company has vigorously defended the lawsuit and believed the plaintiffs' claims were without merit, the Company believed that a settlement of this lawsuit was in the best interests of the shareholders. The settlement was entered into to avoid the substantial costs of further litigation and the risk and uncertainty that litigation entails. By ending this dispute, and ending the significant demands on the time and attention of the Company's management necessary to respond to the litigation, the Company is better able to focus on executing its ongoing Phase III clinical trial with Multikine.
Under the terms of the Settlement Agreement and its related agreements, the plaintiffs and the Company terminated the pending litigation and released each other from all claims each may have had against the other, with certain customary exceptions. The Company agreed to make a $3 million cash payment and issue $9 million of securities to the plaintiffs. These securities consist of senior secured convertible promissory notes with an aggregate principal amount of $4.95 million and 4,050 shares of redeemable Series A Convertible Preferred Stock with an aggregate stated value of $4.05 million. The $3 million cash payment was made at the closing under the Settlement Agreement. The $9 million of securities will be redeemed through nine equal monthly installment payments of approximately $1 million each, plus interest on the notes and dividends on the shares (accounted for as interest) at the rate of 8% per annum, with payments beginning on June 17, 2011 (the month of October 2011 requires no payment) and ending on March 1, 2012. As these installments of the principal amount of the notes and the stated value of the preferred shares are paid down, or as the notes or the preferred shares are converted by the holders into common stock, the initial $9 million due (plus interest and dividends) will be proportionately reduced until the notes are fully paid or converted and the preferred shares are fully redeemed or converted. The Company has pledged all of its assets as collateral for the repayment of these obligations. While the notes and preferred shares are outstanding, the Company is generally prohibited from paying dividends, incurring new debt or making any payments (other than interest) on existing debt, and is subject to certain restrictions on the transfer of its assets. The $12 million was accrued for and included in the Company’s March 31, 2011 consolidated financial statements. Refer to Note 1 for the accounting of the note and preferred shares. For the fiscal year ended September 30, 2011, $115,500 of interest was accrued on the Convertible Notes. During the fiscal year ended September 30, 2011, $30,371 was paid on the preferred shares, and this amount is included in interest expense in the financial statements.
F-42
The notes and the Series A preferred shares could have been convertible, at the option of the holder, into the Company’s common stock at a fixed price of $0.67 per share. The conversion price represented the most recent consolidated closing sale price of the common stock on the NYSE AMEX at the time the settlement agreement was signed by the parties. The plaintiffs agreed to restrictions on their ability to effect short sales of the common stock based on the number of warrants and common shares they hold, but excluding shares issuable upon the conversion of the notes and preferred shares. The plaintiffs have further agreed to permit an independent accounting firm to review their trading records every three months to confirm their compliance with these restrictions.
The parties' respective obligations under the Settlement Agreement, including the Company's obligation to pay cash and issue notes and preferred shares to the plaintiffs, were subject to obtaining the approval by the Court of an order exempting the issuance to the plaintiffs of the notes and preferred shares from registration under Section 3(a)(10) of the Securities Act of 1933. This was to permit the notes and preferred shares, and the shares of common stock issuable upon conversion thereof, to be freely tradable.
On June 17, 2011 the final settlement agreement was signed. During the fiscal year ended September 30, 2011, the $3,000,000 cash payment required by the settlement was made. In addition, all preferred shares were redeemed for a total payment of $4,050,000. In addition, $30,371 were paid to the preferred shareholders and this amount is included in interest expense in the financial statements.
As a condition of the settlement agreement, all claims against the Company were dismissed. As a result, the $81,395 overpayment by one of the claimants was dismissed and the liability was written off during the fiscal year ended September 30, 2011.
The foregoing summary of the terms of the settlement is qualified in its entirety by the detailed terms of the Settlement Agreement and the related agreements and documents which are filed as exhibits to the Company’s report on Form 10-Q for the three months ended March 31, 2011.
F-43
12. NET INCOME (LOSS) PER COMMON SHARE
Basic earnings per share (EPS) excludes dilution and is computed by dividing net income by the weighted average of common shares outstanding for the period. Diluted EPS reflects the potential dilution that could occur if securities or other common stock equivalents (convertible preferred stock, convertible debt, warrants to purchase common stock and common stock options) were exercised or converted into common stock. The following table provides a reconciliation of the numerators and denominators of the basic and diluted per-share computations:
|
Net income (loss) – available to
|
2011 | 2010 | 2009 | |||||||||
|
common
shareholders-basic
|
$ | (26,780,712 | ) | $ | 8,950,973 | $ | (41,400,758 | ) | ||||
|
Less: Conversion of derivative
|
||||||||||||
|
instruments
|
(4,199,256 | ) | (20,130,098 | ) | - | |||||||
|
Net income (loss) - diluted
|
$ | (30,979,968 | ) | $ | (11,179,125 | ) | $ | (41,400,758 | ) | |||
|
Weighted average number of
|
||||||||||||
|
shares - basic and diluted
|
208,488,987 | 202,102,859 | 133,535,050 | |||||||||
|
Earnings per share - basic
|
$ | (0.13 | ) | $ | 0.04 | $ | (0.31 | ) | ||||
|
Earnings per share - diluted
|
$ | (0.15 | ) | $ | (0.06 | ) | $ | (0.31 | ) | |||
Excluded from the above computations of weighted-average shares for diluted net loss per share were options and warrants to purchase 25,353,707, 24,175,054, and 23,384,797 shares of common stock as of September 30, 2011, 2010, and 2009, respectively. These securities were excluded because their inclusion would have an anti-dilutive effect on net loss per share diluted.
F-44
13. SEGMENT REPORTING
Codification 280-10, "
Disclosure about Segments of an Enterprise and Related Information
" establishes standards for reporting information regarding operating segments in annual financial statements and requires selected information for those segments to be presented in interim financial reports issued to stockholders. This topic also establishes standards for related disclosures about products and services and geographic areas. Operating segments are identified as components of an enterprise about which separate discrete financial information is available for evaluation by the chief operating decision maker, or decision-making group, in making decisions how to allocate resources and assess performance. The Company's chief decision maker, as defined under this topic, is the Chief Executive Officer. To date, the Company has viewed its operations as principally one segment, the research and development of certain drugs and vaccines. As a result, the financial information disclosed herein materially represents all of the financial information related to the Company's principal operating segment.
14. QUARTERLY INFORMATION (UNAUDITED)
The following quarterly data are derived from the Company’s consolidated statements of operations.
Financial Data
|
Fiscal 2011
|
||||||||||||||||||||
| Three months ended | Three months ended | Three months ended | Three months Ended | Year Ended | ||||||||||||||||
|
December 31
2010
|
March 31,
2011
|
June 30,
2011
|
September
30,
2011
|
September 30,
2011
|
||||||||||||||||
|
Revenue
|
$ | 662,818 | $ | 43,815 | $ | 77,403 | $ | 172,118 | $ | 956,154 | ||||||||||
|
Operating expenses
|
4,978,852 | 5,140,811 | 4,923,147 | 3,899,018 | 18,941,828 | |||||||||||||||
|
Non operating income (expenses)
|
11,477 | 5,305 | (31,822 | ) | (143,777 | ) | (158,817 | ) | ||||||||||||
|
Other expenses
|
- | (12,000,000 | ) | - | - | (12,000,000 | ) | |||||||||||||
|
Gain/(loss) on derivative instruments
|
(1,946,395 | ) | 3,062,087 | 1,763,311 | 1,553,145 | 4,432,148 | ||||||||||||||
|
Net loss
|
(6,250,952 | ) | (14,029,604 | ) | (3,114,255 | ) | (2,317,532 | ) | (25,712,343 | ) | ||||||||||
|
Modification of warrants
|
- | (1,068,369 | ) | - | - | (1,068,369 | ) | |||||||||||||
|
Net loss available to
|
||||||||||||||||||||
|
common shareholders
|
$ | (6,250,952 | ) | $ | (15,097,973 | ) | $ | (3,114,255 | ) | $ | (2,317,532, | ) | $ | (26,780,712 | ) | |||||
|
Net loss per share-basic
|
$ | (0.03 | ) | $ | (0.07 | ) | $ | (0.01 | ) | $ | (0.01 | ) | $ | (0.13 | ) | |||||
|
Net loss per share-diluted
|
$ | (0.03 | ) | $ | (0.09 | ) | $ | (0.02 | ) | $ | (0.02 | ) | $ | (0.15 | ) | |||||
|
Weighted average shares-basic
|
205,112,418 | 207,089,841 | 208,402,408 | 213,319,921 | 208,488,987 | |||||||||||||||
|
Weighted average shares-diluted
|
205,112,418 | 207,089,841 | 208,402,408 | 213,319,921 | 208,488,987 | |||||||||||||||
F-45
Fiscal 2010
|
Three months
Ended
|
Three months
ended
|
Three months
ended
|
Three months
ended
|
Year Ended
|
||||||||||||||||
|
December 31,
2009
|
March 31,
2010
|
June 30,
2010
|
September
30, 2010
|
September
30, 2010
|
||||||||||||||||
|
Revenue
|
$ | 30,000 | $ | 30,600 | $ | 30,900 | $ | 61,800 | $ | 153,300 | ||||||||||
|
Operating expenses
|
4,282,849 | 5,350,958 | 3,424,959 | 5,654,787 | 18,713,553 | |||||||||||||||
|
Non operating expenses (income)
|
(72,099 | ) | (56,167 | ) | (38,423 | ) | (33,221 | ) | (199,910 | ) | ||||||||||
|
Gain/loss on derivative instruments
|
23,340,267 | 4,519,672 | 2,754,512 | (1,770,679 | ) | 28,843,772 | ||||||||||||||
|
Modification of warrants
|
- | (1,432,456 | ) | - | (100,000 | ) | (1,532,456 | ) | ||||||||||||
|
Net income (loss) available to
|
||||||||||||||||||||
|
common shareholders
|
$ | 19,159,517 | $ | (2,176,975 | ) | $ | (601,124 | ) | $ | (7,430,445 | ) | $ | 8,950,973 | |||||||
|
Net loss per share-basic
|
$ | 0.10 | $ | (0.01 | ) | $ | 0.00 | $ | (0.04 | ) | $ | 0.04 | ||||||||
|
Net loss per share-diluted
|
$ | 0.02 | $ | (0.03 | ) | $ | (0.02 | ) | $ | (0.04 | ) | $ | (0.06 | ) | ||||||
|
Weighted average shares-basic
|
194,959,814 | 204,173,750 | 204,592,051 | 204,757,898 | 202,102,859 | |||||||||||||||
|
Weighted average shares-diluted
|
256,198,162 | 204,173,750 | 204,592,051 | 204,757,898 | 202,102,859 | |||||||||||||||
The Company has experienced large swings in its quarterly gains and losses in 2011 and 2010. These swings are caused by the changes in the fair value of convertible debt and warrants each quarter. These changes in the fair value of these securities are recorded on the consolidated statements of operations. The $12 million other expense in 2011 was the cost for the settlement of the lawsuit. See Note 11 for a discussion of the lawsuit.
F-46
15. SUBSEQUENT EVENTS
In accordance with Codification 855-50, “
Subsequent Events
”, the Company has reviewed subsequent events through the date of the filing.
On October 6, 2011, the Company sold 13,333,334 shares of its common stock, at a price per share of $0.30, in a registered direct offering to institutional investors, representing gross proceeds of $4.0 million. Investors also received warrants to purchase up to 12,000,000 shares of the Company’s common stock at a purchase price of $0.40 at any time prior to October 6, 2014. The Company paid Chardan Capital Markets, LLC, the placement agent for this offering, a cash commission of $140,000, and issued 666,667 Series G warrants to Chardan. Each Series G warrant entitles the holder to purchase one share of the Company’s common stock. The Series G warrants may be exercised at any time prior to August 12, 2014 at a price of $0.40 per share. This financing triggered the reset provision for the remaining Series K and the August 2008 investors which resulted in the issuance of an additional 2,069,726 warrants at $0.30 and an additional 833,333 shares.
On December 9, 2010 CEL-SCI Corporation (CEL-SCI) entered into an At the Market Issuance Agreement with McNicoll Lewis & Vlak LLC, or MLV, under which CEL-SCI may offer and sell shares of its common stock, having an aggregate offering price of up to $30,000,000 from time to time through MLV acting as agent and/or principal. On December 5, 2011 CEL-SCI, per the terms of the agreement, exercised its right to terminate the agreement.
F-47
SIGNATURES
In accordance with Section 13 or 15(a) of the Exchange Act, the Registrant has caused this Report to be signed on its behalf by the undersigned, thereunto duly authorized on the 23
rd
day of December 2011.
| CEL-SCI CORPORATION | |||
|
|
By:
|
/s/ Maximilian de Clara | |
| Maximilian de Clara, President | |||
| Title | |||
Pursuant to the requirements of the Securities Act of l934, this Report has been signed below by the following persons on behalf of the Registrant and in the capacities and on the dates indicated.
|
Signature
|
Title
|
Date
|
||
|
/s/ Maximilian de Clara
|
Director
|
23-Dec-11
|
||
|
Maximilian de Clara
|
||||
|
/s/ Geert Kersten
|
Chief Executive, Principal
|
|||
|
Geert R. Kersten
|
Accounting, Principal Financial
|
|||
|
Officer and a Director
|
23-Dec-11
|
|||
|
/s/ Alexander Esterhazy
|
Director
|
23-Dec-11
|
||
|
Alexander G. Esterhazy
|
||||
|
/s/ C. Richard Kinsolving
|
Director
|
23-Dec-11
|
||
|
Dr. C. Richard Kinsolving
|
||||
|
/s/ Peter Young
|
Director
|
23-Dec-11
|
||
|
Dr. Peter R. Young
|
61
TABLE OF CONTENTS
Part IItem 1. BusinessItem 1A. Risk FactorsItem 1B. Unresolved Sec CommentsItem 2. PropertiesItem 3. Legal ProceedingsItem 4. (removed and Reserved)Item 5. Market For Cel-sci's Common Equity and Related Stockholder MattersItem 6. Selected Financial DataItem 7. Management's Discussion and Analysis Of Financial Condition and Results Of OperationsItem 7A. Quantitative and Qualitative Disclosure About Market RisksItem 8. Financial Statements and Supplementary DataItem 9. Changes in and Disagreements with Accountants on Accounting and Financial DisclosureItem 9A. Controls and ProceduresItem 9B. Other InformationItem 10. Directors and Executive Officers Of The RegistrantItem 11. Executive CompensationItem 12. Security Ownership Of Certain Beneficial Owners and Management and Related Stockholder MattersItem 13. Certain Relationships and Related TransactionsItem 14 . Principal Accounting Fees and ServicesItem 15. Exhibits, Financial Statement Schedules