CEL SCI CORP
10-Ks and 10-Qs
|
|
|
|
|
|
|
|
|
|
|
|
|
|
|
|
|
|
|
|
|
|
|
|
|
|
|
|
|
|
|
|
|
|
|
|
|
|
|
|
|
|
|
|
|
|
|
|
|
|
|
|
|
|
|
|
|
|
|
|
|
|
FORM 10-K
SECURITIES AND EXCHANGE COMMISSION
Washington, D.C. 20549
(Mark One)
|
þ
|
ANNUAL REPORT PURSUANT TO SECTION 13 OR 15(d) OF THE SECURITIES EXCHANGE ACT OF 1934
|
For the fiscal year ended September 30, 2014
.
OR
|
o
|
TRANSITION REPORT PURSUANT TO SECTION 13 OR 15(d) OF THE SECURITIES EXCHANGE ACT OF 1934
|
For the transition period from _________ to __________.
Commission file number 1-11889
| CEL-SCI CORPORATION |
| (Exact name of registrant as specified in its charter) |
| COLORADO | 84-0916344 | |
| (State or other jurisdiction of incorporation or organization) | (I.R.S. Employer Identification No.) |
|
8229 Boone Blvd., Suite 802
Vienna, Virginia
|
22182 | |
| (Address of principal executive offices) | (Zip Code) |
Registrant's telephone number, including area code: (703) 506-9460
Securities registered pursuant to Section 12(b) of the Act: None
Securities registered pursuant to Section 12(g) of the Act:
|
Common Stock, $.01 par value
Series S Warrants
|
|
(Title of Class)
|
Indicate by check mark if the registrant is a well-known seasoned issuer, as defined in Rule 405 of the Securities Act.
o
Indicate by check mark if the registrant is not required to file reports pursuant to Section 13 or Section 15(d) of the Act.
o
Indicate by check mark whether the registrant (1) has filed all reports required to be filed by Section 13 or 15(d) of the Securities Exchange Act of 1934 during the preceding 12 months (or for such shorter period that the registrant was required to file such reports), and (2) has been subject to such filing requirements for the past 90 days. Yes
þ
No
o
Indicate by check mark whether the registrant has submitted electronically and posted on its corporate Web site, if any, every Interactive Data File required to be submitted and posted pursuant to Rule 405 of Regulation S-T (§232.405 of this chapter) during the preceding 12 months (or for such shorter period that the registrant was required to submit and post such files). Yes
þ
No
o
Indicate by check mark if disclosure of delinquent filers pursuant to Item 405 of Regulation S-K is not contained herein, and will not be contained, to the best of Registrant's knowledge, in definitive proxy or information statements incorporated by reference in Part III of this Form 10-K or any amendment to this Form 10-K.
þ
Indicate by check mark whether the registrant is a large accelerated filer, an accelerated filer, a non-accelerated filer, or a smaller reporting company. See the definitions of “large accelerated filer,” “accelerated filer” and “smaller reporting company” in Rule 12b-2 of the Exchange Act.
| Large accelerated filer | o | Accelerated filer | þ |
| Non-accelerated filer | o | Smaller reporting company | o |
| (Do not check if a smaller reporting company) |
Indicate by check mark whether the registrant is a shell company (as defined in Rule 12b-2 of the Exchange Act):
o
Yes
þ
No
The aggregate market value of the voting stock held by non-affiliates of the Registrant, based upon the closing sale price of the registrant’s common stock on March 31, 2014, as quoted on the NYSE MKT, was $86,967,791
.
As of December 11, 2014, the Registrant had 91,345,536 issued and outstanding shares of common stock.
Documents Incorporated by Reference: None
CEL-SCI is focused on finding the best way to activate the immune system to fight cancer and infectious diseases. Its lead investigational therapy Multikine (Leukocyte Interleukin, Injection) is currently in a pivotal Phase III clinical trial against head and neck cancer, for which CEL-SCI has received Orphan Drug Status from the U.S. FDA. If the primary endpoint of the FDA study is achieved, the results will be used to support applications to regulatory agencies around the world for worldwide commercial marketing approvals as a first line cancer therapy. Additional clinical indications for Multikine include cervical dysplasia in HIV/HPV co-infected women, for which a Phase I study was successfully concluded; and the treatment of peri-anal warts in HIV/HPV co-infected men and women, for which a Phase I trial is now underway in conjunction with the U.S. Navy under a Cooperative Research and Development Agreement.
CEL-SCI’s immune therapy, Multikine, is being used in a different way than immune therapy is usually used. It is administered locally to treat local tumors or infections and it is given before any other therapy has been administered. For example, in the ongoing Phase III clinical trial, Multikine is given locally at the site of the tumor as a first line of treatment before surgery, radiation and/or chemotherapy because that is when the immune system is thought to be strongest. The goal is to help the intact immune system kill the micro metastases that usually cause recurrence of the cancer. In short, we believe that local administration and administration before weakening of the immune system by chemotherapy and radiation will result in higher efficacy with less or no toxicity.
CEL-SCI’s focus on HPV is not the development of an antiviral against HPV in the general population. Instead it is the development of an immunotherapy to be used in patients who are immune suppressed by diseases such as HIV and are therefore less able or unable to control HPV and its resultant diseases. This group of patients has no viable treatments available to them and there are, to CEL-SCI’s knowledge, no competitors at the current time. HPV is also relevant to the head and neck cancer Phase III study since it is now known that HPV is a cause of head and neck cancer. Multikine was shown to kill HPV in an earlier study of HIV infected women with cervical dysplasia.
CEL-SCI is also investigating a different peptide-based immunotherapy (LEAPS-H1N1-DC) as a possible treatment for H1N1 hospitalized patients and as a vaccine (CEL-2000) for Rheumatoid Arthritis (currently in preclinical testing) using its LEAPS technology platform. The investigational immunotherapy LEAPS-H1N1-DC treatment involves non-changing regions of H1N1 Pandemic Flu (www.jci.org/articles/view/67550), Avian Flu (H5N1), and the Spanish Flu, as CEL-SCI scientists are very concerned about the possible emergence of a new more virulent hybrid virus through the combination of H1N1 and Avian Flu, or possibly Spanish Flu.
CEL-SCI has operations in Vienna, Virginia, and in/near Baltimore, Maryland, USA
.
CEL-SCI was formed as a Colorado corporation in 1983. CEL-SCI’s principal office is located at 8229 Boone Boulevard, Suite 802, Vienna, VA 22182. CEL-SCI’s telephone number is 703-506-9460 and its website is www.cel-sci.com. CEL-SCI does not incorporate the information on its website into this report, and you should not consider it part of this report
.
CEL-SCI makes its electronic filings with the Securities and Exchange Commission (SEC), including its annual reports on Form 10-K, quarterly reports on Form 10-Q, current reports on Form 8-K and amendments to these reports available on its website free of charge as soon as practicable after they are filed or furnished to the SEC.
1
CEL-SCI’S PRODUCTS
CEL-SCI’s product pipeline consists of the following:
|
|
1)
|
Multikine (Leukocyte Interleukin, Injection) investigational immunotherapy against cancer and Human Papilloma Virus (HPV);
|
|
|
2)
|
LEAPS technology, with two investigational therapies, LEAPS-H1N1-DC pandemic flu treatment for hospitalized patients and CEL-2000, a rheumatoid arthritis treatment vaccine.
|
MULTIKINE
CEL-SCI’s lead investigational therapy, Multikine (Leukocyte Interleukin, Injection), is currently in a Phase III clinical trial as a potential therapeutic agent directed at using the immune system to increase survival of advanced primary head and neck cancer patients. Data from Phase I and Phase II clinical trials suggest that Multikine simulates the activities of a healthy person's immune system, enabling it to use the body's own anti-tumor immune response. Multikine (Leukocyte Interleukin, Injection) is the full name of this investigational therapy, which, for simplicity, is referred to in the remainder of this document as Multikine. Multikine is the trademark that CEL-SCI has registered for this investigational therapy, and this proprietary name is subject to FDA review in connection with CEL-SCI’s future anticipated regulatory submission for approval. Multikine has not been licensed or approved for sale, barter or exchange by the FDA or any other regulatory agency. Neither has its safety or efficacy been established for any use.
Multikine has been cleared by the regulators in seventeen countries around the world, including the U.S. FDA, for a global Phase III clinical trial in advanced primary (not yet treated) head and neck cancer patients. The trial is currently under the management of two new clinical research organizations (CROs) who are adding clinical centers in existing and new countries to increase the speed of patient enrollment.
The trial will test the hypothesis that Multikine treatment administered prior to the current standard therapy for head and neck cancer patients (surgical resection of the tumor and involved lymph nodes followed by radiotherapy or radiotherapy and concurrent chemotherapy) will extend the overall survival, enhance the local/regional control of the disease and reduce the rate of disease progression in patients with advanced oral squamous cell carcinoma.
The primary clinical endpoint in CEL-SCI's ongoing Phase III clinical trial is that a 10% improvement in overall survival in the Multikine treatment arm, plus the current standard of care (SOC - consisting of surgery + radiotherapy or surgery + radiochemotherapy), over that which can be achieved in the SOC arm alone (in the well-controlled Phase III clinical trial currently ongoing) must be achieved. Based on what is presently known about the current survival statistics for this population, CEL-SCI believes that achievement of this endpoint should enable CEL-SCI, subject to further consultations with FDA, to move forward, prepare and submit a Biologic License Application to FDA for Multikine.
2
In this clinical trial Multikine is given to cancer patients first, i.e., prior to their receiving any conventional treatment for cancer, including surgery, radiation and/or chemotherapy. This could be shown to be important because conventional therapy may weaken the immune system, and may compromise the potential effect of immunotherapy. Because Multikine is given before conventional cancer therapy, when the immune system should be more intact, CEL-SCI believes the possibility exists for it to have a greater likelihood of activating an anti-tumor immune response under these conditions. This likelihood is one of the clinical aspects being evaluated in the ongoing global Phase III clinical trial.
Multikine is a different kind of investigational therapy in the fight against cancer; Multikine is a defined mixture of cytokines. It is a combination immunotherapy, possessing both active and passive properties.
In October 2012 and again in November 2013, in an interim review of the safety data from the Phase III study, an Independent Data Monitoring Committee (IDMC) raised no safety concerns. The IDMC also indicated that no safety signals were found that would call into question the benefit/risk of continuing the study. CEL-SCI considers the results of the IDMC review to be important since studies have shown that up to 30% of Phase III trials fail due to safety considerations and the IDMC’s safety findings from this interim review were similar to those reported by investigators during CEL-SCI’s Phase I-II trials. Ultimately, the decision as to whether a drug is safe is made by the FDA based on an assessment of all of the data from a trial.
During the early investigational phase, in Phase I and Phase II clinical trials in over 220 subjects who received the investigational therapy Multikine in doses of 200 to 3200 IU (international units), no serious adverse events were reported as being expressly due to administration of this investigational therapy, and subjects in those clinical trials and the treating physicians reported that this investigational therapy was well tolerated in those early-stage clinical trials. Adverse events which were reported included pain at the injection site, local minor bleeding and edema at the injection site, diarrhea, headache, nausea, and constipation. No "abnormal" laboratory results were reported following Multikine treatment - other than those commonly seen by treating physicians in this patient population - regardless of Multikine administration. Similarly, in these early-phase clinical studies in patients, there was no reported increased toxicity of follow-on treatments as a result of Multikine administration. No complications following surgery (such as increased time for wound healing) were reported. No definitive conclusions can be drawn from these data about the safety or efficacy profile of this investigational therapy, further research is required and the global Phase III study is ongoing in an effort to confirm these results.
3
The following is a summary of results from CEL-SCI’s last Phase II study conducted with Multikine. This study used the same treatment protocol as is being used in CEL-SCI’s Phase III study:
|
●
|
In the final Phase II clinical study, using the same dosage and treatment regimen as is being used in the Phase III study, head and neck cancer patients with locally advanced primary disease who received the investigational therapy Multikine as first-line investigational therapy followed by surgery and radiotherapy were reported by the clinical investigators to have had a 63.2% overall survival (OS) rate at 3.5 years from surgery. This percentage OS was arrived at as follows: of the 22 subjects enrolled in this final Phase II study, the consent for the survival follow-up portion of the study was received from 19 subjects. One subject did not consent to the follow-up portion of the study. The other 2 subjects did not have squamous cell carcinoma of the oral cavity and were thus not evaluable per the protocol. The overall survival rate of subjects receiving the investigational therapy in this study was compared to the overall survival rate that was calculated based upon a review of 55 clinical trials conducted in the same cancer population (with a total of 7,294 patients studied), and reported in the peer reviewed scientific literature between 1987 and 2007. Review of this literature showed an approximate survival rate of 47.5% at 3.5 year from treatment. Therefore, the results of CEL-SCI's final Phase II study were considered to be potentially favorable in terms of overall survival recognizing the limitations of this early-phase study. It should be noted that an earlier investigational therapy Multikine study appears to lend support to the overall survival findings described above - Feinmesser et al Arch Otolaryngol. Surg. 2003. However, no definitive conclusions can be drawn from these data about the potential efficacy or safety profile of this investigational therapy. Moreover, further research is required, and these results must be confirmed in the well-controlled Phase III clinical trial of this investigational therapy that is currently in progress. Subject to completion of that Phase III trial and FDA's review and acceptance of CEL-SCI's entire data set on this investigational therapy, CEL-SCI believes that these early-stage clinical trial results indicate the potential for this investigational therapy to become a treatment for advanced primary head and neck cancer.
|
|
●
|
Reported average of 50% reduction in tumor cells in Phase II trials:
The clinical investigators who administered the three week Multikine treatment regimen used in Phase II studies reported that, as was determined in a controlled pathology study, Multikine administration appeared to have caused, on average, the disappearance of about half of the cancer cells present at surgery (as determined by histopathology assessing the area of Stroma/Tumor (Mean+/- Standard Error of the Mean of the number of cells counted per filed)) even before the start of standard therapy such as radiation and chemotherapy (Timar et al JCO 2005).
|
|
●
|
Reported 12% complete response in the final Phase II trial:
The clinical investigators who administered the three week Multikine investigational treatment regimen used in the final Phase II study reported that, as was determined in a controlled pathology study, the tumor apparently was no longer present (as determined by histopathology) in approximately 12 % of patients (2 of 17 evaluable by pathology). This determination was made by three pathologists blinded to the study from the surgical specimen after a three week treatment with Multikine (Timar et al JCO 2005).
|
4
|
●
|
Adverse events reported in clinical trials:
In clinical trials conducted to date with the Multikine investigational therapy, adverse events which have been reported by the clinical investigators as possibly or probably related to Multikine administration included pain at the injection site, local minor bleeding and edema at the injection site, diarrhea, headache, nausea, and constipation
.
|
The clinical significance of these and other data, to date, from the multiple Multikine clinical trials is not yet known. These preliminary clinical data do suggest the potential to demonstrate a possible improvement in the clinical outcome for patients treated with Multikine.
Subject to completion of CEL-SCI's global Phase III clinical trial and FDA's review of CEL-SCI’s entire data set on this investigational therapy, if the FDA were to conclude that the safety and efficacy of this investigational therapy is established, the early-phase clinical data is encouraging in suggesting the potential that head and neck cancer patients with advanced primary disease (approximately 66% of all head and neck cancer patients) could be candidates for this investigational therapy if it were to be approved by FDA.
CEL-SCI has an agreement with Teva Pharmaceutical Industries, Ltd., which provides Teva with the exclusive license to market and distribute Multikine in Israel, Turkey, Serbia and Croatia. Pursuant to the agreement, Teva has signed up three hospitals and enrolled patients in Israel as part of the Phase III trial. Revenues will be divided between CEL-SCI and Teva.
CEL-SCI has an agreement with Orient Europharma of Taiwan which provides Orient Europharma with the exclusive marketing rights to Multikine for all cancer indications in Taiwan, Singapore, Hong Kong, Malaysia, South Korea, the Philippines, Australia and New Zealand. The agreement requires Orient Europharma to fund the clinical trials needed to obtain marketing approvals in these countries for head and neck cancer, naso-pharyngeal cancer and potentially cervical cancer. Orient Europharma has signed up nine centers in Taiwan where it has enrolled patients as part of the Phase III trial. Revenues will be divided between CEL-SCI and Orient Europharma.
CEL-SCI has a licensing agreement with Byron Biopharma LLC (“Byron”) under which CEL-SCI granted Byron an exclusive license to market and distribute Multikine in the Republic of South Africa. Pursuant to the agreement, Byron will be responsible for registering the product in South Africa. Once Multikine has been approved for sale, CEL-SCI will be responsible for manufacturing the product, while Byron will be responsible for sales in South Africa. Revenues will be divided between CEL-SCI and Byron.
On April 23, 2013, CEL-SCI announced that it had replaced Inventiv Health Clinical, the clinical research organization (CRO) running its Phase III clinical trial. This was necessary since the patient enrollment in the study dropped off substantially following a takeover of Pharmanet by Inventiv which caused many of the members of Inventiv’s study team to leave Inventiv. CEL-SCI has hired two CRO’s who will manage the global Phase III study; Aptiv Solutions and Ergomed who are both international leaders in managing oncology trials. The study is currently being expanded to about 100 clinical sites globally.
5
As of November 30, 2014, the last update given by CEL-SCI, the study had enrolled approximately 310 patients. CEL-SCI expects to see a further increase in the number of patients enrolled in the study at an accelerating pace as (i) the current centers finalize all logistical issues and (ii) more clinical centers are added throughout the world. Full enrollment of the planned 880 patients is expected by about the end of 2015.
In April 2013, CEL-SCI entered into a co-development agreement with Ergomed. Under the co-development agreement, Ergomed will contribute up to $10 million towards the study in the form of offering discounted clinical services in exchange for a single digit percentage of milestone and royalty payments, up to a specified maximum amount, only from sales of Multikine for head and neck cancer. Ergomed, a privately-held firm headquartered in Europe with global operations, has entered into five similar co-development agreements, including one with Genzyme (purchased by Sanofi in 2011 for over $20 billion). Ergomed will be responsible for the majority of the new patient enrollment since it has a novel model for clinical site management to accelerate patient recruitment and retention. For example, Ergomed has almost 25 physicians who can directly call on clinical sites to aid recruitment and retention. Some of the Ergomed physicians also have the experience of being clinical investigators themselves. CEL-SCI believes that this interaction on a physician to physician level is what is needed to help increase enrollment in the Multikine study.
CEL-SCI estimates the total cash cost of the Phase III trial, with the exception of the parts that will be paid by its partners, Teva Pharmaceuticals and Orient Europharma, to be approximately $28.2 million after September 30, 2014. This is in addition to approximately $16.4 million which has been paid as of September 30, 2014. This estimate is based on information currently available in CEL-SCI’s contracts with the Clinical Research Organizations responsible for managing the Phase III trial. This number can be affected by the speed of enrollment, foreign currency exchange rates and many other factors, some of which cannot be foreseen today. It is therefore possible that the cost of the Phase III trial will be higher than currently estimated.
In October 2013, CEL-SCI announced it entered into a CRADA with the U.S. Naval Medical Center, San Diego. Pursuant to this agreement, the Naval Medical Center is currently conducting a Human Subjects Institutional Review Board approved Phase I study of CEL-SCI’s investigational immunotherapy, Multikine, in HIV/HPV co-infected men and women with peri-anal warts. Anal and genital warts are commonly associated with the Human Papilloma Virus (HPV), the most common sexually transmitted disease. Men and women with a history of anogenital warts have a 30 fold increased risk of anal cancer. Persistent HPV infection in the anal region is thought to be responsible for up to 80% of anal cancers. HPV is a significant health problem in the HIV infected population as individuals are living longer as a result of greatly improved HIV medications.
On September 29, 2014 CEL-SCI announced that the first volunteer patient had been enrolled and administered Multikine.
The purpose of this study is to evaluate the safety and clinical impact of Multikine as a treatment of peri-anal warts and assess its effect on AIN in HIV/HPV co-infected men and women.
6
CEL-SCI contributes the investigational study drug Multikine, will retain all rights to any currently owned technology, and will have the right to exclusively license any new technology developed from the collaboration.
Multikine is being given to the HIV/HPV co-infected patients with peri-anal warts since promising early results were seen in another Institutional Review Board approved Multikine Phase I study conducted at the University of Maryland. In this study, investigational therapy Multikine was given to HIV/HPV co-infected women with cervical dysplasia resulting in visual and histological evidence of clearance of lesions. Furthermore, elimination of a number of HPV strains was determined by in situ polymerase chain reaction (PCR) performed on tissue biopsy collected before and after Multikine treatment. As reported by the investigators in the earlier study, the study volunteers all appeared to tolerate the treatment with no reported serious adverse events.
The treatment regimen for the study of up to 15 HIV/HPV co-infected patient volunteers with peri-anal warts to be conducted by the Naval Medical Center is identical to the regimen that was used in the earlier Multikine cervical study in HIV/HPV co-infected patients.
In October 2013, CEL-SCI entered into a co-development and profit sharing agreement with Ergomed for Multikine in HIV/HPV co-infected men and women with peri-anal warts. This agreement will initially be in support of the development with the U.S. Navy. Ergomed will assume up to $3 million in clinical and regulatory costs.
Also in October 2013, CEL-SCI entered into a co-development and profit sharing agreement with Ergomed for Multikine in HIV/HPV co-infected women with cervical dysplasia. Human Papilloma Virus (HPV) is the most common sexually transmitted disease. HPV is a significant health problem in the HIV infected population as individuals are living longer as a result of greatly improved HIV medications. People living with HIV and others with compromised immunity are more at risk for HPV-related complications. Persistent HPV infection can also be a precursor to cervical cancer. Ergomed will assume up to $3 million in clinical and regulatory costs.
MANUFACTURING FACILITY
Before starting the Phase III trial, CEL-SCI needed to build a dedicated manufacturing facility to produce Multikine. This facility has been completed and validated, and has produced several clinical lots for the Phase III clinical trial. The facility has also passed review by a European Union Qualified Person on two different occasions.
CEL-SCI’s lease on the manufacturing facility expires on October 31, 2028.
CEL-SCI completed validation of its new manufacturing facility in January 2010. The state-of-the-art facility is being used to manufacture Multikine for CEL-SCI’s Phase III clinical trial. In addition to using this facility to manufacture Multikine, CEL-SCI, only if the facility is not being used for Multikine, may offer the use of the facility as a service to pharmaceutical companies and others, particularly those that need to “fill and finish” their drugs in a cold environment (4 degrees Celsius, or approximately 39 degrees Fahrenheit). However, priority will always be given to Multikine as management considers the Multikine supply to the clinical studies and preparation for a final marketing approval to be more important than offering fill and finish services. Fill and finish is the process of filling injectable drugs in a sterile manner and is a key part of the manufacturing process for many medicines. See Item 2 of this report for more information concerning the terms of this lease.
7
LEAPS
CEL-SCI’s patented T-cell Modulation Process, referred to as LEAPS (Ligand Epitope Antigen Presentation System), uses “heteroconjugates” to direct the body to choose a specific immune response. LEAPS is designed to stimulate the human immune system to more effectively fight bacterial, viral and parasitic infections as well as autoimmune, allergies, transplantation rejection and cancer, when it cannot do so on its own. Administered like a vaccine, LEAPS combines T-cell binding ligands with small, disease associated, peptide antigens and may provide a new method to treat and prevent certain diseases.
The ability to generate a specific immune response is important because many diseases are often not combated effectively due to the body’s selection of the “inappropriate” immune response. The capability to specifically reprogram an immune response may offer a more effective approach than existing vaccines and drugs in attacking an underlying disease.
Using the LEAPS technology, CEL-SCI has created a potential peptide treatment for H1N1 (swine flu) hospitalized patients. This LEAPS flu treatment is designed to focus on the conserved, non-changing epitopes of the different strains of Type A Influenza viruses (H1N1, H5N1, H3N1, etc.), including “swine”, “avian or bird”, and “Spanish Influenza”, in order to minimize the chance of viral “escape by mutations” from immune recognition. Therefore one should think of this treatment not really as an H1N1 treatment, but as a potential pandemic flu treatment. CEL-SCI’s LEAPS flu treatment contains epitopes known to be associated with immune protection against influenza in animal models.
In September 2009, the U.S. FDA advised CEL-SCI that it could proceed with its first clinical trial to evaluate the effect of LEAPS-H1N1 treatment on the white blood cells of hospitalized H1N1 patients. This followed an expedited initial review of CEL-SCI's regulatory submission for this study proposal.
In November 2009, CEL-SCI announced that The Johns Hopkins University School of Medicine had given clearance for CEL-SCI’s first clinical study to proceed using LEAPS-H1N1. Soon after the start of the study, the number of hospitalized H1N1 patients dramatically declined and the study was unable to complete the enrollment of patients.
Additional work on this treatment for the pandemic flu is being pursued in collaboration with the National Institute of Allergy and Infectious Diseases (NIAID), part of the National Institutes of Health, USA. In May 2011 NIAID scientists presented data at the Keystone Conference on “Pathogenesis of Influenza: Virus-Host Interactions” in Hong Kong, China, showing the positive results of efficacy studies in mice of LEAPS H1N1 activated dendritic cells (DCs) to treat the H1N1 virus. Scientists at the NIAID found that H1N1-infected mice treated with LEAPS-H1N1 DCs showed a survival advantage over mice treated with control DCs. The work was performed in collaboration with scientists led by Kanta Subbarao, M.D., Chief of the Emerging Respiratory Diseases Section in NIAID’s Division of Intramural Research, part of the National Institutes of Health, USA.
8
In July 2013, CEL-SCI announced the publication of the results of additional influenza studies by researchers from the NIAID in the Journal of Clinical Investigation (
www.jci.org/articles/view/67550
). The studies described in the publication show that when CEL-SCI’s investigational J-LEAPS Influenza Virus treatments were used “in vitro” to activate DCs, these activated DCs, when injected into influenza infected mice, arrested the progression of lethal influenza virus infection in these mice. The work was performed in the laboratory of Dr. Subbarao.
With its LEAPS technology, CEL-SCI also developed a second peptide named CEL-2000, a potential rheumatoid arthritis vaccine. The data from animal studies of rheumatoid arthritis using the CEL-2000 treatment vaccine demonstrated that CEL-2000 is an effective treatment against arthritis with fewer administrations than those required by other anti-rheumatoid arthritis treatments, including Enbrel
®
. CEL-2000 is also potentially a more disease type-specific therapy, is calculated to be significantly less expensive and may be useful in patients unable to tolerate or who may not be responsive to existing anti-arthritis therapies.
In February 2010 CEL-SCI announced that its CEL-2000 vaccine demonstrated that it was able to block the progression of rheumatoid arthritis in a mouse model. The results were published in the scientific peer-reviewed Journal of International Immunopharmacology (online edition) in an article titled “CEL-2000: A Therapeutic Vaccine for Rheumatoid Arthritis Arrests Disease Development and Alters Serum Cytokine/Chemokine Patterns in the Bovine Collagen Type II Induced Arthritis in the DBA Mouse Model” with lead author Daniel Zimmerman, Ph.D., Senior Vice President of Research, Cellular Immunology at CEL-SCI. The study was co-authored by scientists from CEL-SCI, Washington Biotech, Northeastern Ohio Universities Colleges of Medicine and Pharmacy and Boulder BioPath.
In August 2012, Dr. Zimmerman gave a Keynote presentation at the OMICS 2nd International Conference on Vaccines and Vaccinations in Chicago. This presentation showed how the LEAPS peptides administered altered only select cytokines specific for each disease model, thereby improving the status of the test animals and even preventing death and morbidity. These results support the growing body of evidence that provides for its mode of action by a common format in these unrelated conditions by r
egulation of Th1 (e.g., IL12 and IFN-γ) and their action on reducing TNF-α and other inflammatory cytokines as well regulation of antibodies to these disease associated antigens. This was also illustrated by a schematic model showing how these pathways in
teract and result in the overall effect of protection and regulation of cytokines in a beneficial manner.
On July 15, 2014, CEL-SCI announced that it has been awarded a Phase I Small Business Innovation Research (SBIR) grant in the amount of $225,000 from the National Institute of Arthritis Muscoskeletal and Skin Diseases, which is part of the National Institutes of Health. The grant will fund the further development of CEL-SCI’s LEAPS technology as a potential treatment for rheumatoid arthritis, an autoimmune disease of the joints. The work will be conducted at Rush University Medical Center in Chicago, Illinois in the laboratories of Tibor Glant, MD, Ph.D., The Jorge O. Galante Professor of Orthopedic Surgery; Katalin Mikecz, MD, Ph.D. Professor of Orthopedic Surgery & Biochemistry; and Allison Finnegan, Ph.D. Professor of Medicine.
9
Even though the various LEAPS drug candidates have not yet been given to humans, they have been tested in vitro with human cells. They have induced similar cytokine responses that were seen in these animal models, which may indicate that the LEAPS technology might translate to humans. The LEAPS candidates have demonstrated protection against lethal herpes simplex virus (HSV1) and H1N1 influenza infection, as a prophylactic or therapeutic agent in animals. They have also shown efficacy in animals in two autoimmune conditions, curtailing and sometimes preventing disease progression in arthritis and myocarditis animal models. CEL-SCI’s belief is that the LEAPS technology may be a significant alternative to the vaccines currently available on the market today for these diseases.
None of the LEAPS investigational products have been approved for sale, barter or exchange by the FDA or any other regulatory agency for any use to treat disease in animals or humans. The safety or efficacy of these products has not been established for any use. Lastly, no definitive conclusions can be drawn from the early-phase, preclinical-trials data involving these investigational products. Before obtaining marketing approval from the FDA in the United States, and by comparable agencies in most foreign countries, these product candidates must undergo rigorous preclinical and clinical testing which is costly and time consuming and subject to unanticipated delays. There can be no assurance that these approvals will be granted.
RISK FACTORS
The risks described below could adversely affect the price of CEL-SCI’s common stock.
Risks Related to CEL-SCI
Since CEL-SCI has earned only limited revenues and has a history of losses, CEL-SCI will require additional capital to remain in operation,
complete its clinical trials and fund pre-marketing expenses.
CEL-SCI has had only limited revenues since it was formed in 1983. Since the date of its formation and through September 30, 2014, CEL-SCI incurred net losses of approximately $238 million. CEL-SCI has relied principally upon the proceeds of the public and private sales of its securities to finance its activities to date.
If CEL-SCI cannot obtain additional capital, CEL-SCI may have to postpone development and research expenditures, which will delay CEL-SCI's ability to produce a competitive product. Delays of this nature may depress the price of CEL-SCI's common stock. In addition, although CEL-SCI is not aware of a direct competitor for Multikine, it is possible that one exists. There are many potential competitors of LEAPS. If competitors develop, any delay in the development of CEL-SCI’s products may provide opportunities to those competitors.
The condition of the overall economy may continue to affect both the availability of capital and CEL-SCI’s stock price. In addition, future capital raises, which will be necessary for CEL-SCI’s survival, will be further dilutive to current shareholders. There can be no assurance that CEL-SCI will be able to raise the capital it will need.
10
All of CEL-SCI's potential products, with the exception of Multikine, are in the early stages of development, and any commercial sale of these products will be many years away.
Even potential product sales from Multikine are years away, since cancer trials can be lengthy. Accordingly, CEL-SCI expects to incur substantial losses for the foreseeable future.
Since CEL-SCI does not intend to pay dividends on its common stock, any potential return to investors will result only from any increases in the price of CEL-SCI's common stock.
At the present time, CEL-SCI intends to use available funds to finance its operations. Accordingly, while payment of dividends rests within the discretion of CEL-SCI’s Directors, no common stock dividends have been declared or paid by CEL-SCI and CEL-SCI has no intention of paying any common stock dividends in the foreseeable future. Any gains for CEL-SCI’s investors will most likely result from increases in the price of CEL-SCI’s common stock, which has been volatile in the recent past. If CEL-SCI’s stock price does not increase, which likely will depend primarily upon the results of the Multikine clinical trials, an investor is unlikely to receive any return on an investment in CEL-SCI’s common stock.
The costs of CEL-SCI’s product development and clinical trials are difficult to estimate and will be very high for many years, preventing CEL-SCI from making a profit for the foreseeable future, if ever.
Clinical and other studies necessary to obtain approval of a new drug can be time consuming and costly, especially in the United States, but also in foreign countries. CEL-SCI's estimates of the costs associated with future clinical trials and research may be substantially lower than what CEL-SCI actually experiences. It is impossible to predict what CEL-SCI will face in the development of a product, such as LEAPS. The purpose of clinical trials is to provide both CEL-SCI and regulatory authorities with safety and efficacy data in humans. It is relatively common to revise a trial or add subjects to a trial in progress. These examples of common vagaries in product development and clinical investigations demonstrate how predicted costs may exceed reasonable expectations. The difficult and often complex steps necessary to obtain regulatory approval, especially that of the United States Food and Drug Administration (“FDA”) and the European Union’s European Medicine’s Agency (“EMA”), involve significant costs and may require several years to complete. CEL-SCI expects that it will need substantial additional financing over an extended period of time in order to fund the costs of future clinical trials, related research, and general and administrative expenses.
The extent of CEL-SCI's clinical trials and research programs are primarily based upon the amount of capital available to CEL-SCI and the extent to which it receives regulatory approvals for clinical trials. CEL-SCI has established estimates of the future costs of the Phase III clinical trial for Multikine, but, as explained above, that estimate may not prove correct.
11
Compliance with changing regulations concerning corporate governance and public disclosure may result in additional expenses.
Changing laws, regulations and standards relating to corporate governance and public disclosure may create uncertainty regarding compliance matters. New or changed laws, regulations and standards are subject to varying interpretations in many cases. As a result, their application in practice may evolve over time. CEL-SCI is committed to maintaining high standards of corporate governance and public disclosure. Complying with evolving interpretations of new or changing legal requirements may cause CEL-SCI to incur higher costs as it revises current practices, policies and procedures, and may divert management time and attention from potential revenue-generating activities to compliance matters. If CEL-SCI’s efforts to comply with new or changed laws, regulations and standards differ from the activities intended by regulatory or governing bodies due to ambiguities related to practice, CEL-SCI’s reputation may also be harmed. Further, CEL-SCI’s board members, chief executive officer, president and other executive officers could face an increased risk of personal liability in connection with the performance of their duties. As a result, CEL-SCI may have difficulty attracting and retaining qualified board members and executive officers, which could harm its business.
CEL-SCI has not established a definite plan for the marketing of Multikine.
CEL-SCI has not established a definitive plan for marketing nor has it established a price structure for any of its products. However, CEL-SCI intends, if it is in a position to do so, to sell Multikine itself in certain markets and to enter into written marketing agreements with various major pharmaceutical firms with established sales forces. The sales forces in turn would, CEL-SCI believes, target CEL-SCI's products to cancer centers, physicians and clinics involved in head and neck cancer. CEL-SCI has already licensed Multikine to three companies, Teva Pharmaceuticals in Israel, Turkey, Serbia and Croatia, Orient Europharma in Taiwan, Singapore, Hong Kong, Malaysia, South Korea, the Philippines, Australia and New Zealand, and Byron BioPharma, LLC in South Africa. CEL-SCI believes that these companies have the resources to market Multikine appropriately in their respective territories, but there is no guarantee that they will. There is no assurance that CEL-SCI will find qualified parties willing to market CEL-SCI’s product in other areas.
CEL-SCI may encounter problems, delays and additional expenses in developing marketing plans with outside firms. In addition, even if Multikine is cost effective and proven to increase overall survival, CEL-SCI may experience other limitations involving the proposed sale of Multikine, such as uncertainty of third-party reimbursement. There is no assurance that CEL-SCI can successfully market any products which it may develop.
CEL-SCI hopes to expand its clinical development capabilities in the future, and any difficulties hiring or retaining key personnel or managing this growth could disrupt CEL-SCI’s operations.
CEL-SCI is highly dependent on the principal members of CEL-SCI’s management and development staff. If the Multikine clinical trial is successful, CEL-SCI expects to expand its clinical development and manufacturing capabilities, which will involve hiring additional employees. Future growth will require CEL-SCI to continue to implement and improve CEL-SCI’s managerial, operational and financial systems and to continue to retain, recruit and train additional qualified personnel, which may impose a strain on CEL-SCI’s administrative and operational infrastructure. The competition for qualified personnel in the biopharmaceutical field is intense. CEL-SCI is highly dependent on its ability to attract, retain and motivate highly qualified management and specialized personnel required for clinical development. Due to CEL-SCI’s limited resources, CEL-SCI may not be able to manage effectively the expansion of its operations or recruit and train additional qualified personnel. If CEL-SCI is unable to retain key personnel or manage its growth effectively, CEL-SCI may not be able to implement its business plan.
12
Multikine is made from components of human blood, which involves inherent risks that may lead to product destruction or patient injury.
Multikine is made, in part, from components of human blood. There are inherent risks associated with products that involve human blood such as possible contamination with viruses, including Hepatitis or HIV. Any possible contamination could require CEL-SCI to destroy batches of Multikine or cause injuries to patients who receive the product, thereby subjecting CEL-SCI to possible financial losses, lawsuits, and harm to its business.
Although CEL-SCI has product liability insurance for Multikine, the successful prosecution of a product liability case against CEL-SCI could have a materially adverse effect upon its business if the amount of any judgment exceeds CEL-SCI's insurance coverage. Such a suit also could damage the reputation of Multikine and make successful marketing of the product less likely. CEL-SCI commenced the Phase III clinical trial for Multikine in December 2010. Although no claims have been brought to date, participants in CEL-SCI's clinical trials could bring civil actions against CEL-SCI for any unanticipated harmful effects arising from the use of Multikine or any drug or product that CEL-SCI may attempt to develop.
Risks Related to Government Approvals
CEL-SCI's product candidates must undergo rigorous preclinical and clinical testing and regulatory approvals, which could be costly and time-consuming and subject CEL-SCI to unanticipated delays or prevent CEL-SCI from marketing any products.
Therapeutic agents, drugs and diagnostic products are subject to approval, prior to general marketing, from the FDA in the United States, the EMA in the European Union, and by comparable agencies in most foreign countries. Before obtaining marketing approval, these product candidates must undergo costly and time consuming preclinical and clinical testing which could subject CEL-SCI to unanticipated delays and may prevent CEL-SCI from marketing its product candidates. There can be no assurance that such approvals will be granted.
CEL-SCI cannot be certain when or under what conditions it will undertake future clinical trials. A variety of issues may delay CEL-SCI’s Phase III clinical trial for Multikine or preclinical and early clinical trials for other products. For example, early trials, or the plans for later trials, may not satisfy the requirements of regulatory authorities, such as the FDA. CEL-SCI may fail to find subjects willing to enroll in CEL-SCI’s trials. CEL-SCI manufactures Multikine, but relies on third party vendors for managing the trial process and other activities, and these vendors may fail to meet appropriate standards. Accordingly, the clinical trials relating to CEL-SCI's product candidates may not be completed on schedule, the FDA or foreign regulatory agencies may order CEL-SCI to stop or modify its research, or these agencies may not ultimately approve any of CEL-SCI's product candidates for commercial sale. Varying interpretations of the data obtained from pre-clinical and clinical testing could delay, limit or prevent regulatory approval of CEL-SCI's product candidates. The data collected from CEL-SCI's clinical trials may not be sufficient to support regulatory approval of its various product candidates, including Multikine. CEL-SCI's failure to adequately demonstrate the safety and efficacy of any of its product candidates would delay or prevent regulatory approval of its product candidates in the United States, which could prevent CEL-SCI from achieving profitability. Although CEL-SCI had positive results in its Phase II trials for Multikine, those results were for a very small sample set, and CEL-SCI will not know definitively how Multikine will perform until CEL-SCI is well into, or completes, its Phase III clinical trial.
13
The requirements governing the conduct of clinical trials, manufacturing, and marketing of CEL-SCI's product candidates, including Multikine, outside the United States vary from country to country. Foreign approvals may take longer to obtain than FDA approvals and can require, among other things, additional testing and different trial designs. Foreign regulatory approval processes include all of the risks associated with the FDA approval process. Some of those agencies also must approve prices for products approved for marketing. Approval of a product by the FDA or the EMA does not ensure approval of the same product by the health authorities of other countries. In addition, changes in regulatory requirements for product approval in any country during the clinical trial process and regulatory agency review of each submitted new application may cause delays or rejections.
CEL-SCI has only limited experience in filing and pursuing applications necessary to gain regulatory approvals. CEL-SCI’s lack of experience may impede its ability to obtain timely approvals from regulatory agencies, if at all. CEL-SCI will not be able to commercialize Multikine and other product candidates until it has obtained regulatory approval. In addition, regulatory authorities may also limit the types of patients to which CEL-SCI or others may market Multikine or CEL-SCI's other products. Any failure to obtain or any delay in obtaining required regulatory approvals may adversely affect the ability of CEL-SCI or potential licensees to successfully market CEL-SCI’s products.
Even if CEL-SCI obtains regulatory approval for its product candidates, CEL-SCI will be subject to stringent, ongoing government regulation.
If CEL-SCI's products receive regulatory approval, either in the United States or internationally, CEL-SCI will continue to be subject to extensive regulatory requirements. These regulations are wide-ranging and govern, among other things:
|
●
|
product design, development and manufacture;
|
|
●
|
product application and use
|
|
●
|
adverse drug experience;
|
|
●
|
product advertising and promotion;
|
|
●
|
product manufacturing, including good manufacturing practices
|
|
●
|
record keeping requirements;
|
|
●
|
registration and listing of CEL-SCI's establishments and products with the FDA, EMA and other state and national agencies;
|
|
●
|
product storage and shipping;
|
|
●
|
drug sampling and distribution requirements;
|
|
●
|
electronic record and signature requirements; and
|
|
●
|
labeling changes or modifications.
|
14
CEL-SCI and any third-party manufacturers or suppliers must continually adhere to federal regulations setting forth requirements, known as current Good Manufacturing Practices, or cGMPs, and their foreign equivalents, which are enforced by the FDA, the EMA and other national regulatory bodies through their facilities inspection programs. If CEL-SCI's facilities, or the facilities of CEL-SCI’s contract manufacturers or suppliers, cannot pass a pre-approval plant inspection, the FDA, EMA, or other national regulators will not approve the marketing applications of CEL-SCI's product candidates. In complying with cGMP and foreign regulatory requirements, CEL-SCI and any of its potential third-party manufacturers or suppliers will be obligated to expend time, money and effort in production, record-keeping and quality control to ensure that CEL-SCI’s products meet applicable specifications and other requirements.
If CEL-SCI does not comply with regulatory requirements at any stage, whether before or after marketing approval is obtained, CEL-SCI may be subject to license suspension or revocation, criminal prosecution, seizure, injunction, fines, be forced to remove a product from the market or experience other adverse consequences, including restrictions or delays in obtaining regulatory marketing approval for such products or for other products for which it seeks approval. This could materially harm CEL-SCI's financial results, reputation and stock price. Additionally, CEL-SCI may not be able to obtain the labeling claims necessary or desirable for product promotion. CEL-SCI may also be required to undertake post-marketing trials, which will be evaluated by applicable authorities to determine if CEL-SCI’s products may remain on the market. If CEL-SCI or other parties identify adverse effects after any of CEL-SCI's products are on the market, or if manufacturing problems occur, regulatory approval may be suspended or withdrawn. CEL-SCI may be required to reformulate its products, conduct additional clinical trials, make changes in product labeling or indications of use, or submit additional marketing applications to support any changes. If CEL-SCI encounters any of the foregoing problems, its business and results of operations will be harmed and the market price of its common stock may decline.
CEL-SCI cannot predict the extent of adverse government regulations which might arise from future legislative or administrative action. Without government approval, CEL-SCI will be unable to sell any of its products.
Foreign governments often impose strict price controls, which may adversely affect CEL-SCI’s future profitability.
CEL-SCI intends to seek approval to market Multikine in both the United States and foreign jurisdictions. If CEL-SCI obtains approval in one or more foreign jurisdictions, CEL-SCI will be subject to rules and regulations in those jurisdictions relating to Multikine. In some foreign countries, particularly in the European Union, prescription drug pricing is subject to governmental control. In these countries, pricing negotiations with governmental authorities can take considerable time after the receipt of marketing approval for a drug candidate. To obtain reimbursement or pricing approval in some countries, CEL-SCI may be required to conduct a clinical trial that compares the cost-effectiveness of Multikine to other available therapies. If reimbursement of Multikine is unavailable or limited in scope or amount, or if pricing is set at unsatisfactory levels, CEL-SCI may be unable to achieve or sustain profitability.
15
Risks Related to Intellectual Property
CEL-SCI may not be able to achieve or maintain a competitive position, and other technological developments may result in CEL-SCI's proprietary technologies becoming uneconomical or obsolete.
CEL-SCI is involved in a biomedical field that is undergoing rapid and significant technological change. The pace of change continues to accelerate. The successful development of products from CEL-SCI's compounds, compositions and processes through CEL-SCI financed research, or as a result of possible licensing arrangements with pharmaceutical or other companies, is not assured.
Many companies are working on drugs designed to cure or treat cancer or cure and treat viruses, such as HPV or H1N1. Many of these companies have financial, research and development, and marketing resources, which are much greater than CEL-SCI’s, and are capable of providing significant long-term competition either by establishing in-house research groups or by forming collaborative ventures with other entities. In addition, smaller companies and non-profit institutions are active in research relating to cancer and infectious diseases. CEL-SCI’s market share will be reduced or eliminated if CEL-SCI’s competitors develop and obtain approval for products that are safer or more effective than CEL-SCI’s products.
CEL-SCI's patents might not protect CEL-SCI's technology from competitors, in which case CEL-SCI may not have any advantage over competitors in selling any products which it may develop.
Certain aspects of CEL-SCI's technologies are covered by U.S. and foreign patents. In addition, CEL-SCI has a number of new patent applications pending. There is no assurance that the applications still pending or which may be filed in the future will result in the issuance of any patents. Furthermore, there is no assurance as to the breadth and degree of protection any issued patents might afford CEL-SCI. Disputes may arise between CEL-SCI and others as to the scope and validity of these or other patents. Any defense of the patents could prove costly and time consuming and there can be no assurance that CEL-SCI will be in a position, or will deem it advisable, to carry on such a defense. A suit for patent infringement could result in increasing costs, delaying or halting development, or even forcing CEL-SCI to abandon a product. Other private and public concerns, including universities, may have filed applications for, may have been issued, or may obtain additional patents and other proprietary rights to technology potentially useful or necessary to CEL-SCI. CEL-SCI currently is not aware of any such patents, but the scope and validity of such patents, if any, and the cost and availability of such rights are impossible to predict. Also, as far as CEL-SCI relies upon unpatented proprietary technology, there is no assurance that others may not acquire or independently develop the same or similar technology.
16
Much of CEL-SCI’s intellectual property is protected as a trade secret, not as a patent.
Much of CEL-SCI’s intellectual property pertains to its manufacturing system, certain aspects of which may not be suitable for patent filing and must be protected as trade secrets. Those trade secrets must be protected diligently by CEL-SCI to protect their disclosure to competitors, since legal protections after disclosure may be minimal or non-existent. Accordingly, much of CEL-SCI’s value is dependent upon its ability to keep its trade secrets confidential. Although CEL-SCI takes measures to ensure confidentiality, CEL-SCI may fail in that attempt. In addition, in some cases a regulator considering CEL-SCI’s application for product approval may require the disclosure of some or all of CEL-SCI’s proprietary information. In such a case, CEL-SCI must decide whether to disclose the information or forego approval in a particular country. If CEL-SCI is unable to market its products in key countries, CEL-SCI’s opportunities and value may suffer.
Risks Related to CEL-SCI's Common Stock
Since the market price for CEL-SCI's common stock is volatile, investors may not be able to sell any of CEL-SCI's shares at a profit.
The market price of CEL-SCI's common stock, as well as the securities of other biopharmaceutical and biotechnology companies, have historically been highly volatile, and the market has from time to time experienced significant price and volume fluctuations that are unrelated to the operating performance of particular companies. During the twelve months ended September 30, 2014, CEL-SCI's stock price has ranged from a low of $0.53 per share to a high of $1.90 per share. Factors such as fluctuations in CEL-SCI's operating results, announcements of technological innovations or new therapeutic products by CEL-SCI or its competitors, governmental regulation, developments in patent or other proprietary rights, public concern as to the safety of products developed by CEL-SCI or other biotechnology and pharmaceutical companies, publications by market analysts, law suits, and general market conditions may have a significant effect on the future market price of CEL-SCI's common stock.
Future sales of CEL-SCI’s securities may dilute the value of current investors’ holdings.
The provisions in CEL-SCI's Articles of Incorporation relating to CEL-SCI's preferred stock allow CEL-SCI's directors to issue preferred stock with rights to multiple votes per share and dividend rights which would have priority over any dividends paid with respect to CEL-SCI's common stock. The issuance of preferred stock with such rights may make more difficult the removal of management even if such removal would be considered beneficial to shareholders generally, and will have the effect of limiting shareholder participation in certain transactions such as mergers or tender offers if such transactions are not favored by incumbent management. In addition, CEL-SCI has issued warrants in the past and may do so in the future. These warrants, providing a future right to purchase shares of CEL-SCI’s common stock at an established price, may further dilute the ownership of current shareholders.
17
In order to raise additional capital, CEL-SCI may need to sell shares of its common stock, or securities convertible into common stock, at prices that may be below the prevailing market price of CEL-SCI's common stock at the time of sale. Since CEL-SCI’s stock price has been volatile, even a sale at market price one week may represent a substantial “discount” over the prior week’s price. Future sales of CEL-SCI’s securities will dilute CEL-SCI’s current stockholders and investors and may have a negative effect on the market price of its common stock.
Shares issuable upon the conversion of a note or upon the exercise of outstanding warrants and options may substantially increase the number of shares available for sale in the public market and may depress the price of CEL-SCI's common stock.
As of November 30, 2014, there were outstanding options which allows the holders to purchase approximately 6,840,000 shares of CEL-SCI’s common stock, at prices ranging between $0.85 and $20.00 per share, outstanding warrants which allow the holders to purchase approximately 35,863,000 shares of CEL-SCI’s common stock, at prices ranging between $0.53 and $5.50 per share, and a convertible note which allows the holder to acquire approximately 276,000 shares of CEL-SCI’s common stock at a conversion price of $4.00. The outstanding options and warrants could adversely affect CEL-SCI’s ability to obtain future financing or engage in certain mergers or other transactions, since the holders of options and warrants can be expected to exercise them at a time when CEL-SCI may be able to obtain additional capital through a new offering of securities on terms more favorable to CEL-SCI than the terms of the outstanding options and warrants. For the life of the options, warrants and the convertible note, the holders have the opportunity to profit from a rise in the market price of CEL-SCI’s common stock without assuming the risk of ownership. The issuance of shares upon the exercise of outstanding options and warrants, or the conversion of the note, will also dilute the ownership interests of CEL-SCI’s existing stockholders.
Substantially all of the shares of common stock that are issuable upon the conversion of the note or the exercise of outstanding options and warrants may be sold in the public market. The sale of common stock described above, or the perception that such sales could occur, may adversely affect the market price of CEL-SCI's common stock.
Any decline in the price of CEL-SCI's common stock may encourage short sales, which could place further downward pressure on the price of CEL-SCI's common stock. Short selling is a practice of selling shares which are not owned by a seller at that time, with the expectation that the market price of the shares will decline in value after the sale, providing the short seller a profit.
CEL-SCI may have exposure for certain securities CEL-SCI sold in October 2013.
In September 2012, CEL-SCI filed a shelf registration statement covering the sale of $50,000,000 of securities (the “2012 Registration Statement”), and in January 2013 CEL-SCI filed another shelf registration statement covering the sale of an additional $50,000,000 of securities (the “2013 Registration Statement”). In October 2013, CEL-SCI filed a prospectus supplement to the 2012 Registration Statement for the sale in an underwritten public offering of 17,826,087 shares of CEL-SCI’s common stock, 20,475,000 Series S Warrants, as well as up to 20,475,000 shares of common stock issuable upon the exercise of the Series S warrants (the “October Prospectus”). Collectively, CEL-SCI offered approximately $43.4 million of securities pursuant to the October Prospectus. This amount includes approximately $17.8 million for the sale of the common stock and Series S warrants and $25.6 million upon the exercise of the Series S Warrants. CEL-SCI subsequently realized that at the time of the October 2013 offering CEL-SCI had approximately $28.9 million available for issuance under the 2012 Registration Statement. As a result, CEL-SCI offered securities that were not registered with the SEC, and that may not have been eligible for an exemption from registration under the federal or state securities laws. CEL-SCI had securities available under the 2013 Registration Statement to register all of the securities not covered by the 2012 Registration Statement. In December 2013, CEL-SCI filed a prospectus supplement to the 2013 Registration Statement registering the offer and sale of all of the shares of common stock issuable upon exercise of the Series S Warrants included in the October 2013 offering to assure that the offering and sale of all of the shares issuable upon exercise of the Series S Warrants were registered (the “December Prospectus”). Prior to the filing of the December Prospectus, no Series S Warrants issued in the October offering had been exercised. Notwithstanding the above, the actions CEL-SCI has taken to mitigate CEL-SCI’s possible non-compliance with securities laws will not prevent regulators from asserting that CEL-SCI violated the law, from imposing penalties and fines against CEL-SCI with respect to any potential violations of securities laws, and may subject CEL-SCI to possible claims for damages from certain investors.
18
None
CEL-SCI leases office space at 8229 Boone Blvd., Suite 802, Vienna, Virginia at a monthly rental of approximately $8,000
.
The lease on the office space expires on June 30, 2015. CEL-SCI believes this arrangement is adequate for the conduct of its present business.
CEL-SCI has a 17,900 square foot laboratory located in Baltimore, Maryland. The laboratory is leased by CEL-SCI at a cost of approximately $11,
0
00 per month. The laboratory lease expires on February 28, 2017
.
In August 2007, CEL-SCI leased a building near Baltimore, Maryland. The building, which consists of approximately 73,000 square feet, has been remodeled in accordance with CEL-SCI’s specifications so that it can be used by CEL-SCI to manufacture Multikine for CEL-SCI’s Phase III clinical trial and sales of the drug if approved by the FDA. The lease expires on October 31, 2028 and requires annual base rent payments of approximately $1,544,000 during the twelve months ending September 30, 2014. The annual base rent escalates each year at 3% beginning on November 1st. CEL-SCI is also required to pay all real and personal property taxes, insurance premiums, maintenance expenses, repair costs and utilities, which were approximately $43,000 per month as of September 30, 2014. The lease allows CEL-SCI, at its election, to extend the lease for two ten-year periods or to purchase the building at the end of the 20-year lease. The lease required CEL-SCI to pay $3,150,000 towards the remodeling costs, which will be recouped by reductions in the annual base rent of $303,228 beginning in fiscal year 2014. In August 2011, CEL-SCI was required to deposit $1,670,917, the equivalent of one year of base rent. The $1,670,917 was required to be deposited when the amount of CEL-SCI’s cash had dropped below the amount stipulated in the lease and is included in non-current assets at September 30, 2014.
On October 31, 2013, CEL-SCI announced the commencement of arbitration proceedings against inVentiv Health Clinical, LLC (f/k/a PharmaNet, LLC), CEL-SCI’s former clinical research organization. The arbitration claim, initiated under the Commercial Rules of the American Arbitration Association, alleges (i) breach of contract, (ii) fraud in the inducement, and (iii) common law fraud, and seeks at least $50 million in damages. In April 2013, CEL-SCI dismissed inVentiv Health Clinical, LLC and replaced it with two clinical research organizations, Aptiv Solutions, Inc. and Ergomed Clinical Research Ltd.
On December 12, 2013, inVentiv Health Clinical, LLC filed an answer and counterclaim in response to CEL-SCI’s claims against it. The counterclaim alleges breach of contract on the part of CEL-SCI and seeks at least $2 million in damages. On December 20, 2013, inVentiv moved to dismiss certain claims. On June 24, 2014, the arbitrator denied inVentiv’s motion to dismiss. Given that this matter is at a preliminary stage, CEL-SCI is not in a position to predict or assess the likely outcome of these proceedings.
Not applicable.
19
ITEM 5.
MARKET FOR CEL-SCI'S COMMON EQUITY AND RELATED STOCKHOLDER MATTERS.
As of September 30, 2014 there were approximately 1,400 record holders of CEL-SCI’s common stock. CEL-SCI’s common stock is traded on the NYSE MKT under the symbol “CVM”.
On June 25, 2013, CEL-SCI’s shareholders approved a reverse split of CEL-SCI’s common stock. The reverse split became effective on the NYSE MKT on September 25, 2013. On that date, every ten issued and outstanding shares of CEL-SCI’s common stock automatically converted into one outstanding share.
As a result of the reverse stock split, the number of CEL-SCI’s outstanding shares of common stock decreased from 310,005,272 (pre-split) shares to 31,001,686 (post-split) shares. In addition, by reducing the number of CEL-SCI’s outstanding shares, CEL-SCI’s loss per share in all prior periods will increase by a factor of ten.
Shown below are the post-split range of high and low quotations for CEL-SCI’s common stock for the periods indicated as reported on the NYSE MKT. The market quotations reflect inter-dealer prices, without retail mark-up, mark-down or commissions and may not necessarily represent actual transactions.
|
Quarter Ending
|
High
|
Low
|
||||||
|
12/31/12
|
$ | 3.90 | $ | 2.60 | ||||
|
3/31/13
|
$ | 2.90 | $ | 2.10 | ||||
|
6/30/13
|
$ | 3.10 | $ | 2.00 | ||||
|
9/30/13
|
$ | 2.70 | $ | 1.60 | ||||
|
12/31/13
|
$ | 1.80 | $ | 0.53 | ||||
|
3/31/14
|
$ | 1.90 | $ | 0.59 | ||||
|
6/30/14
|
$ | 1.72 | $ | 0.98 | ||||
|
9/30/14
|
$ | 1.30 | $ | 0.75 | ||||
Holders of common stock are entitled to receive dividends as may be declared by the Board of Directors out of legally available funds and, in the event of liquidation, to share pro rata in any distribution of CEL-SCI’s assets after payment of liabilities. The Board of Directors is not obligated to declare a dividend. CEL-SCI has not paid any dividends on its common stock and CEL-SCI does not have any current plans to pay any common stock dividends.
The provisions in CEL-SCI’s Articles of Incorporation relating to CEL-SCI’s preferred stock allow CEL-SCI’s directors to issue preferred stock with rights to multiple votes per share and dividend rights which would have priority over any dividends paid with respect to CEL-SCI’s common stock. The issuance of preferred stock with such rights may make more difficult the removal of management even if such removal would be considered beneficial to shareholders generally, and will have the effect of limiting shareholder participation in certain transactions such as mergers or tender offers if such transactions are not favored by incumbent management.
The market price of CEL-SCI’s common stock, as well as the securities of other biopharmaceutical and biotechnology companies, have historically been highly volatile, and the market has from time to time experienced significant price and volume fluctuations that are unrelated to the operating performance of particular companies. Factors such as fluctuations in CEL-SCI’s operating results, announcements of technological innovations or new therapeutic products by CEL-SCI or its competitors, governmental regulation, developments in patent or other proprietary rights, public concern as to the safety of products developed by CEL-SCI or other biotechnology and pharmaceutical companies, and general market conditions may have a significant effect on the market price of CEL-SCI’s common stock.
The graph below matches the cumulative 5-year total return of holders of CEL-SCI’s common stock with the cumulative total returns of the NYSE MTK Composite index and the RDG MicroCap Biotechnology index. The graph assumes that the value of an investment in CEL-SCI's common stock and in each of the indexes (including reinvestment of dividends) was $100 on September 30, 2009 and tracks it through September 30, 2014.
20
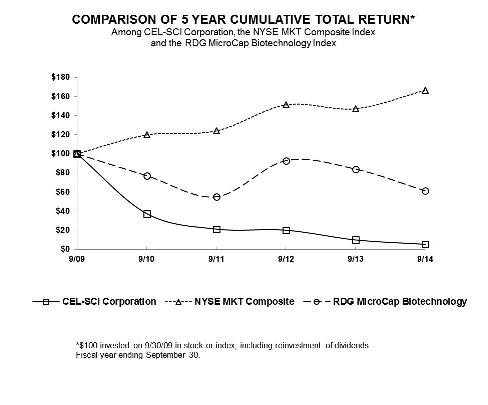
| 9/09 | 9/10 | 9/11 | 9/12 | 9/13 | 9/14 | |||||||||||||||||||
|
CEL-SCI Corporation
|
100.00 | 37.44 | 21.22 | 20.06 | 9.88 | 5.30 | ||||||||||||||||||
|
NYSE MKT Composite
|
100.00 | 119.74 | 123.95 | 151.16 | 147.16 | 166.46 | ||||||||||||||||||
|
RDG MicroCap Biotechnology
|
100.00 | 77.22 | 55.21 | 92.86 | 84.06 | 61.43 | ||||||||||||||||||
The stock price performance included in this graph is not necessarily indicative of future stock price performance.
The following selected historical consolidated financial data are qualified by reference to, and should be read in conjunction with the consolidated financial statements and the related notes thereto, appearing elsewhere in this report, as well as Item 7 of this report.
21
|
|
2014
|
2013
|
2012
|
2011
|
2010
|
|||||||||||||||
|
Grant income and other
|
$ | 264,033 | $ | 159,583 | $ | 254,610 | $ | 956,154 | $ | 153,300 | ||||||||||
|
Operating expenses:
|
||||||||||||||||||||
|
Research and development
|
17,000,145 | 12,681,049 | 10,368,695 | 11,745,629 | 11,911,626 | |||||||||||||||
|
Depreciation and
Amortization
|
231,752 | 364,124 | 533,468 | 531,316 | 516,117 | |||||||||||||||
|
General and administrative
|
10,606,248 | 6,982,686 | 6,595,287 | 6,664,883 | 6,285,810 | |||||||||||||||
|
Gain on derivative instruments
|
248,767 | 10,750,666 | 1,911,683 | 4,432,148 | 28,843,772 | |||||||||||||||
|
Other expenses (3)
|
- | - | - | (12,000,000 | ) | - | ||||||||||||||
|
Interest income
|
122,854 | 117,086 | 116,061 | 164,163 | 362,236 | |||||||||||||||
|
Interest expense
|
(163,774 | ) | (170,423 | ) | (262,214 | ) | (322,980 | ) | (162,326 | ) | ||||||||||
|
Net income (loss)
|
(27,366,265 | ) | (9,170,947 | ) | (15,477,310 | ) | (25,712,343 | ) | 10,483,429 | |||||||||||
|
Issuance of additional shares due to reset provision
|
(1,117,447 | ) | - | (250,000 | ) | - | - | |||||||||||||
|
Modification of warrants
|
- | (59,531 | ) | (325,620 | ) | (1,068,369 | ) | (1,532,456 | ) | |||||||||||
|
Inducement warrants
|
- | - | (1,593,000 | ) | - | - | ||||||||||||||
|
Net income (loss) available to common shareholders
|
$ | (28,483,712 | ) | $ | (9,230,478 | ) | $ | (17,645,930 | ) | $ | (26,780,712 | ) | $ | 8,950,973 | ||||||
|
Net income (loss) per common share
|
||||||||||||||||||||
|
Basic
|
$ | (0.48 | ) | $ | (0.30 | ) | $ | (0.70 | ) | $ | (1.28 | ) | $ | 0.44 | ||||||
|
Diluted
|
$ | (0.49 | ) | $ | (0.66 | ) | $ | (0.78 | ) | $ | (1.49 | ) | $ | (0.55 | ) | |||||
|
Weighted average common
shares outstanding
|
||||||||||||||||||||
|
Basic and Diluted (1)
|
58,804,622 | 30,279,442 | 25,183,654 | 20,848,899 | 20,210,286 | |||||||||||||||
|
|
2014
|
2013
|
2012
|
2011
|
2010
|
|||||||||||||||
|
Working capital (deficit)
|
$ | 8,496,076 | $ | (1,033,370 | ) | $ | 5,529,438 | $ | 1,796,349 | $ | 25,799,304 | |||||||||
|
Total assets
|
$ | 19,230,434 | $ | 10,838,572 | $ | 16,067,450 | $ | 18,625,440 | $ | 37,804,985 | ||||||||||
|
Convertible note and derivative instruments - current (2)
|
$ | 18,105 | - | - | $ | 5,068,552 | $ | 424,286 | ||||||||||||
|
Derivative instruments –
noncurrent (2)
|
$ | 5,487,141 | $ | 433,024 | $ | 6,983,690 | $ | 2,192,521 | $ | 6,521,765 | ||||||||||
|
Total liabilities
|
$ | 8,787,034 | $ | 4,138,482 | $ | 9,040,018 | $ | 9,546,616 | $ | 9,950,220 | ||||||||||
|
Stockholders' equity
|
$ | 10,443,400 | $ | 6,700,090 | $ | 7,027,432 | $ | 9,078,824 | $ | 27,854,765 | ||||||||||
| (1) | The calculation of diluted earnings per share for the years ended September 30, 2014, 2013, 2012, and 2011excluded potentially dilutive shares because their effect would have been anti-dilutive. |
| (2) | Included in total liabilities. |
| (3) | The $12 million other expense in 2011 was the cost of the lawsuit settlement. The detailed terms of the lawsuit settlement and the related agreements and documents were filed as exhibits to CEL-SCI’s report on Form 10-Q for the three months ended March 31, 2011 . |
22
CEL-SCI's net loss available to common shareholders for each fiscal quarter during the two years ended September 30, 2014 were:
| Net loss per share | ||||||||||||
|
Quarter
|
Net loss | Basic | Diluted | |||||||||
|
12/31/2013
|
$ | (5,451,865 | ) | $ | (0.11 | ) | $ | (0.15 | ) | |||
|
3/31/2014
|
$ | (13,365,580 | ) | $ | (0.24 | ) | $ | (0.24 | ) | |||
|
6/30/2014
|
$ | (2,444,480 | ) | $ | (0.04 | ) | $ | (0.11 | ) | |||
|
9/30/2014
|
$ | (7,221,787 | ) | $ | (0.11 | ) | $ | (0.13 | ) | |||
|
12/31/2012
|
$ | (2,310,246 | ) | $ | (0.08 | ) | $ | (0.18 | ) | |||
|
3/31/2013
|
$ | (713,371 | ) | $ | (0.02 | ) | $ | (0.14 | ) | |||
|
6/30/2013
|
$ | (4,507,004 | ) | $ | (0.15 | ) | $ | (0.18 | ) | |||
|
9/30/2013
|
$ | (1,699,857 | ) | $ | (0.05 | ) | $ | (0.16 | ) | |||
Variances in quarterly gains and losses for the quarters presented are caused by the changes in the fair value outstanding warrants accounted for as derivatives each quarter. These changes in the fair value of the convertible debt and warrants are recorded on the statements of operations.
ITEM 7.
MANAGEMENT'S DISCUSSION AND ANALYSIS OF FINANCIAL CONDITION AND RESULTS OF OPERATIONS
The following discussion should be read in conjunction with the consolidated financial statements and the related notes thereto appearing elsewhere in this report.
CEL-SCI’s lead investigational therapy, Multikine, is cleared for a Phase III clinical trial in advanced primary head and neck cancer. It has received a go-ahead by the US FDA as well as eight other countries.
CEL-SCI also owns and is developing a pre-clinical technology called LEAPS (Ligand Epitope Antigen Presentation System).
All of CEL-SCI’s projects are under development. As a result, CEL-SCI cannot predict when it will be able to generate any revenue from the sale of any of its products.
Since inception, CEL-SCI has financed its operations through the issuance of equity securities, convertible notes, loans and certain research grants. CEL-SCI’s expenses will likely exceed its revenues as it continues the development of Multikine and brings other drug candidates into clinical trials. Until such time as CEL-SCI becomes profitable, any or all of these financing vehicles or others may be utilized to assist CEL-SCI’s capital requirements.
Results of Operations
Fiscal 2014
During the year ended September 30, 2014, grant and other income increased by $104,450 compared to the year ended September 30, 2013. The increase is primarily due to the timing of drug shipments to supply the Company’s partner in Taiwan during fiscal year 2014 compared to fiscal year 2013.
23
During the year ended September 30, 2014, research and development expenses increased by $4,319,096 compared to the year ended September 30, 2013. CEL-SCI is continuing the Phase III clinical trial and research and development fluctuates based on the activity level of the clinical trial. In fiscal year 2014, CEL-SCI received clearance from seven new countries for the Phase III trial, added approximately thirty sites and set multiple record breaking months for enrolling patients.
During the year ended September 30, 2014, general and administrative expenses increased by $3,623,562, compared to the year ended September 30, 2013. This increase is primarily due to $1,477,954 of equity based compensation costs for restricted stock issued, increased public relations costs of $443,596 and legal fees of $1,668,780. Public relations costs increased to support the progression of the products through clinical trials. Legal fees increased primarily as a result of arbitration with the Company’s former CRO, as discussed in Item 3 above.
During the year ended September 30, 2014, CEL-SCI recorded a derivative gain of $248,767. For the year ended September 30, 2013, CEL-SCI recorded a derivative gain of $10,750,666. This variation was the result of the change in fair value of the derivative liabilities during the period which was caused by fluctuations in the share price of CEL-SCI’s common stock.
Interest expense decreased $6,649 during the year ended September 30, 2014 compared to the year ended September 30, 2013, and consisted primarily of interest expense on the loan from CEL-SCI’s president of $165,609 and interest on a capital lease.
Fiscal 2013
During the year ended September 30, 2013, grant and other income decreased by $95,027 compared to the year ended September 30, 2012. The decrease is primarily due to the timing of drug shipments to supply the Company’s partner in Taiwan during fiscal year 2013. Shipment of drug was made in October 2013 to resupply the partner.
During the year ended September 30, 2013, research and development expenses increased by $2,312,354 compared to the year ended September 30, 2012. CEL-SCI is continuing the Phase III clinical trial and research and development fluctuates based on the activity level of the clinical trial.
During the year ended September 30, 2013, general and administrative expenses increased by $387,399, compared to the year ended September 30, 2012. This increase is primarily due to the increased cost of employee options.
During the year ended September 30, 2013, CEL-SCI recorded a derivative gain of $10,750,666. For the year ended September 30, 2012, CEL-SCI recorded a derivative gain of $1,911,683. This variation was the result of the change in fair value of the derivative liabilities during the period which was caused by fluctuations in the share price of CEL-SCI’s common stock.
24
Interest expense was $170,423 during the year ended September 30, 2013, and consisted primarily of interest expense on the loan from CEL-SCI’s president of $165,609 and interest on a capital lease. Interest expense was $262,214 for the year ended September 30, 2012 and consisted of interest expense on the loan from CEL-SCI’s president of $165,609 and interest on the convertible notes of $96,605.
Research and Development Expenses
During the five years ended September 30, 2014 CEL-SCI’s research and development efforts involved Multikine and LEAPS. The table below shows the research and development expenses associated with each project during this five-year period.
| 2014 | 2013 | 2012 | 2011 | 2010 | ||||||||||||||||
|
MULTIKINE
|
$ | 16,625,367 | $ | 12,303,564 | $ | 9,977,617 | $ | 11,257,157 | $ | 10,868,046 | ||||||||||
|
LEAPS
|
374,778 | 377,485 | 391,078 | 488,472 | 1,043,580 | |||||||||||||||
|
TOTAL
|
$ | 17,000,145 | $ | 12,681,049 | $ | 10,368,695 | $ | 11,745,629 | $ | 11,911,626 | ||||||||||
In January 2007, CEL-SCI received a “no objection” letter from the FDA indicating that it could proceed with Phase III trials with Multikine in head and neck cancer patients. CEL-SCI had previously received a “no objection” letter from the Canadian Biologics and Genetic Therapies Directorate which enabled CEL-SCI to begin its Phase III clinical trial in Canada. Subsequently, CEL-SCI received similar authorizations from sixteen other regulators.
CEL-SCI’s Phase III clinical trial began in December 2010 after the completion and validation of CEL-SCI’s dedicated manufacturing facility.
As explained in Item 1 of this report, as of November 30, 2014, CEL-SCI was involved in pre-clinical studies with respect to its LEAPS technology. As with Multikine, CEL-SCI does not know what obstacles it will encounter in future pre-clinical and clinical studies involving its LEAPS technology. Consequently, CEL-SCI cannot predict with any certainty the funds required for future research and clinical trials and the timing of future research and development projects.
Clinical and other studies necessary to obtain regulatory approval of a new drug involve significant costs and require several years to complete. The extent of CEL-SCI’s clinical trials and research programs are primarily based upon the amount of capital available to CEL-SCI and the extent to which CEL-SCI has received regulatory approvals for clinical trials. The inability of CEL-SCI to conduct clinical trials or research, whether due to a lack of capital or regulatory approval, will prevent CEL-SCI from completing the studies and research required to obtain regulatory approval for any products which CEL-SCI is developing. Without regulatory approval, CEL-SCI will be unable to sell any of its products.
25
Liquidity and Capital Resources
CEL-SCI has had only limited revenues from operations since its inception in March 1983. CEL-SCI has relied upon capital generated from the public and private offerings of its common stock and convertible notes. In addition, CEL-SCI has utilized short-term loans to meet its capital requirements. Capital raised by CEL-SCI has been expended primarily to acquire an exclusive worldwide license to use, and later purchase, certain patented and unpatented proprietary technology and know-how relating to the human immunological defense system. Capital has also been used for patent applications, debt repayment, research and development, administrative costs, and the construction of CEL-SCI’s laboratory facilities. CEL-SCI does not anticipate realizing significant revenues until it enters into licensing arrangements regarding its technology and know-how or until it receives regulatory approval to sell its products (which could take a number of years). As a result, CEL-SCI has been dependent upon the proceeds from the sale of its securities to meet all of its liquidity and capital requirements and anticipates having to do so in the future. During fiscal year 2014 and 2013, CEL-SCI raised net proceeds of approximately $31,500,000 and $9,800,000, respectively, through the sale of stock and exercise of outstanding warrants. On October 24, 2014, CEL-SCI raised net proceeds of approximately $6,400,000 through the sale of stock and warrants in a public offering and in a registered direct offering.
CEL-SCI will be required to raise additional capital or find additional long-term financing in order to continue with its research efforts. The ability of CEL-SCI to complete the necessary clinical trials and obtain FDA approval for the sale of products to be developed on a commercial basis is uncertain. Ultimately, CEL-SCI must complete the development of its products, obtain the appropriate regulatory approvals and obtain sufficient revenues to support its cost structure. CEL-SCI believes that it has enough capital to support its operations for more than the next twelve months.
CEL-SCI estimates the total cash cost of the Phase III trial, with the exception of the parts that will be paid by its licensees, Teva Pharmaceuticals and Orient Europharma, to be approximately $28.2 million going forward.
In August 2007, CEL-SCI leased a building near Baltimore, Maryland. The building, which consists of approximately 73,000 square feet, has been remodeled in accordance with CEL-SCI’s specifications so that it can be used by CEL-SCI to manufacture Multikine for CEL-SCI’s Phase III clinical trials and sales of the drug if approved by the FDA. The lease expires on October 31, 2028, and required annual base rent payments of approximately $1,544,000 during the twelve months ended September 30, 2014. See Item 2 of this report for more information concerning the terms of this lease.
In August 2008, CEL-SCI sold 138,339 shares of common stock and 207,508 Series N warrants in a private financing for $1,037,500. In June 2009, an additional 116,667 shares and 181,570 Series N warrants were issued to the investors. In October 2011, an additional 83,333 shares and 129,693 Series N warrants were issued to the investors. In October 2013, an additional 764,602 shares and 1,189,961 Series N warrants were issued to the investors. In December 2013, an additional 798,481 shares and 1,242,688 Series N warrants were issued to the investors. The additional shares and warrants were issued due to a reset provision included in the private financing. In January 2014, CEL-SCI offered to the investors to extend the Series N warrants by one year and allow for cashless exercise in exchange for cancelling the reset provision in the warrant agreement. One of the investors accepted this offer. As of September 30, 2014, 106,793 Series N Warrants had been exercised. The remaining 2,844,627 Series N warrants entitle the holders to purchase one share of CEL-SCI's common stock at a price of $0.52731 per share at any time prior to August 18, 2015. On October 28, 2014, the remaining Series N warrants were transferred to the de Clara Trust, of which the Company’s CEO, Geert Kersten, is the Trustee and a beneficiary.
26
Between June 23 and July 8, 2009, CEL-SCI sold 1,534,935 shares of its common stock at a price of $4.00 per share totaling $6,139,739. The investors in this offering also received 1,028,406 Series A warrants which may be exercised at any time prior to December 24, 2014. As of September 30, 2014, 881,309 Series A warrants had been exercised. At September 30, 2014, the remaining Series A warrants entitle the holders to purchase 147,097 shares of CEL-SCI's common stock at a price of $5.00 per share.
Between December 2008 and June 2009, Maximilian de Clara, CEL-SCI’s President and a director, loaned CEL-SCI $1,104,057 under a note payable. In June 2009, CEL-SCI issued Mr. de Clara warrants which entitles Mr. de Clara to purchase 164,824 shares of CEL-SCI’s common stock at a price of $4.00 per share. The warrants are exercisable at any time prior to December 24, 2014. CEL-SCI then negotiated a second extension of the note with Mr. de Clara on terms similar to the first extension. Pursuant to the terms of the second extension the note was extended to July 6, 2014, but, at Mr. de Clara’s option, the loan can be converted into shares of CEL-SCI’s common stock. The number of shares which will be issued upon any conversion will be determined by dividing the amount to be converted by $4.00. As further consideration for the second extension, Mr. de Clara received warrants which to purchase 184,930 shares of CEL-SCI’s common stock at a price of $5.00 per share at any time prior to January 6, 2015. On May 13, 2011, to recognize Mr. de Clara’s willingness to agree to subordinate his note to convertible preferred shares and convertible debt, CEL-SCI extended the maturity date of the note to July 6, 2015. The note from Mr. de Clara bears interest at 15% per year and is secured by a lien on substantially all of CEL-SCI’s assets. CEL-SCI does not have the right to prepay the note without Mr. de Clara’s consent. As of September 30, 2014, none of the warrants issued to Mr. de Clara had been exercised. In August 2014, the loan and warrants were transferred to the de Clara Trust, of which the Company’s CEO, Geert Kersten, is the Trustee and a beneficiary. Mr. de Clara will continue to receive the interest payments.
On August 20, 2009, CEL-SCI sold 1,078,444 shares of its common stock to a group of private investors for $4,852,995 or $4.50 per share. The investors also received 539,220 Series C warrants which may be exercised at any time prior to February 20, 2015. As of September 30, 2014, 75,733 Series C warrants had been exercised. At September 30, 2014, the remaining Series C warrants entitle the holders to purchase 463,487 shares of CEL-SCI's common stock at a price of $5.50 per share and may be exercised any time prior to February 20, 2015.
On January 25, 2012, CEL-SCI sold 1,600,000 shares of its common stock to institutional investors for $5,760,000 or $3.60 per share. The investors also received Series H warrants which may be exercised at any time prior to August 1, 2015. The Series H warrants entitle the holders to purchase 1,200,000 shares of CEL-SCI's common stock at a price of $5.00 per share. As of September 30, 2014, none of the Series H Warrants had been exercised.
27
In February 2012, CEL-SCI received $1,475,000 as a result of the exercise of the remaining Series O warrants. The Series O warrants were exercisable at any time on or prior to March 6, 2016. As an inducement for the early exercise of the Series O warrants, CEL-SCI issued Series P warrants to the former holder of the Series O warrants. The Series P warrants are exercisable at any time prior to March 7, 2017. The Series P warrants entitle the holders to purchase 590,001 shares of CEL-SCI's common stock at a price of $4.50 per share. As of September 30, 2014, none of the Series P Warrants had been exercised.
In June 2012, CEL-SCI sold 1,600,000 shares of its common stock for $5,600,000, or $3.50 per share, in a registered direct offering. The investors in this offering also received Series Q warrants which may be exercised at any time on or before December 22, 2015. The Series Q warrants entitle the holders to purchase 1,200,000 shares of CEL-SCI's common stock at a price of $5.00 per share. As of September 30, 2014, none of the Series Q Warrants had been exercised.
In December 2012, CEL-SCI sold 3,500,000 shares of its common stock to institutional investors for $10,500,000 or $3.00 per share. The investors also received Series R warrants which may be exercised at any time prior to December 7, 2016. The Series R warrants entitle the holders to purchase 2,625,000 shares of CEL-SCI's common stock at a price of $4.00 per share. As of September 30, 2014, none of the Series R Warrants had been exercised.
In October 2013, CEL-SCI sold 17,826,087 shares of its common stock, plus 20,475,000 Series S warrants, in an underwritten offering. The net proceeds to CEL-SCI from the sale of the shares and warrants were approximately $16,424,000, after deducting the underwriting discount. The Series S warrants may be exercised at any time on or before October 11, 2018 at a price of $1.25 per share.
In December 2013, CEL-SCI sold 5,238,095 shares of its common stock and Series S warrants, in an underwritten offering. The net proceeds to CEL-SCI from the sale of the shares and Series S warrants were approximately $2,710,000, after deducting the underwriting discount. The Series S warrants may be exercised at any time on or before October 11, 2018 at a price of $1.25 per share.
In February 2014, the S warrants issued in connection with the public offerings in October and December 2013 began trading on the NYSE MKT under the ticker symbol “CVM WS”. As of September 30, 2014, 2,088,769 Series S Warrants had been exercised. The remaining 23,624,326 Series S warrants entitle the holders to purchase one share of CEL-SCI's common stock at a price of $1.25 per share.
In April 2014, CEL-SCI sold 7,128,229 shares of common stock, plus 1,782,057 Series T warrants, in an underwritten offering. The net proceeds to CEL-SCI from the sale of the stock and warrants were approximately $9.23 million. The Series T warrants may be exercised at any time on or before October 17, 2014 at a price of $1.58 per share. As of September 30, 2014, none of the Series T Warrants had been exercised. On October 17, 2014, all of the Series T warrants expired. CEL-SCI issued 445,514 Series U warrants to the underwriters for this offering. The Series U warrants may be exercised beginning October 17, 2014 at a price of $1.75 per share and expire on October 17, 2017. As of September 30, 2014, none of the Series U warrants had been exercised.
28
In October 2014, CEL-SCI sold 7,894,737 shares of common stock, plus 1,973,684 Series S warrants in an underwritten public offering. The net proceeds to CEL-SCI from the sale of the stock and warrants were approximately $5.5 million. The warrants are immediately exercisable, expire October 11, 2018 and have an exercise price of $1.25.
Additionally, in October 2014, CEL-SCI sold 1,320,000 shares of common stock, plus 330,000 Series S warrants in a registered direct offering. The net proceeds to CEL-SCI from the sale of the stock and warrants were approximately $928,000. The warrants are immediately exercisable, expire October 11, 2018 and have an exercise price of $1.25.
Inventory increased by $435,392 at September 30, 2014 as compared to September 30, 2013, due to the timing of supplies purchased and used in the manufacturing of Multikine for the Phase III trial. In addition, prepaid expenses increased by approximately $127,000. The increase was primarily due to: (1) the Company acquiring additional insurance coverage for its Phase III trial as a result of the study expanding into several new countries during fiscal year 2014, and (2) the timing of ordering certain supplies used in the manufacturing of Multikine that requires an advanced payment.
During the year ended September 30, 2014, CEL-SCI’s cash increased by $8,472,008. Significant components of this increase include $31,547,028 in proceeds from the sale of stock and exercise of warrants; offset by: 1) net cash used in operating activities of $22,928,019, 2) expenditures for equipment and patents of $138,864, and 3) the repayment of $8,137 in capital lease obligations.
Future Capital Requirements
Other than funding operating losses, funding its research and development program, and making required lease payments, CEL-SCI does not have any material capital commitments. Material contractual obligations as of September 30, 2014 are as follows:
|
Years Ending September 30,
|
||||||||||||||||||||||||||||
|
Total
|
2015
|
2016
|
2017
|
2018
|
2019
|
2020 & thereafter
|
||||||||||||||||||||||
|
Operating Leases
|
$ | 28,427,429 | $ | 1,785,873 | $ | 1,769,497 | $ | 1,746,328 | $ | 1,746,802 | $ | 1,808,302 | $ | 19,570,627 | ||||||||||||||
|
Related Party Note & Interest
|
1,228,263 | 1,228,263 | - | - | - | - | - | |||||||||||||||||||||
|
Total Contractual Obligations
|
$ | 29,655,692 | $ | 3,014,136 | $ | 1,769,497 | $ | 1,746,328 | $ | 1,746,802 | $ | 1,808,302 | $ | 19,570,627 | ||||||||||||||
For information on employment contracts, see Item 11 of this report.
Further, CEL-SCI has contingent obligations with vendors for work that will be completed in relation to the Phase III trial. The timing of these obligations cannot be determined at this time. The estimated remaining cash cost of these obligations for the Phase III trial is approximately $28,200,000.
29
CEL-SCI will need to raise additional funds, either through the exercise of the outstanding warrants/options, through a debt or equity financing or a partnering arrangement, to complete the Phase III trial and bring Multikine to market. If CEL-SCI is able to raise additional funds, then CEL-SCI believes that it has enough capital to support its operations for more than the next twelve months. If CEL-SCI cannot raise the needed funds, the Company may have to end the Phase III clinical trial before its completion.
Clinical and other studies necessary to obtain regulatory approval of a new drug involve significant costs and require several years to complete. The extent of CEL-SCI’s clinical trials and research programs are primarily based upon the amount of capital available to CEL-SCI and the extent to which CEL-SCI has received regulatory approvals for clinical trials. The inability of CEL-SCI to conduct clinical trials or research, whether due to a lack of capital or regulatory approval, will prevent CEL-SCI from completing the studies and research required to obtain regulatory approval for any products which CEL-SCI is developing. Without regulatory approval, CEL-SCI will be unable to sell any of its products.
In the absence of revenues, CEL-SCI will be required to raise additional funds through the sale of securities, debt financing or other arrangements in order to continue with its research efforts. However, there can be no assurance that such financing will be available or be available on favorable terms. Ultimately, CEL-SCI must complete the development of its products, obtain appropriate regulatory approvals and obtain sufficient revenues to support its cost structure.
Since all of CEL-SCI’s projects are under development, CEL-SCI cannot predict with any certainty the funds required for future research and clinical trials, the timing of future research and development projects, or when it will be able to generate any revenue from the sale of any of its products.
CEL-SCI's cash flow and earnings are subject to fluctuations due to changes in interest rates on its bank accounts, and, to an immaterial extent, foreign currency exchange rates.
Critical Accounting Policies
CEL-SCI's significant accounting policies are more fully described in Note 1 to the consolidated financial statements included as part of this report. However, certain accounting policies are particularly important to the portrayal of financial position and results of operations and require the application of significant judgments by management. As a result, the consolidated financial statements are subject to an inherent degree of uncertainty. In applying those policies, management uses its judgment to determine the appropriate assumptions to be used in the determination of certain estimates. These estimates are based on CEL-SCI's historical experience, terms of existing contracts, observance of trends in the industry and information available from outside sources, as appropriate. CEL-SCI’s significant accounting policies include:
30
Patents
- Patent expenditures are capitalized and amortized using the straight-line method over 17 years. In the event changes in technology or other circumstances impair the value or life of the patent, appropriate adjustment in the asset value and period of amortization is made. An impairment loss is recognized when estimated future undiscounted cash flows expected to result from the use of the asset, and from disposition, is less than the carrying value of the asset. The amount of the impairment loss is the difference between the estimated fair value of the asset and its carrying value.
Stock Options and Warrants
– Compensation cost for all stock-based awards after October 1, 2005 is measured at fair value as of the grant date in accordance with the provisions of ASC 718. The fair value of the stock options is calculated using the Black-Scholes option pricing model. The Black-Scholes model requires various judgmental assumptions including volatility, forfeiture rates and expected option life. The stock-based compensation cost is recognized on the accelerated method as expense over the requisite service or vesting period.
Options to non-employees are accounted for in accordance with ASC 505-50, “
Equity-Based Payments to Non-Employees
.” Accordingly, compensation cost is recognized when goods or services are received and is measured using the Black-Scholes valuation model. The Black-Scholes model requires CEL-SCI’s management to make assumptions regarding the fair value of the options at the date of grant and the expected life of the options.
Asset Valuations and Review for Potential Impairments
- CEL-SCI reviews its fixed assets, intangibles and deferred rent every fiscal quarter. This review requires that CEL-SCI make assumptions regarding the value of these assets and the changes in circumstances that would affect the carrying value of these assets. If such analysis indicates that a possible impairment may exist, CEL-SCI is then required to estimate the fair value of the asset and, as deemed appropriate, expense all or a portion of the asset. The determination of fair value includes numerous uncertainties, such as the impact of competition on future value. CEL-SCI believes that it has made reasonable estimates and judgments in determining whether its long-lived assets have been impaired; however, if there is a material change in the assumptions used in its determination of fair values or if there is a material change in economic conditions or circumstances influencing fair value, CEL-SCI could be required to recognize certain impairment charges in the future. As a result of the reviews, no changes in asset values were required.
Prepaid Expenses and Inventory
-- Prepaid expenses are payments for future services to be rendered and are expensed over the time period for which the service is rendered. Prepaid expenses may also include payment for goods to be received within one year of the payment date. Inventory consists of bulk purchases of laboratory supplies to be consumed in the manufacturing of CEL-SCI’s product for clinical studies and for quality control and bioassay use. Inventories are stated at the lower of cost or market, where cost is determined using the first-in, first out method applied on a consistent basis.
Derivative Instruments—
CEL-SCI enters into financing arrangements that consist of freestanding derivative instruments or hybrid instruments that contain embedded derivative features. CEL-SCI accounts for these arrangement in accordance with ASC 815, “
Accounting for Derivative Instruments and Hedging Activities
, as well as related interpretations of these standards. In accordance with accounting principles generally accepted in the United States (“GAAP”), derivative instruments and hybrid instruments are recognized as either assets or liabilities in the statement of financial position and are measured at fair value with gains or losses recognized in earnings or other comprehensive income depending on the nature of the derivative or hybrid instruments. Embedded derivatives that are not clearly and closely related to the host contract are bifurcated and recognized at fair value with changes in fair value recognized as either a gain or loss in earnings if they can be reliably measured. When the fair value of embedded derivative features cannot be reliably measured, CEL-SCI measures and reports the entire hybrid instrument at fair value with changes in fair value recognized as either a gain or loss in earnings. CEL-SCI determines the fair value of derivative instruments and hybrid instruments based on available market data using appropriate valuation models, giving consideration to all of the rights and obligations of each instrument and precluding the use of “blockage” discounts or premiums in determining the fair value of a large block of financial instruments. Fair value under these conditions does not necessarily represent fair value determined using valuation standards that give consideration to blockage discounts and other factors that may be considered by market participants in establishing fair value.
31
ITEM 7A.
QUANTITATIVE AND QUALITATIVE DISCLOSURE ABOUT MARKET RISKS
Market risk is the potential change in an instrument's value caused by, for example, fluctuations in interest and currency exchange rates. CEL-SCI enters into financing arrangements that are or include freestanding derivative instruments or that are, or include, hybrid instruments that contain embedded derivative features. CEL-SCI does not enter into derivative instruments for trading purposes. Additional information is presented in the notes to consolidated financial statements. The fair value of these instruments is affected primarily by volatility of the trading prices of CEL-SCI’s common stock. For three years ended September 30, 2014, CEL-SCI recognized a gain of $248,767, $10,750,666, and $1,911,683, respectively, resulting from changes in fair value of derivative instruments. CEL-SCI has exposure to risks associated with foreign exchange rate changes because some of the expenses related to the Phase III trial are transacted in a foreign currency. The interest risk on investments on September 30, 2014 was considered immaterial due to the fact that the interest rates at that time were nominal at best and CEL-SCI keeps its cash and cash equivalents in short term maturities.
See the financial statements included with this Report.
ITEM 9.
CHANGES IN AND DISAGREEMENTS WITH ACCOUNTANTS ON ACCOUNTING AND FINANCIAL DISCLOSURE
Not applicable
Under the direction and with the participation of CEL-SCI’s management, including CEL-SCI’s Chief Executive Officer and Chief Financial Officer, CEL-SCI carried out an evaluation of the effectiveness of the design and operation of its disclosure controls and procedures as of September 30, 2014. CEL-SCI maintains disclosure controls and procedures that are designed to ensure that information required to be disclosed in its periodic reports with the Securities and Exchange Commission is recorded, processed, summarized and reported within the time periods specified in the SEC’s rules and regulations, and that such information is accumulated and communicated to CEL-SCI’s management, including its principal executive officer and principal financial officer, as appropriate, to allow timely decisions regarding required disclosure. CEL-SCI’s disclosure controls and procedures are designed to provide a reasonable level of assurance of reaching its desired disclosure control objectives. Based on the evaluation, the Chief Executive and Principal Financial Officer has concluded that CEL-SCI’s disclosure controls were effective as of September 30, 2014.
32
Management’s Report on Internal Control Over Financial Reporting
CEL-SCI’s management is responsible for establishing and maintaining adequate internal control over financial reporting and for the assessment of the effectiveness of internal control over financial reporting. As defined by the Securities and Exchange Commission, internal control over financial reporting is a process designed by, or under the supervision of CEL-SCI’s principal executive officer and principal financial officer and implemented by CEL-SCI’s Board of Directors, management and other personnel, to provide reasonable assurance regarding the reliability of financial reporting and the preparation of CEL-SCI’s financial statements in accordance with U.S. generally accepted accounting principles.
Because of its inherent limitations, internal control over financial reporting may not prevent or detect misstatements. Also, projections of any evaluation of effectiveness to future periods are subject to the risk that controls may become inadequate because of changes in conditions, or that the degree of compliance with the policies or procedures may deteriorate.
Geert Kersten, CEL-SCI’s Chief Executive and Principal Financial Officer, evaluated the effectiveness of CEL-SCI’s internal control over financial reporting as of September 30, 2014 based on criteria established in Internal Control - Integrated Framework (1992) issued by the Committee of Sponsoring Organizations of the Treadway Commission, or the COSO Framework. Management’s assessment included an evaluation of the design of CEL-SCI’s internal control over financial reporting and testing of the operational effectiveness of those controls.
Based on this evaluation, Mr. Kersten concluded that CEL-SCI’s internal control over financial reporting was effective as of September 30, 2014.
There was no change in CEL-SCI’s internal control over financial reporting that occurred during the fiscal year ended September 30, 2014 that has materially affected, or is reasonably likely to materially affect, CEL-SCI’s internal control over financial reporting.
CEL-SCI’s independent registered public accounting firm BDO USA, LLP has issued an attestation report on CEL-SCI’s internal control over financial reporting.
33
Report of Independent Registered Public Accounting Firm
Board of Directors and Stockholders
CEL-SCI Corporation
Vienna, VA
We have audited CEL-SCI Corporation’s internal control over financial reporting as of September 30, 2014, based on criteria established in
Internal Control – Integrated Framework
(1992)
issued by the Committee of Sponsoring Organizations of the Treadway Commission (the COSO criteria). CEL SCI Corporation’s management is responsible for maintaining effective internal control over financial reporting and for its assessment of the effectiveness of internal control over financial reporting, included in the accompanying “Item 9A, Management’s Report on Internal Control Over Financial Reporting”. Our responsibility is to express an opinion on the company’s internal control over financial reporting based on our audit.
We conducted our audit in accordance with the standards of the Public Company Accounting Oversight Board (United States). Those standards require that we plan and perform the audit to obtain reasonable assurance about whether effective internal control over financial reporting was maintained in all material respects. Our audit included obtaining an understanding of internal control over financial reporting, assessing the risk that a material weakness exists, and testing and evaluating the design and operating effectiveness of internal control based on the assessed risk. Our audit also included performing such other procedures as we considered necessary in the circumstances. We believe that our audit provides a reasonable basis for our opinion.
A company’s internal control over financial reporting is a process designed to provide reasonable assurance regarding the reliability of financial reporting and the preparation of financial statements for external purposes in accordance with generally accepted accounting principles. A company’s internal control over financial reporting includes those policies and procedures that (1) pertain to the maintenance of records that, in reasonable detail, accurately and fairly reflect the transactions and dispositions of the assets of the company; (2) provide reasonable assurance that transactions are recorded as necessary to permit preparation of financial statements in accordance with generally accepted accounting principles, and that receipts and expenditures of the company are being made only in accordance with authorizations of management and directors of the company; and (3) provide reasonable assurance regarding prevention or timely detection of unauthorized acquisition, use, or disposition of the company’s assets that could have a material effect on the financial statements.
Because of its inherent limitations, internal control over financial reporting may not prevent or detect misstatements. Also, projections of any evaluation of effectiveness to future periods are subject to the risk that controls may become inadequate because of changes in conditions, or that the degree of compliance with the policies or procedures may deteriorate.
In our opinion, CEL-SCI Corporation maintained, in all material respects, effective internal control over financial reporting as of September 30, 2014, based on the COSO criteria
.
We also have audited, in accordance with the standards of the Public Company Accounting Oversight Board (United States), the balance sheets of CEL-SCI Corporation as of September 30, 2014 and 2013, and the related statements of operations, stockholders’ equity, and cash flows for each of the three years in the period ended September 30, 2014 and our report dated December 23, 2014 expressed an unqualified opinion thereon.
/s/BDO USA, LLP
Bethesda, Maryland
December 23, 2014
34
None.
Officers and Directors
| Name | Age | Position | ||
|
Maximilian de Clara
|
84 |
Director and President
|
||
|
Geert R. Kersten, Esq.
|
55 |
Director, Chief Executive Officer and Treasurer
|
||
|
Patricia B. Prichep
|
63 |
Senior Vice President of Operations and Corporate Secretary
|
||
|
Dr. Eyal Talor
|
58 |
Chief Scientific Officer
|
||
|
Dr. Daniel H. Zimmerman
|
73 |
Senior Vice President of Research, Cellular Immunology
|
||
|
John Cipriano
|
72 |
Senior Vice President of Regulatory Affairs
|
||
|
Alexander G. Esterhazy
|
72 |
Director
|
||
|
Dr. C. Richard Kinsolving
|
78 |
Director
|
||
|
Dr. Peter R. Young
|
69 | Director |
The directors of CEL-SCI serve in such capacity until the next annual meeting of CEL-SCI's shareholders and until their successors have been duly elected and qualified. The officers of CEL-SCI serve at the discretion of CEL-SCI's directors.
Mr. Maximilian de Clara, by virtue of his position as an officer and director of CEL-SCI, may be deemed to be the "parent" and "founder" of CEL-SCI as those terms are defined under applicable rules and regulations of the SEC.
All of CEL-SCI’s directors have served as directors for a significant period of time. Consequently, their long-standing experience with CEL-SCI benefits both CEL-SCI and its shareholders.
The principal occupations of CEL-SCI's officers and directors, during the past several years, are as follows:
Maximilian de Clara has been a Director of CEL-SCI since its inception in March l983, and has been President of CEL-SCI since July l983. Prior to his affiliation with CEL-SCI, and since at least l978, Mr. de Clara was involved in the management of his personal investments and personally funding research in the fields of biotechnology and biomedicine. Mr. de Clara attended the medical school of the University of Munich from l949 to l955, but left before he received a medical degree. During the summers of l954 and l955, he worked as a research assistant at the University of Istanbul in the field of cancer research. For his efforts and dedication to research and development in the fight against cancer and AIDS, Mr. de Clara was awarded the "Pour le Merit" honorary medal of the Austrian Military Order "Merito Navale" as well as the honor cross of the Austrian Albert Schweitzer Society.
35
Geert Kersten has served in his current leadership role at CEL-SCI since 1995. Mr. Kersten has been with CEL-SCI since 1987. He has been involved in the pioneering field of cancer immunotherapy for over two decades and has successfully steered CEL-SCI through many challenging cycles in the biotechnology industry. Mr. Kersten also provides CEL-SCI with significant expertise in the fields of finance and law and has a unique vision of how CEL-SCI's Multikine product could potentially change the way cancer is treated. Prior to joining CEL-SCI, Mr. Kersten worked at the law firm of Finley & Kumble and worked at Source Capital, an investment banking firm located in McLean, VA. He is a native of Germany, graduated from Millfield School in England, and completed his studies in the US. Mr. Kersten received his Undergraduate Degree in Accounting and an M.B.A. from George Washington University, and a law degree (J.D.) from American University in Washington, DC.
Patricia B. Prichep joined CEL-SCI in 1992 and has been CEL-SCI's Senior Vice President of Operations since March 1994. Between December 1992 and March 1994, Ms. Prichep was CEL-SCI's Director of Operations. Ms. Prichep became CEL-SCI's Corporate Secretary in May 2000. She is responsible for all day-to-day operations of CEL-SCI, including human resources and is the liaison with CEL-SCI’s independent registered public accounting firm for financial reporting. From June 1990 to December 1992, Ms. Prichep was the Manager of Quality and Productivity for the NASD’s Management, Systems and Support Department and was responsible for the internal auditing and work flow analysis of operations. Between 1982 and 1990, Ms. Prichep was Vice President and Operations Manager for Source Capital, Ltd. She handled all operations and compliance for Source Capital and was licensed as a securities broker. Ms. Prichep received her B.A. from the University of Bridgeport in Connecticut.
Eyal Talor, Ph.D. joined CEL-SCI in October 1993. In October 2009, Dr. Talor was promoted to Chief Scientific Officer. Between this promotion and March of 1994 he was the Senior Vice President of Research and Manufacturing. He is a clinical immunologist with over 19 years of hands-on management of clinical research and drug development for immunotherapy application; pre-clinical to Phase III, in the biopharmaceutical industry. His expertise includes; biopharmaceutical R&D and Biologics product development, GMP (Good Manufacturing Practices) manufacture, Quality Control testing, and the design and building of GMP manufacturing and testing facilities. He served as Director of Clinical Laboratories (certified by the State of Maryland) and has experience in the design of clinical trials (Phase I – III) and GCP (Good Clinical Practices) requirements. He also has broad experience in the different aspects of biological assay development, analytical methods validation, raw material specifications, and QC (Quality Control) tests development under FDA/GMP, USP, and ICH guidelines. He has extensive experience in the preparation of documentation for IND and other regulatory submissions. His scientific area of expertise encompasses immune response assessment. He is the author of over 25 publications and has published a number of reviews on immune regulations in relation to clinical immunology. Before coming to CEL-SCI, he was Director of R&D and Clinical Development at CBL, Inc., Principal Scientist - Project Director, and Clinical Laboratory Director at SRA Technologies, Inc. Prior to that he was a full time faculty member at The Johns Hopkins University, Medical Institutions; School of Public Health. He has invented technologies which are covered by two US patents; one on Multikine’s composition of matter and method of use in cancer, and one on a platform Peptide technology (‘Adapt’) for the treatment of autoimmune diseases, asthma, allergy, and transplantation rejection. He also is responsible for numerous product and process inventions as well as a number of pending US and PCT patent applications. He received his Ph.D. in Microbiology and Immunology from the University of Ottawa, Ottawa, Ontario, Canada, and had post-doctoral training in clinical and cellular immunology at The John Hopkins University, Baltimore, Maryland, USA. He holds an Adjunct Associate teaching position at the Johns Hopkins University Medical Institutions.
36
Daniel H. Zimmerman, Ph.D., was CEL-SCI's Senior Vice President of Cellular Immunology between 1996 and December 2008 and again since November 2009. He joined CEL-SCI in January 1996 as the Vice President of Research, Cellular Immunology. Dr. Zimmerman founded CELL-MED, Inc. and was its president from 1987-1995. From 1973-1987, Dr. Zimmerman served in various positions at Electronucleonics, Inc. His positions included: Scientist, Senior Scientist, Technical Director and Program Manager. Dr Zimmerman held various teaching positions at Montgomery College between 1987 and 1995. Dr. Zimmerman has invented technologies which are covered by over a dozen US patents as well as many foreign equivalent patents. He is the author of over 40 scientific publications in the area of immunology and infectious diseases. He has been awarded numerous grants from NIH and DOD. From 1969-1973, Dr. Zimmerman was a Senior Staff Fellow at NIH. For the following 25 years, he continued on at NIH as a guest worker. Dr. Zimmerman received a Ph.D. in Biochemistry in 1969, and a Masters in Zoology in 1966 from the University of Florida as well as a B.S. in Biology from Emory and Henry College in 1963.
John Cipriano, was CEL-SCI’s Senior Vice President of Regulatory Affairs between March 2004 and December 2008 and again since October 2009. Mr. Cipriano brings to CEL-SCI over 30 years of experience with both biotech and pharmaceutical companies. In addition, he held positions at the United States Food and Drug Administration (FDA) as Deputy Director, Division of Biologics Investigational New Drugs, Office of Biologics Research and Review and was the Deputy Director, IND Branch, Division of Biologics Evaluation, Office of Biologics. Mr. Cipriano completed his B.S. in Pharmacy from the Massachusetts College of Pharmacy in Boston, Massachusetts and his M.S. in Pharmaceutical Chemistry from Purdue University in West Lafayette, Indiana.
Alexander G. Esterhazy has been a Director of CEL-SCI since December 1999 and has been an independent financial advisor since November 1997. Between July 1991 and October 1997, Mr. Esterhazy was a senior partner of Corpofina S.A. Geneva, a firm engaged in mergers, acquisitions and portfolio management. Between January 1988 and July 1991, Mr. Esterhazy was a managing director of DG Bank in Switzerland. During this period Mr. Esterhazy was in charge of the Geneva, Switzerland branch of the DG Bank, founded and served as Vice President of DG Finance (Paris) and was the President and Chief Executive Officer of DG-Bourse, a securities brokerage firm.
C. Richard Kinsolving, Ph.D. has been a Director of CEL-SCI since April 2001. Since February 1999, Dr. Kinsolving has been the Chief Executive Officer of BioPharmacon, a pharmaceutical development company. Between December 1992 and February 1999, Dr. Kinsolving was the President of Immuno-Rx, Inc., a company engaged in immuno-pharmaceutical development. Between December 1991 and September 1995, Dr. Kinsolving was President of Bestechnology, Inc. a nonmedical research and development company producing bacterial preparations for industrial use. Dr. Kinsolving received his Ph.D. in Pharmacology from Emory University (1970), his Masters degree in Physiology/Chemistry from Vanderbilt University (1962), and his Bachelor's degree in Chemistry from Tennessee Tech. University (1957).
37
Peter R. Young, Ph.D. has been a Director of CEL-SCI since August 2002. Dr. Young has been a senior executive within the pharmaceutical industry in the United States and Canada for most of his career. Over the last 20 years he has primarily held positions of Chief Executive Officer or Chief Financial Officer and has extensive experience with acquisitions and equity financings. Since November 2001, Dr. Young has been the President of Agnus Dei, LLC, which acts as a partner in an organization managing immune system clinics which treat patients with diseases such as cancer, multiple sclerosis and hepatitis. Since January 2003, Dr. Young has been the President and Chief Executive Officer of SRL Technology, Inc., a company involved in the development of pharmaceutical (drug) delivery systems. Between 1998 and 2001, Dr. Young was the Chief Financial Officer of Adams Laboratories, Inc. Dr. Young received his Ph.D. in Organic Chemistry from the University of Bristol, England (1969), and his Bachelor's degree in Honors Chemistry, Mathematics and Economics also from the University of Bristol, England (1966).
All of CEL-SCI's officers devote substantially all of their time to CEL-SCI's business.
CEL-SCI’s Board of Directors does not have a “leadership structure”, as such, since each director is entitled to introduce resolutions to be considered by the Board and each director is entitled to one vote on any resolution considered by the Board. CEL-SCI’s Chief Executive Officer is not the Chairman of CEL-SCI’s Board of Directors.
CEL-SCI’s Board of Directors has the ultimate responsibility to evaluate and respond to risks facing CEL-SCI. CEL-SCI’s Board of Directors fulfills its obligations in this regard by meeting on a regular basis and communicating, when necessary, with CEL-SCI’s officers.
Alexander G. Esterhazy, Dr. C. Richard Kinsolving and Dr. Peter R. Young are independent directors as that term is defined in section 803 of the listing standards of the NYSE MKT.
CEL-SCI has adopted a Code of Ethics which is applicable to CEL-SCI’S principal executive, financial, and accounting officers and persons performing similar functions. The Code of Ethics is available on CEL-SCI’s website, located at
www.cel-sci.com.
If a violation of this code of ethics act is discovered or suspected, the Senior Officer must (anonymously, if desired) send a detailed note, with relevant documents, to CEL-SCI’s Audit Committee, c/o Dr. Peter Young, 208 Hewitt Drive, Suite 103-143, Waco, TX 76712
.
For purposes of electing directors at its annual meeting, CEL-SCI has a nominating committee that is made up of CEL-SCI’s three independent directors. The nominating committee selects the nominees to the Board of Directors and they are approved by the shareholders.
CEL-SCI does not have any policy regarding the consideration of director candidates recommended by shareholders since a shareholder has never recommended a nominee to the Board of Directors and under Colorado law, any shareholder can nominate a person for election as a director at the annual shareholders’ meeting. However, CEL-SCI’s Board of Directors will consider candidates recommended by shareholders. To submit a candidate for the Board of Directors the shareholder should send the name, address and telephone number of the candidate, together with any relevant background or biographical information, to CEL-SCI’s Chief Executive Officer, at the address shown on the cover page of this report. The Board has not established any specific qualifications or skills a nominee must meet to serve as a director. Although the Board does not have any process for identifying and evaluating director nominees, the Board does not believe there would be any differences in the manner in which the Board evaluates nominees submitted by shareholders as opposed to nominees submitted by any other person.
38
CEL-SCI does not have a policy with regard to Board member’s attendance at annual meetings. All Board members, with the exception of Mr. de Clara and Mr. Esterhazy, attended the last annual shareholder’s meeting held on July 22, 2014.
Holders of CEL-SCI’s common stock can send written communications to CEL-SCI’s entire Board of Directors, or to one or more Board members, by addressing the communication to “the Board of Directors” or to one or more directors, specifying the director or directors by name, and sending the communication to CEL-SCI’s offices in Vienna, Virginia. Communications addressed to the Board of Directors as whole will be delivered to each Board member. Communications addressed to a specific director (or directors) will be delivered to the director (or directors) specified.
Security holder communications not sent to the Board of Directors as a whole are not relayed to Board members.
Compensation Discussion and Analysis
This Compensation Discussion and Analysis (CD&A) outlines CEL-SCI’s compensation philosophy, objectives and process for its executive officers. This CD&A includes information on how compensation decisions are made, the overall objectives of CEL-SCI’s compensation program, a description of the various components of compensation that are provided, and additional information pertinent to understanding CEL-SCI’s executive officer compensation program.
The Compensation Committee determines the compensation of CEL-SCI’s Chief Executive Officer and President and delegates to the Chief Executive Officer the responsibility to determine the base salaries of all other officers, other than himself, under the constraints of an overall limitation on the total amount of compensation to be paid to them.
Compensation Philosophy
CEL-SCI’s compensation philosophy extends to all employees, including executive officers, and is designed to align employee and shareholder interests. The philosophy’s objective is to pay fairly based upon the employee’s position, experience and individual performance. Employees may be rewarded through additional compensation when CEL-SCI meets or exceeds targeted business objectives. Generally, under CEL-SCI’s compensation philosophy, as an employee’s level of responsibility increases, a greater portion of his or her total potential compensation becomes contingent upon annual performance.
39
A substantial portion of an executive's compensation incorporates performance criteria that support and reward achievement of CEL-SCI’s long term business goals.
The fundamental principles of CEL-SCI’s compensation philosophy are described below:
|
●
|
Market-driven.
Compensation programs are structured to be competitive both in their design and in the total compensation that they offer.
|
|
●
|
Performance-based.
Certain officers have some portion of their incentive compensation linked to CEL-SCI’s performance. The application of performance measures as well as the form of the reward may vary depending on the employee’s position and responsibilities.
|
Based on a review of its compensation programs, CEL-SCI does not believe that such programs encourage any of its employees to take risks that would be likely to have a material adverse effect on CEL-SCI. CEL-SCI reached this conclusion based on the following:
|
●
|
The salaries paid to employees are consistent with the employees’ duties and responsibilities.
|
|
●
|
Employees who have high impact relative to the expectations of their job duties and functions are rewarded.
|
|
●
|
CEL-SCI retains employees who have skills critical to its long term success.
|
Review of Executive Officer Compensation
CEL-SCI’s current policy is that the various elements of the compensation package are not interrelated in that gains or losses from past equity incentives are not factored into the determination of other compensation. For instance, if options that are granted in a previous year have an exercise price which is below the market price of CEL-SCI’s common stock, the Committee does not take that circumstance into consideration in determining the amount of the options or restricted stock to be granted the next year. Similarly, if the options or restricted shares granted in a previous year become extremely valuable, the Committee does not take that into consideration in determining the options or restricted stock to be awarded for the next year.
CEL-SCI does not have a policy with regard to the adjustment or recovery of awards or payments if relevant performance measures upon which they are based are restated or otherwise adjusted in a manner that would reduce the size of an award or payment.
Components of Compensation—Executive Officers
CEL-SCI’s executive officers are compensated through the following three components:
|
●
|
Base Salary
|
|
●
|
Long-Term Incentives (stock options and/or grants of stock)
|
|
●
|
Benefits
|
40
These components provide a balanced mix of base compensation and compensation that is contingent upon each executive officer’s individual performance. A goal of the compensation program is to provide executive officers with a reasonable level of security through base salary and benefits. CEL-SCI wants to ensure that the compensation programs are appropriately designed to encourage executive officer retention and motivation to create shareholder value. The Compensation Committee believes that CEL-SCI’s stockholders are best served when CEL-SCI can attract and retain talented executives by providing compensation packages that are competitive but fair.
In past years, base salaries, benefits and incentive compensation opportunities were generally targeted near the median of general survey market data derived from indices covering similar biotech/pharmaceutical companies. The companies included Achillion Pharmaceuticals, Inc., Acura Pharmaceutical, Inc., Alimera Sciences, Inc., Cortex Pharmaceuticals, Inc., IGI Laboratories Inc., StemCells, Inc., Psychemedics Corporation, Biota Biopharmaceuticals, Inc., POZEN, Inc., Synta Pharmaceuticals, Ziopharm Oncology, Sunesis Pharmaceuticals, CytRx Corporation, Novavax Inc., BioCryst Pharmaceuticals, Galena Biopharma Inc., XOMA Ltd., Discovery Laboratories Inc., and Targacept Inc.
CEL-SCI used a third party consultant to provide it with recommendations for strategic long term incentive compensation for certain key executives. The recommendation resulted in the formation of the 2014 Incentive Stock Bonus Plan that was voted on and passed by the shareholders at the annual meeting on July 22, 2014.
Base Salaries
Base salaries generally have been targeted to be competitive when compared to the salary levels of persons holding similar positions in other pharmaceutical companies and other publicly traded companies of comparable size. Each executive officer’s respective responsibilities, experience, expertise and individual performance are considered.
A further consideration in establishing compensation for the senior employees is their long term history with CEL-SCI. Taken into consideration are factors that have helped CEL-SCI survive in times when it was financially extremely weak, such as: willingness to accept salary cuts, willingness not to be paid at all for extended time periods, and in general an attitude that helped CEL-SCI survive during financially difficult times. For example, Geert Kersten, Maximilian de Clara and Patricia Prichep were without any salary between September 2008 and June 2009. Other senior members took substantial salary cuts, all geared towards helping CEL-SCI survive. In all of these cases the officers continued to work without any guarantee of payment.
Long-Term Incentives
Stock grants and option grants help to align the interests of CEL-SCI’s employees with those of its shareholders. Options and stock grants are made under CEL-SCI’s Stock Option, Incentive Stock Bonus, Stock Bonus and Stock Compensation Plans. Options are granted with exercise prices equal to the closing price of CEL-SCI’s common stock on the day immediately preceding the date of grant, with pro rata vesting at the end of each of the following three years.
41
CEL-SCI believes that grants of equity-based compensation:
|
●
|
Enhance the link between the creation of shareholder value and long-term executive incentive compensation;
|
|
●
|
Provide focus, motivation and retention incentive; and
|
|
●
|
Provide competitive levels of total compensation.
|
CEL-SCI’s management believes that the pricing for biotechnology stocks is highly inefficient until the time of product sales. As such, any long term compensation tied to progress as measured by share price is not as efficient as it should be. The plan approved by the shareholders in July 2014, which covers senior and mid-level employees, seeks to address this issue by rewarding employees for meeting major operational milestones and significantly improved share prices.
Benefits
In addition to cash and equity compensation programs, executive officers participate in the health and welfare benefit programs available to other employees. In a few limited circumstances, CEL-SCI provides other benefits to certain executive officers, such as car allowances.
All executive officers are eligible to participate in CEL-SCI’s 401(k) plan on the same basis as its other employees. CEL-SCI matches 100% of each employee’s contribution up to 6% of his or her salary.
The following table sets forth in summary form the compensation received by (i) the Chief Executive and Financial Officer of CEL-SCI and (ii) by each other executive officer of CEL-SCI who received in excess of $100,000 during the three fiscal years ended September 30, 2014
.
|
Fiscal
|
Salary
|
Bonus
|
Restric
ted Stock
Awards
|
Option
Awards
|
All Other
Annual
Compen
sation
|
|||||||||||||||||||||
|
Name and
Principal Position
|
Year
|
(1) | (2) | (3) | (4) | (5) |
Total
|
|||||||||||||||||||
|
|
|
|
|
|||||||||||||||||||||||
|
Maximilian de Clara,
|
2014
|
393,250 | -- | -- | 298,648 | 73,183 | 765,081 | |||||||||||||||||||
|
President
|
2013 | 332,750 | -- | -- | 306,863 | 40,000 | 679,613 | |||||||||||||||||||
|
|
2012 | 363,000 | -- | -- | 200,863 | 102,591 | 666,454 | |||||||||||||||||||
|
Geert R. Kersten,
|
2014
|
584,621 | -- | 3,236,526 | 82,917 | 57,581 | 3,961,645 | |||||||||||||||||||
|
Chief Executive
|
2013
|
439,093 | -- | 15,225 | 1,516,692 | 53,514 | 2,024,524 | |||||||||||||||||||
|
Officer and
|
2012
|
477,924 | -- | 14,925 | 332,027 | 56,935 | 881,811 | |||||||||||||||||||
|
Treasurer
|
||||||||||||||||||||||||||
|
Patricia B. Prichep
|
2014
|
247,852 | -- | 1,735,938 | 55,278 | 6,531 | 2,045,599 | |||||||||||||||||||
|
Senior Vice President
|
2013
|
202,253 | -- | 13,941 | 485,634 | 5,531 | 707,359 | |||||||||||||||||||
|
of Operations and
|
2012
|
210,133 | -- | 12,968 | 156,715 | 6,031 | 385,847 | |||||||||||||||||||
|
Secretary
|
||||||||||||||||||||||||||
|
Eyal Talor, Ph.D.
|
2014
|
283,283 | -- | 1,731,290 | 55,278 | 6,031 | 2,075,882 | |||||||||||||||||||
|
Chief Scientific
|
2013
|
272,388 | -- | 9,600 | 460,255 | 6,031 | 748,274 | |||||||||||||||||||
|
Officer
|
2012
|
259,417 | -- | 9,600 | 140,564 | 6,031 | 415,612 | |||||||||||||||||||
|
Daniel Zimmerman,
|
2014
|
213,231 | -- | 13,274 | 227,319 | 6,031 | 459,855 | |||||||||||||||||||
|
Ph.D. Senior Vice
|
2013
|
205,030 | -- | 12,989 | 87,911 | 6,031 | 311,961 | |||||||||||||||||||
|
President of
|
2012
|
199,058 | -- | 12,303 | 115,354 | 6,031 | 332,746 | |||||||||||||||||||
|
Research. Cellular
|
||||||||||||||||||||||||||
|
Immunology
|
||||||||||||||||||||||||||
|
John Cipriano
|
2014
|
197,354 | -- | 888,614 | 41,549 | 31 | 1,127,458 | |||||||||||||||||||
|
Senior Vice President
|
2013
|
189,763 | -- | -- | 47,968 | 31 | 237,762 | |||||||||||||||||||
|
of Regulatory Affairs
|
2012
|
184,236 | -- | -- | 76,515 | 31 | 260,782 | |||||||||||||||||||
42
|
(1)
|
The dollar value of base salary (cash and non-cash) earned.
|
|
(2)
|
The dollar value of bonus (cash and non-cash) earned.
|
|
(3)
|
The fair value of the shares of restricted stock issued during the periods covered by the table is shown as compensation for services to the persons listed in the table. In the case of all persons listed in the table, the shares were issued as CEL-SCI's contribution on behalf of the named officer who participates in CEL-SCI's 401(k) retirement plan and, by far the largest part, restricted shares issued from the 2014 Incentive Stock Bonus Plan that was voted on and passed by the shareholders at the annual meeting on July 22, 2014. These shares are not vested and are held in escrow. The shares will only be earned upon the achievement of certain milestones leading to the commercialization of the Company’s Multikine technology, or specified increases in the market price of the Company’s stock. If the performance or market criteria are not met as specified in the Incentive Stock Bonus Plan, all or a portion of the awarded shares will be forfeited. The value of all stock awarded during the periods covered by the table are calculated according to ASC 718-10-30-3 which represented the grant date fair value.
|
|
(4)
|
The fair value of all stock options granted during the periods covered by the table are calculated on the grant date in accordance with ASC 718-10-30-3 which represented the grant date fair value
.
|
|
(5)
|
All other compensation received that CEL-SCI could not properly report in any other column of the table including the dollar value of any insurance premiums paid by, or on behalf of, CEL-SCI with respect to term life insurance for the benefit of the named executive officer and car allowances paid by CEL-SCI. Includes board of directors fees for Mr. de Clara and Mr. Kersten.
|
Employee Pension, Profit Sharing or Other Retirement Plans
CEL-SCI has a defined contribution retirement plan, qualifying under Section 401(k) of the Internal Revenue Code and covering substantially all CEL-SCI’s employees. CEL-SCI’s contribution to the plan is made in shares of CEL-SCI's common stock. Each participant's contribution is matched by CEL-SCI with shares of common stock which have a value equal to 100% of the participant's contribution, not to exceed the lesser of $1,000 or 6% of the participant's total compensation. CEL-SCI's contribution of common stock is valued each quarter based upon the closing price of its common stock. The fiscal 2014 expenses for this plan were $159,632. Other than the 401(k) Plan, CEL-SCI does not have a defined benefit, pension plan, profit sharing or other retirement plan.
Compensation of Directors During Year Ended September 30, 2014
| Name | Paid in Cash | Stock Awards (1) | Option Awards (2) | Total | ||||||||||||
|
Maximilian de Clara
|
$ | 40,000 | $ | - | $ | 298,648 | $ | 338,648 | ||||||||
|
Geert Kersten
|
$ | 40,000 | $ | 3,236,526 | $ | 82,917 | $ | 3,359,443 | ||||||||
|
Alexander Esterhazy
|
$ | 45,000 | $ | - | $ | 134,389 | $ | 179,389 | ||||||||
|
C. Richard Kinsolving
|
$ | 45,000 | $ | - | $ | 134,389 | $ | 179,389 | ||||||||
|
Peter R. Young
|
$ | 50,000 | $ | - | $ | 134,389 | $ | 184,389 | ||||||||
|
(1)
|
The fair value of stock issued for services. This stock is not vested, is held in escrow and will only be released to Mr. Kersten upon the achievement of major shareholder approved Company milestones.
|
|
(2)
|
The fair value of options granted computed in accordance with ASC 718-10-30-3 on the date of grant which represents their grant date fair value.
|
Directors’ fees paid to Maximilian de Clara and Geert Kersten are also included in the Executive Compensation table.
43
Employment Contracts
Maximilian de Clara
In April 2005, CEL-SCI entered into a three-year employment agreement with Maximilian de Clara, CEL-SCI’s President. The employment agreement provided that CEL-SCI would pay Mr. de Clara an annual salary of $363,000 during the term of the agreement. On September 8, 2006 Mr. de Clara’s Employment Agreement was amended and extended to April 30, 2010. The terms of the amendment to Mr. de Clara’s employment agreement are referenced in a report on Form 8-K filed with the Securities and Exchange Commission on September 8, 2006. On August 30, 2010, Mr. de Clara’s employment agreement, as amended on September 8, 2006, was extended to August 30, 2013. On August 30, 2013, Mr. de Clara’s employment agreement, as amended on September 8, 2006, was extended again to August 30, 2016.
In the event that there is a material reduction in Mr. de Clara's authority, duties or activities, or in the event there is a change in the control of CEL-SCI, the agreement allows Mr. de Clara to resign from his position at CEL-SCI and receive a lump-sum payment from CEL-SCI equal to 18 months of salary ($544,500) and the unvested portion of any stock options would vest immediately ($297,880). For purposes of the employment agreement, a change in the control of CEL-SCI means the sale of more than 50% of the outstanding shares of CEL-SCI's common stock, or a change in a majority of CEL-SCI's directors.
The employment agreement will also terminate upon the death of Mr. de Clara, Mr. de Clara’s physical or mental disability, the conviction of Mr. de Clara for any crime involving fraud, moral turpitude, or CEL-SCI’s property, or a breach of the employment agreement by Mr. de Clara. If the employment agreement is terminated for any of these reasons, Mr. de Clara, or his legal representatives, as the case may be, will be paid the salary provided by the employment agreement through the date of termination.
Geert Kersten
In September 1, 2003, CEL-SCI entered into a three-year employment agreement with Mr. Kersten. On September 1, 2006, Mr. Kersten’s employment agreement was extended to September 1, 2011. On September 1, 2011, CEL-SCI extended its employment agreement with Mr. Kersten to August 31, 2016. Mr. Kersten’s annual salary for fiscal year 2014 was $521,893. Mr. Kersten will receive at least the same salary increases each year as do other senior executives of CEL-SCI. Increases beyond those, if any, shall be made at the sole discretion of CEL-SCI’s directors.
During the employment term, Mr. Kersten will be entitled to receive any other benefits which are provided to CEL-SCI's executive officers or other full time employees in accordance with CEL-SCI's policies and practices and subject to Mr. Kersten’s satisfaction of any applicable condition of eligibility.
If Mr. Kersten resigns within ninety (90) days of the occurrence of any of the following events: (i) a reduction in Mr. Kersten’s salary (ii) a relocation (or demand for relocation) of Mr. Kersten’s place of employment to a location more than thirty-five (35) miles from his current place of employment, (iii) a significant and material reduction in Mr. Kersten’s authority, job duties or level of responsibility or the imposition of significant and material limitations on the Mr. Kersten’s autonomy in his position, or (iv) a Change in Control, then the employment agreement will be terminated and Mr. Kersten will be entitled to receive a lump-sum payment from CEL-SCI equal to 24 months of salary ($1,043,786) and the unvested portion of any stock options would vest immediately ($1,201,945). For purposes of the employment agreement a change in the control of CEL-SCI means: (1) the merger of CEL-SCI with another entity if after such merger the shareholders of CEL-SCI do not own at least 50% of voting capital stock of the surviving corporation; (2) the sale of substantially all of the assets of CEL-SCI; (3) the acquisition by any person of more than 50% of CEL-SCI's common stock; or (4) a change in a majority of CEL-SCI's directors which has not been approved by the incumbent directors.
44
The employment agreement will also terminate upon the death of Mr. Kersten, Mr. Kersten’s physical or mental disability, willful misconduct, an act of fraud against CEL-SCI, or a breach of the employment agreement by Mr. Kersten.
If the employment agreement is terminated for any of the foregoing, Mr. Kersten, or his legal representatives, as the case may be, will be paid the salary provided by the employment agreement through the date of termination, any options or bonus shares of CEL-SCI then held by Mr. Kersten will become fully vested and the expiration date of any options which would expire during the four year period following his termination of employment will be extended to the date which is four years after his termination of employment.
On August 30, 2013, CEL-SCI amended certain sections of Mr. Kersten’s employment agreement so that it would correspond with similar sections of the employment agreements with Ms. Prichep and Dr. Talor.
Patricia B. Prichep / Eyal Talor, Ph.D.
On August 30, 2010, CEL-SCI entered into a three-year employment agreement with Patricia B. Prichep, CEL-SCI’s Senior Vice President of Operations. On August 30, 2013 the employment agreement with Ms. Prichep was extended to August 30, 2016. Ms. Prichep’s annual salary for fiscal year 2014 was $229,465.
On August 30, 2010, CEL-SCI also entered into a three-year employment agreement with Eyal Talor, Ph.D., CEL-SCI’s Chief Scientific Officer. On August 30, 2013, the employment agreement with Dr. Talor was extended to August 30, 2016. Dr. Talor’s annual salary for fiscal year 2014 was $283,283.
If Ms. Prichep or Dr. Talor resigns within ninety (90) days of the occurrence of any of the following events: (i) a relocation (or demand for relocation) of employee’s place of employment to a location more than thirty-five (35) miles from the employee’s current place of employment, (ii) a significant and material reduction in the employee’s authority, job duties or level of responsibility or (iii) the imposition of significant and material limitations on the employee’s autonomy in her or his position, the employment agreement will be terminated and the employee will be paid the salary provided by the employment agreement through the date of termination and the unvested portion of any stock options held by the employee will vest immediately.
In the event there is a change in the control of CEL-SCI, the employment agreements with Ms. Prichep and Dr. Talor allow Ms. Prichep and/or Dr. Talor (as the case may be) to resign from her or his position at CEL-SCI and receive a lump-sum payment from CEL-SCI equal to 18 months of salary ($344,198 and $424,925 respectively). In addition, the unvested portion of any stock options held by the employee will vest immediately ($463,406 and $463,406 respectively). For purposes of the employment agreements, a change in the control of CEL-SCI means: (1) the merger of CEL-SCI with another entity if after such merger the shareholders of CEL-SCI do not own at least 50% of voting capital stock of the surviving corporation; (2) the sale of substantially all of the assets of CEL-SCI; (3) the acquisition by any person of more than 50% of CEL-SCI's common stock; or (4) a change in a majority of CEL-SCI's directors which has not been approved by the incumbent directors.
45
The employment agreements with Ms. Prichep and Dr. Talor will also terminate upon the death of the employee, the employee’s physical or mental disability, willful misconduct, an act of fraud against CEL-SCI, or a breach of the employment agreement by the employee. If the employment agreement is terminated for any of these reasons the employee, or her or his legal representatives, as the case may be, will be paid the salary provided by the employment agreement through the date of termination.
Compensation Committee Interlocks and Insider Participation
CEL-SCI has a compensation committee comprised of Mr. Alexander Esterhazy, Dr. C. Richard Kinsolving and Dr. Peter Young, all of whom are independent directors.
During the year ended September 30, 2014, no director of CEL-SCI was also an executive officer of another entity, which had an executive officer of CEL-SCI serving as a director of such entity or as a member of the compensation committee of such entity.
Loan from Officer and Director
Between December 2008 and June 2009, Maximilian de Clara, CEL-SCI’s President and a director, loaned CEL-SCI $1,104,057 under a note payable. The loan was initially payable at the end of March 2009, but was extended to the end of June 2009. At the time of the first extension, and in accordance with the loan agreement, CEL-SCI issued Mr. de Clara warrants which entitles Mr. de Clara to purchase 164,824 shares of CEL-SCI’s common stock at a price of $4.00 per share. The warrants are exercisable at any time prior to December 24, 2014. CEL-SCI then negotiated a second extension of the loan with Mr. de Clara on terms similar to the first extension. Pursuant to the terms of the second extension, the note was due on July 6, 2014, but, at Mr. de Clara’s option, the note can be converted into shares of CEL-SCI’s common stock. The number of shares which will be issued upon any conversion will be determined by dividing the amount to be converted by $4.00. As further consideration for the second extension, Mr. de Clara received warrants which allow Mr. de Clara to purchase 184,930 shares of CEL-SCI’s common stock at a price of $5.00 per share at any time prior to January 6, 2015. On May 13, 2011, the Company extended the maturity date of the note to July 6, 2015 to compensate Mr. de Clara for agreeing to subordinate his note to the convertible preferred shares and convertible debt as part of a settlement agreement. The note from Mr. de Clara bears interest at 15% per year and is secured by a lien on substantially all of CEL-SCI’s assets. CEL-SCI does not have the right to prepay the note without Mr. de Clara’s consent. In August 2014, the loan and warrants were transferred to the De Clara Trust, of which the Company’s CEO, Geert Kersten, is the Trustee and a beneficiary. Mr. De Clara will continue to receive the interest payments.
Stock Option, Bonus and Compensation Plans
CEL-SCI has Incentive Stock Option Plans, Non-Qualified Stock Option, Stock Bonus, Stock Compensation Plans and an Incentive Stock Bonus Plan. All Stock Option, Bonus and Compensation Plans have been approved by the stockholders. A summary description of these Plans follows. In some cases these Plans are collectively referred to as the "Plans".
46
Incentive Stock Option Plan
. The Incentive Stock Option Plans authorize the issuance of shares of CEL-SCI's common stock to persons who exercise options granted pursuant to the Plans. Only CEL-SCI’s employees may be granted options pursuant to the Incentive Stock Option Plans.
Options may not be exercised until one year following the date of grant. Options granted to an employee then owning more than 10% of the common stock of CEL-SCI may not be exercisable by its terms after five years from the date of grant. Any other option granted pursuant to the Plans may not be exercisable by its terms after ten years from the date of grant.
The purchase price per share of common stock purchasable under an option is determined by the Committee but cannot be less than the fair market value of the common stock on the date of the grant of the option (or 110% of the fair market value in the case of a person owning more than 10% of CEL-SCI's outstanding shares).
Non-Qualified Stock Option Plans
. The Non-Qualified Stock Option Plans authorize the issuance of shares of CEL-SCI's common stock to persons that exercise options granted pursuant to the Plans. CEL-SCI's employees, directors, officers, consultants and advisors are eligible to be granted options pursuant to the Plans, provided however that bona fide services must be rendered by such consultants or advisors and such services must not be in connection with sale a capital-raising transaction or promoting CEL-SCI’s common stock. The option exercise price is determined by CEL-SCI’s Board of Directors.
Stock Bonus Plan
. Under the Stock Bonus Plans shares of CEL-SCI’s common stock may be issued to CEL-SCI's employees, directors, officers, consultants and advisors, provided however that bona fide services must be rendered by consultants or advisors and such services must not be in connection with a capital-raising transaction or promoting CEL-SCI’s common stock
.
Stock Compensation Plan
. Under the Stock Compensation Plan, shares of CEL-SCI’s common stock may be issued to CEL-SCI’s employees, directors, officers, consultants and advisors in payment of salaries, fees and other compensation owed to these persons. However, bona fide services must be rendered by consultants or advisors and such services must not be in connection with the offer or sale of securities in a capital-raising transaction or promoting CEL-SCI’s common stock
.
Incentive Stock Bonus Plan
. Under the 2014 Incentive Stock Bonus Plan, shares of CEL-SCI’s common stock may be issued to executive officers and other employees who contribute significantly to the success of the Company, to participate in its future prosperity and growth and aligns
their interests with those of the shareholders. The purpose of the Plan is to provide long term incentive for outstanding service to the Company and its shareholders and to assist in recruiting and retaining people of outstanding ability and initiative in executive and management positions.
Other Information Regarding the Plans
. The Plans are administered by CEL-SCI's Compensation Committee (“the Committee”), each member of which is a director of CEL-SCI. The members of the Committee were selected by CEL-SCI's Board of Directors and serve for a one-year tenure and until their successors are elected. A member of the Committee may be removed at any time by action of the Board of Directors. Any vacancies which may occur on the Committee will be filled by the Board of Directors. The Committee is vested with the authority to interpret the provisions of the Plans and supervise the administration of the Plans. In addition, the Committee is empowered to select those persons to whom shares or options are to be granted, to determine the number of shares subject to each grant of a stock bonus or an option and to determine when, and upon what conditions, shares or options granted under the Plans will vest or otherwise be subject to forfeiture and cancellation.
47
In the discretion of the Committee, any option granted pursuant to the Plans may include installment exercise terms such that the option becomes fully exercisable in a series of cumulating portions. The Committee may also accelerate the date upon which any option (or any part of any options) is first exercisable. Any shares issued pursuant to the Stock Bonus Plan or Stock Compensation Plan and any options granted pursuant to the Incentive Stock Option Plan or the Non-Qualified Stock Option Plans will be forfeited if the "vesting" schedule established by the Committee administering the Plans at the time of the grant is not met. For this purpose, vesting means the period during which the employee must remain an employee of CEL-SCI or the period of time a non-employee must provide services to CEL-SCI. At the time an employee ceases working for CEL-SCI (or at the time a non-employee ceases to perform services for CEL-SCI), any shares or options not fully vested will be forfeited and cancelled. At the discretion of the Committee payment for the shares of common stock underlying options may be paid through the delivery of shares of CEL-SCI's common stock having an aggregate fair market value equal to the option price, provided such shares have been owned by the option holder for at least one year prior to such exercise. A combination of cash and shares of common stock may also be permitted at the discretion of the Committee.
Options are generally non-transferable except upon death of the option holder. Shares issued pursuant to the Stock Bonus Plans will generally not be transferable until the person receiving the shares satisfies the vesting requirements imposed by the Committee when the shares were issued.
The Board of Directors of CEL-SCI may at any time, and from time to time, amend, terminate, or suspend one or more of the Plans in any manner it deems appropriate, provided that such amendment, termination or suspension will not adversely affect rights or obligations with respect to shares or options previously granted.
Stock Options
The following tables show information concerning the options granted during the fiscal year ended September 30, 2014, to the persons named below:
Options Granted
| Name | Grant Date | Options Granted | Price Per Share | Expiration Date | |||||||
|
Maximilian de Clara
|
2/26/2014
|
75,000 | $ | 1.09 |
2/25/2024
|
||||||
|
Maximilian de Clara
|
8/6/2014
|
100,000 | $ | 1.10 |
8/5/2024
|
||||||
|
Maximilian de Clara
|
8/26/2014
|
150,000 | $ | 1.08 |
8/25/2024
|
||||||
|
Geert Kersten
|
2/26/2014
|
90,000 | $ | 1.09 |
2/25/2024
|
||||||
|
Patricia Prichep
|
2/26/2014
|
60,000 | $ | 1.09 |
2/25/2024
|
||||||
|
Eyal Talor
|
2/26/2014
|
60,000 | $ | 1.09 |
2/25/2024
|
||||||
|
Daniel Zimmerman
|
2/26/2014
|
45,000 | $ | 1.09 |
2/25/2024
|
||||||
|
Daniel Zimmerman
|
8/6/2014
|
200,000 | $ | 1.10 |
8/5/2024
|
||||||
|
John Cipriano
|
2/26/2014
|
45,000 | $ | 1.09 |
2/25/2024
|
||||||
|
Alexander Esterhazy
|
2/26/2014
|
45,000 | $ | 1.09 |
2/25/2024
|
||||||
|
Alexander Esterhazy
|
8/6/2014
|
100,000 | $ | 1.10 |
8/5/2024
|
||||||
|
C. Richard Kinsolving
|
2/26/2014
|
45,000 | $ | 1.09 |
2/25/2024
|
||||||
|
C. Richard Kinsolving
|
8/6/2014
|
100,000 | $ | 1.10 |
8/5/2024
|
||||||
|
Peter Young
|
2/26/2014
|
45,000 | $ | 1.09 |
2/25/2024
|
||||||
|
Peter Young
|
8/6/2014
|
100,000 | $ | 1.10 |
8/5/2024
|
||||||
48
The following tables show information concerning the options cancelled and exercised during the fiscal year ended September 30, 2014, to the persons named below:
Options Cancelled
| Employee | Total Options | Weighted Average Exercise Price | Weighted Average Remaining Contractual Term (Years) | |||||||||||
None
Options Exercised
|
Date of
|
Shares Acquired
|
Value
|
||||||||||||
|
Name
|
Exercise
|
On Exercise
|
Realized
|
|||||||||||
None
The following lists the outstanding options held by the persons named below:
|
Shares underlying unexercised
|
|||||||||||||
|
Option which are:
|
Exercise
|
Expiration
|
|||||||||||
|
Name
|
Exercisable
|
Unexercisable
|
Price
|
Date
|
|||||||||
|
Maximilian de Clara
|
5,000 | 4.80 |
09/21/15
|
||||||||||
| 10,000 | 5.80 |
09/12/16
|
|||||||||||
| 20,000 | 6.30 |
09/13/17
|
|||||||||||
| 20,000 | 6.20 |
03/04/18
|
|||||||||||
| 143,625 | (1) | 2.50 |
04/23/19
|
||||||||||
| 25,000 | 3.80 |
07/20/19
|
|||||||||||
| 25,000 | 4.80 |
07/20/20
|
|||||||||||
| 25,000 | 6.90 |
04/14/21
|
|||||||||||
| 47,200 | 3.20 |
12/01/16
|
|||||||||||
| 25,000 | 3.90 |
05/17/22
|
|||||||||||
| 20,000 | 2.80 |
12/17/22
|
|||||||||||
| 12,500 | 2.10 |
06/30/23
|
|||||||||||
| 100,000 | 1.10 |
08/05/24
|
|||||||||||
| 150,000 | 1.08 |
08/25/24
|
|||||||||||
| ---------- | |||||||||||||
| 628,325 | |||||||||||||
| 50,000 | (2) | 3.80 |
07/06/19
|
||||||||||
| 12,500 | 3.90 |
05/17/22
|
|||||||||||
| 80,000 | 2.80 |
12/17/22
|
|||||||||||
| 25,000 | 2.10 |
06/30/23
|
|||||||||||
| 75,000 | 1.09 |
02/25/24
|
|||||||||||
| ---------- | |||||||||||||
| 242,500 | |||||||||||||
49
|
Geert R. Kersten
|
5,000 | 4.80 |
09/21/15
|
||||||||||
| 20,000 | 5.80 |
09/12/16
|
|||||||||||
| 20,000 | 6.30 |
09/13/17
|
|||||||||||
| 20,000 | 6.20 |
03/04/18
|
|||||||||||
| 183,861 | (1) | 2.50 |
04/23/19
|
||||||||||
| 30,000 | 3.80 |
07/20/19
|
|||||||||||
| 30,000 | 4.80 |
07/20/20
|
|||||||||||
| 30,000 | 6.90 |
04/14/21
|
|||||||||||
| 125,440 | 3.20 |
12/01/16
|
|||||||||||
| 30,000 | 3.90 |
05/17/22
|
|||||||||||
| 189,000 | 2.80 |
12/17/17
|
|||||||||||
| 57,070 | 2.80 |
12/17/22
|
|||||||||||
| 15,000 | 2.10 |
06/30/23
|
|||||||||||
| ---------- | |||||||||||||
| 755,371 | |||||||||||||
| 400,000 | (2) | 3.80 |
07/06/19
|
||||||||||
| 15,000 | 3.90 |
05/17/22
|
|||||||||||
| 442,930 | 2.80 |
12/17/22
|
|||||||||||
| 30,000 | 2.10 |
06/30/23
|
|||||||||||
| 90,000 | 1.09 |
02/25/24
|
|||||||||||
| ---------- | |||||||||||||
| 977,930 | |||||||||||||
|
Patricia B. Prichep
|
5,000 | 3.30 |
04/26/15
|
||||||||||
| 3,000 | 4.80 |
09/21/15
|
|||||||||||
| 9,000 | 5.80 |
09/12/16
|
|||||||||||
| 10,000 | 6.30 |
09/13/17
|
|||||||||||
| 10,000 | 6.20 |
03/04/18
|
|||||||||||
| 71,710 | (1) | 2.50 |
04/23/19
|
||||||||||
| 15,000 | 3.80 |
07/20/19
|
|||||||||||
| 15,000 | 4.80 |
07/20/20
|
|||||||||||
| 15,000 | 6.90 |
04/14/21
|
|||||||||||
| 38,520 | 3.20 |
12/01/16
|
|||||||||||
| 20,000 | 3.90 |
05/17/22
|
|||||||||||
| 58,000 | 2.80 |
12/17/17
|
|||||||||||
| 23,390 | 2.80 |
12/17/22
|
|||||||||||
| 10,000 | 2.10 |
06/30/23
|
|||||||||||
| ---------- | |||||||||||||
| 303,620 | |||||||||||||
| 300,000 | (2) | 3.80 |
07/06/19
|
||||||||||
| 10,000 | 3.90 |
05/17/22
|
|||||||||||
| 126,610 | 2.80 |
12/17/22
|
|||||||||||
| 20,000 | 2.10 |
06/30/23
|
|||||||||||
| 60,000 | 1.09 |
02/25/24
|
|||||||||||
| ---------- | |||||||||||||
| 516,610 |
50
|
Eyal Talor, Ph.D
|
5,000 | 3.30 |
04/26/15
|
||||||||||
| 3,000 | 4.80 |
09/21/15
|
|||||||||||
| 8,000 | 5.80 |
09/12/16
|
|||||||||||
| 10,000 | 6.30 |
09/13/17
|
|||||||||||
| 10,000 | 6.20 |
03/04/18
|
|||||||||||
| 24,082 | (1) | 2.50 |
04/23/19
|
||||||||||
| 15,000 | 3.80 |
07/20/19
|
|||||||||||
| 15,000 | 4.80 |
07/20/20
|
|||||||||||
| 15,000 | 6.90 |
04/14/21
|
|||||||||||
| 27,773 | 3.20 |
12/01/16
|
|||||||||||
| 20,000 | 3.90 |
05/17/22
|
|||||||||||
| 37,417 | 2.80 |
12/17/17
|
|||||||||||
| 23,390 | 2.80 |
12/17/22
|
|||||||||||
| 10,000 | 2.10 |
06/30/23
|
|||||||||||
| ---------- | |||||||||||||
| 223,662 | |||||||||||||
| 300,000 | (2) | 3.80 |
07/06/19
|
||||||||||
| 10,000 | 3.90 |
05/17/22
|
|||||||||||
| 126,610 | 2.80 |
12/17/22
|
|||||||||||
| 20,000 | 2.10 |
06/30/23
|
|||||||||||
| 60,000 | 1.09 |
02/25/24
|
|||||||||||
| ---------- | |||||||||||||
| 516,610 | |||||||||||||
|
Daniel Zimmerman, Ph.D
|
5,000 | 3.30 |
04/16/15
|
||||||||||
| 3,000 | 4.80 |
09/21/15
|
|||||||||||
| 6,000 | 5.80 |
09/12/16
|
|||||||||||
| 7,500 | 6.30 |
09/13/17
|
|||||||||||
| 7,500 | 6.20 |
03/04/18
|
|||||||||||
| 15,000 | 4.80 |
07/20/20
|
|||||||||||
| 15,000 | 6.90 |
04/14/21
|
|||||||||||
| 25,200 | 3.20 |
12/01/16
|
|||||||||||
| 15,000 | 3.90 |
05/17/22
|
|||||||||||
| 39,200 | 2.80 |
12/17/17
|
|||||||||||
| 7,500 | 2.10 |
06/30/23
|
|||||||||||
| ---------- | |||||||||||||
| 145,900 | |||||||||||||
| 7,500 | 3.90 |
05/17/22
|
|||||||||||
| 15,000 | 2.10 |
06/30/23
|
|||||||||||
| 45,000 | 1.09 |
02/25/24
|
|||||||||||
| 200,000 | 1.10 |
08/05/24
|
|||||||||||
| ---------- | |||||||||||||
| 267,500 |
51
|
John Cipriano
|
3,000 | 4.80 |
09/21/15
|
||||||||||
| 6,000 | 5.80 |
09/12/16
|
|||||||||||
| 7,500 | 6.30 |
09/13/17
|
|||||||||||
| 7,500 | 6.20 |
03/04/18
|
|||||||||||
| 15,000 | 4.80 |
07/20/20
|
|||||||||||
| 15,000 | 6.90 |
04/14/21
|
|||||||||||
| 1,600 | 3.20 |
12/01/16
|
|||||||||||
| 10,000 | 2.50 |
09/30/19
|
|||||||||||
| 15,000 | 3.90 |
05/17/22
|
|||||||||||
| 7,500 | 2.10 |
06/30/23
|
|||||||||||
| ---------- | |||||||||||||
| 88,100 | |||||||||||||
| 7,500 | 3.90 |
05/17/22
|
|||||||||||
| 15,000 | 2.10 |
06/30/23
|
|||||||||||
| 45,000 | 1.09 |
02/25/24
|
|||||||||||
| ---------- | |||||||||||||
| 67,500 |
|
(1)
|
Options awarded to employees who did not collect a salary, or reduced or deferred their salary between September 15, 2008 and June 30, 2009. For example, Mr. de Clara, Mr. Kersten and Ms. Prichep did not collect any salary between September 30, 2008 and June 30, 2009.
|
|
(2)
|
Long-term performance options: The Board of Directors has identified the successful Phase III clinical trial for Multikine to be the most important corporate event to create shareholder value. Therefore, one third of the options can be exercised when the first 400 patients are enrolled in CEL-SCI's Phase III head and neck cancer clinical trial. One third of the options can be exercised when all of the patients have been enrolled in the Phase III clinical trial. One third of the options can be exercised when the Phase III trial is completed. The grant-date fair value of these options awarded to the senior management of the Company amounts to $3.3 million in total.
|
Summary
. The following shows certain information as of September 30, 2014 concerning the stock options and stock bonuses granted by CEL-SCI. Each option represents the right to purchase one share of CEL-SCI's common stock.
|
Name of Plan
|
Total Reserved Under Plans | Shares Outstandning Options | Shares Issued | Remaining Options/Shares Under Plans | ||||||||||||
|
Incentive Stock Option Plans
|
1,960,000 | 1,710,997 | N/A | 3,303 | ||||||||||||
|
Non-Qualified Stock Option Plans
|
5,680,000 | 5,120,152 | N/A | 2,929 | ||||||||||||
|
Stock Bonus Plans
|
1,594,000 | N/A | 1,058,896 | 534,348 | ||||||||||||
|
Stock Compensation Plan
|
1,350,000 | N/A | 1,098,621 | 251,379 | ||||||||||||
|
Incentive Stock Bonus Plan
|
16,000,000 | N/A | 15,700,000 | 300,000 | ||||||||||||
52
Of the shares issued pursuant to CEL-SCI's Stock Bonus Plans
,
462,119 shares were issued as part of CEL-SCI's contribution to its 401(k) plan.
The following table shows the weighted average exercise price of the outstanding options granted pursuant to CEL-SCI’s Incentive and Non-Qualified Stock Option Plans as of September 30, 2014, CEL-SCI’s most recent fiscal year end. CEL-SCI's Incentive and Non-Qualified Stock Option Plans have been approved by CEL-SCI's shareholders.
|
Plan category
|
Number of Securities to be Issued Upon Exercise of Outstandning Options (a) | Weighted-Average Exercise Price of Outstanding Options | Number of Securities Remaining Available For Future Issuance Under Equity Compensation Plans, Excluding Securities Reflected in Column (a) | |||||||||
|
Incentive Stock Option Plans
|
1,710,997 | $ | 3.05 | 3,303 | ||||||||
|
Non-Qualified Stock
Option Plans
|
5,120,152 | $ | 2.96 | 2,929 | ||||||||
Long Term Incentive Plans - Awards in Last Fiscal Year
See footnote 7 to the financial statements included as part of this report.
The following table shows, as of November 30, 2013, information with respect to the only persons owning beneficially 5% or more of CEL-SCI’s outstanding common stock and the number and percentage of outstanding shares owned by each director and officer of CEL-SCI and by the officers and directors as a group. Unless otherwise indicated, each owner has sole voting and investment powers over his shares of common stock.
|
Name and Address
|
Number of Shares
(1)
|
Percent of Class
(3)
|
||||||
|
Maximilian de Clara
|
698,448 | 0.80 | % | |||||
|
Bergstrasse 79
|
||||||||
|
6078 Lungern,
|
||||||||
|
Obwalden, Switzerland
|
||||||||
|
Geert R. Kersten
|
10,878,335 | (2) | 11.40 | % | ||||
|
8229 Boone Blvd., Suite 802
|
||||||||
|
Vienna, VA 22182
|
||||||||
|
Patricia B. Prichep
|
3,559,790 | 3.90 | % | |||||
|
8229 Boone Blvd., Suite 802
|
||||||||
|
Vienna, VA 22182
|
||||||||
|
Eyal Talor, Ph.D.
|
3,431,066 | 3.80 | % | |||||
|
8229 Boone Blvd., Suite 802
|
||||||||
|
Vienna, VA 22182
|
||||||||
|
Daniel H. Zimmerman, Ph.D.
|
220,168 | 0.20 | % | |||||
|
8229 Boone Blvd., Suite 802
|
||||||||
|
Vienna, VA 22182
|
||||||||
53
|
John Cipriano
|
1,703,100 | 1.90 | % | |||||
|
8229 Boone Blvd., Suite 802
|
||||||||
|
Vienna, VA 22182
|
||||||||
|
Alexander G. Esterhazy
|
279,549 | 0.30 | % | |||||
|
20 Chemin du Pre-Poiset
|
||||||||
|
CH- 1253 Vandoeuvres
|
||||||||
|
Geneve, Switzerland
|
||||||||
|
C. Richard Kinsolving, Ph.D.
|
297,125 | 0.30 | % | |||||
|
P.O. Box 20193
|
||||||||
|
Bradenton, FL 34204-0193
|
||||||||
|
Peter R. Young, Ph.D.
|
346,943 | 0.40 | % | |||||
|
208 Hewitt Drive
|
||||||||
|
Suite 103-143
|
||||||||
|
Waco, TX 76712
|
||||||||
|
All Officers and Directors as
a Group (9 persons)
|
21,414,524 | 21.90 | % | |||||
|
(1)
|
Includes shares issuable prior to February 28, 2015 upon the exercise of options or warrants granted to the following persons:
|
|
Name
|
Options or Warrants Exercisable
Prior to February 28, 2015
|
|||
|
Maximilian de Clara
|
673,325 | |||
|
Geert R. Kersten
|
4,336,822 | |||
|
Patricia B. Prichep
|
347,010 | |||
|
Eyal Talor, Ph.D.
|
267,052 | |||
|
Daniel Zimmerman
|
160,900 | |||
|
John Cipriano
|
103,100 | |||
|
Alexander G. Esterhazy
|
256,233 | |||
|
C. Richard Kinsolving, Ph.D.
|
266,900 | |||
|
Peter R. Young, Ph.D.
|
317,167 | |||
|
(2)
|
Amount includes shares held in trust for the benefit of Mr. Kersten's children and warrants held in the de Clara Trust, of which Mr. Kersten is the Trustee and a beneficiary. Geert R. Kersten is the stepson of Maximilian de Clara.
|
|
(3)
|
Amount includes shares referred to in (1) above but excludes shares which may be issued upon the exercise or conversion of other options, warrants and other convertible securities previously issued by CEL-SCI.
|
54
None.
BDO USA, LLP served as CEL-SCI’s independent registered public accountant for the two years ended September 30, 2014. The following table shows the aggregate fees billed to CEL-SCI for these years by BDO USA, LLP:
|
Year Ended September 30,
|
||||||||
|
2014
|
2013
|
|||||||
|
Audit Fees
|
$ | 397,000 | $ | 236,000 | ||||
|
Audit-Related Fees
|
- | - | ||||||
|
Tax Fees
|
- | - | ||||||
|
All Other Fees
|
- | - | ||||||
Audit fees represent amounts billed for professional services rendered for the audit of the CEL-SCI’s annual financial statements and the reviews of the financial statements included in CEL-SCI’s 10-Q reports for the fiscal year and all regulatory filings. See Note 1 to the financial statements included with this report for more information.
Before BDO USA, LLP was engaged by CEL-SCI to render audit or non-audit services, the engagement was approved by CEL-SCI’s audit committee. CEL-SCI’s Board of Directors is of the opinion that the Audit Related Fees charged by BDO USA, LLP are consistent with BDO USA, LLP maintaining its independence from CEL-SCI.
(a) See the Financial Statements attached to this Report.
| Exhibits | ||||
|
3(a)
|
Articles of Incorporation
|
Incorporated by reference to Exhibit 3(a) of CEL-SCI's combined Registration Statement on Form S-1 and Post-Effective Amendment ("Registration Statement"), Registration Nos. 2-85547-D and 33-7531.
|
||
|
3(b)
|
Amended Articles
|
Incorporated by reference to Exhibit 3(a) of CEL-SCI's Registration Statement on Form S-1, Registration Nos. 2-85547-D and 33-7531.
|
||
|
3(c)
|
Amended Articles (Name change only)
|
Filed as Exhibit 3(c) to CEL-SCI's Registration Statement on Form S-1 Registration Statement (No. 33-34878).
|
||
|
3(d)
|
Bylaws
|
Incorporated by reference to Exhibit 3(b) of CEL-SCI's Registration Statement on Form S-1, Registration Nos. 2-85547-D and 33-7531.
|
||
| 4 |
Shareholders Rights Agreement
|
Incorporated by reference to Exhibit 4 of CEL-SCI’S report on Form 8-K dated November 7, 2007.
|
||
|
10(d)
|
Employment Agreement with
Maximilian de Clara
|
Incorporated by reference to Exhibit 10(d)
of CEL-SCI’s report on Form 8-K (dated April
21, 2005) and Exhibit 10(d) to CEL-SCI’s
report on Form 8-K dated September 8, 2006.
|
55
|
10(f)
|
Securities Purchase Agreement (together
with schedule required by Instruction 2 to
Item 601 of Regulation S-K) pertaining to
Series K notes and warrants, together with
The exhibits to the Securities Purchase
Agreement.
|
Incorporated by reference to Exhibit 10 to
CEL-SCI’s report on Form 8-K dated
August 4, 2006.
|
||
|
10(g)
|
Subscription Agreement (together with
Schedule required by Instruction 2 to
Item 601 of Regulation S-K) pertaining to
April 2007 sale of 20,000,000 shares of
CEL-SCI’s common stock, 10,000,000
Series L warrants and 10,000,000 Series M
Warrants
|
Incorporated by reference to Exhibit 10 of
CEL-SCI’s report on Form 8-K dated April
18, 2007
|
||
|
10(h)
|
Warrant Adjustment Agreement with
Laksya Ventures
|
Incorporated by reference to Exhibit 10(i) of
CEL-SCI’s report on Form 8-K dated August
3, 2010
|
||
|
10(i)
|
Employment Agreement with Patricia
Prichep (2013-2016)
|
Incorporated by reference to Exhibit 10(j) of
CEL-SCI’s report on Form 8-K dated August
30, 2013
|
||
|
10(j)
|
Employment Agreement with Eyal Taylor
(2013-2016)
|
Incorporated by reference to Exhibit 10(k) of
CEL-SCI’s report on Form 8-K dated August 30, 2013.
|
||
|
10(k)
|
Amendment to Employment Agreement
with Maximilian de Clara
|
Incorporated by reference to Exhibit 10(l) of
CEL-SCI’s report on Form 8-K dated August 30, 2010 and Exhibit 10(l) of CEL-SCI’s report on Form 8-K dated August 30, 2013.
|
||
|
10(l)
|
Amendment to Development Supply
and Distribution Agreement with Orient
Europharma. (part of Exhibit 10(m) has
been omitted pursuant to a request for
confidential treatment).
|
Incorporated by reference to Exhibit 10(m)
filed with CEL-SCI’s 10-K report for the
year ended September 30, 2010.
|
||
|
10(m)
|
Licensing Agreement with Teva
Pharmaceutical Industries Ltd. (parts
of Exhibit 10(n) have been omitted
pursuantto a request for confidential
treatment.)
|
Incorporated by reference to Exhibit 10(n)
filed with CEL-SCI’s 10-K report for the
year ended September 30, 2010.
|
||
|
10(n)
|
Lease Agreement (parts of Exhibit 10(o)
have been omitted pursuant to a request
for confidential treatment).
|
Incorporated by reference to Exhibit 10(o)
filed with CEL-SCI’s 10-K report for the
year ended September 30, 2010.
|
||
|
10(o)
|
Loan Agreements with Maximilian de
Clara
|
Incorporated by reference to Exhibit 10(p)
filed with CEL-SCI’s 10-K report for the
year ended September 30, 2010.
|
||
|
10(p)
|
Licensing Agreement with Byron
Biopharma
|
Incorporated by reference to Exhibit 10(i) of
CEL-SCI’s report on Form 8-K dated March
27, 2009
|
||
|
10(q)
|
At Market Issuance Sales Agreement
with McNicoll, Lewis & Vlak LLC
|
Incorporated by reference to Exhibit 10(r)
filed with CEL-SCI’s 10-K report for the
year ended September 30, 2010
|
||
|
10(z)
|
Development, Supply and Distribution
Agreement with Orient Europharma
|
Incorporated by reference to Exhibit 10(z)
filed with CEL-SCI’s report on Form
10-K for the year ended September 30, 2003.
|
||
|
10(za)
|
Employment Agreement with
Geert Kersten. Amendment to
Employment Agreement
|
Incorporated by reference to Exhibit 10(za)
to CEL-SCI’s report on Form 8-K dated
September 1, 2011 and Exhibit 10(za) of
CEL-SCI’s report on Form 8-K dated August
30, 2013.
|
||
|
10(aa)
|
Securities Purchase Agreement and
form of the Series F warrants, which is
and exhibit to the Securities Purchase
Agreement.
|
Incorporated by reference to Exhibit 10(aa)
of CEL-SCI’s report on Form 8-K dated
October 3, 2011.
|
56
|
10(bb)
|
Placement Agent Agreement
|
Incorporated by reference to Exhibit 10(bb)
of CEL-SCI’s report on Form 8-K dated
October 3, 2011.
|
|
10(cc)
|
Securities Purchase Agreement, together with the form of the Series H warrant, which is an exhibit to the securities Purchase Agreement.
|
Incorporated by reference to Exhibit 10(cc) of CEL-SCI’s report on Form 8-K dated January 25, 2012.
|
||
|
10(dd)
|
Placement Agent Agreement
|
Incorporated by reference to Exhibit 10(dd) of CEL-SCI’s report on Form 8-K dated January 25, 2012.
|
||
|
10(ee)
|
Warrant Amendment Agreement, together with the form of the Series P warrant, which is an exhibit to the Warrant Amendment Agreement.
|
Incorporated by reference to Exhibit 10(ee) of CEL-SCI’s report on Form 8-K dated February 10, 2012.
|
||
|
10(ff)
|
Placement Agent Agreement
|
Incorporated by reference to Exhibit 10(ff) of CEL-SCI’s report on Form 8-K dated February 10, 2012.
|
||
|
10(gg)
|
Securities Purchase Agreement and the form of the Series Q warrant, which is an exhibit to the Securities Purchase Agreement.
|
Incorporated by reference to Exhibit 10(gg) of CEL-SCI’s report on Form 8-K dated June 18, 2012.
|
||
|
10(hh)
|
Placement Agent Agreement
|
Incorporated by reference to Exhibit 10(hh) of CEL-SCI’s report on Form 8-K dated June 18, 2012.
|
||
|
10 (ii)
|
Securities Purchase Agreement and the form of the Series R warrant, which is an exhibit to the Securities Purchase Agreement.
|
Incorporated by reference to Exhibit 10(ii) of CEL-SCI’s report on Form 8-K dated December 5, 2012.
|
||
|
10 (jj)
|
Placement Agent Agreement
|
Incorporated by reference to Exhibit 10(jj) of CEL-SCI’s report on Form 8-K dated December 5, 2012.
|
||
|
10 (nn)
|
Underwriting Agreement, together with the form of Series S warrant which is an exhibit to the underwriting agreement.
|
Incorporated by reference to Exhibit 1.1 of CEL-SCI’s report on Form 8-K dated October 8, 2013.
|
||
|
10 (oo)
|
Underwriting Agreement, together with the form of Series S warrant which is an exhibit to the underwriting agreement.
|
Incorporated by reference to Exhibit 1.1 of CEL-SCI’s report on Form 8-K dated December 19, 2013.
|
||
|
10 (pp)
|
Underwriting Agreement, together with the form of Series T warrant which is an exhibit to the warrant agent agreement.
|
Incorporated by reference to Exhibit 1.1 of CEL-SCI’s report on Form 8-K dated April 15, 2014.
|
||
|
10 (qq)
|
Underwriting Agreement, together with the form of Series S warrant which is an exhibit to the warrant agent agreement.
|
Incorporated by reference to Exhibit 1.1 of CEL-SCI’s report on Form 8-K dated October 23, 2014.
|
||
|
Consent of BDO USA, LLP
|
||||
|
Rule 13a-14(a) Certifications
|
||||
|
Section 1350 Certifications
|
57
SIGNATURES
In accordance with Section 13 or 15(a) of the Exchange Act, the Registrant has caused this Report to be signed on its behalf by the undersigned, thereunto duly authorized on the ____day of December 2014.
|
CEL-SCI CORPORATION
|
|||
|
|
By:
|
/s/ Maximilian de Clara | |
|
Maximilian de Clara, President
|
|||
Pursuant to the requirements of the Securities Act of l934, this Report has been signed below by the following persons on behalf of the Registrant and in the capacities and on the dates indicated.
|
Signature
|
Title
|
Date
|
||
|
/s/
Maximilian de Clara
|
Director
|
December __, 2014
|
||
|
Maximilian de Clara
|
||||
|
/s/
Geert R. Kersten
|
Chief Executive, Principal
Accounting, Principal Financial
Officer and a Director
|
December __, 2014
|
||
|
Geert R. Kersten
|
||||
|
/s/
Alexander G. Esterhazy
|
Director
|
December __, 2014
|
||
|
Alexander G. Esterhazy
|
||||
|
/s/ Dr. C. Richard Kinsolving
|
Director
|
December __, 2014
|
||
|
Dr. C. Richard Kinsolving
|
||||
|
/s/ Dr. Peter R. Young
|
Director
|
December __, 2014
|
||
|
Dr. Peter R. Young
|
58
CEL-SCI CORPORATION
Financial Statements for the Years
Ended September 30, 2014, 2013 and 2012, and
Report of Independent Registered Public Accounting Firm
CEL-SCI CORPORATION
TABLE OF CONTENTS
| Page | ||
|
REPORT OF INDEPENDENT REGISTERED PUBLIC ACCOUNTING FIRM
|
F-2 | |
|
FINANCIAL STATEMENTS FOR THE YEARS
ENDED SEPTEMBER 30, 2014, 2013 and 2012:
|
||
|
Balance Sheets
|
F-3 | |
|
Statements of Operations
|
F-4 | |
|
Statements of Stockholders’ Equity
|
F-5 | |
|
Statements of Cash Flows
|
F-6 | |
|
Notes to Financial Statements
|
F-8 |
F-1
Report of Independent Registered Public Accounting Firm
Board of Directors and Stockholders
CEL-SCI Corporation
Vienna, Virginia
We have audited the accompanying balance sheets of CEL-SCI Corporation as of September 30, 2014 and 2013 and the related statements of operations, stockholders’ equity, and cash flows for each of the three years in the period ended September 30, 2014. These financial statements are the responsibility of the Company’s management. Our responsibility is to express an opinion on these financial statements based on our audits.
We conducted our audits in accordance with the standards of the Public Company Accounting Oversight Board (United States). Those standards require that we plan and perform the audit to obtain reasonable assurance about whether the financial statements are free of material misstatement. An audit includes examining, on a test basis, evidence supporting the amounts and disclosures in the financial statements, assessing the accounting principles used and significant estimates made by management, as well as evaluating the overall financial statement presentation. We believe that our audits provide a reasonable basis for our opinion.
In our opinion, the financial statements referred to above present fairly, in all material respects, the financial position of CEL-SCI Corporation at September 30, 2014 and 2013, and the results of its operations and its cash flows for each of the three years in the period ended September 30, 2014, in conformity with accounting principles generally accepted in the United States of America.
We also have audited, in accordance with the standards of the Public Company Accounting Oversight Board (United States), CEL-SCI Corporation’s internal control over financial reporting as of September 30, 2014 based on criteria established in
Internal Control – Integrated Framework
(1992)
issued by the Committee of Sponsoring Organizations of the Treadway Commission (COSO) and our report dated December 23, 2014 expressed an unqualified opinion thereon.
/s/ BDO USA, LLP
Bethesda, Maryland
December 23, 2014
F-2
CEL-SCI CORPORATION
BALANCE SHEETS
SEPTEMBER 30, 2014 and 2013
|
ASSETS
|
2014
|
2013
|
||||||
|
CURRENT ASSETS:
|
||||||||
|
Cash and cash equivalents
|
$ | 8,513,620 | $ | 41,612 | ||||
|
Receivables
|
81,820 | 74,263 | ||||||
|
Prepaid expenses
|
907,526 | 780,523 | ||||||
|
Deposits - current portion
|
150,000 | - | ||||||
|
Inventory used for R&D and manufacturing
|
1,452,020 | 1,016,628 | ||||||
|
Deferred rent - current portion
|
544,074 | 598,717 | ||||||
|
Total current assets
|
11,649,060 | 2,511,743 | ||||||
|
RESEARCH AND OFFICE EQUIPMENT, net
|
403,004 | 489,336 | ||||||
|
PATENT COSTS, net
|
323,588 | 318,195 | ||||||
|
DEFERRED RENT - net of current portion
|
4,733,865 | 5,448,381 | ||||||
|
DEPOSITS
|
2,120,917 | 2,070,917 | ||||||
|
TOTAL ASSETS
|
$ | 19,230,434 | $ | 10,838,572 | ||||
|
LIABILITIES AND STOCKHOLDERS' EQUITY
|
||||||||
|
CURRENT LIABILITIES:
|
||||||||
|
Accounts payable
|
$ | 1,160,783 | $ | 1,924,482 | ||||
|
Accrued expenses
|
547,208 | 113,496 | ||||||
|
Due to employees
|
307,961 | 386,337 | ||||||
|
Related party loan
|
1,104,057 | 1,104,057 | ||||||
|
Deferred rent - current portion
|
6,375 | 8,529 | ||||||
|
Lease obligation - current portion
|
8,495 | 8,212 | ||||||
|
Derivative instruments - current portion
|
18,105 | - | ||||||
|
Total current liabilities
|
3,152,984 | 3,545,113 | ||||||
|
Derivative instruments - net of current portion
|
5,487,141 | 433,024 | ||||||
|
Deferred revenue
|
126,591 | 126,545 | ||||||
|
Deferred rent - net of current portion
|
6,290 | 7,875 | ||||||
|
Lease obligation - net of current portion
|
9,028 | 20,925 | ||||||
|
Deposits held
|
5,000 | 5,000 | ||||||
|
Total liabilities
|
8,787,034 | 4,138,482 | ||||||
|
COMMITMENTS AND CONTINGENCIES
|
||||||||
|
STOCKHOLDERS' EQUITY
|
||||||||
|
Preferred stock, $.01 par value-200,000 shares authorized;
|
||||||||
|
-0- shares issued and outstanding
|
- | - | ||||||
|
Common stock, $.01 par value - 600,000,000 shares authorized;
|
||||||||
|
81,902,471 and 31,025,019 shares issued and outstanding
|
||||||||
|
at September 30, 2014 and 2013, respectively
|
819,025 | 310,250 | ||||||
|
Additional paid-in capital
|
249,151,208 | 218,550,408 | ||||||
|
Accumulated deficit
|
(239,526,833 | ) | (212,160,568 | ) | ||||
|
Total stockholders' equity
|
10,443,400 | 6,700,090 | ||||||
|
TOTAL LIABILITIES AND STOCKHOLDERS' EQUITY
|
$ | 19,230,434 | $ | 10,838,572 | ||||
See notes to financial statements.
F-3
CEL-SCI CORPORATION
STATEMENTS OF OPERATIONS
YEARS ENDED SEPTEMBER 30, 2014, 2013 and 2012
|
2014
|
2013
|
2012
|
||||||||||
|
GRANT INCOME AND OTHER
|
$ | 264,033 | $ | 159,583 | $ | 254,610 | ||||||
|
OPERATING EXPENSES:
|
||||||||||||
|
Research and development (excluding
|
||||||||||||
|
R&D depreciation of $172,442, $253,072
|
||||||||||||
|
and $445,710 respectively, included below)
|
17,000,145 | 12,681,049 | 10,368,695 | |||||||||
|
Depreciation and amortization
|
231,752 | 364,124 | 533,468 | |||||||||
|
General & administrative
|
10,606,248 | 6,982,686 | 6,595,287 | |||||||||
|
Total operating expenses
|
27,838,145 | 20,027,859 | 17,497,450 | |||||||||
|
OPERATING LOSS
|
(27,574,112 | ) | (19,868,276 | ) | (17,242,840 | ) | ||||||
|
GAIN ON DERIVATIVE INSTRUMENTS
|
248,767 | 10,750,666 | 1,911,683 | |||||||||
|
INTEREST INCOME
|
122,854 | 117,086 | 116,061 | |||||||||
|
INTEREST EXPENSE
|
(163,774 | ) | (170,423 | ) | (262,214 | ) | ||||||
|
NET LOSS
|
(27,366,265 | ) | (9,170,947 | ) | (15,477,310 | ) | ||||||
|
ISSUANCE OF ADDITIONAL SHARES DUE TO RESET PROVISIONS
|
(1,117,447 | ) | - | (250,000 | ) | |||||||
|
MODIFICATIONS OF WARRANTS
|
- | (59,531 | ) | (325,620 | ) | |||||||
|
INDUCEMENT WARRANTS
|
- | - | (1,593,000 | ) | ||||||||
|
NET LOSS AVAILABLE TO COMMON SHAREHOLDERS
|
$ | (28,483,712 | ) | $ | (9,230,478 | ) | $ | (17,645,930 | ) | |||
|
NET LOSS PER COMMON SHARE
|
||||||||||||
|
BASIC
|
$ | (0.48 | ) | $ | (0.30 | ) | $ | (0.70 | ) | |||
|
DILUTED
|
$ | (0.49 | ) | $ | (0.66 | ) | $ | (0.78 | ) | |||
|
WEIGHTED AVERAGE COMMON SHARES
|
||||||||||||
|
OUTSTANDING
|
||||||||||||
|
BASIC and DILUTED
|
58,804,622 | 30,279,442 | 25,183,654 | |||||||||
See notes to financial statements.
F-4
CEL-SCI CORPORATION
STATEMENTS OF STOCKHOLDERS' EQUITY
YEARS ENDED SEPTEMBER 30, 2014, 2013, and 2012
|
Additional
|
||||||||||||||||||||
|
Common
|
Stock
|
Paid-In
|
Accumulated
|
|||||||||||||||||
|
Shares
|
Amount
|
Capital
|
Deficit
|
Total
|
||||||||||||||||
|
BALANCE, October 1, 2011
|
21,473,461 | $ | 214,735 | $ | 196,376,400 | $ | (187,512,311 | ) | $ | 9,078,824 | ||||||||||
|
Sale of stock
|
4,616,667 | 46,167 | 14,243,351 | - | 14,289,518 | |||||||||||||||
|
Issuance of warrants in connection with
|
||||||||||||||||||||
|
sale of common stock
|
- | - | (6,706,667 | ) | - | (6,706,667 | ) | |||||||||||||
|
401(k) contributions paid
|
||||||||||||||||||||
|
in common stock
|
42,627 | 426 | 154,090 | - | 154,516 | |||||||||||||||
|
Exercise of warrants and stock options
|
1,019,119 | 10,191 | 2,654,348 | - | 2,664,539 | |||||||||||||||
|
Stock issued to nonemployees for service
|
160,618 | 1,606 | 556,686 | - | 558,292 | |||||||||||||||
|
Exercise of derivative liabilities
|
- | - | 122,367 | - | 122,367 | |||||||||||||||
|
Modification of options issued to consultants
|
- | - | 54,789 | - | 54,789 | |||||||||||||||
|
Modification of options issued to employees
|
- | - | 36,990 | - | 36,990 | |||||||||||||||
|
Equity based compensation - employees
|
- | - | 2,229,326 | - | 2,229,326 | |||||||||||||||
|
Equity based compensation - non-employees
|
- | - | 22,248 | - | 22,248 | |||||||||||||||
|
Net loss
|
- | - | - | (15,477,310 | ) | (15,477,310 | ) | |||||||||||||
|
BALANCE, SEPTEMBER 30, 2012
|
27,312,492 | 273,125 | 209,743,928 | (202,989,621 | ) | 7,027,432 | ||||||||||||||
|
Sale of stock
|
3,500,000 | 35,000 | 9,753,769 | - | 9,788,769 | |||||||||||||||
|
Issuance of warrants in connection with
|
||||||||||||||||||||
|
sale of common stock
|
- | - | (4,200,000 | ) | - | (4,200,000 | ) | |||||||||||||
|
401(k) contributions paid
|
||||||||||||||||||||
|
in common stock
|
74,230 | 742 | 158,114 | - | 158,856 | |||||||||||||||
|
Stock issued to nonemployees for service
|
138,297 | 1,383 | 359,542 | - | 360,925 | |||||||||||||||
|
Equity based compensation - employees
|
- | - | 2,636,905 | - | 2,636,905 | |||||||||||||||
|
Equity based compensation - non-employees
|
- | - | 98,150 | - | 98,150 | |||||||||||||||
|
Net loss
|
- | - | - | (9,170,947 | ) | (9,170,947 | ) | |||||||||||||
|
BALANCE, SEPTEMBER 30, 2013
|
31,025,019 | 310,250 | 218,550,408 | (212,160,568 | ) | 6,700,090 | ||||||||||||||
|
Sale of stock
|
31,755,494 | 317,555 | 28,129,691 | - | 28,447,246 | |||||||||||||||
|
Issuance of warrants in connection with
|
||||||||||||||||||||
|
sale of common stock
|
- | - | (7,791,448 | ) | - | (7,791,448 | ) | |||||||||||||
|
401(k) contributions paid
|
||||||||||||||||||||
|
in common stock
|
164,787 | 1,647 | 153,787 | - | 155,434 | |||||||||||||||
|
Exercise of warrants
|
2,668,508 | 26,686 | 4,253,632 | - | 4,280,318 | |||||||||||||||
| Conversion of warrant liability to equity | - | - | 1,308,528 | - | 1,308,528 | |||||||||||||||
|
Stock issued to nonemployees for service
|
579,968 | 5,800 | 621,318 | - | 627,118 | |||||||||||||||
|
Stock issued for patents
|
8,695 | 87 | 9,912 | - | 9,999 | |||||||||||||||
|
Modification of options issued to consultants
|
- | - | 76,991 | - | 76,991 | |||||||||||||||
|
Issuance of restricted stock
|
15,700,000 | 157,000 | (157,000 | ) | - | - | ||||||||||||||
|
Equity based compensation - employees
|
- | - | 3,958,637 | - | 3,958,637 | |||||||||||||||
|
Equity based compensation - non-employees
|
- | - | 36,752 | - | 36,752 | |||||||||||||||
|
Net loss
|
- | - | - | (27,366,265 | ) | (27,366,265 | ) | |||||||||||||
|
BALANCE, SEPTEMBER 30, 2014
|
81,902,471 | $ | 819,025 | $ | 249,151,208 | $ | (239,526,833 | ) | $ | 10,443,400 | ||||||||||
See notes to financial statements.
F-5
CEL-SCI CORPORATION
STATEMENTS OF CASH FLOWS
YEARS ENDED SEPTEMBER 30, 2014, 2013 and 2012
|
2014
|
2013
|
2012
|
||||||||||
|
CASH FLOWS FROM OPERATING ACTIVITIES:
|
||||||||||||
|
Net loss
|
$ | (27,366,265 | ) | $ | (9,170,947 | ) | $ | (15,477,310 | ) | |||
|
Adjustments to reconcile net loss to
|
||||||||||||
|
net cash used in operating activities:
|
||||||||||||
|
Depreciation and amortization
|
231,752 | 364,124 | 533,468 | |||||||||
|
Issuance of common stock, warrants and options for services
|
694,955 | 454,855 | 527,207 | |||||||||
|
Modification of warrants issued to consultants
|
76,991 | - | 54,789 | |||||||||
|
Modification of stock options issued to employees
|
- | - | 36,990 | |||||||||
|
Equity based compensation
|
3,958,637 | 2,636,905 | 2,229,326 | |||||||||
|
Common stock contributed to 401(k) plan
|
155,434 | 158,856 | 154,516 | |||||||||
|
Impairment loss on abandonment of patents
|
1,182 | 22,628 | 44,921 | |||||||||
|
Loss on retired equipment
|
268 | 4,350 | 9,399 | |||||||||
|
Gain on derivative instruments
|
(248,767 | ) | (10,750,666 | ) | (1,911,683 | ) | ||||||
|
(Increase)/decrease in assets:
|
||||||||||||
|
Receivables
|
(7,557 | ) | 84,351 | 298,723 | ||||||||
|
Deferred rent
|
769,159 | 544,028 | 598,714 | |||||||||
|
Prepaid expenses
|
(158,088 | ) | 529,738 | 775,823 | ||||||||
|
Inventory used for R&D and manufacturing
|
(435,392 | ) | 367,856 | 186,698 | ||||||||
|
Deposits
|
(200,000 | ) | (400,000 | ) | - | |||||||
|
Increase/(decrease) in liabilities:
|
||||||||||||
|
Accounts payable
|
(751,971 | ) | 1,316,964 | (168,463 | ) | |||||||
|
Accrued expenses
|
433,712 | 101,995 | (99,006 | ) | ||||||||
|
Deferred revenue
|
46 | 45 | 1,500 | |||||||||
|
Due to employees
|
(78,376 | ) | 186,446 | (2,611 | ) | |||||||
|
Deferred rent liability
|
(3,739 | ) | (108 | ) | 11,986 | |||||||
|
Deposits held
|
- | - | 5,000 | |||||||||
|
Net cash used in operating activities
|
(22,928,019 | ) | (13,548,580 | ) | (12,190,013 | ) | ||||||
|
CASH FLOWS FROM INVESTING ACTIVITIES:
|
||||||||||||
|
Purchases of equipment
|
(103,977 | ) | (102,033 | ) | (54,637 | ) | ||||||
|
Expenditures for patent costs
|
(34,887 | ) | (30,728 | ) | (78,959 | ) | ||||||
|
Net cash used in investing activities
|
(138,864 | ) | (132,761 | ) | (133,596 | ) | ||||||
|
CASH FLOWS FROM FINANCING ACTIVITIES:
|
||||||||||||
|
Proceeds from issuance of common stock and warrants
|
28,428,641 | 9,788,769 | 14,289,518 | |||||||||
|
Proceeds from exercise of warrants and stock options
|
3,118,387 | - | 2,664,539 | |||||||||
|
Payments on convertible debt
|
- | - | (4,950,000 | ) | ||||||||
|
Payments on obligations under capital lease
|
(8,137 | ) | (6,858 | ) | - | |||||||
|
Net cash provided by financing activities
|
31,538,891 | 9,781,911 | 12,004,057 | |||||||||
|
NET INCREASE (DECREASE) IN CASH AND CASH EQUIVALENTS
|
8,472,008 | (3,899,430 | ) | (319,552 | ) | |||||||
|
CASH AND CASH EQUIVALENTS, BEGINNING OF YEAR
|
41,612 | 3,941,042 | 4,260,594 | |||||||||
|
CASH AND CASH EQUIVALENTS, END OF YEAR
|
$ | 8,513,620 | $ | 41,612 | $ | 3,941,042 | ||||||
See notes to financial statements.
F-6
CEL-SCI CORPORATION
STATEMENTS OF CASH FLOWS
YEARS ENDED SEPTEMBER 30, 2014, 2013 and 2012
|
2014
|
2013
|
2012
|
||||||||||
|
ISSUANCE OF WARRANTS:
|
||||||||||||
|
Increase in derivative liabilities
|
$ | (7,791,448 | ) | $ | (4,200,000 | ) | $ | (6,706,667 | ) | |||
|
Decrease in additional paid-in capital
|
7,791,448 | 4,200,000 | 6,706,667 | |||||||||
| $ | - | $ | - | $ | - | |||||||
|
ISSUANCE OF ADDITIONAL SHARES:
|
||||||||||||
|
Increase in common stock
|
$ | (15,631 | ) | $ | - | $ | (8,333 | ) | ||||
|
Increase in additional paid-in capital
|
(1,101,816 | ) | - | (241,667 | ) | |||||||
|
Decrease in additional paid-in capital
|
1,117,447 | - | 250,000 | |||||||||
| $ | - | $ | - | $ | - | |||||||
|
EXERCISE OF WARRANTS
|
||||||||||||
|
Increase in common stock
|
$ | (657 | ) | $ | - | $ | - | |||||
|
Increase in additional paid-in capital
|
(1,161,274 | ) | - | (122,367 | ) | |||||||
|
Decrease in derivative liabilities
|
1,161,931 | - | 122,367 | |||||||||
| $ | - | $ | - | $ | - | |||||||
|
INDUCEMENT WARRANTS
|
||||||||||||
|
Increase in additional paid-in capital
|
$ | - | $ | - | $ | (1,593,000 | ) | |||||
|
Decrease in additional paid-in capital
|
- | - | 1,593,000 | |||||||||
| $ | - | $ | - | $ | - | |||||||
|
RECLASSIFICATION/MODIFICATION OF WARRANTS:
|
||||||||||||
|
Increase in additional paid-in capital
|
$ | (1,308,528 | ) | $ | - | $ | (325,620 | ) | ||||
|
Decrease in additional paid-in capital
|
325,620 | |||||||||||
|
Decrease in derivative liabilities
|
1,308,528 | - | - | |||||||||
| $ | - | $ | - | $ | - | |||||||
|
ISSUANCE OF COMMON STOCK FOR PREPAID SERVICES
|
||||||||||||
|
Increase in additional paid-in capital
|
$ | (31,085 | ) | $ | (57,553 | ) | $ | (53,333 | ) | |||
|
Increase in prepaid expenses
|
31,085 | 57,553 | 53,333 | |||||||||
| $ | - | $ | - | $ | - | |||||||
|
ISSUANCE OF COMMON STOCK FOR PATENT COSTS
|
||||||||||||
|
Increase in common stock
|
$ | (87 | ) | $ | - | $ | - | |||||
|
Increase in additional paid in capital
|
(9,912 | ) | - | - | ||||||||
|
Increase in patent costs
|
9,999 | - | - | |||||||||
| $ | - | $ | - | $ | - | |||||||
|
PATENT COSTS INCLUDED IN ACCOUNTS PAYABLE
|
||||||||||||
|
Increase in patent costs
|
$ | 4,474 | $ | 14,024 | $ | 22,379 | ||||||
|
Increase in accounts payable
|
(4,474 | ) | (14,024 | ) | (22,379 | ) | ||||||
| $ | - | $ | - | $ | - | |||||||
|
NON-CASH EQUIPMENT CHANGES
|
||||||||||||
|
Increase (decrease) in research and office equipment
|
$ | (1,074 | ) | $ | 36,622 | $ | - | |||||
|
Increase in accounts payable
|
(2,345 | ) | - | - | ||||||||
|
Decrease (increase) in capital lease obligation
|
3,419 | (36,622 | ) | - | ||||||||
| $ | - | $ | - | $ | - | |||||||
|
CAPITAL LEASE PAYMENTS INCLUDED IN
|
||||||||||||
|
ACCOUNTS PAYABLE:
|
||||||||||||
|
Decrease in capital lease obligation
|
$ | 58 | $ | 627 | $ | - | ||||||
|
Increase in accounts payable
|
(58 | ) | (627 | ) | - | |||||||
| $ | - | $ | - | $ | - | |||||||
|
SUPPLEMENTAL DISCLOSURE OF CASH FLOWS
|
||||||||||||
|
INFORMATION:
|
||||||||||||
|
Cash expenditure for interest expense
|
$ | 180,654 | $ | 156,225 | $ | 377,715 | ||||||
See notes to financial statements.
F-7
CEL-SCI CORPORATION
NOTES TO FINANCIAL STATEMENTS
1. ORGANIZATION AND SUMMARY OF SIGNIFICANT ACCOUNTING POLICIES
CEL-SCI Corporation (the Company) was incorporated on March 22, 1983, in the state of Colorado, to finance research and development in biomedical science and ultimately to engage in marketing and selling products.
CEL-SCI’s work is focused on finding the best way to activate the immune system to fight cancer and infectious diseases. The Company’s lead investigational therapy, Multikine (Leukocyte Interleukin, Injection), is currently being tested in a Phase III clinical trial as a potential therapeutic agent directed at using the immune system to produce an anti-tumor immune response for advanced primary head and neck cancer. Data from Phase I and Phase II clinical trials suggest Multikine has the potential to directly affect tumor cells. These data also indicate that it appears to activate the patient’s own anti-tumor immune response. Multikine (Leukocyte Interleukin, Injection) is the full name of this investigational therapy, which, for simplicity, is referred to in the remainder of this document as Multikine. Multikine is the trademark that the Company has registered for this investigational therapy, and this proprietary name is subject to FDA review in connection with the Company’s future anticipated regulatory submission for approval. Multikine has not been licensed or approved by the FDA or any other regulatory agency. Neither has its safety or efficacy been established for any use.
Multikine has been cleared by the regulators in seventeen countries around the world, including the U.S. FDA, for a global Phase III clinical trial in advanced primary (not yet treated) head and neck cancer patients. Multikine is also being used in a Phase I study at the Naval Medical Center, San Diego under a Cooperative Research and Development Agreement (CRADA) in HIV/HPV co-infected men and women with peri-anal warts.
On June 25, 2013, CEL-SCI’s shareholders approved a reverse split of the Company’s common stock. The reverse split became effective on the NYSE MKT on September 25, 2013. On that date, every ten issued and outstanding shares of the Company’s common stock automatically converted into one outstanding share. As a result of the reverse stock split, the number of the Company’s outstanding shares of common stock decreased from 310,005,272 (pre-split) shares to 31,001,686 (post-split) shares. In addition, by reducing the number of CEL-SCI’s outstanding shares, CEL-SCI’s loss per share in all prior periods will increase by a factor of ten. The reverse stock split affected all stockholders of the Company’s common stock uniformly, and did not affect any stockholder’s percentage of ownership interest. The par value of the Company’s stock remained unchanged at $0.01 per share and the number of authorized shares of common stock remained the same after the reverse stock split.
As the par value per share of the Company’s common stock remained unchanged at $0.01 per share, a total of $2,790,036 was reclassified from common stock to additional paid-in capital. In connection with this reverse stock split, the number of shares of common stock reserved for issuance under the Company’s incentive and non-qualified stock option plans (Note 7) as well as the shares of common stock underlying outstanding stock options, and warrants were also proportionately reduced while the exercise prices of such stock options and warrants were proportionately increased. All references to shares of common stock and per share data for all periods presented in the accompanying financial statements and notes thereto have been adjusted to reflect the reverse stock split on a retroactive basis.
F-8
Summary of Significant accounting policies:
Cash and Cash Equivalents
– For purposes of the statements of cash flows, cash and cash equivalents consist principally of unrestricted cash on deposit and short-term money market funds. The Company considers all highly liquid investments with a maturity when purchased of less than three months as cash and cash equivalents.
Prepaid Expenses and Inventory
– Prepaid expenses are payments for future services to be rendered and are expensed over the time period for which the service is rendered. Prepaid expenses may also include payment for goods to be received within one year of the payment date. Inventory consists of manufacturing production advances and bulk purchases of laboratory supplies to be consumed in the manufacturing of the Company’s product for clinical studies. Inventories are stated at the lower of cost or market, where cost is determined using the first-in, first out method applied on a consistent basis.
Deposits
– The deposits are required by the lease agreement for the manufacturing facility and by the clinical research organization (CRO) agreements.
Research and Office Equipment and Leasehold Improvements
– Research and office equipment is recorded at cost and depreciated using the straight-line method over estimated useful lives of five to seven years. Leasehold improvements are depreciated over the shorter of the estimated useful life of the asset or the term of the lease. Repairs and maintenance which do not extend the life of the asset are expensed when incurred. The fixed assets are reviewed on a quarterly basis to assess impairment, if any
.
Patents
– Patent expenditures are capitalized and amortized using the straight-line method over the shorter of the expected useful life or the legal life of the patent (17 years). In the event changes in technology or other circumstances impair the value or life of the patent, appropriate adjustment to the asset value and period of amortization is made. An impairment loss is recognized when estimated future undiscounted cash flows expected to result from the use of the asset, and from disposition, is less than the carrying value of the asset. The amount of the impairment loss would be the difference between the estimated fair value of the asset and its carrying value.
Deferred Rent (Asset)
– Consideration paid, including deposits, related to operating leases is recorded as a deferred rent asset and amortized as rent expense over the lease term. Interest on the deferred rent is calculated at 3% on the funds deposited on the manufacturing facility and is included in deferred rent. This interest income will be used to offset future rent.
Deferred Rent (Liability)
– Certain of the Company’s operating leases provide for minimum annual payments that adjust over the life of the lease. The aggregate minimum annual payments are expensed on a straight-line basis over the minimum lease term. The Company recognizes a deferred rent liability for rent escalations when the amount of straight-line rent exceeds the lease payments, and reduces the deferred rent liability when the lease payments exceed the straight-line rent expense. For tenant improvement allowances and rent holidays, the Company records a deferred rent liability and amortizes the deferred rent over the lease term as a reduction to rent expense.
F-9
Derivative Instruments
- The Company has entered into financing arrangements that consist of freestanding derivative instruments that contain embedded derivative features. The Company accounts for these arrangements in accordance with Accounting Standards Codification (ASC) 815, “Accounting for Derivative Instruments and Hedging Activities”. In accordance with accounting principles generally accepted in the United States (U.S.GAAP), derivative instruments and hybrid instruments are recognized as either assets or liabilities on the balance sheet and are measured at fair value with gains or losses recognized in earnings or other comprehensive income depending on the nature of the derivative or hybrid instruments. The Company determines the fair value of derivative instruments and hybrid instruments based on available market data using appropriate valuation models, giving consideration to all of the rights and obligations of each instrument. The derivative liabilities are remeasured at fair value at the end of each reporting period as long as they are outstanding.
Research and Development Grant Revenues
– The Company's grant arrangements are handled on a reimbursement basis. Grant revenues under the arrangements are recognized when costs are incurred.
Research and Development Costs
– Research and development expenditures are expensed as incurred.
Net Loss Per Common Share
– The Company calculates net loss per common share in accordance with ASC 260 “Earnings Per Share” (ASC 260). Basic and diluted net loss per common share was determined by dividing net loss applicable to common shareholders by the weighted average number of common shares outstanding during the period. The Company’s potentially dilutive shares, which include outstanding common stock options, restricted stock units, convertible preferred stock and common stock warrants, have not been included in the computation of diluted net loss per share for all periods as the result would be anti-dilutive.
Concentration of Credit Risk
– Financial instruments, which potentially subject the Company to concentrations of credit risk, consist of cash and cash equivalents. The Company maintains its cash and cash equivalents with high quality financial institutions. At times, these accounts may exceed federally insured limits. The Company has not experienced any losses in such bank accounts. The Company believes it is not exposed to significant credit risk related to cash and cash equivalents. All non-interest bearing cash balances were fully insured
up to $250,000 at September 30, 2014.
Income Taxes
– The Company uses the asset and liability method of accounting for income taxes. Under the asset and liability method, deferred tax assets and liabilities are recognized for future tax consequences attributable to differences between the financial statement carrying amounts of existing assets and liabilities and their respective tax bases and operating and tax loss carryforwards. Deferred tax assets and liabilities are measured using enacted tax rates expected to apply to taxable income in the years in which those temporary differences are expected to be recovered or settled. The effect on deferred tax assets and liabilities of a change in tax rates is recognized in income in the period that includes the enactment date. The Company records a valuation allowance to reduce the deferred tax assets to the amount that is more likely than not to be recognized.
F-10
Use of Estimates
– The preparation of financial statements in conformity U.S. GAAP requires management to make estimates and assumptions that affect the amounts reported in the financial statements and the accompanying disclosures. These estimates are based on management’s best knowledge of current events and actions the Company may undertake in the future. Estimates are used in accounting for, among other items, inventory obsolescence, accruals, stock options, useful lives for depreciation and amortization of long-lived assets, deferred tax assets and the valuation of derivative liabilities. Actual results could differ from estimates, although management does not generally believe such differences would materially affect the financial statements in any given year. However, in regard to the valuation of derivative liabilities determined using various valuation techniques including the Black-Scholes and binomial pricing methodologies, significant fluctuations may materially affect the financial statements in a given year. The Company considers such valuations to be significant estimates.
Fair Value Measurements
– The Company evaluates financial assets and liabilities subject to fair value measurements in accordance with a fair value hierarchy to prioritize the inputs used to measure fair value. A financial instrument’s level within the fair value hierarchy is based on the lowest level of input significant to the fair value measurement, where Level 1 is the highest and Level 3 is the lowest. See Note 12 for the definition of levels and the classification of assets and liabilities in those levels.
Stock-Based Compensation
– Compensation cost for all stock-based awards is measured at fair value as of the grant date in accordance with the provisions of ASC 718, “Compensation – Stock Compensation.” The fair value of stock options is calculated using the Black-Scholes option pricing model. The Black-Scholes model requires various judgmental assumptions including volatility and expected option life. The stock-based compensation cost is recognized on the straight line allocation method as expense over the requisite service or vesting period.
Equity instruments issued to non-employees are accounted for in accordance with ASC 505-50, “Equity-Based Payments to Non-Employees.” Accordingly, compensation is recognized when goods or services are received and is measured using the Black-Scholes valuation model. The Black-Scholes model requires various judgmental assumptions regarding the fair value of the equity instruments at the measurement date and the expected life of the options.
The Company has Incentive Stock Option Plans, Non-Qualified Stock Options Plans, a Stock Compensation Plan, Stock Bonus Plans and an Incentive Stock Bonus Plan. In some cases, these Plans are collectively referred to as the “Plans.” All Plans have been approved by the stockholders.
F-11
The Company’s stock options are not transferable, and the actual value of the stock options that an employee may realize, if any, will depend on the excess of the market price on the date of exercise over the exercise price. The Company has based its assumption for stock price volatility on the variance of daily closing prices of the Company’s stock. The risk-free interest rate assumption was based on the U
.
S
.
Treasury rate at date of the grant with term equal to the expected life of the option. Historical data was used to estimate option exercise and employee termination within the valuation model. The expected term of options represents the period of time that options granted are expected to be outstanding and has been determined based on an analysis of historical exercise behavior. If any of the assumptions used in the Black-Scholes model change significantly, stock-based compensation expense for new awards may differ materially in the future from that recorded in the current period.
Vesting of restricted stock granted under the Incentive Stock Bonus Plan is subject to service, performance or market conditions and meets the classification of equity awards. These awards were measured at fair market value on the grant-dates for issuances where the attainment of performance criteria is probable and at fair value on the grant-dates, using a Monte Carlo simulation for issuances where the attainment of performance criteria is uncertain. The total compensation cost will be expensed over the estimated requisite service period.
Recent Accounting Pronouncements
– In November 2014, the FASB issued guidance codified in ASC 815,
Derivatives and Hedging
: Determining Whether the Host Contract in a Hybrid Financial Instrument Issued in the Form of a Share is More Akin to Debt or to Equity. This accounting standard update will be effective for the Company beginning in the first quarter of fiscal 2017. The Company is currently evaluating the impact of the provisions of the update.
The Company has considered all other recently issued accounting pronouncements and does not believe the adoption of such pronouncements will have a material impact on its financial statements.
2. DERIVATIVES LIABILITIES, WARRANTS AND OTHER OPTIONS
Below is a chart presenting the derivative liabilities, warrants and other options outstanding at September 30, 2014:
|
Warrants
|
Issue Date
|
Shares Issuable upon Exercise of
Warrants
|
Exercise
Price
|
Expiration Date
|
Refer-ence
|
||||||||||
|
Series N
|
8/18/08
|
2,844,627 | 0.53 |
8/18/15
|
1 | ||||||||||
|
Series A
|
6/24/09
|
130,347 | 5.00 |
12/24/14
|
1 | ||||||||||
|
Schleuning (Series A)
|
7/8/09
|
16,750 | 5.00 |
1/8/15
|
1 | ||||||||||
|
Series B
|
9/4/09
|
- | 6.80 |
9/4/14
|
1 | ||||||||||
|
Series C
|
8/20/09 – 8/26/09
|
463,487 | 5.50 |
2/20/15
|
1 | ||||||||||
|
Series E
|
9/21/09
|
- | 17.50 |
8/12/14
|
1 | ||||||||||
|
Series F
|
10/6/11
|
1,200,000 | 4.00 |
10/6/14
|
1 | ||||||||||
|
Series G
|
10/6/11
|
- | 4.00 |
8/12/14
|
1 | ||||||||||
|
Series H
|
1/26/12
|
1,200,000 | 5.00 |
8/1/15
|
1 | ||||||||||
|
Series Q
|
6/21/12
|
1,200,000 | 5.00 |
12/22/15
|
1 | ||||||||||
|
Series R
|
12/6/12
|
2,625,000 | 4.00 |
12/6/16
|
1 | ||||||||||
|
Series S
|
10/11/13-12/24/13
|
23,624,326 | 1.25 |
10/11/18
|
1 | ||||||||||
|
Series T
|
4/17/14
|
1,782,057 | 1.58 |
10/17/14
|
1 | ||||||||||
|
Series U
|
4/17/14
|
445,514 | 1.75 |
10/17/17
|
1 | ||||||||||
|
Series L
|
4/18/07
|
- | 7.50 |
4/17/14
|
2 | ||||||||||
|
Series L (repriced)
|
4/18/07
|
70,000 | 2.50 |
4/2/15
|
2 | ||||||||||
|
Series P
|
2/10/12
|
590,001 | 4.50 |
3/6/17
|
3 | ||||||||||
|
Private Investor
|
7/18/05
|
- | 6.50 |
7/18/14
|
4 | ||||||||||
|
Warrants held by Officer and Director
|
6/24/09 – 7/6/09
|
349,754 | 4.00 – 5.00 |
12/24/14 – 1/6/15
|
5 | ||||||||||
|
Consultants
|
2/15/05 – 4/25/14
|
149,500 | 0.85 – 20.00 |
2/15/15 - 12/27/17
|
6 | ||||||||||
F-12
|
1.
|
Derivative Liabilities
|
The table below presents the derivative instruments and their respective balances at September 30.
|
2014
|
2013
|
|||||||
|
Series N warrants
|
$ | - | $ | 41,501 | ||||
|
Series A through E warrants
|
6,105 | 6,106 | ||||||
|
Series F and G warrants
|
- | 12,667 | ||||||
|
Series H warrants
|
12,000 | 36,000 | ||||||
|
Series Q warrants
|
12,000 | 48,000 | ||||||
|
Series R warrants
|
157,500 | 288,750 | ||||||
|
Series S warrants
|
5,197,352 | - | ||||||
|
Series T warrants
|
- | - | ||||||
|
Series U warrants
|
120,289 | - | ||||||
|
|
||||||||
|
Total derivative liabilities
|
$ | 5,505,246 | $ | 433,024 | ||||
The Company reviews all outstanding warrants in accordance with the requirements of ASC 815. This topic provides that an entity should use a two-step approach to evaluate whether an equity-linked financial instrument (or embedded feature) is indexed to its own stock, including evaluating the instrument’s contingent exercise and settlement provisions. The warrant agreements provide for adjustments to the exercise price for certain dilutive events. Under the provisions of ASC 815, the warrants are not considered indexed to the Company’s stock because future equity offerings or sales of the Company’s stock are not an input to the fair value of a “fixed-for-fixed” option on equity shares, and equity classification is therefore precluded.
In accordance with ASC 815, derivative liabilities must be measured at fair value upon issuance and re-valued at the end of each reporting period through expiration. Any change in fair value between the respective reporting periods is recognized as a gain or loss in the statement of operations.
Series N Warrants
In August 2008, CEL-SCI sold 138,339 shares of common stock and 207,508 Series N warrants in a private financing for $1,037,500. In June 2009, an additional 116,667 shares and 181,570 Series N warrants were issued to the investors. In October 2011, the outstanding 389,078 Series N warrants issued were reset from $4.00 to $3.00. In addition, the investors were issued 129,693 warrants exercisable at $3.00 per share at an initial cost of $220,478.
On October 11, 2013 and December 24, 2013, in connection with public offerings of common stock on those dates, the Company reset the exercise price from $3.00 to $0.53 and issued the Series N warrant holders 2,432,649 additional warrants exercisable at $0.53 as required by the warrant agreements. In January 2014, the Company offered the investors the option to extend the Series N warrants by one year and allow for cashless exercise, in exchange for cancelling the reset provision in the warrant agreement. One of the investors with 2,844,627 warrants accepted this offer. Accordingly, these warrants are no longer considered a derivative liability due to the cancelation of the reset provision. The fair value of the warrants on that date totaled $1,308,528 and was reclassified from derivative liabilities to additional paid-in capital. On March 21, 2014, the other investor exercised 106,793 Series N Warrants. The Company received cash proceeds of $7,424 for 14,078 of the warrants exercised. The remaining 92,715 warrants were exercised in a cashless exercise. The fair value of the warrants on the date of exercise was $137,000 and was reclassified from derivative liabilities to additional paid-in capital.
In addition, the October and December 2013 financings triggered the reset provision included in the August 2008 financing which resulted in the issuance of an additional 1,563,083 shares of common stock. The cost of additional shares issued was $1,117,447. This cost was recorded as a debit and a credit to additional paid-in capital and was deemed a dividend.
As of September 30, 2014, the remaining 2,844,627 Series N warrants entitle the holders to purchase one share of the Company's common stock at a price of $0.53 per share at any time prior to August 18, 2015. On September 30, 2014, no derivative liability was recorded because the warrants no longer were considered a liability for accounting purposes. On September 30, 2013, the value of the Series N warrants was $41,501. During the year ended September 30, 2014, the Company recorded a loss of $1,404,027 on the Series N warrants. During the years ended September 30, 2013 and 2012, the Company recorded a gain of $788,533 and $207,507, respectively, on Series N warrants. On October 28, 2014, the remaining Series N warrants were transferred to the de Clara Trust, of which the Company’s CEO, Geert Kersten, is the Trustee and a beneficiary.
F-13
Series K and Series A through E Warrants
The Company accounted for the Series K and A through E Warrants as derivative liabilities in accordance with ASC 815. These warrants do not qualify for equity accounting and must be accounted for as derivative liabilities since the warrant agreements provide the holder with the right, at its option, to require the Company to a cash settlement of the warrants at Black-Scholes value in the event of a Fundamental Transaction, as defined in the warrant agreement. Since the occurrence of a Fundamental Transaction is not entirely within the Company’s control, there exist circumstances that would require net-cash settlement of the warrants while holders of shares would not receive a cash settlement.
In October 2011, 231,840 warrants held by the investors were reset from $4.00 to $3.00. In addition, the investors were issued 77,280 warrants exercisable at $3.00 per share at an initial cost of $30,912. This cost was accounted for as a debit to loss on derivatives and a credit to derivative liabilities.
In February 2012, all Series K warrants were exercised, and the Company received $927,359 from the exercise of Series K warrants to purchase 309,120 of the Company’s common shares. When the warrants were exercised, the value of the warrants, or $122,367, was converted from derivative liabilities to equity. During the year ended September 30, 2012, the Company recorded a loss of $21,903 from the exercise and mark to market on the remaining Series K warrants. As of September 30, 2012, all Series K warrants had been exercised and no liability was recorded.
In June 2009, the Company issued 1,011,656 Series A warrants exercisable at $5.00 per share in connection with a financing. The cost of the warrants of $2,775,021 was recorded as a debit to additional paid-in capital and a credit to derivative liabilities. As of September 30, 2014, 130,347 of these warrants remained outstanding. As of September 30, 2014 and 2013, the fair value of these derivative liabilities was $1,303.
In July 2009, the Company issued 16,750 warrants to a private investor. The warrants were issued with an exercise price of $5.00 per share and valued at $43,550 using the Black Scholes method. The cost of the warrants was accounted for as a debit to additional paid-in capital and a credit to derivative liabilities. As of September 30, 2014, 16,750 warrants remained outstanding. As of September 30, 2014 and 2013, the fair value of these derivative liabilities was $167 and $168, respectively.
In connection with a loan received and fully repaid in a prior period, the Company issued 50,000 Series B warrants with an exercise price of $6.80 per share. On September 4, 2014, all outstanding Series B warrants expired. As of September 30, 2014, no Series B warrants remained outstanding. As of September 30, 2013, the fair value of the Series B warrants was $0.
In connection with an August 2009 financing, the Company issued 539,222 Series C warrants exercisable at $5.50 per share. As of September 30, 2014, 463,487 of these warrants remained outstanding. As of September 30, 2014 and 2013, the fair value of the Series C warrants was $4,635.
F-14
In September 2009, 71,428 Series E warrants were issued to the placement agent in connection with a financing, with an exercise price of $17.50 per share. On August 12, 2014, all outstanding Series E warrants expired. As of September 30, 2014, no Series E warrants remained outstanding. As of September 30, 2013, the fair value of the Series E warrants was $0.
During the years ended September 30, 2014, 2013 and 2012, the Company recorded a gain of $1, $780,883, and $588,469, respectively, on the Series A through E warrants.
Series F and G warrants
In October 2011, in connection with a financing, the Company issued 1,200,000 Series F warrants exercisable at $4.00 per share at any time prior to October 6, 2014. The Company also issued 66,667 Series G warrants exercisable at $4.00 per share to the placement agent for this offering. The initial cost of the warrants of $2,146,667 was recorded as a debit to additional paid-in capital and a credit to derivative liabilities. On August 12, 2014, all outstanding Series G warrants expired. As of September 30, 2014, 1,200,000 Series F warrants and no Series G warrants remained outstanding. As of September 30, 2014, the fair value of the Series F warrants was $0. As of September 30, 2013, the fair value of the Series F and G warrants was $12,000 and $667, respectively. During the years ended September 30, 2014, 2013 and 2012, the Company recorded a gain of $12,667, $1,634,000, and $500,000 respectively, on the Series F and G warrants. On October 6, 2014, all of the Series F warrants expired.
Series H Warrants
In January 2012, in connection with a financing, the Company issued 1,200,000 Series H warrants exercisable at $5.00 per share at any time prior to August 1, 2015. The initial cost of the warrants of $2,400,000 was recorded as a debit to additional paid-in capital and a credit to derivative liabilities. As of September 30, 2014, 1,200,000 Series H warrants remained outstanding. As of September 30, 2014 and 2013, the fair value of the warrants was $12,000 and $36,000, respectively. During the years ended September 30, 2014, 2013 and 2012, the Company recorded a gain of $24,000, $1,764,000 and $600,000, respectively, on the Series H warrants.
Series Q Warrants
In June 2012, in connection with a financing, the Company issued 1,200,000 Series Q warrants exercisable at $5.00 per share at any time prior to December 22, 2015. The initial cost of the warrants of $2,160,000 was recorded as a debit to additional paid-in capital and a credit to derivative liabilities. As of September 30, 2014, 1,200,000 Series Q warrants remained outstanding. As of September 30, 2014 and 2013, the fair value of the warrants was $12,000 and $48,000, respectively. During the years ended September 30, 2014, 2013 and 2012, the Company recorded a gain of $36,000, $1,872,000 and $240,000, respectively, on the Series Q warrants.
F-15
Series R Warrants
On December 4, 2012, the Company sold 3,500,000 shares of its common stock for $10,500,000, or $3.00 per share, in a registered direct offering. The investors in this offering also received Series R warrants which entitle the investors to purchase up to 2,625,000 shares of the Company’s common stock. The Series R warrants may be exercised at any time before December 6, 2016 at a price of $4.00 per share. The initial cost of the warrants of $4,200,000 was recorded as a debit to additional paid-in capital and a credit to derivative liabilities. As of September 30, 2014, 2,625,000 Series R warrants remained outstanding. As of September 30, 2014 and 2013, the fair value of the Series R warrants was $157,500 and $288,750, respectively. During the years ended September 30, 2014 and 2013, the Company recorded a gain of $131,250 and $3,911,250, respectively, on the Series R warrants.
Series S Warrants
On October 11, 2013, the Company closed a public offering of 17,826,087 units of common stock and warrants at a price of $1.00 per unit for net proceeds of $16,400,000, net of underwriting discounts and commissions and offering expenses of the Company. Each unit consisted of one share of common stock and one Series S warrant to purchase one share of common stock. The Series S warrants are immediately exercisable, expire on October 11, 2018, and have an exercise price of $1.25. In November 2013, the underwriters purchased an additional 2,648,913 warrants pursuant to the overallotment option, for which the Company received net proceeds of $24,370.
On December 24, 2013, the Company closed a public offering of 4,761,905 units of common stock and warrants at a price of $0.63 per unit for net proceeds of $2,790,000, net of underwriting discounts and commissions and offering expenses of the Company. Each unit consisted of one share of common stock and one Series S warrant to purchase one share of common stock. The Series S warrants were immediately exercisable, expire on October 11, 2018, and have an exercise price of $1.25. The underwriters purchased an additional 476,190 units of common stock and warrants pursuant to the overallotment option, for which the Company received net proceeds of approximately $279,000. The initial cost of the S warrants of $7,321,071 was recorded as a debit to additional paid-in capital and a credit to derivative liabilities.
On February 7, 2014, the Series S warrants began trading on the New York Stock Exchange. During the year ended September 30, 2014, 2,088,769 Series S Warrants had been exercised at a price of $1.25, and the Company received proceeds of $2,610,961. The fair value of the warrants on the date of exercise was $1,024,932. As of September 30, 2014, the remaining 23,624,326 Series S warrants entitle the holders to purchase one share of the Company's common stock at a price of $1.25 per share.
As of September 30, 2014, the fair value of the Series S warrants was $5,197,352. During the year ended September 30, 2014, the Company recorded a gain of $1,098,787 on the Series S warrants.
F-16
Series T and U Warrants
On April 17, 2014, the Company closed a public offering of 7,128,229 shares of common stock at a price of $1.40 and 1,782,057 Series T warrants to purchase one share of common stock for net proceeds of $9,230,000, net of underwriting commissions and offering expenses. The Series T warrants are immediately exercisable, expire on October 17, 2014, and have an exercise price of $1.58. The underwriters received 445,514 Series U warrants to purchase one share of common stock. The Series U warrants are exercisable beginning October 17, 2014, expire on October 17, 2017, and have an exercise price of $1.75. The initial cost of the Series T and U warrants of $470,377 was recorded as a debit to additional paid-in capital and a credit to derivative liabilities.
As of September 30, 2014, the fair value of the Series T and U warrants was $120,289. During the year ended September 30, 2014, the Company recorded a gain of $350,088, on the Series T and U warrants. On October 17, 2014, all of the Series T warrants expired.
Senior Convertible Notes and Redeemable Series A Convertible Preferred Stock
In March 2012, the Company repaid the remaining Senior Secured Convertible Notes derived from the settlement, thereby completely eliminating the Senior Secured Convertible Notes, satisfying the settlement and having the lien on the Company’s assets removed.
The accounting for the Senior Secured Convertible Notes was within the scope of ASC 815. Under ASC 815 or ASC 825,”Financial Instruments,” the Company may make an irrevocable election to initially and subsequently measure a hybrid financial instrument in its entirety at fair value. Any change in fair value between the respective reporting dates is recognized as a gain or loss. Based on the analysis of the Senior Secured Convertible Notes, the Company identified several embedded derivative features. The Company elected, in accordance with ASC 825, to initially and subsequently carry the instrument at fair value without bi-furcating the embedded derivatives. For the year ended September 30, 2012, the Company recorded a gain of $49,000 on the Senior Secured Convertible Notes.
|
2.
|
Series L and M Warrants
|
In April 2007, the Company completed a $15 million private financing. Shares were sold at $7.50, a premium over the closing price of the previous two weeks. The financing was accompanied by 1,000,000 warrants with an exercise price of $7.50 and 1,000,000 warrants with an exercise price of $20.00. The warrants are known as Series L and Series M warrants, respectively. The warrants issued with the financing qualified for equity treatment in accordance with ASC 815. The cost of Series L and Series M warrants were recorded as a debit and a credit to additional paid-in capital. In June 2012, 10,167 Series L warrants with an exercise price of $7.50 per share, expired.
In November 2011, the Company reduced the exercise price of 160,000 Series L warrants to $3.40. The additional cost of $86,826 was recorded as a debit and a credit to additional paid-in capital and was a deemed dividend. This cost is included in modification of warrants and increased the net loss available to shareholders on the statement of operations. In March 2012, 60,000 Series L warrants were exercised at a price of $3.40, and the Company received proceeds of $204,000.
F-17
In April 2012, 25,000 Series L warrants exercisable at a price of $7.50 per share were transferred to a consultant and were extended for two years from the current expiration date. The additional value of $43,910 was accounted for as a credit to additional paid-in capital and a debit to general and administrative expense. On April 17, 2014, the 25,000 Series L warrants expired. In April 2013, 100,000 Series L warrants were repriced to $2.50 per share and were extended for two years to April 2, 2015 in return for a reduction in outstanding warrants to 70,000. The additional cost of $59,531 was recorded as a debit and a credit to additional paid-in capital and was a deemed dividend. This cost was included in modification of warrants and increased the net loss available to shareholders on the statements of operations. As of September 30, 2014, 70,000 of the Series L warrants at the reduced exercise price of $2.50 remained outstanding.
In November 2011, the Company reduced the exercise price of 600,000 Series M warrants from $6.00 to $3.40. The additional cost of $238,794 was recorded as a debit and a credit to additional paid-capital and was a deemed dividend. This cost is included in modification of warrants and increased the net loss available to shareholders on the statement of operations.
In October 2013, the Company reduced the exercise prices of the Series M warrants from $3.40 to $1.00 in exchange for a reduction in the number of warrants from 600,000 to 500,000. The additional cost of $76,991 was recorded as non-employee stock compensation expense. In March 2014, 500,000 Series M warrants were exercised at a price of $1.00, and the Company received proceeds of $500,000. As of September 30, 2014, no Series M warrants remained outstanding.
3.
Series O and P Warrants
In March 2009, as further consideration for its rights under a licensing agreement, Byron Biopharma LLC (“Byron”) purchased 375,000 Units from the Company at a price of $2.00 per Unit. Each Unit consisted of one share of the Company’s common stock and two Series O warrants. During the year ended September 30, 2012, all 650,000 of the outstanding Series O warrants were exercised. There were no Series O warrants outstanding at September 30, 2012.
On February 10, 2012, the Company issued 590,001 Series P warrants to the former holder of the Series O warrants as an inducement for the early exercise of the Series O warrants. Series O warrants entitled the holder to purchase 590,001 shares of the Company’s common stock at a price of $2.50 per share at any time on or prior to March 6, 2016. The Series P warrants allow the holder to purchase up to 590,001 shares of the Company’s common stock at a price of $4.50 per share. The Series P warrants are exercisable at any time prior to March 6, 2017. The warrants were accounted for as an equity transaction using the Black-Scholes method to value the warrants. The fair value of the warrants was calculated to be $1,593,000. This cost was recorded as a debit and a credit to additional paid-in capital. This cost is included in inducement warrants and increased the net loss available to shareholders on the statement of operations. As of September 30, 2014, 590,001 Series P warrants remained outstanding.
F-18
|
4.
|
Private Investor Warrants
|
In February 2011, 132,500 warrants issued to a private investor with exercise prices between $5.60 and $8.20 were extended for three years. Between February and August 2014, all 132,500 outstanding warrants expired. As of September 30, 2014, no warrants remained outstanding.
On January 26, 2014, 608,438 warrants issued to the lessor of the Company’s manufacturing facility, priced at $7.50 per share, expired. As of September 30, 2014, no warrants relating to the facilities lease remained outstanding.
|
5.
|
Warrants held by Officer and Director
|
Between December 2008 and June 2009, Maximilian de Clara, the Company’s President and a director, loaned the Company $1,104,057 under a note payable. In June 2009, the Company issued 164,824 warrants, exercisable at $4.00 per share, to Mr. de Clara. The warrants are exercisable at any time prior to December 24, 2014. These warrants were valued at $65,796 using the Black-Scholes method. In July 2009, as consideration for a further extension of the loan, the Company issued 184,930 warrants exercisable at $5.00 per share to Mr. de Clara. These warrants were valued at $341,454 using the Black-Scholes method and can be exercised at any time prior to January 6, 2015. The first warrants were recorded as a discount to the loan and a credit to additional paid-in capital. The second warrants were recorded as a debit to derivative loss of $831,230, a premium of $341,454 on the loan and a credit to additional paid-in capital of $489,776. The warrants and premium are fully amortized. As of September 30, 2014, 349,754 warrants remained outstanding (Note 10). In August 2014, the loan and warrants were transferred to the de Clara Trust, of which the Company’s CEO, Geert Kersten, is the Trustee and a beneficiary.
|
6.
|
Options and Shares Issued to Consultants
|
As of September 30, 2014, 149,500 options that were issued to consultants as payment for services remained outstanding, of which 140,000 options were issued from the Non-Qualified Stock Option plans. During the year ended September 30, 2014 and 2013, 71,250 and 3,000 options previously issued to a consultant from the Non-Qualified Stock Option plans expired, respectively.
In December 2011, 5,000 options were issued to a consultant with an exercise price of $3.00 which vested immediately and expire on December 1, 2016. The cost of these options was $10,211 calculated using the Black-Scholes method and was accounted for as a credit to additional paid-in capital and a debit to general and administrative expense.
In March 2012, 5,000 options were issued to a consultant with an exercise price of $3.50 which vested immediately and expire on March 5, 2017. The cost of these options was $12,037 calculated using the Black-Scholes method and was accounted for as a credit to additional paid-in capital and a debit to general and administrative expense.
In April 2012, 7,000 options issued to a consultant with exercise prices between $6.30 and $7.00 were extended for two years from the current expiration date. The additional value of $10,879 was accounted for as a credit to additional paid-in capital and a debit to general and administrative expense. During the year ended September 30, 2014, the 7,000 options expired.
F-19
On October 15, 2013, the Company entered into a consulting agreement for services to be provided through October 14, 2014. In consideration for services provided, the Company issued the consultant 100,000 restricted shares in three installments – 34,000 upon signing, 33,000 on January 15, 2014, and 33,000 on March 14, 2014. The aggregate fair market value of the 100,000 restricted shares of $108,710 was recorded as a prepaid expense and is being charged to general and administrative expense over the period of service. During the year ended September 30, 2014, the Company recorded $104,540 in consulting expense. At September 30, 2014, $4,170 is included in prepaid expenses.
On October 20, 2013, the Company entered into a consulting agreement for services to be provided through October 19, 2016. In consideration for services provided, the Company agreed to issue the consultant 34,164 restricted shares each month of the agreement, with the first three month issued in advance. During the year ended September 30, 2014, the Company issued the consultant a total of 409,968 shares of restricted stock at the fair market value on the dates of issuance. The aggregate fair market value of $439,008 was recorded as a prepaid expense and is being charged to general and administrative expense over the period of service. The Company had previously entered into a one year consulting agreement with this same consultant for services to be provided through December 27, 2013. In consideration for the services to be provided under that earlier agreement, the Company issued the consultant 50,000 shares of common stock and 50,000 options to purchase common stock at a price of $2.80 per share. The common shares were issued at the fair market value on the agreement date of $2.80. The aggregate fair market value of $140,000 was recorded as a prepaid expense and was charged to general and administrative expense over the period of service. The fair value of the options issued, as calculated using the Black-Scholes method, was determined to be $98,150 and was also charged to general and administrative expense over the period of service. During the years ended September 30, 2014 and 2013, the Company recorded expense of $474,263 and $180,597 for services provided by this consultant, respectively.
On October 28, 2013, the Company entered into a consulting agreement for services to be provided through April 27, 2014. In consideration for services provided, the Company granted the consultant 60,000 options to purchase common stock at a price of $0.85 per share. The fair value of the options issued, as calculated using the Black-Scholes method, was determined to be $24,294 and was charged to general and administrative expense over the period of service.
On December 1, 2013, the Company extended an agreement with a public relations consultant through December 1, 2014. In consideration for services provided, the Company agreed to continue to issue the consultant a monthly retainer of 5,000 shares of restricted stock. In addition, the consultant received an additional 20,000 shares of restricted stock for meeting certain performance requirements. During the years ended September 30, 2014 and 2013, respectively, the Company issued the consultant 70,000 and 60,000 restricted shares of common stock at the fair market value on the grant dates, for an aggregate fair market value of $79,400 and $161,500, respectively which was recorded as a general and administrative expense.
F-20
On April 25, 2014, the Company entered into a consulting agreement for services to be provided through August 25, 2014. In consideration for services provided, the Company granted the consultant 20,000 options to purchase common stock at a price of $1.22 per share. The fair value of the options issued, as calculated using the Black-Scholes method, was determined to be $12,458 and was charged to general and administrative expense over the period of service.
During the years ended September 30, 2014 and 2013, the Company recorded total expense of $694,955 and $342,097 relating to these consulting arrangements. As of September 30, 2014 and 2013, the Company recorded $26,468 and $57,553, respectively, in prepaid consulting expenses.
3. OPERATIONS AND FINANCING
The Company has incurred significant costs since its inception in connection with the acquisition of certain patented and unpatented proprietary technology and know-how relating to the human immunological defense system, patent applications, research and development, administrative costs, construction of laboratory facilities, and clinical trials. The Company has funded such costs with proceeds from loans and the public and private sale of its common and preferred stock. The Company will be required to raise additional capital or find additional long-term financing in order to continue with its research efforts. To date, the Company has not generated any revenue from product sales. The ability of the Company to complete the necessary clinical trials and obtain Federal Drug Administration (FDA) approval for the sale of products to be developed on a commercial basis is uncertain. Ultimately, the Company must complete the development of its products, obtain the appropriate regulatory approvals and obtain sufficient revenues to support its cost structure.
The Company is currently running a large multi-national Phase III clinical trial for head and neck cancer. The Company believes that it has enough capital to support its operations for more than the next twelve months as it believes that it has ready access to new equity capital should the need arise. During fiscal year 2013, the Company raised $9.8 million net proceeds from several institutional investors. During fiscal year 2014, the Company raised approximately $31.5 million in net proceeds through the sale of common stock and warrants in three public offerings and from the exercise of previously issued warrants. In October 2014, the Company raised approximately $6.4 million in net proceeds through the sale of common stock and warrants in a public and a registered direct offering. To finance the study beyond the next 12 months, the Company plans to raise additional capital in the form of corporate partnerships, debt and/or equity financings. The Company believes that it will be able to obtain additional financing because it has done so consistently in the past, and because Multikine is a product in the Phase III trial stage. However, there can be no assurance that the Company will be successful in raising additional funds or that funds will be available to the Company on acceptable terms or at all. If the Company does not raise the necessary amounts of money, the Company will either have to slow down or delay the Phase III clinical trial or even significantly curtail its operations until such time as it is able to raise the required funding.
F-21
Since the Company launched its Phase III trial for Multikine, the Company has spent approximately $16,400,000 as of September 30, 2014 on direct costs for the Phase III clinical trial. The total remaining cash cost of the clinical trial is estimated to be approximately $28,200,000. It should be noted that this estimate is based only on the information currently available in the Company’s contracts with the Clinical Research Organizations responsible for managing the Phase III trial. This number can be affected by the speed of enrollment, foreign currency exchange rates and many other factors, some of which cannot be foreseen today. It is therefore possible that the cost of the Phase III trial will be higher than currently estimated.
4. RESEARCH AND OFFICE EQUIPMENT
Research and office equipment consisted of the following at September 30:
| 2014 | 2013 | |||||||
|
Research equipment
|
$ | 3,230,882 | $ | 3,184,779 | ||||
|
Furniture and equipment
|
141,269 | 139,992 | ||||||
|
Leasehold improvements
|
131,910 | 131,910 | ||||||
| 3,504,061 | 3,456,681 | |||||||
|
Less: Accumulated depreciation and amortization
|
(3,101,057 | ) | (2,967,345 | ) | ||||
|
Net research and office equipment
|
$ | 403,004 | $ | 489,336 | ||||
Depreciation expense for the years ended September 30, 2014, 2013 and 2012 totaled $188,967, $275,917 and $447,171, respectively. During the years ended September 30, 2014, 2013 and 2012, equipment with a net book value of $268, $4,350 and $9,399, respectively, was retired.
5. PATENTS
Patents consisted of the following at September 30:
| 2014 | 2013 | |||||||
|
Patents
|
$ | 1,517,344 | $ | 1,470,047 | ||||
|
Accumulated amortization
|
(1,193,756 | ) | (1,151,852 | ) | ||||
|
Net Patents
|
$ | 323,588 | $ | 318,195 | ||||
F-22
During the years ended September 30, 2014, 2013 and 2012, the Company recorded patent impairment charges of $1,182, $22,628 and $44,921, respectively, for the net book value of patents abandoned during the year. These amounts are included in general and administrative expenses. Amortization expense for the years ended September 30, 2014, 2013 and 2012 totaled $42,785, $88,207 and $86,297, respectively. The total estimated future amortization is as follows:
|
Year ending September 30,
|
||||
| 2015 | $ | 36,051 | ||
| 2016 | 36,051 | |||
| 2017 | 36,051 | |||
| 2018 | 35,716 | |||
| 2019 | 34,014 | |||
| Thereafter | 145,705 | |||
| $ | 323,588 | |||
6. INCOME TAXES
At September 30, 2014, the Company had a federal net operating loss carryforward of approximately $141 million, which begins to expire during the fiscal year ended in 2018 and is fully expired by the end of the fiscal year ended 2034. In addition, the Company has a general business credit as a result of the credit for increasing research activities (“R&D credit”) of approximately $1.2 million at September 30, 2014, which begins to expire during the fiscal year ended 2020 and is fully expired during the fiscal year ended 2029. At September 30, 2013, the Company had a federal net operating loss carryforward of approximately $130 million and an R&D credit of approximately $1.2 million. Deferred taxes at September 30 consisted of the following:
| 2014 | 2013 | |||||||
|
Net operating loss carryforwards
|
$ | 55,229,799 | $ | 50,485,248 | ||||
|
R&D credit
|
1,221,487 | 1,221,487 | ||||||
|
Stock-based compensation
|
4,054,450 | 3,323,353 | ||||||
|
Fixed assets and intangibles
|
26,329 | - | ||||||
|
Capitalized R&D
|
9,897,041 | 5,542,816 | ||||||
|
Vacation and other
|
108,891 | 270,121 | ||||||
|
Total deferred tax assets
|
70,537,997 | 60,843,025 | ||||||
|
|
||||||||
|
Fixed assets and intangibles
|
- | (1,968 | ) | |||||
|
Total deferred tax liabilities
|
- | (1,968 | ) | |||||
|
Valuation allowance
|
(70,537,997 | ) | (60,841,057 | ) | ||||
|
Net deferred tax asset
|
$ | - | $ | - | ||||
In assessing the realization of deferred tax assets, management considered whether it was more likely than not that some, or all
,
of the deferred tax asset will be realized. The ultimate realization of the deferred tax assets is dependent upon the generation of future taxable income. Management has considered the history of the Company’s operating losses and believes that the realization of the benefit of the deferred tax assets cannot be reasonably assured. In addition, under Internal Revenue Code Section 382, the Company’s ability to utilize these net operating loss carryforwards may be limited or eliminated in the event of future changes in ownership.
F-23
Certain net deferred tax liabilities at September 30, 2013, totaling approximately $6.3 million were reversed, with the offsetting adjustment increasing deferred tax allowances. These adjustments had no effect on the Company’s financial position or operating results.
The Company has no federal or state current or deferred tax expense or benefit. The Company’s effective tax rate differs from the applicable federal statutory tax rate. The reconciliation of these rates for the three years ended September 30, 2014 is as follows:
| 2014 | 2013 | 2012 | ||||||||||
| Federal Rate | 34.00 | % | 34.00 | % | 34.00 | % | ||||||
| State tax rate, net of federal benefit | 5.15 | 4.97 | 5.21 | |||||||||
| State tax rate change | 0.93 | (3.77 | ) | 18.07 | ||||||||
| Other adjustments | 0.00 | 0.00 | (0.53 | ) | ||||||||
| Expired tax attributes | 0.00 | (87.87 | ) | (33.54 | ) | |||||||
| Adjustment to deferreds | 19.13 | 14.30 | 0.00 | |||||||||
| Permanent differences | (0.43 | ) | (1.59 | ) | (0.68 | ) | ||||||
| Change in valuation allowance | (58.78 | ) | 39.96 | (23.53 | ) | |||||||
| Effective tax rate | 0.00 | % | 0.00 | % | 0.00 | % | ||||||
The Company applies the provisions of ASC 740,
“Accounting for Uncertainty in Income Taxes,”
which requires financial statement benefits to be recognized for positions taken for tax return purposes when it is more likely than not that the position will be sustained. The Company has elected to reflect any tax penalties or interest resulting from tax assessments on uncertain tax positions as a component of tax expense. The tax return years 2009 through 2013 remain open to examination by the major domestic taxing jurisdictions to which the Company is subject.
7. STOCK COMPENSATION
The Company awarded employees and non-employees with stock compensation as follows:
|
Fiscal Year Ended September 30,
|
||||||||||||
|
2014
|
2013
|
2012
|
||||||||||
|
Employees
|
$ | 3,958,637 | $ | 2,636,905 | $ | 2,266,316 | ||||||
|
Non-employees
|
$ | 771,946 | $ | 454,855 | $ | 581,996 | ||||||
During the years ended September 30, 2014, 2013 and 2012, non-employee compensation excluded $26,468, $57,553 and $53,333
,
respectively, for future services to be performed (Note 11).
During the years ended September 30, 2014, 2013 and 2012, the Company recognized expense of $3,958,637, $2,636,905 and $2,229,326, respectively, for options issued or vested and restricted stock awarded during the year. This expense was recorded as general and administrative expense. No options were exercised during the years ended September 30, 2014, 2013 and 2012. No restricted shares vested during the year ended September 30, 2014.
During the year ended September 30, 2014, the Company issued 1,643,240 stock options to employees and directors at a fair value of $1,518,862, ($0.92 fair value per option). During the year ended September 30, 2013, the Company issued 1,809,387 stock options to employees and directors at a fair value of $3,652,630, ($2.02 fair value per option). During the year ended September 30, 2012, the Company issued 667,937 stock options to employees and directors at a fair value of $1,876,122, ($2.80 fair value per option) and also cancelled 390,047 stock options that were outstanding to employees and directors at a fair value of $265,096, ($
0.
68 fair value per option). On September 30, 2014, the Company had 3,387,265 options that were unvested at a fair value of $7,288,244, which is a weighted average fair value of $2.15 per share with a weighted average remaining vesting life of 1.87 years. The fair value of each option grant was estimated on the date of grant using the Black-Scholes option-pricing model with the following assumptions.
F-24
| 2014 | 2013 | 2012 | ||||
|
Expected stock price volatility
|
72.81 – 86.87%
|
84.41-92.28%
|
87.72-94.93%
|
|||
|
Risk-free interest rate
|
0.59 – 2.65%
|
0.75-2.73%
|
0.83-1.92%
|
|||
|
Expected life of options
|
3.0 – 9.76 Years
|
4.85-9.77 Years
|
4.82-9.66 Years
|
|||
|
Expected dividend yield
|
- | - | - |
Non-Qualified Stock Option Plan
--At September 30, 2014, the Company has collectively authorized the issuance of 5,680,000 shares of common stock under its Non-Qualified Stock Option Plan. Options typically vest over a three-year period and expire no later than ten years after the grant date. Terms of the options are to be determined by the Company’s Compensation Committee, which administers the plans. The Company’s employees, directors, officers, and consultants or advisors are eligible to be granted options under the Non-Qualified Stock Option Plans.
Incentive Stock Option Plan
--At September 30, 2014, the Company had collectively authorized the issuance of 1,960,000 shares of common stock under its Incentive Stock Option Plan. Options typically vest over a three-year period and expire no later than ten years after the grant date. Terms of the options were determined by the Company’s Compensation Committee, which administers the plans. Only the Company’s employees are eligible to be granted options under the Incentive Stock Option Plans.
Activity in the Company’s Non-Qualified and Incentive Stock Option Plans for the year ended September 30, 2014 is summarized as follows:
Non-Qualified and Incentive Stock Option Plans
|
Outstanding
|
Exercisable
|
|||||||||||||||||||||||||||||||
|
Number of
Shares
|
Weighted
Average
|
Weighted
Ave
|
Aggregate
Intrinsic
|
Number of
Shares
|
Weighted
Average
|
Weighted
Ave
|
Aggregate
Intrinsic
|
|||||||||||||||||||||||||
|
Outstanding at October 1, 2013
|
5,188,141 | $ | 3.62 | 6.53 | $ | 133 | 2,422,997 | $ | 4.00 | 4.95 | $ | 133 | ||||||||||||||||||||
|
Vested
|
1,094,803 | $ | 2.14 | |||||||||||||||||||||||||||||
|
Granted (a)
|
1,723,240 | $ | 1.09 | |||||||||||||||||||||||||||||
|
Exercised
|
||||||||||||||||||||||||||||||||
|
Forfeited
|
6,316 | $ | 1.60 | |||||||||||||||||||||||||||||
|
Expired
|
73,916 | $ | 4.29 | 73,916 | $ | 4.29 | ||||||||||||||||||||||||||
|
Cancelled
|
||||||||||||||||||||||||||||||||
|
Outstanding at September 30, 2014
|
6,831,149 | $ | 2.98 | 6.55 | $ | 3,600 | 3,443,884 | $ | 3.40 | 5.49 | $ | 3,600 | ||||||||||||||||||||
|
(a)
|
During the year ending September 30, 2014, 80,000 stock options were granted to consultants.
|
A summary of the status of the Company’s non-vested options for the year ended September 30, 2014 is presented below:
| Number of Shares | Weighted Average Grant Date Fair Value | |||||||
|
Unvested at October 1, 2012
|
1,649,063 | $ | 3.60 | |||||
|
Vested
|
(729,087 | ) | ||||||
|
Granted
|
1,859,387 | |||||||
|
Forfeited
|
(14,219 | ) | ||||||
|
Unvested at October 1, 2013
|
2,765,144 | $ | 2.79 | |||||
|
Vested
|
(1,094,803 | ) | ||||||
|
Granted
|
1,723,240 | |||||||
|
Forfeited
|
(6,316 | ) | ||||||
|
Unvested at September 30, 2014
|
3,387,265 | $ | 2.15 | |||||
F-25
In November 2011, the Company modified the number of options issued to certain employees and directors, as well as the exercise prices and the expiration dates of the options. This resulted in the cancellation of 390,047 options priced between $5.40 and $19.40 and the issuance of 312,037 options at $3.20. In accordance with ASC 718, the incremental compensation cost was $409,370 and amortized over the remaining service period.
In December 2011, the Company extended the expiration date on 29,167 options from the Stock Option Plans with exercise prices ranging from $1.60 to $3.30. The options originally would have expired between April 2012 and August 2012 and were extended for three years to expiration dates ranging from April 2015 to August 2015. This extension was considered a new measurement date with respect to the modified options. At the date of modification, the additional cost of the options was $36,990. As of September 30, 2014, all repriced options remained outstanding.
In December 2012, the Company offered employees and directors holding options that expire on April 1, 2013 the opportunity to forfeit these options and have new options issued with an expiration date of December 17, 2017. All twelve employees and directors eligible for this offer accepted the terms. This resulted in the cancellation of 387,466 options priced at $2.20 per share and the concurrent issuance of the same number of options at $2.80 per share. At the cancellation date, the incremental compensation cost was $477,879 which was amortized over the remaining service period. As of September 30, 2014, all options remained outstanding.
Stock Bonus Plans
-- At September 30, 2014, the Company was authorized to issue up to 1,594,000 shares of common stock under its Stock Bonus Plans. All employees, directors, officers, consultants, and advisors are eligible to be granted shares. During the year ended September 30, 2014, 164,787 shares were issued to the Company’s 401(k) plan for a cost of $155,434
.
During the year ended September 30, 2013, 74,230 shares were issued to the Company’s 401(k) plan for a cost of $158,856. During the year ended September 30, 2012, 42,627 shares were issued to the Company’s 401(k) plan for a cost of $154,516. During the years ended September 30, 2012, the Company issued 618 shares from Stock Bonus Plans to consultants for payment of services at a cost $1,792. As of September 30, 2014, the Company has issued a total of 1,058,896 shares of common stock from the Stock Bonus Plans.
Stock Compensation Plan
-- At September 30, 2014, 1,350,000 shares were authorized for use in the Company’s stock compensation plan. During the years ended September 30, 2014
,
2013 and 2012, 409,968, 50,000 and 100,000 shares were issued from the Stock Compensation Plan to consultants for payment of services at a cost of $439,008, $140,000 and $320,000, respectively. As of September 30, 2014, the Company has issued 1,098,621 shares of common stock from the Stock Compensation Plan.
Incentive Stock Bonus Plan
-- On July 22, 2014 the Company's shareholders approved the 2014 Incentive Stock Bonus Plan, authorizing the issuance of 16,000,000 shares in the Company’s Incentive Stock Bonus Plan. During the year ended September 30, 2014, 15,700,000 shares were issued from the Incentive Stock Bonus Plan to officers and employees
.
The shares are unvested and are held in escrow. The shares will only be earned upon the achievement of certain milestones leading to the commercialization of the Company’s Multikine technology
,
or specified increases in the market price of the Company’s stock
.
If the performance or market criteria are not met as specified in the Incentive Stock Bonus Plan, all or a portion of the awarded shares will be forfeited. At September 30, 2014, no restricted shares were vested. The fair value of the shares on the grant date was calculated to be $8,662,502, using the market value on the grant-date for issuances where the attainment of performance criteria is likely and using a Monte Carlo simulation for issuances where the attainment of performance criteria is uncertain. The total value of the shares, if earned, will be expensed over the requisite service periods for each milestone, provided the requisite service periods are rendered, regardless of whether the market conditions are met. No compensation cost is recognized for awards where the requisite service period is not rendered. During the year ended September 30, 2014, the Company recorded expense relating to the restricted stock of $1,477,954. At September 30, 2014, the Company has unrecognized compensation expense of $7,184,548 which is expected to be recognized over a weighted average period of 5.35 years.
F-26
8. EMPLOYEE BENEFIT PLAN
The Company maintains a defined contribution retirement plan, qualifying under Section 401(k) of the Internal Revenue Code, subject to the Employee Retirement Income Security Act of 1974, as amended, and covering substantially all Company employees. Each participant’s contribution is matched by the Company with shares of common stock that have a value equal to 100% of the participant’s contribution, not to exceed the lesser of $10,000 or 6% of the participant’s total compensation. The Company’s contribution of common stock is valued each quarter based upon the closing bid price of the Company’s common stock. Total expense, including plan maintenance, for the years ended September 30, 2014, 2013 and 2012, in connection with this Plan was $159,632, $162,865 and $158,500, respectively.
9. COMMITMENTS AND CONTINGENCIES
Clinical Research Agreements
In March 2013, the Company entered into an agreement with Aptiv Solutions to provide certain clinical research services in accordance with a master service agreement. The Company will reimburse Aptiv for costs incurred. In May 2013, CEL-SCI made an advance payment of $400,000. In October 2013, the Company made the second and final advance payment of $200,000. The funds advanced will be credited back in $150,000 annual increments from December 2014 through December 2017. As of September 30, 2014, $150,000 of the deposit is classified as a current asset.
In April 2013, the Company entered into a co-development and revenue sharing agreement with Ergomed. Under the agreement, Ergomed will contribute up to $10 million towards the Phase III head and neck cancer study in the form of offering discounted clinical services in exchange for a single digit percentage of milestone and royalty payments, up to four times Ergomed’s contribution amount. The Company accounted for the co-development and revenue sharing agreement in accordance with ASC 808 “Collaborative Arrangements”. The Company determined the payments to Ergomed are within the scope of ASC 730 “Research and Development.” Therefore, the Company records the discount on the clinical services as a credit to research and development expense on its Statements of Operations. Since the Company entered into the co-development and revenue sharing agreement with Ergomed it has incurred research and development expenses of approximately $5,223,000 related to Ergomed’s services. This amount is net of Ergomed’s discount of approximately $1,794,000. During the years ended September 30, 2014 and 2013, the Company recorded, approximately $4,385,000 and $838,000, respectively, as research and development expense related to Ergomed’s services. These amounts were net of Ergomed’s discount of approximately $1,513,000 and $281,000, respectively.
In October 2013, the Company entered into two co-development and profit sharing agreements with Ergomed. One agreement supports the U.S. Navy with the development of Multikine as a potential treatment for peri-anal warts in HIV/HPV co-infected men and women. The other agreement focuses on the development of Multikine as a potential treatment for cervical dysplasia in HIV/HPV co-infected women. Ergomed will assume up to $3 million in clinical and regulatory costs for each study.
In April 2013, the Company dismissed inVentiv Health Clinical, LLC (inVentiv, f/k/a PharmaNet, LLC), the Company’s former clinical research organization and replaced it with Aptiv Solutions, Inc. and Ergomed Clinical Research Ltd, as noted above. On October 31, 2013, the Company commenced arbitration proceedings against inVentiv. The arbitration claim, initiated under the Commercial Rules of the American Arbitration Association, alleges (i) breach of contract, (ii) fraud in the inducement, and (iii) common law fraud, and seeks at least $50 million in damages.
On December 12, 2013, inVentiv filed a counterclaim, alleging breach of contract on the part of the Company and seeking at least $2 million in damages. On December 20, 2013, inVentiv moved to dismiss certain claims. On June 24, 2014, the arbitrator denied inVentiv’s motion to dismiss. Given that this matter is at a preliminary stage, the Company is not in a position to predict or assess the likely outcome of these proceedings.
F-27
Lease Agreements
The future minimum annual rental payments due under non-cancelable operating leases for office and laboratory space are as follows:
| 2015 | $ | 1,785,873 | ||
| 2016 | 1,769,497 | |||
| 2017 | 1,746,328 | |||
| 2018 | 1,746,802 | |||
| 2019 | 1,808,302 | |||
|
2020 and thereafter
|
19,570,627 | |||
|
Total minimum lease payments:
|
$ | 28,427,429 | ||
Rent expense, including amortization of deferred rent, for the years ended September 30, 2014, 2013 and 2012, was $2,650,829, $2,651,460 and $2,659,532
,
respectively. The Company’s three leases expire between June 2015 and October 2028.
In August 2007, the Company leased a building near Baltimore, Maryland. The building was remodeled in accordance with the Company’s specifications so that it can be used by the Company to manufacture Multikine for the Company’s Phase III clinical trial and sales of the drug if approved by the FDA. The lease is for a term of twenty years and requires annual base rent to escalate each year at 3%. The Company is required to pay all real estate and personal property taxes, insurance premiums, maintenance expenses, repair costs and utilities. The lease allows the Company, at its election, to extend the lease for two ten-year periods or to purchase the building at the end of the 20-year lease.
At September 30, 2014, the Company recorded a total deferred rent asset of $5,277,939, of which $4,733,865 is long term and the balance of $544,074 is included in current assets. At September 30, 2013, the Company recorded a total deferred rent asset of $6,047,098, of which $5,448,381 is long term and the balance of $598,717 is included in current assets. On September 30, 2014 and 2013, the Company has included in deferred rent the following: 1) deposit on the manufacturing facility ($3,150,000); 2) the fair value of the warrants issued to lessor ($1,403,654); 3) additional investment ($2,995,541); 4) deposit on the cost of the leasehold improvements for the manufacturing facility ($1,786,591). At September 30, 2014, the Company has also included accrued interest on deposit of $329,525, and accumulated amortization of $4,387,374
.
At September 30, 2013, the Company has also included accrued interest on deposit of $499,968, and accumulated amortization of $3,788,656
.
The Company was required to deposit the equivalent of one year of base rent in accordance with the lease. When the Company meets the minimum cash balance required by the lease, the deposit will be returned to the Company. The $1,670,917 is included in non-current assets on September 30, 2014 and 2013.
In December 2011, the Company began subleasing a portion of its rental space on a month to month term lease, which requires a 30 day notice for termination. The sublease rent for the years ended September 30, 2014, 2013 and 2012 was $63,144, $61,305 and $48,500, respectively, and is recorded in grant income and other in the statements of operations.
The Company leases its research and development laboratory under a 60 month lease which expires February 28, 2017. The operating lease includes escalating rental payments. The Company is recognizing the related rent expense on a straight line basis over the full 60 month term of the lease at the rate of $11,360 per month. As of September 30, 2014 and 2013, the Company has recorded a deferred rent liability of $6,387 and $3,992, respectively.
The Company leases office headquarters under a 36 month lease which expires June 30, 2015. The operating lease includes escalating rental payments. The Company is recognizing the related rent expense on a straight line basis over the full 36 month term of the lease at the rate $7,864 per month. As of September 30, 2014 and 2013, the Company has recorded a deferred rent liability of $6,278 and $12,412, respectively.
The Company leases office equipment under a capital lease arrangement. The term of the capital lease is 48 months and expires on September 30, 2016. The monthly lease payment is $1,025. The lease bears interest at approximately 6% per annum.
F-28
Employment Contracts
On August 30, 2013, the Company’s employment agreement with Maximilian de Clara, the Company’s President and a director, as amended on September 8, 2006 and extended on August 30, 2010, was further extended to August 30, 2016. The employment agreement provides that the Company will pay Mr. de Clara an annual salary of $363,000 during the term of the agreement. In the event that there is a material reduction in his authority, duties or activities, or in the event there is a change in the control of the Company, then the agreement allows him to resign from his position at the Company and receive a lump-sum payment from the Company equal to 18 months of salary. For purposes of the employment agreement, a change in the control of the Company means the sale of more than 50% of the outstanding shares of the Company’s common stock, or a change in a majority of the Company’s directors.
On September 1, 2011, the Company agreed to extend its employment agreement with Geert Kersten, the Company’s Chief Executive Officer, to August 31, 2016. Mr. Kersten’s annual salary for fiscal year 2014 was $521,893. Mr. Kersten will receive at least the same salary increases each year as do other senior executives of the Company. Further increases, if any, will be made at the sole discretion of the Company’s directors.
During the employment term, Mr. Kersten will be entitled to receive any other benefits which are provided to the Company’s executive officers or other fulltime employees in accordance with the Company’s policies and practices and subject to Mr. Kersten’s satisfaction of any applicable condition of eligibility.
If Mr. Kersten resigns within ninety (90) days of the occurrence of any of the following events: (i) a relocation (or demand for relocation) of Mr. Kersten’s place of employment to a location more than thirty-five (35) miles from his current place of employment, (ii) a significant and material reduction in Mr. Kersten’s authority, job duties or level of responsibility or (iii) the imposition of significant and material limitations on the Mr. Kersten’s autonomy in his position, the employment agreement will be terminated.
The employment agreement will also terminate upon the death of Mr. Kersten, Mr. Kersten’s physical or mental disability, willful misconduct, an act of fraud against the Company, or a breach of the employment agreement by Mr. Kersten.
If the employment agreement is terminated for any of the foregoing, Mr. Kersten, or his legal representatives, as the case may be, will be paid the salary provided by the employment agreement through the date of termination, any options or bonus shares of the Company then held by Mr. Kersten will become fully vested and the expiration date of any options which would expire during the four year period following his termination of employment will be extended to the date which is four years after his termination of employment.
In the event there is a change in the control of the Company, the agreement allows Mr. Kersten to resign from his position at the Company and receive a lump-sum payment from the Company equal to 24 months of salary, based upon his salary then in effect on the date of his resignation. For purposes of the employment agreement a change in the control of the Company means: (1) the merger of the Company with another entity if after such merger the shareholders of the Company do not own at least 50% of voting capital stock of the surviving corporation; (2) the sale of substantially all of the assets of the Company; (3) the acquisition by any person of more than 50% of the Company’s common stock; or (4) a change in a majority of the Company’s directors which has not been approved by the incumbent directors.
F-29
On August 30, 2013, the Company amended certain sections of Mr. Kersten’s employee agreement so that it would correspond with similar sections of the employment agreements discussed below.
On August 30, 2013, the Company extended its employment agreement with Patricia B. Prichep, the Company’s Senior Vice President of Operations
,
through August 30, 2016. Ms. Prichep’s annual salary for fiscal year 2014 was $229,465.
On August 30, 2013, the Company extended its employment agreement with Eyal Talor, Ph.D., the Company’s Chief Scientific Officer
,
through August 30, 2016. Dr. Talor’s annual salary for fiscal year 2014 was $283,283
.
In the event there is a change in the control of the Company, the employment agreements with Ms. Prichep and Dr. Talor allow Ms. Prichep and/or Dr. Talor (as the case may be) to resign from her or his position at the Company and receive a lump-sum payment from the Company equal to 18 months of salary. For purposes of the employment agreements, a change in the control of the Company means: (1) the merger of the Company with another entity if after such merger the shareholders of the Company do not own at least 50% of voting capital stock of the surviving corporation; (2) the sale of substantially all of the assets of the Company; (3) the acquisition by any person of more than 50% of the Company’s common stock; or (4) a change in a majority of the Company’s directors which has not been approved by the incumbent directors.
The employment agreements with Ms. Prichep and Dr. Talor will also terminate upon the death of the employee, the employee’s physical or mental disability, willful misconduct, an act of fraud against the Company, or a breach of the employment agreement by the employee. If the employment agreement is terminated for any of these reasons the employee, or her or his legal representatives, as the case may be, will be paid the salary provided by the employment agreement through the date of termination.
Further, the Company has contingent obligations with other vendors for work that will be completed in relation to the Phase III trial. The timing of these obligations cannot be determined at this time. The total remaining cash cost of these future obligations for the Phase III trial is estimated to be approximately $28,200,000.
10. LOANS FROM OFFICER AND INVESTOR
The Company’s President, and a director, Maximilian de Clara, loaned the Company $1,104,057 under a note payable. The loan from Mr. de Clara bears interest at 15% per year and is secured by a lien on substantially all of the Company’s assets. The Company does not have the right to prepay the note without Mr. de Clara’s consent. The note was initially payable at the end of March 2009, but was extended. At the time of the first extension, and in accordance with the loan agreement, the Company issued Mr. de Clara warrants to purchase 164,824 shares of the Company’s common stock at a price of $4.00 per share. The warrants are exercisable at any time prior to December 24, 2014. In June 2009, the note with Mr. de Clara was extended for the second time to July 6, 2014. At Mr. de Clara’s option, the note may be converted into shares of the Company’s common stock. The number of shares which will be issued upon any conversion will be determined by dividing the amount to be converted by $4.00. As further consideration for the second extension, Mr. de Clara received warrants to purchase 184,930 shares of the Company’s common stock at a price of $5.00 per share at any time prior to January 6, 2015. On May 13, 2011, to recognize Mr. de Clara’s willingness to agree to subordinate his note to the convertible preferred shares and convertible debt, the Company extended the maturity date of the note to July 6, 2015, however Mr. de Clara may demand payment upon giving the Company 10 days of notice. In August 2014, the loan and warrants were transferred to the de Clara Trust, of which the Company’s CEO, Geert Kersten, is the Trustee and a beneficiary. Mr. de Clara will continue to receive the interest payments.
During the years ended September 30, 2014, 2013 and 2012, the Company paid $179,409, $151,808 and $165,608, respectively, in interest expense to Mr. de Clara.
F-30
11. STOCKHOLDERS’ EQUITY
During the year ended September 30, 2014, 2,695,562 Series M, N and S warrants were exercised. The Company issued 2,668,508 shares of common stock and received $3,118,387 from the exercise of these warrants since 92,715 Series N warrants were exercised in a cashless exercise. During the year ended September 30, 2013, no warrants were exercised. During the year ended September 30, 2012, 650,000 Series O warrants issued in connection with a licensing agreement with Byron (Note 2), were exercised. The Company received $1,625,000 from the exercise of these warrants. Also during the year ended September 30, 2012, Series K and Series L warrants were exercised resulting in the issuance of 369,120 shares of common stock at prices ranging from $3.00 to $3.40. The Company received a total of $1,131,359 from the exercise of these warrants. The Company incurred direct financing fees of $91,820, which were charged to additional paid-in capital during the year ended September 30, 2012.
In October 2011, the Company sold 1,333,334 shares of its common stock, at a price per share of $3.00, in a registered direct offering to institutional investors, representing gross proceeds of $4.0 million. Investors also received Series F warrants to purchase up to 1,200,000 shares of the Company’s common stock at a purchase price of $4.00 at any time prior to October 6, 2014. The Company paid Chardan Capital Markets, LLC, the placement agent for this offering, a cash commission of $140,000, and issued 66,667 Series G warrants to Chardan. This financing triggered the reset provision from the August 2008 financing which resulted in the issuance of an additional 83,333 shares of common stock. The cost of additional shares issued was $250,000. This cost was recorded as a debit and a credit to additional paid-in capital and was deemed a dividend. On August 12, 2014, all outstanding Series G warrants expired. As of September 30, 2014, 1,200,000 Series F warrants and no Series G warrants remained outstanding. At September 30, 2014, the fair value of the outstanding Series F warrants was $0 (Note 2). On October 6, 2014, all of the Series F warrants expired.
In January 2012, the Company sold 1,600,000 shares of its common stock, at a price per share of $3.60, in a registered direct offering to institutional investors, representing gross proceeds of $5.76 million. Investors also received Series H warrants to purchase up to 1,200,000 shares of the Company’s common stock at a purchase price of $5.00 at any time prior to August 1, 2015. The Company paid Chardan Capital Markets, LLC, the placement agent for this offering, a cash commission of $403,200. The initial cost of the warrants was $2,400,000 and was recorded as a debit to additional paid-in capital and a credit to derivative liabilities. As of September 30, 2014, all of the Series H warrants remained outstanding, with a fair value of $12,000, which is shown on the Company’s balance sheet as a derivative liability (Note 2).
In June 2012, the Company sold 1,600,000 shares of its common stock, at a price per share of $3.50, in a registered direct offering to institutional investors, representing gross proceeds of $5.60 million. Investors also received Series Q warrants to purchase up to 1,200,000 shares of the Company’s common stock at a purchase price of $5.00 at any time prior to December 22, 2015. The Company paid Chardan Capital Markets, LLC, the placement agent for this offering, a cash commission of $448,000. The initial cost of the warrants was $2,160,000 and was recorded as a debit to additional paid-in capital and a credit to derivative liabilities. As of September 30, 2014, all of the Series Q warrants remained outstanding, with a fair value of $12,000, which is shown on the Company’s balance sheet as a derivative liability (Note 2).
In December 2012, the Company sold 3,500,000 shares of its common stock for $10,500,000, or $3.00 per share, in a registered direct offering. The investors in this offering also received Series R warrants which entitle the investors to purchase up to 2,625,000 shares of the Company’s common stock. The Series R warrants may be exercised at any time before December 7, 2016 at a price of $4.00 per share. The Company paid Chardan Capital Markets, LLC, the placement agent for this offering, a cash commission of $682,500. The initial cost of the warrants was $4,200,000 and was recorded as a debit to additional paid-in capital and a credit to derivative liabilities. As of September 30, 2014, all of the Series R warrants remained outstanding, with a fair value of $157,500, which is shown on the Company’s balance sheet as a derivative liability (Note 2).
On October 11, 2013, the Company closed a public offering of units of common stock and Series S warrants at a price of $1.00 per unit for net proceeds of $16,400,000, net of underwriting discounts and commissions. Each unit consisted of one share of common stock and a warrant to purchase one share of common stock. The warrants are immediately exercisable and expire on October 11, 2018, and have an exercise price of $1.25. In November 2013, the underwriters purchased an additional 2,648,913 warrants pursuant to the overallotment option, for which the Company received net proceeds of $24,370.
On December 24, 2013, the Company closed a public offering of units of common stock and warrants at a price of $0.63 per unit for net proceeds of $2,790,000, net of underwriting discounts and commissions. Each unit consisted of one share of common stock and a warrant to purchase one share of common stock. The warrants are immediately exercisable and expire on October 11, 2018, and have an exercise price of $1.25. The underwriters exercised the option for the full 10% overallotment, for which the Company received net proceeds of approximately $279,000.
F-31
The Company incurred $189,188 in offering costs related to the October and December 2013 offerings which were charged to additional paid-in capital and netted against the cash proceeds in the Statement of Cash Flows. As of September 30, 2014, 23,624,326 Series S warrants remained outstanding, with a fair value of $5,197,352, which is shown on the Company’s balance sheet as a derivative liability (Note 2).
The October and December 2013 financings triggered the reset provision from the August 2008 financing which resulted in the issuance of an additional 1,563,083 shares of common stock. The cost of additional shares issued was $1,117,447. This cost was recorded as a debit and a credit to additional paid-in capital and was deemed a dividend.
On April 17, 2014, the Company closed a public offering of units consisting of an aggregate of 7,128,229 shares of common stock and Series T warrants to purchase an aggregate of 1,782,057 shares of common stock. The units were sold at a price of $1.40 per unit. The common stock and warrants separated immediately. The warrants are immediately exercisable, expire on October 17, 2014, and have an exercise price of $1.58 per share. The Company received net proceeds of approximately $9,143,000, after deducting the underwriting commissions and offering expenses. The underwriters received 445,514 Series U warrants to purchase one share of common stock. The Series U warrants are exercisable beginning October 17, 2014, expire on October 17, 2017, and have an exercise price of $1.75. As of September 30, 2014, all of the Series T and U warrants remained outstanding, with a fair value of $0 and $120,289, respectively, which is shown on the Company’s balance sheet as a derivative liability (Note 2). On October 17, 2014, all of the Series T warrants expired.
During the year ended September 30, 2014, the Company issued 15,700,000 restricted shares from the Incentive Stock Bonus Plan to officers and employees. The shares are unvested and held in escrow. The shares will only be earned upon the achievement of certain milestones leading to the commercialization of the Company’s Multikine technology
,
or specified increases in the market price of the Company’s stock
.
If the performance or market criteria are not met as specified in the Incentive Stock Bonus Plan, all or a portion of the awarded shares will be forfeited. The fair value of the shares on the date of issuance was calculated by using the market value on the grant-date for issuances where the attainment of performance criteria is likely and using a Monte Carlo simulation for issuances where the attainment of performance criteria is uncertain. The total value of the shares, if earned, is calculated to be $8,662,502 and will be expensed over the requisite service period for each milestone. At September 30, 2014, the Company had unrecognized compensation expense of $7,184,548 relating to the restricted stock awards. None of these restricted shares were vested at September 30, 2014.
F-32
12. FAIR VALUE MEASUREMENTS
In accordance with the provisions of ASC 820, “
Fair Value Measurements
,” the Company determines fair value as the price that would be received to sell an asset or paid to transfer a liability in an orderly transaction between market participants at the measurement date. The Company generally applies the income approach to determine fair value. This method uses valuation techniques to convert future amounts to a single present amount. The measurement is based on the value indicated by current market expectations about those future amounts.
ASC 820 establishes a fair value hierarchy that prioritizes the inputs used to measure fair value. The hierarchy gives the highest priority to active markets for identical assets and liabilities (Level 1 measurement) and the lowest priority to unobservable inputs (Level 3 measurement). The Company classifies fair value balances based on the observability of those inputs. The three levels of the fair value hierarchy are as follows:
|
o
|
Level 1 – Observable inputs such as quoted prices in active markets for identical assets or liabilities
|
|
o
|
Level 2 – Inputs other than quoted prices that are observable for the asset or liability, either directly or indirectly. These include quoted prices for similar assets or liabilities in active markets, quoted prices for identical or similar assets or liabilities in markets that are not active and amounts derived from valuation models where all significant inputs are observable in active markets
|
|
o
|
Level 3 – Unobservable inputs that reflect management’s assumptions
|
For disclosure purposes, assets and liabilities are classified in their entirety in the fair value hierarchy level based on the lowest level of input that is significant to the overall fair value measurement. The Company’s assessment of the significance of a particular input to the fair value measurement requires judgment and may affect the placement within the fair value hierarchy levels.
The table below sets forth the assets and liabilities measured at fair value on a recurring basis, by input level, in the balance sheet at September 30, 2014:
| Quoted Prices in Active Markets for Identical Assets or Liabilities (Level 1) | Significant Other Observable Inputs (Level 2) | Significant Unobservable Inputs (Level 3) | Total | |||||||||||||
|
Derivative Instruments
|
$ | 5,197,352 | $ | - | $ | 307,894 | $ | 5,505,246 | ||||||||
The table below sets forth the assets and liabilities measured at fair value on a recurring basis, by input level, in the balance sheet at September 30, 2013:
| Quoted Prices in Active Markets for Identical Assets or Liabilities (Level 1) | Significant Other Observable Inputs (Level 2) | Significant Unobservable Inputs (Level 3) | Total | |||||||||||||
|
Derivative Instruments
|
$ | - | $ | - | $ | 433,024 | $ | 433,024 | ||||||||
|
2014
|
2013
|
|||||||
|
Beginning balance
|
$ | 433,024 | $ | 6,983,690 | ||||
|
Issuances
|
7,791,448 | 4,200,000 | ||||||
|
Settlements
|
(1,445,528 | ) | - | |||||
|
Transfers to Level 1
|
(7,321,071 | ) | - | |||||
|
Realized and unrealized losses/(gains) recorded in earnings
|
850,021 | (10,750,066 | ) | |||||
|
Ending balance
|
$ | 307,894 | $ | 433,024 | ||||
The fair values of the Company’s derivative instruments disclosed above under Level 3 are primarily derived from valuation models where significant inputs such as historical price and volatility of the Company’s stock as well as U.S. Treasury Bill rates are observable in active markets.
F-33
13. NET LOSS PER COMMON SHARE
Basic loss per share is computed by dividing net loss available to common shareholders by the weighted average number of common shares outstanding during the period. The Company’s potentially dilutive shares, which include outstanding common stock options, common stock warrants, restricted stock and shares issuable on convertible debt, have not been included in the computation of diluted net loss per share for all periods presented, as the result would be anti-dilutive. For the years presented, the gain on derivative instruments in not included in net loss available to common shareholders for purposes of computing dilutive loss per share because its effect is anti-dilutive.
The following table provides a reconciliation of the numerators and denominators of the basic and diluted per-share computations:
| 2014 | 2013 | 2012 | ||||||||||
|
Net loss – available to
common shareholders
|
$ | (28,483,712 | ) | $ | (9,230,478 | ) | $ | (17,645,930 | ) | |||
|
Less: Gain on derivative
Instruments
|
(248,767 | ) | (10,750,666 | ) | (1,911,683 | ) | ||||||
|
Net loss - diluted
|
$ | (28,732,479 | ) | $ | (19,981,144 | ) | $ | (19,557,613 | ) | |||
|
Weighted average number of
shares - basic and diluted
|
58,804,622 | 30,279,442 | 25,183,654 | |||||||||
|
Loss per share - basic
|
$ | (0.48 | ) | $ | (0.30 | ) | $ | (0.70 | ) | |||
|
Loss per share - diluted
|
$ | (0.49 | ) | $ | (0.66 | ) | $ | (0.78 | ) | |||
In accordance with the contingently issuable shares guidance of FASB ASC Topic 260,
Earnings Per Share
, the calculation of diluted net loss per share excludes 15,700,000 shares of unvested restricted stock for the year ended September 30, 2014, because their inclusion would be anti-dilutive. Also excluded from the above computations of weighted-average shares for diluted net loss per share were options and warrants to purchase approximately 40,271,000
,
12,351,000 and 9,827,000 shares of common stock as of September 30, 2014, 2013 and 2012, respectively, because their inclusion would be anti-dilutive.
14. SEGMENT REPORTING
ASC 280, “
Disclosure about Segments of an Enterprise and Related Information
” establishes standards for reporting information regarding operating segments in annual financial statements and requires selected information for those segments to be presented in interim financial reports issued to stockholders. This topic also establishes standards for related disclosures about products and services and geographic areas. Operating segments are identified as components of an enterprise about which separate discrete financial information is available for evaluation by the chief operating decision maker, or decision-making group, in making decisions how to allocate resources and assess performance. The Company’s chief decision maker, as defined under this topic, is the Chief Executive Officer. To date, the Company has viewed its operations as principally one segment, the research and development of certain drugs and vaccines. As a result, the financial information disclosed herein materially represents all of the financial information related to the Company’s principal operating segment.
F-34
15. QUARTERLY INFORMATION (UNAUDITED)
The following quarterly data are derived from the Company’s statements of operations.
Financial Data
|
Fiscal 2014
|
||||||||||||||||||||
|
Three months
|
Three months
|
Three months
|
Three months
|
|||||||||||||||||
|
ended
|
ended
|
ended
|
Ended
|
Year ended
|
||||||||||||||||
|
December 31
2013
|
March 31,
2014
|
June 30,
2014
|
September 30,
2014
|
September 30,
2014
|
||||||||||||||||
|
Revenue
|
$ | 113,144 | $ | 67,157 | $ | 15,914 | $ | 67,818 | $ | 264,033 | ||||||||||
|
Operating expenses
|
6,047,454 | 6,293,592 | 6,917,243 | 8,579,856 | 27,838,145 | |||||||||||||||
|
Non-operating expenses, net
|
(10,925 | ) | (6,797 | ) | (10,927 | ) | (12,271 | ) | (40,920 | ) | ||||||||||
|
Gain (loss) on derivative instruments
|
1,610,817 | (7,132,348 | ) | 4,467,776 | 1,302,522 | 248,767 | ||||||||||||||
|
Net loss
|
(4,334,418 | ) | (13,365,580 | ) | (2,444,480 | ) | (7,221,787 | ) | (27,366,265 | ) | ||||||||||
|
Issuance of shares due to reset provisions
|
(1,117,447 | ) | - | - | - | (1,117,447 | ) | |||||||||||||
|
Net loss available to
|
||||||||||||||||||||
|
common shareholders
|
$ | (5,451,865 | ) | $ | (13,365,580 | ) | $ | (2,444,480 | ) | $ | (7,221,787 | ) | $ | (28,483,712 | ) | |||||
|
Net loss per share-basic
|
$ | (0.11 | ) | $ | (0.24 | ) | $ | (0.04 | ) | $ | (0.11 | ) | $ | (0.48 | ) | |||||
|
Net loss per share-diluted
|
$ | (0.15 | ) | $ | (0.24 | ) | $ | (0.11 | ) | $ | (0.13 | ) | $ | (0.49 | ) | |||||
|
Weighted average shares-basic and diluted
|
48,215,919 | 56,239,562 | 64,664,274 | 66,091,826 | 58,804,622 | |||||||||||||||
|
Fiscal 2013
|
||||||||||||||||||||
|
Three months
|
Three months
|
Three months
|
Three months
|
|||||||||||||||||
|
ended
|
ended
|
ended
|
ended
|
Year ended
|
||||||||||||||||
|
December 31
2012
|
March 31,
2013
|
June 30,
2013
|
September 30,
2013
|
September 30,
2013
|
||||||||||||||||
|
Revenue
|
$ | 15,000 | $ | 15,405 | $ | 113,728 | $ | 15,450 | $ | 159,583 | ||||||||||
|
Operating expenses
|
5,059,457 | 4,255,229 | 5,626,927 | 5,087,191 | 20,027,859 | |||||||||||||||
|
Non operating expenses, net
|
(11,987 | ) | (11,811 | ) | (13,666 | ) | (14,928 | ) | (53,337 | ) | ||||||||||
|
Gain on derivative instruments
|
2,746,198 | 3,538,264 | 1,079,392 | 3,386,812 | 10,750,666 | |||||||||||||||
|
Net loss
|
(2,310,246 | ) | (713,371 | ) | (4,447,473 | ) | (1,699,857 | ) | (9,170,947 | ) | ||||||||||
|
Modification of warrants
|
- | - | (59,531 | ) | - | (59,531 | ) | |||||||||||||
|
Net loss available to
|
||||||||||||||||||||
|
common shareholders
|
$ | (2,310,246 | ) | $ | (713,371 | ) | $ | (4,507,004 | ) | $ | (1,699,857 | ) | $ | (9,230,478 | ) | |||||
|
Net loss per share-basic
|
$ | (0.08 | ) | $ | (0.02 | ) | $ | (0.15 | ) | $ | (0.05 | ) | $ | (0.30 | ) | |||||
|
Net loss per share-diluted
|
$ | (0.18 | ) | $ | (0.14 | ) | $ | (0.18 | ) | $ | (0.16 | ) | $ | (0.66 | ) | |||||
|
Weighted average shares-basic and diluted
|
28,311,602 | 30,901,177 | 30,930,650 | 30,994,932 | 30,279,442 | |||||||||||||||
The Company has experienced large swings in its quarterly gains and losses in 2014 and 2013 caused by the changes in the fair value of warrants each quarter.
F-35
17. SUBSEQUENT EVENTS
In accordance with ASC 855, “
Subsequent Events
”, the Company has reviewed subsequent events through the date of the filing.
On October 24, 2014 the Company announced that it closed an underwritten public offering of 7,894,737 shares of common stock and 1,973,684 warrants to purchase shares of common stock. For every four shares of common stock sold, investors in this offering were issued a warrant to purchase one share of common stock. The common stock and warrants were sold at a combined price of $0.76 for net proceeds of approximately $5.5 million, net of underwriting discounts and commissions and offering expenses. The warrants were immediately exercisable, expire October 11, 2018 and have an exercise price of $1.25.
Additionally, on October 21, 2014, the Company announced that it had sold 1,320,000 shares of the Company’s common stock, as well as warrants to purchase an additional 330,000 shares of common stock. For every four shares sold, the Company issued to investors in this offering one warrant. The shares of common stock and warrants are being sold at a combined price of $0.76 per share with net proceeds from the offering of approximately $928,000, after deducting the sales and commissions and estimated expenses. The common stock and warrants will separate immediately. The warrants were immediately exercisable, expire October 11, 2018 and have an exercise price of $1.25.
F-36
SIGNATURES
In accordance with Section 13 or 15(a) of the Exchange Act, the Registrant has caused this Report to be signed on its behalf by the undersigned, thereunto duly authorized on the
23rd day of December 2014.
|
CEL-SCI CORPORATION
|
|||
|
|
By:
|
/s/ Maximilian de Clara | |
|
Maximilian de Clara, President
|
|||
Pursuant to the requirements of the Securities Act of l934, this Report has been signed below by the following persons on behalf of the Registrant and in the capacities and on the dates indicated.
|
Signature
|
Title
|
Date
|
||
|
/s/
Maximilian de Clara
|
Director
|
December 23, 2014
|
||
|
Maximilian de Clara
|
||||
|
/s/
Geert R. Kersten
|
Chief Executive, Principal
Accounting, Principal Financial
Officer and a Director
|
December 23, 2014
|
||
|
Geert R. Kersten
|
||||
|
/s/
Alexander G. Esterhazy
|
Director
|
December 23, 2014
|
||
|
Alexander G. Esterhazy
|
||||
|
/s/ Dr. C. Richard Kinsolving
|
Director
|
December 23, 2014
|
||
|
Dr. C. Richard Kinsolving
|
||||
|
/s/ Dr. Peter R. Young
|
Director
|
December 23, 2014
|
||
|
Dr. Peter R. Young
|
F-37
TABLE OF CONTENTS
Part IItem 1. BusinessItem 1B. Unresolved Sec CommentsItem 2. PropertiesItem 3. Legal ProceedingsItem 4. Mine Safety DisclosureItem 5. Market For Cel-sci's Common Equity and Related Stockholder MattersItem 6. Selected Financial DataItem 7. Management's Discussion and Analysis Of Financial Condition and Results Of OperationsItem 7A. Quantitative and Qualitative Disclosure About Market RisksItem 8. Financial Statements and Supplementary DataItem 9. Changes in and Disagreements with Accountants on Accounting and Financial DisclosureItem 9A. Controls and ProceduresItem 9B. Other InformationItem 10. Directors and Executive Officers Of The RegistrantItem 11. Executive CompensationItem 12. Security Ownership Of Certain Beneficial Owners and Management and Related Stockholder MattersItem 13. Certain Relationships and Related TransactionsItem 14 . Principal Accounting Fees and ServicesItem 15. Exhibits, Financial Statement Schedules