|
|
|
|
|
|
|
|
|
|
|
|
|
|
|
|
|
|
|
|
|
|
|
|
|
|
|
|
|
|
|
|
|
|
|
|
|
|
|
|
|
|
|
|
|
|
|
|
|
|
|
|
|
|
|
|
|
|
|
Table of Contents
| Delaware | 94-0890210 |
6001 Bollinger Canyon Road,
San Ramon, California 94583-2324 |
||
|
|
|
|
||
|
(State or other jurisdiction of
incorporation or organization) |
(I.R.S. Employer
Identification No.) |
(Address of principal executive offices) (Zip Code) |
|
Title of Each Class |
Name of Each Exchange
on Which Registered |
|
|
|
|
Yes þ No o
Yes o No þ
Yes þ No o
|
Large
accelerated filer
þ
|
Accelerated filer o |
Non-accelerated filer
o
(Do not check if a smaller reporting company) |
Smaller reporting company o |
| Item | Page No. | |||||||
| 3 | ||||||||
| 3 | ||||||||
| 4 | ||||||||
|
|
4 | |||||||
|
|
4 | |||||||
|
|
5 | |||||||
|
|
6 | |||||||
|
|
6 | |||||||
|
|
6 | |||||||
|
|
7 | |||||||
|
|
8 | |||||||
|
|
8 | |||||||
|
|
9 | |||||||
|
|
9 | |||||||
|
|
24 | |||||||
|
|
25 | |||||||
|
|
25 | |||||||
|
|
26 | |||||||
|
|
27 | |||||||
|
|
28 | |||||||
|
|
29 | |||||||
|
|
29 | |||||||
|
|
30 | |||||||
|
|
30 | |||||||
|
|
30 | |||||||
|
|
30 | |||||||
|
|
31 | |||||||
| 32 | ||||||||
| 34 | ||||||||
| 34 | ||||||||
| 34 | ||||||||
| PART II | ||||||||
| 37 | ||||||||
| 37 | ||||||||
| 37 | ||||||||
| 37 | ||||||||
| 37 | ||||||||
| 37 | ||||||||
| 38 | ||||||||
| 38 | ||||||||
| 38 | ||||||||
| 38 | ||||||||
| 38 | ||||||||
| PART III | ||||||||
| 39 | ||||||||
| 40 | ||||||||
| 40 | ||||||||
| 40 | ||||||||
| 40 | ||||||||
| PART IV | ||||||||
| 41 | ||||||||
| 42 | ||||||||
| 43 | ||||||||
| EX-12.1 | ||||||||
| EX-21.1 | ||||||||
| EX-23.1 | ||||||||
| EX-24.1 | ||||||||
| EX-24.2 | ||||||||
| EX-24.3 | ||||||||
| EX-24.4 | ||||||||
| EX-24.5 | ||||||||
| EX-24.6 | ||||||||
| EX-24.7 | ||||||||
| EX-24.8 | ||||||||
| EX-24.9 | ||||||||
| EX-24.10 | ||||||||
| EX-24.11 | ||||||||
| EX-24.12 | ||||||||
| EX-24.13 | ||||||||
| EX-24.14 | ||||||||
| EX-31.1 | ||||||||
| EX-31.2 | ||||||||
| EX-32.1 | ||||||||
| EX-32.2 | ||||||||
| EX-99.1 | ||||||||
| EX-99.2 | ||||||||
| EX-101 INSTANCE DOCUMENT | ||||||||
| EX-101 SCHEMA DOCUMENT | ||||||||
| EX-101 CALCULATION LINKBASE DOCUMENT | ||||||||
| EX-101 LABELS LINKBASE DOCUMENT | ||||||||
| EX-101 PRESENTATION LINKBASE DOCUMENT | ||||||||
| EX-101 DEFINITION LINKBASE DOCUMENT | ||||||||
1
Table of Contents
FOR THE PURPOSE OF “SAFE HARBOR” PROVISIONS OF THE
PRIVATE SECURITIES LITIGATION REFORM ACT OF 1995
2
Table of Contents
| Item 1. | Business |
| (a) | General Development of Business |
3
Table of Contents
| (b) | Description of Business and Properties |
4
Table of Contents
|
Components of Oil-Equivalent |
||||||||||||||||||||||||
|
Crude Oil & Natural Gas
|
||||||||||||||||||||||||
|
Oil-Equivalent (Thousands
|
Liquids (Thousands of
|
Natural Gas (Millions of
|
||||||||||||||||||||||
| of Barrels per Day) | Barrels per Day) | Cubic Feet per Day) | ||||||||||||||||||||||
| 2010 | 2009 | 2010 | 2009 | 2010 | 2009 | |||||||||||||||||||
|
United States
|
708 | 717 | 489 | 484 | 1,314 | 1,399 | ||||||||||||||||||
|
Other Americas:
|
||||||||||||||||||||||||
|
Canada
|
54 | 28 | 53 | 27 | 4 | 4 | ||||||||||||||||||
|
Colombia
|
41 | 41 | — | — | 249 | 245 | ||||||||||||||||||
|
Trinidad and Tobago
|
38 | 34 | 1 | 1 | 223 | 199 | ||||||||||||||||||
|
Argentina
|
32 | 38 | 31 | 33 | 5 | 27 | ||||||||||||||||||
|
Brazil
|
24 | 2 | 23 | 2 | 7 | — | ||||||||||||||||||
|
Total Other Americas
|
189 | 143 | 108 | 63 | 488 | 475 | ||||||||||||||||||
|
Africa:
|
||||||||||||||||||||||||
|
Nigeria
|
253 | 232 | 239 | 225 | 86 | 48 | ||||||||||||||||||
|
Angola
|
161 | 150 | 152 | 141 | 52 | 49 | ||||||||||||||||||
|
Chad
|
28 | 27 | 27 | 26 | 6 | 5 | ||||||||||||||||||
|
Republic of the Congo
|
25 | 21 | 23 | 19 | 10 | 13 | ||||||||||||||||||
|
Democratic Republic of the Congo
|
2 | 3 | 2 | 3 | 1 | 1 | ||||||||||||||||||
|
Total Africa
|
469 | 433 | 443 | 414 | 155 | 116 | ||||||||||||||||||
|
Asia:
|
||||||||||||||||||||||||
|
Indonesia
|
226 | 243 | 187 | 199 | 236 | 268 | ||||||||||||||||||
|
Thailand
|
216 | 198 | 70 | 65 | 875 | 794 | ||||||||||||||||||
|
Partitioned Zone
(PZ)
4
|
98 | 105 | 94 | 101 | 23 | 21 | ||||||||||||||||||
|
Bangladesh
|
69 | 66 | 2 | 2 | 404 | 387 | ||||||||||||||||||
|
Kazakhstan
|
64 | 69 | 39 | 42 | 149 | 161 | ||||||||||||||||||
|
Azerbaijan
|
30 | 30 | 28 | 28 | 11 | 10 | ||||||||||||||||||
|
Philippines
|
25 | 27 | 4 | 4 | 124 | 137 | ||||||||||||||||||
|
China
|
20 | 19 | 18 | 17 | 13 | 16 | ||||||||||||||||||
|
Myanmar
|
13 | 13 | — | — | 81 | 76 | ||||||||||||||||||
|
Total Asia
|
761 | 770 | 442 | 458 | 1,916 | 1,870 | ||||||||||||||||||
|
Australia
|
111 | 108 | 34 | 35 | 458 | 434 | ||||||||||||||||||
|
Europe:
|
||||||||||||||||||||||||
|
United Kingdom
|
97 | 110 | 64 | 73 | 194 | 222 | ||||||||||||||||||
|
Denmark
|
51 | 55 | 32 | 35 | 116 | 119 | ||||||||||||||||||
|
Netherlands
|
8 | 9 | 2 | 2 | 35 | 41 | ||||||||||||||||||
|
Norway
|
3 | 5 | 3 | 5 | 1 | 1 | ||||||||||||||||||
|
Total Europe
|
159 | 179 | 101 | 115 | 346 | 383 | ||||||||||||||||||
|
Total Consolidated Operations
|
2,397 | 2,350 | 1,617 | 1,569 | 4,677 | 4,677 | ||||||||||||||||||
|
Equity
Affiliates
5
|
366 | 328 | 306 | 277 | 363 | 312 | ||||||||||||||||||
|
Total Including
Affiliates
6
|
2,763 | 2,678 | 1,923 | 1,846 | 5,040 | 4,989 | ||||||||||||||||||
|
1
2009
conformed to 2010 geographic presentation.
|
||||||||||||||||||||||||
|
2
Excludes
Athabasca oil sands production, net:
|
— | 26 | — | 26 | — | — | ||||||||||||||||||
|
3
Includes
synthetic oil: Canada, net
|
24 | — | 24 | — | — | — | ||||||||||||||||||
|
Venezuelan
affiliate,
net
28
|
— | 28 | — | — | — | |||||||||||||||||||
|
4
Located
between Saudi Arabia and Kuwait.
|
||||||||||||||||||||||||
|
5
Volumes
represent Chevron’s share of production by affiliates,
including Tengizchevroil in Kazakhstan and Petroboscan,
Petroindependiente and Petropiar in Venezuela.
|
||||||||||||||||||||||||
|
6
Volumes
include natural gas consumed in operations of 537 million
and 521 million cubic feet per day in 2010 and 2009,
respectively. Total “as sold” natural gas volumes were
4,503 million and 4,468 million cubic feet per day for
2010 and 2009, respectively.
|
||||||||||||||||||||||||
5
Table of Contents
|
Productive
2,3
|
Productive
2
|
|||||||||||||||
| Oil Wells | Gas Wells | |||||||||||||||
| Gross | Net | Gross | Net | |||||||||||||
|
United States
|
49,455 | 32,462 | 11,637 | 5,720 | ||||||||||||
|
Other Americas
|
640 | 487 | 49 | 25 | ||||||||||||
|
Africa
|
2,387 | 798 | 17 | 7 | ||||||||||||
|
Asia
|
12,420 | 10,693 | 3,050 | 1,920 | ||||||||||||
|
Australia
|
753 | 422 | 64 | 11 | ||||||||||||
|
Europe
|
325 | 101 | 156 | 37 | ||||||||||||
|
Total Consolidated Companies
|
65,980 | 44,963 | 14,973 | 7,720 | ||||||||||||
|
Equity in Affiliates
|
1,135 | 404 | 7 | 2 | ||||||||||||
|
Total Including Affiliates
|
67,115 | 45,367 | 14,980 | 7,722 | ||||||||||||
|
Multiple completion wells included above:
|
901 | 590 | 370 | 303 | ||||||||||||
|
1
|
Includes wells producing or capable of producing and injection wells temporarily functioning as producing wells. Wells that produce both crude oil and natural gas are classified as oil wells. | |
|
2
|
Gross wells include the total number of wells in which the company has an interest. Net wells include wholly owned wells and the sum of the company’s fractional interests in gross wells. | |
|
3
|
Canadian synthetic oil is not produced through wells and therefore is not represented in the table above. |
6
Table of Contents
| 2010 | 2009 | 2008 | ||||||||||
|
Liquids — Millions of barrels
|
||||||||||||
|
Consolidated Companies
|
4,270 | 4,610 | 4,735 | |||||||||
|
Affiliated Companies
|
2,233 | 2,363 | 2,615 | |||||||||
|
Natural Gas — Billions of cubic feet
|
||||||||||||
|
Consolidated Companies
|
20,755 | 22,153 | 19,022 | |||||||||
|
Affiliated Companies
|
3,496 | 3,896 | 4,053 | |||||||||
|
Total Oil-Equivalent — Millions of barrels
|
||||||||||||
|
Consolidated Companies
|
7,729 | 8,303 | 7,905 | |||||||||
|
Affiliated Companies
|
2,816 | 3,012 | 3,291 | |||||||||
(Thousands of Acres)
|
Developed and
|
||||||||||||||||||||||||
| Undeveloped 3 | Developed 3 | Undeveloped | ||||||||||||||||||||||
| Gross | Net | Gross | Net | Gross | Net | |||||||||||||||||||
|
United States
|
5,799 | 4,625 | 6,868 | 4,232 | 12,667 | 8,857 | ||||||||||||||||||
|
Other Americas
|
28,039 | 16,405 | 1,197 | 357 | 29,236 | 16,762 | ||||||||||||||||||
|
Africa
|
8,176 | 4,022 | 3,339 | 1,373 | 11,515 | 5,395 | ||||||||||||||||||
|
Asia
|
48,480 | 25,500 | 5,420 | 2,764 | 53,900 | 28,264 | ||||||||||||||||||
|
Australia
|
14,945 | 6,958 | 1,706 | 365 | 16,651 | 7,323 | ||||||||||||||||||
|
Europe
|
4,097 | 2,408 | 632 | 134 | 4,729 | 2,542 | ||||||||||||||||||
|
Total Consolidated Companies
|
109,536 | 59,918 | 19,162 | 9,225 | 128,698 | 69,143 | ||||||||||||||||||
|
Equity in Affiliates
|
636 | 299 | 263 | 106 | 899 | 405 | ||||||||||||||||||
|
Total Including Affiliates
|
110,172 | 60,217 | 19,425 | 9,331 | 129,597 | 69,548 | ||||||||||||||||||
|
1
|
Gross acreage includes the total number of acres in all tracts in which the company has an interest. Net acreage includes wholly owned interests and the sum of the company’s fractional interests in gross acreage. | |
|
2
|
Table does not include mining acreage associated with synthetic oil production in Canada. At year-end 2010, such undeveloped gross and net acreage totaled 222 and 31, respectively. Developed gross and net acreage associated with Canadian synthetic oil operations totaled 48 and 9, respectively. Developed acreage is acreage associated with productive mines. Undeveloped acreage is acreage on which mines have not been established and that may contain undeveloped proved reserves. | |
|
3
|
Developed acreage is spaced or assignable to productive wells. Undeveloped acreage is acreage on which wells have not been drilled or completed to permit commercial production and that may contain proved undeveloped reserves. The gross undeveloped acres that will expire in 2011, 2012 and 2013 if production is not established by certain required dates are 6,458, 2,672 and 5,996, respectively. |
7
Table of Contents
|
Wells Drilling
|
Net Wells Completed 1,2 | |||||||||||||||||||||||||||||||
| at 12/31/10 3 | 2010 | 2009 | 2008 | |||||||||||||||||||||||||||||
| Gross | Net | Prod. | Dry | Prod. | Dry | Prod. | Dry | |||||||||||||||||||||||||
|
United States
|
62 | 32 | 634 | 7 | 582 | 3 | 846 | 4 | ||||||||||||||||||||||||
|
Other Americas
|
4 | 2 | 32 | — | 36 | — | 35 | — | ||||||||||||||||||||||||
|
Africa
|
12 | 5 | 33 | — | 40 | — | 33 | — | ||||||||||||||||||||||||
|
Asia
|
55 | 21 | 445 | 15 | 580 | 10 | 665 | 1 | ||||||||||||||||||||||||
|
Australia
|
— | — | — | — | — | — | — | — | ||||||||||||||||||||||||
|
Europe
|
5 | — | 4 | — | 7 | — | 6 | — | ||||||||||||||||||||||||
|
Total Consolidated Companies
|
138 | 60 | 1,148 | 22 | 1,245 | 13 | 1,585 | 5 | ||||||||||||||||||||||||
|
Equity in Affiliates
|
2 | 1 | 8 | — | 6 | — | 16 | — | ||||||||||||||||||||||||
|
Total Including Affiliates
|
140 | 61 | 1,156 | 22 | 1,251 | 13 | 1,601 | 5 | ||||||||||||||||||||||||
|
1
|
2009 and 2008 conformed to 2010 geographic presentation. | |
|
2
|
Indicates the fractional number of wells completed during the year, regardless of when drilling was initiated. Completion refers to the installation of permanent equipment for the production of crude oil or natural gas or, in the case of a dry well, the reporting of abandonment to the appropriate agency. | |
|
3
|
Represents wells in the process of drilling, including wells for which drilling was not completed and which were temporarily suspended at the end of 2010. Gross wells include the total number of wells in which the company has an interest. Net wells include wholly owned wells and the sum of the company’s fractional interests in gross wells. |
8
Table of Contents
|
Wells Drilling
|
Net Wells Completed 1,2 | |||||||||||||||||||||||||||||||
| at 12/31/10 3 | 2010 | 2009 | 2008 | |||||||||||||||||||||||||||||
| Gross | Net | Prod. | Dry | Prod. | Dry | Prod. | Dry | |||||||||||||||||||||||||
|
United States
|
5 | 2 | 1 | 1 | 4 | 5 | 8 | 2 | ||||||||||||||||||||||||
|
Other Americas
|
2 | 1 | — | 1 | 1 | 2 | 39 | 2 | ||||||||||||||||||||||||
|
Africa
|
5 | 2 | 1 | — | 2 | 1 | 2 | 1 | ||||||||||||||||||||||||
|
Asia
|
9 | 4 | 5 | 5 | 9 | 1 | 9 | 2 | ||||||||||||||||||||||||
|
Australia
|
1 | 1 | 5 | 2 | 4 | 2 | 4 | — | ||||||||||||||||||||||||
|
Europe
|
— | — | — | — | — | — | 1 | — | ||||||||||||||||||||||||
|
Total Consolidated Companies
|
22 | 10 | 12 | 9 | 20 | 11 | 63 | 7 | ||||||||||||||||||||||||
|
Equity in Affiliates
|
— | — | — | — | — | — | — | — | ||||||||||||||||||||||||
|
Total Including Affiliates
|
22 | 10 | 12 | 9 | 20 | 11 | 63 | 7 | ||||||||||||||||||||||||
|
1
|
2009 and 2008 conformed to 2010 geographic presentation. | |
|
2
|
Indicates the fractional number of wells completed during the year, regardless of when drilling was initiated. Completion refers to the installation of permanent equipment for the production of crude oil or natural gas or, in the case of a dry well, the reporting of abandonment to the appropriate agency. Some exploratory wells are not drilled with the intention of producing from the well bore. In such cases, “completion” refers to the completion of drilling. Further categorization of productive or dry is based on the determination as to whether hydrocarbons in a sufficient quantity were found to justify completion as a producing well, whether or not the well is actually going to be completed as a producer. | |
|
3
|
Represents wells that are in the process of drilling but have been neither abandoned nor completed as of the last day of the year, including wells for which drilling was not completed and which were temporarily suspended at the end of 2010. Gross wells include the total number of wells in which the company has an interest. Net wells include wholly owned wells and the sum of the company’s fractional interests in gross wells. |
9
Table of Contents
|
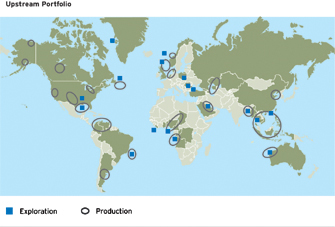
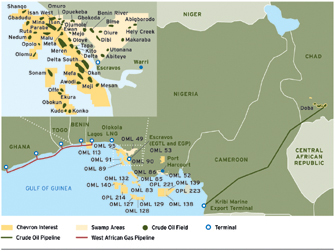
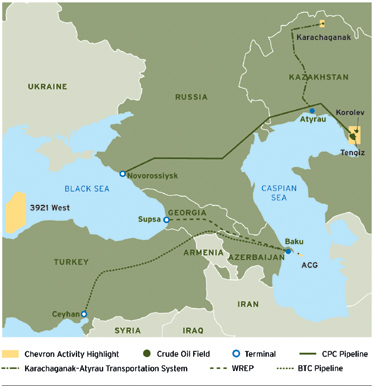
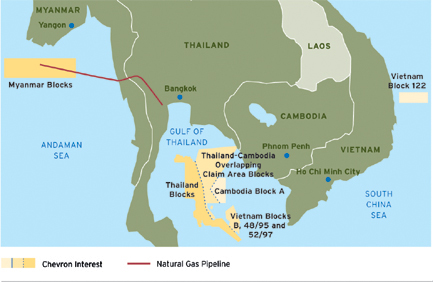
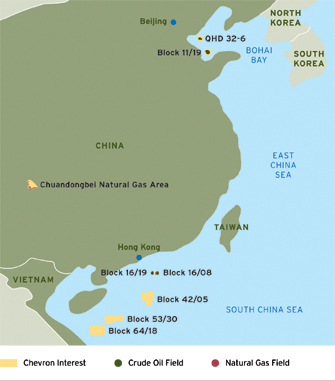
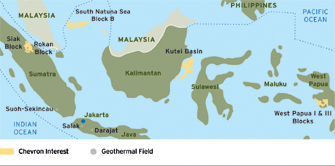
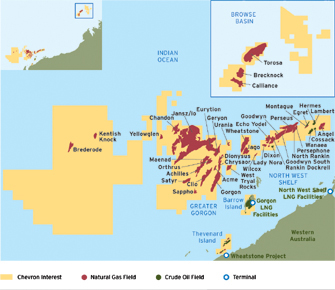
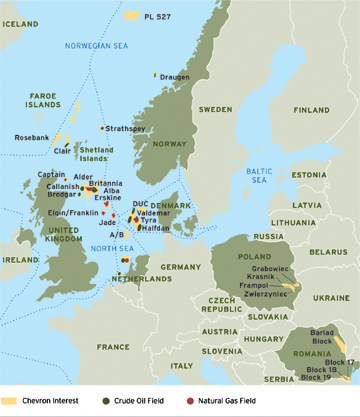
Chevron has exploration and production activities in most of the world’s major hydrocarbon basins. The company’s upstream strategy is to grow profitably in core areas, build new legacy positions and commercialize the company’s equity natural gas resource base while growing a high-impact global gas business. The map at left indicates Chevron’s primary areas of exploration and production. |
| a) | United States |
|
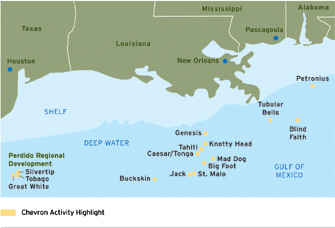
Average net oil-equivalent production during 2010 for the company’s combined interests in the Gulf of Mexico shelf and deepwater areas, and the onshore fields in the region was 260,000 barrels per day. The daily
oil-equivalent
production was composed of 169,000 barrels of crude oil, 445 million cubic feet of natural gas and 17,000 barrels of natural gas liquids.
In April 2010, an accident occurred at the BP-operated Macondo prospect in the deepwater Gulf of Mexico, resulting in a loss of life, the sinking of the rig and a significant oil spill. Chevron was not a participant in the well. Subsequent to the event, the U.S. Department of the Interior placed a moratorium on the drilling of wells using subsea blowout preventers (BOPs) or surface BOPs on a floating facility in the Gulf of Mexico and the Pacific |
10
Table of Contents
11
Table of Contents
| b) | Other Americas |
|
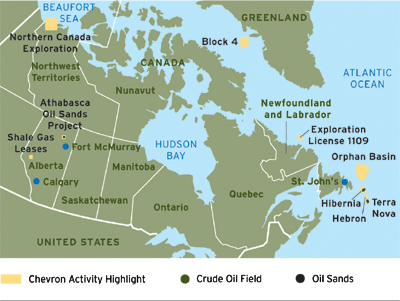
Canada:
Company activities in Canada include nonoperated working interests of 26.9 percent in the Hibernia Field and 26.6 percent in the Hebron Field, both offshore eastern Canada, and 20 percent in both the Athabasca Oil Sands Project (AOSP) and the AOSP Expansion 1 Project. Average net
oil-equivalent
production during 2010 was 54,000 barrels per day, composed of 53,000 barrels of crude oil, synthetic oil and natural gas liquids and 4 million cubic feet of natural gas.
The company’s 2010 production from the Hibernia Field averaged 28,000 barrels per day. The working interest owners are pursuing development of the Hibernia Southern Extension (HSE) unitized blocks. Binding agreements were signed in February 2010 with the government of Newfoundland and Labrador on the development of the HSE unitized area, providing Chevron with a 23.6 percent nonoperated working interest. First |
12
Table of Contents
|
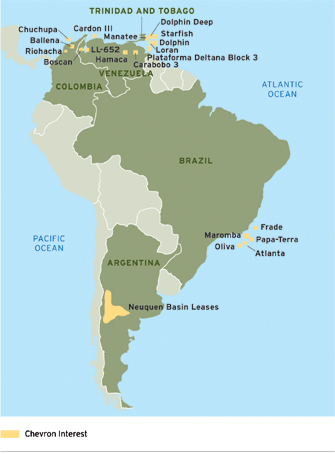
Argentina:
Chevron holds operated interests in five concessions in the Neuquen Basin. Working interests range from 18.8 percent to 100 percent. Net oil-equivalent production in 2010 averaged 32,000 barrels per day, composed of 31,000 barrels of crude oil and natural gas liquids and 5 million cubic feet of natural gas. The company also holds a 14 percent interest in the Oleoductos del Valle S.A. pipeline. In 2010, Chevron sold its interest in the Puesto Prado, Las Bases and El Sauce fields in the Neuquen Basin.
Brazil: Chevron holds working interests in three deepwater blocks in the Campos Basin. Chevron also holds a nonoperated working interest in one deepwater block in the Santos Basin. Net oil-equivalent production in 2010 averaged 24,000 barrels per day. During 2010, development drilling continued at the 51.7 percent-owned and operated Frade Field, located in the Campos Basin. Further development drilling is expected to add five development wells and three injection wells to the field by the end of 2011. The concession that includes the Frade project expires in 2025. In the partner-operated Campos Basin Block BC-20, two areas — 37.5 percent-owned Papa-Terra and 30 percent-owned Maromba — were retained for development following the end of the exploration phase of this block. A final investment decision for the Papa-Terra project was made in January 2010. Major construction contracts were awarded in 2010, and development drilling is expected to |
13
Table of Contents
| c) | Africa |
|
Angola:
Chevron holds company-operated working interests in offshore Blocks 0 and 14 and nonoperated working interests in offshore Block 2 and the onshore Fina Sonangol Texaco (FST) area. Net production from these operations in 2010 averaged 161,000 barrels of
oil-equivalent
per day.
The company operates the 39.2 percent-owned Block 0, which averaged 116,000 barrels per day of net liquids production in 2010. The Block 0 concession extends through 2030. Development of the Mafumeira Field in Block 0 continued in 2010. A development drilling program was completed in the northern section and achieved maximum total crude oil and condensate production of 57,000 barrels per day in fourth quarter 2010. FEED started in January 2010 on Mafumeira Sul, a project to develop the southern portion of the Mafumeira Field. A final investment decision is expected in fourth quarter 2011. Maximum total production from Mafumeira Sul is expected to be 110,000 barrels of crude oil and 10,000 barrels of LPG per day. At year-end 2010, no proved reserves had been recognized for the Mafumeira Sul project. |
14
Table of Contents
well was completed in the fourth quarter. The project is expected to enter FEED in third quarter 2011. A new development area in the Malange Field was awarded in 2010, following a successful 2009 appraisal well. As of the end of 2010, development of the Negage Field remained suspended until cooperative arrangements between Angola and Democratic Republic of the Congo could be finalized. At the end of 2010, proved reserves had not been recognized for these projects.
15
Table of Contents
|
Chad/Cameroon:
Chevron participates in a project to develop crude oil fields in southern Chad and transport the produced volumes by pipeline to the coast of Cameroon for export. Chevron has a 25 percent nonoperated working interest in the producing operations and an approximate 21 percent interest in two affiliates that own the crude oil export pipeline. Average daily net production from the Chad fields in 2010 was 28,000 barrels of oil-equivalent. The Chad producing operations are conducted under a concession that expires in 2030.
Nigeria: Chevron holds a 40 percent interest in 13 concessions predominantly in the onshore and near-offshore region of the Niger Delta. The company operates under a joint-venture arrangement in this region with the Nigerian National Petroleum Corporation, which owns a 60 percent interest. The company also owns varying interests in 10 |
16
Table of Contents
| d) | Asia |
|
Azerbaijan: Chevron holds a nonoperated working interest in the Azerbaijan International Operating Company (AIOC), which produces crude oil in the Caspian Sea from the Azeri-Chirag-Gunashli (ACG) project. In 2010, the company increased its working interest in AIOC from 10.3 percent to 11.3 percent. The company’s daily net production from AIOC averaged 30,000 barrels of oil-equivalent in 2010. AIOC operations are conducted under a production-sharing contract (PSC) that expires in 2024. The final investment decision on the next development phase of the ACG project was made in March 2010, and proved reserves were recognized. The project will further develop the deepwater Gunashli Field. Production is expected to begin in 2013. The total estimated cost of the project is $6 billion with maximum total daily production of 185,000 barrels of oil-equivalent. Chevron also has an 8.9 percent interest in the Baku-Tbilisi-Ceyhan (BTC) affiliate, which owns and operates a crude oil export pipeline from Baku, Azerbaijan, through Georgia to Mediterranean deepwater port facilities in Ceyhan, Turkey. The BTC Pipeline has a capacity of 1.2 million barrels |
17
Table of Contents
18
Table of Contents
|
Thailand: Chevron has operated and nonoperated working interests in multiple offshore blocks. The company’s net oil-equivalent production in 2010 averaged 216,000 barrels per day, composed of 70,000 barrels of crude oil and condensate and 875 million cubic feet of natural gas. All of the company’s natural gas production is sold to PTT Public Company Limited, Thailand’s national oil company, under long-term sales contracts. Operated interests are in the Pattani Basin with ownership interests ranging from 35 percent to 80 percent. Concessions for producing areas within this basin expire between 2022 and 2035. Chevron has a 16 percent nonoperated working interest in the Arthit Field located in the Malay |
19
Table of Contents
|
China:
Chevron has operated and nonoperated working interests in several areas in China. The company’s net oil-equivalent production in 2010 averaged 20,000 barrels per day, composed of 18,000 barrels of crude oil and condensate and 13 million cubic feet of natural gas.
The company operates and holds a 49 percent interest in the Chuandongbei area in the onshore Sichuan Basin, where the company entered into a PSC to develop natural gas resources in 2008. The project includes two sour-gas purification plants with an aggregate design capacity of 740 million cubic feet per day. During 2010, the company continued construction on the first natural gas purification plant and initiated other development activities. First production is expected in 2012, with planned maximum total natural gas production of 558 million cubic feet per day. Proved reserves have been recognized for this project. The PSC for Chuandongbei expires in 2037. Drilling of one exploration well is also planned for third quarter 2011 in the Chuandongbei area. In September 2010, the company acquired new operating interests in three deepwater exploration blocks in the South China Sea’s Pearl River Mouth Basin. The company has a 100 percent working interest in Blocks 53/30 and 64/18, and a 59.2 percent working interest in Block 42/05 under |
|
Indonesia: Chevron holds interests in operated and nonoperated joint ventures in Indonesia. The company has 100 percent-owned and operated interests in the Rokan and Siak PSCs onshore Sumatra. The company’s interest in the Mountain Front Kuantan PSC was transferred to a local operator in second quarter 2010. Chevron also operates four PSCs in the Kutei Basin, located offshore East Kalimantan. These interests range from 80 percent to 92.5 percent. Chevron also has a 25 percent nonoperated working interest in a joint venture in Block B in the South Natuna Sea. The company relinquished its 40 percent interest in the NE Madura III Block in the East Java Sea |
per day. The daily oil-equivalent rate comprised 187,000 barrels of liquids and 236 million cubic feet of natural gas.
The largest producing field is Duri, located in the Rokan PSC. Duri has been under steamflood operation since 1985
and is one of the world’s largest steamflood developments. The North Duri Development is divided into multiple expansion areas.
20
Table of Contents
|
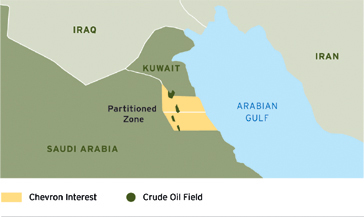
Partitioned Zone (PZ):
Chevron holds a concession with the Kingdom of Saudi Arabia to operate the kingdom’s 50 percent interest in the petroleum resources of the onshore area of the PZ between Saudi Arabia and Kuwait. Under the agreement, the company has rights to this 50 percent interest in the hydrocarbon resource until 2039.
During 2010, the company’s average net oil-equivalent production was 98,000 barrels per day, composed of 94,000 barrels of crude oil and 23 million cubic feet of natural gas. During 2010, the company continued to evaluate data from a steam injection pilot project that was initiated in 2009. The pilot is an application of steam injection into a |
21
Table of Contents
| e) | Australia |
|
Chevron has a 16.7 percent nonoperated working interest in the North West Shelf (NWS) Venture offshore Western Australia. Daily net production from the project during 2010 averaged 25,000 barrels of crude oil and condensate, 456 million cubic feet of natural gas, and 5,000 barrels of LPG. Approximately 70 percent of the natural gas was sold in the form of LNG to major utilities in Japan, South Korea and China, primarily under long-term contracts. The remaining natural gas was sold to the Western Australia domestic market.
The NWS Venture continues to progress two major capital projects — North Rankin 2 and NWS Oil Redevelopment. The North Rankin 2 project is designed to recover remaining low-pressure natural gas from the North Rankin and Perseus natural gas fields to meet gas supply needs. Modifications for process tie-ins and a barge link from North Rankin A progressed during 2010. Upon completion, North Rankin A and B are designed to be operated as a single integrated facility. The project is scheduled to start |
22
Table of Contents
| f) | Europe |
23
Table of Contents
|
Norway:
The company holds a 7.6 percent nonoperated working interest in the Draugen Field. The company’s net production averaged 3,000 barrels of oil-equivalent per day during 2010. Chevron is the operator and has a 40 percent working interest in exploration license PL 527 in the deepwater portion of the Norwegian Sea. In 2010, Chevron focused on processing data from a
2-D
seismic survey. In February 2011, the company relinquished its 40 percent nonoperated working interest in the PL 397 license in the Barents Sea.
Poland: Acquisition work commenced in October 2010 on a 2-D seismic survey across Chevron’s four 100 percent-owned and operated shale gas licenses in southeast Poland (the Zwierzyniec, Kransnik, Frampol and Grabowiec concessions). These licenses cover a combined total of 1.1 million acres. The data will be used to plan a multi-well drilling program expected to start toward the end of 2011. Romania: In July 2010, the company was the successful bidder for three shale gas exploration blocks. Blocks 17, 18 and 19 in southeast Romania comprise approximately 670,000 acres. Negotiation of the license agreements for these blocks continued into 2011. In addition, the company acquired a 100 percent interest in the EV-2 Barlad shale gas concession in February 2011. This license, located in northeast Romania, |
24
Table of Contents
(Crude-unit capacities and crude oil inputs in thousands of barrels per day; includes equity share in affiliates)
| December 31, 2010 | ||||||||||||||||||||||
|
Operable
|
Refinery Inputs | |||||||||||||||||||||
| Locations | Number | Capacity | 2010 | 2009 | 2008 | |||||||||||||||||
|
Pascagoula
|
Mississippi | 1 | 330 | 325 | 345 | 299 | ||||||||||||||||
|
El Segundo
|
California | 1 | 269 | 250 | 247 | 263 | ||||||||||||||||
|
Richmond
|
California | 1 | 243 | 228 | 218 | 237 | ||||||||||||||||
|
Kapolei
|
Hawaii | 1 | 54 | 46 | 49 | 46 | ||||||||||||||||
|
Salt Lake City
|
Utah | 1 | 45 | 41 | 40 | 38 | ||||||||||||||||
|
Perth
Amboy
1
|
New Jersey | 1 | 80 | — | — | 8 | ||||||||||||||||
|
Total Consolidated Companies
—
United
States
|
6 | 1,021 | 890 | 899 | 891 | |||||||||||||||||
|
Pembroke
|
United Kingdom | 1 | 210 | 211 | 205 | 203 | ||||||||||||||||
|
Cape Town
2
|
South Africa | 1 | 110 | 70 | 72 | 75 | ||||||||||||||||
|
Burnaby, B.C.
|
Canada | 1 | 55 | 40 | 49 | 36 | ||||||||||||||||
|
Total Consolidated Companies
—
International
|
3 | 375 | 321 | 326 | 314 | |||||||||||||||||
|
Affiliates
3
|
Various Locations | 8 | 764 | 683 | 653 | 653 | ||||||||||||||||
|
Total Including Affiliates
—
International
|
11 | 1,139 | 1,004 | 979 | 967 | |||||||||||||||||
|
Total Including Affiliates
—
Worldwide
|
17 | 2,160 | 1,894 | 1,878 | 1,858 | |||||||||||||||||
| 1 | Perth Amboy has been idled since early 2008 and is operated as a terminal. | |
| 2 | Chevron holds 100 percent of the common stock issued by Chevron South Africa (Pty) Limited, which owns the Cape Town Refinery. A consortium of South African partners owns preferred shares ultimately convertible to a 25 percent equity interest in Chevron South Africa (Pty) Limited. None of the preferred shares had been converted as of February 2011. | |
| 3 | Includes 3,000 and 6,000 barrels per day of refinery inputs in 2009 and 2008, respectively, for interests in refineries that were sold during those periods. |
25
Table of Contents
(Thousands of Barrels per Day)
| 2010 | 2009 | 2008 | ||||||||||
|
United States
|
||||||||||||
|
Gasoline
|
700 | 720 | 692 | |||||||||
|
Jet Fuel
|
223 | 254 | 274 | |||||||||
|
Gas Oil and Kerosene
|
232 | 226 | 229 | |||||||||
|
Residual Fuel Oil
|
99 | 110 | 127 | |||||||||
|
Other Petroleum
Products
1
|
95 | 93 | 91 | |||||||||
|
Total United States
|
1,349 | 1,403 | 1,413 | |||||||||
|
International
2
|
||||||||||||
|
Gasoline
|
521 | 555 | 589 | |||||||||
|
Jet Fuel
|
271 | 264 | 278 | |||||||||
|
Gas Oil and Kerosene
|
583 | 647 | 710 | |||||||||
|
Residual Fuel Oil
|
197 | 209 | 257 | |||||||||
|
Other Petroleum
Products
1
|
192 | 176 | 182 | |||||||||
|
Total International
|
1,764 | 1,851 | 2,016 | |||||||||
|
Total
Worldwide
2
|
3,113 | 3,254 | 3,429 | |||||||||
|
1
Principally
naphtha, lubricants, asphalt and coke.
|
||||||||||||
|
2
Includes
share of equity affiliates’ sales:
|
562 | 516 | 512 | |||||||||
26
Table of Contents
27
Table of Contents
| Net Mileage 1,2 | ||||
|
United States:
|
||||
|
Crude Oil
|
2,417 | |||
|
Natural Gas
|
2,400 | |||
|
Petroleum
Products
3
|
5,456 | |||
|
Total United States
|
10,273 | |||
|
International:
|
||||
|
Crude Oil
4
|
700 | |||
|
Natural
Gas
5
|
650 | |||
|
Petroleum
Products
3
|
424 | |||
|
Total International
|
1,774 | |||
|
Worldwide
|
12,047 | |||
|
1
|
Partially owned pipelines are included at the company’s equity percentage of total pipeline mileage. | |
|
2
|
Excludes gathering pipelines relating to the crude oil and natural gas production function. | |
|
3
|
Includes the company’s share of chemical pipelines managed by the 50 percent-owned CPChem. | |
|
4
|
Includes the company’s share of Chad/Cameroon pipeline, Baku-Tbilisi-Ceyhan Pipeline, Western Route Export Pipeline and Caspian Pipeline. | |
|
5
|
Includes the company’s share of West Africa Gas Pipeline. |
28
Table of Contents
| U.S. Flag | Foreign Flag | |||||||||||||||
|
Cargo Capacity
|
Cargo Capacity
|
|||||||||||||||
| Number | (Millions of Barrels) | Number | (Millions of Barrels) | |||||||||||||
|
Owned
|
1 | 0.2 | 1 | 1.1 | ||||||||||||
|
Bareboat-Chartered
|
4 | 1.4 | 17 | 25.0 | ||||||||||||
|
Time-Chartered
2
|
— | — | 14 | 10.6 | ||||||||||||
|
Total
|
5 | 1.6 | 32 | 36.7 | ||||||||||||
| 1 | Consolidated companies only. Excludes tankers chartered on a voyage basis, those with dead-weight tonnage less than 25,000 and those used exclusively for storage. |
| 2 | Tankers chartered for more than one year. |
29
Table of Contents
30
Table of Contents
31
Table of Contents
| Item 1A. | Risk Factors |
32
Table of Contents
33
Table of Contents
| Item 1B. | Unresolved Staff Comments |
| Item 2. | Properties |
| Item 3. | Legal Proceedings |
34
Table of Contents
35
Table of Contents
36
Table of Contents
ISSUER PURCHASES OF EQUITY SECURITIES
|
Maximum
|
||||||||||||||||
|
Total Number of
|
Number of Shares
|
|||||||||||||||
|
Total Number
|
Average
|
Shares Purchased as
|
that May Yet be
|
|||||||||||||
|
of Shares
|
Price Paid
|
Part of Publicly
|
Purchased Under
|
|||||||||||||
| Period | Purchased (1)(2) | per Share | Announced Program | the Program (2) | ||||||||||||
|
Oct. 1 – Oct. 31, 2010
|
17,025 | 83.82 | — | — | ||||||||||||
|
Nov. 1 – Nov. 30, 2010
|
4,743,062 | 83.25 | 4,595,000 | — | ||||||||||||
|
Dec. 1 – Dec. 31, 2010
|
4,178,507 | 87.82 | 4,175,800 | — | ||||||||||||
|
Total Oct. 1 – Dec. 31, 2010
|
8,938,594 | 85.45 | 8,770,800 | — | ||||||||||||
| (1) | Pertains to common shares repurchased during the three-month period ended December 31, 2010, from company employees for required personal income tax withholdings on the exercise of the stock options issued to management under long-term incentive plans and former Texaco Inc. and Unocal stock option plans. Also includes shares delivered or attested to in satisfaction of the exercise price by holders of certain former Texaco Inc. employee stock options exercised during the three-month period ended December 31, 2010. | |
| (2) | In July 2010, the company terminated the $15 billion share repurchase program initiated in September 2007. No share repurchases occurred in 2010 prior to the termination of this program. From the inception of that program, the company acquired 118,996,749 shares at a cost of $10.1 billion. In its place, the Board of Directors approved a new, ongoing share repurchase program with no set term or monetary limits, under which common shares would be acquired by the company at prevailing prices, as permitted by securities laws and other legal requirements and subject to market conditions and other factors. As of December 31, 2010, 8,770,800 shares had been acquired under this program for $750 million. |
| Item 6. | Selected Financial Data |
| Item 7. | Management’s Discussion and Analysis of Financial Condition and Results of Operations |
| Item 7A. | Quantitative and Qualitative Disclosures About Market Risk |
| Item 8. | Financial Statements and Supplementary Data |
| Item 9. | Changes in and Disagreements With Accountants on Accounting and Financial Disclosure |
37
Table of Contents
| Item 9A. | Controls and Procedures |
| (a) | Evaluation of Disclosure Controls and Procedures |
| (b) | Management’s Report on Internal Control Over Financial Reporting |
| (c) | Changes in Internal Control Over Financial Reporting |
| Item 9B. | Other Information |
38
Table of Contents
| Item 10. | Directors, Executive Officers and Corporate Governance |
| Name and Age | Current and Prior Positions (up to five years) | Current Areas of Responsibility | ||||
|
J.S. Watson
|
54 |
Chairman of the Board and Chief Executive Officer (since 2010)
|
Chief Executive Officer | |||
| Vice Chairman of the Board (2009) | ||||||
| Executive Vice President (2008 to 2009) | ||||||
|
Vice President and President of Chevron
International Exploration and Production Company (2005 through 2007) |
||||||
|
G.L. Kirkland
|
60 |
Vice Chairman of the Board and Executive
Vice President (since 2010) |
Worldwide Exploration and
Production Activities and Global |
|||
| Executive Vice President (2005 through 2009) | Gas Activities, including Natural | |||||
| Gas Trading | ||||||
|
J.E. Bethancourt
|
59 | Executive Vice President (since 2003)* | Technology; Mining; Health, | |||
| Environment and Safety; Project | ||||||
| Resources Company; Procurement | ||||||
|
J.R. Blackwell
|
52 |
Executive Vice President (as of March 1, 2011)
President of Chevron Asia Pacific Exploration
and Production Company (2008 through 2011)
Managing Director of Chevron Southern Africa
Strategic Business Unit (2003 to 2007) |
Technology; Mining; Project
Resources Company; Procurement |
|||
|
M.K. Wirth
|
50 |
Executive Vice President (since 2006)
President of Global Supply and Trading (2004 to 2006) |
Worldwide Refining, Marketing, Lubricants, and Supply and | |||
| Trading Activities, excluding | ||||||
| Natural Gas Trading; Chemicals | ||||||
|
R.I. Zygocki
|
53 |
Executive Vice President (as of March 1, 2011)
Vice President, Policy, Government and Public
Affairs (2007 through 2011)
Vice President, Health, Environment and
Safety (2003 through 2007) |
Strategy and Planning; Health, Environment and Safety; Policy, Government and Public Affairs | |||
|
P.E. Yarrington
|
54 |
Vice President and Chief Financial Officer
(since 2009) |
Finance | |||
|
Vice President and Treasurer (2007 through 2008)
Vice President, Policy, Government and Public
Affairs (2002 to 2007) |
||||||
|
R.H. Pate
|
48 |
Vice President and General Counsel (since 2009)
Partner and Head of Global Competition Practice
of Hunton & Williams LLP, a major U.S. law firm (2005 to 2009) |
Law, Governance and Compliance | |||
| * | Effective through February 28, 2011. |
39
Table of Contents
| Item 11. | Executive Compensation |
| Item 12. | Security Ownership of Certain Beneficial Owners and Management and Related Stockholder Matters |
| Item 13. | Certain Relationships and Related Transactions, and Director Independence |
| Item 14. | Principal Accounting Fees and Services |
40
Table of Contents
| Item 15. | Exhibits, Financial Statement Schedules |
| Page(s) | ||
| FS-26 | ||
| FS-27 | ||
| FS-28 | ||
| FS-29 | ||
| FS-30 | ||
| FS-31 | ||
| FS-32 to FS-63 |
| Included on page 42 is Schedule II — Valuation and Qualifying Accounts. |
| The Exhibit Index on pages E-1 through E-2 lists the exhibits that are filed as part of this report. |
41
Table of Contents
Millions of Dollars
| Year Ended December 31 | ||||||||||||
| 2010 | 2009 | 2008 | ||||||||||
|
Employee Termination Benefits:
|
||||||||||||
|
Balance at January 1
|
$ | 13 | $ | 44 | $ | 117 | ||||||
|
Additions (deductions) charged (credited) to expense
|
235 | (12 | ) | (13 | ) | |||||||
|
Payments
|
(103 | ) | (19 | ) | (60 | ) | ||||||
|
Balance at December 31
|
$ | 145 | $ | 13 | $ | 44 | ||||||
|
Allowance for Doubtful Accounts:
|
||||||||||||
|
Balance at January 1
|
$ | 293 | $ | 275 | $ | 200 | ||||||
|
(Reductions) additions to expense
|
(13 | ) | 92 | 105 | ||||||||
|
Bad debt write-offs
|
(41 | ) | (74 | ) | (30 | ) | ||||||
|
Balance at December 31
|
$ | 239 | $ | 293 | $ | 275 | ||||||
|
Deferred Income Tax Valuation Allowance:*
|
||||||||||||
|
Balance at January 1
|
$ | 7,921 | $ | 7,535 | $ | 5,949 | ||||||
|
Additions to deferred income tax expense
|
1,454 | 2,204 | 2,599 | |||||||||
|
Reduction of deferred income tax expense
|
(190 | ) | (1,818 | ) | (1,013 | ) | ||||||
|
Balance at December 31
|
$ | 9,185 | $ | 7,921 | $ | 7,535 | ||||||
| * | See also Note 15 to the Consolidated Financial Statements, beginning on page FS-47. |
42
Table of Contents
| By |
/s/
John
S. Watson
|
|
Principal Executive Officers
|
||
| (and Directors) | Directors | |
|
/s/
John S. Watson
John S. Watson, Chairman of the Board and Chief Executive Officer |
Samuel H. Armacost*
Samuel H. Armacost |
|
|
/s/
George L.
Kirkland
George L. Kirkland, Vice Chairman of the Board |
Linnet F. Deily*
Linnet F. Deily |
|
|
Robert E. Denham*
Robert E. Denham |
||
|
Robert J. Eaton*
Robert J. Eaton |
||
|
Chuck Hagel*
Chuck Hagel |
||
|
Principal Financial Officer
/s/ Patricia E. Yarrington Patricia E. Yarrington, Vice President and Chief Financial Officer Principal Accounting Officer /s/ Matthew J. Foehr Matthew J. Foehr, Vice President and Comptroller |
Enrique Hernandez, Jr.*
Enrique Hernandez, Jr. Franklyn G. Jenifer* Franklyn G. Jenifer Sam Nunn* Sam Nunn Donald B. Rice* Donald B. Rice |
|
|
Kevin W. Sharer*
Kevin W. Sharer |
||
|
*By:
/s/
Lydia I.
Beebe
Lydia I. Beebe, Attorney-in-Fact |
Charles R. Shoemate*
Charles R. Shoemate John G. Stumpf* John G. Stumpf |
|
|
Ronald D. Sugar*
Ronald D. Sugar |
||
|
Carl Ware*
Carl Ware |
43
FS-1
Table of Contents
Financial Condition and Results of Operations
| Millions of dollars, except per-share amounts | 2010 | 2009 | 2008 | ||||||||||
|
Net Income Attributable to
|
|||||||||||||
|
Chevron Corporation
|
$ | 19,024 | $ | 10,483 | $ | 23,931 | |||||||
|
Per Share Amounts:
|
|||||||||||||
|
Net Income Attributable to
|
|||||||||||||
|
Chevron Corporation
|
|||||||||||||
|
– Basic
|
$ | 9.53 | $ | 5.26 | $ | 11.74 | |||||||
|
– Diluted
|
$ | 9.48 | $ | 5.24 | $ | 11.67 | |||||||
|
Dividends
|
$ | 2.84 | $ | 2.66 | $ | 2.53 | |||||||
|
Sales and Other
|
|||||||||||||
|
Operating Revenues
|
$ | 198,198 | $ | 167,402 | $ | 264,958 | |||||||
|
Return on:
|
|||||||||||||
|
Capital Employed
|
17.4 | % | 10.6 | % | 26.6 | % | |||||||
|
Stockholders’ Equity
|
19.3 | % | 11.7 | % | 29.2 | % | |||||||
| Millions of dollars | 2010 | 2009 | 2008 | ||||||||||
|
Upstream
1
|
|||||||||||||
|
United States
|
$ | 4,122 | $ | 2,262 | $ | 7,147 | |||||||
|
International
|
13,555 | 8,670 | 15,022 | ||||||||||
|
Total Upstream
|
17,677 | 10,932 | 22,169 | ||||||||||
|
Downstream
1
|
|||||||||||||
|
United States
|
1,339 | (121 | ) | 1,369 | |||||||||
|
International
|
1,139 | 594 | 1,783 | ||||||||||
|
Total Downstream
|
2,478 | 473 | 3,152 | ||||||||||
|
All Other
|
(1,131 | ) | (922 | ) | (1,390 | ) | |||||||
|
Net Income Attributable to
Chevron Corporation 2,3 |
$ | 19,024 | $ | 10,483 | $ | 23,931 | |||||||
|
1
2009 and 2008 information has been revised to
conform with the 2010 segment presentation. |
|||||||||||||
|
2
Includes foreign currency effects:
|
$ | (423 | ) | $ | (744 | ) | $ | 862 | |||||
| 3 Also referred to as “earnings” in the discussions that follow. | |||||||||||||
FS-2
Table of Contents
FS-3
Table of Contents
Financial Condition and Results of Operations
FS-4
Table of Contents
FS-5
Table of Contents
Financial Condition and Results of Operations
FS-6
Table of Contents
| Millions of dollars | 2010 | 2009 | 2008 | ||||||||||
|
Earnings
|
$ | 4,122 | $ | 2,262 | $ | 7,147 | |||||||
FS-7
Table of Contents
Financial Condition and Results of Operations
| Millions of dollars | 2010 | 2009 | 2008 | ||||||||||
|
Earnings*
|
$ | 13,555 | $ | 8,670 | $ | 15,022 | |||||||
|
*Includes foreign currency effects:
|
$ (293 | ) | $ (578 | ) | $ 937 | ||||||||
FS-8
Table of Contents
| Millions of dollars | 2010 | 2009 | 2008 | ||||||||||
|
Earnings
|
$ | 1,339 | $ | (121 | ) | $ | 1,369 | ||||||
| Millions of dollars | 2010 | 2009 | 2008 | ||||||||||
|
Earnings*
|
$ | 1,139 | $ | 594 | $ | 1,783 | |||||||
|
|
|||||||||||||
|
*Includes foreign currency effects:
|
$ | (135 | ) | $ | (191 | ) | $ | 111 | |||||
Earnings of $594 million in 2009 decreased about $1.2 billion from 2008. A decline of approximately $2.6 billion between periods was associated with weaker margins on the manufacture and sale of gasoline and other refined products and the absence of gains recorded in 2008 on derivative instruments. Foreign currency effects produced an unfavorable variance of about $300 million. Partially offsetting these items were a $1.0 billion benefit from lower operating expenses associated mainly with contract labor, professional services and transportation costs, and about a $550 million increase in gains on asset sales related to refined products marketing operations, primarily in certain countries in Latin America and Africa.
International refined product sales volumes of 1.76 million barrels per day in 2010 were 5 percent lower than in 2009, mainly due to asset sales in certain countries in Africa and Latin America. Refined product sales volumes of 1.85 million barrels per day in 2009 were 8 percent lower than in 2008, mainly due to the effects of asset sales and lower demand.
Refer to the “Selected Operating Data” table, on page FS-11, for a three-year comparison of sales volumes of gasoline and other refined products and refinery input volumes.
FS-9
Table of Contents
Financial Condition and Results of Operations
| Millions of dollars | 2010 | 2009 | 2008 | ||||||||||
|
Net charges*
|
$ | (1,131 | ) | $ | (922 | ) | $ | (1,390 | ) | ||||
|
|
|||||||||||||
|
*Includes foreign currency effects:
|
$ | 5 | $ | 25 | $ | (186 | ) | ||||||
| Millions of dollars | 2010 | 2009 | 2008 | ||||||||||
|
Sales and other operating revenues
|
$ | 198,198 | $ | 167,402 | $ | 264,958 | |||||||
| Millions of dollars | 2010 | 2009 | 2008 | ||||||||||
|
Income from equity affiliates
|
$ | 5,637 | $ | 3,316 | $ | 5,366 | |||||||
| Millions of dollars | 2010 | 2009 | 2008 | ||||||||||
|
Other income
|
$ | 1,093 | $ | 918 | $ | 2,681 | |||||||
| Millions of dollars | 2010 | 2009 | 2008 | ||||||||||
|
Purchased crude oil and products
|
$ | 116,467 | $ | 99,653 | $ | 171,397 | |||||||
| Millions of dollars | 2010 | 2009 | 2008 | ||||||||||
|
Operating, selling, general and
administrative expenses |
$ | 23,955 | $ | 22,384 | $ | 26,551 | |||||||
| Operating, selling, general and administrative expenses in 2010 were about $1.6 billion higher than 2009, primarily due to $600 million of higher fuel expenses; $500 million for employee compensation and benefits; $200 million of increased construction, repair and maintenance expense; and an increase of about $200 million associated with higher tanker charter rates. In addition, charges of $234 million related to employee reductions were included in the 2010 period. Total expenses for 2009 decreased approximately $4.2 billion from 2008 primarily due to $1.4 billion of lower fuel and transportation expenses; $800 million of decreased costs for contract labor and professional services; the absence of uninsured 2008 hurricane-related charges of $700 million; a decrease of about $500 million for environmental remediation activities; $200 million of lower costs for materials; and $600 million for other items. |
| Millions of dollars | 2010 | 2009 | 2008 | ||||||||||
|
Exploration expense
|
$ | 1,147 | $ | 1,342 | $ | 1,169 | |||||||
| Exploration expenses in 2010 declined from 2009 mainly due to lower amounts for geological and geophysical costs and well write-offs. Exploration expenses in 2009 |
FS-10
Table of Contents
| Millions of dollars | 2010 | 2009 | 2008 | ||||||||||
|
Depreciation,
depletion and
amortization |
$ | 13,063 | $ | 12,110 | $ | 9,528 | |||||||
|
The increase in 2010 from 2009 was largely due to higher depreciation rates and higher
production for certain oil and gas fields, partly offset by lower impairments. Depreciation,
depletion and amortization expenses increased in 2009 from 2008 due to incremental production
related to start-ups for upstream projects in the United States and Africa and higher depreciation
rates for certain other oil and gas producing fields.
|
|||||||||||||
| Millions of dollars | 2010 | 2009 | 2008 | ||||||||||
|
Taxes other than on income
|
$ | 18,191 | $ | 17,591 | $ | 21,303 | |||||||
|
Taxes other than on income increased in 2010 from 2009 mainly due to higher excise taxes
in Canada and the United Kingdom. Taxes other than on income decreased in 2009 from 2008 mainly due
to lower import duties for the company’s downstream operations in the United Kingdom.
|
|||||||||||||
| Millions of dollars | 2010 | 2009 | 2008 | ||||||||||
|
Interest and debt expense
|
$ | 50 | $ | 28 | $ | – | |||||||
|
Interest and debt expense, net of capitalized interest, increased in 2010 from 2009
primarily due to slightly higher average effective interest rates. The increase in 2009 over 2008
was due to an increase in long-term debt.
|
|||||||||||||
| Millions of dollars | 2010 | 2009 | 2008 | ||||||||||
|
Income tax expense
|
$ | 12,919 | $ | 7,965 | $ | 19,026 | |||||||
| 2010 | 2009 | 2008 | |||||||||||
|
U.S. Upstream
|
|||||||||||||
|
Net Crude Oil and Natural Gas
|
|||||||||||||
|
Liquids Production (MBPD)
|
489 | 484 | 421 | ||||||||||
|
Net Natural Gas Production (MMCFPD)
3
|
1,314 | 1,399 | 1,501 | ||||||||||
|
Net Oil-Equivalent Production (MBOEPD)
|
708 | 717 | 671 | ||||||||||
|
Sales of Natural Gas (MMCFPD)
|
5,932 | 5,901 | 7,226 | ||||||||||
|
Sales of Natural Gas Liquids (MBPD)
|
22 | 17 | 15 | ||||||||||
|
Revenues From Net Production
|
|||||||||||||
|
Liquids ($/Bbl)
|
$ | 71.59 | $ | 54.36 | $ | 88.43 | |||||||
|
Natural Gas ($/MCF)
|
$ | 4.26 | $ | 3.73 | $ | 7.90 | |||||||
|
|
|||||||||||||
|
International Upstream
|
|||||||||||||
|
Net Crude Oil and Natural Gas
|
|||||||||||||
|
Liquids Production (MBPD)
4
|
1,434 | 1,362 | 1,228 | ||||||||||
|
Net Natural Gas Production (MMCFPD)
3
|
3,726 | 3,590 | 3,624 | ||||||||||
|
Net Oil-Equivalent
|
|||||||||||||
|
Production (MBOEPD)
5
|
2,055 | 1,987 | 1,859 | ||||||||||
|
Sales of Natural Gas (MMCFPD)
|
4,493 | 4,062 | 4,215 | ||||||||||
|
Sales of Natural Gas Liquids (MBPD)
|
27 | 23 | 17 | ||||||||||
|
Revenues From Liftings
|
|||||||||||||
|
Liquids ($/Bbl)
|
$ | 72.68 | $ | 55.97 | $ | 86.51 | |||||||
|
Natural Gas ($/MCF)
|
$ | 4.64 | $ | 4.01 | $ | 5.19 | |||||||
|
|
|||||||||||||
|
Worldwide Upstream
|
|||||||||||||
|
Net Oil-Equivalent Production
(MBOEPD) 3, 5 |
|||||||||||||
|
United States
|
708 | 717 | 671 | ||||||||||
|
International
|
2,055 | 1,987 | 1,859 | ||||||||||
|
Total
|
2,763 | 2,704 | 2,530 | ||||||||||
|
|
|||||||||||||
|
U.S. Downstream
|
|||||||||||||
|
Gasoline Sales (MBPD)
6
|
700 | 720 | 692 | ||||||||||
|
Other Refined Product Sales (MBPD)
|
649 | 683 | 721 | ||||||||||
|
Total Refined Product Sales (MBPD)
|
1,349 | 1,403 | 1,413 | ||||||||||
|
Sales of Natural Gas Liquids (MBPD)
|
139 | 144 | 144 | ||||||||||
|
Refinery Input (MBPD)
|
890 | 899 | 891 | ||||||||||
|
|
|||||||||||||
|
International Downstream
|
|||||||||||||
|
Gasoline Sales (MBPD)
6
|
521 | 555 | 589 | ||||||||||
|
Other Refined Product Sales (MBPD)
|
1,243 | 1,296 | 1,427 | ||||||||||
|
Total Refined Product Sales (MBPD)
7
|
1,764 | 1,851 | 2,016 | ||||||||||
|
Sales of Natural Gas Liquids (MBPD)
|
78 | 88 | 97 | ||||||||||
|
Refinery Input (MBPD)
|
1,004 | 979 | 967 | ||||||||||
| 1 | Includes company share of equity affiliates. | |
| 2 |
MBPD – thousands of barrels per day; MMCFPD – millions of cubic feet per day;
MBOEPD – thousands of barrels of oil-equivalents per day; Bbl – Barrel; MCF = Thousands of cubic feet. Oil-equivalent gas (OEG) conversion ratio is 6,000 cubic feet of natural gas = 1 barrel of oil. |
|
| 3 | Includes natural gas consumed in operations (MMCFPD): |
|
United States
|
62 | 58 | 70 | |||||||||
|
International
|
475 | 463 | 450 | |||||||||
|
4
Includes: Canada – synthetic oil
|
24 | – | – | |||||||||
|
Venezuela affiliate – synthetic oil
|
28 | – | – | |||||||||
|
5
Includes Canada oil sands
|
– | 26 | 27 | |||||||||
|
6
Includes branded and unbranded gasoline.
|
||||||||||||
|
7
Includes sales of affiliates (MBPD):
|
562 | 516 | 512 |
FS-11
Table of Contents
Financial Condition and Results of Operations
FS-12
Table of Contents
| 2010 | 2009 | 2008 | ||||||||||||||||||||||||||||||||||||
| Millions of dollars | U.S. | Int’l. | Total | U.S. | Int’l. | Total | U.S. | Int’l. | Total | |||||||||||||||||||||||||||||
|
Upstream
|
$ | 3,450 | $ | 15,454 | $ | 18,904 | $ | 3,294 | $ | 15,002 | $ | 18,296 | $ | 5,648 | $ | 12,713 | $ | 18,361 | ||||||||||||||||||||
|
Downstream
|
1,456 | 1,096 | 2,552 | 2,087 | 1,449 | 3,536 | 2,457 | 1,332 | 3,789 | |||||||||||||||||||||||||||||
|
All Other
|
286 | 13 | 299 | 402 | 3 | 405 | 618 | 7 | 625 | |||||||||||||||||||||||||||||
|
Total
|
$ | 5,192 | $ | 16,563 | $ | 21,755 | $ | 5,783 | $ | 16,454 | $ | 22,237 | $ | 8,723 | $ | 14,052 | $ | 22,775 | ||||||||||||||||||||
|
Total, Excluding Equity in Affiliates
|
$ | 4,934 | $ | 15,433 | $ | 20,367 | $ | 5,558 | $ | 15,094 | $ | 20,652 | $ | 8,241 | $ | 12,228 | $ | 20,469 | ||||||||||||||||||||
Of the $21.8 billion of expenditures in 2010, 87 percent, or $18.9 billion, was related to upstream activities. Approximately 80 percent was expended for upstream operations in 2009 and 2008. International upstream accounted for about 82 percent of the worldwide upstream investment in 2010, about 80 percent in 2009 and about 70 percent in 2008, reflecting the company’s continuing focus on opportunities available outside the United States.
The company estimates that in 2011, capital and exploratory expenditures will be $26.0 billion, including $2.0 billion of spending by affiliates. Approximately 85 percent of the total, or $22.6 billion, is budgeted for exploration and produc-
| At December 31 | |||||||||||||
| 2010 | 2009 | 2008 | |||||||||||
|
Current Ratio
|
1.7 | 1.4 | 1.1 | ||||||||||
|
Interest Coverage Ratio
|
101.7 | 62.3 | 166.9 | ||||||||||
|
Debt Ratio
|
9.8 | % | 10.3 | % | 9.3 | % | |||||||
FS-13
Table of Contents
Financial Condition and Results of Operations
Debt Ratio – total debt as a percentage of total debt plus Chevron Corporation Stockholders’ Equity, which indicates the company’s leverage. The decrease between 2010 and 2009 was due to a higher Chevron Corporation stockholders’ equity balance. The increase in 2009 over 2008 was primarily due to the increase in debt.
| Millions of dollars | Commitment Expiration by Period | |||||||||||||||||||
| 2012– | 2014– | After | ||||||||||||||||||
| Total | 2011 | 2013 | 2015 | 2015 | ||||||||||||||||
|
Guarantee of
non-
consolidated affiliate or joint-venture obligation |
$ | 613 | $ | – | $ | 76 | $ | 77 | $ | 460 | ||||||||||
FS-14
Table of Contents
| Millions of dollars | Payments Due by Period | |||||||||||||||||||
| 2012– | 2014– | After | ||||||||||||||||||
| Total | 2011 | 2013 | 2015 | 2015 | ||||||||||||||||
|
On Balance Sheet:
2
|
||||||||||||||||||||
|
Short-Term Debt
3
|
$ | 187 | $ | 187 | $ | – | $ | – | $ | – | ||||||||||
|
Long-Term Debt
3
|
11,003 | – | 6,940 | 2,020 | 2,043 | |||||||||||||||
|
Noncancelable Capital
Lease Obligations |
488 | 99 | 161 | 91 | 137 | |||||||||||||||
|
Interest
|
2,208 | 299 | 486 | 320 | 1,103 | |||||||||||||||
|
Off Balance Sheet:
|
||||||||||||||||||||
|
Noncancelable Operating Lease Obligations
|
2,836 | 650 | 900 | 561 | 725 | |||||||||||||||
|
Throughput and
Take-or-Pay Agreements |
34,127 | 16,305 | 5,592 | 4,727 | 7,503 | |||||||||||||||
|
Other Unconditional Purchase Obligations
4
|
4,420 | 913 | 2,004 | 1,343 | 160 | |||||||||||||||
| 1 | Excludes contributions for pensions and other postretirement benefit plans. Information on employee benefit plans is contained in Note 21 beginning on page FS-52. | |
| 2 | Does not include amounts related to the company’s income tax liabilities associated with uncertain tax positions. The company is unable to make reasonable estimates for the periods in which these liabilities may become payable. The company does not expect settlement of such liabilities will have a material effect on its results of operations, consolidated financial position or liquidity in any single period. | |
| 3 | $5.4 billion of short-term debt that the company expects to refinance is included in long-term debt. The repayment schedule above reflects the projected repayment of the entire amounts in the 2012-2013 period. | |
| 4 | Does not include obligations to purchase the company’s share of natural gas liquids and regasified natural gas associated with operations of the 36.4 percent-owned Angola LNG affiliate. The LNG plant is expected to commence operations in 2012 and is designed to produce 5.2 million metric tons of LNG and related natural gas liquids per year. Volumes and prices associated with these purchase obligations are neither fixed nor determinable. |
FS-15
Table of Contents
Financial Condition and Results of Operations
| Millions of dollars | 2010 | 2009 | |||||||
|
Crude Oil
|
$ | 15 | $ | 17 | |||||
|
Natural Gas
|
4 | 4 | |||||||
|
Refined Products
|
14 | 19 | |||||||
FS-16
Table of Contents
FS-17
Table of Contents
Financial Condition and Results of Operations
| Millions of dollars | 2010 | 2009 | 2008 | ||||||||||
|
Balance at January 1
|
$ | 1,700 | $ | 1,818 | $ | 1,539 | |||||||
|
Net Additions
|
220 | 351 | 784 | ||||||||||
|
Expenditures
|
(413 | ) | (469 | ) | (505 | ) | |||||||
|
Balance at December 31
|
$ | 1,507 | $ | 1,700 | $ | 1,818 | |||||||
FS-18
Table of Contents
FS-19
Table of Contents
Financial Condition and Results of Operations
| 1. | the nature of the estimates and assumptions is material due to the levels of subjectivity and judgment necessary to account for highly uncertain matters or the susceptibility of such matters to change; and | ||
| 2. | the impact of the estimates and assumptions on the company’s financial condition or operating performance is material. |
FS-20
Table of Contents
FS-21
Table of Contents
Financial Condition and Results of Operations
FS-22
Table of Contents
FS-23
Table of Contents
Unaudited
| 2010 | 2009 | ||||||||||||||||||||||||||||||||
| Millions of dollars, except per-share amounts | 4th Q | 3rd Q | 2nd Q | 1st Q | 4th Q | 3rd Q | 2nd Q | 1st Q | |||||||||||||||||||||||||
|
Revenues and Other Income
|
|||||||||||||||||||||||||||||||||
|
Sales and other operating revenues
1
|
$ | 51,852 | $ | 48,554 | $ | 51,051 | $ | 46,741 | $ | 47,588 | $ | 45,180 | $ | 39,647 | $ | 34,987 | |||||||||||||||||
|
Income from equity affiliates
|
1,510 | 1,242 | 1,650 | 1,235 | 898 | 1,072 | 735 | 611 | |||||||||||||||||||||||||
|
Other income
|
665 | (78 | ) | 303 | 203 | 190 | 373 | (177 | ) | 532 | |||||||||||||||||||||||
|
Total Revenues and Other Income
|
54,027 | 49,718 | 53,004 | 48,179 | 48,676 | 46,625 | 40,205 | 36,130 | |||||||||||||||||||||||||
|
Costs and Other Deductions
|
|||||||||||||||||||||||||||||||||
|
Purchased crude oil and products
|
30,109 | 28,610 | 30,604 | 27,144 | 28,606 | 26,969 | 23,678 | 20,400 | |||||||||||||||||||||||||
|
Operating expenses
|
5,343 | 4,665 | 4,591 | 4,589 | 4,899 | 4,403 | 4,209 | 4,346 | |||||||||||||||||||||||||
|
Selling, general and administrative expenses
|
1,408 | 1,181 | 1,136 | 1,042 | 1,330 | 1,177 | 1,043 | 977 | |||||||||||||||||||||||||
|
Exploration expenses
|
335 | 420 | 212 | 180 | 281 | 242 | 438 | 381 | |||||||||||||||||||||||||
|
Depreciation, depletion and amortization
|
3,439 | 3,401 | 3,141 | 3,082 | 3,156 | 2,988 | 3,099 | 2,867 | |||||||||||||||||||||||||
|
Taxes other than on income
1
|
4,623 | 4,559 | 4,537 | 4,472 | 4,583 | 4,644 | 4,386 | 3,978 | |||||||||||||||||||||||||
|
Interest and debt expense
|
4 | 9 | 17 | 20 | – | 14 | 6 | 8 | |||||||||||||||||||||||||
|
Total Costs and Other Deductions
|
45,261 | 42,845 | 44,238 | 40,529 | 42,855 | 40,437 | 36,859 | 32,957 | |||||||||||||||||||||||||
|
Income Before Income Tax Expense
|
8,766 | 6,873 | 8,766 | 7,650 | 5,821 | 6,188 | 3,346 | 3,173 | |||||||||||||||||||||||||
|
Income Tax Expense
|
3,446 | 3,081 | 3,322 | 3,070 | 2,719 | 2,342 | 1,585 | 1,319 | |||||||||||||||||||||||||
|
Net Income
|
$ | 5,320 | $ | 3,792 | $ | 5,444 | $ | 4,580 | $ | 3,102 | $ | 3,846 | $ | 1,761 | $ | 1,854 | |||||||||||||||||
|
Less: Net income attributable to
noncontrolling interests |
25 | 24 | 35 | 28 | 32 | 15 | 16 | 17 | |||||||||||||||||||||||||
|
Net Income Attributable to Chevron Corporation
|
$ | 5,295 | $ | 3,768 | $ | 5,409 | $ | 4,552 | $ | 3,070 | $ | 3,831 | $ | 1,745 | $ | 1,837 | |||||||||||||||||
|
Per Share of Common Stock
|
|||||||||||||||||||||||||||||||||
|
Net Income Attributable to Chevron Corporation
|
|||||||||||||||||||||||||||||||||
|
– Basic
|
$ | 2.65 | $ | 1.89 | $ | 2.71 | $ | 2.28 | $ | 1.54 | $ | 1.92 | $ | 0.88 | $ | 0.92 | |||||||||||||||||
|
– Diluted
|
$ | 2.64 | $ | 1.87 | $ | 2.70 | $ | 2.27 | $ | 1.53 | $ | 1.92 | $ | 0.87 | $ | 0.92 | |||||||||||||||||
|
Dividends
|
$ | 0.72 | $ | 0.72 | $ | 0.72 | $ | 0.68 | $ | 0.68 | $ | 0.68 | $ | 0.65 | $ | 0.65 | |||||||||||||||||
|
Common Stock Price Range – High
2,3
|
$ | 92.39 | $ | 82.19 | $ | 83.41 | $ | 81.09 | $ | 79.82 | $ | 73.37 | $ | 72.75 | $ | 78.45 | |||||||||||||||||
|
– Low
2,3
|
$ | 80.41 | $ | 66.83 | $ | 67.80 | $ | 69.55 | $ | 67.87 | $ | 60.88 | $ | 63.06 | $ | 56.12 | |||||||||||||||||
|
1
Includes excise, value-added and similar taxes:
|
$ | 2,136 | $ | 2,182 | $ | 2,201 | $ | 2,072 | $ | 2,086 | $ | 2,079 | $ | 2,034 | $ | 1,910 | |||||||||||||||||
|
2
Intraday price.
|
|||||||||||||||||||||||||||||||||
|
3
2009 conformed with 2010 presentation.
|
|||||||||||||||||||||||||||||||||
FS-24
Table of Contents

|

|

|
||||
|
|
||||||
|
John S. Watson
|
Patricia E. Yarrington | Matthew J. Foehr | ||||
| Chairman of the Board | Vice President | Vice President | ||||
| and Chief Executive Officer | and Chief Financial Officer | and Comptroller |
FS-25
Table of Contents
February 24, 2011
FS-26
Table of Contents
| Year ended December 31 | |||||||||||||
| 2010 | 2009 | 2008 | |||||||||||
|
Revenues and Other Income
|
|||||||||||||
|
Sales and other operating revenues*
|
$ | 198,198 | $ | 167,402 | $ | 264,958 | |||||||
|
Income from equity affiliates
|
5,637 | 3,316 | 5,366 | ||||||||||
|
Other income
|
1,093 | 918 | 2,681 | ||||||||||
|
Total Revenues and Other Income
|
204,928 | 171,636 | 273,005 | ||||||||||
|
Costs and Other Deductions
|
|||||||||||||
|
Purchased crude oil and products
|
116,467 | 99,653 | 171,397 | ||||||||||
|
Operating expenses
|
19,188 | 17,857 | 20,795 | ||||||||||
|
Selling, general and administrative expenses
|
4,767 | 4,527 | 5,756 | ||||||||||
|
Exploration expenses
|
1,147 | 1,342 | 1,169 | ||||||||||
|
Depreciation, depletion and amortization
|
13,063 | 12,110 | 9,528 | ||||||||||
|
Taxes other than on income*
|
18,191 | 17,591 | 21,303 | ||||||||||
|
Interest and debt expense
|
50 | 28 | – | ||||||||||
|
Total Costs and Other Deductions
|
172,873 | 153,108 | 229,948 | ||||||||||
|
Income Before Income Tax Expense
|
32,055 | 18,528 | 43,057 | ||||||||||
|
Income Tax Expense
|
12,919 | 7,965 | 19,026 | ||||||||||
|
Net Income
|
19,136 | 10,563 | 24,031 | ||||||||||
|
Less: Net income attributable to noncontrolling
interests
|
112 | 80 | 100 | ||||||||||
|
Net Income Attributable to Chevron Corporation
|
$ | 19,024 | $ | 10,483 | $ | 23,931 | |||||||
|
Per Share of Common Stock
|
|||||||||||||
|
Net Income Attributable to Chevron Corporation
|
|||||||||||||
|
– Basic
|
$ | 9.53 | $ | 5.26 | $ | 11.74 | |||||||
|
– Diluted
|
$ | 9.48 | $ | 5.24 | $ | 11.67 | |||||||
|
*Includes excise, value-added and similar taxes.
|
$ | 8,591 | $ | 8,109 | $ | 9,846 | |||||||
FS-27
Table of Contents
Millions of dollars
| Year ended December 31 | |||||||||||||
| 2010 | 2009 | 2008 | |||||||||||
|
Net Income
|
$ | 19,136 | $ | 10,563 | $ | 24,031 | |||||||
|
Currency translation adjustment
|
|||||||||||||
|
Unrealized net change arising during period
|
6 | 60 | (112 | ) | |||||||||
|
Unrealized holding (loss) gain on securities
|
|||||||||||||
|
Net (loss) gain arising during period
|
(4 | ) | 2 | (6 | ) | ||||||||
|
Derivatives
|
|||||||||||||
|
Net derivatives gain (loss) on hedge transactions
|
25 | (69 | ) | 139 | |||||||||
|
Reclassification to net income of net realized loss (gain)
|
5 | (23 | ) | 32 | |||||||||
|
Income taxes on derivatives transactions
|
(10 | ) | 32 | (61 | ) | ||||||||
|
Total
|
20 | (60 | ) | 110 | |||||||||
|
Defined benefit plans
|
|||||||||||||
|
Actuarial loss
|
|||||||||||||
|
Amortization to net income of net actuarial loss
|
635 | 575 | 483 | ||||||||||
|
Actuarial loss arising during period
|
(857 | ) | (1,099 | ) | (3,228 | ) | |||||||
|
Prior service cost
|
|||||||||||||
|
Amortization to net income of net prior service credits
|
(61 | ) | (65 | ) | (64 | ) | |||||||
|
Prior service cost arising during period
|
(12 | ) | (34 | ) | (32 | ) | |||||||
|
Defined benefit plans sponsored by equity affiliates
|
(12 | ) | 65 | (97 | ) | ||||||||
|
Income taxes on defined benefit plans
|
140 | 159 | 1,037 | ||||||||||
|
Total
|
(167 | ) | (399 | ) | (1,901 | ) | |||||||
|
Other Comprehensive Loss, Net of Tax
|
(145 | ) | (397 | ) | (1,909 | ) | |||||||
|
Comprehensive Income
|
18,991 | 10,166 | 22,122 | ||||||||||
|
Comprehensive income attributable to noncontrolling
interests
|
(112 | ) | (80 | ) | (100 | ) | |||||||
|
Comprehensive Income Attributable to Chevron Corporation
|
$ | 18,879 | $ | 10,086 | $ | 22,022 | |||||||
FS-28
Table of Contents
Millions of dollars, except per-share amounts
| At December 31 | |||||||||
| 2010 | 2009 | ||||||||
|
Assets
|
|||||||||
|
Cash and cash equivalents
|
$ | 14,060 | $ | 8,716 | |||||
|
Time deposits
|
2,855 | – | |||||||
|
Marketable securities
|
155 | 106 | |||||||
|
Accounts and notes receivable (less allowance: 2010 – $184; 2009 – $228)
|
20,759 | 17,703 | |||||||
|
Inventories:
|
|||||||||
|
Crude oil and petroleum products
|
3,589 | 3,680 | |||||||
|
Chemicals
|
395 | 383 | |||||||
|
Materials, supplies and other
|
1,509 | 1,466 | |||||||
|
Total inventories
|
5,493 | 5,529 | |||||||
|
Prepaid expenses and other current assets
|
5,519 | 5,162 | |||||||
|
Total Current Assets
|
48,841 | 37,216 | |||||||
|
Long-term receivables, net
|
2,077 | 2,282 | |||||||
|
Investments and advances
|
21,520 | 21,158 | |||||||
|
Properties, plant and equipment, at cost
|
207,367 | 188,288 | |||||||
|
Less: Accumulated depreciation, depletion and amortization
|
102,863 | 91,820 | |||||||
|
Properties, plant and equipment, net
|
104,504 | 96,468 | |||||||
|
Deferred charges and other assets
|
3,210 | 2,879 | |||||||
|
Goodwill
|
4,617 | 4,618 | |||||||
|
Total Assets
|
$ | 184,769 | $ | 164,621 | |||||
|
Liabilities and Equity
|
|||||||||
|
Short-term debt
|
$ | 187 | $ | 384 | |||||
|
Accounts payable
|
19,259 | 16,437 | |||||||
|
Accrued liabilities
|
5,324 | 5,375 | |||||||
|
Federal and other taxes on income
|
2,776 | 2,624 | |||||||
|
Other taxes payable
|
1,466 | 1,391 | |||||||
|
Total Current Liabilities
|
29,012 | 26,211 | |||||||
|
Long-term debt
|
11,003 | 9,829 | |||||||
|
Capital lease obligations
|
286 | 301 | |||||||
|
Deferred credits and other noncurrent obligations
|
19,264 | 17,390 | |||||||
|
Noncurrent deferred income taxes
|
12,697 | 11,521 | |||||||
|
Reserves for employee benefit plans
|
6,696 | 6,808 | |||||||
|
Total Liabilities
|
78,958 | 72,060 | |||||||
|
Preferred stock (authorized 100,000,000 shares, $1.00 par value; none issued)
|
– | – | |||||||
|
Common stock (authorized 6,000,000,000 shares; $0.75 par value; 2,442,676,580 shares
issued at December 31, 2010 and 2009) |
1,832 | 1,832 | |||||||
|
Capital in excess of par value
|
14,796 | 14,631 | |||||||
|
Retained earnings
|
119,641 | 106,289 | |||||||
|
Accumulated other comprehensive loss
|
(4,466 | ) | (4,321 | ) | |||||
|
Deferred compensation and benefit plan trust
|
(311 | ) | (349 | ) | |||||
|
Treasury stock, at cost (2010 – 435,195,799 shares; 2009 – 434,954,774 shares)
|
(26,411 | ) | (26,168 | ) | |||||
|
Total Chevron Corporation Stockholders’ Equity
|
105,081 | 91,914 | |||||||
|
Noncontrolling interests
|
730 | 647 | |||||||
|
Total Equity
|
105,811 | 92,561 | |||||||
|
Total Liabilities and Equity
|
$ | 184,769 | $ | 164,621 | |||||
FS-29
Table of Contents
Millions of dollars
| Year ended December 31 | |||||||||||||
| 2010 | 2009 | 2008 | |||||||||||
|
Operating Activities
|
|||||||||||||
|
Net Income
|
$ | 19,136 | $ | 10,563 | $ | 24,031 | |||||||
|
Adjustments
|
|||||||||||||
|
Depreciation, depletion and amortization
|
13,063 | 12,110 | 9,528 | ||||||||||
|
Dry hole expense
|
496 | 552 | 375 | ||||||||||
|
Distributions less than income from equity affiliates
|
(501 | ) | (103 | ) | (440 | ) | |||||||
|
Net before-tax gains on asset retirements and sales
|
(1,004 | ) | (1,255 | ) | (1,358 | ) | |||||||
|
Net foreign currency effects
|
251 | 466 | (355 | ) | |||||||||
|
Deferred income tax provision
|
559 | 467 | 598 | ||||||||||
|
Net decrease (increase) in operating working capital
|
76 | (2,301 | ) | (1,673 | ) | ||||||||
|
Increase in long-term receivables
|
(12 | ) | (258 | ) | (161 | ) | |||||||
|
Decrease (increase) in other deferred charges
|
48 | 201 | (84 | ) | |||||||||
|
Cash contributions to employee pension plans
|
(1,450 | ) | (1,739 | ) | (839 | ) | |||||||
|
Other
|
697 | 670 | 10 | ||||||||||
|
Net Cash Provided by Operating Activities
|
31,359 | 19,373 | 29,632 | ||||||||||
|
Investing Activities
|
|||||||||||||
|
Capital expenditures
|
(19,612 | ) | (19,843 | ) | (19,666 | ) | |||||||
|
Proceeds and deposits related to asset sales
|
1,995 | 2,564 | 1,491 | ||||||||||
|
Net purchases of time deposits
|
(2,855 | ) | – | – | |||||||||
|
Net (purchases) sales of marketable securities
|
(49 | ) | 127 | 483 | |||||||||
|
Repayment of loans by equity affiliates
|
338 | 336 | 179 | ||||||||||
|
Net (purchases) sales of other short-term investments
|
(732 | ) | 244 | 432 | |||||||||
|
Net Cash Used for Investing Activities
|
(20,915 | ) | (16,572 | ) | (17,081 | ) | |||||||
|
Financing Activities
|
|||||||||||||
|
Net (payments) borrowings of short-term obligations
|
(212 | ) | (3,192 | ) | 2,647 | ||||||||
|
Proceeds from issuances of long-term debt
|
1,250 | 5,347 | – | ||||||||||
|
Repayments of long-term debt and other financing
obligations
|
(156 | ) | (496 | ) | (965 | ) | |||||||
|
Cash dividends – common stock
|
(5,674 | ) | (5,302 | ) | (5,162 | ) | |||||||
|
Distributions to noncontrolling interests
|
(72 | ) | (71 | ) | (99 | ) | |||||||
|
Net (purchases) sales of treasury shares
|
(306 | ) | 168 | (6,821 | ) | ||||||||
|
Net Cash Used for Financing Activities
|
(5,170 | ) | (3,546 | ) | (10,400 | ) | |||||||
|
Effect of Exchange Rate Changes
on Cash and Cash Equivalents |
70 | 114 | (166 | ) | |||||||||
|
Net Change in Cash and Cash Equivalents
|
5,344 | (631 | ) | 1,985 | |||||||||
|
Cash and Cash Equivalents at January 1
|
8,716 | 9,347 | 7,362 | ||||||||||
|
Cash and Cash Equivalents at December 31
|
$ | 14,060 | $ | 8,716 | $ | 9,347 | |||||||
FS-30
Table of Contents
| 2010 | 2009 | 2008 | |||||||||||||||||||||||
| Shares | Amount | Shares | Amount | Shares | Amount | ||||||||||||||||||||
|
Preferred Stock
|
– | $ | – | – | $ | – | – | $ | – | ||||||||||||||||
|
Common Stock
|
2,442,677 | $ | 1,832 | 2,442,677 | $ | 1,832 | 2,442,677 | $ | 1,832 | ||||||||||||||||
|
Capital in Excess of Par
|
|||||||||||||||||||||||||
|
Balance at January 1
|
$ | 14,631 | $ | 14,448 | $ | 14,289 | |||||||||||||||||||
|
Treasury stock transactions
|
165 | 183 | 159 | ||||||||||||||||||||||
|
Balance at December 31
|
$ | 14,796 | $ | 14,631 | $ | 14,448 | |||||||||||||||||||
|
Retained Earnings
|
|||||||||||||||||||||||||
|
Balance at January 1
|
$ | 106,289 | $ | 101,102 | $ | 82,329 | |||||||||||||||||||
|
Net income attributable to Chevron Corporation
|
19,024 | 10,483 | 23,931 | ||||||||||||||||||||||
|
Cash dividends on common stock
|
(5,674 | ) | (5,302 | ) | (5,162 | ) | |||||||||||||||||||
|
Tax benefit from dividends paid on
unallocated ESOP shares and other |
2 | 6 | 4 | ||||||||||||||||||||||
|
Balance at December 31
|
$ | 119,641 | $ | 106,289 | $ | 101,102 | |||||||||||||||||||
|
Accumulated Other Comprehensive Loss
|
|||||||||||||||||||||||||
|
Currency translation adjustment
|
|||||||||||||||||||||||||
|
Balance at January 1
|
$ | (111 | ) | $ | (171 | ) | $ | (59 | ) | ||||||||||||||||
|
Change during year
|
6 | 60 | (112 | ) | |||||||||||||||||||||
|
Balance at December 31
|
$ | (105 | ) | $ | (111 | ) | $ | (171 | ) | ||||||||||||||||
|
Pension and other postretirement benefit plans
|
|||||||||||||||||||||||||
|
Balance at January 1
|
$ | (4,308 | ) | $ | (3,909 | ) | $ | (2,008 | ) | ||||||||||||||||
|
Change to defined benefit plans during year
|
$ | (167 | ) | (399 | ) | (1,901 | ) | ||||||||||||||||||
|
Balance at December 31
|
$ | (4,475 | ) | $ | (4,308 | ) | $ | (3,909 | ) | ||||||||||||||||
|
Unrealized net holding gain on securities
|
|||||||||||||||||||||||||
|
Balance at January 1
|
$ | 15 | $ | 13 | $ | 19 | |||||||||||||||||||
|
Change during year
|
(4 | ) | 2 | (6 | ) | ||||||||||||||||||||
|
Balance at December 31
|
$ | 11 | $ | 15 | $ | 13 | |||||||||||||||||||
|
Net derivatives gain (loss) on hedge transactions
|
|||||||||||||||||||||||||
|
Balance at January 1
|
$ | 83 | $ | 143 | $ | 33 | |||||||||||||||||||
|
Change during year
|
20 | (60 | ) | 110 | |||||||||||||||||||||
|
Balance at December 31
|
$ | 103 | $ | 83 | $ | 143 | |||||||||||||||||||
|
Balance at December 31
|
$ | (4,466 | ) | $ | (4,321 | ) | $ | (3,924 | ) | ||||||||||||||||
|
Deferred Compensation and Benefit Plan Trust
|
|||||||||||||||||||||||||
|
Deferred Compensation
|
|||||||||||||||||||||||||
|
Balance at January 1
|
$ | (109 | ) | $ | (194 | ) | $ | (214 | ) | ||||||||||||||||
|
Net reduction of ESOP debt and other
|
38 | 85 | 20 | ||||||||||||||||||||||
|
Balance at December 31
|
(71 | ) | (109 | ) | (194 | ) | |||||||||||||||||||
|
Benefit Plan Trust (Common Stock)
|
14,168 | (240 | ) | 14,168 | (240 | ) | 14,168 | (240 | ) | ||||||||||||||||
|
Balance at December 31
|
14,168 | $ | (311 | ) | 14,168 | $ | (349 | ) | 14,168 | $ | (434 | ) | |||||||||||||
|
Treasury Stock at Cost
|
|||||||||||||||||||||||||
|
Balance at January 1
|
434,955 | $ | (26,168 | ) | 438,445 | $ | (26,376 | ) | 352,243 | $ | (18,892 | ) | |||||||||||||
|
Purchases
|
9,091 | (775 | ) | 85 | (6 | ) | 95,631 | (8,011 | ) | ||||||||||||||||
|
Issuances – mainly employee benefit plans
|
(8,850 | ) | 532 | (3,575 | ) | 214 | (9,429 | ) | 527 | ||||||||||||||||
|
Balance at December 31
|
435,196 | $ | (26,411 | ) | 434,955 | $ | (26,168 | ) | 438,445 | $ | (26,376 | ) | |||||||||||||
|
Total Chevron Corporation Stockholders’ Equity
at December 31 |
$ | 105,081 | $ | 91,914 | $ | 86,648 | |||||||||||||||||||
|
Noncontrolling Interests
|
$ | 730 | $ | 647 | $ | 469 | |||||||||||||||||||
|
Total Equity
|
$ | 105,811 | $ | 92,561 | $ | 87,117 | |||||||||||||||||||
FS-31
Table of Contents
Millions of dollars, except per-share amounts
FS-32
Table of Contents
FS-33
Table of Contents
Millions of dollars, except per-share amounts
| 2010 | 2009 | 2008 | |||||||||||
|
Balance at January 1
|
$ | 647 | $ | 469 | $ | 204 | |||||||
|
Net income
|
112 | 80 | 100 | ||||||||||
|
Distributions to noncontrolling
interests
|
(72 | ) | (71 | ) | (99 | ) | |||||||
|
Other changes, net
|
43 | 169 | 264 | ||||||||||
|
Balance at December 31
|
$ | 730 | $ | 647 | $ | 469 | |||||||
FS-34
Table of Contents
| Year ended December 31 | |||||||||||||
| 2010 | 2009 | 2008 | |||||||||||
|
Net decrease (increase) in operating
working
capital was composed of the following: |
|||||||||||||
|
(Increase) decrease in accounts and
notes receivable |
$ | (2,767 | ) | $ | (1,476 | ) | $ | 6,030 | |||||
|
Decrease (increase) in inventories
|
15 | 1,213 | (1,545 | ) | |||||||||
|
Increase in prepaid expenses and
other current assets |
(542 | ) | (264 | ) | (621 | ) | |||||||
|
Increase (decrease) in accounts
payable and accrued liabilities |
3,049 | (1,121 | ) | (4,628 | ) | ||||||||
|
Increase (decrease) in income and
other taxes payable |
321 | (653 | ) | (909 | ) | ||||||||
|
Net decrease (increase) in operating
working capital |
$ | 76 | $ | (2,301 | ) | $ | (1,673 | ) | |||||
|
Net cash provided by operating
activities includes the following cash payments for interest and income taxes: |
|||||||||||||
|
Interest paid on debt
(net of capitalized interest) |
$ | 34 | $ | – | $ | – | |||||||
|
Income taxes
|
$ | 11,749 | $ | 7,537 | $ | 19,130 | |||||||
|
Net sales of marketable securities
consisted of the following gross amounts: |
|||||||||||||
|
Marketable securities sold
|
$ | 41 | $ | 157 | $ | 3,719 | |||||||
|
Marketable securities purchased
|
(90 | ) | (30 | ) | (3,236 | ) | |||||||
|
Net (purchases) sales of marketable
securities |
$ | (49 | ) | $ | 127 | $ | 483 | ||||||
|
Net purchases of time deposits
consisted of the following gross amounts: |
|||||||||||||
|
Time deposits purchased
|
$ | (5,060 | ) | $ | – | $ | – | ||||||
|
Time deposits matured
|
2,205 | – | – | ||||||||||
|
Net purchases of time deposits
|
$ | (2,855 | ) | $ | – | $ | – | ||||||
| Year ended December 31 | |||||||||||||
| 2010 | 2009 | 2008 | |||||||||||
|
Additions to properties, plant
and equipment 1 |
$ | 18,474 | $ | 16,107 | $ | 18,495 | |||||||
|
Additions to investments
|
861 | 942 | 1,051 | ||||||||||
|
Current year dry hole expenditures
|
414 | 468 | 320 | ||||||||||
|
Payments for other liabilities
and assets, net 2 |
(137 | ) | 2,326 | (200 | ) | ||||||||
|
Capital expenditures
|
19,612 | 19,843 | 19,666 | ||||||||||
|
Expensed exploration expenditures
|
651 | 790 | 794 | ||||||||||
|
Assets acquired through capital
lease obligations and other financing obligations |
104 | 19 | 9 | ||||||||||
|
Capital and exploratory
expenditures,
excluding equity affiliates |
20,367 | 20,652 | 20,469 | ||||||||||
|
Company’s share of expenditures
by equity affiliates |
1,388 | 1,585 | 2,306 | ||||||||||
|
Capital and exploratory
expenditures,
including equity affiliates |
$ | 21,755 | $ | 22,237 | $ | 22,775 | |||||||
| 1 Excludes noncash additions of $2,753 in 2010, $985 in 2009 and $5,153 in 2008. | ||
| 2 2009 includes payments of $2,450 for accruals recorded in 2008. | ||
FS-35
Table of Contents
Millions of dollars, except per-share amounts
| Year ended December 31 | |||||||||||||
| 2010 | 2009 | 2008 | |||||||||||
|
Sales and other operating
revenues |
$ | 145,381 | $ | 121,553 | $ | 195,593 | |||||||
|
Total costs and other deductions
|
139,984 | 120,053 | 185,788 | ||||||||||
|
Net income attributable to CUSA
|
4,159 | 1,141 | 7,318 | ||||||||||
| At December 31 | |||||||||
| 2010 | 2009 | ||||||||
|
Current assets
|
$ | 29,211 | $ | 23,286 | |||||
|
Other assets
|
35,294 | 32,827 | |||||||
|
Current liabilities
|
18,098 | 16,098 | |||||||
|
Other liabilities
|
16,785 | 14,625 | |||||||
|
Total CUSA net equity
|
29,622 | 25,390 | |||||||
|
Memo: Total debt
|
$ 8,284 | $ 6,999 | |||||||
| Year ended December 31 | |||||||||||||
| 2010 | 2009 | 2008 | |||||||||||
|
Sales and other operating revenues
|
$ | 885 | $ | 683 | $ | 1,022 | |||||||
|
Total costs and other deductions
|
1,008 | 810 | 947 | ||||||||||
|
Net (loss) income attributable to CTC
|
(116 | ) | (124 | ) | 120 | ||||||||
| At December 31 | |||||||||
| 2010 | 2009 | ||||||||
|
Current assets
|
$ | 209 | $ | 377 | |||||
|
Other assets
|
201 | 173 | |||||||
|
Current liabilities
|
101 | 115 | |||||||
|
Other liabilities
|
75 | 90 | |||||||
|
Total CTC net equity
|
234 | 345 | |||||||
| Year ended December 31 | |||||||||||||
| 2010 | 2009 | 2008 | |||||||||||
|
Sales and other operating revenues
|
$ | 17,812 | $ | 12,013 | $ | 14,329 | |||||||
|
Costs and other deductions
|
8,394 | 6,044 | 5,621 | ||||||||||
|
Net income attributable to TCO
|
6,593 | 4,178 | 6,134 | ||||||||||
| At December 31 | |||||||||
| 2010 | 2009 | ||||||||
|
Current assets
|
$ | 3,376 | $ | 3,190 | |||||
|
Other assets
|
11,813 | 12,022 | |||||||
|
Current liabilities
|
2,402 | 2,426 | |||||||
|
Other liabilities
|
4,130 | 4,484 | |||||||
|
Total TCO net equity
|
8,657 | 8,302 | |||||||
FS-36
Table of Contents
| At December 31 | |||||||||
| 2010 | 2009 | ||||||||
|
Upstream
|
$ | 561 | $ | 510 | |||||
|
Downstream
|
316 | 334 | |||||||
|
All Other
|
169 | 169 | |||||||
|
Total
|
1,046 | 1,013 | |||||||
|
Less: Accumulated amortization
|
573 | 585 | |||||||
|
Net capitalized leased assets
|
$ | 473 | $ | 428 | |||||
| Year ended December 31 | |||||||||||||
| 2010 | 2009 | 2008 | |||||||||||
|
Minimum rentals
|
$ | 2,373 | $ | 2,179 | $ | 2,984 | |||||||
|
Contingent rentals
|
10 | 7 | 6 | ||||||||||
|
Total
|
2,383 | 2,186 | 2,990 | ||||||||||
|
Less: Sublease rental income
|
41 | 41 | 41 | ||||||||||
|
Net rental expense
|
$ | 2,342 | $ | 2,145 | $ | 2,949 | |||||||
| At December 31 | |||||||||
| Operating | Capital | ||||||||
| Leases | Leases | ||||||||
|
Year: 2011
|
650 | 99 | |||||||
|
2012
|
530 | 93 | |||||||
|
2013
|
370 | 68 | |||||||
|
2014
|
288 | 51 | |||||||
|
2015
|
273 | 40 | |||||||
|
Thereafter
|
725 | 137 | |||||||
|
Total
|
$ | 2,836 | $ | 488 | |||||
|
Less: Amounts representing interest
and executory costs |
(105 | ) | |||||||
|
Net present values
|
383 | ||||||||
|
Less: Capital lease obligations
included in short-term debt |
(97 | ) | |||||||
|
Long-term capital lease obligations
|
$ | 286 | |||||||
FS-37
Table of Contents
Millions of dollars, except per-share amounts
| Prices in Active | Prices in Active | |||||||||||||||||||||||||||||||||
| Markets for | Other | Markets for | Other | |||||||||||||||||||||||||||||||
| Identical | Observable | Unobservable | Identical | Observable | Unobservable | |||||||||||||||||||||||||||||
| At December 31 | Assets/Liabilities | Inputs | Inputs | At December 31 | Assets/Liabilities | Inputs | Inputs | |||||||||||||||||||||||||||
| 2010 | (Level 1) | (Level 2) | (Level 3) | 2009 | (Level 1) | (Level 2) | (Level 3) | |||||||||||||||||||||||||||
|
Marketable securities
|
$ | 155 | $ | 155 | $ | – | $ | – | $ | 106 | $ | 106 | $ | – | $ | – | ||||||||||||||||||
|
Derivatives
|
122 | 11 | 111 | – | 127 | 14 | 113 | – | ||||||||||||||||||||||||||
|
Total Recurring Assets
|
||||||||||||||||||||||||||||||||||
|
at Fair Value
|
$ | 277 | $ | 166 | $ | 111 | $ | – | $ | 233 | $ | 120 | $ | 113 | $ | – | ||||||||||||||||||
|
Derivatives
|
$ | 171 | $ | 75 | $ | 96 | $ | – | $ | 101 | $ | 20 | $ | 81 | $ | – | ||||||||||||||||||
|
Total Recurring Liabilities
|
||||||||||||||||||||||||||||||||||
|
at Fair Value
|
$ | 171 | $ | 75 | $ | 96 | $ | – | $ | 101 | $ | 20 | $ | 81 | $ | – | ||||||||||||||||||
FS-38
Table of Contents
| Prices in Active | Other | Loss (Before Tax) | Prices in Active | Other | Loss (Before Tax) | ||||||||||||||||||||||||||||||||||||
| Year ended | Markets for | Observable | Unobservable | Year ended | Year ended | Markets for | Observable | Unobservable | Year ended | ||||||||||||||||||||||||||||||||
| December 31 | Identical Assets | Inputs | Inputs | December 31 | December 31 | Identical Assets | Inputs | Inputs | December 31 | ||||||||||||||||||||||||||||||||
| 2010 | (Level 1) | (Level 2) | (Level 3) | 2010 | 2009 | (Level 1) | (Level 2) | (Level 3) | 2009 | ||||||||||||||||||||||||||||||||
|
Properties, plant and
equipment, net
(held and used)
|
$ | 57 | $ | – | $ | – | $ | 57 | $ | 85 | $ | 490 | $ | – | $ | – | $ | 490 | $ | 459 | |||||||||||||||||||||
|
Properties, plant and
equipment, net
(held for sale)
|
13 | – | – | 13 | 36 | 68 | – | 68 | – | 92 | |||||||||||||||||||||||||||||||
|
Investments and advances
|
– | – | – | – | 15 | 39 | – | – | 39 | 42 | |||||||||||||||||||||||||||||||
|
Total Nonrecurring
Assets
at Fair Value |
$ | 70 | $ | – | $ | – | $ | 70 | $ | 136 | $ | 597 | $ | – | $ | 68 | $ | 529 | $ | 593 | |||||||||||||||||||||
FS-39
Table of Contents
Millions of dollars, except per-share amounts
| Asset Derivatives – Fair Value | Liability Derivatives – Fair Value | |||||||||||||||||||||||
| Type of | Balance Sheet | At December 31 | At December 31 | Balance Sheet | At December 31 | At December 31 | ||||||||||||||||||
| Derivative Contract | Classification | 2010 | 2009 | Classification | 2010 | 2009 | ||||||||||||||||||
|
Commodity
|
Accounts and notes
receivable, net |
$ | 58 | $ | 99 |
Accrued payable
|
$ | 131 | $ | 73 | ||||||||||||||
|
Commodity
|
Long-term
receivable, net |
64 | 28 |
Deferred credits and other
noncurrent obligations |
40 | 28 | ||||||||||||||||||
|
|
$ | 122 | $ | 127 | $ | 171 | $ | 101 | ||||||||||||||||
The Effect of Derivatives Not Designated as Hedging Instruments
| Gain/(Loss) | ||||||||||||||||
| Type of Derivative | Statement of | Year ended December 31 | ||||||||||||||
| Contract | Income Classification | 2010 | 2009 | 2008 | ||||||||||||
|
Foreign Exchange
|
Other income | $ | – | $ | 26 | $ | (314 | ) | ||||||||
|
Commodity
|
Sales and other | |||||||||||||||
|
|
operating revenues | (98 | ) | (94 | ) | 706 | ||||||||||
|
Commodity
|
Purchased crude oil | |||||||||||||||
|
|
and products | (36 | ) | (353 | ) | 424 | ||||||||||
|
Commodity
|
Other income | (1 | ) | – | (3 | ) | ||||||||||
|
|
$ | (135 | ) | $ | (421 | ) | $ | 813 | ||||||||
FS-40
Table of Contents
| Year ended December 31 | |||||||||||||
| 2010 | 2009 | 2008 | |||||||||||
|
Segment Earnings
|
|||||||||||||
|
Upstream
|
|||||||||||||
|
United States
|
$ | 4,122 | $ | 2,262 | $ | 7,147 | |||||||
|
International
|
13,555 | 8,670 | 15,022 | ||||||||||
|
Total Upstream
|
17,677 | 10,932 | 22,169 | ||||||||||
|
Downstream
|
|||||||||||||
|
United States
|
1,339 | (121 | ) | 1,369 | |||||||||
|
International
|
1,139 | 594 | 1,783 | ||||||||||
|
Total Downstream
|
2,478 | 473 | 3,152 | ||||||||||
|
Total Segment Earnings
|
20,155 | 11,405 | 25,321 | ||||||||||
|
All Other
|
|||||||||||||
|
Interest expense
|
(41 | ) | (22 | ) | – | ||||||||
|
Interest income
|
70 | 46 | 192 | ||||||||||
|
Other
|
(1,160 | ) | (946 | ) | (1,582 | ) | |||||||
|
Net Income Attributable
|
|||||||||||||
|
to Chevron Corporation
|
$ | 19,024 | $ | 10,483 | $ | 23,931 | |||||||
FS-41
Table of Contents
Millions of dollars, except per-share amounts
| At December 31 | |||||||||
| 2010 | 2009 | ||||||||
|
Upstream
|
|||||||||
|
United States
|
$ | 26,319 | $ | 25,478 | |||||
|
International
|
89,306 | 81,209 | |||||||
|
Goodwill
|
4,617 | 4,618 | |||||||
|
Total Upstream
|
120,242 | 111,305 | |||||||
|
Downstream
|
|||||||||
|
United States
|
21,406 | 20,317 | |||||||
|
International
|
20,559 | 19,618 | |||||||
|
Total Downstream
|
41,965 | 39,935 | |||||||
|
Total Segment Assets
|
162,207 | 151,240 | |||||||
|
All Other*
|
|||||||||
|
United States
|
11,125 | 7,125 | |||||||
|
International
|
11,437 | 6,256 | |||||||
|
Total All Other
|
22,562 | 13,381 | |||||||
|
Total
Assets – United States
|
58,850 | 52,920 | |||||||
|
Total
Assets – International
|
121,302 | 107,083 | |||||||
|
Goodwill
|
4,617 | 4,618 | |||||||
|
Total Assets
|
$ | 184,769 | $ | 164,621 | |||||
| *“All Other” assets consist primarily of worldwide cash, cash equivalents, time deposits and marketable securities, real estate, energy services, information systems, mining operations, power generation businesses, alternative fuels and technology companies, and assets of the corporate administrative functions. | ||
| Year ended December 31 | |||||||||||||
| 2010 | 2009 | 2008 | |||||||||||
|
Upstream
|
|||||||||||||
|
United States
|
$ | 10,316 | $ | 9,225 | $ | 23,566 | |||||||
|
Intersegment
|
13,839 | 10,297 | 15,162 | ||||||||||
|
Total United States
|
24,155 | 19,522 | 38,728 | ||||||||||
|
International
|
17,300 | 13,463 | 19,531 | ||||||||||
|
Intersegment
|
23,834 | 18,477 | 24,205 | ||||||||||
|
Total International
|
41,134 | 31,940 | 43,736 | ||||||||||
|
Total Upstream
|
65,289 | 51,462 | 82,464 | ||||||||||
|
Downstream
|
|||||||||||||
|
United States
|
70,436 | 58,056 | 87,759 | ||||||||||
|
Excise and similar taxes
|
4,484 | 4,573 | 4,748 | ||||||||||
|
Intersegment
|
115 | 98 | 242 | ||||||||||
|
Total United States
|
75,035 | 62,727 | 92,749 | ||||||||||
|
International
|
90,922 | 77,845 | 123,389 | ||||||||||
|
Excise and similar taxes
|
4,107 | 3,536 | 5,098 | ||||||||||
|
Intersegment
|
93 | 87 | 80 | ||||||||||
|
Total International
|
95,122 | 81,468 | 128,567 | ||||||||||
|
Total Downstream
|
170,157 | 144,195 | 221,316 | ||||||||||
|
All Other
|
|||||||||||||
|
United States
|
610 | 665 | 815 | ||||||||||
|
Intersegment
|
947 | 964 | 917 | ||||||||||
|
Total United States
|
1,557 | 1,629 | 1,732 | ||||||||||
|
International
|
23 | 39 | 52 | ||||||||||
|
Intersegment
|
39 | 33 | 33 | ||||||||||
|
Total International
|
62 | 72 | 85 | ||||||||||
|
Total All Other
|
1,619 | 1,701 | 1,817 | ||||||||||
|
Segment Sales and Other
|
|||||||||||||
|
Operating Revenues
|
|||||||||||||
|
United States
|
100,747 | 83,878 | 133,209 | ||||||||||
|
International
|
136,318 | 113,480 | 172,388 | ||||||||||
|
Total Segment Sales and Other
|
|||||||||||||
|
Operating Revenues
|
237,065 | 197,358 | 305,597 | ||||||||||
|
Elimination of intersegment sales
|
(38,867 | ) | (29,956 | ) | (40,639 | ) | |||||||
|
Total Sales and Other
|
|||||||||||||
|
Operating Revenues
|
$ | 198,198 | $ | 167,402 | $ | 264,958 | |||||||
| Segment Income Taxes Segment income tax expense for the years 2010, 2009 and 2008 is as follows: | |||||||||||||
| Year ended December 31 | |||||||||||||
| 2010 | 2009 | 2008 | |||||||||||
|
Upstream
|
|||||||||||||
|
United States
|
$ | 2,285 | $ | 1,251 | $ | 3,705 | |||||||
|
International
|
10,480 | 7,451 | 15,122 | ||||||||||
|
Total Upstream
|
12,765 | 8,702 | 18,827 | ||||||||||
|
Downstream
|
|||||||||||||
|
United States
|
680 | (83 | ) | 780 | |||||||||
|
International
|
462 | 463 | 871 | ||||||||||
|
Total Downstream
|
1,142 | 380 | 1,651 | ||||||||||
|
All Other
|
(988 | ) | (1,117 | ) | (1,452 | ) | |||||||
|
Total Income Tax Expense
|
$ | 12,919 | $ | 7,965 | $ | 19,026 | |||||||
FS-42
Table of Contents
| Investments and Advances | Equity in Earnings | ||||||||||||||||||||
| At December 31 | Year ended December 31 | ||||||||||||||||||||
| 2010 | 2009 | 2010 | 2009 | 2008 | |||||||||||||||||
|
Upstream
|
|||||||||||||||||||||
|
Tengizchevroil
|
$ | 5,789 | $ | 5,938 | $ | 3,398 | $ | 2,216 | $ | 3,220 | |||||||||||
|
Petropiar/Hamaca
|
973 | 1,139 | 262 | 122 | 317 | ||||||||||||||||
|
Caspian Pipeline Consortium
|
974 | 852 | 124 | 105 | 103 | ||||||||||||||||
|
Petroboscan
|
937 | 832 | 222 | 171 | 244 | ||||||||||||||||
|
Angola LNG Limited
|
2,481 | 1,853 | (21 | ) | (12 | ) | (8 | ) | |||||||||||||
|
Other
|
1,922 | 1,947 | 319 | 287 | 424 | ||||||||||||||||
|
Total Upstream
|
13,076 | 12,561 | 4,304 | 2,889 | 4,300 | ||||||||||||||||
|
Downstream
|
|||||||||||||||||||||
|
GS Caltex Corporation
|
2,496 | 2,406 | 158 | (191 | ) | 444 | |||||||||||||||
|
Chevron Phillips Chemical
|
|||||||||||||||||||||
|
Company LLC
|
2,419 | 2,327 | 704 | 328 | 158 | ||||||||||||||||
|
Star Petroleum Refining
|
|||||||||||||||||||||
|
Company Ltd.
|
947 | 873 | 122 | (4 | ) | 22 | |||||||||||||||
|
Caltex Australia Ltd.
|
767 | 740 | 101 | 11 | 250 | ||||||||||||||||
|
Colonial Pipeline Company
|
– | 514 | 43 | 51 | 32 | ||||||||||||||||
|
Other
|
602 | 540 | 151 | 149 | 140 | ||||||||||||||||
|
Total Downstream
|
7,231 | 7,400 | 1,279 | 344 | 1,046 | ||||||||||||||||
|
All Other
|
|||||||||||||||||||||
|
Other
|
509 | 507 | 54 | 83 | 20 | ||||||||||||||||
|
Total equity method
|
$ | 20,816 | $ | 20,468 | $ | 5,637 | $ | 3,316 | $ | 5,366 | |||||||||||
|
Other at or below cost
|
704 | 690 | |||||||||||||||||||
|
Total investments and
|
|||||||||||||||||||||
|
advances
|
$ | 21,520 | $ | 21,158 | |||||||||||||||||
|
Total United States
|
$ | 3,769 | $ | 4,195 | $ | 846 | $ | 511 | $ | 307 | |||||||||||
|
Total International
|
$ | 17,751 | $ | 16,963 | $ | 4,791 | $ | 2,805 | $ | 5,059 | |||||||||||
FS-43
Table of Contents
Millions of dollars, except per-share amounts
| Affiliates | Chevron Share | ||||||||||||||||||||||||
| Year ended December 31 | 2010 | 2009 | 2008 | 2010 | 2009 | 2008 | |||||||||||||||||||
|
Total revenues
|
$ | 107,505 | $ | 81,995 | $ | 112,707 | $ | 52,088 | $ | 39,280 | $ | 54,055 | |||||||||||||
|
Income before income tax expense
|
18,468 | 11,083 | 17,500 | 7,966 | 4,511 | 7,532 | |||||||||||||||||||
|
Net income attributable to affiliates
|
12,831 | 8,261 | 12,705 | 5,683 | 3,285 | 5,524 | |||||||||||||||||||
|
At December 31
|
|||||||||||||||||||||||||
|
Current assets
|
$ | 30,335 | $ | 27,111 | $ | 25,194 | $ | 12,845 | $ | 11,009 | $ | 10,804 | |||||||||||||
|
Noncurrent assets
|
57,491 | 55,363 | 51,878 | 21,401 | 21,361 | 20,129 | |||||||||||||||||||
|
Current liabilities
|
20,428 | 17,450 | 17,727 | 9,363 | 7,833 | 7,474 | |||||||||||||||||||
|
Noncurrent liabilities
|
19,749 | 21,531 | 21,049 | 4,459 | 5,106 | 4,533 | |||||||||||||||||||
|
Total affiliates’ net equity
|
$ | 47,649 | $ | 43,493 | $ | 38,296 | $ | 20,424 | $ | 19,431 | $ | 18,926 | |||||||||||||
FS-44
Table of Contents
| At December 31 | Year ended December 31 | ||||||||||||||||||||||||||||||||||||||||||||||||||
| Gross Investment at Cost | Net Investment | Additions at Cost 2 | Depreciation Expense 3 | ||||||||||||||||||||||||||||||||||||||||||||||||
| 2010 | 2009 | 2008 | 2010 | 2009 | 2008 | 2010 | 2009 | 2008 | 2010 | 2009 | 2008 | ||||||||||||||||||||||||||||||||||||||||
|
Upstream
|
|||||||||||||||||||||||||||||||||||||||||||||||||||
|
United States
|
$ | 62,523 | $ | 58,328 | $ | 54,878 | $ | 23,277 | $ | 22,273 | $ | 22,701 | $ | 4,934 | $ | 3,518 | $ | 5,395 | $ | 4,078 | $ | 3,992 | $ | 2,704 | |||||||||||||||||||||||||||
|
International
|
110,578 | 96,557 | 86,676 | 64,388 | 57,450 | 53,371 | 14,381 | 10,803 | 14,997 | 7,448 | 6,669 | 5,461 | |||||||||||||||||||||||||||||||||||||||
|
Total Upstream
|
173,101 | 154,885 | 141,554 | 87,665 | 79,723 | 76,072 | 19,315 | 14,321 | 20,392 | 11,526 | 10,661 | 8,165 | |||||||||||||||||||||||||||||||||||||||
|
Downstream
|
|||||||||||||||||||||||||||||||||||||||||||||||||||
|
United States
|
19,820 | 18,962 | 17,397 | 10,379 | 10,032 | 8,908 | 1,199 | 1,874 | 2,061 | 741 | 666 | 627 | |||||||||||||||||||||||||||||||||||||||
|
International
|
9,697 | 9,852 | 10,021 | 3,948 | 4,154 | 4,266 | 361 | 456 | 537 | 451 | 454 | 482 | |||||||||||||||||||||||||||||||||||||||
|
Total Downstream
|
29,517 | 28,814 | 27,418 | 14,327 | 14,186 | 13,174 | 1,560 | 2,330 | 2,598 | 1,192 | 1,120 | 1,109 | |||||||||||||||||||||||||||||||||||||||
|
All Other
4
|
|||||||||||||||||||||||||||||||||||||||||||||||||||
|
United States
|
4,722 | 4,569 | 4,310 | 2,496 | 2,548 | 2,523 | 259 | 354 | 598 | 341 | 325 | 250 | |||||||||||||||||||||||||||||||||||||||
|
International
|
27 | 20 | 17 | 16 | 11 | 11 | 11 | 3 | 5 | 4 | 4 | 4 | |||||||||||||||||||||||||||||||||||||||
|
Total All Other
|
4,749 | 4,589 | 4,327 | 2,512 | 2,559 | 2,534 | 270 | 357 | 603 | 345 | 329 | 254 | |||||||||||||||||||||||||||||||||||||||
|
Total United States
|
87,065 | 81,859 | 76,585 | 36,152 | 34,853 | 34,132 | 6,392 | 5,746 | 8,054 | 5,160 | 4,983 | 3,581 | |||||||||||||||||||||||||||||||||||||||
|
Total International
|
120,302 | 106,429 | 96,714 | 68,352 | 61,615 | 57,648 | 14,753 | 11,262 | 15,539 | 7,903 | 7,127 | 5,947 | |||||||||||||||||||||||||||||||||||||||
|
Total
|
$ | 207,367 | $ | 188,288 | $ | 173,299 | $ | 104,504 | $ | 96,468 | $ | 91,780 | $ | 21,145 | $ | 17,008 | $ | 23,593 | $ | 13,063 | $ | 12,110 | $ | 9,528 | |||||||||||||||||||||||||||
| 1 | Other than the United States and Nigeria, no other country accounted for 10 percent or more of the company’s net properties, plant and equipment (PP&E) in 2010, 2009 and 2008. Nigeria had net PP&E of $13,896, $12,463 and $10,730 for 2010, 2009 and 2008, respectively. |
| 2 | Net of dry hole expense related to prior years’ expenditures of $82, $84 and $55 in 2010, 2009 and 2008, respectively. |
| 3 | Depreciation expense includes accretion expense of $513, $463 and $430 in 2010, 2009 and 2008, respectively. |
| 4 | Primarily mining operations, power generation businesses, real estate assets and management information systems. |
FS-45
Table of Contents
Millions of dollars, except per-share amounts
Chevron and Texpet filed an arbitration claim in September 2009 against the Republic of Ecuador before the Permanent Court of Arbitration in The Hague under the Rules of the United Nations Commission on International Trade Law. The claim alleges violations of the Republic of Ecuador’s obligations under the United States-Ecuador Bilateral Investment Treaty (BIT) and breaches of the settlement and release agreements between the Republic of Ecuador and Texpet (described above), which are investment agreements protected
FS-46
Table of Contents
| Year ended December 31 | |||||||||||||
| 2010 | 2009 | 2008 | |||||||||||
|
Taxes on income
|
|||||||||||||
|
U.S. Federal
|
|||||||||||||
|
Current
|
$ | 1,501 | $ | 128 | $ | 2,879 | |||||||
|
Deferred
|
162 | (147 | ) | 274 | |||||||||
|
State and local
|
|||||||||||||
|
Current
|
376 | 216 | 528 | ||||||||||
|
Deferred
|
20 | 14 | 141 | ||||||||||
|
Total United States
|
2,059 | 211 | 3,822 | ||||||||||
|
International
|
|||||||||||||
|
Current
|
10,483 | 7,154 | 15,021 | ||||||||||
|
Deferred
|
377 | 600 | 183 | ||||||||||
|
Total International
|
10,860 | 7,754 | 15,204 | ||||||||||
|
Total taxes on income
|
$ | 12,919 | $ | 7,965 | $ | 19,026 | |||||||
| Year ended December 31 | |||||||||||||
| 2010 | 2009 | 2008 | |||||||||||
|
U.S. statutory federal income tax rate
|
35.0 | % | 35.0 | % | 35.0 | % | |||||||
|
Effect of income taxes from inter-
national operations at rates different from the U.S. statutory rate |
5.2 | 10.4 | 10.1 | ||||||||||
|
State and local taxes on income, net
|
|||||||||||||
|
of U.S. federal income tax benefit
|
0.8 | 0.9 | 1.0 | ||||||||||
|
Prior year tax adjustments
|
(0.6 | ) | (0.3 | ) | (0.1 | ) | |||||||
|
Tax credits
|
(0.5 | ) | (1.1 | ) | (0.5 | ) | |||||||
|
Effects of enacted changes in tax laws
|
0.0 | 0.1 | (0.6 | ) | |||||||||
|
Other
|
0.4 | (2.0 | ) | (0.7 | ) | ||||||||
|
Effective tax rate
|
40.3 | % | 43.0 | % | 44.2 | % | |||||||
| At December 31 | |||||||||
| 2010 | 2009 | ||||||||
|
Deferred tax liabilities
|
|||||||||
|
Properties, plant and equipment
|
$ | 19,855 | $ | 18,545 | |||||
|
Investments and other
|
2,401 | 2,350 | |||||||
|
Total deferred tax liabilities
|
22,256 | 20,895 | |||||||
|
Deferred tax assets
|
|||||||||
|
Foreign tax credits
|
(6,669 | ) | (5,387 | ) | |||||
|
Abandonment/environmental reserves
|
(5,004 | ) | (4,424 | ) | |||||
|
Employee benefits
|
(3,627 | ) | (3,499 | ) | |||||
|
Deferred credits
|
(2,176 | ) | (3,469 | ) | |||||
|
Tax loss carryforwards
|
(882 | ) | (819 | ) | |||||
|
Other accrued liabilities
|
(486 | ) | (553 | ) | |||||
|
Inventory
|
(483 | ) | (431 | ) | |||||
|
Miscellaneous
|
(1,676 | ) | (1,681 | ) | |||||
|
Total deferred tax assets
|
(21,003 | ) | (20,263 | ) | |||||
|
Deferred tax assets valuation allowance
|
9,185 | 7,921 | |||||||
|
Total deferred taxes, net
|
$ | 10,438 | $ | 8,553 | |||||
FS-47
Table of Contents
Millions of dollars, except per-share amounts
| At December 31 | |||||||||
| 2010 | 2009 | ||||||||
|
Prepaid expenses and other current assets
|
$ | (1,624 | ) | $ | (1,825 | ) | |||
|
Deferred charges and other assets
|
(851 | ) | (1,268 | ) | |||||
|
Federal and other taxes on income
|
216 | 125 | |||||||
|
Noncurrent deferred income taxes
|
12,697 | 11,521 | |||||||
|
Total deferred income taxes, net
|
$ | 10,438 | $ | 8,553 | |||||
| 2010 | 2009 | 2008 | |||||||||||
|
Balance at January 1
|
$ | 3,195 | $ | 2,696 | $ | 2,199 | |||||||
|
Foreign currency effects
|
17 | (1 | ) | (1 | ) | ||||||||
|
Additions based on tax positions
taken in current year |
334 | 459 | 522 | ||||||||||
|
Reductions based on tax positions
taken in current year |
– | – | (17 | ) | |||||||||
|
Additions/reductions resulting from
current-year asset acquisitions/sales |
– | – | 175 | ||||||||||
|
Additions for tax positions taken
in prior years |
270 | 533 | 337 | ||||||||||
|
Reductions for tax positions taken
in prior years |
(165 | ) | (182 | ) | (246 | ) | |||||||
|
Settlements with taxing authorities
in current year |
(136 | ) | (300 | ) | (215 | ) | |||||||
|
Reductions as a result of a lapse
of the applicable statute of limitations |
(8 | ) | (10 | ) | (58 | ) | |||||||
|
Balance at December 31
|
$ | 3,507 | $ | 3,195 | $ | 2,696 | |||||||
FS-48
Table of Contents
| Year ended December 31 | |||||||||||||
| 2010 | 2009 | 2008 | |||||||||||
|
United States
|
|||||||||||||
|
Excise and
similar taxes on
products and merchandise |
$ | 4,484 | $ | 4,573 | $ | 4,748 | |||||||
|
Import duties and other levies
|
– | (4 | ) | 1 | |||||||||
|
Property and
other
miscellaneous taxes |
567 | 584 | 588 | ||||||||||
|
Payroll taxes
|
219 | 223 | 204 | ||||||||||
|
Taxes on production
|
271 | 135 | 431 | ||||||||||
|
Total United States
|
5,541 | 5,511 | 5,972 | ||||||||||
|
International
|
|||||||||||||
|
Excise and
similar taxes on
products and merchandise |
4,107 | 3,536 | 5,098 | ||||||||||
|
Import duties and other levies
|
6,183 | 6,550 | 8,368 | ||||||||||
|
Property and
other
miscellaneous taxes |
2,000 | 1,740 | 1,557 | ||||||||||
|
Payroll taxes
|
133 | 134 | 106 | ||||||||||
|
Taxes on production
|
227 | 120 | 202 | ||||||||||
|
Total International
|
12,650 | 12,080 | 15,331 | ||||||||||
|
Total taxes other than on income
|
$ | 18,191 | $ | 17,591 | $ | 21,303 | |||||||
| At December 31 | |||||||||
| 2010 | 2009 | ||||||||
|
Commercial paper*
|
$ | 2,471 | $ | 2,499 | |||||
|
Notes
payable to banks and others with
originating terms of one year or less |
43 | 213 | |||||||
|
Current maturities of long-term debt
|
33 | 66 | |||||||
|
Current
maturities of long-term
capital leases |
81 | 76 | |||||||
|
Redeemable
long-term obligations
Long-term debt |
2,943 | 1,702 | |||||||
|
Capital leases
|
16 | 18 | |||||||
|
Subtotal
|
5,587 | 4,574 | |||||||
|
Reclassified to long-term debt
|
(5,400 | ) | (4,190 | ) | |||||
|
Total short-term debt
|
$ | 187 | $ | 384 | |||||
| * | Weighted-average interest rates at December 31, 2010 and 2009, were 0.16 percent and 0.08 percent, respectively. |
| At December 31 | |||||||||
| 2010 | 2009 | ||||||||
|
3.95% notes due 2014
|
$ | 1,998 | $ | 1,997 | |||||
|
3.45% notes due 2012
|
1,500 | 1,500 | |||||||
|
4.95% notes due 2019
|
1,500 | 1,500 | |||||||
|
8.625% debentures due 2032
|
147 | 147 | |||||||
|
8.625% debentures due 2031
|
107 | 107 | |||||||
|
7.5% debentures due 2043
|
83 | 83 | |||||||
|
8% debentures due 2032
|
74 | 74 | |||||||
|
7.327% amortizing notes due 2014
1
|
72 | 109 | |||||||
|
9.75% debentures due 2020
|
54 | 56 | |||||||
|
8.875% debentures due 2021
|
40 | 40 | |||||||
|
8.625% debentures due 2010
|
– | 30 | |||||||
|
Medium-term notes, maturing from
|
|||||||||
|
2021 to 2038 (5.97%)
2
|
38 | 38 | |||||||
|
Fixed interest rate notes, maturing 2011 (9.378%)
2
|
19 | 19 | |||||||
|
Other foreign currency obligations
|
– | – | |||||||
|
Other
long-term debt (5.66%)
2
|
4 | 5 | |||||||
|
Total including debt due within one year
|
5,636 | 5,705 | |||||||
|
Debt due within one year
|
(33 | ) | (66 | ) | |||||
|
Reclassified from short-term debt
|
5,400 | 4,190 | |||||||
|
Total long-term debt
|
$ | 11,003 | $ | 9,829 | |||||
| 1 | Guarantee of ESOP debt. | |
| 2 | Weighted-average interest rate at December 31, 2010. |
FS-49
Table of Contents
Millions of dollars, except per-share amounts
| 2010 | 2009 | 2008 | |||||||||||
|
Beginning balance at January 1
|
$ | 2,435 | $ | 2,118 | $ | 1,660 | |||||||
|
Additions to
capitalized exploratory
well costs pending the determination of proved reserves |
482 | 663 | 643 | ||||||||||
|
Reclassifications
to wells, facilities
and equipment based on the determination of proved reserves |
(129 | ) | (174 | ) | (49 | ) | |||||||
|
Capitalized
exploratory well costs
charged to expense |
(70 | ) | (172 | ) | (136 | ) | |||||||
|
Ending balance at December 31
|
$ | 2,718 | $ | 2,435 | $ | 2,118 | |||||||
| At December 31 | |||||||||||||
| 2010 | 2009 | 2008 | |||||||||||
|
Exploratory
well costs capitalized
for a period of one year or less |
$ | 419 | $ | 564 | $ | 559 | |||||||
|
Exploratory
well costs capitalized
for a period greater than one year |
2,299 | 1,871 | 1,559 | ||||||||||
|
Balance at December 31
|
$ | 2,718 | $ | 2,435 | $ | 2,118 | |||||||
|
Number of
projects with exploratory
well costs that have been capitalized for a period greater than one year* |
53 | 46 | 50 | ||||||||||
| * | Certain projects have multiple wells or fields or both. |
FS-50
Table of Contents
| Number | ||||||||
| Aging based on drilling completion date of individual wells: | Amount | of wells | ||||||
|
1992
|
$ | 8 | 3 | |||||
|
1997–1999
|
27 | 6 | ||||||
|
2000–2004
|
442 | 54 | ||||||
|
2005–2009
|
1,822 | 113 | ||||||
|
Total
|
$ | 2,299 | 176 | |||||
| Aging based on drilling completion date of last | Number | |||||||
| suspended well in project: | Amount | of projects | ||||||
|
1992
|
$ | 8 | 1 | |||||
|
1999
|
8 | 1 | ||||||
|
2003–2005
|
340 | 9 | ||||||
|
2006–2010
|
1,943 | 42 | ||||||
|
Total
|
$ | 2,299 | 53 | |||||
FS-51
Table of Contents
Millions of dollars, except per-share amounts
Compensation - Continued
| Year ended December 31 | |||||||||||||
| 2010 | 2009 | 2008 | |||||||||||
|
Stock Options
|
|||||||||||||
|
Expected term in years
1
|
6.1 | 6.0 | 6.1 | ||||||||||
|
Volatility
2
|
30.8 | % | 30.2 | % | 22.0 | % | |||||||
|
Risk-free interest rate based on
zero coupon U.S. treasury note |
2.9 | % | 2.1 | % | 3.0 | % | |||||||
|
Dividend yield
|
3.9 | % | 3.2 | % | 2.7 | % | |||||||
|
Weighted-average fair value per
option granted |
$ | 16.28 | $ | 15.36 | $ | 15.97 | |||||||
|
|
|||||||||||||
|
Restored Options
|
|||||||||||||
|
Expected term in years
1
|
1.2 | 1.2 | 1.2 | ||||||||||
|
Volatility
2
|
38.9 | % | 45.0 | % | 23.1 | % | |||||||
|
Risk-free interest rate based on
zero coupon U.S. treasury note |
0.6 | % | 1.1 | % | 1.9 | % | |||||||
|
Dividend yield
|
3.8 | % | 3.5 | % | 2.7 | % | |||||||
|
Weighted-average fair value per
option granted |
$ | 12.91 | $ | 12.38 | $ | 10.01 | |||||||
| 1 | Expected term is based on historical exercise and postvesting cancellation data. | |
| 2 | Volatility rate is based on historical stock prices over an appropriate period, generally equal to the expected term. |
| Weighted- | ||||||||||||||||
| Weighted- | Average | |||||||||||||||
| Average | Remaining | Aggregate | ||||||||||||||
| Shares | Exercise | Contractual | Intrinsic | |||||||||||||
| (Thousands) | Price | Term | Value | |||||||||||||
|
Outstanding at
January 1, 2010 |
69,463 | $ | 63.70 | |||||||||||||
|
Granted
|
15,454 | $ | 73.70 | |||||||||||||
|
Exercised
|
(8,133 | ) | $ | 49.82 | ||||||||||||
|
Restored
|
27 | $ | 78.41 | |||||||||||||
|
Forfeited
|
(1,959 | ) | $ | 73.34 | ||||||||||||
|
Outstanding at
December 31, 2010 |
74,852 | $ | 67.04 | 6.4 yrs | $ | 1,813 | ||||||||||
|
Exercisable at
December 31, 2010 |
48,174 | $ | 63.29 | 5.2 yrs | $ | 1,348 | ||||||||||
FS-52
Table of Contents
| Pension Benefits | ||||||||||||||||||||||||||
| 2010 | 2009 | Other Benefits | ||||||||||||||||||||||||
| U.S. | Int’l. | U.S. | Int’l. | 2010 | 2009 | |||||||||||||||||||||
|
Change
in Benefit Obligation
|
||||||||||||||||||||||||||
|
Benefit obligation at January 1
|
$ | 9,664 | $ | 4,715 | $ | 8,127 | $ | 3,891 | $ | 3,065 | $ | 2,931 | ||||||||||||||
|
Service cost
|
337 | 153 | 266 | 128 | 39 | 43 | ||||||||||||||||||||
|
Interest cost
|
486 | 307 | 481 | 292 | 175 | 180 | ||||||||||||||||||||
|
Plan participants’ contributions
|
– | 7 | – | 7 | 147 | 145 | ||||||||||||||||||||
|
Plan amendments
|
– | – | 1 | 10 | 12 | 20 | ||||||||||||||||||||
|
Curtailments
|
– | – | – | – | – | (5 | ) | |||||||||||||||||||
|
Actuarial loss (gain)
|
568 | 200 | 1,391 | 299 | 486 | 56 | ||||||||||||||||||||
|
Foreign currency exchange rate changes
|
– | (17 | ) | – | 333 | 11 | 27 | |||||||||||||||||||
|
Benefits paid
|
(784 | ) | (295 | ) | (602 | ) | (245 | ) | (330 | ) | (332 | ) | ||||||||||||||
|
Benefit obligation at December 31
|
10,271 | 5,070 | 9,664 | 4,715 | 3,605 | 3,065 | ||||||||||||||||||||
|
Change in
Plan Assets
|
||||||||||||||||||||||||||
|
Fair value of plan assets at January 1
|
7,304 | 3,235 | 5,448 | 2,600 | – | – | ||||||||||||||||||||
|
Actual return on plan assets
|
867 | 361 | 964 | 402 | – | – | ||||||||||||||||||||
|
Foreign currency exchange rate changes
|
– | (63 | ) | – | 226 | – | – | |||||||||||||||||||
|
Employer contributions
|
1,192 | 258 | 1,494 | 245 | 183 | 187 | ||||||||||||||||||||
|
Plan participants’ contributions
|
– | 7 | – | 7 | 147 | 145 | ||||||||||||||||||||
|
Benefits paid
|
(784 | ) | (295 | ) | (602 | ) | (245 | ) | (330 | ) | (332 | ) | ||||||||||||||
|
Fair value of plan assets at December 31
|
8,579 | 3,503 | 7,304 | 3,235 | – | – | ||||||||||||||||||||
|
Funded
Status at December 31
|
$ | (1,692 | ) | $ | (1,567 | ) | $ | (2,360 | ) | $ | (1,480 | ) | $ | (3,605 | ) | $ | (3,065 | ) | ||||||||
| Pension Benefits | ||||||||||||||||||||||||||
| 2010 | 2009 | Other Benefits | ||||||||||||||||||||||||
| U.S. | Int’l. | U.S. | Int’l. | 2010 | 2009 | |||||||||||||||||||||
|
Deferred charges and other assets
|
$ | 7 | $ | 77 | $ | 6 | $ | 37 | $ | – | $ | – | ||||||||||||||
|
Accrued liabilities
|
(134 | ) | (71 | ) | (66 | ) | (67 | ) | (225 | ) | (208 | ) | ||||||||||||||
|
Reserves for employee benefit plans
|
(1,565 | ) | (1,573 | ) | (2,300 | ) | (1,450 | ) | (3,380 | ) | (2,857 | ) | ||||||||||||||
|
Net amount recognized at December 31
|
$ | (1,692 | ) | $ | (1,567 | ) | $ | (2,360 | ) | $ | (1,480 | ) | $ | (3,605 | ) | $ | (3,065 | ) | ||||||||
| Pension Benefits | ||||||||||||||||||||||||||
| 2010 | 2009 | Other Benefits | ||||||||||||||||||||||||
| U.S. | Int’l. | U.S. | Int’l. | 2010 | 2009 | |||||||||||||||||||||
|
Net actuarial loss
|
$ | 3,919 | $ | 1,903 | $ | 4,181 | $ | 1,889 | $ | 935 | $ | 465 | ||||||||||||||
|
Prior service (credit) costs
|
(52 | ) | 179 | (60 | ) | 201 | (135 | ) | (222 | ) | ||||||||||||||||
|
Total recognized at December 31
|
$ | 3,867 | $ | 2,082 | $ | 4,121 | $ | 2,090 | $ | 800 | $ | 243 | ||||||||||||||
| Pension Benefits | |||||||||||||||||
| 2010 | 2009 | ||||||||||||||||
| U.S. | Int’l. | U.S. | Int’l. | ||||||||||||||
|
Projected benefit obligations
|
$ | 10,265 | $ | 3,668 | $ | 9,658 | $ | 3,550 | |||||||||
|
Accumulated benefit obligations
|
9,528 | 3,113 | 8,702 | 3,102 | |||||||||||||
|
Fair value of plan assets
|
8,566 | 2,190 | 7,292 | 2,116 | |||||||||||||
FS-53
Table of Contents
Millions of dollars, except per-share amounts
| Pension Benefits | ||||||||||||||||||||||||||||||||||||||
| 2010 | 2009 | 2008 | Other Benefits | |||||||||||||||||||||||||||||||||||
| U.S. | Int’l. | U.S. | Int’l. | U.S. | Int’l. | 2010 | 2009 | 2008 | ||||||||||||||||||||||||||||||
|
Net
Periodic Benefit Cost
|
||||||||||||||||||||||||||||||||||||||
|
Service cost
|
$ | 337 | $ | 153 | $ | 266 | $ | 128 | $ | 250 | $ | 132 | $ | 39 | $ | 43 | $ | 44 | ||||||||||||||||||||
|
Interest cost
|
486 | 307 | 481 | 292 | 499 | 292 | 175 | 180 | 178 | |||||||||||||||||||||||||||||
|
Expected return on plan assets
|
(538 | ) | (241 | ) | (395 | ) | (203 | ) | (593 | ) | (273 | ) | – | – | – | |||||||||||||||||||||||
|
Amortization of prior service
(credits) costs
|
(8 | ) | 22 | (7 | ) | 23 | (7 | ) | 24 | (75 | ) | (81 | ) | (81 | ) | |||||||||||||||||||||||
|
Recognized actuarial losses
|
318 | 98 | 298 | 108 | 60 | 77 | 27 | 27 | 38 | |||||||||||||||||||||||||||||
|
Settlement losses
|
186 | 6 | 141 | 1 | 306 | 2 | – | – | – | |||||||||||||||||||||||||||||
|
Curtailment losses
|
– | – | – | – | – | – | – | (5 | ) | – | ||||||||||||||||||||||||||||
|
Special termination benefit recognition
|
– | – | – | – | – | 1 | – | – | – | |||||||||||||||||||||||||||||
|
Total net periodic benefit cost
|
781 | 345 | 784 | 349 | 515 | 255 | 166 | 164 | 179 | |||||||||||||||||||||||||||||
|
Changes Recognized in Other
Comprehensive Income
|
||||||||||||||||||||||||||||||||||||||
|
Net actuarial loss (gain) during period
|
242 | 118 | 823 | 194 | 2,624 | 646 | 497 | 82 | (42 | ) | ||||||||||||||||||||||||||||
|
Amortization of actuarial loss
|
(504 | ) | (104 | ) | (439 | ) | (109 | ) | (366 | ) | (79 | ) | (27 | ) | (27 | ) | (38 | ) | ||||||||||||||||||||
|
Prior service cost during period
|
– | – | 1 | 13 | – | 32 | 12 | 20 | – | |||||||||||||||||||||||||||||
|
Amortization of prior service
credits (costs)
|
8 | (22 | ) | 7 | (23 | ) | 7 | (24 | ) | 75 | 81 | 81 | ||||||||||||||||||||||||||
|
Total changes recognized in
other comprehensive income
|
(254 | ) | (8 | ) | 392 | 75 | 2,265 | 575 | 557 | 156 | 1 | |||||||||||||||||||||||||||
|
Recognized in Net Periodic
Benefit Cost and Other
Comprehensive Income
|
$ | 527 | $ | 337 | $ | 1,176 | $ | 424 | $ | 2,780 | $ | 830 | $ | 723 | $ | 320 | $ | 180 | ||||||||||||||||||||
FS-54
Table of Contents
| Pension Benefits | ||||||||||||||||||||||||||||||||||||||
| 2010 | 2009 | 2008 | Other Benefits | |||||||||||||||||||||||||||||||||||
| U.S. | Int’l. | U.S. | Int’l. | U.S. | Int’l. | 2010 | 2009 | 2008 | ||||||||||||||||||||||||||||||
|
Assumptions used to determine
|
||||||||||||||||||||||||||||||||||||||
|
benefit obligations:
|
||||||||||||||||||||||||||||||||||||||
|
Discount rate
|
4.8 | % | 6.5 | % | 5.3 | % | 6.8 | % | 6.3 | % | 7.5 | % | 5.2 | % | 5.9 | % | 6.3 | % | ||||||||||||||||||||
|
Rate of compensation increase
|
4.5 | % | 6.7 | % | 4.5 | % | 6.3 | % | 4.5 | % | 6.8 | % | N/A | N/A | 4.0 | % | ||||||||||||||||||||||
|
Assumptions used to determine
|
||||||||||||||||||||||||||||||||||||||
|
net periodic benefit cost:
|
||||||||||||||||||||||||||||||||||||||
|
Discount rate
|
5.3 | % | 6.8 | % | 6.3 | % | 7.5 | % | 6.3 | % | 6.7 | % | 5.9 | % | 6.3 | % | 6.3 | % | ||||||||||||||||||||
|
Expected return on plan assets
|
7.8 | % | 7.8 | % | 7.8 | % | 7.5 | % | 7.8 | % | 7.4 | % | N/A | N/A | N/A | |||||||||||||||||||||||
|
Rate of compensation increase
|
4.5 | % | 6.3 | % | 4.5 | % | 6.8 | % | 4.5 | % | 6.4 | % | N/A | N/A | 4.5 | % | ||||||||||||||||||||||
| 1 Percent | 1 Percent | |||||||
| Increase | Decrease | |||||||
|
Effect on total service and interest cost components
|
$ | 11 | $ | (9 | ) | |||
|
Effect on postretirement benefit obligation
|
$ | 146 | $ | (125 | ) | |||
FS-55
Table of Contents
Millions of dollars, except per-share amounts
| U.S. | Int’l | ||||||||||||||||||||||||||||||||
| Total Fair Value | Level 1 | Level 2 | Level 3 | Total Fair Value | Level 1 | Level 2 | Level 3 | ||||||||||||||||||||||||||
|
At December 31, 2010
|
|||||||||||||||||||||||||||||||||
|
Equities
|
|||||||||||||||||||||||||||||||||
|
U.S.
1
|
$ | 2,121 | $ | 2,121 | $ | – | $ | – | $ | 465 | $ | 465 | $ | – | $ | – | |||||||||||||||||
|
International
|
1,405 | 1,405 | – | – | 721 | 721 | – | – | |||||||||||||||||||||||||
|
Collective Trusts/Mutual Funds
2
|
2,068 | 5 | 2,063 | – | 578 | 80 | 498 | – | |||||||||||||||||||||||||
|
Fixed Income
|
|||||||||||||||||||||||||||||||||
|
Government
|
659 | 19 | 640 | – | 568 | 38 | 530 | – | |||||||||||||||||||||||||
|
Corporate
|
314 | – | 314 | – | 351 | 24 | 299 | 28 | |||||||||||||||||||||||||
|
Mortgage-Backed Securities
|
82 | – | 82 | – | 2 | – | – | 2 | |||||||||||||||||||||||||
|
Other Asset Backed
|
74 | – | 74 | – | 16 | – | 16 | – | |||||||||||||||||||||||||
|
Collective Trusts/Mutual Funds
2
|
1,064 | – | 1,064 | – | 332 | 19 | 313 | – | |||||||||||||||||||||||||
|
Mixed Funds
3
|
9 | 9 | – | – | 105 | 16 | 89 | – | |||||||||||||||||||||||||
|
Real Estate
4
|
596 | – | – | 596 | 142 | – | – | 142 | |||||||||||||||||||||||||
|
Cash and Cash Equivalents
|
213 | 213 | – | – | 217 | 217 | – | – | |||||||||||||||||||||||||
|
Other
5
|
(26 | ) | (87 | ) | 8 | 53 | 6 | (5 | ) | 9 | 2 | ||||||||||||||||||||||
|
Total at December 31, 2010
|
$ | 8,579 | $ | 3,685 | $ | 4,245 | $ | 649 | $ | 3,503 | $ | 1,575 | $ | 1,754 | $ | 174 | |||||||||||||||||
|
At December 31, 2009
|
|||||||||||||||||||||||||||||||||
|
Equities
|
|||||||||||||||||||||||||||||||||
|
U.S.
1
|
$ | 2,115 | $ | 2,115 | $ | – | $ | – | $ | 370 | $ | 370 | $ | – | $ | – | |||||||||||||||||
|
International
|
977 | 977 | – | – | 492 | 492 | – | – | |||||||||||||||||||||||||
|
Collective Trusts/Mutual Funds
2,6
|
1,264 | 3 | 1,261 | – | 786 | 91 | 695 | – | |||||||||||||||||||||||||
|
Fixed Income
|
|||||||||||||||||||||||||||||||||
|
Government
|
713 | 149 | 564 | – | 506 | 54 | 452 | – | |||||||||||||||||||||||||
|
Corporate
|
430 | – | 430 | – | 371 | 17 | 336 | 18 | |||||||||||||||||||||||||
|
Mortgage-Backed Securities
|
149 | – | 149 | – | 2 | – | – | 2 | |||||||||||||||||||||||||
|
Other Asset Backed
|
90 | – | 90 | – | 19 | – | 19 | – | |||||||||||||||||||||||||
|
Collective Trusts/Mutual Funds
2
|
326 | – | 326 | – | 230 | 14 | 216 | – | |||||||||||||||||||||||||
|
Mixed Funds
3,6
|
8 | 8 | – | – | 105 | 17 | 88 | – | |||||||||||||||||||||||||
|
Real Estate
4
|
479 | – | – | 479 | 131 | – | – | 131 | |||||||||||||||||||||||||
|
Cash and Cash Equivalents
|
743 | 743 | – | – | 207 | 207 | – | – | |||||||||||||||||||||||||
|
Other
5
|
10 | (57 | ) | 16 | 51 | 16 | (3 | ) | 18 | 1 | |||||||||||||||||||||||
|
Total
at December 31, 2009
|
$ | 7,304 | $ | 3,938 | $ | 2,836 | $ | 530 | $ | 3,235 | $ | 1,259 | $ | 1,824 | $ | 152 | |||||||||||||||||
| 1 | U.S. equities include investments in the company’s common stock in the amount of $38 at December 31, 2010 and $ 29 at December 31, 2009. |
| 2 | Collective Trusts/Mutual Funds for U.S. plans are entirely index funds; for International plans, they are mostly index funds. For these index funds, the Level 2 designation is partially based on the restriction that advance notification of redemptions, typically two business days, is required. |
| 3 | Mixed funds are composed of funds that invest in both equity and fixed-income instruments in order to diversify and lower risk. |
| 4 | The year-end valuations of the U.S. real estate assets are based on internal appraisals by the real estate managers, which are updates of third-party appraisals that occur at least once a year for each property in the portfolio. |
| 5 | The “Other” asset class includes net payables for securities purchased but not yet settled (Level 1); dividends and interest- and tax-related receivables (Level 2); insurance contracts and investments in private-equity limited partnerships (Level 3). |
| 6 | Certain amounts have been reclassified to conform to their 2010 presentation. |
FS-56
Table of Contents
| Fixed Income | ||||||||||||||||||||||||||||
| Mortgage- | ||||||||||||||||||||||||||||
| Backed | ||||||||||||||||||||||||||||
| U.S. Equities | Corporate | Securities | Real Estate | Other | Total | |||||||||||||||||||||||
|
Total at December 31, 2008
|
$ | 1 | $ | 23 | $ | 2 | $ | 763 | $ | 52 | $ | 841 | ||||||||||||||||
|
Actual Return on Plan Assets:
|
||||||||||||||||||||||||||||
|
Assets held at the reporting date
|
(1 | ) | 2 | – | (178 | ) | – | (177 | ) | |||||||||||||||||||
|
Assets sold during the period
|
– | 5 | – | 8 | – | 13 | ||||||||||||||||||||||
|
Purchases, Sales and Settlements
|
– | (12 | ) | – | 17 | – | 5 | |||||||||||||||||||||
|
Transfers in and/or out of Level 3
|
– | – | – | – | – | – | ||||||||||||||||||||||
|
Total at December 31, 2009
|
$ | – | $ | 18 | $ | 2 | $ | 610 | $ | 52 | $ | 682 | ||||||||||||||||
|
Actual Return on Plan Assets:
|
||||||||||||||||||||||||||||
|
Assets held at the reporting date
|
– | 3 | – | 34 | 1 | 38 | ||||||||||||||||||||||
|
Assets sold during the period
|
– | – | – | 1 | – | 1 | ||||||||||||||||||||||
|
Purchases, Sales and Settlements
|
– | 7 | – | 93 | 2 | 102 | ||||||||||||||||||||||
|
Transfers in and/or out of Level 3
|
– | – | – | – | – | – | ||||||||||||||||||||||
|
Total at December 31, 2010
|
$ | – | $ | 28 | $ | 2 | $ | 738 | $ | 55 | $ | 823 | ||||||||||||||||
| Pension Benefits | Other | |||||||||||
| U.S. | Int’l. | Benefits | ||||||||||
|
2011
|
$ | 994 | $ | 247 | $ | 225 | ||||||
|
2012
|
$ | 926 | $ | 298 | $ | 230 | ||||||
|
2013
|
$ | 924 | $ | 300 | $ | 238 | ||||||
|
2014
|
$ | 934 | $ | 320 | $ | 246 | ||||||
|
2015
|
$ | 937 | $ | 346 | $ | 253 | ||||||
|
2016–2020
|
$ | 4,687 | $ | 2,095 | $ | 1,345 | ||||||
FS-57
Table of Contents
Millions of dollars, except per-share amounts
| Thousands | 2010 | 2009 | |||||||
|
Allocated shares
|
20,718 | 21,211 | |||||||
|
Unallocated shares
|
2,374 | 3,636 | |||||||
|
Total LESOP shares
|
23,092 | 24,847 | |||||||
FS-58
Table of Contents
| Amounts Before Tax | ||||
|
Balance at January 1, 2010
|
$ | – | ||
|
Accruals
|
244 | |||
|
Adjustments
|
(10 | ) | ||
|
Payments
|
(96 | ) | ||
|
Balance at December 31, 2010
|
$ | 138 | ||
FS-59
Table of Contents
Millions of dollars, except per-share amounts
FS-60
Table of Contents
FS-61
Table of Contents
Millions of dollars, except per-share amounts
| 2010 | 2009 | 2008 | |||||||||||
|
Balance at January 1
|
$ | 10,175 | $ | 9,395 | $ | 8,253 | |||||||
|
Liabilities incurred
|
129 | 144 | 308 | ||||||||||
|
Liabilities settled
|
(755 | ) | (757 | ) | (973 | ) | |||||||
|
Accretion expense
|
513 | 463 | 430 | ||||||||||
|
Revisions in estimated
cash flows
|
2,426 | 930 | 1,377 | ||||||||||
|
Balance at December 31
|
$ | 12,488 | $ | 10,175 | $ | 9,395 | |||||||
| Year ended December 31 | |||||||||||||
| 2010 | 2009 | 2008 | |||||||||||
|
Total financing interest and debt
costs
|
$ | 317 | $ | 301 | $ | 256 | |||||||
|
Less: Capitalized interest
|
267 | 273 | 256 | ||||||||||
|
Interest and debt expense
|
$ | 50 | $ | 28 | $ | – | |||||||
|
Research and development expenses
|
$ | 526 | $ | 603 | $ | 702 | |||||||
|
Foreign currency effects*
|
$ | (423 | ) | $ | (744 | ) | $ | 862 | |||||
| * | Includes $ (71), $ (194) and $ 420 in 2010, 2009 and 2008, respectively, for the company’s share of equity affiliates’ foreign currency effects. |
FS-62
Table of Contents
| Year ended December 31 | |||||||||||||
| 2010 | 2009 | 2008 | |||||||||||
|
Basic
EPS Calculation
|
|||||||||||||
|
Earnings available to common stockholders – Basic
1
|
$ | 19,024 | $ | 10,483 | $ | 23,931 | |||||||
|
Weighted-average number of common shares outstanding
|
1,996 | 1,991 | 2,037 | ||||||||||
|
Add: Deferred awards held as stock units
|
1 | 1 | 1 | ||||||||||
|
Total weighted-average number of common shares outstanding
|
1,997 | 1,992 | 2,038 | ||||||||||
|
Earnings per share of common stock – Basic
|
$ | 9.53 | $ | 5.26 | $ | 11.74 | |||||||
|
Diluted
EPS Calculation
|
|||||||||||||
|
Earnings available to common stockholders – Diluted
1
|
$ | 19,024 | $ | 10,483 | $ | 23,931 | |||||||
|
Weighted-average number of common shares outstanding
|
1,996 | 1,991 | 2,037 | ||||||||||
|
Add: Deferred awards held as stock units
|
1 | 1 | 1 | ||||||||||
|
Add: Dilutive effect of employee stock-based awards
|
10 | 9 | 12 | ||||||||||
|
Total weighted-average number of common shares outstanding
|
2,007 | 2,001 | 2,050 | ||||||||||
|
Earnings per share of common stock – Diluted
|
$ | 9.48 | $ | 5.24 | $ | 11.67 | |||||||
| 1 | There was no effect of dividend equivalents paid on stock units or dilutive impact of employee stock-based awards on earnings. |
FS-63
Table of Contents
FS-64
Table of Contents
| Millions of dollars, except per-share amounts | 2010 | 2009 | 2008 | 2007 | 2006 | ||||||||||||||||
|
Statement
of Income Data
|
|||||||||||||||||||||
|
Revenues
and Other Income
|
|||||||||||||||||||||
|
Total sales
and other operating
revenues
1
,
2
|
$ | 198,198 | $ | 167,402 | $ | 264,958 | $ | 214,091 | $ | 204,892 | |||||||||||
|
Income from equity affiliates and other income
|
6,730 | 4,234 | 8,047 | 6,813 | 5,226 | ||||||||||||||||
|
Total
Revenues and Other Income
|
204,928 | 171,636 | 273,005 | 220,904 | 210,118 | ||||||||||||||||
|
Total
Costs and Other Deductions
|
172,873 | 153,108 | 229,948 | 188,630 | 178,072 | ||||||||||||||||
|
Income
Before Income Tax Expense
|
32,055 | 18,528 | 43,057 | 32,274 | 32,046 | ||||||||||||||||
|
Income
Tax Expense
|
12,919 | 7,965 | 19,026 | 13,479 | 14,838 | ||||||||||||||||
|
Net
Income
|
19,136 | 10,563 | 24,031 | 18,795 | 17,208 | ||||||||||||||||
|
Less: Net income attributable to noncontrolling interests
|
112 | 80 | 100 | 107 | 70 | ||||||||||||||||
|
Net
Income Attributable to Chevron Corporation
|
$ | 19,024 | $ | 10,483 | $ | 23,931 | $ | 18,688 | $ | 17,138 | |||||||||||
|
Per
Share of Common Stock
|
|||||||||||||||||||||
|
Net
Income Attributable to
Chevron
2
|
|||||||||||||||||||||
|
– Basic
|
$ | 9.53 | $ | 5.26 | $ | 11.74 | $ | 8.83 | $ | 7.84 | |||||||||||
|
– Diluted
|
$ | 9.48 | $ | 5.24 | $ | 11.67 | $ | 8.77 | $ | 7.80 | |||||||||||
|
Cash
Dividends Per Share
|
$ | 2.84 | $ | 2.66 | $ | 2.53 | $ | 2.26 | $ | 2.01 | |||||||||||
|
Balance
Sheet Data (at December 31)
|
|||||||||||||||||||||
|
Current assets
|
$ | 48,841 | $ | 37,216 | $ | 36,470 | $ | 39,377 | $ | 36,304 | |||||||||||
|
Noncurrent assets
|
135,928 | 127,405 | 124,695 | 109,409 | 96,324 | ||||||||||||||||
|
Total
Assets
|
184,769 | 164,621 | 161,165 | 148,786 | 132,628 | ||||||||||||||||
|
Short-term debt
|
187 | 384 | 2,818 | 1,162 | 2,159 | ||||||||||||||||
|
Other current liabilities
|
28,825 | 25,827 | 29,205 | 32,636 | 26,250 | ||||||||||||||||
|
Long-term debt and capital lease obligations
|
11,289 | 10,130 | 6,083 | 6,070 | 7,679 | ||||||||||||||||
|
Other noncurrent liabilities
|
38,657 | 35,719 | 35,942 | 31,626 | 27,396 | ||||||||||||||||
|
Total
Liabilities
|
78,958 | 72,060 | 74,048 | 71,494 | 63,484 | ||||||||||||||||
|
Total
Chevron Corporation Stockholders’ Equity
|
$ | 105,081 | $ | 91,914 | $ | 86,648 | $ | 77,088 | $ | 68,935 | |||||||||||
|
Noncontrolling interests
|
730 | 647 | 469 | 204 | 209 | ||||||||||||||||
|
Total
Equity
|
$ | 105,811 | $ | 92,561 | $ | 87,117 | $ | 77,292 | $ | 69,144 | |||||||||||
|
1
Includes excise, value-added and similar taxes:
|
$
8,591
|
$
8,109
|
$
9,846
|
$
10,121
|
$
9,551
|
||||||||||||||||
|
2
Includes amounts in revenues for buy/sell contracts; associated costs are in
|
|||||||||||||||||||||
|
“Total Costs and Other Deductions.”
|
$
–
|
$
–
|
$
–
|
$
–
|
$
6,725
|
||||||||||||||||
FS-65
Table of Contents
Unaudited
| Consolidated Companies | Affiliated Companies | |||||||||||||||||||||||||||||||||||
| Other | ||||||||||||||||||||||||||||||||||||
| Millions of dollars | U.S. | Americas | Africa | Asia | Australia | Europe | Total | TCO | Other | |||||||||||||||||||||||||||
|
Year
Ended December 31, 2010
|
||||||||||||||||||||||||||||||||||||
|
Exploration
|
||||||||||||||||||||||||||||||||||||
|
Wells
|
$ | 99 | $ | 118 | $ | 94 | $ | 244 | $ | 293 | $ | 61 | $ | 909 | $ | – | $ | – | ||||||||||||||||||
|
Geological and geophysical
|
67 | 46 | 87 | 29 | 8 | 18 | 255 | – | – | |||||||||||||||||||||||||||
|
Rentals and other
|
121 | 39 | 55 | 47 | 95 | 57 | 414 | – | – | |||||||||||||||||||||||||||
|
Total exploration
|
287 | 203 | 236 | 320 | 396 | 136 | 1,578 | – | – | |||||||||||||||||||||||||||
|
Property acquisitions
2
|
||||||||||||||||||||||||||||||||||||
|
Proved
|
24 | – | – | 129 | – | – | 153 | – | – | |||||||||||||||||||||||||||
|
Unproved
|
359 | 429 | 160 | 187 | – | 10 | 1,145 | – | – | |||||||||||||||||||||||||||
|
Total property acquisitions
|
383 | 429 | 160 | 316 | – | 10 | 1,298 | – | – | |||||||||||||||||||||||||||
|
Development
3
|
4,446 | 1,611 | 2,985 | 3,325 | 2,623 | 411 | 15,401 | 230 | 343 | |||||||||||||||||||||||||||
|
Total
Costs
Incurred
4
|
$ | 5,116 | $ | 2,243 | $ | 3,381 | $ | 3,961 | $ | 3,019 | $ | 557 | $ | 18,277 | $ | 230 | $ | 343 | ||||||||||||||||||
|
Year
Ended December 31,
2009
5
|
||||||||||||||||||||||||||||||||||||
|
Exploration
|
||||||||||||||||||||||||||||||||||||
|
Wells
|
$ | 361 | $ | 70 | 140 | $ | 45 | 275 | $ | 84 | $ | 975 | $ | – | $ | – | ||||||||||||||||||||
|
Geological and geophysical
|
62 | 70 | 114 | 49 | 17 | 16 | 328 | – | – | |||||||||||||||||||||||||||
|
Rentals and other
|
153 | 146 | 92 | 60 | 127 | 43 | 621 | – | – | |||||||||||||||||||||||||||
|
Total exploration
|
576 | 286 | 346 | 154 | 419 | 143 | 1,924 | – | – | |||||||||||||||||||||||||||
|
Property acquisitions
2
|
||||||||||||||||||||||||||||||||||||
|
Proved
|
3 | – | – | – | – | – | 3 | – | – | |||||||||||||||||||||||||||
|
Unproved
|
29 | – | – | – | – | – | 29 | – | – | |||||||||||||||||||||||||||
|
Total property acquisitions
|
32 | – | – | – | – | – | 32 | – | – | |||||||||||||||||||||||||||
|
Development
3
|
3,338 | 1,515 | 3,426 | 2,698 | 565 | 285 | 11,827 | 265 | 69 | |||||||||||||||||||||||||||
|
Total
Costs Incurred
|
$ | 3,946 | $ | 1,801 | $ | 3,772 | $ | 2,852 | $ | 984 | $ | 428 | $ | 13,783 | $ | 265 | $ | 69 | ||||||||||||||||||
|
Year
Ended December 31,
2008
5
|
||||||||||||||||||||||||||||||||||||
|
Exploration
|
||||||||||||||||||||||||||||||||||||
|
Wells
|
$ | 519 | $ | 47 | $ | 197 | $ | 85 | $ | 248 | $ | 19 | $ | 1,115 | $ | – | $ | – | ||||||||||||||||||
|
Geological and geophysical
|
66 | 75 | 90 | 42 | 28 | 28 | 329 | – | – | |||||||||||||||||||||||||||
|
Rentals and other
|
143 | 135 | 60 | 70 | 46 | 31 | 485 | – | – | |||||||||||||||||||||||||||
|
Total exploration
|
728 | 257 | 347 | 197 | 322 | 78 | 1,929 | – | – | |||||||||||||||||||||||||||
|
Property acquisitions
2
|
||||||||||||||||||||||||||||||||||||
|
Proved
|
88 | – | – | 169 | – | – | 257 | – | – | |||||||||||||||||||||||||||
|
Unproved
|
579 | – | – | 280 | – | – | 859 | – | – | |||||||||||||||||||||||||||
|
Total property acquisitions
|
667 | – | – | 449 | – | – | 1,116 | – | – | |||||||||||||||||||||||||||
|
Development
3
|
4,348 | 1,334 | 3,723 | 4,697 | 540 | 545 | 15,187 | 643 | 120 | |||||||||||||||||||||||||||
|
Total
Costs
Incurred
6
|
$ | 5,743 | $ | 1,591 | $ | 4,070 | $ | 5,343 | $ | 862 | $ | 623 | $ | 18,232 | $ | 643 | $ | 120 | ||||||||||||||||||
| 1 | Includes costs incurred whether capitalized or expensed. Excludes general support equipment expenditures. Includes capitalized amounts related to asset retirement obligations. |
| See Note 25, “Asset Retirement Obligations,” on page FS-62. | |
| 2 | Includes wells, equipment and facilities associated with proved reserves. Does not include properties acquired in nonmonetary transactions. |
| 3 | Includes $745, $121 and $224 costs incurred prior to assignment of proved reserves for consolidated companies in 2010, 2009 and 2008, respectively. Also includes $12 in 2009 for affiliated Other. |
| 4 | Reconciliation of consolidated companies total cost incurred to Upstream capital and exploratory (C&E) expenditures – $billions. |
|
|
Total cost incurred
|
$ | 18.3 | ||||||||
|
|
ARO
|
(2.5 | ) | ||||||||
|
|
Non oil and gas activities
|
3.1 | (Includes LNG and gas-to-liquids $2.3, transportation $0.4, affiliate $0.3, other $0.1) | ||||||||
|
|
|||||||||||
|
|
Upstream C&E
|
$ | 18.9 | Reference FS-13 upstream total | |||||||
| 5 | Geographic presentation conformed to 2010 consistent with the presentation of the oil and gas reserve tables. |
| 6 | Excludes costs incurred for oil sands in Other Americas and heavy oil in affiliated Other, since 2008 precedes the update to Extractive Industries – Oil and Gas (Topic 932). |
FS-66
Table of Contents
Gas Producing Activities
| Consolidated Companies | Affiliated Companies | |||||||||||||||||||||||||||||||||||
| Other | ||||||||||||||||||||||||||||||||||||
| Millions of dollars | U.S. | Americas | Africa | Asia | Australia | Europe | Total | TCO | Other | |||||||||||||||||||||||||||
|
At
December 31, 2010
|
||||||||||||||||||||||||||||||||||||
|
Unproved properties
|
$ | 2,553 | $ | 1,349 | $ | 359 | $ | 2,561 | $ | 6 | $ | 8 | $ | 6,836 | $ | 108 | $ | – | ||||||||||||||||||
|
Proved properties and
related producing assets
|
55,601 | 7,747 | 23,683 | 33,316 | 2,585 | 9,035 | 131,967 | 6,512 | 1,594 | |||||||||||||||||||||||||||
|
Support equipment
|
975 | 265 | 1,282 | 1,421 | 259 | 165 | 4,367 | 985 | – | |||||||||||||||||||||||||||
|
Deferred exploratory wells
|
743 | 210 | 611 | 224 | 732 | 198 | 2,718 | – | – | |||||||||||||||||||||||||||
|
Other uncompleted projects
|
2,299 | 3,844 | 4,061 | 3,627 | 3,631 | 362 | 17,824 | 357 | 1,001 | |||||||||||||||||||||||||||
|
Gross
Capitalized Costs
|
62,171 | 13,415 | 29,996 | 41,149 | 7,213 | 9,768 | 163,712 | 7,962 | 2,595 | |||||||||||||||||||||||||||
|
Unproved properties valuation
|
967 | 436 | 150 | 200 | 2 | – | 1,755 | 34 | – | |||||||||||||||||||||||||||
|
Proved producing properties –
Depreciation and depletion
|
37,682 | 3,986 | 10,986 | 18,197 | 1,718 | 7,162 | 79,731 | 1,530 | 249 | |||||||||||||||||||||||||||
|
Support equipment depreciation
|
518 | 153 | 600 | 1,126 | 84 | 114 | 2,595 | 402 | – | |||||||||||||||||||||||||||
|
Accumulated provisions
|
39,167 | 4,575 | 11,736 | 19,523 | 1,804 | 7,276 | 84,081 | 1,966 | 249 | |||||||||||||||||||||||||||
|
Net
Capitalized Costs
|
$ | 23,004 | $ | 8,840 | $ | 18,260 | $ | 21,626 | $ | 5,409 | $ | 2,492 | $ | 79,631 | $ | 5,996 | $ | 2,346 | ||||||||||||||||||
|
At
December 31,
2009
1
|
||||||||||||||||||||||||||||||||||||
|
Unproved properties
|
$ | 2,320 | $ | 946 | $ | 321 | $ | 3,355 | $ | 7 | $ | 10 | $ | 6,959 | $ | 113 | $ | – | ||||||||||||||||||
|
Proved properties and
related producing assets
|
51,582 | 6,033 | 20,967 | 29,637 | 2,507 | 8,727 | 119,453 | 6,404 | 1,759 | |||||||||||||||||||||||||||
|
Support equipment
|
810 | 323 | 1,012 | 1,383 | 162 | 163 | 3,853 | 947 | – | |||||||||||||||||||||||||||
|
Deferred exploratory wells
|
762 | 216 | 603 | 209 | 440 | 205 | 2,435 | – | – | |||||||||||||||||||||||||||
|
Other uncompleted projects
|
2,384 | 4,106 | 3,960 | 2,936 | 1,274 | 192 | 14,852 | 284 | 58 | |||||||||||||||||||||||||||
|
Gross
Capitalized Costs
|
57,858 | 11,624 | 26,863 | 37,520 | 4,390 | 9,297 | 147,552 | 7,748 | 1,817 | |||||||||||||||||||||||||||
|
Unproved properties valuation
|
915 | 391 | 163 | 170 | 1 | (2 | ) | 1,638 | 32 | – | ||||||||||||||||||||||||||
|
Proved producing properties –
Depreciation and depletion
|
34,574 | 3,182 | 8,823 | 15,783 | 1,579 | 6,482 | 70,423 | 1,150 | 282 | |||||||||||||||||||||||||||
|
Support equipment depreciation
|
424 | 197 | 526 | 773 | 58 | 102 | 2,080 | 356 | – | |||||||||||||||||||||||||||
|
Accumulated provisions
|
35,913 | 3,770 | 9,512 | 16,726 | 1,638 | 6,582 | 74,141 | 1,538 | 282 | |||||||||||||||||||||||||||
|
Net
Capitalized Costs
|
$ | 21,945 | $ | 7,854 | $ | 17,351 | $ | 20,794 | $ | 2,752 | $ | 2,715 | $ | 73,411 | $ | 6,210 | $ | 1,535 | ||||||||||||||||||
| 1 | Geographic presentation conformed to 2010 consistent with the presentation of the oil and gas reserve tables. |
FS-67
Table of Contents
Gas Producing Activities - Continued
| Consolidated Companies | Affiliated Companies | |||||||||||||||||||||||||||||||||||
| Other | ||||||||||||||||||||||||||||||||||||
| Millions of dollars | U.S. | Americas | Africa | Asia | Australia | Europe | Total | TCO | Other | |||||||||||||||||||||||||||
|
At
December 31,
2008
1,2
|
||||||||||||||||||||||||||||||||||||
|
Unproved properties
|
$ | 2,495 | $ | 900 | $ | 294 | $ | 3,300 | $ | 139 | $ | 12 | $ | 7,140 | $ | 113 | $ | – | ||||||||||||||||||
|
Proved properties and
related producing assets
|
46,280 | 4,492 | 17,495 | 27,607 | 2,237 | 8,548 | 106,659 | 5,991 | 837 | |||||||||||||||||||||||||||
|
Support equipment
|
717 | 338 | 967 | 1,321 | 95 | 137 | 3,575 | 888 | – | |||||||||||||||||||||||||||
|
Deferred exploratory wells
|
602 | 246 | 499 | 198 | 404 | 169 | 2,118 | – | – | |||||||||||||||||||||||||||
|
Other uncompleted projects
|
4,275 | 1,585 | 4,226 | 2,461 | 904 | 154 | 13,605 | 501 | 101 | |||||||||||||||||||||||||||
|
Gross Capitalized Costs
|
54,369 | 7,561 | 23,481 | 34,887 | 3,779 | 9,020 | 133,097 | 7,493 | 938 | |||||||||||||||||||||||||||
|
Unproved properties valuation
|
845 | 441 | 202 | 150 | 137 | (2 | ) | 1,773 | 29 | – | ||||||||||||||||||||||||||
|
Proved producing properties –
Depreciation and depletion
|
30,780 | 2,743 | 6,602 | 13,617 | 1,289 | 5,617 | 60,648 | 831 | 163 | |||||||||||||||||||||||||||
|
Support equipment depreciation
|
382 | 216 | 523 | 690 | 49 | 91 | 1,951 | 307 | – | |||||||||||||||||||||||||||
|
Accumulated provisions
|
32,007 | 3,400 | 7,327 | 14,457 | 1,475 | 5,706 | 64,372 | 1,167 | 163 | |||||||||||||||||||||||||||
|
Net Capitalized Costs
3
|
$ | 22,362 | $ | 4,161 | $ | 16,154 | $ | 20,430 | $ | 2,304 | $ | 3,314 | $ | 68,725 | $ | 6,326 | $ | 775 | ||||||||||||||||||
| 1 | Geographic presentation conformed to 2010 consistent with the presentation of the oil and gas reserve tables. |
| 2 | Amounts for Affiliated Companies – Other conformed to agreements entered in 2007 and 2008 for Venezuelan affiliates. |
| 3 | Excludes net capitalized costs for oil sands in Other Americas and heavy oil in affiliated Other, since 2008 precedes the update to Extractive Industries – Oil and Gas (Topic 932). |
FS-68
Table of Contents
Gas Producing Activities 1
| Consolidated Companies | Affiliated Companies | |||||||||||||||||||||||||||||||||||
| Other | ||||||||||||||||||||||||||||||||||||
| Millions of dollars | U.S. | Americas | Africa | Asia | Australia | Europe | Total | TCO | Other | |||||||||||||||||||||||||||
|
Year Ended December 31, 2010
|
||||||||||||||||||||||||||||||||||||
|
Revenues from net production
|
||||||||||||||||||||||||||||||||||||
|
Sales
|
$ | 2,540 | $ | 2,441 | $ | 2,278 | $ | 7,221 | $ | 994 | $ | 1,519 | $ | 16,993 | $ | 6,031 | $ | 1,307 | ||||||||||||||||||
|
Transfers
|
12,172 | 1,038 | 10,306 | 6,242 | 985 | 2,138 | 32,881 | – | – | |||||||||||||||||||||||||||
|
Total
|
14,712 | 3,479 | 12,584 | 13,463 | 1,979 | 3,657 | 49,874 | 6,031 | 1,307 | |||||||||||||||||||||||||||
|
Production expenses excluding taxes
|
(3,338 | ) | (805 | ) | (1,413 | ) | (2,996 | ) | (96 | ) | (534 | ) | (9,182 | ) | (347 | ) | (152 | ) | ||||||||||||||||||
|
Taxes other than on income
|
(542 | ) | (102 | ) | (130 | ) | (85 | ) | (334 | ) | (2 | ) | (1,195 | ) | (360 | ) | (101 | ) | ||||||||||||||||||
|
Proved producing properties:
|
||||||||||||||||||||||||||||||||||||
|
Depreciation and depletion
|
(3,639 | ) | (907 | ) | (2,204 | ) | (2,816 | ) | (151 | ) | (681 | ) | (10,398 | ) | (432 | ) | (131 | ) | ||||||||||||||||||
|
Accretion expense
2
|
(240 | ) | (23 | ) | (102 | ) | (35 | ) | (15 | ) | (53 | ) | (468 | ) | (8 | ) | (5 | ) | ||||||||||||||||||
|
Exploration expenses
|
(193 | ) | (173 | ) | (242 | ) | (289 | ) | (175 | ) | (75 | ) | (1,147 | ) | (5 | ) | – | |||||||||||||||||||
|
Unproved properties valuation
|
(123 | ) | (71 | ) | (25 | ) | (33 | ) | – | (2 | ) | (254 | ) | – | – | |||||||||||||||||||||
|
Other income (expense)
3
|
(154 | ) | (895 | ) | (103 | ) | (205 | ) | 109 | 165 | (1,083 | ) | (65 | ) | 191 | |||||||||||||||||||||
|
Results before income taxes
|
6,483 | 503 | 8,365 | 7,004 | 1,317 | 2,475 | 26,147 | 4,814 | 1,109 | |||||||||||||||||||||||||||
|
Income tax expense
|
(2,273 | ) | (304 | ) | (5,735 | ) | (3,844 | ) | (391 | ) | (1,477 | ) | (14,024 | ) | (1,445 | ) | (615 | ) | ||||||||||||||||||
|
Results of Producing Operations
|
$ | 4,210 | $ | 199 | $ | 2,630 | $ | 3,160 | $ | 926 | $ | 998 | $ | 12,123 | $ | 3,369 | $ | 494 | ||||||||||||||||||
|
Year Ended December 31, 2009
4
|
||||||||||||||||||||||||||||||||||||
|
Revenues from net production
|
||||||||||||||||||||||||||||||||||||
|
Sales
|
$ | 2,278 | $ | 918 | $ | 1,767 | $ | 5,648 | $ | 543 | $ | 1,712 | $ | 12,866 | $ | 4,043 | $ | 938 | ||||||||||||||||||
|
Transfers
|
9,133 | 1,555 | 7,304 | 4,926 | 765 | 1,546 | 25,229 | – | – | |||||||||||||||||||||||||||
|
Total
|
11,411 | 2,473 | 9,071 | 10,574 | 1,308 | 3,258 | 38,095 | 4,043 | 938 | |||||||||||||||||||||||||||
|
Production expenses excluding taxes
|
(3,281 | ) | (731 | ) | (1,345 | ) | (2,208 | ) | (94 | ) | (565 | ) | (8,224 | ) | (363 | ) | (240 | ) | ||||||||||||||||||
|
Taxes other than on income
|
(367 | ) | (90 | ) | (132 | ) | (53 | ) | (190 | ) | (4 | ) | (836 | ) | (50 | ) | (96 | ) | ||||||||||||||||||
|
Proved producing properties:
|
||||||||||||||||||||||||||||||||||||
|
Depreciation and depletion
|
(3,493 | ) | (486 | ) | (2,175 | ) | (2,279 | ) | (214 | ) | (898 | ) | (9,545 | ) | (381 | ) | (88 | ) | ||||||||||||||||||
|
Accretion expense
2
|
(194 | ) | (27 | ) | (66 | ) | (70 | ) | (2 | ) | (50 | ) | (409 | ) | (7 | ) | (3 | ) | ||||||||||||||||||
|
Exploration expenses
|
(451 | ) | (203 | ) | (236 | ) | (113 | ) | (224 | ) | (115 | ) | (1,342 | ) | – | – | ||||||||||||||||||||
|
Unproved properties valuation
|
(228 | ) | (28 | ) | (11 | ) | (44 | ) | – | – | (311 | ) | – | – | ||||||||||||||||||||||
|
Other income (expense)
3
|
156 | (508 | ) | 98 | (327 | ) | 350 | (182 | ) | (413 | ) | (131 | ) | 9 | ||||||||||||||||||||||
|
Results before income taxes
|
3,553 | 400 | 5,204 | 5,480 | 934 | 1,444 | 17,015 | 3,111 | 520 | |||||||||||||||||||||||||||
|
Income tax expense
|
(1,258 | ) | (203 | ) | (3,214 | ) | (2,921 | ) | (256 | ) | (901 | ) | (8,753 | ) | (935 | ) | (258 | ) | ||||||||||||||||||
|
Results of Producing Operations
|
$ | 2,295 | $ | 197 | $ | 1,990 | $ | 2,559 | $ | 678 | $ | 543 | $ | 8,262 | $ | 2,176 | $ | 262 | ||||||||||||||||||
| 1 | The value of owned production consumed in operations as fuel has been eliminated from revenues and production expenses, and the related volumes have been deducted from net production in calculating the unit average sales price and production cost. This has no effect on the results of producing operations. |
| 2 | Represents accretion of ARO liability. Refer to Note 25, “Asset Retirement Obligations,” on page FS-62. |
| 3 | Includes foreign currency gains and losses, gains and losses on property dispositions, and income from operating and technical service agreements. |
| 4 | Geographic presentation conformed to 2010 consistent with the presentation of the oil and gas reserve tables. |
FS-69
Table of Contents
Gas Producing Activities 1 - Continued
| Consolidated Companies | Affiliated Companies | |||||||||||||||||||||||||||||||||||
| Other | ||||||||||||||||||||||||||||||||||||
| Millions of dollars | U.S. | Americas | Africa | Asia | Australia | Europe | Total | TCO | Other | |||||||||||||||||||||||||||
|
Year Ended December 31, 2008
2
|
||||||||||||||||||||||||||||||||||||
|
Revenues from net production
|
||||||||||||||||||||||||||||||||||||
|
Sales
|
$ | 4,882 | $ | 1,088 | $ | 2,578 | $ | 7,969 | $ | 508 | $ | 2,938 | $ | 19,963 | $ | 4,971 | $ | 1,599 | ||||||||||||||||||
|
Transfers
|
12,868 | 1,286 | 8,373 | 7,179 | 1,499 | 2,365 | 33,570 | – | – | |||||||||||||||||||||||||||
|
Total
|
17,750 | 2,374 | 10,951 | 15,148 | 2,007 | 5,303 | 53,533 | 4,971 | 1,599 | |||||||||||||||||||||||||||
|
Production expenses excluding taxes
|
(3,822 | ) | (254 | ) | (1,228 | ) | (2,096 | ) | (95 | ) | (620 | ) | (8,115 | ) | (376 | ) | (125 | ) | ||||||||||||||||||
|
Taxes other than on income
|
(716 | ) | (42 | ) | (163 | ) | (263 | ) | (323 | ) | (5 | ) | (1,512 | ) | (41 | ) | (278 | ) | ||||||||||||||||||
|
Proved producing properties:
|
||||||||||||||||||||||||||||||||||||
|
Depreciation and depletion
|
(2,286 | ) | (402 | ) | (1,176 | ) | (2,299 | ) | (122 | ) | (928 | ) | (7,213 | ) | (237 | ) | (77 | ) | ||||||||||||||||||
|
Accretion expense
3
|
(242 | ) | (15 | ) | (60 | ) | (48 | ) | (5 | ) | (39 | ) | (409 | ) | (2 | ) | (1 | ) | ||||||||||||||||||
|
Exploration expenses
|
(370 | ) | (156 | ) | (223 | ) | (178 | ) | (148 | ) | (94 | ) | (1,169 | ) | – | – | ||||||||||||||||||||
|
Unproved properties valuation
|
(114 | ) | (7 | ) | (13 | ) | (36 | ) | (1 | ) | – | (171 | ) | – | – | |||||||||||||||||||||
|
Other income (expense)
4
|
707 | (227 | ) | (350 | ) | 198 | 36 | 509 | 873 | 184 | 105 | |||||||||||||||||||||||||
|
Results before income taxes
|
10,907 | 1,271 | 7,738 | 10,426 | 1,349 | 4,126 | 35,817 | 4,499 | 1,223 | |||||||||||||||||||||||||||
|
Income tax expense
|
(3,856 | ) | (591 | ) | (6,051 | ) | (5,697 | ) | (425 | ) | (2,425 | ) | (19,045 | ) | (1,357 | ) | (612 | ) | ||||||||||||||||||
|
Results of Producing Operations
5
|
$ | 7,051 | $ | 680 | $ | 1,687 | $ | 4,729 | $ | 924 | $ | 1,701 | $ | 16,772 | $ | 3,142 | $ | 611 | ||||||||||||||||||
| 1 | The value of owned production consumed in operations as fuel has been eliminated from revenues and production expenses, and the related volumes have been deducted from net production in calculating the unit average sales price and production cost. This has no effect on the results of producing operations. |
| 2 | Geographic presentation conformed to 2010 consistent with the presentation of the oil and gas reserve tables. |
| 3 | Represents accretion of ARO liability. Refer to Note 25, “Asset Retirement Obligations,” on page FS-62. |
| 4 | Includes foreign currency gains and losses, gains and losses on property dispositions, and income from operating and technical service agreements. |
| 5 | Excludes results of producing operations for oil sands in Other Americas and heavy oil in affiliated Other, since 2008 precedes the update to Extractive Industries – Oil and Gas (Topic 932). |
FS-70
Table of Contents
Gas Producing Activities - Unit Prices and Costs 1
| Consolidated Companies | Affiliated Companies | |||||||||||||||||||||||||||||||||||
| Other | ||||||||||||||||||||||||||||||||||||
| U.S. | Americas | Africa | Asia | Australia | Europe | Total | TCO | Other | ||||||||||||||||||||||||||||
|
Year Ended December 31, 2010
|
||||||||||||||||||||||||||||||||||||
|
Average sales prices
|
||||||||||||||||||||||||||||||||||||
|
Liquids, per barrel
|
$ | 71.59 | $ | 77.77 | $ | 78.00 | $ | 70.96 | $ | 76.43 | $ | 76.10 | $ | 74.02 | $ | 63.94 | $ | 64.92 | ||||||||||||||||||
|
Natural gas, per thousand cubic feet
|
4.25 | 2.52 | 0.73 | 4.45 | 6.76 | 7.09 | 4.55 | 1.41 | 4.20 | |||||||||||||||||||||||||||
|
Average production costs, per barrel
2
|
13.11 | 11.86 | 8.57 | 11.71 | 2.55 | 9.42 | 10.96 | 3.14 | 7.37 | |||||||||||||||||||||||||||
|
Year Ended December 31, 2009
3
|
||||||||||||||||||||||||||||||||||||
|
Average sales prices
|
||||||||||||||||||||||||||||||||||||
|
Liquids, per barrel
|
$ | 54.36 | $ | 65.28 | $ | 60.35 | $ | 54.76 | $ | 54.58 | $ | 57.19 | $ | 56.92 | $ | 47.33 | $ | 50.18 | ||||||||||||||||||
|
Natural gas, per thousand cubic feet
|
3.73 | 2.01 | 0.20 | 4.07 | 4.24 | 6.61 | 3.94 | 1.54 | 1.85 | |||||||||||||||||||||||||||
|
Average production costs, per barrel
2
|
12.71 | 12.04 | 8.85 | 8.82 | 2.57 | 8.87 | 9.97 | 3.71 | 12.42 | |||||||||||||||||||||||||||
|
Year Ended December 31, 2008
3
|
||||||||||||||||||||||||||||||||||||
|
Average sales prices
|
||||||||||||||||||||||||||||||||||||
|
Liquids, per barrel
|
$ | 88.43 | $ | 71.45 | $ | 91.71 | $ | 83.67 | $ | 90.50 | $ | 93.74 | $ | 87.44 | $ | 79.11 | $ | 69.65 | ||||||||||||||||||
|
Natural gas, per thousand cubic feet
|
7.90 | 2.84 | – | 4.55 | 7.22 | 9.84 | 6.02 | 1.56 | 3.98 | |||||||||||||||||||||||||||
|
Average production costs, per barrel
2,4
|
15.85 | 4.67 | 10.00 | 8.12 | 2.89 | 9.59 | 10.49 | 5.24 | 5.32 | |||||||||||||||||||||||||||
| 1 | The value of owned production consumed in operations as fuel has been eliminated from revenues and production expenses, and the related volumes have been deducted from net production in calculating the unit average sales price and production cost. This has no effect on the results of producing operations. |
| 2 | Natural gas converted to oil-equivalent gas (OEG) barrels at a rate of 6 MCF = 1 OEG barrel. |
| 3 | Geographic presentation conformed to 2010 consistent with the presentation of the oil and gas reserve tables. |
| 4 | Excludes oil sands in Other Americas and heavy oil in affiliated Other, since 2008 precedes the update to Extractive Industries – Oil and Gas (Topic 932). |
FS-71
Table of Contents
| 2010 1 | 2009 1,2 | 2008 2,3 | ||||||||||||||||||||||||||||||
| Crude Oil | Crude Oil | Crude Oil | ||||||||||||||||||||||||||||||
| Liquids and Synthetic Oil in Millions of Barrels | Condensate | Synthetic | Natural | Condensate | Synthetic | Natural | Condensate | Natural | ||||||||||||||||||||||||
| Natural Gas in Billions of Cubic Feet | NGLs | Oil | Gas | NGLs | Oil | Gas | NGLs | Gas | ||||||||||||||||||||||||
|
Proved Developed
|
||||||||||||||||||||||||||||||||
|
Consolidated Companies
|
||||||||||||||||||||||||||||||||
|
U.S.
|
1,045 | – | 2,113 | 1,122 | – | 2,314 | 1,158 | 2,709 | ||||||||||||||||||||||||
|
Other Americas
|
84 | 352 | 1,490 | 66 | 190 | 1,678 | 77 | 1,853 | ||||||||||||||||||||||||
|
Africa
|
830 | – | 1,304 | 820 | – | 978 | 789 | 1,209 | ||||||||||||||||||||||||
|
Asia
|
826 | – | 4,836 | 926 | – | 5,062 | 1,094 | 4,758 | ||||||||||||||||||||||||
|
Australia
|
39 | – | 881 | 50 | – | 1,071 | 46 | 918 | ||||||||||||||||||||||||
|
Europe
|
136 | – | 235 | 151 | – | 302 | 172 | 392 | ||||||||||||||||||||||||
|
Total Consolidated
|
2,960 | 352 | 10,859 | 3,135 | 190 | 11,405 | 3,336 | 11,839 | ||||||||||||||||||||||||
|
Affiliated Companies
|
||||||||||||||||||||||||||||||||
|
TCO
|
1,128 | – | 1,484 | 1,256 | – | 1,830 | 1,369 | 1,999 | ||||||||||||||||||||||||
|
Other
|
95 | 53 | 70 | 97 | 56 | 73 | 263 | 124 | ||||||||||||||||||||||||
|
Total
Consolidated and Affiliated Companies
|
4,183 | 405 | 12,413 | 4,488 | 246 | 13,308 | 4,968 | 13,962 | ||||||||||||||||||||||||
|
Proved Undeveloped
|
||||||||||||||||||||||||||||||||
|
Consolidated Companies
|
||||||||||||||||||||||||||||||||
|
U.S.
|
230 | – | 359 | 239 | – | 384 | 312 | 441 | ||||||||||||||||||||||||
|
Other Americas
|
24 | 114 | 325 | 38 | 270 | 307 | 72 | 515 | ||||||||||||||||||||||||
|
Africa
|
338 | – | 1,640 | 426 | – | 2,043 | 596 | 1,847 | ||||||||||||||||||||||||
|
Asia
|
187 | – | 2,357 | 245 | – | 2,798 | 362 | 3,238 | ||||||||||||||||||||||||
|
Australia
|
49 | – | 5,175 | 48 | – | 5,174 | 27 | 1,044 | ||||||||||||||||||||||||
|
Europe
|
16 | – | 40 | 19 | – | 42 | 30 | 98 | ||||||||||||||||||||||||
|
Total Consolidated
|
844 | 114 | 9,896 | 1,015 | 270 | 10,748 | 1,399 | 7,183 | ||||||||||||||||||||||||
|
Affiliated Companies
|
||||||||||||||||||||||||||||||||
|
TCO
|
692 | – | 902 | 690 | – | 1,003 | 807 | 1,176 | ||||||||||||||||||||||||
|
Other
|
62 | 203 | 1,040 | 54 | 210 | 990 | 176 | 754 | ||||||||||||||||||||||||
|
Total Consolidated and Affiliated Companies
|
1,598 | 317 | 11,838 | 1,759 | 480 | 12,741 | 2,382 | 9,113 | ||||||||||||||||||||||||
|
Total Proved Reserves
|
5,781 | 722 | 24,251 | 6,247 | 726 | 26,049 | 7,350 | 23,075 | ||||||||||||||||||||||||
| 1 | Based on 12-month average price. |
| 2 | Geographic presentation conformed to 2010. |
| 3 | Based on year-end prices. |
FS-72
Table of Contents
FS-73
Table of Contents
FS-74
Table of Contents
| Total | ||||||||||||||||||||||||||||||||||||||||||||||||
| Consolidated Companies | Affiliated Companies | Consolidated | ||||||||||||||||||||||||||||||||||||||||||||||
| Other | Synthetic | Synthetic | and Affiliated | |||||||||||||||||||||||||||||||||||||||||||||
| Millions of barrels | U.S. | Americas | 1 | Africa | Asia | Australia | Europe | Oil | 2,3 | Total | TCO | Oil | 2,4 | Other | 5 | Companies | ||||||||||||||||||||||||||||||||
|
Reserves at January 1, 2008
6
|
1,624 | 165 | 1,500 | 1,023 | 84 | 269 | 4,665 | 1,989 | 433 | 7,087 | ||||||||||||||||||||||||||||||||||||||
|
Changes attributable to:
|
||||||||||||||||||||||||||||||||||||||||||||||||
|
Revisions
|
(16 | ) | (1 | ) | 2 | 574 | 1 | (24 | ) | 536 | 249 | 18 | 803 | |||||||||||||||||||||||||||||||||||
|
Improved recovery
|
5 | 3 | 1 | 18 | – | – | 27 | – | 10 | 37 | ||||||||||||||||||||||||||||||||||||||
|
Extensions and discoveries
|
17 | 8 | 3 | 5 | – | – | 33 | – | – | 33 | ||||||||||||||||||||||||||||||||||||||
|
Purchases
|
1 | – | – | – | – | – | 1 | – | – | 1 | ||||||||||||||||||||||||||||||||||||||
|
Sales
7
|
(7 | ) | – | – | – | – | – | (7 | ) | – | – | (7 | ) | |||||||||||||||||||||||||||||||||||
|
Production
|
(154 | ) | (26 | ) | (121 | ) | (164 | ) | (12 | ) | (43 | ) | (520 | ) | (62 | ) | (22 | ) | (604 | ) | ||||||||||||||||||||||||||||
|
Reserves at December 31, 2008
6,8
|
1,470 | 149 | 1,385 | 1,456 | 73 | 202 | – | 4,735 | 2,176 | – | 439 | 7,350 | ||||||||||||||||||||||||||||||||||||
|
Changes attributable to:
|
||||||||||||||||||||||||||||||||||||||||||||||||
|
Revisions
|
63 | (29 | ) | (46 | ) | (121 | ) | 18 | 10 | 460 | 355 | (184 | ) | 266 | (269 | ) | 168 | |||||||||||||||||||||||||||||||
|
Improved recovery
|
2 | – | 48 | – | – | – | – | 50 | 36 | – | – | 86 | ||||||||||||||||||||||||||||||||||||
|
Extensions and discoveries
|
6 | 13 | 10 | 3 | 20 | – | – | 52 | – | – | – | 52 | ||||||||||||||||||||||||||||||||||||
|
Purchases
|
– | – | – | – | – | – | – | – | – | – | – | – | ||||||||||||||||||||||||||||||||||||
|
Sales
|
(3 | ) | (6 | ) | – | – | – | – | – | (9 | ) | – | – | – | (9 | ) | ||||||||||||||||||||||||||||||||
|
Production
|
(177 | ) | (23 | ) | (151 | ) | (167 | ) | (13 | ) | (42 | ) | – | (573 | ) | (82 | ) | – | (19 | ) | (674 | ) | ||||||||||||||||||||||||||
|
Reserves
at December 31, 2009
6,8
|
1,361 | 104 | 1,246 | 1,171 | 98 | 170 | 460 | 4,610 | 1,946 | 266 | 151 | 6,973 | ||||||||||||||||||||||||||||||||||||
|
Changes attributable to:
|
||||||||||||||||||||||||||||||||||||||||||||||||
|
Revisions
|
63 | 12 | 17 | (26 | ) | 3 | 19 | 15 | 103 | (33 | ) | – | 12 | 82 | ||||||||||||||||||||||||||||||||||
|
Improved recovery
|
11 | 3 | 58 | 2 | – | – | – | 74 | – | – | 3 | 77 | ||||||||||||||||||||||||||||||||||||
|
Extensions and discoveries
|
19 | 19 | 9 | 16 | – | – | – | 63 | – | – | – | 63 | ||||||||||||||||||||||||||||||||||||
|
Purchases
|
– | – | – | 11 | – | – | – | 11 | – | – | – | 11 | ||||||||||||||||||||||||||||||||||||
|
Sales
|
(1 | ) | – | – | – | – | – | – | (1 | ) | – | – | – | (1 | ) | |||||||||||||||||||||||||||||||||
|
Production
|
(178 | ) | (30 | ) | (162 | ) | (161 | ) | (13 | ) | (37 | ) | (9 | ) | (590 | ) | (93 | ) | (10 | ) | (9 | ) | (702 | ) | ||||||||||||||||||||||||
|
Reserves at December 31, 2010
8
|
1,275 | 108 | 1,168 | 1,013 | 88 | 152 | 466 | 4,270 | 1,820 | 256 | 157 | 6,503 | ||||||||||||||||||||||||||||||||||||
| 1 | Ending reserve balances in North America and South America were 14, 12, 19 and 94, 92, 130 in 2010, 2009 and 2008, respectively. |
| 2 | Prospective reporting effective December 31, 2009. |
| 3 | Reserves associated with Canada. |
| 4 | Reserves associated with Venezuela that were reported in affiliated other as heavy oil in 2008. |
| 5 | Ending reserve balances in Africa and South America were 36, 31, 19 and 121, 120, 420 in 2010, 2009 and 2008, respectively. |
| 6 | Geographic presentation conformed to 2010. |
| 7 | Includes reserves disposed of through nonmonetary transactions. |
| 8 | Included are year-end reserve quantities related to production-sharing contracts (PSC) (refer to page E-25 for the definition of a PSC). PSC-related reserve quantities are 24 percent, 26 percent and 32 percent for consolidated companies for 2010, 2009 and 2008, respectively. |
FS-75
Table of Contents
FS-76
Table of Contents
| Total | ||||||||||||||||||||||||||||||||||||||||
| Consolidated Companies | Affiliated Companies | Consolidated | ||||||||||||||||||||||||||||||||||||||
| Other | and Affiliated | |||||||||||||||||||||||||||||||||||||||
| Billions of cubic feet (BCF) | U.S. | Americas 1 | Africa | Asia | Australia | Europe | Total | TCO | Other 2 | Companies | ||||||||||||||||||||||||||||||
|
Reserves
at January 1,
2008
3
|
3,677 | 2,378 | 3,049 | 7,207 | 2,105 | 721 | 19,137 | 2,748 | 255 | 22,140 | ||||||||||||||||||||||||||||||
|
Changes attributable to:
|
||||||||||||||||||||||||||||||||||||||||
|
Revisions
|
(28 | ) | 154 | 60 | 1,073 | (5 | ) | (88 | ) | 1,166 | 498 | 632 | 2,296 | |||||||||||||||||||||||||||
|
Improved recovery
|
– | – | – | – | – | – | – | – | – | – | ||||||||||||||||||||||||||||||
|
Extensions and discoveries
|
108 | 1 | – | 23 | – | – | 132 | – | – | 132 | ||||||||||||||||||||||||||||||
|
Purchases
|
66 | – | – | 441 | – | – | 507 | – | – | 507 | ||||||||||||||||||||||||||||||
|
Sales
4
|
(124 | ) | – | – | – | – | – | (124 | ) | – | – | (124 | ) | |||||||||||||||||||||||||||
|
Production
5
|
(549 | ) | (165 | ) | (53 | ) | (748 | ) | (138 | ) | (143 | ) | (1,796 | ) | (71 | ) | (9 | ) | (1,876 | ) | ||||||||||||||||||||
|
Reserves
at December 31,
2008
3,6
|
3,150 | 2,368 | 3,056 | 7,996 | 1,962 | 490 | 19,022 | 3,175 | 878 | 23,075 | ||||||||||||||||||||||||||||||
|
Changes attributable to:
|
||||||||||||||||||||||||||||||||||||||||
|
Revisions
|
39 | (126 | ) | 4 | 493 | 166 | (7 | ) | 569 | (237 | ) | 193 | 525 | |||||||||||||||||||||||||||
|
Improved recovery
|
– | – | – | – | – | – | – | – | – | – | ||||||||||||||||||||||||||||||
|
Extensions and discoveries
|
53 | 1 | 3 | 54 | 4,276 | – | 4,387 | – | – | 4,387 | ||||||||||||||||||||||||||||||
|
Purchases
|
– | – | – | – | – | – | – | – | – | – | ||||||||||||||||||||||||||||||
|
Sales
|
(33 | ) | (84 | ) | – | – | – | – | (117 | ) | – | – | (117 | ) | ||||||||||||||||||||||||||
|
Production
5
|
(511 | ) | (174 | ) | (42 | ) | (683 | ) | (159 | ) | (139 | ) | (1,708 | ) | (105 | ) | (8 | ) | (1,821 | ) | ||||||||||||||||||||
|
Reserves
at December 31,
2009
3,6
|
2,698 | 1,985 | 3,021 | 7,860 | 6,245 | 344 | 22,153 | 2,833 | 1,063 | 26,049 | ||||||||||||||||||||||||||||||
|
Changes attributable to:
|
||||||||||||||||||||||||||||||||||||||||
|
Revisions
|
220 | 4 | (20 | ) | (31 | ) | (22 | ) | 46 | 197 | (324 | ) | 56 | (71 | ) | |||||||||||||||||||||||||
|
Improved recovery
|
1 | 1 | – | – | – | – | 2 | – | – | 2 | ||||||||||||||||||||||||||||||
|
Extensions and discoveries
|
36 | 4 | – | 59 | – | 11 | 110 | – | – | 110 | ||||||||||||||||||||||||||||||
|
Purchases
|
3 | – | – | 4 | – | – | 7 | – | – | 7 | ||||||||||||||||||||||||||||||
|
Sales
|
(7 | ) | – | – | – | – | – | (7 | ) | – | – | (7 | ) | |||||||||||||||||||||||||||
|
Production
5
|
(479 | ) | (179 | ) | (57 | ) | (699 | ) | (167 | ) | (126 | ) | (1,707 | ) | (123 | ) | (9 | ) | (1,839 | ) | ||||||||||||||||||||
|
Reserves at December 31, 2010
6
|
2,472 | 1,815 | 2,944 | 7,193 | 6,056 | 275 | 20,755 | 2,386 | 1,110 | 24,251 | ||||||||||||||||||||||||||||||
| 1 | Ending reserve balances in North America and South America were 21, 23, 24 and 1,794, 1,962 and 2,344 in 2010, 2009 and 2008, respectively. |
| 2 | Ending reserve balances in Africa and South America were 953, 898, 700 and 157, 165, 178 in 2010, 2009 and 2008, respectively. |
| 3 | Geographic presentation conformed to 2010. |
| 4 | Includes reserves disposed of through nonmonetary transactions. |
| 5 | Total “as sold” volumes are 4.5 BCF, 4.5 BCF and 4.6 BCF for 2010, 2009 and 2008, respectively. |
| 6 |
Includes reserve quantities related to production-sharing contracts (PSC) (refer to page E-25 for the definition of a PSC). PSC-related reserve quantities are 29 percent, 31 percent and 40 percent for consolidated companies for 2010, 2009 and 2008, respectively.
|
FS-77
Table of Contents
FS-78
Table of Contents
Flows Related to Proved Oil and Gas Reserves
| Consolidated Companies | Affiliated Companies |
Total
Consolidated |
||||||||||||||||||||||||||||||||||||||
| Other | and Affiliated | |||||||||||||||||||||||||||||||||||||||
| Millions of dollars | U.S. | Americas | Africa | Asia | Australia | Europe | Total | TCO | Other | Companies | ||||||||||||||||||||||||||||||
|
At December 31, 2010
|
||||||||||||||||||||||||||||||||||||||||
|
Future cash inflows from production
1
|
$ | 101,281 | $ | 48,068 | $ | 90,402 | $ | 101,553 | $ | 52,635 | $ | 13,618 | $ | 407,557 | $ | 124,970 | $ | 31,188 | $ | 563,715 | ||||||||||||||||||||
|
Future production costs
|
(36,609 | ) | (22,118 | ) | (19,591 | ) | (30,793 | ) | (9,191 | ) | (5,842 | ) | (124,144 | ) | (7,298 | ) | (4,172 | ) | (135,614 | ) | ||||||||||||||||||||
|
Future development costs
|
(6,661 | ) | (6,953 | ) | (12,239 | ) | (11,690 | ) | (13,160 | ) | (708 | ) | (51,411 | ) | (8,777 | ) | (2,254 | ) | (62,442 | ) | ||||||||||||||||||||
|
Future income taxes
|
(20,307 | ) | (7,337 | ) | (34,405 | ) | (26,355 | ) | (9,085 | ) | (4,031 | ) | (101,520 | ) | (30,763 | ) | (12,919 | ) | (145,202 | ) | ||||||||||||||||||||
|
Undiscounted future net cash flows
|
37,704 | 11,660 | 24,167 | 32,715 | 21,199 | 3,037 | 130,482 | 78,132 | 11,843 | 220,457 | ||||||||||||||||||||||||||||||
|
10 percent midyear annual discount
for timing of estimated cash flows |
(13,218 | ) | (6,751 | ) | (9,221 | ) | (12,287 | ) | (15,282 | ) | (699 | ) | (57,458 | ) | (43,973 | ) | (6,574 | ) | (108,005 | ) | ||||||||||||||||||||
|
Standardized Measure
Net Cash Flows |
$ | 24,486 | 4,909 | $ | 14,946 | $ | 20,428 | $ | 5,917 | $ | 2,338 | $ | 73,024 | $ | 34,159 | $ | 5,269 | $ | 112,452 | |||||||||||||||||||||
|
At December 31, 2009
|
||||||||||||||||||||||||||||||||||||||||
|
Future cash inflows from production
2
|
$ | 81,332 | $ | 39,251 | $ | 75,338 | $ | 91,993 | $ | 49,875 | $ | 11,988 | $ | 349,777 | $ | 97,793 | $ | 23,825 | $ | 471,395 | ||||||||||||||||||||
|
Future production costs
|
(35,295 | ) | (27,716 | ) | (22,459 | ) | (31,843 | ) | (8,648 | ) | (5,842 | ) | (131,803 | ) | (6,923 | ) | (4,765 | ) | (143,491 | ) | ||||||||||||||||||||
|
Future development costs
|
(7,027 | ) | (3,711 | ) | (14,715 | ) | (12,884 | ) | (12,371 | ) | (561 | ) | (51,269 | ) | (8,190 | ) | (3,986 | ) | (63,445 | ) | ||||||||||||||||||||
|
Future income taxes
|
(13,662 | ) | (3,674 | ) | (22,503 | ) | (18,905 | ) | (10,484 | ) | (3,269 | ) | (72,497 | ) | (23,357 | ) | (7,774 | ) | (103,628 | ) | ||||||||||||||||||||
|
Undiscounted future net cash flows
|
25,348 | 4,150 | 15,661 | 28,361 | 18,372 | 2,316 | 94,208 | 59,323 | 7,300 | 160,831 | ||||||||||||||||||||||||||||||
|
10 percent midyear annual discount
for timing of estimated cash flows |
(8,822 | ) | (2,275 | ) | (5,882 | ) | (11,722 | ) | (14,764 | ) | (467 | ) | (43,932 | ) | (34,937 | ) | (4,450 | ) | (83,319 | ) | ||||||||||||||||||||
|
Standardized Measure
Net Cash Flows |
$ | 16,526 | 1,875 | $ | 9,779 | $ | 16,639 | $ | 3,608 | $ | 1,849 | $ | 50,276 | $ | 24,386 | $ | 2,850 | $ | 77,512 | |||||||||||||||||||||
|
At December 31, 2008
|
||||||||||||||||||||||||||||||||||||||||
|
Future cash inflows from production
2
|
$ | 66,174 | $ | 12,051 | $ | 52,344 | $ | 75,855 | $ | 14,368 | $ | 10,989 | $ | 231,781 | $ | 51,252 | $ | 13,968 | $ | 297,001 | ||||||||||||||||||||
|
Future production costs
|
(45,738 | ) | (3,369 | ) | (20,302 | ) | (33,817 | ) | (5,989 | ) | (6,005 | ) | (115,220 | ) | (14,502 | ) | (2,319 | ) | (132,041 | ) | ||||||||||||||||||||
|
Future development costs
|
(6,099 | ) | (1,367 | ) | (19,001 | ) | (15,298 | ) | (909 | ) | (1,132 | ) | (43,806 | ) | (10,140 | ) | (1,551 | ) | (55,497 | ) | ||||||||||||||||||||
|
Future income taxes
|
(5,091 | ) | (3,095 | ) | (9,581 | ) | (10,278 | ) | (2,241 | ) | (2,257 | ) | (32,543 | ) | (7,517 | ) | (5,223 | ) | (45,283 | ) | ||||||||||||||||||||
|
Undiscounted future net cash flows
|
9,246 | 4,220 | 3,460 | 16,462 | 5,229 | 1,595 | 40,212 | 19,093 | 4,875 | 64,180 | ||||||||||||||||||||||||||||||
|
10 percent midyear annual discount
for timing of estimated cash flows |
(2,318 | ) | (1,406 | ) | (1,139 | ) | (7,042 | ) | (2,455 | ) | (191 | ) | (14,551 | ) | (11,261 | ) | (2,966 | ) | (28,778 | ) | ||||||||||||||||||||
|
Standardized Measure
Net Cash Flows |
$ | 6,928 | $ | 2,814 | $ | 2,321 | $ | 9,420 | $ | 2,774 | $ | 1,404 | $ | 25,661 | $ | 7,832 | $ | 1,909 | $ | 35,402 | ||||||||||||||||||||
| 1 | Based on 12-month average price. |
| 2 | Based on year-end prices. |
FS-79
Table of Contents
Future Net Cash Flows From Proved Reserves
| Total | ||||||||||||
| Consolidated | ||||||||||||
| and Affiliated | ||||||||||||
| Millions of dollars | Consolidated Companies | Affiliated Companies | Companies | |||||||||
|
Present
Value at January 1, 2008
|
$ | 97,049 | $ | 41,758 | $ | 138,807 | ||||||
|
Sales and transfers of oil and gas produced net of production costs
|
(43,906 | ) | (5,750 | ) | (49,656 | ) | ||||||
|
Development costs incurred
|
13,682 | 763 | 14,445 | |||||||||
|
Purchases of reserves
|
233 | – | 233 | |||||||||
|
Sales of reserves
|
(542 | ) | – | (542 | ) | |||||||
|
Extensions, discoveries and improved recovery less related costs
|
646 | 83 | 729 | |||||||||
|
Revisions of previous quantity estimates
|
37,853 | 3,718 | 41,571 | |||||||||
|
Net changes in prices, development and production costs
|
(169,046 | ) | (51,696 | ) | (220,742 | ) | ||||||
|
Accretion of discount
|
17,458 | 5,976 | 23,434 | |||||||||
|
Net change in income tax
|
72,234 | 14,889 | 87,123 | |||||||||
|
Net change for 2008
|
(71,388 | ) | (32,017 | ) | (103,405 | ) | ||||||
|
Present
Value at December 31, 2008
|
$ | 25,661 | $ | 9,741 | $ | 35,402 | ||||||
|
Sales and transfers of oil and gas produced net of production costs
|
(27,559 | ) | (4,209 | ) | (31,768 | ) | ||||||
|
Development costs incurred
|
10,791 | 335 | 11,126 | |||||||||
|
Purchases of reserves
|
– | – | – | |||||||||
|
Sales of reserves
|
(285 | ) | – | (285 | ) | |||||||
|
Extensions, discoveries and improved recovery less related costs
|
3,438 | 697 | 4,135 | |||||||||
|
Revisions of previous quantity estimates
|
3,230 | (4,343 | ) | (1,113 | ) | |||||||
|
Net changes in prices, development and production costs
|
51,528 | 30,915 | 82,443 | |||||||||
|
Accretion of discount
|
4,282 | 1,412 | 5,694 | |||||||||
|
Net change in income tax
|
(20,810 | ) | (7,312 | ) | (28,122 | ) | ||||||
|
Net change for 2009
|
24,615 | 17,495 | 42,110 | |||||||||
|
Present
Value at December 31, 2009
|
$ | 50,276 | $ | 27,236 | $ | 77,512 | ||||||
|
Sales and transfers of oil and gas produced net of production costs
|
(39,499 | ) | (6,377 | ) | (45,876 | ) | ||||||
|
Development costs incurred
|
12,042 | 572 | 12,614 | |||||||||
|
Purchases of reserves
|
513 | – | 513 | |||||||||
|
Sales of reserves
|
(47 | ) | – | (47 | ) | |||||||
|
Extensions, discoveries and improved recovery less related costs
|
5,194 | 63 | 5,257 | |||||||||
|
Revisions of previous quantity estimates
|
10,156 | 974 | 11,130 | |||||||||
|
Net changes in prices, development and production costs
|
43,887 | 19,878 | 63,765 | |||||||||
|
Accretion of discount
|
8,391 | 3,797 | 12,188 | |||||||||
|
Net change in income tax
|
(17,889 | ) | (6,715 | ) | (24,604 | ) | ||||||
|
Net change for 2010
|
22,748 | 12,192 | 34,940 | |||||||||
|
Present
Value at December 31, 2010
|
$ | 73,024 | $ | 39,428 | $ | 112,452 | ||||||
FS-80
Table of Contents
| Exhibit No. | Description | |
|
3.1
|
Restated Certificate of Incorporation of Chevron Corporation, dated May 30, 2008, filed as Exhibit 3.1 to Chevron Corporation’s Quarterly Report on Form 10-Q for the quarterly period ended June 30, 2008, and incorporated herein by reference. | |
|
3.2
|
By-Laws of Chevron Corporation, as amended September 29, 2010, filed as Exhibit 3.1 to Chevron Corporation’s Current Report on Form 8-K dated September 30, 2010, and incorporated herein by reference. | |
|
4.1
|
Pursuant to the Instructions to Exhibits, certain instruments defining the rights of holders of long-term debt securities of the company and its consolidated subsidiaries are not filed because the total amount of securities authorized under any such instrument does not exceed 10 percent of the total assets of the corporation and its subsidiaries on a consolidated basis. A copy of such instrument will be furnished to the Commission upon request. | |
|
4.2
|
Confidential Stockholder Voting Policy of Chevron Corporation, filed as Exhibit 4.2 to Chevron Corporation’s Annual Report on Form 10-K for the year ended December 31, 2008, and incorporated herein by reference. | |
|
10.1
|
Chevron Corporation Non-Employee Directors’ Equity Compensation and Deferral Plan, filed as Exhibit 10.1 to Chevron Corporation’s Annual Report on Form 10-K for the year ended December 31, 2008, and incorporated herein by reference. | |
|
10.2
|
Chevron Incentive Plan, filed as Exhibit 10.2 to Chevron Corporation’s Annual Report on Form 10-K for the year ended December 31, 2008, and incorporated herein by reference. | |
|
10.3
|
Long-Term Incentive Plan of Chevron Corporation, filed as Exhibit 10.3 to Chevron Corporation’s Annual Report on Form 10-K for the year ended December 31, 2008, and incorporated herein by reference. | |
|
10.4
|
Chevron Corporation Deferred Compensation Plan for Management Employees, as amended and restated on December 7, 2005, filed as Exhibit 10.5 to Chevron Corporation’s Current Report on Form 8-K dated December 13, 2005, and incorporated herein by reference. | |
|
10.5
|
Chevron Corporation Deferred Compensation Plan for Management Employees II, filed as Exhibit 10.5 to Chevron Corporation’s Annual Report on Form 10-K for the year ended December 31, 2008, and incorporated herein by reference. | |
|
10.6
|
Chevron Corporation Retirement Restoration Plan, filed as Exhibit 10.6 to Chevron Corporation’s Annual Report on Form 10-K for the year ended December 31, 2008, and incorporated herein by reference. | |
|
10.7
|
Chevron Corporation ESIP Restoration Plan, filed as Exhibit 10.7 to Chevron Corporation’s Annual Report on Form 10-K for the year ended December 31, 2008, and incorporated herein by reference. | |
|
10.8
|
Texaco Inc. Stock Incentive Plan, adopted May 9, 1989, as amended May 13, 1993, and May 13, 1997, filed as Exhibit 10.13 to Chevron Corporation’s Annual Report on Form 10-K for the year ended December 31, 2001, and incorporated herein by reference. | |
|
10.9
|
Supplemental Pension Plan of Texaco Inc., dated June 26, 1975, filed as Exhibit 10.14 to Chevron Corporation’s Annual Report on Form 10-K for the year ended December 31, 2001, and incorporated herein by reference. | |
|
10.10
|
Supplemental Bonus Retirement Plan of Texaco Inc., dated May 1, 1981, filed as Exhibit 10.15 to Chevron Corporation’s Annual Report on Form 10-K for the year ended December 31, 2001, and incorporated herein by reference. | |
|
10.11
|
Texaco Inc. Director and Employee Deferral Plan approved March 28, 1997, filed as Exhibit 10.16 to Chevron Corporation’s Annual Report on Form 10-K for the year ended December 31, 2001, and incorporated herein by reference. | |
|
10.12
|
Summary of Chevron Incentive Plan Award Criteria, filed as Exhibit 10.13 to Chevron Corporation’s Annual Report on Form 10-K for the year ended December 31, 2008, and incorporated herein by reference. | |
|
10.13
|
Chevron Corporation Change in Control Surplus Employee Severance Program for Salary Grades 41 through 43, filed as Exhibit 10.1 to Chevron Corporation’s Current Report on Form 8-K dated December 6, 2006, and incorporated herein by reference. | |
|
10.14
|
Chevron Corporation Benefit Protection Program, filed as Exhibit 10.2 to Chevron Corporation’s Current Report on Form 8-K dated December 6, 2006, and incorporated herein by reference. | |
|
10.15
|
Form of Terms and Conditions for Awards under the Long-Term Incentive Plan of Chevron Corporation, filed as Exhibit 10.1 to Chevron Corporation’s Current Report on Form 8-K dated February 1, 2011, and incorporated herein by reference. |
E-1
Table of Contents
| Exhibit No. | Description | |
|
10.16
|
Form of Restricted Stock Unit Grant Agreement under the Long-Term Incentive Plan of Chevron Corporation, filed as Exhibit 10.16 to Chevron Corporation’s Annual Report on Form 10-K for the year ended December 31, 2009, and incorporated herein by reference. | |
|
10.17
|
Form of Retainer Stock Option Agreement under the Chevron Corporation Non-Employee Directors’ Equity Compensation and Deferral Plan, filed as Exhibit 10.17 to Chevron Corporation’s Annual Report on Form 10-K for the year ended December 31, 2009, and incorporated herein by reference. | |
|
10.18
|
Form of Stock Units Agreement under the Chevron Corporation Non-Employee Directors’ Equity Compensation and Deferral Plan, filed as Exhibit 10.19 to Chevron Corporation’s Annual Report on Form 10-K for the year ended December 31, 2008, and incorporated herein by reference. | |
|
10.19
|
Employment Agreement, dated October 3, 2002, between Chevron Corporation and Charles A. James, filed as Exhibit 10.19 to Chevron Corporation’s Annual Report on Form 10-K for the year ended December 31, 2009, and incorporated herein by reference. | |
|
10.20
|
Termination Agreement, dated January 5, 2010, between Chevron Corporation and Charles A. James, filed as Exhibit 10.20 to Chevron Corporation’s Annual Report on Form 10-K for the year ended December 31, 2009, and incorporated herein by reference. | |
|
12.1*
|
Computation of Ratio of Earnings to Fixed Charges (page E-3). | |
|
21.1*
|
Subsidiaries of Chevron Corporation (pages E-4 through E-5). | |
|
23.1*
|
Consent of PricewaterhouseCoopers LLP (page E-6). | |
|
24.1 to 24.14*
|
Powers of Attorney for directors and certain officers of Chevron Corporation, authorizing the signing of the Annual Report on Form 10-K on their behalf. | |
|
31.1*
|
Rule 13a-14(a)/15d-14(a) Certification of the company’s Chief Executive Officer (page E-21). | |
|
31.2*
|
Rule 13a-14(a)/15d-14(a) Certification of the company’s Chief Financial Officer (page E-22). | |
|
32.1*
|
Section 1350 Certification of the company’s Chief Executive Officer (page E-23). | |
|
32.2*
|
Section 1350 Certification of the company’s Chief Financial Officer (page E-24). | |
|
99.1*
|
Definitions of Selected Energy and Financial Terms (pages E-25 through E-27). | |
|
99.2*
|
Mine Safety Disclosure. | |
|
101.INS*
|
XBRL Instance Document. | |
|
101.SCH*
|
XBRL Schema Document. | |
|
101.CAL*
|
XBRL Calculation Linkbase Document. | |
|
101.LAB*
|
XBRL Label Linkbase Document. | |
|
101.PRE*
|
XBRL Presentation Linkbase Document. | |
|
101.DEF*
|
XBRL Definition Linkbase Document. |
| * | Filed herewith. |
E-2