|
|
|
|
|
|
|
|
|
|
|
|
|
|
|
|
|
|
|
|
|
|
|
|
|
|
|
|
|
|
|
|
|
|
|
|
|
|
|
|
|
|
|
|
|
|
|
|
|
|
|
|
|
|
|
|
|
|
|
Table of Contents
| Delaware | 94-0890210 |
6001 Bollinger Canyon Road,
San Ramon, California 94583-2324 |
||
|
|
|
|
||
|
(State or other jurisdiction of
incorporation or organization) |
(I.R.S. Employer
Identification No.) |
(Address of principal executive offices) (Zip Code) |
|
Title of Each Class |
Name of Each Exchange
on Which Registered |
|
|
|
|
Yes þ No o
Yes o No þ
Yes þ No o
|
Large
accelerated filer
þ
|
Accelerated filer o |
Non-accelerated filer
o
(Do not check if a smaller reporting company) |
Smaller reporting company o |
| Item | Page No. | |||||||
| 3 | ||||||||
| 3 | ||||||||
| 4 | ||||||||
|
|
4 | |||||||
|
|
4 | |||||||
|
|
5 | |||||||
|
|
6 | |||||||
|
|
6 | |||||||
|
|
6 | |||||||
|
|
7 | |||||||
|
|
7 | |||||||
|
|
7 | |||||||
|
|
8 | |||||||
|
|
8 | |||||||
|
|
23 | |||||||
|
|
24 | |||||||
|
|
24 | |||||||
|
|
25 | |||||||
|
|
26 | |||||||
|
|
26 | |||||||
|
|
27 | |||||||
|
|
27 | |||||||
|
|
28 | |||||||
|
|
28 | |||||||
|
|
28 | |||||||
|
|
28 | |||||||
|
|
29 | |||||||
| 29 | ||||||||
| 31 | ||||||||
| 32 | ||||||||
| 32 | ||||||||
| 33 | ||||||||
| 33 | ||||||||
| 33 | ||||||||
| 33 | ||||||||
| 33 | ||||||||
| 34 | ||||||||
| 34 | ||||||||
| 34 | ||||||||
| 34 | ||||||||
| 34 | ||||||||
| 34 | ||||||||
| 34 | ||||||||
| 35 | ||||||||
| 36 | ||||||||
| 36 | ||||||||
| 36 | ||||||||
| 36 | ||||||||
| 37 | ||||||||
| 38 | ||||||||
| 39 | ||||||||
| EX-10.9 | ||||||||
| EX-10.13 | ||||||||
| EX-10.16 | ||||||||
| EX-12.1 | ||||||||
| EX-21.1 | ||||||||
| EX-23.1 | ||||||||
| EX-24.1 | ||||||||
| EX-24.2 | ||||||||
| EX-24.3 | ||||||||
| EX-24.4 | ||||||||
| EX-24.5 | ||||||||
| EX-24.6 | ||||||||
| EX-24.7 | ||||||||
| EX-24.8 | ||||||||
| EX-24.9 | ||||||||
| EX-24.10 | ||||||||
| EX-24.11 | ||||||||
| EX-31.1 | ||||||||
| EX-31.2 | ||||||||
| EX-32.1 | ||||||||
| EX-32.2 | ||||||||
| EX-95 | ||||||||
| EX-99.1 | ||||||||
| EX-101 INSTANCE DOCUMENT | ||||||||
| EX-101 SCHEMA DOCUMENT | ||||||||
| EX-101 CALCULATION LINKBASE DOCUMENT | ||||||||
| EX-101 LABELS LINKBASE DOCUMENT | ||||||||
| EX-101 PRESENTATION LINKBASE DOCUMENT | ||||||||
| EX-101 DEFINITION LINKBASE DOCUMENT | ||||||||
1
Table of Contents
FOR THE PURPOSE OF “SAFE HARBOR” PROVISIONS OF THE
PRIVATE SECURITIES LITIGATION REFORM ACT OF 1995
2
Table of Contents
| Item 1. | Business |
| (a) | General Development of Business |
3
Table of Contents
| (b) | Description of Business and Properties |
4
Table of Contents
|
Components of Oil-Equivalent |
||||||||||||||||||||||||
|
Crude Oil & Natural Gas
|
||||||||||||||||||||||||
|
Oil-Equivalent (Thousands
|
Liquids (Thousands of
|
Natural Gas (Millions of
|
||||||||||||||||||||||
| of Barrels per Day) | Barrels per Day) | Cubic Feet per Day) | ||||||||||||||||||||||
| 2011 | 2010 | 2011 | 2010 | 2011 | 2010 | |||||||||||||||||||
|
United States
|
678 | 708 | 465 | 489 | 1,279 | 1,314 | ||||||||||||||||||
|
Other Americas:
|
||||||||||||||||||||||||
|
Canada
|
70 | 54 | 69 | 53 | 4 | 4 | ||||||||||||||||||
|
Colombia
|
39 | 41 | — | — | 234 | 249 | ||||||||||||||||||
|
Brazil
|
35 | 24 | 33 | 23 | 13 | 7 | ||||||||||||||||||
|
Trinidad and Tobago
|
31 | 38 | — | 1 | 183 | 223 | ||||||||||||||||||
|
Argentina
|
27 | 32 | 26 | 31 | 4 | 5 | ||||||||||||||||||
|
Total Other Americas
|
202 | 189 | 128 | 108 | 438 | 488 | ||||||||||||||||||
|
Africa:
|
||||||||||||||||||||||||
|
Nigeria
|
260 | 253 | 236 | 239 | 142 | 86 | ||||||||||||||||||
|
Angola
|
147 | 161 | 139 | 152 | 50 | 52 | ||||||||||||||||||
|
Chad
|
26 | 28 | 25 | 27 | 6 | 6 | ||||||||||||||||||
|
Republic of the Congo
|
23 | 25 | 21 | 23 | 10 | 10 | ||||||||||||||||||
|
Democratic Republic of the Congo
|
3 | 2 | 3 | 2 | 1 | 1 | ||||||||||||||||||
|
Total Africa
|
459 | 469 | 424 | 443 | 209 | 155 | ||||||||||||||||||
|
Asia:
|
||||||||||||||||||||||||
|
Thailand
|
209 | 216 | 65 | 70 | 867 | 875 | ||||||||||||||||||
|
Indonesia
|
208 | 226 | 166 | 187 | 253 | 236 | ||||||||||||||||||
|
Partitioned
Zone
2
|
91 | 98 | 88 | 94 | 20 | 23 | ||||||||||||||||||
|
Bangladesh
|
74 | 69 | 2 | 2 | 434 | 404 | ||||||||||||||||||
|
Kazakhstan
|
62 | 64 | 38 | 39 | 144 | 149 | ||||||||||||||||||
|
Azerbaijan
|
28 | 30 | 26 | 28 | 10 | 11 | ||||||||||||||||||
|
Philippines
|
25 | 25 | 4 | 4 | 126 | 124 | ||||||||||||||||||
|
China
|
22 | 20 | 20 | 18 | 10 | 13 | ||||||||||||||||||
|
Myanmar
|
14 | 13 | — | — | 86 | 81 | ||||||||||||||||||
|
Total Asia
|
733 | 761 | 409 | 442 | 1,950 | 1,916 | ||||||||||||||||||
|
Australia
|
101 | 111 | 26 | 34 | 448 | 458 | ||||||||||||||||||
|
Europe:
|
||||||||||||||||||||||||
|
United Kingdom
|
85 | 97 | 59 | 64 | 155 | 194 | ||||||||||||||||||
|
Denmark
|
44 | 51 | 29 | 32 | 91 | 116 | ||||||||||||||||||
|
Netherlands
|
7 | 8 | 2 | 2 | 31 | 35 | ||||||||||||||||||
|
Norway
|
3 | 3 | 3 | 3 | 1 | 1 | ||||||||||||||||||
|
Total Europe
|
139 | 159 | 93 | 101 | 278 | 346 | ||||||||||||||||||
|
Total Consolidated Operations
|
2,312 | 2,397 | 1,545 | 1,617 | 4,602 | 4,677 | ||||||||||||||||||
|
Equity
Affiliates
3
|
361 | 366 | 304 | 306 | 339 | 363 | ||||||||||||||||||
|
Total Including
Affiliates
4
|
2,673 | 2,763 | 1,849 | 1,923 | 4,941 | 5,040 | ||||||||||||||||||
|
1
Includes
synthetic oil: Canada, net
|
40 | 24 | 40 | 24 | — | — | ||||||||||||||||||
|
Venezuelan
affiliate,
net
32
|
28 | 32 | 28 | — | — | |||||||||||||||||||
|
2
Located
between Saudi Arabia and Kuwait.
|
||||||||||||||||||||||||
|
3
Volumes
represent Chevron’s share of production by affiliates,
including Tengizchevroil in Kazakhstan and Petroboscan,
Petroindependiente and Petropiar in Venezuela.
|
||||||||||||||||||||||||
|
4
Volumes
include natural gas consumed in operations of 582 million
and 537 million cubic feet per day in 2011 and 2010,
respectively. Total “as sold” natural gas volumes were
4,359 million and 4,503 million cubic feet per day for
2011 and 2010, respectively.
|
||||||||||||||||||||||||
5
Table of Contents
|
Productive
|
Productive
|
|||||||||||||||
| Oil Wells | Gas Wells | |||||||||||||||
| Gross | Net | Gross | Net | |||||||||||||
|
United States
|
49,511 | 32,368 | 14,061 | 7,671 | ||||||||||||
|
Other Americas
|
709 | 533 | 40 | 17 | ||||||||||||
|
Africa
|
2,548 | 850 | 17 | 7 | ||||||||||||
|
Asia
|
12,612 | 10,861 | 3,437 | 2,125 | ||||||||||||
|
Australia
|
807 | 453 | 64 | 11 | ||||||||||||
|
Europe
|
332 | 105 | 222 | 48 | ||||||||||||
|
Total Consolidated Companies
|
66,519 | 45,170 | 17,841 | 9,879 | ||||||||||||
|
Equity in Affiliates
|
1,231 | 434 | 7 | 2 | ||||||||||||
|
Total Including Affiliates
|
67,750 | 45,604 | 17,848 | 9,881 | ||||||||||||
|
Multiple completion wells included above:
|
887 | 573 | 378 | 280 | ||||||||||||
| 2011 | 2010 | 2009 | ||||||||||
|
Liquids — Millions of barrels
|
||||||||||||
|
Consolidated Companies
|
4,295 | 4,270 | 4,610 | |||||||||
|
Affiliated Companies
|
2,160 | 2,233 | 2,363 | |||||||||
|
Natural Gas — Billions of cubic feet
|
||||||||||||
|
Consolidated Companies
|
25,229 | 20,755 | 22,153 | |||||||||
|
Affiliated Companies
|
3,454 | 3,496 | 3,896 | |||||||||
|
Total Oil-Equivalent — Millions of barrels
|
||||||||||||
|
Consolidated Companies
|
8,500 | 7,729 | 8,303 | |||||||||
|
Affiliated Companies
|
2,736 | 2,816 | 3,012 | |||||||||
6
Table of Contents
(Thousands of Acres)
|
Developed and
|
||||||||||||||||||||||||
| Undeveloped* | Developed | Undeveloped | ||||||||||||||||||||||
| Gross | Net | Gross | Net | Gross | Net | |||||||||||||||||||
|
United States
|
6,290 | 5,171 | 7,752 | 5,051 | 14,042 | 10,222 | ||||||||||||||||||
|
Other Americas
|
26,803 | 15,338 | 1,392 | 395 | 28,195 | 15,733 | ||||||||||||||||||
|
Africa
|
8,068 | 3,921 | 3,324 | 1,370 | 11,392 | 5,291 | ||||||||||||||||||
|
Asia
|
41,125 | 21,613 | 5,426 | 2,760 | 46,551 | 24,373 | ||||||||||||||||||
|
Australia
|
12,801 | 6,064 | 920 | 240 | 13,721 | 6,304 | ||||||||||||||||||
|
Europe
|
5,093 | 3,608 | 645 | 137 | 5,738 | 3,745 | ||||||||||||||||||
|
Total Consolidated Companies
|
100,180 | 55,715 | 19,459 | 9,953 | 119,639 | 65,668 | ||||||||||||||||||
|
Equity in Affiliates
|
419 | 191 | 252 | 100 | 671 | 291 | ||||||||||||||||||
|
Total Including Affiliates
|
110,599 | 55,906 | 19,711 | 10,053 | 120,310 | 65,959 | ||||||||||||||||||
|
*
|
The gross undeveloped acres that will expire in 2012, 2013 and 2014 if production is not established by certain required dates are 4,675, 5,993 and 2,903, respectively. |
7
Table of Contents
|
Wells Drilling
|
Net Wells Completed | |||||||||||||||||||||||||||||||
| at 12/31/11 | 2011 | 2010 | 2009 | |||||||||||||||||||||||||||||
| Gross | Net | Prod. | Dry | Prod. | Dry | Prod. | Dry | |||||||||||||||||||||||||
|
United States
|
105 | 62 | 909 | 9 | 634 | 7 | 582 | 3 | ||||||||||||||||||||||||
|
Other Americas
|
8 | 4 | 37 | — | 32 | — | 36 | — | ||||||||||||||||||||||||
|
Africa
|
7 | 3 | 29 | — | 33 | — | 40 | — | ||||||||||||||||||||||||
|
Asia
|
85 | 37 | 549 | 15 | 445 | 15 | 580 | 10 | ||||||||||||||||||||||||
|
Australia
|
1 | — | — | — | — | — | — | — | ||||||||||||||||||||||||
|
Europe
|
5 | — | 6 | — | 4 | — | 7 | — | ||||||||||||||||||||||||
|
Total Consolidated Companies
|
211 | 106 | 1,530 | 24 | 1,148 | 22 | 1,245 | 13 | ||||||||||||||||||||||||
|
Equity in Affiliates
|
1 | 1 | 25 | — | 8 | — | 6 | — | ||||||||||||||||||||||||
|
Total Including Affiliates
|
212 | 107 | 1,555 | 24 | 1,156 | 22 | 1,251 | 13 | ||||||||||||||||||||||||
|
Wells Drilling
|
Net Wells Completed | |||||||||||||||||||||||||||||||
| at 12/31/11 | 2011 | 2010 | 2009 | |||||||||||||||||||||||||||||
| Gross | Net | Prod. | Dry | Prod. | Dry | Prod. | Dry | |||||||||||||||||||||||||
|
United States
|
2 | 2 | 5 | 1 | 1 | 1 | 4 | 5 | ||||||||||||||||||||||||
|
Other Americas
|
2 | 1 | 1 | — | — | 1 | 1 | 2 | ||||||||||||||||||||||||
|
Africa
|
3 | 1 | 1 | — | 1 | — | 2 | 1 | ||||||||||||||||||||||||
|
Asia
|
1 | 1 | 10 | 1 | 5 | 5 | 9 | 1 | ||||||||||||||||||||||||
|
Australia
|
1 | 1 | 4 | 1 | 5 | 2 | 4 | 2 | ||||||||||||||||||||||||
|
Europe
|
2 | 1 | — | 1 | — | — | — | — | ||||||||||||||||||||||||
|
Total Consolidated Companies
|
11 | 7 | 21 | 4 | 12 | 9 | 20 | 11 | ||||||||||||||||||||||||
|
Equity in Affiliates
|
— | — | 1 | — | — | — | — | — | ||||||||||||||||||||||||
|
Total Including Affiliates
|
11 | 7 | 22 | 4 | 12 | 9 | 20 | 11 | ||||||||||||||||||||||||
8
Table of Contents
|
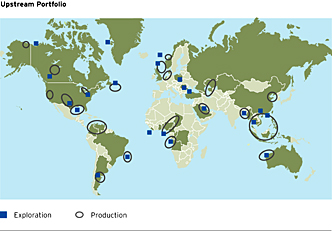
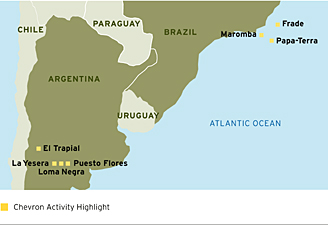
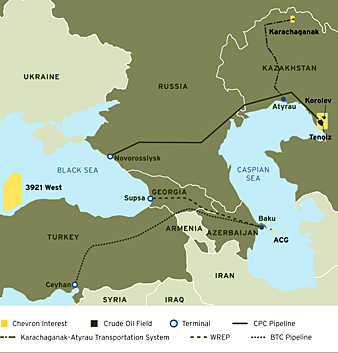
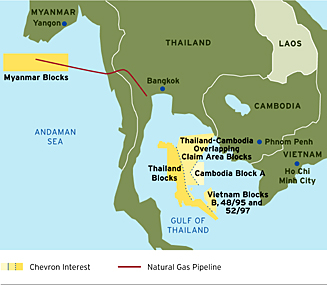
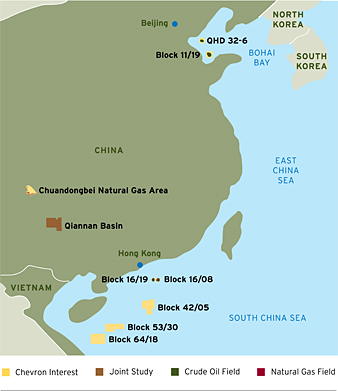
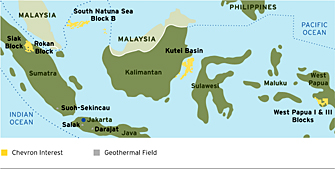
Chevron has exploration and production activities in most of the world’s major hydrocarbon basins. The company’s upstream strategy is to grow profitably in core areas, build new legacy positions and commercialize the company’s equity natural gas resource base while growing a high-impact global gas business. The map at left indicates Chevron’s primary areas of exploration and production. |
| a) | United States |
|
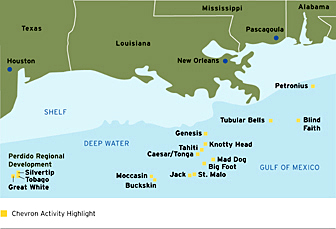
Average net oil-equivalent production during 2011 for the company’s combined interests in the Gulf of Mexico shelf and deepwater areas, and the onshore fields in the region was 244,000 barrels per day. The daily oil-equivalent production was composed of 161,000 barrels of crude oil, 401 million cubic feet of natural gas and 16,000 barrels of natural gas liquids.
Chevron was engaged in various exploration and development activities in the deepwater Gulf of Mexico during 2011. The Jack and St. Malo fields are located within 25 miles of each other and are being jointly developed. Chevron has a 50 percent working interest in Jack and a 51 percent working interest in St. Malo. Both fields are company operated. All major installation contracts have been awarded and construction began for |
9
Table of Contents
10
Table of Contents
|
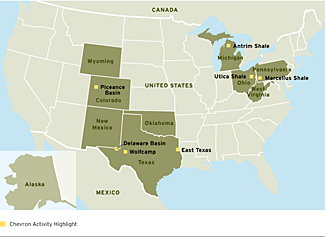
Company activities outside California and the Gulf of Mexico include operated and nonoperated interests in properties across the mid-continental United States, the Appalachian Basin, Michigan, Ohio and Alaska. During 2011, the company’s U.S. production outside California and the Gulf of Mexico averaged 251,000 net oil-equivalent barrels per day, composed of 91,000 barrels of crude oil, 795 million cubic feet of natural gas and 28,000 barrels of natural gas liquids.
In West Texas, the company continues to pursue development of tight carbonates, tight sands, and liquids-rich shale resources in the Midland Basin’s Wolfcamp play and several plays in the Delaware Basin through use of advanced drilling and completion technologies. Additional production growth is expected from interests in these formations in |
| b) | Other Americas |
|
Canada:
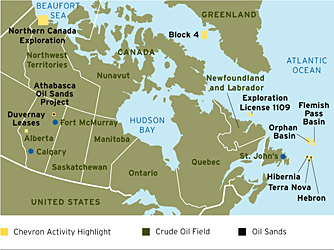
Company activities in Canada include nonoperated working interests of 26.9 percent in the Hibernia Field, 26.6 percent in the Hebron Field and 23.6 percent in the unitized Hibernia South Extension, all offshore eastern Canada. In Alberta, the company holds a 20 percent nonoperated working interest in the Athabasca Oil Sands Project (AOSP). Average net oil-equivalent production during 2011 was 70,000 barrels per day, composed of 69,000 barrels of crude oil, synthetic oil and natural gas liquids and 4 million cubic feet of natural gas.
Development of the Hibernia Southern Extension is expected to stem the production decline from the Hibernia Field. The project includes drilling of producing wells from the existing Hibernia platform and subsea drilling of water injection wells. All project approvals were in place by early 2011 and two producing wells were successfully drilled |
11
Table of Contents
|
Argentina:
Chevron holds operated interests in four concessions in the Neuquen Basin. Working interests range from 18.8 percent to 100 percent. Net oil-equivalent production in 2011 averaged 27,000 barrels per day, composed of 26,000 barrels of crude oil and natural gas liquids and 4 million cubic feet of natural gas. During 2011, the company reached an agreement to extend the El Trapial concession for an additional 10 years until 2032. The company expects to drill two exploratory wells in 2012 in the Vaca Muerta formation, targeting shale gas and tight oil resources.
Brazil: Chevron holds working interests in three deepwater fields in the Campos Basin. Net oil-equivalent production in 2011 averaged 35,000 barrels per day, composed of 33,000 barrels of crude oil and 13 million cubic feet of |
12
Table of Contents
|
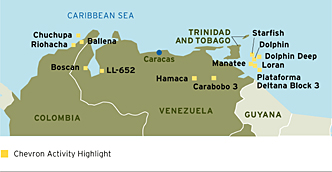
Venezuela: Chevron holds interests in two producing affiliates located in western Venezuela and one producing affiliate in the Orinoco Belt. Chevron has a 30 percent interest in the Petropiar affiliate that operates the Hamaca heavy-oil production and upgrading project located in Venezuela’s Orinoco Belt, a 39.2 percent interest in the Petroboscan affiliate that operates the Boscan Field in the western part of the country, and a 25.2 percent interest in the Petroindependiente affiliate that operates the LL-652 Field in Lake Maracaibo. The company’s share of net oil-equivalent production during 2011 from these operations, including synthetic oil from Hamaca, averaged |
| c) | Africa |
|
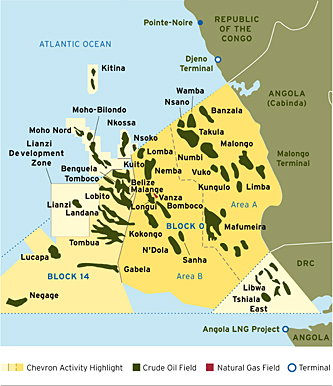
Angola:
Chevron holds company-operated working interests in offshore Blocks 0 and 14 and nonoperated working interests in offshore Block 2 and the onshore Fina Sonangol Texaco area. Net production from these operations in 2011 averaged 147,000 barrels of oil-equivalent per day.
The company operates the 39.2 percent-owned Block 0, which averaged 108,000 barrels per day of net liquids production in 2011. The Block 0 concession extends through 2030. Work on the second development stage of the Mafumeira Field in Block 0 continued in 2011. Mafumeira Sul, a project to develop the southern portion of the field, is expected to reach a final investment decision in second quarter 2012. Maximum total production from Mafumeira Sul is expected to be 110,000 barrels of crude oil and 10,000 barrels of LPG per day. At year-end 2011, proved reserves had not been recognized for the Mafumeira Sul project. In the Greater Vanza/Longui Area of Block 0, development concept studies continued during 2011 and the project is expected to enter FEED in second-half 2012. FEED activities continued on the south extension |
13
Table of Contents
14
Table of Contents
|
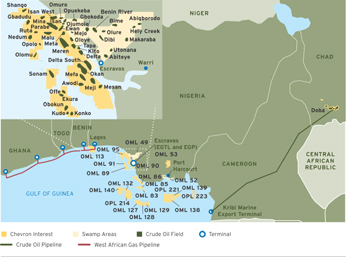
Nigeria:
Chevron holds a 40 percent interest in 13 concessions predominantly in the onshore and near-offshore region of the Niger Delta. The company operates under a joint-venture arrangement in this region with the Nigerian National Petroleum Corporation, which owns a 60 percent interest. The company also owns varying interests in four operated and six nonoperated deepwater blocks. In 2011, the company’s net oil-equivalent production in Nigeria averaged 260,000 barrels per day, composed of 236,000 barrels of liquids and 142 million cubic feet of natural gas.
Chevron operates and holds a 67.3 percent interest in the Agbami Field, located in deepwater Oil Mining Lease (OML) 127 and OML 128. During 2011, drilling continued on a 10-well, Phase 2 development program that is designed to offset field decline and maintain plateau production. The first well is expected to be |
15
Table of Contents
| d) | Asia |
|
Azerbaijan: Chevron holds an 11.3 percent nonoperated working interest in the Azerbaijan International Operating Company (AIOC), which produces crude oil in the Caspian Sea from the Azeri-Chirag-Gunashli (ACG) project. The company’s daily net production from AIOC averaged 28,000 barrels of oil-equivalent in 2011. AIOC operations are conducted under a PSC that expires in 2024. During 2011, construction progressed on the next development phase of the ACG project, which will further develop the deepwater Gunashli Field. Production is expected to begin in 2013. Proved reserves have been recognized for this project. The total estimated cost of the project is $6 billion, with maximum total daily production of 140,000 barrels of oil-equivalent. Chevron also has an 8.9 percent interest in the Baku-Tbilisi-Ceyhan (BTC) affiliate, which owns and operates a crude oil export pipeline from Baku, Azerbaijan, through Georgia to Mediterranean deepwater port facilities at Ceyhan, Turkey. The BTC Pipeline has a capacity of 1.2 million barrels per day and transports the majority of ACG production. Another production export route for crude oil is the Western Route Export Pipeline, |
16
Table of Contents
|
Cambodia: Chevron owns a 30 percent interest and operates the 1.2 million-acre Block A, located in the Gulf of Thailand. In 2011, the company progressed discussions on the production permit. Government approval and a final investment decision are expected by the end of 2012. At the end of 2011, proved reserves had not been recognized for the project. Myanmar: Chevron has a 28.3 percent nonoperated working interest in a PSC for the production of natural gas from the Yadana and Sein fields, within Blocks M5 and M6, in the Andaman Sea. The PSC expires in 2028. The company also has a 28.3 percent nonoperated interest in a pipeline company that transports the natural gas to the Myanmar-Thailand border for delivery to power plants in Thailand. The company’s average net natural gas production in 2011 was 86 million cubic feet per day. |
17
Table of Contents
|
China:
Chevron has operated and nonoperated working interests in several areas in China. The company’s net oil-equivalent production in 2011 averaged 22,000 barrels per day, composed of 20,000 barrels of crude oil and condensate and 10 million cubic feet of natural gas.
The company operates and holds a 49 percent interest in the Chuandongbei PSC, located in the onshore Sichuan Basin. The project includes two sour-gas processing plants with an aggregate design capacity of 740 million cubic feet per day connected by a natural gas gathering system to five fields. During 2011, the company continued construction on the first natural gas processing plant. In 2012, construction is expected to start at the second natural gas processing plant. Start-up of the initial phase of the project is expected in 2013, with planned maximum total natural gas production of 558 million cubic feet per day. Proved reserves have been recognized for this project. The PSC for Chuandongbei expires in 2037. The company holds operating interests in three deepwater exploration blocks in the South China Sea. During the exploration phase, the company has a 100 percent |
18
Table of Contents
|
Indonesia: Chevron holds operated and nonoperated working interests in Indonesia. The company has 100 percent-owned and operated interests in the Rokan and Siak PSCs onshore Sumatra. Chevron also operates four PSCs in the Kutei Basin, located offshore East Kalimantan. These interests range from 62 percent to 92.5 percent. Chevron also has a 51 percent operated working interests in two exploration blocks in western Papua, West Papua I and West Papua III, and a 25 percent nonoperated working interest in a joint venture in Block B in the South Natuna Sea. |
19
Table of Contents
|
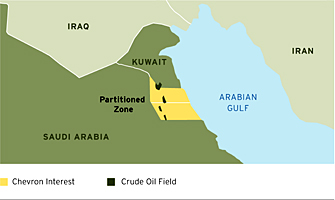
Partitioned Zone (PZ):
Chevron holds a concession with the Kingdom of Saudi Arabia to operate the kingdom’s 50 percent interest in the petroleum resources of the onshore area of the PZ between Saudi Arabia and Kuwait. Under the agreement, the company has rights to this 50 percent interest in the hydrocarbon resource until 2039.
During 2011, the company’s average net oil-equivalent production was 91,000 barrels per day, composed of 88,000 barrels of crude oil and 20 million cubic feet of natural gas. During 2011, the company continued a steam injection pilot project in the First Eocene carbonate reservoir that was initiated in 2009. A project to expand the steam injection pilot to the Second Eocene reservoir |
| e) | Australia |
|
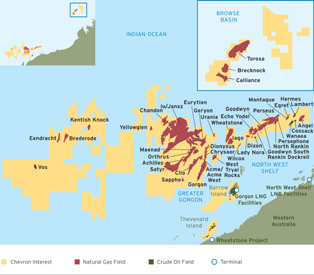
Chevron has a 16.7 percent nonoperated working interest in the North West Shelf (NWS) Venture offshore Western Australia. Daily net production from the project during 2011 averaged 18,000 barrels of crude oil and condensate, 445 million cubic feet of natural gas, and 4,000 barrels of LPG. Approximately 70 percent of the natural gas was sold in the form of LNG to major utilities in Asia, primarily under long-term contracts. The remaining natural gas was sold to the Western Australia domestic market. The concession for the NWS Venture expires in 2034.
The NWS Venture continues to progress two major capital projects — North Rankin 2 and NWS Oil Redevelopment. The North Rankin 2 project is designed to recover remaining low-pressure natural gas from the North Rankin and Perseus natural gas fields to meet gas supply needs and maintain production capacity of NWS. The North Rankin B platform was completed and installed during 2011. Maximum total daily production is expected to be about |
20
Table of Contents
21
Table of Contents
| f) | Europe |
|
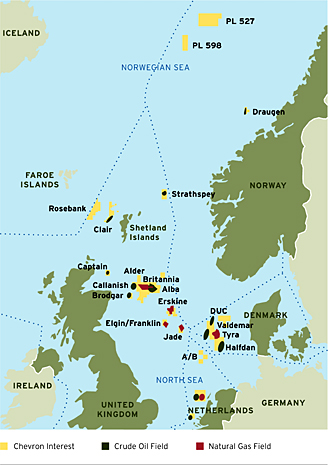
Denmark:
Chevron has a 15 percent working interest in the partner-operated Danish Underground Consortium (DUC), which produces crude oil and natural gas from 13 fields in the Danish North Sea. Net oil-equivalent production in 2011 from DUC averaged 44,000 barrels per day, composed of 29,000 barrels of crude oil and 91 million cubic feet of natural gas.
Netherlands: Chevron operates and holds interests ranging from 34.1 percent to 80 percent in 10 blocks in the Dutch sector of the North Sea. In 2011, the company’s net oil-equivalent production from the producing blocks was 7,000 barrels per day, composed of 2,000 barrels of crude oil and 31 million cubic feet of natural gas. In fourth quarter 2011, the second stage of the A/B Gas Project achieved first gas. Norway: The company holds a 7.6 percent nonoperated working interest in the Draugen Field. The company’s net production averaged 3,000 barrels of oil-equivalent per day during 2011. Chevron is the operator and has a 40 percent working interest in exploration license PL 527. In 2011, Chevron was awarded a 40 percent-owned and operated interest in exploration license PL 598. Both licenses are in the deepwater portion of the Norwegian Sea. United Kingdom: The company’s average net oil-equivalent production in 2011 from 10 offshore fields was 85,000 barrels per day, composed of 59,000 barrels of crude oil and natural gas liquids and 155 million cubic feet of natural gas. Most of the production was from the 85 percent-owned and operated Captain Field, the 23.4 percent-owned |
22
Table of Contents
|
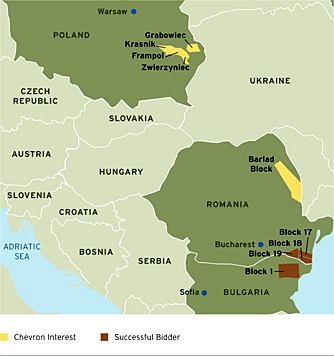
Bulgaria:
In June 2011, the Bulgarian government advised that Chevron had submitted a winning tender for a permit for exploration in a
1.1 million-acre
area in northeast Bulgaria. In January 2012, prior to execution of the license agreement, the Bulgarian government announced the withdrawal of the decision awarding the permit and the Bulgarian parliament imposed a ban on hydraulic fracturing, a technology commonly used for shale exploration and production. Chevron is continuing to work closely with the government of Bulgaria to provide the necessary assurances to the government and the public that hydrocarbons from shale can be developed safely and responsibly.
Poland: Chevron holds four shale concessions in southeast Poland (Grabowiec, Zwierzyniec, Krasnik and Frampol). All four exploration licenses are 100 percent-owned and operated and comprise a total of 1.1 million acres. In 2011, Chevron focused on processing data from a 2-D seismic survey. The data is being used to plan a multiwell drilling program that commenced in fourth quarter 2011. |
23
Table of Contents
(Crude-unit capacities and crude oil inputs in thousands of barrels per day; includes equity share in affiliates)
| December 31, 2011 | ||||||||||||||||||||||
|
Operable
|
Refinery Inputs | |||||||||||||||||||||
| Locations | Number | Capacity | 2011 | 2010 | 2009 | |||||||||||||||||
|
Pascagoula
|
Mississippi | 1 | 330 | 327 | 325 | 345 | ||||||||||||||||
|
El Segundo
|
California | 1 | 269 | 244 | 250 | 247 | ||||||||||||||||
|
Richmond
|
California | 1 | 257 | 192 | 228 | 218 | ||||||||||||||||
|
Kapolei
|
Hawaii | 1 | 54 | 47 | 46 | 49 | ||||||||||||||||
|
Salt Lake City
|
Utah | 1 | 45 | 44 | 41 | 40 | ||||||||||||||||
|
Perth
Amboy
1
|
New Jersey | 1 | 80 | — | — | — | ||||||||||||||||
|
Total Consolidated Companies
—
United
States
|
6 | 1,035 | 854 | 890 | 899 | |||||||||||||||||
|
Pembroke
2
|
United Kingdom | — | — | 122 | 211 | 205 | ||||||||||||||||
|
Cape Town
3
|
South Africa | 1 | 110 | 77 | 70 | 72 | ||||||||||||||||
|
Burnaby, B.C.
|
Canada | 1 | 55 | 43 | 40 | 49 | ||||||||||||||||
|
Total Consolidated Companies
—
International
|
2 | 165 | 242 | 321 | 326 | |||||||||||||||||
|
Affiliates
4
|
Various Locations | 7 | 767 | 691 | 683 | 653 | ||||||||||||||||
|
Total Including Affiliates
—
International
|
9 | 932 | 933 | 1,004 | 979 | |||||||||||||||||
|
Total Including Affiliates
—
Worldwide
|
15 | 1,967 | 1,787 | 1,894 | 1,878 | |||||||||||||||||
| 1 | Perth Amboy has been idled since early 2008 and is operated as a terminal. | |
| 2 | Pembroke was sold in August 2011. | |
| 3 | Chevron holds 100 percent of the common stock issued by Chevron South Africa (Pty) Limited, which owns the Cape Town Refinery. A consortium of South African partners owns preferred shares ultimately convertible to a 25 percent equity interest in Chevron South Africa (Pty) Limited. None of the preferred shares had been converted as of February 2012. | |
| 4 | Includes 1,000, 2,000 and 4,000 barrels per day of refinery inputs in 2011, 2010 and 2009, respectively, for interests in refineries that were sold during those periods. |
24
Table of Contents
(Thousands of Barrels per Day)
| 2011 | 2010 | 2009 | ||||||||||
|
United States
|
||||||||||||
|
Gasoline
|
649 | 700 | 720 | |||||||||
|
Jet Fuel
|
209 | 223 | 254 | |||||||||
|
Gas Oil and Kerosene
|
213 | 232 | 226 | |||||||||
|
Residual Fuel Oil
|
87 | 99 | 110 | |||||||||
|
Other Petroleum
Products
1
|
99 | 95 | 93 | |||||||||
|
Total United States
|
1,257 | 1,349 | 1,403 | |||||||||
|
International
2
|
||||||||||||
|
Gasoline
|
447 | 521 | 555 | |||||||||
|
Jet Fuel
|
269 | 271 | 264 | |||||||||
|
Gas Oil and Kerosene
|
543 | 583 | 647 | |||||||||
|
Residual Fuel Oil
|
233 | 197 | 209 | |||||||||
|
Other Petroleum
Products
1
|
200 | 192 | 176 | |||||||||
|
Total International
|
1,692 | 1,764 | 1,851 | |||||||||
|
Total
Worldwide
2
|
2,949 | 3,113 | 3,254 | |||||||||
|
1
Principally
naphtha, lubricants, asphalt and coke.
|
||||||||||||
|
2
Includes
share of equity affiliates’ sales:
|
556 | 562 | 516 | |||||||||
25
Table of Contents
| Net Mileage 1,2 | ||||
|
United States:
|
||||
|
Crude Oil
|
2,115 | |||
|
Natural Gas
|
2,282 | |||
|
Petroleum Products
|
6,125 | |||
|
Total United States
|
10,522 | |||
|
International:
|
||||
|
Crude Oil
|
700 | |||
|
Natural Gas
|
699 | |||
|
Petroleum Products
|
311 | |||
|
Total International
|
1,710 | |||
|
Worldwide
|
12,232 | |||
| 1 | Includes company’s share of pipeline mileage owned by equity affiliates. |
| 2 | Excludes gathering pipelines relating to the crude oil and natural gas production function. |
26
Table of Contents
| U.S. Flag | Foreign Flag | |||||||||||||||
|
Cargo Capacity
|
Cargo Capacity
|
|||||||||||||||
| Number | (Millions of Barrels) | Number | (Millions of Barrels) | |||||||||||||
|
Owned
|
— | — | 1 | 1.1 | ||||||||||||
|
Bareboat-Chartered
|
4 | 1.4 | 17 | 25.0 | ||||||||||||
|
Time-Chartered
2
|
— | — | 13 | 10.5 | ||||||||||||
|
Total
|
4 | 1.4 | 31 | 36.6 | ||||||||||||
| 1 | Consolidated companies only. Excludes tankers chartered on a voyage basis, those with dead-weight tonnage less than 25,000 and those used exclusively for storage. |
| 2 | Tankers chartered for more than one year. |
27
Table of Contents
28
Table of Contents
| Item 1A. | Risk Factors |
29
Table of Contents
30
Table of Contents
| Item 1B. | Unresolved Staff Comments |
31
Table of Contents
| Item 2. | Properties |
| Item 3. | Legal Proceedings |
32
Table of Contents
| Item 4. | Mine Safety Disclosures |
ISSUER PURCHASES OF EQUITY SECURITIES
|
Maximum
|
||||||||||||||||
|
Total Number of
|
Number of Shares
|
|||||||||||||||
|
Total Number
|
Average
|
Shares Purchased as
|
that May Yet be
|
|||||||||||||
|
of Shares
|
Price Paid
|
Part of Publicly
|
Purchased Under
|
|||||||||||||
| Period | Purchased (1)(2) | per Share | Announced Program | the Program (2) | ||||||||||||
|
Oct. 1 – Oct. 31, 2011
|
4,379,887 | 99.86 | 4,378,905 | — | ||||||||||||
|
Nov. 1 – Nov. 30, 2011
|
4,173,725 | 102.18 | 4,170,000 | — | ||||||||||||
|
Dec. 1 – Dec. 31, 2011
|
3,738,606 | 103.63 | 3,730,500 | — | ||||||||||||
|
Total Oct. 1 – Dec. 31, 2011
|
12,292,218 | 101.80 | 12,279,405 | — | ||||||||||||
| (1) | Pertains to common shares repurchased during the three-month period ended December 31, 2011, from company employees for required personal income tax withholdings on the exercise of the stock options issued to management under long-term incentive plans and former Texaco Inc. and Unocal stock option plans. Also includes shares delivered or attested to in satisfaction of the exercise price by holders of certain former Texaco Inc. employee stock options exercised during the three-month period ended December 31, 2011. | |
| (2) | In July 2010, the Board of Directors approved an ongoing share repurchase program with no set term or monetary limits, under which common shares would be acquired by the company through open market purchases (some pursuant to a Rule 10b5-1 plan) at prevailing prices, as permitted by securities laws and other legal requirements and subject to market conditions and other factors. As of December 31, 2011, 51,064,679 shares had been acquired under this program for $5.0 billion. |
| Item 6. | Selected Financial Data |
| Item 7. | Management’s Discussion and Analysis of Financial Condition and Results of Operations |
| Item 7A. | Quantitative and Qualitative Disclosures About Market Risk |
33
Table of Contents
| Item 8. | Financial Statements and Supplementary Data |
| Item 9. | Changes in and Disagreements With Accountants on Accounting and Financial Disclosure |
| Item 9A. | Controls and Procedures |
| (a) | Evaluation of Disclosure Controls and Procedures |
| (b) | Management’s Report on Internal Control Over Financial Reporting |
| (c) | Changes in Internal Control Over Financial Reporting |
| Item 9B. | Other Information |
34
Table of Contents
| Name and Age | Current and Prior Positions (up to five years) | Current Areas of Responsibility | ||||
|
J.S. Watson
|
55 |
Chairman of the Board and Chief Executive Officer (since 2010)
|
Chief Executive Officer | |||
| Vice Chairman of the Board (2009) | ||||||
| Executive Vice President (2008 to 2009) | ||||||
|
Vice President and President of Chevron
International Exploration and Production Company (2005 through 2007) |
||||||
|
G.L. Kirkland
|
61 |
Vice Chairman of the Board and Executive
Vice President (since 2010) |
Worldwide Exploration and
Production Activities and Global |
|||
| Executive Vice President (2005 through 2009) | Gas Activities, including Natural | |||||
| Gas Trading | ||||||
|
J.R. Blackwell
|
53 |
Executive Vice President (since 2011)
President of Chevron Asia Pacific Exploration
and Production Company (2008 through 2011)
Managing Director of Chevron Southern Africa
Strategic Business Unit (2003 to 2007) |
Technology; Mining; Project
Resources Company; Procurement |
|||
|
M.K. Wirth
|
51 | Executive Vice President (since 2006) | Worldwide Refining, Marketing, | |||
| President of Global Supply and Trading | Lubricants, and Supply and | |||||
| (2004 to 2006) | Trading Activities, excluding | |||||
| Natural Gas Trading; Chemicals | ||||||
|
R.I. Zygocki
|
54 | Executive Vice President (since 2011) | Strategy and Planning; Health, | |||
|
Vice President, Policy, Government and Public
Affairs (2007 through 2011)
Vice President, Health, Environment and Safety (2003 through 2007)
|
Environment and Safety; Policy,
Government and Public Affairs |
|||||
|
P.E. Yarrington
|
55 |
Vice President and Chief Financial Officer
(since 2009) |
Finance | |||
|
Vice President and Treasurer (2007 through 2008)
Vice President, Policy, Government and Public
Affairs (2002 to 2007) |
||||||
|
R.H. Pate
|
49 |
Vice President and General Counsel (since 2009)
Partner and Head of Global Competition Practice
of Hunton & Williams LLP, a major U.S. law firm (2005 to 2009) |
Law, Governance and Compliance | |||
35
Table of Contents
| Item 11. | Executive Compensation |
| Item 12. | Security Ownership of Certain Beneficial Owners and Management and Related Stockholder Matters |
| Item 13. | Certain Relationships and Related Transactions, and Director Independence |
| Item 14. | Principal Accounting Fees and Services |
36
Table of Contents
| Item 15. | Exhibits, Financial Statement Schedules |
| Page(s) | ||
| FS-22 | ||
| FS-23 | ||
| FS-24 | ||
| FS-25 | ||
| FS-26 | ||
| FS-27 | ||
| FS-28 to FS-59 |
| Included on page 38 is Schedule II — Valuation and Qualifying Accounts. |
| The Exhibit Index on pages E-1 through E-2 lists the exhibits that are filed as part of this report. |
37
Table of Contents
Millions of Dollars
| Year Ended December 31 | ||||||||||||
| 2011 | 2010 | 2009 | ||||||||||
|
Employee Termination Benefits:
|
||||||||||||
|
Balance at January 1
|
$ | 145 | $ | 13 | $ | 44 | ||||||
|
Additions (deductions) charged (credited) to expense
|
— | 235 | (12 | ) | ||||||||
|
Payments
|
(82 | ) | (103 | ) | (19 | ) | ||||||
|
Balance at December 31
|
$ | 63 | $ | 145 | $ | 13 | ||||||
|
Allowance for Doubtful Accounts:
|
||||||||||||
|
Balance at January 1
|
$ | 239 | $ | 293 | $ | 275 | ||||||
|
Additions (reductions) to expense
|
4 | (13 | ) | 92 | ||||||||
|
Bad debt write-offs
|
(76 | ) | (41 | ) | (74 | ) | ||||||
|
Balance at December 31
|
$ | 167 | $ | 239 | $ | 293 | ||||||
|
Deferred Income Tax Valuation Allowance:*
|
||||||||||||
|
Balance at January 1
|
$ | 9,185 | $ | 7,921 | $ | 7,535 | ||||||
|
Additions to deferred income tax expense
|
2,216 | 1,454 | 2,204 | |||||||||
|
Reduction of deferred income tax expense
|
(305 | ) | (190 | ) | (1,818 | ) | ||||||
|
Balance at December 31
|
$ | 11,096 | $ | 9,185 | $ | 7,921 | ||||||
| * | See also Note 15 to the Consolidated Financial Statements, beginning on page FS-43. |
38
Table of Contents
| By |
/s/
John
S. Watson
|
|
Principal Executive Officers
|
||
| (and Directors) | Directors | |
|
/s/
John S. Watson
John S. Watson, Chairman of the Board and Chief Executive Officer |
Linnet F. Deily*
Linnet F. Deily |
|
|
/s/
George L.
Kirkland
George L. Kirkland, Vice Chairman of the Board |
Robert E. Denham*
Robert E. Denham |
|
|
Robert J. Eaton*
Robert J. Eaton |
||
|
Chuck Hagel*
Chuck Hagel |
||
|
Principal Financial Officer
/s/ Patricia E. Yarrington Patricia E. Yarrington, Vice President and Chief Financial Officer Principal Accounting Officer /s/ Matthew J. Foehr Matthew J. Foehr, Vice President and Comptroller |
Enrique Hernandez, Jr.*
Enrique Hernandez, Jr. Donald B. Rice* Donald B. Rice Kevin W. Sharer* Kevin W. Sharer Charles R. Shoemate* Charles R. Shoemate John G. Stumpf* John G. Stumpf |
|
|
*By:
/s/
Lydia I.
Beebe
Lydia I. Beebe, Attorney-in-Fact |
Ronald D. Sugar*
Ronald D. Sugar Carl Ware* Carl Ware |
39
|
Consolidated Financial Statements
|
FS-1
Table of Contents
Financial Condition and Results of Operations
| Millions of dollars, except per-share amounts | 2011 | 2010 | 2009 | ||||||||||
|
Net Income Attributable to
Chevron Corporation |
$ | 26,895 | $ | 19,024 | $ | 10,483 | |||||||
|
Per Share Amounts:
|
|||||||||||||
|
Net Income Attributable to
|
|||||||||||||
|
Chevron Corporation
|
|||||||||||||
|
– Basic
|
$ | 13.54 | $ | 9.53 | $ | 5.26 | |||||||
|
– Diluted
|
$ | 13.44 | $ | 9.48 | $ | 5.24 | |||||||
|
Dividends
|
$ | 3.09 | $ | 2.84 | $ | 2.66 | |||||||
|
Sales and Other
|
|||||||||||||
|
Operating Revenues
|
$ | 244,371 | $ | 198,198 | $ | 167,402 | |||||||
|
Return on:
|
|||||||||||||
|
Capital Employed
|
21.6 | % | 17.4 | % | 10.6 | % | |||||||
|
Stockholders’ Equity
|
23.8 | % | 19.3 | % | 11.7 | % | |||||||
|
Earnings by Major Operating Area
|
|||||||||||||
| Millions of dollars | 2011 | 2010 | 2009 | ||||||||||
|
Upstream
1
|
|||||||||||||
|
United States
|
$ | 6,512 | $ | 4,122 | $ | 2,262 | |||||||
|
International
|
18,274 | 13,555 | 8,670 | ||||||||||
|
Total Upstream
|
24,786 | 17,677 | 10,932 | ||||||||||
|
Downstream
1
|
|||||||||||||
|
United States
|
1,506 | 1,339 | (121 | ) | |||||||||
|
International
|
2,085 | 1,139 | 594 | ||||||||||
|
Total Downstream
|
3,591 | 2,478 | 473 | ||||||||||
|
All Other
|
(1,482 | ) | (1,131 | ) | (922 | ) | |||||||
|
Net Income Attributable to
Chevron Corporation 2,3 |
$ | 26,895 | $ | 19,024 | $ | 10,483 | |||||||
|
1
2009 information has
been revised to conform with
the 2011 and 2010 segment
presentation.
|
|||||||||||||
|
2
Includes foreign
currency effects:
|
$ | 121 | $ | (423 | ) | $ | (744 | ) | |||||
| 3 Also referred to as “earnings” in the discussions that follow. | |||||||||||||
FS-2
Table of Contents
|
|
FS-3
Table of Contents
Financial Condition and Results of Operations
FS-4
Table of Contents
FS-5
Table of Contents
Financial Condition and Results of Operations
through FS-5.
| Millions of dollars | 2011 | 2010 | 2009 | ||||||||||
|
Earnings
|
$ | 6,512 | $ | 4,122 | $ | 2,262 | |||||||
|
|
FS-6
Table of Contents
| Millions of dollars | 2011 | 2010 | 2009 | ||||||||||
|
Earnings*
|
$ | 18,274 | $ | 13,555 | $ | 8,670 | |||||||
|
|
|||||||||||||
|
*Includes foreign currency effects:
|
$ 211 | $ (293 | ) | $ (578 | ) | ||||||||
| Millions of dollars | 2011 | 2010 | 2009 | ||||||||||
|
Earnings
|
$ | 1,506 | $ | 1,339 | $ | (121 | ) | ||||||
|
|
FS-7
Table of Contents
Financial Condition and Results of Operations
| Millions of dollars | 2011 | 2010 | 2009 | ||||||||||
|
Earnings*
|
$ | 2,085 | $ | 1,139 | $ | 594 | |||||||
|
|
|||||||||||||
|
*Includes foreign currency effects:
|
$ | (65 | ) | $ | (135 | ) | $ | (191 | ) | ||||
| Millions of dollars | 2011 | 2010 | 2009 | ||||||||||
|
Net charges*
|
$ | (1,482 | ) | $ | (1,131 | ) | $ | (922 | ) | ||||
|
|
|||||||||||||
|
*Includes foreign currency effects:
|
$ | (25 | ) | $ | 5 | $ | 25 | ||||||
| Millions of dollars | 2011 | 2010 | 2009 | ||||||||||
|
Sales and other operating revenues
|
$ | 244,371 | $ | 198,198 | $ | 167,402 | |||||||
| Millions of dollars | 2011 | 2010 | 2009 | ||||||||||
|
Income from equity affiliates
|
$ | 7,363 | $ | 5,637 | $ | 3,316 | |||||||
FS-8
Table of Contents
| Millions of dollars | 2011 | 2010 | 2009 | ||||||||||
|
Other income
|
$ | 1,972 | $ | 1,093 | $ | 918 | |||||||
| Millions of dollars | 2011 | 2010 | 2009 | ||||||||||
|
Purchased crude oil and products
|
$ | 149,923 | $ | 116,467 | $ | 99,653 | |||||||
| Millions of dollars | 2011 | 2010 | 2009 | ||||||||||
|
Operating, selling, general and
administrative expenses
|
$ | 26,394 | $ | 23,955 | $ | 22,384 | |||||||
| Millions of dollars | 2011 | 2010 | 2009 | ||||||||||
|
Exploration expense
|
$ | 1,216 | $ | 1,147 | $ | 1,342 | |||||||
| Millions of dollars | 2011 | 2010 | 2009 | ||||||||||
|
Depreciation,
depletion and
amortization
|
$ | 12,911 | $ | 13,063 | $ | 12,110 | |||||||
| Millions of dollars | 2011 | 2010 | 2009 | ||||||||||
|
Taxes other than on income
|
$ | 15,628 | $ | 18,191 | $ | 17,591 | |||||||
| Millions of dollars | 2011 | 2010 | 2009 | ||||||||||
|
Interest and debt expense
|
$ | – | $ | 50 | $ | 28 | |||||||
| Millions of dollars | 2011 | 2010 | 2009 | ||||||||||
|
Income tax expense
|
$ | 20,626 | $ | 12,919 | $ | 7,965 | |||||||
FS-9
Table of Contents
Financial Condition and Results of Operations
| 2011 | 2010 | 2009 | |||||||||||
|
U.S. Upstream
|
|||||||||||||
|
Net Crude Oil and Natural Gas
|
|||||||||||||
|
Liquids Production (MBPD)
|
465 | 489 | 484 | ||||||||||
|
Net Natural Gas Production (MMCFPD)
3
|
1,279 | 1,314 | 1,399 | ||||||||||
|
Net Oil-Equivalent Production (MBOEPD)
|
678 | 708 | 717 | ||||||||||
|
Sales of Natural Gas (MMCFPD)
|
5,836 | 5,932 | 5,901 | ||||||||||
|
Sales of Natural Gas Liquids (MBPD)
|
15 | 22 | 17 | ||||||||||
|
Revenues From Net Production
|
|||||||||||||
|
Liquids ($/Bbl)
|
$ | 97.51 | $ | 71.59 | $ | 54.36 | |||||||
|
Natural Gas ($/MCF)
|
$ | 4.04 | $ | 4.26 | $ | 3.73 | |||||||
|
|
|||||||||||||
|
International Upstream
|
|||||||||||||
|
Net Crude Oil and Natural Gas
|
|||||||||||||
|
Liquids Production (MBPD)
4
|
1,384 | 1,434 | 1,362 | ||||||||||
|
Net Natural Gas Production (MMCFPD)
3
|
3,662 | 3,726 | 3,590 | ||||||||||
|
Net Oil-Equivalent
|
|||||||||||||
|
Production (MBOEPD)
5
|
1,995 | 2,055 | 1,987 | ||||||||||
|
Sales of Natural Gas (MMCFPD)
|
4,361 | 4,493 | 4,062 | ||||||||||
|
Sales of Natural Gas Liquids (MBPD)
|
24 | 27 | 23 | ||||||||||
|
Revenues From Liftings
|
|||||||||||||
|
Liquids ($/Bbl)
|
$ | 101.53 | $ | 72.68 | $ | 55.97 | |||||||
|
Natural Gas ($/MCF)
|
$ | 5.39 | $ | 4.64 | $ | 4.01 | |||||||
|
|
|||||||||||||
|
Worldwide Upstream
|
|||||||||||||
|
Net Oil-Equivalent Production
(MBOEPD) 3,5 |
|||||||||||||
|
United States
|
678 | 708 | 717 | ||||||||||
|
International
|
1,995 | 2,055 | 1,987 | ||||||||||
|
Total
|
2,673 | 2,763 | 2,704 | ||||||||||
|
|
|||||||||||||
|
U.S. Downstream
|
|||||||||||||
|
Gasoline Sales (MBPD)
6
|
649 | 700 | 720 | ||||||||||
|
Other Refined Product Sales (MBPD)
|
608 | 649 | 683 | ||||||||||
|
Total Refined Product Sales (MBPD)
|
1,257 | 1,349 | 1,403 | ||||||||||
|
Sales of Natural Gas Liquids (MBPD)
|
146 | 139 | 144 | ||||||||||
|
Refinery Input (MBPD)
|
854 | 890 | 899 | ||||||||||
|
|
|||||||||||||
|
International Downstream
|
|||||||||||||
|
Gasoline Sales (MBPD)
6
|
447 | 521 | 555 | ||||||||||
|
Other Refined Product Sales (MBPD)
|
1,245 | 1,243 | 1,296 | ||||||||||
|
Total Refined Product Sales (MBPD)
7
|
1,692 | 1,764 | 1,851 | ||||||||||
|
Sales of Natural Gas Liquids (MBPD)
|
63 | 78 | 88 | ||||||||||
|
Refinery Input (MBPD)
|
933 | 1,004 | 979 | ||||||||||
| 1 | Includes company share of equity affiliates. | |
| 2 |
MBPD – thousands of barrels per day; MMCFPD –
millions of cubic feet per day;
MBOEPD – thousands of barrels of oil-equivalents per day; Bbl – Barrel; MCF = Thousands of cubic feet. Oil-equivalent gas (OEG) conversion ratio is 6,000 cubic feet of natural gas = 1 barrel of oil. |
|
| 3 | Includes natural gas consumed in operations (MMCFPD): |
|
United States
|
69 | 62 | 58 | |||||||||
|
International
|
513 | 475 | 463 | |||||||||
|
4
Includes: Canada – synthetic oil
|
40 | 24 | – | |||||||||
|
Venezuela affiliate – synthetic oil
|
32 | 28 | – | |||||||||
|
5
Includes Canada oil sands
|
– | – | 26 | |||||||||
|
6
Includes branded and unbranded gasoline.
|
||||||||||||
|
7
Includes sales of affiliates (MBPD):
|
556 | 562 | 516 |
|
|
FS-10
Table of Contents
| 2011 | 2010 | 2009 | ||||||||||||||||||||||||||||||||||||
| Millions of dollars | U.S. | Int’l. | Total | U.S. | Int’l. | Total | U.S. | Int’l. | Total | |||||||||||||||||||||||||||||
|
Upstream
1
|
$ | 8,318 | $ | 17,554 | $ | 25,872 | $ | 3,450 | $ | 15,454 | $ | 18,904 | $ | 3,294 | $ | 15,002 | $ | 18,296 | ||||||||||||||||||||
|
Downstream
|
1,461 | 1,150 | 2,611 | 1,456 | 1,096 | 2,552 | 2,087 | 1,449 | 3,536 | |||||||||||||||||||||||||||||
|
All Other
|
575 | 8 | 583 | 286 | 13 | 299 | 402 | 3 | 405 | |||||||||||||||||||||||||||||
|
Total
|
$ | 10,354 | $ | 18,712 | $ | 29,066 | $ | 5,192 | $ | 16,563 | $ | 21,755 | $ | 5,783 | $ | 16,454 | $ | 22,237 | ||||||||||||||||||||
|
Total, Excluding Equity in Affiliates
|
$ | 10,077 | $ | 17,294 | $ | 27,371 | $ | 4,934 | $ | 15,433 | $ | 20,367 | $ | 5,558 | $ | 15,094 | $ | 20,652 | ||||||||||||||||||||
Of the $29.1 billion of expenditures in 2011, 89 percent, or $25.9 billion, was related to upstream activities. Approximately 87 percent and 80 percent were expended for upstream operations in 2010 and 2009. International upstream accounted for about 68 percent of the worldwide upstream investment in 2011, about 82 percent in 2010 and about 80 percent in 2009. These amounts exclude the acquisition of Atlas Energy, Inc. in 2011.
FS-11
Table of Contents
Financial Condition and Results of Operations
| At December 31 | |||||||||||||
| 2011 | 2010 | 2009 | |||||||||||
|
Current Ratio
|
1.6 | 1.7 | 1.4 | ||||||||||
|
Interest Coverage Ratio
|
165.4 | 101.7 | 62.3 | ||||||||||
|
Debt Ratio
|
7.7 | % | 9.8 | % | 10.3 | % | |||||||

| Millions of dollars | Commitment Expiration by Period | |||||||||||||||||||
| 2013– | 2015– | After | ||||||||||||||||||
| Total | 2012 | 2014 | 2016 | 2016 | ||||||||||||||||
|
Guarantee of
non-
consolidated affiliate or joint-venture obligation |
$ | 601 | $ | 38 | $ | 77 | $ | 77 | $ | 409 | ||||||||||
FS-12
Table of Contents
| Millions of dollars | Payments Due by Period | |||||||||||||||||||
| 2013– | 2015– | After | ||||||||||||||||||
| Total | 2012 | 2014 | 2016 | 2016 | ||||||||||||||||
|
On Balance Sheet:
2
|
||||||||||||||||||||
|
Short-Term Debt
3
|
$ | 340 | $ | 340 | $ | – | $ | – | $ | – | ||||||||||
|
Long-Term Debt
3
|
9,684 | – | 7,641 | – | 2,043 | |||||||||||||||
|
Noncancelable Capital
Lease Obligations |
251 | 70 | 79 | 34 | 68 | |||||||||||||||
|
Interest
|
1,764 | 223 | 366 | 264 | 911 | |||||||||||||||
|
Off Balance Sheet:
|
||||||||||||||||||||
|
Noncancelable Operating Lease Obligations
|
3,509 | 693 | 1,155 | 868 | 793 | |||||||||||||||
|
Throughput and
Take-or-Pay Agreements 4 |
21,664 | 4,912 | 5,382 | 4,218 | 7,152 | |||||||||||||||
|
Other Unconditional Purchase Obligations
4
|
4,759 | 1,102 | 2,524 | 906 | 227 | |||||||||||||||
| 1 | Excludes contributions for pensions and other postretirement benefit plans. Information on employee benefit plans is contained in Note 21 beginning on page FS-49. | |
| 2 | Does not include amounts related to the company’s income tax liabilities associated with uncertain tax positions. The company is unable to make reasonable estimates for the periods in which these liabilities may become payable. The company does not expect settlement of such liabilities will have a material effect on its results of operations, consolidated financial position or liquidity in any single period. | |
| 3 | $5.6 billion of short-term debt that the company expects to refinance is included in long- term debt. The repayment schedule above reflects the projected repayment of the entire amounts in the 2013–2014 period. | |
| 4 | Does not include commodity purchase obligations that are not fixed or determinable. These obligations are generally monetized in a relatively short period of time through sales transactions or similar agreements with third parties. Examples include obligations to purchase LNG, regasified natural gas and refinery products at indexed prices. |
FS-13
Table of Contents
Financial Condition and Results of Operations
| Millions of dollars | 2011 | 2010 | |||||||
|
Crude Oil
|
$ | 22 | $ | 15 | |||||
|
Natural Gas
|
4 | 4 | |||||||
|
Refined Products
|
11 | 14 | |||||||
| Millions of dollars | 2011 | 2010 | 2009 | ||||||||||
|
Balance at January 1
|
$ | 1,507 | $ | 1,700 | $ | 1,818 | |||||||
|
Net Additions
|
343 | 220 | 351 | ||||||||||
|
Expenditures
|
(446 | ) | (413 | ) | (469 | ) | |||||||
|
Balance at December 31
|
$ | 1,404 | $ | 1,507 | $ | 1,700 | |||||||
FS-14
Table of Contents
FS-15
Table of Contents
Financial Condition and Results of Operations
| 1. | the nature of the estimates and assumptions is material due to the levels of subjectivity and judgment necessary to account for highly uncertain matters or the susceptibility of such matters to change; and | ||
| 2. | the impact of the estimates and assumptions on the company’s financial condition or operating performance is material. |
FS-16
Table of Contents
FS-17
Table of Contents
Financial Condition and Results of Operations
FS-18
Table of Contents
FS-19
Table of Contents
| 2011 | 2010 | ||||||||||||||||||||||||||||||||
| Millions of dollars, except per-share amounts | 4th Q | 3rd Q | 2nd Q | 1st Q | 4th Q | 3rd Q | 2nd Q | 1st Q | |||||||||||||||||||||||||
|
Revenues and Other Income
|
|||||||||||||||||||||||||||||||||
|
Sales and other operating revenues
1
|
$ | 58,027 | $ | 61,261 | $ | 66,671 | $ | 58,412 | $ | 51,852 | $ | 48,554 | $ | 51,051 | $ | 46,741 | |||||||||||||||||
|
Income from equity affiliates
|
1,567 | 2,227 | 1,882 | 1,687 | 1,510 | 1,242 | 1,650 | 1,235 | |||||||||||||||||||||||||
|
Other income
|
391 | 944 | 395 | 242 | 665 | (78 | ) | 303 | 203 | ||||||||||||||||||||||||
|
Total Revenues and Other Income
|
59,985 | 64,432 | 68,948 | 60,341 | 54,027 | 49,718 | 53,004 | 48,179 | |||||||||||||||||||||||||
|
Costs and Other Deductions
|
|||||||||||||||||||||||||||||||||
|
Purchased crude oil and products
|
36,363 | 37,600 | 40,759 | 35,201 | 30,109 | 28,610 | 30,604 | 27,144 | |||||||||||||||||||||||||
|
Operating expenses
|
5,948 | 5,378 | 5,260 | 5,063 | 5,343 | 4,665 | 4,591 | 4,589 | |||||||||||||||||||||||||
|
Selling, general and administrative expenses
|
1,330 | 1,115 | 1,200 | 1,100 | 1,408 | 1,181 | 1,136 | 1,042 | |||||||||||||||||||||||||
|
Exploration expenses
|
386 | 240 | 422 | 168 | 335 | 420 | 212 | 180 | |||||||||||||||||||||||||
|
Depreciation, depletion and amortization
|
3,313 | 3,215 | 3,257 | 3,126 | 3,439 | 3,401 | 3,141 | 3,082 | |||||||||||||||||||||||||
|
Taxes other than on income
1
|
2,680 | 3,544 | 4,843 | 4,561 | 4,623 | 4,559 | 4,537 | 4,472 | |||||||||||||||||||||||||
|
Interest and debt expense
|
– | – | – | – | 4 | 9 | 17 | 20 | |||||||||||||||||||||||||
|
Total Costs and Other Deductions
|
50,020 | 51,092 | 55,741 | 49,219 | 45,261 | 42,845 | 44,238 | 40,529 | |||||||||||||||||||||||||
|
Income Before Income Tax Expense
|
9,965 | 13,340 | 13,207 | 11,122 | 8,766 | 6,873 | 8,766 | 7,650 | |||||||||||||||||||||||||
|
Income Tax Expense
|
4,813 | 5,483 | 5,447 | 4,883 | 3,446 | 3,081 | 3,322 | 3,070 | |||||||||||||||||||||||||
|
Net Income
|
$ | 5,152 | $ | 7,857 | $ | 7,760 | $ | 6,239 | $ | 5,320 | $ | 3,792 | $ | 5,444 | $ | 4,580 | |||||||||||||||||
|
Less: Net
income attributable to
noncontrolling interests |
29 | 28 | 28 | 28 | 25 | 24 | 35 | 28 | |||||||||||||||||||||||||
|
Net Income Attributable to Chevron Corporation
|
$ | 5,123 | $ | 7,829 | $ | 7,732 | $ | 6,211 | $ | 5,295 | $ | 3,768 | $ | 5,409 | $ | 4,552 | |||||||||||||||||
|
Per Share of Common Stock
|
|||||||||||||||||||||||||||||||||
|
Net Income
Attributable to Chevron Corporation
|
|||||||||||||||||||||||||||||||||
|
– Basic
|
$ | 2.61 | $ | 3.94 | $ | 3.88 | $ | 3.11 | $ | 2.65 | $ | 1.89 | $ | 2.71 | $ | 2.28 | |||||||||||||||||
|
– Diluted
|
$ | 2.58 | $ | 3.92 | $ | 3.85 | $ | 3.09 | $ | 2.64 | $ | 1.87 | $ | 2.70 | $ | 2.27 | |||||||||||||||||
|
Dividends
|
$ | 0.81 | $ | 0.78 | $ | 0.78 | $ | 0.72 | $ | 0.72 | $ | 0.72 | $ | 0.72 | $ | 0.68 | |||||||||||||||||
|
Common Stock Price Range – High
2
|
$ | 110.01 | $ | 109.75 | $ | 109.94 | $ | 109.65 | $ | 92.39 | $ | 82.19 | $ | 83.41 | $ | 81.09 | |||||||||||||||||
|
– Low
2
|
$ | 86.68 | $ | 87.30 | $ | 97.00 | $ | 90.12 | $ | 80.41 | $ | 66.83 | $ | 67.80 | $ | 69.55 | |||||||||||||||||
|
1
Includes excise, value-added and similar taxes:
|
$ | 1,713 | $ | 1,974 | $ | 2,264 | $ | 2,134 | $ | 2,136 | $ | 2,182 | $ | 2,201 | $ | 2,072 | |||||||||||||||||
|
2
Intraday price.
|
|||||||||||||||||||||||||||||||||
FS-20
Table of Contents

|

|

|
||
|
|
||||
|
John S. Watson
|
Patricia E. Yarrington | Matthew J. Foehr | ||
|
Chairman of the Board
|
Vice President | Vice President | ||
|
and Chief Executive Officer
|
and Chief Financial Officer | and Comptroller |
FS-21
Table of Contents

February 23, 2012
FS-22
Table of Contents
| Year ended December 31 | |||||||||||||
| 2011 | 2010 | 2009 | |||||||||||
|
Revenues and Other Income
|
|||||||||||||
|
Sales and other operating revenues*
|
$ | 244,371 | $ | 198,198 | $ | 167,402 | |||||||
|
Income from equity affiliates
|
7,363 | 5,637 | 3,316 | ||||||||||
|
Other income
|
1,972 | 1,093 | 918 | ||||||||||
|
Total Revenues and Other Income
|
253,706 | 204,928 | 171,636 | ||||||||||
|
Costs and Other Deductions
|
|||||||||||||
|
Purchased crude oil and products
|
149,923 | 116,467 | 99,653 | ||||||||||
|
Operating expenses
|
21,649 | 19,188 | 17,857 | ||||||||||
|
Selling, general and administrative expenses
|
4,745 | 4,767 | 4,527 | ||||||||||
|
Exploration expenses
|
1,216 | 1,147 | 1,342 | ||||||||||
|
Depreciation, depletion and amortization
|
12,911 | 13,063 | 12,110 | ||||||||||
|
Taxes other than on income*
|
15,628 | 18,191 | 17,591 | ||||||||||
|
Interest and debt expense
|
– | 50 | 28 | ||||||||||
|
Total Costs and Other Deductions
|
206,072 | 172,873 | 153,108 | ||||||||||
|
Income Before Income Tax Expense
|
47,634 | 32,055 | 18,528 | ||||||||||
|
Income Tax Expense
|
20,626 | 12,919 | 7,965 | ||||||||||
|
Net Income
|
27,008 | 19,136 | 10,563 | ||||||||||
|
Less: Net income attributable to noncontrolling interests
|
113 | 112 | 80 | ||||||||||
|
Net Income Attributable to Chevron Corporation
|
$ | 26,895 | $ | 19,024 | $ | 10,483 | |||||||
|
Per Share of Common Stock
|
|||||||||||||
|
Net Income Attributable to Chevron Corporation
|
|||||||||||||
|
– Basic
|
$ | 13.54 | $ | 9.53 | $ | 5.26 | |||||||
|
– Diluted
|
$ | 13.44 | $ | 9.48 | $ | 5.24 | |||||||
|
*Includes excise, value-added and similar taxes.
|
$ | 8,085 | $ | 8,591 | $ | 8,109 | |||||||
FS-23
Table of Contents
Millions of dollars
| Year ended December 31 | |||||||||||||
| 2011 | 2010 | 2009 | |||||||||||
|
Net Income
|
$ | 27,008 | $ | 19,136 | $ | 10,563 | |||||||
|
Currency translation adjustment
|
|||||||||||||
|
Unrealized net change arising during period
|
17 | 6 | 60 | ||||||||||
|
Unrealized holding (loss) gain on securities
|
|||||||||||||
|
Net (loss) gain arising during period
|
(11 | ) | (4 | ) | 2 | ||||||||
|
Derivatives
|
|||||||||||||
|
Net derivatives gain (loss) on hedge transactions
|
20 | 25 | (69 | ) | |||||||||
|
Reclassification to net income of net realized loss (gain)
|
9 | 5 | (23 | ) | |||||||||
|
Income taxes on derivatives transactions
|
(10 | ) | (10 | ) | 32 | ||||||||
|
Total
|
19 | 20 | (60 | ) | |||||||||
|
Defined benefit plans
|
|||||||||||||
|
Actuarial loss
|
|||||||||||||
|
Amortization to net income of net actuarial loss
|
773 | 635 | 575 | ||||||||||
|
Actuarial loss arising during period
|
(3,250 | ) | (857 | ) | (1,099 | ) | |||||||
|
Prior service cost
|
|||||||||||||
|
Amortization to net income of net prior service credits
|
(26 | ) | (61 | ) | (65 | ) | |||||||
|
Prior service cost arising during period
|
(27 | ) | (12 | ) | (34 | ) | |||||||
|
Defined benefit plans sponsored by equity affiliates
|
(81 | ) | (12 | ) | 65 | ||||||||
|
Income taxes on defined benefit plans
|
1,030 | 140 | 159 | ||||||||||
|
Total
|
(1,581 | ) | (167 | ) | (399 | ) | |||||||
|
Other Comprehensive Loss, Net of Tax
|
(1,556 | ) | (145 | ) | (397 | ) | |||||||
|
Comprehensive Income
|
25,452 | 18,991 | 10,166 | ||||||||||
|
Comprehensive income attributable to noncontrolling interests
|
(113 | ) | (112 | ) | (80 | ) | |||||||
|
Comprehensive Income Attributable to Chevron Corporation
|
$ | 25,339 | $ | 18,879 | $ | 10,086 | |||||||
FS-24
Table of Contents
Millions of dollars, except per-share amounts
| At December 31 | |||||||||
| 2011 | 2010 | ||||||||
|
Assets
|
|||||||||
|
Cash and cash equivalents
|
$ | 15,864 | $ | 14,060 | |||||
|
Time deposits
|
3,958 | 2,855 | |||||||
|
Marketable securities
|
249 | 155 | |||||||
|
Accounts and notes receivable (less allowance: 2011 – $98; 2010 – $184)
|
21,793 | 20,759 | |||||||
|
Inventories:
|
|||||||||
|
Crude oil and petroleum products
|
3,420 | 3,589 | |||||||
|
Chemicals
|
502 | 395 | |||||||
|
Materials, supplies and other
|
1,621 | 1,509 | |||||||
|
Total inventories
|
5,543 | 5,493 | |||||||
|
Prepaid expenses and other current assets
|
5,827 | 5,519 | |||||||
|
Total Current Assets
|
53,234 | 48,841 | |||||||
|
Long-term receivables, net
|
2,233 | 2,077 | |||||||
|
Investments and advances
|
22,868 | 21,520 | |||||||
|
Properties, plant and equipment, at cost
|
233,432 | 207,367 | |||||||
|
Less: Accumulated depreciation, depletion and amortization
|
110,824 | 102,863 | |||||||
|
Properties, plant and equipment, net
|
122,608 | 104,504 | |||||||
|
Deferred charges and other assets
|
3,889 | 3,210 | |||||||
|
Goodwill
|
4,642 | 4,617 | |||||||
|
Total Assets
|
$ | 209,474 | $ | 184,769 | |||||
|
Liabilities and Equity
|
|||||||||
|
Short-term debt
|
$ | 340 | $ | 187 | |||||
|
Accounts payable
|
22,147 | 19,259 | |||||||
|
Accrued liabilities
|
5,287 | 5,324 | |||||||
|
Federal and other taxes on income
|
4,584 | 2,776 | |||||||
|
Other taxes payable
|
1,242 | 1,466 | |||||||
|
Total Current Liabilities
|
33,600 | 29,012 | |||||||
|
Long-term debt
|
9,684 | 11,003 | |||||||
|
Capital lease obligations
|
128 | 286 | |||||||
|
Deferred credits and other noncurrent obligations
|
19,181 | 19,264 | |||||||
|
Noncurrent deferred income taxes
|
15,544 | 12,697 | |||||||
|
Reserves for employee benefit plans
|
9,156 | 6,696 | |||||||
|
Total Liabilities
|
87,293 | 78,958 | |||||||
|
Preferred stock (authorized 100,000,000 shares; $1.00 par value; none issued)
|
– | – | |||||||
|
Common stock (authorized 6,000,000,000 shares; $0.75 par value; 2,442,676,580 shares
issued at December 31, 2011 and 2010) |
1,832 | 1,832 | |||||||
|
Capital in excess of par value
|
15,156 | 14,796 | |||||||
|
Retained earnings
|
140,399 | 119,641 | |||||||
|
Accumulated other comprehensive loss
|
(6,022 | ) | (4,466 | ) | |||||
|
Deferred compensation and benefit plan trust
|
(298 | ) | (311 | ) | |||||
|
Treasury stock, at cost (2011 – 461,509,656 shares; 2010 – 435,195,799 shares)
|
(29,685 | ) | (26,411 | ) | |||||
|
Total Chevron Corporation Stockholders’ Equity
|
121,382 | 105,081 | |||||||
|
Noncontrolling interests
|
799 | 730 | |||||||
|
Total Equity
|
122,181 | 105,811 | |||||||
|
Total Liabilities and Equity
|
$ | 209,474 | $ | 184,769 | |||||
FS-25
Table of Contents
Millions of dollars
| Year ended December 31 | |||||||||||||
| 2011 | 2010 | 2009 | |||||||||||
|
Operating Activities
|
|||||||||||||
|
Net Income
|
$ | 27,008 | $ | 19,136 | $ | 10,563 | |||||||
|
Adjustments
|
|||||||||||||
|
Depreciation, depletion and amortization
|
12,911 | 13,063 | 12,110 | ||||||||||
|
Dry hole expense
|
377 | 496 | 552 | ||||||||||
|
Distributions less than income from equity affiliates
|
(570 | ) | (501 | ) | (103 | ) | |||||||
|
Net before-tax gains on asset retirements and sales
|
(1,495 | ) | (1,004 | ) | (1,255 | ) | |||||||
|
Net foreign currency effects
|
(103 | ) | 251 | 466 | |||||||||
|
Deferred income tax provision
|
1,589 | 559 | 467 | ||||||||||
|
Net decrease (increase) in operating working capital
|
2,318 | 76 | (2,301 | ) | |||||||||
|
Increase in long-term receivables
|
(150 | ) | (12 | ) | (258 | ) | |||||||
|
Decrease in other deferred charges
|
341 | 48 | 201 | ||||||||||
|
Cash contributions to employee pension plans
|
(1,467 | ) | (1,450 | ) | (1,739 | ) | |||||||
|
Other
|
339 | 697 | 670 | ||||||||||
|
Net Cash Provided by Operating Activities
|
41,098 | 31,359 | 19,373 | ||||||||||
|
Investing Activities
|
|||||||||||||
|
Acquisition of Atlas Energy
|
(3,009 | ) | – | – | |||||||||
|
Advance to Atlas Energy
|
(403 | ) | – | – | |||||||||
|
Capital expenditures
|
(26,500 | ) | (19,612 | ) | (19,843 | ) | |||||||
|
Proceeds and deposits related to asset sales
|
3,517 | 1,995 | 2,564 | ||||||||||
|
Net purchases of time deposits
|
(1,104 | ) | (2,855 | ) | – | ||||||||
|
Net (purchases) sales of marketable securities
|
(74 | ) | (49 | ) | 127 | ||||||||
|
Repayment of loans by equity affiliates
|
339 | 338 | 336 | ||||||||||
|
Net (purchases) sales of other short-term investments
|
(255 | ) | (732 | ) | 244 | ||||||||
|
Net Cash Used for Investing Activities
|
(27,489 | ) | (20,915 | ) | (16,572 | ) | |||||||
|
Financing Activities
|
|||||||||||||
|
Net borrowings (payments) of short-term obligations
|
23 | (212 | ) | (3,192 | ) | ||||||||
|
Proceeds from issuances of long-term debt
|
377 | 1,250 | 5,347 | ||||||||||
|
Repayments of long-term debt and other financing obligations
|
(2,769 | ) | (156 | ) | (496 | ) | |||||||
|
Cash dividends – common stock
|
(6,139 | ) | (5,674 | ) | (5,302 | ) | |||||||
|
Distributions to noncontrolling interests
|
(71 | ) | (72 | ) | (71 | ) | |||||||
|
Net (purchases) sales of treasury shares
|
(3,193 | ) | (306 | ) | 168 | ||||||||
|
Net Cash Used for Financing Activities
|
(11,772 | ) | (5,170 | ) | (3,546 | ) | |||||||
|
Effect of Exchange Rate Changes
on Cash and Cash Equivalents |
(33 | ) | 70 | 114 | |||||||||
|
Net Change in Cash and Cash Equivalents
|
1,804 | 5,344 | (631 | ) | |||||||||
|
Cash and Cash Equivalents at January 1
|
14,060 | 8,716 | 9,347 | ||||||||||
|
Cash and Cash Equivalents at December 31
|
$ | 15,864 | $ | 14,060 | $ | 8,716 | |||||||
FS-26
Table of Contents
| 2011 | 2010 | 2009 | |||||||||||||||||||||||
| Shares | Amount | Shares | Amount | Shares | Amount | ||||||||||||||||||||
|
Preferred Stock
|
– | $ | – | – | $ | – | – | $ | – | ||||||||||||||||
|
Common Stock
|
2,442,677 | $ | 1,832 | 2,442,677 | $ | 1,832 | 2,442,677 | $ | 1,832 | ||||||||||||||||
|
Capital in Excess of Par
|
|||||||||||||||||||||||||
|
Balance at January 1
|
$ | 14,796 | $ | 14,631 | $ | 14,448 | |||||||||||||||||||
|
Treasury stock transactions
|
360 | 165 | 183 | ||||||||||||||||||||||
|
Balance at December 31
|
$ | 15,156 | $ | 14,796 | $ | 14,631 | |||||||||||||||||||
|
Retained Earnings
|
|||||||||||||||||||||||||
|
Balance at January 1
|
$ | 119,641 | $ | 106,289 | $ | 101,102 | |||||||||||||||||||
|
Net income attributable to Chevron Corporation
|
26,895 | 19,024 | 10,483 | ||||||||||||||||||||||
|
Cash dividends on common stock
|
(6,139 | ) | (5,674 | ) | (5,302 | ) | |||||||||||||||||||
|
Tax benefit from dividends paid on
unallocated ESOP shares and other |
2 | 2 | 6 | ||||||||||||||||||||||
|
Balance at December 31
|
$ | 140,399 | $ | 119,641 | $ | 106,289 | |||||||||||||||||||
|
Accumulated Other Comprehensive Loss
|
|||||||||||||||||||||||||
|
Currency translation adjustment
|
|||||||||||||||||||||||||
|
Balance at January 1
|
$ | (105 | ) | $ | (111 | ) | $ | (171 | ) | ||||||||||||||||
|
Change during year
|
17 | 6 | 60 | ||||||||||||||||||||||
|
Balance at December 31
|
$ | (88 | ) | $ | (105 | ) | $ | (111 | ) | ||||||||||||||||
|
Pension and other postretirement benefit plans
|
|||||||||||||||||||||||||
|
Balance at January 1
|
$ | (4,475 | ) | $ | (4,308 | ) | $ | (3,909 | ) | ||||||||||||||||
|
Change during year
|
(1,581 | ) | (167 | ) | (399 | ) | |||||||||||||||||||
|
Balance at December 31
|
$ | (6,056 | ) | $ | (4,475 | ) | $ | (4,308 | ) | ||||||||||||||||
|
Unrealized net holding gain on securities
|
|||||||||||||||||||||||||
|
Balance at January 1
|
$ | 11 | $ | 15 | $ | 13 | |||||||||||||||||||
|
Change during year
|
(11 | ) | (4 | ) | 2 | ||||||||||||||||||||
|
Balance at December 31
|
$ | – | $ | 11 | $ | 15 | |||||||||||||||||||
|
Net derivatives gain (loss) on hedge transactions
|
|||||||||||||||||||||||||
|
Balance at January 1
|
$ | 103 | $ | 83 | $ | 143 | |||||||||||||||||||
|
Change during year
|
19 | 20 | (60 | ) | |||||||||||||||||||||
|
Balance at December 31
|
$ | 122 | $ | 103 | $ | 83 | |||||||||||||||||||
|
Balance at December 31
|
$ | (6,022 | ) | $ | (4,466 | ) | $ | (4,321 | ) | ||||||||||||||||
|
Deferred Compensation and Benefit Plan Trust
|
|||||||||||||||||||||||||
|
Deferred Compensation
|
|||||||||||||||||||||||||
|
Balance at January 1
|
$ | (71 | ) | $ | (109 | ) | $ | (194 | ) | ||||||||||||||||
|
Net reduction of ESOP debt and other
|
13 | 38 | 85 | ||||||||||||||||||||||
|
Balance at December 31
|
(58 | ) | (71 | ) | (109 | ) | |||||||||||||||||||
|
Benefit Plan Trust (Common Stock)
|
14,168 | (240 | ) | 14,168 | (240 | ) | 14,168 | (240 | ) | ||||||||||||||||
|
Balance at December 31
|
14,168 | $ | (298 | ) | 14,168 | $ | (311 | ) | 14,168 | $ | (349 | ) | |||||||||||||
|
Treasury Stock at Cost
|
|||||||||||||||||||||||||
|
Balance at January 1
|
435,196 | $ | (26,411 | ) | 434,955 | $ | (26,168 | ) | 438,445 | $ | (26,376 | ) | |||||||||||||
|
Purchases
|
42,424 | (4,262 | ) | 9,091 | (775 | ) | 85 | (6 | ) | ||||||||||||||||
|
Issuances – mainly employee benefit plans
|
(16,110 | ) | 988 | (8,850 | ) | 532 | (3,575 | ) | 214 | ||||||||||||||||
|
Balance at December 31
|
461,510 | $ | (29,685 | ) | 435,196 | $ | (26,411 | ) | 434,955 | $ | (26,168 | ) | |||||||||||||
|
Total Chevron Corporation Stockholders’ Equity
at December 31 |
$ | 121,382 | $ | 105,081 | $ | 91,914 | |||||||||||||||||||
|
Noncontrolling Interests
|
$ | 799 | $ | 730 | $ | 647 | |||||||||||||||||||
|
Total Equity
|
$ | 122,181 | $ | 105,811 | $ | 92,561 | |||||||||||||||||||
FS-27
Table of Contents
Millions of dollars, except per-share amounts
FS-28
Table of Contents
FS-29
Table of Contents
Millions of dollars, except per-share amounts
| Millions of Dollars | At February 17, 2011 | |||
|
Current assets
|
$ | 155 | ||
|
Investments and long-term receivables
|
456 | |||
|
Properties
|
6,051 | |||
|
Goodwill
|
27 | |||
|
Other assets
|
5 | |||
|
Total assets acquired
|
6,694 | |||
|
Current liabilities
|
(560 | ) | ||
|
Long-term debt and capital leases
|
(761 | ) | ||
|
Deferred income taxes
|
(1,915 | ) | ||
|
Other liabilities
|
(25 | ) | ||
|
Total liabilities assumed
|
(3,261 | ) | ||
|
Net assets acquired
|
$ | 3,433 | ||
FS-30
Table of Contents
| 2011 | 2010 | 2009 | |||||||||||
|
Balance at January 1
|
$ | 730 | $ | 647 | $ | 469 | |||||||
|
Net income
|
113 | 112 | 80 | ||||||||||
|
Distributions to
noncontrolling interests
|
(71 | ) | (72 | ) | (71 | ) | |||||||
|
Other changes, net
|
27 | 43 | 169 | ||||||||||
|
Balance at December 31
|
$ | 799 | $ | 730 | $ | 647 | |||||||
| Year ended December 31 | |||||||||||||
| 2011 | 2010 | 2009 | |||||||||||
|
Net decrease (increase) in operating
working capital was composed of the following: |
|||||||||||||
|
Increase in accounts and
notes receivable |
$ | (2,156 | ) | $ | (2,767 | ) | $ | (1,476 | ) | ||||
|
(Increase) decrease in inventories
|
(404 | ) | 15 | 1,213 | |||||||||
|
Increase in prepaid expenses and
other current assets |
(853 | ) | (542 | ) | (264 | ) | |||||||
|
Increase (decrease) in accounts
payable and accrued liabilities |
3,839 | 3,049 | (1,121 | ) | |||||||||
|
Increase (decrease) in income and
other taxes payable |
1,892 | 321 | (653 | ) | |||||||||
|
Net decrease (increase) in operating
working capital |
$ | 2,318 | $ | 76 | $ | (2,301 | ) | ||||||
|
Net cash provided by operating
activities includes the following cash payments for interest and income taxes: |
|||||||||||||
|
Interest paid on debt
(net of capitalized interest) |
$ | – | $ | 34 | $ | – | |||||||
|
Income taxes
|
$ | 17,374 | $ | 11,749 | $ | 7,537 | |||||||
|
Net sales of marketable securities
consisted of the following gross amounts: |
|||||||||||||
|
Marketable securities purchased
|
$ | (112 | ) | $ | (90 | ) | $ | (30 | ) | ||||
|
Marketable securities sold
|
38 | 41 | 157 | ||||||||||
|
Net (purchases) sales of marketable
securities |
$ | (74 | ) | $ | (49 | ) | $ | 127 | |||||
|
Net purchases of time deposits
consisted of the following gross amounts: |
|||||||||||||
|
Time deposits purchased
|
$ | (6,439 | ) | $ | (5,060 | ) | $ | – | |||||
|
Time deposits matured
|
5,335 | 2,205 | – | ||||||||||
|
Net purchases of time deposits
|
$ | (1,104 | ) | $ | (2,855 | ) | $ | – | |||||
FS-31
Table of Contents
Millions of dollars, except per-share amounts
of Cash Flows - Continued
| Year ended December 31 | |||||||||||||
| 2011 | 2010 | 2009 | |||||||||||
|
Additions to properties, plant
and equipment 1 |
$ | 25,440 | $ | 18,474 | $ | 16,107 | |||||||
|
Additions to investments
|
900 | 861 | 942 | ||||||||||
|
Current year dry hole expenditures
|
332 | 414 | 468 | ||||||||||
|
Payments for other liabilities
and assets, net 2 |
(172 | ) | (137 | ) | 2,326 | ||||||||
|
Capital expenditures
|
26,500 | 19,612 | 19,843 | ||||||||||
|
Expensed exploration expenditures
|
839 | 651 | 790 | ||||||||||
|
Assets acquired through capital
lease obligations and other financing obligations |
32 | 104 | 19 | ||||||||||
|
Capital and exploratory
expenditures,
excluding equity affiliates |
27,371 | 20,367 | 20,652 | ||||||||||
|
Company’s share of expenditures
by equity affiliates |
1,695 | 1,388 | 1,585 | ||||||||||
|
Capital and exploratory
expenditures,
including equity affiliates |
$ | 29,066 | $ | 21,755 | $ | 22,237 | |||||||
| 1 Excludes noncash additions of $945 in 2011, $2,753 in 2010 and $985 in 2009. | ||
| 2 2009 includes payments of $2,450 for accruals recorded in 2008. | ||
FS-32
Table of Contents
| Year ended December 31 | |||||||||||||
| 2011 | 2010 | 2009 | |||||||||||
|
Sales and
other operating
revenues |
$ | 187,917 | $ | 145,381 | $ | 121,553 | |||||||
|
Total costs and other deductions
|
178,498 | 139,984 | 120,053 | ||||||||||
|
Net income attributable to CUSA
|
6,899 | 4,159 | 1,141 | ||||||||||
| At December 31 | |||||||||
| 2011 | 2010 | ||||||||
|
Current assets
|
$ | 34,478 | $ | 29,211 | |||||
|
Other assets
|
47,556 | 35,294 | |||||||
|
Current liabilities
|
19,082 | 18,098 | |||||||
|
Other liabilities
|
26,153 | 16,785 | |||||||
|
Total CUSA net equity
|
36,799 | 29,622 | |||||||
|
|
|||||||||
|
Memo: Total debt
|
$ | 14,763 | $ | 8,284 | |||||
| Year ended December 31 | |||||||||||||
| 2011 | 2010 | 2009 | |||||||||||
|
Sales and other operating revenues
|
$ | 793 | $ | 885 | $ | 683 | |||||||
|
Total costs and other deductions
|
974 | 1,008 | 810 | ||||||||||
|
Net loss attributable to CTC
|
(177 | ) | (116 | ) | (124 | ) | |||||||
| At December 31 | |||||||||
| 2011 | 2010* | ||||||||
|
Current assets
|
$ | 290 | $ | 309 | |||||
|
Other assets
|
228 | 201 | |||||||
|
Current liabilities
|
114 | 101 | |||||||
|
Other liabilities
|
346 | 175 | |||||||
|
Total CTC net equity
|
58 | 234 | |||||||
| * | 2010 current assets and other liabilities conformed with 2011 presentation. |
| Year ended December 31 | |||||||||||||
| 2011 | 2010 | 2009 | |||||||||||
|
Sales and other operating revenues
|
$ | 25,278 | $ | 17,812 | $ | 12,013 | |||||||
|
Costs and other deductions
|
10,941 | 8,394 | 6,044 | ||||||||||
|
Net income attributable to TCO
|
10,039 | 6,593 | 4,178 | ||||||||||
| At December 31 | |||||||||
| 2011 | 2010 | ||||||||
|
Current assets
|
$ | 3,477 | $ | 3,376 | |||||
|
Other assets
|
11,619 | 11,813 | |||||||
|
Current liabilities
|
2,995 | 2,402 | |||||||
|
Other liabilities
|
3,759 | 4,130 | |||||||
|
Total TCO net equity
|
8,342 | 8,657 | |||||||
| At December 31 | |||||||||
| 2011 | 2010 | ||||||||
|
Upstream
|
$ | 585 | $ | 561 | |||||
|
Downstream
|
316 | 316 | |||||||
|
All Other
|
– | 169 | |||||||
|
Total
|
901 | 1,046 | |||||||
|
Less: Accumulated amortization
|
568 | 573 | |||||||
|
Net capitalized leased assets
|
$ | 333 | $ | 473 | |||||
| Year ended December 31 | |||||||||||||
| 2011 | 2010* | 2009* | |||||||||||
|
Minimum rentals
|
$ | 892 | $ | 931 | $ | 933 | |||||||
|
Contingent rentals
|
11 | 10 | 7 | ||||||||||
|
Total
|
903 | 941 | 940 | ||||||||||
|
Less:
Sublease rental income
|
39 | 41 | 41 | ||||||||||
|
Net rental expense
|
$ | 864 | $ | 900 | $ | 899 | |||||||
| * | Prior years have been adjusted to exclude cost of certain charters from rental expenses. |
FS-33
Table of Contents
Millions of dollars, except per-share amounts
| At December 31 | |||||||||
| Operating | Capital | ||||||||
| Leases | Leases | ||||||||
|
Year: 2012
|
693 | 70 | |||||||
|
2013
|
632 | 47 | |||||||
|
2014
|
523 | 32 | |||||||
|
2015
|
475 | 21 | |||||||
|
2016
|
393 | 13 | |||||||
|
Thereafter
|
793 | 68 | |||||||
|
Total
|
$ | 3,509 | $ | 251 | |||||
|
Less: Amounts representing interest
and executory costs |
(55 | ) | |||||||
|
Net present values
|
196 | ||||||||
|
Less: Capital lease obligations
included in short-term debt |
(68 | ) | |||||||
|
Long-term capital lease obligations
|
$ | 128 | |||||||
| At December 31, 2011 | At December 31, 2010 | ||||||||||||||||||||||||||||||||
| Total | Level 1 | Level 2 | Level 3 | Total | Level 1 | Level 2 | Level 3 | ||||||||||||||||||||||||||
|
Marketable securities
|
249 | 249 | – | – | 155 | 155 | – | – | |||||||||||||||||||||||||
|
Derivatives
|
208 | 104 | 104 | – | 122 | 11 | 111 | – | |||||||||||||||||||||||||
|
Total Assets at Fair Value
|
$ | 457 | $ | 353 | $ | 104 | $ | – | $ | 277 | $ | 166 | $ | 111 | $ | – | |||||||||||||||||
|
Derivatives
|
102 | 101 | 1 | – | 171 | 75 | 96 | – | |||||||||||||||||||||||||
|
Total Liabilities at Fair Value
|
$ | 102 | $ | 101 | $ | 1 | $ | – | $ | 171 | $ | 75 | $ | 96 | $ | – | |||||||||||||||||
FS-34
Table of Contents
| At December 31 | At December 31 | ||||||||||||||||||||||||||||||||||||||||
| Before-Tax | Before-Tax | ||||||||||||||||||||||||||||||||||||||||
| Loss | Loss | ||||||||||||||||||||||||||||||||||||||||
| Total | Level 1 | Level 2 | Level 3 | Year 2011 | Total | Level 1 | Level 2 | Level 3 | Year 2010 | ||||||||||||||||||||||||||||||||
|
Properties, plant and
equipment, net (held and used) |
$ | 67 | $ | – | $ | – | $ | 67 | $ | 81 | $ | 57 | $ | – | $ | – | $ | 57 | $ | 85 | |||||||||||||||||||||
|
Properties, plant and
equipment, net (held for sale) |
167 | – | 167 | – | 54 | 13 | – | – | 13 | 36 | |||||||||||||||||||||||||||||||
|
Investments and advances
|
– | – | – | – | 108 | – | – | – | – | 15 | |||||||||||||||||||||||||||||||
|
Total Nonrecurring
Assets at Fair Value |
$ | 234 | $ | – | $ | 167 | $ | 67 | $ | 243 | $ | 70 | $ | – | $ | – | $ | 70 | $ | 136 | |||||||||||||||||||||
FS-35
Table of Contents
Millions of dollars, except per-share amounts
| Balance Sheet | At December 31 | At December 31 | |||||||||||
| Type of Contract | Classification | 2011 | 2010 | ||||||||||
| Commodity |
Accounts and
notes receivable, net |
$ | 133 | $ | 58 | ||||||||
| Commodity |
Long-term
receivables, net |
75 | 64 | ||||||||||
|
Total Assets at
Fair Value
|
$ | 208 | $ | 122 | |||||||||
| Commodity |
Accounts payable
|
$ | 36 | $ | 131 | ||||||||
| Commodity |
Deferred credits and other
noncurrent obligations |
66 | 40 | ||||||||||
|
Total Liabilities
at Fair Value
|
$ | 102 | $ | 171 | |||||||||
| Gain/(Loss) | |||||||||||||||||
| Type of Derivative | Statement of | Year ended December 31 | |||||||||||||||
| Contract | Income Classification | 2011 | 2010 | 2009 | |||||||||||||
| Foreign Exchange |
Other income
|
$ | – | $ | – | $ | 26 | ||||||||||
| Commodity |
Sales and other
operating revenues |
(255 | ) | (98 | ) | (94 | ) | ||||||||||
| Commodity |
Purchased crude oil
and products |
15 | (36 | ) | (353 | ) | |||||||||||
| Commodity |
Other income
|
(2 | ) | (1 | ) | – | |||||||||||
|
|
$ | (242 | ) | $ | (135 | ) | $ | (421 | ) | ||||||||
FS-36
Table of Contents
FS-37
Table of Contents
Millions of dollars, except per-share amounts
| Year ended December 31 | |||||||||||||
| 2011 | 2010 | 2009 | |||||||||||
|
Segment Earnings
|
|||||||||||||
|
Upstream
|
|||||||||||||
|
United States
|
$ | 6,512 | $ | 4,122 | $ | 2,262 | |||||||
|
International
|
18,274 | 13,555 | 8,670 | ||||||||||
|
Total Upstream
|
24,786 | 17,677 | 10,932 | ||||||||||
|
Downstream
|
|||||||||||||
|
United States
|
1,506 | 1,339 | (121 | ) | |||||||||
|
International
|
2,085 | 1,139 | 594 | ||||||||||
|
Total Downstream
|
3,591 | 2,478 | 473 | ||||||||||
|
Total Segment Earnings
|
28,377 | 20,155 | 11,405 | ||||||||||
|
All Other
|
|||||||||||||
|
Interest expense
|
– | (41 | ) | (22 | ) | ||||||||
|
Interest income
|
78 | 70 | 46 | ||||||||||
|
Other
|
(1,560 | ) | (1,160 | ) | (946 | ) | |||||||
|
Net Income Attributable
to Chevron Corporation |
$ | 26,895 | $ | 19,024 | $ | 10,483 | |||||||
| At December 31 | |||||||||
| 2011 | 2010 | ||||||||
|
Upstream
|
|||||||||
|
United States
|
$ | 37,108 | $ | 26,319 | |||||
|
International
|
98,540 | 89,306 | |||||||
|
Goodwill
|
4,642 | 4,617 | |||||||
|
Total Upstream
|
140,290 | 120,242 | |||||||
|
Downstream
|
|||||||||
|
United States
|
22,182 | 21,406 | |||||||
|
International
|
20,517 | 20,559 | |||||||
|
Total Downstream
|
42,699 | 41,965 | |||||||
|
Total Segment Assets
|
182,989 | 162,207 | |||||||
|
All Other*
|
|||||||||
|
United States
|
8,824 | 11,125 | |||||||
|
International
|
17,661 | 11,437 | |||||||
|
Total All Other
|
26,485 | 22,562 | |||||||
|
Total
Assets – United States
|
68,114 | 58,850 | |||||||
|
Total
Assets – International
|
136,718 | 121,302 | |||||||
|
Goodwill
|
4,642 | 4,617 | |||||||
|
Total Assets
|
$ | 209,474 | $ | 184,769 | |||||
| * | “All Other” assets consist primarily of worldwide cash, cash equivalents, time deposits and marketable securities, real estate, energy services, information systems, mining operations, power generation businesses, alternative fuels and technology companies, and assets of the corporate administrative functions. | |
| Year ended December 31 | |||||||||||||
| 2011 | 2010 | 2009* | |||||||||||
|
Upstream
|
|||||||||||||
|
United States
|
$ | 9,623 | $ | 10,316 | $ | 9,225 | |||||||
|
Intersegment
|
18,115 | 13,839 | 10,297 | ||||||||||
|
Total United States
|
27,738 | 24,155 | 19,522 | ||||||||||
|
International
|
20,086 | 17,300 | 13,463 | ||||||||||
|
Intersegment
|
35,012 | 23,834 | 18,477 | ||||||||||
|
Total International
|
55,098 | 41,134 | 31,940 | ||||||||||
|
Total Upstream
|
82,836 | 65,289 | 51,462 | ||||||||||
|
Downstream
|
|||||||||||||
|
United States
|
86,793 | 70,436 | 58,056 | ||||||||||
|
Excise and similar taxes
|
4,199 | 4,484 | 4,573 | ||||||||||
|
Intersegment
|
86 | 115 | 98 | ||||||||||
|
Total United States
|
91,078 | 75,035 | 62,727 | ||||||||||
|
International
|
119,254 | 90,922 | 77,845 | ||||||||||
|
Excise and similar taxes
|
3,886 | 4,107 | 3,536 | ||||||||||
|
Intersegment
|
81 | 93 | 87 | ||||||||||
|
Total International
|
123,221 | 95,122 | 81,468 | ||||||||||
|
Total Downstream
|
214,299 | 170,157 | 144,195 | ||||||||||
|
All Other
|
|||||||||||||
|
United States
|
526 | 610 | 665 | ||||||||||
|
Intersegment
|
1,072 | 947 | 964 | ||||||||||
|
Total United States
|
1,598 | 1,557 | 1,629 | ||||||||||
|
International
|
4 | 23 | 39 | ||||||||||
|
Intersegment
|
42 | 39 | 33 | ||||||||||
|
Total International
|
46 | 62 | 72 | ||||||||||
|
Total All Other
|
1,644 | 1,619 | 1,701 | ||||||||||
|
Segment Sales and Other
Operating Revenues |
|||||||||||||
|
United States
|
120,414 | 100,747 | 83,878 | ||||||||||
|
International
|
178,365 | 136,318 | 113,480 | ||||||||||
|
Total Segment Sales and Other
Operating Revenues |
298,779 | 237,065 | 197,358 | ||||||||||
|
Elimination of intersegment sales
|
(54,408 | ) | (38,867 | ) | (29,956 | ) | |||||||
|
Total Sales and Other
Operating Revenues |
$ | 244,371 | $ | 198,198 | $ | 167,402 | |||||||
| * | 2009 conformed with 2010 and 2011 presentation. | |
FS-38
Table of Contents
| Year ended December 31 | |||||||||||||
| 2011 | 2010 | 2009 | |||||||||||
|
Upstream
|
|||||||||||||
|
United States
|
$ | 3,701 | $ | 2,285 | $ | 1,251 | |||||||
|
International
|
16,743 | 10,480 | 7,451 | ||||||||||
|
Total Upstream
|
20,444 | 12,765 | 8,702 | ||||||||||
|
Downstream
|
|||||||||||||
|
United States
|
785 | 680 | (83 | ) | |||||||||
|
International
|
416 | 462 | 463 | ||||||||||
|
Total Downstream
|
1,201 | 1,142 | 380 | ||||||||||
|
All Other
|
(1,019 | ) | (988 | ) | (1,117 | ) | |||||||
|
Total Income Tax Expense
|
$ | 20,626 | $ | 12,919 | $ | 7,965 | |||||||
| Investments and Advances | Equity in Earnings | ||||||||||||||||||||
| At December 31 | Year ended December 31 | ||||||||||||||||||||
| 2011 | 2010 | 2011 | 2010 | 2009 | |||||||||||||||||
|
Upstream
|
|||||||||||||||||||||
|
Tengizchevroil
|
$ | 5,306 | $ | 5,789 | $ | 5,097 | $ | 3,398 | $ | 2,216 | |||||||||||
|
Petropiar
|
909 | 973 | 116 | 262 | 122 | ||||||||||||||||
|
Caspian
Pipeline Consortium
|
1,094 | 974 | 122 | 124 | 105 | ||||||||||||||||
|
Petroboscan
|
1,032 | 937 | 247 | 222 | 171 | ||||||||||||||||
|
Angola LNG Limited
|
2,921 | 2,481 | (42 | ) | (21 | ) | (12 | ) | |||||||||||||
|
Other
|
2,420 | 1,922 | 166 | 319 | 287 | ||||||||||||||||
|
Total Upstream
|
13,682 | 13,076 | 5,706 | 4,304 | 2,889 | ||||||||||||||||
|
Downstream
|
|||||||||||||||||||||
|
GS Caltex Corporation
|
2,572 | 2,496 | 248 | 158 | (191 | ) | |||||||||||||||
|
Chevron Phillips Chemical
Company LLC
|
2,909 | 2,419 | 985 | 704 | 328 | ||||||||||||||||
|
Star Petroleum Refining
Company Ltd.
|
1,022 | 947 | 75 | 122 | (4 | ) | |||||||||||||||
|
Caltex Australia Ltd.
|
819 | 767 | 117 | 101 | 11 | ||||||||||||||||
|
Colonial Pipeline Company
|
– | – | – | 43 | 51 | ||||||||||||||||
|
Other
|
630 | 602 | 183 | 151 | 149 | ||||||||||||||||
|
Total Downstream
|
7,952 | 7,231 | 1,608 | 1,279 | 344 | ||||||||||||||||
|
All Other
|
|||||||||||||||||||||
|
Other
|
516 | 509 | 49 | 54 | 83 | ||||||||||||||||
|
Total equity method
|
$ | 22,150 | $ | 20,816 | $ | 7,363 | $ | 5,637 | $ | 3,316 | |||||||||||
|
Other at or below cost
|
718 | 704 | |||||||||||||||||||
|
Total
investments and
advances
|
$ | 22,868 | $ | 21,520 | |||||||||||||||||
|
Total United States
|
$ | 4,847 | $ | 3,769 | $ | 1,119 | $ | 846 | $ | 511 | |||||||||||
|
Total International
|
$ | 18,021 | $ | 17,751 | $ | 6,244 | $ | 4,791 | $ | 2,805 | |||||||||||
FS-39
Table of Contents
Millions of dollars, except per-share amounts
| Affiliates | Chevron Share | ||||||||||||||||||||||||
| Year ended December 31 | 2011 | 2010 | 2009 | 2011 | 2010 | 2009 | |||||||||||||||||||
|
Total revenues
|
$ | 140,107 | $ | 107,505 | $ | 81,995 | $ | 68,632 | $ | 52,088 | $ | 39,280 | |||||||||||||
|
Income before income tax expense
|
23,054 | 18,468 | 11,083 | 10,555 | 7,966 | 4,511 | |||||||||||||||||||
|
Net income attributable to affiliates
|
16,663 | 12,831 | 8,261 | 7,413 | 5,683 | 3,285 | |||||||||||||||||||
|
At December 31
|
|||||||||||||||||||||||||
|
Current assets
|
$ | 35,573 | $ | 30,335 | $ | 27,111 | $ | 14,695 | $ | 12,845 | $ | 11,009 | |||||||||||||
|
Noncurrent assets
|
61,855 | 57,491 | 55,363 | 22,422 | 21,401 | 21,361 | |||||||||||||||||||
|
Current liabilities
|
24,671 | 20,428 | 17,450 | 11,040 | 9,363 | 7,833 | |||||||||||||||||||
|
Noncurrent liabilities
|
19,267 | 19,749 | 21,531 | 4,491 | 4,459 | 5,106 | |||||||||||||||||||
|
Total affiliates’ net equity
|
$ | 53,490 | $ | 47,649 | $ | 43,493 | $ | 21,586 | $ | 20,424 | $ | 19,431 | |||||||||||||
FS-40
Table of Contents
| At December 31 | Year ended December 31 | ||||||||||||||||||||||||||||||||||||||||||||||||||
| Gross Investment at Cost | Net Investment | Additions at Cost 2,3 | Depreciation Expense 4 | ||||||||||||||||||||||||||||||||||||||||||||||||
| 2011 | 2010 | 2009 | 2011 | 2010 | 2009 | 2011 | 2010 | 2009 | 2011 | 2010 | 2009 | ||||||||||||||||||||||||||||||||||||||||
|
Upstream
|
|||||||||||||||||||||||||||||||||||||||||||||||||||
|
United States
|
$ | 74,369 | $ | 62,523 | $ | 58,328 | $ | 33,461 | $ | 23,277 | $ | 22,273 | $ | 14,404 | $ | 4,934 | $ | 3,518 | $ | 3,870 | $ | 4,078 | $ | 3,992 | |||||||||||||||||||||||||||
|
International
|
125,795 | 110,578 | 96,557 | 72,543 | 64,388 | 57,450 | 15,722 | 14,381 | 10,803 | 7,590 | 7,448 | 6,669 | |||||||||||||||||||||||||||||||||||||||
|
Total Upstream
|
200,164 | 173,101 | 154,885 | 106,004 | 87,665 | 79,723 | 30,126 | 19,315 | 14,231 | 11,460 | 11,526 | 10,661 | |||||||||||||||||||||||||||||||||||||||
|
Downstream
|
|||||||||||||||||||||||||||||||||||||||||||||||||||
|
United States
|
20,699 | 19,820 | 18,962 | 10,723 | 10,379 | 10,032 | 1,226 | 1,199 | 1,874 | 776 | 741 | 666 | |||||||||||||||||||||||||||||||||||||||
|
International
|
7,422 | 9,697 | 9,852 | 2,995 | 3,948 | 4,154 | 443 | 361 | 456 | 332 | 451 | 454 | |||||||||||||||||||||||||||||||||||||||
|
Total Downstream
|
28,121 | 29,517 | 28,814 | 13,718 | 14,327 | 14,186 | 1,669 | 1,560 | 2,330 | 1,108 | 1,192 | 1,120 | |||||||||||||||||||||||||||||||||||||||
|
All Other
5
|
|||||||||||||||||||||||||||||||||||||||||||||||||||
|
United States
|
5,117 | 4,722 | 4,569 | 2,872 | 2,496 | 2,548 | 591 | 259 | 354 | 338 | 341 | 325 | |||||||||||||||||||||||||||||||||||||||
|
International
|
30 | 27 | 20 | 14 | 16 | 11 | 5 | 11 | 3 | 5 | 4 | 4 | |||||||||||||||||||||||||||||||||||||||
|
Total All Other
|
5,147 | 4,749 | 4,589 | 2,886 | 2,512 | 2,559 | 596 | 270 | 357 | 343 | 345 | 329 | |||||||||||||||||||||||||||||||||||||||
|
Total United States
|
100,185 | 87,065 | 81,859 | 47,056 | 36,152 | 34,853 | 16,221 | 6,392 | 5,746 | 4,984 | 5,160 | 4,983 | |||||||||||||||||||||||||||||||||||||||
|
Total International
|
133,247 | 120,302 | 106,429 | 75,552 | 68,352 | 61,615 | 16,170 | 14,753 | 11,262 | 7,927 | 7,903 | 7,127 | |||||||||||||||||||||||||||||||||||||||
|
Total
|
$ | 233,432 | $ | 207,367 | $ | 188,288 | $ | 122,608 | $ | 104,504 | $ | 96,468 | $ | 32,391 | $ | 21,145 | $ | 17,008 | $ | 12,911 | $ | 13,063 | $ | 12,110 | |||||||||||||||||||||||||||
| 1 | Other than the United States, Nigeria and Australia, no other country accounted for 10 percent or more of the company’s net properties, plant and equipment (PP&E) in 2011. Nigeria had PP&E of $15,601, $13,896 and $12,463 for 2011, 2010 and 2009, respectively. Australia had $12,423 in 2011. | |
| 2 | Net of dry hole expense related to prior years’ expenditures of $45, $82 and $84 in 2011, 2010 and 2009, respectively. | |
| 3 | Includes properties acquired with the acquisition of Atlas Energy, Inc. in 2011. | |
| 4 | Depreciation expense includes accretion expense of $628, $513 and $463 in 2011, 2010 and 2009, respectively. | |
| 5 | Primarily mining operations, power generation businesses, real estate assets and management information systems. | |
FS-41
Table of Contents
Millions of dollars, except per-share amounts
FS-42
Table of Contents
| Year ended December 31 | |||||||||||||
| 2011 | 2010 | 2009 | |||||||||||
|
Taxes on income
|
|||||||||||||
|
U.S. Federal
|
|||||||||||||
|
Current
|
$ | 1,893 | $ | 1,501 | $ | 128 | |||||||
|
Deferred
|
877 | 162 | (147 | ) | |||||||||
|
State and local
|
|||||||||||||
|
Current
|
596 | 376 | 216 | ||||||||||
|
Deferred
|
41 | 20 | 14 | ||||||||||
|
Total United States
|
3,407 | 2,059 | 211 | ||||||||||
|
International
|
|||||||||||||
|
Current
|
16,548 | 10,483 | 7,154 | ||||||||||
|
Deferred
|
671 | 377 | 600 | ||||||||||
|
Total International
|
17,219 | 10,860 | 7,754 | ||||||||||
|
Total taxes on income
|
$ | 20,626 | $ | 12,919 | $ | 7,965 | |||||||
FS-43
Table of Contents
Millions of dollars, except per-share amounts
The reconciliation between the U.S. statutory federal income tax rate and the company’s effective income tax rate is detailed in the following table:
| Year ended December 31 | |||||||||||||
| 2011 | 2010 | 2009 | |||||||||||
|
U.S. statutory federal income tax rate
|
35.0 | % | 35.0 | % | 35.0 | % | |||||||
|
Effect of income taxes from inter-
national operations at rates different from the U.S. statutory rate |
7.5 | 5.2 | 10.4 | ||||||||||
|
State and local taxes on income, net
of U.S. federal income tax benefit |
0.9 | 0.8 | 0.9 | ||||||||||
|
Prior year tax adjustments
|
(0.1 | ) | (0.6 | ) | (0.3 | ) | |||||||
|
Tax credits
|
(0.4 | ) | (0.5 | ) | (1.1 | ) | |||||||
|
Effects of changes in tax rates
|
0.5 | – | 0.1 | ||||||||||
|
Other
|
(0.1 | ) | 0.4 | (2.0 | ) | ||||||||
|
Effective tax rate
|
43.3 | % | 40.3 | % | 43.0 | % | |||||||
| At December 31 | |||||||||
| 2011 | 2010 | ||||||||
|
Deferred tax liabilities
|
|||||||||
|
Properties, plant and equipment
|
$ | 23,597 | $ | 19,855 | |||||
|
Investments and other
|
2,271 | 2,401 | |||||||
|
Total deferred tax liabilities
|
25,868 | 22,256 | |||||||
|
Deferred tax assets
|
|||||||||
|
Foreign tax credits
|
(8,476 | ) | (6,669 | ) | |||||
|
Abandonment/environmental reserves
|
(5,387 | ) | (5,004 | ) | |||||
|
Employee benefits
|
(4,773 | ) | (3,627 | ) | |||||
|
Deferred credits
|
(1,548 | ) | (2,176 | ) | |||||
|
Tax loss carryforwards
|
(828 | ) | (882 | ) | |||||
|
Other accrued liabilities
|
(531 | ) | (486 | ) | |||||
|
Inventory
|
(360 | ) | (483 | ) | |||||
|
Miscellaneous
|
(1,595 | ) | (1,676 | ) | |||||
|
Total deferred tax assets
|
(23,498 | ) | (21,003 | ) | |||||
|
Deferred tax assets valuation allowance
|
11,096 | 9,185 | |||||||
|
Total deferred taxes, net
|
$ | 13,466 | $ | 10,438 | |||||
| At December 31 | |||||||||
| 2011 | 2010 | ||||||||
|
Prepaid expenses and other current assets
|
$ | (1,149 | ) | $ | (1,624 | ) | |||
|
Deferred charges and other assets
|
(1,224 | ) | (851 | ) | |||||
|
Federal and other taxes on income
|
295 | 216 | |||||||
|
Noncurrent deferred income taxes
|
15,544 | 12,697 | |||||||
|
Total deferred income taxes, net
|
$ | 13,466 | $ | 10,438 | |||||
FS-44
Table of Contents
| 2011 | 2010 | 2009 | |||||||||||
|
Balance at January 1
|
$ | 3,507 | $ | 3,195 | $ | 2,696 | |||||||
|
Foreign currency effects
|
(2 | ) | 17 | (1 | ) | ||||||||
|
Additions based on tax
positions
taken in current year |
469 | 334 | 459 | ||||||||||
|
Reductions based on tax
positions
taken in current year |
– | – | – | ||||||||||
|
Additions/reductions
resulting from
current-year asset acquisitions/sales |
(41 | ) | – | – | |||||||||
|
Additions for tax positions
taken
in prior years |
236 | 270 | 533 | ||||||||||
|
Reductions for tax positions
taken
in prior years |
(366 | ) | (165 | ) | (182 | ) | |||||||
|
Settlements with taxing
authorities
in current year |
(318 | ) | (136 | ) | (300 | ) | |||||||
|
Reductions as a result of a lapse
of the applicable statute of limitations |
(4 | ) | (8 | ) | (10 | ) | |||||||
|
Balance at December 31
|
$ | 3,481 | $ | 3,507 | $ | 3,195 | |||||||
| Year ended December 31 | |||||||||||||
| 2011 | 2010 | 2009 | |||||||||||
|
United States
|
|||||||||||||
|
Excise and similar taxes
on products and merchandise |
$ | 4,199 | $ | 4,484 | $ | 4,573 | |||||||
|
Import duties and other levies
|
4 | – | (4 | ) | |||||||||
|
Property and other
miscellaneous taxes |
726 | 567 | 584 | ||||||||||
|
Payroll taxes
|
236 | 219 | 223 | ||||||||||
|
Taxes on production
|
308 | 271 | 135 | ||||||||||
|
Total United States
|
5,473 | 5,541 | 5,511 | ||||||||||
|
International
|
|||||||||||||
|
Excise and similar taxes on
products and merchandise |
3,886 | 4,107 | 3,536 | ||||||||||
|
Import duties and other levies
|
3,511 | 6,183 | 6,550 | ||||||||||
|
Property and other
miscellaneous taxes |
2,354 | 2,000 | 1,740 | ||||||||||
|
Payroll taxes
|
148 | 133 | 134 | ||||||||||
|
Taxes on production
|
256 | 227 | 120 | ||||||||||
|
Total International
|
10,155 | 12,650 | 12,080 | ||||||||||
|
Total taxes other than on income
|
$ | 15,628 | $ | 18,191 | $ | 17,591 | |||||||
FS-45
Table of Contents
Millions of dollars, except per-share amounts
|
Short-Term Debt
|
| At December 31 | |||||||||
| 2011 | 2010 | ||||||||
|
Commercial paper*
|
$ | 2,498 | $ | 2,471 | |||||
|
Notes payable to banks and others with
originating terms of one year or less |
40 | 43 | |||||||
|
Current maturities of long-term debt
|
17 | 33 | |||||||
|
Current maturities of long-term
capital leases |
54 | 81 | |||||||
|
Redeemable long-term obligations
|
|||||||||
|
Long-term debt
|
3,317 | 2,943 | |||||||
|
Capital leases
|
14 | 16 | |||||||
|
Subtotal
|
5,940 | 5,587 | |||||||
|
Reclassified to long-term debt
|
(5,600 | ) | (5,400 | ) | |||||
|
Total short-term debt
|
$ | 340 | $ | 187 | |||||
| * | Weighted-average interest rates at December 31, 2011 and 2010, were 0.04 percent and 0.16 percent, respectively. |
| At December 31 | |||||||||
| 2011 | 2010 | ||||||||
|
3.95% notes due 2014
|
$ | 1,998 | $ | 1,998 | |||||
|
3.45% notes due 2012
|
– | 1,500 | |||||||
|
4.95% notes due 2019
|
1,500 | 1,500 | |||||||
|
8.625% debentures due 2032
|
147 | 147 | |||||||
|
8.625% debentures due 2031
|
107 | 107 | |||||||
|
7.5% debentures due 2043
|
83 | 83 | |||||||
|
8% debentures due 2032
|
74 | 74 | |||||||
|
7.327% amortizing notes due 2014
1
|
59 | 72 | |||||||
|
9.75% debentures due 2020
|
54 | 54 | |||||||
|
8.875% debentures due 2021
|
40 | 40 | |||||||
|
Medium-term notes, maturing from
2021 to 2038 (6.02%) 2 |
38 | 38 | |||||||
|
Fixed
interest rate notes, maturing 2011 (9.378%)
2
|
– | 19 | |||||||
|
Other long-term debt (8.07%)
2
|
1 | 4 | |||||||
|
Total including debt due within one year
|
4,101 | 5,636 | |||||||
|
Debt due within one year
|
(17 | ) | (33 | ) | |||||
|
Reclassified from short-term debt
|
5,600 | 5,400 | |||||||
|
Total long-term debt
|
$ | 9,684 | $ | 11,003 | |||||
| 1 | Guarantee of ESOP debt. | |
| 2 | Weighted-average interest rate at December 31, 2011 and 2010. |
FS-46
Table of Contents
| 2011 | 2010 | 2009 | |||||||||||
|
Beginning balance at January 1
|
$ | 2,718 | $ | 2,435 | $ | 2,118 | |||||||
|
Additions to capitalized exploratory
well costs pending the determination of proved reserves |
652 | 482 | 663 | ||||||||||
|
Reclassifications to wells, facilities
and equipment based on the determination of proved reserves |
(828 | ) | (129 | ) | (174 | ) | |||||||
|
Capitalized exploratory well costs
charged to expense |
(45 | ) | (70 | ) | (172 | ) | |||||||
|
Other reductions*
|
(63 | ) | – | – | |||||||||
|
Ending balance at December 31
|
$ | 2,434 | $ | 2,718 | $ | 2,435 | |||||||
| * | Represents property sales. |
| At December 31 | |||||||||||||
| 2011 | 2010 | 2009 | |||||||||||
|
Exploratory well costs capitalized
for a period of one year or less |
$ | 557 | $ | 419 | $ | 564 | |||||||
|
Exploratory well costs capitalized
for a period greater than one year |
1,877 | 2,299 | 1,871 | ||||||||||
|
Balance at December 31
|
$ | 2,434 | $ | 2,718 | $ | 2,435 | |||||||
|
Number of projects with exploratory
well costs that have been capitalized for a period greater than one year* |
47 | 53 | 46 | ||||||||||
| * | Certain projects have multiple wells or fields or both. |
FS-47
Table of Contents
Millions of dollars, except per-share amounts
| Number | ||||||||
| Aging based on drilling completion date of individual wells: | Amount | of wells | ||||||
|
1997–2000
|
$ | 49 | 16 | |||||
|
2001–2005
|
396 | 47 | ||||||
|
2006–2010
|
1,432 | 98 | ||||||
|
Total
|
$ | 1,877 | 161 | |||||
| Aging based on drilling completion date of last | Number | |||||||
| suspended well in project: | Amount | of projects | ||||||
|
1999
|
$ | 8 | 1 | |||||
|
2003–2006
|
345 | 10 | ||||||
|
2007–2011
|
1,524 | 36 | ||||||
|
Total
|
$ | 1,877 | 47 | |||||
FS-48
Table of Contents
| Year ended December 31 | |||||||||||||
| 2011 | 2010 | 2009 | |||||||||||
|
Stock Options
|
|||||||||||||
|
Expected term in years
1
|
6.2 | 6.1 | 6.0 | ||||||||||
|
Volatility
2
|
31.0 | % | 30.8 | % | 30.2 | % | |||||||
|
Risk-free interest rate based on
zero coupon U.S. treasury note |
2.6 | % | 2.9 | % | 2.1 | % | |||||||
|
Dividend yield
|
3.6 | % | 3.9 | % | 3.2 | % | |||||||
|
Weighted-average fair value per
option granted |
$ | 21.24 | $ | 16.28 | $ | 15.36 | |||||||
|
Restored Options
|
|||||||||||||
|
Expected term in years
1
|
1.2 | 1.2 | 1.2 | ||||||||||
|
Volatility
2
|
20.6 | % | 38.9 | % | 45.0 | % | |||||||
|
Risk-free interest rate based on
zero coupon U.S. treasury note |
0.7 | % | 0.6 | % | 1.1 | % | |||||||
|
Dividend yield
|
3.4 | % | 3.8 | % | 3.5 | % | |||||||
|
Weighted-average fair value per option
granted
|
$ | 7.55 | $ | 12.91 | $ | 12.38 | |||||||
| 1 | Expected term is based on historical exercise and postvesting cancellation data. | |
| 2 | Volatility rate is based on historical stock prices over an appropriate period, generally equal to the expected term. |
| Weighted- | ||||||||||||||||
| Weighted- | Average | |||||||||||||||
| Average | Remaining | Aggregate | ||||||||||||||
| Shares | Exercise | Contractual | Intrinsic | |||||||||||||
| (Thousands) | Price | Term | Value | |||||||||||||
|
Outstanding at
January 1, 2011 |
74,852 | $ | 67.04 | |||||||||||||
|
Granted
|
14,260 | $ | 94.46 | |||||||||||||
|
Exercised
|
(15,844 | ) | $ | 60.20 | ||||||||||||
|
Restored
|
33 | $ | 103.96 | |||||||||||||
|
Forfeited
|
(953 | ) | $ | 85.79 | ||||||||||||
|
Outstanding at
December 31, 2011 |
72,348 | $ | 73.71 | 6.4 yrs | $ | 2,365 | ||||||||||
|
Exercisable at
December 31, 2011 |
45,494 | $ | 67.84 | 5.3 yrs | $ | 1,755 | ||||||||||
FS-49
Table of Contents
Millions of dollars, except per-share amounts
| Pension Benefits | ||||||||||||||||||||||||||
| 2011 | 2010 | Other Benefits | ||||||||||||||||||||||||
| U.S. | Int’l. | U.S. | Int’l. | 2011 | 2010 | |||||||||||||||||||||
|
Change in Benefit Obligation
|
||||||||||||||||||||||||||
|
Benefit obligation at January 1
|
$ | 10,271 | $ | 5,070 | $ | 9,664 | $ | 4,715 | $ | 3,605 | $ | 3,065 | ||||||||||||||
|
Service cost
|
374 | 174 | 337 | 153 | 58 | 39 | ||||||||||||||||||||
|
Interest cost
|
463 | 325 | 486 | 307 | 180 | 175 | ||||||||||||||||||||
|
Plan participants’ contributions
|
– | 6 | – | 7 | 148 | 147 | ||||||||||||||||||||
|
Plan amendments
|
– | 27 | – | – | – | 12 | ||||||||||||||||||||
|
Actuarial loss (gain)
|
1,920 | 318 | 568 | 200 | 149 | 486 | ||||||||||||||||||||
|
Foreign currency exchange rate changes
|
– | (98 | ) | – | (17 | ) | (19 | ) | 11 | |||||||||||||||||
|
Benefits paid
|
(863 | ) | (303 | ) | (784 | ) | (295 | ) | (346 | ) | (330 | ) | ||||||||||||||
|
Curtailment
|
– | – | – | – | (10 | ) | – | |||||||||||||||||||
|
Benefit obligation at December 31
|
12,165 | 5,519 | 10,271 | 5,070 | 3,765 | 3,605 | ||||||||||||||||||||
|
Change in Plan Assets
|
||||||||||||||||||||||||||
|
Fair value of plan assets at January 1
|
8,579 | 3,503 | 7,304 | 3,235 | – | – | ||||||||||||||||||||
|
Actual return on plan assets
|
(143 | ) | 118 | 867 | 361 | – | – | |||||||||||||||||||
|
Foreign currency exchange rate changes
|
– | (66 | ) | – | (63 | ) | – | – | ||||||||||||||||||
|
Employer contributions
|
1,147 | 319 | 1,192 | 258 | 198 | 183 | ||||||||||||||||||||
|
Plan participants’ contributions
|
– | 6 | – | 7 | 148 | 147 | ||||||||||||||||||||
|
Benefits paid
|
(863 | ) | (303 | ) | (784 | ) | (295 | ) | (346 | ) | (330 | ) | ||||||||||||||
|
Fair value of plan assets at December 31
|
8,720 | 3,577 | 8,579 | 3,503 | – | – | ||||||||||||||||||||
|
Funded Status at December 31
|
$ | (3,445 | ) | $ | (1,942 | ) | $ | (1,692 | ) | $ | (1,567 | ) | $ | (3,765 | ) | $ | (3,605 | ) | ||||||||
| Pension Benefits | ||||||||||||||||||||||||||
| 2011 | 2010 | Other Benefits | ||||||||||||||||||||||||
| U.S. | Int’l. | U.S. | Int’l. | 2011 | 2010 | |||||||||||||||||||||
|
Deferred charges and other assets
|
$ | 5 | $ | 116 | $ | 7 | $ | 77 | $ | – | $ | – | ||||||||||||||
|
Accrued liabilities
|
(72 | ) | (84 | ) | (134 | ) | (71 | ) | (222 | ) | (225 | ) | ||||||||||||||
|
Reserves for employee benefit plans
|
(3,378 | ) | (1,974 | ) | (1,565 | ) | (1,573 | ) | (3,543 | ) | (3,380 | ) | ||||||||||||||
|
Net amount recognized at December 31
|
$ | (3,445 | ) | $ | (1,942 | ) | $ | (1,692 | ) | $ | (1,567 | ) | $ | (3,765 | ) | $ | (3,605 | ) | ||||||||
| Pension Benefits | ||||||||||||||||||||||||||
| 2011 | 2010 | Other Benefits | ||||||||||||||||||||||||
| U.S. | Int’l. | U.S. | Int’l. | 2011 | 2010 | |||||||||||||||||||||
|
Net actuarial loss
|
$ | 5,982 | $ | 2,250 | $ | 3,919 | $ | 1,903 | $ | 1,002 | $ | 935 | ||||||||||||||
|
Prior service (credit) costs
|
(44 | ) | 152 | (52 | ) | 179 | (63 | ) | (135 | ) | ||||||||||||||||
|
Total recognized at December 31
|
$ | 5,938 | $ | 2,402 | $ | 3,867 | $ | 2,082 | $ | 939 | $ | 800 | ||||||||||||||
FS-50
Table of Contents
| Pension Benefits | ||||||||||||||||
| 2011 | 2010 | |||||||||||||||
| U.S. | Int’l. | U.S. | Int’l. | |||||||||||||
|
Projected benefit obligations
|
$ | 12,157 | $ | 4,207 | $ | 10,265 | $ | 3,668 | ||||||||
|
Accumulated
benefit obligations
|
11,191 | 3,586 | 9,528 | 3,113 | ||||||||||||
|
Fair value of plan assets
|
8,707 | 2,357 | 8,566 | 2,190 | ||||||||||||
| Pension Benefits | ||||||||||||||||||||||||||||||||||||||
| 2011 | 2010 | 2009 | Other Benefits | |||||||||||||||||||||||||||||||||||
| U.S. | Int’l. | U.S. | Int’l. | U.S. | Int’l. | 2011 | 2010 | 2009 | ||||||||||||||||||||||||||||||
|
Net Periodic Benefit Cost
|
||||||||||||||||||||||||||||||||||||||
|
Service cost
|
$ | 374 | $ | 174 | $ | 337 | $ | 153 | $ | 266 | $ | 128 | $ | 58 | $ | 39 | $ | 43 | ||||||||||||||||||||
|
Interest cost
|
463 | 325 | 486 | 307 | 481 | 292 | 180 | 175 | 180 | |||||||||||||||||||||||||||||
|
Expected return on plan assets
|
(613 | ) | (283 | ) | (538 | ) | (241 | ) | (395 | ) | (203 | ) | – | – | – | |||||||||||||||||||||||
|
Amortization of prior service
(credits) costs
|
(8 | ) | 19 | (8 | ) | 22 | (7 | ) | 23 | (72 | ) | (75 | ) | (81 | ) | |||||||||||||||||||||||
|
Recognized actuarial losses
|
310 | 101 | 318 | 98 | 298 | 108 | 64 | 27 | 27 | |||||||||||||||||||||||||||||
|
Settlement losses
|
298 | – | 186 | 6 | 141 | 1 | – | – | – | |||||||||||||||||||||||||||||
|
Curtailment losses (gains)
|
– | 35 | – | – | – | – | (10 | ) | – | (5 | ) | |||||||||||||||||||||||||||
|
Total net periodic benefit cost
|
824 | 371 | 781 | 345 | 784 | 349 | 220 | 166 | 164 | |||||||||||||||||||||||||||||
|
Changes Recognized in Other
Comprehensive Income
|
||||||||||||||||||||||||||||||||||||||
|
Net actuarial loss during period
|
2,671 | 448 | 242 | 118 | 823 | 194 | 131 | 497 | 82 | |||||||||||||||||||||||||||||
|
Amortization of actuarial loss
|
(608 | ) | (101 | ) | (504 | ) | (104 | ) | (439 | ) | (109 | ) | (64 | ) | (27 | ) | (27 | ) | ||||||||||||||||||||
|
Prior service cost during period
|
– | 27 | – | – | 1 | 13 | – | 12 | 20 | |||||||||||||||||||||||||||||
|
Amortization of prior service
credits (costs)
|
8 | (54 | ) | 8 | (22 | ) | 7 | (23 | ) | 72 | 75 | 81 | ||||||||||||||||||||||||||
|
Total changes recognized in
other
comprehensive income |
2,071 | 320 | (254 | ) | (8 | ) | 392 | 75 | 139 | 557 | 156 | |||||||||||||||||||||||||||
|
Recognized in Net Periodic
Benefit Cost and Other Comprehensive Income |
$ | 2,895 | $ | 691 | $ | 527 | $ | 337 | $ | 1,176 | $ | 424 | $ | 359 | $ | 723 | $ | 320 | ||||||||||||||||||||
FS-51
Table of Contents
Millions of dollars, except per-share amounts
| Pension Benefits | ||||||||||||||||||||||||||||||||||||||
| 2011 | 2010 | 2009 | Other Benefits | |||||||||||||||||||||||||||||||||||
| U.S. | Int’l. | U.S. | Int’l. | U.S. | Int’l. | 2011 | 2010 | 2009 | ||||||||||||||||||||||||||||||
|
Assumptions used to determine benefit obligations:
|
||||||||||||||||||||||||||||||||||||||
|
Discount rate
|
3.8 | % | 5.9 | % | 4.8 | % | 6.5 | % | 5.3 | % | 6.8 | % | 4.2 | % | 5.2 | % | 5.9 | % | ||||||||||||||||||||
|
Rate of compensation increase
|
4.5 | % | 5.7 | % | 4.5 | % | 6.7 | % | 4.5 | % | 6.3 | % | N/A | N/A | N/A | |||||||||||||||||||||||
|
Assumptions used to determine
net periodic benefit cost: |
||||||||||||||||||||||||||||||||||||||
|
Discount rate
|
4.8 | % | 6.5 | % | 5.3 | % | 6.8 | % | 6.3 | % | 7.5 | % | 5.2 | % | 5.9 | % | 6.3 | % | ||||||||||||||||||||
|
Expected return on plan assets
|
7.8 | % | 7.8 | % | 7.8 | % | 7.8 | % | 7.8 | % | 7.5 | % | N/A | N/A | N/A | |||||||||||||||||||||||
|
Rate of compensation increase
|
4.5 | % | 6.7 | % | 4.5 | % | 6.3 | % | 4.5 | % | 6.8 | % | N/A | N/A | N/A | |||||||||||||||||||||||
| 1 Percent | 1 Percent | |||||||
| Increase | Decrease | |||||||
|
Effect on total service and interest cost components
|
$ | 17 | $ | (15 | ) | |||
|
Effect on postretirement benefit obligation
|
$ | 177 | $ | (150 | ) | |||
FS-52
Table of Contents
| U.S. | Int’l. | ||||||||||||||||||||||||||||||||
| Total Fair Value | Level 1 | Level 2 | Level 3 | Total Fair Value | Level 1 | Level 2 | Level 3 | ||||||||||||||||||||||||||
|
At December 31, 2011
|
|||||||||||||||||||||||||||||||||
|
Equities
|
|||||||||||||||||||||||||||||||||
|
U.S.
1
|
$ | 1,470 | $ | 1,470 | $ | – | $ | – | $ | 497 | $ | 497 | $ | – | $ | – | |||||||||||||||||
|
International
|
1,203 | 1,203 | – | – | 693 | 693 | – | – | |||||||||||||||||||||||||
|
Collective Trusts/Mutual Funds
2
|
2,633 | 14 | 2,619 | – | 596 | 28 | 568 | – | |||||||||||||||||||||||||
|
Fixed Income
|
|||||||||||||||||||||||||||||||||
|
Government
|
622 | 146 | 476 | – | 635 | 25 | 610 | – | |||||||||||||||||||||||||
|
Corporate
|
338 | – | 338 | – | 319 | 16 | 276 | 27 | |||||||||||||||||||||||||
|
Mortgage-Backed Securities
|
107 | – | 107 | – | 2 | – | – | 2 | |||||||||||||||||||||||||
|
Other Asset Backed
|
61 | – | 61 | – | 5 | – | 5 | – | |||||||||||||||||||||||||
|
Collective Trusts/Mutual Funds
2
|
1,046 | – | 1,046 | – | 345 | 61 | 284 | – | |||||||||||||||||||||||||
|
Mixed Funds
3
|
10 | 10 | – | – | 102 | 13 | 89 | – | |||||||||||||||||||||||||
|
Real Estate
4
|
843 | – | – | 843 | 155 | – | – | 155 | |||||||||||||||||||||||||
|
Cash and Cash Equivalents
|
404 | 404 | – | – | 211 | 211 | – | – | |||||||||||||||||||||||||
|
Other
5
|
(17 | ) | (79 | ) | 8 | 54 | 17 | (2 | ) | 17 | 2 | ||||||||||||||||||||||
|
Total at December 31, 2011
|
$ | 8,720 | $ | 3,168 | $ | 4,655 | $ | 897 | $ | 3,577 | $ | 1,542 | $ | 1,849 | $ | 186 | |||||||||||||||||
|
At December 31, 2010
|
|||||||||||||||||||||||||||||||||
|
Equities
|
|||||||||||||||||||||||||||||||||
|
U.S.
1
|
$ | 2,121 | $ | 2,121 | $ | – | $ | – | $ | 465 | $ | 465 | $ | – | $ | – | |||||||||||||||||
|
International
|
1,405 | 1,405 | – | – | 721 | 721 | – | – | |||||||||||||||||||||||||
|
Collective Trusts/Mutual Funds
2
|
2,068 | 5 | 2,063 | – | 578 | 80 | 498 | – | |||||||||||||||||||||||||
|
Fixed Income
|
|||||||||||||||||||||||||||||||||
|
Government
|
659 | 19 | 640 | – | 568 | 38 | 530 | – | |||||||||||||||||||||||||
|
Corporate
|
314 | – | 314 | – | 351 | 24 | 299 | 28 | |||||||||||||||||||||||||
|
Mortgage-Backed Securities
|
82 | – | 82 | – | 2 | – | – | 2 | |||||||||||||||||||||||||
|
Other Asset Backed
|
74 | – | 74 | – | 16 | – | 16 | – | |||||||||||||||||||||||||
|
Collective Trusts/Mutual Funds
2
|
1,064 | – | 1,064 | – | 332 | 19 | 313 | – | |||||||||||||||||||||||||
|
Mixed Funds
3
|
9 | 9 | – | – | 105 | 16 | 89 | – | |||||||||||||||||||||||||
|
Real Estate
4
|
596 | – | – | 596 | 142 | – | – | 142 | |||||||||||||||||||||||||
|
Cash and Cash Equivalents
|
213 | 213 | – | – | 217 | 217 | – | – | |||||||||||||||||||||||||
|
Other
5
|
(26 | ) | (87 | ) | 8 | 53 | 6 | (5 | ) | 9 | 2 | ||||||||||||||||||||||
|
Total at December 31, 2010
|
$ | 8,579 | $ | 3,685 | $ | 4,245 | $ | 649 | $ | 3,503 | $ | 1,575 | $ | 1,754 | $ | 174 | |||||||||||||||||
| 1 | U.S. equities include investments in the company’s common stock in the amount of $35 at December 31, 2011, and $38 at December 31, 2010. |
| 2 | Collective Trusts/Mutual Funds for U.S. plans are entirely index funds; for International plans, they are mostly index funds. For these index funds, the Level 2 designation is partially based on the restriction that advance notification of redemptions, typically two business days, is required. |
| 3 | Mixed funds are composed of funds that invest in both equity and fixed-income instruments in order to diversify and lower risk. |
| 4 | The year-end valuations of the U.S. real estate assets are based on internal appraisals by the real estate managers, which are updates of third-party appraisals that occur at least once a year for each property in the portfolio. |
| 5 | The “Other” asset class includes net payables for securities purchased but not yet settled (Level 1); dividends and interest- and tax-related receivables (Level 2); insurance contracts and investments in private-equity limited partnerships (Level 3). |
FS-53
Table of Contents
Millions of dollars, except per-share amounts
| Fixed Income | ||||||||||||||||||||||||
| Mortgage-Backed | ||||||||||||||||||||||||
| Corporate | Securities | Real Estate | Other | Total | ||||||||||||||||||||
|
Total at December 31, 2009
|
$ 18 | $ 2 | $ 610 | $ 52 | $ 682 | |||||||||||||||||||
|
Actual Return on Plan Assets:
|
||||||||||||||||||||||||
|
Assets held at the reporting date
|
3 | – | 34 | 1 | 38 | |||||||||||||||||||
|
Assets sold during the period
|
– | – | 1 | – | 1 | |||||||||||||||||||
|
Purchases, Sales and Settlements
|
7 | – | 93 | 2 | 102 | |||||||||||||||||||
|
Transfers in and/or out of Level 3
|
– | – | – | – | – | |||||||||||||||||||
|
Total at December 31, 2010
|
$ 28 | $ 2 | $ 738 | $ 55 | $ 823 | |||||||||||||||||||
|
Actual Return on Plan Assets:
|
||||||||||||||||||||||||
|
Assets held at the reporting date
|
– | – | 103 | 4 | 107 | |||||||||||||||||||
|
Assets sold during the period
|
– | – | 1 | (2 | ) | (1 | ) | |||||||||||||||||
|
Purchases, Sales and Settlements
|
(1 | ) | – | 156 | (1 | ) | 154 | |||||||||||||||||
|
Transfers in and/or out of Level 3
|
– | – | – | – | – | |||||||||||||||||||
|
Total at December 31, 2011
|
$ 27 | $ 2 | $ 998 | $ 56 | $ 1,083 | |||||||||||||||||||
| Pension Benefits | Other | |||||||||||
| U.S. | Int’l. | Benefits | ||||||||||
|
2012
|
$ | 1,053 | $ | 268 | $ | 223 | ||||||
|
2013
|
$ | 1,043 | $ | 316 | $ | 229 | ||||||
|
2014
|
$ | 1,046 | $ | 320 | $ | 234 | ||||||
|
2015
|
$ | 1,050 | $ | 344 | $ | 240 | ||||||
|
2016
|
$ | 1,062 | $ | 375 | $ | 245 | ||||||
|
2017–2021
|
$ | 5,261 | $ | 2,153 | $ | 1,287 | ||||||
FS-54
Table of Contents
| Thousands | 2011 | 2010 | |||||||
|
Allocated shares
|
19,047 | 20,718 | |||||||
|
Unallocated shares
|
1,864 | 2,374 | |||||||
|
Total LESOP shares
|
20,911 | 23,092 | |||||||
FS-55
Table of Contents
Millions of dollars, except per-share amounts
| Amounts Before Tax | ||||
|
Balance at January 1, 2011
|
$ | 138 | ||
|
Adjustments
|
(28 | ) | ||
|
Payments
|
(74 | ) | ||
|
Balance at December 31, 2011
|
$ | 36 | ||
FS-56
Table of Contents
FS-57
Table of Contents
| 2011 | 2010 | 2009 | |||||||||||
|
Balance at January 1
|
$ | 12,488 | $ | 10,175 | $ | 9,395 | |||||||
|
Liabilities incurred
|
62 | 129 | 144 | ||||||||||
|
Liabilities settled
|
(1,316 | ) | (755 | ) | (757 | ) | |||||||
|
Accretion expense
|
628 | 513 | 463 | ||||||||||
|
Revisions in estimated cash flows
|
905 | 2,426 | 930 | ||||||||||
|
Balance at December 31
|
$ | 12,767 | $ | 12,488 | $ | 10,175 | |||||||
| Year ended December 31 | |||||||||||||
| 2011 | 2010 | 2009 | |||||||||||
|
Total financing interest and debt costs
|
$ | 288 | $ | 317 | $ | 301 | |||||||
|
Less: Capitalized interest
|
288 | 267 | 273 | ||||||||||
|
Interest and debt expense
|
$ | – | $ | 50 | $ | 28 | |||||||
|
Research and development expenses
|
$ | 627 | $ | 526 | $ | 603 | |||||||
|
Foreign currency effects*
|
$ | 121 | $ | (423 | ) | $ | (744 | ) | |||||
| * | Includes $(27), $(71) and $(194) in 2011, 2010 and 2009, respectively, for the company’s share of equity affiliates’ foreign currency effects. |
FS-58
Table of Contents
| Year ended December 31 | |||||||||||||
| 2011 | 2010 | 2009 | |||||||||||
|
Basic EPS Calculation
|
|||||||||||||
|
Earnings available to common stockholders – Basic*
|
$ | 26,895 | $ | 19,024 | $ | 10,483 | |||||||
|
Weighted-average number of common shares outstanding
|
1,986 | 1,996 | 1,991 | ||||||||||
|
Add: Deferred awards held as stock units
|
– | 1 | 1 | ||||||||||
|
Total weighted-average number of common shares outstanding
|
1,986 | 1,997 | 1,992 | ||||||||||
|
Earnings per share of common stock – Basic
|
$ | 13.54 | $ | 9.53 | $ | 5.26 | |||||||
|
Diluted EPS Calculation
|
|||||||||||||
|
Earnings available to common stockholders – Diluted*
|
$ | 26,895 | $ | 19,024 | $ | 10,483 | |||||||
|
Weighted-average number of common shares outstanding
|
1,986 | 1,996 | 1,991 | ||||||||||
|
Add: Deferred awards held as stock units
|
– | 1 | 1 | ||||||||||
|
Add: Dilutive effect of employee stock-based awards
|
15 | 10 | 9 | ||||||||||
|
Total weighted-average number of common shares outstanding
|
2,001 | 2,007 | 2,001 | ||||||||||
|
Earnings per share of common stock – Diluted
|
$ | 13.44 | $ | 9.48 | $ | 5.24 | |||||||
| * | There was no effect of dividend equivalents paid on stock units or dilutive impact of employee stock-based awards on earnings. |
FS-59
Table of Contents
FS-60
Table of Contents
| Millions of dollars, except per-share amounts | 2011 | 2010 | 2009 | 2008 | 2007 | ||||||||||||||||
|
Statement of Income Data
|
|||||||||||||||||||||
|
Revenues and Other Income
|
|||||||||||||||||||||
|
Total sales and other operating revenues*
|
$ | 244,371 | $ | 198,198 | $ | 167,402 | $ | 264,958 | $ | 214,091 | |||||||||||
|
Income from equity affiliates and other income
|
9,335 | 6,730 | 4,234 | 8,047 | 6,813 | ||||||||||||||||
|
Total Revenues and Other Income
|
253,706 | 204,928 | 171,636 | 273,005 | 220,904 | ||||||||||||||||
|
Total Costs and Other Deductions
|
206,072 | 172,873 | 153,108 | 229,948 | 188,630 | ||||||||||||||||
|
Income Before Income Tax Expense
|
47,634 | 32,055 | 18,528 | 43,057 | 32,274 | ||||||||||||||||
|
Income Tax Expense
|
20,626 | 12,919 | 7,965 | 19,026 | 13,479 | ||||||||||||||||
|
Net Income
|
27,008 | 19,136 | 10,563 | 24,031 | 18,795 | ||||||||||||||||
|
Less: Net income attributable to noncontrolling interests
|
113 | 112 | 80 | 100 | 107 | ||||||||||||||||
|
Net Income Attributable to Chevron Corporation
|
$ | 26,895 | $ | 19,024 | $ | 10,483 | $ | 23,931 | $ | 18,688 | |||||||||||
|
Per Share of Common Stock
|
|||||||||||||||||||||
|
Net Income Attributable to Chevron
|
|||||||||||||||||||||
|
–
Basic
|
$ | 13.54 | $ | 9.53 | $ | 5.26 | $ | 11.74 | $ | 8.83 | |||||||||||
|
–
Diluted
|
$ | 13.44 | $ | 9.48 | $ | 5.24 | $ | 11.67 | $ | 8.77 | |||||||||||
|
Cash Dividends Per Share
|
$ | 3.09 | $ | 2.84 | $ | 2.66 | $ | 2.53 | $ | 2.26 | |||||||||||
|
Balance Sheet Data (at December 31)
|
|||||||||||||||||||||
|
Current assets
|
$ | 53,234 | $ | 48,841 | $ | 37,216 | $ | 36,470 | $ | 39,377 | |||||||||||
|
Noncurrent assets
|
156,240 | 135,928 | 127,405 | 124,695 | 109,409 | ||||||||||||||||
|
Total Assets
|
209,474 | 184,769 | 164,621 | 161,165 | 148,786 | ||||||||||||||||
|
Short-term debt
|
340 | 187 | 384 | 2,818 | 1,162 | ||||||||||||||||
|
Other current liabilities
|
33,260 | 28,825 | 25,827 | 29,205 | 32,636 | ||||||||||||||||
|
Long-term debt and capital lease obligations
|
9,812 | 11,289 | 10,130 | 6,083 | 6,070 | ||||||||||||||||
|
Other noncurrent liabilities
|
43,881 | 38,657 | 35,719 | 35,942 | 31,626 | ||||||||||||||||
|
Total Liabilities
|
87,293 | 78,958 | 72,060 | 74,048 | 71,494 | ||||||||||||||||
|
Total Chevron Corporation Stockholders’ Equity
|
$ | 121,382 | $ | 105,081 | $ | 91,914 | $ | 86,648 | $ | 77,088 | |||||||||||
|
Noncontrolling interests
|
799 | 730 | 647 | 469 | 204 | ||||||||||||||||
|
Total Equity
|
$ | 122,181 | $ | 105,811 | $ | 92,561 | $ | 87,117 | $ | 77,292 | |||||||||||
|
*
Includes excise, value-added and similar taxes:
|
$
8,085
|
$
8,591
|
$
8,109
|
$
9,846
|
$
10,121
|
||||||||||||||||
FS-61
Table of Contents
Unaudited
| Consolidated Companies | Affiliated Companies | |||||||||||||||||||||||||||||||||||
| Other | ||||||||||||||||||||||||||||||||||||
| Millions of dollars | U.S. | Americas | Africa | Asia | Australia | Europe | Total | TCO | Other | |||||||||||||||||||||||||||
|
Year Ended December 31, 2011
|
||||||||||||||||||||||||||||||||||||
|
Exploration
|
||||||||||||||||||||||||||||||||||||
|
Wells
|
$ | 321 | $ | 71 | $ | 104 | $ | 146 | $ | 242 | $ | 188 | $ | 1,072 | $ | – | $ | – | ||||||||||||||||||
|
Geological and geophysical
|
76 | 59 | 65 | 121 | 23 | 43 | 387 | – | – | |||||||||||||||||||||||||||
|
Rentals and other
|
109 | 45 | 83 | 67 | 71 | 78 | 453 | – | – | |||||||||||||||||||||||||||
|
Total exploration
|
506 | 175 | 252 | 334 | 336 | 309 | 1,912 | – | – | |||||||||||||||||||||||||||
|
Property acquisitions
2
|
||||||||||||||||||||||||||||||||||||
|
Proved
|
1,174 | 16 | – | 1 | – | – | 1,191 | – | – | |||||||||||||||||||||||||||
|
Unproved
|
7,404 | 228 | – | – | – | 25 | 7,657 | – | – | |||||||||||||||||||||||||||
|
Total property acquisitions
|
8,578 | 244 | – | 1 | – | 25 | 8,848 | – | – | |||||||||||||||||||||||||||
|
Development
3
|
5,517 | 1,537 | 2,698 | 2,867 | 2,638 | 633 | 15,890 | 379 | 368 | |||||||||||||||||||||||||||
|
Total Costs Incurred
4
|
$ | 14,601 | $ | 1,956 | $ | 2,950 | $ | 3,202 | $ | 2,974 | $ | 967 | $ | 26,650 | $ | 379 | $ | 368 | ||||||||||||||||||
|
Year Ended December 31, 2010
|
||||||||||||||||||||||||||||||||||||
|
Exploration
|
||||||||||||||||||||||||||||||||||||
|
Wells
|
$ | 99 | $ | 118 | $ | 94 | $ | 244 | $ | 293 | $ | 61 | $ | 909 | $ | – | $ | – | ||||||||||||||||||
|
Geological and geophysical
|
67 | 46 | 87 | 29 | 8 | 18 | 255 | – | – | |||||||||||||||||||||||||||
|
Rentals and other
|
121 | 39 | 55 | 47 | 95 | 57 | 414 | – | – | |||||||||||||||||||||||||||
|
Total exploration
|
287 | 203 | 236 | 320 | 396 | 136 | 1,578 | – | – | |||||||||||||||||||||||||||
|
Property acquisitions
2
|
||||||||||||||||||||||||||||||||||||
|
Proved
|
24 | – | – | 129 | – | – | 153 | – | – | |||||||||||||||||||||||||||
|
Unproved
|
359 | 429 | 160 | 187 | – | 10 | 1,145 | – | – | |||||||||||||||||||||||||||
|
Total property acquisitions
|
383 | 429 | 160 | 316 | – | 10 | 1,298 | – | – | |||||||||||||||||||||||||||
|
Development
3
|
4,446 | 1,611 | 2,985 | 3,325 | 2,623 | 411 | 15,401 | 230 | 343 | |||||||||||||||||||||||||||
|
Total Costs Incurred
|
$ | 5,116 | $ | 2,243 | $ | 3,381 | $ | 3,961 | $ | 3,019 | $ | 557 | $ | 18,277 | $ | 230 | $ | 343 | ||||||||||||||||||
|
Year Ended December 31, 2009
|
||||||||||||||||||||||||||||||||||||
|
Exploration
|
||||||||||||||||||||||||||||||||||||
|
Wells
|
$ | 361 | $ | 70 | $ | 140 | $ | 45 | $ | 275 | $ | 84 | $ | 975 | $ | – | $ | – | ||||||||||||||||||
|
Geological and geophysical
|
62 | 70 | 114 | 49 | 17 | 16 | 328 | – | – | |||||||||||||||||||||||||||
|
Rentals and other
|
153 | 146 | 92 | 60 | 127 | 43 | 621 | – | – | |||||||||||||||||||||||||||
|
Total exploration
|
576 | 286 | 346 | 154 | 419 | 143 | 1,924 | – | – | |||||||||||||||||||||||||||
|
Property acquisitions
2
|
||||||||||||||||||||||||||||||||||||
|
Proved
|
3 | – | – | – | – | – | 3 | – | – | |||||||||||||||||||||||||||
|
Unproved
|
29 | – | – | – | – | – | 29 | – | – | |||||||||||||||||||||||||||
|
Total property acquisitions
|
32 | – | – | – | – | – | 32 | – | – | |||||||||||||||||||||||||||
|
Development
3
|
3,338 | 1,515 | 3,426 | 2,698 | 565 | 285 | 11,827 | 265 | 69 | |||||||||||||||||||||||||||
|
Total Costs Incurred
|
$ | 3,946 | $ | 1,801 | $ | 3,772 | $ | 2,852 | $ | 984 | $ | 428 | $ | 13,783 | $ | 265 | $ | 69 | ||||||||||||||||||
| 1 | Includes costs incurred whether capitalized or expensed. Excludes general support equipment expenditures. Includes capitalized amounts related to asset retirement obligations. |
| See Note 25, “Asset Retirement Obligations,” on page FS-58. | |
| 2 | Includes wells, equipment and facilities associated with proved reserves. Does not include properties acquired in nonmonetary transactions. |
| 3 | Includes $1,035, $745 and $121 costs incurred prior to assignment of proved reserves for consolidated companies in 2011, 2010 and 2009, respectively. |
| 4 | Reconciliation of consolidated and affiliated companies total cost incurred to Upstream capital and exploratory (C&E) expenditures – $ billions. |
|
|
Total cost incurred for 2011
|
$ | 27.4 | ||||||||
|
|
Non oil and gas activities
|
5.4 | (Includes LNG and gas-to-liquids $4.3, transportation $0.5, affiliate $0.5, other $0.1) | ||||||||
|
|
Atlas properties
|
(6.1 | ) | ||||||||
|
|
ARO
|
(0.8 | ) | ||||||||
|
|
Upstream C&E
|
$ | 25.9 | Reference Page FS-11 upstream total | |||||||
|
|
|||||||||||
FS-62
Table of Contents
Gas Producing Activities
| Consolidated Companies | Affiliated Companies | |||||||||||||||||||||||||||||||||||
| Other | ||||||||||||||||||||||||||||||||||||
| Millions of dollars | U.S. | Americas | Africa | Asia | Australia | Europe | Total | TCO | Other | |||||||||||||||||||||||||||
|
At December 31, 2011
|
||||||||||||||||||||||||||||||||||||
|
Unproved properties
|
$ | 9,806 | $ | 1,417 | $ | 368 | $ | 2,408 | $ | 6 | $ | 33 | $ | 14,038 | $ | 109 | $ | – | ||||||||||||||||||
|
Proved properties and
related producing assets |
57,674 | 11,029 | 25,549 | 36,740 | 2,244 | 9,549 | 142,785 | 6,583 | 1,607 | |||||||||||||||||||||||||||
|
Support equipment
|
1,071 | 292 | 1,362 | 1,544 | 533 | 169 | 4,971 | 1,018 | – | |||||||||||||||||||||||||||
|
Deferred exploratory wells
|
565 | 63 | 629 | 260 | 709 | 208 | 2,434 | – | – | |||||||||||||||||||||||||||
|
Other uncompleted projects
|
4,887 | 2,408 | 4,773 | 3,109 | 6,076 | 492 | 21,745 | 605 | 1,466 | |||||||||||||||||||||||||||
|
Gross Capitalized Costs
|
74,003 | 15,209 | 32,681 | 44,061 | 9,568 | 10,451 | 185,973 | 8,315 | 3,073 | |||||||||||||||||||||||||||
|
Unproved properties valuation
|
1,085 | 498 | 178 | 262 | 2 | 13 | 2,038 | 38 | – | |||||||||||||||||||||||||||
|
Proved producing properties –
Depreciation and depletion
|
39,210 | 4,826 | 13,173 | 20,991 | 1,574 | 7,742 | 87,516 | 1,910 | 436 | |||||||||||||||||||||||||||
|
Support equipment depreciation
|
530 | 175 | 715 | 1,192 | 238 | 129 | 2,979 | 451 | – | |||||||||||||||||||||||||||
|
Accumulated provisions
|
40,825 | 5,499 | 14,066 | 22,445 | 1,814 | 7,884 | 92,533 | 2,399 | 436 | |||||||||||||||||||||||||||
|
Net Capitalized Costs
|
$ | 33,178 | $ | 9,710 | $ | 18,615 | $ | 21,616 | $ | 7,754 | $ | 2,567 | $ | 93,440 | $ | 5,916 | $ | 2,637 | ||||||||||||||||||
|
At December 31, 2010
|
||||||||||||||||||||||||||||||||||||
|
Unproved properties
|
$ | 2,553 | $ | 1,349 | $ | 359 | $ | 2,561 | $ | 6 | $ | 8 | $ | 6,836 | $ | 108 | $ | – | ||||||||||||||||||
|
Proved properties and
related producing assets |
55,601 | 7,747 | 23,683 | 33,316 | 2,585 | 9,035 | 131,967 | 6,512 | 1,594 | |||||||||||||||||||||||||||
|
Support equipment
|
975 | 265 | 1,282 | 1,421 | 259 | 165 | 4,367 | 985 | – | |||||||||||||||||||||||||||
|
Deferred exploratory wells
|
743 | 210 | 611 | 224 | 732 | 198 | 2,718 | – | – | |||||||||||||||||||||||||||
|
Other uncompleted projects
|
2,299 | 3,844 | 4,061 | 3,627 | 3,631 | 362 | 17,824 | 357 | 1,001 | |||||||||||||||||||||||||||
|
Gross Capitalized Costs
|
62,171 | 13,415 | 29,996 | 41,149 | 7,213 | 9,768 | 163,712 | 7,962 | 2,595 | |||||||||||||||||||||||||||
|
Unproved properties valuation
|
967 | 436 | 150 | 200 | 2 | – | 1,755 | 34 | – | |||||||||||||||||||||||||||
|
Proved producing properties –
Depreciation and depletion
|
37,682 | 3,986 | 10,986 | 18,197 | 1,718 | 7,162 | 79,731 | 1,530 | 249 | |||||||||||||||||||||||||||
|
Support equipment depreciation
|
518 | 153 | 600 | 1,126 | 84 | 114 | 2,595 | 402 | – | |||||||||||||||||||||||||||
|
Accumulated provisions
|
39,167 | 4,575 | 11,736 | 19,523 | 1,804 | 7,276 | 84,081 | 1,966 | 249 | |||||||||||||||||||||||||||
|
Net Capitalized Costs
|
$ | 23,004 | $ | 8,840 | $ | 18,260 | $ | 21,626 | $ | 5,409 | $ | 2,492 | $ | 79,631 | $ | 5,996 | $ | 2,346 | ||||||||||||||||||
FS-63
Table of Contents
Gas Producing Activities - Continued
| Consolidated Companies | Affiliated Companies | |||||||||||||||||||||||||||||||||||
| Other | ||||||||||||||||||||||||||||||||||||
| Millions of dollars | U.S. | Americas | Africa | Asia | Australia | Europe | Total | TCO | Other | |||||||||||||||||||||||||||
|
At December 31, 2009
|
||||||||||||||||||||||||||||||||||||
|
Unproved properties
|
$ | 2,320 | $ | 946 | $ | 321 | $ | 3,355 | $ | 7 | $ | 10 | $ | 6,959 | $ | 113 | $ | – | ||||||||||||||||||
|
Proved properties and
related producing assets |
51,582 | 6,033 | 20,967 | 29,637 | 2,507 | 8,727 | 119,453 | 6,404 | 1,759 | |||||||||||||||||||||||||||
|
Support equipment
|
810 | 323 | 1,012 | 1,383 | 162 | 163 | 3,853 | 947 | – | |||||||||||||||||||||||||||
|
Deferred exploratory wells
|
762 | 216 | 603 | 209 | 440 | 205 | 2,435 | – | – | |||||||||||||||||||||||||||
|
Other uncompleted projects
|
2,384 | 4,106 | 3,960 | 2,936 | 1,274 | 192 | 14,852 | 284 | 58 | |||||||||||||||||||||||||||
|
Gross Capitalized Costs
|
57,858 | 11,624 | 26,863 | 37,520 | 4,390 | 9,297 | 147,552 | 7,748 | 1,817 | |||||||||||||||||||||||||||
|
Unproved properties valuation
|
915 | 391 | 163 | 170 | 1 | (2 | ) | 1,638 | 32 | – | ||||||||||||||||||||||||||
|
Proved producing properties –
Depreciation and depletion
|
34,574 | 3,182 | 8,823 | 15,783 | 1,579 | 6,482 | 70,423 | 1,150 | 282 | |||||||||||||||||||||||||||
|
Support equipment depreciation
|
424 | 197 | 526 | 773 | 58 | 102 | 2,080 | 356 | – | |||||||||||||||||||||||||||
|
Accumulated provisions
|
35,913 | 3,770 | 9,512 | 16,726 | 1,638 | 6,582 | 74,141 | 1,538 | 282 | |||||||||||||||||||||||||||
|
Net Capitalized Costs
|
$ | 21,945 | $ | 7,854 | $ | 17,351 | $ | 20,794 | $ | 2,752 | $ | 2,715 | $ | 73,411 | $ | 6,210 | $ | 1,535 | ||||||||||||||||||
FS-64
Table of Contents
Gas Producing Activities 1
| Consolidated Companies | Affiliated Companies | |||||||||||||||||||||||||||||||||||
| Other | ||||||||||||||||||||||||||||||||||||
| Millions of dollars | U.S. | Americas | Africa | Asia | Australia | Europe | Total | TCO | Other | |||||||||||||||||||||||||||
|
Year Ended December 31, 2011
|
||||||||||||||||||||||||||||||||||||
|
Revenues from net production
|
||||||||||||||||||||||||||||||||||||
|
Sales
|
$ | 2,508 | $ | 1,672 | $ | 1,174 | $ | 9,431 | $ | 1,474 | $ | 1,868 | $ | 18,127 | $ | 8,581 | $ | 1,988 | ||||||||||||||||||
|
Transfers
|
15,811 | 3,724 | 15,726 | 8,962 | 1,012 | 2,672 | 47,907 | – | – | |||||||||||||||||||||||||||
|
Total
|
18,319 | 5,396 | 16,900 | 18,393 | 2,486 | 4,540 | 66,034 | 8,581 | 1,988 | |||||||||||||||||||||||||||
|
Production expenses excluding taxes
|
(3,668 | ) | (1,061 | ) | (1,526 | ) | (4,489 | ) | (117 | ) | (564 | ) | (11,425 | ) | (449 | ) | (235 | ) | ||||||||||||||||||
|
Taxes other than on income
|
(597 | ) | (137 | ) | (153 | ) | (242 | ) | (396 | ) | (2 | ) | (1,527 | ) | (429 | ) | (815 | ) | ||||||||||||||||||
|
Proved producing properties:
|
||||||||||||||||||||||||||||||||||||
|
Depreciation and depletion
|
(3,366 | ) | (796 | ) | (2,225 | ) | (2,923 | ) | (136 | ) | (580 | ) | (10,026 | ) | (442 | ) | (140 | ) | ||||||||||||||||||
|
Accretion expense
2
|
(291 | ) | (27 | ) | (106 | ) | (81 | ) | (18 | ) | (39 | ) | (562 | ) | (8 | ) | (4 | ) | ||||||||||||||||||
|
Exploration expenses
|
(207 | ) | (144 | ) | (188 | ) | (271 | ) | (128 | ) | (277 | ) | (1,215 | ) | – | – | ||||||||||||||||||||
|
Unproved properties valuation
|
(134 | ) | (146 | ) | (27 | ) | (60 | ) | – | (14 | ) | (381 | ) | – | – | |||||||||||||||||||||
|
Other income (expense)
3
|
163 | (1,191 | ) | (409 | ) | 231 | (18 | ) | (74 | ) | (1,298 | ) | (8 | ) | (29 | ) | ||||||||||||||||||||
|
Results before income taxes
|
10,219 | 1,894 | 12,266 | 10,558 | 1,673 | 2,990 | 39,600 | 7,245 | 765 | |||||||||||||||||||||||||||
|
Income tax expense
|
(3,728 | ) | (535 | ) | (7,802 | ) | (5,374 | ) | (507 | ) | (1,913 | ) | (19,859 | ) | (2,176 | ) | (392 | ) | ||||||||||||||||||
|
Results of Producing Operations
|
$ | 6,491 | $ | 1,359 | $ | 4,464 | $ | 5,184 | $ | 1,166 | $ | 1,077 | $ | 19,741 | $ | 5,069 | $ | 373 | ||||||||||||||||||
|
Year Ended December 31, 2010
|
||||||||||||||||||||||||||||||||||||
|
Revenues from net production
|
||||||||||||||||||||||||||||||||||||
|
Sales
|
$ | 2,540 | $ | 2,441 | $ | 2,278 | $ | 7,221 | $ | 994 | $ | 1,519 | $ | 16,993 | $ | 6,031 | $ | 1,307 | ||||||||||||||||||
|
Transfers
|
12,172 | 1,038 | 10,306 | 6,242 | 985 | 2,138 | 32,881 | – | – | |||||||||||||||||||||||||||
|
Total
|
14,712 | 3,479 | 12,584 | 13,463 | 1,979 | 3,657 | 49,874 | 6,031 | 1,307 | |||||||||||||||||||||||||||
|
Production expenses excluding taxes
|
(3,338 | ) | (805 | ) | (1,413 | ) | (2,996 | ) | (96 | ) | (534 | ) | (9,182 | ) | (347 | ) | (152 | ) | ||||||||||||||||||
|
Taxes other than on income
|
(542 | ) | (102 | ) | (130 | ) | (85 | ) | (334 | ) | (2 | ) | (1,195 | ) | (360 | ) | (101 | ) | ||||||||||||||||||
|
Proved producing properties:
|
||||||||||||||||||||||||||||||||||||
|
Depreciation and depletion
|
(3,639 | ) | (907 | ) | (2,204 | ) | (2,816 | ) | (151 | ) | (681 | ) | (10,398 | ) | (432 | ) | (131 | ) | ||||||||||||||||||
|
Accretion expense
2
|
(240 | ) | (23 | ) | (102 | ) | (35 | ) | (15 | ) | (53 | ) | (468 | ) | (8 | ) | (5 | ) | ||||||||||||||||||
|
Exploration expenses
|
(193 | ) | (173 | ) | (242 | ) | (289 | ) | (175 | ) | (75 | ) | (1,147 | ) | (5 | ) | – | |||||||||||||||||||
|
Unproved properties valuation
|
(123 | ) | (71 | ) | (25 | ) | (33 | ) | – | (2 | ) | (254 | ) | – | – | |||||||||||||||||||||
|
Other income (expense)
3
|
(154 | ) | (818 | ) | (103 | ) | (282 | ) | 109 | 165 | (1,083 | ) | (65 | ) | 191 | |||||||||||||||||||||
|
Results before income taxes
|
6,483 | 580 | 8,365 | 6,927 | 1,317 | 2,475 | 26,147 | 4,814 | 1,109 | |||||||||||||||||||||||||||
|
Income tax expense
4
|
(2,273 | ) | (223 | ) | (4,535 | ) | (3,886 | ) | (325 | ) | (1,455 | ) | (12,697 | ) | (1,445 | ) | (615 | ) | ||||||||||||||||||
|
Results of Producing Operations
|
$ | 4,210 | $ | 357 | $ | 3,830 | $ | 3,041 | $ | 992 | $ | 1,020 | $ | 13,450 | $ | 3,369 | $ | 494 | ||||||||||||||||||
| 1 | The value of owned production consumed in operations as fuel has been eliminated from revenues and production expenses, and the related volumes have been deducted from net production in calculating the unit average sales price and production cost. This has no effect on the results of producing operations. |
| 2 | Represents accretion of ARO liability. Refer to Note 25, “Asset Retirement Obligations,” on page FS-58. |
| 3 | Includes foreign currency gains and losses, gains and losses on property dispositions, and income from operating and technical service agreements. |
| 4 | Income tax expense for 2010 conformed to 2011 presentation for certain tax items. |
FS-65
Table of Contents
Gas Producing Activities 1 - Continued
| Consolidated Companies | Affiliated Companies | |||||||||||||||||||||||||||||||||||
| Other | ||||||||||||||||||||||||||||||||||||
| Millions of dollars | U.S. | Americas | Africa | Asia | Australia | Europe | Total | TCO | Other | |||||||||||||||||||||||||||
|
Year Ended December 31, 2009
|
||||||||||||||||||||||||||||||||||||
|
Revenues from net production
|
||||||||||||||||||||||||||||||||||||
|
Sales
|
$ | 2,278 | $ | 918 | $ | 1,767 | $ | 5,648 | $ | 543 | $ | 1,712 | $ | 12,866 | $ | 4,043 | $ | 938 | ||||||||||||||||||
|
Transfers
|
9,133 | 1,555 | 7,304 | 4,926 | 765 | 1,546 | 25,229 | – | – | |||||||||||||||||||||||||||
|
Total
|
11,411 | 2,473 | 9,071 | 10,574 | 1,308 | 3,258 | 38,095 | 4,043 | 938 | |||||||||||||||||||||||||||
|
Production expenses excluding taxes
|
(3,281 | ) | (731 | ) | (1,345 | ) | (2,208 | ) | (94 | ) | (565 | ) | (8,224 | ) | (363 | ) | (240 | ) | ||||||||||||||||||
|
Taxes other than on income
|
(367 | ) | (90 | ) | (132 | ) | (53 | ) | (190 | ) | (4 | ) | (836 | ) | (50 | ) | (96 | ) | ||||||||||||||||||
|
Proved producing properties:
|
||||||||||||||||||||||||||||||||||||
|
Depreciation and depletion
|
(3,493 | ) | (486 | ) | (2,175 | ) | (2,279 | ) | (214 | ) | (898 | ) | (9,545 | ) | (381 | ) | (88 | ) | ||||||||||||||||||
|
Accretion expense
2
|
(194 | ) | (27 | ) | (66 | ) | (70 | ) | (2 | ) | (50 | ) | (409 | ) | (7 | ) | (3 | ) | ||||||||||||||||||
|
Exploration expenses
|
(451 | ) | (203 | ) | (236 | ) | (113 | ) | (224 | ) | (115 | ) | (1,342 | ) | – | – | ||||||||||||||||||||
|
Unproved properties valuation
|
(228 | ) | (28 | ) | (11 | ) | (44 | ) | – | – | (311 | ) | – | – | ||||||||||||||||||||||
|
Other income (expense)
3
|
156 | (508 | ) | 98 | (327 | ) | 350 | (182 | ) | (413 | ) | (131 | ) | 9 | ||||||||||||||||||||||
|
Results before income taxes
|
3,553 | 400 | 5,204 | 5,480 | 934 | 1,444 | 17,015 | 3,111 | 520 | |||||||||||||||||||||||||||
|
Income tax expense
|
(1,258 | ) | (203 | ) | (3,214 | ) | (2,921 | ) | (256 | ) | (901 | ) | (8,753 | ) | (935 | ) | (258 | ) | ||||||||||||||||||
|
Results of Producing Operations
|
$ | 2,295 | $ | 197 | $ | 1,990 | $ | 2,559 | $ | 678 | $ | 543 | $ | 8,262 | $ | 2,176 | $ | 262 | ||||||||||||||||||
| 1 | The value of owned production consumed in operations as fuel has been eliminated from revenues and production expenses, and the related volumes have been deducted from net production in calculating the unit average sales price and production cost. This has no effect on the results of producing operations. |
| 2 | Represents accretion of ARO liability. Refer to Note 25, “Asset Retirement Obligations,” on page FS-58. |
| 3 | Includes foreign currency gains and losses, gains and losses on property dispositions, and income from operating and technical service agreements. |
FS-66
Table of Contents
Gas Producing Activities - Unit Prices and Costs 1
| Consolidated Companies | Affiliated Companies | |||||||||||||||||||||||||||||||||||
| Other | ||||||||||||||||||||||||||||||||||||
| U.S. | Americas | Africa | Asia | Australia | Europe | Total | TCO | Other | ||||||||||||||||||||||||||||
|
Year Ended December 31, 2011
|
||||||||||||||||||||||||||||||||||||
|
Average sales prices
|
||||||||||||||||||||||||||||||||||||
|
Liquids, per barrel
|
$ | 97.51 | $ | 105.33 | $ | 109.45 | $ | 100.55 | $ | 103.70 | $ | 107.11 | $ | 102.92 | $ | 94.60 | $ | 90.90 | ||||||||||||||||||
|
Natural gas, per thousand cubic feet
|
4.02 | 2.97 | 0.41 | 5.28 | 9.98 | 9.91 | 5.29 | 1.60 | 6.57 | |||||||||||||||||||||||||||
|
Average production costs, per barrel
2
|
15.08 | 14.62 | 9.48 | 17.47 | 3.41 | 11.44 | 13.98 | 4.23 | 10.54 | |||||||||||||||||||||||||||
|
Year Ended December 31, 2010
|
||||||||||||||||||||||||||||||||||||
|
Average sales prices
|
||||||||||||||||||||||||||||||||||||
|
Liquids, per barrel
|
$ | 71.59 | $ | 77.77 | $ | 78.00 | $ | 70.96 | $ | 76.43 | $ | 76.10 | $ | 74.02 | $ | 63.94 | $ | 64.92 | ||||||||||||||||||
|
Natural gas, per thousand cubic feet
|
4.25 | 2.52 | 0.73 | 4.45 | 6.76 | 7.09 | 4.55 | 1.41 | 4.20 | |||||||||||||||||||||||||||
|
Average production costs, per barrel
2
|
13.11 | 11.86 | 8.57 | 11.71 | 2.55 | 9.42 | 10.96 | 3.14 | 7.37 | |||||||||||||||||||||||||||
|
Year Ended December 31, 2009
|
||||||||||||||||||||||||||||||||||||
|
Average sales prices
|
||||||||||||||||||||||||||||||||||||
|
Liquids, per barrel
|
$ | 54.36 | $ | 65.28 | $ | 60.35 | $ | 54.76 | $ | 54.58 | $ | 57.19 | $ | 56.92 | $ | 47.33 | $ | 50.18 | ||||||||||||||||||
|
Natural gas, per thousand cubic feet
|
3.73 | 2.01 | 0.20 | 4.07 | 4.24 | 6.61 | 3.94 | 1.54 | 1.85 | |||||||||||||||||||||||||||
|
Average production costs, per barrel
2
|
12.71 | 12.04 | 8.85 | 8.82 | 2.57 | 8.87 | 9.97 | 3.71 | 12.42 | |||||||||||||||||||||||||||
| 1 | The value of owned production consumed in operations as fuel has been eliminated from revenues and production expenses, and the related volumes have been deducted from net production in calculating the unit average sales price and production cost. This has no effect on the results of producing operations. |
| 2 | Natural gas converted to oil-equivalent gas (OEG) barrels at a rate of 6 MCF = 1 OEG barrel. |
FS-67
Table of Contents
| 2011 | * | 2010 | * | 2009 | * | |||||||||||||||||||||||||||||||
| Crude Oil | Crude Oil | Crude Oil | ||||||||||||||||||||||||||||||||||
| Liquids and Synthetic Oil in Millions of Barrels | Condensate | Synthetic | Natural | Condensate | Synthetic | Natural | Condensate | Synthetic | Natural | |||||||||||||||||||||||||||
| Natural Gas in Billions of Cubic Feet | NGLs | Oil | Gas | NGLs | Oil | Gas | NGLs | Oil | Gas | |||||||||||||||||||||||||||
|
Proved Developed
|
||||||||||||||||||||||||||||||||||||
|
Consolidated Companies
|
||||||||||||||||||||||||||||||||||||
|
U.S.
|
990 | – | 2,486 | 1,045 | – | 2,113 | 1,122 | – | 2,314 | |||||||||||||||||||||||||||
|
Other Americas
|
82 | 403 | 1,147 | 84 | 352 | 1,490 | 66 | 190 | 1,678 | |||||||||||||||||||||||||||
|
Africa
|
792 | – | 1,276 | 830 | – | 1,304 | 820 | – | 978 | |||||||||||||||||||||||||||
|
Asia
|
703 | – | 4,300 | 826 | – | 4,836 | 926 | – | 5,062 | |||||||||||||||||||||||||||
|
Australia
|
39 | – | 813 | 39 | – | 881 | 50 | – | 1,071 | |||||||||||||||||||||||||||
|
Europe
|
116 | – | 204 | 136 | – | 235 | 151 | – | 302 | |||||||||||||||||||||||||||
|
Total Consolidated
|
2,722 | 403 | 10,226 | 2,960 | 352 | 10,859 | 3,135 | 190 | 11,405 | |||||||||||||||||||||||||||
|
Affiliated Companies
|
||||||||||||||||||||||||||||||||||||
|
TCO
|
1,019 | – | 1,400 | 1,128 | – | 1,484 | 1,256 | – | 1,830 | |||||||||||||||||||||||||||
|
Other
|
93 | 50 | 75 | 95 | 53 | 70 | 97 | 56 | 73 | |||||||||||||||||||||||||||
|
Total Consolidated and Affiliated Companies
|
3,834 | 453 | 11,701 | 4,183 | 405 | 12,413 | 4,488 | 246 | 13,308 | |||||||||||||||||||||||||||
|
Proved Undeveloped
|
||||||||||||||||||||||||||||||||||||
|
Consolidated Companies
|
||||||||||||||||||||||||||||||||||||
|
U.S.
|
321 | – | 1,160 | 230 | – | 359 | 239 | – | 384 | |||||||||||||||||||||||||||
|
Other Americas
|
31 | 120 | 517 | 24 | 114 | 325 | 38 | 270 | 307 | |||||||||||||||||||||||||||
|
Africa
|
363 | – | 1,920 | 338 | – | 1,640 | 426 | – | 2,043 | |||||||||||||||||||||||||||
|
Asia
|
191 | – | 2,421 | 187 | – | 2,357 | 245 | – | 2,798 | |||||||||||||||||||||||||||
|
Australia
|
101 | – | 8,931 | 49 | – | 5,175 | 48 | – | 5,174 | |||||||||||||||||||||||||||
|
Europe
|
43 | – | 54 | 16 | – | 40 | 19 | – | 42 | |||||||||||||||||||||||||||
|
Total Consolidated
|
1,050 | 120 | 15,003 | 844 | 114 | 9,896 | 1,015 | 270 | 10,748 | |||||||||||||||||||||||||||
|
Affiliated Companies
|
||||||||||||||||||||||||||||||||||||
|
TCO
|
740 | – | 851 | 692 | – | 902 | 690 | – | 1,003 | |||||||||||||||||||||||||||
|
Other
|
64 | 194 | 1,128 | 62 | 203 | 1,040 | 54 | 210 | 990 | |||||||||||||||||||||||||||
|
Total Consolidated and Affiliated Companies
|
1,854 | 314 | 16,982 | 1,598 | 317 | 11,838 | 1,759 | 480 | 12,741 | |||||||||||||||||||||||||||
|
Total Proved Reserves
|
5,688 | 767 | 28,683 | 5,781 | 722 | 24,251 | 6,247 | 726 | 26,049 | |||||||||||||||||||||||||||
| * | Based on 12-month average price. |
FS-68
Table of Contents
FS-69
Table of Contents
FS-70
Table of Contents
| Total | ||||||||||||||||||||||||||||||||||||||||||||||||
| Consolidated Companies | Affiliated Companies | Consolidated | ||||||||||||||||||||||||||||||||||||||||||||||
| Other | Synthetic | Synthetic | and Affiliated | |||||||||||||||||||||||||||||||||||||||||||||
| Millions of barrels | U.S. | Americas 1 | Africa | Asia | Australia | Europe | Oil 2,3 | Total | TCO | Oil 2 | Other 4 | Companies | ||||||||||||||||||||||||||||||||||||
|
Reserves at January 1, 2009
|
1,470 | 149 | 1,385 | 1,456 | 73 | 202 | – | 4,735 | 2,176 | – | 439 | 7,350 | ||||||||||||||||||||||||||||||||||||
|
Changes attributable to:
|
||||||||||||||||||||||||||||||||||||||||||||||||
|
Revisions
|
63 | (29 | ) | (46 | ) | (121 | ) | 18 | 10 | 460 | 355 | (184 | ) | 266 | (269 | ) | 168 | |||||||||||||||||||||||||||||||
|
Improved recovery
|
2 | – | 48 | – | – | – | – | 50 | 36 | – | – | 86 | ||||||||||||||||||||||||||||||||||||
|
Extensions and discoveries
|
6 | 13 | 10 | 3 | 20 | – | – | 52 | – | – | – | 52 | ||||||||||||||||||||||||||||||||||||
|
Purchases
|
– | – | – | – | – | – | – | – | – | – | – | – | ||||||||||||||||||||||||||||||||||||
|
Sales
|
(3 | ) | (6 | ) | – | – | – | – | – | (9 | ) | – | – | – | (9 | ) | ||||||||||||||||||||||||||||||||
|
Production
|
(177 | ) | (23 | ) | (151 | ) | (167 | ) | (13 | ) | (42 | ) | – | (573 | ) | (82 | ) | – | (19 | ) | (674 | ) | ||||||||||||||||||||||||||
|
Reserves at December 31, 2009
5
|
1,361 | 104 | 1,246 | 1,171 | 98 | 170 | 460 | 4,610 | 1,946 | 266 | 151 | 6,973 | ||||||||||||||||||||||||||||||||||||
|
Changes attributable to:
|
||||||||||||||||||||||||||||||||||||||||||||||||
|
Revisions
|
63 | 12 | 17 | (26 | ) | 3 | 19 | 15 | 103 | (33 | ) | – | 12 | 82 | ||||||||||||||||||||||||||||||||||
|
Improved recovery
|
11 | 3 | 58 | 2 | – | – | – | 74 | – | – | 3 | 77 | ||||||||||||||||||||||||||||||||||||
|
Extensions and discoveries
|
19 | 19 | 9 | 16 | – | – | – | 63 | – | – | – | 63 | ||||||||||||||||||||||||||||||||||||
|
Purchases
|
– | – | – | 11 | – | – | – | 11 | – | – | – | 11 | ||||||||||||||||||||||||||||||||||||
|
Sales
|
(1 | ) | – | – | – | – | – | – | (1 | ) | – | – | – | (1 | ) | |||||||||||||||||||||||||||||||||
|
Production
|
(178 | ) | (30 | ) | (162 | ) | (161 | ) | (13 | ) | (37 | ) | (9 | ) | (590 | ) | (93 | ) | (10 | ) | (9 | ) | (702 | ) | ||||||||||||||||||||||||
|
Reserves at December 31,
2010
5
|
1,275 | 108 | 1,168 | 1,013 | 88 | 152 | 466 | 4,270 | 1,820 | 256 | 157 | 6,503 | ||||||||||||||||||||||||||||||||||||
|
Changes attributable to:
|
||||||||||||||||||||||||||||||||||||||||||||||||
|
Revisions
|
63 | 4 | 60 | 25 | (2 | ) | 15 | 32 | 197 | 28 | – | 10 | 235 | |||||||||||||||||||||||||||||||||||
|
Improved recovery
|
6 | 4 | 48 | – | – | – | – | 58 | – | – | – | 58 | ||||||||||||||||||||||||||||||||||||
|
Extensions and discoveries
|
140 | 30 | 34 | 4 | 65 | 26 | – | 299 | – | – | – | 299 | ||||||||||||||||||||||||||||||||||||
|
Purchases
|
2 | – | – | – | – | – | 40 | 42 | – | – | – | 42 | ||||||||||||||||||||||||||||||||||||
|
Sales
|
(5 | ) | – | – | – | (1 | ) | – | – | (6 | ) | – | – | – | (6 | ) | ||||||||||||||||||||||||||||||||
|
Production
|
(170 | ) | (33 | ) | (155 | ) | (148 | ) | (10 | ) | (34 | ) | (15 | ) | (565 | ) | (89 | ) | (12 | ) | (10 | ) | (676 | ) | ||||||||||||||||||||||||
|
Reserves at December 31, 2011
5
|
1,311 | 113 | 1,155 | 894 | 140 | 159 | 523 | 4,295 | 1,759 | 244 | 157 | 6,455 | ||||||||||||||||||||||||||||||||||||
| 1 | Ending reserve balances in North America were 13, 14 and 12 and in South America were 100, 94 and 92 in 2011, 2010 and 2009, respectively. | |
| 2 | Prospective reporting effective December 31, 2009, in accordance with the SEC rule on Modernization of Oil and Gas Reporting. | |
| 3 | Reserves associated with Canada. | |
| 4 | Ending reserve balances in Africa were 38, 36 and 31 and in South America were 119, 121 and 120 in 2011, 2010 and 2009, respectively. | |
| 5 | Included are year-end reserve quantities related to production-sharing contracts (PSC) (refer to page E-11 for the definition of a PSC). PSC-related reserve quantities are 22 percent, 24 percent and 26 percent for consolidated companies for 2011, 2010 and 2009, respectively. |
FS-71
Table of Contents
FS-72
Table of Contents
| Total | ||||||||||||||||||||||||||||||||||||||||
| Consolidated Companies | Affiliated Companies | Consolidated | ||||||||||||||||||||||||||||||||||||||
| Other | and Affiliated | |||||||||||||||||||||||||||||||||||||||
| Billions of cubic feet (BCF) | U.S. | Americas 1 | Africa | Asia | Australia | Europe | Total | TCO | Other 2 | Companies | ||||||||||||||||||||||||||||||
|
Reserves at January 1, 2009
|
3,150 | 2,368 | 3,056 | 7,996 | 1,962 | 490 | 19,022 | 3,175 | 878 | 23,075 | ||||||||||||||||||||||||||||||
|
Changes attributable to:
|
||||||||||||||||||||||||||||||||||||||||
|
Revisions
|
39 | (126 | ) | 4 | 493 | 166 | (7 | ) | 569 | (237 | ) | 193 | 525 | |||||||||||||||||||||||||||
|
Improved recovery
|
– | – | – | – | – | – | – | – | – | – | ||||||||||||||||||||||||||||||
|
Extensions and discoveries
|
53 | 1 | 3 | 54 | 4,276 | – | 4,387 | – | – | 4,387 | ||||||||||||||||||||||||||||||
|
Purchases
|
– | – | – | – | – | – | – | – | – | – | ||||||||||||||||||||||||||||||
|
Sales
|
(33 | ) | (84 | ) | – | – | – | – | (117 | ) | – | – | (117 | ) | ||||||||||||||||||||||||||
|
Production
3
|
(511 | ) | (174 | ) | (42 | ) | (683 | ) | (159 | ) | (139 | ) | (1,708 | ) | (105 | ) | (8 | ) | (1,821 | ) | ||||||||||||||||||||
|
Reserves at December 31, 2009
4
|
2,698 | 1,985 | 3,021 | 7,860 | 6,245 | 344 | 22,153 | 2,833 | 1,063 | 26,049 | ||||||||||||||||||||||||||||||
|
Changes attributable to:
|
||||||||||||||||||||||||||||||||||||||||
|
Revisions
|
220 | 4 | (20 | ) | (31 | ) | (22 | ) | 46 | 197 | (324 | ) | 56 | (71 | ) | |||||||||||||||||||||||||
|
Improved recovery
|
1 | 1 | – | – | – | – | 2 | – | – | 2 | ||||||||||||||||||||||||||||||
|
Extensions and discoveries
|
36 | 4 | – | 59 | – | 11 | 110 | – | – | 110 | ||||||||||||||||||||||||||||||
|
Purchases
|
3 | – | – | 4 | – | – | 7 | – | – | 7 | ||||||||||||||||||||||||||||||
|
Sales
|
(7 | ) | – | – | – | – | – | (7 | ) | – | – | (7 | ) | |||||||||||||||||||||||||||
|
Production
3
|
(479 | ) | (179 | ) | (57 | ) | (699 | ) | (167 | ) | (126 | ) | (1,707 | ) | (123 | ) | (9 | ) | (1,839 | ) | ||||||||||||||||||||
|
Reserves at December 31, 2010
4
|
2,472 | 1,815 | 2,944 | 7,193 | 6,056 | 275 | 20,755 | 2,386 | 1,110 | 24,251 | ||||||||||||||||||||||||||||||
|
Changes attributable to:
|
||||||||||||||||||||||||||||||||||||||||
|
Revisions
|
217 | (4 | ) | 39 | 196 | (107 | ) | 74 | 415 | (21 | ) | 103 | 497 | |||||||||||||||||||||||||||
|
Improved recovery
|
– | 1 | – | – | – | – | 1 | – | – | 1 | ||||||||||||||||||||||||||||||
|
Extensions and discoveries
|
287 | 13 | 290 | 46 | 4,035 | 9 | 4,680 | – | – | 4,680 | ||||||||||||||||||||||||||||||
|
Purchases
|
1,231 | – | – | 2 | – | – | 1,233 | – | – | 1,233 | ||||||||||||||||||||||||||||||
|
Sales
|
(95 | ) | – | – | (2 | ) | (77 | ) | – | (174 | ) | – | – | (174 | ) | |||||||||||||||||||||||||
|
Production
3
|
(466 | ) | (161 | ) | (77 | ) | (714 | ) | (163 | ) | (100 | ) | (1,681 | ) | (114 | ) | (10 | ) | (1,805 | ) | ||||||||||||||||||||
|
Reserves at December 31, 2011
4
|
3,646 | 1,664 | 3,196 | 6,721 | 9,744 | 258 | 25,229 | 2,251 | 1,203 | 28,683 | ||||||||||||||||||||||||||||||
| 1 | Ending reserve balances in North America and South America were 19, 21, 23 and 1,645, 1,794, 1,962 in 2011, 2010 and 2009, respectively. | |
| 2 | Ending reserve balances in Africa and South America were 1,016, 953, 898 and 187, 157, 165 in 2011, 2010 and 2009, respectively. | |
| 3 | Total “as sold” volumes are 4.4 BCF, 4.5 BCF and 4.5 BCF for 2011, 2010 and 2009, respectively. | |
| 4 | Includes reserve quantities related to production-sharing contracts (PSC) (refer to page E-11 for the definition of a PSC). PSC-related reserve quantities are 21 percent, 29 percent and 31 percent for consolidated companies for 2011, 2010 and 2009, respectively. |
FS-73
Table of Contents
FS-74
Table of Contents
Flows Related to Proved Oil and Gas Reserves
| Consolidated Companies | Affiliated Companies |
Total
Consolidated |
||||||||||||||||||||||||||||||||||||||
| Other | and Affiliated | |||||||||||||||||||||||||||||||||||||||
| Millions of dollars | U.S. | Americas | Africa | Asia | Australia | Europe | Total | TCO | Other | Companies | ||||||||||||||||||||||||||||||
|
At December 31, 2011
|
||||||||||||||||||||||||||||||||||||||||
|
Future cash inflows from production
1
|
$ | 143,633 | $ | 63,579 | $ | 124,077 | $ | 124,972 | $ | 113,773 | $ | 19,704 | $ | 589,738 | $ | 171,588 | $ | 42,212 | $ | 803,538 | ||||||||||||||||||||
|
Future production costs
|
(39,523 | ) | (22,856 | ) | (22,703 | ) | (35,579 | ) | (15,411 | ) | (7,467 | ) | (143,539 | ) | (7,976 | ) | (19,430 | ) | (170,945 | ) | ||||||||||||||||||||
|
Future development costs
|
(11,272 | ) | (9,345 | ) | (10,695 | ) | (15,035 | ) | (29,489 | ) | (676 | ) | (76,512 | ) | (10,778 | ) | (2,836 | ) | (90,126 | ) | ||||||||||||||||||||
|
Future income taxes
|
(34,050 | ) | (9,121 | ) | (53,103 | ) | (33,884 | ) | (20,661 | ) | (7,229 | ) | (158,048 | ) | (43,176 | ) | (10,833 | ) | (212,057 | ) | ||||||||||||||||||||
|
Undiscounted future net cash flows
|
58,788 | 22,257 | 37,576 | 40,474 | 48,212 | 4,332 | 211,639 | 109,658 | 9,113 | 330,410 | ||||||||||||||||||||||||||||||
|
10 percent midyear annual discount
for timing of estimated cash flows |
(25,013 | ) | (15,082 | ) | (13,801 | ) | (14,627 | ) | (35,051 | ) | (1,117 | ) | (104,691 | ) | (61,675 | ) | (4,883 | ) | (171,249 | ) | ||||||||||||||||||||
|
Standardized Measure
Net Cash Flows |
$ | 33,775 | $ | 7,175 | $ | 23,775 | $ | 25,847 | $ | 13,161 | $ | 3,215 | $ | 106,948 | $ | 47,983 | $ | 4,230 | $ | 159,161 | ||||||||||||||||||||
|
At December 31, 2010
|
||||||||||||||||||||||||||||||||||||||||
|
Future cash inflows from production
1
|
$ | 101,281 | $ | 48,068 | $ | 90,402 | $ | 101,553 | $ | 52,635 | $ | 13,618 | $ | 407,557 | $ | 124,970 | $ | 31,188 | $ | 563,715 | ||||||||||||||||||||
|
Future production costs
|
(36,609 | ) | (22,118 | ) | (19,591 | ) | (30,793 | ) | (9,191 | ) | (5,842 | ) | (124,144 | ) | (7,298 | ) | (4,172 | ) | (135,614 | ) | ||||||||||||||||||||
|
Future development costs
|
(6,661 | ) | (6,953 | ) | (12,239 | ) | (11,690 | ) | (13,160 | ) | (708 | ) | (51,411 | ) | (8,777 | ) | (2,254 | ) | (62,442 | ) | ||||||||||||||||||||
|
Future income taxes
|
(20,307 | ) | (7,337 | ) | (34,405 | ) | (26,355 | ) | (9,085 | ) | (4,031 | ) | (101,520 | ) | (30,763 | ) | (12,919 | ) | (145,202 | ) | ||||||||||||||||||||
|
Undiscounted future net cash flows
|
37,704 | 11,660 | 24,167 | 32,715 | 21,199 | 3,037 | 130,482 | 78,132 | 11,843 | 220,457 | ||||||||||||||||||||||||||||||
|
10 percent midyear annual discount
for timing of estimated cash flows |
(13,218 | ) | (6,751 | ) | (9,221 | ) | (12,287 | ) | (15,282 | ) | (699 | ) | (57,458 | ) | (43,973 | ) | (6,574 | ) | (108,005 | ) | ||||||||||||||||||||
|
Standardized Measure
Net Cash Flows |
$ | 24,486 | $ | 4,909 | $ | 14,946 | $ | 20,428 | $ | 5,917 | $ | 2,338 | $ | 73,024 | $ | 34,159 | $ | 5,269 | $ | 112,452 | ||||||||||||||||||||
|
At December 31, 2009
|
||||||||||||||||||||||||||||||||||||||||
|
Future cash inflows from production
2
|
$ | 81,332 | $ | 39,251 | $ | 75,338 | $ | 91,993 | $ | 49,875 | $ | 11,988 | $ | 349,777 | $ | 97,793 | $ | 23,825 | $ | 471,395 | ||||||||||||||||||||
|
Future production costs
|
(35,295 | ) | (27,716 | ) | (22,459 | ) | (31,843 | ) | (8,648 | ) | (5,842 | ) | (131,803 | ) | (6,923 | ) | (4,765 | ) | (143,491 | ) | ||||||||||||||||||||
|
Future development costs
|
(7,027 | ) | (3,711 | ) | (14,715 | ) | (12,884 | ) | (12,371 | ) | (561 | ) | (51,269 | ) | (8,190 | ) | (3,986 | ) | (63,445 | ) | ||||||||||||||||||||
|
Future income taxes
|
(13,662 | ) | (3,674 | ) | (22,503 | ) | (18,905 | ) | (10,484 | ) | (3,269 | ) | (72,497 | ) | (23,357 | ) | (7,774 | ) | (103,628 | ) | ||||||||||||||||||||
|
Undiscounted future net cash flows
|
25,348 | 4,150 | 15,661 | 28,361 | 18,372 | 2,316 | 94,208 | 59,323 | 7,300 | 160,831 | ||||||||||||||||||||||||||||||
|
10 percent midyear annual discount
for timing of estimated cash flows |
(8,822 | ) | (2,275 | ) | (5,882 | ) | (11,722 | ) | (14,764 | ) | (467 | ) | (43,932 | ) | (34,937 | ) | (4,450 | ) | (83,319 | ) | ||||||||||||||||||||
|
Standardized Measure
Net Cash Flows |
$ | 16,526 | $ | 1,875 | $ | 9,779 | $ | 16,639 | $ | 3,608 | $ | 1,849 | $ | 50,276 | $ | 24,386 | $ | 2,850 | $ | 77,512 | ||||||||||||||||||||
| 1 | Based on 12-month average price. |
| 2 | Based on year-end prices. |
FS-75
Table of Contents
Future Net Cash Flows From Proved Reserves
| Total | ||||||||||||
| Consolidated | ||||||||||||
| and Affiliated | ||||||||||||
| Millions of dollars | Consolidated Companies | Affiliated Companies | Companies | |||||||||
|
Present Value at January 1, 2009
|
$ | 25,661 | $ | 9,741 | $ | 35,402 | ||||||
|
Sales and transfers of oil and gas produced net of production costs
|
(27,559 | ) | (4,209 | ) | (31,768 | ) | ||||||
|
Development costs incurred
|
10,791 | 335 | 11,126 | |||||||||
|
Purchases of reserves
|
– | – | – | |||||||||
|
Sales of reserves
|
(285 | ) | – | (285 | ) | |||||||
|
Extensions, discoveries and improved recovery less related costs
|
3,438 | 697 | 4,135 | |||||||||
|
Revisions of previous quantity estimates
|
3,230 | (4,343 | ) | (1,113 | ) | |||||||
|
Net changes in prices, development and production costs
|
51,528 | 30,915 | 82,443 | |||||||||
|
Accretion of discount
|
4,282 | 1,412 | 5,694 | |||||||||
|
Net change in income tax
|
(20,810 | ) | (7,312 | ) | (28,122 | ) | ||||||
|
Net change for 2009
|
24,615 | 17,495 | 42,110 | |||||||||
|
Present Value at December 31, 2009
|
$ | 50,276 | $ | 27,236 | $ | 77,512 | ||||||
|
Sales and transfers of oil and gas produced net of production costs
|
(39,499 | ) | (6,377 | ) | (45,876 | ) | ||||||
|
Development costs incurred
|
12,042 | 572 | 12,614 | |||||||||
|
Purchases of reserves
|
513 | – | 513 | |||||||||
|
Sales of reserves
|
(47 | ) | – | (47 | ) | |||||||
|
Extensions, discoveries and improved recovery less related costs
|
5,194 | 63 | 5,257 | |||||||||
|
Revisions of previous quantity estimates
|
10,156 | 974 | 11,130 | |||||||||
|
Net changes in prices, development and production costs
|
43,887 | 19,878 | 63,765 | |||||||||
|
Accretion of discount
|
8,391 | 3,797 | 12,188 | |||||||||
|
Net change in income tax
|
(17,889 | ) | (6,715 | ) | (24,604 | ) | ||||||
|
Net change for 2010
|
22,748 | 12,192 | 34,940 | |||||||||
|
Present Value at December 31, 2010
|
$ | 73,024 | $ | 39,428 | $ | 112,452 | ||||||
|
Sales and transfers of oil and gas produced net of production costs
|
(53,063 | ) | (8,679 | ) | (61,742 | ) | ||||||
|
Development costs incurred
|
13,869 | 729 | 14,598 | |||||||||
|
Purchases of reserves
|
1,212 | – | 1,212 | |||||||||
|
Sales of reserves
|
(803 | ) | – | (803 | ) | |||||||
|
Extensions, discoveries and improved recovery less related costs
|
12,288 | – | 12,288 | |||||||||
|
Revisions of previous quantity estimates
|
16,750 | 791 | 17,541 | |||||||||
|
Net changes in prices, development and production costs
|
61,428 | 19,097 | 80,525 | |||||||||
|
Accretion of discount
|
11,943 | 5,563 | 17,506 | |||||||||
|
Net change in income tax
|
(29,700 | ) | (4,716 | ) | (34,416 | ) | ||||||
|
Net change for 2011
|
33,924 | 12,785 | 46,709 | |||||||||
|
Present Value at December 31, 2011
|
$ | 106,948 | $ | 52,213 | $ | 159,161 | ||||||
FS-76
Table of Contents
| Exhibit No. | Description | |
|
3.1
|
Restated Certificate of Incorporation of Chevron Corporation, dated May 30, 2008, filed as Exhibit 3.1 to Chevron Corporation’s Quarterly Report on Form 10-Q for the quarterly period ended June 30, 2008, and incorporated herein by reference. | |
|
3.2
|
By-Laws of Chevron Corporation, as amended September 29, 2010, filed as Exhibit 3.1 to Chevron Corporation’s Current Report on Form 8-K filed September 30, 2010, and incorporated herein by reference. | |
|
4.1
|
Pursuant to the Instructions to Exhibits, certain instruments defining the rights of holders of long-term debt securities of the company and its consolidated subsidiaries are not filed because the total amount of securities authorized under any such instrument does not exceed 10 percent of the total assets of the corporation and its subsidiaries on a consolidated basis. A copy of such instrument will be furnished to the Securities and Exchange Commission upon request. | |
|
4.2
|
Confidential Stockholder Voting Policy of Chevron Corporation, filed as Exhibit 4.2 to Chevron Corporation’s Annual Report on Form 10-K for the year ended December 31, 2008, and incorporated herein by reference. | |
|
10.1
|
Chevron Corporation Non-Employee Directors’ Equity Compensation and Deferral Plan, filed as Exhibit 10.1 to Chevron Corporation’s Annual Report on Form 10-K for the year ended December 31, 2008, and incorporated herein by reference. | |
|
10.2
|
Chevron Incentive Plan, filed as Exhibit 10.2 to Chevron Corporation’s Annual Report on Form 10-K for the year ended December 31, 2008, and incorporated herein by reference. | |
|
10.3
|
Long-Term Incentive Plan of Chevron Corporation, filed as Exhibit 10.3 to Chevron Corporation’s Annual Report on Form 10-K for the year ended December 31, 2008, and incorporated herein by reference. | |
|
10.4
|
Chevron Corporation Deferred Compensation Plan for Management Employees, filed as Exhibit 10.5 to Chevron Corporation’s Current Report on Form 8-K filed December 13, 2005, and incorporated herein by reference. | |
|
10.5
|
Chevron Corporation Deferred Compensation Plan for Management Employees II, filed as Exhibit 10.5 to Chevron Corporation’s Annual Report on Form 10-K for the year ended December 31, 2008, and incorporated herein by reference. | |
|
10.6
|
Chevron Corporation Retirement Restoration Plan, filed as Exhibit 10.6 to Chevron Corporation’s Annual Report on Form 10-K for the year ended December 31, 2008, and incorporated herein by reference. | |
|
10.7
|
Chevron Corporation ESIP Restoration Plan, filed as Exhibit 10.7 to Chevron Corporation’s Annual Report on Form 10-K for the year ended December 31, 2008, and incorporated herein by reference. | |
|
10.8
|
Texaco Inc. Director and Employee Deferral Plan, filed as Exhibit 10.16 to Chevron Corporation’s Annual Report on Form 10-K for the year ended December 31, 2001, and incorporated herein by reference. | |
|
10.9*
|
Summary of Chevron Incentive Plan Award Criteria. | |
|
10.10
|
Chevron Corporation Change in Control Surplus Employee Severance Program for Salary Grades 41 through 43, filed as Exhibit 10.1 to Chevron Corporation’s Current Report on Form 8-K filed December 12, 2006, and incorporated herein by reference. | |
|
10.11
|
Chevron Corporation Benefit Protection Program, filed as Exhibit 10.2 to Chevron Corporation’s Current Report on Form 8-K filed December 12, 2006, and incorporated herein by reference. | |
|
10.12
|
Form of Terms and Conditions for Awards under the Long-Term Incentive Plan of Chevron Corporation, filed as Exhibit 10.1 to Chevron Corporation’s Current Report on Form 8-K filed February 1, 2011, and incorporated herein by reference. | |
|
10.13*
|
Form of Restricted Stock Unit Grant Agreement under the Long-Term Incentive Plan of Chevron Corporation. | |
|
10.14
|
Form of Retainer Stock Option Agreement under the Chevron Corporation Non-Employee Directors’ Equity Compensation and Deferral Plan, filed as Exhibit 10.17 to Chevron Corporation’s Annual Report on Form 10-K for the year ended December 31, 2009, and incorporated herein by reference. | |
|
10.15
|
Form of Stock Units Agreement under the Chevron Corporation Non-Employee Directors’ Equity Compensation and Deferral Plan, filed as Exhibit 10.19 to Chevron Corporation’s Annual Report on Form 10-K for the year ended December 31, 2008, and incorporated herein by reference. | |
|
10.16*
|
Agreement between Chevron Corporation and R. Hewitt Pate. | |
|
12.1*
|
Computation of Ratio of Earnings to Fixed Charges (page E-6). | |
|
21.1*
|
Subsidiaries of Chevron Corporation (pages E-7 through E-8). |
E-1
Table of Contents
| Exhibit No. | Description | |
|
23.1*
|
Consent of PricewaterhouseCoopers LLP (page E-9). | |
|
24.1 to 24.11*
|
Powers of Attorney for directors and certain officers of Chevron Corporation, authorizing the signing of the Annual Report on Form 10-K on their behalf. | |
|
31.1*
|
Rule 13a-14(a)/15d-14(a) Certification of the company’s Chief Executive Officer (page E-21). | |
|
31.2*
|
Rule 13a-14(a)/15d-14(a) Certification of the company’s Chief Financial Officer (page E-22). | |
|
32.1*
|
Section 1350 Certification of the company’s Chief Executive Officer (page E-23). | |
|
32.2*
|
Section 1350 Certification of the company’s Chief Financial Officer (page E-24). | |
|
95*
|
Mine Safety Disclosure. | |
|
99.1*
|
Definitions of Selected Energy and Financial Terms (pages E-26 through E-28). | |
|
101.INS*
|
XBRL Instance Document. | |
|
101.SCH*
|
XBRL Schema Document. | |
|
101.CAL*
|
XBRL Calculation Linkbase Document. | |
|
101.LAB*
|
XBRL Label Linkbase Document. | |
|
101.PRE*
|
XBRL Presentation Linkbase Document. | |
|
101.DEF*
|
XBRL Definition Linkbase Document. |
| * | Filed herewith. |
E-2