CHEVRON CORP
10-Ks and 10-Qs
|
|
|
|
|
|
|
|
|
|
|
|
|
|
|
|
|
|
|
|
|
|
|
|
|
|
|
|
|
|
|
|
|
|
|
|
|
|
|
|
|
|
|
|
|
|
|
|
|
|
|
|
|
|
|
|
|
|
|
UNITED STATES SECURITIES AND EXCHANGE COMMISSION
Washington, D.C. 20549
Form 10-K
þ
ANNUAL REPORT PURSUANT TO SECTION 13 OR 15(d) OF THE
SECURITIES EXCHANGE ACT OF 1934
For the fiscal year ended
December 31, 2013
OR
o
TRANSITION REPORT PURSUANT TO SECTION 13 OR 15(d) OF THE
SECURITIES EXCHANGE ACT OF 1934
For the transition period from
to
Commission File Number 001-00368
Chevron Corporation
(Exact name of registrant as specified in its charter)
|
Delaware
|
94-0890210
|
6001 Bollinger Canyon Road,
San Ramon, California 94583-2324 |
||
|
(State or other jurisdiction of
incorporation or organization) |
(I.R.S. Employer
Identification No.) |
(Address of principal executive offices) (Zip Code)
|
||
Registrant’s telephone number, including area code (925) 842-1000
Securities registered pursuant to Section 12 (b) of the Act:
|
Title of Each Class
|
Name of Each Exchange
on Which Registered |
|
|
Common stock, par value $.75 per share
|
New York Stock Exchange, Inc.
|
|
Indicate by check mark if the registrant is a well-known seasoned issuer, as defined in Rule 405 of the Securities Act.
Yes þ No o
Yes þ No o
Indicate by check mark if the registrant is not required to file reports pursuant to Section 13 or Section 15(d) of the Act.
Yes o No þ
Yes o No þ
Indicate by check mark whether the registrant (1) has filed all reports required to be filed by Section 13 or 15(d) of the Securities Exchange Act of 1934 during the preceding 12 months (or for such shorter period that the registrant was required to file such reports), and (2) has been subject to such filing requirements for the past 90 days.
Yes þ No o
Yes þ No o
Indicate by check mark whether the registrant has submitted electronically and posted on its corporate Web site, if any, every Interactive Data File required to be submitted and posted pursuant to Rule 405 of Regulation S-T (§ 232.405 of this chapter) during the preceding 12 months (or for such shorter period that the registrant was required to submit and post such files). Yes
þ
No
o
Indicate by check mark if disclosure of delinquent filers pursuant to Item 405 of Regulation S-K (§ 229.405 of this chapter) is not contained herein, and will not be contained, to the best of registrant’s knowledge, in definitive proxy or information statements incorporated by reference in Part III of this Form 10-K or any amendment to this Form 10-K.
o
Indicate by check mark whether the registrant is a large accelerated filer, an accelerated filer, a non-accelerated filer, or a smaller reporting company. See the definitions of “large accelerated filer,” “accelerated filer” and “smaller reporting company” in Rule 12b-2 of the Exchange Act.
|
Large accelerated filer
þ
|
Accelerated filer
o
|
Non-accelerated filer
o
(Do not check if a smaller reporting company) |
Smaller reporting company
o
|
|||
Indicate by check mark whether the registrant is a shell company (as defined in Rule 12b-2 of the Act). Yes
o
No
þ
Aggregate market value of the voting and non-voting common equity held by non-affiliates computed by reference to the price at which the common equity was last sold, or the average bid and asked price of such common equity, as of the last business day of the registrant’s most recently completed second fiscal quarter —
$228,635,687,380
(As of
June 28, 2013
)
Number of Shares of Common Stock
outstanding as of February 10, 2014
—
1,909,130,328
DOCUMENTS INCORPORATED BY REFERENCE
(To The Extent Indicated Herein)
Notice of the
2014
Annual Meeting and
2014
Proxy Statement, to be filed pursuant to Rule 14a-6(b) under the Securities Exchange Act of 1934, in connection with the company’s
2014
Annual Meeting of Stockholders (in Part III)
1
TABLE OF CONTENTS
|
ITEM
|
PAGE NO.
|
||
|
3
|
|||
|
3
|
|||
|
4
|
|||
|
4
|
|||
|
4
|
|||
|
24
|
|||
|
26
|
|||
|
27
|
|||
|
27
|
|||
|
29
|
|||
|
29
|
|||
|
29
|
|||
|
31
|
|||
|
31
|
|||
|
31
|
|||
|
31
|
|||
|
31
|
|||
|
32
|
|||
|
32
|
|||
|
32
|
|||
|
32
|
|||
|
33
|
|||
|
34
|
|||
|
34
|
|||
|
34
|
|||
|
34
|
|||
|
35
|
|||
|
36
|
|||
|
37
|
|||
|
EX-10.8
|
EX-24.10
|
|
EX-10.9
|
EX-31.1
|
|
EX-12.1
|
EX-31.2
|
|
EX-21.1
|
EX-32.1
|
|
EX-23.1
|
EX-32.2
|
|
EX-24.1
|
EX-95
|
|
EX-24.2
|
EX-99.1
|
|
EX-24.3
|
EX-101 INSTANCE DOCUMENT
|
|
EX-24.4
|
EX-101 SCHEMA DOCUMENT
|
|
EX-24.5
|
EX-101 CALCULATION LINKBASE DOCUMENT
|
|
EX-24.6
|
EX-101 LABELS LINKBASE DOCUMENT
|
|
EX-24.7
|
EX-101 PRESENTATION LINKBASE DOCUMENT
|
|
EX-24.8
|
EX-101 DEFINITION LINKBASE DOCUMENT
|
|
EX-24.9
|
|
1
CAUTIONARY STATEMENT RELEVANT TO FORWARD-LOOKING INFORMATION
FOR THE PURPOSE OF “SAFE HARBOR” PROVISIONS OF THE
PRIVATE SECURITIES LITIGATION REFORM ACT OF 1995
FOR THE PURPOSE OF “SAFE HARBOR” PROVISIONS OF THE
PRIVATE SECURITIES LITIGATION REFORM ACT OF 1995
This
Annual Report on Form 10-K
of Chevron Corporation contains forward-looking statements relating to Chevron’s operations that are based on management’s current expectations, estimates and projections about the petroleum, chemicals and other energy-related industries. Words such as “anticipates,” “expects,” “intends,” “plans,” “targets,” “forecasts,” “projects,” “believes,” “seeks,” “schedules,” “estimates,” “budgets,” “outlook” and similar expressions are intended to identify such forward-looking statements. These statements are not guarantees of future performance and are subject to certain risks, uncertainties and other factors, many of which are beyond the company’s control and are difficult to predict. Therefore, actual outcomes and results may differ materially from what is expressed or forecasted in such forward-looking statements. The reader should not place undue reliance on these forward-looking statements, which speak only as of the date of this report. Unless legally required, Chevron undertakes no obligation to update publicly any forward-looking statements, whether as a result of new information, future events or otherwise.
Among the important factors that could cause actual results to differ materially from those in the forward-looking statements are: changing crude oil and natural gas prices; changing refining, marketing and chemicals margins; actions of competitors or regulators; timing of exploration expenses; timing of crude oil liftings; the competitiveness of alternate-energy sources or product substitutes; technological developments; the results of operations and financial condition of equity affiliates; the inability or failure of the company’s joint-venture partners to fund their share of operations and development activities; the potential failure to achieve expected net production from existing and future crude oil and natural gas development projects; potential delays in the development, construction or start-up of planned projects; the potential disruption or interruption of the company’s production or manufacturing facilities or delivery/transportation networks due to war, accidents, political events, civil unrest, severe weather or crude oil production quotas that might be imposed by the Organization of Petroleum Exporting Countries; the potential liability for remedial actions or assessments under existing or future environmental regulations and litigation; significant investment or product changes required by existing or future environmental statutes, regulations and litigation; the potential liability resulting from other pending or future litigation; the company’s future acquisition or disposition of assets and gains and losses from asset dispositions or impairments; government-mandated sales, divestitures, recapitalizations, industry-specific taxes, changes in fiscal terms or restrictions on scope of company operations; foreign currency movements compared with the U.S. dollar; the effects of changed accounting rules under generally accepted accounting principles promulgated by rule-setting bodies; and the factors set forth under the heading “Risk Factors” on pages 27 through 29 in this report. In addition, such results could be affected by general domestic and international economic and political conditions. Other unpredictable or unknown factors not discussed in this report could also have material adverse effects on forward-looking statements.
2
General Development of Business
Summary Description of Chevron
Chevron Corporation,
*
a Delaware corporation, manages its investments in subsidiaries and affiliates and provides administrative, financial, management and technology support to U.S. and international subsidiaries that engage in fully integrated petroleum operations, chemicals operations, mining operations, and power and energy services. Upstream operations consist primarily of exploring for, developing and producing crude oil and natural gas; processing, liquefaction, transportation and regasification associated with liquefied natural gas; transporting crude oil by major international oil export pipelines; transporting, storage and marketing of natural gas; and a gas-to-liquids project. Downstream operations consist primarily of refining crude oil into petroleum products; marketing of crude oil and refined products; transporting crude oil and refined products by pipeline, marine vessel, motor equipment and rail car; and manufacturing and marketing of commodity petrochemicals, plastics for industrial uses and fuel and lubricant additives.
A list of the company’s major subsidiaries is presented on page E-4. As of December 31,
2013
, Chevron had approximately 64,600 employees (including about 3,200 service station employees). Approximately 32,000 employees (including about 3,000 service station employees), or 50 percent, were employed in U.S. operations.
Overview of Petroleum Industry
Petroleum industry operations and profitability are influenced by many factors. Prices for crude oil, natural gas, petroleum products and petrochemicals are generally determined by supply and demand. The members of the Organization of Petroleum Exporting Countries (OPEC) are typically the world’s swing producers of crude oil and their production levels are a major factor in determining worldwide supply. Demand for crude oil and its products and for natural gas is largely driven by the conditions of local, national and global economies, although weather patterns and taxation relative to
other energy sources also play a significant part. Laws and governmental policies, particularly in the areas of taxation, energy and the environment affect where and how companies conduct their operations and formulate their products and, in some cases, limit their profits directly.
Strong competition exists in all sectors of the petroleum and petrochemical industries in supplying the energy, fuel and chemical needs of industry and individual consumers. Chevron competes with fully integrated, major global petroleum companies, as well as independent and national petroleum companies, for the acquisition of crude oil and natural gas leases and other properties and for the equipment and labor required to develop and operate those properties. In its downstream business, Chevron competes with fully integrated, major petroleum companies and other independent refining, marketing, transportation and chemicals entities and national petroleum companies in the sale or acquisition of various goods or services in many national and international markets.
Operating Environment
Refer to pages FS-2 through FS-8 of this Form 10-K in Management’s Discussion and Analysis of Financial Condition and Results of Operations for a discussion of the company’s current business environment and outlook.
Chevron’s Strategic Direction
Chevron’s primary objective is to create shareholder value and achieve sustained financial returns from its operations that will enable it to outperform its competitors. In the upstream, the company’s strategies are to grow profitably in core areas and build new legacy positions. In the downstream, the strategies are to deliver competitive returns and grow earnings across the value chain. The company also continues to apply commercial excellence to enable the success of the upstream and downstream strategies, to utilize technology across all its businesses to differentiate performance, and to invest in profitable renewable energy and energy efficiency solutions.
___________________________________
|
*
|
Incorporated in Delaware in 1926 as Standard Oil Company of California, the company adopted the name Chevron Corporation in 1984 and ChevronTexaco Corporation in 2001. In 2005, ChevronTexaco Corporation changed its name to Chevron Corporation. As used in this report, the term “Chevron” and such terms as “the company,” “the corporation,” “our,” “we” and “us” may refer to Chevron Corporation, one or more of its consolidated subsidiaries, or all of them taken as a whole, but unless stated otherwise they do not include “affiliates” of Chevron — i.e., those companies accounted for by the equity method (generally owned 50 percent or less) or investments accounted for by the cost method. All of these terms are used for convenience only and are not intended as a precise description of any of the separate companies, each of which manages its own affairs.
|
3
Description of Business and Properties
The upstream and downstream activities of the company and its equity affiliates are widely dispersed geographically, with operations and projects* in North America, South America, Europe, Africa, Asia and Australia. Tabulations of segment sales and other operating revenues, earnings and income taxes for the three years ending December 31,
2013
, and assets as of the end of
2013
and
2012
— for the United States and the company’s international geographic areas — are in Note 11 to the Consolidated Financial Statements beginning on page FS-35. Similar comparative data for the company’s investments in and income from equity affiliates and property, plant and equipment are in Notes 12 and 13 on pages FS-37 through FS-39.
Capital and Exploratory Expenditures
Total expenditures for
2013
were
$41.9 billion
, including
$2.7 billion
for the company’s share of equity-affiliate expenditures. In
2012
and
2011
, expenditures were
$34.2 billion
and
$29.1 billion
, respectively, including the company’s share of affiliates’ expenditures of
$2.1 billion
in
2012
and
$1.7 billion
in
2011
.
Of the
$41.9 billion
in expenditures for
2013
,
90 percent
, or
$37.9 billion
, was related to upstream activities. Approximately
89 percent
was expended for upstream operations in both
2012
and
2011
. International upstream accounted for about
78 percent
of the worldwide upstream investment in
2013
, about
72 percent
in
2012
and about
68 percent
in
2011
. These amounts exclude the acquisition of Atlas Energy, Inc. in 2011.
In
2014
, the company estimates capital and exploratory expenditures will be $39.8 billion, including $4.8 billion of spending by affiliates. Approximately 90 percent of the total, or $35.8 billion, is budgeted for exploration and production activities, with $27.9 billion, or about 78 percent, of this amount for projects outside the United States.
Refer also to a discussion of the company’s capital and exploratory expenditures on page FS-
12.
Upstream
The table on the following page summarizes the net production of liquids and natural gas for
2013
and
2012
by the company and its affiliates. Worldwide oil-equivalent production of
2.597 million
barrels per day in 2013 was essentially unchanged from
2012
. The benefits of lower maintenance-related downtime and higher reliability at the Tengizchevroil facilities in Kazakhstan, and ramp-ups at the Usan Project in Nigeria, in the Marcellus Shale in western Pennsylvania and in the Delaware Basin in New Mexico were offset by normal field declines. Refer to the “Results of Operations” section beginning on page
FS-6
for a detailed discussion of the factors explaining the
2011
through
2013
changes in production for crude oil and natural gas liquids, and natural gas.
The company estimates its average worldwide oil-equivalent production in
2014
will be approximately
2.610 million
barrels per day based on an average Brent price of
$109
per barrel in
2013
. This estimate is subject to many factors and uncertainties, including quotas that may be imposed by OPEC, price effects on entitlement volumes, changes in fiscal terms or restrictions on the scope of company operations, delays in project start-ups and ramp-ups, fluctuations in demand for natural gas in various markets, weather conditions that may shut in production, civil unrest, changing geopolitics, delays in completion of maintenance turnarounds, greater-than-expected declines in production from mature fields, or other disruptions to operations. The longer-term outlook for production levels is also affected by the size and number of economic investment opportunities and, for new, large-scale projects, the time lag between initial exploration and the beginning of production. Refer to the “Review of Ongoing Exploration and Production Activities in Key Areas,” beginning on page 9, for a discussion of the company’s major crude oil and natural gas development projects.
___________________________________
|
*
|
As used in this report, the term “project” may describe new upstream development activity, individual phases in a multiphase development, maintenance activities, certain existing assets, new investments in downstream and chemicals capacity, investments in emerging and sustainable energy activities, and certain other activities. All of these terms are used for convenience only and are not intended as a precise description of the term “project” as it relates to any specific governmental law or regulation.
|
4
Net Production of Crude Oil and Natural Gas Liquids and Natural Gas
1
|
Components of Oil-Equivalent
|
|||||||||||||||||||
|
Crude Oil & Natural Gas
|
|||||||||||||||||||
|
Oil-Equivalent (Thousands
|
Liquids (Thousands of
|
Natural Gas (Millions
|
|||||||||||||||||
|
of Barrels per Day)
|
Barrels per Day)
|
of Cubic Feet per Day)
|
|||||||||||||||||
|
2013
|
2012
|
2013
|
2012
|
2013
|
2012
|
||||||||||||||
|
United States
|
657
|
|
655
|
|
449
|
|
455
|
|
1,246
|
|
1,203
|
|
|||||||
|
Other Americas
|
|||||||||||||||||||
|
Argentina
|
19
|
|
22
|
|
18
|
|
21
|
|
6
|
|
4
|
|
|||||||
|
Brazil
|
6
|
|
6
|
|
5
|
|
6
|
|
2
|
|
2
|
|
|||||||
|
Canada
|
71
|
|
69
|
|
70
|
|
68
|
|
9
|
|
4
|
|
|||||||
|
Colombia
|
36
|
|
36
|
|
—
|
|
—
|
|
216
|
|
216
|
|
|||||||
|
Trinidad and Tobago
|
29
|
|
29
|
|
—
|
|
—
|
|
173
|
|
173
|
|
|||||||
|
Total Other Americas
|
161
|
|
162
|
|
93
|
|
95
|
|
406
|
|
399
|
|
|||||||
|
Africa
|
|||||||||||||||||||
|
Angola
|
127
|
|
137
|
|
118
|
|
128
|
|
52
|
|
53
|
|
|||||||
|
Chad
|
19
|
|
23
|
|
18
|
|
22
|
|
4
|
|
6
|
|
|||||||
|
Democratic Republic of the Congo
|
3
|
|
3
|
|
2
|
|
2
|
|
1
|
|
1
|
|
|||||||
|
Nigeria
|
268
|
|
269
|
|
238
|
|
242
|
|
182
|
|
165
|
|
|||||||
|
Republic of the Congo
|
14
|
|
19
|
|
13
|
|
17
|
|
10
|
|
13
|
|
|||||||
|
Total Africa
|
431
|
|
451
|
|
389
|
|
411
|
|
249
|
|
238
|
|
|||||||
|
Asia
|
|||||||||||||||||||
|
Azerbaijan
|
28
|
|
28
|
|
26
|
|
26
|
|
10
|
|
10
|
|
|||||||
|
Bangladesh
|
113
|
|
94
|
|
2
|
|
2
|
|
663
|
|
550
|
|
|||||||
|
China
|
20
|
|
21
|
|
19
|
|
20
|
|
6
|
|
9
|
|
|||||||
|
Indonesia
|
193
|
|
198
|
|
156
|
|
158
|
|
225
|
|
236
|
|
|||||||
|
Kazakhstan
|
57
|
|
61
|
|
34
|
|
37
|
|
135
|
|
139
|
|
|||||||
|
Myanmar
|
16
|
|
16
|
|
—
|
|
—
|
|
96
|
|
94
|
|
|||||||
|
Partitioned Zone
2
|
87
|
|
90
|
|
84
|
|
86
|
|
19
|
|
21
|
|
|||||||
|
Philippines
|
23
|
|
24
|
|
3
|
|
4
|
|
119
|
|
120
|
|
|||||||
|
Thailand
|
229
|
|
243
|
|
62
|
|
67
|
|
1,003
|
|
1,060
|
|
|||||||
|
Total Asia
|
766
|
|
775
|
|
386
|
|
400
|
|
2,276
|
|
2,239
|
|
|||||||
|
Australia
|
96
|
|
99
|
|
26
|
|
28
|
|
421
|
|
428
|
|
|||||||
|
Europe
|
|||||||||||||||||||
|
Denmark
|
28
|
|
36
|
|
19
|
|
24
|
|
55
|
|
74
|
|
|||||||
|
Netherlands
|
9
|
|
9
|
|
2
|
|
2
|
|
41
|
|
42
|
|
|||||||
|
Norway
|
2
|
|
3
|
|
2
|
|
3
|
|
1
|
|
1
|
|
|||||||
|
United Kingdom
|
55
|
|
66
|
|
40
|
|
46
|
|
94
|
|
122
|
|
|||||||
|
Total Europe
|
94
|
|
114
|
|
63
|
|
75
|
|
191
|
|
239
|
|
|||||||
|
Total Consolidated Companies
|
2,205
|
|
2,256
|
|
1,406
|
|
1,464
|
|
4,789
|
|
4,746
|
|
|||||||
|
Affiliates3
|
392
|
|
354
|
|
325
|
|
300
|
|
403
|
|
328
|
|
|||||||
|
Total Including Affiliates
4
|
2,597
|
|
2,610
|
|
1,731
|
|
1,764
|
|
5,192
|
|
5,074
|
|
|||||||
|
1
Includes synthetic oil: Canada, net
|
43
|
|
43
|
|
43
|
|
43
|
|
—
|
|
—
|
|
|||||||
|
Venezuelan affiliate, net
|
25
|
|
17
|
|
25
|
|
17
|
|
—
|
|
—
|
|
|||||||
|
2
Located between Saudi Arabia and Kuwait.
|
|||||||||||||||||||
|
3 Volumes represent Chevron’s share of production by affiliates, including Tengizchevroil in Kazakhstan; Petroboscan, Petroindependiente and Petropiar in Venezuela; and Angola LNG in Angola.
|
|||||||||||||||||||
|
4
Volumes include natural gas consumed in operations of 524 million and 522 million cubic feet per day in 2013 and 2012, respectively. Total “as sold” natural gas volumes were 4,668 million and 4,552 million cubic feet per day for 2013 and 2012, respectively.
|
|||||||||||||||||||
5
Average Sales Prices and Production Costs per Unit of Production
Refer to Table IV on page FS-64 for the company’s average sales price per barrel of crude oil, condensate and natural gas liquids and per thousand cubic feet of natural gas produced, and the average production cost per oil-equivalent barrel for
2013
,
2012
and
2011
.
Gross and Net Productive Wells
The following table summarizes gross and net productive wells at year-end
2013
for the company and its affiliates:
Productive Oil and Gas Wells at December 31,
2013
|
Productive
|
Productive
|
||||||||||||
|
Oil Wells
|
Gas Wells
|
||||||||||||
|
Gross
|
Net
|
Gross
|
Net
|
||||||||||
|
United States
|
50,533
|
|
33,068
|
|
14,217
|
|
7,740
|
|
|||||
|
Other Americas
|
1,042
|
|
690
|
|
60
|
|
37
|
|
|||||
|
Africa
|
2,608
|
|
870
|
|
17
|
|
7
|
|
|||||
|
Asia
|
13,530
|
|
11,693
|
|
3,318
|
|
1,953
|
|
|||||
|
Australia
|
808
|
|
428
|
|
69
|
|
12
|
|
|||||
|
Europe
|
373
|
|
95
|
|
173
|
|
42
|
|
|||||
|
Total Consolidated Companies
|
68,894
|
|
46,844
|
|
17,854
|
|
9,791
|
|
|||||
|
Affiliates
|
1,364
|
|
476
|
|
7
|
|
2
|
|
|||||
|
Total Including Affiliates
|
70,258
|
|
47,320
|
|
17,861
|
|
9,793
|
|
|||||
|
Multiple completion wells included above
|
952
|
|
677
|
|
413
|
|
372
|
|
|||||
Reserves
Refer to Table V beginning on page FS-64 for a tabulation of the company’s proved net crude oil and natural gas reserves by geographic area, at the beginning of
2011
and each year-end from
2011
through
2013
. Reserves governance, technologies used in establishing proved reserves additions, and major changes to proved reserves by geographic area for the three-year period ended December 31,
2013
, are summarized in the discussion for Table V. Discussion is also provided regarding the nature of, status of and planned future activities associated with the development of proved undeveloped reserves. The company recognizes reserves for projects with various development periods, sometimes exceeding five years. The external factors that impact the duration of a project include scope and complexity, remoteness or adverse operating conditions, infrastructure constraints, and contractual limitations.
The net proved reserve balances at the end of each of the three years
2011
through
2013
are shown in the following table.
Net Proved Reserves at December 31
|
2013
|
2012
|
2011
|
|||||||
|
Liquids — Millions of barrels
|
|||||||||
|
Consolidated Companies
|
4,303
|
|
4,353
|
|
4,295
|
|
|||
|
Affiliated Companies
|
2,042
|
|
2,128
|
|
2,160
|
|
|||
|
Total Liquids
|
6,345
|
|
6,481
|
|
6,455
|
|
|||
|
Natural Gas — Billions of cubic feet
|
|||||||||
|
Consolidated Companies
|
25,670
|
|
25,654
|
|
25,229
|
|
|||
|
Affiliated Companies
|
3,476
|
|
3,541
|
|
3,454
|
|
|||
|
Total Natural Gas
|
29,146
|
|
29,195
|
|
28,683
|
|
|||
|
Oil-Equivalent — Millions of barrels
|
|||||||||
|
Consolidated Companies
|
8,582
|
|
8,629
|
|
8,500
|
|
|||
|
Affiliated Companies
|
2,621
|
|
2,718
|
|
2,736
|
|
|||
|
Total Oil-Equivalent
|
11,203
|
|
11,347
|
|
11,236
|
|
|||
6
Acreage
At December 31,
2013
, the company owned or had under lease or similar agreements undeveloped and developed crude oil and natural gas properties throughout the world. The geographical distribution of the company’s acreage is shown in the following table.
Acreage at December 31,
2013
(Thousands of Acres)
(Thousands of Acres)
|
Developed and
|
|||||||||||||||||||
|
Undeveloped*
|
Developed
|
Undeveloped
|
|||||||||||||||||
|
Gross
|
Net
|
Gross
|
Net
|
Gross
|
Net
|
||||||||||||||
|
United States
|
6,237
|
|
5,125
|
|
7,381
|
|
4,714
|
|
13,618
|
|
9,839
|
|
|||||||
|
Other Americas
|
26,898
|
|
15,397
|
|
1,389
|
|
384
|
|
28,287
|
|
15,781
|
|
|||||||
|
Africa
|
15,490
|
|
8,995
|
|
3,286
|
|
1,362
|
|
18,776
|
|
10,357
|
|
|||||||
|
Asia
|
31,897
|
|
15,485
|
|
1,498
|
|
871
|
|
33,395
|
|
16,356
|
|
|||||||
|
Australia
|
19,418
|
|
13,655
|
|
912
|
|
236
|
|
20,330
|
|
13,891
|
|
|||||||
|
Europe
|
5,205
|
|
4,045
|
|
489
|
|
73
|
|
5,694
|
|
4,118
|
|
|||||||
|
Total Consolidated Companies
|
105,145
|
|
62,702
|
|
14,955
|
|
7,640
|
|
120,100
|
|
70,342
|
|
|||||||
|
Affiliates
|
935
|
|
429
|
|
262
|
|
103
|
|
1,197
|
|
532
|
|
|||||||
|
Total Including Affiliates
|
106,080
|
|
63,131
|
|
15,217
|
|
7,743
|
|
121,297
|
|
70,874
|
|
|||||||
|
*
|
The gross undeveloped acres that will expire in
2014
,
2015
and
2016
if production is not established by certain required dates are 2,627, 2,430 and 701, respectively.
|
Delivery Commitments
The company sells crude oil and natural gas from its producing operations under a variety of contractual obligations. Most contracts generally commit the company to sell quantities based on production from specified properties, but some natural gas sales contracts specify delivery of fixed and determinable quantities, as discussed below.
In the United States, the company is contractually committed to deliver to third parties 285 billion cubic feet of natural gas through
2016
. The company believes it can satisfy these contracts through a combination of equity production from the company’s proved developed U.S. reserves and third-party purchases. These commitments include a variety of pricing terms, including both indexed and fixed-price contracts.
Outside the United States, the company is contractually committed to deliver a total of 871 billion cubic feet of natural gas to third parties from
2014
through
2016
from operations in Australia, Colombia, Denmark, the Netherlands and the Philippines. These sales contracts contain variable pricing formulas that are generally referenced to the prevailing market price for crude oil, natural gas or other petroleum products at the time of delivery. The company believes it can satisfy these contracts from quantities available from production of the company’s proved developed reserves in these countries.
7
Development Activities
Refer to Table I on page FS-59 for details associated with the company’s development expenditures and costs of proved property acquisitions for
2013
,
2012
and
2011
.
The following table summarizes the company’s net interest in productive and dry development wells completed in each of the past three years, and the status of the company’s development wells drilling at December 31,
2013
. A “development well” is a well drilled within the proved area of a crude oil or natural gas reservoir to the depth of a stratigraphic horizon known to be productive.
Development Well Activity
|
Wells Drilling
|
Net Wells Completed
|
||||||||||||||||||||||||
|
at 12/31/13
|
2013
|
2012
|
2011
|
||||||||||||||||||||||
|
Gross
|
Net
|
Prod.
|
Dry
|
Prod.
|
Dry
|
Prod.
|
Dry
|
||||||||||||||||||
|
United States
|
134
|
|
75
|
|
1,101
|
|
4
|
|
941
|
|
6
|
|
909
|
|
9
|
|
|||||||||
|
Other Americas
|
60
|
|
39
|
|
127
|
|
—
|
|
50
|
|
—
|
|
37
|
|
—
|
|
|||||||||
|
Africa
|
9
|
|
3
|
|
20
|
|
1
|
|
23
|
|
—
|
|
29
|
|
—
|
|
|||||||||
|
Asia
|
77
|
|
42
|
|
535
|
|
5
|
|
566
|
|
6
|
|
549
|
|
6
|
|
|||||||||
|
Australia
|
4
|
|
2
|
|
—
|
|
—
|
|
—
|
|
—
|
|
—
|
|
—
|
|
|||||||||
|
Europe
|
3
|
|
—
|
|
3
|
|
—
|
|
9
|
|
—
|
|
6
|
|
—
|
|
|||||||||
|
Total Consolidated Companies
|
287
|
|
161
|
|
1,786
|
|
10
|
|
1,589
|
|
12
|
|
1,530
|
|
15
|
|
|||||||||
|
Affiliates
|
30
|
|
13
|
|
25
|
|
—
|
|
26
|
|
—
|
|
25
|
|
—
|
|
|||||||||
|
Total Including Affiliates
|
317
|
|
174
|
|
1,811
|
|
10
|
|
1,615
|
|
12
|
|
1,555
|
|
15
|
|
|||||||||
|
|
|
||||||||||||||||||||||||
Exploration Activities
Refer to Table I on page FS-59 for detail on the company’s exploration expenditures and costs of unproved property acquisitions for
2013
,
2012
and
2011
.
The following table summarizes the company’s net interests in productive and dry exploratory wells completed in each of the last three years, and the number of exploratory wells drilling at December 31,
2013
. “Exploratory wells” are wells drilled to find and produce crude oil or natural gas in unproved areas and include delineation and appraisal wells, which are wells drilled to find a new reservoir in a field previously found to be productive of crude oil or natural gas in another reservoir or to extend a known reservoir beyond the proved area.
Exploratory Well Activity
|
Wells Drilling
|
Net Wells Completed
|
||||||||||||||||||||||||
|
at 12/31/13
|
2013
|
2012
|
2011
|
||||||||||||||||||||||
|
Gross
|
Net
|
Prod.
|
Dry
|
Prod.
|
Dry
|
Prod.
|
Dry
|
||||||||||||||||||
|
United States
|
10
|
|
|
7
|
|
|
17
|
|
|
2
|
|
|
4
|
|
|
—
|
|
|
5
|
|
|
1
|
|
||
|
Other Americas
|
3
|
|
|
1
|
|
|
12
|
|
|
2
|
|
|
8
|
|
|
—
|
|
|
1
|
|
|
—
|
|
||
|
Africa
|
2
|
|
|
1
|
|
|
—
|
|
|
—
|
|
|
1
|
|
|
2
|
|
|
1
|
|
|
—
|
|
||
|
Asia
|
4
|
|
|
3
|
|
|
13
|
|
|
4
|
|
|
12
|
|
|
3
|
|
|
10
|
|
|
1
|
|
||
|
Australia
|
2
|
|
|
1
|
|
|
3
|
|
|
—
|
|
|
3
|
|
|
—
|
|
|
4
|
|
|
1
|
|
||
|
Europe
|
2
|
|
|
—
|
|
|
2
|
|
|
2
|
|
|
1
|
|
|
2
|
|
|
—
|
|
|
1
|
|
||
|
Total Consolidated Companies
|
23
|
|
|
13
|
|
|
47
|
|
|
10
|
|
|
29
|
|
|
7
|
|
|
21
|
|
|
4
|
|
||
|
Affiliates
|
—
|
|
|
—
|
|
|
—
|
|
|
—
|
|
|
—
|
|
|
—
|
|
|
1
|
|
|
—
|
|
||
|
Total Including Affiliates
|
23
|
|
|
13
|
|
|
47
|
|
|
10
|
|
|
29
|
|
|
7
|
|
|
22
|
|
|
4
|
|
||
8
Review of Ongoing Exploration and Production Activities in Key Areas
Chevron’s
2013
key upstream activities, some of which are also discussed in Management’s Discussion and Analysis of Financial Condition and Results of Operations, beginning on page FS-6, are presented below. The comments include references to “total production” and “net production,” which are defined under “Production” in Exhibit 99.1 on page E-10.
The discussion that follows references the status of proved reserves recognition for significant long-lead-time projects not on production and for projects recently placed on production. Reserves are not discussed for exploration activities or recent discoveries that have not advanced to a project stage, or for mature areas of production that do not have individual projects requiring significant levels of capital or exploratory investment. Amounts indicated for project costs represent total project costs, not the company’s share of costs for projects that are less than wholly owned.

|
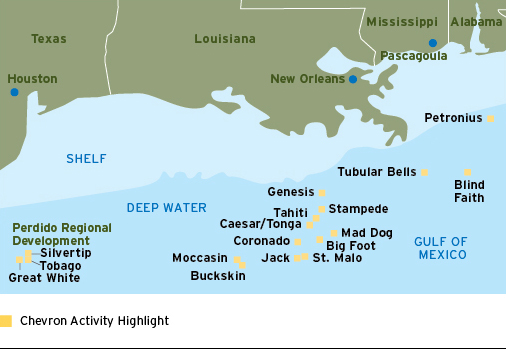
Chevron has exploration and production activities in most of the world’s major hydrocarbon basins. The map above indicates Chevron’s primary areas for exploration and production.
United States
Upstream activities in the United States are concentrated in California, the Gulf of Mexico, Colorado, Louisiana, Michigan, New Mexico, Ohio, Oklahoma, Pennsylvania, Texas, West Virginia and Wyoming. Average net oil-equivalent production in the United States during 2013 was 657,000 barrels per day.
In California, the company has significant production in the San Joaquin Valley. In 2013, net daily production averaged 162,000 barrels of crude oil, 69 million cubic feet of natural gas and 4,000 barrels of natural gas liquids (NGLs). Approximately 86 percent of the crude oil production is considered heavy oil (typically with API gravity lower than 22 degrees).
|
During 2013, net daily production for the company’s combined interests in the Gulf of Mexico averaged 143,000 barrels of crude oil, 347 million cubic feet of natural gas and 15,000 barrels of NGLs.
Chevron was engaged in various exploration and development activities in the deepwater Gulf of Mexico during 2013. The Jack and St. Malo fields are being jointly developed with a host floating production unit (FPU) located between the two fields. Chevron has a 50 percent interest in the Jack Field and a 51 percent interest in the St. Malo Field. Both fields are company-operated. Chevron's interest in the production host facility was reduced to 40.6 percent in 2013, after the owners of a third-party oil field acquired an interest in the host. The facility has a design capacity of 170,000 barrels of crude oil and 42 million cubic feet of natural gas per day to accommodate production from the Jack/St. Malo development and third-party tiebacks. Development drilling activities continued during the year, and the FPU was moored at the offshore location in fourth quarter 2013. At the end of 2013, project activities were 74 percent complete and first oil is expected in late 2014. Total project costs for the initial phase of development are estimated at $7.5 billion. Proved reserves have been recognized for this project.
In 2013, work continued on the evaluation of additional development opportunities for the Jack and St. Malo fields. Stage 2, the first phase of future development work, is expected to include four additional development wells, two each at the Jack and the St. Malo fields. Front-end engineering and design (FEED) activities began in mid-2013, and a final investment decision is expected in 2015. At the end of 2013, proved reserves had not been recognized for the Jack/St. Malo Stage 2 Project.
Production from the Jack/St. Malo development is expected to ramp up to a total daily rate of 94,000 barrels of crude oil and 21 million cubic feet of natural gas. The Jack and St. Malo fields have an estimated production life of 30 years.
9
Fabrication continued in 2013 for the 60 percent-owned and operated Big Foot Project. The development plan includes a 15-slot drilling and production platform with water injection facilities and a design capacity of 75,000 barrels of crude oil and 25 million cubic feet of natural gas per day. At the end of 2013, project activities were 84 percent complete, and the platform is expected to be towed to the location in third quarter 2014. Total project costs are estimated at $5.1 billion, and first production is anticipated in 2015. The field has an estimated production life of 20 years. Proved reserves have been recognized for this project.
Tahiti 2 is the second development phase for the 58 percent-owned and operated Tahiti Field, and is designed to increase recovery from the main producing interval by adding
two production wells, three water injection wells and water injection facilities. Start-up of the first production well occurred in fourth quarter 2013. Additional infill drilling is scheduled for the Tahiti Field from 2014 through 2016. The next development phase, the Tahiti Vertical Expansion Project, is being planned, with FEED expected in 2015. At the end of 2013, proved reserves had not been recognized for the infill drilling or the Tahiti Vertical Expansion Project. The Tahiti Field has an estimated production life of 30 years.
The company has a 42.9 percent nonoperated working interest in the Tubular Bells Field. Development drilling continued during 2013, and plans include three producing and two injection wells, with a subsea tieback to a third-party production facility. First oil is planned for third quarter 2014, with total production expected to reach 44,000 barrels of oil-equivalent per day. The field has an estimated production life of 25 years. Proved reserves have been recognized for this project.
The company has a 15.6 percent nonoperated working interest in the Mad Dog Field. The next development phase, the Mad Dog II Project, is planned to develop the southern portion of the Mad Dog Field. The project was recycled in 2013 and is expected to reenter FEED in late 2014. At the end of 2013, proved reserves had not been recognized for this project.
Chevron holds a 20 percent nonoperated working interest in the Stampede Project, which includes the joint development of the Knotty Head and Pony fields. The development plans include a tension leg platform with a planned design capacity of 80,000 barrels of crude oil and 40 million cubic feet of natural gas per day. The project entered FEED in second quarter 2013, and a final investment decision is expected in fourth quarter 2014. At the end of 2013, proved reserves had not been recognized for this project.
Pre-FEED activities continue at the 55 percent-owned and operated Buckskin Project. The project is expected to enter FEED in 2015. The Moccasin discovery, located 12 miles from Buckskin, is a potential tieback opportunity into Buckskin.
Deepwater exploration activities in 2013 included participation in six exploratory wells — three appraisal and three wildcat. Drilling of the first appraisal well at the 43.8 percent-owned and operated Moccasin discovery was
completed in third quarter 2013. Drilling of an appraisal well at the Buckskin discovery is expected to be completed in second quarter 2014. Drilling at the 40 percent-owned and operated Coronado prospect resulted in a crude oil discovery in the Lower Tertiary Wilcox formation in first quarter 2013. Drilling commenced on the first Coronado appraisal well in December 2013. The company also completed drilling a wildcat well at the 30 percent-owned and operated Rio Grande prospect in December 2013 and at the 67.5 percent-owned and operated Oceanographer prospect in January 2014.
Chevron added eight leases to its deepwater portfolio as a result of awards from the central Gulf of Mexico lease sale held in first quarter 2013. In addition, Chevron acquired three deepwater leases from the western Gulf of Mexico lease sale held in third quarter 2013.

|
Company activities in the midcontinental United States include operated and nonoperated interests in properties primarily in Colorado, New Mexico, Oklahoma, Texas and Wyoming. During 2013, the company’s net daily production in these areas averaged 96,000 barrels of crude oil, 610 million cubic feet of natural gas and 28,000 barrels of NGLs.
In West Texas, the company continues to pursue development of shale and tight resources in the Midland Basin’s Wolfcamp play and several plays in the Delaware Basin through use of advanced drilling and completion technologies. Additional production growth is expected from interests in these formations in future years. In June 2013, the company reached a joint development agreement covering 104,000 total acres in the Delaware Basin. In East Texas, the company continued development, at a managed pace, of multiple stacked reservoirs, including the Travis Peak, Cotton Valley, Bossier and Haynesville zones, during 2013.
10

|
The company holds leases in the Marcellus Shale and the Utica Shale, primarily located in southwestern Pennsylvania, eastern Ohio, and the West Virginia panhandle, and in the Antrim Shale and Collingwood/Utica Shale in Michigan. During 2013, the company's net daily production in these areas averaged 220 million cubic feet of natural gas. In 2013, development of the Marcellus Shale continued at a measured pace, focused on improving execution capability and reservoir understanding. Activities in the Utica Shale during 2013 included drilling seven exploratory wells. This initial activity was focused on acquiring data necessary for potential future development.
Other Americas
“Other Americas” is composed of Argentina, Brazil, Canada, Colombia, Greenland, Suriname, Trinidad and Tobago, and Venezuela. Net oil-equivalent production from these countries averaged 226,000 barrels per day during 2013.
Canada:
Chevron has interests in oil sands projects and shale acreage in Alberta; shale acreage and a liquefied natural gas (LNG) project in British Columbia; exploration, development and production projects offshore in the Atlantic region; and exploration and discovered resource interests in the Beaufort Sea region of the Northwest Territories. Average net oil-equivalent production during 2013 was 71,000 barrels per day, composed of 27,000 barrels of crude oil, 9 million cubic feet of natural gas and 43,000 barrels of synthetic oil from oil sands.
The company holds a 20 percent nonoperated working interest in the Athabasca Oil Sands Project (AOSP). Oil sands are mined from both the Muskeg River and the Jackpine mines, and bitumen is extracted from the oil sands and upgraded into

|
synthetic oil. Construction work progressed during 2013 on the Quest Project, a carbon capture and sequestration project that is designed to capture and store more than one million tons of carbon dioxide produced annually by bitumen processing at the AOSP by 2015.
In February 2013, Chevron acquired a 50 percent-owned and operated interest in the Kitimat LNG and Pacific Trail Pipeline projects, and a 50 percent nonoperated working interest in 644,000 total acres in the Horn River and Liard shale gas basins in British Colombia. The Kitimat LNG Project is planned to include a two-train, 10.0 million-metric-ton-per-year LNG facility. The total production capacity for the project is expected to be 1.6 billion cubic feet of natural gas per day. Activities during 2013 included FEED, early site preparation and LNG marketing activities.
Chevron holds a 26.9 percent nonoperated working interest in the Hibernia Field and a 23.6 nonoperated working interest in the unitized Hibernia Southern Extension (HSE) areas offshore Atlantic Canada. The HSE development is expected to increase the economic life of the Hibernia Field. During 2013, two subsea water injection wells began drilling, and installation of subsea equipment was initiated. Full production start-up is expected in 2015. Proved reserves have been recognized for this project.
The company holds a 26.6 percent nonoperated working interest in the heavy oil Hebron Field, also offshore Atlantic Canada. The development plan includes a concrete, gravity-based platform with a design capacity of 150,000 barrels of crude oil per day. Procurement and construction activities progressed in 2013. Project costs are estimated at $14 billion. The project has an expected economic life of 30 years, and first oil is expected in 2017. Proved reserves have been recognized for this project.
In 2013, the company acquired 86,000 total additional acres in the Duvernay shale formation in Alberta.
Drilling for these tight resources continued in 2013, with completion of a
11
multiwell program. Nine wells were completed and tied into production facilities by early 2014.
The company also holds a 40 percent nonoperated working interest in exploration rights for two blocks in the Flemish Pass Basin offshore Newfoundland. During 2013, the company relinquished its license in the Orphan Basin located offshore Newfoundland and Exploration License 1109 located offshore Labrador. The company also holds two exploration licenses in the Beaufort Sea region of the Northwest Territories and a 40 percent nonoperated working interest in the Amauligak discovery.
In addition, Chevron holds interests in the Aitken Creek and Alberta Hub natural gas storage facilities, which have aggregate total capacity of approximately 100 billion cubic feet. These facilities are located in western Canada near the Duvernay, Horn River, Liard and Montney shale gas plays.
Greenland:
In December 2013, Chevron acquired a 29.2 percent interest in and operatorship of two blocks located in the Kanumas Area, offshore the northeast cost of Greenland. Blocks 9 and 14 cover 1.2 million acres. The acquisition of seismic data is planned for 2014.
Argentina:
Chevron holds operated interests in four concessions in the Neuquen Basin, with working interests ranging from 18.8 percent to 100 percent, and a 50 percent nonoperated working interest in one concession. Net oil-equivalent production in 2013 averaged 19,000 barrels per day, composed of 18,000 barrels of crude oil and 6 million cubic feet of natural gas. During 2013, the company completed four exploratory wells in El Trapial concession, targeting oil and gas in the Vaca Muerta Shale. Chevron plans to continue production testing the wells during 2014. El Trapial concession expires in 2032.
In addition, Chevron signed agreements during 2013 to advance the Loma Campana Project to develop the Vaca Muerta Shale
.
In 2013, 109 wells were drilled, and the drilling plan includes more than 140 wells in 2014.
Brazil:
Chevron holds working interests in three deepwater fields in the Campos Basin: Frade (51.7 percent-owned and operated), Papa-Terra and Maromba (37.5 percent and 30 percent nonoperated working interests, respectively). Net oil-equivalent production in 2013 averaged 6,000 barrels per day, composed of 5,000 barrels of crude oil and 2 million cubic feet of natural gas.
In second quarter 2013, the company received regulatory approval to partially resume production at the Frade Field. A plan to resume production from additional existing wells has been submitted for regulatory approval. The concession that includes the Frade Field expires in 2025.

|
First production from the initial well occurred in fourth quarter 2013 for the Papa-Terra Project. The project includes a floating production, storage and offloading vessel (FPSO) and a tension leg wellhead platform, with a design capacity of 140,000 barrels of crude oil and 35 million cubic feet of natural gas per day. The concession that contains the Papa-Terra Field expires in 2032. Additional development drilling is planned for 2014.
Evaluation of the field development concept for Maromba continues. At the end of 2013, proved reserves had not been recognized for this project
.
The concession containing the Maromba Field expires in 2032.
In May 2013, Chevron was awarded a 50 percent interest in and operatorship of Block CE-M715. The deepwater block covers 81,000 total acres and is located in the Ceará Basin offshore equatorial Brazil. Acquisition of seismic data is planned for 2014.
12
Colombia:
The company operates the offshore Chuchupa and the onshore Ballena and Riohacha natural gas fields and receives 43 percent of the production for the remaining life of each field and a variable production volume based on prior Chuchupa capital contributions. Daily net production averaged 216 million cubic feet of natural gas in 2013.
Suriname:
Chevron holds a 50 percent nonoperated working interest in Blocks 42 and 45 offshore Suriname. In 2013, seismic data was acquired for Block 45. The data is being processed in 2014 to plan for the drilling of an exploration well in 2015.

|
Trinidad and Tobago:
The company has a 50 percent nonoperated working interest in three blocks in the East Coast Marine Area offshore Trinidad, which includes the Dolphin and Dolphin Deep producing natural gas fields and the Starfish development. Net production in 2013 averaged 173 million cubic feet of natural gas per day. Development of the Starfish Field continued during 2013, and first gas is expected in 2015. Natural gas from the project is planned to supply existing contractual commitments. Proved reserves have been recognized for this project. Chevron also holds a 50 percent-owned and operated interest in the Manatee Area of Block 6(d), where the Manatee discovery comprises a single cross-border field with Venezuela's Loran Field in Block 2. In 2013, cross-border agreements were signed between the governments of Trinidad and Tobago and Venezuela, and work continued on maturing commercial development concepts.
Venezuela:
Chevron's production activities are performed by two affiliates in western Venezuela and one affiliate in the Orinoco Belt. Chevron has a 30 percent interest in the Petropiar affiliate that operates the Hamaca heavy oil production and upgrading project located in Venezuela’s Orinoco Belt, a 39.2 percent interest in the Petroboscan affiliate that operates the Boscan Field in western Venezuela, and a 25.2 percent interest in the Petroindependiente affiliate that operates the LL-652 Field in Lake Maracaibo. The company’s share of net oil-equivalent production during 2013 from these operations averaged 65,000 barrels per day, composed of 61,000 barrels of liquids and 26 million cubic feet of natural gas.
Chevron holds a 34 percent interest in the Petroindependencia affiliate that is working toward commercialization of Carabobo 3, a heavy oil project located within the Carabobo Area of the Orinoco Belt. Project activities in 2013 focused on assessing development alternatives.
The company operates and holds a 60 percent interest in Block 2 and a 100 percent interest in Block 3 in the Plataforma Deltana area offshore eastern Venezuela. The Loran Field in Block 2 and the Manatee Field in Trinidad and Tobago form a single, cross-border field that lies along the maritime border of Venezuela and Trinidad and Tobago. During 2013, cross-border agreements were signed between the governments of Venezuela and Trinidad and Tobago, and work continued on maturing commercial development concepts.
Africa
In Africa, the company is engaged in upstream activities in Angola, Chad, Democratic Republic of the Congo, Liberia, Morocco, Nigeria, the Republic of the Congo, Sierra Leone and South Africa. Net oil-equivalent production in Africa averaged 437
,
000 barrels per day during 2013.

|
Angola:
Chevron holds company-operated working interests in offshore Blocks 0 and 14 and nonoperated working interests in offshore Block 2 and the onshore Fina Sonangol Texaco (FST) concession area. In addition, Chevron has a 36.4 percent interest in Angola LNG Limited. Net production from these operations in 2013 averaged 133,000 barrels of oil-equivalent per day.
13
The company operates the 39.2 percent-owned Block 0, which averaged 90,000 barrels per day of net liquids production in 2013. The Block 0 concession extends through 2030.
Construction activities on Mafumeira Sul, the second development stage for the Mafumeira Field in Block 0, progressed in 2013. Development plans include a central processing facility, two wellhead platforms, subsea pipelines, and 34 producing and 16 water injection wells. The facility has a design capacity of 150,000 barrels of liquids and 350 million cubic feet of natural gas per day. First production is planned for 2015, and ramp-up to full production is expected to continue until 2017. The project is estimated to cost $5.6 billion. Proved reserves have been recognized for this project.
A project to develop the Greater Longui Area of Block 0 is expected to enter FEED in first-half 2014. FEED activities progressed during 2013 on the south extension of the N’Dola Field development and work continues toward a final investment decision. The facility is planned to have a design capacity of 28,000 barrels of crude oil and 50 million cubic feet of natural gas per day. At the end of 2013, proved reserves had not been recognized for these projects.
Work continued in 2013 on the Nemba Enhanced Secondary Recovery Stage 1 & 2 Project in Block 0. Installation of the platform was completed in early 2014, and project start-up is expected in 2015. Total daily production is expected to be 12,000 barrels of crude oil
.
Proved reserves have been recognized for this project.
Also in Block 0, drilling of an exploration well in Area A was completed in early 2013 and resulted in a discovery in the post-salt Vermelha interval. Plans for future development are under evaluation. Drilling of an appraisal well in the Minzu Pinda reservoir commenced in late 2013 and is planned to be completed in second quarter 2014
.
A pre-salt exploration well in Area A is planned for first-half 2014.
The company operates and holds a 31 percent interest in a production-sharing contract (PSC) for deepwater Block 14. Net production in 2013 averaged 27,000 barrels of liquids per day. Development and production rights for the various producing fields in Block 14 expire between 2023 and 2028.
Planning continues on the multireservoir, deepwater Lucapa Field in Block 14, located on the north rim of the Congo River Canyon. The project was recycled in 2013 to conduct additional subsurface studies over a 12-month period. During the year, development alternatives were evaluated for the Malange Field, and the project is expected to enter FEED in early 2014. At the end of 2013, proved reserves had not been recognized for these projects.
In addition to the exploration and production activities in Angola, Chevron has a 36.4 percent interest in Angola LNG Limited, which operates an onshore natural gas liquefaction plant in Soyo, Angola. The plant has a capacity to process 1.1 billion cubic feet of natural gas per day, with expected average total daily sales of 670 million cubic feet of natural gas and up to 63,000 barrels of NGLs. This is the world's first LNG
plant supplied with associated gas, where the natural gas is a by-product of crude oil production. Feedstock for the plant originates from multiple fields and operators. The first LNG shipment from the plant occurred in second quarter 2013. Commissioning and testing of the plant continued through the end of 2013. Due to the variability in the associated gas that supplies Angola LNG, the plant is expected to operate at approximately 50 percent of capacity until permanent plant modifications are completed in 2015, allowing Angola LNG to consistently produce at full capacity. Total daily production in 2013 averaged 83 million cubic feet of natural gas (30 million net) and 2,000 barrels of NGLs (1,000 net). The anticipated economic life of the project is in excess of 20 years.
The company also holds a 38.1 percent interest in the Congo River Canyon Crossing Pipeline project that is designed to transport up to 250 million cubic feet of natural gas per day from Block 0 and Block 14 to the Angola LNG plant. Construction on the project continued in 2013, with project completion targeted for 2015.
Angola-Republic of the Congo Joint Development Area:
Chevron operates and holds a 31.3 percent interest in the Lianzi Unitization Zone, located in an area shared equally by Angola and the Republic of the Congo. The project scope includes four producing wells and three water injection wells with a subsea tieback to an existing platform in Block 14. The project has a design capacity of 46,000 barrels of crude oil per day. First production is planned for 2015. Proved reserves have been recognized for this project.
Democratic Republic of the Congo:
Chevron has a 17.7 percent nonoperated working interest in an offshore concession. Daily net production in 2013 averaged 2,000 barrels of crude oil.
Republic of the Congo:
Chevron has a 31.5 percent nonoperated working interest in the offshore Haute Mer permit areas (Nkossa, Nsoko and Moho-Bilondo). The licenses for Nsoko, Nkossa and Moho-Bilondo expire in 2018, 2027 and 2030, respectively. In September 2013, the company sold its nonoperated interest in the Kitina permit area. Net production averaged 13,000 barrels of liquids per day in 2013.
A final investment decision was reached in first quarter 2013 for the Moho Nord Project, located in the Moho-Bilondo development area. The $10 billion project includes a new facilities hub and a subsea tieback to the existing Moho-Bilondo FPU. First production is expected in 2015, and total daily production of 140,000 barrels of crude oil is expected in 2017. The initial recognition of proved reserves occurred in 2013
.
14
Chad/Cameroon:
Chevron has a 25 percent nonoperated working interest in crude oil producing operations in southern Chad and an approximate 21 percent interest in two affiliates that own an export pipeline that transports crude oil to the coast of Cameroon. Average daily net crude oil production from the Chad fields in 2013 was 18,000 barrels. The Chad producing operations are conducted under a concession that expires in 2030.
|
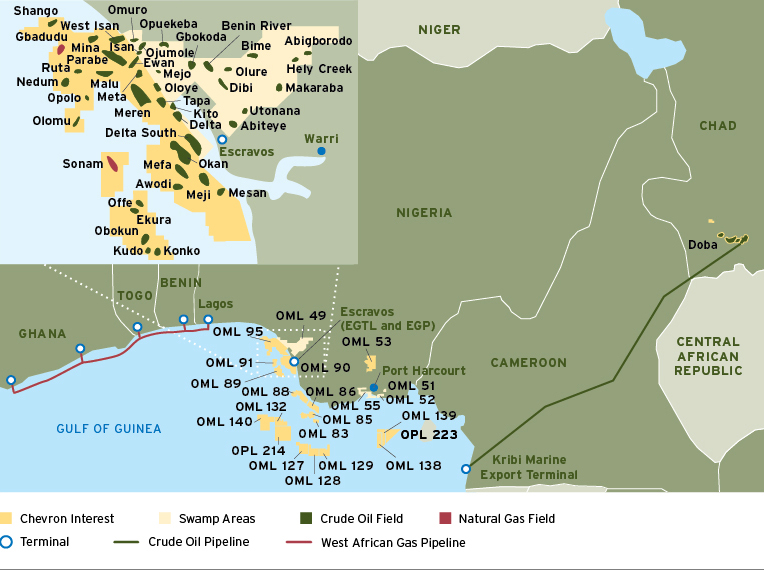
Nigeria:
Chevron holds a 40 percent interest in 13 operated concessions, predominantly in the onshore and near-offshore regions of the Niger Delta. The company also owns varying interests in three operated and six nonoperated deepwater blocks. In 2013, the company’s net oil-equivalent production in Nigeria averaged 268,000 barrels per day, composed of 233,000 barrels of crude oil, 182 million cubic feet of natural gas and 5,000 barrels of liquefied petroleum gas (LPG).
Chevron operates and holds a 67.3 percent interest in the Agbami Field, located in deepwater Oil Mining Lease (OML) 127 and OML 128. During 2013, drilling continued on a 10-well, Phase 2 development program, Agbami 2, that is expected to offset field decline and maintain plateau production. Drilling is expected to continue through 2015. The third development phase, Agbami 3, is a five-well drilling program expected to offset field decline. The project entered FEED in early 2014, and a final investment decision is expected in second-half 2014. Drilling is scheduled to continue through 2017. The leases that contain the Agbami Field expire in 2023 and 2024.
Chevron holds a 30 percent nonoperated interest in the deepwater Usan Field in OML 138. Ramp-up continued during 2013, and additional development drilling is planned for 2014 through 2017.
Also in the deepwater area, the Aparo Field in OML 132 and OML 140 and the third-party-owned Bonga SW Field in OML 118 share a common geologic structure and are planned to be jointly developed. The proposed development plan involves subsea wells tied back to an FPSO with a planned design
capacity of 225,000 barrels of crude oil per day. The project achieved FEED in second quarter 2013, and a final investment decision is expected in late 2014. At the end of 2013, no proved reserves were recognized for this project.
In the Niger Delta region, the company reached a final investment decision in 2013 on the Dibi Long-Term Project that is designed to rebuild the Dibi facilities and replace the Early Production System facility. The facilities have a design capacity of 70,000 barrels of crude oil per day, and start-up is expected in 2016.
Also in the Niger Delta region, ramp-up activity continued at the Escravos Gas Plant (EGP). During 2013, construction continued on Phase 3B of the EGP project, which is designed to gather 120 million cubic feet of natural gas per day from eight near-shore fields and to compress and transport the natural gas to onshore facilities. The Phase 3B project is expected to be completed in 2016. Proved reserves associated with this project have been recognized.
Construction activities progressed during 2013 on the 40 percent-owned and operated Sonam Field Development Project, which is designed to process natural gas through EGP, deliver 215 million cubic feet of natural gas per day to the domestic market and produce a total of 30,000 barrels of liquids per day. First production is expected in 2016. Proved reserves have been recognized for the project.
Chevron is the operator of and has a 75 percent interest in this 33,000-barrel-per-day gas-to-liquids facility at Escravos. The facility is designed to process 325 million cubic feet per day of natural gas. Production is scheduled to commence in first-half 2014, and the first product shipment is expected to occur in second-half 2014.
The estimated cost of the project is $10 billion.
In deepwater exploration, Chevron operates and holds a 100 percent interest in OML 132, where an exploration well at Aparo North is planned for 2014. In addition, Chevron operates and holds a 95 percent interest in the deepwater Nsiko discovery in OML 140, where additional exploration activities are planned for 2014.
Shallow-water exploration activities to identify and evaluate potential deep hydrocarbon targets are ongoing. Reprocessing of 3-D seismic data over OML 49 and regional mapping activities over OML 86 and OML 88 continued in 2013.
With a 36.7 percent interest, Chevron is the largest shareholder in the West African Gas Pipeline Company Limited affiliate, which owns and operates the 421-mile West African Gas Pipeline. The pipeline supplies Nigerian natural gas to customers in Benin, Ghana and Togo for industrial applications and power generation and has the capacity to transport 170 million cubic feet per day.
Liberia:
Chevron holds a 45 percent interest in and operates three deepwater blocks off the coast of Liberia. In 2014, the company plans additional drilling based on the evaluation of 3-D seismic data and 2012 drilling results.
15
Morocco:
In early 2013, the company acquired a 75 percent-owned and operated interest in three deepwater areas offshore Morocco. The areas, Cap Rhir Deep, Cap Cantin Deep and Cap Walidia Deep, encompass approximately 7.2 million acres. The acquisition of seismic data is planned for 2014.
Sierra Leone:
The company holds a 55 percent interest in and operates a concession off the coast of Sierra Leone. The concession contains two deepwater blocks, with a combined area of approximately 1.4 million acres. Interpretation of 2-D seismic data is planned for 2014.
South Africa:
In 2013, the company continued seeking shale gas exploration opportunities in the Karoo Basin in South Africa under an agreement that allows Chevron and its partner to work together to obtain exploration permits in the 151 million-acre basin.
Asia
In Asia, the company is engaged in upstream activities in Azerbaijan, Bangladesh, Cambodia, China, Indonesia, Kazakhstan, the Kurdistan Region of Iraq, Myanmar, the Partitioned Zone located between Saudi Arabia and Kuwait, the Philippines, Russia, Thailand, and Vietnam. During 2013, net oil-equivalent production averaged 1,087,000 barrels per day.
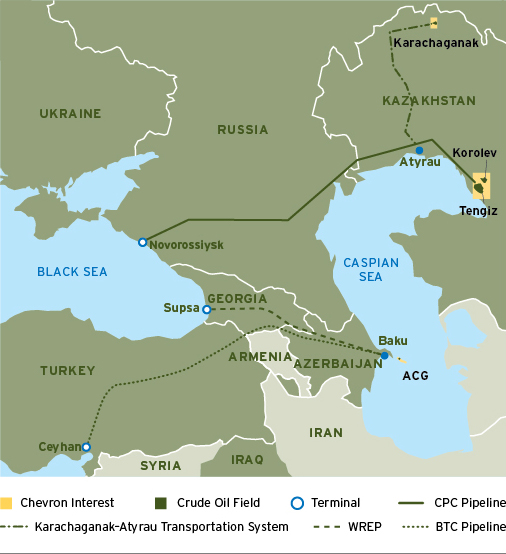
|
Azerbaijan:
Chevron holds an 11.3 percent nonoperated working interest in the Azerbaijan International Operating Company (AIOC), which produces crude oil from the Azeri-
Chirag-Gunashli (ACG) fields. The company’s daily net production averaged 28,000 barrels of oil-equivalent in 2013. AIOC operations are conducted under a PSC that expires in 2024.
In January 2014, production commenced on the next development phase of the ACG project, which further develops the Chirag and Deepwater Gunashli fields. The project has an incremental design capacity of 183,000 barrels of crude oil and 285 million cubic feet of natural gas per day.
Chevron also has an 8.9 percent interest in the Baku-Tbilisi-Ceyhan (BTC) affiliate, which owns and operates a crude oil export pipeline from Baku, Azerbaijan, through Georgia to Mediterranean deepwater port facilities at Ceyhan, Turkey. The BTC pipeline has a capacity of 1 million barrels per day and transports the majority of ACG production. Another production export route for crude oil is the Western Route Export Pipeline, which is operated by AIOC, with capacity to transport 100,000 barrels per day from Baku, Azerbaijan, to a marine terminal at Supsa, Georgia.
Kazakhstan:
Chevron participates in two major upstream developments in western Kazakhstan. The company holds a 50 percent interest in the Tengizchevroil (TCO) affiliate, which is operating and developing the Tengiz and Korolev crude oil fields under a concession that expires in 2033. Chevron’s net oil-equivalent production in 2013 from these fields averaged 321,000 barrels per day, composed of 243,000 barrels of crude oil, 347 million cubic feet of natural gas and 20,000 barrels of NGLs. During 2013, the majority of TCO’s crude oil production was exported through the Caspian Pipeline Consortium (CPC) pipeline that runs from Tengiz in Kazakhstan to tanker-loading facilities at Novorossiysk on the Russian coast of the Black Sea. The balance of production was exported by rail to Black Sea ports and via the BTC pipeline to the Mediterranean.
In 2013, FEED continued for three projects. The Wellhead Pressure Management Project (WPMP) is designed to maintain production capacity and extend the production plateau from existing assets. The Capacity and Reliability (CAR) Project is designed to reduce facility bottlenecks and increase plant efficiency and reliability. The Future Growth Project (FGP) is designed to increase total daily production by 250,000 to 300,000 barrels of oil-equivalent and to increase ultimate recovery from the reservoir. The project plans to expand the utilization of sour gas injection technology proven in existing operations. During 2013, the company and the government of Kazakhstan signed a memorandum of understanding that establishes the framework and mutual commitments to progress the FGP and the WPMP. The final investment decision on the CAR Project was made in February 2014.
The final investment decisions on the WPMP and the FGP are planned for second-half 2014. At the end of 2013, proved reserves have been recognized for the WPMP and the CAR Project
.
16
The company holds an 18 percent nonoperated working interest in the Karachaganak Field under a PSC that expires in 2038. During 2013, Karachaganak net oil-equivalent production averaged 57,000 barrels per day, composed of 34,000 barrels of liquids and 135 million cubic feet of natural gas. Access to the CPC and Atyrau-Samara (Russia) pipelines enabled 32,000 net barrels per day of Karachaganak liquids to be exported and sold at world-market prices during 2013. The remaining liquids were sold into local and Russian markets. In 2013, work continued on identifying the optimal scope for future expansion of the field. At the end of 2013, proved reserves had not been recognized for a future expansion.
Kazakhstan/Russia:
Chevron has a 15 percent interest in the CPC affiliate. During 2013, CPC transported an average of 706,000 barrels of crude oil per day, including 635,000 barrels per day from Kazakhstan and 71,000 barrels per day from Russia. In 2013, work continued on the 670,000-barrel-per-day expansion of the pipeline capacity with completion of the offshore loading system. The project is being implemented in phases, with capacity increasing progressively until reaching maximum capacity of 1.4 million barrels per day in 2016. The incremental capacity is expected to reach 400,000 barrels per day by year-end 2014, with the first increase expected to be realized by March 2014. The expansion is expected to provide additional transportation capacity that accommodates a portion of the future growth in TCO production.
Bangladesh:
Chevron holds a 99 percent interest in two operated PSCs covering Block 12 (Bibiyana Field) and Blocks 13 and 14 (Jalalabad and Moulavi Bazar fields). The rights to produce from Jalalabad expire in 2024, from Moulavi Bazar in 2028 and from Bibiyana in 2034. Net oil-equivalent production from these operations in 2013 averaged 113,000 barrels per day, composed of 663 million cubic feet of natural gas and 2,000 barrels of condensate.
The Bibiyana Expansion Project includes installation of two gas processing trains, additional development wells and an enhanced liquids recovery facility, and has an incremental design capacity of 300 million cubic feet of natural gas and 4,000 barrels of condensate per day. First production is expected in late 2014. Proved reserves have been recognized for this project.
Cambodia:
Chevron owns a 30 percent interest in and operates the 1.2 million-acre Block A, located in the Gulf of Thailand. In 2013, the company continued discussions on the production permit and commercial terms for development of Block A. The planned development consists of a wellhead platform and a floating storage and offloading vessel (FSO). A final investment decision is pending resolution of commercial terms. At the end of 2013, proved reserves had not been recognized for the project.
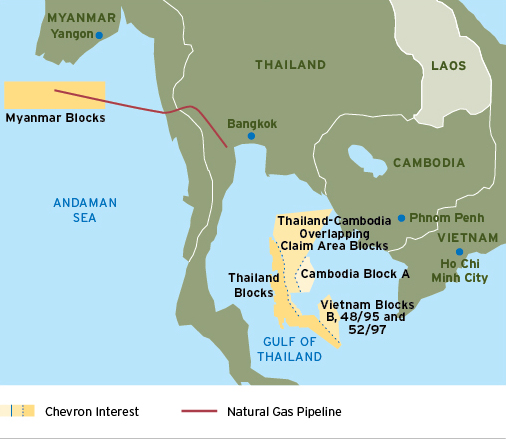
|
Myanmar:
Chevron has a 28.3 percent nonoperated working interest in a PSC for the production of natural gas from the Yadana and Sein fields, within Blocks M5 and M6, in the Andaman Sea. The PSC expires in 2028. The company also has a 28.3 percent nonoperated interest in a pipeline company that transports most of the natural gas to the Myanmar-Thailand border for delivery to power plants in Thailand. The company’s average net natural gas production in 2013 was 96 million cubic feet per day.
Thailand:
Chevron has operated and nonoperated working interests in multiple offshore blocks in the Gulf of Thailand. The company’s net oil-equivalent production in 2013 averaged 229,000 barrels per day, composed of 62,000 barrels of crude oil and condensate and 1 billion cubic feet of natural gas. The company’s natural gas production is sold to the domestic market under long-term sales agreements.
The company holds operated interests in the Pattani Basin with ownership interests ranging from 35 percent to 80 percent. Concessions for producing areas within this basin expire between 2020 and 2035. Chevron also has a 16 percent nonoperated working interest in the Arthit Field located in the Malay Basin. Concessions for the producing areas within this basin expire between 2036 and 2040.
In the Pattani Basin, the Ubon Project entered FEED in second quarter 2013, and a final investment decision is expected in 2015. The facilities have a planned design capacity of 35,000 barrels of liquids and 115 million cubic feet of natural gas per day. At the end of 2013, proved reserves had not been recognized for this project.
During 2013, the company drilled five exploration wells in the Pattani Basin, and three were successful.
The company also holds exploration interests in the Thailand-Cambodia overlapping claim area that are inactive, pending resolution of border issues between Thailand and Cambodia.
17
Vietnam:
Chevron is the operator of two PSCs in the Malay Basin off the southwest coast of Vietnam. The company has a 42.4 percent interest in a PSC that includes Blocks B and 48/95, and a 43.4 percent interest in a PSC for Block 52/97.
The Block B Gas Development Project includes installation of wellhead and hub platforms, an FSO, a central processing platform and a pipeline to shore. The facilities have a design capacity of 640 million cubic feet of natural gas and 21,000 barrels of liquids per day. A final investment decision for the development is pending resolution of commercial terms. Concurrent with the commercial negotiations, the company is also evaluating these assets for possible divestment. At the end of 2013, proved reserves had not been recognized for the development project.

|
China:
Chevron has operated and nonoperated working interests in several areas in China. The company’s net oil-equivalent production in 2013 averaged 20,000 barrels per day, composed of 19,000 barrels of crude oil and condensate and 6 million cubic feet of natural gas.
The company operates and holds a 49 percent interest in the Chuandongbei PSC, located onshore in the Sichuan Basin. The full development includes two sour gas processing plants connected by a natural gas gathering system to five fields.
During 2013, the company continued construction on both natural gas processing plants. The first plant's initial three trains have a design outlet capacity of 258 million cubic feet per day, with the first train targeted for mechanical completion in 2014. Start-up is scheduled for 2015. The total design outlet capacity for the project is 558 million cubic feet per day. The total project cost is estimated to be $6.4 billion. Proved reserves have been recognized for this project. The PSC for Chuandongbei expires in 2038.
The company holds a 59.2 percent-owned and operated interest in deepwater Block 42/05 in the South China Sea. In late 2013 and early 2014, an exploratory well was drilled in Block 42/05 and was unsuccessful. Chevron also has a 100 percent-owned and operated interest in shallow-water Blocks 15/10 and 15/28. In 2013, the company acquired two 3-D seismic surveys in these blocks. Processing of this seismic data is ongoing.
During 2013, the company drilled two exploratory wells for shale gas in the Qiannan Basin and both were unsuccessful.
The company also has nonoperated working interests of 24.5 percent in the QHD 32-6 Field and 16.2 percent in Block 11/19 in the Bohai Bay and 32.7 percent in Block16/19 in the Pearl River Mouth Basin.
Philippines:
The company holds a 45 percent nonoperated working interest in the Malampaya natural gas field. Net oil-equivalent production in 2013 averaged 23,000 barrels per day, composed of 119 million cubic feet of natural gas and 3,000 barrels of condensate. The Malampaya Phase 2 Project is designed to maintain capacity. During 2013, work progressed with two infill wells being completed. First production is expected to commence in first quarter 2014 with compression facilities to follow in 2015. Proved reserves have been recognized for this project.
18
Chevron holds a 40 percent interest in an affiliate that develops and produces geothermal resources in southern Luzon, which supplies steam to third-party power generation facilities with a combined operating capacity of 692 megawatts. During 2013, the affiliate secured a renewable energy service contract for an additional 25 years. Chevron also has a 90 percent-owned and operated interest in the Kalinga geothermal prospect area in northern Luzon. In 2013, Chevron held negotiations to sell down equity to comply with local law and to secure a 25-year term for a renewable energy service contract. Negotiations are planned to continue into 2014. The company continues to assess the prospect area.

|
Indonesia:
Chevron holds operated and nonoperated working interests in Indonesia. In Sumatra, the company holds a 100 percent-owned and operated interest in the Rokan PSC. The Siak PSC expired in November 2013.
C
hevron also operates four PSCs in the Kutei Basin, located offshore eastern Kalimantan. These interests range from 62 percent to 92.5 percent. Chevron also has a 25 percent nonoperated working interest in a joint venture in Block B in the South Natuna Sea and a 51 percent operated working interest in two exploration blocks in western Papua, West Papua I and West Papua III.
The company’s net oil-equivalent production in 2013 from its interests in Indonesia averaged 193,000 barrels per day, composed of 156,000 barrels of liquids and 225 million cubic feet of natural gas. The largest producing field is Duri, located in the Rokan PSC. Duri has been under steamflood since 1985 and is one of the world’s largest steamflood developments. The company continues to implement projects designed to sustain production from existing reservoirs. The company progressed construction on the Duri Area 13 expansion project during 2013. First production occurred in second-half 2013, and ramp-up of production is expected through 2016. The Rokan PSC expires in 2021.
During 2013, two deepwater natural gas development projects in the Kutei Basin progressed under a single plan of development. Collectively, these projects are referred to as the Indonesia Deepwater Development. One of these projects, Gendalo-Gehem, includes two separate hub developments, each with its own FPU, subsea drill centers, natural gas and condensate pipelines, and an onshore receiving facility. The
project has a planned design capacity of 1.1 billion cubic feet of natural gas and 47,000 barrels of condensate per day. During 2013, the company received bids for all major contracts. A final investment decision is planned for 2014, but is subject to the timing of government approvals. The company’s working interest is approximately 63 percent. At the end of 2013, proved reserves had not been recognized for this project.
The other project, Bangka, includes a subsea tieback to the West Seno FPU, with a planned design capacity of 115 million cubic feet of natural gas and 4,000 barrels of condensate per day. The company’s working interest is 62 percent. Bids were received on all major contracts during 2013. A final investment decision is planned for 2014, but is subject to the timing of government approvals. At year-end 2013, proved reserves had not been recognized for this project.
In Sumatra, three exploration wells were drilled with one discovery. Further exploration and appraisal drilling is planned for 2014. In the West Papua exploration blocks, which are in close proximity to a third-party LNG facility, 2-D seismic data acquisition and processing was completed for West Papua III in 2013.
In West Java, the company operates and holds a 95 percent interest in the Darajat geothermal field, which supplies steam to a power plant with a total operating capacity of 270 megawatts. Chevron also operates and holds a 100 percent interest in the Salak geothermal field in West Java, which supplies steam to a power plant with a total operating capacity of 377 megawatts. In the Suoh-Sekincau prospect area of South Sumatra, the company holds a 95 percent-owned and operated interest in a license to explore and develop a geothermal prospect.
19
Kurdistan Region of Iraq:
The company operates and holds an 80 percent interest in two PSCs covering the Rovi and Sarta blocks.In June 2013, the company acquired the operatorship and an 80 percent interest in the Qara Dagh Block. The blocks cover a combined area of 444,000 acres. In second-half 2013, Chevron commenced exploration drilling in the Rovi and Sarta blocks, and drilling on two wells is expected to be completed in first quarter 2014.
Acquisition of seismic data and further exploration drilling is planned during 2014.
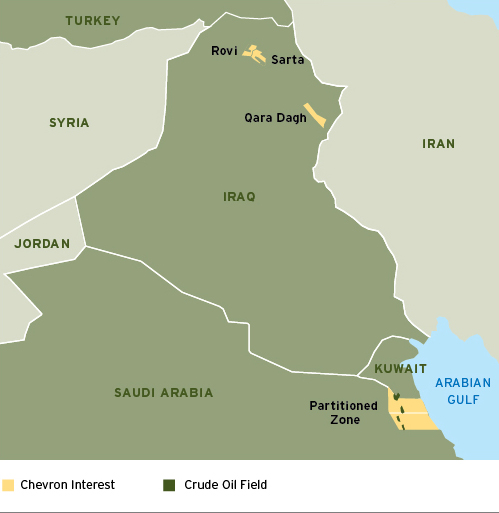
|
Partitioned Zone (PZ):
Chevron holds a concession to operate the Kingdom of Saudi Arabia's 50 percent interest in the hydrocarbon resources in the onshore area of the PZ between Saudi Arabia and Kuwait. The concession expires in 2039.
During 2013, the company's average net oil-equivalent production was 87,000 barrels per day, composed of 84,000 barrels of crude oil and 19 million cubic feet of natural gas. During 2013, the company continued a steam injection pilot project in the First Eocene carbonate reservoir and achieved thermal maturity. A project to expand the steam injection pilot to the Second Eocene reservoir entered FEED in September 2013. Development planning also continued on a full-field steamflood application in the Wafra Field. The Wafra Steamflood Stage 1 Project has a planned design capacity of 80,000 barrels of crude oil per day and is expected to enter FEED in late 2014. At the end of 2013, proved reserves had not been recognized for any of these steamflood developments.
Also in 2013, FEED activities continued on the Central Gas Utilization Project. The project is intended to increase natural gas utilization and eliminate routine flaring. A final investment decision is expected in late 2014. At year-end 2013, proved reserves had not been recognized for this project.
Australia
In Australia, the company’s upstream efforts are concentrated off the northwest coast. During 2013, the average net oil-equivalent production from Australia was 96,000 barrels per day.

|
Chevron holds a 47.3 percent ownership interest across most of the Greater Gorgon Area and is the operator of the Gorgon Project, which includes the development of the Gorgon and nearby Jansz-Io natural gas fields. The development includes a three-train, 15.6 million-metric-ton-per-year LNG facility, a carbon dioxide injection facility and a domestic natural gas plant. The total production capacity for the project is expected to be approximately 2.6 billion cubic feet of natural gas and 20,000 barrels of condensate per day. Gorgon plant start-up and first cargo is planned for mid-2015. Total estimated project costs for the first phase of development are $54 billion. Proved reserves have been recognized for this project. The project's estimated economic life exceeds 40 years from the time of start-up.
Work on the Gorgon project continued during 2013 with approximately 75 percent of the project activities complete at year-end. Through early 2014, 20 of 21 Train 1 LNG plant modules had been delivered and installed at Barrow Island, with the final module expected to arrive by mid-year. In addition, installation activities were completed for the domestic gas pipeline from Barrow Island to the mainland, enabling delivery of commissioning gas. Progress continued on the construction of the LNG tanks and jetty, with completion of LNG Tank 1 expected in second-half 2014. Start-up of the first gas turbine generator, allowing first natural gas into the LNG plant, is planned for late 2014.
20
Construction of the upstream facilities also advanced with 14 of the 18 subsea wells drilled and completed. The offshore pipelines from both fields to Barrow Island were completed in 2013. Infield flow lines and subsea structures continue to be installed in 2014. Perforation of all eight development wells in the Gorgon Field and completion of the Jansz-Io drilling program are expected in late 2014.
Chevron has signed binding, long-term LNG Sales and Purchase Agreements with six Asian customers for delivery of about 4.8 million metric tons of LNG per year, which brings delivery commitments to 65 percent of Chevron’s share of LNG from this project. Discussions continue with potential customers to increase long-term sales to around 80 percent of Chevron’s net LNG offtake. Chevron also has binding long-term agreements for delivery of about 65 million cubic feet per day of natural gas to Western Australian natural gas consumers starting in 2015, and the company continues to market additional natural gas quantities from the Gorgon Project.
The evaluation of expansion options to increase the production capacity of Gorgon is planned to continue in 2014.
Chevron is the operator of the Wheatstone Project, which includes a two-train, 8.9 million-metric-ton-per-year LNG facility and a domestic gas plant located at Ashburton North, on the coast of Western Australia. The company plans to supply natural gas to the facilities from three company-operated licenses containing the Wheatstone and Iago fields. Chevron holds a 64.1 percent interest in the LNG facilities and an 80.2 percent interest in the offshore licenses. Total production capacity for the Wheatstone and Iago fields and nearby third-party fields is expected to be approximately 1.6 billion cubic feet of natural gas and 30,000 barrels of condensate per day. Start-up of the first train is expected in 2016. Total estimated costs for the foundation phase are $29 billion. Proved reserves have been recognized for this project. The project's estimated economic life exceeds 30 years from the time of start-up.
In 2013, construction and fabrication activities progressed, with a focus on delivering site infrastructure to enable efficient plant construction. Offshore dredging, pipeline installation and drilling of development wells commenced during the year. Fabrication also progressed on key upstream components, including the offshore platform and subsea equipment. Delivery of the first Train 1 LNG plant modules is expected in second-half 2014, along with the installation of the offshore platform steel gravity-based structure, completion of the natural gas export trunkline and completion of the LNG Tank 1 foundation. The project was approximately 25 percent complete at year-end.
T
he company also executed binding long-term Sales and Purchase Agreements with two Asian customers for the delivery of additional LNG. As of year-end 2013, 85 percent of Chevron’s equity LNG offtake is committed under long-term agreements with customers in Asia. In addition, the company continues to market its equity share of natural gas to Western Australia consumers.
During 2013, the company announced two natural gas discoveries in the Carnarvon Basin. These include natural gas discoveries at the 50 percent-owned and operated Kentish Knock South prospect in Block WA-365-P and the 50 percent-owned and operated Elfin prospect in Block WA-268-P. These discoveries are expected to contribute to potential expansion opportunities at company-operated LNG projects.
Chevron has a 16.7 percent nonoperated working interest in the North West Shelf (NWS) Venture in Western Australia. Daily net production in 2013 averaged 19,000 barrels of crude oil and condensate, 419 million cubic feet of natural gas, and 3,000 barrels of LPG. Approximately 70 percent of the natural gas was sold in the form of LNG to major utilities in Asia, primarily under long-term contracts. The remaining natural gas was sold to the Western Australia domestic market. The concession for the NWS Venture expires in 2034.
Production commenced at the North Rankin 2 Project in fourth quarter 2013. The project is designed to recover remaining low-pressure natural gas from the North Rankin and Perseus fields to meet gas supply needs and maintain NWS daily production of about 2 billi
on cubic feet of natural gas and 39,000 barrels of condensate. The project's estimated economic life exceeds 20 years from the time of start-up.
T
he company holds nonoperated working interests ranging from 24.8 percent to 50 percent in three blocks in the Browse Basin.
In 2013, the company acquired nonoperated working interests in two onshore blocks covering 810,000 total acres in the Nappamerri Trough, located in the Cooper Basin region in central Australia. The acquisition includes a 30 percent interest in PEL 218 in South Australia and an 18 percent interest in ATP 855 in Queensland. Pending favorable results of an exploration drilling program, Chevron could earn nonoperated working interests of 60 percent in PEL 218 and 36 percent in ATP 855.
In October 2013, the company acquired exploration interests in offshore Blocks EPP44 and EPP45, which span more than 8 million acres in the Bight Basin off the South Australian coast. Chevron is the operator and holds a 100 percent interest.
21
Europe
In Europe, the company is engaged in upstream activities in Bulgaria, Denmark, Lithuania, the Netherlands, Norway, Poland, Romania, Ukraine and the United Kingdom. Net oil-equivalent production in Europe averaged 94,000 barrels per day during 2013.

|
Denmark:
Chevron holds a 12 percent nonoperated working interest in the Danish Underground Consortium (DUC), which produces crude oil and natural gas from 13 fields in the Danish North Sea. Net oil-equivalent production in 2013 from DUC averaged 28,000 barrels per day, composed of 19,000 barrels of crude oil and 55 million cubic feet of natural gas. The concession expires in 2042.
Netherlands:
Chevron operates and holds interests ranging from 23.5 percent to 80 percent in 11 blocks in the Dutch sector of the North Sea. In 2013, the company’s net oil-equivalent production was 9,000 barrels per day, composed of 2,000 barrels of crude oil and 41 million cubic feet of natural gas. The company is evaluating these assets for possible divestment.
Norway:
The company holds a 7.6 percent nonoperated working interest in the Draugen Field. The company’s net production averaged 2,000 barrels of oil-equivalent per day during 2013. The company is evaluating this asset for possible divestment. Chevron is the operator and has a 40 percent working interest in exploration licenses PL 527 and PL 598. Both licenses are in the deepwater portion of the Norwegian Sea.
United Kingdom:
The company’s average net oil-equivalent production in 2013 from nine offshore fields was 55,000 barrels per day, composed of 40,000 barrels of liquids and 94 million cubic feet of natural gas. Most of the production was from three fields: the 85 percent-owned and operated Captain Field, the 23.4 percent-owned and operated Alba Field, and the 32.4 percent-owned and jointly operated Britannia Field.
At the 73.7 percent-owned and operated Alder Project, FEED activities were completed and a final investment decision was made in late 2013. The project is proceeding as a single subsea well tied back to the existing Britannia platform and has a design capacity of 14,000 barrels of condensate and 110 million cubic feet of natural gas per day. First production is scheduled for 2016. The initial recognition of proved reserves occurred in 2013 for this project.
Procurement and fabrication activities continued during 2013 for the Clair Ridge Project, located west of the Shetland Islands, in which the company has a 19.4 percent nonoperated working interest. The project is the second development phase of the Clair Field. Total design capacity is 120,000 barrels of crude oil and 100 million cubic feet of natural gas per day. The total estimated cost of the project is $7 billion. Production is scheduled to begin in 2016, and the project's estimated economic life exceeds 40 years from the time of start-up. Proved reserves have been recognized for the Clair Ridge Project.
At the 40 percent-owned and operated Rosebank Project northwest of the Shetland Islands, the company continues to assess alternatives for the optimum development of the Rosebank Field. At the end of 2013, proved reserves had not been recognized for this project.
An exploration well was drilled in License P1189, and the results of this well are under evaluation. In License P1191, 3-D seismic data was acquired to map the area southwest of the Rosebank Field. In the North Sea, an exploration well to further delineate the southern extension of the Jade Field was drilled in second-half 2013, and the results are under evaluation.
22
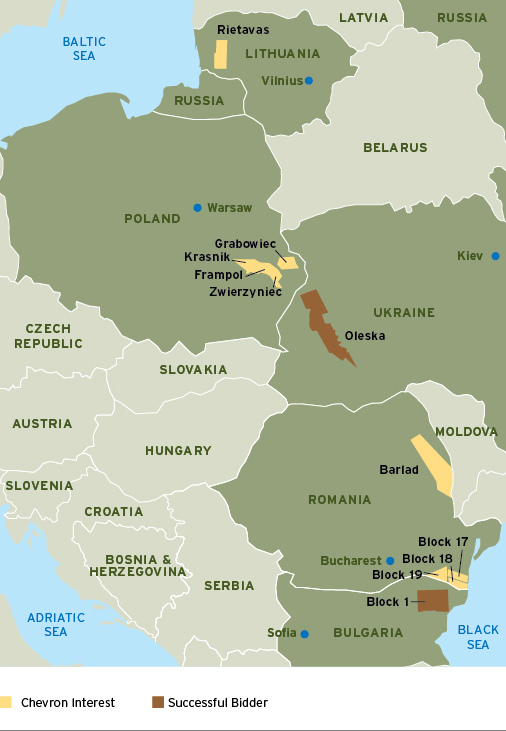
|
Bulgaria:
In 2011, the Bulgarian government advised that Chevron had submitted a winning tender for an exploration permit in northeast Bulgaria. However, prior to execution of the license agreement, the government announced the withdrawal of the decision as the Bulgarian parliament imposed a ban on hydraulic fracturing. Chevron continues to work with the government of Bulgaria to provide the necessary assurances that shale hydrocarbons can be developed safely and responsibly.
Lithuania:
Chevron holds a 50 percent interest in a Lithuanian exploration and production company. In 2013, two exploration wells were drilled in the 394,000-acre Rietavas Block, and the results of the wells are under evaluation. Drilling of a third exploration well commenced in January 2014 and is planned to be completed during second quarter 2014.
Poland:
Chevron holds four shale concessions in southeast Poland (Frampol, Grabowiec, Krasnik and Zwierzyniec). All four exploration licenses are 100 percent-owned and operated
and comprise a total of 1.1 million acres. In 2013, the first exploration wells were drilled in the Zwierzyniec and Krasnik concessions. A 3-D seismic survey is under way on the Grabowiec concession and is planned to be completed in second quarter 2014. Exploration activities are planned to continue during 2014.
Romania:
The company holds a 100 percent interest in and operates the 1.6 million-acre Barlad Shale concession in northeast Romania. Drilling of the first exploration well is planned to commence in second quarter 2014. In addition, Chevron holds a 100 percent interest in and operates three concessions covering 670,000 acres in southeast Romania. In October 2013, the company commenced acquisition of 2-D seismic data across two of the three concessions.
Ukraine:
In November 2013, Chevron signed a PSC with the government of Ukraine for a 50 percent interest in and operatorship of the 1.6 million acre Oleska Shale block in western Ukraine. As of early 2014, the Joint Operating Agreement terms were being negotiated.
Sales of Natural Gas and Natural Gas Liquids
The company sells natural gas and natural gas liquids from its producing operations under a variety of contractual arrangements. In addition, the company also makes third-party purchases and sales of natural gas and natural gas liquids in connection with its trading activities.
During
2013
, U.S. and international sales of natural gas were
5.5
billion and
4.3
billion cubic feet per day, respectively, which includes the company’s share of equity affiliates’ sales. Outside the United States, substantially all of the natural gas sales from the company’s producing interests are from operations in Australia, Bangladesh, Canada, Europe, Kazakhstan, Indonesia, Latin America, Myanmar, Nigeria, the Philippines and Thailand.
U.S. and international sales of natural gas liquids were
142,000
and
88,000
barrels per day, respectively, in
2013
. Substantially all of the international sales of natural gas liquids from the company's producing interests are from operations in Africa, Kazakhstan, Indonesia and the United Kingdom.
Refer to “Selected Operating Data,” on page FS-10 in Management’s Discussion and Analysis of Financial Condition and Results of Operations, for further information on the company’s sales volumes of natural gas and natural gas liquids. Refer also to “Delivery Commitments” on page 7 for information related to the company’s delivery commitments for the sale of crude oil and natural gas.
23
Downstream
Refining Operations
At the end of
2013
, the company had a refining network capable of processing nearly 2 million barrels of crude oil per day. Operable capacity at December 31,
2013
, and daily refinery inputs for
2011
through
2013
for the company and affiliate refineries are summarized in the table below.
Average crude oil distillation capacity utilization during
2013
was 84 percent, compared with 88 percent in
2012
. At the U.S. refineries, crude oil distillation capacity utilization averaged 81 percent in
2013
, compared with 87 percent in
2012
. Chevron processes both imported and domestic crude oil in its U.S. refining operations. Imported crude oil accounted for about 76 percent and 77 percent of Chevron’s U.S. refinery inputs in
2013
and
2012
, respectively.
At the Pascagoula Refinery, construction progressed during 2013 on a facility to produce approximately 25,000 barrels per day of premium base oil. Mechanical completion of the plant is expected in first quarter 2014, and ramp up to full production is planned during second quarter 2014.
During 2013, work continued on projects to improve refinery flexibility and enhance the capability to process lower
cost
feedstocks. In early 2013, start-up was achieved on a project at the Pascagoula Refinery that provides additional flexibility to process a broader range of crudes. A project to improve flexibility at the Salt Lake City Refinery is scheduled to be completed by mid-2014.
Outside the United States, GS Caltex, a 50 percent-owned affiliate, started commercial operations of a 53,000-barrel-per-day gas oil fluid catalytic cracking unit at the Yeosu Refinery in South Korea in second quarter 2013. In 2013, Caltex Australia Ltd., a 50 percent-owned affiliate, progressed its plans to convert the Kurnell, Australia, refinery to an import terminal in 2014. In February 2014, Singapore Refining Company, Chevron's 50 percent-owned joint venture, reached a final investment decision to install a gasoline clean fuels facility and cogeneration plant. Addition of the facilities is expected to increase the refinery's capability to produce higher value gasoline and improve energy efficiency.
Petroleum Refineries: Locations, Capacities and Inputs
(Crude-unit capacities and crude oil inputs in thousands of barrels per day; includes equity share in affiliates)
(Crude-unit capacities and crude oil inputs in thousands of barrels per day; includes equity share in affiliates)
|
December 31, 2013
|
Refinery Inputs
|
||||||||||||||||
|
Locations
|
Number
|
Operable
Capacity
|
2013
|
2012
|
2011
|
||||||||||||
|
Pascagoula
|
Mississippi
|
1
|
|
330
|
|
304
|
|
335
|
|
327
|
|
||||||
|
El Segundo
|
California
|
1
|
|
269
|
|
235
|
|
265
|
|
244
|
|
||||||
|
Richmond
|
California
|
1
|
|
257
|
|
153
|
|
142
|
|
192
|
|
||||||
|
Kapolei
|
Hawaii
|
1
|
|
54
|
|
39
|
|
46
|
|
47
|
|
||||||
|
Salt Lake City
|
Utah
|
1
|
|
45
|
|
43
|
|
45
|
|
44
|
|
||||||
|
Total Consolidated Companies — United States
|
5
|
|
955
|
|
774
|
|
833
|
|
854
|
|
|||||||
|
Pembroke
1
|
United Kingdom
|
—
|
|
—
|
|
—
|
|
—
|
|
122
|
|
||||||
|
Map Ta Phut
2
|
Thailand
|
1
|
|
165
|
|
161
|
|
95
|
|
—
|
|
||||||
|
Cape Town
3
|
South Africa
|
1
|
|
110
|
|
78
|
|
79
|
|
77
|
|
||||||
|
Burnaby, B.C.
|
Canada
|
1
|
|
55
|
|
42
|
|
49
|
|
43
|
|
||||||
|
Total Consolidated Companies — International
|
3
|
|
330
|
|
281
|
|
223
|
|
242
|
|
|||||||
|
Affiliates
2
|
Various Locations
|
6
|
|
675
|
|
583
|
|
646
|
|
691
|
|
||||||
|
Total Including Affiliates — International
|
9
|
|
1,005
|
|
864
|
|
869
|
|
933
|
|
|||||||
|
Total Including Affiliates — Worldwide
|
14
|
|
1,960
|
|
1,638
|
|
1,702
|
|
1,787
|
|
|||||||
|
1
|
Pembroke was sold in August 2011.
|
|
2
|
As of June 2012, Star Petroleum Refining Company crude input volumes are reported on a consolidated basis. Prior to June 2012, crude volumes reflect a 64 percent equity interest and are reported in affiliates.
|
|
3
|
Chevron holds a controlling interest in the shares issued by Chevron South Africa (Pty) Limited, which owns the Cape Town Refinery. A consortium of South African partners owns preferred shares ultimately convertible to a 25 percent equity interest in Chevron South Africa (Pty) Limited.
|
24
Marketing Operations
The company markets petroleum products under the principal brands of “Chevron,” “Texaco” and “Caltex” throughout many parts of the world. The following table identifies the company’s and affiliates’ refined products sales volumes, excluding intercompany sales, for the three years ended December 31,
2013
.
Refined Products Sales Volumes
(Thousands of Barrels per Day)
(Thousands of Barrels per Day)
|
2013
|
2012
|
2011
|
|||||||
|
United States
|
|||||||||
|
Gasoline
|
613
|
|
624
|
|
649
|
|
|||
|
Jet Fuel
|
215
|
|
212
|
|
209
|
|
|||
|
Gas Oil and Kerosene
|
195
|
|
213
|
|
213
|
|
|||
|
Residual Fuel Oil
|
69
|
|
68
|
|
87
|
|
|||
|
Other Petroleum Products
1
|
90
|
|
94
|
|
99
|
|
|||
|
Total United States
|
1,182
|
|
1,211
|
|
1,257
|
|
|||
|
International
2
|
|||||||||
|
Gasoline
|
398
|
|
412
|
|
447
|
|
|||
|
Jet Fuel
|
245
|
|
243
|
|
269
|
|
|||
|
Gas Oil and Kerosene
|
510
|
|
496
|
|
543
|
|
|||
|
Residual Fuel Oil
|
179
|
|
210
|
|
233
|
|
|||
|
Other Petroleum Products
1
|
197
|
|
193
|
|
200
|
|
|||
|
Total International
|
1,529
|
|
1,554
|
|
1,692
|
|
|||
|
Total Worldwide
2
|
2,711
|
|
2,765
|
|
2,949
|
|
|||
|
1
Principally naphtha, lubricants, asphalt and coke.
|
|||||||||
|
2
Includes share of affiliates’ sales:
|
471
|
|
522
|
|
556
|
|
|||
In the United States, the company markets under the Chevron and Texaco brands. At year-end
2013
, the company supplied directly or through retailers and marketers approximately 8,050 Chevron- and Texaco-branded motor vehicle service stations, primarily in the southern and western states. Approximately 400 of these outlets are company-owned or -leased stations.
Outside the United States, Chevron supplied directly or through retailers and marketers approximately 8,600 branded service stations, including affiliates. In British Columbia, Canada, the company markets under the Chevron brand. The company markets in Latin America using the Texaco brand. In the Asia-Pacific region, southern Africa, Egypt and Pakistan, the company uses the Caltex brand. The company also operates through affiliates under various brand names. In South Korea, the company operates through its 50 percent-owned affiliate, GS Caltex, and in Australia through its 50 percent-owned affiliate, Caltex Australia Limited.
Chevron markets commercial aviation fuel at approximately 115 airports worldwide. The company also markets an extensive line of lubricant and coolant products under the product lines Havoline, Delo, Ursa, Meropa, Rando, Clarity and
Taro in the United States and worldwide under the three brands: Chevron, Texaco and Caltex.
Chemicals Operations
Chevron owns a 50 percent interest in its Chevron Phillips Chemical Company LLC (CPChem) affiliate. At the end of
2013
, CPChem owned or had joint-venture interests in 35 manufacturing facilities and two research and development centers around the world.
During 2013
, CPChem progressed construction of a 1-hexene plant at the company’s Cedar Bayou complex in Baytown, Texas, with a design capacity of 250,000 metric tons per year. Start-up is expected in second quarter 2014. In October 2013, CPChem announced a final investment decision on its U.S. Gulf Coast Petrochemicals Project, which is expected to capitalize on advantaged feedstock sourced from shale gas development in North America. The $6 billion project includes an ethane cracker with an annual design capacity of 1.5 million metric tons of ethylene to be located at the Cedar Bayou complex in Baytown, Texas, and two polyethylene facilities to be located in Old Ocean, Texas, each with an annual design capacity of 500,000 metric tons.
Chevron’s Oronite brand lubricant and fuel additives business is a leading developer, manufacturer and marketer of performance additives for lubricating oils and fuels. The company owns and operates facilities in Brazil, France, Japan, the Netherlands, Singapore and the United States and has equity interests in facilities in India and Mexico. Oronite lubricant additives are blended with refined base oil to produce finished lubricants, used primarily in engine applications such as passenger cars, heavy-duty diesel trucks, buses, ships, locomotives and motorcycles. Additives for fuels are blended to improve engine performance and extend engine life. In 2013, construction continued on a project to expand the capacity of the existing additives plant on Jurong Island in Singapore. Commercial operations are expected to begin by third quarter 2014. Upon start-up, the plant is expected to double its capacity since it was commissioned in 1999. In Gonfreville, France, a project to expand dispersant production by more than 25 percent was completed in third quarter 2013, and a project to effectively double detergent capacity began construction with expected completion in late 2014.
25
Transportation
Pipelines:
Chevron owns and operates an extensive network of crude oil, natural gas, natural gas liquid, refined product and chemical pipelines and other infrastructure assets in the United States. The company also has direct and indirect interests in other U.S. and international pipelines. The company’s ownership interests in pipelines are summarized in the following table.
Pipeline Mileage at December 31,
2013
|
Net Mileage
1,2
|
|||
|
United States
|
|||
|
Crude Oil
|
1,883
|
|
|
|
Natural Gas
|
2,638
|
|
|
|
Petroleum Products
|
4,395
|
|
|
|
Total United States
|
8,916
|
|
|
|
International
|
|||
|
Crude Oil
|
667
|
|
|
|
Natural Gas
|
199
|
|
|
|
Petroleum Products
|
290
|
|
|
|
Total International
|
1,156
|
|
|
|
Worldwide
|
10,072
|
|
|
|
1
|
Includes company’s share of pipeline mileage owned by affiliates.
|
|
2
|
Excludes gathering pipelines relating to the crude oil and natural gas production function.
|
The company is leading the construction of a 136-mile, 24-inch crude oil pipeline from the planned Jack/St. Malo deepwater production facility to a platform in Green Canyon Block 19 on the U.S. Gulf of Mexico shelf, where there is an interconnect to pipelines delivering crude oil into Texas and Louisiana. In early 2014, the company completed laying the pipe, which included the installation of two subsea connections for future tie-ins. All remaining work on the pipeline is expected to be completed by start-up of the production facility in late 2014.
In June 2013, the company completed the sale of the 100 percent-owned and operated Northwest Products System.
Refer to pages 15, 16 and 17 in the Upstream section for information on the Chad/Cameroon pipeline, the West African Gas Pipeline, the Baku-Tbilisi-Ceyhan Pipeline, the Western Route Export Pipeline and the Caspian Pipeline Consortium.
Shipping:
All tankers in Chevron’s controlled seagoing fleet were utilized during
2013
. During
2013
, the company had 58 deep-sea vessels chartered on a voyage basis, or for a period of less than one year. The following table summarizes the capacity of the company’s controlled fleet.
Controlled Tankers at December 31,
2013
1
|
U.S. Flag
|
Foreign Flag
|
||||||||||
|
Cargo Capacity
|
Cargo Capacity
|
||||||||||
|
Number
|
(Millions of Barrels)
|
Number
|
(Millions of Barrels)
|
||||||||
|
Owned
|
—
|
|
—
|
|
1
|
|
1.0
|
|
|||
|
Bareboat-Chartered
|
4
|
|
1.4
|
|
17
|
|
25.0
|
|
|||
|
Time-Chartered
2
|
3
|
|
1.0
|
|
9
|
|
8.5
|
|
|||
|
Total
|
7
|
|
2.4
|
|
27
|
|
34.5
|
|
|||
|
1
|
Consolidated companies only. Excludes tankers chartered on a voyage basis, those with dead-weight tonnage less than 25,000 and those used exclusively for storage.
|
|
2
|
Tankers chartered for more than one year.
|
The company’s U.S.-flagged fleet is engaged primarily in transporting refined products in the coastal waters of the United States.
The foreign-flagged vessels are engaged primarily in transporting crude oil from the Middle East, Southeast Asia, the Black Sea, South America, Mexico and West Africa to ports in the United States, Europe, Australia and Asia. The company’s foreign-flagged vessels also transport refined products and feedstocks to and from various locations worldwide.
In 2013, the company took delivery of two vessels that included one bareboat charter VLCC and a dynamically positioned shuttle tanker. Progress continued on contracts in place for bareboat charters and new builds, to modernize the fleet and increase LNG coverage. The company also owns a one-sixth interest in each of seven LNG carriers transporting cargoes for the North West Shelf Venture in Australia.
Other Businesses
Mining:
Chevron owns and operates the Questa molybdenum mine in New Mexico. At year-end 2013, Chevron had 160 million pounds of proven molybdenum reserves at Questa. Production and underground development at Questa continued at reduced levels in 2013 in response to weak prices for molybdenum.
Power and Energy Services:
In 2014, Chevron Energy Solutions is being combined with Chevron Global Power Company. As the company's power and energy services provider, this business delivers comprehensive commercial, engineering and operational support services to improve power reliability and energy efficiency of Chevron operations worldwide. The responsibilities also include developing and building sustainable energy projects for the production of renewable power and to reduce energy costs that benefit third parties and the environment.
26
This business also manages Chevron's interest in a variety of gas-fired and renewable power generation assets. The gas-fired cogeneration facilities produce electricity and steam and utilize recovered waste heat to support enhanced oil recovery operations. The renewable facilities consist of wind, geothermal, photovoltaic and solar-to-steam production assets.
Chevron also has major geothermal operations in Indonesia and the Philippines and is evaluating several advanced solar technologies for use in oil field operations as part of its renewable energy strategy. For additional information on the company’s geothermal operations and renewable energy projects, refer to page 19 in the Upstream section and “Research and Technology” below.
Research and Technology:
The company’s energy technology organization supports Chevron’s upstream and downstream businesses by conducting research, developing and qualifying technology, providing technical services, and providing competency development in earth sciences; reservoir and production engineering; drilling and completions; facilities engineering; manufacturing; process technology; catalysis; technical computing; and health, environment and safety disciplines. The information technology organization integrates computing, telecommunications, data management, security and network technology to provide a standardized digital infrastructure and enable Chevron’s global operations and business processes.
Chevron's technology ventures group manages investments in venture capital and projects in emerging energy technologies and their integration into Chevron’s core businesses. As of the end of
2013
, the ventures group continued to explore technologies such as next-generation biofuels, advanced solar and enhanced pipeline inspection methods, and made investments in the primary carbon market.
Chevron’s research and development expenses were
$750 million,
$648 million and $627 million for the years
2013
,
2012
and
2011
, respectively.
Some of the investments the company makes in the areas described above are in new or unproven technologies and business processes, and ultimate technical or commercial successes are not certain.
Environmental Protection:
The company designs, operates and maintains its facilities to avoid potential spills or leaks and minimize the impact of those that may occur. Chevron requires its facilities and operations to have operating standards and processes and emergency response plans that address all credible and significant risks identified through site-specific risk and impact assessments. Chevron also requires that sufficient resources be available to execute these plans. In the unlikely event that a major spill or leak occurs, Chevron also maintains a Worldwide Emergency Response Team comprised of employees who are trained in various aspects of emergency response, including post-incident remediation.
To complement the company’s capabilities, Chevron maintains active membership in international oil spill response cooperatives, including the Marine Spill Response Corporation, which operates in U.S. territorial waters, and Oil Spill Response, Ltd. (OSRL), which operates globally. The company is a founding member of the Marine Well Containment Company, whose primary mission is to expediently deploy containment equipment and systems to capture and contain crude oil in the unlikely event of a future loss of control of a deepwater well in the Gulf of Mexico. In addition, the company is a member of the Subsea Well Response Project (SWRP). SWRP’s objective is to further develop the industry’s capability to contain and shut in subsea well control incidents in different regions of the world.
Refer to Management's Discussion and Analysis of Financial Condition and Results of Operations on page FS-15 for additional information on environmental matters and their impact on Chevron, and on the company's
2013
environmental expenditures. Refer to page FS-15 and Note 23 on page FS-55 for a discussion of environmental remediation provisions and year-end reserves. Refer also to Item 1A. Risk Factors on pages 27 through 29 for a discussion of greenhouse gas regulation and climate change.
Website Access to SEC Reports
The company’s website is
www.chevron.com
. Information contained on the company’s website is not part of this Annual Report on Form 10-K. The company’s Annual Reports on Form 10-K, Quarterly Reports on Form 10-Q, Current Reports on Form 8-K and any amendments to these reports filed or furnished pursuant to Section 13(a) or 15(d) of the Securities Exchange Act of 1934 are available free of charge on the company’s website soon after such reports are filed with or furnished to the Securities and Exchange Commission (SEC). The reports are also available on the SEC’s website at
www.sec.gov
.
|
Item 1A.
|
Risk Factors
|
Chevron is a global energy company with a diversified business portfolio, a strong balance sheet, and a history of generating sufficient cash to pay dividends and fund capital and exploratory expenditures. Nevertheless, some inherent risks could materially impact the company’s financial results of operations or financial condition.
Chevron is exposed to the effects of changing commodity prices:
Chevron is primarily in a commodities business that has a history of price volatility. The single largest variable that affects the company’s results of operations is the price of crude oil, which can be influenced by general economic conditions, industry inventory levels, production quotas imposed by the Organization of Petroleum Exporting Countries (OPEC), weather-related damage and disruptions, competing fuel prices, and geopolitical risk. Chevron accepts
27
the risk of changing commodity prices as part of its business planning process. As such, an investment in the company carries significant exposure to fluctuations in global crude oil prices.
During extended periods of historically low prices for crude oil, the company’s upstream earnings and capital and exploratory expenditure programs will be negatively affected. Upstream assets may also become impaired. The impact on downstream earnings is dependent upon the supply and demand for refined products and the associated margins on refined product sales.
The scope of Chevron’s business will decline if the company does not successfully develop resources:
The company is in an extractive business; therefore, if Chevron is not successful in replacing the crude oil and natural gas it produces with good prospects for future production or through acquisitions, the company’s business will decline. Creating and maintaining an inventory of projects depends on many factors, including obtaining and renewing rights to explore, develop and produce hydrocarbons; drilling success; ability to bring long-lead-time, capital-intensive projects to completion on budget and on schedule; and efficient and profitable operation of mature properties.
The company’s operations could be disrupted by natural or human factors:
Chevron operates in both urban areas and remote and sometimes inhospitable regions. The company’s operations and facilities are therefore subject to disruption from either natural or human causes beyond its control, including hurricanes, floods and other forms of severe weather, war, civil unrest and other political events, fires, earthquakes, system failures, cyber threats and terrorist acts, any of which could result in suspension of operations or harm to people or the natural environment.
The company’s operations have inherent risks and hazards that require significant and continuous oversight:
Chevron’s results depend on its ability to identify and mitigate the risks and hazards inherent to operating in the crude oil and natural gas industry. The company seeks to minimize these operational risks by carefully designing and building its facilities and conducting its operations in a safe and reliable manner. However, failure to manage these risks effectively could result in unexpected incidents, including releases, explosions or mechanical failures resulting in personal injury, loss of life, environmental damage, loss of revenues, legal liability and/or disruption to operations. Chevron has implemented and maintains a system of corporate policies, behaviors and compliance mechanisms to manage safety, health, environmental, reliability and efficiency risks; to verify compliance with applicable laws and policies; and to respond to and learn from unexpected incidents. In certain situations where Chevron is not the operator, the company may have limited influence and control over third parties, which may limit its ability to manage and control such risks.
Chevron’s business subjects the company to liability risks from litigation or government action:
The company produces, transports, refines and markets materials with potential toxicity, and it purchases, handles and disposes of other potentially toxic materials in the course of its business. Chevron's operations also produce byproducts, which may be considered pollutants. Often these operations are conducted through joint ventures over which the company may have limited influence and control. Any of these activities could result in liability or significant delays in operations arising from private litigation or government action, either as a result of an accidental, unlawful discharge or as a result of new conclusions about the effects of the company’s operations on human health or the environment. In addition, to the extent that societal pressures or political or other factors are involved, it is possible that such liability could be imposed without regard to the company’s causation of or contribution to the asserted damage, or to other mitigating factors.
For information concerning some of the litigation in which the company is involved, including information relating to Ecuador matters, see Note 14 to the Consolidated Financial Statements, beginning on page FS-39.
The company does not insure against all potential losses, which could result in significant financial exposure:
The company does not have commercial insurance or third-party indemnities to fully cover all operational risks or potential liability in the event of a significant incident or series of incidents causing catastrophic loss. As a result, the company is, to a substantial extent, self-insured for such events. The company relies on existing liquidity, financial resources and borrowing capacity to meet short-term obligations that would arise from such an event or series of events. The occurrence of a significant incident or unforeseen liability for which the company is not fully insured or for which insurance recovery is significantly delayed could have a material adverse effect on the company’s results of operations or financial condition.
Political instability and significant changes in the regulatory environment could harm Chevron’s business:
The company’s operations, particularly exploration and production, can be affected by changing economic, regulatory and political environments in the various countries in which it operates. As has occurred in the past, actions could be taken by governments to increase public ownership of the company’s partially or wholly owned businesses or to impose additional taxes or royalties.
In certain locations, governments have imposed or proposed restrictions on the company’s operations, export and exchange controls, burdensome taxes, and public disclosure requirements that might harm the company’s competitiveness or relations with other governments or third parties. In other countries, political conditions have existed that may threaten the safety of employees and the company’s continued presence in those countries, and internal unrest,
28
acts of violence or strained relations between a government and the company or other governments may adversely affect the company’s operations. Those developments have, at times, significantly affected the company’s related operations and results and are carefully considered by management when evaluating the level of current and future activity in such countries. At December 31,
2013
, 21 percent of the company’s net proved reserves were located in Kazakhstan. The company also has significant interests in OPEC-member countries, including Angola, Nigeria and Venezuela, and in the Partitioned Zone between Saudi Arabia and Kuwait. Twenty-one percent of the company’s net proved reserves, including affiliates, were located in OPEC countries at December 31,
2013
.
Regulation of greenhouse gas emissions could increase Chevron’s operational costs and reduce demand for Chevron’s products:
Continued political attention to issues concerning climate change, the role of human activity in it, and potential mitigation through regulation could have a material impact on the company’s operations and financial results.
International agreements and national or regional legislation and regulatory measures to limit greenhouse emissions are currently in various stages of discussion or implementation. These and other greenhouse gas emissions-related laws, policies and regulations may result in substantial capital, compliance, operating and maintenance costs. The level of expenditure required to comply with these laws and regulations is uncertain and is expected to vary depending on the laws enacted in each jurisdiction, the company’s activities in it and market conditions. Greenhouse gas emissions that could be regulated include those arising from the company’s exploration and production of crude oil and natural gas; the upgrading of production from oil sands into synthetic oil; power generation; the conversion of crude oil and natural gas into refined products; the processing, liquefaction and regasification of natural gas; the transportation of crude oil, natural gas and related products and consumers’ or customers’ use of the company’s products. Some of these activities, such as consumers’ and customers’ use of the company’s products, as well as actions taken by the company’s competitors in response to such laws and regulations, are beyond the company’s control.
The effect of regulation on the company’s financial performance will depend on a number of factors including, among others, the sectors covered, the greenhouse gas emissions reductions required by law, the extent to which Chevron would be entitled to receive emission allowance allocations or would need to purchase compliance instruments on the open market or through auctions, the price and availability of emission allowances and credits, and the impact of legislation or other regulation on the company’s ability to recover the costs incurred through the pricing of the company’s products. Material price increases or incentives to conserve or use alternative energy sources could reduce demand for
products the company currently sells and adversely affect the company’s sales volumes, revenues and margins.
Changes in management’s estimates and assumptions may have a material impact on the company’s consolidated financial statements and financial or operational performance in any given period:
In preparing the company’s periodic reports under the Securities Exchange Act of 1934, including its financial statements, Chevron’s management is required under applicable rules and regulations to make estimates and assumptions as of a specified date. These estimates and assumptions are based on management’s best estimates and experience as of that date and are subject to substantial risk and uncertainty. Materially different results may occur as circumstances change and additional information becomes known. Areas requiring significant estimates and assumptions by management include measurement of benefit obligations for pension and other postretirement benefit plans; estimates of crude oil and natural gas recoverable reserves; accruals for estimated liabilities, including litigation reserves; and impairments to property, plant and equipment. Changes in estimates or assumptions or the information underlying the assumptions, such as changes in the company’s business plans, general market conditions or changes in commodity prices, could affect reported amounts of assets, liabilities or expenses.
|
Item1B.
|
Unresolved Staff Comments
|
None.
|
Item 2.
|
Properties
|
The location and character of the company’s crude oil, natural gas and mining properties and its refining, marketing, transportation and chemicals facilities are described on page 3 under Item 1. Business. Information required by Subpart 1200 of Regulation S-K (“Disclosure by Registrants Engaged in Oil and Gas Producing Activities”) is also contained in Item 1 and in Tables I through VII on pages FS-59 through FS-71. Note 13, “Properties, Plant and Equipment,” to the company’s financial statements is on page FS-39.
Ecuador:
Information related to Ecuador matters is included in Note 14 to the Consolidated Financial Statements under the heading Ecuador, beginning on page FS-39.
Certain Governmental Proceedings:
As initially disclosed in the first quarter 2011 Form 10-Q, the Environmental Protection Agency (EPA) indicated that it would assess the company's Salt Lake City Refinery a civil penalty for alleged violations of federal requirements and Utah's air quality laws. These alleged violations were
29
the subject of an August 20, 2008, EPA Notice of Violation (NOV) for which no penalty was assessed at the time. On October 21, 2013, the U.S. District Court in Utah entered a Consent Decree resolving the NOV. Pursuant to the Consent Decree, Chevron paid a penalty of $384,000 and agreed to implement certain other measures.
On August 6, 2012, a piping failure and fire occurred at the Chevron U.S.A. Inc. refinery in Richmond, California. Various federal, state, and local agencies initiated investigations as a result of the incident. Based on its civil investigation, the United States EPA issued a Finding of Violations (FOV) to Chevron on December 17, 2013, which includes 62 findings of alleged noncompliance at the refinery. The majority of these findings relate to the August 2012 fire and alleged violations of chemical-accident-prevention laws, but the FOV also addresses a number of release-reporting issues, some of which are unrelated to the fire. Resolution of the alleged violations may result in the payment of a civil penalty of $100,000 or more.
In July 2009, the Hawaii Department of Health (DOH) alleged that Chevron is obligated to pay stipulated civil penalties in conjunction with commitments Chevron undertook to install and operate certain air emission control equipment at its Hawaii Refinery pursuant to a Clean Air Act settlement with the United States EPA and the DOH. The company has disputed many of the allegations. Resolution of the alleged violations may result in the payment of a civil penalty of $100,000 or more.
As initially disclosed in the 2012 Form 10-K, in September and November 2012, Chevron's Richmond Refinery received from the Bay Area Air Quality Management District (BAAQMD) proposals to resolve 47 alleged NOVs related to air quality regulations. In December 2012, a settlement agreement was finalized covering 28 of those NOVs for payment of $145,600 in civil penalties. The company reached a settlement agreement with BAAQMD and paid $190,000 in civil penalties to resolve 17 of the remaining NOVs, and the BAAQMD has informed the company that it will not seek penalties for the last two remaining NOVs.
On June 10, 2013, the company received correspondence from the California Air Resources Board regarding an alleged violation of California's Regulation for the Mandatory Reporting of Greenhouse Gas Emissions based on alleged delay in the reporting of emissions data for Chevron's San Joaquin Valley Business Unit. Chevron has reached an agreement-in-principle with the California Air Resources Board under which the company would pay a $328,500 civil penalty to resolve the alleged violations.
The California Air Resources Board (CARB) has alleged that greenhouse gas (GHG) emissions reported by Chevron’s El Segundo Refinery for the 2011 calendar year contained an error in violation of California’s GHG reporting regulation, and that the reporting error resulted in an over-allocation of GHG allowances. The company has reached an agreement-in-
principle with the CARB under which Chevron would pay a $364,500 civil penalty to resolve the alleged violations.
As initially disclosed in the third quarter 2013 Form 10-Q, in July 2013, Chevron Products Company, a division of Chevron U.S.A. Inc., received a NOV from the CARB for the Richmond and Montebello (California) terminals alleging the selling or offering for sale of gasoline containing more than the maximum allowable ethanol content. Resolution of the alleged violation may result in the payment of a civil penalty of $100,000 or more.
On October 18, 2013, the CARB issued a Notice of Violation alleging that Chevron’s San Diego terminal sold gasoline with less than the required detergent content for 34 months from 2010 to 2012. Resolution of the alleged violation may result in the payment of a civil penalty of $100,000 or more.
On December 18, 2013, EPA declared certain renewable fuel credits (also referred to as Renewable Identification Numbers or RINs) generated by E-Biofuel to be invalid. The company previously submitted RINs generated by E-Biofuel for 2012 compliance with federal renewable fuels requirements. Under current EPA policy, the company's earlier submittal of those now-invalid RINs generated by E-Biofuel may result in the payment of a civil penalty of $100,000 or more.
As previously disclosed in the third quarter 2013 Form 10-Q, Chevron U.S.A. Inc. has participated in settlement discussions and received a proposed settlement agreement from the South Coast Air Quality Management District to resolve alleged violations of the El Segundo Refinery's Clean Air Act Title V Operating Permit. Resolution of the alleged violations may result in the payment of a civil penalty of $100,000 or more.
The State of New Mexico provided to Chevron a NOV on December 11, 2013, alleging that the flaring of fuel gas that occurred during periodic compressor purging events at the Chevron Buckeye CO2 plant resulted in hourly air emissions during these events in excess of the plant permit limits and alleging that the company had failed to timely report these excess emissions. The resolution of this NOV may result in the payment of a civil penalty of $100,000 or more.
As initially disclosed in the second quarter 2013 Form 10-Q, Chevron Pipe Line Company (CPL) received a NOV from the Utah Division of Water Quality (DWQ) in April 2013 alleging state law violations resulting from a pipeline spill near Willard Bay State Park, Utah. CPL has concluded a settlement agreement with the DWQ and the Utah Department of Natural Resources, State Parks and Recreation Division to resolve these alleged violations, which includes a monetary penalty of $350,000 as well as $5 million for environmentally beneficial mitigation projects and for lost use damages.
30
|
Item 4.
|
Mine Safety Disclosures
|
Information concerning mine safety violations or other regulatory matters required by Section 1503(a) of the Dodd-Frank Wall Street Reform and Consumer Protection Act and Item 104 of Regulation S-K (17 C.F.R. § 229.104) is included in Exhibit 95 of this Annual Report on Form 10-K.
The information on Chevron’s common stock market prices, dividends, principal exchanges on which the stock is traded and number of stockholders of record is contained in the Quarterly Results and Stock Market Data tabulations, on page FS-19.
Chevron Corporation Issuer Purchases of Equity Securities
|
Maximum
|
||||||||||
|
Total Number of
|
|
Number of Shares
|
||||||||
|
Total Number
|
|
Average
|
Shares Purchased as
|
|
that May Yet be
|
|||||
|
of Shares
|
|
Price Paid
|
Part of Publicly
|
|
Purchased Under
|
|||||
|
Period
|
Purchased
1,2
|
|
per Share
|
Announced Program
|
|
the Program
2
|
||||
|
Oct. 1 - Oct. 31, 2013
|
3,936,342
|
|
$119.22
|
3,935,677
|
|
—
|
||||
|
Nov. 1 - Nov. 30, 2013
|
4,700,264
|
|
120.10
|
4,699,917
|
|
—
|
||||
|
Dec. 1 - Dec. 31, 2013
|
1,739,623
|
|
124.34
|
1,739,623
|
|
—
|
||||
|
Total Oct. 1 - Dec. 31, 2013
|
10,376,229
|
|
$120.48
|
10,375,217
|
|
—
|
||||
|
1
|
Includes common shares repurchased from company employees for required personal income tax withholdings on the exercise of the stock options and shares delivered or attested to in satisfaction of the exercise price by holders of the employee stock options. The options were issued to and exercised by management under Chevron long-term incentive plans and Unocal stock option plans.
|
|
2
|
In July 2010, the Board of Directors approved an ongoing share repurchase program with no set term or monetary limits, under which common shares would be acquired by the company through open market purchases or in negotiated transactions at prevailing prices, as permitted by securities laws and other legal requirements and subject to market conditions and other factors. As of December 31,
2013
,
139,340,805
shares had been acquired under this program (some pursuant to a Rule 10b5-1 plan and some pursuant to accelerated share repurchase plans) for
$15 billion
at an average price of approximately
$108
per share.
|
The selected financial data for years
2009
through
2013
are presented on page FS
-58.
The index to Management’s Discussion and Analysis of Financial Condition and Results of Operations, Consolidated Financial Statements and Supplementary Data is presented on page FS
-1.
The company’s discussion of interest rate, foreign currency and commodity price market risk is contained in Management’s Discussion and Analysis of Financial Condition and Results of Operations — “Financial and Derivative Instrument Market Risk,” beginning on page FS-13 and in Note 10 to the
Consolidated Financial Statements, “Financial and Derivative Instruments,” beginning on page FS-34.
31
The index to Management’s Discussion and Analysis, Consolidated Financial Statements and Supplementary Data is presented on page FS-1.
None.
(a) Evaluation of Disclosure Controls and Procedures
The company’s management has evaluated, with the participation of the Chief Executive Officer and the Chief Financial Officer, the effectiveness of the company’s disclosure controls and procedures (as defined in Rule 13a-15(e) and 15d-15(e) under the Securities Exchange Act of 1934 (the “Exchange Act”)) as of the end of the period covered by this report. Based on this evaluation, the Chief Executive Officer and the Chief Financial Officer concluded that the company’s disclosure controls and procedures were effective as of December 31,
2013
.
(b) Management’s Report on Internal Control Over Financial Reporting
The company’s management is responsible for establishing and maintaining adequate internal control over financial reporting, as such term is defined in Exchange Act Rule 13a-15(f). The
company’s management, including the Chief Executive Officer and the Chief Financial Officer, conducted an evaluation of the effectiveness of the company’s internal control over financial reporting based on the
Internal Control — Integrated Framework
(1992)
issued by the Committee of Sponsoring Organizations of the Treadway Commission (COSO). Based on the results of this evaluation, the company’s management concluded that internal control over financial reporting was effective as of December 31,
2013
.
The effectiveness of the company’s internal control over financial reporting as of December 31,
2013
, has been audited by PricewaterhouseCoopers LLP, an independent registered public accounting firm, as stated in its report included on page FS-21.
(c) Changes in Internal Control Over Financial Reporting
During the quarter ended December 31,
2013
, there were no changes in the company’s internal control over financial reporting that have materially affected, or are reasonably likely to materially affect, the company’s internal control over financial reporting.
On May 14, 2013, COSO published an updated
Internal Control — Integrated Framework
(2013) and related illustrative documents. As of December 31, 2013, the company is utilizing the original framework published in 1992. The transition period for adoption of the updated framework ends December 15, 2014.
None.
32
Executive Officers of the Registrant at
February 21, 2014
The Executive Officers of the Corporation consist of the Chairman of the Board, the Vice Chairman of the Board and such other officers of the Corporation who are members of the Executive Committee.
|
Name
|
Age
|
Current and Prior Positions (up to five years)
|
Current Areas of Responsibility
|
||
|
J.S. Watson
|
57
|
Chairman of the Board and Chief Executive Officer (since 2010)
|
Chief Executive Officer
|
||
|
Vice Chairman of the Board (2009)
|
|||||
|
Executive Vice President (2008 to 2009)
|
|||||
|
G.L. Kirkland
|
63
|
Vice Chairman of the Board and Executive Vice President
(since 2010)
Executive Vice President (2005 through 2009)
|
Vice Chairman of the Board and Executive Vice President
|
||
|
M.K. Wirth
|
53
|
Executive Vice President (since 2006)
|
Worldwide Refining, Marketing and Lubricants; Chemicals
|
||
|
R.I. Zygocki
|
56
|
Executive Vice President (since 2011)
Vice President, Policy, Government and Public Affairs
(2007 through 2011)
|
Strategy and Planning; Health, Environment and Safety; Policy, Government and Public Affairs; Mining
|
||
|
J.C. Geagea
|
54
|
Senior Vice President, Technology, Projects and Services
(since 2014)
Corporate Vice President and President, Gas and Midstream
(2012 through 2013) Managing Director, Asia South Business Unit (2008 through 2011) |
Technology; Project Resources Company; Procurement
|
||
|
J.W. Johnson
|
54
|
Senior Vice President, Upstream (since 2014)
President, Europe, Eurasia and Middle East Exploration and
Production (2011 through 2013) Managing Director, Eurasia Business Unit (2008 to 2011) |
Worldwide Exploration and Production Activities
|
||
|
P.R. Breber
|
49
|
Corporate Vice President and President, Gas and Midstream
(since 2014)
Managing Director, Asia South Business Unit (2012 through 2013)
Deputy Managing Director, Asia South Business Unit (2011) Vice President and Treasurer (2009 to 2011) |
Worldwide Natural Gas Commercialization; Supply and Trading Activities, including Natural Gas Trading; Shipping; Pipeline; and Power and Energy Services
|
||
|
P.E. Yarrington
|
57
|
Vice President and Chief Financial Officer (since 2009)
|
Finance
|
||
|
R.H. Pate
|
51
|
Vice President and General Counsel (since 2009)
Partner and Head of Global Competition Practice of Hunton & Williams LLP, a major U.S. law firm (2005 to 2009)
|
Law, Governance and Compliance
|
||
33
The information about directors required by Item 401 (a), (d), (e) and (f) of Regulation S-K and contained under the heading “Election of Directors” in the Notice of the
2014
Annual Meeting and
2014
Proxy Statement, to be filed pursuant to Rule 14a-6(b) under the Securities Exchange Act of 1934 (the “Exchange Act”), in connection with the company’s
2014
Annual Meeting of Stockholders (the “
2014
Proxy Statement”), is incorporated by reference into this Annual Report on Form 10-K.
The information required by Item 405 of Regulation S-K and contained under the heading “Stock Ownership Information — Section 16(a) Beneficial Ownership Reporting Compliance” in the
2014
Proxy Statement is incorporated by reference into this Annual Report on Form 10-K.
The information required by Item 406 of Regulation S-K and contained under the heading “Corporate Governance — Business Conduct and Ethics Code” in the
2014
Proxy Statement is incorporated by reference into this Annual Report on Form 10-K.
The information required by Item 407(d)(4) and (5) of Regulation S-K and contained under the heading “Corporate Governance — Board Committees” in the
2014
Proxy Statement is incorporated by reference into this Annual Report on Form 10-K.
There were no changes to the process by which stockholders may recommend nominees to the Board of Directors during the last fiscal year.
The information required by Item 402 of Regulation S-K and contained under the headings “Executive Compensation” and “Director Compensation” in the
2014
Proxy Statement is incorporated by reference into this Annual Report on Form 10-K.
The information required by Item 407(e)(4) of Regulation S-K and contained under the heading “Corporate Governance — Board Committees” in the
2014
Proxy Statement is incorporated by reference into this Annual Report on Form 10-K.
The information required by Item 407(e)(5) of Regulation S-K and contained under the heading “Corporate Governance — Management Compensation Committee Report” in the
2014
Proxy Statement is incorporated herein by reference into this Annual Report on Form 10-K. Pursuant to the rules and regulations of the SEC under the Exchange Act, the information under such caption incorporated by reference from the
2014
Proxy Statement shall not be deemed to be “soliciting material,” or to be “filed” with the Commission, or subject to Regulation 14A or 14C or the liabilities of Section 18 of the Exchange Act nor shall it be deemed incorporated by reference into any filing under the Securities Act of 1933.
The information required by Item 403 of Regulation S-K and contained under the heading “Stock Ownership Information — Security Ownership of Certain Beneficial Owners and Management” in the
2014
Proxy Statement is incorporated by reference into this Annual Report on Form 10-K.
The information required by Item 201(d) of Regulation S-K and contained under the heading “Equity Compensation Plan Information” in the
2014
Proxy Statement is incorporated by reference into this Annual Report on Form 10-K.
The information required by Item 404 of Regulation S-K and contained under the heading “Corporate Governance — Transactions with Related Parties” in the
2014
Proxy Statement is incorporated by reference into this Annual Report on Form 10-K.
The information required by Item 407(a) of Regulation S-K and contained under the heading “Corporate Governance — Director Independence” in the
2014
Proxy Statement is incorporated by reference into this Annual Report on Form 10-K.
The information required by Item 9(e) of Schedule 14A and contained under the heading “Board Proposal to Ratify the Appointment of the Independent Registered Public Accounting Firm” in the
2014
Proxy Statement is incorporated by reference into this Annual Report on Form 10-K.
34
|
(a)
|
The following documents are filed as part of this report:
|
(1) Financial Statements:
|
Page(s)
|
|
|
FS-27 to FS-57
|
|
(2) Financial Statement Schedules:
Included on page 36 is Schedule II - Valuation and Qualifying Accounts.
(3) Exhibits:
The Exhibit Index on pages E-1 through E-2 lists the exhibits that are filed as part of this report.
35
Schedule II — Valuation And Qualifying Accounts
(Millions Of Dollars)
|
Year Ended December 31
|
|||||||||||
|
2013
|
2012
|
2011
|
|||||||||
|
Employee Termination Benefits
|
|||||||||||
|
Balance at January 1
|
$
|
30
|
|
$
|
63
|
|
$
|
145
|
|
||
|
(Reductions) additions charged to expense
|
(6
|
)
|
3
|
|
—
|
|
|||||
|
Payments
|
(10
|
)
|
(36
|
)
|
(82
|
)
|
|||||
|
Balance at December 31
|
$
|
14
|
|
$
|
30
|
|
$
|
63
|
|
||
|
Allowance for Doubtful Accounts
|
|||||||||||
|
Balance at January 1
|
$
|
155
|
|
$
|
167
|
|
$
|
239
|
|
||
|
Additions (reductions) to expense
|
1
|
|
(4
|
)
|
4
|
|
|||||
|
Bad debt write-offs
|
(61
|
)
|
(8
|
)
|
(76
|
)
|
|||||
|
Balance at December 31
|
$
|
95
|
|
$
|
155
|
|
$
|
167
|
|
||
|
Deferred Income Tax Valuation Allowance*
|
|||||||||||
|
Balance at January 1
|
$
|
15,443
|
|
$
|
11,096
|
|
$
|
9,185
|
|
||
|
Additions to deferred income tax expense
|
2,665
|
|
5,471
|
|
2,216
|
|
|||||
|
Reduction of deferred income tax expense
|
(937
|
)
|
(1,124
|
)
|
(305
|
)
|
|||||
|
Balance at December 31
|
$
|
17,171
|
|
$
|
15,443
|
|
$
|
11,096
|
|
||
*
See also Note 15 to the Consolidated Financial Statements, beginning on page FS-43.
36
Signatures
Pursuant to the requirements of Section 13 or 15(d) of the Securities Exchange Act of 1934, the Registrant has duly caused this report to be signed on its behalf by the undersigned, thereunto duly authorized, on the 21st day of February, 2014.
|
Chevron Corporation
|
|
|
By
|
/s/ JOHN S. WATSON
|
|
John S. Watson, Chairman of the Board
and Chief Executive Officer |
|
Pursuant to the requirements of the Securities Exchange Act of 1934, this report has been signed below by the following persons on behalf of the Registrant and in the capacities indicated on the 21st day of February, 2014.
|
Principal Executive Officers
|
|
|
(and Directors)
|
Directors
|
|
/s/JOHN S. WATSON
John S. Watson, Chairman of the Board and Chief Executive Officer |
LINNET F. DEILY*
Linnet F. Deily |
|
/s/GEORGE L. KIRKLAND
George L. Kirkland, Vice Chairman of the Board |
ROBERT E. DENHAM*
Robert E. Denham |
|
ALICE P. GAST*
Alice P. Gast |
|
|
ENRIQUE HERNANDEZ, JR.*
Enrique Hernandez, Jr. |
|
|
Principal Financial Officer
|
JON M. HUNTSMAN, JR.*
Jon M. Huntsman, Jr. |
|
/s/PATRICIA E. YARRINGTON
Patricia E. Yarrington, Vice President and Chief Financial Officer |
CHARLES W. MOORMAN*
Charles W. Moorman
KEVIN W. SHARER*
Kevin W. Sharer |
|
Principal Accounting Officer
|
|
|
/s/MATTHEW J. FOEHR
Matthew J. Foehr, Vice President and Comptroller |
JOHN G. STUMPF*
John G. Stumpf
RONALD D. SUGAR*
Ronald D. Sugar
|
|
*By:
/s/LYDIA I. BEEBE
Lydia I. Beebe, Attorney-in-Fact |
CARL WARE*
Carl Ware |
37
|
Financial Table of Contents
|
|||||
|
FS-2
|
FS-27
|
||||
|
Note
2
|
Changes in Accumulated Other Comprehensive Losses
FS-29
|
||||
|
Note
3
|
Noncontrolling Interests
FS-30
|
||||
|
Note
4
|
|||||
|
Note
5
|
|||||
|
Note
6
|
|||||
|
Selected Operating Data
FS-10
|
Note
7
|
||||
|
Note
8
|
Lease Commitments
FS-32
|
||||
|
Financial Ratios
FS-13
|
Note
9
|
Fair Value Measurements
FS-32
|
|||
|
Note
10
|
|||||
|
Note 1
1
|
|||||
|
Note 1
2
|
Investments and Advances
FS-37
|
||||
|
Note 1
3
|
|||||
|
Environmental Matters
FS-15
|
Note 1
4
|
Litigation
FS-39
|
|||
|
Note 1
5
|
Taxes
FS-43
|
||||
|
New Accounting Standards
FS-18
|
Note 1
6
|
Short-Term Debt
FS-45
|
|||
|
Note 1
7
|
Long-Term Debt
FS-46
|
||||
|
Note 1
8
|
New Accounting Standards
FS-46
|
||||
|
Note 1
9
|
|||||
|
FS-20
|
Note
20
|
||||
|
Note 2
1
|
Employee Benefit Plans
FS-48
|
||||
|
Note 2
2
|
Equity
FS-54
|
||||
|
Consolidated Financial Statements
|
Note 2
3
|
||||
|
Reports of Management
FS-20
|
Note 2
4
|
||||
|
Note 2
5
|
|||||
|
Note 2
6
|
Assets Held for Sale
FS-57
|
||||
|
Note 27
|
Earnings Per Share
FS-57
|
||||
FS-1
|
Management's Discussion and Analysis of
Financial Condition and Results of Operations
|
||
Key Financial Results
|
Millions of dollars, except per-share amounts
|
2013
|
|
2012
|
|
2011
|
|
||||||
|
Net Income Attributable to
|
||||||||||||
|
Chevron Corporation
|
$
|
21,423
|
|
$
|
26,179
|
|
$
|
26,895
|
|
|||
|
Per Share Amounts:
|
|
|
|
|||||||||
|
Net Income Attributable to
|
|
|
|
|||||||||
|
Chevron Corporation
|
|
|
|
|||||||||
|
– Basic
|
$
|
11.18
|
|
$
|
13.42
|
|
$
|
13.54
|
|
|||
|
– Diluted
|
$
|
11.09
|
|
$
|
13.32
|
|
$
|
13.44
|
|
|||
|
Dividends
|
$
|
3.90
|
|
$
|
3.51
|
|
$
|
3.09
|
|
|||
|
Sales and Other
|
|
|
|
|||||||||
|
Operating Revenues
|
$
|
220,156
|
|
$
|
230,590
|
|
$
|
244,371
|
|
|||
|
Return on:
|
|
|
|
|||||||||
|
Capital Employed
|
13.5
|
%
|
18.7
|
%
|
21.6
|
%
|
||||||
|
Stockholders’ Equity
|
15.0
|
%
|
20.3
|
%
|
23.8
|
%
|
||||||
|
Earnings by Major Operating Area
|
||||||||||||
|
Millions of dollars
|
2013
|
|
2012
|
|
2011
|
|
||||||
|
Upstream
|
||||||||||||
|
United States
|
$
|
4,044
|
|
$
|
5,332
|
|
$
|
6,512
|
|
|||
|
International
|
16,765
|
|
18,456
|
|
18,274
|
|
||||||
|
Total Upstream
|
20,809
|
|
23,788
|
|
24,786
|
|
||||||
|
Downstream
|
||||||||||||
|
United States
|
787
|
|
2,048
|
|
1,506
|
|
||||||
|
International
|
1,450
|
|
2,251
|
|
2,085
|
|
||||||
|
Total Downstream
|
2,237
|
|
4,299
|
|
3,591
|
|
||||||
|
All Other
|
(1,623
|
)
|
(1,908
|
)
|
(1,482
|
)
|
||||||
|
Net Income Attributable to
|
||||||||||||
|
Chevron Corporation
1,2
|
$
|
21,423
|
|
$
|
26,179
|
|
$
|
26,895
|
|
|||
|
1
Includes foreign currency effects:
|
$
|
474
|
|
$
|
(454
|
)
|
$
|
121
|
|
|||
|
2
Income net of tax, also referred to as “earnings” in the discussions that follow.
|
||||||||||||
Refer to the “Results of Operations” section beginning on page FS-6 for a discussion of financial results by major operating area for the three years ended
December 31, 2013
.
Business Environment and Outlook
Chevron is a global energy company with substantial business activities in the following countries: Angola, Argentina, Australia, Azerbaijan, Bangladesh, Brazil, Cambodia, Canada, Chad, China, Colombia, Democratic Republic of the Congo, Denmark, Indonesia, Kazakhstan, Myanmar, the Netherlands, Nigeria, Norway, the Partitioned Zone between Saudi Arabia and Kuwait, the Philippines, Republic of the Congo, Singapore, South Africa, South Korea, Thailand, Trinidad and Tobago, the United Kingdom, the United States, Venezuela, and Vietnam.
Earnings of the company depend mostly on the profitability of its upstream and downstream business segments. The biggest factor affecting the results of operations for the company is the price of crude oil. In the downstream business, crude oil is the largest cost component of refined products. Seasonality is not a primary driver of changes in the company’s quarterly earnings during the year.
To sustain its long-term competitive position in the upstream business, the company must develop and replenish an inventory of projects that offer attractive financial returns for the investment required. Identifying promising areas for exploration, acquiring the necessary rights to explore for and to produce crude oil and natural gas, drilling successfully, and handling the many technical and operational details in a safe and cost-effective manner are all important factors in this effort. Projects often require long lead times and large capital commitments.
The company’s operations, especially upstream, can also be affected by changing economic, regulatory and political environments in the various countries in which it operates, including the United States. From time to time, certain governments have sought to renegotiate contracts or impose additional costs on the company. Governments may attempt to do so in the future. Civil unrest, acts of violence or strained relations between a government and the company or other governments may impact the company’s operations or investments. Those developments have at times significantly affected the company’s operations and results and are carefully considered by management when evaluating the level of current and future activity in such countries.
The company continually evaluates opportunities to dispose of assets that are not expected to provide sufficient long-term value or to acquire assets or operations complementary to its asset base to help augment the company’s financial performance and growth. Refer to the “Results of Operations” section beginning on page FS-6 for discussions of net gains on asset sales during
2013
. Asset dispositions and restructurings may also occur in future periods and could result in significant gains or losses.
The company closely monitors developments in the financial and credit markets, the level of worldwide economic activity, and the implications for the company of movements in prices for crude oil and natural gas. Management takes these developments into account in the conduct of daily operations and for business planning.
Comments related to earnings trends for the company’s major business areas are as follows:
Upstream
Earnings for the upstream segment are closely aligned with industry prices for crude oil and natural gas. Crude oil and natural gas prices are subject to external factors over which the company has no control, including product demand connected with global economic conditions, industry inventory levels, production quotas imposed by the Organization of Petroleum Exporting Countries (OPEC), weather-related damage and disruptions, competing fuel prices, and regional supply interruptions or fears thereof that may be caused by military conflicts, civil unrest or political uncertainty. Any of these factors could also inhibit the
FS-2
company’s production capacity in an affected region. The company closely monitors developments in the countries in which it operates and holds investments, and seeks to manage risks in operating its facilities and businesses. The longer-term trend in earnings for the upstream segment is also a function of other factors, including the company’s ability to find or acquire and efficiently produce crude oil and natural gas, changes in fiscal terms of contracts, and changes in tax laws and regulations.
The company continues to actively manage its schedule of work, contracting, procurement and supply-chain activities to effectively manage costs. However, price levels for capital and exploratory costs and operating expenses associated with the production of crude oil and natural gas can be subject to external factors beyond the company’s control. External factors include not only the general level of inflation, but also commodity prices and prices charged by the industry’s material and service providers, which can be affected by the volatility of the industry’s own supply-and-demand conditions for such materials and services. In recent years, Chevron and the oil and gas industry
generally experienced an increase in certain costs that
exceeded the general trend of inflation in many areas of the
world. Capital and exploratory expenditures and operating expenses can also be affected by damage to production facilities caused by severe weather or civil unrest.

|
The chart above shows the trend in benchmark prices for Brent crude oil, West Texas Intermediate (WTI) crude oil and U.S. Henry Hub natural gas. The Brent price averaged $109 per barrel for the full-year
2013
, compared to $112 in
2012
. As of mid-February
2014
, the Brent price was $109 per barrel. The majority of the company’s equity crude production is priced based on the Brent benchmark. The WTI price averaged $98 per barrel for the full-year
2013
, compared to $94 in
2012
. As of mid-February
2014
, the WTI price was $100 per barrel. WTI continued to trade at a discount to Brent in 2013 due to historically high inventories stemming from strong growth in domestic production and limitations on outbound pipeline capacity from the U.S. midcontinent. After narrowing during the first six months of 2013, the WTI discount slowly widened into
the fourth quarter as seasonal refinery turnarounds contributed to surplus supply conditions for WTI, while Brent prices were supported by supply disruptions due to international events.
A differential in crude oil prices exists between high-quality (high-gravity, low-sulfur) crudes and those of lower quality (low-gravity, high-sulfur). The amount of the differential in any period is associated with the supply of heavy crude versus the demand, which is a function of the capacity of refineries that are able to process this lower quality feedstock into light products (motor gasoline, jet fuel, aviation gasoline and diesel fuel). During
2013
, the differential between North American light and heavy crude oil remained below historical norms due to growth in U.S. light sweet crude production in the midcontinent region and pipeline capacity constraints at Cushing. Outside of North America, the light-heavy crude differential narrowed modestly in 2013 as supply disruptions in key producing countries tightened light sweet crude markets and additional heavy crude oil conversion capacity came online.
Chevron produces or shares in the production of heavy crude oil in California, Chad, Indonesia, the Partitioned Zone between Saudi Arabia and Kuwait, Venezuela and in certain fields in Angola, China and the United Kingdom sector of the North Sea. (See page FS-10 for the company’s average U.S. and international crude oil realizations.)
In contrast to price movements in the global market for crude oil, price changes for natural gas in many regional markets are more closely aligned with supply-and-demand conditions in those markets. In the United States, prices at Henry Hub averaged $3.70 per thousand cubic feet (MCF) during
2013
, compared with $2.71 during
2012
. As of mid-February
2014
, the Henry Hub spot price was $5.53 per

|
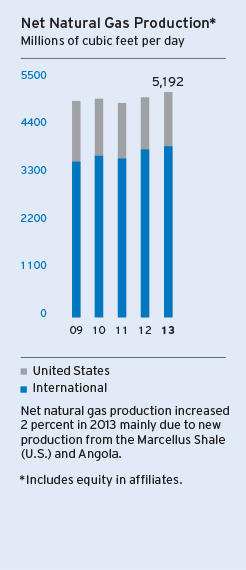
|
|
FS-3
|
Management's Discussion and Analysis of
Financial Condition and Results of Operations
|
||
MCF. Fluctuations in the price of natural gas in the United States are closely associated with customer demand relative to the volumes produced in North America.
Outside the United States, price changes for natural gas depend on a wide range of supply, demand and regulatory circumstances. In some locations, Chevron is investing in long-term projects to install infrastructure to produce and liquefy natural gas for transport by tanker to other markets. International natural gas realizations averaged about $5.91 per MCF during
2013
, compared with $5.99 per MCF during
2012
. (See page FS-10 for the company’s average natural gas realizations for the U.S. and international regions.)
The company’s worldwide net oil-equivalent production in
2013
averaged
2.597 million
barrels per day. About one-fifth of the company’s net oil-equivalent production in
2013
occurred in the OPEC-member countries of Angola, Nigeria, Venezuela and the Partitioned Zone between Saudi Arabia and Kuwait. OPEC quotas had no effect on the company’s net crude oil production in
2013
or
2012
. At their December 2013 meeting, members of OPEC supported maintaining the current production quota of 30 million barrels per day, which has been in effect since December 2008.
The company estimates that oil-equivalent production in
2014
will average approximately
2.610 million
barrels per day, based on an average Brent price of
$109
per barrel for the full-year
2013
. This estimate is subject to many factors and uncertainties, including quotas that may be imposed by OPEC; price effects on entitlement volumes; changes in fiscal terms or restrictions on the scope of company operations; delays in construction, start-up or ramp-up of projects; fluctuations in demand for natural gas in various markets; weather conditions that may shut in production; civil unrest; changing geopolitics; delays in completion of maintenance turnarounds; greater-than-expected declines in production from mature fields; or other disruptions to operations. The outlook for future production levels is also affected by the size and number of economic investment opportunities and, for new, large-scale projects, the time lag between initial exploration and the beginning of production. Investments in upstream projects generally begin well in advance of the start of the associated crude oil and natural gas production. A significant majority of Chevron’s upstream investment is made outside the United States.

|

|
Refer to the “Results of Operations” section on pages FS-6 through FS-8 for additional discussion of the company’s upstream business.
Refer to Table V beginning on page FS-64 for a tabulation of the company’s proved net oil and gas reserves by geographic area, at the beginning of
2011
and each year-end from
2011
through
2013
, and an accompanying discussion of major changes to proved reserves by geographic area for the three-year period ending
December 31, 2013
.
On November 7, 2011, while drilling a development well in the deepwater Frade Field about 75 miles offshore Brazil, an unanticipated pressure spike caused oil to migrate from the well bore through a series of fissures to the sea floor, emitting approximately 2,400 barrels of oil. The source of the seep was substantially contained within four days and the well was plugged and abandoned. On March 14, 2012, the company identified a small, second seep in a different part of the field. No evidence of any coastal or wildlife impacts
FS-4
related to these seeps have emerged. A Brazilian federal district prosecutor filed two civil lawsuits seeking $10.7 billion in damages for each of the two seeps. On October 1, 2013, the Court dismissed the two civil lawsuits and approved a settlement under which Chevron and its consortium partners agreed to spend approximately $43 million on social and environmental programs. On November 11, 2013, the Court announced that the settlement is final. The federal district prosecutor also filed criminal charges against Chevron and eleven Chevron employees. On February 19, 2013, the court dismissed the criminal matter, and on appeal, the appellate court reinstated two of the ten allegations, specifically those charges alleging environmental damage and failure to provide timely notification to authorities. The company is assessing its legal options. The company’s ultimate exposure related to the incident is not currently determinable, but could be significant to net income in any one period.
Downstream
Earnings for the downstream segment are closely tied to margins on the refining, manufacturing and marketing of products that include gasoline, diesel, jet fuel, lubricants, fuel oil, fuel and lubricant additives, and petrochemicals. Industry margins are sometimes volatile and can be affected by the global and regional supply-and-demand balance for refined products and petrochemicals and by changes in the price of crude oil, other refinery and petrochemical feedstocks, and natural gas. Industry margins can also be influenced by inventory levels, geopolitical events, costs of materials and services, refinery or chemical plant capacity utilization, maintenance programs, and disruptions at refineries or chemical plants resulting from unplanned outages due to severe weather, fires or other operational events.
Other factors affecting profitability for downstream operations include the reliability and efficiency of the company’s refining, marketing and petrochemical assets, the effectiveness of its crude oil and product supply functions, and the volatility of tanker-charter rates for the company’s shipping operations, which are driven by the industry’s demand for crude oil and product tankers. Other factors beyond the company’s control include the general level of inflation and energy costs to operate the company’s refining, marketing and petrochemical assets.
The company’s most significant marketing areas are the West Coast of North America, the U.S. Gulf Coast, Asia and southern Africa. Chevron operates or has significant ownership interests in refineries in each of these areas.
Refer to the “Results of Operations” section on pages FS-6 through FS-8 for additional discussion of the company’s downstream operations.
All Other
consists of mining operations, power and energy services, worldwide cash management and debt financing activities, corporate administrative functions, insurance operations, real estate activities, alternative fuels, and technology companies.
Operating Developments
Key operating developments and other events during
2013
and early
2014
included the following:
Upstream
Angola
First shipment of liquefied natural gas was made from the Angola LNG project.
Argentina
Signed agreements advancing the Loma Compana Project to develop the Vaca Muerta Shale.
Australia
Signed binding long-term LNG Sales and Purchase Agreements with two Asian customers. Binding long-term agreements now cover approximately 85 percent of Chevron’s equity LNG offtake from the Wheatstone Project.
Announced two natural gas discoveries in the Carnarvon Basin. These include discoveries at the 50 percent-owned and operated Kentish Knock South prospect in Block WA-365-P and
the 50 percent-owned and operated Elfin prospect in Block
WA-268-P.
Reached agreement to acquire interests in two onshore natural gas blocks in the Cooper Basin region of central Australia.
Acquired exploration interests in two blocks located in the deepwater Bight Basin offshore South Australia.
Brazil
C
onfirmed the start of crude oil production from the Papa-Terra Field.
Awarded participation in a deepwater block in the Ceará Basin.
Canada
Announced an agreement to acquire additional, complementary acreage in the Duvernay Shale.
Announced the successful conclusion of the initial twelve-well exploration drilling program in the liquids-rich portion of the Duvernay Shale located in western Canada.
Kurdistan Region of Iraq
Announced the acquisition of an 80 percent interest and operatorship of the Qara Dagh Block.
Republic of the Congo
Announced the final investment decision on the deepwater Moho Nord Project.
United States
Announced a joint development agreement for additional Delaware Basin acreage and access to related infrastructure.
Announced a crude oil discovery at the Coronado prospect in the deepwater Gulf of Mexico.
Announced a successful production test of a St. Malo well in the deepwater Gulf of Mexico.
FS-5
|
Management's Discussion and Analysis of
Financial Condition and Results of Operations
|
||
Downstream
South Korea
The company's 50 percent-owned GS Caltex affiliate started commercial operations of its gas oil fluid catalytic cracking unit at the Yeosu Refinery.
United States
The company's 50 percent-owned Chevron Phillips Chemical Company LLC (CPChem) announced a final investment decision on its U.S. Gulf Coast Petrochemicals Project. This project will include an ethane cracker with an annual design capacity of 1.5 million metric tons per year and two polyethylene facilities, each with an annual design capacity of 500,000 metric tons per year.
CPChem announced plans to expand annual ethylene production by 200 million pounds at its Sweeny complex in Old Ocean, Texas.
Other
Common Stock Dividends
The quarterly common stock dividend was increased by 11.1 percent in April 2013 to $1.00 per common share, making
2013
the 26th consecutive year that the company increased its annual dividend payment.
Common Stock Repurchase Program
The company purchased $5.0 billion of its common stock in
2013
under its share repurchase program. The program began in 2010 and has no set term or monetary limits.
Results of Operations
Major Operating Areas
The following section presents the results of operations and variances on an after-tax basis for the company’s business segments – Upstream and Downstream – as well as for “All Other.” Earnings are also presented for the U.S. and international geographic areas of the Upstream and Downstream business segments. Refer to Note 11, beginning on page FS-35, for a discussion of the company’s “reportable segments.” This section should also be read in conjunction with the discussion in “Business Environment and Outlook” on pages FS-2 through FS-5.
U.S. Upstream
|
Millions of dollars
|
2013
|
|
2012
|
|
2011
|
|
||||||
|
Earnings
|
$
|
4,044
|
|
$
|
5,332
|
|
$
|
6,512
|
|
|||
U.S. upstream earnings of
$4.0 billion
in
2013
decreased
$1.3 billion
from
2012
, primarily due to higher operating, depreciation and exploration expenses of $420 million, $350 million, and $190 million, respectively, and lower crude oil production of $170 million. Higher natural gas realizations of approximately $200 million were mostly offset by lower crude oil realizations of $170 million.
U.S. upstream earnings of
$5.3 billion
in
2012
decreased
$1.2 billion
from
2011
, primarily due to lower natural gas and crude oil realizations of $340 million and $200 million, respectively, lower crude oil production of $240 million, and lower gains on asset sales of $180 million.
The company’s average realization for U.S. crude oil and natural gas liquids in
2013
was
$93.46
per barrel, compared with
$95.21
in
2012
and
$97.51
in
2011
. The average natural gas realization was
$3.37
per thousand cubic feet in
2013
, compared with
$2.64
and
$4.04
in
2012
and
2011
, respectively.
Net oil-equivalent production in
2013
averaged
657,000
barrels per day, essentially unchanged from
2012
and down
3 percent
from
2011
. Between
2013
and
2012
, new production in the Marcellus Shale in western Pennsylvania and the Delaware Basin in New Mexico, along with the absence of weather-related downtime in the Gulf of Mexico, was largely offset by normal field declines. The decrease in production between
2012
and
2011
was associated with normal field declines and an absence of volumes associated with Cook Inlet, Alaska, assets sold in 2011. Partially offsetting this decrease was a ramp-up of projects in the Gulf of Mexico and Marcellus Shale and improved operational performance in the Gulf of Mexico. The net liquids component of oil-equivalent production for
2013
averaged
449,000
barrels per day, down
1 percent
from
2012
and
3 percent
from
2011
. Net natural gas production averaged about
1.2 billion
cubic feet per day in
2013
, up approximately
4 percent
from
2012
and down about
3 percent
from
2011
. Refer to the “Selected Operating Data” table on page FS-10 for a three-year comparative of production volumes in the United States.
FS-6
International Upstream
|
Millions of dollars
|
2013
|
|
2012
|
|
2011
|
|
||||||
|
Earnings*
|
$
|
16,765
|
|
$
|
18,456
|
|
$
|
18,274
|
|
|||
|
*Includes foreign currency effects:
|
$
|
559
|
|
$
|
(275
|
)
|
$
|
211
|
|
|||
International upstream earnings were
$16.8 billion
in
2013
compared with
$18.5 billion
in
2012
. The decrease was
mainly due to the absence of 2012 gains of approximately
$1.4 billion on an asset exchange in Australia and $600
million on the sale of an equity interest in the Wheatstone
Project, lower crude oil prices of $500 million, and higher operating expense of $400 million. Partially offsetting these effects were lower income tax expenses of $430 million. Foreign currency effects increased earnings by
$559 million
in
2013
, compared with a decrease of
$275 million
a year earlier.
International upstream earnings were
$18.5 billion
in
2012
compared with
$18.3 billion
in
2011
. The increase was mainly due to the gain of approximately $1.4 billion on an asset exchange in Australia, higher natural gas realizations of about $610 million and the nearly $600 million gain on sale of an equity interest in the Wheatstone Project. Mostly offsetting these effects were lower crude oil volumes of about $1.3 billion and higher exploration expenses of about $430 million. Foreign currency effects decreased earnings by
$275 million
in
2012
, compared with an increase of
$211 million
a year earlier.
The company’s average realization for international crude oil and natural gas liquids in
2013
was
$100.26
per barrel, compared with
$101.88
in
2012
and
$101.53
in
2011
. The average natural gas realization was
$5.91
per thousand cubic feet in
2013
, compared with
$5.99
and
$5.39
in
2012
and
2011
, respectively.

|

|
International net oil-equivalent production of
1.94 million
barrels per day in
2013
decreased
1 percent
from
2012
and decreased about
3 percent
from
2011
. Project ramp-ups in Nigeria and Angola in 2013 were more than offset by normal field declines. The decline between
2012
and
2011
was a result of new production in Thailand and Nigeria in
2012
being more than offset by normal field declines, the shut-in of the Frade Field in Brazil and a major planned turnaround at Tengizchevroil.
The net liquids component of international oil-equivalent production was
1.3 million
barrels per day in
2013
, a decrease of approximately
2 percent
from
2012
and a decrease of approximately
7 percent
from
2011
. International net natural gas production of
3.9 billion
cubic feet per day in
2013
was up
2 percent
from
2012
and up
8 percent
from
2011
.
Refer to the “Selected Operating Data” table, on page FS-10, for a three-year comparative of international production volumes.
U.S. Downstream
|
Millions of dollars
|
2013
|
|
2012
|
|
2011
|
|
||||||
|
Earnings
|
$
|
787
|
|
$
|
2,048
|
|
$
|
1,506
|
|
|||
U.S. downstream operations earned
$787 million
in
2013
, compared with
$2.0 billion
in
2012
. The decrease was mainly due to lower margins on refined product sales of $860 million and higher operating expenses of $600 million reflecting repair and maintenance activities at the company's refineries. The decrease was partially offset by higher earnings of $150 million from the 50 percent-owned CPChem.
U.S. downstream operations earned
$2.0 billion
in
2012
, compared with
$1.5 billion
in
2011
. The increase was mainly due to higher margins on refined products sales of $520 and higher earnings of $140 from CPChem. These benefits were partly offset by higher operating expenses of $130 million.
FS-7
|
Management's Discussion and Analysis of
Financial Condition and Results of Operations
|
||
Refined product sales of
1.18 million
barrels per day in
2013
declined
2 percent
, mainly reflecting lower gas oil, kerosene and gasoline sales. Sales volumes of refined products were
1.21 million
barrels per day in
2012
, a decrease of 4 percent from
2011
, mainly reflecting lower gasoline and fuel oil sales. U.S. branded gasoline sales of 517,000 barrels per day in
2013
were essentially unchanged from 2012 and
2011
.
Refer to the “Selected Operating Data” table on page FS-10 for a three-year comparison of sales volumes of gasoline and other refined products and refinery input volumes.
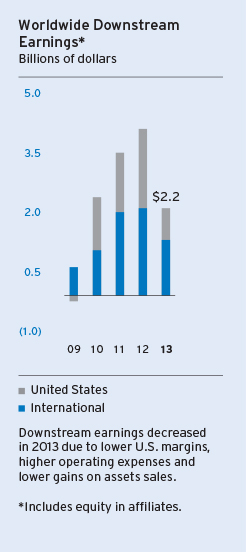
|
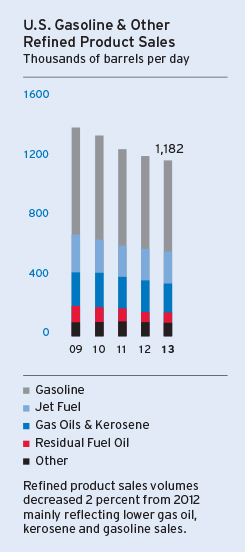
|
International Downstream
|
Millions of dollars
|
2013
|
|
2012
|
|
2011
|
|
||||||
|
Earnings*
|
$
|
1,450
|
|
$
|
2,251
|
|
$
|
2,085
|
|
|||
|
*Includes foreign currency effects:
|
$
|
(76
|
)
|
$
|
(173
|
)
|
$
|
(65
|
)
|
|||
International downstream earned
$1.5 billion
in
2013
, compared with
$2.3 billion
in
2012
. Earnings decreased due to lower gains on asset sales of $540 million and higher income tax expenses of $110 million. Foreign currency effects decreased earnings by
$76 million
in
2013
, compared to
$173 million
a year earlier.
International downstream earned
2.3 billion
in
2012
, compared with
$2.1 billion
in
2011
. Earnings increased due to a favorable change in effects on derivative instruments of $190 million and higher margins on refined product sales of $100 million. Foreign currency effects decreased earnings by
$173 million
in
2012
, compared with a decrease of
$65 million
a year earlier.
|
Total refined product sales of
1.53
million barrels per day in 2013 declined 2 percent from 2012, mainly reflecting lower fuel oil and gasoline sales. Sales of 1.55 million barrels per day in 2012 declined 8 percent from 2011, primarily related to the third quarter 2011 sale of the company’s refining and marketing assets in the United Kingdom and Ireland. Excluding the impact of 2011 asset sales, sales volumes were flat between the comparative periods.
|

|
Refer to the “Selected Operating Data” table, on page FS-10, for a three-year comparison of sales volumes of gasoline and other refined products and refinery input volumes.
All Other
|
Millions of dollars
|
2013
|
|
2012
|
|
2011
|
|
||||||
|
Net charges*
|
$
|
(1,623
|
)
|
$
|
(1,908
|
)
|
$
|
(1,482
|
)
|
|||
|
*Includes foreign currency effects:
|
$
|
(9
|
)
|
$
|
(6
|
)
|
$
|
(25
|
)
|
|||
All Other includes mining operations, power and energy services, worldwide cash management and debt financing activities, corporate administrative functions, insurance operations, real estate activities, alternative fuels, and technology companies.
Net charges in
2013
decreased
$285 million
from
2012
, mainly due to lower corporate tax items and other corporate charges.
Net charges in
2012
increased
$426 million
from
2011
, mainly due to higher environmental reserves additions, corporate tax items and other corporate charges, partially offset by lower employee compensation and benefits expenses.
FS-8
Comparative amounts for certain income statement categories are shown below:
|
Millions of dollars
|
2013
|
|
2012
|
|
2011
|
|
||||||
|
Sales and other operating revenues
|
$
|
220,156
|
|
$
|
230,590
|
|
$
|
244,371
|
|
|||
Sales and other operating revenues decreased in
2013
mainly due to lower refined product prices and lower crude oil volumes and prices. The decrease between 2012 and 2011 was mainly due to the 2011 sale of the company’s refining and marketing assets in the United Kingdom and Ireland, and lower crude oil volumes.
|
Millions of dollars
|
2013
|
|
2012
|
|
2011
|
|
||||||
|
Income from equity affiliates
|
$
|
7,527
|
|
$
|
6,889
|
|
$
|
7,363
|
|
|||
Income from equity affiliates increased in
2013
from
2012
mainly due to higher upstream-related earnings from Tengizchevroil in Kazakhstan and Petropiar in Venezuela, and higher earnings from CPChem, partially offset by 2013 impairments of power-related affiliates.
Income from equity affiliates decreased in
2012
from
2011
mainly due to lower upstream-related earnings from Tengizchevroil in Kazakhstan as a result of lower crude oil production, and higher operating expenses at Angola LNG Limited and Petropiar in Venezuela. Downstream-related earnings were higher between comparative periods, primarily due to higher margins at CPChem.
Refer to Note 12, beginning on page FS-37, for a discussion of Chevron’s investments in affiliated companies.
|
Millions of dollars
|
2013
|
|
2012
|
|
2011
|
|
||||||
|
Other income
|
$
|
1,165
|
|
$
|
4,430
|
|
$
|
1,972
|
|
|||
Other income of
$1.2 billion
in
2013
included net gains from asset sales of $710 million before-tax. Other income in
2012
and
2011
included net gains from asset sales of $4.2 billion and $1.5 billion before-tax, respectively. Interest income was approximately $136 million in
2013
, $166 million in
2012
and $145 million in
2011
. Foreign currency effects increased other income by $103 million in
2013
, while decreasing other income by $207 million in
2012
and increasing other income by $103 million in
2011
.
|
Millions of dollars
|
2013
|
|
2012
|
|
2011
|
|
||||||
|
Purchased crude oil and products
|
$
|
134,696
|
|
$
|
140,766
|
|
$
|
149,923
|
|
|||
Crude oil and product purchases of
$134.7 billion
were down in
2013
mainly due to lower prices for refined products and lower volumes for crude oil, partially offset by higher refined product volumes. Crude oil and product purchases in
2012
decreased by $9.2 billion from the prior year mainly due to the 2011 sale of the company’s refining and marketing assets in the United Kingdom and Ireland and lower natural gas prices.
|
Millions of dollars
|
2013
|
|
2012
|
|
2011
|
|
||||||
|
Operating, selling, general and
administrative expenses
|
$
|
29,137
|
|
$
|
27,294
|
|
$
|
26,394
|
|
|||
Operating, selling, general and administrative expenses increased
$1.8 billion
between
2013
and
2012
due to higher employee compensation and benefits costs
of $720 million, construction and
maintenance expenses of $590 million, and professional services costs
of $500 million.
Operating, selling, general and administrative expenses increased
$900 million
between
2012
and
2011
mainly due to higher contract labor and professional services of $590 million, and higher employee compensation and benefits of $280 million.
|
Millions of dollars
|
2013
|
|
2012
|
|
2011
|
|
||||||
|
Exploration expense
|
$
|
1,861
|
|
$
|
1,728
|
|
$
|
1,216
|
|
|||
Exploration expenses in
2013
increased from
2012
mainly due to higher charges for well write-offs.
Exploration expenses in
2012
increased from
2011
mainly due to higher geological and geophysical costs and well write-offs.
|
Millions of dollars
|
2013
|
|
2012
|
|
2011
|
|
||||||
|
Depreciation, depletion and
amortization
|
$
|
14,186
|
|
$
|
13,413
|
|
$
|
12,911
|
|
|||
The increase in
2013
from
2012
was mainly due to higher depreciation rates for certain oil and gas producing fields, higher upstream impairments and higher accretion expense, partially offset by lower production levels. The increase in
2012
from
2011
was mainly due to higher depreciation rates for certain oil and gas producing fields, partially offset by lower production levels.
|
Millions of dollars
|
2013
|
|
2012
|
|
2011
|
|
||||||
|
Taxes other than on income
|
$
|
13,063
|
|
$
|
12,376
|
|
$
|
15,628
|
|
|||
Taxes other than on income increased in
2013
from
2012
mainly due to the consolidation of the 64 percent-owned Star Petroleum Refining Company, beginning June 2012, and higher consumer excise taxes in the United States. Taxes other than on income decreased in
2012
from
2011
primarily due to lower import duties in the United Kingdom reflecting the sale of the company’s refining and marketing assets in the United Kingdom and Ireland in 2011. Partially offsetting the decrease were excise taxes associated with consolidation of Star Petroleum Refining Company beginning June 2012.
FS-9
|
Management's Discussion and Analysis of
Financial Condition and Results of Operations
|
||
|
Millions of dollars
|
2013
|
|
2012
|
|
2011
|
|
||||||
|
Income tax expense
|
$
|
14,308
|
|
$
|
19,996
|
|
$
|
20,626
|
|
|||
Effective income tax rates were
40 percent
in
2013
,
43 percent
in
2012
and
43 percent
in
2011
. The decrease in the effective tax rate between
2013
and
2012
was primarily due to a lower effective tax rate in international upstream operations. The lower international upstream effective tax rate was driven by a greater portion of equity income in 2013 than in 2012 (equity income is included as part of before-tax income and is generally recorded net of income taxes) and foreign currency remeasurement impacts.
The rate was unchanged between
2012
and
2011
. The impact of lower effective tax rates in international upstream operations was offset by foreign currency remeasurement impacts between periods. For international upstream, the lower effective tax rates in the
2012
period were driven primarily by the effects of asset sales, one-time tax benefits and reduced withholding taxes, which were partially offset by a lower utilization of tax credits during the year.
Selected Operating Data
1,2
|
2013
|
|
2012
|
|
2011
|
|
|||||||
|
U.S. Upstream
|
||||||||||||
|
Net Crude Oil and Natural Gas
|
||||||||||||
|
Liquids Production (MBPD)
|
449
|
|
455
|
|
465
|
|
||||||
|
Net Natural Gas Production (MMCFPD)
3
|
1,246
|
|
1,203
|
|
1,279
|
|
||||||
|
Net Oil-Equivalent Production (MBOEPD)
|
657
|
|
655
|
|
678
|
|
||||||
|
Sales of Natural Gas (MMCFPD)
|
5,483
|
|
5,470
|
|
5,836
|
|
||||||
|
Sales of Natural Gas Liquids (MBPD)
|
17
|
|
16
|
|
15
|
|
||||||
|
Revenues From Net Production
|
|
|||||||||||
|
Liquids ($/Bbl)
|
$
|
93.46
|
|
$
|
95.21
|
|
$
|
97.51
|
|
|||
|
Natural Gas ($/MCF)
|
$
|
3.37
|
|
$
|
2.64
|
|
$
|
4.04
|
|
|||
|
International Upstream
|
||||||||||||
|
Net Crude Oil and Natural Gas
|
||||||||||||
|
Liquids Production (MBPD)
4
|
1,282
|
|
1,309
|
|
1,384
|
|
||||||
|
Net Natural Gas Production (MMCFPD)
3
|
3,946
|
|
3,871
|
|
3,662
|
|
||||||
|
Net Oil-Equivalent Production (MBOEPD)
|
||||||||||||
|
Production (MBOEPD)
4
|
1,940
|
|
1,955
|
|
1,995
|
|
||||||
|
Sales of Natural Gas (MMCFPD)
|
4,251
|
|
4,315
|
|
4,361
|
|
||||||
|
Sales of Natural Gas Liquids (MBPD)
|
26
|
|
24
|
|
24
|
|
||||||
|
Revenues From Liftings
|
||||||||||||
|
Liquids ($/Bbl)
|
$
|
100.26
|
|
$
|
101.88
|
|
$
|
101.53
|
|
|||
|
Natural Gas ($/MCF)
|
$
|
5.91
|
|
$
|
5.99
|
|
$
|
5.39
|
|
|||
|
Worldwide Upstream
|
||||||||||||
|
Net Oil-Equivalent Production (MBOEPD)
4
|
||||||||||||
|
United States
|
657
|
|
655
|
|
678
|
|
||||||
|
International
|
1,940
|
|
1,955
|
|
1,995
|
|
||||||
|
Total
|
2,597
|
|
2,610
|
|
2,673
|
|
||||||
|
U.S. Downstream
|
||||||||||||
|
Gasoline Sales (MBPD)
5
|
613
|
|
624
|
|
649
|
|
||||||
|
Other Refined Product Sales (MBPD)
|
569
|
|
587
|
|
608
|
|
||||||
|
Total Refined Product Sales (MBPD)
|
1,182
|
|
1,211
|
|
1,257
|
|
||||||
|
Sales of Natural Gas Liquids (MBPD)
|
125
|
|
141
|
|
146
|
|
||||||
|
Refinery Input (MBPD)
|
774
|
|
833
|
|
854
|
|
||||||
|
International Downstream
|
||||||||||||
|
Gasoline Sales (MBPD)
5
|
398
|
|
412
|
|
447
|
|
||||||
|
Other Refined Product Sales (MBPD)
|
1,131
|
|
1,142
|
|
1,245
|
|
||||||
|
Total Refined Product Sales (MBPD)
6
|
1,529
|
|
1,554
|
|
1,692
|
|
||||||
|
Sales of Natural Gas Liquids (MBPD)
|
62
|
|
64
|
|
63
|
|
||||||
|
Refinery Input (MBPD)
7
|
864
|
|
869
|
|
933
|
|
||||||
|
1
|
Includes company share of equity affiliates.
|
||||||||
|
2
|
MBPD – thousands of barrels per day; MMCFPD – millions of cubic feet per day; MBOEPD – thousands of barrels of oil-equivalents per day; Bbl – Barrel; MCF - Thousands of cubic feet. Oil-equivalent gas (OEG) conversion ratio is 6,000 cubic feet of natural gas = 1 barrel of oil.
|
||||||||
|
3
|
Includes natural gas consumed in operations (MMCFPD):
|
||||||||
|
United States
8
|
72
|
|
65
|
|
69
|
|
|||
|
International
8
|
452
|
|
457
|
|
447
|
|
|||
|
4
|
Includes: Canada – synthetic oil
|
43
|
|
43
|
|
40
|
|
||
|
Venezuela affiliate – synthetic oil
|
25
|
|
17
|
|
32
|
|
|||
|
5
|
Includes branded and unbranded gasoline.
|
||||||||
|
6
|
Includes sales of affiliates (MBPD):
|
471
|
|
522
|
|
556
|
|
||
|
7
|
As of June 2012, Star Petroleum Refining Company crude-input volumes are reported on a 100 percent consolidated basis. Prior to June 2012, crude-input volumes reflect a 64 percent equity interest.
|
||||||||
|
8
|
2012 and 2011 conform to 2013 presentation.
|
||||||||
FS-10
Liquidity and Capital Resources
Cash, Cash Equivalents, Time Deposits and Marketable Securities
Total balances were
$16.5 billion
and
$21.9 billion
at
December 31, 2013
and
2012
, respectively. Cash provided by operating activities in
2013
was
$35.0 billion
, compared with
$38.8 billion
in
2012
and $41.1 billion in
2011
. Cash provided by operating activities was net of contributions to employee pension plans of approximately $1.2 billion, $1.2 billion and $1.5 billion in
2013
,
2012
and
2011
, respectively. Cash provided by investing activities included proceeds and deposits related to asset sales of $1.1 billion in
2013
, $2.8 billion in
2012
, and $3.5 billion in
2011
.
Restricted cash of
$1.2 billion
and
$1.5 billion
at
December 31, 2013
and
2012
, respectively, was held in cash and short-term marketable securities and recorded as “Deferred charges and other assets” on the Consolidated Balance Sheet. These amounts are generally associated with tax payments, upstream abandonment activities, funds held in escrow for asset acquisitions and capital investment projects.
Dividends
Dividends paid to common stockholders were
$7.5
billion in
2013
,
$6.8
billion in
2012
and $6.1 billion in
2011
. In April 2013, the company increased its quarterly dividend by 11.1 percent to $1.00 per common share.
The
$8.2
billion
increase
in total debt and capital lease obligations during
2013
included a $6 billion bond issuance in June 2013, timed in part to take advantage of historically low interest rates. The company’s debt and capital lease obligations due within one year, consisting primarily of commercial paper, redeemable long-term obligations and the current portion of long-term debt, totaled $8.4 billion at
December 31, 2013
, compared with $6.0 billion at year-end
2012
. Of these amounts, $8.0 billion and $5.9 billion were reclassified to long-term at the end of each period, respectively. At year-end
2013
, settlement of these obligations was not expected to require the use of working capital in
2014
, as the company had the intent and the ability, as evidenced by committed credit facilities, to refinance them on a long-term basis.
Chevron has an automatic shelf registration statement that expires in November 2015 for an unspecified amount of nonconvertible debt securities issued or guaranteed by the company.
The major debt rating agencies routinely evaluate the company’s debt, and the company’s cost of borrowing can increase or decrease depending on these debt ratings. The company has outstanding public bonds issued by Chevron Corporation and Texaco Capital Inc. All of these securities are the obligations of, or guaranteed by, Chevron Corporation and are rated AA by Standard & Poor’s Corporation and Aa1 by Moody’s Investors Service. The company’s U.S. commercial paper is rated A-1+ by Standard &
Poor’s and P-l by Moody’s. All of these ratings denote high-quality, investment-grade securities.
The company’s future debt level is dependent primarily on results of operations, the capital program and cash that
may be generated from asset dispositions. Based on its high-quality debt ratings, the company believes that it has substantial borrowing capacity to meet unanticipated cash requirements. The company also can modify capital spending plans during any extended periods of low prices for crude oil and natural gas and narrow margins for refined products and commodity chemicals to provide flexibility to continue paying the common stock dividend and maintain the company’s high-quality debt ratings.
Committed Credit Facilities
Information related to committed credit facilities is included in Note 16 to the Consolidated Financial Statements, Short-Term Debt, beginning on page FS-45.
Common Stock Repurchase Program
In July 2010, the Board of Directors approved an ongoing share repurchase program with no set term or monetary limits. The company expects to repurchase between $500 million and $2 billion of its common shares per quarter, at prevailing prices, as permitted by securities laws and other legal requirements and subject to market conditions and other factors. During
2013
, the company purchased
41.6
million common shares for
$5.0
billion. From the inception of the program through
2013
, the company had purchased
139.3
million shares for
$15.0
billion.
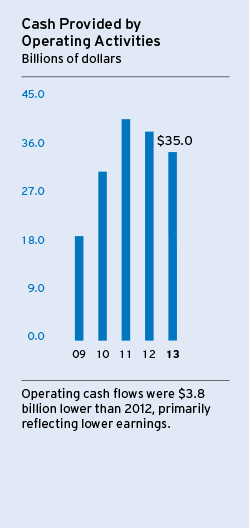
|

|
FS-11
|
Management's Discussion and Analysis of
Financial Condition and Results of Operations
|
||
Capital and Exploratory Expenditures
|
2013
|
2012
|
2011
|
|||||||||||||||||||||||||||||||||||
|
Millions of dollars
|
U.S.
|
|
Int’l.
|
|
Total
|
|
U.S.
|
|
Int’l.
|
|
Total
|
|
U.S.
|
|
Int’l.
|
|
Total
|
|
|||||||||||||||||||
|
Upstream
1
|
$
|
8,480
|
|
$
|
29,378
|
|
$
|
37,858
|
|
$
|
8,531
|
|
$
|
21,913
|
|
$
|
30,444
|
|
$
|
8,318
|
|
$
|
17,554
|
|
$
|
25,872
|
|
||||||||||
|
Downstream
|
1,986
|
|
1,189
|
|
3,175
|
|
1,913
|
|
1,259
|
|
3,172
|
|
1,461
|
|
1,150
|
|
2,611
|
|
|||||||||||||||||||
|
All Other
|
821
|
|
23
|
|
844
|
|
602
|
|
11
|
|
613
|
|
575
|
|
8
|
|
583
|
|
|||||||||||||||||||
|
Total
|
$
|
11,287
|
|
$
|
30,590
|
|
$
|
41,877
|
|
$
|
11,046
|
|
$
|
23,183
|
|
$
|
34,229
|
|
$
|
10,354
|
|
$
|
18,712
|
|
$
|
29,066
|
|
||||||||||
|
Total, Excluding Equity in Affiliates
|
$
|
10,562
|
|
$
|
28,617
|
|
$
|
39,179
|
|
$
|
10,738
|
|
$
|
21,374
|
|
$
|
32,112
|
|
$
|
10,077
|
|
$
|
17,294
|
|
$
|
27,371
|
|
||||||||||
1
Excludes the acquisition of Atlas Energy, Inc. in 2011.
Capital and Exploratory Expenditures
Total expenditures for
2013
were $
41.9
billion, including $
2.7
billion for the company’s share of equity-affiliate expenditures, which did not require cash outlays by the company. In
2012
and
2011
, expenditures were $
34.2
billion and $
29.1
billion, respectively, including the company’s share of affiliates’ expenditures of $
2.1
billion and $
1.7
billion, respectively.
Expenditures for 2013 include approximately $4 billion for major resource acquisitions in Argentina, Australia, the Permian Basin and the Kurdistan Region of Iraq, along with additional acreage in the Duvernay Shale and interests in the Kitimat LNG Project in Canada. In addition, work progressed on a number of major capital projects, particularly two Australian LNG projects and two deepwater Gulf of Mexico projects.
Of the $
41.9
billion of expenditures in
2013
,
90
percent, or $
37.9
billion, was related to upstream activities. Approximately,

|

|
89
percent was expended for upstream operations in
2012
and
2011
. International upstream accounted for
78
percent of the worldwide upstream investment in
2013
,
72
percent in
2012
and
68
percent in
2011
. These amounts exclude the acquisition of Atlas Energy, Inc. in 2011.
The company estimates that
2014
capital and exploratory expenditures will be $39.8 billion, including $4.8 billion of spending by affiliates. Approximately 90 percent of the total, or $35.8 billion, is budgeted for exploration and production activities. Approximately $27.9 billion, or 78 percent, of this amount is for projects outside the United States. Spending in
2014
is primarily focused on major development projects in Angola, Argentina, Australia, Canada, Kazakhstan, Nigeria, Republic of the Congo, Russia, the United Kingdom and the U.S. Also included is funding for enhancing recovery and mitigating natural field declines for currently-producing assets, and for focused exploration and appraisal activities.
Worldwide downstream spending in
2014
is estimated at $3.1 billion, with $1.8 billion for projects in the United States. Major capital outlays include projects under construction at refineries in the United States and expansion of additives production capacity in Singapore. Additional investments are expected to be funded by CPChem for chemicals projects in the United States.
Investments in technology companies, power and energy services, and other corporate businesses in
2014
are budgeted at $1 billion.
Noncontrolling Interests
The company had noncontrolling interests of
$1.3 billion
at both December 31,
2013
and
2012
. Distributions to noncontrolling interests totaled
$99 million
and
$41 million
in
2013
and
2012
, respectively.
Pension Obligations
Information related to pension plan contributions is included on page FS-53 in Note 21 to the Consolidated Financial Statements under the heading “Cash Contributions and Benefit Payments.”
FS-12
Financial Ratios
Financial Ratios
|
At December 31
|
|||||||||
|
2013
|
2012
|
2011
|
|||||||
|
Current Ratio
|
1.5
|
1.6
|
1.6
|
||||||
|
Interest Coverage Ratio
|
126.2
|
191.3
|
165.4
|
||||||
|
Debt Ratio
|
12.1
|
%
|
8.2
|
%
|
7.7
|
%
|
|||
Current Ratio
–
current assets divided by current liabilities, which indicates the company’s ability to repay its short-term liabilities with short-term assets. The current ratio in all periods was adversely affected by the fact that Chevron’s inventories are valued on a last-in, first-out basis. At year-end
2013
, the book value of inventory was lower than replacement costs, based on average acquisition costs during the year, by approximately $9.1 billion.
Interest Coverage Ratio
–
income before income tax expense, plus interest and debt expense and amortization of capitalized interest, less net income attributable to noncontrolling interests, divided by before-tax interest costs. This ratio indicates the company’s ability to pay interest on outstanding debt. The company’s interest coverage ratio in
2013
was lower than
2012
and
2011
due to lower income.
Debt Ratio
– total debt as a percentage of total debt plus Chevron Corporation Stockholders' Equity, which indicates the company’s leverage. The company's debt ratio in
2013
was higher than
2012
and
2011
due to higher debt, partially offset by a higher stockholders' equity balance.
Guarantees, Off-Balance-Sheet Arrangements and Contractual Obligations, and Other Contingencies
Direct Guarantees
|
Millions of dollars
|
Commitment Expiration by Period
|
||||||||
|
2015–
|
2017–
|
After
|
|||||||
|
Total
|
2014
|
2016
|
2018
|
2018
|
|||||
|
Guarantee of non- consolidated affiliate or joint-venture obligations
|
$524
|
$38
|
$76
|
$76
|
$334
|
||||
The company’s guarantee of
$524 million
is associated with certain payments under a terminal use agreement entered into by an equity affiliate. Over the approximate
14
-year remaining term of the guarantee, the maximum guarantee amount will be reduced as certain fees are paid by the affiliate. There are numerous cross-indemnity agreements with the affiliate and the other partners to permit recovery of amounts paid under the guarantee. Chevron has recorded no liability for its obligation under this guarantee.
Indemnifications
Information related to indemnifications is included on page FS-55 in Note 23 to the Consolidated Financial Statements under the heading “Indemnifications.”
Long-Term Unconditional Purchase Obligations and Commitments, Including Throughput and Take-or-Pay Agreements
The company and its subsidiaries have certain other contingent liabilities with respect to long-term unconditional purchase obligations and commitments, including throughput and take-or-pay agreements, some of which relate to suppliers’
financing arrangements. The agreements typically provide goods and services, such as pipeline and storage capacity, drilling rigs, utilities, and petroleum products, to be used or sold in the ordinary course of the company’s business. The aggregate approximate amounts of required payments under these various commitments are:
2014
– $4.2 billion;
2015
– $4.5 billion;
2016
– $3.2 billion;
2017
– $2.6 billion;
2018
– $2.2 billion; 2019 and after – $6.9 billion. A portion of these commitments may ultimately be shared with project partners. Total payments under the agreements were approximately $3.6 billion in
2013
, $3.6 billion in
2012
and $6.6 billion in
2011
.
The following table summarizes the company’s significant contractual obligations:
Contractual Obligations
1
|
Millions of dollars
|
Payments Due by Period
|
||||||||||||||||||
|
2015–
|
2017–
|
After
|
|
||||||||||||||||
|
Total
|
|
2014
|
|
2016
|
|
2018
|
|
2018
|
|
||||||||||
|
On Balance Sheet:
2
|
|||||||||||||||||||
|
Short-Term Debt
3
|
$
|
374
|
|
$
|
374
|
|
$
|
—
|
|
$
|
—
|
|
$
|
—
|
|
||||
|
Long-Term Debt
3
|
19,960
|
|
—
|
|
8,750
|
|
4,000
|
|
7,210
|
|
|||||||||
|
Noncancelable Capital Lease Obligations
|
177
|
|
45
|
|
52
|
|
34
|
|
46
|
|
|||||||||
|
Interest
|
2,611
|
|
335
|
|
659
|
|
606
|
|
1,011
|
|
|||||||||
|
Off Balance Sheet:
|
|||||||||||||||||||
|
Noncancelable Operating Lease Obligations
|
3,709
|
|
798
|
|
1,327
|
|
778
|
|
806
|
|
|||||||||
|
Throughput and Take-or-Pay Agreements
4
|
15,320
|
|
2,679
|
|
4,372
|
|
2,587
|
|
5,682
|
|
|||||||||
|
Other Unconditional Purchase Obligations
4
|
8,257
|
|
1,527
|
|
3,386
|
|
2,188
|
|
1,156
|
|
|||||||||
|
1
|
Excludes contributions for pensions and other postretirement benefit plans. Information on employee benefit plans is contained in Note 21 beginning on page FS-48.
|
|
2
|
Does not include amounts related to the company’s income tax liabilities associated with uncertain tax positions. The company is unable to make reasonable estimates of the periods in which these liabilities may become payable. The company does not expect settlement of such liabilities will have a material effect on its consolidated financial position or liquidity in any single period.
|
|
3
|
$8.0 billion of short-term debt that the company expects to refinance is included in long-term debt. The repayment schedule above reflects the projected repayment of the entire amounts in the
2015
–
2016
period.
|
|
4
|
Does not include commodity purchase obligations that are not fixed or determinable. These obligations are generally monetized in a relatively short period of time through sales transactions or similar agreements with third parties. Examples include obligations to purchase LNG, regasified natural gas and refinery products at indexed prices.
|
Financial and Derivative Instrument Market Risk
The market risk associated with the company’s portfolio of financial and derivative instruments is discussed on the next page. The estimates of financial exposure to market risk do not represent the company’s projection of future market changes. The actual impact of future market changes could differ materially due to factors discussed elsewhere in this report, including those set forth under the heading “Risk Factors” in Part I, Item 1A, of the company’s
2013
Annual Report on Form 10-K.
FS-13
|
Management's Discussion and Analysis of
Financial Condition and Results of Operations
|
||
Derivative Commodity Instruments
Chevron is exposed to market risks related to the price volatility of crude oil, refined products, natural gas, natural gas liquids, liquefied natural gas and refinery feedstocks. The company uses derivative commodity instruments to manage these exposures on a portion of its activity, including firm commitments and anticipated transactions for the purchase, sale and storage of crude oil, refined products, natural gas, natural gas liquids and feedstock for company refineries. The company also uses derivative commodity instruments for limited trading purposes. The results of these activities were not material to the company’s financial position, results of operations or cash flows in
2013
.
The company’s market exposure positions are monitored on a daily basis by an internal Risk Control group in accordance with the company’s risk management policies, which have been approved by the Audit Committee of the company’s Board of Directors.
Derivatives beyond those designated as normal purchase and normal sale contracts are recorded at fair value on the Consolidated Balance Sheet with resulting gains and losses reflected in income. Fair values are derived principally from published market quotes and other independent third-party quotes. The change in fair value of Chevron’s derivative commodity instruments in
2013
was not material to the company's results of operations.
The company uses the Monte Carlo simulation method with a 95 percent confidence level as its Value-at-Risk (VaR) model to estimate the maximum potential loss in fair value from the effect of adverse changes in market conditions on derivative commodity instruments held or issued. A one-day holding period is used on the assumption that market-risk positions can be liquidated or hedged within one day. Based on these inputs, the VaR for the company's primary risk exposures in the area of derivative commodity instruments at December 31,
2013
and
2012
was not material to the company's cash flows or results of operations.
Foreign Currency
The company may enter into foreign currency derivative contracts to manage some of its foreign currency exposures. These exposures include revenue and anticipated purchase transactions, including foreign currency capital expenditures and lease commitments. The foreign currency derivative contracts, if any, are recorded at fair value on the balance sheet with resulting gains and losses reflected in income. There were no open foreign currency derivative contracts at December 31,
2013
.
Interest Rates
The company may enter into interest rate swaps from time to time as part of its overall strategy to manage the interest rate risk on its debt. Interest rate swaps, if any, are recorded at fair value on the balance sheet with resulting gains and losses reflected in income. At year-end
2013
, the company had no interest rate swaps.
Transactions With Related Parties
Chevron enters into a number of business arrangements with related parties, principally its equity affiliates. These arrangements include long-term supply or offtake agreements and long-term purchase agreements. Refer to “Other Information” in Note 12 of the Consolidated Financial Statements, page FS-38, for further discussion. Management believes these agreements have been negotiated on terms consistent with those that would have been negotiated with an unrelated party.
Litigation and Other Contingencies
MTBE
Information related to methyl tertiary butyl ether (MTBE) matters is included on page FS-39 in Note 14 to the Consolidated Financial Statements under the heading “MTBE.”
Ecuador
Information related to Ecuador matters is included in Note 14 to the Consolidated Financial Statements under the heading “Ecuador,” beginning on page FS-39.
Environmental
The following table displays the annual changes to the company’s before-tax environmental remediation reserves, including those for federal Superfund sites and analogous sites under state laws.
|
Millions of dollars
|
2013
|
|
2012
|
|
2011
|
|
|||||
|
Balance at January 1
|
$
|
1,403
|
|
1,403.844
|
|
$
|
1,507
|
|
|||
|
Net Additions
|
488
|
|
428.475
|
|
343
|
|
|||||
|
Expenditures
|
(435
|
)
|
(429
|
)
|
(446
|
)
|
|||||
|
Balance at December 31
|
$
|
1,456
|
|
$
|
1,403
|
|
$
|
1,404
|
|
||
FS-14
The company records asset retirement obligations when there is a legal obligation associated with the retirement of long-lived assets and the liability can be reasonably estimated. These asset retirement obligations include costs related to environmental issues. The liability balance of approximately
$14.3 billion
for asset retirement obligations at year-end
2013
related primarily to upstream properties.
For the company’s other ongoing operating assets, such as refineries and chemicals facilities, no provisions are made for exit or cleanup costs that may be required when such assets reach the end of their useful lives unless a decision to sell or otherwise abandon the facility has been made, as the indeterminate settlement dates for the asset retirements prevent estimation of the fair value of the asset retirement obligation.
Refer to the discussion below for additional information on environmental matters and their impact on Chevron, and on the company's
2013
environmental expenditures. Refer to Note 23 on pages FS-55 through FS-56 for additional discussion of environmental remediation provisions and year-end reserves. Refer also to Note 24 on page FS-56 for additional discussion of the company's asset retirement obligations.
Suspended Wells
Information related to suspended wells is included in Note 19 to the Consolidated Financial Statements, Accounting for Suspended Exploratory Wells, beginning on page FS-46.
Income Taxes
Information related to income tax contingencies is included on pages FS-43 through FS-45 in Note 15 and pages FS-54 through FS-55 in Note 23 to the Consolidated Financial Statements under the heading “Income Taxes.”
Other Contingencies
Information related to other contingencies is included on page FS-56 in Note 23 to the Consolidated Financial Statements under the heading “Other Contingencies.”
Environmental Matters
Virtually all aspects of the businesses in which the company engages are subject to various international, federal, state and local environmental, health and safety laws, regulations and market-based programs. These regulatory requirements continue to increase in both number and complexity over time and govern not only the manner in which the company conducts its operations, but also the products it sells. Regulations intended to address concerns about greenhouse gas emissions and global climate change also continue to evolve and include those at the international or multinational (such as the mechanisms under the Kyoto Protocol and the European Union's Emissions Trading System), national (such as the U.S. Environmental Protection Agency's emission standards and renewable transportation fuel content requirements or domestic market-based programs such as those in effect in Australia and New Zealand), and state or regional (such as California's Global Warming Solutions Act) levels.
Most of the costs of complying with laws and regulations pertaining to company operations and products are embedded in the normal costs of doing business. It is not possible to predict with certainty the amount of additional investments in new or existing facilities or amounts of incremental operating costs to be incurred in the future to: prevent, control, reduce or eliminate releases of hazardous materials into the environment; comply with existing
and new environmental laws or regulations; or remediate and restore areas damaged by prior releases of hazardous materials. Although these costs may be significant to the results of operations in any single period, the company does not expect them to have a material effect on the company's liquidity or financial position.
Accidental leaks and spills requiring cleanup may occur in the ordinary course of business. In addition to the costs for environmental protection associated with its ongoing operations and products, the company may incur expenses for corrective actions at various owned and previously owned facilities and at third-party-owned waste disposal sites used by the company. An obligation may arise when operations are closed or sold or at non-Chevron sites where company products have been handled or disposed of. Most of the expenditures to fulfill these obligations relate to facilities and sites where past operations followed practices and procedures that were considered acceptable at the time but now require investigative or remedial work or both to meet current standards.
Using definitions and guidelines established by the American Petroleum Institute, Chevron estimated its worldwide environmental spending in
2013
at approximately $2.7 billion for its consolidated companies. Included in these expenditures were approximately $1.0 billion of environmental capital expenditures and $1.7 billion of costs associated with the prevention, control, abatement or elimination of hazardous substances and pollutants from operating, closed or divested sites, and the abandonment and restoration of sites.
For
2014
, total worldwide environmental capital expenditures are estimated at $1.1 billion. These capital costs are in addition to the ongoing costs of complying with environmental regulations and the costs to remediate previously contaminated sites.
Critical Accounting Estimates and Assumptions
Management makes many estimates and assumptions in the application of generally accepted accounting principles (GAAP) that may have a material impact on the company’s consolidated financial statements and related disclosures and on the comparability of such information over different reporting periods. All such estimates and assumptions affect reported amounts of assets, liabilities, revenues and expenses, as well as disclosures of contingent assets and liabilities. Estimates and assumptions are based on management’s experience and other information available prior to the issuance of the financial statements. Materially different results can occur as circumstances change and additional information becomes known.
FS-15
|
Management's Discussion and Analysis of
Financial Condition and Results of Operations
|
||
The discussion in this section of “critical” accounting estimates and assumptions is according to the disclosure guidelines of the Securities and Exchange Commission (SEC), wherein:
|
1.
|
the nature of the estimates and assumptions is material due to the levels of subjectivity and judgment necessary to account for highly uncertain matters or the susceptibility of such matters to change; and
|
|
2.
|
the impact of the estimates and assumptions on the company’s financial condition or operating performance is material.
|
The development and selection of accounting estimates and assumptions, including those deemed “critical,” and the associated disclosures in this discussion have been discussed by management with the Audit Committee of the Board of Directors. The areas of accounting and the associated “critical” estimates and assumptions made by the company are as follows:
Oil and Gas Reserves
Crude oil and natural gas reserves are estimates of future production that impact certain asset and expense accounts included in the Consolidated Financial Statements. Proved reserves are the estimated quantities of oil and gas that geoscience and engineering data demonstrate with reasonable certainty to be economically producible in the future under existing economic conditions, operating methods and government regulations. Proved reserves include both developed and undeveloped volumes. Proved developed reserves represent volumes expected to be recovered through existing wells with existing equipment and operating methods. Proved undeveloped reserves are volumes expected to be recovered from new wells on undrilled proved acreage, or from existing wells where a relatively major expenditure is required for recompletion. Variables impacting Chevron's estimated volumes of crude oil and natural gas reserves include field performance, available technology and economic conditions.
The estimates of crude oil and natural gas reserves are important to the timing of expense recognition for costs incurred and to the valuation of certain oil and gas producing assets. Impacts of oil and gas reserves on Chevron's Consolidated Financial Statements, using the successful efforts method of accounting, include the following:
|
1.
|
Amortization - Proved reserves are used in amortizing capitalized costs related to oil and gas producing activities on the unit-of-production (UOP) method. Capitalized exploratory drilling and development costs are depreciated on a UOP basis using proved developed reserves. Acquisition costs of proved properties are amortized on a UOP basis using total proved reserves. During
2013
, Chevron's UOP Depreciation, Depletion and Amortization (DD&A) for oil and gas properties was $11.6 billion, and proved developed reserves at the beginning of
2013
were 4.8 billion barrels. If the estimates of proved reserves used in the UOP calculations for consolidated operations had been lower by 5 percent across all oil and gas properties, UOP DD&A in
2013
would have increased by approximately
$600 million
.
|
|
2.
|
Impairment - Oil and gas reserves are used in assessing oil and gas producing properties for impairment. A significant reduction in the estimated reserves of a property would
|
trigger an impairment review. In assessing whether the property is impaired, the fair value of the property must be determined. Frequently, a discounted cash flow methodology is the best estimate of fair value. Proved reserves (and, in some cases, a portion of unproved resources) are used to estimate future production volumes in the cash flow model. For a further discussion of estimates and assumptions used in impairment assessments, see
Impairment of Properties, Plant and Equipment and Investments in Affiliates
below.
Refer to Table V, “Reserve Quantity Information,” beginning on page FS-64, for the changes in proved reserve estimates for the three years ending December 31,
2013
, and to Table VII, “Changes in the Standardized Measure of Discounted Future Net Cash Flows From Proved Reserves” on page FS-72 for estimates of proved reserve values for each of the three years ended December 31,
2013
.
This Oil and Gas Reserves commentary should be read in conjunction with the Properties, Plant and Equipment section of Note 1 to the Consolidated Financial Statements, beginning on page FS-27, which includes a description of the “successful efforts” method of accounting for oil and gas exploration and production activities.
Impairment of Properties, Plant and Equipment and Investments in Affiliates
The company assesses its properties, plant and equipment (PP&E) for possible impairment whenever events or changes in circumstances indicate that the carrying value of the assets may not be recoverable. If the carrying value of an asset exceeds the future undiscounted cash flows expected from the asset, an impairment charge is recorded for the excess of carrying value of the asset over its estimated fair value.
Determination as to whether and how much an asset is impaired involves management estimates on highly uncertain matters, such as future commodity prices, the effects of inflation and technology improvements on operating expenses, production profiles, and the outlook for global or regional market supply-and-demand conditions for crude oil, natural gas, commodity chemicals and refined products. However, the impairment reviews and calculations are based on
FS-16
assumptions that are consistent with the company’s business plans and long-term investment decisions. Refer also to the discussion of impairments of properties, plant and equipment in Note 9 beginning on page FS-33 and to the section on Properties, Plant and Equipment in Note 1, "Summary of Significant Accounting Policies," beginning on page FS-27.
No material individual impairments of PP&E or Investments were recorded for the three years ending December 31,
2013
. A sensitivity analysis of the impact on earnings for these periods if other assumptions had been used in impairment reviews and impairment calculations is not practicable, given the broad range of the company’s PP&E and the number of assumptions involved in the estimates. That is, favorable changes to some assumptions might have avoided the need to impair any assets in these periods, whereas unfavorable changes might have caused an additional unknown number of other assets to become impaired.
Investments in common stock of affiliates that are accounted for under the equity method, as well as investments in other securities of these equity investees, are reviewed for impairment when the fair value of the investment falls below the company’s carrying value. When such a decline is deemed to be other than temporary, an impairment charge is recorded to the income statement for the difference between the investment’s carrying value and its estimated fair value at the time.
In making the determination as to whether a decline is other than temporary, the company considers such factors as the duration and extent of the decline, the investee’s financial performance, and the company’s ability and intention to retain its investment for a period that will be sufficient to allow for any anticipated recovery in the investment’s market value. Differing assumptions could affect whether an investment is impaired in any period or the amount of the impairment, and are not subject to sensitivity analysis.
From time to time, the company performs impairment reviews and determines whether any write-down in the carrying value of an asset or asset group is required. For example, when significant downward revisions to crude oil and natural gas reserves are made for any single field or concession, an impairment review is performed to determine if the carrying value of the asset remains recoverable. Also, if the expectation of sale of a particular asset or asset group in any period has been deemed more likely than not, an impairment review is performed, and if the estimated net proceeds exceed the carrying value of the asset or asset group, no impairment charge is required. Such calculations are reviewed each period until the asset or asset group is disposed of. Assets that are not impaired on a held-and-used basis could possibly become impaired if a decision is made to sell such assets. That is, the assets would be impaired if they are classified as held-for-sale and the estimated proceeds from the sale, less costs to sell, are less than the assets’ associated carrying values.
Asset Retirement Obligations
In the determination of fair value for an asset retirement obligation (ARO), the company uses various assumptions and judgments, including such factors as the existence of a legal obligation, estimated amounts and timing of settlements, discount and inflation rates, and the expected impact of advances in technology and process improvements. A sensitivity analysis of the ARO impact on earnings for
2013
is not practicable, given the broad range of the company's long-lived assets and the
number of assumptions involved in the estimates. That is, favorable changes to some assumptions would have reduced estimated future obligations, thereby lowering accretion expense and amortization costs, whereas unfavorable changes would have the opposite effect. Refer to Note 24 on page FS-56 for additional discussions on asset retirement obligations.
Pension and Other Postretirement Benefit Plans
Note 21, beginning on page FS-48, includes information on the funded status of the company’s pension and other postretirement benefit (OPEB) plans reflected on the Consolidated Balance Sheet; the components of pension and OPEB expense reflected on the Consolidated Statement of Income; and the related underlying assumptions.
The determination of pension plan expense and obligations is based on a number of actuarial assumptions. Two critical assumptions are the expected long-term rate of return on plan assets and the discount rate applied to pension plan obligations. Critical assumptions in determining expense and obligations for OPEB plans, which provide for certain health care and life insurance benefits for qualifying retired employees and which are not funded, are the discount rate and the assumed health care cost-trend rates. Information related to the Company’s processes to develop these assumptions is included on page FS-48 in Note 21 under the relevant headings. Actual rates may vary significantly from estimates because of unanticipated changes in the world's financial markets.
For
2013
, the company used an expected long-term rate of return of
7.5
percent and a discount rate of
3.6
percent for U.S. pension plans. For the 10 years ending December 31,
2013
, actual asset returns averaged 6.4 percent for the plan. The actual return for
2013
was more than 7.5 percent and was associated with a continuing recovery in the financial markets during the year. Additionally, with the exception of two other years within this 10-year period, actual asset returns for this plan equaled or exceeded
7.5
percent.
Total pension expense for
2013
was
$1.3 billion
. An increase in the expected long-term return on plan assets or the discount rate would reduce pension plan expense, and vice versa. As an indication of the sensitivity of pension expense to the long-term rate of return assumption, a 1 percent increase in this assumption for the company’s primary U.S. pension plan, which accounted for about 59 percent of companywide pension expense, would have reduced total pension plan expense for
2013
by approximately $85 million. A 1 percent increase in the discount rate for this same plan would have reduced pension expense for
2013
by approximately $190 million.
The aggregate funded status recognized at December 31,
2013
, was a net liability of approximately
$2.4 billion
. An increase in the discount rate would decrease the pension obligation, thus changing the funded status of a plan. At December 31,
2013
, the company used a discount rate of
FS-17
|
Management's Discussion and Analysis of
Financial Condition and Results of Operations
|
||
4.3
percent to measure the obligations for the U.S. pension plans. As an indication of the sensitivity of pension liabilities to the discount rate assumption, a 0.25 percent increase in the discount rate applied to the company’s primary U.S. pension plan, which accounted for about 59 percent of the companywide pension obligation, would have reduced the plan obligation by approximately $345 million, which would have increased the plan’s overfunded status from approximately $0.4 billion to $0.7 billion.
For the company’s OPEB plans, expense for
2013
was
$218 million
, and the total liability, which reflected the unfunded status of the plans at the end of
2013
, was
$3.1 billion
. For the main U.S. OPEB plan, the company used a 3.9 percent discount rate to measure expense in
2013
, and a 4.7 percent discount rate to measure the benefit obligations at December 31,
2013
. Discount rate changes, similar to those used in the pension sensitivity analysis, resulted in an immaterial impact on
2013
OPEB expense and OPEB liabilities at the end of
2013
. For information on the sensitivity of the health care cost-trend rate, refer to FS-51 in Note 21 under the heading “Other Benefit Assumptions.”
Differences between the various assumptions used to determine expense and the funded status of each plan and actual experience are included in actuarial gain/loss. Refer to page FS-50 in Note 21 for a description of the method used to amortize the
$5.2 billion
of before-tax actuarial losses recorded by the company as of December 31,
2013
, and an estimate of the costs to be recognized in expense during
2014
. In addition, information related to company contributions is included on Page FS-53 in Note 21 under the heading “Cash Contributions and Benefit Payments.”
Contingent Losses
Management also makes judgments and estimates in recording liabilities for claims, litigation, tax matters and environmental remediation. Actual costs can frequently vary from estimates for a variety of reasons. For example, the costs for settlement of claims and litigation can vary from estimates based on differing interpretations of laws, opinions on culpability and assessments on the amount of damages. Similarly, liabilities for environmental remediation are subject to change because of changes in laws, regulations and their interpretation, the determination of additional information on the extent and nature of site contamination, and improvements in technology.
Under the accounting rules, a liability is generally recorded for these types of contingencies if management determines the loss to be both probable and estimable. The company generally reports these losses as “Operating expenses” or “Selling, general and administrative expenses” on the Consolidated Statement of Income. An exception to this handling is for income tax matters, for which benefits are recognized only if management determines the tax position is “more likely than not” (i.e., likelihood greater than 50 percent) to be allowed by the tax jurisdiction. For additional discussion of income tax uncertainties, refer to Note 23 beginning on page FS-54. Refer also to the business segment discussions elsewhere in this section for the effect on earnings from losses associated with certain litigation, environmental remediation and tax matters for the three years ended December 31,
2013
.
An estimate as to the sensitivity to earnings for these periods if other assumptions had been used in recording these liabilities is not
practicable because of the number of contingencies that must be assessed, the number of underlying assumptions and the wide range of reasonably possible outcomes, both in terms of the probability of loss and the estimates of such loss.
New Accounting Standards
Refer to Note 18, on pag
e FS-46 in
the Notes to Consolidated Financial Statements, for information regarding new accounting standards.
FS-18
Quarterly Results and Stock Market Data
Unaudited
|
2013
|
2012
|
||||||||||||||||||||||||||||||
|
Millions of dollars, except per-share amounts
|
4th Q
|
|
3rd Q
|
|
2nd Q
|
|
1st Q
|
|
4th Q
|
|
3rd Q
|
|
2nd Q
|
|
1st Q
|
|
|||||||||||||||
|
Revenues and Other Income
|
|||||||||||||||||||||||||||||||
|
Sales and other operating revenues
1
|
$
|
53,950
|
|
$
|
56,603
|
|
$
|
55,307
|
|
$
|
54,296
|
|
$
|
56,254
|
|
$
|
55,660
|
|
$
|
59,780
|
|
58,896
|
|
||||||||
|
Income from equity affiliates
|
1,824
|
|
1,635
|
|
1,784
|
|
2,284
|
|
1,815
|
|
1,274
|
|
2,091
|
|
$
|
1,709
|
|
||||||||||||||
|
Other income
|
384
|
|
265
|
|
278
|
|
238
|
|
2,483
|
|
1,110
|
|
737
|
|
100
|
|
|||||||||||||||
|
Total Revenues and Other Income
|
56,158
|
|
58,503
|
|
57,369
|
|
56,818
|
|
60,552
|
|
58,044
|
|
62,608
|
|
60,705
|
|
|||||||||||||||
|
Costs and Other Deductions
|
|||||||||||||||||||||||||||||||
|
Purchased crude oil and products
|
32,691
|
|
34,822
|
|
34,273
|
|
32,910
|
|
33,959
|
|
33,982
|
|
36,772
|
|
36,053
|
|
|||||||||||||||
|
Operating expenses
|
6,521
|
|
6,066
|
|
6,278
|
|
5,762
|
|
6,273
|
|
5,694
|
|
5,420
|
|
5,183
|
|
|||||||||||||||
|
Selling, general and administrative expenses
|
1,176
|
|
1,197
|
|
1,139
|
|
998
|
|
1,182
|
|
1,352
|
|
1,250
|
|
940
|
|
|||||||||||||||
|
Exploration expenses
|
726
|
|
559
|
|
329
|
|
247
|
|
357
|
|
475
|
|
493
|
|
403
|
|
|||||||||||||||
|
Depreciation, depletion and amortization
|
3,635
|
|
3,658
|
|
3,412
|
|
3,481
|
|
3,554
|
|
3,370
|
|
3,284
|
|
3,205
|
|
|||||||||||||||
|
Taxes other than on income
1
|
3,211
|
|
3,366
|
|
3,349
|
|
3,137
|
|
3,251
|
|
3,239
|
|
3,034
|
|
2,852
|
|
|||||||||||||||
|
Total Costs and Other Deductions
|
47,960
|
|
49,668
|
|
48,780
|
|
46,535
|
|
48,576
|
|
48,112
|
|
50,253
|
|
48,636
|
|
|||||||||||||||
|
Income Before Income Tax Expense
|
8,198
|
|
8,835
|
|
8,589
|
|
10,283
|
|
11,976
|
|
9,932
|
|
12,355
|
|
12,069
|
|
|||||||||||||||
|
Income Tax Expense
|
3,240
|
|
3,839
|
|
3,185
|
|
4,044
|
|
4,679
|
|
4,624
|
|
5,123
|
|
5,570
|
|
|||||||||||||||
|
Net Income
|
$
|
4,958
|
|
$
|
4,996
|
|
$
|
5,404
|
|
$
|
6,239
|
|
$
|
7,297
|
|
$
|
5,308
|
|
$
|
7,232
|
|
$
|
6,499
|
|
|||||||
|
Less: Net income attributable to
noncontrolling interests |
28
|
|
46
|
|
39
|
|
61
|
|
52
|
|
55
|
|
22
|
|
28
|
|
|||||||||||||||
|
Net Income Attributable to Chevron Corporation
|
$
|
4,930
|
|
$
|
4,950
|
|
$
|
5,365
|
|
$
|
6,178
|
|
$
|
7,245
|
|
$
|
5,253
|
|
$
|
7,210
|
|
$
|
6,471
|
|
|||||||
|
Per Share of Common Stock
|
|||||||||||||||||||||||||||||||
|
Net Income Attributable to Chevron Corporation
|
|||||||||||||||||||||||||||||||
|
– Basic
|
$2.60
|
$2.58
|
$2.80
|
$3.20
|
$3.73
|
$2.71
|
$3.68
|
$3.30
|
|||||||||||||||||||||||
|
– Diluted
|
$2.57
|
$2.57
|
$2.77
|
$3.18
|
$3.70
|
$2.69
|
$3.66
|
$3.27
|
|||||||||||||||||||||||
|
Dividends
|
$1.00
|
$1.00
|
$1.00
|
$0.90
|
$0.90
|
$0.90
|
$0.90
|
$0.81
|
|||||||||||||||||||||||
|
Common Stock Price Range – High
2
|
$125.65
|
$127.83
|
$127.40
|
$121.56
|
$118.38
|
$118.53
|
$108.79
|
$112.28
|
|||||||||||||||||||||||
|
– Low
2
|
$114.44
|
$117.22
|
$114.12
|
$108.74
|
$100.66
|
$103.29
|
$95.73
|
$102.08
|
|||||||||||||||||||||||
|
1
Includes excise, value-added and similar taxes:
|
$
|
2,128
|
|
$
|
2,223
|
|
$
|
2,108
|
|
$
|
2,033
|
|
$
|
2,131
|
|
$
|
2,163
|
|
$
|
1,929
|
|
$
|
1,787
|
|
|||||||
|
2
Intraday price.
|
|||||||||||||||||||||||||||||||
|
The company’s common stock is listed on the New York Stock Exchange (trading symbol: CVX). As of February 10, 2014, stockholders of record numbered approximately 160,000. There are no restrictions on the company’s ability to pay dividends.
|
|||||||||||||||||||||||||||||||
FS-19
|
Management’s Responsibility for Financial Statements
|
||
|
To the Stockholders of Chevron Corporation
Management of Chevron is responsible for preparing the accompanying consolidated financial statements and the related information appearing in this report. The statements were prepared in accordance with accounting principles generally accepted in the United States of America and fairly represent the transactions and financial position of the company. The financial statements include amounts that are based on management’s best estimates and judgments.
As stated in its report included herein, the independent registered public accounting firm of PricewaterhouseCoopers LLP has audited the company’s consolidated financial statements in accordance with the standards of the Public Company Accounting Oversight Board (United States). The Board of Directors of Chevron has an Audit Committee composed of directors who are not officers or employees of the company. The Audit Committee meets regularly with members of management, the internal auditors and the independent registered public accounting firm to review accounting, internal control, auditing and financial reporting matters. Both the internal auditors and the independent registered public accounting firm have free and direct access to the Audit Committee without the presence of management. |
||
|
Management’s Report on Internal Control Over Financial Reporting
|
||
|
The company’s management is responsible for establishing and maintaining adequate internal control over financial reporting, as such term is defined in Exchange Act Rule 13a-15(f). The company’s management, including the Chief Executive Officer and Chief Financial Officer, conducted an evaluation of the effectiveness of the company’s internal control over financial reporting based on the
Internal Control – Integrated Framework
(1992)
issued by the Committee of Sponsoring Organizations of the Treadway Commission (COSO). Based on the results of this evaluation, the company’s management concluded that internal control over financial reporting was effective as of December 31, 2013.
On May 14, 2013, COSO published an updated Internal Control - Integrated Framework (2013) and related illustrative documents. As of December 31, 2013, the company is utilizing the original framework published in 1992. The transition period for adoption of the updated framework ends December 15, 2014.
The effectiveness of the company’s internal control over financial reporting as of December 31, 2013, has been audited by PricewaterhouseCoopers LLP, an independent registered public accounting firm, as stated in its report included herein.
|
||

|

|

|
|
John S. Watson
|
Patricia E. Yarrington
|
Matthew J. Foehr
|
|
Chairman of the Board
|
Vice President
|
Vice President
|
|
and Chief Executive Officer
|
and Chief Financial Officer
|
and Comptroller
|
|
February 21, 2014
|
||
FS-20
Report of Independent Registered Public Accounting Firm
|
To the Stockholders and the Board of Directors of Chevron Corporation:
|
evidence supporting the amounts and disclosures in the financial statements, assessing the accounting principles used and significant estimates made by management, and evaluating the overall financial statement presentation. Our audit of internal control over financial reporting included obtaining an understanding of internal control over financial reporting, assessing the risk that a material weakness exists, and testing and evaluating the design and operating effectiveness of internal control based on the assessed risk. Our audits also included performing such other procedures as we considered necessary in the circumstances. We believe that our audits provide a reasonable basis for our opinions.
A company’s internal control over financial reporting is a process designed to provide reasonable assurance regarding the reliability of financial reporting and the preparation of financial statements for external purposes in accordance with generally accepted accounting principles. A company’s internal control over financial reporting includes those policies and procedures that (i) pertain to the maintenance of records that, in reasonable detail, accurately and fairly reflect the transactions and dispositions of the assets of the company; (ii) provide reasonable assurance that transactions are recorded as necessary to permit preparation of financial statements in accordance with generally accepted accounting principles, and that receipts and expenditures of the company are being made only in accordance with authorizations of management and directors of the company; and (iii) provide reasonable assurance regarding prevention or timely detection of unauthorized acquisition, use, or disposition of the company’s assets that could have a material effect on the financial statements.
Because of its inherent limitations, internal control over financial reporting may not prevent or detect misstatements. Also, projections of any evaluation of effectiveness to future periods are subject to the risk that controls may become inadequate because of changes in conditions, or that the degree of compliance with the policies or procedures may deteriorate.
|
|
In our opinion, the accompanying consolidated balance sheet and the related consolidated statements of income, comprehensive income, equity and of cash flows present fairly, in all material respects, the financial position of Chevron Corporation and its subsidiaries at December 31, 2013, and December 31, 2012, and the results of their operations and their cash flows for each of the three years in the period ended December 31, 2013, in conformity with accounting principles generally accepted in the United States of America. In addition, in our opinion, the financial statement schedule listed in the index appearing under Item 15(a)(2) presents fairly, in all material respects, the information set forth therein when read in conjunction with the related consolidated financial statements. Also in our opinion, the Company maintained, in all material respects, effective internal control over financial reporting as of December 31, 2013, based on criteria established in
Internal Control – Integrated Framework
(1992)
issued by the Committee of Sponsoring Organizations of the Treadway Commission (COSO). The Company’s management is responsible for these financial statements and financial statement schedule, for maintaining effective internal control over financial reporting, and for its assessment of the effectiveness of internal control over financial reporting, included in the accompanying Management’s Report on Internal Control Over Financial Reporting. Our responsibility is to express opinions on these financial statements, on the financial statement schedule, and on the Company’s internal control over financial reporting based on our integrated audits. We conducted our audits in accordance with the standards of the Public Company Accounting Oversight Board (United States). Those standards require that we plan and perform the audits to obtain reasonable assurance about whether the financial statements are free of material misstatement and whether effective internal control over financial reporting was maintained in all material respects. Our audits of the financial statements included examining, on a test basis,
|
|

|
|
|
San Francisco, California
|
|
|
February 21, 2014
|
|
FS-21
Consolidated Statement of Income
Millions of dollars, except per-share amounts
Millions of dollars, except per-share amounts
|
Year ended December 31
|
||||||||||||
|
2013
|
|
2012
|
|
2011
|
|
|||||||
|
Revenues and Other Income
|
||||||||||||
|
Sales and other operating revenues*
|
$
|
220,156
|
|
$
|
230,590
|
|
$
|
244,371
|
|
|||
|
Income from equity affiliates
|
7,527
|
|
6,889
|
|
7,363
|
|
||||||
|
Other income
|
1,165
|
|
4,430
|
|
1,972
|
|
||||||
|
Total Revenues and Other Income
|
228,848
|
|
241,909
|
|
253,706
|
|
||||||
|
Costs and Other Deductions
|
||||||||||||
|
Purchased crude oil and products
|
134,696
|
|
140,766
|
|
149,923
|
|
||||||
|
Operating expenses
|
24,627
|
|
22,570
|
|
21,649
|
|
||||||
|
Selling, general and administrative expenses
|
4,510
|
|
4,724
|
|
4,745
|
|
||||||
|
Exploration expenses
|
1,861
|
|
1,728
|
|
1,216
|
|
||||||
|
Depreciation, depletion and amortization
|
14,186
|
|
13,413
|
|
12,911
|
|
||||||
|
Taxes other than on income*
|
13,063
|
|
12,376
|
|
15,628
|
|
||||||
|
Total Costs and Other Deductions
|
192,943
|
|
195,577
|
|
206,072
|
|
||||||
|
Income Before Income Tax Expense
|
35,905
|
|
46,332
|
|
47,634
|
|
||||||
|
Income Tax Expense
|
14,308
|
|
19,996
|
|
20,626
|
|
||||||
|
Net Income
|
21,597
|
|
26,336
|
|
27,008
|
|
||||||
|
Less: Net income attributable to noncontrolling interests
|
174
|
|
157
|
|
113
|
|
||||||
|
Net Income Attributable to Chevron Corporation
|
$
|
21,423
|
|
$
|
26,179
|
|
$
|
26,895
|
|
|||
|
Per Share of Common Stock
|
||||||||||||
|
Net Income Attributable to Chevron Corporation
|
||||||||||||
|
– Basic
|
$
|
11.18
|
|
$
|
13.42
|
|
$
|
13.54
|
|
|||
|
– Diluted
|
$
|
11.09
|
|
$
|
13.32
|
|
$
|
13.44
|
|
|||
|
*Includes excise, value-added and similar taxes.
|
$
|
8,492
|
|
$
|
8,010
|
|
$
|
8,085
|
|
|||
|
See accompanying Notes to the Consolidated Financial Statements.
|
||||||||||||
FS-22
Consolidated Statement of Comprehensive Income
Millions of dollars
Millions of dollars
|
Year ended December 31
|
|||||||||||||
|
2013
|
|
2012
|
|
2011
|
|
||||||||
|
Net Income
|
$
|
21,597
|
|
$
|
26,336
|
|
$
|
27,008
|
|
||||
|
Currency translation adjustment
|
|||||||||||||
|
Unrealized net change arising during period
|
42
|
|
23
|
|
17
|
|
|||||||
|
Unrealized holding (loss) gain on securities
|
|||||||||||||
|
Net (loss) gain arising during period
|
(7
|
)
|
1
|
|
(11
|
)
|
|||||||
|
Derivatives
|
|||||||||||||
|
Net derivatives (loss) gain on hedge transactions
|
(111
|
)
|
20
|
|
20
|
|
|||||||
|
Reclassification to net income of net realized (gain) loss
|
(1
|
)
|
(14
|
)
|
9
|
|
|||||||
|
Income taxes on derivatives transactions
|
39
|
|
(3
|
)
|
(10
|
)
|
|||||||
|
Total
|
(73
|
)
|
3
|
|
19
|
|
|||||||
|
Defined benefit plans
|
|||||||||||||
|
Actuarial gain (loss)
|
|||||||||||||
|
Amortization to net income of net actuarial loss and settlements
|
866
|
|
920
|
|
773
|
|
|||||||
|
Actuarial gain (loss) arising during period
|
3,379
|
|
(1,180
|
)
|
(3,250
|
)
|
|||||||
|
Prior service credits (cost)
|
|||||||||||||
|
Amortization to net income of net prior service credits
|
(27
|
)
|
(61
|
)
|
(26
|
)
|
|||||||
|
Prior service credits (cost) arising during period
|
60
|
|
(142
|
)
|
(27
|
)
|
|||||||
|
Defined benefit plans sponsored by equity affiliates
|
164
|
|
(54
|
)
|
(81
|
)
|
|||||||
|
Income taxes on defined benefit plans
|
(1,614
|
)
|
143
|
|
1,030
|
|
|||||||
|
Total
|
2,828
|
|
(374
|
)
|
(1,581
|
)
|
|||||||
|
Other Comprehensive Gain (Loss), Net of Tax
|
2,790
|
|
(347
|
)
|
(1,556
|
)
|
|||||||
|
Comprehensive Income
|
24,387
|
|
25,989
|
|
25,452
|
|
|||||||
|
Comprehensive income attributable to noncontrolling interests
|
(174
|
)
|
(157
|
)
|
(113
|
)
|
|||||||
|
Comprehensive Income Attributable to Chevron Corporation
|
$
|
24,213
|
|
$
|
25,832
|
|
$
|
25,339
|
|
||||
|
See accompanying Notes to the Consolidated Financial Statements.
|
|||||||||||||
FS-23
Millions of dollars, except per-share amounts
|
At December 31
|
|||||||
|
2013
|
|
2012
|
|
||||
|
Assets
|
|||||||
|
Cash and cash equivalents
|
$
|
16,245
|
|
$
|
20,939
|
|
|
|
Time deposits
|
8
|
|
708
|
|
|||
|
Marketable securities
|
263
|
|
266
|
|
|||
|
Accounts and notes receivable (less allowance: 2013 - $62; 2012 - $80)
|
21,622
|
|
20,997
|
|
|||
|
Inventories:
|
|||||||
|
Crude oil and petroleum products
|
3,879
|
|
3,923
|
|
|||
|
Chemicals
|
491
|
|
475
|
|
|||
|
Materials, supplies and other
|
2,010
|
|
1,746
|
|
|||
|
Total inventories
|
6,380
|
|
6,144
|
|
|||
|
Prepaid expenses and other current assets
|
5,732
|
|
6,666
|
|
|||
|
Total Current Assets
|
50,250
|
|
55,720
|
|
|||
|
Long-term receivables, net
|
2,833
|
|
3,053
|
|
|||
|
Investments and advances
|
25,502
|
|
23,718
|
|
|||
|
Properties, plant and equipment, at cost
|
296,433
|
|
263,481
|
|
|||
|
Less: Accumulated depreciation, depletion and amortization
|
131,604
|
|
122,133
|
|
|||
|
Properties, plant and equipment, net
|
164,829
|
|
141,348
|
|
|||
|
Deferred charges and other assets
|
5,120
|
|
4,503
|
|
|||
|
Goodwill
|
4,639
|
|
4,640
|
|
|||
|
Assets held for sale
|
580
|
|
—
|
|
|||
|
Total Assets
|
$
|
253,753
|
|
$
|
232,982
|
|
|
|
Liabilities and Equity
|
|||||||
|
Short-term debt
|
$
|
374
|
|
$
|
127
|
|
|
|
Accounts payable
|
22,815
|
|
22,776
|
|
|||
|
Accrued liabilities
|
5,402
|
|
5,738
|
|
|||
|
Federal and other taxes on income
|
3,092
|
|
4,341
|
|
|||
|
Other taxes payable
|
1,335
|
|
1,230
|
|
|||
|
Total Current Liabilities
|
33,018
|
|
34,212
|
|
|||
|
Long-term debt
|
19,960
|
|
11,966
|
|
|||
|
Capital lease obligations
|
97
|
|
99
|
|
|||
|
Deferred credits and other noncurrent obligations
|
22,982
|
|
21,502
|
|
|||
|
Noncurrent deferred income taxes
|
21,301
|
|
17,672
|
|
|||
|
Noncurrent employee benefit plans
|
5,968
|
|
9,699
|
|
|||
|
Total Liabilities
|
103,326
|
|
95,150
|
|
|||
|
Preferred stock (authorized 100,000,000 shares; $1.00 par value; none issued)
|
—
|
|
—
|
|
|||
|
Common stock (authorized 6,000,000,000 shares; $0.75 par value; 2,442,676,580 shares
issued at December 31, 2013 and 2012) |
1,832
|
|
1,832
|
|
|||
|
Capital in excess of par value
|
15,713
|
|
15,497
|
|
|||
|
Retained earnings
|
173,677
|
|
159,730
|
|
|||
|
Accumulated other comprehensive loss
|
(3,579
|
)
|
(6,369
|
)
|
|||
|
Deferred compensation and benefit plan trust
|
(240
|
)
|
(282
|
)
|
|||
|
Treasury stock, at cost (2013 - 529,073,512 shares; 2012 - 495,978,691 shares)
|
(38,290
|
)
|
(33,884
|
)
|
|||
|
Total Chevron Corporation Stockholders' Equity
|
149,113
|
|
136,524
|
|
|||
|
Noncontrolling interests
|
1,314
|
|
1,308
|
|
|||
|
Total Equity
|
150,427
|
|
137,832
|
|
|||
|
Total Liabilities and Equity
|
$
|
253,753
|
|
$
|
232,982
|
|
|
|
See accompanying Notes to the Consolidated Financial Statements.
|
|||||||
FS-24
Millions of dollars
|
Year ended December 31
|
|||||||||||
|
2013
|
|
2012
|
|
2011
|
|
||||||
|
Operating Activities
|
|||||||||||
|
Net Income
|
$
|
21,597
|
|
$
|
26,336
|
|
$
|
27,008
|
|
||
|
Adjustments
|
|||||||||||
|
Depreciation, depletion and amortization
|
14,186
|
|
13,413
|
|
12,911
|
|
|||||
|
Dry hole expense
|
683
|
|
555
|
|
377
|
|
|||||
|
Distributions less than income from equity affiliates
|
(1,178
|
)
|
(1,351
|
)
|
(570
|
)
|
|||||
|
Net before-tax gains on asset retirements and sales
|
(639
|
)
|
(4,089
|
)
|
(1,495
|
)
|
|||||
|
Net foreign currency effects
|
(103
|
)
|
207
|
|
(103
|
)
|
|||||
|
Deferred income tax provision
|
1,876
|
|
2,015
|
|
1,589
|
|
|||||
|
Net (increase) decrease in operating working capital
|
(1,331
|
)
|
363
|
|
2,318
|
|
|||||
|
Decrease (increase) in long-term receivables
|
183
|
|
(169
|
)
|
(150
|
)
|
|||||
|
(Increase) decrease in other deferred charges
|
(321
|
)
|
1,047
|
|
341
|
|
|||||
|
Cash contributions to employee pension plans
|
(1,194
|
)
|
(1,228
|
)
|
(1,467
|
)
|
|||||
|
Other
|
1,243
|
|
1,713
|
|
336
|
|
|||||
|
Net Cash Provided by Operating Activities
|
35,002
|
|
38,812
|
|
41,095
|
|
|||||
|
Investing Activities
|
|||||||||||
|
Acquisition of Atlas Energy
|
—
|
|
—
|
|
(3,009
|
)
|
|||||
|
Advance to Atlas Energy
|
—
|
|
—
|
|
(403
|
)
|
|||||
|
Capital expenditures
|
(37,985
|
)
|
(30,938
|
)
|
(26,500
|
)
|
|||||
|
Proceeds and deposits related to asset sales
|
1,143
|
|
2,777
|
|
3,517
|
|
|||||
|
Net sales (purchases) of time deposits
|
700
|
|
3,250
|
|
(1,104
|
)
|
|||||
|
Net sales (purchases) of marketable securities
|
3
|
|
(3
|
)
|
(74
|
)
|
|||||
|
Repayment of loans by equity affiliates
|
314
|
|
328
|
|
339
|
|
|||||
|
Net sales (purchases) of other short-term investments
|
216
|
|
(210
|
)
|
(255
|
)
|
|||||
|
Net Cash Used for Investing Activities
|
(35,609
|
)
|
(24,796
|
)
|
(27,489
|
)
|
|||||
|
Financing Activities
|
|||||||||||
|
Net borrowings of short-term obligations
|
2,378
|
|
264
|
|
23
|
|
|||||
|
Proceeds from issuances of long-term debt
|
6,000
|
|
4,007
|
|
377
|
|
|||||
|
Repayments of long-term debt and other financing obligations
|
(132
|
)
|
(2,224
|
)
|
(2,769
|
)
|
|||||
|
Cash dividends - common stock
|
(7,474
|
)
|
(6,844
|
)
|
(6,136
|
)
|
|||||
|
Distributions to noncontrolling interests
|
(99
|
)
|
(41
|
)
|
(71
|
)
|
|||||
|
Net purchases of treasury shares
|
(4,494
|
)
|
(4,142
|
)
|
(3,193
|
)
|
|||||
|
Net Cash Used for Financing Activities
|
(3,821
|
)
|
(8,980
|
)
|
(11,769
|
)
|
|||||
|
Effect of Exchange Rate Changes on Cash and Cash Equivalents
|
(266
|
)
|
39
|
|
(33
|
)
|
|||||
|
Net Change in Cash and Cash Equivalents
|
(4,694
|
)
|
5,075
|
|
1,804
|
|
|||||
|
Cash and Cash Equivalents at January 1
|
20,939
|
|
15,864
|
|
14,060
|
|
|||||
|
Cash and Cash Equivalents at December 31
|
$
|
16,245
|
|
$
|
20,939
|
|
$
|
15,864
|
|
||
|
See accompanying Notes to the Consolidated Financial Statements.
|
|||||||||||
FS-25
Consolidated Statement of Equity
Shares in thousands; amounts in millions of dollars
|
2013
|
2012
|
2011
|
||||||||||||||||||
|
Shares
|
|
Amount
|
|
Shares
|
|
Amount
|
|
Shares
|
|
Amount
|
|
|||||||||
|
Preferred Stock
|
—
|
|
$
|
—
|
|
—
|
|
$
|
—
|
|
—
|
|
$
|
—
|
|
|||||
|
Common Stock
|
2,442,677
|
|
$
|
1,832
|
|
2,442,677
|
|
$
|
1,832
|
|
2,442,677
|
|
$
|
1,832
|
|
|||||
|
Capital in Excess of Par
|
||||||||||||||||||||
|
Balance at January 1
|
$
|
15,497
|
|
$
|
15,156
|
|
$
|
14,796
|
|
|||||||||||
|
Treasury stock transactions
|
216
|
|
341
|
|
360
|
|
||||||||||||||
|
Balance at December 31
|
$
|
15,713
|
|
$
|
15,497
|
|
$
|
15,156
|
|
|||||||||||
|
Retained Earnings
|
||||||||||||||||||||
|
Balance at January 1
|
$
|
159,730
|
|
$
|
140,399
|
|
$
|
119,641
|
|
|||||||||||
|
Net income attributable to Chevron Corporation
|
21,423
|
|
26,179
|
|
26,895
|
|
||||||||||||||
|
Cash dividends on common stock
|
(7,474
|
)
|
(6,844
|
)
|
(6,136
|
)
|
||||||||||||||
|
Stock dividends
|
(3
|
)
|
(3
|
)
|
(3
|
)
|
||||||||||||||
|
Tax (charge) benefit from dividends paid on
unallocated ESOP shares and other |
1
|
|
(1
|
)
|
2
|
|
||||||||||||||
|
Balance at December 31
|
$
|
173,677
|
|
$
|
159,730
|
|
$
|
140,399
|
|
|||||||||||
|
Accumulated Other Comprehensive Loss
|
||||||||||||||||||||
|
Currency translation adjustment
|
||||||||||||||||||||
|
Balance at January 1
|
$
|
(65
|
)
|
$
|
(88
|
)
|
$
|
(105
|
)
|
|||||||||||
|
Change during year
|
42
|
|
23
|
|
17
|
|
||||||||||||||
|
Balance at December 31
|
$
|
(23
|
)
|
$
|
(65
|
)
|
$
|
(88
|
)
|
|||||||||||
|
Unrealized net holding (loss) gain on securities
|
||||||||||||||||||||
|
Balance at January 1
|
$
|
1
|
|
$
|
—
|
|
$
|
11
|
|
|||||||||||
|
Change during year
|
(7
|
)
|
1
|
|
(11
|
)
|
||||||||||||||
|
Balance at December 31
|
$
|
(6
|
)
|
$
|
1
|
|
$
|
—
|
|
|||||||||||
|
Net derivatives gain (loss) on hedge transactions
|
||||||||||||||||||||
|
Balance at January 1
|
$
|
125
|
|
$
|
122
|
|
$
|
103
|
|
|||||||||||
|
Change during year
|
(73
|
)
|
3
|
|
19
|
|
||||||||||||||
|
Balance at December 31
|
$
|
52
|
|
$
|
125
|
|
$
|
122
|
|
|||||||||||
|
Pension and other postretirement benefit plans
|
||||||||||||||||||||
|
Balance at January 1
|
$
|
(6,430
|
)
|
$
|
(6,056
|
)
|
$
|
(4,475
|
)
|
|||||||||||
|
Change during year
|
2,828
|
|
(374
|
)
|
(1,581
|
)
|
||||||||||||||
|
Balance at December 31
|
$
|
(3,602
|
)
|
$
|
(6,430
|
)
|
$
|
(6,056
|
)
|
|||||||||||
|
Balance at December 31
|
$
|
(3,579
|
)
|
$
|
(6,369
|
)
|
$
|
(6,022
|
)
|
|||||||||||
|
Deferred Compensation and Benefit Plan Trust
|
||||||||||||||||||||
|
Deferred Compensation
|
||||||||||||||||||||
|
Balance at January 1
|
$
|
(42
|
)
|
$
|
(58
|
)
|
$
|
(71
|
)
|
|||||||||||
|
Net reduction of ESOP debt and other
|
42
|
|
16
|
|
13
|
|
||||||||||||||
|
Balance at December 31
|
$
|
—
|
|
$
|
(42
|
)
|
$
|
(58
|
)
|
|||||||||||
|
Benefit Plan Trust (Common Stock)
|
14,168
|
|
(240
|
)
|
14,168
|
|
(240
|
)
|
14,168
|
|
(240
|
)
|
||||||||
|
Balance at December 31
|
14,168
|
|
$
|
(240
|
)
|
14,168
|
|
$
|
(282
|
)
|
14,168
|
|
$
|
(298
|
)
|
|||||
|
Treasury Stock at Cost
|
||||||||||||||||||||
|
Balance at January 1
|
495,979
|
|
$
|
(33,884
|
)
|
461,510
|
|
$
|
(29,685
|
)
|
435,196
|
|
$
|
(26,411
|
)
|
|||||
|
Purchases
|
41,676
|
|
(5,004
|
)
|
46,669
|
|
(5,004
|
)
|
42,424
|
|
(4,262
|
)
|
||||||||
|
Issuances - mainly employee benefit plans
|
(8,581
|
)
|
598
|
|
(12,200
|
)
|
805
|
|
(16,110
|
)
|
988
|
|
||||||||
|
Balance at December 31
|
529,074
|
|
$
|
(38,290
|
)
|
495,979
|
|
$
|
(33,884
|
)
|
461,510
|
|
$
|
(29,685
|
)
|
|||||
|
Total Chevron Corporation Stockholders' Equity at December 31
|
$
|
149,113
|
|
$
|
136,524
|
|
$
|
121,382
|
|
|||||||||||
|
Noncontrolling Interests
|
$
|
1,314
|
|
$
|
1,308
|
|
$
|
799
|
|
|||||||||||
|
Total Equity
|
$
|
150,427
|
|
$
|
137,832
|
|
$
|
122,181
|
|
|||||||||||
|
See accompanying Notes to the Consolidated Financial Statements.
|
||||||||||||||||||||
FS-26
|
Notes to the Consolidated Financial Statements
Millions of dollars, except per-share amounts
|
Note 1
Summary of Significant Accounting Policies
General
Upstream operations consist primarily of exploring for, developing and producing crude oil and natural gas; liquefaction, transportation and regasification associated with liquefied natural gas (LNG); transporting crude oil by major international oil export pipelines; processing, transporting, storage and marketing of natural gas; and a gas-to-liquids project. Downstream operations relate primarily to refining crude oil into petroleum products; marketing of crude oil and refined products; transporting crude oil and refined products by pipeline, marine vessel, motor equipment and rail car; and manufacturing and marketing of commodity petrochemicals, plastics for industrial uses, and additives for fuels and lubricant oils.
The company’s Consolidated Financial Statements are prepared in accordance with accounting principles generally accepted in the United States of America. These require the use of estimates and assumptions that affect the assets, liabilities, revenues and expenses reported in the financial statements, as well as amounts included in the notes thereto, including discussion and disclosure of contingent liabilities. Although the company uses its best estimates and judgments, actual results could differ from these estimates as future confirming events occur.
Subsidiary and Affiliated Companies
The Consolidated Financial Statements include the accounts of controlled subsidiary companies more than
50
percent-owned and any variable-interest entities in which the company is the primary beneficiary. Undivided interests in oil and gas joint ventures and certain other assets are consolidated on a proportionate basis. Investments in and advances to affiliates in which the company has a substantial ownership interest of approximately 20 percent to 50 percent, or for which the company exercises significant influence but not control over policy decisions, are accounted for by the equity method. As part of that accounting, the company recognizes gains and losses that arise from the issuance of stock by an affiliate that results in changes in the company’s proportionate share of the dollar amount of the affiliate’s equity currently in income.
Investments are assessed for possible impairment when events indicate that the fair value of the investment may be below the company’s carrying value. When such a condition is deemed to be other than temporary, the carrying value of the investment is written down to its fair value, and the amount of the write-down is included in net income. In making the determination as to whether a decline is other than temporary, the company considers such factors as the duration and extent of the decline, the investee’s financial performance, and the company’s ability and intention to retain its investment for a period that will be sufficient to allow for any anticipated
recovery in the investment’s market value. The new cost basis of investments in these equity investees is not changed for subsequent recoveries in fair value.
Differences between the company’s carrying value of an equity investment and its underlying equity in the net assets of the affiliate are assigned to the extent practicable to specific assets and liabilities based on the company’s analysis of the various factors giving rise to the difference. When appropriate, the company’s share of the affiliate’s reported earnings is adjusted quarterly to reflect the difference between these allocated values and the affiliate’s historical book values.
Derivatives
The majority of the company’s activity in derivative commodity instruments is intended to manage the financial risk posed by physical transactions. For some of this derivative activity, generally limited to large, discrete or infrequently occurring transactions, the company may elect to apply fair value or cash flow hedge accounting. For other similar derivative instruments, generally because of the short-term nature of the contracts or their limited use, the company does not apply hedge accounting, and changes in the fair value of those contracts are reflected in current income. For the company’s commodity trading activity, gains and losses from derivative instruments are reported in current income. The company may enter into interest rate swaps from time to time as part of its overall strategy to manage the interest rate risk on its debt. Interest rate swaps related to a portion of the company’s fixed-rate debt, if any, may be accounted for as fair value hedges. Interest rate swaps related to floating-rate debt, if any, are recorded at fair value on the balance sheet with resulting gains and losses reflected in income. Where Chevron is a party to master netting arrangements, fair value receivable and payable amounts recognized for derivative instruments executed with the same counterparty are generally offset on the balance sheet.
Short-Term Investments
All short-term investments are classified as available for sale and are in highly liquid debt securities. Those investments that are part of the company’s cash management portfolio and have original maturities of three months or less are reported as “Cash equivalents.” Bank time deposits with maturities greater than
90
days are reported as “Time deposits.” The balance of short-term investments is reported as “Marketable securities” and is marked-to-market, with any unrealized gains or losses included in “Other comprehensive income.”
Inventories
Crude oil, petroleum products and chemicals inventories are generally stated at cost, using a last-in, first-out method. In the aggregate, these costs are below market. “Materials, supplies and other” inventories generally are stated at average cost.
FS-27
|
Notes to the Consolidated Financial Statements
Millions of dollars, except per-share amounts
Note 1
Summary of Significant Accounting Policies - Continued
|
||
Properties, Plant and Equipment
The successful efforts method is used for crude oil and natural gas exploration and production activities. All costs for development wells, related plant and equipment, proved mineral interests in crude oil and natural gas properties, and related asset retirement obligation (ARO) assets are capitalized. Costs of exploratory wells are capitalized pending determination of whether the wells found proved reserves. Costs of wells that are assigned proved reserves remain capitalized. Costs also are capitalized for exploratory wells that have found crude oil and natural gas reserves even if the reserves cannot be classified as proved when the drilling is completed, provided the exploratory well has found a sufficient quantity of reserves to justify its completion as a producing well and the company is making sufficient progress assessing the reserves and the economic and operating viability of the project. All other exploratory wells and costs are expensed. Refer to Note 19, beginning on page FS-46, for additional discussion of accounting for suspended exploratory well costs.
Long-lived assets to be held and used, including proved crude oil and natural gas properties, are assessed for possible impairment by comparing their carrying values with their associated undiscounted, future net before-tax cash flows. Events that can trigger assessments for possible impairments include write-downs of proved reserves based on field performance, significant decreases in the market value of an asset, significant change in the extent or manner of use of or a physical change in an asset, and a more-likely-than-not expectation that a long-lived asset or asset group will be sold or otherwise disposed of significantly sooner than the end of its previously estimated useful life. Impaired assets are written down to their estimated fair values, generally their discounted, future net before-tax cash flows. For proved crude oil and natural gas properties in the United States, the company generally performs an impairment review on an individual field basis. Outside the United States, reviews are performed on a country, concession, development area or field basis, as appropriate. In Downstream, impairment reviews are performed on the basis of a refinery, a plant, a marketing/lubricants area or distribution area, as appropriate. Impairment amounts are recorded as incremental “Depreciation, depletion and amortization” expense.
Long-lived assets that are held for sale are evaluated for possible impairment by comparing the carrying value of the asset with its fair value less the cost to sell. If the net book value exceeds the fair value less cost to sell, the asset is considered impaired and adjusted to the lower value. Refer to Note 9, beginning on page FS-32, relating to fair value measurements.
The fair value of a liability for an ARO is recorded as an asset and a liability when there is a legal obligation associated with the retirement of a long-lived asset and the amount can be reasonably estimated. Refer also to Note 24, on page FS-56, relating to AROs.
Depreciation and depletion of all capitalized costs of proved crude oil and natural gas producing properties, except mineral interests, are expensed using the unit-of-production method, generally by individual field, as the proved developed reserves are produced. Depletion expenses for capitalized costs of proved mineral interests are recognized using the unit-of-production method by individual field as the related proved reserves are produced. Periodic valuation provisions for impairment of capitalized costs of unproved mineral interests are expensed.
The capitalized costs of all other plant and equipment are depreciated or amortized over their estimated useful lives. In general, the declining-balance method is used to depreciate plant and equipment in the United States; the straight-line method is generally used to depreciate international plant and equipment and to amortize all capitalized leased assets.
Gains or losses are not recognized for normal retirements of properties, plant and equipment subject to composite group amortization or depreciation. Gains or losses from abnormal retirements are recorded as expenses, and from sales as “Other income.”
Expenditures for maintenance (including those for planned major maintenance projects), repairs and minor renewals to maintain facilities in operating condition are generally expensed as incurred. Major replacements and renewals are capitalized.
Goodwill
Goodwill resulting from a business combination is not subject to amortization. The company tests such goodwill at the reporting unit level for impairment on an annual basis and between annual tests if an event occurs or circumstances change that would more likely than not reduce the fair value of the reporting unit below its carrying amount.
Environmental Expenditures
Environmental expenditures that relate to ongoing operations or to conditions caused by past operations are expensed. Expenditures that create future benefits or contribute to future revenue generation are capitalized.
Liabilities related to future remediation costs are recorded when environmental assessments or cleanups or both are probable and the costs can be reasonably estimated. For the company’s U.S. and Canadian marketing facilities, the accrual is based in part on the probability that a future remediation commitment will be required. For crude oil, natural gas and
mineral-producing properties, a liability for an ARO is made in accordance with accounting standards for asset retirement and environmental obligations. Refer to Note 24, on page FS-56, for a discussion of the company’s AROs.
FS-28
|
Note 1
Summary of Significant Accounting Policies - Continued
|
For federal Superfund sites and analogous sites under state laws, the company records a liability for its designated share of the probable and estimable costs, and probable amounts for other potentially responsible parties when mandated by the regulatory agencies because the other parties are not able to pay their respective shares.
The gross amount of environmental liabilities is based on the company’s best estimate of future costs using currently available technology and applying current regulations and the company’s own internal environmental policies. Future amounts are not discounted. Recoveries or reimbursements are recorded as assets when receipt is reasonably assured.
Currency Translation
The U.S. dollar is the functional currency for substantially all of the company’s consolidated operations and those of its equity affiliates. For those operations, all gains and losses from currency remeasurement are included in current period income. The cumulative translation effects for those few entities, both consolidated and affiliated, using functional currencies other than the U.S. dollar are included in “Currency translation adjustment” on the Consolidated Statement of Equity.
Revenue Recognition
Revenues associated with sales of crude oil, natural gas, coal, petroleum and chemicals products, and all other sources are recorded when title passes to the customer, net of royalties, discounts and allowances, as applicable. Revenues
from natural gas production from properties in which Chevron
has an interest with other producers are generally recognized using the entitlement method. Excise, value-added and similar taxes assessed by a governmental authority on a revenue-producing transaction between a seller and a customer are presented on a gross basis. The associated amounts are shown as a footnote to the Consolidated Statement of Income, on page FS-22. Purchases and sales of inventory with the same counterparty that are entered into in contemplation of one another (including buy/sell arrangements) are combined and recorded on a net basis and reported in “Purchased crude oil and products” on the Consolidated Statement of Income.
Stock Options and Other Share-Based Compensation
The company issues stock options and other share-based compensation to certain employees. For equity awards, such as stock options, total compensation cost is based on the grant date fair value, and for liability awards, such as stock appreciation rights, total compensation cost is based on the settlement value. The company recognizes stock-based compensation expense for all awards over the service period required to earn the award, which is the shorter of the vesting period or the time period an employee becomes eligible to retain the award at retirement. Stock options and stock appreciation rights granted under the company’s Long-Term Incentive Plan have graded vesting provisions by which one-third of each award vests on the first, second and third anniversaries of the date of grant. The company amortizes these graded awards on a straight-line basis.
Note 2
Changes in Accumulated Other Comprehensive Losses
The change in Accumulated Other Comprehensive Losses (AOCL) presented on the Consolidated Balance Sheet and the impact of significant amounts reclassified from AOCL on information presented in the Consolidated Statement of Income for the year ending
December 31, 2013
, are reflected in the table below.
Changes in Accumulated Other Comprehensive Losses by Component
1
|
Year Ended December 31, 2013
|
|||||||||||||||||||
|
Currency Translation Adjustment
|
|
Unrealized Holding Gains (Losses) on Securities
|
|
Derivatives
|
|
Defined Benefit Plans
|
|
Total
|
|
||||||||||
|
Balance at January 1
|
$
|
(65
|
)
|
$
|
1
|
|
$
|
125
|
|
$
|
(6,430
|
)
|
$
|
(6,369
|
)
|
||||
|
Components of Other Comprehensive
Income (Loss):
|
|||||||||||||||||||
|
Before Reclassifications
|
42
|
|
(7
|
)
|
(72
|
)
|
2,302
|
|
2,265
|
|
|||||||||
|
Reclassifications
2
|
—
|
|
—
|
|
(1
|
)
|
526
|
|
525
|
|
|||||||||
|
Net Other Comprehensive Income (Loss)
|
42
|
|
(7
|
)
|
(73
|
)
|
2,828
|
|
2,790
|
|
|||||||||
|
Balance at December 31
|
$
|
(23
|
)
|
$
|
(6
|
)
|
$
|
52
|
|
$
|
(3,602
|
)
|
$
|
(3,579
|
)
|
||||
1
All amounts are net of tax.
2
Refer to Note 21, Employee Benefits for reclassified components totaling
$839
that are included in employee benefit costs for the year ending
December 31, 2013
. Related income taxes for the same period, totaling
$313
, are reflected in Income Tax Expense on the Consolidated Statement of Income. All other reclassified amounts were insignificant.
FS-29
|
Notes to the Consolidated Financial Statements
Millions of dollars, except per-share amounts
Note 3
Noncontrolling Interests
|
Note 3
Noncontrolling Interests
Ownership interests in the company’s subsidiaries held by parties other than the parent are presented separately from the parent’s equity on the Consolidated Balance Sheet. The amount of consolidated net income attributable to the parent and the noncontrolling interests are both presented on the face of the Consolidated Statement of Income. The term “earnings” is defined as “Net Income Attributable to Chevron Corporation.”
Activity for the equity attributable to noncontrolling interests for
2013
,
2012
and
2011
is as follows:
|
2013
|
|
2012
|
|
2011
|
|
|||||||
|
Balance at January 1
|
$
|
1,308
|
|
$
|
799
|
|
$
|
730
|
|
|||
|
Net income
|
174
|
|
157
|
|
113
|
|
||||||
|
Distributions to noncontrolling interests
|
(99
|
)
|
(41
|
)
|
(71
|
)
|
||||||
|
Other changes, net*
|
(69
|
)
|
393
|
|
27
|
|
||||||
|
Balance at December 31
|
$
|
1,314
|
|
$
|
1,308
|
|
$
|
799
|
|
|||
* Includes components of comprehensive income, which are disclosed separately in the Consolidated Statement of Comprehensive Income.
Note 4
Information Relating to the Consolidated Statement of Cash Flows
|
Year ended December 31
|
||||||||||||
|
2013
|
|
2012
|
|
2011
|
|
|||||||
|
Net (increase) decrease in operating working capital was composed of the following:
|
||||||||||||
|
(Increase) decrease in accounts and
notes receivable |
$
|
(1,101
|
)
|
$
|
1,153
|
|
$
|
(2,156
|
)
|
|||
|
Increase in inventories
|
(237
|
)
|
(233
|
)
|
(404
|
)
|
||||||
|
Decrease (increase) in prepaid expenses and other current assets
|
834
|
|
(471
|
)
|
(853
|
)
|
||||||
|
Increase in accounts payable and accrued liabilities
|
160
|
|
544
|
|
3,839
|
|
||||||
|
(Decrease) increase in income and other taxes payable
|
(987
|
)
|
(630
|
)
|
1,892
|
|
||||||
|
Net (increase) decrease in operating working capital
|
$
|
(1,331
|
)
|
$
|
363
|
|
$
|
2,318
|
|
|||
|
Net cash provided by operating activities includes the following cash payments for income taxes:
|
||||||||||||
|
Income taxes
|
$
|
12,898
|
|
$
|
17,334
|
|
$
|
17,374
|
|
|||
|
Net sales (purchases) of marketable securities consisted of the following gross amounts:
|
||||||||||||
|
Marketable securities purchased
|
$
|
(7
|
)
|
$
|
(35
|
)
|
$
|
(112
|
)
|
|||
|
Marketable securities sold
|
10
|
|
32
|
|
38
|
|
||||||
|
Net sales (purchases) of marketable securities
|
$
|
3
|
|
$
|
(3
|
)
|
$
|
(74
|
)
|
|||
|
Net sales (purchases) of time deposits consisted of the following gross amounts:
|
||||||||||||
|
Time deposits purchased
|
$
|
(2,317
|
)
|
$
|
(717
|
)
|
$
|
(6,439
|
)
|
|||
|
Time deposits matured
|
3,017
|
|
3,967
|
|
5,335
|
|
||||||
|
Net sales (purchases) of time deposits
|
$
|
700
|
|
$
|
3,250
|
|
$
|
(1,104
|
)
|
|||
The “
Net (increase) decrease in operating working capital
” includes reductions of
$79
,
$98
and
$121
for excess income tax benefits associated with stock options exercised during
2013
,
2012
and
2011
, respectively. These amounts are offset by an equal amount in “
Net purchases of treasury shares
.” "Other" includes changes in postretirement benefits obligations and other long-term liabilities.
In February 2011, the company acquired Atlas Energy, Inc. (Atlas) for the aggregate purchase price of approximately
$4,500
. The purchase price included assumption of debt and certain payments noted below. The “Acquisition of Atlas Energy” reflects the
$3,009
cash paid for all the common shares of Atlas. An “Advance to Atlas Energy” of
$403
was made to facilitate the purchase of a
49 percent
interest in Laurel Mountain Midstream LLC on the day of closing. The “Repayments of long-term debt and other financing obligations” in 2011 includes
$761
for repayment of Atlas debt and
$271
for payoff of the Atlas revolving credit facility. The “
Net (increase) decrease in operating working capital
” includes
$184
for payments made in connection with Atlas equity awards subsequent to the acquisition. The remaining impacts of the acquisition did not have a material impact on the Consolidated Statement of Cash Flows.
The “
Net purchases of treasury shares
” represents the cost of common shares acquired less the cost of shares issued for share-based compensation plans. Purchases totaled
$5,004
,
$5,004
and
$4,262
in
2013
,
2012
and
2011
, respectively. In
2013
,
2012
and
2011
, the company purchased
41.6 million
,
46.6 million
and
42.3 million
common shares for
$5,000
,
$5,000
and
$4,250
under its ongoing share repurchase program, respectively.
In
2013
,
2012
and
2011
, “
Net sales (purchases) of other short-term investments
” generally consisted of restricted cash associated with tax payments, upstream abandonment activities, funds held in escrow for asset acquisitions and capital investment projects that was invested in cash and short-term securities and reclassified from “Cash and cash equivalents” to “Deferred charges and other assets” on the Consolidated Balance Sheet. The company issued
$374
in
2011
of tax exempt bonds as a source of funds for U.S. refinery projects, which is included in “Proceeds from issuance of long-term debt.”
The Consolidated Statement of Cash Flows excludes changes to the Consolidated Balance Sheet that did not affect cash. The 2012 period excludes the effects of
$800
of proceeds to be received in future periods for the sale of an equity interest in the Wheatstone Project, of which
$82
was received in 2013. "Capital expenditures" in the 2012 period excludes a
$1,850
increase in "Properties, plant and equipment" related to an upstream asset exchange in Australia. Refer also to Note 24, on page FS-56, for a discussion of revisions to the company’s AROs that also did not involve cash receipts or payments for the three years ending December 31,
2013
.
FS-30
|
Note 4
Information Relating to the Consolidated Statement of Cash Flows - Continued
|
The major components of “Capital expenditures” and the reconciliation of this amount to the reported capital and exploratory expenditures, including equity affiliates, are presented in the following table:
|
Year ended December 31
|
||||||||||||
|
2013
|
|
2012
|
|
2011
|
|
|||||||
|
Additions to properties, plant
and equipment * |
$
|
36,550
|
|
$
|
29,526
|
|
$
|
25,440
|
|
|||
|
Additions to investments
|
934
|
|
1,042
|
|
900
|
|
||||||
|
Current-year dry hole expenditures
|
594
|
|
475
|
|
332
|
|
||||||
|
Payments for other liabilities
and assets, net |
(93
|
)
|
(105
|
)
|
(172
|
)
|
||||||
|
Capital expenditures
|
37,985
|
|
30,938
|
|
26,500
|
|
||||||
|
Expensed exploration expenditures
|
1,178
|
|
1,173
|
|
839
|
|
||||||
|
Assets acquired through capital lease obligations and other financing obligations
|
16
|
|
1
|
|
32
|
|
||||||
|
Capital and exploratory expenditures, excluding equity affiliates
|
39,179
|
|
32,112
|
|
27,371
|
|
||||||
|
Company's share of expenditures by equity affiliates
|
2,698
|
|
2,117
|
|
1,695
|
|
||||||
|
Capital and exploratory expenditures, including equity affiliates
|
$
|
41,877
|
|
$
|
34,229
|
|
$
|
29,066
|
|
|||
* Excludes noncash additions of
$1,661
in
2013
,
$4,569
in
2012
and
$945
in
2011
.
Note 5
Summarized Financial Data – Chevron U.S.A. Inc.
Chevron U.S.A. Inc. (CUSA) is a major subsidiary of Chevron Corporation. CUSA and its subsidiaries manage and operate most of Chevron’s U.S. businesses. Assets include those related to the exploration and production of crude oil, natural gas and natural gas liquids and those associated with the refining, marketing, supply and distribution of products derived from petroleum, excluding most of the regulated pipeline operations of Chevron. CUSA also holds the company’s investment in the Chevron Phillips Chemical Company LLC joint venture, which is accounted for using the equity method.
During 2012, Chevron implemented legal reorganizations in which certain Chevron subsidiaries transferred assets to or under CUSA. The summarized financial information for CUSA and its consolidated subsidiaries presented in the following table gives retroactive effect to the reorganizations as if they had occurred on January 1, 2011. However, the financial information in the following table may not reflect the financial position and operating results in the periods presented if the reorganization had occurred on that date.
The summarized financial information for CUSA and its consolidated subsidiaries is as follows:
|
Year ended December 31
|
||||||||||||
|
2013
|
|
2012
|
|
2011
|
|
|||||||
|
Sales and other operating revenues
|
$
|
174,318
|
|
$
|
183,215
|
|
$
|
187,929
|
|
|||
|
Total costs and other deductions
|
169,984
|
|
175,009
|
|
178,510
|
|
||||||
|
Net income attributable to CUSA
|
3,714
|
|
6,216
|
|
6,898
|
|
||||||
|
At December 31
|
||||||||
|
2013
|
|
2012
|
|
|||||
|
Current assets
|
$
|
17,626
|
|
$
|
18,983
|
|
||
|
Other assets
|
57,288
|
|
52,082
|
|
||||
|
Current liabilities
|
17,486
|
|
18,161
|
|
||||
|
Other liabilities
|
28,119
|
|
26,472
|
|
||||
|
Total CUSA net equity
|
29,309
|
|
26,432
|
|
||||
|
Memo: Total debt
|
$
|
14,482
|
|
$
|
14,482
|
|
||
Note 6
Summarized Financial Data – Chevron Transport Corporation Ltd.
Chevron Transport Corporation Ltd. (CTC), incorporated in Bermuda, is an indirect, wholly owned subsidiary of Chevron Corporation. CTC is the principal operator of Chevron’s international tanker fleet and is engaged in the marine transportation of crude oil and refined petroleum products. Most of CTC’s shipping revenue is derived from providing transportation services to other Chevron companies. Chevron Corporation has fully and unconditionally guaranteed this subsidiary’s obligations in connection with certain debt securities issued by a third party. Summarized financial information for CTC and its consolidated subsidiaries is as follows:
|
Year ended December 31
|
||||||||||||
|
2013
|
|
2012
|
|
2011
|
|
|||||||
|
Sales and other operating revenues
|
$
|
504
|
|
$
|
606
|
|
$
|
793
|
|
|||
|
Total costs and other deductions
|
695
|
|
745
|
|
974
|
|
||||||
|
Net loss attributable to CTC
|
(191
|
)
|
(135
|
)
|
(177
|
)
|
||||||
|
At December 31
|
||||||||
|
2013
|
|
2012
|
|
|||||
|
Current assets
|
$
|
221
|
|
$
|
199
|
|
||
|
Other assets
|
549
|
|
313
|
|
||||
|
Current liabilities
|
94
|
|
154
|
|
||||
|
Other liabilities
|
911
|
|
415
|
|
||||
|
Total CTC net deficit
|
$
|
(235
|
)
|
$
|
(57
|
)
|
||
There were no restrictions on CTC's ability to pay dividends or make loans or advances at December 31,
2013
.
FS-31
|
Notes to the Consolidated Financial Statements
Millions of dollars, except per-share amounts
Note 7
Summarized Financial Data – Tengizchevroil LLP
|
||
Note 7
Summarized Financial Data – Tengizchevroil LLP
Chevron has a
50 percent
equity ownership interest in Tengizchevroil LLP (TCO). Refer to Note 12, on page FS-37, for a discussion of TCO operations.
Summarized financial information for
100 percent
of TCO is presented in the following table:
|
|
Year ended December 31
|
|||||||||||
|
|
2013
|
|
2012
|
|
2011
|
|
||||||
|
Sales and other operating revenues
|
$
|
25,239
|
|
|
|
$
|
23,089
|
|
|
$
|
25,278
|
|
|
Costs and other deductions
|
11,173
|
|
|
|
10,064
|
|
|
10,941
|
|
|||
|
Net income attributable to TCO
|
9,855
|
|
|
|
9,119
|
|
|
10,039
|
|
|||
|
|
At December 31
|
|||||||
|
|
2013
|
|
2012
|
|
||||
|
Current assets
|
$
|
3,598
|
|
|
|
$
|
3,251
|
|
|
Other assets
|
12,964
|
|
|
|
12,020
|
|
||
|
Current liabilities
|
3,016
|
|
|
|
2,597
|
|
||
|
Other liabilities
|
2,761
|
|
|
|
3,390
|
|
||
|
Total TCO net equity
|
$
|
10,785
|
|
|
|
$
|
9,284
|
|
Note 8
Lease Commitments
Certain noncancelable leases are classified as capital leases, and the leased assets are included as part of “Properties, plant and equipment, at cost” on the Consolidated Balance Sheet. Such leasing arrangements involve crude oil production and processing equipment, service stations, bareboat charters, office buildings, and other facilities. Other leases are classified as operating leases and are not capitalized. The payments on operating leases are recorded as expense. Details of the capitalized leased assets are as follows:
|
At December 31
|
||||||||
|
2013
|
|
2012
|
|
|||||
|
Upstream
|
$
|
445
|
|
$
|
433
|
|
||
|
Downstream
|
316
|
|
316
|
|
||||
|
All Other
|
—
|
|
—
|
|
||||
|
Total
|
761
|
|
749
|
|
||||
|
Less: Accumulated amortization
|
523
|
|
479
|
|
||||
|
Net capitalized leased assets
|
$
|
238
|
|
$
|
270
|
|
||
Rental expenses incurred for operating leases during
2013
,
2012
and
2011
were as follows:
|
Year ended December 31
|
|||||||||||||
|
2013
|
|
2012
|
|
2011
|
|
|
|||||||
|
Minimum rentals
|
$
|
1,049
|
|
$
|
973
|
|
$
|
892
|
|
||||
|
Contingent rentals
|
1
|
|
7
|
|
11
|
|
|||||||
|
Total
|
1,050
|
|
980
|
|
903
|
|
|||||||
|
Less: Sublease rental income
|
25
|
|
32
|
|
39
|
|
|||||||
|
Net rental expense
|
$
|
1,025
|
|
$
|
948
|
|
$
|
864
|
|
||||
Contingent rentals are based on factors other than the passage of time, principally sales volumes at leased service stations.
Certain leases include escalation clauses for adjusting rentals to reflect changes in price indices, renewal options ranging up to
25
years, and options to purchase the leased property during or at the end of the initial or renewal lease period for the fair market value or other specified amount at that time.
At December 31,
2013
, the estimated future minimum lease payments (net of noncancelable sublease rentals) under operating and capital leases, which at inception had a noncancelable term of more than one year, were as follows:
|
At December 31
|
||||||||
|
Operating
|
|
Capital
|
|
|||||
|
Leases
|
|
Leases
|
|
|||||
|
Year: 2014
|
$
|
798
|
|
$
|
45
|
|
||
|
2015
|
733
|
|
32
|
|
||||
|
2016
|
594
|
|
20
|
|
||||
|
2017
|
472
|
|
17
|
|
||||
|
2018
|
306
|
|
17
|
|
||||
|
Thereafter
|
806
|
|
46
|
|
||||
|
Total
|
$
|
3,709
|
|
$
|
177
|
|
||
|
Less: Amounts representing interest and executory costs
|
$
|
(37
|
)
|
|||||
|
Net present values
|
140
|
|
||||||
|
Less: Capital lease obligations
included in short-term debt |
(43
|
)
|
||||||
|
Long-term capital lease obligations
|
$
|
97
|
|
|||||
Note 9
Fair Value Measurements
The three levels of the fair value hierarchy of inputs the company uses to measure the fair value of an asset or a liability are described as follows:
Level 1: Quoted prices (unadjusted) in active markets for identical assets and liabilities. For the company, Level 1 inputs include exchange-traded futures contracts for which the parties are willing to transact at the exchange-quoted price and marketable securities that are actively traded.
Level 2: Inputs other than Level 1 that are observable, either directly or indirectly. For the company, Level 2 inputs include quoted prices for similar assets or liabilities, prices obtained through third-party broker quotes and prices that can be corroborated with other observable inputs for substantially the complete term of a contract.
Level 3: Unobservable inputs. The company does not use Level 3 inputs for any of its recurring fair value measurements. Level 3 inputs may be required for the determination of fair value associated with certain nonrecurring measurements of nonfinancial assets and liabilities.
FS-32
|
Note 9
Fair Value Measurements - Continued
|
||
The tables below show the fair value hierarchy for assets and liabilities measured at fair value on a recurring and nonrecurring basis at December 31,
2013
, and December 31,
2012
.
Marketable Securities
The company calculates fair value for its marketable securities based on quoted market prices for identical assets. The fair values reflect the cash that would have been received if the instruments were sold at December 31,
2013
.
Derivatives
The company records its derivative instruments – other than any commodity derivative contracts that are designated as normal purchase and normal sale – on the Consolidated Balance Sheet at fair value, with the offsetting amount to the Consolidated Statement of Income. Derivatives classified as Level 1 include futures, swaps and options contracts traded in active markets such as the New York Mercantile Exchange. Derivatives classified as Level 2 include swaps, options, and forward contracts, principally with financial institutions and other oil and gas companies, the fair values of which are obtained from third-party broker quotes, industry pricing services and exchanges. The company obtains multiple sources of pricing information for the Level 2 instruments. Since this pricing information is generated from observable market data, it has historically been very consistent. The company does not materially adjust this information.
Properties, Plant and Equipment
The company did not have any material long-lived assets measured at fair value on a nonrecurring basis to report in
2013
or
2012
.
Investments and Advances
The company did not have any material investments and advances measured at fair value on a nonrecurring basis to report in
2013
or
2012
.
Assets and Liabilities Not Required to Be Measured at Fair Value
The company holds cash equivalents and bank time deposits in U.S. and non-U.S. portfolios. The instruments classified as cash equivalents are primarily bank time deposits with maturities of
90
days or less and money market funds. “Cash and cash equivalents” had carrying/fair values of
$16,245
and
$20,939
at December 31,
2013
, and December 31,
2012
, respectively. The instruments held in “Time deposits” are bank time deposits with maturities greater than
90
days, and had carrying/fair values of
$8
and
$708
at December 31,
2013
, and December 31,
2012
, respectively. The fair values of cash, cash equivalents and bank time deposits are classified as Level 1 and reflect the cash that would have been received if the instruments were settled at December 31,
2013
.
Assets and Liabilities Measured at Fair Value on a Recurring Basis
|
At December 31, 2013
|
At December 31, 2012
|
|||||||||||||||||||||||||||||||
|
Total
|
|
Level 1
|
|
Level 2
|
|
Level 3
|
|
Total
|
|
Level 1
|
|
Level 2
|
|
Level 3
|
|
|||||||||||||||||
|
Marketable securities
|
$
|
263
|
|
$
|
263
|
|
$
|
—
|
|
$
|
—
|
|
$
|
266
|
|
$
|
266
|
|
$
|
—
|
|
$
|
—
|
|
||||||||
|
Derivatives
|
28
|
|
—
|
|
28
|
|
—
|
|
86
|
|
21
|
|
65
|
|
—
|
|
||||||||||||||||
|
Total Assets at Fair Value
|
$
|
291
|
|
$
|
263
|
|
$
|
28
|
|
$
|
—
|
|
$
|
352
|
|
$
|
287
|
|
$
|
65
|
|
$
|
—
|
|
||||||||
|
Derivatives
|
89
|
|
80
|
|
9
|
|
—
|
|
149
|
|
148
|
|
1
|
|
—
|
|
||||||||||||||||
|
Total Liabilities at Fair Value
|
$
|
89
|
|
$
|
80
|
|
$
|
9
|
|
$
|
—
|
|
$
|
149
|
|
$
|
148
|
|
$
|
1
|
|
$
|
—
|
|
||||||||
Assets and Liabilities Measured at Fair Value on a Nonrecurring Basis
|
At December 31
|
At December 31
|
|||||||||||||||||||||||||||||||||||||||
|
Before-Tax Loss
|
Before-Tax Loss
|
|||||||||||||||||||||||||||||||||||||||
|
Total
|
|
Level 1
|
|
Level 2
|
|
Level 3
|
|
Year 2013
|
Total
|
|
Level 1
|
|
Level 2
|
|
Level 3
|
|
Year 2012
|
|||||||||||||||||||||||
|
Properties, plant and
equipment, net (held and used)
|
$
|
102
|
|
$
|
—
|
|
$
|
—
|
|
$
|
102
|
|
$
|
278
|
|
$
|
84
|
|
$
|
—
|
|
$
|
—
|
|
$
|
84
|
|
$
|
213
|
|
||||||||||
|
Properties, plant and
equipment, net (held for sale) |
69
|
|
—
|
|
69
|
|
—
|
|
104
|
|
16
|
|
—
|
|
—
|
|
16
|
|
17
|
|
||||||||||||||||||||
|
Investments and advances
|
38
|
|
—
|
|
35
|
|
3
|
|
228
|
|
—
|
|
—
|
|
—
|
|
—
|
|
15
|
|
||||||||||||||||||||
|
Total Nonrecurring Assets
at Fair Value
|
$
|
209
|
|
$
|
—
|
|
$
|
104
|
|
$
|
105
|
|
$
|
610
|
|
$
|
100
|
|
$
|
—
|
|
$
|
—
|
|
$
|
100
|
|
$
|
245
|
|
||||||||||
FS-33
|
Notes to the Consolidated Financial Statements
Millions of dollars, except per-share amounts
Note 9
Fair Value Measurements - Continued
|
||
"Cash and cash equivalents” do not include investments with a carrying/fair value of
$1,210
and
$1,454
at December 31,
2013
, and December 31,
2012
, respectively. At December 31,
2013
, these investments are classified as Level 1 and include restricted funds related to tax payments and certain upstream abandonment activities which are reported in “Deferred charges and other assets” on the Consolidated Balance Sheet. Long-term debt of
$11,960
and
$6,086
at
December 31, 2013
, and
December 31, 2012
, had estimated fair values of
$12,267
and
$6,770
, respectively. Long-term debt primarily includes corporate issued bonds. The fair value of corporate bonds is
$11,581
and classified as Level 1. The fair value of the other bonds is
$686
and classified as Level 2.
The carrying values of short-term financial assets and liabilities on the Consolidated Balance Sheet approximate their fair values. Fair value remeasurements of other financial instruments at December 31,
2013
and
2012
, were not material.
Note 10
Financial and Derivative Instruments
Derivative Commodity Instruments
Chevron is exposed to market risks related to price volatility of crude oil, refined products, natural gas, natural gas liquids, liquefied natural gas and refinery feedstocks.
The company uses derivative commodity instruments to manage these exposures on a portion of its activity, including firm commitments and anticipated transactions for the purchase, sale and storage of crude oil, refined products, natural gas, natural gas liquids and feedstock for company refineries. From time to time, the company also uses derivative commodity instruments for limited trading purposes.
The company’s derivative commodity instruments principally include crude oil, natural gas and refined product futures, swaps, options, and forward contracts. None of the company’s derivative instruments is designated as a hedging instrument, although certain of the company’s affiliates make such designation. The company’s derivatives are not material to the company’s financial position, results of operations or liquidity. The company believes it has no material market or credit risks to its operations, financial position or liquidity as a result of its commodity derivative activities.
The company uses derivative commodity instruments traded on the New York Mercantile Exchange and on electronic platforms of the Inter-Continental Exchange and Chicago Mercantile Exchange. In addition, the company enters into swap contracts and option contracts principally with major financial institutions and other oil and gas companies in the “over-the-counter” markets, which are governed by International Swaps and Derivatives Association agreements and other master netting arrangements. Depending on the nature of the derivative transactions, bilateral collateral arrangements may also be required.
Derivative instruments measured at fair value at December 31,
2013
, December 31,
2012
, and December 31,
2011
, and their classification on the Consolidated Balance Sheet and Consolidated Statement of Income are as follows:
Consolidated Balance Sheet: Fair Value of Derivatives Not Designated as Hedging Instruments
|
Type of
|
Balance Sheet
|
At December 31
|
|
At December 31
|
|
|||
|
Contract
|
Classification
|
2013
|
|
2012
|
|
|||
|
Commodity
|
Accounts and notes receivable, net
|
$
|
22
|
|
$
|
57
|
|
|
|
Commodity
|
Long-term receivables, net
|
6
|
|
29
|
|
|||
|
Total Assets at Fair Value
|
$
|
28
|
|
$
|
86
|
|
||
|
Commodity
|
Accounts payable
|
$
|
65
|
|
$
|
112
|
|
|
|
Commodity
|
Deferred credits and other noncurrent obligations
|
24
|
|
37
|
|
|||
|
Total Liabilities at Fair Value
|
$
|
89
|
|
$
|
149
|
|
||
Consolidated Statement of Income: The Effect of Derivatives Not Designated as Hedging Instruments
|
Gain/(Loss)
|
|||||||||||||
|
Type of Derivative
|
Statement of
|
Year ended December 31
|
|||||||||||
|
Contract
|
Income Classification
|
2013
|
|
2012
|
|
2011
|
|
||||||
|
Commodity
|
Sales and other
operating revenues |
$
|
(108
|
)
|
$
|
(49
|
)
|
$
|
(255
|
)
|
|||
|
Commodity
|
Purchased crude oil
and products |
(77
|
)
|
(24
|
)
|
15
|
|
||||||
|
Commodity
|
Other income
|
(9
|
)
|
6
|
|
(2
|
)
|
||||||
|
$
|
(194
|
)
|
$
|
(67
|
)
|
$
|
(242
|
)
|
|||||
FS-34
|
Note 10
Financial and Derivative Instruments - Continued
|
||
The table below represents gross and net derivative assets and liabilities subject to netting agreements on the Consolidated Balance Sheet at
December 31, 2013
and
December 31, 2012
.
Consolidated Balance Sheet: The Effect of Netting Derivative Assets and Liabilities
|
|
Gross Amount Recognized
|
|
Gross Amounts Offset
|
|
Net Amounts Presented
|
|
Gross Amounts Not Offset
|
|
Net Amount
|
|
||||||||||
|
At December 31, 2013
|
||||||||||||||||||||
|
Derivative Assets
|
$
|
732
|
|
$
|
704
|
|
$
|
28
|
|
$
|
27
|
|
$
|
1
|
|
|||||
|
Derivative Liabilities
|
$
|
793
|
|
$
|
704
|
|
$
|
89
|
|
$
|
—
|
|
$
|
89
|
|
|||||
|
At December 31, 2012
|
||||||||||||||||||||
|
Derivative Assets
|
$
|
749
|
|
$
|
663
|
|
$
|
86
|
|
$
|
64
|
|
$
|
22
|
|
|||||
|
Derivative Liabilities
|
$
|
812
|
|
$
|
663
|
|
$
|
149
|
|
$
|
5
|
|
$
|
144
|
|
|||||
Derivative assets and liabilities are classified on the Consolidated Balance Sheet as accounts and notes receivable, long-term receivables, accounts payable, and deferred credits and other noncurrent obligations. Amounts not offset on the Consolidated Balance Sheet represent positions that do not meet all the conditions for "a right of offset."
Concentrations of Credit Risk
The company’s financial instruments that are exposed to concentrations of credit risk consist primarily of its cash equivalents, time deposits, marketable securities, derivative financial instruments and trade receivables. The company’s short-term investments are placed with a wide array of financial institutions with high credit ratings. Company investment policies limit the company’s exposure both to credit risk and to concentrations of credit risk. Similar policies on diversification and creditworthiness are applied to the company’s counterparties in derivative instruments.
The trade receivable balances, reflecting the company’s diversified sources of revenue, are dispersed among the company’s broad customer base worldwide. As a result, the company believes concentrations of credit risk are limited. The company routinely assesses the financial strength of its customers. When the financial strength of a customer is not considered sufficient, alternative risk mitigation measures may be deployed including requiring pre-payments, letters of credit or other acceptable collateral instruments to support sales to customers.
Note 11
Operating Segments and Geographic Data
Although each subsidiary of Chevron is responsible for its own affairs, Chevron Corporation manages its investments in these subsidiaries and their affiliates. The investments are grouped into
two
business segments, Upstream and Downstream, representing the company’s “reportable segments” and “operating segments.” Upstream operations consist primarily of exploring for, developing and producing crude oil and natural gas; liquefaction, transportation and regasification associated with liquefied natural gas (LNG); transporting crude oil by major international oil export pipelines; processing, transporting, storage and marketing of natural gas; and a gas-to-liquids project. Downstream operations consist primarily of refining of crude oil into petroleum products; marketing of crude oil and refined products; transporting of crude oil and refined products by pipeline, marine vessel, motor equipment and rail car; and manufacturing and marketing of commodity petrochemicals, plastics for industrial uses, and fuel and lubricant additives. All Other activities of the company include
mining operations, power and energy services, worldwide cash management and debt financing activities, corporate administrative functions, insurance operations, real estate activities, alternative fuels, and technology companies.
The segments are separately managed for investment purposes under a structure that includes “segment managers” who report to the company’s “chief operating decision maker” (CODM). The CODM is the company’s Executive Committee (EXCOM), a committee of senior officers that includes the Chief Executive Officer, and EXCOM reports to the Board of Directors of Chevron Corporation.
The operating segments represent components of the company that engage in activities (a) from which revenues are earned and expenses are incurred; (b) whose operating results are regularly reviewed by the CODM, which makes decisions about resources to be allocated to the segments and assesses their performance; and (c) for which discrete financial information is available.
Segment managers for the reportable segments are directly accountable to and maintain regular contact with the company’s CODM to discuss the segment’s operating activities and financial performance. The CODM approves annual capital and exploratory budgets at the reportable segment level, as well as reviews capital and exploratory funding for major projects and approves major changes to the annual capital and
FS-35
|
Notes to the Consolidated Financial Statements
Millions of dollars, except per-share amounts
Note 11
Operating Segments and Geographic Data - Continued
|
||
exploratory budgets. However, business-unit managers within the operating segments are directly responsible for decisions relating to project implementation and all other matters connected with daily operations. Company officers who are members of the EXCOM also have individual management responsibilities and participate in other committees for purposes other than acting as the CODM.
The company’s primary country of operation is the United States of America, its country of domicile. Other components of the company’s operations are reported as "International” (outside the United States).
Segment Earnings
The company evaluates the performance of its operating segments on an after-tax basis, without considering the effects of debt financing interest expense or investment interest income, both of which are managed by the company on a worldwide basis. Corporate administrative costs and assets are not allocated to the operating segments. However, operating segments are billed for the direct use of corporate services. Nonbillable costs remain at the corporate level in “All Other.” Earnings by major operating area are presented in the following table:
|
Year ended December 31
|
||||||||||||
|
2013
|
|
2012
|
|
2011
|
|
|||||||
|
Segment Earnings
|
||||||||||||
|
Upstream
|
||||||||||||
|
United States
|
$
|
4,044
|
|
$
|
5,332
|
|
$
|
6,512
|
|
|||
|
International
|
16,765
|
|
18,456
|
|
18,274
|
|
||||||
|
Total Upstream
|
20,809
|
|
23,788
|
|
24,786
|
|
||||||
|
Downstream
|
||||||||||||
|
United States
|
787
|
|
2,048
|
|
1,506
|
|
||||||
|
International
|
1,450
|
|
2,251
|
|
2,085
|
|
||||||
|
Total Downstream
|
2,237
|
|
4,299
|
|
3,591
|
|
||||||
|
Total Segment Earnings
|
23,046
|
|
28,087
|
|
28,377
|
|
||||||
|
All Other
|
||||||||||||
|
Interest income
|
80
|
|
83
|
|
78
|
|
||||||
|
Other
|
(1,703
|
)
|
(1,991
|
)
|
(1,560
|
)
|
||||||
|
Net Income Attributable
to Chevron Corporation |
$
|
21,423
|
|
$
|
26,179
|
|
$
|
26,895
|
|
|||
Segment Assets
Segment assets do not include intercompany investments or intercompany receivables. Segment assets at year-end
2013
and
2012
are as follows:
|
At December 31
|
||||||||
|
2013
|
|
2012
|
|
|||||
|
Upstream
|
||||||||
|
United States
|
$
|
45,436
|
|
$
|
41,891
|
|
||
|
International
|
137,096
|
|
115,806
|
|
||||
|
Goodwill
|
4,639
|
|
4,640
|
|
||||
|
Total Upstream
|
187,171
|
|
162,337
|
|
||||
|
Downstream
|
||||||||
|
United States
|
23,829
|
|
23,023
|
|
||||
|
International
|
20,268
|
|
20,024
|
|
||||
|
Total Downstream
|
44,097
|
|
43,047
|
|
||||
|
Total Segment Assets
|
231,268
|
|
205,384
|
|
||||
|
All Other
|
||||||||
|
United States
|
7,326
|
|
7,727
|
|
||||
|
International
|
15,159
|
|
19,871
|
|
||||
|
Total All Other
|
22,485
|
|
27,598
|
|
||||
|
Total Assets – United States
|
76,591
|
|
72,641
|
|
||||
|
Total Assets – International
|
172,523
|
|
155,701
|
|
||||
|
Goodwill
|
4,639
|
|
4,640
|
|
||||
|
Total Assets
|
$
|
253,753
|
|
$
|
232,982
|
|
||
Segment Sales and Other Operating Revenues
Operating segment sales and other operating revenues, including internal transfers, for the years
2013
,
2012
and
2011
, are presented in the table that follows. Products are transferred between operating segments at internal product values that approximate market prices.
Revenues for the upstream segment are derived primarily from the production and sale of crude oil and natural gas, as well as the sale of third-party production of natural gas. Revenues for the downstream segment are derived from the refining and marketing of petroleum products such as gasoline, jet fuel, gas oils, lubricants, residual fuel oils and other products derived from crude oil. This segment also generates revenues from the manufacture and sale of additives for fuels and lubricant oils and the transportation and trading of refined products, crude oil and natural gas liquids.
FS-36
|
Note 11
Operating Segments and Geographic Data - Continued
|
||
|
Year ended December 31
|
||||||||||||
|
2013
|
|
2012
|
|
2011
|
|
|||||||
|
Upstream
|
||||||||||||
|
United States
|
$
|
8,052
|
|
$
|
6,416
|
|
$
|
9,623
|
|
|||
|
Intersegment
|
16,865
|
|
17,229
|
|
18,115
|
|
||||||
|
Total United States
|
24,917
|
|
23,645
|
|
27,738
|
|
||||||
|
International
|
17,607
|
|
19,459
|
|
20,086
|
|
||||||
|
Intersegment
|
33,034
|
|
34,094
|
|
35,012
|
|
||||||
|
Total International
|
50,641
|
|
53,553
|
|
55,098
|
|
||||||
|
Total Upstream
|
75,558
|
|
77,198
|
|
82,836
|
|
||||||
|
Downstream
|
||||||||||||
|
United States
|
80,272
|
|
83,043
|
|
86,793
|
|
||||||
|
Excise and similar taxes
|
4,792
|
|
4,665
|
|
4,199
|
|
||||||
|
Intersegment
|
39
|
|
49
|
|
86
|
|
||||||
|
Total United States
|
85,103
|
|
87,757
|
|
91,078
|
|
||||||
|
International
|
105,373
|
|
113,279
|
|
119,254
|
|
||||||
|
Excise and similar taxes
|
3,699
|
|
3,346
|
|
3,886
|
|
||||||
|
Intersegment
|
859
|
|
80
|
|
81
|
|
||||||
|
Total International
|
109,931
|
|
116,705
|
|
123,221
|
|
||||||
|
Total Downstream
|
195,034
|
|
204,462
|
|
214,299
|
|
||||||
|
All Other
|
||||||||||||
|
United States
|
358
|
|
378
|
|
526
|
|
||||||
|
Intersegment
|
1,524
|
|
1,300
|
|
1,072
|
|
||||||
|
Total United States
|
1,882
|
|
1,678
|
|
1,598
|
|
||||||
|
International
|
3
|
|
4
|
|
4
|
|
||||||
|
Intersegment
|
31
|
|
48
|
|
42
|
|
||||||
|
Total International
|
34
|
|
52
|
|
46
|
|
||||||
|
Total All Other
|
1,916
|
|
1,730
|
|
1,644
|
|
||||||
|
Segment Sales and Other
Operating Revenues |
||||||||||||
|
United States
|
111,902
|
|
113,080
|
|
120,414
|
|
||||||
|
International
|
160,606
|
|
170,310
|
|
178,365
|
|
||||||
|
Total Segment Sales and Other
Operating Revenues |
272,508
|
|
283,390
|
|
298,779
|
|
||||||
|
Elimination of intersegment sales
|
(52,352
|
)
|
(52,800
|
)
|
(54,408
|
)
|
||||||
|
Total Sales and Other
Operating Revenues |
$
|
220,156
|
|
$
|
230,590
|
|
$
|
244,371
|
|
|||
Segment Income Taxes
Segment income tax expense for the years
2013
,
2012
and
2011
is as follows:
|
Year ended December 31
|
||||||||||||
|
2013
|
|
2012
|
|
2011
|
|
|||||||
|
Upstream
|
||||||||||||
|
United States
|
$
|
2,333
|
|
$
|
2,820
|
|
$
|
3,701
|
|
|||
|
International
|
12,470
|
|
16,554
|
|
16,743
|
|
||||||
|
Total Upstream
|
14,803
|
|
19,374
|
|
20,444
|
|
||||||
|
Downstream
|
||||||||||||
|
United States
|
364
|
|
1,051
|
|
785
|
|
||||||
|
International
|
389
|
|
587
|
|
416
|
|
||||||
|
Total Downstream
|
753
|
|
1,638
|
|
1,201
|
|
||||||
|
All Other
|
(1,248
|
)
|
(1,016
|
)
|
(1,019
|
)
|
||||||
|
Total Income Tax Expense
|
$
|
14,308
|
|
$
|
19,996
|
|
$
|
20,626
|
|
|||
Other Segment Information
Additional information for the segmentation of major equity affiliates is contained in Note 12. Information related to properties, plant and equipment by segment is contained in Note 13, on page FS-39.
Note 12
Investments and Advances
Equity in earnings, together with investments in and advances to companies accounted for using the equity method and other investments accounted for at or below cost, is shown in the following table. For certain equity affiliates, Chevron pays its share of some income taxes directly. For such affiliates, the equity in earnings does not include these taxes, which are reported on the Consolidated Statement of Income as “Income tax expense.”
|
Investments and Advances
|
Equity in Earnings
|
|||||||||||||||||||
|
At December 31
|
Year ended December 31
|
|||||||||||||||||||
|
2013
|
|
2012
|
|
2013
|
|
2012
|
|
2011
|
|
|||||||||||
|
Upstream
|
||||||||||||||||||||
|
Tengizchevroil
|
$
|
5,875
|
|
$
|
5,451
|
|
$
|
4,957
|
|
$
|
4,614
|
|
$
|
5,097
|
|
|||||
|
Petropiar
|
858
|
|
952
|
|
339
|
|
55
|
|
116
|
|
||||||||||
|
Caspian Pipeline Consortium
|
1,298
|
|
1,187
|
|
113
|
|
96
|
|
122
|
|
||||||||||
|
Petroboscan
|
1,375
|
|
1,261
|
|
300
|
|
229
|
|
247
|
|
||||||||||
|
Angola LNG Limited
|
3,423
|
|
3,186
|
|
(111
|
)
|
(106
|
)
|
(42
|
)
|
||||||||||
|
Other
|
2,835
|
|
2,658
|
|
214
|
|
266
|
|
166
|
|
||||||||||
|
Total Upstream
|
15,664
|
|
14,695
|
|
5,812
|
|
5,154
|
|
5,706
|
|
||||||||||
|
Downstream
|
||||||||||||||||||||
|
GS Caltex Corporation
|
2,518
|
|
2,610
|
|
132
|
|
249
|
|
248
|
|
||||||||||
|
Chevron Phillips Chemical Company LLC
|
4,312
|
|
3,451
|
|
1,371
|
|
1,206
|
|
985
|
|
||||||||||
|
Star Petroleum Refining Company Ltd.
|
—
|
|
—
|
|
—
|
|
22
|
|
75
|
|
||||||||||
|
Caltex Australia Ltd.
|
1,020
|
|
835
|
|
224
|
|
77
|
|
117
|
|
||||||||||
|
Other
|
989
|
|
837
|
|
199
|
|
196
|
|
183
|
|
||||||||||
|
Total Downstream
|
8,839
|
|
7,733
|
|
1,926
|
|
1,750
|
|
1,608
|
|
||||||||||
|
All Other
|
||||||||||||||||||||
|
Other
|
375
|
|
640
|
|
(211
|
)
|
(15
|
)
|
49
|
|
||||||||||
|
Total equity method
|
$
|
24,878
|
|
$
|
23,068
|
|
$
|
7,527
|
|
$
|
6,889
|
|
$
|
7,363
|
|
|||||
|
Other at or below cost
|
624
|
|
650
|
|
||||||||||||||||
|
Total investments and advances
|
$
|
25,502
|
|
$
|
23,718
|
|
||||||||||||||
|
Total United States
|
$
|
6,638
|
|
$
|
5,788
|
|
$
|
1,294
|
|
$
|
1,268
|
|
$
|
1,119
|
|
|||||
|
Total International
|
$
|
18,864
|
|
$
|
17,930
|
|
$
|
6,233
|
|
$
|
5,621
|
|
$
|
6,244
|
|
|||||
Descriptions of major affiliates, including significant differences between the company’s carrying value of its investments and its underlying equity in the net assets of the affiliates, are as follows:
Tengizchevroil
Chevron has a
50 percent
equity ownership interest in Tengizchevroil (TCO), which was formed in
1993
to develop the Tengiz and Korolev crude oil fields in Kazakhstan over a
40
-year period. At December 31,
2013
, the company’s carrying value of its investment in TCO was about
$160
higher than the amount of underlying equity in TCO’s net assets. This difference results from Chevron acquiring a portion of its interest in TCO at a value greater than the underlying book value for that portion of TCO’s net assets. See Note 7, on page FS-32, for summarized financial information for
100 percent
of TCO.
FS-37
|
Notes to the Consolidated Financial Statements
Millions of dollars, except per-share amounts
Note 12
Investments and Advances - Continued
|
||
Petropiar
Chevron has a
30 percent
interest in Petropiar, a joint stock company formed in
2008
to operate the Hamaca heavy-oil production and upgrading project. The project, located in Venezuela’s Orinoco Belt, has a
25
-year contract term. Prior to the formation of Petropiar, Chevron had a
30 percent
interest in the Hamaca project. At December 31,
2013
, the company’s carrying value of its investment in Petropiar was approximately
$170
less than the amount of underlying equity in Petropiar’s net assets. The difference represents the excess of Chevron’s underlying equity in Petropiar’s net assets over the net book value of the assets contributed to the venture.
Caspian Pipeline Consortium
Chevron has a
15 percent
interest in the Caspian Pipeline Consortium, a variable interest entity, which provides the critical export route for crude oil from both TCO and Karachaganak. The company joined the consortium in
1997
and has investments and advances totaling
$1,298
, which includes long-term loans of
$1,251
at year-end
2013
. The loans were provided to fund
30 percent
of the initial pipeline construction. The company is not the primary beneficiary of the consortium because it does not direct activities of the consortium and only receives its proportionate share of the financial returns.
Petroboscan
Chevron has a
39 percent
interest in Petroboscan, a joint stock company formed in
2006
to operate the Boscan Field in Venezuela until
2026
. Chevron previously operated the field under an operating service agreement. At December 31,
2013
, the company’s carrying value of its investment in Petroboscan was approximately
$180
higher than the amount of underlying equity in Petroboscan’s net assets. The difference reflects the excess of the net book value of the assets contributed by Chevron over its underlying equity in Petroboscan’s net assets. In 2013, Chevron finalized a financial agreement with Petroboscan.
The financing, not to exceed
$2 billion
, will occur in stages over a
limited
drawdown period set to expire on December 31, 2018. The loan will support a specific work program to maintain and increase production to an agreed-upon level. The terms are designed to support cash needs for ongoing operations and new development, as well as distributions.
Angola LNG Ltd.
Chevron has a
36 percent
interest in Angola LNG Ltd., which processes and liquefies natural gas produced in Angola for delivery to international markets.
GS Caltex Corporation
Chevron owns
50 percent
of GS Caltex Corporation, a joint venture with GS Energy. The joint venture imports, refines and markets petroleum products and petrochemicals, predominantly in South Korea.
Chevron Phillips Chemical Company LLC
Chevron owns
50 percent
of Chevron Phillips Chemical Company LLC. The other half is owned by Phillips 66.
Caltex Australia Ltd.
Chevron has a
50 percent
equity ownership interest in Caltex Australia Ltd. (CAL). The remaining
50 percent
of CAL is publicly owned. At December 31,
2013
, the fair value of Chevron’s share of CAL common stock was approximately
$2,400
.
Other Information
“Sales and other operating revenues” on the Consolidated Statement of Income includes
$14,635
,
$17,356
and
$20,164
with affiliated companies for
2013
,
2012
and
2011
, respectively. “Purchased crude oil and products” includes
$7,063
,
$6,634
and
$7,489
with affiliated companies for
2013
,
2012
and
2011
, respectively.
“Accounts and notes receivable” on the Consolidated Balance Sheet includes
$1,328
and
$1,207
due from affiliated companies at December 31,
2013
and
2012
, respectively. “Accounts payable” includes
$466
and
$407
due to affiliated companies at December 31,
2013
and
2012
, respectively.
The following table provides summarized financial information on a
100 percent
basis for all equity affiliates as well as Chevron’s total share, which includes Chevron's net loans to affiliates of
$1,129
,
$1,494
and
$957
at December 31,
2013
,
2012
and
2011
, respectively.
|
Affiliates
|
Chevron Share
|
|||||||||||||||||||||||
|
Year ended December 31
|
2013
|
|
2012
|
|
2011
|
|
2013
|
|
2012
|
|
2011
|
|
||||||||||||
|
Total revenues
|
$
|
131,875
|
|
$
|
136,065
|
|
$
|
140,107
|
|
$
|
63,101
|
|
$
|
65,196
|
|
$
|
68,632
|
|
||||||
|
Income before income tax expense
|
24,075
|
|
23,016
|
|
23,054
|
|
11,108
|
|
9,856
|
|
10,555
|
|
||||||||||||
|
Net income attributable to affiliates
|
15,594
|
|
16,786
|
|
16,663
|
|
7,845
|
|
6,938
|
|
7,413
|
|
||||||||||||
|
At December 31
|
||||||||||||||||||||||||
|
Current assets
|
$
|
39,713
|
|
$
|
37,541
|
|
$
|
35,573
|
|
$
|
15,156
|
|
$
|
14,732
|
|
$
|
14,695
|
|
||||||
|
Noncurrent assets
|
68,593
|
|
66,065
|
|
61,855
|
|
25,059
|
|
23,523
|
|
22,422
|
|
||||||||||||
|
Current liabilities
|
29,642
|
|
27,878
|
|
24,671
|
|
11,587
|
|
11,093
|
|
11,040
|
|
||||||||||||
|
Noncurrent liabilities
|
19,442
|
|
19,366
|
|
19,267
|
|
4,559
|
|
4,879
|
|
4,491
|
|
||||||||||||
|
Total affiliates’ net equity
|
$
|
59,222
|
|
$
|
56,362
|
|
$
|
53,490
|
|
$
|
24,069
|
|
$
|
22,283
|
|
$
|
21,586
|
|
||||||
FS-38
|
Note 13 Properties, Plant and Equipment |
Note 13
Properties, Plant and Equipment
1
|
At December 31
|
Year ended December 31
|
|||||||||||||||||||||||||||||||||||||||||||||||||
|
Gross Investment at Cost
|
Net Investment
|
Additions at Cost
2,3
|
Depreciation Expense
4
|
|||||||||||||||||||||||||||||||||||||||||||||||
|
2013
|
|
|
2012
|
|
|
2011
|
|
|
|
2013
|
|
|
2012
|
|
|
2011
|
|
|
|
2013
|
|
|
2012
|
|
|
2011
|
|
|
|
2013
|
|
|
2012
|
|
|
2011
|
|
|||||||||||||
|
Upstream
|
|
|
|
|
|
|
|
|
|
|
|
|
|
|
|
|
|
|
|
|
|
|
|
|
|
|
||||||||||||||||||||||||
|
United States
|
$
|
89,555
|
|
|
$
|
81,908
|
|
|
$
|
74,369
|
|
|
|
$
|
41,831
|
|
|
$
|
37,909
|
|
|
$
|
33,461
|
|
|
|
$
|
8,188
|
|
|
$
|
8,211
|
|
|
$
|
14,404
|
|
|
|
$
|
4,412
|
|
|
$
|
3,902
|
|
|
$
|
3,870
|
|
|
International
|
169,623
|
|
|
145,799
|
|
|
125,795
|
|
|
|
104,100
|
|
|
85,318
|
|
|
72,543
|
|
|
|
27,383
|
|
|
21,343
|
|
|
15,722
|
|
|
|
8,336
|
|
|
8,015
|
|
|
7,590
|
|
||||||||||||
|
Total Upstream
|
259,178
|
|
|
227,707
|
|
|
200,164
|
|
|
|
145,931
|
|
|
123,227
|
|
|
106,004
|
|
|
|
35,571
|
|
|
29,554
|
|
|
30,126
|
|
|
|
12,748
|
|
|
11,917
|
|
|
11,460
|
|
||||||||||||
|
Downstream
|
|
|
|
|
|
|
|
|
|
|
|
|
|
|
|
|
|
|
|
|
|
|
|
|
|
|
||||||||||||||||||||||||
|
United States
|
22,407
|
|
|
21,792
|
|
|
20,699
|
|
|
|
11,481
|
|
|
11,333
|
|
|
10,723
|
|
|
|
1,154
|
|
|
1,498
|
|
|
1,226
|
|
|
|
780
|
|
|
799
|
|
|
776
|
|
||||||||||||
|
International
|
9,303
|
|
|
8,990
|
|
|
7,422
|
|
|
|
4,139
|
|
|
3,930
|
|
|
2,995
|
|
|
|
653
|
|
|
2,544
|
|
|
443
|
|
|
|
360
|
|
|
308
|
|
|
332
|
|
||||||||||||
|
Total Downstream
|
31,710
|
|
|
30,782
|
|
|
28,121
|
|
|
|
15,620
|
|
|
15,263
|
|
|
13,718
|
|
|
|
1,807
|
|
|
4,042
|
|
|
1,669
|
|
|
|
1,140
|
|
|
1,107
|
|
|
1,108
|
|
||||||||||||
|
All Other
5
|
|
|
|
|
|
|
|
|
|
|
|
|
|
|
|
|
|
|
|
|
|
|
|
|
|
|
||||||||||||||||||||||||
|
United States
|
5,402
|
|
|
4,959
|
|
|
5,117
|
|
|
|
3,194
|
|
|
2,845
|
|
|
2,872
|
|
|
|
721
|
|
|
415
|
|
|
591
|
|
|
|
286
|
|
|
384
|
|
|
338
|
|
||||||||||||
|
International
|
143
|
|
|
33
|
|
|
30
|
|
|
|
84
|
|
|
13
|
|
|
14
|
|
|
|
23
|
|
|
4
|
|
|
5
|
|
|
|
12
|
|
|
5
|
|
|
5
|
|
||||||||||||
|
Total All Other
|
5,545
|
|
|
4,992
|
|
|
5,147
|
|
|
|
3,278
|
|
|
2,858
|
|
|
2,886
|
|
|
|
744
|
|
|
419
|
|
|
596
|
|
|
|
298
|
|
|
389
|
|
|
343
|
|
||||||||||||
|
Total United States
|
117,364
|
|
|
108,659
|
|
|
100,185
|
|
|
|
56,506
|
|
|
52,087
|
|
|
47,056
|
|
|
|
10,063
|
|
|
10,124
|
|
|
16,221
|
|
|
|
5,478
|
|
|
5,085
|
|
|
4,984
|
|
||||||||||||
|
Total International
|
179,069
|
|
|
154,822
|
|
|
133,247
|
|
|
|
108,323
|
|
|
89,261
|
|
|
75,552
|
|
|
|
28,059
|
|
|
23,891
|
|
|
16,170
|
|
|
|
8,708
|
|
|
8,328
|
|
|
7,927
|
|
||||||||||||
|
Total
|
$
|
296,433
|
|
|
$
|
263,481
|
|
|
$
|
233,432
|
|
|
|
$
|
164,829
|
|
|
$
|
141,348
|
|
|
$
|
122,608
|
|
|
|
$
|
38,122
|
|
|
$
|
34,015
|
|
|
$
|
32,391
|
|
|
|
$
|
14,186
|
|
|
$
|
13,413
|
|
|
$
|
12,911
|
|
|
1
|
Other than the United States, Australia and Nigeria, no other country accounted for
10
percent or more of the company’s net properties, plant and equipment (PP&E) in
2013
. Australia had
$31,464
,
$21,770
and
$12,423
in
2013
,
2012
, and 2011, respectively. Nigeria had PP&E of
$18,429
,
$17,485
and
$15,601
for
2013
,
2012
and
2011
, respectively.
|
|
2
|
Net of dry hole expense related to prior years’ expenditures of
$89
,
$80
and
$45
in
2013
,
2012
and
2011
, respectively.
|
|
3
|
Includes properties acquired with the acquisition of Atlas Energy, Inc., in 2011.
|
|
4
|
Depreciation expense includes accretion expense of
$627
,
$629
and
$628
in
2013
,
2012
and
2011
, respectively.
|
|
5
|
Primarily mining operations, power and energy services, real estate assets and management information systems.
|
Note 14
Litigation
MTBE
Chevron and many other companies in the petroleum industry have used methyl tertiary butyl ether (MTBE) as a gasoline additive. Chevron is a party to
ten
pending lawsuits and claims, the majority of which involve numerous other petroleum marketers and refiners. Resolution of these lawsuits and claims may ultimately require the company to correct or ameliorate the alleged effects on the environment of prior release of MTBE by the company or other parties. Additional lawsuits and claims related to the use of MTBE, including personal-injury claims, may be filed in the future. The company’s ultimate exposure related to pending lawsuits and claims is not determinable. The company no longer uses MTBE in the manufacture of gasoline in the United States.
Ecuador
Chevron is a defendant in a civil lawsuit initiated in the Superior Court of Nueva Loja in Lago Agrio, Ecuador, in May 2003 by plaintiffs who claim to be representatives of certain residents of an area where an oil production consortium formerly had operations. The lawsuit alleges damage to the environment from the oil exploration and production operations and seeks unspecified damages to fund environmental remediation and restoration of the alleged environmental harm, plus a health monitoring program. Until 1992, Texaco Petroleum Company (Texpet), a subsidiary of Texaco Inc., was a minority member of this consortium with Petroecuador, the Ecuadorian state-owned oil
company, as the majority partner; since 1990, the operations have been conducted solely by Petroecuador. At the conclusion of the consortium and following an independent third-party environmental audit of the concession area, Texpet entered into a formal agreement with the Republic of Ecuador and Petroecuador for Texpet to remediate specific sites assigned by the government in proportion to Texpet’s ownership share of the consortium. Pursuant to that agreement, Texpet conducted a
three
-year remediation program at a cost of
$40
. After certifying that the sites were properly remediated, the government granted Texpet and all related corporate entities a full release from any and all environmental liability arising from the consortium operations.
Based on the history described above, Chevron believes that this lawsuit lacks legal or factual merit. As to matters of law, the company believes first, that the court lacks jurisdiction over Chevron; second, that the law under which plaintiffs bring the action, enacted in 1999, cannot be applied retroactively; third, that the claims are barred by the statute of limitations in Ecuador; and, fourth, that the lawsuit is also barred by the releases from liability previously given to Texpet by the Republic of Ecuador and Petroecuador and by the pertinent provincial and municipal governments. With regard to the facts, the company believes that the evidence confirms that Texpet’s remediation was properly conducted and that the remaining environmental damage reflects Petroecuador’s
FS-39
|
Notes to the Consolidated Financial Statements
Millions of dollars, except per-share amounts
Note 14
Litigation - Continued
|
||
failure to timely fulfill its legal obligations and Petroecuador’s further conduct since assuming full control over the operations.
In 2008, a mining engineer appointed by the court to identify and determine the cause of environmental damage, and to specify steps needed to remediate it, issued a report recommending that the court assess
$18,900
, which would, according to the engineer, provide financial compensation for purported damages, including wrongful death claims, and pay for, among other items, environmental remediation, health care systems and additional infrastructure for Petroecuador. The engineer’s report also asserted that an additional
$8,400
could be assessed against Chevron for unjust enrichment. In 2009, following the disclosure by Chevron of evidence that the judge participated in meetings in which businesspeople and individuals holding themselves out as government officials discussed the case and its likely outcome, the judge presiding over the case was recused. In 2010, Chevron moved to strike the mining engineer’s report and to dismiss the case based on evidence obtained through discovery in the United States indicating that the report was prepared by consultants for the plaintiffs before being presented as the mining engineer’s independent and impartial work and showing further evidence of misconduct. In August 2010, the judge issued an order stating that he was not bound by the mining engineer’s report and requiring the parties to provide their positions on damages within
45 days
. Chevron subsequently petitioned for recusal of the judge, claiming that he had disregarded evidence of fraud and misconduct and that he had failed to rule on a number of motions within the statutory time requirement.
In September 2010, Chevron submitted its position on damages, asserting that no amount should be assessed against it. The plaintiffs’ submission, which relied in part on the mining engineer’s report, took the position that damages are between approximately
$16,000
and
$76,000
and that unjust enrichment should be assessed in an amount between approximately
$5,000
and
$38,000
. The next day, the judge issued an order closing the evidentiary phase of the case and notifying the parties that he had requested the case file so that he could prepare a judgment. Chevron petitioned to have that order declared a nullity in light of Chevron’s prior recusal petition, and because procedural and evidentiary matters remained unresolved. In October 2010, Chevron’s motion to recuse the judge was granted. A new judge took charge of the case and revoked the prior judge’s order closing the evidentiary phase of the case. On December 17, 2010, the judge issued an order closing the evidentiary phase of the case and notifying the parties that he had requested the case file so that he could prepare a judgment.
On February 14, 2011, the provincial court in Lago Agrio rendered an adverse judgment in the case. The court rejected
Chevron’s defenses to the extent the court addressed them in its opinion. The judgment assessed approximately
$8,600
in damages and approximately
$900
as an award for the plaintiffs’ representatives. It also assessed an additional amount of approximately
$8,600
in punitive damages unless the company issued a public apology within
15 days
of the judgment, which Chevron did not do. On February 17, 2011, the plaintiffs appealed the judgment, seeking increased damages, and on March 11, 2011, Chevron appealed the judgment seeking to have the judgment
nullified. On January 3, 2012, an appellate panel in the provincial court affirmed the February 14, 2011 decision and ordered that Chevron pay additional attorneys’ fees in the amount of “
0.10%
of the values that are derived from the decisional act of this judgment.” The plaintiffs filed a petition to clarify and amplify the appellate decision on January 6, 2012, and the court issued a ruling in response on January 13, 2012, purporting to clarify and amplify its January 3, 2012 ruling, which included clarification that the deadline for the company to issue a public apology to avoid the additional amount of approximately
$8,600
in punitive damages was within
15 days
of the clarification ruling, or February 3, 2012. Chevron did not issue an apology because doing so might be mischaracterized as an admission of liability and would be contrary to facts and evidence submitted at trial. On January 20, 2012, Chevron appealed (called a petition for cassation) the appellate panel’s decision to Ecuador’s National Court of Justice. As part of the appeal, Chevron requested the suspension of any requirement that Chevron post a bond to prevent enforcement under Ecuadorian law of the judgment during the cassation appeal. On February 17, 2012, the appellate panel of the provincial court admitted Chevron’s cassation appeal in a procedural step necessary for the National Court of Justice to hear the appeal. The provincial court appellate panel denied Chevron’s request for a suspension of the requirement that Chevron post a bond and stated that it would not comply with the First and Second Interim Awards of the international arbitration tribunal discussed on the next page. On March 29, 2012, the matter was transferred from the provincial court to the National Court of Justice, and on November 22, 2012, the National Court agreed to hear Chevron's cassation appeal. On August 3, 2012, the provincial court in Lago Agrio approved a court-appointed liquidator’s report on damages that calculated the total judgment in the case to be
$19,100
. On November 13, 2013, the National Court ratified the judgment but nullified the
$8,600
punitive damage assessment, resulting in a judgment of
$9,500
. On December 23, 2013, Chevron appealed the decision to the Ecuador Constitutional Court, Ecuador's highest court.
FS-40
|
Note 14
Litigation - Continued
|
||
On July 2, 2013, the provincial court in Lago Agrio issued an embargo order in Ecuador ordering that any funds to be paid by the Government of Ecuador to Chevron to satisfy a
$96
award issued in an unrelated action by an arbitral tribunal presiding in the Permanent Court of Arbitration in The Hague under the Rules of the United Nations Commission on International Trade Law must be paid to the Lago Agrio plaintiffs. The award was issued by the tribunal under the United States-Ecuador Bilateral Investment Treaty in an action filed in 2006 in connection with seven breach of contract cases that Texpet filed against the Government of Ecuador between 1991 and 1993. The Government of Ecuador has appealed the tribunal's award. A Federal District Court for the District of Columbia confirmed the tribunal's award, and the Government of Ecuador has appealed the District Court's decision.
Chevron has no assets in Ecuador and the Lago Agrio plaintiffs' lawyers have stated in press releases and through other media that they will seek to enforce the Ecuadorian judgment in various countries and otherwise disrupt Chevron's operations. On May 30, 2012, the Lago Agrio plaintiffs filed an action against Chevron Corporation, Chevron Canada Limited, and Chevron Canada Finance Limited in the Ontario Superior Court of Justice in Ontario, Canada, seeking to recognize and enforce the Ecuadorian judgment. On May 1, 2013, the Ontario Superior Court of Justice held that the Court has jurisdiction over Chevron and Chevron Canada Limited for purposes of the action, but stayed the action due to the absence of evidence that Chevron Corporation has assets in Ontario. The Lago Agrio plaintiffs appealed that decision. On December 17, 2013, the Court of Appeals for Ontario affirmed the lower court’s decision on jurisdiction and set aside the stay, allowing the recognition and enforcement action to be heard in the Ontario Superior Court of Justice. Chevron has appealed the decision concerning jurisdiction to the Supreme Court of Canada and, on January 16, 2014, the Court of Appeals for Ontario granted Chevron’s motion to stay the recognition and enforcement proceeding pending a decision on the admissibility of the Supreme Court appeal.
On June 27, 2012, the Lago Agrio plaintiffs filed an action against Chevron Corporation in the Superior Court of Justice in Brasilia, Brazil, seeking to recognize and enforce the Ecuadorian judgment. On October 15, 2012, the provincial court in Lago Agrio issued an ex parte embargo order that purports to order the seizure of assets belonging to separate Chevron subsidiaries in Ecuador, Argentina and Colombia. On November 6, 2012, at the request of the Lago Agrio plaintiffs, a court in Argentina issued a Freeze Order against Chevron Argentina S.R.L. and another Chevron subsidiary, Ingeniero Nortberto Priu, requiring shares of both companies to be "embargoed," requiring third parties to withhold
40 percent
of any payments due to Chevron Argentina S.R.L. and ordering banks to withhold
40 percent
of the funds in Chevron Argentina S.R.L. bank accounts. On December 14th, 2012, the Argentinean court rejected a motion to revoke the Freeze Order but modified it by ordering that third parties are not required to withhold funds but must report their payments. The court also clarified that the Freeze Order relating to bank accounts excludes taxes. On January 30, 2013, an appellate court upheld the Freeze Order, but on June 4, 2013 the Supreme Court of Argentina revoked the Freeze Order in its entirety. On December 12, 2013,
the Lago Agrio plaintiffs served Chevron with notice of their filing of an enforcement proceeding in the National Court, First Instance, of Argentina. Chevron intends to vigorously defend against the proceeding. Chevron continues to believe the provincial court’s judgment is illegitimate and unenforceable in Ecuador, the United States and other countries. The company also believes the judgment is the product of fraud, and contrary to the legitimate scientific evidence. Chevron cannot predict the timing or ultimate outcome of the appeals process in Ecuador or any enforcement action. Chevron expects to continue a vigorous defense of any imposition of liability in the Ecuadorian courts and to contest and defend any and all enforcement actions.
Chevron and Texpet filed an arbitration claim in September 2009 against the Republic of Ecuador before an arbitral tribunal presiding in the Permanent Court of Arbitration in The Hague under the Rules of the United Nations Commission on International Trade Law. The claim alleges violations of the Republic of Ecuador’s obligations under the United States–Ecuador Bilateral Investment Treaty (BIT) and breaches of the settlement and release agreements between the Republic of Ecuador and Texpet (described above), which are investment agreements protected by the BIT. Through the arbitration, Chevron and Texpet are seeking relief against the Republic of Ecuador, including a declaration that any judgment against Chevron in the Lago Agrio litigation constitutes a violation of Ecuador’s obligations under the BIT. On February 9, 2011, the Tribunal issued an Order for Interim Measures requiring the Republic of Ecuador to take all measures at its disposal to suspend or cause to be suspended the enforcement or recognition within and without Ecuador of any judgment against Chevron in the Lago Agrio case pending further order of the Tribunal. On January 25, 2012, the Tribunal converted the Order for Interim Measures into an Interim Award. Chevron filed a renewed application for further interim measures on January 4, 2012, and the Republic of Ecuador opposed Chevron’s application and requested that the existing Order for Interim Measures be vacated on January 9, 2012. On February 16,
FS-41
|
Notes to the Consolidated Financial Statements
Millions of dollars, except per-share amounts
Note 14
Litigation - Continued
|
||
2012, the Tribunal issued a Second Interim Award mandating that the Republic of Ecuador take all measures necessary (whether by its judicial, legislative or executive branches) to suspend or cause to be suspended the enforcement and recognition within and without Ecuador of the judgment against Chevron and, in particular, to preclude any certification by the Republic of Ecuador that would cause the judgment to be enforceable against Chevron. On February 27, 2012, the Tribunal issued a Third Interim Award confirming its jurisdiction to hear Chevron's arbitration claims. On February 7, 2013, the Tribunal issued its Fourth Interim Award in which it declared that the Republic of Ecuador “has violated the First and Second Interim Awards under the [BIT], the UNCITRAL Rules and international law in regard to the finalization and enforcement subject to execution of the Lago Agrio Judgment within and outside Ecuador, including (but not limited to) Canada, Brazil and Argentina.” The Tribunal has divided the merits phase of the proceeding into three phases. On September 17, 2013, the Tribunal issued its First Partial Award from Phase One, finding that the settlement agreements between the Republic of Ecuador and Texpet applied to Texpet and Chevron, released Texpet and Chevron from claims based on "collective" or "diffuse" rights arising from Texpet's operations in the former concession area and precluded third parties from asserting collective/diffuse rights environmental claims relating to Texpet's operations in the former concession area but did not preclude individual claims for personal harm. Chevron expects that the application of this ruling will be considered by the Tribunal in Phase Two, including a determination whether the claims of the Lago Agrio plaintiffs are individual or collective/diffuse. The Tribunal had set Phase Two to begin on January 20, 2014 to hear Chevron's denial of justice claims, but on January 2, 2014, the Tribunal postponed Phase Two and held a procedural hearing on January 20-21, 2014. The Tribunal set a hearing on April 28-30, 2014 to address remaining issues relating to Phase One. It also set a hearing on April 20 to May 6, 2015 to address Phase Two issues. The Tribunal has not set a date for Phase Three, which will be the damages phase of the arbitration.
Through a series of U.S. court proceedings initiated by Chevron to obtain discovery relating to the Lago Agrio litigation and the BIT arbitration, Chevron obtained evidence that it believes shows a pattern of fraud, collusion, corruption, and other misconduct on the part of several lawyers, consultants and others acting for the Lago Agrio plaintiffs. In February 2011, Chevron filed a civil lawsuit in the Federal District Court for the Southern District of New York against the Lago Agrio plaintiffs and several of their lawyers, consultants and supporters, alleging violations of the Racketeer Influenced and Corrupt Organizations Act and other state laws. Through the civil lawsuit, Chevron is seeking relief that includes a declaration that any judgment against Chevron in the Lago Agrio litigation is the result of fraud and other unlawful conduct and is therefore unenforceable. On March 7, 2011, the Federal District Court issued a preliminary injunction prohibiting the Lago Agrio plaintiffs and persons acting in concert with them from taking any action in furtherance of recognition or enforcement of any judgment against Chevron in the Lago Agrio case pending resolution of Chevron’s civil lawsuit by the Federal District Court. On May 31, 2011, the Federal District Court severed claims
one
through eight
of Chevron’s complaint from the
ninth
claim for declaratory relief and imposed a discovery stay on claims one through eight pending a trial on the ninth claim for declaratory relief. On September 19, 2011, the U.S. Court of Appeals for the Second Circuit vacated the preliminary injunction, stayed the trial on Chevron’s ninth claim, a claim for declaratory relief, that had been set for November 14, 2011, and denied the defendants’ mandamus petition to recuse the judge hearing the lawsuit. The Second Circuit issued its opinion on January 26, 2012 ordering the dismissal of Chevron’s ninth claim for declaratory relief. On February 16, 2012, the Federal District Court lifted the stay on claims one through eight, and on October 18, 2012, the Federal District Court set a trial date of October 15, 2013. On March 22, 2013, Chevron settled its claims against Stratus Consulting, and on April 12, 2013 sworn declarations by representatives of Stratus Consulting were filed with the Court admitting their role and that of the plaintiffs' attorneys in drafting the environmental report of the mining engineer appointed by the provincial court in Lago Agrio. On September 26, 2013, the Second Circuit denied the defendants' Petition for Writ of Mandamus to recuse the judge hearing the case and to collaterally estop Chevron from seeking a declaration that the Lago Agrio judgment was obtained through fraud and other unlawful conduct. The trial commenced on October 15, 2013 and concluded on November 22, 2013. Post-trial briefing has concluded, but no decision has been rendered by the Federal District Court as of the date of this report.
The ultimate outcome of the foregoing matters, including any financial effect on Chevron, remains uncertain. Management does not believe an estimate of a reasonably possible loss (or a range of loss) can be made in this case. Due to the defects associated with the Ecuadorian judgment, the 2008 engineer’s report on alleged damages and the September 2010 plaintiffs’ submission on alleged damages, management does not believe these documents have any utility in calculating a reasonably possible loss (or a range of loss). Moreover, the highly uncertain legal environment surrounding the case provides no basis for management to estimate a reasonably possible loss (or a range of loss).
FS-42
|
Notes to the Consolidated Financial Statements
Millions of dollars, except per-share amounts
Note 15
Taxes - Continued
|
||
Note 15
Taxes
Income Taxes
|
Year ended December 31
|
||||||||||||
|
2013
|
|
2012
|
|
2011
|
|
|||||||
|
Taxes on income
|
||||||||||||
|
U.S. federal
|
||||||||||||
|
Current
|
$
|
15
|
|
$
|
1,703
|
|
$
|
1,893
|
|
|||
|
Deferred
|
1,128
|
|
673
|
|
877
|
|
||||||
|
State and local
|
||||||||||||
|
Current
|
120
|
|
652
|
|
596
|
|
||||||
|
Deferred
|
74
|
|
(145
|
)
|
41
|
|
||||||
|
Total United States
|
1,337
|
|
2,883
|
|
3,407
|
|
||||||
|
International
|
||||||||||||
|
Current
|
12,296
|
|
15,626
|
|
16,548
|
|
||||||
|
Deferred
|
675
|
|
1,487
|
|
671
|
|
||||||
|
Total International
|
12,971
|
|
17,113
|
|
17,219
|
|
||||||
|
Total taxes on income
|
$
|
14,308
|
|
$
|
19,996
|
|
$
|
20,626
|
|
|||
In
2013
, before-tax income for U.S. operations, including related corporate and other charges, was
$4,672
, compared with before-tax income of
$8,456
and
$10,222
in
2012
and
2011
, respectively. For international operations, before-tax income was
$31,233
,
$37,876
and
$37,412
in
2013
,
2012
and
2011
, respectively. U.S. federal income tax expense was reduced by
$175
,
$165
and
$191
in
2013
,
2012
and
2011
, respectively, for business tax credits.
The reconciliation between the U.S. statutory federal income tax rate and the company’s effective income tax rate is detailed in the following table:
The reconciliation between the U.S. statutory federal income tax rate and the company’s effective income tax rate is detailed in the following table:
|
Year ended December 31
|
||||||||||||
|
2013
|
|
2012
|
|
2011
|
|
|||||||
|
U.S. statutory federal income tax rate
|
35.0
|
|
%
|
35.0
|
|
%
|
35.0
|
|
%
|
|||
|
Effect of income taxes from international operations at rates different from the U.S. statutory rate
|
5.1
|
|
7.8
|
|
7.5
|
|
||||||
|
State and local taxes on income, net of U.S. federal income tax benefit
|
0.6
|
|
0.6
|
|
0.9
|
|
||||||
|
Prior-year tax adjustments
|
(0.8
|
)
|
(0.2
|
)
|
(0.1
|
)
|
||||||
|
Tax credits
|
(0.5
|
)
|
(0.4
|
)
|
(0.4
|
)
|
||||||
|
Effects of changes in tax rates
|
—
|
|
0.3
|
|
0.5
|
|
||||||
|
Other
|
0.5
|
|
0.1
|
|
(0.1
|
)
|
||||||
|
Effective tax rate
|
39.9
|
|
%
|
43.2
|
|
%
|
43.3
|
|
%
|
|||
The company’s effective tax rate decreased from
43.2 percent
in
2012
to
39.9 percent
in
2013
. The decrease was primarily due to a lower effective tax rate in international upstream operations. The lower international upstream effective tax rate was driven by a greater portion of equity income in 2013 than in 2012 (equity income is included as part of before-tax income and is generally
recorded net of income taxes) and foreign currency remeasurement impacts.
The company records its deferred taxes on a tax-jurisdiction basis and classifies those net amounts as current or noncurrent based on the balance sheet classification of the related assets or liabilities. The reported deferred tax balances are composed of the following:
|
At December 31
|
||||||||
|
2013
|
|
2012
|
|
|||||
|
Deferred tax liabilities
|
||||||||
|
Properties, plant and equipment
|
$
|
25,936
|
|
$
|
24,295
|
|
||
|
Investments and other
|
2,272
|
|
2,276
|
|
||||
|
Total deferred tax liabilities
|
28,208
|
|
26,571
|
|
||||
|
Deferred tax assets
|
||||||||
|
Foreign tax credits
|
(11,572
|
)
|
(10,817
|
)
|
||||
|
Abandonment/environmental reserves
|
(6,279
|
)
|
(5,728
|
)
|
||||
|
Employee benefits
|
(3,825
|
)
|
(5,100
|
)
|
||||
|
Deferred credits
|
(2,768
|
)
|
(2,891
|
)
|
||||
|
Tax loss carryforwards
|
(1,016
|
)
|
(738
|
)
|
||||
|
Other accrued liabilities
|
(533
|
)
|
(381
|
)
|
||||
|
Inventory
|
(358
|
)
|
(281
|
)
|
||||
|
Miscellaneous
|
(1,439
|
)
|
(1,835
|
)
|
||||
|
Total deferred tax assets
|
(27,790
|
)
|
(27,771
|
)
|
||||
|
Deferred tax assets valuation allowance
|
17,171
|
|
15,443
|
|
||||
|
Total deferred taxes, net
|
$
|
17,589
|
|
$
|
14,243
|
|
||
Deferred tax liabilities at the end of
2013
increased by approximately
$1,600
from year-end
2012
. The increase was related to increased temporary differences for property, plant and equipment. Deferred tax assets were essentially unchanged between periods.
The overall valuation allowance relates to deferred tax assets for U.S. foreign tax credit carryforwards, tax loss carryforwards and temporary differences. It reduces the deferred tax assets to amounts that are, in management’s assessment, more likely than not to be realized. At the end of
2013
, the company had tax loss carryforwards of approximately
$3,064
and tax credit carryforwards of approximately
$1,301
primarily related to various international tax jurisdictions. Whereas some of these tax loss carryforwards do not have an expiration date, others expire at various times from
2014
through
2029
. U.S. foreign tax credit carryforwards of
$11,572
will expire between
2014
and
2023
.
FS-43
|
Note 15 Taxes |
||
At December 31,
2013
and
2012
, deferred taxes were classified on the Consolidated Balance Sheet as follows:
|
At December 31
|
||||||||
|
2013
|
|
2012
|
|
|||||
|
Prepaid expenses and other current assets
|
$
|
(1,341
|
)
|
$
|
(1,365
|
)
|
||
|
Deferred charges and other assets
|
(2,954
|
)
|
(2,662
|
)
|
||||
|
Federal and other taxes on income
|
583
|
|
598
|
|
||||
|
Noncurrent deferred income taxes
|
21,301
|
|
17,672
|
|
||||
|
Total deferred income taxes, net
|
$
|
17,589
|
|
$
|
14,243
|
|
||
Income taxes are not accrued for unremitted earnings of international operations that have been or are intended to be reinvested indefinitely. Undistributed earnings of international consolidated subsidiaries and affiliates for which no deferred income tax provision has been made for possible future remittances totaled approximately
$31,300
at December 31,
2013
. This amount represents earnings reinvested as part of the company’s ongoing international business. It is not practicable to estimate the amount of taxes that might be payable on the possible remittance of earnings that are intended to be reinvested indefinitely. At the end of
2013
, deferred income taxes were recorded for the undistributed earnings of certain international operations where indefinite reinvestment of the earnings is not planned. The company does not anticipate incurring significant additional taxes on remittances of earnings that are not indefinitely reinvested.
Uncertain Income Tax Positions
The company recognizes a tax benefit in the financial statements for an uncertain tax position only if management’s assessment is that the position is “more likely than not” (i.e., a likelihood
greater than 50 percent
) to be allowed by the tax jurisdiction based solely on the technical merits of the position. The term “tax position” in the accounting standards for income taxes refers to a position in a previously filed tax return or a position expected to be taken in a future tax return that is reflected in measuring current or deferred income tax assets and liabilities for interim or annual periods.
The following table indicates the changes to the company’s unrecognized tax benefits for the years ended December 31,
2013
,
2012
and
2011
. The term “unrecognized tax benefits” in the accounting standards for income taxes refers to the differences between a tax position taken or expected to be taken in a tax return and the benefit measured and recognized in the financial statements. Interest and penalties are not included.
|
2013
|
|
2012
|
|
2011
|
|
|||||||
|
Balance at January 1
|
$
|
3,071
|
|
$
|
3,481
|
|
$
|
3,507
|
|
|||
|
Foreign currency effects
|
(58
|
)
|
4
|
|
(2
|
)
|
||||||
|
Additions based on tax positions
taken in current year |
276
|
|
543
|
|
469
|
|
||||||
|
Additions/reductions resulting from current-year asset acquisitions/sales
|
—
|
|
—
|
|
(41
|
)
|
||||||
|
Additions for tax positions taken
in prior years |
1,164
|
|
152
|
|
236
|
|
||||||
|
Reductions for tax positions taken in prior years
|
(176
|
)
|
(899
|
)
|
(366
|
)
|
||||||
|
Settlements with taxing authorities in current year
|
(320
|
)
|
(138
|
)
|
(318
|
)
|
||||||
|
Reductions as a result of a lapse
of the applicable statute of limitations |
(109
|
)
|
(72
|
)
|
(4
|
)
|
||||||
|
Balance at December 31
|
$
|
3,848
|
|
$
|
3,071
|
|
$
|
3,481
|
|
|||
The increase in unrecognized tax benefits between December 31, 2012, and December 31, 2013 was primarily due to additions for refund claims to be filed with respect to prior years.
Approximately
71 percent
of the
$3,848
of unrecognized tax benefits at December 31,
2013
, would have an impact on the effective tax rate if subsequently recognized. Certain of these unrecognized tax benefits relate to tax carryforwards that may require a full valuation allowance at the time of any such recognition.
Tax positions for Chevron and its subsidiaries and affiliates are subject to income tax audits by many tax jurisdictions throughout the world. For the company’s major tax jurisdictions, examinations of tax returns for certain prior tax years had not been completed as of December 31,
2013
. For these jurisdictions, the latest years for which income tax examinations had been finalized were as follows: United States –
2008
, Nigeria –
2000
, Angola –
2001
, Saudi Arabia –
2009
and Kazakhstan –
2007
.
The company engages in ongoing discussions with tax authorities regarding the resolution of tax matters in the various jurisdictions. Both the outcome of these tax matters and the timing of resolution and/or closure of the tax audits are highly uncertain. However, it is reasonably possible that developments on tax matters in certain tax jurisdictions may result in significant increases or decreases in the company’s total unrecognized tax benefits within the next
12
months. Given the number of years that still remain subject to examination and the number of matters being examined in the various tax jurisdictions, the company is unable to estimate the range of possible adjustments to the balance of unrecognized tax benefits.
FS-44
|
Notes to the Consolidated Financial Statements
Millions of dollars, except per-share amounts
Note 15
Taxes - Continued
|
||
The company completed its assessment of the potential impact of the August 2012 decision by the U.S. Court of Appeals for the Third Circuit that disallowed the Historic Rehabilitation Tax Credits claimed by an unrelated taxpayer. The findings of this assessment did not result in a material impact on the company's financial position, results of operations or cash flows.
On the Consolidated Statement of Income, the company reports interest and penalties related to liabilities for uncertain tax positions as “Income tax expense.” As of December 31,
2013
, accruals of
$215
for anticipated interest and penalty obligations were included on the Consolidated Balance Sheet, compared with accruals of
$293
as of year-end
2012
. Income tax expense (benefit) associated with interest and penalties was
$(42)
,
$145
and
$(64)
in
2013
,
2012
and
2011
, respectively.
Taxes Other Than on Income
|
Year ended December 31
|
||||||||||||
|
2013
|
|
2012
|
|
2011
|
|
|||||||
|
United States
|
||||||||||||
|
Excise and similar taxes
on products and merchandise |
$
|
4,792
|
|
$
|
4,665
|
|
$
|
4,199
|
|
|||
|
Import duties and other levies
|
4
|
|
1
|
|
4
|
|
||||||
|
Property and other
miscellaneous taxes |
1,036
|
|
782
|
|
726
|
|
||||||
|
Payroll taxes
|
255
|
|
240
|
|
236
|
|
||||||
|
Taxes on production
|
333
|
|
328
|
|
308
|
|
||||||
|
Total United States
|
6,420
|
|
6,016
|
|
5,473
|
|
||||||
|
International
|
||||||||||||
|
Excise and similar taxes on
products and merchandise |
3,700
|
|
3,345
|
|
3,886
|
|
||||||
|
Import duties and other levies
|
41
|
|
106
|
|
3,511
|
|
||||||
|
Property and other
miscellaneous taxes |
2,486
|
|
2,501
|
|
2,354
|
|
||||||
|
Payroll taxes
|
168
|
|
160
|
|
148
|
|
||||||
|
Taxes on production
|
248
|
|
248
|
|
256
|
|
||||||
|
Total International
|
6,643
|
|
6,360
|
|
10,155
|
|
||||||
|
Total taxes other than on income
|
$
|
13,063
|
|
$
|
12,376
|
|
$
|
15,628
|
|
|||
Note 16
Short-Term Debt
|
At December 31
|
||||||||
|
2013
|
|
2012
|
|
|||||
|
Commercial paper*
|
$
|
5,130
|
|
$
|
2,783
|
|
||
|
Notes payable to banks and others with
originating terms of one year or less |
49
|
|
23
|
|
||||
|
Current maturities of long-term debt
|
—
|
|
20
|
|
||||
|
Current maturities of long-term
capital leases |
34
|
|
38
|
|
||||
|
Redeemable long-term obligations
|
||||||||
|
Long-term debt
|
3,152
|
|
3,151
|
|
||||
|
Capital leases
|
9
|
|
12
|
|
||||
|
Subtotal
|
8,374
|
|
6,027
|
|
||||
|
Reclassified to long-term debt
|
(8,000
|
)
|
(5,900
|
)
|
||||
|
Total short-term debt
|
$
|
374
|
|
$
|
127
|
|
||
|
*
|
Weighted-average interest rates at December 31,
2013
and
2012
, were
0.09 percent
and
0.13 percent
, respectively.
|
Redeemable long-term obligations consist primarily of tax-exempt variable-rate put bonds that are included as current liabilities because they become redeemable at the option of the bondholders during the year following the balance sheet date.
The company may periodically enter into interest rate swaps on a portion of its short-term debt. At December 31,
2013
, the company had no interest rate swaps on short-term debt.
At December 31,
2013
, the company had
$8,000
in committed credit facilities with various major banks, expiring in
December 2016
, that enable the refinancing of short-term obligations on a long-term basis. These facilities support commercial paper borrowing and can also be used for general corporate purposes. The company’s practice has been to continually replace expiring commitments with new commitments on substantially the same terms, maintaining levels management believes appropriate. Any borrowings under the facilities would be unsecured indebtedness at interest rates based on the London Interbank Offered Rate or an average of base lending rates published by specified banks and on terms reflecting the company’s strong credit rating. No borrowings were outstanding
under these facilities at December 31,
2013
.
At December 31,
2013
and
2012
, the company classified
$8,000
and
$5,900
, respectively, of short-term debt as long-term. Settlement of these obligations is not expected to require the use of working capital within one year, as the company has both the intent and the ability, as evidenced by committed credit facilities, to refinance them on a long-term basis.
FS-45
|
Notes to the Consolidated Financial Statements
Millions of dollars, except per-share amounts
Note 17
Long-Term Debt
|
Note 17
Long-Term Debt
Total long-term debt, excluding capital leases, at December 31,
2013
, was
$19,960
. The company’s long-term debt outstanding at year-end
2013
and
2012
was as follows:
|
At December 31
|
||||||||
|
2013
|
|
2012
|
|
|||||
|
3.191% notes due 2023
|
$
|
2,250
|
|
$
|
—
|
|
||
|
1.104% notes due 2017
|
2,000
|
|
2,000
|
|
||||
|
1.718% notes due 2018
|
2,000
|
|
—
|
|
||||
|
2.355% notes due 2022
|
2,000
|
|
2,000
|
|
||||
|
4.95% notes due 2019
|
1,500
|
|
1,500
|
|
||||
|
2.427% notes due 2020
|
1,000
|
|
—
|
|
||||
|
0.889% notes due 2016
|
750
|
|
—
|
|
||||
|
8.625% debentures due 2032
|
147
|
|
147
|
|
||||
|
8.625% debentures due 2031
|
107
|
|
107
|
|
||||
|
8% debentures due 2032
|
74
|
|
74
|
|
||||
|
9.75% debentures due 2020
|
54
|
|
54
|
|
||||
|
8.875% debentures due 2021
|
40
|
|
40
|
|
||||
|
Medium-term notes, maturing from
2021 to 2038 (5.96%) 1 |
38
|
|
38
|
|
||||
|
7.5% debentures due 2043
|
—
|
|
83
|
|
||||
|
7.327% amortizing notes due 2014
2
|
—
|
|
23
|
|
||||
|
7.327% amortizing notes due 2013
2
|
—
|
|
20
|
|
||||
|
Total including debt due within one year
|
11,960
|
|
6,086
|
|
||||
|
Debt due within one year
|
—
|
|
(20
|
)
|
||||
|
Reclassified from short-term debt
|
8,000
|
|
5,900
|
|
||||
|
Total long-term debt
|
$
|
19,960
|
|
$
|
11,966
|
|
||
|
1
|
Weighted-average interest rate at December 31,
2013
.
|
|
2
|
Guarantee of ESOP debt.
|
Chevron has an automatic statement that expires in 2015. This registration statement is for an unspecified amount of nonconvertible debt securities issued or guaranteed by the company.
Long-term debt of
$11,960
matures as follows:
2014
–
$0
;
2015
–
$0
;
2016
–
$750
;
2017
–
$2,000
;
2018
–
$2,000
; and after
2018
–
$7,210
.
In June 2013,
$6,000
of Chevron Corporation bonds were issued, and
$83
of Texaco Capital, Inc. 7.5% bonds due 2043 and
$23
of Chevron Corporation 7.327% bonds due 2014 were redeemed early. In January 2013,
$20
of Chevron Corporation 7.327% bonds matured.
See Note 9, beginning on page FS-32, for information concerning the fair value of the company’s long-term debt.
Note 18
New Accounting Standards
Income Taxes (Topic 740), Presentation of an Unrecognized Tax Benefit When a Net Operating Loss Carryforward, a Similar Tax Loss, or a Tax Credit Carryforward Exists (ASU 2013-11)
In July 2013, the FASB issued ASU 2013-11, which became effective for the company January 1, 2014. The standard provides that a liability related to an unrecognized tax benefit should be offset against a deferred tax asset for a net operating loss carryforward, a similar tax loss, or a tax credit carryforward if such settlement is required or expected in the event the uncertain tax position is disallowed. Adoption of the standard is not expected to have a significant effect on the company's results of operations, financial position or liquidity.
Note 19
Accounting for Suspended Exploratory Wells
The company continues to capitalize exploratory well cost after the completion of drilling when (a) the well has found a sufficient quantity of reserves to justify completion as a producing well, and (b) the entity is making sufficient progress assessing the reserves and the economic and operating viability of the project. If either condition is not met or if an enterprise obtains information that raises substantial doubt about the economic or operational viability of the project, the exploratory well would be assumed to be impaired, and its costs, net of any salvage value, would be charged to expense. (Note that an entity is not required to complete the exploratory well as a producing well.) The accounting standards provide a number of indicators that can assist an entity in demonstrating that sufficient progress is being made in assessing the reserves and economic viability of the project.
The following table indicates the changes to the company’s suspended exploratory well costs for the three years ended December 31,
2013
:
|
2013
|
|
2012
|
|
2011
|
|
|||||||
|
Beginning balance at January 1
|
$
|
2,681
|
|
$
|
2,434
|
|
$
|
2,718
|
|
|||
|
Additions to capitalized exploratory well costs pending the determination of proved reserves
|
885
|
|
595
|
|
652
|
|
||||||
|
Reclassifications to wells, facilities
and equipment based on the determination of proved reserves |
(290
|
)
|
(244
|
)
|
(828
|
)
|
||||||
|
Capitalized exploratory well costs
charged to expense |
(31
|
)
|
(49
|
)
|
(45
|
)
|
||||||
|
Other reductions*
|
—
|
|
(55
|
)
|
(63
|
)
|
||||||
|
Ending balance at December 31
|
$
|
3,245
|
|
$
|
2,681
|
|
$
|
2,434
|
|
|||
|
*
|
Represents property sales.
|
FS-46
|
Note 19
Accounting for Suspended Exploratory Wells - Continued
|
||
The following table provides an aging of capitalized well costs and the number of projects for which exploratory well costs have been capitalized for a period greater than one year since the completion of drilling.
|
At December 31
|
||||||||||||
|
2013
|
|
2012
|
|
2011
|
|
|||||||
|
Exploratory well costs capitalized
for a period of one year or less |
$
|
641
|
|
$
|
501
|
|
$
|
557
|
|
|||
|
Exploratory well costs capitalized
for a period greater than one year |
2,604
|
|
2,180
|
|
1,877
|
|
||||||
|
Balance at December 31
|
$
|
3,245
|
|
$
|
2,681
|
|
$
|
2,434
|
|
|||
|
Number of projects with exploratory well costs that have been capitalized for a period greater than one year*
|
51
|
|
46
|
|
47
|
|
||||||
|
*
|
Certain projects have multiple wells or fields or both.
|
Of the
$2,604
of exploratory well costs capitalized for more than one year at December 31,
2013
,
$1,733
(
22
projects) is related to projects that had drilling activities under way or firmly planned for the near future. The
$871
balance is related to
29
projects in areas requiring a major capital expenditure before production could begin and for which additional drilling efforts were not under way or firmly planned for the near future. Additional drilling was not deemed necessary because the presence of hydrocarbons had already been established, and other activities were in process to enable a future decision on project development.
The projects for the
$871
referenced above had the following activities associated with assessing the reserves and the projects’ economic viability: (a)
$382
(
six
projects) – undergoing front-end engineering and design with final investment decision expected within
three years
; (b)
$47
(
two
projects) – development concept under review by government; (c)
$384
(
nine
projects) – development alternatives under review; (d)
$58
(
twelve
projects) – miscellaneous activities for projects with smaller amounts suspended. While progress was being made on all
51
projects, the decision on the recognition of proved reserves under SEC rules in some cases may not occur for several years because of the complexity, scale and negotiations connected with the projects. Approximately half of these decisions are expected to occur in the next
three years
.
The
$2,604
of suspended well costs capitalized for a period greater than one year as of December 31,
2013
, represents
191
exploratory wells in
51
projects. The tables below contain the aging of these costs on a well and project basis:
|
Aging based on drilling completion date of individual wells:
|
Amount
|
|
Number
of wells
|
|
|||
|
1997–2002
|
$
|
120
|
|
28
|
|
||
|
2003–2007
|
531
|
|
46
|
|
|||
|
2008–2012
|
1,953
|
|
117
|
|
|||
|
Total
|
$
|
2,604
|
|
191
|
|
||
|
Aging based on drilling completion date of last suspended well in project:
|
Amount
|
|
Number
of projects
|
|
|||
|
1999
|
$
|
8
|
|
1
|
|
||
|
2003–2008
|
347
|
|
10
|
|
|||
|
2009–2013
|
2,249
|
|
40
|
|
|||
|
Total
|
$
|
2,604
|
|
51
|
|
||
Note 20
Stock Options and Other Share-Based Compensation
Compensation expense for stock options for
2013
,
2012
and
2011
was
$292
(
$190
after tax),
$283
(
$184
after tax) and
$265
(
$172
after tax), respectively. In addition, compensation expense for stock appreciation rights, restricted stock, performance units and restricted stock units was
$223
(
$145
after tax),
$177
(
$115
after tax) and
$214
(
$139
after tax) for
2013
,
2012
and
2011
, respectively. No significant stock-based compensation cost was capitalized at
December 31, 2013
, or December 31,
2012
.
Cash received in payment for option exercises under all share-based payment arrangements for
2013
,
2012
and
2011
was
$553
,
$753
and
$948
, respectively. Actual tax benefits realized for the tax deductions from option exercises were
$73
,
$101
and
$121
for
2013
,
2012
and
2011
, respectively.
Cash paid to settle performance units and stock appreciation rights was
$186
,
$123
and
$151
for
2013
,
2012
and
2011
, respectively.
Chevron Long-Term Incentive Plan (LTIP)
Awards under the LTIP may take the form of, but are not limited to, stock options, restricted stock, restricted stock units, stock appreciation rights, performance units and nonstock grants. From April 2004 through May 2023, no more than
260 million
shares may be issued under the LTIP. For awards issued on or after May 29, 2013, no more than
50 million
of those shares may be in a form other than a stock option, stock appreciation right or award requiring full payment for shares by the award recipient. For the major types of awards outstanding as of
December 31, 2013
, the contractual terms vary between
three
years for the performance units and
10
years for the stock options and stock appreciation rights.
FS-47
|
Notes to the Consolidated Financial Statements
Millions of dollars, except per-share amounts
Note 20
Stock Options and Other Share-Based Compensation - Continued
|
||
Unocal Share-Based Plans (Unocal Plans)
When Chevron acquired Unocal in August 2005, outstanding stock options and stock appreciation rights granted under various Unocal Plans were exchanged for fully vested Chevron options and appreciation rights. These awards retained the same provisions as the original Unocal Plans. Unexercised awards began expiring in early 2010 and will continue to expire through early 2015.
The fair market values of stock options and stock appreciation rights granted in
2013
,
2012
and
2011
were measured on the date of grant using the Black-Scholes option-pricing model, with the following weighted-average assumptions:
|
Year ended December 31
|
|||||||||||||
|
2013
|
|
2012
|
|
2011
|
|
||||||||
|
Stock Options
|
|
||||||||||||
|
Expected term in years
1
|
6.0
|
|
|
|
6.0
|
|
|
6.2
|
|
|
|||
|
Volatility
2
|
31.3
|
|
%
|
|
31.7
|
|
%
|
31.0
|
|
%
|
|||
|
Risk-free interest rate based on zero coupon U.S. treasury note
|
1.2
|
|
%
|
|
1.1
|
|
%
|
2.6
|
|
%
|
|||
|
Dividend yield
|
3.3
|
|
%
|
|
3.2
|
|
%
|
3.6
|
|
%
|
|||
|
Weighted-average fair value per option granted
|
$
|
24.48
|
|
|
|
$
|
23.35
|
|
|
$
|
21.24
|
|
|
|
1
|
Expected term is based on historical exercise and postvesting cancellation data.
|
|
2
|
Volatility rate is based on historical stock prices over an appropriate period, generally equal to the expected term.
|
A summary of option activity during
2013
is presented below:
|
Weighted-
|
|
Average
|
||||||||||
|
Average
|
|
Remaining
|
Aggregate
|
|
||||||||
|
Shares
|
|
Exercise
|
|
Contractual
|
Intrinsic
|
|
||||||
|
(Thousands)
|
|
Price
|
|
Term (Years)
|
Value
|
|
||||||
|
Outstanding at
January 1, 2013 |
71,895
|
|
$
|
81.26
|
|
|
|
|||||
|
Granted
|
13,194
|
|
$
|
116.45
|
|
|
|
|||||
|
Exercised
|
(8,377
|
)
|
$
|
68.20
|
|
|
|
|||||
|
Forfeited
|
(1,086
|
)
|
$
|
93.98
|
|
|
|
|||||
|
Outstanding at
December 31, 2013 |
75,626
|
|
$
|
88.44
|
|
6.12
|
$
|
2,758
|
|
|||
|
Exercisable at
December 31, 2013 |
51,797
|
|
$
|
78.52
|
|
5.05
|
$
|
2,403
|
|
|||
The total intrinsic value (i.e., the difference between the exercise price and the market price) of options exercised during
2013
,
2012
and
2011
was
$445
,
$580
and
$668
, respectively. During this period, the company continued its practice of issuing treasury shares upon exercise of these awards.
As of
December 31, 2013
, there was
$259
of total unrecognized before-tax compensation cost related to nonvested share-based
compensation arrangements granted under the plans. That cost is expected to be recognized over a weighted-average period of
1.7
years.
At January 1,
2013
, the number of LTIP performance units outstanding was equivalent to
2,827,757
shares. During
2013
,
776,180
units were granted,
1,007,952
units vested with cash proceeds distributed to recipients and
64,715
units were forfeited. At
December 31, 2013
, units outstanding were
2,531,270
, and the fair value of the liability recorded for these instruments was
$312
measured using the Monte Carlo simulation method. In addition, outstanding stock appreciation rights and other awards that were granted under various LTIP and former Unocal programs totaled approximately
2.9 million
equivalent shares as of
December 31, 2013
. A liability of
$107
was recorded for these awards.
Note 21
Employee Benefit Plans
The company has defined benefit pension plans for many employees. The company typically prefunds defined benefit plans as required by local regulations or in certain situations where prefunding provides economic advantages. In the United States, all qualified plans are subject to the Employee Retirement Income Security Act (ERISA) minimum funding standard. The company does not typically fund U.S. nonqualified pension plans that are not subject to funding requirements under laws and regulations because contributions to these pension plans may be less economic and investment returns may be less attractive than the company’s other investment alternatives.
The company also sponsors other postretirement (OPEB) plans that provide medical and dental benefits, as well as life insurance for some active and qualifying retired employees. The plans are unfunded, and the company and retirees share the costs. Medical coverage for Medicare-eligible retirees in the company’s main U.S. medical plan is secondary to Medicare (including Part D) and the increase to the company contribution for retiree medical coverage is limited to no more than
4 percent
each year. Certain life insurance benefits are paid by the company.
The company recognizes the overfunded or underfunded status of each of its defined benefit pension and OPEB plans as an asset or liability on the Consolidated Balance Sheet.
FS-48
|
Note 21
Employee Benefit Plans - Continued
|
||
The funded status of the company’s pension and other postretirement benefit plans for
2013
and
2012
follows:
|
Pension Benefits
|
|||||||||||||||||||||||||
|
2013
|
2012
|
Other Benefits
|
|||||||||||||||||||||||
|
U.S.
|
|
Int’l.
|
|
U.S.
|
|
Int’l.
|
|
2013
|
|
2012
|
|
||||||||||||||
|
Change in Benefit Obligation
|
|||||||||||||||||||||||||
|
Benefit obligation at January 1
|
$
|
13,654
|
|
$
|
6,287
|
|
$
|
12,165
|
|
$
|
5,519
|
|
$
|
3,787
|
|
$
|
3,765
|
|
|||||||
|
Service cost
|
495
|
|
197
|
|
452
|
|
181
|
|
66
|
|
61
|
|
|||||||||||||
|
Interest cost
|
471
|
|
314
|
|
435
|
|
320
|
|
149
|
|
153
|
|
|||||||||||||
|
Plan participants’ contributions
|
—
|
|
8
|
|
—
|
|
7
|
|
154
|
|
151
|
|
|||||||||||||
|
Plan amendments
|
(78
|
)
|
18
|
|
94
|
|
37
|
|
—
|
|
11
|
|
|||||||||||||
|
Actuarial (gain) loss
|
(1,398
|
)
|
(206
|
)
|
1,322
|
|
417
|
|
(636
|
)
|
44
|
|
|||||||||||||
|
Foreign currency exchange rate changes
|
—
|
|
(187
|
)
|
—
|
|
114
|
|
(23
|
)
|
1
|
|
|||||||||||||
|
Benefits paid
|
(1,064
|
)
|
(336
|
)
|
(763
|
)
|
(308
|
)
|
(359
|
)
|
(350
|
)
|
|||||||||||||
|
Divestitures
|
—
|
|
—
|
|
(51
|
)
|
—
|
|
—
|
|
(49
|
)
|
|||||||||||||
|
Benefit obligation at December 31
|
12,080
|
|
6,095
|
|
13,654
|
|
6,287
|
|
3,138
|
|
3,787
|
|
|||||||||||||
|
Change in Plan Assets
|
|||||||||||||||||||||||||
|
Fair value of plan assets at January 1
|
9,909
|
|
4,125
|
|
8,720
|
|
3,577
|
|
—
|
|
—
|
|
|||||||||||||
|
Actual return on plan assets
|
1,546
|
|
375
|
|
1,149
|
|
375
|
|
—
|
|
—
|
|
|||||||||||||
|
Foreign currency exchange rate changes
|
—
|
|
(21
|
)
|
—
|
|
90
|
|
—
|
|
—
|
|
|||||||||||||
|
Employer contributions
|
819
|
|
392
|
|
844
|
|
384
|
|
205
|
|
199
|
|
|||||||||||||
|
Plan participants’ contributions
|
—
|
|
8
|
|
—
|
|
7
|
|
154
|
|
151
|
|
|||||||||||||
|
Benefits paid
|
(1,064
|
)
|
(336
|
)
|
(763
|
)
|
(308
|
)
|
(359
|
)
|
(350
|
)
|
|||||||||||||
|
Divestitures
|
—
|
|
—
|
|
(41
|
)
|
—
|
|
—
|
|
—
|
|
|||||||||||||
|
Fair value of plan assets at December 31
|
11,210
|
|
4,543
|
|
9,909
|
|
4,125
|
|
—
|
|
—
|
|
|||||||||||||
|
Funded Status at December 31
|
$
|
(870
|
)
|
$
|
(1,552
|
)
|
$
|
(3,745
|
)
|
$
|
(2,162
|
)
|
$
|
(3,138
|
)
|
$
|
(3,787
|
)
|
|||||||
Amounts recognized on the Consolidated Balance Sheet for the company’s pension and other postretirement benefit plans at December 31,
2013
and
2012
, include:
|
Pension Benefits
|
|||||||||||||||||||||||||
|
2013
|
2012
|
Other Benefits
|
|||||||||||||||||||||||
|
U.S.
|
|
Int’l.
|
|
U.S.
|
|
Int’l.
|
|
2013
|
|
2012
|
|
||||||||||||||
|
Deferred charges and other assets
|
$
|
394
|
|
$
|
128
|
|
$
|
7
|
|
$
|
55
|
|
$
|
—
|
|
$
|
—
|
|
|||||||
|
Accrued liabilities
|
(76
|
)
|
(81
|
)
|
(61
|
)
|
(76
|
)
|
(215
|
)
|
(225
|
)
|
|||||||||||||
|
Noncurrent employee benefit plans
|
(1,188
|
)
|
(1,599
|
)
|
(3,691
|
)
|
(2,141
|
)
|
(2,923
|
)
|
(3,562
|
)
|
|||||||||||||
|
Net amount recognized at December 31
|
$
|
(870
|
)
|
$
|
(1,552
|
)
|
$
|
(3,745
|
)
|
$
|
(2,162
|
)
|
$
|
(3,138
|
)
|
$
|
(3,787
|
)
|
|||||||
Amounts recognized on a before-tax basis in “Accumulated other comprehensive loss” for the company’s pension and OPEB plans were
$5,464
and
$9,742
at the end of
2013
and
2012
, respectively. These amounts consisted of:
|
Pension Benefits
|
|||||||||||||||||||||||||
|
2013
|
2012
|
Other Benefits
|
|||||||||||||||||||||||
|
U.S.
|
|
Int’l.
|
|
U.S.
|
|
Int’l.
|
|
2013
|
|
2012
|
|
||||||||||||||
|
Net actuarial loss
|
$
|
3,185
|
|
$
|
1,808
|
|
$
|
6,087
|
|
$
|
2,439
|
|
$
|
256
|
|
$
|
968
|
|
|||||||
|
Prior service (credit) costs
|
(22
|
)
|
167
|
|
58
|
|
170
|
|
70
|
|
20
|
|
|||||||||||||
|
Total recognized at December 31
|
$
|
3,163
|
|
$
|
1,975
|
|
$
|
6,145
|
|
$
|
2,609
|
|
$
|
326
|
|
$
|
988
|
|
|||||||
The accumulated benefit obligations for all U.S. and international pension plans were
$10,876
and
$5,108
, respectively, at
December 31, 2013
, and
$12,108
and
$5,167
, respectively, at
December 31, 2012
.
FS-49
|
Notes to the Consolidated Financial Statements
Millions of dollars, except per-share amounts
Note 21
Employee Benefit Plans - Continued
|
||
Information for U.S. and international pension plans with an accumulated benefit obligation in excess of plan assets at
December 31, 2013
and
2012
, was:
|
Pension Benefits
|
||||||||||||||||
|
2013
|
2012
|
|||||||||||||||
|
U.S.
|
|
Int’l.
|
|
U.S.
|
|
Int’l.
|
|
|||||||||
|
Projected benefit obligations
|
$
|
1,267
|
|
$
|
1,692
|
|
$
|
13,647
|
|
$
|
4,812
|
|
||||
|
Accumulated benefit obligations
|
1,155
|
|
1,240
|
|
12,101
|
|
4,063
|
|
||||||||
|
Fair value of plan assets
|
4
|
|
203
|
|
9,895
|
|
2,756
|
|
||||||||
The components of net periodic benefit cost and amounts recognized in the Consolidated Statement of Comprehensive Income for
2013
,
2012
and
2011
are shown in the table below:
|
Pension Benefits
|
|||||||||||||||||||||||||||||||||||||
|
2013
|
2012
|
2011
|
Other Benefits
|
||||||||||||||||||||||||||||||||||
|
U.S.
|
|
Int’l.
|
|
U.S.
|
|
Int’l.
|
|
U.S.
|
|
Int’l.
|
|
2013
|
|
2012
|
|
2011
|
|
||||||||||||||||||||
|
Net Periodic Benefit Cost
|
|||||||||||||||||||||||||||||||||||||
|
Service cost
|
$
|
495
|
|
$
|
197
|
|
$
|
452
|
|
$
|
181
|
|
$
|
374
|
|
$
|
174
|
|
$
|
66
|
|
$
|
61
|
|
$
|
58
|
|
||||||||||
|
Interest cost
|
471
|
|
314
|
|
435
|
|
320
|
|
463
|
|
325
|
|
149
|
|
153
|
|
180
|
|
|||||||||||||||||||
|
Expected return on plan assets
|
(701
|
)
|
(274
|
)
|
(634
|
)
|
(269
|
)
|
(613
|
)
|
(283
|
)
|
—
|
|
—
|
|
—
|
|
|||||||||||||||||||
|
Amortization of prior service costs (credits)
|
2
|
|
21
|
|
(7
|
)
|
18
|
|
(8
|
)
|
19
|
|
(50
|
)
|
(72
|
)
|
(72
|
)
|
|||||||||||||||||||
|
Recognized actuarial losses
|
485
|
|
143
|
|
470
|
|
136
|
|
310
|
|
101
|
|
53
|
|
56
|
|
64
|
|
|||||||||||||||||||
|
Settlement losses
|
173
|
|
12
|
|
220
|
|
5
|
|
298
|
|
—
|
|
—
|
|
(26
|
)
|
—
|
|
|||||||||||||||||||
|
Curtailment losses (gains)
|
—
|
|
—
|
|
—
|
|
—
|
|
—
|
|
35
|
|
—
|
|
—
|
|
(10
|
)
|
|||||||||||||||||||
|
Total net periodic benefit cost
|
925
|
|
413
|
|
936
|
|
391
|
|
824
|
|
371
|
|
218
|
|
172
|
|
220
|
|
|||||||||||||||||||
|
Changes Recognized in Comprehensive Income
|
|||||||||||||||||||||||||||||||||||||
|
Net actuarial (gain) loss during period
|
(2,244
|
)
|
(476
|
)
|
805
|
|
330
|
|
2,671
|
|
448
|
|
(659
|
)
|
45
|
|
131
|
|
|||||||||||||||||||
|
Amortization of actuarial loss
|
(658
|
)
|
(155
|
)
|
(700
|
)
|
(141
|
)
|
(608
|
)
|
(101
|
)
|
(53
|
)
|
(79
|
)
|
(64
|
)
|
|||||||||||||||||||
|
Prior service (credits) costs during period
|
(78
|
)
|
18
|
|
94
|
|
37
|
|
—
|
|
27
|
|
—
|
|
11
|
|
—
|
|
|||||||||||||||||||
|
Amortization of prior service (costs) credits
|
(2
|
)
|
(21
|
)
|
7
|
|
(18
|
)
|
8
|
|
(54
|
)
|
50
|
|
72
|
|
72
|
|
|||||||||||||||||||
|
Total changes recognized in other
comprehensive income |
(2,982
|
)
|
(634
|
)
|
206
|
|
208
|
|
2,071
|
|
320
|
|
(662
|
)
|
49
|
|
139
|
|
|||||||||||||||||||
|
Recognized in Net Periodic Benefit Cost and Other Comprehensive Income
|
$
|
(2,057
|
)
|
$
|
(221
|
)
|
$
|
1,142
|
|
$
|
599
|
|
$
|
2,895
|
|
$
|
691
|
|
$
|
(444
|
)
|
$
|
221
|
|
$
|
359
|
|
||||||||||
Net actuarial losses recorded in “Accumulated other comprehensive loss” at
December 31, 2013
, for the company’s U.S. pension, international pension and OPEB plans are being amortized on a straight-line basis over approximately
10
,
12
and
10
years, respectively. These amortization periods represent the estimated average remaining service of employees expected to receive benefits under the plans. These losses are amortized to the extent they exceed
10 percent
of the higher of the projected benefit obligation or market-related value of plan assets. The amount subject to amortization is determined on a plan-by-plan basis. During
2014
, the company estimates actuarial losses of
$209
,
$102
and
$7
will be amortized from “Accumulated other comprehensive loss” for U.S. pension, international pension and OPEB plans,
respectively. In addition, the company estimates an additional
$132
will be recognized from “Accumulated other comprehensive loss” during
2014
related to lump-sum settlement costs from U.S. pension plans.
The weighted average amortization period for recognizing prior service costs (credits) recorded in “Accumulated other comprehensive loss” at
December 31, 2013
, was approximately
10
and
12
years for U.S. and international pension plans, respectively, and
10
years for other postretirement benefit plans. During
2014
, the company estimates prior service (credits) costs of
$(9)
,
$21
and
$14
will be amortized from “Accumulated other comprehensive loss” for U.S. pension, international pension and OPEB plans, respectively.
FS-50
|
Notes to the Consolidated Financial Statements
Millions of dollars, except per-share amounts
Note 21
Employee Benefit Plans - Continued
|
||
Assumptions
The following weighted-average assumptions were used to determine benefit obligations and net periodic benefit costs for years ended December 31:
|
Pension Benefits
|
||||||||||||||||||||||||||||
|
2013
|
2012
|
2011
|
Other Benefits
|
|||||||||||||||||||||||||
|
U.S.
|
|
Int’l.
|
|
U.S.
|
|
Int’l.
|
|
U.S.
|
|
Int’l.
|
|
2013
|
|
2012
|
|
2011
|
|
|||||||||||
|
Assumptions used to determine benefit obligations:
|
||||||||||||||||||||||||||||
|
Discount rate
|
4.3
|
%
|
5.8
|
%
|
3.6
|
%
|
5.2
|
%
|
3.8
|
%
|
5.9
|
%
|
4.9
|
%
|
4.1
|
%
|
4.2
|
%
|
||||||||||
|
Rate of compensation increase
|
4.5
|
%
|
5.5
|
%
|
4.5
|
%
|
5.5
|
%
|
4.5
|
%
|
5.7
|
%
|
N/A
|
|
N/A
|
|
N/A
|
|
||||||||||
|
Assumptions used to determine net periodic benefit cost:
|
||||||||||||||||||||||||||||
|
Discount rate
|
3.6
|
%
|
5.2
|
%
|
3.8
|
%
|
5.9
|
%
|
4.8
|
%
|
6.5
|
%
|
4.1
|
%
|
4.2
|
%
|
5.2
|
%
|
||||||||||
|
Expected return on plan assets
|
7.5
|
%
|
6.8
|
%
|
7.5
|
%
|
7.5
|
%
|
7.8
|
%
|
7.8
|
%
|
N/A
|
|
N/A
|
|
N/A
|
|
||||||||||
|
Rate of compensation increase
|
4.5
|
%
|
5.5
|
%
|
4.5
|
%
|
5.7
|
%
|
4.5
|
%
|
6.7
|
%
|
N/A
|
|
N/A
|
|
N/A
|
|
||||||||||
Expected Return on Plan Assets
The company’s estimated long-term rates of return on pension assets are driven primarily by actual historical asset-class returns, an assessment of expected future performance, advice from external actuarial firms and the incorporation of specific asset-class risk factors. Asset allocations are periodically updated using pension plan asset/liability studies, and the company’s estimated long-term rates of return are consistent with these studies.
For
2013
, the company used an expected long-term rate of return of
7.5 percent
for U.S. pension plan assets, which account for
71 percent
of the company’s pension plan assets. In
2012
and
2011
, the company used a long-term rate of return of
7.5
and 7.8 percent, respectively for this plan.
The market-related value of assets of the major U.S. pension plan used in the determination of pension expense was based on the market values in the
three
months preceding the year-end measurement date. Management considers the
three
-month time period long enough to minimize the effects of distortions from day-to-day market volatility and still be contemporaneous to the end of the year. For other plans, market value of assets as of year-end is used in calculating the pension expense.
Discount Rate
The discount rate assumptions used to determine the U.S. and international pension and postretirement benefit plan obligations and expense reflect the rate at which benefits could be effectively settled, and is equal to the equivalent single rate resulting from yield curve analysis. This analysis considered the projected benefit payments specific to the company's plans and the yields on high-quality bonds. At
December 31, 2013
, the company used a
4.3 percent
discount rate for the U.S. pension plans and
4.7 percent
for the main U.S. OPEB plan. The discount rates at the end of
2012
and
2011
were
3.6
and
3.9 percent
and
3.8
and
4.0 percent
for the U.S. pension plans and the main U.S. OPEB plans, respectively.
Other Benefit Assumptions
For the measurement of accumulated postretirement benefit obligation at
December 31, 2013
, for the main U.S. postretirement medical plan, the assumed health care cost-trend rates start with
7.3 percent
in
2014
and gradually decline to
4.5 percent
for
2025
and beyond. For this measurement at
December 31, 2012
, the assumed health care cost-trend rates started with
7.5 percent
in
2013
and gradually declined to
4.5
percent
for
2025
and beyond. In both measurements, the annual increase to company contributions was capped at
4 percent
.
Assumed health care cost-trend rates can have a significant effect on the amounts reported for retiree health care costs. The impact is mitigated by the
4 percent
cap on the company’s medical contributions for the primary U.S. plan. A 1-percentage-point change in the assumed health care cost-trend rates would have the following effects on worldwide plans:
|
1 Percent
|
|
1 Percent
|
|
||||
|
Increase
|
|
Decrease
|
|
||||
|
Effect on total service and interest cost components
|
$
|
13
|
|
$
|
(11
|
)
|
|
|
Effect on postretirement benefit obligation
|
$
|
137
|
|
$
|
(115
|
)
|
|
Plan Assets and Investment Strategy
The fair value hierarchy of inputs the company uses to value the pension assets is divided into three levels:
Level 1: Fair values of these assets are measured using unadjusted quoted prices for the assets or the prices of identical assets in active markets that the plans have the ability to access.
Level 2: Fair values of these assets are measured based on quoted prices for similar assets in active markets; quoted prices for identical or similar assets in inactive markets; inputs other than quoted prices that are observable for the asset; and inputs that are derived principally from or corroborated by observable market data through correlation or other means. If
FS-51
|
Note 21
Employee Benefit Plans - Continued
|
||
the asset has a contractual term, the Level 2 input is observable for substantially the full term of the asset. The fair values for Level 2 assets are generally obtained from third-party broker quotes, independent pricing services and exchanges.
Level 3: Inputs to the fair value measurement are unobservable for these assets. Valuation may be performed using a financial model with estimated inputs entered into the model.
The fair value measurements of the company’s pension plans for
2013
and
2012
are below:
|
U.S.
|
Int’l.
|
|||||||||||||||||||||||||||||||
|
Total Fair Value
|
|
Level 1
|
|
Level 2
|
|
Level 3
|
|
Total Fair Value
|
|
Level 1
|
|
Level 2
|
|
Level 3
|
|
|||||||||||||||||
|
At December 31, 2012
|
||||||||||||||||||||||||||||||||
|
Equities
|
||||||||||||||||||||||||||||||||
|
U.S.
1
|
$
|
1,709
|
|
$
|
1,709
|
|
$
|
—
|
|
$
|
—
|
|
$
|
334
|
|
$
|
334
|
|
$
|
—
|
|
$
|
—
|
|
||||||||
|
International
|
1,263
|
|
1,263
|
|
—
|
|
—
|
|
520
|
|
520
|
|
—
|
|
—
|
|
||||||||||||||||
|
Collective Trusts/Mutual Funds
2
|
2,979
|
|
7
|
|
2,972
|
|
—
|
|
1,233
|
|
402
|
|
831
|
|
—
|
|
||||||||||||||||
|
Fixed Income
|
||||||||||||||||||||||||||||||||
|
Government
|
435
|
|
396
|
|
39
|
|
—
|
|
578
|
|
40
|
|
538
|
|
—
|
|
||||||||||||||||
|
Corporate
|
384
|
|
—
|
|
384
|
|
—
|
|
230
|
|
25
|
|
175
|
|
30
|
|
||||||||||||||||
|
Mortgage-Backed Securities
|
65
|
|
—
|
|
65
|
|
—
|
|
2
|
|
—
|
|
—
|
|
2
|
|
||||||||||||||||
|
Other Asset Backed
|
51
|
|
—
|
|
51
|
|
—
|
|
4
|
|
—
|
|
4
|
|
—
|
|
||||||||||||||||
|
Collective Trusts/Mutual Funds
2
|
1,520
|
|
—
|
|
1,520
|
|
—
|
|
671
|
|
26
|
|
645
|
|
—
|
|
||||||||||||||||
|
Mixed Funds
3
|
—
|
|
—
|
|
—
|
|
—
|
|
115
|
|
4
|
|
111
|
|
—
|
|
||||||||||||||||
|
Real Estate
4
|
1,114
|
|
—
|
|
—
|
|
1,114
|
|
177
|
|
—
|
|
—
|
|
177
|
|
||||||||||||||||
|
Cash and Cash Equivalents
|
373
|
|
373
|
|
—
|
|
—
|
|
222
|
|
204
|
|
18
|
|
—
|
|
||||||||||||||||
|
Other
5
|
16
|
|
(44
|
)
|
5
|
|
55
|
|
39
|
|
(3
|
)
|
40
|
|
2
|
|
||||||||||||||||
|
Total at December 31, 2012
|
$
|
9,909
|
|
$
|
3,704
|
|
$
|
5,036
|
|
$
|
1,169
|
|
$
|
4,125
|
|
$
|
1,552
|
|
$
|
2,362
|
|
$
|
211
|
|
||||||||
|
At December 31, 2013
|
||||||||||||||||||||||||||||||||
|
Equities
|
||||||||||||||||||||||||||||||||
|
U.S.
1
|
$
|
2,298
|
|
$
|
2,298
|
|
$
|
—
|
|
$
|
—
|
|
$
|
409
|
|
$
|
409
|
|
$
|
—
|
|
$
|
—
|
|
||||||||
|
International
|
1,501
|
|
1,501
|
|
—
|
|
—
|
|
533
|
|
533
|
|
—
|
|
—
|
|
||||||||||||||||
|
Collective Trusts/Mutual Funds
2
|
2,977
|
|
26
|
|
2,951
|
|
—
|
|
1,066
|
|
211
|
|
855
|
|
—
|
|
||||||||||||||||
|
Fixed Income
|
||||||||||||||||||||||||||||||||
|
Government
|
81
|
|
52
|
|
29
|
|
—
|
|
726
|
|
46
|
|
680
|
|
—
|
|
||||||||||||||||
|
Corporate
|
1,275
|
|
—
|
|
1,275
|
|
—
|
|
545
|
|
23
|
|
499
|
|
23
|
|
||||||||||||||||
|
Mortgage-Backed Securities
|
1
|
|
—
|
|
1
|
|
—
|
|
4
|
|
—
|
|
2
|
|
2
|
|
||||||||||||||||
|
Other Asset Backed
|
—
|
|
—
|
|
—
|
|
—
|
|
—
|
|
—
|
|
—
|
|
—
|
|
||||||||||||||||
|
Collective Trusts/Mutual Funds
2
|
1,357
|
|
—
|
|
1,357
|
|
—
|
|
647
|
|
27
|
|
620
|
|
—
|
|
||||||||||||||||
|
Mixed Funds
3
|
—
|
|
—
|
|
—
|
|
—
|
|
120
|
|
5
|
|
115
|
|
—
|
|
||||||||||||||||
|
Real Estate
4
|
1,265
|
|
—
|
|
—
|
|
1,265
|
|
294
|
|
—
|
|
—
|
|
294
|
|
||||||||||||||||
|
Cash and Cash Equivalents
|
385
|
|
385
|
|
—
|
|
—
|
|
173
|
|
173
|
|
—
|
|
—
|
|
||||||||||||||||
|
Other
5
|
70
|
|
(2
|
)
|
18
|
|
54
|
|
26
|
|
(2
|
)
|
25
|
|
3
|
|
||||||||||||||||
|
Total at December 31, 2013
|
$
|
11,210
|
|
$
|
4,260
|
|
$
|
5,631
|
|
$
|
1,319
|
|
$
|
4,543
|
|
$
|
1,425
|
|
$
|
2,796
|
|
$
|
322
|
|
||||||||
|
1
|
U.S. equities include investments in the company’s common stock in the amount of
$28
at
December 31, 2013
, and
$27
at
December 31, 2012
.
|
|
2
|
Collective Trusts/Mutual Funds for U.S. plans are entirely index funds; for International plans, they are mostly index funds. For these index funds, the Level 2 designation is partially based on the restriction that advance notification of redemptions, typically two business days, is required.
|
|
3
|
Mixed funds are composed of funds that invest in both equity and fixed-income instruments in order to diversify and lower risk.
|
|
4
|
The year-end valuations of the U.S. real estate assets are based on internal appraisals by the real estate managers, which are updates of third-party appraisals that occur at least once a year for each property in the portfolio.
|
|
5
|
The “Other” asset class includes net payables for securities purchased but not yet settled (Level 1); dividends and interest- and tax-related receivables (Level 2); insurance contracts and investments in private-equity limited partnerships (Level 3).
|
FS-52
|
Notes to the Consolidated Financial Statements
Millions of dollars, except per-share amounts
Note 21
Employee Benefit Plans - Continued
|
||
The effects of fair value measurements using significant unobservable inputs on changes in Level 3 plan assets are outlined below:
|
Fixed Income
|
||||||||||||||||||||||
|
Mortgage-Backed
|
|
|||||||||||||||||||||
|
Corporate
|
|
Securities
|
|
Real Estate
|
|
Other
|
|
Total
|
|
|||||||||||||
|
Total at December 31, 2011
|
$
|
27
|
|
$
|
2
|
|
$
|
998
|
|
$
|
56
|
|
$
|
1,083
|
|
|||||||
|
Actual Return on Plan Assets:
|
||||||||||||||||||||||
|
Assets held at the reporting date
|
—
|
|
—
|
|
108
|
|
1
|
|
109
|
|
||||||||||||
|
Assets sold during the period
|
—
|
|
—
|
|
2
|
|
—
|
|
2
|
|
||||||||||||
|
Purchases, Sales and Settlements
|
4
|
|
—
|
|
182
|
|
—
|
|
186
|
|
||||||||||||
|
Transfers in and/or out of Level 3
|
—
|
|
—
|
|
—
|
|
—
|
|
—
|
|
||||||||||||
|
Total at December 31, 2012
|
$
|
31
|
|
$
|
2
|
|
$
|
1,290
|
|
$
|
57
|
|
$
|
1,380
|
|
|||||||
|
Actual Return on Plan Assets:
|
||||||||||||||||||||||
|
Assets held at the reporting date
|
(9
|
)
|
—
|
|
90
|
|
—
|
|
81
|
|
||||||||||||
|
Assets sold during the period
|
—
|
|
—
|
|
3
|
|
—
|
|
3
|
|
||||||||||||
|
Purchases, Sales and Settlements
|
1
|
|
—
|
|
176
|
|
—
|
|
177
|
|
||||||||||||
|
Transfers in and/or out of Level 3
|
—
|
|
—
|
|
—
|
|
—
|
|
—
|
|
||||||||||||
|
Total at December 31, 2013
|
$
|
23
|
|
$
|
2
|
|
$
|
1,559
|
|
$
|
57
|
|
$
|
1,641
|
|
|||||||
The primary investment objectives of the pension plans are to achieve the highest rate of total return within prudent levels of risk and liquidity, to diversify and mitigate potential downside risk associated with the investments, and to provide adequate liquidity for benefit payments and portfolio management.
The company’s U.S. and U.K. pension plans comprise
88 percent
of the total pension assets. Both the U.S. and U.K. plans have an Investment Committee that regularly meets during the year to review the asset holdings and their returns. To assess the plans’ investment performance, long-term asset allocation policy benchmarks have been established.
For the primary U.S. pension plan, the company's Benefit Plan Investment Committee has established the following approved asset allocation ranges: Equities
40
–
70 percent
, Fixed Income and Cash
20
–
60 percent
, Real Estate
0
–
15 percent
, and Other
0
–
5 percent
. For the U.K. pension plan, the U.K. Board of Trustees has established the following asset allocation guidelines, which are reviewed regularly: Equities
40
-
60
percent, Fixed Income and Cash
25
–
50 percent
and Real Estate
5
-
15
percent. The other significant international pension plans also have established maximum and minimum asset allocation ranges that vary by plan. Actual asset allocation within approved ranges is based on a variety of current economic and market conditions and consideration of specific asset class risk. To mitigate concentration and other risks, assets are invested across multiple asset classes with active investment managers and passive index funds.
The company does not prefund its OPEB obligations.
Cash Contributions and Benefit Payments
In
2013
, the company contributed
$819
and
$375
to its U.S. and international pension plans, respectively. In
2014
, the company expects contributions to be approximately
$350
to its U.S. plan and
$350
to its international pension plans. Actual contribution amounts are dependent upon investment returns, changes in pension obligations, regulatory environments and other economic factors. Additional funding may
ultimately be required if investment returns are insufficient to offset increases in plan obligations.
The company anticipates paying other postretirement benefits of approximately
$215
in
2014
, compared with
$205
paid in
2013
.
The following benefit payments, which include estimated future service, are expected to be paid by the company in the next 10 years:
|
Pension Benefits
|
Other
|
|
|||||||||
|
U.S.
|
|
Int’l.
|
|
Benefits
|
|
||||||
|
2014
|
$
|
1,212
|
|
$
|
284
|
|
$
|
215
|
|
||
|
2015
|
$
|
1,187
|
|
$
|
290
|
|
$
|
218
|
|
||
|
2016
|
$
|
1,170
|
|
$
|
284
|
|
$
|
221
|
|
||
|
2017
|
$
|
1,175
|
|
$
|
363
|
|
$
|
224
|
|
||
|
2018
|
$
|
1,168
|
|
$
|
391
|
|
$
|
227
|
|
||
|
2019-2023
|
$
|
5,399
|
|
$
|
2,307
|
|
$
|
1,148
|
|
||
Employee Savings Investment Plan
Eligible employees of Chevron and certain of its subsidiaries participate in the Chevron Employee Savings Investment Plan (ESIP).
Charges to expense for the ESIP represent the company’s contributions to the plan, which are funded either through the purchase of shares of common stock on the open market or through the release of common stock held in the leveraged employee stock ownership plan (LESOP), which is described in the section that follows. Total company matching contributions to employee accounts within the ESIP were
$303
,
$286
and
$263
in
2013
,
2012
and
2011
, respectively. This cost was reduced by the value of shares released from the LESOP totaling
$140
,
$43
and
$38
in
2013
,
2012
and
2011
, respectively. The remaining amounts, totaling
$163
,
$243
FS-53
|
Note 21
Employee Benefit Plans - Continued
|
||
and
$225
in
2013
,
2012
and
2011
, respectively, represent open market purchases.
Employee Stock Ownership Plan
Within the Chevron ESIP is an employee stock ownership plan (ESOP). In 1989, Chevron established a LESOP as a constituent part of the ESOP. The LESOP provides partial prefunding of the company’s future commitments to the ESIP. The debt associated with the LESOP was retired in 2013 and the remaining unallocated shares were distributed to ESIP participants during the year.
The company reported compensation expense equal to LESOP debt principal repayments less dividends received and used by the LESOP for debt service. Interest accrued on LESOP debt was recorded as interest expense. Dividends paid on LESOP shares were reflected as a reduction of retained earnings. All LESOP shares were considered outstanding for earnings-per-share computations.
Total expenses (credits) for the LESOP were
$5
,
$1
and
$(1)
in
2013
,
2012
and
2011
, respectively. The net expense (credit) for the respective years were composed of compensation expenses (credits) of
$4
$(2)
and
$(5)
and charges to interest expense for LESOP debt of
$1
,
$3
and
$4
.
Of the dividends paid on the LESOP shares,
$38
,
$18
and
$18
were used in
2013
,
2012
and
2011
, respectively, to service LESOP debt. The company also contributed $
7
and $
2
in 2013 and 2012, respectively, to satisfy LESOP debt service. No company contributions were required in 2011, as dividends received by the LESOP were sufficient to satisfy LESOP debt service.
Shares held in the LESOP were released and allocated to the accounts of ESIP participants based on debt service deemed to be paid in the year in proportion to the total of current-year and remaining debt service. LESOP shares as of
December 31, 2013
and
2012
, were as follows:
|
Thousands
|
2013
|
|
2012
|
|
||
|
Allocated shares
|
17,954
|
|
18,055
|
|
||
|
Unallocated shares
|
—
|
|
1,292
|
|
||
|
Total LESOP shares
|
17,954
|
|
19,347
|
|
||
Benefit Plan Trusts
Prior to its acquisition by Chevron, Texaco established a benefit plan trust for funding obligations under some of its benefit plans. At year-end
2013
, the trust contained
14.2 million
shares of Chevron treasury stock. The trust will sell the shares or use the dividends from the shares to pay benefits only to the extent that the company does not pay such benefits. The company intends to continue to pay its obligations under the benefit plans. The trustee will vote the shares held in the trust as instructed by the trust’s beneficiaries. The shares held in the trust are not considered outstanding for earnings-per-share purposes until distributed or sold by the trust in payment of benefit obligations.
Prior to its acquisition by Chevron, Unocal established various grantor trusts to fund obligations under some of its benefit plans, including the deferred compensation and supplemental retirement plans. At
December 31, 2013
and
2012
, trust assets of
$40
and
$48
, respectively, were invested primarily in interest-earning accounts.
Employee Incentive Plans
The Chevron Incentive Plan is an annual cash bonus plan for eligible employees that links awards to corporate, business unit and individual performance in the prior year. Charges to expense for cash bonuses were
$871
,
$898
and
$1,217
in
2013
,
2012
and
2011
, respectively. Chevron also has the LTIP for officers and other regular salaried employees of the company and its subsidiaries who hold positions of significant responsibility. Awards under the LTIP consist of stock options and other share-based compensation that are described in Note 20, beginning on page FS-47.
Note 22
Equity
Retained earnings at December 31,
2013
and
2012
, included approximately
$11,395
and
$10,119
, respectively, for the company’s share of undistributed earnings of equity affiliates.
At December 31,
2013
, about
143 million
shares of Chevron’s common stock remained available for issuance from the
260 million
shares that were reserved for issuance under the Chevron LTIP. In addition, approximately
204,000
shares remain available for issuance from the
800,000
shares of the company’s common stock that were reserved for awards under the Chevron Corporation Non-Employee Directors’ Equity Compensation and Deferral Plan.
Note 23
Other Contingencies and Commitments
Income Taxes
The company calculates its income tax expense and liabilities quarterly. These liabilities generally are subject to audit and are not finalized with the individual taxing authorities until several years after the end of the annual period for which income taxes have been calculated. Refer to Note 15, beginning on page FS-43, for a discussion of the periods for which tax returns have been audited for the company’s major tax jurisdictions and a discussion for all tax jurisdictions of the differences between the amount of tax benefits recognized in the financial statements and the amount taken or expected to be taken in a tax return. As discussed on page FS-45, Chevron completed its assessment of the potential impact of the August 2012 decision by the U.S. Court of Appeals for the Third Circuit that disallowed the Historic Rehabilitation Tax Credits claimed by an unrelated taxpayer. The findings of this assessment did not result in a
FS-54
|
Note 23
Other Contingencies and Commitments - Continued
|
||
material impact on the company's financial position, results of operations or cash flows.
Guarantees
The company’s guarantee of
$524
is associated with certain payments under a terminal use agreement entered into by an equity affiliate. Over the approximate
14
-year remaining term of the guarantee, the maximum guarantee amount will be reduced as certain fees are paid by the affiliate. There are numerous cross-indemnity agreements with the affiliate and the other partners to permit recovery of amounts paid under the guarantee. Chevron has recorded no liability for its obligation under this guarantee.
Indemnifications
In the acquisition of Unocal, the company assumed certain indemnities relating to contingent environmental liabilities associated with assets that were sold in 1997. The acquirer of those assets shared in certain environmental remediation costs up to a maximum obligation of
$200
, which had been reached at December 31, 2009. Under the indemnification agreement, after reaching the
$200
obligation, Chevron is solely responsible until April 2022, when the indemnification expires. The environmental conditions or events that are subject to these indemnities must have arisen prior to the sale of the assets in 1997.
Although the company has provided for known obligations under this indemnity that are probable and reasonably estimable, the amount of additional future costs may be material to results of operations in the period in which they are recognized. The company does not expect these costs will have a material effect on its consolidated financial position or liquidity.
Long-Term Unconditional Purchase Obligations and Commitments, Including Throughput and Take-or-Pay Agreements
The company and its subsidiaries have certain other contingent liabilities with respect to long-term unconditional purchase obligations and commitments, including throughput and take-or-pay agreements, some of which relate to suppliers’ financing arrangements. The agreements typically provide goods and services, such as pipeline and storage capacity, drilling rigs, utilities, and petroleum products, to be used or sold in the ordinary course of the company’s business. The aggregate approximate amounts of required payments under these various commitments are:
2014
–
$4,200
;
2015
–
$4,500
;
2016
–
$3,200
;
2017
–
$2,600
;
2018
–
$2,200
; 2019 and after –
$6,900
. A portion of these commitments may ultimately be shared with project partners. Total payments under the agreements were approximately
$3,600
in
2013
,
$3,600
in
2012
and
$6,600
in
2011
.
Environmental
The company is subject to loss contingencies pursuant to laws, regulations, private claims and legal proceedings related to environmental matters that are subject to legal settlements or that in the future may require the company to take action to correct or ameliorate the effects on the environment of prior release of chemicals or petroleum substances, including MTBE, by the company or other parties. Such contingencies may exist for various sites, including, but not limited to, federal Superfund sites and analogous sites under state laws, refineries, crude oil fields, service stations, terminals, land development areas, and mining operations, whether operating, closed or
divested. These future costs are not fully determinable due to such factors as the unknown magnitude of possible contamination, the unknown timing and extent of the corrective actions that may be required, the determination of the company’s liability in proportion to other responsible parties, and the extent to which such costs are recoverable from third parties.
Although the company has provided for known environmental obligations that are probable and reasonably estimable, the amount of additional future costs may be material to results of operations in the period in which they are recognized. The company does not expect these costs will have a material effect on its consolidated financial position or liquidity. Also, the company does not believe its obligations to make such expenditures have had, or will have, any significant impact on the company’s competitive position relative to other U.S. or international petroleum or chemical companies.
Chevron’s environmental reserve as of
December 31, 2013
, was
$1,456
. Included in this balance were remediation activities at approximately
174
sites for which the company had been identified as a potentially responsible party or otherwise involved in the remediation by the U.S. Environmental Protection Agency (EPA) or other regulatory agencies under the provisions of the federal Superfund law or analogous state laws. The company’s remediation reserve for these sites at year-end
2013
was
$179
. The federal Superfund law and analogous state laws provide for joint and several liability for all responsible parties. Any future actions by the EPA or other regulatory agencies to require Chevron to assume other potentially responsible parties’ costs at designated hazardous waste sites are not expected to have a material effect on the company’s results of operations, consolidated financial position or liquidity.
Of the remaining year-end
2013
environmental reserves balance of
$1,277
,
$834
related to the company’s U.S. downstream operations, including refineries and other plants, marketing locations (i.e., service stations and terminals), chemical facilities, and pipelines. The remaining
$443
was associated with various sites in international downstream
$79
, upstream
$313
and other businesses
$51
. Liabilities at all sites, whether operating, closed or divested, were primarily associated with the company’s plans and activities to
FS-55
|
Notes to the Consolidated Financial Statements
Millions of dollars, except per-share amounts
Note 23
Other Contingencies and Commitments - Continued
|
||
remediate soil or groundwater contamination or both. These and other activities include one or more of the following: site assessment; soil excavation; offsite disposal of contaminants; onsite containment, remediation and/or extraction of petroleum hydrocarbon liquid and vapor from soil; groundwater extraction and treatment; and monitoring of the natural attenuation of the contaminants.
The company manages environmental liabilities under specific sets of regulatory requirements, which in the United States include the Resource Conservation and Recovery Act and various state and local regulations. No single remediation site at year-end
2013
had a recorded liability that was material to the company’s results of operations, consolidated financial position or liquidity.
It is likely that the company will continue to incur additional liabilities, beyond those recorded, for environmental remediation relating to past operations. These future costs are not fully determinable due to such factors as the unknown magnitude of possible contamination, the unknown timing and extent of the corrective actions that may be required, the determination of the company’s liability in proportion to other responsible parties, and the extent to which such costs are recoverable from third parties.
Refer to Note 24 for a discussion of the company’s asset retirement obligations.
Other Contingencies
On April 26, 2010, a California appeals court issued a ruling related to the adequacy of an Environmental Impact Report (EIR) supporting the issuance of certain permits by the city of Richmond, California, to replace and upgrade certain facilities at Chevron’s refinery in Richmond. Settlement discussions with plaintiffs in the case ended late fourth quarter 2010, and on March 3, 2011, the trial court entered a final judgment and peremptory writ ordering the City to set aside the project EIR and conditional use permits and enjoining Chevron from any further work. On May 23, 2011, the company filed an application with the City Planning Department for a conditional use permit for a revised project to complete construction of the hydrogen plant, certain sulfur removal facilities and related infrastructure. On June 10, 2011, the City published its Notice of Preparation of the revised EIR for the project. The revised and recirculated EIR is intended to comply with the appeals court decision. Management believes the outcomes associated with the project are uncertain. Due to the uncertainty of the company’s future course of action, or potential outcomes of any action or combination of actions, management does not believe an estimate of the financial effects, if any, can be made at this time.
Chevron receives claims from and submits claims to customers; trading partners; U.S. federal, state and local regulatory bodies; governments; contractors; insurers; and suppliers. The amounts of these claims, individually and in the aggregate, may be significant and take lengthy periods to resolve.
The company and its affiliates also continue to review and analyze their operations and may close, abandon, sell, exchange, acquire or restructure assets to achieve operational or strategic benefits and to improve competitiveness and profitability. These activities, individually or together, may result in gains or losses in future periods.
Note 24
Asset Retirement Obligations
The company records the fair value of a liability for an asset retirement obligation (ARO) as an asset and liability when there is a legal obligation associated with the retirement of a tangible long-lived asset and the liability can be reasonably estimated. The legal obligation to perform the asset retirement activity is unconditional, even though uncertainty may exist about the timing and/or method of settlement that may be beyond the company’s control. This uncertainty about the timing and/or method of settlement is factored into the measurement of the liability when sufficient information exists to reasonably estimate fair value. Recognition of the ARO includes: (1) the present value of a liability and offsetting asset, (2) the subsequent accretion of that liability and depreciation of the asset, and (3) the periodic review of the ARO liability estimates and discount rates.
AROs are primarily recorded for the company’s crude oil and natural gas producing assets. No significant AROs associated with any legal obligations to retire downstream long-lived assets have been recognized, as indeterminate settlement dates for the asset retirements prevent estimation of the fair value of the associated ARO. The company performs periodic reviews of its downstream long-lived assets for any changes in facts and circumstances that might require recognition of a retirement obligation.
The following table indicates the changes to the company’s before-tax asset retirement obligations in
2013
,
2012
and
2011
:
|
2013
|
|
2012
|
|
2011
|
|
|||||||
|
Balance at January 1
|
$
|
13,271
|
|
$
|
12,767
|
|
$
|
12,488
|
|
|||
|
Liabilities incurred
|
59
|
|
133
|
|
62
|
|
||||||
|
Liabilities settled
|
(907
|
)
|
(966
|
)
|
(1,316
|
)
|
||||||
|
Accretion expense
|
627
|
|
629
|
|
628
|
|
||||||
|
Revisions in estimated cash flows
|
1,248
|
|
708
|
|
905
|
|
||||||
|
Balance at December 31
|
$
|
14,298
|
|
$
|
13,271
|
|
$
|
12,767
|
|
|||
In the table above, the amounts associated with "Revisions in estimated cash flows" reflect increasing cost estimates to abandon wells, equipment and facilities.
The long-term portion of the
$14,298
balance at the end of
2013
was
$13,476
.
FS-56
|
Note 25 Other Financial Information |
Note 25
Other Financial Information
Earnings in
2013
included after-tax gains of approximately
$500
relating to the sale of nonstrategic properties. Of this amount, approximately
$300
and $
200
related to downstream and upstream assets, respectively. Earnings in
2012
included after-tax gains of approximately
$2,800
relating to the sale of nonstrategic properties. Of this amount, approximately
$2,200
and $
600
related to upstream and downstream assets, respectively.
Other financial information is as follows:
|
Year ended December 31
|
||||||||||||
|
2013
|
|
2012
|
|
2011
|
|
|||||||
|
Total financing interest and debt costs
|
$
|
284
|
|
$
|
242
|
|
$
|
288
|
|
|||
|
Less: Capitalized interest
|
284
|
|
242
|
|
288
|
|
||||||
|
Interest and debt expense
|
$
|
—
|
|
$
|
—
|
|
$
|
—
|
|
|||
|
Research and development expenses
|
$
|
750
|
|
$
|
648
|
|
$
|
627
|
|
|||
|
Foreign currency effects*
|
$
|
474
|
|
$
|
(454
|
)
|
$
|
121
|
|
|||
|
*
|
Includes
$244
,
$(202)
and
$(27)
in
2013
,
2012
and
2011
, respectively, for the company’s share of equity affiliates’ foreign currency effects.
|
The excess of replacement cost over the carrying value of inventories for which the last-in, first-out (LIFO) method is used was
$9,150
and
$9,292
at December 31,
2013
and
2012
, respectively. Replacement cost is generally based on average acquisition costs for the year. LIFO profits (charges) of
$14
,
$121
and
$193
were included in earnings for the years
2013
,
2012
and
2011
, respectively.
The company has
$4,639
in goodwill on the Consolidated Balance Sheet related to the 2005 acquisition of Unocal and to the 2011 acquisition of Atlas Energy, Inc. The company tested this goodwill for impairment during
2013
and concluded no impairment was necessary.
Note 26
Assets Held For Sale
At December 31, 2013, the company classified
$580
of net properties, plant and equipment as “Assets held for sale” on the Consolidated Balance Sheet. These assets are associated with upstream operations that are anticipated to be sold in 2014. The revenues and earnings contributions of these assets in 2013 were not material.
Note 27
Earnings Per Share
Basic earnings per share (EPS) is based upon “Net Income Attributable to Chevron Corporation” (“earnings”) and includes the effects of deferrals of salary and other compensation awards that are invested in Chevron stock units by certain officers and employees of the company. Diluted EPS includes the effects of these items as well as the dilutive effects of outstanding stock options awarded under the company’s stock option programs (refer to Note 20, “Stock Options and Other Share-Based Compensation,” beginning on page FS-47). The table below sets forth the computation of basic and diluted EPS:
|
Year ended December 31
|
||||||||||||
|
2013
|
|
2012
|
|
2011
|
|
|||||||
|
Basic EPS Calculation
|
||||||||||||
|
Earnings available to common stockholders - Basic*
|
$
|
21,423
|
|
$
|
26,179
|
|
$
|
26,895
|
|
|||
|
Weighted-average number of common shares outstanding
|
1,916
|
|
1,950
|
|
1,986
|
|
||||||
|
Add: Deferred awards held as stock units
|
1
|
|
—
|
|
—
|
|
||||||
|
Total weighted-average number of common shares outstanding
|
1,917
|
|
1,950
|
|
1,986
|
|
||||||
|
Earnings per share of common stock - Basic
|
$
|
11.18
|
|
$
|
13.42
|
|
$
|
13.54
|
|
|||
|
Diluted EPS Calculation
|
||||||||||||
|
Earnings available to common stockholders - Diluted*
|
$
|
21,423
|
|
$
|
26,179
|
|
$
|
26,895
|
|
|||
|
Weighted-average number of common shares outstanding
|
1,916
|
|
1,950
|
|
1,986
|
|
||||||
|
Add: Deferred awards held as stock units
|
1
|
|
—
|
|
—
|
|
||||||
|
Add: Dilutive effect of employee stock-based awards
|
15
|
|
15
|
|
15
|
|
||||||
|
Total weighted-average number of common shares outstanding
|
1,932
|
|
1,965
|
|
2,001
|
|
||||||
|
Earnings per share of common stock - Diluted
|
$
|
11.09
|
|
$
|
13.32
|
|
$
|
13.44
|
|
|||
*
There was no effect of dividend equivalents paid on stock units or dilutive impact of employee stock-based awards on earnings.
FS-57
Five-Year Financial Summary
Unaudited
|
Millions of dollars, except per-share amounts
|
2013
|
|
2012
|
|
2011
|
|
2010
|
|
2009
|
|
||||||||||
|
Statement of Income Data
|
||||||||||||||||||||
|
Revenues and Other Income
|
||||||||||||||||||||
|
Total sales and other operating revenues*
|
$
|
220,156
|
|
$
|
230,590
|
|
$
|
244,371
|
|
$
|
198,198
|
|
$
|
167,402
|
|
|||||
|
Income from equity affiliates and other income
|
8,692
|
|
11,319
|
|
9,335
|
|
6,730
|
|
4,234
|
|
||||||||||
|
Total Revenues and Other Income
|
228,848
|
|
241,909
|
|
253,706
|
|
204,928
|
|
171,636
|
|
||||||||||
|
Total Costs and Other Deductions
|
192,943
|
|
195,577
|
|
206,072
|
|
172,873
|
|
153,108
|
|
||||||||||
|
Income Before Income Tax Expense
|
35,905
|
|
46,332
|
|
47,634
|
|
32,055
|
|
18,528
|
|
||||||||||
|
Income Tax Expense
|
14,308
|
|
19,996
|
|
20,626
|
|
12,919
|
|
7,965
|
|
||||||||||
|
Net Income
|
21,597
|
|
26,336
|
|
27,008
|
|
19,136
|
|
10,563
|
|
||||||||||
|
Less: Net income attributable to noncontrolling interests
|
174
|
|
157
|
|
113
|
|
112
|
|
80
|
|
||||||||||
|
Net Income Attributable to Chevron Corporation
|
$
|
21,423
|
|
$
|
26,179
|
|
$
|
26,895
|
|
$
|
19,024
|
|
$
|
10,483
|
|
|||||
|
Per Share of Common Stock
|
||||||||||||||||||||
|
Net Income Attributable to Chevron
|
||||||||||||||||||||
|
– Basic
|
$
|
11.18
|
|
$
|
13.42
|
|
$
|
13.54
|
|
$
|
9.53
|
|
$
|
5.26
|
|
|||||
|
– Diluted
|
$
|
11.09
|
|
$
|
13.32
|
|
$
|
13.44
|
|
$
|
9.48
|
|
$
|
5.24
|
|
|||||
|
Cash Dividends Per Share
|
$
|
3.90
|
|
$
|
3.51
|
|
$
|
3.09
|
|
$
|
2.84
|
|
$
|
2.66
|
|
|||||
|
Balance Sheet Data (at December 31)
|
||||||||||||||||||||
|
Current assets
|
$
|
50,250
|
|
$
|
55,720
|
|
$
|
53,234
|
|
$
|
48,841
|
|
$
|
37,216
|
|
|||||
|
Noncurrent assets
|
203,503
|
|
177,262
|
|
156,240
|
|
135,928
|
|
127,405
|
|
||||||||||
|
Total Assets
|
253,753
|
|
232,982
|
|
209,474
|
|
184,769
|
|
164,621
|
|
||||||||||
|
Short-term debt
|
374
|
|
127
|
|
340
|
|
187
|
|
384
|
|
||||||||||
|
Other current liabilities
|
32,644
|
|
34,085
|
|
33,260
|
|
28,825
|
|
25,827
|
|
||||||||||
|
Long-term debt and capital lease obligations
|
20,057
|
|
12,065
|
|
9,812
|
|
11,289
|
|
10,130
|
|
||||||||||
|
Other noncurrent liabilities
|
50,251
|
|
48,873
|
|
43,881
|
|
38,657
|
|
35,719
|
|
||||||||||
|
Total Liabilities
|
103,326
|
|
95,150
|
|
87,293
|
|
78,958
|
|
72,060
|
|
||||||||||
|
Total Chevron Corporation Stockholders' Equity
|
$
|
149,113
|
|
$
|
136,524
|
|
$
|
121,382
|
|
$
|
105,081
|
|
$
|
91,914
|
|
|||||
|
Noncontrolling interests
|
1,314
|
|
1,308
|
|
799
|
|
730
|
|
647
|
|
||||||||||
|
Total Equity
|
$
|
150,427
|
|
$
|
137,832
|
|
$
|
122,181
|
|
$
|
105,811
|
|
$
|
92,561
|
|
|||||
|
* Includes excise, value-added and similar taxes:
|
$
|
8,492
|
|
$
|
8,010
|
|
$
|
8,085
|
|
$
|
8,591
|
|
$
|
8,109
|
|
|||||
FS-58
|
Supplemental Information on Oil and Gas Producing Activities
Unaudited
|
|||
In accordance with FASB and SEC disclosure and reporting requirements for oil and gas producing activities, this section provides supplemental information on oil and gas exploration and producing activities of the company in seven separate
tables. Tables I through IV provide historical cost information pertaining to costs incurred in exploration, property acquisitions and development; capitalized costs; and results of operations. Tables V through VII present information
Table I - Costs Incurred in Exploration, Property Acquisitions and Development
1
|
Consolidated Companies
|
Affiliated Companies
|
||||||||||||||||||||||||||||||||||
|
Other
|
|
||||||||||||||||||||||||||||||||||
|
Millions of dollars
|
U.S.
|
|
Americas
|
|
Africa
|
|
Asia
|
|
Australia
|
|
Europe
|
|
Total
|
|
TCO
|
|
Other
|
|
|||||||||||||||||
|
Year Ended December 31, 2013
|
|||||||||||||||||||||||||||||||||||
|
Exploration
|
|||||||||||||||||||||||||||||||||||
|
Wells
|
$
|
594
|
|
$
|
495
|
|
$
|
88
|
|
$
|
405
|
|
$
|
262
|
|
$
|
123
|
|
$
|
1,967
|
|
$
|
—
|
|
$
|
—
|
|
||||||||
|
Geological and geophysical
|
134
|
|
70
|
|
105
|
|
116
|
|
29
|
|
55
|
|
509
|
|
—
|
|
—
|
|
|||||||||||||||||
|
Rentals and other
|
166
|
|
62
|
|
147
|
|
80
|
|
124
|
|
131
|
|
710
|
|
—
|
|
—
|
|
|||||||||||||||||
|
Total exploration
|
894
|
|
627
|
|
340
|
|
601
|
|
415
|
|
309
|
|
3,186
|
|
—
|
|
—
|
|
|||||||||||||||||
|
Property acquisitions
2
|
|||||||||||||||||||||||||||||||||||
|
Proved
|
71
|
|
—
|
|
26
|
|
64
|
|
—
|
|
1
|
|
162
|
|
—
|
|
—
|
|
|||||||||||||||||
|
Unproved
|
331
|
|
2,068
|
|
—
|
|
203
|
|
105
|
|
3
|
|
2,710
|
|
—
|
|
—
|
|
|||||||||||||||||
|
Total property acquisitions
|
402
|
|
2,068
|
|
26
|
|
267
|
|
105
|
|
4
|
|
2,872
|
|
—
|
|
—
|
|
|||||||||||||||||
|
Development
3
|
7,457
|
|
2,306
|
|
3,549
|
|
4,907
|
|
6,611
|
|
1,046
|
|
25,876
|
|
1,027
|
|
544
|
|
|||||||||||||||||
|
Total Costs Incurred
4
|
$
|
8,753
|
|
$
|
5,001
|
|
$
|
3,915
|
|
$
|
5,775
|
|
$
|
7,131
|
|
$
|
1,359
|
|
$
|
31,934
|
|
$
|
1,027
|
|
$
|
544
|
|
||||||||
|
Year Ended December 31, 2012
5
|
|||||||||||||||||||||||||||||||||||
|
Exploration
|
|||||||||||||||||||||||||||||||||||
|
Wells
|
$
|
251
|
|
$
|
202
|
|
$
|
121
|
|
$
|
271
|
|
$
|
302
|
|
$
|
88
|
|
$
|
1,235
|
|
$
|
—
|
|
$
|
—
|
|
||||||||
|
Geological and geophysical
|
99
|
|
105
|
|
107
|
|
86
|
|
47
|
|
58
|
|
502
|
|
—
|
|
—
|
|
|||||||||||||||||
|
Rentals and other
|
161
|
|
55
|
|
93
|
|
201
|
|
85
|
|
107
|
|
702
|
|
—
|
|
—
|
|
|||||||||||||||||
|
Total exploration
|
511
|
|
362
|
|
321
|
|
558
|
|
434
|
|
253
|
|
2,439
|
|
—
|
|
—
|
|
|||||||||||||||||
|
Property acquisitions
2
|
|||||||||||||||||||||||||||||||||||
|
Proved
|
248
|
|
—
|
|
8
|
|
39
|
|
—
|
|
—
|
|
295
|
|
—
|
|
—
|
|
|||||||||||||||||
|
Unproved
|
1,150
|
|
29
|
|
5
|
|
342
|
|
28
|
|
—
|
|
1,554
|
|
—
|
|
28
|
|
|||||||||||||||||
|
Total property acquisitions
|
1,398
|
|
29
|
|
13
|
|
381
|
|
28
|
|
—
|
|
1,849
|
|
—
|
|
28
|
|
|||||||||||||||||
|
Development
3
|
6,597
|
|
1,211
|
|
3,118
|
|
3,797
|
|
5,379
|
|
753
|
|
20,855
|
|
660
|
|
293
|
|
|||||||||||||||||
|
Total Costs Incurred
4
|
$
|
8,506
|
|
$
|
1,602
|
|
$
|
3,452
|
|
$
|
4,736
|
|
$
|
5,841
|
|
$
|
1,006
|
|
$
|
25,143
|
|
$
|
660
|
|
$
|
321
|
|
||||||||
|
Year Ended December 31, 2011
|
|||||||||||||||||||||||||||||||||||
|
Exploration
|
|||||||||||||||||||||||||||||||||||
|
Wells
|
$
|
321
|
|
$
|
71
|
|
$
|
104
|
|
$
|
146
|
|
$
|
242
|
|
$
|
188
|
|
$
|
1,072
|
|
$
|
—
|
|
$
|
—
|
|
||||||||
|
Geological and geophysical
|
76
|
|
59
|
|
65
|
|
121
|
|
23
|
|
43
|
|
387
|
|
—
|
|
—
|
|
|||||||||||||||||
|
Rentals and other
|
109
|
|
45
|
|
83
|
|
67
|
|
71
|
|
78
|
|
453
|
|
—
|
|
—
|
|
|||||||||||||||||
|
Total exploration
|
506
|
|
175
|
|
252
|
|
334
|
|
336
|
|
309
|
|
1,912
|
|
—
|
|
—
|
|
|||||||||||||||||
|
Property acquisitions
2
|
|||||||||||||||||||||||||||||||||||
|
Proved
|
1,174
|
|
16
|
|
—
|
|
1
|
|
—
|
|
—
|
|
1,191
|
|
—
|
|
—
|
|
|||||||||||||||||
|
Unproved
|
7,404
|
|
228
|
|
—
|
|
—
|
|
—
|
|
25
|
|
7,657
|
|
—
|
|
—
|
|
|||||||||||||||||
|
Total property acquisitions
|
8,578
|
|
244
|
|
—
|
|
1
|
|
—
|
|
25
|
|
8,848
|
|
—
|
|
—
|
|
|||||||||||||||||
|
Development
3
|
5,517
|
|
1,537
|
|
2,698
|
|
2,867
|
|
2,638
|
|
633
|
|
15,890
|
|
379
|
|
368
|
|
|||||||||||||||||
|
Total Costs Incurred
|
$
|
14,601
|
|
$
|
1,956
|
|
$
|
2,950
|
|
$
|
3,202
|
|
$
|
2,974
|
|
$
|
967
|
|
$
|
26,650
|
|
$
|
379
|
|
$
|
368
|
|
||||||||
|
1
|
Includes costs incurred whether capitalized or expensed. Excludes general support equipment expenditures. Includes capitalized amounts related to asset retirement obligations. See Note 24, “Asset Retirement Obligations,” on page FS-56.
|
||||||||
|
2
|
Does not include properties acquired in nonmonetary transactions.
|
||||||||
|
3
|
Includes $661, $963 and $1,035 costs incurred prior to assignment of proved reserves for consolidated companies in 2013, 2012 and 2011, respectively.
|
||||||||
|
4
|
Reconciliation of consolidated and affiliated companies total cost incurred to Upstream capital and exploratory (C&E) expenditures - $ billions.
|
||||||||
|
2013
|
2012
5
|
|
|||||||
|
Total cost incurred
|
$
|
33.5
|
|
$
|
26.1
|
|
|||
|
Non-oil and gas activities
|
5.8
|
|
5.0
|
|
(Primarily includes LNG, gas-to-liquids and transportation activities)
|
||||
|
ARO
|
(1.4
|
)
|
(0.7
|
)
|
|||||
|
Upstream C&E
|
$
|
37.9
|
|
$
|
30.4
|
|
Reference Page FS-12 Upstream total
|
||
|
5
|
2012 Non-oil and gas allocation revised.
|
||||||||
FS-59
|
Table I
Costs Incurred in Exploration, Property Acquisitions and Development - Continued
|
||
on the company’s estimated net proved-reserve quantities, standardized measure of estimated discounted future net cash flows related to proved reserves and changes in estimated discounted future net cash flows. The Africa geographic area includes activities principally in Angola, Chad, Democratic Republic of the Congo, Nigeria and Republic of the Congo. The Asia geographic area includes activities principally in Azerbaijan, Bangladesh, China, Indonesia, Kazakhstan, Myanmar, the Partitioned Zone between Kuwait and Saudi Arabia, the Philippines, and Thailand. The Europe geographic area includes activities primarily in
Denmark, the Netherlands, Norway and the United Kingdom. The Other Americas geographic region includes activities primarily in Argentina, Brazil, Canada, Colombia, and Trinidad and Tobago. Amounts for TCO represent Chevron’s 50 percent equity share of Tengizchevroil, an exploration and production partnership in the Republic of Kazakhstan. The affiliated companies Other amounts are composed of the company’s equity interests principally in Venezuela and Angola. Refer to Note 12, beginning on page FS-37, for a discussion of the company’s major equity affiliates.
Table II - Capitalized Costs Related to Oil and Gas Producing Activities
|
|
Consolidated Companies
|
|
Affiliated Companies
|
||||||||||||||||||||||||||||||||
|
|
|
|
Other
|
|
|
|
|
|
|
|
|
|
|
|
|
|
|
|
|||||||||||||||||
|
Millions of dollars
|
U.S.
|
|
|
Americas
|
|
|
Africa
|
|
|
Asia
|
|
|
Australia
|
|
|
Europe
|
|
|
Total
|
|
|
TCO
|
|
|
Other
|
|
|||||||||
|
At December 31, 2013
|
|||||||||||||||||||||||||||||||||||
|
Unproved properties
|
$
|
10,228
|
|
|
$
|
3,697
|
|
|
$
|
267
|
|
|
$
|
2,064
|
|
|
$
|
1,990
|
|
|
$
|
36
|
|
|
$
|
18,282
|
|
|
$
|
109
|
|
|
$
|
29
|
|
|
Proved properties and
related producing assets |
67,837
|
|
|
12,868
|
|
|
32,936
|
|
|
42,780
|
|
|
3,274
|
|
|
9,592
|
|
|
169,287
|
|
|
6,977
|
|
|
3,408
|
|
|||||||||
|
Support equipment
|
1,314
|
|
|
344
|
|
|
1,180
|
|
|
1,678
|
|
|
1,608
|
|
|
177
|
|
|
6,301
|
|
|
1,166
|
|
|
—
|
|
|||||||||
|
Deferred exploratory wells
|
670
|
|
|
297
|
|
|
536
|
|
|
335
|
|
|
1,134
|
|
|
273
|
|
|
3,245
|
|
|
—
|
|
|
—
|
|
|||||||||
|
Other uncompleted projects
|
9,149
|
|
|
4,175
|
|
|
4,424
|
|
|
5,998
|
|
|
16,000
|
|
|
1,390
|
|
|
41,136
|
|
|
1,638
|
|
|
404
|
|
|||||||||
|
Gross Capitalized Costs
|
89,198
|
|
|
21,381
|
|
|
39,343
|
|
|
52,855
|
|
|
24,006
|
|
|
11,468
|
|
|
238,251
|
|
|
9,890
|
|
|
3,841
|
|
|||||||||
|
Unproved properties valuation
|
1,243
|
|
|
707
|
|
|
203
|
|
|
389
|
|
|
6
|
|
|
31
|
|
|
2,579
|
|
|
45
|
|
|
10
|
|
|||||||||
|
Proved producing properties – Depreciation and depletion
|
45,756
|
|
|
5,695
|
|
|
18,051
|
|
|
27,356
|
|
|
2,083
|
|
|
7,825
|
|
|
106,766
|
|
|
2,672
|
|
|
696
|
|
|||||||||
|
Support equipment depreciation
|
656
|
|
|
189
|
|
|
647
|
|
|
1,177
|
|
|
384
|
|
|
149
|
|
|
3,202
|
|
|
538
|
|
|
—
|
|
|||||||||
|
Accumulated provisions
|
47,655
|
|
|
6,591
|
|
|
18,901
|
|
|
28,922
|
|
|
2,473
|
|
|
8,005
|
|
|
112,547
|
|
|
3,255
|
|
|
706
|
|
|||||||||
|
Net Capitalized Costs
|
$
|
41,543
|
|
|
$
|
14,790
|
|
|
$
|
20,442
|
|
|
$
|
23,933
|
|
|
$
|
21,533
|
|
|
$
|
3,463
|
|
|
$
|
125,704
|
|
|
$
|
6,635
|
|
|
$
|
3,135
|
|
|
At December 31, 2012 *
|
|||||||||||||||||||||||||||||||||||
|
Unproved properties
|
$
|
10,478
|
|
|
$
|
1,415
|
|
|
$
|
271
|
|
|
$
|
2,039
|
|
|
$
|
1,884
|
|
|
$
|
34
|
|
|
$
|
16,121
|
|
|
$
|
109
|
|
|
$
|
28
|
|
|
Proved properties and
related producing assets |
62,274
|
|
|
11,237
|
|
|
30,106
|
|
|
39,889
|
|
|
2,420
|
|
|
9,994
|
|
|
155,920
|
|
|
6,832
|
|
|
1,852
|
|
|||||||||
|
Support equipment
|
1,179
|
|
|
330
|
|
|
1,195
|
|
|
1,554
|
|
|
1,191
|
|
|
172
|
|
|
5,621
|
|
|
1,089
|
|
|
—
|
|
|||||||||
|
Deferred exploratory wells
|
412
|
|
|
201
|
|
|
598
|
|
|
326
|
|
|
911
|
|
|
233
|
|
|
2,681
|
|
|
—
|
|
|
—
|
|
|||||||||
|
Other uncompleted projects
|
7,203
|
|
|
3,211
|
|
|
3,466
|
|
|
4,123
|
|
|
10,578
|
|
|
768
|
|
|
29,349
|
|
|
906
|
|
|
1,594
|
|
|||||||||
|
Gross Capitalized Costs
|
81,546
|
|
|
16,394
|
|
|
35,636
|
|
|
47,931
|
|
|
16,984
|
|
|
11,201
|
|
|
209,692
|
|
|
8,936
|
|
|
3,474
|
|
|||||||||
|
Unproved properties valuation
|
1,121
|
|
|
634
|
|
|
201
|
|
|
253
|
|
|
2
|
|
|
28
|
|
|
2,239
|
|
|
41
|
|
|
—
|
|
|||||||||
|
Proved producing properties – Depreciation and depletion
|
42,224
|
|
|
5,288
|
|
|
15,566
|
|
|
24,432
|
|
|
1,832
|
|
|
8,255
|
|
|
97,597
|
|
|
2,274
|
|
|
551
|
|
|||||||||
|
Support equipment depreciation
|
589
|
|
|
178
|
|
|
613
|
|
|
1,101
|
|
|
305
|
|
|
137
|
|
|
2,923
|
|
|
480
|
|
|
—
|
|
|||||||||
|
Accumulated provisions
|
$
|
43,934
|
|
|
$
|
6,100
|
|
|
$
|
16,380
|
|
|
$
|
25,786
|
|
|
$
|
2,139
|
|
|
$
|
8,420
|
|
|
$
|
102,759
|
|
|
$
|
2,795
|
|
|
$
|
551
|
|
|
Net Capitalized Costs
|
$
|
37,612
|
|
|
$
|
10,294
|
|
|
$
|
19,256
|
|
|
$
|
22,145
|
|
|
$
|
14,845
|
|
|
$
|
2,781
|
|
|
$
|
106,933
|
|
|
$
|
6,141
|
|
|
$
|
2,923
|
|
|
* 2012 Non-oil and gas allocation revised.
|
|||||||||||||||||||||||||||||||||||
FS-60
|
Table II
Capitalized Costs Related to Oil and
Gas Producing Activities - Continued |
|||
|
|
Consolidated Companies
|
|
Affiliated Companies
|
||||||||||||||||||||||||||||||||
|
|
|
|
Other
|
|
|
|
|
|
|
|
|
|
|
|
|
|
|
|
|||||||||||||||||
|
Millions of dollars
|
U.S.
|
|
|
Americas
|
|
|
Africa
|
|
|
Asia
|
|
|
Australia
|
|
|
Europe
|
|
|
Total
|
|
|
TCO
|
|
|
Other
|
|
|||||||||
|
At December 31, 2011
|
|||||||||||||||||||||||||||||||||||
|
Unproved properties
|
$
|
9,806
|
|
|
$
|
1,417
|
|
|
$
|
368
|
|
|
$
|
2,408
|
|
|
$
|
6
|
|
|
$
|
33
|
|
|
$
|
14,038
|
|
|
$
|
109
|
|
|
$
|
—
|
|
|
Proved properties and
related producing assets |
57,674
|
|
|
11,029
|
|
|
25,549
|
|
|
36,740
|
|
|
2,244
|
|
|
9,549
|
|
|
142,785
|
|
|
6,583
|
|
|
1,607
|
|
|||||||||
|
Support equipment
|
1,071
|
|
|
292
|
|
|
1,362
|
|
|
1,544
|
|
|
533
|
|
|
169
|
|
|
4,971
|
|
|
1,018
|
|
|
—
|
|
|||||||||
|
Deferred exploratory wells
|
565
|
|
|
63
|
|
|
629
|
|
|
260
|
|
|
709
|
|
|
208
|
|
|
2,434
|
|
|
—
|
|
|
—
|
|
|||||||||
|
Other uncompleted projects
|
4,887
|
|
|
2,408
|
|
|
4,773
|
|
|
3,109
|
|
|
6,076
|
|
|
492
|
|
|
21,745
|
|
|
605
|
|
|
1,466
|
|
|||||||||
|
Gross Capitalized Costs
|
74,003
|
|
|
15,209
|
|
|
32,681
|
|
|
44,061
|
|
|
9,568
|
|
|
10,451
|
|
|
185,973
|
|
|
8,315
|
|
|
3,073
|
|
|||||||||
|
Unproved properties valuation
|
1,085
|
|
|
498
|
|
|
178
|
|
|
262
|
|
|
2
|
|
|
13
|
|
|
2,038
|
|
|
38
|
|
|
—
|
|
|||||||||
|
Proved producing properties – Depreciation and depletion
|
39,210
|
|
|
4,826
|
|
|
13,173
|
|
|
20,991
|
|
|
1,574
|
|
|
7,742
|
|
|
87,516
|
|
|
1,910
|
|
|
436
|
|
|||||||||
|
Support equipment depreciation
|
530
|
|
|
175
|
|
|
715
|
|
|
1,192
|
|
|
238
|
|
|
129
|
|
|
2,979
|
|
|
451
|
|
|
—
|
|
|||||||||
|
Accumulated provisions
|
40,825
|
|
|
5,499
|
|
|
14,066
|
|
|
22,445
|
|
|
1,814
|
|
|
7,884
|
|
|
92,533
|
|
|
2,399
|
|
|
436
|
|
|||||||||
|
Net Capitalized Costs
|
$
|
33,178
|
|
|
$
|
9,710
|
|
|
$
|
18,615
|
|
|
$
|
21,616
|
|
|
$
|
7,754
|
|
|
$
|
2,567
|
|
|
$
|
93,440
|
|
|
$
|
5,916
|
|
|
$
|
2,637
|
|
FS-61
|
Table III
Results of Operations for Oil and
Gas Producing Activities 1 |
|||
The company’s results of operations from oil and gas producing activities for the years
2013
,
2012
and
2011
are shown in the following table. Net income from exploration and production activities as reported on page FS-36 reflects income taxes computed on an effective rate basis.
Income taxes in Table III are based on statutory tax rates, reflecting allowable deductions and tax credits. Interest income and expense are excluded from the results reported in Table III and from the net income amounts on FS-36.
Table III - Results of Operations for Oil and Gas Producing Activities
1
|
|
Consolidated Companies
|
|
Affiliated Companies
|
||||||||||||||||||||||||||||||||
|
|
|
|
Other
|
|
|
|
|
|
|
|
|
|
|
|
|
|
|
|
|||||||||||||||||
|
Millions of dollars
|
U.S.
|
|
|
Americas
|
|
|
Africa
|
|
|
Asia
|
|
|
Australia
|
|
|
Europe
|
|
|
Total
|
|
|
TCO
|
|
|
Other
|
|
|||||||||
|
Year Ended December 31, 2013
|
|||||||||||||||||||||||||||||||||||
|
Revenues from net production
|
|||||||||||||||||||||||||||||||||||
|
Sales
|
$
|
2,303
|
|
|
$
|
1,351
|
|
|
$
|
702
|
|
|
$
|
9,220
|
|
|
$
|
1,431
|
|
|
$
|
1,345
|
|
|
$
|
16,352
|
|
|
$
|
8,522
|
|
|
$
|
2,100
|
|
|
Transfers
|
14,471
|
|
|
1,973
|
|
|
14,804
|
|
|
9,521
|
|
|
984
|
|
|
1,701
|
|
|
43,454
|
|
|
—
|
|
|
—
|
|
|||||||||
|
Total
|
16,774
|
|
|
3,324
|
|
|
15,506
|
|
|
18,741
|
|
|
2,415
|
|
|
3,046
|
|
|
59,806
|
|
|
8,522
|
|
|
2,100
|
|
|||||||||
|
Production expenses excluding taxes
|
(4,606
|
)
|
|
(1,218
|
)
|
|
(2,099
|
)
|
|
(4,429
|
)
|
|
(193
|
)
|
|
(759
|
)
|
|
(13,304
|
)
|
|
(401
|
)
|
|
(444
|
)
|
|||||||||
|
Taxes other than on income
|
(648
|
)
|
|
(90
|
)
|
|
(149
|
)
|
|
(140
|
)
|
|
(378
|
)
|
|
(3
|
)
|
|
(1,408
|
)
|
|
(439
|
)
|
|
(704
|
)
|
|||||||||
|
Proved producing properties:
|
|||||||||||||||||||||||||||||||||||
|
Depreciation and depletion
|
(4,039
|
)
|
|
(440
|
)
|
|
(2,747
|
)
|
|
(3,602
|
)
|
|
(342
|
)
|
|
(416
|
)
|
|
(11,586
|
)
|
|
(518
|
)
|
|
(179
|
)
|
|||||||||
|
Accretion expense
2
|
(223
|
)
|
|
(22
|
)
|
|
(125
|
)
|
|
(114
|
)
|
|
(28
|
)
|
|
(79
|
)
|
|
(591
|
)
|
|
(9
|
)
|
|
(14
|
)
|
|||||||||
|
Exploration expenses
|
(555
|
)
|
|
(372
|
)
|
|
(203
|
)
|
|
(272
|
)
|
|
(161
|
)
|
|
(258
|
)
|
|
(1,821
|
)
|
|
—
|
|
|
—
|
|
|||||||||
|
Unproved properties valuation
|
(129
|
)
|
|
(84
|
)
|
|
(13
|
)
|
|
(141
|
)
|
|
(4
|
)
|
|
(5
|
)
|
|
(376
|
)
|
|
—
|
|
|
(10
|
)
|
|||||||||
|
Other income (expense)
3
|
242
|
|
|
(5
|
)
|
|
145
|
|
|
(275
|
)
|
|
89
|
|
|
13
|
|
|
209
|
|
|
(81
|
)
|
|
462
|
|
|||||||||
|
Results before income taxes
|
6,816
|
|
|
1,093
|
|
|
10,315
|
|
|
9,768
|
|
|
1,398
|
|
|
1,539
|
|
|
30,929
|
|
|
7,074
|
|
|
1,211
|
|
|||||||||
|
Income tax expense
|
(2,471
|
)
|
|
(289
|
)
|
|
(6,545
|
)
|
|
(4,824
|
)
|
|
(411
|
)
|
|
(1,058
|
)
|
|
(15,598
|
)
|
|
(2,122
|
)
|
|
(624
|
)
|
|||||||||
|
Results of Producing Operations
|
$
|
4,345
|
|
|
$
|
804
|
|
|
$
|
3,770
|
|
|
$
|
4,944
|
|
|
$
|
987
|
|
|
$
|
481
|
|
|
$
|
15,331
|
|
|
$
|
4,952
|
|
|
$
|
587
|
|
|
Year Ended December 31, 2012
|
|||||||||||||||||||||||||||||||||||
|
Revenues from net production
|
|||||||||||||||||||||||||||||||||||
|
Sales
|
$
|
1,832
|
|
|
$
|
1,561
|
|
|
$
|
1,480
|
|
|
$
|
10,485
|
|
|
$
|
1,539
|
|
|
$
|
1,618
|
|
|
$
|
18,515
|
|
|
$
|
7,869
|
|
|
$
|
1,951
|
|
|
Transfers
|
15,122
|
|
|
1,997
|
|
|
15,033
|
|
|
9,071
|
|
|
1,073
|
|
|
2,148
|
|
|
44,444
|
|
|
—
|
|
|
—
|
|
|||||||||
|
Total
|
16,954
|
|
|
3,558
|
|
|
16,513
|
|
|
19,556
|
|
|
2,612
|
|
|
3,766
|
|
|
62,959
|
|
|
7,869
|
|
|
1,951
|
|
|||||||||
|
Production expenses excluding taxes
|
(4,009
|
)
|
|
(1,073
|
)
|
|
(1,918
|
)
|
|
(4,545
|
)
|
|
(164
|
)
|
|
(637
|
)
|
|
(12,346
|
)
|
|
(463
|
)
|
|
(442
|
)
|
|||||||||
|
Taxes other than on income
|
(654
|
)
|
|
(123
|
)
|
|
(161
|
)
|
|
(191
|
)
|
|
(390
|
)
|
|
(3
|
)
|
|
(1,522
|
)
|
|
(439
|
)
|
|
(767
|
)
|
|||||||||
|
Proved producing properties:
|
|||||||||||||||||||||||||||||||||||
|
Depreciation and depletion
|
(3,462
|
)
|
|
(508
|
)
|
|
(2,475
|
)
|
|
(3,399
|
)
|
|
(315
|
)
|
|
(541
|
)
|
|
(10,700
|
)
|
|
(427
|
)
|
|
(147
|
)
|
|||||||||
|
Accretion expense
2
|
(226
|
)
|
|
(33
|
)
|
|
(66
|
)
|
|
(92
|
)
|
|
(23
|
)
|
|
(46
|
)
|
|
(486
|
)
|
|
(8
|
)
|
|
(6
|
)
|
|||||||||
|
Exploration expenses
|
(244
|
)
|
|
(145
|
)
|
|
(427
|
)
|
|
(489
|
)
|
|
(133
|
)
|
|
(272
|
)
|
|
(1,710
|
)
|
|
—
|
|
|
—
|
|
|||||||||
|
Unproved properties valuation
|
(127
|
)
|
|
(138
|
)
|
|
(16
|
)
|
|
(133
|
)
|
|
—
|
|
|
(15
|
)
|
|
(429
|
)
|
|
—
|
|
|
—
|
|
|||||||||
|
Other income (expense)
3
|
167
|
|
|
(169
|
)
|
|
(199
|
)
|
|
245
|
|
|
2,495
|
|
|
13
|
|
|
2,552
|
|
|
27
|
|
|
31
|
|
|||||||||
|
Results before income taxes
|
8,399
|
|
|
1,369
|
|
|
11,251
|
|
|
10,952
|
|
|
4,082
|
|
|
2,265
|
|
|
38,318
|
|
|
6,559
|
|
|
620
|
|
|||||||||
|
Income tax expense
|
(3,043
|
)
|
|
(310
|
)
|
|
(7,558
|
)
|
|
(5,739
|
)
|
|
(1,226
|
)
|
|
(1,511
|
)
|
|
(19,387
|
)
|
|
(1,972
|
)
|
|
(299
|
)
|
|||||||||
|
Results of Producing Operations
|
$
|
5,356
|
|
|
$
|
1,059
|
|
|
$
|
3,693
|
|
|
$
|
5,213
|
|
|
$
|
2,856
|
|
|
$
|
754
|
|
|
$
|
18,931
|
|
|
$
|
4,587
|
|
|
$
|
321
|
|
|
1
|
The value of owned production consumed in operations as fuel has been eliminated from revenues and production expenses, and the related volumes have been deducted from net production in calculating the unit average sales price and production cost. This has no effect on the results of producing operations.
|
|
2
|
Represents accretion of ARO liability. Refer to Note 24, “Asset Retirement Obligations,” on page FS-56.
|
|
3
|
Includes foreign currency gains and losses, gains and losses on property dispositions and other miscellaneous income and expenses.
|
FS-62
|
Table III
Results of Operations for Oil and
Gas Producing Activities 1 - Continued |
|||
Table III - Results of Operations for Oil and Gas Producing Activities
1
, continued
|
|
Consolidated Companies
|
|
Affiliated Companies
|
||||||||||||||||||||||||||||||||
|
|
|
|
Other
|
|
|
|
|
|
|
|
|
|
|
|
|
|
|
|
|||||||||||||||||
|
Millions of dollars
|
U.S.
|
|
|
Americas
|
|
|
Africa
|
|
|
Asia
|
|
|
Australia
|
|
|
Europe
|
|
|
Total
|
|
|
TCO
|
|
|
Other
|
|
|||||||||
|
Year Ended December 31, 2011
|
|||||||||||||||||||||||||||||||||||
|
Revenues from net production
|
|||||||||||||||||||||||||||||||||||
|
Sales
|
$
|
2,508
|
|
|
$
|
2,047
|
|
|
$
|
1,174
|
|
|
$
|
9,431
|
|
|
$
|
1,474
|
|
|
$
|
1,868
|
|
|
$
|
18,502
|
|
|
$
|
8,581
|
|
|
$
|
1,988
|
|
|
Transfers
|
15,811
|
|
|
2,624
|
|
|
15,726
|
|
|
8,962
|
|
|
1,012
|
|
|
2,672
|
|
|
46,807
|
|
|
—
|
|
|
—
|
|
|||||||||
|
Total
|
18,319
|
|
|
4,671
|
|
|
16,900
|
|
|
18,393
|
|
|
2,486
|
|
|
4,540
|
|
|
65,309
|
|
|
8,581
|
|
|
1,988
|
|
|||||||||
|
Production expenses excluding taxes
|
(3,668
|
)
|
|
(1,061
|
)
|
|
(1,526
|
)
|
|
(4,489
|
)
|
|
(117
|
)
|
|
(564
|
)
|
|
(11,425
|
)
|
|
(449
|
)
|
|
(235
|
)
|
|||||||||
|
Taxes other than on income
|
(597
|
)
|
|
(137
|
)
|
|
(153
|
)
|
|
(242
|
)
|
|
(396
|
)
|
|
(2
|
)
|
|
(1,527
|
)
|
|
(429
|
)
|
|
(815
|
)
|
|||||||||
|
Proved producing properties:
|
|||||||||||||||||||||||||||||||||||
|
Depreciation and depletion
|
(3,366
|
)
|
|
(796
|
)
|
|
(2,225
|
)
|
|
(2,923
|
)
|
|
(136
|
)
|
|
(580
|
)
|
|
(10,026
|
)
|
|
(442
|
)
|
|
(140
|
)
|
|||||||||
|
Accretion expense
2
|
(291
|
)
|
|
(27
|
)
|
|
(106
|
)
|
|
(81
|
)
|
|
(18
|
)
|
|
(39
|
)
|
|
(562
|
)
|
|
(8
|
)
|
|
(4
|
)
|
|||||||||
|
Exploration expenses
|
(207
|
)
|
|
(144
|
)
|
|
(188
|
)
|
|
(271
|
)
|
|
(128
|
)
|
|
(277
|
)
|
|
(1,215
|
)
|
|
—
|
|
|
—
|
|
|||||||||
|
Unproved properties valuation
|
(134
|
)
|
|
(146
|
)
|
|
(27
|
)
|
|
(60
|
)
|
|
—
|
|
|
(14
|
)
|
|
(381
|
)
|
|
—
|
|
|
—
|
|
|||||||||
|
Other income (expense)
3
|
163
|
|
|
(466
|
)
|
|
(409
|
)
|
|
231
|
|
|
(18
|
)
|
|
(74
|
)
|
|
(573
|
)
|
|
(8
|
)
|
|
(29
|
)
|
|||||||||
|
Results before income taxes
|
10,219
|
|
|
1,894
|
|
|
12,266
|
|
|
10,558
|
|
|
1,673
|
|
|
2,990
|
|
|
39,600
|
|
|
7,245
|
|
|
765
|
|
|||||||||
|
Income tax expense
|
(3,728
|
)
|
|
(535
|
)
|
|
(7,802
|
)
|
|
(5,374
|
)
|
|
(507
|
)
|
|
(1,913
|
)
|
|
(19,859
|
)
|
|
(2,176
|
)
|
|
(392
|
)
|
|||||||||
|
Results of Producing Operations
|
$
|
6,491
|
|
|
$
|
1,359
|
|
|
$
|
4,464
|
|
|
$
|
5,184
|
|
|
$
|
1,166
|
|
|
$
|
1,077
|
|
|
$
|
19,741
|
|
|
$
|
5,069
|
|
|
$
|
373
|
|
|
1
|
The value of owned production consumed in operations as fuel has been eliminated from revenues and production expenses, and the related volumes have been deducted from net production in calculating the unit average sales price and production cost. This has no effect on the results of producing operations.
|
|
2
|
Represents accretion of ARO liability. Refer to Note 24, “Asset Retirement Obligations,” on page FS-56.
|
|
3
|
Includes foreign currency gains and losses, gains and losses on property dispositions, and other miscellaneous income and expenses.
|
Table IV - Results of Operations for Oil and Gas Producing Activities - Unit Prices and Costs
1
|
|
Consolidated Companies
|
|
Affiliated Companies
|
||||||||||||||||||||||||||||||||
|
|
|
|
Other
|
|
|
|
|
|
|
|
|
|
|
|
|
|
|
|
|||||||||||||||||
|
|
U.S.
|
|
|
Americas
|
|
|
Africa
|
|
|
Asia
|
|
|
Australia
|
|
|
Europe
|
|
|
Total
|
|
|
TCO
|
|
|
Other
|
|
|||||||||
|
Year Ended December 31, 2013
|
|
||||||||||||||||||||||||||||||||||
|
Average sales prices
|
|
||||||||||||||||||||||||||||||||||
|
Liquids, per barrel
|
$
|
93.46
|
|
$
|
88.32
|
|
$
|
107.22
|
|
$
|
98.37
|
|
$
|
103.28
|
|
|
$
|
105.78
|
|
$
|
99.05
|
|
$
|
88.06
|
|
$
|
78.87
|
|
|||||||
|
Natural gas, per thousand cubic feet
|
3.38
|
|
2.68
|
|
1.76
|
|
6.02
|
|
10.61
|
|
|
11.04
|
|
5.45
|
|
1.50
|
|
4.00
|
|
||||||||||||||||
|
Average production costs, per barrel
2
|
19.57
|
|
21.29
|
|
13.93
|
|
16.49
|
|
5.90
|
|
|
22.87
|
|
17.10
|
|
4.37
|
|
22.69
|
|
||||||||||||||||
|
Year Ended December 31, 2012
|
|||||||||||||||||||||||||||||||||||
|
Average sales prices
|
|||||||||||||||||||||||||||||||||||
|
Liquids, per barrel
|
$
|
95.21
|
|
$
|
87.87
|
|
$
|
109.64
|
|
$
|
102.46
|
|
$
|
103.06
|
|
$
|
108.77
|
|
$
|
101.61
|
|
$
|
89.34
|
|
$
|
83.97
|
|
||||||||
|
Natural gas, per thousand cubic feet
|
2.65
|
|
3.59
|
|
1.22
|
|
6.03
|
|
10.99
|
|
10.10
|
|
5.42
|
|
1.36
|
|
5.39
|
|
|||||||||||||||||
|
Average production costs, per barrel
2
|
16.99
|
|
18.38
|
|
12.14
|
|
16.71
|
|
4.86
|
|
15.72
|
|
15.46
|
|
4.42
|
|
18.73
|
|
|||||||||||||||||
|
Year Ended December 31, 2011
|
|||||||||||||||||||||||||||||||||||
|
Average sales prices
|
|||||||||||||||||||||||||||||||||||
|
Liquids, per barrel
|
$
|
97.51
|
|
$
|
89.87
|
|
$
|
109.45
|
|
$
|
100.55
|
|
$
|
103.70
|
|
$
|
107.11
|
|
$
|
101.63
|
|
$
|
94.60
|
|
$
|
90.90
|
|
||||||||
|
Natural gas, per thousand cubic feet
|
4.02
|
|
2.97
|
|
0.41
|
|
5.28
|
|
9.98
|
|
9.91
|
|
5.29
|
|
1.60
|
|
6.57
|
|
|||||||||||||||||
|
Average production costs, per barrel
2
|
15.08
|
|
14.62
|
|
9.48
|
|
17.47
|
|
3.41
|
|
11.44
|
|
13.98
|
|
4.23
|
|
10.54
|
|
|||||||||||||||||
|
1
|
The value of owned production consumed in operations as fuel has been eliminated from revenues and production expenses, and the related volumes have been deducted from net production in calculating the unit average sales price and production cost. This has no effect on the results of producing operations.
|
|
2
|
Natural gas converted to oil-equivalent gas (OEG) barrels at a rate of 6 MCF = 1 OEG barrel.
|
FS-63
|
Table V
Reserve Quantity Information
|
Table V
Reserve Quantity Information
|
|
2013
|
2012
|
2011
|
|||||||||||||||||||||||
|
Liquids in Millions of Barrels
|
Crude Oil
|
|
|
|
|
|
|
Crude Oil
|
|
|
|
|
|
|
Crude Oil
|
|
|
|
|
|
||||||
|
Condensate
|
|
|
Synthetic
|
|
|
Natural
|
|
|
Condensate
|
|
|
Synthetic
|
|
|
Natural
|
|
|
Condensate
|
|
|
Synthetic
|
|
|
Natural
|
|
|
|
Natural Gas in Billions of Cubic Feet
|
NGLs
|
|
|
Oil
|
|
|
Gas
|
|
|
NGLs
|
|
|
Oil
|
|
|
Gas
|
|
|
NGLs
|
|
|
Oil
|
|
|
Gas
|
|
|
Proved Developed
|
|
|
|
|
|
|
|
|
|
|
|
|
|
|
|
|
|
|||||||||
|
Consolidated Companies
|
|
|
|
|
|
|
|
|
|
|
|
|
|
|
|
|
|
|||||||||
|
U.S.
|
976
|
|
|
—
|
|
|
2,632
|
|
|
1,012
|
|
|
—
|
|
|
2,574
|
|
|
990
|
|
|
—
|
|
|
2,486
|
|
|
Other Americas
|
109
|
|
|
403
|
|
|
943
|
|
|
91
|
|
|
391
|
|
|
1,063
|
|
|
82
|
|
|
403
|
|
|
1,147
|
|
|
Africa
|
763
|
|
|
—
|
|
|
1,161
|
|
|
782
|
|
|
—
|
|
|
1,163
|
|
|
792
|
|
|
—
|
|
|
1,276
|
|
|
Asia
|
601
|
|
|
—
|
|
|
4,620
|
|
|
643
|
|
|
—
|
|
|
4,511
|
|
|
703
|
|
|
—
|
|
|
4,300
|
|
|
Australia
|
44
|
|
|
—
|
|
|
1,251
|
|
|
31
|
|
|
—
|
|
|
682
|
|
|
39
|
|
|
—
|
|
|
813
|
|
|
Europe
|
94
|
|
|
—
|
|
|
200
|
|
|
103
|
|
|
—
|
|
|
191
|
|
|
116
|
|
|
—
|
|
|
204
|
|
|
Total Consolidated
|
2,587
|
|
|
403
|
|
|
10,807
|
|
|
2,662
|
|
391
|
|
10,184
|
|
|
2,722
|
|
|
403
|
|
|
10,226
|
|
||
|
Affiliated Companies
|
|
|
|
|
|
|
|
|
|
|
|
|
|
|
|
|
|
|||||||||
|
TCO
|
884
|
|
|
—
|
|
|
1,188
|
|
|
977
|
|
|
—
|
|
|
1,261
|
|
|
1,019
|
|
|
—
|
|
|
1,400
|
|
|
Other
|
105
|
|
|
44
|
|
|
330
|
|
|
115
|
|
|
50
|
|
|
377
|
|
|
93
|
|
|
50
|
|
|
75
|
|
|
Total Consolidated and Affiliated Companies
|
3,576
|
|
|
447
|
|
|
12,325
|
|
|
3,754
|
|
441
|
|
11,822
|
|
|
3,834
|
|
|
453
|
|
|
11,701
|
|
||
|
Proved Undeveloped
|
|
|
|
|
|
|
|
|
|
|
|
|
|
|
|
|
|
|||||||||
|
Consolidated Companies
|
|
|
|
|
|
|
|
|
|
|
|
|
|
|
|
|
|
|||||||||
|
U.S.
|
354
|
|
|
—
|
|
|
1,358
|
|
|
347
|
|
|
—
|
|
|
1,148
|
|
|
321
|
|
|
—
|
|
|
1,160
|
|
|
Other Americas
|
134
|
|
|
134
|
|
|
357
|
|
|
132
|
|
|
122
|
|
|
412
|
|
|
31
|
|
|
120
|
|
|
517
|
|
|
Africa
|
341
|
|
|
—
|
|
|
1,884
|
|
|
348
|
|
|
—
|
|
|
1,918
|
|
|
363
|
|
|
—
|
|
|
1,920
|
|
|
Asia
|
191
|
|
|
—
|
|
|
2,125
|
|
|
194
|
|
|
—
|
|
|
2,356
|
|
|
191
|
|
|
—
|
|
|
2,421
|
|
|
Australia
|
87
|
|
|
—
|
|
|
9,076
|
|
|
103
|
|
|
—
|
|
|
9,570
|
|
|
101
|
|
|
—
|
|
|
8,931
|
|
|
Europe
|
72
|
|
|
—
|
|
|
63
|
|
|
54
|
|
|
—
|
|
|
66
|
|
|
43
|
|
|
—
|
|
|
54
|
|
|
Total Consolidated
|
1,179
|
|
134
|
|
14,863
|
|
1,178
|
|
122
|
|
15,470
|
|
|
1,050
|
|
|
120
|
|
|
15,003
|
|
|||||
|
Affiliated Companies
|
|
|
|
|
|
|
|
|
|
|
|
|
|
|
|
|
|
|||||||||
|
TCO
|
784
|
|
|
—
|
|
|
1,102
|
|
|
755
|
|
|
—
|
|
|
1,038
|
|
|
740
|
|
|
—
|
|
|
851
|
|
|
Other
|
49
|
|
|
176
|
|
|
856
|
|
|
49
|
|
|
182
|
|
|
865
|
|
|
64
|
|
|
194
|
|
|
1,128
|
|
|
Total Consolidated and Affiliated Companies
|
2,012
|
|
310
|
|
16,821
|
|
1,982
|
|
304
|
|
17,373
|
|
|
1,854
|
|
|
314
|
|
|
16,982
|
|
|||||
|
Total Proved Reserves
|
5,588
|
|
|
757
|
|
|
29,146
|
|
|
5,736
|
|
745
|
|
29,195
|
|
|
5,688
|
|
|
767
|
|
|
28,683
|
|
||
Reserves Governance
The company has adopted a comprehensive reserves and resource classification system modeled after a system developed and approved by the Society of Petroleum Engineers, the World Petroleum Congress and the American Association of Petroleum Geologists. The system classifies recoverable hydrocarbons into six categories based on their status at the time of reporting – three deemed commercial and three potentially recoverable. Within the commercial classification are proved reserves and two categories of unproved: probable and possible. The potentially recoverable categories are also referred to as contingent resources. For reserves estimates to be classified as proved, they must meet all SEC and company standards.
Proved oil and gas reserves are the estimated quantities that geoscience and engineering data demonstrate with reasonable certainty to be economically producible in the future from known reservoirs under existing economic conditions, operating methods and government regulations. Net proved reserves exclude royalties and interests owned by others and reflect contractual arrangements and royalty obligations in effect at the time of the estimate.
Proved reserves are classified as either developed or undeveloped. Proved developed reserves are the quantities expected to be recovered through existing wells with existing equipment and operating methods.
Due to the inherent uncertainties and the limited nature of reservoir data, estimates of reserves are subject to change as additional information becomes available.
Proved reserves are estimated by company asset teams composed of earth scientists and engineers. As part of the internal control process related to reserves estimation, the company maintains a Reserves Advisory Committee (RAC) that is chaired by the Manager of Corporate Reserves, a corporate department that reports directly to the Vice Chairman responsible for the company’s worldwide exploration and production activities. The Manager of Corporate Reserves has more than 30 years’ experience working in the oil and gas industry and a Master of Science in Petroleum Engineering degree from Stanford University. His experience includes
FS-64
|
Table V
Reserve Quantity Information - Continued
|
||
more than 15 years of managing oil and gas reserves processes. He was chairman of the Society of Petroleum Engineers Oil and Gas Reserves Committee, served on the United Nations Expert Group on Resources Classification, and is a past member of the Joint Committee on Reserves Evaluator Training and the California Conservation Committee. He is an active member of the Society of Petroleum Evaluation Engineers and serves on the Society of Petroleum Engineers Oil and Gas Reserves Committee.
All RAC members are degreed professionals, each with more than 10 years of experience in various aspects of reserves estimation relating to reservoir engineering, petroleum engineering, earth science or finance. The members are
knowledgeable in SEC guidelines for proved reserves classification and receive annual training on the preparation of reserves estimates. The reserves activities are managed by two operating company-level reserves managers. These two reserves managers are not members of the RAC so as to preserve corporate-level independence.
The RAC has the following primary responsibilities: establish the policies and processes used within the operating units to estimate reserves; provide independent reviews and oversight of the business units’ recommended reserves estimates and changes; confirm that proved reserves are recognized in accordance with SEC guidelines; determine that reserve volumes are calculated using consistent and appropriate standards, procedures and technology; and maintain the
Corporate Reserves Manual,
which provides standardized procedures used corporatewide for classifying and reporting hydrocarbon reserves.
During the year, the RAC is represented in meetings with each of the company’s upstream business units to review and discuss reserve changes recommended by the various asset teams. Major changes are also reviewed with the company’s Strategy and Planning Committee, whose members include the Chief Executive Officer and the Chief Financial Officer. The company’s annual reserve activity is also reviewed with the Board of Directors. If major changes to reserves were to occur between the annual reviews, those matters would also be discussed with the Board.
RAC subteams also conduct in-depth reviews during the year of many of the fields that have large proved reserves quantities. These reviews include an examination of the proved-reserve records and documentation of their compliance with the
Corporate Reserves Manual.
Technologies Used in Establishing Proved Reserves Additions
In
2013
, additions to Chevron’s proved reserves were based on a wide range of geologic and engineering technologies. Information generated from wells, such as well logs, wire line sampling, production and pressure testing, fluid analysis, and core analysis, was integrated with seismic data, regional geologic studies, and information from analogous reservoirs to provide “reasonably certain” proved reserves estimates. Both proprietary and commercially available analytic tools, including reservoir simulation, geologic modeling and seismic processing, have been used in the interpretation of the subsurface data. These technologies have been utilized extensively by the company in the past, and the company believes that they provide a high degree of confidence in establishing reliable and consistent reserves estimates.
Proved Undeveloped Reserve Quantities
At the end of
2013
, proved undeveloped reserves totaled 5.1 billion barrels of oil-equivalent (BOE), a decrease of 56 million BOE from year-end 2012. The decrease was due to the transfer of 461 million BOE to proved developed, partially offset by increases of 210 BOE in extensions and discoveries, 7 million BOE in purchases, 42 million BOE in improved recovery and 146 million BOE in revisions.
Investment to Convert Proved Undeveloped to Proved Developed Reserves
During
2013
, investments totaling approximately $17.4 billion in oil and gas producing activities and about $3.4 billion in non-oil and gas producing activities were expended to advance the development of proved undeveloped reserves. Australia accounted for $9.6 billion of the total, mainly for development and construction activities at the Gorgon and Wheatstone LNG projects. Expenditures of about $3.5 billion in the United States related primarily to various development activities in the Gulf of Mexico and the midcontinent region. In Asia, expenditures during the year totaled $3.0 billion, primarily related to development projects in Thailand, Indonesia and with the TCO affiliate in Kazakhstan. In Africa, about $2.9 billion was expended on various offshore development and natural gas projects in Nigeria and Angola.
Proved Undeveloped Reserves for Five Years or More
Reserves that remain proved undeveloped for five or more years are a result of several factors that affect optimal project development and execution, such as the complex nature of the development project in adverse and remote locations, physical limitations of infrastructure or plant capacities that dictate project timing, compression projects that are pending reservoir pressure declines, and contractual limitations that dictate production levels.
FS-65
|
Table V
Reserve Quantity Information - Continued
|
||
At year-end
2013
, the company held approximately 1.6 billion BOE of proved undeveloped reserves that have remained undeveloped for five years or more. The reserves are held by consolidated and affiliated companies and the majority of these reserves are in locations where the company has a proven track record of developing major projects.
In Africa, the majority of the approximately 300 million BOE of proved undeveloped reserves that have remained undeveloped for five years or more is related to deepwater and natural gas developments in Nigeria. Major Nigerian deepwater development projects include Agbami, which started production in 2008 and has ongoing development activities to maintain full utilization of infrastructure capacity, and the Usan development, which started production in 2012. Also in Nigeria, various fields and infrastructure associated with the Escravos gas projects are currently under development.
In Asia, less than 200 million BOE remain classified as proved undeveloped for more than five years. The majority relate to ongoing development activities in the Pattani Field in Thailand and the Azeri-Chirag-Gunashli fields in Azerbaijan.
Affiliates account for 1.1 billion barrels of proved undeveloped reserves that have remained undeveloped for five years or more, with the majority related to the TCO affiliate in Kazakhstan. At TCO, further field development to convert the remaining proved undeveloped reserves is scheduled to occur in line with reservoir depletion. In Venezuela, development drilling continues at Hamaca to optimize utilization of upgrader capacity.
Annually, the company assesses whether any changes have occurred in facts or circumstances, such as changes to development plans, regulations or government policies, that would warrant a revision to reserve estimates. For
2013
, this assessment did not result in any material changes in reserves classified as proved undeveloped. Over the past three years, the ratio of proved undeveloped reserves to total proved reserves has ranged between 44 percent and 46 percent. The consistent completion of major capital projects has kept the ratio in a narrow range over this time period.
Proved Reserve Quantities
At
December 31, 2013
, proved reserves for the company were 11.2 billion BOE. Approximately 18 percent of the total reserves were located in the United States.
Aside from the TCO affiliate's Tengiz Field in Kazakhstan, no single property accounted for more than 5 percent of the company’s total oil-equivalent proved reserves. About 18 other individual properties in the company’s portfolio of assets each contained between 1 percent and 5 percent of the company’s oil-equivalent proved reserves, which in the aggregate accounted for 44 percent of the company’s total oil-equivalent proved reserves. These properties were geographically dispersed, located in the United States, Canada, South America, Africa, Asia and Australia.
In the United States, total proved reserves at year-end
2013
were 2.0 billion BOE. California properties accounted for 30 percent of the U.S. reserves, with most classified as heavy oil. Because of heavy oil’s high viscosity and the need to employ enhanced recovery methods, most of the company’s heavy oil fields in California employ a continuous steamflooding process. The Gulf of Mexico region contains 26 percent of the U.S. reserves and production operations are mostly offshore. Other U.S. areas represent the remaining 44 percent of U.S. reserves. For production of crude oil, some fields utilize enhanced recovery methods, including waterflooding and CO
2
injection.
For the three years ending
December 31, 2013
, the pattern of net
reserve changes shown in the following tables are not necessarily indicative of future trends. Apart from acquisitions, the company’s ability to add proved reserves can be affected by, among other things, events and circumstances that are outside the company’s control, such as delays in government permitting, partner approvals of development plans, changes in oil and gas prices, OPEC constraints, geopolitical uncertainties, and civil unrest.
The company’s estimated net proved reserves of crude oil, condensate, natural gas liquids and synthetic oil and changes thereto for the years
2011
,
2012
and
2013
are shown in the table on page FS-67. The company’s estimated net proved reserves of natural gas are shown on page FS-68.
FS-66
|
Table V
Reserve Quantity Information - Continued
|
||
Net Proved Reserves (Developed and Undeveloped) of Crude Oil, Condensate, Natural Gas Liquids and Synthetic Oil
|
|
Consolidated Companies
|
|
Affiliated Companies
|
|
Total
Consolidated
|
|
|||||||||||||||||||||||||||||
|
|
|
|
|
Other
|
|
|
|
|
|
|
|
|
|
|
|
|
|
|
Synthetic
|
|
|
|
|
|
|
|
|
Synthetic
|
|
|
|
|
|
and Affiliated
|
|
|
Millions of barrels
|
U.S.
|
|
|
Americas
1
|
|
|
Africa
|
|
|
Asia
|
|
|
Australia
|
|
|
Europe
|
|
|
Oil
2
|
|
|
Total
|
|
|
TCO
|
|
|
Oil
|
|
|
Other
3
|
|
|
Companies
|
|
|
Reserves at January 1, 2011
|
1,275
|
|
|
108
|
|
|
1,168
|
|
|
1,013
|
|
|
88
|
|
|
152
|
|
|
466
|
|
|
4,270
|
|
|
1,820
|
|
|
256
|
|
|
157
|
|
|
6,503
|
|
|
Changes attributable to:
|
|||||||||||||||||||||||||||||||||||
|
Revisions
|
63
|
|
|
4
|
|
|
60
|
|
|
25
|
|
|
(2
|
)
|
|
15
|
|
|
32
|
|
|
197
|
|
|
28
|
|
|
—
|
|
|
10
|
|
|
235
|
|
|
Improved recovery
|
6
|
|
|
4
|
|
|
48
|
|
|
—
|
|
|
—
|
|
|
—
|
|
|
—
|
|
|
58
|
|
|
—
|
|
|
—
|
|
|
—
|
|
|
58
|
|
|
Extensions and discoveries
|
140
|
|
|
30
|
|
|
34
|
|
|
4
|
|
|
65
|
|
|
26
|
|
|
—
|
|
|
299
|
|
|
—
|
|
|
—
|
|
|
—
|
|
|
299
|
|
|
Purchases
|
2
|
|
|
—
|
|
|
—
|
|
|
—
|
|
|
—
|
|
|
—
|
|
|
40
|
|
|
42
|
|
|
—
|
|
|
—
|
|
|
—
|
|
|
42
|
|
|
Sales
|
(5
|
)
|
|
—
|
|
|
—
|
|
|
—
|
|
|
(1
|
)
|
|
—
|
|
|
—
|
|
|
(6
|
)
|
|
—
|
|
|
—
|
|
|
—
|
|
|
(6
|
)
|
|
Production
|
(170
|
)
|
|
(33
|
)
|
|
(155
|
)
|
|
(148
|
)
|
|
(10
|
)
|
|
(34
|
)
|
|
(15
|
)
|
|
(565
|
)
|
|
(89
|
)
|
|
(12
|
)
|
|
(10
|
)
|
|
(676
|
)
|
|
Reserves at December 31, 2011
4
|
1,311
|
|
|
113
|
|
|
1,155
|
|
|
894
|
|
|
140
|
|
|
159
|
|
|
523
|
|
|
4,295
|
|
|
1,759
|
|
|
244
|
|
|
157
|
|
|
6,455
|
|
|
Changes attributable to:
|
|||||||||||||||||||||||||||||||||||
|
Revisions
|
104
|
|
|
20
|
|
|
66
|
|
|
97
|
|
|
4
|
|
|
16
|
|
|
6
|
|
|
313
|
|
|
59
|
|
|
(6
|
)
|
|
24
|
|
|
390
|
|
|
Improved recovery
|
24
|
|
|
8
|
|
|
30
|
|
|
6
|
|
|
—
|
|
|
9
|
|
|
—
|
|
|
77
|
|
|
—
|
|
|
—
|
|
|
—
|
|
|
77
|
|
|
Extensions and discoveries
|
77
|
|
|
101
|
|
|
30
|
|
|
2
|
|
|
7
|
|
|
—
|
|
|
—
|
|
|
217
|
|
|
—
|
|
|
—
|
|
|
1
|
|
|
218
|
|
|
Purchases
|
10
|
|
|
—
|
|
|
—
|
|
|
—
|
|
|
—
|
|
|
—
|
|
|
—
|
|
|
10
|
|
|
—
|
|
|
—
|
|
|
—
|
|
|
10
|
|
|
Sales
|
(1
|
)
|
|
—
|
|
|
—
|
|
|
(15
|
)
|
|
(7
|
)
|
|
—
|
|
|
—
|
|
|
(23
|
)
|
|
—
|
|
|
—
|
|
|
—
|
|
|
(23
|
)
|
|
Production
|
(166
|
)
|
|
(19
|
)
|
|
(151
|
)
|
|
(147
|
)
|
|
(10
|
)
|
|
(27
|
)
|
|
(16
|
)
|
|
(536
|
)
|
|
(86
|
)
|
|
(6
|
)
|
|
(18
|
)
|
|
(646
|
)
|
|
Reserves at December 31, 2012
4
|
1,359
|
|
|
223
|
|
|
1,130
|
|
|
837
|
|
|
134
|
|
|
157
|
|
|
513
|
|
|
4,353
|
|
|
1,732
|
|
|
232
|
|
|
164
|
|
|
6,481
|
|
|
Changes attributable to:
|
|||||||||||||||||||||||||||||||||||
|
Revisions
|
55
|
|
|
25
|
|
|
94
|
|
|
84
|
|
|
7
|
|
|
17
|
|
|
40
|
|
|
322
|
|
|
32
|
|
|
(3
|
)
|
|
3
|
|
|
354
|
|
|
Improved recovery
|
26
|
|
|
—
|
|
|
10
|
|
|
10
|
|
|
—
|
|
|
11
|
|
|
—
|
|
|
57
|
|
|
—
|
|
|
—
|
|
|
—
|
|
|
57
|
|
|
Extensions and discoveries
|
55
|
|
|
4
|
|
|
13
|
|
|
2
|
|
|
—
|
|
|
4
|
|
|
—
|
|
|
78
|
|
|
—
|
|
|
—
|
|
|
—
|
|
|
78
|
|
|
Purchases
|
2
|
|
|
9
|
|
|
—
|
|
|
—
|
|
|
—
|
|
|
—
|
|
|
—
|
|
|
11
|
|
|
—
|
|
|
—
|
|
|
—
|
|
|
11
|
|
|
Sales
|
(3
|
)
|
|
—
|
|
|
(1
|
)
|
|
—
|
|
|
—
|
|
|
—
|
|
|
—
|
|
|
(4
|
)
|
|
—
|
|
|
—
|
|
|
—
|
|
|
(4
|
)
|
|
Production
|
(164
|
)
|
|
(18
|
)
|
|
(142
|
)
|
|
(141
|
)
|
|
(10
|
)
|
|
(23
|
)
|
|
(16
|
)
|
|
(514
|
)
|
|
(96
|
)
|
|
(9
|
)
|
|
(13
|
)
|
|
(632
|
)
|
|
Reserves at December 31, 2013
4
|
1,330
|
|
|
243
|
|
|
1,104
|
|
|
792
|
|
|
131
|
|
|
166
|
|
|
537
|
|
|
4,303
|
|
|
1,668
|
|
|
220
|
|
|
154
|
|
|
6,345
|
|
|
1
|
Ending reserve balances in North America were
141
,
121
and
13
and in South America were
102
,
102
and
100
in
2013
,
2012
and
2011
, respectively.
|
|
2
|
Reserves associated with Canada.
|
|
3
|
Ending reserve balances in Africa were
37
,
41
and
38
and in South America were
117
,
123
and
119
in
2013
,
2012
and
2011
, respectively.
|
|
4
|
Included are year-end reserve quantities related to production-sharing contracts (PSC) (refer to page E-11 for the definition of a PSC). PSC-related reserve quantities are
20
percent,
20
percent and
22
percent for consolidated companies for
2013
,
2012
and
2011
, respectively.
|
Noteworthy amounts in the categories of liquids proved reserve changes for
2011
through
2013
are discussed below:
Revisions
In 2011, net revisions increased reserves 235 million barrels. For consolidated companies, improved reservoir performance accounted for a majority of the 63 million barrel increase in the United States. In Africa, improved field performance drove the 60 million barrel increase. In Asia, increases from improved reservoir performance were partially offset by the effects of higher prices on entitlement volumes. Synthetic oil reserves in Canada increased by 32 million barrels, primarily due to geotechnical revisions. For affiliated companies, improved facility and reservoir performance was partially offset by the price effect on entitlement volumes at TCO.
In 2012, net revisions increased reserves 390 million barrels. Improved field performance and drilling associated with Gulf of Mexico projects accounted for the majority of the 104 million barrel increase in the United States. In Asia, drilling results across numerous assets drove the 97 million barrel increase. Improved field performance from various Nigeria and Angola producing assets was primarily responsible for the 66 million barrel increase
in Africa. Improved plant efficiency for the TCO affiliate was responsible for a large portion of the 59 million barrel increase.
In 2013, net revisions increased reserves 354 million barrels. Improved field performance from various Nigeria and Angola producing assets was primarily responsible for the 94 million barrel increase in Africa. In Asia, drilling performance across numerous assets resulted in an 84 million barrel increase. Improved field performance and drilling associated with Gulf of Mexico projects and drilling in the Midland and Delaware basins accounted for the majority of the 55 million barrel increase in the United States. Synthetic oil reserves in Canada increased by 40 million barrels, primarily due to improved field performance.
Improved Recovery
In 2011, improved recovery increased volumes by 58 million barrels. Reserves in Africa increased 48 million barrels due primarily to secondary recovery performance in Nigeria.
In 2012, improved recovery increased reserves by 77 million barrels, primarily due to secondary recovery performance in Africa and in Gulf of Mexico fields in the United States.
FS-67
|
Table V
Reserve Quantity Information - Continued
|
||
In 2013, improved recovery increased reserves by 57 million barrels due to numerous small projects, including expansions of existing projects in the United States, Europe, Asia, and Africa.
Extensions and Discoveries
In 2011, extensions and discoveries increased reserves 299 million barrels. In the United States, additions related to two Gulf of Mexico projects resulted in the majority of the 140 million barrel increase. In Australia, the Wheatstone Project increased liquid volumes 65 million barrels. Africa and Other Americas increased reserves 34 million and 30 million barrels, respectively, following the start of new projects in these areas. In Europe, a project in the United Kingdom increased reserves 26 million barrels.
In 2012, extensions and discoveries increased reserves 218 million barrels. In Other Americas, extensions and discoveries
increased reserves 101 million barrels, primarily due to the initial booking of the Hebron project in Canada. In the United States, additions at several Gulf of Mexico projects and drilling activities in the mid-continent region were primarily responsible for the 77 million barrel increase.
In 2013, extensions and discoveries increased reserves 78 million barrels. In the United States, extensions and discoveries in the Midland and Delaware basins were primarily responsible for the 55 million barrel increase.
Purchases
In 2011, purchases increased worldwide liquid volumes 42 million barrels. The acquisition of additional acreage in Canada increased synthetic oil reserves 40 million barrels.
Net Proved Reserves of Natural Gas
|
|
Consolidated Companies
|
|
Affiliated Companies
|
|
Total
Consolidated
|
|
|||||||||||||||||||||||
|
|
|
|
Other
|
|
|
|
|
|
|
|
|
|
|
|
|
|
|
|
|
and Affiliated
|
|
||||||||
|
Billions of cubic feet (BCF)
|
U.S.
|
|
|
Americas
1
|
|
|
Africa
|
|
|
Asia
|
|
|
Australia
|
|
|
Europe
|
|
|
Total
|
|
|
TCO
|
|
|
Other
2
|
|
|
Companies
|
|
|
Reserves at January 1, 2011
|
2,472
|
|
|
1,815
|
|
|
2,944
|
|
|
7,193
|
|
|
6,056
|
|
|
275
|
|
|
20,755
|
|
|
2,386
|
|
|
1,110
|
|
|
24,251
|
|
|
Changes attributable to:
|
|||||||||||||||||||||||||||||
|
Revisions
|
217
|
|
|
(4
|
)
|
|
39
|
|
|
196
|
|
|
(107
|
)
|
|
74
|
|
|
415
|
|
|
(21
|
)
|
|
103
|
|
|
497
|
|
|
Improved recovery
|
—
|
|
|
1
|
|
|
—
|
|
|
—
|
|
|
—
|
|
|
—
|
|
|
1
|
|
|
—
|
|
|
—
|
|
|
1
|
|
|
Extensions and discoveries
|
287
|
|
|
13
|
|
|
290
|
|
|
46
|
|
|
4,035
|
|
|
9
|
|
|
4,680
|
|
|
—
|
|
|
—
|
|
|
4,680
|
|
|
Purchases
|
1,231
|
|
|
—
|
|
|
—
|
|
|
2
|
|
|
—
|
|
|
—
|
|
|
1,233
|
|
|
—
|
|
|
—
|
|
|
1,233
|
|
|
Sales
|
(95
|
)
|
|
—
|
|
|
—
|
|
|
(2
|
)
|
|
(77
|
)
|
|
—
|
|
|
(174
|
)
|
|
—
|
|
|
—
|
|
|
(174
|
)
|
|
Production
3
|
(466
|
)
|
|
(161
|
)
|
|
(77
|
)
|
|
(714
|
)
|
|
(163
|
)
|
|
(100
|
)
|
|
(1,681
|
)
|
|
(114
|
)
|
|
(10
|
)
|
|
(1,805
|
)
|
|
Reserves at December 31, 2011
4
|
3,646
|
|
|
1,664
|
|
|
3,196
|
|
|
6,721
|
|
|
9,744
|
|
|
258
|
|
|
25,229
|
|
|
2,251
|
|
|
1,203
|
|
|
28,683
|
|
|
Changes attributable to:
|
|||||||||||||||||||||||||||||
|
Revisions
|
318
|
|
|
(77
|
)
|
|
(30
|
)
|
|
1,007
|
|
|
358
|
|
|
84
|
|
|
1,660
|
|
|
158
|
|
|
37
|
|
|
1,855
|
|
|
Improved recovery
|
5
|
|
|
—
|
|
|
—
|
|
|
1
|
|
|
—
|
|
|
2
|
|
|
8
|
|
|
—
|
|
|
—
|
|
|
8
|
|
|
Extensions and discoveries
|
166
|
|
|
34
|
|
|
2
|
|
|
50
|
|
|
747
|
|
|
—
|
|
|
999
|
|
|
—
|
|
|
12
|
|
|
1,011
|
|
|
Purchases
|
33
|
|
|
—
|
|
|
—
|
|
|
—
|
|
|
—
|
|
|
—
|
|
|
33
|
|
|
—
|
|
|
—
|
|
|
33
|
|
|
Sales
|
(6
|
)
|
|
—
|
|
|
—
|
|
|
(93
|
)
|
|
(439
|
)
|
|
—
|
|
|
(538
|
)
|
|
—
|
|
|
—
|
|
|
(538
|
)
|
|
Production
3
|
(440
|
)
|
|
(146
|
)
|
|
(87
|
)
|
|
(819
|
)
|
|
(158
|
)
|
|
(87
|
)
|
|
(1,737
|
)
|
|
(110
|
)
|
|
(10
|
)
|
|
(1,857
|
)
|
|
Reserves at December 31, 2012
4
|
3,722
|
|
|
1,475
|
|
|
3,081
|
|
|
6,867
|
|
|
10,252
|
|
|
257
|
|
|
25,654
|
|
|
2,299
|
|
|
1,242
|
|
|
29,195
|
|
|
Changes attributable to:
|
|||||||||||||||||||||||||||||
|
Revisions
|
(234
|
)
|
|
(59
|
)
|
|
27
|
|
|
627
|
|
|
229
|
|
|
46
|
|
|
636
|
|
|
117
|
|
|
(35
|
)
|
|
718
|
|
|
Improved recovery
|
3
|
|
|
—
|
|
|
2
|
|
|
6
|
|
|
—
|
|
|
4
|
|
|
15
|
|
|
—
|
|
|
—
|
|
|
15
|
|
|
Extensions and discoveries
|
951
|
|
|
—
|
|
|
27
|
|
|
16
|
|
|
—
|
|
|
27
|
|
|
1,021
|
|
|
—
|
|
|
—
|
|
|
1,021
|
|
|
Purchases
|
12
|
|
|
32
|
|
|
—
|
|
|
60
|
|
|
—
|
|
|
—
|
|
|
104
|
|
|
—
|
|
|
—
|
|
|
104
|
|
|
Sales
|
(10
|
)
|
|
—
|
|
|
(1
|
)
|
|
—
|
|
|
—
|
|
|
(1
|
)
|
|
(12
|
)
|
|
—
|
|
|
—
|
|
|
(12
|
)
|
|
Production
3
|
(454
|
)
|
|
(148
|
)
|
|
(91
|
)
|
|
(831
|
)
|
|
(154
|
)
|
|
(70
|
)
|
|
(1,748
|
)
|
|
(126
|
)
|
|
(21
|
)
|
|
(1,895
|
)
|
|
Reserves at December 31, 2013
4
|
3,990
|
|
|
1,300
|
|
|
3,045
|
|
|
6,745
|
|
|
10,327
|
|
|
263
|
|
|
25,670
|
|
|
2,290
|
|
|
1,186
|
|
|
29,146
|
|
|
1
|
Ending reserve balances in North America and South America were
54
,
49
,
19
and
1,246
,
1,426
,
1,645
in
2013
,
2012
and
2011
, respectively.
|
|
2
|
Ending reserve balances in Africa and South America were
1,009
,
1,068
,
1,016
and
177
,
174
,
187
in
2013
,
2012
and
2011
, respectively.
|
|
3
|
Total “as sold” volumes are
1,704
BCF,
1,666
BCF and
1,615
BCF for
2013
,
2012
and
2011
, respectively. 2011 and 2012 conformed to 2013 presentation.
|
|
4
|
Includes reserve quantities related to production-sharing contracts (PSC) (refer to page E-11 for the definition of a PSC). PSC-related reserve quantities are
20
percent,
21
percent and
21
percent for consolidated companies for
2013
,
2012
and
2011
, respectively.
|
FS-68
|
Table V
Reserve Quantity Information - Continued
|
||
Noteworthy amounts in the categories of natural gas proved-reserve changes for
2011
through
2013
are discussed below:
Revisions
In 2011, net revisions increased reserves 497 BCF. For consolidated companies, improved reservoir performance accounted for a majority of the 217 BCF increase in the United States. In Asia, a net increase of 196 BCF was driven by development drilling and improved field performance in Thailand, partially offset by the effects of higher prices on entitlement volumes in Kazakhstan. For affiliated companies, ongoing reservoir assessment resulted in the recognition of additional reserves related to the Angola LNG project. At TCO, improved facility and reservoir performance was more than offset by the price effect on entitlement volumes.
In 2012, net revisions increased reserves 1,855 BCF. A net increase of 1,007 BCF in Asia was primarily due to development drilling and additional compression in Bangladesh, and drilling results and improved field performance in Thailand. In Australia, updated reservoir data interpretation based on additional drilling at the Gorgon Project drove the 358 BCF increase. Drilling results from activities in the Marcellus Shale were responsible for the majority of the 318 BCF increase in the United States.
In 2013, net revisions increased reserves 718 BCF. A net increase of 627 BCF in Asia was primarily due to development drilling and improved field performance in Bangladesh and Thailand. In Australia, drilling performance drove the 229 BCF increase. The majority of the net decrease of 234 BCF in the United States was due to a change in development plans in the Appalachian region.
Extensions and Discoveries
In 2011, extensions and discoveries increased reserves 4,680 BCF. In Australia, the Wheatstone Project accounted for the 4,035 BCF in additions. In Africa, the start of a new natural gas development project in Nigeria resulted in the 290 BCF increase. In the United States, development drilling accounted for the majority of the 287 BCF increase.
In 2012, extensions and discoveries increased reserves by 1,011 BCF. The increase of 747 BCF in Australia was primarily related to positive drilling results at the Gorgon Project.
In 2013, extensions and discoveries increased reserves by 1,021 BCF, with the majority in the Appalachian region in the U.S.
Purchases
In 2011, purchases increased reserves 1,233 BCF. In the United States, acquisitions in the Marcellus Shale increased reserves 1,230 BCF.
Sales
In 2011, sales decreased reserves 174 BCF. In Australia, the Wheatstone Project unitization and equity sales agreements reduced reserves 77 BCF. In the United States, sales in Alaska and other smaller fields reduced reserves 95 BCF.
In 2012, sales decreased reserves by 538 BCF. Sales of a portion of the company's equity interest in the Wheatstone Project were responsible for the 439 BCF reserves reduction in Australia.
FS-69
|
Table VI
Standardized Measure of Discounted Future Net Cash
Flows Related to Proved Oil and Gas Reserves |
|||
The standardized measure of discounted future net cash flows, related to the preceding proved oil and gas reserves, is calculated in accordance with the requirements of the FASB. Estimated future cash inflows from production are computed by applying 12-month average prices for oil and gas to year-end quantities of estimated net proved reserves. Future price changes are limited to those provided by contractual arrangements in existence at the end of each reporting year. Future development and production costs are those estimated future expenditures necessary to develop and produce year-end estimated proved reserves based on year-end cost indices, assuming continuation of year-end economic conditions, and include estimated costs for asset retirement obligations. Estimated future income taxes are calculated by applying appropriate year-end statutory tax rates. These rates reflect allowable deductions and tax credits and are applied to estimated future pretax net cash flows, less the tax basis of related assets. Discounted future net cash flows are calculated
using 10 percent midperiod discount factors. Discounting requires a year-by-year estimate of when future expenditures will be incurred and when reserves will be produced.
The information provided does not represent management’s estimate of the company’s expected future cash flows or value of proved oil and gas reserves. Estimates of proved-reserve quantities are imprecise and change over time as new information becomes available. Moreover, probable and possible reserves, which may become proved in the future, are excluded from the calculations. The valuation prescribed by the FASB requires assumptions as to the timing and amount of future development and production costs. The calculations are made as of December 31 each year and should not be relied upon as an indication of the company’s future cash flows or value of its oil and gas reserves. In the following table, “Standardized Measure Net Cash Flows” refers to the standardized measure of discounted future net cash flows.
Table VI - Standardized Measure of Discounted Future Net Cash Flows Related to Proved Oil and Gas Reserves
|
|
Consolidated Companies
|
|
Affiliated Companies
|
|
Total
Consolidated |
|
|||||||||||||||||||||||||||||||||
|
|
|
|
Other
|
|
|
|
|
|
|
|
|
|
|
|
|
|
|
|
|
and Affiliated
|
|
||||||||||||||||||
|
Millions of dollars
|
U.S.
|
|
|
Americas
|
|
|
Africa
|
|
|
Asia
|
|
|
Australia
|
|
|
Europe
|
|
|
Total
|
|
|
TCO
|
|
|
Other
|
|
|
Companies
|
|
||||||||||
|
At December 31, 2013
|
|
|
|
|
|
|
|
|
|
|
|
|
|
|
|
|
|
|
|
||||||||||||||||||||
|
Future cash inflows from production
1
|
$
|
136,942
|
|
|
$
|
73,468
|
|
|
$
|
117,119
|
|
|
$
|
111,970
|
|
|
$
|
130,620
|
|
|
$
|
20,232
|
|
|
$
|
590,351
|
|
|
$
|
157,108
|
|
|
$
|
43,380
|
|
|
$
|
790,839
|
|
|
Future production costs
|
(39,009
|
)
|
|
(29,373
|
)
|
|
(27,800
|
)
|
|
(35,716
|
)
|
|
(19,387
|
)
|
|
(10,099
|
)
|
|
(161,384
|
)
|
|
(32,245
|
)
|
|
(18,027
|
)
|
|
(211,656
|
)
|
||||||||||
|
Future development costs
|
(12,058
|
)
|
|
(10,149
|
)
|
|
(10,983
|
)
|
|
(17,290
|
)
|
|
(18,220
|
)
|
|
(2,644
|
)
|
|
(71,344
|
)
|
|
(12,852
|
)
|
|
(3,879
|
)
|
|
(88,075
|
)
|
||||||||||
|
Future income taxes
|
(28,458
|
)
|
|
(9,454
|
)
|
|
(53,953
|
)
|
|
(26,162
|
)
|
|
(27,904
|
)
|
|
(4,727
|
)
|
|
(150,658
|
)
|
|
(33,603
|
)
|
|
(9,418
|
)
|
|
(193,679
|
)
|
||||||||||
|
Undiscounted future net cash flows
|
57,417
|
|
|
24,492
|
|
|
24,383
|
|
|
32,802
|
|
|
65,109
|
|
|
2,762
|
|
|
206,965
|
|
|
78,408
|
|
|
12,056
|
|
|
297,429
|
|
||||||||||
|
10 percent midyear annual discount for timing of estimated cash flows
|
(23,055
|
)
|
|
(15,217
|
)
|
|
(8,165
|
)
|
|
(10,901
|
)
|
|
(35,110
|
)
|
|
(888
|
)
|
|
(93,336
|
)
|
|
(41,444
|
)
|
|
(6,482
|
)
|
|
(141,262
|
)
|
||||||||||
|
Standardized Measure
Net Cash Flows |
$
|
34,362
|
|
|
$
|
9,275
|
|
|
$
|
16,218
|
|
|
$
|
21,901
|
|
|
$
|
29,999
|
|
|
$
|
1,874
|
|
|
$
|
113,629
|
|
|
$
|
36,964
|
|
|
$
|
5,574
|
|
|
$
|
156,167
|
|
|
At December 31, 2012
2
|
|
|
|
|
|
|
|
|
|
|
|
|
|
|
|
|
|
|
|
||||||||||||||||||||
|
Future cash inflows from production
1
|
$
|
139,856
|
|
|
$
|
72,548
|
|
|
$
|
122,189
|
|
|
$
|
121,849
|
|
|
$
|
134,009
|
|
|
$
|
19,653
|
|
|
$
|
610,104
|
|
|
$
|
169,966
|
|
|
$
|
47,496
|
|
|
$
|
827,566
|
|
|
Future production costs
|
(41,773
|
)
|
|
(27,191
|
)
|
|
(24,592
|
)
|
|
(35,713
|
)
|
|
(18,340
|
)
|
|
(8,768
|
)
|
|
(156,377
|
)
|
|
(32,085
|
)
|
|
(19,899
|
)
|
|
(208,361
|
)
|
||||||||||
|
Future development costs
|
(11,192
|
)
|
|
(14,810
|
)
|
|
(14,601
|
)
|
|
(17,275
|
)
|
|
(24,923
|
)
|
|
(1,946
|
)
|
|
(84,747
|
)
|
|
(12,355
|
)
|
|
(3,710
|
)
|
|
(100,812
|
)
|
||||||||||
|
Future income taxes
|
(32,357
|
)
|
|
(9,902
|
)
|
|
(48,683
|
)
|
|
(30,763
|
)
|
|
(27,224
|
)
|
|
(5,589
|
)
|
|
(154,518
|
)
|
|
(37,658
|
)
|
|
(13,363
|
)
|
|
(205,539
|
)
|
||||||||||
|
Undiscounted future net cash flows
|
54,534
|
|
|
20,645
|
|
|
34,313
|
|
|
38,098
|
|
|
63,522
|
|
|
3,350
|
|
|
214,462
|
|
|
87,868
|
|
|
10,524
|
|
|
312,854
|
|
||||||||||
|
10 percent midyear annual discount for timing of estimated cash flows
|
(23,055
|
)
|
|
(14,331
|
)
|
|
(12,429
|
)
|
|
(13,033
|
)
|
|
(40,450
|
)
|
|
(860
|
)
|
|
(104,158
|
)
|
|
(47,534
|
)
|
|
(5,644
|
)
|
|
(157,336
|
)
|
||||||||||
|
Standardized Measure
Net Cash Flows |
$
|
31,479
|
|
|
$
|
6,314
|
|
|
$
|
21,884
|
|
|
$
|
25,065
|
|
|
$
|
23,072
|
|
|
$
|
2,490
|
|
|
$
|
110,304
|
|
|
$
|
40,334
|
|
|
$
|
4,880
|
|
|
$
|
155,518
|
|
|
At December 31, 2011
|
|
|
|
|
|
|
|
|
|
|
|
|
|
|
|
|
|
|
|
||||||||||||||||||||
|
Future cash inflows from production
1
|
$
|
143,633
|
|
|
$
|
63,579
|
|
|
$
|
124,077
|
|
|
$
|
124,972
|
|
|
$
|
113,773
|
|
|
$
|
19,704
|
|
|
$
|
589,738
|
|
|
$
|
171,588
|
|
|
$
|
42,212
|
|
|
$
|
803,538
|
|
|
Future production costs
|
(39,523
|
)
|
|
(22,856
|
)
|
|
(22,703
|
)
|
|
(35,579
|
)
|
|
(15,411
|
)
|
|
(7,467
|
)
|
|
(143,539
|
)
|
|
(30,904
|
)
|
|
(19,430
|
)
|
|
(193,873
|
)
|
||||||||||
|
Future development costs
|
(11,272
|
)
|
|
(9,345
|
)
|
|
(10,695
|
)
|
|
(15,035
|
)
|
|
(29,489
|
)
|
|
(676
|
)
|
|
(76,512
|
)
|
|
(10,778
|
)
|
|
(2,836
|
)
|
|
(90,126
|
)
|
||||||||||
|
Future income taxes
|
(34,050
|
)
|
|
(9,121
|
)
|
|
(53,103
|
)
|
|
(33,884
|
)
|
|
(20,661
|
)
|
|
(7,229
|
)
|
|
(158,048
|
)
|
|
(36,698
|
)
|
|
(10,833
|
)
|
|
(205,579
|
)
|
||||||||||
|
Undiscounted future net cash flows
|
58,788
|
|
|
22,257
|
|
|
37,576
|
|
|
40,474
|
|
|
48,212
|
|
|
4,332
|
|
|
211,639
|
|
|
93,208
|
|
|
9,113
|
|
|
313,960
|
|
||||||||||
|
10 percent midyear annual discount for timing of estimated cash flows
|
(25,013
|
)
|
|
(15,082
|
)
|
|
(13,801
|
)
|
|
(14,627
|
)
|
|
(35,051
|
)
|
|
(1,117
|
)
|
|
(104,691
|
)
|
|
(51,547
|
)
|
|
(4,883
|
)
|
|
(161,121
|
)
|
||||||||||
|
Standardized Measure
Net Cash Flows |
$
|
33,775
|
|
|
$
|
7,175
|
|
|
$
|
23,775
|
|
|
$
|
25,847
|
|
|
$
|
13,161
|
|
|
$
|
3,215
|
|
|
$
|
106,948
|
|
|
$
|
41,661
|
|
|
$
|
4,230
|
|
|
$
|
152,839
|
|
|
1
|
Based on 12-month average price.
|
|
2
|
2012 conformed to 2013 presentation.
|
FS-70
|
Table VII
Changes in the Standardized Measure of Discounted
Future Net Cash Flows From Proved Reserves |
|||
The changes in present values between years, which can be significant, reflect changes in estimated proved-reserve quantities and prices and assumptions used in forecasting production volumes
and costs. Changes in the timing of production are included with “Revisions of previous quantity estimates.”
Table VII - Changes in the Standardized Measure
of Discounted Future Net Cash Flows From Proved Reserves
|
|
|
|
|
|
Total
|
|
|||||
|
|
|
|
|
|
Consolidated
|
|
|||||
|
|
|
|
|
|
and Affiliated
|
|
|||||
|
Millions of dollars
|
Consolidated Companies*
|
|
|
Affiliated Companies
|
|
|
Companies
|
|
|||
|
Present Value at January 1, 2011
|
$
|
73,024
|
|
$
|
35,619
|
|
$
|
108,643
|
|
||
|
Sales and transfers of oil and gas produced net of production costs
|
(52,338
|
)
|
(8,679
|
)
|
(61,017
|
)
|
|||||
|
Development costs incurred
|
13,869
|
|
729
|
|
14,598
|
|
|||||
|
Purchases of reserves
|
1,212
|
|
—
|
|
1,212
|
|
|||||
|
Sales of reserves
|
(803
|
)
|
—
|
|
(803
|
)
|
|||||
|
Extensions, discoveries and improved recovery less related costs
|
12,288
|
|
—
|
|
12,288
|
|
|||||
|
Revisions of previous quantity estimates
|
16,025
|
|
923
|
|
16,948
|
|
|||||
|
Net changes in prices, development and production costs
|
61,428
|
|
15,979
|
|
77,407
|
|
|||||
|
Accretion of discount
|
11,943
|
|
5,048
|
|
16,991
|
|
|||||
|
Net change in income tax
|
(29,700
|
)
|
(3,728
|
)
|
(33,428
|
)
|
|||||
|
Net change for 2011
|
33,924
|
|
10,272
|
|
44,196
|
|
|||||
|
Present Value at December 31, 2011
|
$
|
106,948
|
|
$
|
45,891
|
|
$
|
152,839
|
|
||
|
Sales and transfers of oil and gas produced net of production costs
|
(49,094
|
)
|
(7,708
|
)
|
(56,802
|
)
|
|||||
|
Development costs incurred
|
18,013
|
|
942
|
|
18,955
|
|
|||||
|
Purchases of reserves
|
376
|
|
—
|
|
376
|
|
|||||
|
Sales of reserves
|
(1,630
|
)
|
—
|
|
(1,630
|
)
|
|||||
|
Extensions, discoveries and improved recovery less related costs
|
9,251
|
|
106
|
|
9,357
|
|
|||||
|
Revisions of previous quantity estimates
|
26,022
|
|
3,759
|
|
29,781
|
|
|||||
|
Net changes in prices, development and production costs
|
(19,178
|
)
|
(2,266
|
)
|
(21,444
|
)
|
|||||
|
Accretion of discount
|
18,026
|
|
6,322
|
|
24,348
|
|
|||||
|
Net change in income tax
|
1,570
|
|
(1,832
|
)
|
(262
|
)
|
|||||
|
Net change for 2012
|
3,356
|
|
(677
|
)
|
2,679
|
|
|||||
|
Present Value at December 31, 2012
|
$
|
110,304
|
|
$
|
45,214
|
|
$
|
155,518
|
|
||
|
Sales and transfers of oil and gas produced net of production costs
|
(43,760
|
)
|
|
(8,692
|
)
|
|
(52,452
|
)
|
|||
|
Development costs incurred
|
22,907
|
|
|
1,411
|
|
|
24,318
|
|
|||
|
Purchases of reserves
|
184
|
|
|
—
|
|
|
184
|
|
|||
|
Sales of reserves
|
243
|
|
|
—
|
|
|
243
|
|
|||
|
Extensions, discoveries and improved recovery less related costs
|
3,135
|
|
|
—
|
|
|
3,135
|
|
|||
|
Revisions of previous quantity estimates
|
25,573
|
|
|
1,306
|
|
|
26,879
|
|
|||
|
Net changes in prices, development and production costs
|
(25,959
|
)
|
|
(5,925
|
)
|
|
(31,884
|
)
|
|||
|
Accretion of discount
|
18,463
|
|
|
6,406
|
|
|
24,869
|
|
|||
|
Net change in income tax
|
2,539
|
|
|
2,818
|
|
|
5,357
|
|
|||
|
Net change for 2013
|
3,325
|
|
|
(2,676
|
)
|
|
649
|
|
|||
|
Present Value at December 31, 2013
|
$
|
113,629
|
|
|
$
|
42,538
|
|
|
$
|
156,167
|
|
*2012 conformed to 2013 presentation.
FS-71
EXHIBIT INDEX
|
Exhibit No.
|
Description
|
|
|
3.1
|
Restated Certificate of Incorporation of Chevron Corporation, dated May 30, 2008, filed as Exhibit 3.1 to Chevron Corporation’s Quarterly Report on Form 10-Q for the quarterly period ended June 30, 2008, and incorporated herein by reference.
|
|
|
3.2
|
By-Laws of Chevron Corporation, as amended January 29, 2014, filed as Exhibit 3.1 to Chevron Corporation’s Current Report on Form 8-K filed January 31, 2014, and incorporated herein by reference.
|
|
|
4.1
|
Pursuant to the Instructions to Exhibits, certain instruments defining the rights of holders of long-term debt securities of the company and its consolidated subsidiaries are not filed because the total amount of securities authorized under any such instrument does not exceed 10 percent of the total assets of the corporation and its subsidiaries on a consolidated basis. A copy of such instrument will be furnished to the Securities and Exchange Commission upon request.
|
|
|
4.2
|
Confidential Stockholder Voting Policy of Chevron Corporation, filed as Exhibit 4.2 to Chevron Corporation’s Annual Report on Form 10-K for the year ended December 31, 2008, and incorporated herein by reference.
|
|
|
10.1
|
Chevron Corporation Non-Employee Directors’ Equity Compensation and Deferral Plan, filed as Exhibit 10.1 to Chevron Corporation’s Annual Report on Form 10-K for the year ended December 31, 2008, and incorporated herein by reference.
|
|
|
10.2
|
Chevron Incentive Plan, filed as Exhibit 10.2 to Chevron Corporation’s Annual Report on Form 10-K for the year ended December 31, 2008, and incorporated herein by reference.
|
|
|
10.3
|
Long-Term Incentive Plan of Chevron Corporation, filed as Exhibit B to Chevron Corporation’s Notice of the 2013 Annual Meeting and 2013 Proxy Statement filed April 11, 2013, and incorporated herein by reference.
|
|
|
10.4
|
Chevron Corporation Deferred Compensation Plan for Management Employees, filed as Exhibit 10.5 to Chevron Corporation’s Current Report on Form 8-K filed December 13, 2005, and incorporated herein by reference.
|
|
|
10.5
|
Chevron Corporation Deferred Compensation Plan for Management Employees II, filed as Exhibit 10.5 to Chevron Corporation’s Annual Report on Form 10-K for the year ended December 31, 2008, and incorporated herein by reference.
|
|
|
10.6
|
Chevron Corporation Retirement Restoration Plan, filed as Exhibit 10.6 to Chevron Corporation’s Annual Report on Form 10-K for the year ended December 31, 2008, and incorporated herein by reference.
|
|
|
10.7
|
Chevron Corporation ESIP Restoration Plan, filed as Exhibit 10.7 to Chevron Corporation’s Annual Report on Form 10-K for the year ended December 31, 2008, and incorporated herein by reference.
|
|
|
10.8*
|
Summary of Chevron Incentive Plan Award Criteria.
|
|
|
10.9*
|
Form of Terms and Conditions for Awards under the Long-Term Incentive Plan of Chevron Corporation.
|
|
|
10.10
|
Form of Restricted Stock Unit Grant Agreement under the Long-Term Incentive Plan of Chevron Corporation, filed as Exhibit 10.13 to Chevron Corporation's Annual Report on Form 10-K for the year ended December 31, 2012, and incorporated herein by reference.
|
|
|
10.11
|
Form of Retainer Stock Option Agreement under the Chevron Corporation Non-Employee Directors’ Equity Compensation and Deferral Plan, filed as Exhibit 10.17 to Chevron Corporation’s Annual Report on Form 10-K for the year ended December 31, 2009, and incorporated herein by reference.
|
|
|
10.12
|
Form of Stock Units Agreement under the Chevron Corporation Non-Employee Directors’ Equity Compensation and Deferral Plan, filed as Exhibit 10.19 to Chevron Corporation’s Annual Report on Form 10-K for the year ended December 31, 2008, and incorporated herein by reference.
|
|
|
10.13
|
Agreement between Chevron Corporation and R. Hewitt Pate, filed as Exhibit 10.16 to Chevron's Annual Report on Form 10-K for the year ended December 31, 2011, and incorporated herein by reference.
|
|
|
12.1*
|
Computation of Ratio of Earnings to Fixed Charges (page E-3).
|
|
|
21.1*
|
Subsidiaries of Chevron Corporation (page E-4).
|
|
E-1
|
Exhibit No.
|
Description
|
|
|
23.1*
|
Consent of PricewaterhouseCoopers LLP (page E-5).
|
|
|
24.1 to 24.10*
|
Powers of Attorney for directors and certain officers of Chevron Corporation, authorizing the signing of the Annual Report on Form 10-K on their behalf.
|
|
|
31.1*
|
Rule 13a-14(a)/15d-14(a) Certification of the company’s Chief Executive Officer (page E-6).
|
|
|
31.2*
|
Rule 13a-14(a)/15d-14(a) Certification of the company’s Chief Financial Officer (page E-7).
|
|
|
32.1*
|
Section 1350 Certification of the company’s Chief Executive Officer (page E-8).
|
|
|
32.2*
|
Section 1350 Certification of the company’s Chief Financial Officer (page E-9).
|
|
|
95*
|
Mine Safety Disclosure.
|
|
|
99.1*
|
Definitions of Selected Energy and Financial Terms (pages E-10 through E-11).
|
|
|
101.INS*
|
XBRL Instance Document.
|
|
|
101.SCH*
|
XBRL Schema Document.
|
|
|
101.CAL*
|
XBRL Calculation Linkbase Document.
|
|
|
101.LAB*
|
XBRL Label Linkbase Document.
|
|
|
101.PRE*
|
XBRL Presentation Linkbase Document.
|
|
|
101.DEF*
|
XBRL Definition Linkbase Document.
|
|
Attached as Exhibit 101 to this report are documents formatted in XBRL (Extensible Business Reporting Language). The financial information contained in the XBRL-related documents is “unaudited” or “unreviewed.”
_______________________________
|
*
|
Filed herewith.
|
Copies of the above exhibits not contained herein are available to any security holder upon written request to the Corporate Governance Department, Chevron Corporation, 6001 Bollinger Canyon Road, San Ramon, California 94583-2324.
E-2
TABLE OF CONTENTS
Part IItem 1. BusinessItem 1A. Risk FactorsItem 2. PropertiesItem 3. Legal ProceedingsItem 4. Mine Safety DisclosuresPart IIItem 5. Market For The Registrant S Common Equity, Related Stockholder Matters and Issuer Purchases Of Equity SecuritiesItem 6. Selected Financial DataItem 7. Management S Discussion and Analysis Of Financial Condition and Results Of OperationsItem 7A. Quantitative and Qualitative Disclosures About Market RiskItem 8. Financial Statements and Supplementary DataItem 9. Changes in and Disagreements with Accountants on Accounting and Financial DisclosureItem 9A. Controls and ProceduresItem 9B. Other InformationPart IIIItem 10. Directors, Executive Officers and Corporate GovernanceItem 11. Executive CompensationItem 12. Security Ownership Of Certain Beneficial Owners and Management and Related Stockholder MattersItem 13. Certain Relationships and Related Transactions, and Director IndependenceItem 14. Principal Accounting Fees and ServicesPart IVItem 15. Exhibits, Financial Statement SchedulesNote 1 Summary Of Significant Accounting Policies - ContinuedNote 3 Noncontrolling InterestsNote 4 Information Relating To The Consolidated Statement Of Cash Flows - ContinuedNote 7 Summarized Financial Data Tengizchevroil LlpNote 9 Fair Value Measurements - ContinuedNote 10 Financial and Derivative Instruments - ContinuedNote 11 Operating Segments and Geographic Data - ContinuedNote 12 Investments and Advances - ContinuedNote 13 Properties, Plant and EquipmentNote 14 Litigation - ContinuedNote 15 Taxes - ContinuedNote 15 TaxesNote 17 Long-term DebtNote 19 Accounting For Suspended Exploratory Wells - ContinuedNote 20 Stock Options and Other Share-based Compensation - ContinuedNote 21 Employee Benefit Plans - ContinuedNote 23 Other Contingencies and Commitments - ContinuedNote 25 Other Financial Information