CLEARWAY ENERGY, INC.
10-Ks and 10-Qs
|
|
|
|
|
|
|
|
|
|
|
|
|
|
|
|
|
|
|
|
|
|
|
|
|
|
|
|
|
|
|
|
|
|
|
|
|
|
|
|
|
|
|
|
UNITED STATES SECURITIES AND EXCHANGE COMMISSION
Washington, D.C. 20549
FORM 10-Q
|
x
|
|
Quarterly report pursuant to Section 13 or 15(d) of the Securities Exchange Act of 1934
|
|
For the Quarterly Period Ended: September 30, 2015
|
||
|
o
|
Transition report pursuant to Section 13 or 15(d) of the Securities Exchange Act of 1934
|
|
Commission File Number: 001-36002
NRG Yield, Inc.
(Exact name of registrant as specified in its charter)
|
Delaware
(State or other jurisdiction
of incorporation or organization)
|
46-1777204
(I.R.S. Employer
Identification No.)
|
|
|
|
|
|
|
211 Carnegie Center, Princeton, New Jersey
(Address of principal executive offices)
|
08540
(Zip Code)
|
|
(609) 524-4500
(Registrant’s telephone number, including area code)
Indicate by check mark whether the registrant (1) has filed all reports required to be filed by Section 13 or 15(d) of the Securities Exchange Act of 1934 during the preceding 12 months (or for such shorter period that the registrant was required to file such reports), and (2) has been subject to such filing requirements for the past 90 days.
Yes
x
No
o
Indicate by check mark whether the registrant has submitted electronically and posted on its corporate Web site, if any, every Interactive Data File required to be submitted and posted pursuant to Rule 405 of Regulation S-T (§232.405 of this chapter) during the preceding 12 months (or for such shorter period that the registrant was required to submit and post such files).
Yes
x
No
o
Indicate by check mark whether the registrant is a large accelerated filer, an accelerated filer, a non-accelerated filer, or a smaller reporting company. See the definitions of “large accelerated filer,” “accelerated filer,” and “smaller reporting company” in Rule 12b-2 of the Exchange Act.
|
Large accelerated filer
x
|
Accelerated filer
o
|
Non-accelerated filer
o
|
Smaller reporting company
o
|
|||
|
(Do not check if a smaller reporting company)
|
||||||
Indicate by check mark whether the registrant is a shell company (as defined in Rule 12b-2 of the Exchange Act).
Yes
o
No
x
As of
October 31, 2015
, there were
34,586,250
shares of Class A common stock outstanding, par value $0.01 per share,
42,738,750
shares of Class B common stock outstanding, par value $0.01 per share,
62,784,250
shares of Class C common stock outstanding, par value $0.01 per share, and
42,738,750
shares of Class D common stock outstanding, par value $0.01 per share.
1
TABLE OF CONTENTS
Index
2
CAUTIONARY STATEMENT REGARDING FORWARD-LOOKING INFORMATION
This Quarterly Report on Form 10-Q of NRG Yield, Inc., together with its consolidated subsidiaries, or the Company, includes forward-looking statements within the meaning of Section 27A of the Securities Act of 1933, as amended, or the Securities Act, and Section 21E of the Securities Exchange Act of 1934, as amended, or the Exchange Act. The words "believes," "projects," "anticipates," "plans," "expects," "intends," "estimates" and similar expressions are intended to identify forward-looking statements. These forward-looking statements involve known and unknown risks, uncertainties and other factors that may cause the Company's actual results, performance and achievements, or industry results, to be materially different from any future results, performance or achievements expressed or implied by such forward-looking statements. These factors, risks and uncertainties include the factors described under Item 1A —
Risk Factors
in Part I, Item 1A of the Company's Annual Report on Form 10-K for the year ended December 31, 2014, and the following:
|
•
|
The Company's ability to maintain and grow its quarterly dividend;
|
|
•
|
The Company's ability to successfully identify, evaluate and consummate acquisitions from third parties;
|
|
•
|
The Company's ability to acquire assets from NRG;
|
|
•
|
The Company's ability to raise additional capital due to its indebtedness, corporate structure, market conditions or otherwise;
|
|
•
|
Hazards customary to the power production industry and power generation operations such as fuel and electricity price volatility, unusual weather conditions, catastrophic weather-related or other damage to facilities, unscheduled generation outages, maintenance or repairs, unanticipated changes to fuel supply costs or availability due to higher demand, shortages, transportation problems or other developments, environmental incidents, or electric transmission or gas pipeline system constraints and the possibility that the Company may not have adequate insurance to cover losses as a result of such hazards;
|
|
•
|
The Company's ability to operate its businesses efficiently, manage maintenance capital expenditures and costs effectively, and generate earnings and cash flows from its asset-based businesses in relation to its debt and other obligations;
|
|
•
|
The willingness and ability of counterparties to the Company's offtake agreements to fulfill their obligations under such agreements;
|
|
•
|
The Company's ability to enter into contracts to sell power and procure fuel on acceptable terms and prices as current offtake agreements expire;
|
|
•
|
Government regulation, including compliance with regulatory requirements and changes in market rules, rates, tariffs and environmental laws;
|
|
•
|
Operating and financial restrictions placed on the Company and its subsidiaries that are contained in the project-level debt facilities and other agreements of certain subsidiaries and project-level subsidiaries generally, in the NRG Yield Operating LLC revolving credit facility, in the indenture governing the Senior Notes and in the indenture governing the Company's convertible notes; and
|
|
•
|
The Company's ability to borrow additional funds and access capital markets, as well as the Company's substantial indebtedness and the possibility that the Company may incur additional indebtedness going forward.
|
Forward-looking statements speak only as of the date they were made, and the Company undertakes no obligation to publicly update or revise any forward-looking statements, whether as a result of new information, future events or otherwise. The foregoing review of factors that could cause the Company's actual results to differ materially from those contemplated in any forward-looking statements included in this Quarterly Report on Form 10-Q should not be construed as exhaustive.
3
GLOSSARY OF TERMS
When the following terms and abbreviations appear in the text of this report, they have the meanings indicated below:
|
2014 Form 10-K
|
NRG Yield, Inc.'s Annual Report on Form 10-K for the year ended December 31, 2014
|
|
|
2019 Convertible Notes
|
$345 million aggregate principal amount of 3.50% Convertible Notes due 2019
|
|
|
2020 Convertible Notes
|
$287.5 million aggregate principal amount of 3.25% Convertible Notes due 2020
|
|
|
Alta TE Holdco
|
Alta Wind X-XI TE Holdco LLC
|
|
|
Alta Wind Portfolio
|
Seven wind facilities that total 947 MW located in Tehachapi, California and a portfolio of associated land leases
|
|
|
AOCL
|
Accumulated Other Comprehensive Loss
|
|
|
ASC
|
The FASB Accounting Standards Codification, which the FASB established as the source of
authoritative U.S. GAAP
|
|
|
ASU
|
Accounting Standards Updates – updates to the ASC
|
|
|
Buffalo Bear
|
Buffalo Bear, LLC, the operating subsidiary of Tapestry Wind LLC, which owns the Buffalo Bear project
|
|
|
CAFD
|
Cash Available For Distribution
|
|
|
COD
|
Commercial Operations Date
|
|
|
Company
|
NRG Yield, Inc. together with its consolidated subsidiaries
|
|
|
CVSR
|
California Valley Solar Ranch
|
|
|
DGPV Holdco
|
NRG DGPV Holdco 1 LLC
|
|
|
Distributed Solar
|
Solar power projects, typically less than 20 MW in size, that primarily sell power produced to customers for usage on site, or are interconnected to sell power into the local distribution grid
|
|
|
Drop Down Assets
|
Collectively, the June 2014 Drop Down Assets and the January 2015 Drop Down Assets
|
|
|
Economic Gross Margin
|
Energy and capacity revenue, less cost of fuels
|
|
|
El Segundo
|
NRG West Holdings LLC, the subsidiary of Natural Gas Repowering LLC, which owns the El Segundo Energy Center project
|
|
|
EME
|
Edison Mission Energy
|
|
|
ERCOT
|
Electric Reliability Council of Texas, the Independent System Operator and the regional reliability coordinator of the various electricity systems within Texas
|
|
|
EWG
|
Exempt Wholesale Generator
|
|
|
Exchange Act
|
The Securities Exchange Act of 1934, as amended
|
|
|
FASB
|
Financial Accounting Standards Board
|
|
|
FERC
|
Federal Energy Regulatory Commission
|
|
|
GenConn
|
GenConn Energy LLC
|
|
|
HLBV
|
Hypothetical Liquidation at Book Value
|
|
|
IASB
|
International Accounting Standards Board
|
|
|
ISO
|
Independent System Operator, also referred to as RTO
|
|
|
January 2015 Drop Down Assets
|
The Laredo Ridge, Tapestry and Walnut Creek projects, which were acquired by the Company from NRG on January 2, 2015
|
|
|
June 2014 Drop Down Assets
|
The TA High Desert, Kansas South and El Segundo projects, which were acquired by the Company from NRG on June 30, 2014
|
|
|
Kansas South
|
NRG Solar Kansas South LLC, the operating subsidiary of NRG Solar Kansas South Holdings LLC, which owns the Kansas South project
|
|
|
Laredo Ridge
|
Laredo Ridge Wind, LLC, the operating subsidiary of Mission Wind Laredo, LLC, which owns the Laredo Ridge project
|
|
|
LIBOR
|
London Inter-Bank Offered Rate
|
|
|
Marsh Landing
|
NRG Marsh Landing LLC, formerly GenOn Marsh Landing LLC
|
|
|
MMBtu
|
Million British Thermal Units
|
|
|
MW
|
Megawatt
|
|
4
|
MWh
|
Saleable megawatt hour, net of internal/parasitic load megawatt-hour
|
|
|
MWt
|
Megawatts Thermal Equivalent
|
|
|
NERC
|
North American Electric Reliability Corporation
|
|
|
Net Exposure
|
Counterparty credit exposure to NRG Yield, Inc. net of collateral
|
|
|
NOLs
|
Net Operating Losses
|
|
|
November 2015 Drop Down Assets
|
75% of the Class B interests of NRG Wind TE Holdco, which owns a portfolio of 12 wind facilities totaling 814 net MW
|
|
|
NRG
|
NRG Energy, Inc.
|
|
|
NRG Wind TE Holdco
|
NRG Wind TE Holdco LLC
|
|
|
NRG Yield LLC
|
The holding company through which the projects are owned by NRG, the holder of Class B and Class D common units, and NRG Yield, Inc., the holder of the Class A and Class C common units
|
|
|
NRG Yield Operating LLC
|
The holder of the project assets that are owned by NRG Yield LLC
|
|
|
OCI/OCL
|
Other comprehensive income/loss
|
|
|
Pinnacle
|
Pinnacle Wind, LLC, the operating subsidiary of Tapestry Wind LLC, which owns the Pinnacle project
|
|
|
PPA
|
Power Purchase Agreement
|
|
|
PUCT
|
Public Utility Commission of Texas
|
|
|
PURPA
|
Public Utility Regulatory Policies Act of 1978
|
|
|
QF
|
Qualifying Facility under PURPA
|
|
|
ROFO Agreement
|
Amended and Restated Right of First Offer Agreement between the Company and NRG
|
|
|
RPV Holdco
|
NRG RPV Holdco 1 LLC
|
|
|
RTO
|
Regional Transmission Organization
|
|
|
SEC
|
U.S. Securities and Exchange Commission
|
|
|
Senior Notes
|
NRG Yield Operating LLC's $500 million of 5.375% unsecured senior notes due 2024
|
|
|
TA High Desert
|
TA-High Desert LLC, the operating subsidiary of NRG Solar Mayfair LLC, which owns the TA High Desert project
|
|
|
Taloga
|
Taloga Wind, LLC, the operating subsidiary of Tapestry Wind LLC, which owns the Taloga project
|
|
|
Tapestry
|
Collection of the Pinnacle, Buffalo Bear and Taloga projects
|
|
|
Thermal Business
|
The Company's thermal business, which consists of thermal infrastructure assets that provide steam, hot water and/or chilled water, and in some instances electricity, to commercial businesses, universities, hospitals and governmental units
|
|
|
U.S.
|
United States of America
|
|
|
U.S. GAAP
|
Accounting principles generally accepted in the U.S.
|
|
|
Utility Scale Solar
|
Solar power projects, typically 20 MW or greater in size (on an alternating current, or AC, basis), that are interconnected into the transmission or distribution grid to sell power at a wholesale level
|
|
|
VaR
|
Value at Risk
|
|
|
VIE
|
Variable Interest Entity
|
|
|
Walnut Creek
|
NRG Walnut Creek, LLC, the operating subsidiary of WCEP Holdings, LLC, which owns the Walnut Creek project
|
|
5
NRG YIELD, INC.
CONSOLIDATED STATEMENTS OF INCOME
|
Three months ended September 30,
|
Nine months ended September 30,
|
||||||||||||||
|
(In millions, except per share amounts)
|
2015
|
2014
(a)
|
2015
|
2014
(a)
|
|||||||||||
|
Operating Revenues
|
|||||||||||||||
|
Total operating revenues
|
$
|
209
|
|
$
|
184
|
|
$
|
606
|
|
$
|
497
|
|
|||
|
Operating Costs and Expenses
|
|||||||||||||||
|
Cost of operations
|
69
|
|
60
|
|
211
|
|
173
|
|
|||||||
|
Depreciation and amortization
|
50
|
|
34
|
|
163
|
|
112
|
|
|||||||
|
General and administrative — affiliate
|
3
|
|
3
|
|
9
|
|
7
|
|
|||||||
|
Acquisition-related transaction and integration costs
|
1
|
|
2
|
|
2
|
|
2
|
|
|||||||
|
Total operating costs and expenses
|
123
|
|
99
|
|
385
|
|
294
|
|
|||||||
|
Operating Income
|
86
|
|
85
|
|
221
|
|
203
|
|
|||||||
|
Other Income (Expense)
|
|||||||||||||||
|
Equity in earnings of unconsolidated affiliates
|
19
|
|
11
|
|
29
|
|
26
|
|
|||||||
|
Other income, net
|
1
|
|
1
|
|
2
|
|
2
|
|
|||||||
|
Loss on debt extinguishment
|
(2
|
)
|
—
|
|
(9
|
)
|
—
|
|
|||||||
|
Interest expense
|
(62
|
)
|
(48
|
)
|
(176
|
)
|
(109
|
)
|
|||||||
|
Total other expense, net
|
(44
|
)
|
(36
|
)
|
(154
|
)
|
(81
|
)
|
|||||||
|
Income Before Income Taxes
|
42
|
|
49
|
|
67
|
|
122
|
|
|||||||
|
Income tax expense
|
8
|
|
10
|
|
8
|
|
15
|
|
|||||||
|
Net Income
|
34
|
|
39
|
|
59
|
|
107
|
|
|||||||
|
Less: Pre-acquisition net income of Drop Down Assets
|
—
|
|
8
|
|
—
|
|
33
|
|
|||||||
|
Net Income Excluding Pre-acquisition Net Income of Drop Down Assets
|
34
|
|
31
|
|
59
|
|
74
|
|
|||||||
|
Less: Net income attributable to noncontrolling interests
|
17
|
|
25
|
|
37
|
|
58
|
|
|||||||
|
Net Income Attributable to NRG Yield, Inc.
|
$
|
17
|
|
$
|
6
|
|
$
|
22
|
|
$
|
16
|
|
|||
|
Earnings Per Share Attributable to NRG Yield, Inc. Class A and Class C Common Stockholders
|
|||||||||||||||
|
Weighted average number of Class A common shares outstanding - basic and diluted
|
35
|
|
31
|
|
35
|
|
25
|
|
|||||||
|
Weighted average number of Class C common shares outstanding - basic and diluted
|
63
|
|
31
|
|
44
|
|
25
|
|
|||||||
|
Earnings per Weighted Average Class A and Class C Common Share - Basic and Diluted
|
0.18
|
|
0.10
|
|
0.28
|
|
0.31
|
|
|||||||
|
Dividends Per Class A Common Share
|
$
|
0.21
|
|
$
|
0.365
|
|
$
|
0.80
|
|
$
|
1.045
|
|
|||
|
Dividends Per Class C Common Share
|
$
|
0.21
|
|
N/A
|
|
$
|
0.41
|
|
N/A
|
|
|||||
(a)
Retrospectively adjusted as discussed in Note 1,
Nature of Business
.
See accompanying notes to consolidated financial statements.
6
NRG YIELD, INC.
CONSOLIDATED STATEMENTS OF COMPREHENSIVE INCOME (LOSS)
|
Three months ended September 30,
|
Nine months ended September 30,
|
||||||||||||||
|
(In millions)
|
2015
|
2014
(a)
|
2015
|
2014
(a)
|
|||||||||||
|
Net Income
|
$
|
34
|
|
$
|
39
|
|
$
|
59
|
|
$
|
107
|
|
|||
|
Other Comprehensive Income (Loss), net of tax
|
|||||||||||||||
|
Unrealized (loss) gain on derivatives, net of income tax benefit of $9, $2, $13 and $2
|
(29
|
)
|
6
|
|
(25
|
)
|
(28
|
)
|
|||||||
|
Other comprehensive (loss) income
|
(29
|
)
|
6
|
|
(25
|
)
|
(28
|
)
|
|||||||
|
Comprehensive Income
|
5
|
|
45
|
|
34
|
|
79
|
|
|||||||
|
Less: Pre-acquisition net income of Drop Down Assets
|
—
|
|
8
|
|
—
|
|
33
|
|
|||||||
|
Less: Comprehensive income attributable to noncontrolling interests
|
4
|
|
29
|
|
35
|
|
37
|
|
|||||||
|
Comprehensive Income (Loss) Attributable to NRG Yield, Inc.
|
$
|
1
|
|
$
|
8
|
|
$
|
(1
|
)
|
$
|
9
|
|
|||
(a)
Retrospectively adjusted as discussed in Note 1,
Nature of Business
.
See accompanying notes to consolidated financial statements.
7
NRG YIELD, INC.
|
September 30, 2015
|
December 31, 2014
(a)
|
||||||
|
ASSETS
|
(In millions)
|
||||||
|
Current Assets
|
|
|
|||||
|
Cash and cash equivalents
|
$
|
125
|
|
$
|
406
|
|
|
|
Restricted cash
|
69
|
|
45
|
|
|||
|
Accounts receivable — trade
|
104
|
|
85
|
|
|||
|
Accounts receivable — affiliate
|
1
|
|
—
|
|
|||
|
Inventory
|
30
|
|
27
|
|
|||
|
Derivative instruments — affiliate
|
3
|
|
—
|
|
|||
|
Notes receivable
|
7
|
|
6
|
|
|||
|
Deferred income taxes
|
12
|
|
16
|
|
|||
|
Prepayments and other current assets
|
25
|
|
21
|
|
|||
|
Total current assets
|
376
|
|
606
|
|
|||
|
Property, plant and equipment
|
|||||||
|
In service
|
4,929
|
|
4,796
|
|
|||
|
Under construction
|
4
|
|
8
|
|
|||
|
Total property, plant and equipment
|
4,933
|
|
4,804
|
|
|||
|
Less accumulated depreciation
|
(499
|
)
|
(338
|
)
|
|||
|
Net property, plant and equipment
|
4,434
|
|
4,466
|
|
|||
|
Other Assets
|
|||||||
|
Equity investments in affiliates
|
553
|
|
227
|
|
|||
|
Notes receivable
|
11
|
|
15
|
|
|||
|
Intangible assets, net of accumulated amortization of $80 and $36
|
1,377
|
|
1,423
|
|
|||
|
Derivative instruments
|
—
|
|
2
|
|
|||
|
Deferred income taxes
|
124
|
|
118
|
|
|||
|
Other non-current assets
|
114
|
|
108
|
|
|||
|
Total other assets
|
2,179
|
|
1,893
|
|
|||
|
Total Assets
|
$
|
6,989
|
|
$
|
6,965
|
|
|
(a)
Retrospectively adjusted as discussed in Note 1,
Nature of Business
.
See accompanying notes to consolidated financial statements.
8
NRG YIELD, INC.
CONSOLIDATED BALANCE SHEETS (Continued)
|
September 30, 2015
|
December 31, 2014
(a)
|
||||||
|
LIABILITIES AND STOCKHOLDERS’ EQUITY
|
(In millions, except share information)
|
||||||
|
Current Liabilities
|
|
|
|||||
|
Current portion of long-term debt
|
$
|
224
|
|
$
|
214
|
|
|
|
Accounts payable — trade
|
22
|
|
20
|
|
|||
|
Accounts payable — affiliate
|
58
|
|
46
|
|
|||
|
Derivative instruments
|
42
|
|
48
|
|
|||
|
Accrued expenses and other current liabilities
|
79
|
|
61
|
|
|||
|
Total current liabilities
|
425
|
|
389
|
|
|||
|
Other Liabilities
|
|
|
|||||
|
Long-term debt
|
4,285
|
|
4,573
|
|
|||
|
Derivative instruments
|
74
|
|
69
|
|
|||
|
Other non-current liabilities
|
53
|
|
49
|
|
|||
|
Total non-current liabilities
|
4,412
|
|
4,691
|
|
|||
|
Total Liabilities
|
4,837
|
|
5,080
|
|
|||
|
Commitments and Contingencies
|
|
|
|
|
|||
|
Stockholders' Equity
|
|
|
|||||
|
Preferred stock, $0.01 par value; 10,000,000 shares authorized; none issued
|
—
|
|
—
|
|
|||
|
Class A, Class B, Class C and Class D common stock, $0.01 par value; 3,000,000,000 shares authorized (Class A 500,000,000, Class B 500,000,000, Class C 1,000,000,000, Class D 1,000,000,000); 182,848,000 shares issued and outstanding (Class A 34,586,250, Class B 42,738,750, Class C 62,784,250, Class D 42,738,750) and 154,650,000 shares issued and outstanding (Class A 34,586,250, Class B 42,738,750, Class C 34,586,250, Class D 42,738,750) at September 30, 2015 and December 31, 2014, respectively
|
1
|
|
—
|
|
|||
|
Additional paid-in capital
|
1,820
|
|
1,240
|
|
|||
|
Retained earnings
|
15
|
|
3
|
|
|||
|
Accumulated other comprehensive loss
|
(32
|
)
|
(9
|
)
|
|||
|
Noncontrolling interest
|
348
|
|
651
|
|
|||
|
Total Stockholders' Equity
|
2,152
|
|
1,885
|
|
|||
|
Total Liabilities and Stockholders' Equity
|
$
|
6,989
|
|
$
|
6,965
|
|
|
(a)
Retrospectively adjusted as discussed in
Note 1
,
Nature of Business
.
See accompanying notes to consolidated financial statements.
9
NRG YIELD, INC.
|
Nine months ended September 30,
|
|||||||
|
2015
|
2014
(a)
|
||||||
|
(In millions)
|
|||||||
|
Cash Flows from Operating Activities
|
|||||||
|
Net income
|
$
|
59
|
|
$
|
107
|
|
|
|
Adjustments to reconcile net income to net cash provided by operating activities:
|
|||||||
|
Distributions in excess of equity in earnings of unconsolidated affiliates
|
25
|
|
17
|
|
|||
|
Depreciation and amortization
|
163
|
|
112
|
|
|||
|
Amortization of financing costs and debt discount/premiums
|
11
|
|
8
|
|
|||
|
Amortization of intangibles and out-of-market contracts
|
41
|
|
21
|
|
|||
|
Adjustment for debt extinguishment
|
9
|
|
—
|
|
|||
|
Changes in deferred income taxes
|
8
|
|
15
|
|
|||
|
Changes in derivative instruments
|
(36
|
)
|
(14
|
)
|
|||
|
Changes in other working capital
|
(11
|
)
|
(17
|
)
|
|||
|
Net Cash Provided by Operating Activities
|
269
|
|
249
|
|
|||
|
Cash Flows from Investing Activities
|
|
|
|||||
|
Acquisition of businesses, net of cash acquired
|
(37
|
)
|
(901
|
)
|
|||
|
Acquisition of Drop Down Assets, net of cash acquired
|
(489
|
)
|
(336
|
)
|
|||
|
Capital expenditures
|
(16
|
)
|
(28
|
)
|
|||
|
(Increase) decrease in restricted cash
|
(24
|
)
|
20
|
|
|||
|
Decrease in notes receivable
|
5
|
|
6
|
|
|||
|
Proceeds from renewable energy grants
|
—
|
|
137
|
|
|||
|
Net investments in unconsolidated affiliates
|
(335
|
)
|
(17
|
)
|
|||
|
Other
|
—
|
|
11
|
|
|||
|
Net Cash Used in Investing Activities
|
(896
|
)
|
(1,108
|
)
|
|||
|
Cash Flows from Financing Activities
|
|||||||
|
Contributions from noncontrolling interests
|
119
|
|
—
|
|
|||
|
Capital contributions from NRG
|
—
|
|
2
|
|
|||
|
Distributions and return of capital to NRG
|
—
|
|
(45
|
)
|
|||
|
Proceeds from the issuance of common stock
|
599
|
|
630
|
|
|||
|
Payment of dividends and distributions to shareholders
|
(99
|
)
|
(72
|
)
|
|||
|
Proceeds from issuance of long-term debt
|
589
|
|
924
|
|
|||
|
Payment of debt issuance costs
|
(13
|
)
|
(26
|
)
|
|||
|
Payments for long-term debt
|
(849
|
)
|
(220
|
)
|
|||
|
Net Cash Provided by Financing Activities
|
346
|
|
1,193
|
|
|||
|
Net (Decrease) Increase in Cash and Cash Equivalents
|
(281
|
)
|
334
|
|
|||
|
Cash and Cash Equivalents at Beginning of Period
|
406
|
|
59
|
|
|||
|
Cash and Cash Equivalents at End of Period
|
$
|
125
|
|
$
|
393
|
|
|
(a)
Retrospectively adjusted as discussed in Note 1,
Nature of Business
.
See accompanying notes to consolidated financial statements.
10
NRG YIELD, INC.
NOTES TO CONSOLIDATED FINANCIAL STATEMENTS
Note 1
—
Nature of Business
NRG Yield, Inc., together with its consolidated subsidiaries, or the Company, is a dividend growth-oriented company formed as a Delaware corporation on December 20, 2012, to serve as the primary vehicle through which NRG owns, operates and acquires contracted renewable and conventional generation and thermal infrastructure assets. The Company owns
100%
of the Class A units and Class C units of NRG Yield LLC, including a controlling interest through its position as managing member. NRG Yield LLC, through its wholly owned subsidiary, NRG Yield Operating LLC, or Yield Operating, is the holder of a portfolio of renewable and conventional generation and thermal infrastructure assets, primarily located in the Northeast, Southwest and California regions of the U.S.
The Company consolidates the results of NRG Yield LLC through its controlling interest, with NRG's interest shown as noncontrolling interest in the financial statements. On May 14, 2015, the Company completed a stock split in connection with which each outstanding share of Class A common stock was split into one share of Class A common stock and one share of Class C common stock, and each outstanding share of Class B common stock was split into one share of Class B common stock and one share of Class D common stock. The stock split is referred to as the Recapitalization and all references to share or per share amounts in the accompanying consolidated financial statements and applicable disclosures have been retrospectively adjusted to reflect the Recapitalization. In addition, on June 29, 2015, NRG Yield, Inc. completed the issuance of
28,198,000
shares of Class C common stock for net proceeds of
$599 million
. See further discussion in Note 10,
Changes in Capital Structure
. The holders of the Company's outstanding shares of Class A and Class C common stock are entitled to dividends as declared. NRG receives its distributions from NRG Yield LLC through its ownership of NRG Yield LLC Class B and Class D units.
The following table represents the structure of the Company as of
September 30, 2015
:

11
As of
September 30, 2015
, the Company's operating assets are comprised of the following projects:
|
Projects
|
Percentage Ownership
|
Net Capacity (MW)
(a)
|
Offtake Counterparty
|
Expiration
|
||||||
|
Conventional
|
||||||||||
|
GenConn Middletown
(b)
|
50
|
%
|
95
|
|
Connecticut Light & Power
|
2041
|
||||
|
GenConn Devon
(b)
|
50
|
%
|
95
|
|
Connecticut Light & Power
|
2040
|
||||
|
Marsh Landing
|
100
|
%
|
720
|
|
Pacific Gas and Electric
|
2023
|
||||
|
El Segundo
|
100
|
%
|
550
|
|
Southern California Edison
|
2023
|
||||
|
Walnut Creek
|
100
|
%
|
485
|
|
Southern California Edison
|
2023
|
||||
|
1,945
|
|
|||||||||
|
Utility Scale Solar
|
||||||||||
|
Alpine
|
100
|
%
|
66
|
|
Pacific Gas and Electric
|
2033
|
||||
|
Avenal
(b)
|
50
|
%
|
23
|
|
Pacific Gas and Electric
|
2031
|
||||
|
Avra Valley
|
100
|
%
|
25
|
|
Tucson Electric Power
|
2032
|
||||
|
Blythe
|
100
|
%
|
21
|
|
Southern California Edison
|
2029
|
||||
|
Borrego
|
100
|
%
|
26
|
|
San Diego Gas and Electric
|
2038
|
||||
|
Roadrunner
|
100
|
%
|
20
|
|
El Paso Electric
|
2031
|
||||
|
CVSR
|
48.95
|
%
|
122
|
|
Pacific Gas and Electric
|
2038
|
||||
|
Kansas South
|
100
|
%
|
20
|
|
Pacific Gas and Electric
|
2033
|
||||
|
TA High Desert
|
100
|
%
|
20
|
|
Southern California Edison
|
2033
|
||||
|
Desert Sunlight 250
|
|
25
|
%
|
|
63
|
|
|
Southern California Edison
|
|
2035
|
|
Desert Sunlight 300
|
|
25
|
%
|
|
75
|
|
|
Pacific Gas and Electric
|
|
2040
|
|
481
|
|
|||||||||
|
Distributed Solar
|
||||||||||
|
AZ DG Solar Projects
|
100
|
%
|
5
|
|
Various
|
2025 - 2033
|
||||
|
PFMG DG Solar Projects
|
51
|
%
|
4
|
|
Various
|
2032
|
||||
|
9
|
|
|||||||||
|
Wind
|
||||||||||
|
Alta I
|
100
|
%
|
150
|
|
Southern California Edison
|
2035
|
||||
|
Alta II
|
100
|
%
|
150
|
|
Southern California Edison
|
2035
|
||||
|
Alta III
|
100
|
%
|
150
|
|
Southern California Edison
|
2035
|
||||
|
Alta IV
|
100
|
%
|
102
|
|
Southern California Edison
|
2035
|
||||
|
Alta V
|
100
|
%
|
168
|
|
Southern California Edison
|
2035
|
||||
|
Alta X
(c)(d)
|
100
|
%
|
137
|
|
Southern California Edison
|
2038
(c)
|
||||
|
Alta XI
(c)(d)
|
100
|
%
|
90
|
|
Southern California Edison
|
2038
(c)
|
||||
|
South Trent
|
100
|
%
|
101
|
|
AEP Energy Partners
|
2029
|
||||
|
Laredo Ridge
|
100
|
%
|
80
|
|
Nebraska Public Power District
|
2031
|
||||
|
Taloga
|
100
|
%
|
130
|
|
Oklahoma Gas & Electric
|
2031
|
||||
|
Pinnacle
|
100
|
%
|
55
|
|
Maryland Department of General Services and University System of Maryland
|
2031
|
||||
|
Buffalo Bear
|
100
|
%
|
19
|
|
Western Farmers Electric Co-operative
|
2033
|
||||
|
Spring Canyon II
(c)
|
|
90.1
|
%
|
|
31
|
|
|
Platte River Power Authority
|
|
2038
|
|
Spring Canyon III
(c)
|
|
90.1
|
%
|
|
26
|
|
|
Platte River Power Authority
|
|
2039
|
|
1,389
|
|
|||||||||
|
Thermal
|
||||||||||
|
Thermal equivalent MWt
(e)
|
100
|
%
|
1,310
|
|
Various
|
Various
|
||||
|
Thermal generation
|
100
|
%
|
124
|
|
Various
|
Various
|
||||
|
Total net capacity (excluding equivalent MWt)
(f)
|
3,948
|
|
||||||||
(a) Net capacity represents the maximum, or rated, generating capacity of the facility multiplied by the Company's percentage ownership in the facility as of
September 30, 2015
.
(b) On September 30, 2015, the Company acquired NRG's remaining 0.05% for an immaterial amount.
(c) Projects are part of tax equity arrangements, as further described in Note 2,
Summary of Significant Accounting Policies
.
(d) PPA begins on January 1, 2016.
(e) For thermal energy, net capacity represents MWt for steam or chilled water and excludes
134
MWt available under the right-to-use provisions contained in agreements between two of the Company's thermal facilities and certain of its customers.
(f) Total net capacity excludes capacity for RPV Holdco and DGPV Holdco, which are consolidated by NRG, as further described in Note 5,
Variable Interest Entities
.
12
Substantially all of the Company's generation assets are under long-term contractual arrangements for the output or capacity from these assets. The thermal assets are comprised of district energy systems and combined heat and power plants that produce steam, hot water and/or chilled water and in some instances, electricity at a central plant. Three of the district energy systems are subject to rate regulation by state public utility commissions while the other district energy systems have rates determined by negotiated bilateral contracts.
The Company entered into a management services agreement with NRG for various services, including human resources, accounting, tax, legal, information systems, treasury, and risk management. Costs incurred by the Company under this agreement were
$9 million
and
$7 million
for the
nine months
ended
September 30, 2015
, and
2014
, respectively, which included certain direct expenses incurred by NRG on behalf of the Company.
Stockholders' equity represents the equity associated with the Class A and Class C common stockholders, with the equity associated with the Class B and Class D common stockholder, or NRG, classified as noncontrolling interest.
As described in
Note 3
,
Business Acquisitions
, on January 2, 2015, the Company acquired the Laredo Ridge, Tapestry, and Walnut Creek projects, or the January 2015 Drop Down Assets, for total cash consideration of
$489 million
, including
$9 million
for working capital, plus assumed debt of
$737 million
. Additionally, on June 30, 2014, the Company acquired the TA High Desert, Kansas South, and El Segundo projects, or the June 2014 Drop Down Assets, from NRG for total cash consideration of
$357 million
plus assumed project level debt. These acquisitions were accounted for as transfers of entities under common control. The accounting guidance requires retrospective combination of the entities for all periods presented as if the combination has been in effect since the inception of common control. Accordingly, the Company prepared its consolidated financial statements to reflect the transfers as if they had taken place from the beginning of the financial statements period or from the date the entities were under common control (if later than the beginning of the financial statements period). The January 2015 Drop Down Assets are reflected as if the transfer took place on April 1, 2014, which represents the date these entities were acquired by NRG.
The accompanying unaudited interim consolidated financial statements have been prepared in accordance with the SEC’s regulations for interim financial information. Accordingly, they do not include all of the information and notes required by U.S. GAAP for complete financial statements. The following notes should be read in conjunction with the accounting policies and other disclosures as set forth in the notes to the Company’s annual financial statements for the year ended
December 31, 2014
. Interim results are not necessarily indicative of results for a full year.
In the opinion of management, the accompanying unaudited interim consolidated financial statements contain all material adjustments consisting of normal and recurring accruals necessary to present fairly the Company's consolidated financial position as of
September 30, 2015
, and the results of operations, comprehensive income and cash flows for the
nine months
ended
September 30, 2015
, and
2014
.
Note 2
—
Summary of Significant Accounting Policies
Use of Estimates
The preparation of consolidated financial statements in accordance with U.S. GAAP requires management to make estimates and assumptions. These estimates and assumptions impact the reported amount of assets and liabilities and disclosures of contingent assets and liabilities as of the date of the consolidated financial statements. They also impact the reported amount of net earnings during the reporting period. Actual results could be different from these estimates.
Tax Equity Arrangements
Certain portions of the Company’s noncontrolling interests in subsidiaries represent third-party interests in the net assets under certain tax equity arrangements, which are consolidated by the Company, that have been entered into to finance the cost of wind facilities eligible for certain tax credits. Additionally, certain portions of the Company’s investments in unconsolidated affiliates reflect the Company’s interests in tax equity arrangements, that are not consolidated by the Company, that have been entered into to finance the cost of solar energy systems under operating leases eligible for certain tax credits. The Company has determined that the provisions in the contractual agreements of these structures represent substantive profit sharing arrangements. Further, the Company has determined that the appropriate methodology for calculating the noncontrolling interest and investment in unconsolidated affiliates that reflects the substantive profit sharing arrangements is a balance sheet approach utilizing the hypothetical liquidation at book value, or HLBV, method. Under the HLBV method, the amounts reported as noncontrolling interests and investment in unconsolidated affiliates represent the amounts the investors to the tax equity arrangements would hypothetically receive at each balance sheet date under the liquidation provisions of the contractual agreements, assuming the net assets of the funding structures were liquidated at their recorded amounts determined in accordance with U.S. GAAP.
The
investors’ interests in the results of operations of the funding structures are determined as the difference in noncontrolling interests and
13
investment in unconsolidated affiliates at the start and end of each reporting period, after taking into account any capital transactions between the structures and the funds’ investors. The calculations utilized to apply the HLBV method include estimated calculations of taxable income or losses for each reporting period.
Noncontrolling Interests
The following table reflects the changes in the Company's noncontrolling interest balance:
|
(In millions)
|
|||
|
Balance as of December 31, 2014
|
651
|
|
|
|
Payment to NRG for acquired January 2015 Drop Down Assets
|
(489
|
)
|
|
|
Contributions from noncontrolling interest for Alta Wind X-X1 TE Holdco
|
119
|
|
|
|
Noncontrolling interest acquired in Spring Canyon acquisition
|
74
|
|
|
|
Comprehensive income
|
35
|
|
|
|
Non-cash contributions
|
10
|
|
|
|
Cash distributions to NRG
|
(52
|
)
|
|
|
Balance as of September 30, 2015
|
$
|
348
|
|
On June 30, 2015, the Company sold an economic interest in Alta Wind X-XI TE Holdco, holder of the Alta Wind X and Alta Wind XI projects, to a financial institution in order to monetize cash and tax attributes, primarily production tax credits. The net proceeds of
$119 million
are reflected as noncontrolling interest in the Company's balance sheet.
As described in Note 3,
Business Acquisitions
, the Company acquired Spring Canyon on May 7, 2015. The Company owns
90.1%
of the Class B shares of Spring Canyon. The seller, Invenergy, owns the remaining
9.9%
of the Class B shares and the Class A shares are owned by a tax equity investor. The interests of Invenergy and the tax equity investor of
$74 million
are shown as noncontrolling interests.
On January 2, 2015, the Company acquired the January 2015 Drop Down Assets, as discussed in
Note 3
,
Business Acquisitions
. The difference between the cash paid of
$489 million
and the historical value of the entities' net assets of
$61 million
, as well as
$23 million
of AOCL, was recorded as a distribution to NRG and reduced the balance of its noncontrolling interest. In addition, as the January 2015 Drop Down Assets were owned by NRG until January 2, 2015, the pre-acquisition earnings of such projects are recorded as attributable to NRG's noncontrolling interest.
Distributions
The following table lists the distributions paid on NRG Yield LLC's Class B and D units during the
nine months
ended
September 30, 2015
:
|
Third Quarter 2015
|
Second Quarter 2015
|
First Quarter 2015
|
|||||||||
|
Distributions per Class B
|
$
|
0.21
|
|
$
|
0.20
|
|
$
|
0.39
|
|
||
|
Distributions per Class D
|
$
|
0.21
|
|
$
|
0.20
|
|
N/A
|
|
|||
On
November 4, 2015
, NRG Yield LLC announced the declaration of a distribution on its units of
$0.215
per unit payable on
December 15, 2015
to unit holders of record as of
December 1, 2015
. The portion of the distributions paid by NRG Yield LLC to NRG is recorded as a reduction to the Company's noncontrolling interest balance.
Recent Accounting Developments
ASU 2015-16
— In September 2015, the FASB issued ASU No. 2015-16,
Business Combinations (Topic 805): Simplifying the Accounting for Measurement-Period Adjustments
, or ASU No. 2015-16. The amendments of ASU No. 2015-16 require that an acquirer recognize measurement period adjustments to the provisional amounts recognized in a business combination in the reporting period during which the adjustments are determined. Additionally, the amendments of ASU No. 2015-16 require the acquirer to record in the same period's financial statements the effect on earnings of changes in depreciation, amortization or other income effects, if any, as a result of the measurement period adjustment, calculated as if the accounting had been completed at the acquisition date as well as disclosing on either the face of the income statement or in the notes the portion of the amount recorded in current period earnings that would have been recorded in previous reporting periods. The guidance in ASU No. 2015-16 is effective for financial statements issued for fiscal years beginning after December 15, 2015, and interim periods within those fiscal years. The amendments should be applied prospectively. The adoption of this standard is not expected to have a material impact on the Company's results of operations, cash flows or financial position.
14
ASU 2015-03 and ASU 2015-15
— In April 2015, the FASB issued ASU No. 2015-03,
Interest - Imputation of Interest (Subtopic 835-30): Simplifying the Presentation of Debt Issuance Costs
, or ASU No. 2015-03. The amendments of ASU No. 2015-03 were issued to reduce complexity in the balance sheet presentation of debt issuance costs. ASU No. 2015-03 requires that debt issuance costs be presented in the balance sheet as a direct deduction from the carrying amount of debt liability, consistent with debt discounts or premiums. The recognition and measurement guidance for debt issuance costs are not affected by the amendments in this standard. Additionally, in August 2015, the FASB issued ASU No. 2015-15,
Interest - Imputation of Interest (Subtopic 835-30): Presentation and Subsequent Measurement of Debt Issuance Costs Associated with Line-of-Credit Arrangements,
or ASU No. 2015-15, as ASU No. 2015-03 did not specifically address presentation or subsequent measurement of debt issuance costs related to line-of-credit arrangements. ASU No. 2015-15 allows an entity to continue to defer and present debt issuance costs ratably over the term of the line-of-credit arrangement, regardless of whether there are any outstanding borrowings on the line-of-credit arrangement. The guidance in ASU No. 2015-03 and ASU No. 2015-15 is effective for financial statements issued for fiscal years beginning after December 15, 2015, and interim periods within those fiscal years. Early adoption is permitted for financial statements that have not been previously issued. Had the Company adopted this guidance early, other assets would have been lower by $
65 million
and $
67 million
with corresponding decreases in debt as of
September 30, 2015
, and
December 31, 2014
, respectively. The adoption of this standard will have no impact on the Company's results of operations, cash flows or net assets.
ASU 2015-02
— In February 2015, the FASB issued ASU No. 2015-02,
Consolidation (Topic 810): Amendments to the Consolidation Analysis
, or ASU No. 2015-02. The amendments of ASU No. 2015-02 were issued in an effort to minimize situations under previously existing guidance in which a reporting entity was required to consolidate another legal entity in which that reporting entity did not have: (1) the ability through contractual rights to act primarily on its own behalf; (2) ownership of the majority of the legal entity's voting rights; or (3) the exposure to a majority of the legal entity's economic benefits. ASU No. 2015-02 affects reporting entities that are required to evaluate whether they should consolidate certain legal entities. All legal entities are subject to reevaluation under the revised consolidation model. The guidance in ASU No. 2015-02 is effective for periods beginning after December 15, 2015. Early adoption is permitted. The Company adopted the standard effective January 1, 2015 and the adoption of this standard did not impact the Company's results of operations, cash flows or financial position.
ASU 2014-16
— In November 2014, the FASB issued ASU No. 2014-16,
Derivatives and Hedging (Topic 815): Determining Whether the Host Contract in a Hybrid Financial Instrument Issued in the Form of a Share Is More Akin to Debt or to Equity
, or ASU No. 2014-16. The amendments of ASU No. 2014-16 clarify how U.S. GAAP should be applied in determining whether the nature of a host contract is more akin to debt or equity and in evaluating whether the economic characteristics and risks of an embedded feature are "clearly and closely related" to its host contract. The guidance in ASU No. 2014-16 is effective for fiscal years, and interim periods within those fiscal years, beginning after December 15, 2015. Early adoption is permitted. The Company adopted the standard effective January 1, 2015 and the adoption of this standard did not impact the Company's results of operations, cash flows or financial position.
ASU 2014-09
— In May 2014, the FASB issued ASU No. 2014-09,
Revenue from Contracts with Customers
(Topic 606), or ASU No. 2014-09. The amendments of ASU No. 2014-09 complete the joint effort between the FASB and the International Accounting Standards Board, or IASB, to develop a common revenue standard for U.S. GAAP and International Financial Reporting Standards, or IFRS, and to improve financial reporting. The guidance in ASU No. 2014-09 provides that an entity should recognize revenue to depict the transfer of goods or services to customers in an amount that reflects the consideration to which the entity expects to be entitled to in exchange for the goods or services provided and establishes the following steps to be applied by an entity: (1) identify the contract with a customer; (2) identify the performance obligations in the contract; (3) determine the transaction price; (4) allocate the transaction price to the performance obligations in the contract; and (5) recognize revenue when (or as) the entity satisfies the performance obligation. In August 2015, the FASB issued ASU 2015-14, which formally deferred the effective date by one year to make the guidance of ASU No. 2014-09 effective for annual reporting periods beginning after December 15, 2017, including interim periods therein. Early adoption is permitted, but not prior to the original effective date, which was for annual reporting periods beginning after December 15, 2016. The Company is currently evaluating the impact of the standard on the Company's results of operations, cash flows and financial position.
15
Note 3
—
Business Acquisitions
2015 Acquisitions
November 2015 Drop Down Assets from NRG
On November 3, 2015, the Company acquired
75%
of the Class B interests of NRG Wind TE Holdco, or the November 2015 Drop Down Assets, which owns a portfolio of
12
wind facilities totaling
814
net MW, from NRG for total cash consideration of
$210 million
, subject to working capital adjustments. The Company will be responsible for its pro-rata share of non-recourse project debt of
$193 million
and noncontrolling interest associated with a tax equity structure of
$165 million
(as of September 30, 2015).
The Company funded the acquisition with borrowings from the revolving credit facility. The assets and liabilities transferred to the Company relate to interests under common control by NRG and were recorded at historical cost in accordance with ASC 805-50,
Business Combinations - Related Issues
. The difference between the cash paid and historical value of the entities' equity was recorded as a distribution to NRG and reduced the balance of its noncontrolling interest. Because the transaction constituted a transfer of net assets under common control, the guidance requires retrospective combination of the entities for all periods presented as if the combination has been in effect since the inception of common control.
The Class A interests of NRG Wind TE Holdco are owned by a tax equity investor, or Investor, who receives
99%
of allocations of taxable income and other items until the flip point, which occurs when the Investor obtains a specified return on its initial investment, at which time the allocations to the Investor change to
8.53%
. The Company generally receives
75%
of cash available for distribution until the flip point, at which time the allocations to the Company of cash available for distribution change to
68.60%
. If the flip point has not occurred by a specified date,
100%
of cash available for distribution is allocated to the Investor until the flip point occurs. NRG Wind TE Holdco is a VIE and the Company is the primary beneficiary, through its position as managing member, and consolidates NRG Wind TE Holdco.
The following is a summary of assets and liabilities transferred in connection with the acquisition as of
September 30, 2015
:
|
NRG Wind TE Holdco
|
|||
|
(In millions)
|
|||
|
Current assets
|
$
|
34
|
|
|
Property, plant and equipment
|
673
|
|
|
|
Non-current assets
|
179
|
|
|
|
Total assets
|
886
|
|
|
|
Debt
|
193
|
|
|
|
Other current and non-current liabilities
|
33
|
|
|
|
Total liabilities
|
226
|
|
|
|
Less: noncontrolling interest
|
$
|
289
|
|
|
Net assets acquired
|
$
|
371
|
|
Supplemental Pro Forma Information
As described above, the Company's acquisition of the November 2015 Drop Down Assets was accounted for as a transfer of entities under common control. The following unaudited supplemental pro forma information represents the results of operations as if the Company had acquired the November 2015 Drop Down Assets on January 1, 2014, including the impact of acquisition accounting with respect to NRG's acquisition of the projects. All net income or losses prior to the Company's acquisition of the projects is reflected as attributable to NRG and, accordingly, no pro forma impact to earnings per Class A and Class C common share was calculated.
|
For the three months ended
|
For the nine months ended
|
|||||||||||||||
|
(In millions)
|
September 30, 2015
|
September 30, 2014
|
September 30, 2015
|
September 30, 2014
|
||||||||||||
|
Operating revenues
|
$
|
225
|
|
$
|
200
|
|
$
|
660
|
|
$
|
561
|
|
||||
|
Net income
|
24
|
|
37
|
|
42
|
|
77
|
|
||||||||
16
Desert Sunlight
—
On June 29, 2015, the Company acquired
25%
of the membership interest in Desert Sunlight Investment Holdings, LLC, which owns
two
solar photovoltaic facilities that total
550
MW, located in Desert Center, California from EFS Desert Sun, LLC, an affiliate of GE Energy Financial Services for a purchase price of
$285 million
. Power generated by the facilities is sold to Southern California Edison and Pacific Gas and Electric under long-term PPAs with approximately
20 years
and
25 years
of remaining contract life, respectively. The Company accounts for its
25%
investment as an equity method investment.
Spring Canyon
—
On May 7, 2015, the Company acquired a
90.1%
interest in Spring Canyon II, a
34
MW wind facility, and Spring Canyon III, a
29
MW wind facility, each located in Logan County, Colorado, from Invenergy Wind Global LLC. The purchase price was funded with cash on hand. Power generated by Spring Canyon II and Spring Canyon III is sold to Platte River Power Authority under long-term PPAs with approximately
24 years
of remaining contract life.
University of Bridgeport Fuel Cell
—
On April 30, 2015, the Company completed the acquisition of the University of Bridgeport Fuel Cell project in Bridgeport, Connecticut from FuelCell Energy, Inc. The project added an additional
1.4
MW of thermal capacity to the Company's portfolio, with a
12 years
contract, with the option for a 7-year extension. The acquisition is reflected in the Company's Thermal segment.
January 2015 Drop Down Assets from NRG
—
On January 2, 2015, the Company acquired the following projects from NRG: (i) Laredo Ridge, an
80
MW wind facility located in Petersburg, Nebraska, (ii) Tapestry, which includes Buffalo Bear, a
19
MW wind facility in Buffalo, Oklahoma; Taloga, a
130
MW wind facility in Putnum, Oklahoma; and Pinnacle, a
55
MW wind facility in Keyser, West Virginia, and (iii) Walnut Creek, a
485
MW natural gas facility located in City of Industry, California, for total cash consideration of
$489 million
, including
$9 million
for working capital, plus assumed project-level debt of
$737 million
. The Company funded the acquisition with cash on hand and drawings under its revolving credit facility. The assets and liabilities transferred to the Company relate to interests under common control by NRG and were recorded at historical cost in accordance with ASC 805-50,
Business Combinations - Related Issues
. The difference between the cash paid and the historical value of the entities' equity of
$61 million
, as well as
$23 million
of AOCL, was recorded as a distribution to NRG and reduced the balance of its noncontrolling interest. Since the transaction constituted a transfer of assets under common control, the guidance requires retrospective combination of the entities for all periods presented as if the combination has been in effect since the inception of common control. NRG acquired the majority of EME's assets, including Laredo Ridge, Tapestry and Walnut Creek, on April 1, 2014.
The following table presents the historical information summary combining the financial information for the January 2015 Drop Down Assets transferred in connection with the acquisition:
|
December 31, 2014
|
|||||||||||||||||||
|
As Previously Reported
|
Walnut Creek
|
Tapestry
|
Laredo Ridge
|
As Currently Reported
|
|||||||||||||||
|
(In millions)
|
|||||||||||||||||||
|
Current assets
|
$
|
539
|
|
$
|
46
|
|
$
|
14
|
|
$
|
7
|
|
$
|
606
|
|
||||
|
Property, plant and equipment
|
3,487
|
|
575
|
|
286
|
|
118
|
|
4,466
|
|
|||||||||
|
Non-current assets
|
1,726
|
|
57
|
|
61
|
|
49
|
|
1,893
|
|
|||||||||
|
Total assets
|
5,752
|
|
678
|
|
361
|
|
174
|
|
6,965
|
|
|||||||||
|
Debt
|
4,050
|
|
437
|
|
192
|
|
108
|
|
4,787
|
|
|||||||||
|
Other current and non-current liabilities
|
222
|
|
62
|
|
5
|
|
4
|
|
293
|
|
|||||||||
|
Total liabilities
|
4,272
|
|
499
|
|
197
|
|
112
|
|
5,080
|
|
|||||||||
|
Net assets
|
$
|
1,480
|
|
$
|
179
|
|
$
|
164
|
|
$
|
62
|
|
$
|
1,885
|
|
||||
17
Supplemental Pro Forma Information
As described above, the Company's acquisition of the January 2015 Drop Down Assets was accounted for as a transfer of entities under common control and all periods were retrospectively adjusted to reflect the entities as if they were transferred on the date the entities were under common control, which was April 1, 2014, the date NRG acquired Walnut Creek, Laredo Ridge and Tapestry. The following unaudited supplemental pro forma information represents the results of operations as if the Company had acquired the January 2015 Drop Down Assets on January 1, 2014, including the impact of acquisition accounting with respect to NRG's acquisition of the projects. While the financial statements have been retrospectively adjusted, all net income or losses prior to the Company's acquisition of the projects is reflected as attributable to NRG and accordingly, no pro forma impact to earnings per Class A and Class C common share was calculated.
|
For the nine months ended
|
||||
|
(In millions)
|
September 30, 2014
|
|||
|
Operating revenues
|
$
|
523
|
|
|
|
Net income
|
104
|
|
||
Since the acquisition date, the January 2015 Drop Down Assets contributed
$106 million
in operating revenues and
$31 million
in net income.
2014 Acquisitions
Alta Wind Portfolio Acquisition
—
On
August 12, 2014, the Company acquired
100%
of the membership interests of Alta Wind Asset Management Holdings, LLC, Alta Wind Company, LLC, Alta Wind X Holding Company, LLC and Alta Wind XI Holding Company, LLC, which collectively own
seven
wind facilities that total
947
MW located in Tehachapi, California and a portfolio of associated land leases, or the Alta Wind Portfolio. Power generated by the Alta Wind Portfolio is sold to Southern California Edison under long-term PPAs, with
21 years
of remaining contract life for Alta Wind I-V. The Alta Wind X and XI PPAs begin in 2016 with a term of
22 years
and currently sell energy and renewable energy credits on a merchant basis.
The purchase price for the Alta Wind Portfolio was
$923 million
, which consisted of a base purchase price of
$870 million
, as well as a payment for working capital of
$53 million
, plus the assumption of
$1.6 billion
of non-recourse project-level debt. In order to fund the purchase price, NRG Yield, Inc. completed an equity offering of
12,075,000
shares of its Class A common stock at an offering price of
$54.00
per share on July 29, 2014, which resulted in net proceeds of
$630 million
, after underwriting discounts and expenses. In addition, on August 5, 2014, NRG Yield Operating LLC issued
$500 million
of Senior Notes, which bear interest at a rate of
5.375%
and mature in August 2024.
The acquisition was recorded as a business combination under ASC 805-50, with identifiable assets acquired and liabilities assumed provisionally recorded at their estimated fair values on the acquisition date. The accounting for the business combination was completed as of August 11, 2015, at which point the fair values became final. The following table summarizes the provisional amounts recognized for assets acquired and liabilities assumed as of December 31, 2014, as well as adjustments made through August 11, 2015, when the allocation became final.
18
The purchase price of
$923 million
was allocated as follows:
|
Acquisition Date Fair Value at December 31, 2014
|
Measurement period adjustments
|
Revised Acquisition Date
|
||||||||||
|
(In millions)
|
||||||||||||
|
Assets
|
||||||||||||
|
Cash
|
$
|
22
|
|
$
|
—
|
|
$
|
22
|
|
|||
|
Current and non-current assets
|
49
|
|
(2
|
)
|
47
|
|
||||||
|
Property, plant and equipment
|
1,304
|
|
6
|
|
1,310
|
|
||||||
|
Intangible assets
|
1,177
|
|
(6
|
)
|
1,171
|
|
||||||
|
Total assets acquired
|
2,552
|
|
(2
|
)
|
2,550
|
|
||||||
|
Liabilities
|
||||||||||||
|
Debt
|
1,591
|
|
—
|
|
1,591
|
|
||||||
|
Current and non-current liabilities
|
38
|
|
(2
|
)
|
36
|
|
||||||
|
Total liabilities assumed
|
1,629
|
|
(2
|
)
|
1,627
|
|
||||||
|
Net assets acquired
|
$
|
923
|
|
$
|
—
|
|
$
|
923
|
|
|||
Fair value measurements
The fair values of the property, plant and equipment and intangible assets were measured primarily based on significant inputs that are not observable in the market and thus represent a Level 3 measurement as defined in ASC 820. Significant inputs were as follows:
|
•
|
Property, plant and equipment
—
The fair values were determined primarily based on an income method using discounted cash flows and validated using a cost approach based on the replacement cost of the assets less economic obsolescence. The income approach was applied by determining the enterprise value for each acquired entity and subtracting the fair value of the intangible assets and working capital to determine the implied value of the tangible fixed assets. This methodology was primarily relied upon as the forecasted cash flows incorporate the specific attributes of each asset including age, useful life, equipment condition and technology. The income approach also allows for an accurate reflection of current and expected market dynamics such as supply and demand and regulatory environment as of the acquisition date.
|
|
•
|
Intangible Assets - PPAs
—
The fair values of the PPAs acquired were determined utilizing a variation of the income approach where the incremental future cash flows resulting from the acquired PPAs compared to the cash flows based on current market prices were discounted to present value at a weighted average cost of capital reflective of a market participant. The values were corroborated with available market data. The PPA values will be amortized over the term of the PPAs, which approximate
22 years
.
|
|
•
|
Intangible Assets - Leasehold rights
—
The fair values of the leasehold rights acquired, which represent the contractual right to receive royalty payments equal to a percentage of PPA revenue from certain projects, were determined utilizing the income approach. The values were corroborated with available market data. The leasehold rights values will be amortized over a period of
21 years
, which is equal to the average term of the contracts.
|
June 2014 Drop Down Assets
—
On June 30, 2014, the Company acquired from NRG: (i) El Segundo, a
550
MW fast-start, gas-fired facility located in Los Angeles County, California; (ii) TA High Desert, a
20
MW solar facility located in Los Angeles County, California; and (iii) Kansas South, a
20
MW solar facility located in Kings County, California. The Company paid total cash consideration of
$357 million
, which represents a base purchase price of
$349 million
and
$8 million
of working capital adjustments. In addition, the acquisition included the assumption of
$612 million
of project-level debt. The assets and liabilities transferred to the Company relate to interests under common control by NRG and were recorded at historical cost in accordance with ASC 805-50. The difference between the cash proceeds and the historical value of the net assets was recorded as a distribution to NRG and reduced the balance of its noncontrolling interest. Since the transaction constituted a transfer of entities under common control, the guidance requires retrospective combination of the entities for all periods presented as if the combination has been in effect since the inception of common control. Accordingly, the Company prepared its consolidated financial statements to reflect the transfer as if it had taken place from the beginning of the financial statements period.
19
Note 4
—
Property, Plant and Equipment
The Company’s major classes of property, plant, and equipment were as follows:
|
September 30, 2015
|
December 31, 2014
|
Depreciable Lives
|
|||||||
|
(In millions)
|
|||||||||
|
Facilities and equipment
|
$
|
4,837
|
|
$
|
4,709
|
|
2 - 40 Years
|
||
|
Land and improvements
|
92
|
|
87
|
|
|||||
|
Construction in progress
|
4
|
|
8
|
|
|||||
|
Total property, plant and equipment
|
4,933
|
|
4,804
|
|
|||||
|
Accumulated depreciation
|
(499
|
)
|
(338
|
)
|
|||||
|
Net property, plant and equipment
|
$
|
4,434
|
|
$
|
4,466
|
|
|||
Note 5
—
Variable Interest Entities, or VIEs
Entity that is Consolidated
Alta TE Holdco
—
On June 30, 2015, the Company sold an economic interest in Alta TE Holdco to a financial institution in order to monetize certain cash and tax attributes, primarily production tax credits. The financial institution, or Investor, receives
99%
of allocations of taxable income and other items until the flip point, which occurs when the Investor obtains a specified return on its initial investment, at which time the allocations to the Investor change to
5%
. The Company receives
100%
of cash available for distribution in the first year and subsequently receives
94.34%
until the flip point, at which time the allocations to the Company of cash available for distribution change to
97.12%
, unless the flip point has not occurred by a specified date, which would result in
100%
of cash available for distribution allocated to the Investor until the flip point occurs. Alta TE Holdco is a VIE and the Company is the primary beneficiary through its position as managing member, and therefore consolidates Alta TE Holdco. The net proceeds of
$119 million
are reflected as noncontrolling interest in the Company's balance sheet.
The summarized financial information for Alta TE Holdco consisted of the following:
|
(In millions)
|
September 30, 2015
|
||
|
Other current and non-current assets
|
$
|
20
|
|
|
Property, plant and equipment
|
490
|
|
|
|
Intangible assets
|
287
|
|
|
|
Total assets
|
797
|
|
|
|
Current and non-current liabilities
|
13
|
|
|
|
Total liabilities
|
13
|
|
|
|
Noncontrolling interest
|
124
|
|
|
|
Net assets less noncontrolling interests
|
$
|
660
|
|
Entities that are not Consolidated
The Company has interests in entities that are considered VIEs under ASC 810,
Consolidation
, but for which it is not considered the primary beneficiary. The Company accounts for its interests in these entities under the equity method of accounting.
NRG DGPV Holdco 1 LLC
—
On May 8, 2015, NRG Yield DGPV Holding LLC, a subsidiary of the Company and NRG Renew LLC, a subsidiary of NRG, entered into a partnership by forming NRG DGPV Holdco 1 LLC, or DGPV Holdco, the purpose of which is to own or purchase solar power generation projects and other ancillary related assets from NRG Renew LLC, via intermediate funds, including: (i) a tax equity-financed portfolio of
11
recently completed community solar projects representing approximately
11
MW with a weighted average remaining PPA term of
20 years
; and (ii) a tax equity-financed portfolio of approximately
29
commercial photovoltaic systems representing approximately
89
MW. The following illustrates the structure of DGPV Holdco:
20

As of September 30, 2015, the Company's investment in DGPV Holdco related to the recently completed community solar projects was
$17 million
. Additionally, as of September 30, 2015, the Company's investment related to the commercial photovoltaic systems was
$11 million
,
$9 million
of which remained payable at September 30, 2015. DGPV Holdco is considered a VIE under ASC 810, however the Company is not the primary beneficiary and will account for its investment under the equity method. The Company's maximum exposure to loss is limited to its equity investment, which was
$28 million
as of
September 30, 2015
.
NRG RPV Holdco 1 LLC
—
On April 9, 2015, NRG Yield RPV Holding LLC, a subsidiary of the Company and NRG Residential Solar Solutions LLC, a subsidiary of NRG, entered into a partnership by forming NRG RPV Holdco 1 LLC, or RPV Holdco, that will invest in and hold operating portfolios of residential solar assets developed by NRG Home Solar, a subsidiary of NRG, including: (i) an existing, unlevered portfolio of over
2,200
leases across nine states representing approximately
17
MW with a weighted average remaining lease term of approximately
17 years
; and (ii) a tax equity-financed portfolios of approximately
13,000
leases representing approximately
90
MW, with an average lease term for the existing and new leases of approximately
17
to
20 years
. The following illustrates the structure of RPV Holdco:
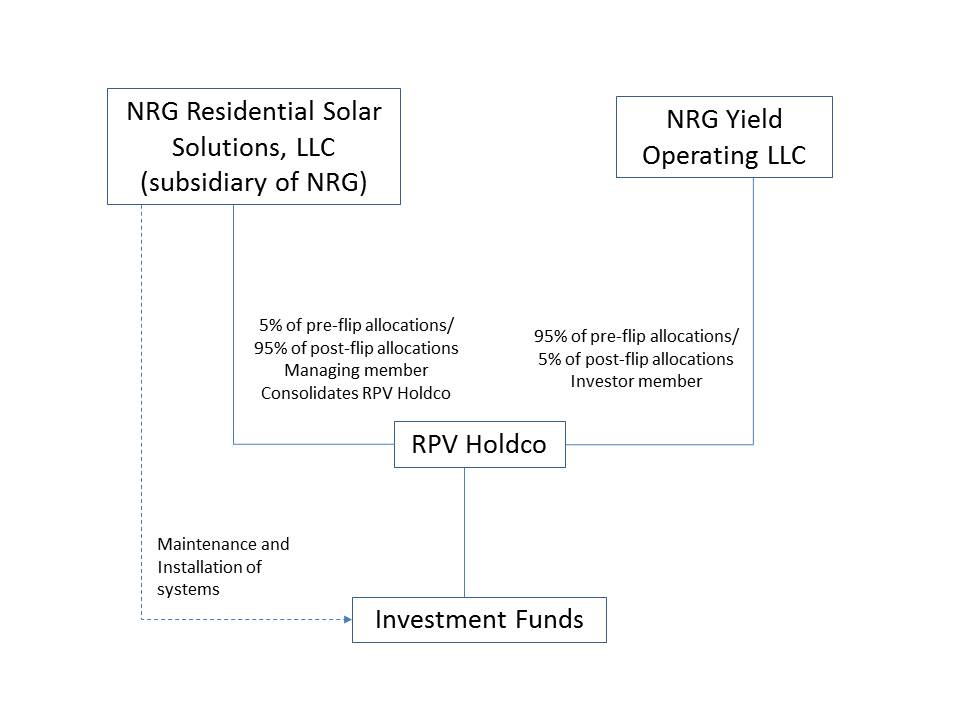
The Company invested
$26 million
in RPV Holdco in April 2015 related to the existing, unlevered portfolio of leases. The Company also invested
$21 million
of its
$150 million
commitment in the tax equity-financed portfolios through
September 30, 2015
. The Company's maximum exposure will be limited to its equity investment. RPV Holdco is considered a VIE under ASC 810, however the Company is not the primary beneficiary, and will account for its investment under the equity method. The Company's maximum exposure to loss is limited to its equity investment, which was
$47 million
as of
September 30, 2015
.
GenConn Energy LLC
—
The Company has a
50%
interest in GCE Holding LLC, the owner of GenConn, which owns and operates
two
190
MW peaking generation facilities in Connecticut at the Devon and Middletown sites. Each of these facilities was constructed pursuant to a 30-year cost of service type contract with the Connecticut Light & Power Company. GenConn is
21
considered a VIE under ASC 810, however the Company is not the primary beneficiary, and accounts for its investment under the equity method. Effective September 30, 2015, the Company increased its
49.95%
ownership by acquiring an additional
0.05%
membership interest from NRG, bringing its total ownership interest to
50%
.
The project was funded through equity contributions from the owners and non-recourse, project-level debt. As of
September 30, 2015
, the Company's investment in GenConn was
$110 million
and its maximum exposure to loss is limited to its equity investment. Additionally, GenConn has a
$237 million
project note with an interest rate of
4.73%
and a maturity date of July 2041, and a 5-year,
$35 million
working capital facility that matures in 2018, which can be used to issue letters of credit at an interest rate of
1.875%
per annum. As of
September 30, 2015
,
$220 million
was outstanding under the note and
nothing
was drawn on the working capital facility. The note is secured by all of the GenConn assets.
The following table presents summarized financial information for GCE Holding LLC:
|
Three months ended September 30,
|
Nine months ended September 30,
|
||||||||||||||
|
(In millions)
|
2015
|
2014
|
2015
|
2014
|
|||||||||||
|
Income Statement Data:
|
|||||||||||||||
|
Operating revenues
|
$
|
21
|
|
$
|
18
|
|
$
|
61
|
|
$
|
62
|
|
|||
|
Operating income
|
9
|
|
10
|
|
29
|
|
30
|
|
|||||||
|
Net income
|
$
|
6
|
|
$
|
7
|
|
$
|
20
|
|
$
|
21
|
|
|||
|
September 30, 2015
|
December 31, 2014
|
||||||
|
Balance Sheet Data:
|
(In millions)
|
||||||
|
Current assets
|
$
|
32
|
|
$
|
33
|
|
|
|
Non-current assets
|
420
|
|
438
|
|
|||
|
Current liabilities
|
16
|
|
20
|
|
|||
|
Non-current liabilities
|
$
|
216
|
|
$
|
223
|
|
|
Desert Sunlight Investment Holdings, LLC -
The Company has a
25%
membership interest in Desert Sunlight Investment Holdings, LLC, which owns
two
solar photovoltaic facilities that total
550
MW in Desert Center, California. Power generated by the facilities is sold to Southern California Edison and Pacific Gas and Electric under long-term PPAs with approximately
20 years
and
25 years
of contract life, respectively. Desert Sunlight is considered a VIE under ASC 810, however the Company is not the primary beneficiary, and accounts for its investment under the equity method.
As of
September 30, 2015
, the Company's investment in Desert Sunlight was
$281 million
and its maximum exposure to loss is limited to its equity investment.
The following tables present summarized financial information for Desert Sunlight Investment Holdings, LLC:
|
Three months ended September 30,
|
Nine months ended September 30,
|
||||||||||||||
|
(In millions)
|
2015
|
2014
|
2015
|
2014
|
|||||||||||
|
Income Statement Data:
|
|||||||||||||||
|
Operating revenues
|
$
|
73
|
|
$
|
48
|
|
$
|
170
|
|
$
|
102
|
|
|||
|
Operating income
|
51
|
|
33
|
|
108
|
|
58
|
|
|||||||
|
Net income
|
$
|
39
|
|
$
|
22
|
|
$
|
70
|
|
$
|
27
|
|
|||
|
September 30, 2015
|
December 31, 2014
|
||||||
|
Balance Sheet Data:
|
(In millions)
|
||||||
|
Current assets
|
$
|
381
|
|
$
|
706
|
|
|
|
Non-current assets
|
1,508
|
|
1,519
|
|
|||
|
Current liabilities
|
91
|
|
436
|
|
|||
|
Non-current liabilities
|
$
|
1,141
|
|
$
|
1,152
|
|
|
22
Note 6
—
Fair Value of Financial Instruments
For cash and cash equivalents, restricted cash, accounts receivable, accounts payable, accounts payable — affiliate, accrued expenses and other liabilities, the carrying amounts approximate fair value because of the short-term maturity of those instruments and are classified as Level 1 within the fair value hierarchy.
The estimated carrying amounts and fair values of the Company’s recorded financial instruments not carried at fair market value are as follows:
|
As of September 30, 2015
|
As of December 31, 2014
|
||||||||||||||
|
Carrying Amount
|
Fair Value
|
Carrying Amount
|
Fair Value
|
||||||||||||
|
(In millions)
|
|||||||||||||||
|
Assets:
|
|
|
|
|
|||||||||||
|
Notes receivable, including current portion
|
$
|
18
|
|
$
|
18
|
|
$
|
21
|
|
$
|
21
|
|
|||
|
Liabilities:
|
|||||||||||||||
|
Long-term debt, including current portion
|
$
|
4,509
|
|
$
|
4,406
|
|
$
|
4,787
|
|
$
|
4,873
|
|
|||
The fair value of notes receivable and long-term debt are based on expected future cash flows discounted at market interest rates, or current interest rates for similar instruments, and are classified as Level 3 within the fair value hierarchy.
Fair Value Accounting under ASC 820
ASC 820 establishes a fair value hierarchy that prioritizes the inputs to valuation techniques used to measure fair value into three levels as follows:
|
•
|
Level 1—quoted prices (unadjusted) in active markets for identical assets or liabilities that the Company has the ability to access as of the measurement date.
|
|
•
|
Level 2—inputs other than quoted prices included within Level 1 that are directly observable for the asset or liability or indirectly observable through corroboration with observable market data.
|
|
•
|
Level 3—unobservable inputs for the asset or liability only used when there is little, if any, market activity for the asset or liability at the measurement date.
|
In accordance with ASC 820, the Company determines the level in the fair value hierarchy within which each fair value measurement in its entirety falls, based on the lowest level input that is significant to the fair value measurement.
Recurring Fair Value Measurements
The Company records its derivative assets and liabilities at fair market value on its consolidated balance sheet. The following table presents assets and liabilities measured and recorded at fair value on the Company's consolidated balance sheets on a recurring basis and their level within the fair value hierarchy:
|
As of September 30, 2015
|
As of December 31, 2014
|
||||||||||
|
Fair Value
(a)
|
Fair Value
(a)
|
Fair Value
(b)
|
|||||||||
|
(In millions)
|
Level 1
|
Level 2
|
Level 2
|
||||||||
|
Derivative assets:
|
|||||||||||
|
Commodity contracts
|
$
|
—
|
|
$
|
3
|
|
$
|
—
|
|
||
|
Interest rate contracts
|
—
|
|
—
|
|
2
|
|
|||||
|
Total assets
|
—
|
|
3
|
|
2
|
|
|||||
|
Derivative liabilities:
|
|||||||||||
|
Commodity contracts
|
1
|
|
2
|
|
3
|
|
|||||
|
Interest rate contracts
|
—
|
|
113
|
|
114
|
|
|||||
|
Total liabilities
|
$
|
1
|
|
$
|
115
|
|
$
|
117
|
|
||
(a)
There were
no
assets or liabilities classified as Level 3 as of
September 30, 2015
.
(b)
There were
no
assets or liabilities classified as Level 1 or Level 3 as of
December 31, 2014
.
23
Derivative Fair Value Measurements
A portion of the Company's contracts are exchange-traded contracts with readily available quoted market prices. A majority of the Company's contracts are non-exchange-traded and valued using prices provided by external sources. For the Company’s energy markets, management receives quotes from multiple sources. To the extent that multiple quotes are received, the prices reflect the average of the bid-ask mid-point prices obtained from all sources believed to provide the most liquid market for the commodity. The remainder of the assets and liabilities represent contracts for which external sources or observable market quotes are not available. These contracts are valued using various valuation techniques including, but not limited to, internal models that apply fundamental analysis of the market and corroboration with similar markets. As of
September 30, 2015
, there were
no
contracts valued with prices provided by models and other valuation techniques.
The fair value of each contract is discounted using a risk free interest rate. In addition, a credit reserve is applied to reflect credit risk, which is calculated based on credit default swaps. To the extent that the net exposure is an asset, the Company uses the counterparty’s default swap rate. If the net exposure is a liability, the Company uses its default swap rate. The credit reserve is added to the discounted fair value to reflect the exit price that a market participant would be willing to receive to assume the liabilities or that a market participant would be willing to pay for the assets. As of
September 30, 2015
, the credit reserve resulted in a
$3 million
increase in fair value in OCI. It is possible that future market prices could vary from those used in recording assets and liabilities and such variations could be material.
Concentration of Credit Risk
In addition to the credit risk discussion as disclosed in
Note 2
,
Summary of Significant Accounting Policies
,
to the Company's audited consolidated financial statements included in the Company's 2014 Form 10-K
, the following item is a discussion of the concentration of credit risk for the Company's financial instruments. Credit risk relates to the risk of loss resulting from non-performance or non-payment by counterparties pursuant to the terms of their contractual obligations. The Company monitors and manages credit risk through credit policies that include: (i) an established credit approval process; (ii) daily monitoring of counterparties' credit limits; (iii) the use of credit mitigation measures such as margin, collateral, prepayment arrangements, or volumetric limits; (iv) the use of payment netting agreements; and (v) the use of master netting agreements that allow for the netting of positive and negative exposures of various contracts associated with a single counterparty. Risks surrounding counterparty performance and credit could ultimately impact the amount and timing of expected cash flows. The Company seeks to mitigate counterparty risk by having a diversified portfolio of counterparties.
Counterparty credit exposure includes credit risk exposure under certain long-term agreements, including solar and other PPAs. As external sources or observable market quotes are not available to estimate such exposure, the Company estimates the exposure related to these contracts based on various techniques including, but not limited to, internal models based on a fundamental analysis of the market and extrapolation of observable market data with similar characteristics. Based on these valuation techniques, as of
September 30, 2015
, credit risk exposure to these counterparties attributable to the Company's ownership interests was approximately
$2.9 billion
for the next
five years
. The majority of these power contracts are with utilities with strong credit quality and public utility commission or other regulatory support, as further described in
Note 11
,
Segment Reporting
,
to the Company's audited consolidated financial statements included in the Company's 2014 Form 10-K.
However, such regulated utility counterparties can be impacted by changes in government regulations, which the Company is unable to predict.
Note 7
—
Accounting for Derivative Instruments and Hedging Activities
This footnote should be read in conjunction with the complete description under Note 7,
Accounting for Derivative Instruments and Hedging Activities
,
to the Company's audited consolidated financial statements included in the Company's 2014 Form 10-K
.
Energy-Related Commodities
As of
September 30, 2015
, the Company had forward contracts with an NRG subsidiary, hedging the sale of power from the Alta X and Alta XI wind facilities, entered into in the first quarter of 2015 and extending through the end of 2015 and forward contracts for the purchase of fuel commodities relating to the forecasted usage of the Company’s district energy centers extending through 2017. At
September 30, 2015
, these contracts were not designated as cash flow or fair value hedges.
Interest Rate Swaps
As of
September 30, 2015
, the Company had interest rate derivative instruments on non-recourse debt extending through 2031, most of which are designated as cash flow hedges.
24
Volumetric Underlying Derivative Transactions
The following table summarizes the net notional volume buy/(sell) of the Company's open derivative transactions broken out by commodity as of
September 30, 2015
, and
December 31, 2014
.
|
Total Volume
|
|||||||||
|
September 30, 2015
|
December 31, 2014
|
||||||||
|
Commodity
|
Units
|
(In millions)
|
|||||||
|
Natural Gas
|
MMBtu
|
4
|
|
2
|
|
||||
|
Interest
|
Dollars
|
$
|
1,786
|
|
$
|
2,817
|
|
||
The decrease in the interest rate position is primarily the result of settling the Alta X and Alta XI interest rate swaps in connection with the repayment of the outstanding project-level debt during the second quarter of 2015, as further described in
Note 8
,
Long-term Debt
.
Fair Value of Derivative Instruments
The following table summarizes the fair value within the derivative instrument valuation on the balance sheet:
|
|
Fair Value
|
||||||||||||||
|
|
Derivative Assets
|
Derivative Liabilities
|
|||||||||||||
|
September 30, 2015
|
December 31, 2014
|
September 30, 2015
|
December 31, 2014
|
||||||||||||
|
(In millions)
|
|||||||||||||||
|
Derivatives Designated as Cash Flow Hedges:
|
|
|
|
|
|||||||||||
|
Interest rate contracts current
|
$
|
—
|
|
$
|
—
|
|
$
|
36
|
|
$
|
40
|
|
|||
|
Interest rate contracts long-term
|
—
|
|
2
|
|
67
|
|
49
|
|
|||||||
|
Total Derivatives Designated as Cash Flow Hedges
|
—
|
|
2
|
|
103
|
|
89
|
|
|||||||
|
Derivatives Not Designated as Cash Flow Hedges
:
|
|
|
|
|
|||||||||||
|
Interest rate contracts current
|
—
|
|
—
|
|
3
|
|
5
|
|
|||||||
|
Interest rate contracts long-term
|
—
|
|
—
|
|
7
|
|
20
|
|
|||||||
|
Commodity contracts current
|
3
|
|
—
|
|
3
|
|
3
|
|
|||||||
|
Total Derivatives Not Designated as Cash Flow Hedges
|
3
|
|
—
|
|
13
|
|
28
|
|
|||||||
|
Total Derivatives
|
$
|
3
|
|
$
|
2
|
|
$
|
116
|
|
$
|
117
|
|
|||
The Company has elected to present derivative assets and liabilities on the balance sheet on a trade-by-trade basis and does not offset amounts at the counterparty master agreement level. As of
September 30, 2015
, there was
no
outstanding collateral paid or received. The following table summarizes the offsetting of derivatives by counterparty master agreement level:
|
Gross Amounts Not Offset in the Statement of Financial Position
|
|||||||||||
|
As of September 30, 2015
|
Gross Amounts of Recognized Assets/Liabilities
|
Derivative Instruments
|
Net Amount
|
||||||||
|
Commodity contracts:
|
(In millions)
|
||||||||||
|
Derivative assets
|
$
|
3
|
|
$
|
(1
|
)
|
$
|
2
|
|
||
|
Derivative liabilities
|
(3
|
)
|
1
|
|
(2
|
)
|
|||||
|
Total commodity contracts
|
—
|
|
—
|
|
—
|
|
|||||
|
Interest rate contracts:
|
|||||||||||
|
Derivative liabilities
|
(113
|
)
|
—
|
|
(113
|
)
|
|||||
|
Total interest rate contracts
|
(113
|
)
|
—
|
|
(113
|
)
|
|||||
|
Total derivative instruments
|
$
|
(113
|
)
|
$
|
—
|
|
$
|
(113
|
)
|
||
25
|
Gross Amounts Not Offset in the Statement of Financial Position
|
|||||||||||
|
As of December 31, 2014
|
Gross Amounts of Recognized Assets/Liabilities
|
Derivative Instruments
|
Net Amount
|
||||||||
|
Commodity contracts:
|
(In millions)
|
||||||||||
|
Derivative liabilities
|
$
|
(3
|
)
|
$
|
—
|
|
$
|
(3
|
)
|
||
|
Total commodity contracts
|
(3
|
)
|
—
|
|
(3
|
)
|
|||||
|
Interest rate contracts:
|
|||||||||||
|
Derivative assets
|
2
|
|
(2
|
)
|
—
|
|
|||||
|
Derivative liabilities
|
(114
|
)
|
2
|
|
(112
|
)
|
|||||
|
Total interest rate contracts
|
(112
|
)
|
—
|
|
(112
|
)
|
|||||
|
Total derivative instruments
|
$
|
(115
|
)
|
$
|
—
|
|
$
|
(115
|
)
|
||
Accumulated Other Comprehensive Loss
The following table summarizes the effects on the Company’s accumulated OCL balance attributable to interest rate swaps designated as cash flow hedge derivatives, net of tax:
|
Three months ended September 30,
|
Nine months ended September 30,
|
||||||||||||||
|
2015
|
2014
|
2015
|
2014
|
||||||||||||
|
(In millions)
|
|||||||||||||||
|
Accumulated OCL beginning balance
|
$
|
(48
|
)
|
$
|
(34
|
)
|
$
|
(52
|
)
|
$
|
—
|
|
|||
|
Reclassified from accumulated OCL to income due to realization of previously deferred amounts
|
3
|
|
1
|
|
10
|
|
8
|
|
|||||||
|
Mark-to-market of cash flow hedge accounting contracts
|
(32
|
)
|
5
|
|
(35
|
)
|
(36
|
)
|
|||||||
|
Accumulated OCL ending balance, net of income tax benefit of $19, and $3, respectively
|
$
|
(77
|
)
|
$
|
(28
|
)
|
$
|
(77
|
)
|
$
|
(28
|
)
|
|||
|
Accumulated OCL attributable to NRG
|
(45
|
)
|
(22
|
)
|
(45
|
)
|
(22
|
)
|
|||||||
|
Accumulated OCL attributable to NRG Yield, Inc.
|
$
|
(32
|
)
|
$
|
(6
|
)
|
$
|
(32
|
)
|
$
|
(6
|
)
|
|||
|
Losses expected to be realized from OCL during the next 12 months, net of income tax benefit of $4
|
$
|
(14
|
)
|
$
|
(14
|
)
|
|||||||||
Amounts reclassified from accumulated OCL into income and amounts recognized in income from the ineffective portion of cash flow hedges are recorded to interest expense. There was
no
ineffectiveness for the three or
nine months
ended
September 30, 2015
, and
2014
.
The Company has interest rate derivative instruments that are not designated as cash flow hedges. The effect of interest rate hedges is recorded to interest expense. For the three months ended
September 30, 2015
, and
2014
, the impact to the consolidated statements of operations was a loss of
$6 million
and
$0 million
, respectively. For the
nine months
ended
September 30, 2015
, and
2014
, the impact to the consolidated statements of operations was a gain of
$13 million
and a loss of
$6 million
, respectively.
A portion of the Company’s derivative commodity contracts relates to its Thermal Business for the purchase of fuel commodities based on the forecasted usage of the thermal district energy centers. Realized gains and losses on these contracts are reflected in the fuel costs that are permitted to be billed to customers through the related customer contracts or tariffs and, accordingly, no gains or losses are reflected in the consolidated statements of operations for these contracts.
Commodity contracts also hedge the forecasted sale of power for the Alta X and Alta XI wind facilities until the start of the PPAs on January 1, 2016. The effect of these commodity hedges is recorded to operating revenues. For the three months ended
September 30, 2015
, the impact to the consolidated statements of operations was an unrealized loss of
$1 million
. For the
nine months
ended
September 30, 2015
, the impact to the consolidated statements of operations was an unrealized gain of
$2 million
.
See
Note 6
,
Fair Value of Financial Instruments
, for discussion regarding concentration of credit risk.
26
Note 8
—
Long-term Debt
This footnote should be read in conjunction with the complete description under Note 9,
Long-term Debt
,
to the Company's 2014 Form 10-K. Long-term debt consisted of the following:
|
September 30, 2015
|
December 31, 2014
|
September 30, 2015, interest rate %
(a)
|
|||||||
|
(In millions, except rates)
|
|||||||||
|
Senior Notes, due 2024
|
$
|
500
|
|
$
|
500
|
|
5.375
|
||
|
Convertible notes, due 2019
(b)
|
329
|
|
326
|
|
3.50
|
||||
|
NRG Yield LLC and NRG Yield Operating LLC Revolving Credit Facility, due 2019
(c)
|
92
|
|
—
|
|
L+2.75
|
||||
|
Convertible notes, due 2020
(d)
|
266
|
|
—
|
|
3.25
|
||||
|
Project-level debt:
|
|||||||||
|
Alta Wind I, lease financing arrangement, due 2034
|
255
|
|
261
|
|
7.015
|
||||
|
Alta Wind II, lease financing arrangement, due 2034
|
200
|
|
205
|
|
5.696
|
||||
|
Alta Wind III, lease financing arrangement, due 2034
|
208
|
|
212
|
|
6.067
|
||||
|
Alta Wind IV, lease financing arrangement, due 2034
|
135
|
|
138
|
|
5.938
|
||||
|
Alta Wind V, lease financing arrangement, due 2035
|
215
|
|
220
|
|
6.071
|
||||
|
Alta Wind X, due 2021
|
—
|
|
300
|
|
L+2.00
|
||||
|
Alta Wind XI, due 2021
|
—
|
|
191
|
|
L+2.00
|
||||
|
Alta Realty Investments, due 2031
|
33
|
|
34
|
|
7.00
|
||||
|
Alta Wind Asset Management, due 2031
|
19
|
|
20
|
|
L+2.375
|
||||
|
NRG West Holdings LLC, due 2023 (El Segundo Energy Center)
|
485
|
|
506
|
|
L+1.625 - L+2.25
|
||||
|
NRG Marsh Landing LLC, due 2017 and 2023
|
431
|
|
464
|
|
L+1.75 - L+1.875
|
||||
|
Walnut Creek Energy, due 2023
|
363
|
|
391
|
|
L+1.625
|
||||
|
Tapestry Wind LLC, due 2021
|
184
|
|
192
|
|
L+1.625
|
||||
|
NRG Solar Alpine LLC, due 2014 and 2022
|
156
|
|
163
|
|
L+1.75
|
||||
|
NRG Energy Center Minneapolis LLC, due 2017 and 2025
|
110
|
|
121
|
|
5.95 -7.25
|
||||
|
Laredo Ridge LLC, due 2028
|
105
|
|
108
|
|
L+1.875
|
||||
|
NRG Solar Borrego LLC, due 2025 and 2038
|
73
|
|
75
|
|
L+ 2.50/5.65
|
||||
|
South Trent Wind LLC, due 2020
|
62
|
|
65
|
|
L+1.625
|
||||
|
NRG Solar Avra Valley LLC, due 2031
|
61
|
|
63
|
|
L+1.75
|
||||
|
TA High Desert LLC, due 2020 and 2032
|
54
|
|
55
|
|
L+2.50/5.15
|
||||
|
WCEP Holdings LLC, due 2023
|
46
|
|
46
|
|
L+3.00
|
||||
|
NRG Roadrunner LLC, due 2031
|
40
|
|
42
|
|
L+1.625
|
||||
|
NRG Solar Kansas South LLC, due 2031
|
34
|
|
35
|
|
L+2.00
|
||||
|
NRG Solar Blythe LLC, due 2028
|
22
|
|
22
|
|
L+1.625
|
||||
|
PFMG and related subsidiaries financing agreement, due 2030
|
30
|
|
31
|
|
6.00
|
||||
|
NRG Energy Center Princeton LLC, due 2017
|
1
|
|
1
|
|
5.95
|
||||
|
Subtotal project-level debt:
|
3,322
|
|
3,961
|
|
|||||
|
Total debt
|
4,509
|
|
4,787
|
|
|||||
|
Less current maturities
|
224
|
|
214
|
|
|||||
|
Total long-term debt
|
$
|
4,285
|
|
$
|
4,573
|
|
|||
(a) As of
September 30, 2015
, L+ equals
3 month LIBOR
plus x%, except for the NRG Marsh Landing term loan, Walnut Creek term loan, and the Revolving Credit Facility where L+ equals
1 month LIBOR
plus x% and Kansas South where L+ equals
6 month LIBOR
plus x%.
(b) Net of discount of
$16 million
and
$19 million
as of
September 30, 2015
, and
December 31, 2014
, respectively.
(c) Applicable rate is determined by the Borrower Leverage Ratio, as defined in the credit agreement.
(d) Net of discount of
$22 million
as of
September 30, 2015
.
27
The financing arrangements listed above contain certain covenants, including financial covenants that the Company is required to comply with during the term of the respective arrangement. As of
September 30, 2015
, the Company was in compliance with all of the required covenants.
The discussion below lists changes to or additions of long-term debt for the
nine months
ended
September 30, 2015
.
Convertible Notes due 2019
In connection with the Recapitalization, the Company adjusted the conversion rate of its 2019 Convertible Notes. Effective on May 15, 2015, the conversion rate was adjusted to
42.9644
shares of Class A common stock per
$1,000
principal amount of 2019 Convertible Notes in accordance with the terms of the related indenture.
NRG Yield LLC and NRG Yield Operating LLC Revolving Credit Facility
On June 26, 2015, the Company amended the revolving credit facility to, among other things, increase the availability from
$450 million
to
$495 million
. As of
September 30, 2015
,
$92 million
of borrowings and
$25 million
of letters of credit were outstanding. On November 3, 2015, the Company borrowed
$209 million
from the revolving credit facility to finance the acquisition of the November 2015 Drop Down Assets, as discussed in
Note 3
,
Business Acquisitions
.
Convertible Senior Notes due 2020
On June 29, 2015, the Company closed on its offering of
$287.5 million
aggregate principal amount of
3.25%
Convertible Senior Notes due 2020, or the 2020 Convertible Notes. The 2020 Convertible Notes are convertible, under certain circumstances, into the Company’s Class C common stock, cash or a combination thereof at an initial conversion price of
$27.50
per Class C common share, which is equivalent to an initial conversion rate of approximately
36.3636
shares of Class C common stock per
$1,000
principal amount of notes. Interest on the 2020 Convertible Notes is payable semi-annually in arrears on June 1 and December 1 of each year, commencing on December 1, 2015. The 2020 Convertible Notes mature on June 1, 2020, unless earlier repurchased or converted in accordance with their terms. Prior to the close of business on the business day immediately preceding December 1, 2019, the 2020 Convertible Notes will be convertible only upon the occurrence of certain events and during certain periods, and thereafter, at any time until the close of business on the second scheduled trading day immediately preceding the maturity date.
The 2020 Convertible Notes are accounted for in accordance with ASC 470-20. Under ASC 470-20, issuers of convertible debt instruments that may be settled in cash upon conversion, including partial cash settlement, are required to separately account for the liability (debt) and equity (conversion option) components. The application of ACS 470-20 resulted in the recognition of
$23 million
as the value for the equity component with the offset to debt discount. The debt discount will be amortized to interest expense using the effective interest method over the term of the 2020 Convertible Notes.
Alta Wind X and Alta Wind XI Financing Due 2021
On June 30, 2015, the Company entered into a tax equity financing arrangement through which NRG Yield Operating received
$119 million
in net proceeds, as described in
Note 5
,
Variable Interest Entities, or VIEs
. These proceeds, as well as proceeds obtained from the June 29, 2015, common stock issuance, as described in
Note 10
,
Changes in Capital Structure
, and 2020 Convertible Notes issuance, as described above, were utilized to repay all of the outstanding project indebtedness associated with the Alta Wind X and Alta Wind XI wind facilities. The Company also settled interest rate swaps associated with the project level debt for the Alta Wind X and Alta Wind XI wind facilities at a value of
$17 million
.
Laredo Ridge
On July 27, 2010, Laredo Ridge entered into a credit agreement with a group of lenders for a
$75 million
construction loan that was convertible to a term loan upon completion of the project, a
$53 million
cash grant loan and a
$3 million
working capital loan facility. The project met the conditions to convert to a term loan on March 18, 2011. The cash grant loan was repaid in July 2011 with proceeds of the cash grant. The credit agreement also included a letter of credit facility on behalf of Laredo Ridge of up to
$9 million
. Laredo Ridge paid a fee equal to the applicable margin on issued letters of credit.
On December 17, 2014, Laredo Ridge amended the credit agreement to increase its term loan borrowings by an additional
$41 million
to reduce the working capital facility by
$1 million
, to increase the letter of credit facility by
$1 million
and to reduce the related interest rate to
LIBOR
plus
1.875%
through December 31, 2018,
LIBOR
plus
2.125%
from January 1, 2019 through December 31, 2023 and
LIBOR
plus
2.375%
from January 1, 2024 through the maturity date. The fee on the working capital facility was reduced to
0.5%
. In addition, the maturity date was extended to December 31, 2028. The proceeds were utilized to make a distribution of
$33 million
to NRG Wind LLC, an NRG subsidiary, with the remaining
$8 million
utilized to fund the costs of the amendment. As of
September 30, 2015
,
$105 million
was outstanding under the term loan,
nothing
was outstanding under the working capital facility, and
$10 million
of letters of credit in support of the project were issued.
28
In connection with the amendment to the credit agreement, Laredo Ridge entered into a series of fixed for floating interest rate swaps that would fix the interest rate for a minimum of
75%
of the outstanding notional amount. Laredo Ridge pays its counterparty the equivalent of a
2.31%
fixed interest payment on a predetermined notional value, and quarterly, Laredo Ridge will receive the equivalent of a floating interest payment based on the three-month LIBOR calculated on the same notional value through December 31, 2028. All interest rate swap payments by Laredo Ridge and its counterparties are made quarterly and LIBOR is determined in advance of each interest period.
Tapestry Wind LLC
On December 21, 2011, Tapestry Wind LLC entered into a credit agreement with a group of lenders for a
$214 million
term loan and an
$8 million
working capital loan facility. The term loan matures in December 2021. It is secured by Tapestry Wind LLC's interest in the Buffalo Bear, Taloga, and Pinnacle projects. The term loan amortizes based upon a predetermined schedule. The working capital facility is available to fund the operating needs of Tapestry Wind LLC. The commitment fee on this facility is
0.75%
. The credit agreement also includes a letter of credit facility on behalf of Tapestry Wind LLC of up to
$20 million
. Tapestry Wind LLC pays a fee equal to the applicable margin on issued letters of credit.
Under the terms of the agreement, Tapestry Wind LLC entered into a series of fixed for floating interest rate swaps that would fix the interest rate for a minimum of
90%
of the outstanding notional amount. Tapestry Wind LLC will pay its counterparty the equivalent of a
2.21%
fixed interest payment on a predetermined notional value, and quarterly, Tapestry Wind LLC will receive the equivalent of a floating interest payment based on a three-month LIBOR calculated on the same notional value through December 21, 2021. All interest rate swap payments by Tapestry Wind LLC and its counterparties are made quarterly and the LIBOR is determined in advance of each interest period. Swaps became effective December 30, 2011, and amortize in proportion to the term loan. At the same time Tapestry Wind LLC entered into a series of forward starting swaps to hedge the refinancing risk. The swaps are effective December 21, 2021. Tapestry Wind LLC will pay its counterparty the equivalent of a
3.57%
fixed interest payment on a predetermined notional value, and quarterly, Tapestry Wind LLC will receive the equivalent of a floating interest payment based on a three-month LIBOR calculated on the same notional value through December 21, 2029.
On November 12, 2014, Tapestry Wind LLC amended the credit agreement to reduce the related interest rate to
LIBOR
plus
1.625%
through December 20, 2018, and
LIBOR
plus
1.75%
from December 21, 2018, through the maturity date. As of
September 30, 2015
,
$184 million
was outstanding under the term loan,
nothing
was outstanding under the working capital facility and
$20 million
of letters of credit in support of the project were issued.
Walnut Creek
On July 27, 2011, Walnut Creek entered into a credit agreement with a group of lenders for a
$442 million
construction loan that was convertible to a term loan upon completion of the project, and a
$5 million
working capital loan facility. The project met the conditions to convert to a term loan on June 21, 2013, and matures in May 2023. The term loan amortizes based upon a predetermined schedule. The working capital facility is available to fund the operating needs of Walnut Creek. The commitment fee on this facility is
0.625%
. The Walnut Creek agreement also includes a letter of credit facility on behalf of Walnut Creek of up to
$117 million
. Walnut Creek pays a fee equal to the applicable margin on issued letters of credit.
Under the terms of the agreement, Walnut Creek entered into a series of fixed for floating interest rate swaps that would fix the interest rate for a minimum of
90%
of the outstanding notional amount. Walnut Creek will pay its counterparty the equivalent of a
3.54%
fixed interest payment on a predetermined notional value, and quarterly, Walnut Creek will receive the equivalent of a floating interest payment based on a three-month LIBOR calculated on the same notional value through May 31, 2023. All interest rate swap payments by Walnut Creek and its counterparties are made quarterly and the LIBOR is determined in advance of each interest period. Swaps became effective June 28, 2013, and amortize in proportion to the term loan.
On October 21, 2014, Walnut Creek amended the credit agreement to increase its term loan borrowings by an additional
$10 million
, and to reduce the related interest rate to
LIBOR
plus
1.625%
through September 30, 2018,
LIBOR
plus
1.75%
from October 1, 2018, through September 30, 2022, and
LIBOR
plus
1.875%
from October 1, 2022, through the maturity date. The fee on the working capital facility was reduced to
0.5%
. The proceeds were utilized to make a distribution of
$6 million
to WCEP Holdings LLC with the remaining
$4 million
utilized to fund the costs of the amendment. In addition, Walnut Creek entered into an additional interest rate swap to maintain the minimum of
90%
of the outstanding notional amount being swapped to a fixed interest rate. Walnut Creek pays its counterparty the equivalent of a
4.0025%
fixed interest payment on a predetermined notional value, and quarterly, Walnut Creek receives the equivalent of a floating interest payment based on a three-month LIBOR calculated on the same notional value through July 31, 2020. All interest rate swap payments by Walnut Creek and its counterparties are made quarterly and the LIBOR is determined in advance of each interest period. Swaps became effective June 28, 2013, and amortize in proportion to the term loan. As of
September 30, 2015
,
$363 million
was outstanding under the term loan,
nothing
was outstanding under the working capital facility, and
$49 million
of letters of credit were issued.
29
WCEP Holdings LLC
On July 27, 2011, WCEP Holdings LLC entered into a credit agreement with a group of lenders for a
$53 million
construction loan that was convertible to a term loan upon completion of the Walnut Creek project. The Walnut Creek project met the conditions for the WCEP Holdings LLC loan to convert to a term loan on June 21, 2013. The term loan has an interest rate of
LIBOR
plus an applicable margin of
4%
. The term loan matures in May 2023. The term loan amortizes based upon a predetermined schedule.
Under the terms of the credit agreement, WCEP Holdings LLC entered into two fixed for floating interest rate swaps that would fix the interest rate for a minimum of
90%
of the outstanding notional amount. WCEP Holdings LLC will pay its counterparty the equivalent of a
4%
fixed interest payment on a predetermined notional value, and quarterly, WCEP Holdings LLC will receive the equivalent of a floating interest payment based on a three-month LIBOR calculated on the same notional value through May 31, 2023. All interest rate swap payments by WCEP Holdings LLC and its counterparties are made quarterly and the LIBOR is determined in advance of each interest period. Swaps became effective June 28, 2013, and amortize in proportion to the term loan.
On October 21, 2014, WCEP Holdings LLC amended the credit agreement to reduce the related interest rate to
LIBOR
plus
3%
. The proceeds of the distribution from Walnut Creek were utilized to make an optional repayment of
$6 million
on the term loan. In addition, WCEP Holdings LLC partially terminated the interest rate agreements so that at least
90%
and no more than
100%
of the aggregate principal amount of the loans then outstanding will be subject to interest rate agreements. As of
September 30, 2015
,
$46 million
was outstanding under the term loan.
Avenal Solar Holdings LLC
On March 18, 2015, Avenal Solar Holdings LLC, one of the Company's equity method investments, amended its credit agreement to increase its borrowings by
$43 million
and to reduce the related interest rate from
6 month LIBOR
plus an applicable margin of
2.25%
to
6 month LIBOR
plus
1.75%
from March 18, 2015, through March 17, 2022,
6 month LIBOR
plus
2.00%
from March 18, 2022, through March 17, 2027, and
6 month LIBOR
plus
2.25%
from March 18, 2027, through the maturity date. As a result of the credit agreement amendment, the Company received net proceeds of
$20 million
after fees from its
49.95%
ownership in Avenal. Effective September 30, 2015, the Company increased its ownership to
50%
by acquiring an additional
0.05%
membership interest in Avenal.
NRG West Holdings LLC
On May 29, 2015, NRG West Holdings LLC amended its financing agreement to increase borrowings under the Tranche A facility by
$5 million
and to reduce the related interest rate to
LIBOR
plus an applicable margin of
1.625%
from May 29, 2015, to August 31, 2017,
LIBOR
plus an applicable margin of
1.75%
from September 1, 2017, to August 31, 2020, and
LIBOR
plus
1.875%
from September 1, 2020, through the maturity date; to reduce the Tranche B loan interest rate to
LIBOR
plus an applicable margin of
2.250%
from May 29, 2015, to August 31, 2017,
LIBOR
plus
2.375%
from September 1, 2017, to August 31, 2020, and
LIBOR
plus an applicable margin of
2.50%
from September 1, 2020, through the maturity date and to reduce the working capital facility by
$9 million
. The proceeds of the increased borrowing were used to pay costs associated with the refinancing. Further, the amendment resulted in a
$7 million
loss on debt extinguishment.
30
Note 9
—
Earnings Per Share
Basic and diluted earnings per common share are computed by dividing net income by the weighted average number of common shares outstanding. Shares issued during the year are weighted for the portion of the year that they were outstanding. The number of shares and per share amounts for the prior periods presented below have been retrospectively restated to reflect the Recapitalization as further described in
Note 10
,
Changes in Capital Structure
.
The reconciliation of the Company's basic and diluted earnings per share is shown in the following tables:
|
Three months ended September 30,
|
|||||||||||||||
|
2015
|
2014
|
||||||||||||||
|
(In millions, except per share data)
|
Common Class A
|
Common Class C
|
Common Class A
|
Common Class C
|
|||||||||||
|
Basic and diluted earnings per share attributable to NRG Yield, Inc. common stockholders
|
|||||||||||||||
|
Net income attributable to NRG Yield, Inc.
|
$
|
6
|
|
$
|
11
|
|
$
|
3
|
|
$
|
3
|
|
|||
|
Weighted average number of common shares outstanding
|
35
|
|
63
|
|
31
|
|
31
|
|
|||||||
|
Earnings per weighted average common share — basic and diluted
(a)
|
$
|
0.18
|
|
$
|
0.18
|
|
$
|
0.10
|
|
$
|
0.10
|
|
|||
|
Nine months ended September 30,
|
|||||||||||||||
|
2015
|
2014
|
||||||||||||||
|
(In millions, except per share data)
(a)
|
Common Class A
|
Common Class C
|
Common Class A
|
Common Class C
|
|||||||||||
|
Basic and diluted earnings per share attributable to NRG Yield, Inc. common stockholders
|
|||||||||||||||
|
Net income attributable to NRG Yield, Inc.
|
$
|
10
|
|
$
|
12
|
|
$
|
8
|
|
$
|
8
|
|
|||
|
Weighted average number of common shares outstanding
|
35
|
|
44
|
|
25
|
|
25
|
|
|||||||
|
Earnings per weighted average common share — basic and diluted
(a)
|
$
|
0.28
|
|
$
|
0.28
|
|
$
|
0.31
|
|
$
|
0.31
|
|
|||
(a)
Basic and diluted earnings per share might not recalculate due to presenting Net income attributable to NRG Yield, Inc. and Weighted average number of common shares outstanding in millions rather than whole dollars.
With respect to the Class A common stock, there were a total of
15 million
and
7 million
anti-dilutive outstanding equity instruments for the three months ended
September 30, 2015
, and
2014
, respectively, and
15 million
and
6 million
anti-dilutive outstanding equity instruments for the
nine months
ended
September 30, 2015
, and
2014
, respectively, related to the 2019 Convertible Notes. With respect to the Class C common stock, there were a total of
10 million
anti-dilutive outstanding equity instruments for the three months ended
September 30, 2015
, and
4 million
anti-dilutive outstanding equity instruments for the
nine months
ended
September 30, 2015
, related to the 2020 Convertible Notes.
Note 10
—
Changes in Capital Structure
Recapitalization
On May 5, 2015, the Company's stockholders approved amendments to the Company's certificate of incorporation that adjusted the Company’s capital structure by creating two new classes of capital stock, Class C common stock and Class D common stock, and distributed shares of Class C and Class D common stock to holders of the Company's outstanding Class A and Class B common stock, respectively, through a stock split. The Recapitalization became effective on May 14, 2015.
The Class C common stock and Class D common stock have the same rights and privileges and rank equally, share ratably and are identical in all respects to the shares of Class A common stock and Class B common stock, respectively, as to all matters, except that each share of Class C common stock and Class D common stock is entitled to
1/100th
of a vote on all stockholder matters. The par value per share of the Company’s Class A common stock and Class B common stock remains unchanged at
$0.01
per share after the effect of the stock split described above. Accordingly, the stock split was accounted for as a stock dividend. The Company recorded a transfer between retained earnings and common stock equal to the par value of each share of Class C
31
common stock and Class D common stock that was issued. The Company also retrospectively adjusted all prior period share and per share amounts in the consolidated financial statements for the effect of the stock dividend, so that all periods are comparable.
Class C Common Stock Issuance
On June 29, 2015, the Company closed on its offering of
28,198,000
shares of Class C common stock at a price of
$22
per share, which included
3,678,000
shares of Class C common stock purchased by the underwriters through the exercise of an over-allotment option. Net proceeds to the Company from the sale of the Class C common stock were
$599 million
, net of underwriting discounts and commissions of
$21 million
. The Company utilized the proceeds of the offering to acquire
28,198,000
additional Class C units of NRG Yield LLC and, as a result, it currently owns
53.3%
of the economic interests of NRG Yield LLC, with NRG retaining
46.7%
of the economic interests of NRG Yield LLC.
Dividends to Class A and Class C common stockholders
The following table lists the dividends paid on the Company's Class A common stock and Class C common stock during the
nine months
ended
September 30, 2015
:
|
Third Quarter 2015
|
Second Quarter 2015
|
First Quarter 2015
|
|||||||||
|
Dividends per Class A share
|
$
|
0.21
|
|
$
|
0.20
|
|
$
|
0.39
|
|
||
|
Dividends per Class C share
|
$
|
0.21
|
|
0.20
|
|
N/A
|
|
||||
Dividends on the Class A common stock and Class C common stock are subject to available capital, market conditions, and compliance with associated laws, regulations and other contractual obligations.
On
November 4, 2015
, the Company announced the declaration of quarterly dividends on its Class A common stock and Class C common stock of
$0.215
per share payable on
December 15, 2015
, to stockholders of record as of
December 1, 2015
.
The Company also has authorized
10,000,000
shares of preferred stock, par value
$0.01
per share.
None
of the shares of preferred stock have been issued.
32
Note 11
—
Segment Reporting
The Company’s segment structure reflects how management currently operates and allocates resources. The Company's businesses are primarily segregated based on conventional power generation, renewable businesses which consist of solar and wind, and the thermal and chilled water business. The Corporate segment reflects the Company's corporate costs. The Company's chief operating decision maker, its Chief Executive Officer, evaluates the performance of its segments based on operational measures including adjusted earnings before interest, taxes, depreciation and amortization, or Adjusted EBITDA, and cash available for distribution, or CAFD, as well as net income (loss).
|
Three months ended September 30, 2015
|
|||||||||||||||||||
|
(In millions)
|
Conventional Generation
|
Renewables
|
Thermal
|
Corporate
|
Total
|
||||||||||||||
|
Operating revenues
|
$
|
86
|
|
$
|
77
|
|
$
|
46
|
|
$
|
—
|
|
$
|
209
|
|
||||
|
Cost of operations
|
15
|
|
23
|
|
31
|
|
—
|
|
69
|
|
|||||||||
|
Depreciation and amortization
|
19
|
|
26
|
|
5
|
|
—
|
|
50
|
|
|||||||||
|
General and administrative — affiliate
|
—
|
|
—
|
|
—
|
|
3
|
|
3
|
|
|||||||||
|
Acquisition-related transaction and integration costs
|
—
|
|
—
|
|
—
|
|
1
|
|
1
|
|
|||||||||
|
Operating income (loss)
|
52
|
|
28
|
|
10
|
|
(4
|
)
|
86
|
|
|||||||||
|
Equity in earnings of unconsolidated affiliates
|
3
|
|
16
|
|
—
|
|
—
|
|
19
|
|
|||||||||
|
Other income, net
|
—
|
|
1
|
|
—
|
|
—
|
|
1
|
|
|||||||||
|
Loss on debt extinguishment
|
—
|
|
(2
|
)
|
—
|
|
—
|
|
(2
|
)
|
|||||||||
|
Interest expense
|
(11
|
)
|
(32
|
)
|
(1
|
)
|
(18
|
)
|
(62
|
)
|
|||||||||
|
Income (loss) before income taxes
|
44
|
|
11
|
|
9
|
|
(22
|
)
|
42
|
|
|||||||||
|
Income tax expense
|
—
|
|
—
|
|
—
|
|
8
|
|
8
|
|
|||||||||
|
Net Income (Loss)
|
$
|
44
|
|
$
|
11
|
|
$
|
9
|
|
$
|
(30
|
)
|
$
|
34
|
|
||||
|
Total Assets
|
$
|
2,132
|
|
$
|
4,214
|
|
$
|
434
|
|
$
|
209
|
|
$
|
6,989
|
|
||||
|
Three months ended September 30, 2014
|
|||||||||||||||||||
|
(In millions)
|
Conventional Generation
|
Renewables
|
Thermal
|
Corporate
|
Total
|
||||||||||||||
|
Operating revenues
|
$
|
80
|
|
$
|
56
|
|
$
|
48
|
|
$
|
—
|
|
$
|
184
|
|
||||
|
Cost of operations
|
15
|
|
13
|
|
32
|
|
—
|
|
60
|
|
|||||||||
|
Depreciation and amortization
|
13
|
|
16
|
|
5
|
|
—
|
|
34
|
|
|||||||||
|
General and administrative — affiliate
|
—
|
|
—
|
|
—
|
|
3
|
|
3
|
|
|||||||||
|
Acquisition-related transaction and integration costs
|
—
|
|
—
|
|
—
|
|
2
|
|
2
|
|
|||||||||
|
Operating income (loss)
|
52
|
|
27
|
|
11
|
|
(5
|
)
|
85
|
|
|||||||||
|
Equity in earnings of unconsolidated affiliates
|
4
|
|
7
|
|
—
|
|
—
|
|
11
|
|
|||||||||
|
Other income, net
|
—
|
|
—
|
|
—
|
|
1
|
|
1
|
|
|||||||||
|
Interest expense
|
(14
|
)
|
(23
|
)
|
(2
|
)
|
(9
|
)
|
(48
|
)
|
|||||||||
|
Income (loss) before income taxes
|
42
|
|
11
|
|
9
|
|
(13
|
)
|
49
|
|
|||||||||
|
Income tax expense
|
—
|
|
—
|
|
—
|
|
10
|
|
10
|
|
|||||||||
|
Net Income (Loss)
|
$
|
42
|
|
$
|
11
|
|
$
|
9
|
|
$
|
(23
|
)
|
$
|
39
|
|
||||
33
|
|
Nine months ended September 30, 2015
|
||||||||||||||||||
|
(In millions)
|
Conventional Generation
|
|
Renewables
|
|
Thermal
|
|
Corporate
|
|
Total
|
||||||||||
|
Operating revenues
|
$
|
247
|
|
$
|
224
|
|
$
|
135
|
|
$
|
—
|
|
|
$
|
606
|
|
|||
|
Cost of operations
|
51
|
|
64
|
|
96
|
|
—
|
|
|
211
|
|
||||||||
|
Depreciation and amortization
|
61
|
|
88
|
|
14
|
|
—
|
|
|
163
|
|
||||||||
|
General and administrative — affiliate
|
—
|
|
—
|
|
—
|
|
9
|
|
|
9
|
|
||||||||
|
Acquisition-related transaction and integration costs
|
—
|
|
—
|
|
—
|
|
2
|
|
2
|
|
|||||||||
|
Operating income (loss)
|
135
|
|
72
|
|
25
|
|
(11
|
)
|
221
|
|
|||||||||
|
Equity in earnings of unconsolidated affiliates
|
10
|
|
19
|
|
—
|
|
—
|
|
|
29
|
|
||||||||
|
Other income, net
|
1
|
|
1
|
|
—
|
|
—
|
|
2
|
|
|||||||||
|
Loss on debt extinguishment
|
(7
|
)
|
(2
|
)
|
—
|
|
—
|
|
(9
|
)
|
|||||||||
|
Interest expense
|
(36
|
)
|
(91
|
)
|
(5
|
)
|
(44
|
)
|
|
(176
|
)
|
||||||||
|
Income (loss) before income taxes
|
103
|
|
(1
|
)
|
20
|
|
(55
|
)
|
|
67
|
|
||||||||
|
Income tax expense
|
—
|
|
—
|
|
—
|
|
8
|
|
|
8
|
|
||||||||
|
Net Income (Loss)
|
$
|
103
|
|
$
|
(1
|
)
|
$
|
20
|
|
$
|
(63
|
)
|
|
$
|
59
|
|
|||
|
Nine months ended September 30, 2014
|
|||||||||||||||||||
|
(In millions)
|
Conventional Generation
|
Renewables
|
Thermal
|
Corporate
|
Total
|
||||||||||||||
|
Operating revenues
|
$
|
223
|
|
$
|
118
|
|
$
|
156
|
|
$
|
—
|
|
$
|
497
|
|
||||
|
Cost of operations
|
41
|
|
24
|
|
108
|
|
—
|
|
173
|
|
|||||||||
|
Depreciation and amortization
|
60
|
|
38
|
|
14
|
|
—
|
|
112
|
|
|||||||||
|
General and administrative — affiliate
|
—
|
|
—
|
|
—
|
|
7
|
|
7
|
|
|||||||||
|
Acquisition-related transaction and integration costs
|
—
|
|
—
|
|
—
|
|
2
|
|
2
|
|
|||||||||
|
Operating income (loss)
|
122
|
|
56
|
|
34
|
|
(9
|
)
|
203
|
|
|||||||||
|
Equity in earnings of unconsolidated affiliates
|
11
|
|
15
|
|
—
|
|
—
|
|
26
|
|
|||||||||
|
Other income, net
|
—
|
|
1
|
|
—
|
|
1
|
|
2
|
|
|||||||||
|
Interest expense
|
(40
|
)
|
(46
|
)
|
(6
|
)
|
(17
|
)
|
(109
|
)
|
|||||||||
|
Income (loss) before income taxes
|
93
|
|
26
|
|
28
|
|
(25
|
)
|
122
|
|
|||||||||
|
Income tax expense
|
—
|
|
—
|
|
—
|
|
15
|
|
15
|
|
|||||||||
|
Net Income (Loss)
|
$
|
93
|
|
$
|
26
|
|
$
|
28
|
|
$
|
(40
|
)
|
$
|
107
|
|
||||
Note 12
—
Income Taxes
Effective Tax Rate
The income tax provision consisted of the following:
|
|
Three months ended September 30,
|
Nine months ended September 30,
|
|||||||||||||
|
|
2015
|
2014
|
2015
|
2014
|
|||||||||||
|
|
(In millions, except percentages)
|
||||||||||||||
|
Income before income taxes
|
$
|
42
|
|
$
|
49
|
|
$
|
67
|
|
$
|
122
|
|
|||
|
Income tax expense
|
8
|
|
10
|
|
8
|
|
15
|
|
|||||||
|
Effective income tax rate
|
19.0
|
%
|
20.4
|
%
|
11.9
|
%
|
12.3
|
%
|
|||||||
For the
three
and
nine months
ended
September 30, 2015
and
2014
, the overall effective tax rate was different than the statutory rate of
35%
primarily due to taxable earnings allocated to NRG resulting from its interest in NRG Yield LLC and production tax credits generated from certain wind facilities.
For tax purposes, NRG Yield LLC is treated as a partnership; therefore, the Company and NRG each record their respective share of taxable income or loss.
34
The Company's deferred tax balances reflect cumulative net operating losses and the difference in book and tax basis of the Company's assets primarily due to an increase in the tax basis of property, plant and equipment. The change in tax basis resulted in non-cash additions of
$29 million
during the
nine months
ended
September 30, 2015
, and
$65 million
during the year ended
December 31, 2014
, to the Company's additional paid-in capital.
Note 13
—
Related Party Transactions
Management Services Agreement by and between the Company and NRG
NRG provides the Company with various operation, management, and administrative services, which include human resources, accounting, tax, legal, information systems, treasury, and risk management, as set forth in the Management Services Agreement. As of
September 30, 2015
, the base management fee was approximately
$7 million
per year, subject to an inflation-based adjustment annually at an inflation factor based on the year-over-year U.S. consumer price index. The fee is also subject to adjustments following the consummation of future acquisitions and as a result of a change in the scope of services provided under the Management Services Agreement. During the
nine months
ended
September 30, 2015
, the fee was increased by approximately
$1 million
per year primarily due to the acquisition of the January 2015 Drop Down Assets. Costs incurred under this agreement were
$9 million
and
$7 million
for the
nine months
ended
September 30, 2015
, and
2014
, respectively, which included certain direct expenses incurred by NRG on behalf of the Company in addition to the base management fee. There was a balance of
$5 million
due to NRG in accounts payable — affiliate as of
September 30, 2015
.
Operation and Maintenance Services (O&M) Agreements by and between Thermal Entities and NRG
On October 1, 2014, NRG entered into Plant O&M Services Agreements with certain wholly-owned subsidiaries of the Company. NRG provides necessary and appropriate services to operate and maintain the subsidiaries' plant operations, businesses and thermal facilities. NRG is to be reimbursed for the provided services, as well as for all reasonable and related expenses and expenditures, and payments to third parties for services and materials rendered to or on behalf of the parties to the agreements. NRG is not entitled to any management fee or mark-up under the agreements. Prior to October 1, 2014, NRG provided the same services to the Thermal Business on an informal basis. Total fees incurred under the agreements were
$21 million
for the
nine months
ended
September 30, 2015
, and
2014
. There was a balance of
$30 million
and
$22 million
due to NRG in accounts payable — affiliate as of
September 30, 2015
, and
December 31, 2014
, respectively. Subsequent to quarter end,
$7 million
of the outstanding balance has been paid.
Administrative Services Agreement by and between Marsh Landing and GenOn Energy Services, LLC
Marsh Landing is a party to an administrative services agreement with GenOn Energy Services, LLC, a wholly-owned subsidiary of NRG, which provides invoice processing and payment on behalf of Marsh Landing. Marsh Landing reimburses GenOn Energy Services, LLC for the amounts paid by it. The Company reimbursed costs under this agreement of approximately
$11 million
for the
nine months
ended
September 30, 2015
, and
2014
. There was a balance of
$1 million
and
$4 million
due to GenOn Energy Services, LLC in accounts payable — affiliate as of
September 30, 2015
, and
December 31, 2014
, respectively.
O&M
Services Agreements by and between El Segundo and NRG El Segundo Operations
El Segundo incurs fees under an O&M agreement with NRG El Segundo Operations, Inc., a wholly-owned subsidiary of NRG. Under the O&M agreement, NRG El Segundo Operations, Inc. manages, operates and maintains the El Segundo facility for an initial term of ten years following the commercial operations date. For the
nine months
ended
September 30, 2015
, and 2014, the costs incurred under the agreement were approximately
$4 million
and
$3 million
, respectively. There was a balance of
$1 million
due to NRG El Segundo in accounts payable — affiliate as of
September 30, 2015
, and
December 31, 2014
.
O&M
Services Agreements by and between GenConn and NRG
GenConn incurs fees under two O&M agreements with wholly-owned subsidiaries of NRG. The fees incurred under the agreements were
$3 million
and
$5 million
for the
nine months
ended
September 30, 2015
, and
2014
, respectively.
Administrative Services Agreement by and between CVSR and NRG
CVSR is a party to an administrative services agreement with NRG Energy Services LLC, a wholly-owned subsidiary of NRG, which provides O&M services on behalf of CVSR. CVSR reimburses NRG Energy Services LLC for the amounts paid by it. CVSR reimbursed costs under this agreement of
$4 million
and
$5 million
for the nine months ended
September 30, 2015
, and
2014
, respectively.
35
The following discussion analyzes the Company's historical financial condition and results of operations, which were recast to include the effect of the June 2014 Drop Down Assets and January 2015 Drop Down Assets on June 30, 2014, and January 2, 2015, respectively. As further discussed in
Note 1
,
Nature of Business
, to the Consolidated Financial Statements, the purchase of these assets was accounted for in accordance with ASC 850-50
, Business Combinations - Related Issues
, pursuant to which the assets and liabilities transferred to the Company relate to interests under common control by NRG and, accordingly, were recorded at historical cost. The difference between the cash proceeds and historical value of the net assets was recorded as a distribution to NRG and reduced the balance of its noncontrolling interest. The guidance requires retrospective combination of the entities for all periods presented as if the combination has been in effect since the inception of common control.
As you read this discussion and analysis, refer to the Company's Consolidated Statements of Operations to this Form 10-Q, which present the results of operations for the
nine months
ended
September 30, 2015
, and
2014
. Also refer to the Company's 2014 Form 10-K, which includes detailed discussions of various items impacting the Company's business, results of operations and financial condition.
The discussion and analysis below has been organized as follows:
|
•
|
Executive Summary, including a description of the business and significant events that are important to understanding the results of operations and financial condition;
|
|
•
|
Results of operations, including an explanation of significant differences between the periods in the specific line items of the consolidated statements of operations;
|
|
•
|
Financial condition addressing liquidity position, sources and uses of cash, capital resources and requirements, commitments, and off-balance sheet arrangements;
|
|
•
|
Known trends that may affect the Company’s results of operations and financial condition in the future; and
|
|
•
|
Critical accounting policies which are most important to both the portrayal of the Company's financial condition and results of operations, and which require management's most difficult, subjective or complex judgment.
|
36
Executive Summary
Introduction and Overview
The Company is a dividend growth-oriented company formed as a Delaware corporation on December 20, 2012, to serve as the primary vehicle through which NRG owns, operates and acquires contracted renewable and conventional generation and thermal infrastructure assets. The Company believes it is well positioned to be a premier company for investors seeking stable and growing dividend income from a diversified portfolio of lower-risk high-quality assets.
The Company owns a diversified portfolio of contracted renewable and conventional generation and thermal infrastructure assets in the U.S. The Company’s contracted generation portfolio collectively represents
3,824
net MW.
Each of these assets sells substantially all of its output pursuant to long-term offtake agreements with creditworthy counterparties. The average remaining contract duration of these offtake agreements was approximately
17 years
as of
September 30, 2015
,
based on cash available for distribution
. The Company also owns thermal infrastructure assets with an aggregate steam and chilled water capacity of
1,310
net MWt and electric generation capacity of
124
net MW. These thermal infrastructure assets provide steam, hot water and/or chilled water, and in some instances electricity, to commercial businesses, universities, hospitals and governmental units in multiple locations, principally through long-term contracts or pursuant to rates regulated by state utility commissions.
Significant Event During Quarter
The following significant event has occurred since the filing of the Company's last quarterly report:
November 2015 Drop Down Assets from NRG
On November 3, 2015, the Company acquired
75%
of the Class B interests of the November 2015 Drop Down Assets, which own a portfolio of
12
wind facilities totaling
814
net MW, from NRG for total cash consideration of
$210 million
, subject to working capital adjustments. The Company will be responsible for its pro-rata share of non-recourse project debt of
$193 million
and noncontrolling interest associated with a tax equity structure of
$165 million
(as of September 30, 2015).
Regulatory Matters
The Company’s regulatory matters are described in the Company’s 2014 Form 10-K in Item 1,
Business
—
Regulatory Matters.
As owners of power plants and participants in wholesale and thermal energy markets, certain of the Company's subsidiaries are subject to regulation by various federal and state government agencies. These include FERC and the PUCT, as well as other public utility commissions in certain states where the Company's assets are located. Each of the Company's U.S. generating facilities qualifies as an EWG or QF. In addition, the Company is subject to the market rules, procedures and protocols of the various ISO and RTO markets in which it participates. Likewise, the Company must also comply with the mandatory reliability requirements imposed by NERC and the regional reliability entities in the regions where the Company operates.
The Company's operations within the ERCOT footprint are not subject to rate regulation by FERC, as they are deemed to operate solely within the ERCOT market and not in interstate commerce. These operations are subject to regulation by the PUCT.
Environmental Matters
The Company’s environmental matters are described in the Company’s 2014 Form 10-K in Item 1,
Business
—
Environmental Matters
and Item 1A,
Risk Factors.
The Company is subject to a wide range of environmental laws in the development, construction, ownership and operation of projects. These laws generally require that governmental permits and approvals be obtained before construction and during operation of facilities. The Company is also subject to laws and regulations surrounding the protection of wildlife, including migratory birds, eagles and threatened and endangered species. Environmental laws have become increasingly stringent and the Company expects this trend to continue.
37
Basis of Presentation
The acquisitions of the June 2014 Drop Down Assets from NRG on June 30, 2014, and the January 2015 Drop Down Assets on January 2, 2015, were accounted for as a transfer of entities under common control. The guidance requires retrospective combination of the entities for all periods presented as if the combination has been in effect since the inception of common control. Accordingly, the Company prepared its consolidated financial statements to reflect the transfers as if they had taken place from the beginning of the financial statements period or from the date the entities were under common control (if later than the beginning of the financial statements period). The January 2015 Drop Down Assets are reflected as if the transfer took place on April 1, 2014, which represents the date these entities were acquired by NRG. Members' equity represents NRG's equity in the subsidiaries, and accordingly, in connection with their acquisition by the Company, the balance was reclassified to noncontrolling interest. The Company reduces net income attributable to its Class A and Class C common stockholders by the pre-acquisition net income for the June 2014 Drop Down Assets and January 2015 Drop Down Assets, collectively, the Drop Down Assets, as it is not available to the stockholders.
Trends Affecting Results of Operations
El Segundo Forced Outage
In January 2015, El Segundo experienced a steam turbine water intrusion resulting in a forced outage on Units 5 and 6. The units returned to service in April 2015. The Company completed a root cause analysis and has implemented steps to prevent a recurrence of the event. The Company reviewed the financial impact of repair costs and lost capacity revenue and expects to collect approximately $4 million of insurance proceeds in the fourth quarter of 2015.
Wind Resource Availability
The Company's results continue to be impacted by lower than normal wind resource availability. While the Company's wind facilities were available, adverse weather had a negative impact on wind resources. The Company cannot predict wind resource availability and its related impact on future results.
38
Consolidated Results of Operations
The following table provides selected financial information:
|
|
Three months ended September 30,
|
Nine months ended September 30,
|
|||||||||||||||||||
|
(In millions, except otherwise noted)
|
2015
|
2014
|
Change %
|
2015
|
2014
|
Change %
|
|||||||||||||||
|
Operating Revenues
|
|||||||||||||||||||||
|
Energy and capacity revenues
|
$
|
225
|
|
$
|
203
|
|
11
|
|
$
|
645
|
|
$
|
517
|
|
25
|
|
|||||
|
Contract amortization
|
(15
|
)
|
(19
|
)
|
(21
|
)
|
(41
|
)
|
(20
|
)
|
105
|
|
|||||||||
|
Mark-to-market economic hedging activities
|
(1
|
)
|
—
|
|
(100
|
)
|
2
|
|
—
|
|
100
|
|
|||||||||
|
Total operating revenues
|
209
|
|
184
|
|
14
|
|
606
|
|
497
|
|
22
|
|
|||||||||
|
Operating Costs and Expenses
|
|||||||||||||||||||||
|
Cost of fuels
|
19
|
|
20
|
|
(5
|
)
|
57
|
|
73
|
|
(22
|
)
|
|||||||||
|
Operations and maintenance
|
33
|
|
27
|
|
22
|
|
106
|
|
73
|
|
45
|
|
|||||||||
|
Other costs of operations
|
17
|
|
13
|
|
31
|
|
48
|
|
27
|
|
78
|
|
|||||||||
|
Depreciation and amortization
|
50
|
|
34
|
|
47
|
|
163
|
|
112
|
|
46
|
|
|||||||||
|
General and administrative — affiliate
|
3
|
|
3
|
|
—
|
|
9
|
|
7
|
|
29
|
|
|||||||||
|
Acquisition-related transaction and integration costs
|
1
|
|
2
|
|
(50
|
)
|
2
|
|
2
|
|
—
|
|
|||||||||
|
Total operating costs and expenses
|
123
|
|
99
|
|
24
|
|
385
|
|
294
|
|
31
|
|
|||||||||
|
Operating Income
|
86
|
|
85
|
|
1
|
|
221
|
|
203
|
|
9
|
|
|||||||||
|
Other Income (Expense)
|
|
||||||||||||||||||||
|
Equity in earnings of unconsolidated affiliates
|
19
|
|
11
|
|
73
|
|
29
|
|
26
|
|
12
|
|
|||||||||
|
Other income, net
|
1
|
|
1
|
|
—
|
|
2
|
|
2
|
|
—
|
|
|||||||||
|
Loss on debt extinguishment
|
(2
|
)
|
—
|
|
100
|
|
(9
|
)
|
—
|
|
100
|
|
|||||||||
|
Interest expense
|
(62
|
)
|
(48
|
)
|
29
|
|
(176
|
)
|
(109
|
)
|
61
|
|
|||||||||
|
Total other expense, net
|
(44
|
)
|
(36
|
)
|
22
|
|
(154
|
)
|
(81
|
)
|
90
|
|
|||||||||
|
Income Before Income Taxes
|
42
|
|
49
|
|
(14
|
)
|
67
|
|
122
|
|
(45
|
)
|
|||||||||
|
Income tax expense
|
8
|
|
10
|
|
(20
|
)
|
8
|
|
15
|
|
(47
|
)
|
|||||||||
|
Net Income
|
34
|
|
39
|
|
(13
|
)
|
59
|
|
107
|
|
(45
|
)
|
|||||||||
|
Less: Pre-acquisition net income of Drop Down Assets
|
—
|
|
8
|
|
(100
|
)
|
—
|
|
33
|
|
(100
|
)
|
|||||||||
|
Net Income Excluding Pre-acquisition Net Income of Drop Down Assets
|
34
|
|
31
|
|
10
|
|
59
|
|
74
|
|
(20
|
)
|
|||||||||
|
Less: Net income attributable to noncontrolling interests
|
17
|
|
25
|
|
(32
|
)
|
37
|
|
58
|
|
(36
|
)
|
|||||||||
|
Net Income Attributable to NRG Yield, Inc.
|
$
|
17
|
|
$
|
6
|
|
183
|
|
$
|
22
|
|
$
|
16
|
|
38
|
|
|||||
|
Three months ended September 30,
|
Nine months ended September 30,
|
||||||||||
|
Business metrics:
|
2015
|
2014
|
2015
|
2014
|
|||||||
|
Renewable MWh sold (in thousands)
(a)
|
954
|
|
680
|
|
2,858
|
|
1,454
|
|
|||
|
Thermal MWt sold (in thousands)
|
468
|
|
467
|
|
1,519
|
|
1,576
|
|
|||
|
Thermal MWh sold (in thousands)
|
92
|
|
65
|
|
219
|
|
189
|
|
|||
(a)
Volumes sold do not include the MWh generated by the Company's equity method investments.
39
Management’s Discussion of the Results of Operations for the Three Months ended
September 30, 2015
, and
2014
Economic Gross Margin
The Company evaluates its operating performance using the measure of economic gross margin, which is not a GAAP measure and may not be comparable to other companies’ presentations or deemed more useful than the GAAP information provided elsewhere in this report. Economic gross margin is defined as energy and capacity revenue less cost of fuels. Economic gross margin does not include mark-to-market gains or losses on economic hedging activities or contract amortization.
The following tables present the composition of economic gross margin for the
three
months ended September 30, 2015, and 2014:
|
Conventional
|
Renewables
|
Thermal
|
Total
|
||||||||||||
|
(In millions)
|
|||||||||||||||
|
Three months ended September 30, 2015
|
|
||||||||||||||
|
Energy and capacity revenues
|
$
|
88
|
|
$
|
91
|
|
$
|
46
|
|
$
|
225
|
|
|||
|
Cost of fuels
|
(1
|
)
|
—
|
|
(18
|
)
|
(19
|
)
|
|||||||
|
Economic gross margin
|
$
|
87
|
|
$
|
91
|
|
$
|
28
|
|
$
|
206
|
|
|||
|
Three months ended September 30, 2014
|
|
||||||||||||||
|
Energy and capacity revenues
|
$
|
90
|
|
$
|
64
|
|
$
|
49
|
|
$
|
203
|
|
|||
|
Cost of fuels
|
—
|
|
—
|
|
(20
|
)
|
(20
|
)
|
|||||||
|
Economic gross margin
|
$
|
90
|
|
$
|
64
|
|
$
|
29
|
|
$
|
183
|
|
|||
Economic gross margin
increased
by
$23 million
during the
three
months ended
September 30, 2015
, compared to the same period in
2014
, primarily due to the acquisition of the Alta Wind Portfolio in August 2014.
Operations and Maintenance Expense
|
Conventional
|
Renewables
|
Thermal
|
Total
|
||||||||||||
|
(In millions)
|
|||||||||||||||
|
Three months ended September 30, 2015
|
$
|
6
|
|
$
|
15
|
|
$
|
12
|
|
$
|
33
|
|
|||
|
Three months ended September 30, 2014
|
7
|
|
9
|
|
11
|
|
27
|
|
|||||||
Operations and maintenance expense
increased
by
$6 million
during the
three
months ended
September 30, 2015
, compared to the same period in
2014
, primarily due to the Alta Wind Portfolio acquired in August 2014.
Other Costs of Operations
Other costs of operations
increased
by $4 million during the
three
months ended
September 30, 2015
, compared to the same period in
2014
, primarily due to an increase in property taxes resulting from the acquisition of the Alta Wind Portfolio in August 2014.
Depreciation and Amortization
Depreciation and amortization
increased
by
$16 million
during the
three
months ended
September 30, 2015
, compared to the same period in
2014
, due to the impact of the adjustments to the acquisition accounting for the January 2015 Drop Down Assets and the acquisition of the Alta Wind Portfolio in August 2014.
Equity in Earnings of Unconsolidated Affiliates
Equity in earnings of unconsolidated affiliates
increased
by
$8 million
during the
three
months ended
September 30, 2015
, compared to the same period in
2014
, due primarily to the acquisition of Desert Sunlight on June 29, 2015, as well as increased equity in earnings from CVSR, partially offset by losses from RPV Holdco.
Interest Expense
Interest expense
increased
by
$14 million
during the
three
months ended
September 30, 2015
, compared to the same period in
2014
, due primarily to:
40
|
(In millions)
|
|||
|
Increase due to the Senior Notes issued in August 2014 and the 2020 Convertible Notes issued in June 2015
|
$
|
7
|
|
|
Increase due to acquisition of the Alta Wind Portfolio in August 2014
|
5
|
|
|
|
Increase from changes in the fair value of interest rate swaps
|
4
|
|
|
|
Decrease from repricing of project-level financing arrangements and principal repayments
|
(2
|
)
|
|
|
$
|
14
|
|
|
Income Tax Expense
For the
three
months ended
September 30, 2015
, the Company recorded income tax
expense
of
$8 million
on pretax
income
of
$42 million
. For the same period in
2014
, the Company recorded income tax
expense
of
$10 million
on pretax
income
of
$49 million
. For the
three
months ended
September 30, 2015
and
2014
, the Company's overall effective tax rate was different than the statutory rate of
35%
primarily due to taxable earnings allocated to NRG resulting from its interest in NRG Yield LLC and production tax credits generated from certain wind facilities.
Income Attributable to Noncontrolling Interests
For the
three
months ended
September 30, 2015
, the Company had income of
$22 million
attributable to NRG's interest in the Company and a loss of
$5 million
attributable to non-controlling interests with respect to its tax equity financing arrangements and the application of the HLBV method. For the
three
months ended
September 30, 2014
, the Company had income of
$25 million
attributable to NRG's interest in the Company.
Management’s Discussion of the Results of Operations for the
Nine Months
ended
September 30, 2015
, and
2014
Economic gross margin
The Company evaluates its operating performance using the measure of economic gross margin, which is not a GAAP measure and may not be comparable to other companies’ presentations or deemed more useful than the GAAP information provided elsewhere in this report. Economic gross margin is defined as energy and capacity revenue less cost of fuels. Economic gross margin does not include mark-to-market gains or losses on economic hedging activities or contract amortization.
The following tables present the composition of economic gross margin for the
nine
months ended September 30, 2015, and 2014:
|
Conventional
|
Renewables
|
Thermal
|
Total
|
||||||||||||
|
(In millions)
|
|||||||||||||||
|
Nine months ended September 30, 2015
|
|||||||||||||||
|
Energy and capacity revenues
|
$
|
251
|
|
$
|
258
|
|
$
|
136
|
|
$
|
645
|
|
|||
|
Cost of fuels
|
(2
|
)
|
—
|
|
(55
|
)
|
(57
|
)
|
|||||||
|
Economic gross margin
|
$
|
249
|
|
$
|
258
|
|
$
|
81
|
|
$
|
588
|
|
|||
|
Nine months ended September 30, 2014
|
|||||||||||||||
|
Energy and capacity revenues
|
$
|
233
|
|
$
|
126
|
|
$
|
158
|
|
$
|
517
|
|
|||
|
Cost of fuels
|
(3
|
)
|
—
|
|
(70
|
)
|
(73
|
)
|
|||||||
|
Economic gross margin
|
$
|
230
|
|
$
|
126
|
|
$
|
88
|
|
$
|
444
|
|
|||
41
Economic gross margin
increased
by
$144 million
during the
nine months
ended
September 30, 2015
, compared to the same period in
2014
due to:
|
(In millions)
|
|||
|
Increase in Renewables gross margin due to the acquisition of the Alta Wind Portfolio in August 2014 and the Tapestry and Laredo Ridge projects, which were acquired by NRG in April 2014 and sold to the Company on January 2, 2015
|
$
|
132
|
|
|
Increase in Conventional gross margin due to Walnut Creek, which was acquired by NRG in April 2014 and sold to the Company on January 2, 2015, partially offset by reduced revenues at El Segundo due to the forced outage in the first half of 2015, returning to service in April 2015
|
19
|
|
|
|
Decrease in Thermal gross margin due to milder weather conditions in the first nine months of 2015 compared to 2014
|
(7
|
)
|
|
|
$
|
144
|
|
|
Contract amortization
Contract amortization
increased
by
$21 million
during the
nine months
ended
September 30, 2015
,
compared to the same period in
2014
due to the amortization of the PPAs acquired in the acquisitions of the Alta Wind Portfolio in August 2014 and the January 2015 Drop Down Assets.
Mark-to-market for economic hedging activities
Mark-to-market results for the
nine months
ended
September 30, 2015
, represent the unrealized gains on forward contracts with an NRG subsidiary hedging the sale of power from the Alta X and Alta XI wind facilities extending through the end of 2015, as further described in
Note 7
—
Accounting for Derivative Instruments and Hedging Activities
.
Operations and Maintenance Expense
|
Conventional
|
Renewables
|
Thermal
|
Total
|
||||||||||||
|
(In millions)
|
|||||||||||||||
|
Nine months ended September 30, 2015
|
$
|
27
|
|
$
|
42
|
|
$
|
37
|
|
$
|
106
|
|
|||
|
Nine months ended September 30, 2014
|
22
|
|
18
|
|
33
|
|
73
|
|
|||||||
Operations and maintenance expense increased by
$33 million
during the
nine months
ended
September 30, 2015
, compared to the same period in
2014
, primarily due to the acquisitions of the Alta Wind Portfolio in August 2014 and the January 2015 Drop Down Assets, as well as El Segundo's forced outage in the first half of 2015, returning to service in April 2015.
Other Costs of Operations
Other costs of operations
increased
by
$21 million
during the
nine months
ended
September 30, 2015
, compared to the same period in
2014
, primarily due an increase in property taxes resulting from the acquisition of the Alta Wind Portfolio in August 2014 and the January 2015 Drop Down Assets.
Depreciation and Amortization
Depreciation and amortization
increased
by
$51 million
during the
nine months
ended
September 30, 2015
, compared to the same period in
2014
, due primarily to the acquisition of the Alta Wind Portfolio in August 2014 and the January 2015 Drop Down Assets.
Equity in Earnings of Unconsolidated Affiliates
Equity in earnings of unconsolidated affiliates
increased
by
$3 million
during the
nine months
ended
September 30, 2015
, compared to the same period in
2014
, due primarily to the acquisition of Desert Sunlight on June 29, 2015, partially offset by losses from RPV Holdco.
Interest Expense
Interest expense
increased
by
$67 million
during the
nine months
ended
September 30, 2015
, compared to the same period in
2014
, due to:
42
|
(In millions)
|
|||
|
Increase due to the acquisition of the Alta Wind Portfolio in August 2014 and the acquisition of the January 2015 Assets
|
$
|
52
|
|
|
Increase due to 2019 Convertible Notes issued in first quarter 2014, Senior Notes due 2024 issued in August 2014, and issuance of the 2020 Convertible Notes in the second quarter 2015
|
26
|
|
|
|
Decrease from repricing of project-level financing arrangements and principal repayments
|
(8
|
)
|
|
|
Decrease from changes in the fair value of interest rate swaps
|
(3
|
)
|
|
|
$
|
67
|
|
|
Income Tax Expense
For the
nine months
ended
September 30, 2015
, the Company recorded
$8 million
income tax
expense
on pretax
income
of
$67 million
. For the same period in
2014
, the Company recorded income tax expense of
$15 million
on pretax income of
$122 million
. For the
nine months
ended
September 30, 2015
and
2014
, the overall effective tax rate was different than the statutory rate of 35% primarily due to taxable earnings allocated to NRG resulting from its interest in NRG Yield LLC and production tax credits generated from certain wind facilities.
Income Attributable to Noncontrolling Interests
For the
nine months
ended
September 30, 2015
, the Company had income of
$35 million
attributable to NRG's interest in the Company and income of
$2 million
attributable to non-controlling interests with respect to its tax equity financing arrangements and the application of the HLBV method. For the
nine months
ended September 30, 2014, the Company had income of
$58 million
attributable to NRG's interest in the Company.
Liquidity and Capital Resources
The Company's principal liquidity requirements are to meet its financial commitments, finance current operations, fund capital expenditures, including acquisitions from time to time, to service debt and to pay dividends. Historically, the Company's predecessor operations were financed as part of NRG's integrated operations and largely relied on internally generated cash flows as well as corporate and/or project-level borrowings to satisfy its capital expenditure requirements.
As a normal part of the Company's business, depending on market conditions, the Company will from time to time consider opportunities to repay, redeem, repurchase or refinance its indebtedness. Changes in the Company's operating plans, lower than anticipated sales, increased expenses, acquisitions or other events may cause the Company to seek additional debt or equity financing in future periods. There can be no guarantee that financing will be available on acceptable terms or at all. Debt financing, if available, could impose additional cash payment obligations and additional covenants and operating restrictions.
Liquidity Position
As of
September 30, 2015
, and
December 31, 2014
, the Company's liquidity was approximately
$572 million
and
$863 million
, respectively, comprised of cash, restricted cash, and availability under the Company's revolving credit facility. The
decrease
primarily relates to the acquisition of the January 2015 Drop Down Assets. The Company's various financing arrangements are described in
Note 8
,
Long-term Debt
.
Management believes that the Company's liquidity position, cash flows from operations and availability under its revolving credit facility will be adequate to meet the Company's financial commitments, debt service obligations, finance growth, operating and maintenance capital expenditures, and to fund dividends to holders of the Company's Class A common stock and Class C common stock, both in the near and longer term. Management continues to regularly monitor the Company's ability to finance the needs of its operating, financing and investing activity within the dictates of prudent balance sheet management.
Credit Ratings
Credit rating agencies rate a firm's public debt securities. These ratings are utilized by the debt markets in evaluating a firm's credit risk. Ratings influence the price paid to issue new debt securities by indicating to the market the Company's ability to pay principal, interest and preferred dividends. Rating agencies evaluate a firm's industry, cash flow, leverage, liquidity, and hedge profile, among other factors, in their credit analysis of a firm's credit risk.
On September 18, 2015, S&P reaffirmed its corporate credit ratings on NRG Yield, Inc. and the Senior Notes due 2024. The rating outlook is stable.
43
On October 6, 2015, Moody's lowered its corporate credit ratings on NRG Yield, Inc. and the Senior Notes due 2024 to Ba2 from Ba1. The rating outlook is stable.
The following table summarizes the credit ratings for NRG Yield, Inc., and the Senior Notes as of November 4, 2015:
|
|
S&P
|
Moody's
|
|
|
NRG Yield, Inc.
|
BB+
|
Ba2
|
|
|
5.375% Senior Notes, due 2024
|
BB+
|
Ba2
|
|
Sources of Liquidity
The Company's principal sources of liquidity include cash on hand, cash generated from operations, borrowings under new and existing financing arrangements and the issuance of additional equity and debt securities as appropriate given market conditions. As described in
Note 8
,
Long-term Debt
, the Company's financing arrangements consist of the revolving credit facility, the 2019 Convertible Notes, the 2020 Convertible Notes, the Senior Notes and project-level financings for its various assets.
Recapitalization
Effective May 14, 2015, NRG Yield, Inc. amended its certificate of incorporation to create two new classes of capital stock, Class C common stock and Class D common stock, and distributed shares of the Class C common stock and Class D common stock to holders of the NRG Yield, Inc.'s outstanding Class A common stock and Class B common stock, respectively, through a stock split.
The Class C common stock and Class D common stock have the same rights and privileges and rank equally, share ratably and are identical in all respects to the shares of Class A common stock and Class B common stock, respectively, as to all matters, except that each share of Class C common stock and Class D common stock is entitled to 1/100th of a vote on all stockholder matters.
In connection with the amendments described above, the ROFO Agreement was amended to make additional assets available to the Company should NRG choose to sell them, including (i) two natural gas facilities totaling 795 MW of net capacity that are expected to reach COD in 2017 and 2020, (ii) an equity interest in a wind portfolio that includes wind facilities totaling approximately 934 MW of net capacity, the majority of which was sold to the Company on November 3, 2015, and (iii) up to $250 million of equity interests in one or more residential or distributed solar generation portfolios developed by affiliates of NRG.
On June 29, 2015, NRG Yield, Inc. issued
28,198,000
shares of Class C common stock for net proceeds, after underwriting discounts and expenses, of
$599 million
, net of underwriting discounts and commissions of
$21 million
. The Company utilized the proceeds of the offering to acquire
28,198,000
additional Class C units of NRG Yield LLC and, as a result, it currently owns
53.3%
of the economic interests of NRG Yield LLC, with NRG retaining
46.7%
of the economic interests of NRG Yield LLC. Additionally, on June 29, 2015, the Company completed an offering of
$287.5 million
aggregate principal amount of
3.25%
Convertible Notes due 2020.
Uses of Liquidity
The Company's requirements for liquidity and capital resources, other than for operating its facilities, are categorized as: (i) debt service obligations, as described more fully in
Note 8
,
Long-term Debt
; (ii) capital expenditures; (iii) acquisitions and investments; and (iv) cash dividends to investors.
Capital Expenditures
The Company's capital spending program is mainly focused on maintenance capital expenditures, or costs to maintain the assets currently operating, such as costs to replace or refurbish assets during routine maintenance. The Company develops annual capital spending plans based on projected requirements for maintenance capital. For the
nine months
ended
September 30, 2015
, and
2014
, the Company used approximately
$16 million
and
$28 million
, respectively, to fund capital expenditures. The capital expenditures in the first
nine months
of 2015 relate to maintenance expenses in the amount of $7 million, as well as growth expenditures for the thermal projects in the amount of $9 million.
In January 2015, El Segundo experienced a steam turbine water intrusion resulting in a forced outage on Units 5 and 6. The units returned to service in April 2015. The Company completed a root cause analysis and has implemented steps to prevent a recurrence of the event. The Company reviewed the financial impact of repair costs and lost capacity revenue and expects to collect approximately $4 million of insurance proceeds in the fourth quarter of 2015.
44
Acquisitions and Investments
The Company intends to acquire generation assets developed and constructed by NRG in the future, as well as generation and thermal infrastructure assets from third parties where the Company believes its knowledge of the market, operating expertise and access to capital provides a competitive advantage, and to utilize such acquisitions as a means to grow its cash available for distribution. The following acquisitions and investments have occurred to date in 2015:
|
•
|
On November 3, 2015, the Company acquired
75%
of the Class B interests of NRG Wind TE Holdco, which owns a portfolio of 12 wind facilities totaling 814 net MW, from NRG for total cash consideration of
$210 million
, subject to working capital adjustments. The Company will be responsible for its pro-rata share of non-recourse project debt of
$193 million
and noncontrolling interest associated with a tax equity structure of
$165 million
(as of September 30, 2015).
|
|
•
|
On June 30, 2015, the Company sold an economic interest in the Alta X and Alta XI wind facilities through a tax equity financing arrangement and received
$119 million
in net proceeds. These proceeds, as well as proceeds obtained from the Company's equity and debt offerings completed in the second quarter of 2015, as discussed above, were utilized to repay all of the outstanding project indebtedness associated with the Alta X and Alta XI wind facilities.
|
|
•
|
On June 29, 2015, the Company acquired
25%
of the membership interest in Desert Sunlight Investment Holdings, LLC, which owns two solar photovoltaic facilities totaling 550 MW, located in Desert Center, California, from EFS Desert Sun, LLC, a subsidiary of GE Energy Financial Services, for a purchase price of
$285 million
, utilizing a portion of the proceeds from the Class C common stock issuance. The Company's pro-rata share of non-recourse project level debt was
$285 million
as of
September 30, 2015
.
|
|
•
|
On May 7, 2015, the Company acquired a
90.1%
interest in Spring Canyon II, a
34
MW wind facility, and Spring Canyon III, a
29
MW wind facility, each located in Logan County, Colorado, from Invenergy Wind Global LLC. The purchase price was funded with cash on hand. Power generated by Spring Canyon II and Spring Canyon III is sold to Platte River Power Authority under long-term PPAs with approximately
24 years
of remaining contract life.
|
|
•
|
In May 2015, the Company and NRG formed a partnership that will invest in and hold operating portfolios of distributed solar assets developed by NRG Renew, a subsidiary of NRG. The partnership will allow NRG to periodically monetize its distributed solar investments and the Company to invest in a growing segment of the solar market. Under the terms of the partnership agreement, the Company will receive 95% of the economics until achieving a targeted return, expected to be achieved commensurate with the end of the customer contract period, after which NRG will receive 95% of the economics. The Company has initially committed to invest up to
$100 million
of cash contributions into the partnership over time. The partnership is expected to be fully invested over the next 15 months.
|
|
•
|
On April 30, 2015, the Company completed the acquisition of the University of Bridgeport Fuel Cell project in Bridgeport, Connecticut from FuelCell Energy, Inc. The project added an additional
1.4
MW of thermal capacity with a
12 year
contract, with the option for a 7-year extension.
|
|
•
|
On April 9, 2015, NRG and the Company entered into a partnership that will invest in and hold operating portfolios of residential solar assets developed by NRG Home Solar, a subsidiary of NRG, including: (i) an existing, unlevered portfolio of over 2,200 leases across nine states representing approximately 17 MW with a weighted average remaining lease term of approximately 17 years, in which the Company invested $26 million in April 2015; and (ii) tax equity-financed portfolios of approximately 13,000 leases representing approximately 90 MW, with an average lease term for the existing and new leases of approximately 17 to 20 years, in which the Company invested
$21 million
of its
$150 million
commitment through
September 30, 2015
.
|
|
•
|
On January 2, 2015, NRG Yield Operating LLC acquired the following projects from NRG: (i) Laredo Ridge, an 80 MW wind facility located in Nebraska; (ii) the Tapestry projects, which include Buffalo Bear, a 19 MW wind facility in Oklahoma; Taloga, a 130 MW wind facility in Oklahoma; and Pinnacle, a 55 MW wind facility in West Virginia; and (iii) Walnut Creek, a 485 MW natural gas facility located in California, for total cash consideration of
$489 million
including adjustments of
$9 million
for working capital, plus assumed project level debt of
$737 million
. The Company funded the acquisition with cash on hand and approximately
$210 million
borrowed under the Company's revolving credit facility.
|
45
Cash Dividends to Investors
The Company intends to use the amount of cash that it receives from its distributions from NRG Yield LLC to pay quarterly dividends to the holders of its Class A common stock and Class C common stock. NRG Yield LLC intends to distribute to its unit holders in the form of a quarterly distribution all of the cash available for distribution that is generated each quarter, less reserves for the prudent conduct of the business, including among others, maintenance capital expenditures to maintain the operating capacity of the assets. Cash available for distribution is defined as earnings before income taxes, depreciation and amortization, excluding contract amortization, cash interest paid, income taxes paid, maintenance capital expenditures, investments in unconsolidated affiliates, growth capital expenditures, net of capital and debt funding, and principal amortization of indebtedness, and including cash distributions from unconsolidated affiliates. Dividends on t
he Class A common stock and Class C common stock are subject to available capital, market conditions, and compliance with associated laws, regulations and other contractual obligations. The Company expects that, based on current circumstances, comparable cash dividends will continue to be paid in the foreseeable future.
As a result of the Recapitalization, the Company adjusted its dividend policy to reflect the additional number of shares of Class C common stock outstanding. The following table lists the dividends paid on the Company's Class A common stock and Class C common stock during the
nine months
ended
September 30, 2015
:
|
Third Quarter 2015
|
Second Quarter 2015
|
First Quarter 2015
|
|||||||||
|
Dividends per Class A share
|
$
|
0.21
|
|
$
|
0.20
|
|
$
|
0.39
|
|
||
|
Dividends per Class C share
|
$
|
0.21
|
|
$
|
0.20
|
|
N/A
|
|
|||
On
November 4, 2015
, the Company announced the declaration of quarterly dividends on its Class A common stock and Class C common stock of
$0.215
per share payable on
December 15, 2015
, to stockholders of record as of
December 1, 2015
.
46
Cash Flow Discussion
The following table reflects the changes in cash flows for the
nine months
ended
September 30, 2015
, compared to
2014
:
|
Nine months ended September 30,
|
2015
|
2014
|
Change
|
||||||||
|
|
(In millions)
|
||||||||||
|
Net cash provided by operating activities
|
$
|
269
|
|
$
|
249
|
|
$
|
20
|
|
||
|
Net cash used in investing activities
|
(896
|
)
|
(1,108
|
)
|
212
|
|
|||||
|
Net cash provided by financing activities
|
346
|
|
1,193
|
|
(847
|
)
|
|||||
Net Cash Provided By Operating Activities
|
Changes to net cash provided by operating activities were driven by:
|
(In millions)
|
||
|
Higher net distributions from unconsolidated affiliates
|
$
|
8
|
|
|
Increase in operating income adjusted for non-cash items and changes in working capital
|
12
|
|
|
|
$
|
20
|
|
|
Net Cash Used In Investing Activities
|
Changes to net cash used in investing activities were driven by:
|
(In millions)
|
||
|
Payments to acquire businesses, net of cash acquired (primarily the Alta acquisition in 2014)
|
$
|
864
|
|
|
Higher payments made to acquire January 2015 Drop Down Assets on January 2, 2015, compared to the payments made on June 30, 2014, for the June 2014 Drop Down Assets
|
(153
|
)
|
|
|
Decrease in capital expenditures due to several projects being placed in service in early 2014
|
12
|
|
|
|
Changes in restricted cash primarily due to cash transfers in connection with higher debt principal payments in 2015
|
(44
|
)
|
|
|
Proceeds from renewable grants in 2014
|
(137
|
)
|
|
|
Increase in net investments in unconsolidated affiliates in 2015, compared to 2014, primarily due to the investment in Desert Sunlight made on June 29, 2015
|
(318
|
)
|
|
|
Other
|
(12
|
)
|
|
|
$
|
212
|
|
|
Net Cash Provided By Financing Activities
|
Changes in net cash provided by financing activities were driven by:
|
(In millions)
|
||
|
Contributions from non-controlling interests in 2015
|
$
|
119
|
|
|
Payment of dividends and returns of capital to NRG, partially offset by contributions from NRG in the first nine months of 2014
|
43
|
|
|
|
Increase in dividends and distributions paid
|
(27
|
)
|
|
|
Lower net proceeds from Class C equity offering on June 29, 2015, compared to the net proceeds from Class A equity offering on July 29, 2014
|
(31
|
)
|
|
|
Increase in debt payments, as well as decrease in proceeds from long-term debt in the first nine months of 2015, compared to 2014
|
(964
|
)
|
|
|
Decrease in debt issuance costs due to lower borrowings in the first nine months of 2015
|
13
|
|
|
|
$
|
(847
|
)
|
|
47
NOLs, Deferred Tax Assets and Uncertain Tax Position Implications, under ASC 740
As of
September 30, 2015
, the Company has a cumulative federal NOL carry forward balance of
$269 million
for financial statement purposes, which will begin expiring in 2033. As a result of the Company's tax position, and based on current forecasts, the Company does not anticipate significant income tax payments for federal, state and local jurisdictions in
2015
.
The Company is subject to examination by taxing authorities for income tax returns filed in the U.S. federal jurisdiction and various state jurisdictions. The Company is not subject to U.S. federal or state income tax examinations for years prior to 2013.
As of
September 30, 2015
, the Company has net deferred tax assets of
$136 million
, which the Company believes are realizable primarily through the generation of future income before income taxes. In order to be able to consider future earnings in the assessment of the realizability of deferred tax assets, generally accepted accounting principles indicate the Company should not have cumulative losses in the recent past. Should the Company determine it cannot utilize estimates of future earnings in its assessment, it could be required to establish a valuation allowance for up to the full amount of its deferred tax asset.
The Company has no uncertain tax benefits.
Off-Balance Sheet Arrangements
Obligations under Certain Guarantee Contracts
The Company may enter into guarantee arrangements in the normal course of business to facilitate commercial transactions with third parties.
Retained or Contingent Interests
The Company does not have any material retained or contingent interests in assets transferred to an unconsolidated entity.
Obligations Arising Out of a Variable Interest in an Unconsolidated Entity
Variable interest in equity investments
— As of
September 30, 2015
, the Company has several investments with an ownership interest percentage of 50% or less in energy and energy-related entities that are accounted for under the equity method. GenConn Energy LLC and Desert Sunlight Investment Holdings LLC are both variable interest entities for which the Company is not the primary beneficiary.
The Company's pro-rata share of non-recourse debt held by unconsolidated affiliates was approximately
$857 million
as of
September 30, 2015
. This indebtedness may restrict the ability of these subsidiaries to issue dividends or distributions to the Company. See also
Note 5
,
Variable Interest Entities, or VIEs
.
Contractual Obligations and Commercial Commitments
The Company has a variety of contractual obligations and other commercial commitments that represent prospective cash requirements in addition to our capital expenditure programs, as disclosed in the Company's 2014 Form 10-K. See also
Note 8
,
Long-term Debt
,
for additional discussion of contractual obligations incurred during
the
nine months
ended
September 30, 2015
.
48
Fair Value of Derivative Instruments
The Company may enter into fuel purchase contracts and other energy-related financial instruments to mitigate variability in earnings due to fluctuations in spot market prices and to hedge fuel requirements at certain generation facilities. In addition, in order to mitigate interest rate risk associated with the issuance of variable rate debt, the Company enters into interest rate swap agreements.
The tables below disclose the activities that include both exchange and non-exchange traded contracts accounted for at fair value in accordance with ASC 820. Specifically, these tables disaggregate realized and unrealized changes in fair value; disaggregate estimated fair values at
September 30, 2015
, based on their level within the fair value hierarchy defined in ASC 820; and indicate the maturities of contracts at
September 30, 2015
. For a full discussion of the Company's valuation methodology of its contracts, see
Derivative Fair Value Measurements
in
Note 6
,
Fair Value of Financial Instruments
.
|
Derivative Activity Gains/(Losses)
|
(In millions)
|
||
|
Fair value of contracts as of December 31, 2014
|
$
|
(115
|
)
|
|
Contracts realized or otherwise settled during the period
|
50
|
|
|
|
Changes in fair value
|
(48
|
)
|
|
|
Fair Value of Contracts as of September 30, 2015
|
$
|
(113
|
)
|
|
Fair Value of Contracts as of September 30, 2015
|
|||||||||||||||||||
|
Maturity
|
|||||||||||||||||||
|
Fair value hierarchy Gains/(Losses)
|
1 Year or Less
|
Greater Than 1 Year to 3 Years
|
Greater Than 3 Years to 5 Years
|
Greater Than 5 Years
|
Total Fair
Value
|
||||||||||||||
|
(In millions)
|
|||||||||||||||||||
|
Level 1
|
$
|
(1
|
)
|
$
|
—
|
|
$
|
—
|
|
$
|
—
|
|
$
|
(1
|
)
|
||||
|
Level 2
|
$
|
(38
|
)
|
$
|
(48
|
)
|
$
|
(19
|
)
|
$
|
(7
|
)
|
$
|
(112
|
)
|
||||
|
Total
|
$
|
(39
|
)
|
$
|
(48
|
)
|
$
|
(19
|
)
|
$
|
(7
|
)
|
$
|
(113
|
)
|
||||
The Company has elected to disclose derivative assets and liabilities on a trade-by-trade basis and does not offset amounts at the counterparty master agreement level. As discussed below in
Quantitative and Qualitative Disclosures about Market Risk -Commodity Price Risk,
NRG, on behalf of the
Company, measures the sensitivity of the portfolio to potential changes in market prices using VaR, a statistical model which attempts to predict risk of loss based on market price and volatility. NRG's risk management policy places a limit on one-day holding period VaR, which limits the net open position.
Critical Accounting Policies and Estimates
The Company's discussion and analysis of the financial condition and results of operations are based upon the consolidated financial statements, which have been prepared in accordance with U.S. GAAP. The preparation of these financial statements and related disclosures in compliance with U.S. GAAP requires the application of appropriate technical accounting rules and guidance as well as the use of estimates and judgments that affect the reported amounts of assets, liabilities, revenues and expenses, and related disclosures of contingent assets and liabilities. The application of these policies necessarily involves judgments regarding future events, including the likelihood of success of particular projects, legal and regulatory challenges, and the fair value of certain assets and liabilities. These judgments, in and of themselves, could materially affect the financial statements and disclosures based on varying assumptions, which may be appropriate to use. In addition, the financial and operating environment may also have a significant effect, not only on the operation of the business, but on the results reported through the application of accounting measures used in preparing the financial statements and related disclosures, even if the nature of the accounting policies has not changed.
On an ongoing basis, the Company evaluates these estimates, utilizing historic experience, consultation with experts and other methods the Company considers reasonable. In any event, actual results may differ substantially from the Company's estimates. Any effects on the Company's business, financial position or results of operations resulting from revisions to these estimates are recorded in the period in which the information that gives rise to the revision becomes known.
49
The Company's significant accounting policies are summarized in
Note 2
,
Summary of Significant Accounting Policies
. The Company identifies its most critical accounting policies as those that are the most pervasive and important to the portrayal of the Company's financial position and results of operations, and that require the most difficult, subjective and/or complex judgments by management regarding estimates about matters that are inherently uncertain. The Company's critical accounting policies include income taxes and valuation allowance for deferred tax assets, impairment of long lived assets and other intangible assets and acquisition accounting.
Recent Accounting Developments
See
Note 2
,
Summary of Significant Accounting Policies
, for a discussion of recent accounting developments.
50
The Company is exposed to several market risks in its normal business activities. Market risk is the potential loss that may result from market changes associated with the Company's power generation or with an existing or forecasted financial or commodity transaction. The types of market risks the Company is exposed to are commodity price risk, interest rate risk, liquidity risk, and credit risk.
Commodity Price Risk
Commodity price risks result from exposures to changes in spot prices, forward prices, volatilities, and correlations between various commodities, such as electricity, natural gas and emissions credits. The Company manages the commodity price risk of its merchant generation operations by entering into derivative or non-derivative instruments to hedge the variability in future cash flows from forecasted power sales or purchases of fuel. The portion of forecasted transactions hedged may vary based upon management's assessment of market, weather, operation and other factors.
Based on a sensitivity analysis using simplified assumptions, the impact of a $0.50 per MMBtu increase or decrease in natural gas prices across the term of the derivative contracts would cause
no
change to the net value of derivatives as of
September 30, 2015
.
Interest Rate Risk
The Company is exposed to fluctuations in interest rates through its issuance of variable rate debt. Exposures to interest rate fluctuations may be mitigated by entering into derivative instruments known as interest rate swaps, caps, collars and put or call options. These contracts reduce exposure to interest rate volatility and result in primarily fixed rate debt obligations when taking into account the combination of the variable rate debt and the interest rate derivative instrument. NRG's risk management policies allow the Company to reduce interest rate exposure from variable rate debt obligations.
Most of the Company's project subsidiaries enter into interest rate swaps, intended to hedge the risks associated with interest rates on non-recourse project level debt. See Note 9,
Long-Term Debt,
to the Company's audited consolidated financial statements included in the Company's 2014 Form 10-K, and
Note 8
,
Long-term Debt
, to this Form 10-Q for more information about interest rate swaps of the Company's project subsidiaries.
If all of the above swaps had been discontinued on
September 30, 2015
, the Company would have owed the counterparties
$116 million
. Based on the investment grade rating of the counterparties, the Company believes its exposure to credit risk due to nonperformance by counterparties to its hedge contracts to be insignificant.
The Company has long-term debt instruments that subject it to the risk of loss associated with movements in market interest rates. As of
September 30, 2015
, a 1% change in interest rates would result in an approximately
$3 million
change in market interest expense on a rolling twelve month basis.
As of
September 30, 2015
, the fair value of the Company's debt was
$4,406 million
and the carrying value was
$4,509 million
. The Company estimates that a 1% decrease in market interest rates would have increased the fair value of its long-term debt by
$372 million
.
Liquidity Risk
Liquidity risk arises from the general funding needs of the Company's activities and in the management of the Company's assets and liabilities.
Counterparty Credit Risk
Credit risk relates to the risk of loss resulting from non-performance or non-payment by counterparties pursuant to the terms of their contractual obligations. The Company monitors and manages credit risk through credit policies that include: (i) an established credit approval process; and (ii) the use of credit mitigation measures such as prepayment arrangements or volumetric limits. Risks surrounding counterparty performance and credit could ultimately impact the amount and timing of expected cash flows. The Company seeks to mitigate counterparty risk by having a diversified portfolio of counterparties.
51
Conclusion Regarding the Effectiveness of Disclosure Controls
and
Procedures
Under the supervision and with the participation of the Company's management, including its principal executive officer, principal financial officer and principal accounting officer, the Company conducted an evaluation of the effectiveness of the design and operation of its disclosure controls and procedures, as such term is defined in Rules 13a-15(e) or 15d-15(e) of the Exchange Act. Based on this evaluation, the Company's principal executive officer, principal financial officer and principal accounting officer concluded that the disclosure controls and procedures were effective as of the end of the period covered by this Quarterly Report on Form 10-Q.
Changes in Internal Control over Financial Reporting
There were no changes in the Company’s internal control over financial reporting (as such term is defined in Rule 13a-15(f) under the Exchange Act) that occurred in the third quarter of
2015
that materially affected, or are reasonably likely to materially affect, the Company’s internal control over financial reporting.
52
None.
Information regarding risk factors appears in Part I, Item 1A,
Risk Factors
in the Company's 2014 Form 10-K. There have been no material changes in the Company's risk factors since those reported in its 2014 Form 10-K.
None.
None.
Not applicable.
None.
|
Number
|
Description
|
Method of Filing
|
||
|
2.1
|
Purchase and Sale Agreement, dated as of September 17, 2015, by and between NRG Energy Gas & Wind Holdings, Inc. and NRG Yield Operating LLC.
|
Incorporated herein by reference to Exhibit 2.1 to the Company's Current Report on Form 8-K filed on September 21, 2015.
|
||
|
31.1
|
Rule 13a-14(a)/15d-14(a) certification of David Crane.
|
Filed herewith.
|
||
|
31.2
|
Rule 13a-14(a)/15d-14(a) certification of Kirkland B. Andrews.
|
Filed herewith.
|
||
|
31.3
|
Rule 13a-14(a)/15d-14(a) certification of David Callen.
|
Filed herewith.
|
||
|
32
|
Section 1350 Certification.
|
Filed herewith.
|
||
|
101 INS
|
XBRL Instance Document.
|
Filed herewith.
|
||
|
101 SCH
|
XBRL Taxonomy Extension Schema.
|
Filed herewith.
|
||
|
101 CAL
|
XBRL Taxonomy Extension Calculation Linkbase.
|
Filed herewith.
|
||
|
101 DEF
|
XBRL Taxonomy Extension Definition Linkbase.
|
Filed herewith.
|
||
|
101 LAB
|
XBRL Taxonomy Extension Label Linkbase.
|
Filed herewith.
|
||
|
101 PRE
|
XBRL Taxonomy Extension Presentation Linkbase.
|
Filed herewith.
|
||
53
SIGNATURES
Pursuant to the requirements of the Securities Exchange Act of 1934, the registrant has duly caused this report to be signed on its behalf by the undersigned thereunto duly authorized.
|
|
NRG YIELD, INC.
(Registrant)
|
|
||
|
|
/s/ DAVID CRANE
|
|
||
|
|
David Crane
|
|
||
|
|
Chief Executive Officer
(Principal Executive Officer)
|
|
||
|
|
||||
|
|
|
|
||
|
|
/s/ KIRKLAND B. ANDREWS
|
|
||
|
|
Kirkland B. Andrews
|
|
||
|
|
Chief Financial Officer
(Principal Financial Officer)
|
|
||
|
|
||||
|
|
|
|
||
|
|
/s/ DAVID CALLEN
|
|
||
|
|
David Callen
|
|
||
|
Date: November 4, 2015
|
Chief Accounting Officer
(Principal Accounting Officer)
|
|
||
|
|
||||
54
TABLE OF CONTENTS
Part I - Financial InformationItem 1 Financial StatementsNote 1 Nature Of BusinessNote 2 Summary Of Significant Accounting PoliciesNote 3 Business AcquisitionsNote 4 Property, Plant and EquipmentNote 5 Variable Interest Entities, Or ViesNote 6 Fair Value Of Financial InstrumentsNote 7 Accounting For Derivative Instruments and Hedging ActivitiesNote 8 Long-term DebtNote 9 Earnings Per ShareNote 10 Changes in Capital StructureNote 11 Segment ReportingNote 12 Income TaxesNote 13 Related Party TransactionsItem 2 Management's Discussion and Analysis Of Financial Condition and The Results Of OperationsItem 3 Quantitative and Qualitative Disclosures About Market RiskItem 4 Controls and ProceduresPart II - Other InformationItem 1 Legal ProceedingsItem 1A Risk FactorsItem 2 Unregistered Sales Of Equity Securities and Use Of ProceedsItem 3 Defaults Upon Senior SecuritiesItem 4 Mine Safety DisclosuresItem 5 Other InformationItem 6 Exhibits