CUSHMAN & WAKEFIELD PLC
UNITED STATES
SECURITIES AND EXCHANGE COMMISSION
Washington, D.C. 20549
FORM 10-K
x
ANNUAL REPORT PURSUANT TO SECTION 13 OR 15( d ) OF THE SECURITIES EXCHANGE
ACT OF 1934
For the fiscal year ended December 31, 2018
or
☐
TRANSITION REPORT PURSUANT TO SECTION 13 OR 15(d) OF THE SECURITIES EXCHANGE ACT OF 1934
For the transition period from to .
Commission File Number 001 - 38611
Cushman & Wakefield plc
(Exact name of registrant as specified in its charter)
|
England and Wales
|
|
98-1193584
|
|
(State or other jurisdiction of
incorporation or organization)
|
|
(I.R.S. Employer
Identification Number)
|
|
|
|
|
|
125 Old Broad Street
London, United Kingdom
|
|
EC2N 1AR
|
|
(Address of principal executive offices)
|
|
(Zip Code)
|
|
|
|
|
|
+20 13296 3000
|
||
|
(Registrant's telephone number, including area code)
|
||
Securities registered pursuant to Section 12(b) of the Act:
|
Title of Each Class
|
|
Name of Each Exchange on Which Registered
|
|
Ordinary Share, $0.10 par value
|
|
New York Stock Exchange
|
Securities registered pursuant to Section 12(g) of the Act: N.A.
Indicate by check mark if the registrant is a well-known seasoned issuer, as defined in Rule 405 of the Securities Act. Yes ☐ No
x
Indicate by check mark if the registrant is not required to file reports pursuant to Section 13 or Section 15(d) of the Act. Yes ☐ No
x
Indicate by check mark whether the registrant (1) has filed all reports required to be filed by Section 13 or 15(d) of the Securities Exchange Act of 1934 during the preceding 12 months (or for such shorter period that the registrant was required to file such reports), and (2) has been subject to such filing requirements for the past 90 days. Yes
x
No ☐
Indicate by check mark whether the registrant has submitted electronically every Interactive Data File required to be submitted pursuant to Rule 405 of Regulation S-T (§232.405 of this chapter) during the preceding 12 months (or for such shorter period that the registrant was required to submit and post such files). Yes
x
No ☐ .
Indicate by check mark if disclosure of delinquent filers pursuant to Item 405 of Regulation S-K (§229.405 of this chapter) is not contained herein, and will not be contained, to the best of registrant's knowledge, in definitive proxy or information statements incorporated by reference in Part III of this Form 10-K or any amendment to the Form 10-K.
x
Indicate by check mark whether the registrant is a large accelerated filer, an accelerated filer, a non-accelerated filer, smaller reporting company, or an emerging growth company. See the definitions of “large accelerated filer,” “accelerated filer,” “smaller reporting company” and “emerging growth company” in Rule 12b-2 of the Exchange Act.
|
Large accelerated filer
|
☐
|
|
Accelerated filer
|
☐
|
|
Non-accelerated filer
|
x
|
|
Smaller reporting company
|
☐
|
|
|
|
|
Emerging growth company
|
☐
|
If an emerging growth company, indicate by check mark if the registrant has elected not to use the extended transition period for complying with any new or revised financial accounting standards provided pursuant to Section 13(a) of the Exchange Act. ☐
Indicate by check mark whether the registrant is a shell company (as defined in Rule 12b-2 of the Exchange Act). Yes ☐ No
x
As of June 29, 2018, the last business day of the registrant's most recently completed second fiscal quarter, there was no established public trading market for the registrant's equity securities.
As of January 31, 2019, the number of ordinary shares outstanding was
216,597,244
.
DOCUMENTS INCORPORATED BY REFERENCE
Portions of the proxy statement for the registrant’s 2019 Annual Meeting of Stockholders are incorporated by reference in Part III of this Annual Report on Form 10-K. The proxy statement will be filed with the U.S. Securities and Exchange Commission within 120 days after the end of the fiscal year to which this report relates.
CUSHMAN & WAKEFIELD plc
ANNUAL REPORT ON FORM 10-K
TABLE OF CONTENTS
|
|
|
|
|
Page
|
|
|
|
|
||
|
PART I
|
|
|
||
|
|
|
|
|
|
|
Item 1.
|
Business
|
|||
|
Item 1A.
|
Risk Factors
|
|||
|
Item 1B.
|
Unresolved Staff Comments
|
|||
|
Item 2.
|
Properties
|
|||
|
Item 3.
|
Legal Proceedings
|
|||
|
Item 4.
|
Mine Safety Disclosures
|
|||
|
PART II
|
||||
|
Item 5.
|
Market for the Registrant's Common Equity, Related Stockholder Matters and Issuer Purchases of Equity Securities
|
|||
|
Item 6.
|
Selected Financial Data
|
|||
|
Item 7.
|
Management's Discussion and Analysis of Financial Condition and Results of Operations
|
|||
|
Item 7A.
|
Quantitative and Qualitative Disclosures About Market Risk
|
|||
|
Item 8.
|
Financial Statements and Supplementary Data
|
|||
|
Item 9.
|
Changes in and Disagreements With Accountants on Accounting and Financial Disclosure
|
|||
|
Item 9A.
|
Controls and Procedures
|
|||
|
Item 9B.
|
Other Information
|
|||
|
|
||||
|
PART III
|
||||
|
Item 10.
|
Directors, Executive Officers and Corporate Governance
|
|||
|
Item 11.
|
Executive Compensation
|
|||
|
Item 12.
|
Security Ownership of Certain Beneficial Owners and Management and Related Stockholder Matters
|
|||
|
Item 13.
|
Certain Relationships and Related Transactions, and Director Independence
|
|||
|
Item 14.
|
Principal Accountant Fees and Services
|
|||
|
PART IV
|
||||
|
Item 15.
|
Exhibits and Financial Statement Schedules
|
|||
|
Schedule II - Valuation and Qualifying Accounts
|
||||
|
Signatures
|
||||
2
PART I
Item 1. Business Overview
Cushman & Wakefield plc (together with its subsidiaries,
“Cushman & Wakefield,”
“
the Company
,”
“we,” “ours” and “us”
) is a preeminent global leading commercial real estate services firm with an iconic brand and approximately
51,000
employees led by an experienced executive team. We operate from
approximately
400
offices in
70
countries, managing approximately 3.6 billion square feet of commercial real estate space on behalf of institutional, corporate and private clients. We serve the world’s real estate owners and occupiers, delivering a broad suite of services through our integrated and scalable platform. Our business is focused on meeting the increasing demands of our clients through a comprehensive offering of services including Property, facilities and project management, Leasing, Capital markets, Valuation and other services. In
2018
,
2017
and
2016
, we generated revenues of
$8.2 billion
,
$6.9 billion
and
$6.2 billion
, respectively, and Fee revenues of
$6.0 billion
,
$5.3 billion
and
$4.8 billion
, respectively. Fee revenue is a non-GAAP financial measure, please refer to Item 7. Management’s Discussion and Analysis of Financial Condition and Results of Operations for a definition of Fee revenue, a description of the purposes for which our management uses Fee revenue and a reconciliation of Fee revenue to revenue.
Since 2014, we have built our company organically and through the combination of DTZ, Cassidy Turley and Cushman & Wakefield, giving us the scale and worldwide footprint to effectively serve our clients’ multinational businesses. The result is a global real estate services firm with the iconic Cushman & Wakefield brand, steeped in over 100 years of leadership. We were recently named #2 in our industry’s top brand study, the Lipsey Company’s Top 25 Commercial Real Estate Brands.
The past several years have been a period of rapid growth and transformation for our company. Our experienced management team has been focused on integrating companies, driving operating efficiencies, realizing cost savings, attracting and retaining talent and improving financial performance. In August 2018, Cushman & Wakefield successfully completed an initial public offering (the "IPO"), listing the firm on the New York Stock Exchange (NYSE: CWK).
Today, Cushman & Wakefield is one of the top three real estate services providers as measured by revenue and workforce. We have made significant investments in technology and workflows to support our growth strategy to improve our productivity and drive better outcomes for our clients. We have built a scalable platform that is well positioned to execute our growth strategy focused on: (i) participating in further industry consolidation; (ii) meeting the growing outsourcing and service needs of our target customer base; and (iii) leveraging our strong competitive position to increase our market share. Our proven track record of strong operational and financial performance leaves us well-positioned to capitalize on the attractive and growing commercial real estate services industry.
Our Principal Services and Regions of Operation
We have organized our business, and report our operating results, through three geographic segments: the Americas; Europe, Middle East and Africa ("EMEA"); and Asia Pacific ("APAC") representing
70%
,
12%
and
18%
of our 2018 revenue and
68%
,
15%
and
17%
of our
2018
Fee revenue, respectively. Within those segments, we operate the following service lines: Property, facilities and project management; Leasing; Capital markets; and Valuation and other, representing
59%
,
23%
,
12%
, and
6%
of our 2018 revenue and
44%
,
32%
,
16%
and
8%
of our
2018
Fee revenue, respectively.
Our Geographical Segments
Our global presence and integrated platform enables us to provide a broad base of services across geographies. We hold leading positions in all of our key markets. This global footprint, complemented with a full suite of service offerings, positions us as one of a small number of providers able to respond to complex global mandates from large multinational occupiers and owners.
By revenue, our largest country was the United States, representing
66%
,
62%
and
62%
of revenue in the
years ended
December 31, 2018
,
2017
and
2016
, respectively, followed by Australia, representing
7%
,
10%
and
10%
of revenue in the
years ended
December 31, 2018
,
2017
and
2016
, respectively.
Our Service Lines
Property, Facilities and Project Management
.
Our largest service line includes property management, facilities management, facilities services and project and development services. Revenues in this service line are recurring in nature, many through multi-year contracts with relatively high switching costs.
3
For occupiers, we offer integrated facilities management, project and development services, portfolio administration, transaction management and strategic consulting. These services are offered individually, or through our global occupier services offering, which provides a comprehensive range of bundled services resulting in consistent quality service and cost savings.
For owners, we offer a variety of property management services, which include client accounting, engineering and operations, lease compliance administration, project and development services and sustainability services.
In addition, we offer self-performed facilities services globally to both owners and occupiers, which include janitorial, maintenance, critical environment management, landscaping and office services.
Fees in this service line are primarily earned on a fixed basis or as a margin applied to the underlying costs. As such, this service line has a large component of revenue that consists of us contracting with third-party providers (engineers, landscapers, etc.) and then passing these expenses on to our clients.
Leasing
.
Our second largest service line, Leasing, consists of two primary sub-services: owner representation and tenant representation. In owner representation leasing, we typically contract with a building owner on a multi-year agreement to lease their available space. In tenant representation leasing, we are typically engaged by a tenant to identify and negotiate a lease for them in the form of a renewal, expansion or relocation. We have a high degree of visibility into Leasing services fees due to contractual renewal dates, leading to renewal, expansion or new lease revenue. In addition, Leasing fees are less cyclical as tenants needs to renew or lease space to operate in all economic conditions.
Leasing fees are typically earned after a lease is signed and are calculated as a percentage of the total value of payments over the life of the lease.
Capital Markets
.
We represent both buyers and sellers in real estate purchase and sales transactions and also arrange financing supporting purchases. Our services include investment sales and equity, debt and structured financing. Fees generated are linked to transactional volume and velocity in the commercial real estate market.
Our Capital markets fees are transactional in nature and generally earned at the close of a transaction.
Valuation and other
.
We provide valuations and advice on real estate debt and equity decisions to clients through the following services: appraisal management; investment management; valuation advisory; portfolio advisory; diligence advisory; dispute analysis and litigation support; financial reporting and property and/or portfolio valuation. Fees are earned on both a contractual and transactional basis.
Industry Overview and Market Trends
We operate in an industry where the increasing complexity of our clients’ real estate operations drives demand for high quality services providers. The sector is fragmented among regional, local and boutique providers. Industry sources estimate that the five largest global firms combined account for less than 20% of the worldwide commercial real estate services industry by revenue. According to industry research, the global commercial real estate industry is expected to grow at approximately 5% per year to more than $4 trillion in 2022, outpacing expected global gross domestic product (“GDP”) growth. The market for global integrated facilities management is expected to grow at approximately 6% per year from 2016 to 2025. Top global services providers, including Cushman & Wakefield, are positioned to grow Fee revenue at a rate faster than GDP as the industry continues to consolidate and evolve, secular outsourcing trends continue, and top firms increase their share of the market.
During the next few years, key drivers of revenue growth for the largest commercial real estate services providers are expected to include:
Occupier Demand for Real Estate Services.
Occupiers are focusing on their core competencies and choosing to outsource commercial real estate services. Multiple market trends like globalization and changes in workplace strategy are driving occupiers to seek third-party real estate services providers as an effective means to reduce costs, improve their operating efficiency and maximize productivity. We believe large corporations generally prefer outsourcing to global firms with fully developed platforms that can provide all the commercial real estate services needed. Today, only three firms, including Cushman & Wakefield, are positioned to meet those expectations.
4
Institutional Investors Owning a Greater Proportion of Global Real Estate.
Institutional owners, such as real estate investment trusts (known as REITs), pension funds, sovereign wealth funds and other financial entities, are acquiring more real estate assets and financing them in the capital markets.
Increased institutional ownership drives demand for services in three ways:
|
◦
|
Increased demand for property management services
- Institutional owners self-perform property management services at a lower rate than private owners, outsourcing more to services providers.
|
|
◦
|
Increased demand for transaction services
- Institutional owners execute real estate transactions at a higher rate than private owners.
|
|
◦
|
Increased demand for advisory services
- Because of a higher transaction rate, there is an opportunity for services providers to grow the number of ongoing advisory engagements.
|
Owners and Occupiers Continue to Consolidate Their Real Estate Services Providers.
Owners and occupiers are consolidating their services provider relationships on a regional, national, and global basis to obtain more consistent execution across markets and to benefit from streamlined management oversight of “single point of contact” service delivery.
Global Services Providers Create Value in a Fragmented Industry.
The global services providers with larger operating platforms can take advantage of economies of scale. Those few firms with scalable operating platforms are best positioned to drive profitability as consolidation in the highly fragmented commercial real estate services industry is expected to continue.
Increasing Business Complexity Creates Opportunities for Technological Innovation.
Organizations have become increasingly complex and are relying more heavily on technology and data to manage their operations. Large global commercial real estate services providers with leading technological capabilities are best positioned to capitalize on this technological trend by better serving their clients’ complex real estate services needs and gaining market share from smaller operators. In addition, integrated technology platforms can lead to margin improvements for the larger global providers with scale.
Our Competitive Strengths
We believe we are well positioned to capitalize on the growth and globalization trends in the commercial real estate services industry due to the following competitive strengths:
Global Size and Scale.
We believe multinational clients prefer to partner with real estate services providers with the scale necessary to meet their needs across multiple geographies and service lines. Often, this scale is a pre- requisite to compete for complex global service mandates. We are one of three global real estate services providers able to deliver such services on a global basis. We have built a platform by investing in our people and technology to enable our approximately
51,000
employees to offer our clients services through an extensive network of
approximately
400
offices across
70
countries. This scale provides operational leverage, translating revenue growth into increased profitability.
Breadth of Our Service Offerings.
We offer our clients a fully integrated commercial real estate services experience across Property, facilities and project management, Leasing, Capital markets, and Valuation and other services. These services can be bundled into regional, national and global contracts and/or delivered locally for individual assignments to meet the needs of a wide range of client types. Regardless of a client’s assignment, we view each interaction with our clients as an opportunity to deliver an exceptional experience by offering a full platform of services, while deepening and strengthening our relationships.
5
Comprehensive Technology Strategy
.
Our technology strategy focuses on (i) delivering high-value client outcomes, (ii) increasing employee productivity and connectedness and (iii) driving business change through innovation. We have invested significantly in our technology platform over the last several years. This has improved service delivery and client outcomes. We have deployed enterprise-wide financial, human capital and client relationship management systems, such as Workday and Salesforce, to increase global connectivity and productivity. We are focused on innovative solutions that improve the owner or occupier experience. As we continue to drive innovation for our clients, we have created strategic opportunities and partnerships with leading technology organizations, start-ups and property technology firms (such as Metaprop NYC).
Our Iconic Brand.
The history of our franchise and brand is one of the oldest and most respected in the industry. Our founding predecessor firm, DTZ, traces its history back to 1784 with the founding of Chessire Gibson in the U.K. Our brand, Cushman & Wakefield, was founded in 1917 in New York. Today, this pedigree, heritage and continuity of brand continues to be recognized by our clients, employees and the industry. Recently, Cushman & Wakefield was recognized in the top 2 by a leading industry ranking of the Top 25 Commercial Real Estate Brands. In addition, according to leading industry publications, we have held the top positions in real estate sectors like U.S. industrial brokerage, U.S. retail brokerage and U.K. office brokerage, and have been consistently ranked among the International Association of Outsourcing Professionals’, or IAOP, top 100 outsourcing professional service firms. In 2018, Forbes named Cushman & Wakefield on its list of America’s Best Large Employers and we were named the top CRE advisor in the world by Euromoney.
Significant Recurring Revenue Provides Durable Platform.
In
2018,
88%
of revenue and
nearly
85%
of Fee revenue was generated from service lines that have proven to be more resilient to changing economic conditions. Our Property, facilities and project management service line, which is recurring and contractual in nature, generated
59%
of our revenue and
44%
of our Fee revenue in
2018
. Additionally, services with high visibility including our Leasing and Valuation and other service lines generated
29%
of our revenue and
40%
of our Fee revenue in
2018
. These revenue streams have provided greater stability to our cash flows and underlying business.
Top Talent in the Industry
.
For years, our people have earned a strong reputation by successfully executing some of the most iconic and complex real estate assignments in the world. Because of this legacy of excellence, our leading platform and brand strength, we attract and retain some of the top talent in the industry. We provide our employees with training growth opportunities to support their ongoing success. In addition, we are focused on management development to drive strong operational performance and continuing innovation. The investment into our talent helps to foster a strong organizational culture, leading to employee satisfaction. This was confirmed recently when a global employee survey, which was benchmarked against other top organizations, showed our employees have a strong sense of pride in Cushman & Wakefield and commitment to our firm.
Capital-Light Business Model
.
We generate strong cash flow through our low capital intensive business model and focused and disciplined capital deployment. We target average capital expenditures to be less than 1% of revenue in the near to medium term. We expect to reinvest this cash flow into our services platform as well as infill M&A to continue to drive growth.
Best-In-Class Executive Leadership and Sponsorship.
Our executive management team possesses a diverse set of backgrounds across complementary expertise and disciplines. Our Executive Chairman and Chief Executive Officer ("CEO"), Brett White, has more than 33 years of commercial real estate experience successfully leading the largest companies in our sector. John Forrester, our President, was previously the CEO of DTZ where he began his career in 1988. Our Chief Financial Officer ("CFO"), Duncan Palmer, has held senior financial positions in global organizations across various industries over his career, including serving as CFO of Owens Corning and RELX Group.
TPG Global LLC (
together with its affiliates, “TPG”),
PAG Asia Capital ("PAG") and Ontario Teachers' Pension Plan Board ("OTPP"), collectively referred to as our Principal Shareholders have supported our growth initiatives and have a proven track record of investing and growing industry-leading businesses like ours. As of December 31, 2018, our Principal Shareholders collectively held approximately
64
% of our outstanding ordinary shares. This group of Principal Shareholders brings with them years of institutional investing and stewardship with deep knowledge and experience sponsoring public companies.
6
Our Growth Strategy
We have built an integrated, global services platform that delivers the best outcomes for clients locally, regionally and globally. Our primary business objective is growing revenue and profitability by leveraging this platform to provide our clients with excellent service. We are focused on executing the following strategies to support our growth objectives:
Recruit, Hire and Retain Top Talent
.
We attract and retain high quality employees. These employees produce superior client results and position us to win additional business across our platform. Our real estate professionals come from a diverse set of backgrounds, cultures and expertise that creates a culture of collaboration and a tradition of excellence. We believe our people are the key to our business and we have instilled an atmosphere of collective success.
Expand Margins Through Operational Excellence
.
Our management team has driven integration benefits during the period of our ownership by the Principal Shareholders resulting in significant margin expansion through organic operational improvements, the successful realization of synergies from previous acquisitions and developing economies of scale. Adjusted EBITDA margins have expanded since our inception in 2014. We expect to continue to grow margin and view it as a primary measure of productivity.
Leverage Breadth of Services to Provide Superior Client Outcomes.
Our current scale and position creates a significant opportunity for growth by delivering more services to existing clients across multiple service lines. Following the DTZ, Cassidy Turley and Cushman & Wakefield mergers, many of our clients realized more value by bundling multiple services, giving them instant access to global scale and better solutions through multidisciplinary service teams. As we continue to add depth and scale to our growing platform, we create more opportunities to do more for our clients, leading to increased organic growth.
Continue to Deploy Capital Around Our Infill M&A Strategy
.
We have an ongoing pipeline of potential acquisitions to improve our offerings to clients across geographies and service lines. We are highly focused on the successful execution of our acquisition strategy and have been successful at targeting, acquiring and integrating real estate services providers to broaden our geographic and specialized service capabilities. The opportunities offered by infill acquisitions are additive to our platform as we continue to grow our business. We expect to be able to continue to find, acquire and integrate acquisitions to drive growth and improve profitability, in part by leveraging our scalable platform and technology investments. Infill opportunities occur across all geographies and service lines and over time we expect to invest in acquisitions with recurring and more visible revenue streams.
Deploy Technology to Improve Client Experience
.
Through the integration of DTZ, Cassidy Turley and Cushman & Wakefield, we invested heavily in technology platforms, workflow processes and systems to improve client engagement and outcomes across our service offerings. The recent timeframe of these investments has allowed us to adopt best-in-class systems that work together to benefit our clients and our business. These systems are scalable to efficiently onboard new businesses and employees without the need for significant additional capital investment in new systems. In addition, our investments in technology have helped us attract and retain key employees, enable productivity improvements that contribute to margin expansion and strongly positioned us to expand the number and types of service offerings we deliver to our key global customers. We have made significant investments to streamline and integrate these systems, which are now part of a fully integrated platform supported by an efficient back- office.
Competition
We compete across a variety of geographies, markets and service lines within the commercial real estate services industry. Each of the service lines in which we operate is highly competitive on a global, national, regional and local level. While we are one of the three largest global commercial real estate services firms as measured by Fee revenue and workforce, our relative competitive position varies by geography and service line. Depending on the product or service, we face competition from other commercial real estate services providers, institutional lenders, in-house corporate real estate departments, investment banking firms, investment managers, accounting firms and consulting firms. Although many of our competitors across our larger service lines are smaller local or regional firms, they may have a stronger presence in certain markets. We are also subject to competition from other large national and multinational firms that have similar service competencies and geographic footprint to ours, including
Jones Lang LaSalle Incorporated (NYSE:JLL) and CBRE Group, Inc. (NYSE: CBRE)
.
7
Corporate Information
DTZ Jersey Holdings Limited, our parent company prior to the restructuring, is a Jersey limited company that was formed in 2014 in connection with the purchase of DTZ from UGL Limited. On July 6, 2018, the shareholders of DTZ Jersey Holdings Limited exchanged their shares in DTZ Jersey Holdings Limited for interests in newly issued shares of Cushman & Wakefield Limited (the “Share Exchange”), a private limited company incorporated in England and Wales. On July 19, 2018, Cushman & Wakefield Limited re-registered as a public limited company organized under the laws of England and Wales (the “Re-registration”) named Cushman & Wakefield plc. On July 20, 2018, the Company undertook a share consolidation of its outstanding ordinary shares (the “Share Consolidation”), which resulted in a proportional decrease in the number of ordinary shares outstanding as well as corresponding adjustments to outstanding options and restricted share units (“RSUs”). On August 6, 2018, the Company closed the IPO of its ordinary shares.
Cushman & Wakefield plc does not conduct any operations other than with respect to its direct and indirect ownership of its subsidiaries, and its business operations are conducted primarily out of its indirect operating subsidiary, DTZ Worldwide Limited. Our corporate headquarters are located at 225 West Wacker Drive, Chicago, Illinois. Our website address is www.cushmanwakefield.com. The information contained on, or accessible through, our website is not part of or incorporated into this Form 10-K.
Our History
In 2014, our Principal Shareholders started our company in its current form, with the purchase of DTZ from UGL Limited. At the end of 2014, the Principal Shareholders acquired and combined Cassidy Turley with DTZ. Finally, in 2015, we completed our transformative growth with the acquisition of Cushman & Wakefield. The company was combined under the name Cushman & Wakefield in September 2015.
References in this Form 10-K to “DTZ” are to the DTZ Group legacy property services business of UGL Limited, acquired by our Principal Shareholders on November 5, 2014, references to “Cassidy Turley” are to the legacy Cassidy Turley companies, acquired by our Principal Shareholders and combined with us on December 31, 2014 and references to the “C&W Group” (or to “Cushman & Wakefield” where historical context requires) are to C&W Group, Inc., the legacy Cushman & Wakefield business, acquired by our Principal Shareholders and combined with us on September 1, 2015.
As part of the IPO we underwent a restructuring from our former holding company, a Jersey limited company, DTZ Jersey Holdings Limited, to a public limited company organized under the laws of England and Wales named Cushman & Wakefield plc.
Our Owner and Occupier Clients
Our clients include a full range of real estate owners and occupiers, including tenants, investors and multi- national corporations in numerous markets, including office, retail, industrial, multifamily, student housing, hotels, data center, healthcare, self-storage, land, condominium conversions, subdivisions and special use. Our clients vary greatly in size and complexity, and include for-profit and non-profit entities, governmental entities and public and private companies.
Seasonality
The market for some of our products and services is seasonal, especially in the Leasing and Capital markets service lines. Generally, our industry is focused on completing transactions by calendar year-end, with a significant concentration in the last quarter of the calendar year
while certain expenses are recognized more evenly throughout the calendar year
. Historically, our revenue and operating income tend to be lowest in the first quarter, and highest in the fourth quarter of each year.
The Property, facilities and project management service line partially mitigates this intra-year seasonality, due to the recurring nature of this service line, which generates more stable revenues throughout the year.
The seasonality of Fee revenue flows through to our net income and cash flow from operations.
Intellectual Property
We hold various trademarks and trade names worldwide, which include the “Cushman & Wakefield,” and “DTZ” names. Although we believe our intellectual property plays a role in maintaining our competitive position in a number of the markets that we serve, we do not believe we would be materially adversely affected by expiration or termination of our trademarks or trade names or the loss of any of our other intellectual property rights other than the “Cushman & Wakefield” name. We primarily operate under the “Cushman & Wakefield” name and have generally adopted a strategy of having our acquisitions transition to the “Cushman & Wakefield” name. We own
8
numerous domain names and have registered numerous trademarks and/or service marks globally. With respect to the Cushman & Wakefield name, we have processed and continuously maintain trademark registration for this trade name in most jurisdictions where we conduct business. We obtained our most recent U.S. trademark registrations for the Cushman & Wakefield name and logo in 2017, and these registrations would expire in 2027 if we failed to renew them.
Executive Officers of the Registrant
See "Item 10. Directors, Executive Officers and Corporate Governance" in Part III.
Employees
As of
December 31, 2018
, we had approximately
51,000
employees worldwide. Our employees include management, brokers, and other sales staff, administrative specialists,
valuation specialists,
maintenance, landscaping, janitorial and office staff and others.
Across our Property, facilities and project management, Leasing, Capital markets, and Valuation and other service lines, our employees are compensated in different manners in line with the common practice in their professional field and geographic region. Many of our real estate professionals in the Americas and in certain international markets work on a commission basis, particularly our Leasing and Capital markets professionals in the United States. Commissions are tied to the value of individual or team-based transactions and subject to fluctuation. Many of our similar real estate professionals in EMEA and Asia Pacific work on a salary basis, with an additional performance bonus based on a share of the profits of their business unit or team. Even within our geographic segments, our service lines utilize a varied mix of professional and non-salaried employees.
As of
December 31, 2018
, approximately 17% of our employees were subject to collective bargaining agreements, the substantial majority of whom are employees in facilities services, including janitorial, security and mechanical maintenance services.
We consider relations with our employees to be good.
Regulation
The brokerage of real estate sales and leasing transactions, property and facilities management, conducting real estate valuation and securing debt for clients, among other service lines, require that we comply with regulations affecting the real estate industry and maintain licenses in the various jurisdictions in which we operate. Like other market participants that operate in numerous jurisdictions and in various service lines, we must comply with numerous regulatory regimes.
A number of our services, including the services provided by certain of our indirect wholly-owned subsidiaries in the U.S., U.K., France and Japan, are subject to regulation and oversight by the SEC, FINRA, the Defense Security Service, the U.K. Financial Conduct Authority, the Autorité des Marchés Financiers (France), the Financial Services Agency (Japan), the Ministry of Land, Infrastructure, Transport and Tourism (Japan) or other self-regulatory organizations and foreign and state regulators, and compliance failures or regulatory action could adversely affect our business. We could be required to pay fines, return commissions, have a license suspended or revoked or be subject to other adverse action if we conduct regulated activities without a license or violate applicable rules and regulations. Licensing requirements could also impact our ability to engage in certain types of transactions, change the way in which we conduct business or affect the cost of conducting business. We and our licensed associates may be subject to various obligations and we could become subject to claims by regulators and/or participants in real estate sales or other services claiming that we did not fulfill our obligations. This could include claims with respect to alleged conflicts of interest where we act, or are perceived to be acting, for two or more clients. While management has overseen highly regulated businesses before and expects us to comply with all applicable regulations in a satisfactory manner, no assurance can be given that it will always be the case. In addition, federal, state and local laws and regulations impose various environmental zoning restrictions, use controls and disclosure obligations that impact the management, development, use and/or sale of real estate. Such laws and regulations tend to discourage sales and leasing activities, as well as mortgage lending availability, with respect to such properties. In our role as property or facilities manager, we could incur liability under environmental laws for the investigation or remediation of hazardous or toxic substances or wastes relating to properties we currently or formerly managed. Such liability may be imposed without regard for the lawfulness of the original disposal activity, or our knowledge of, or fault for, the release or contamination.
Applicable laws and contractual obligations to property owners could also subject us to environmental liabilities through our provision of management services. Environmental laws and regulations impose liability on current or previous real property owners or operators for the cost of investigating, cleaning up or removing contamination caused by hazardous or toxic substances at the property. As a result, we may be held liable as an operator for
9
such costs in our role as an on-site property manager. This liability may result even if the original actions were legal and we had no knowledge of, or were not responsible for, the presence of the hazardous or toxic substances. Similarly, environmental laws and regulations impose liability for the investigation or cleanup of off-site locations upon parties that disposed or arranged for disposal of hazardous wastes at such locations. As a result, we may be held liable for such costs at landfills or other hazardous waste sites where wastes from our managed properties were sent for disposal. Under certain environmental laws, we could also be held responsible for the entire amount of the liability if other responsible parties are unable to pay. We may also be liable under common law to third parties for property damages and personal injuries resulting from environmental contamination at our sites, including the presence of asbestos-containing materials or lead-based paint. Insurance coverage for such matters may be unavailable or inadequate to cover our liabilities. Additionally, liabilities incurred to comply with more stringent future environmental requirements could adversely affect any or all of our service lines.
Item 1A. Risk Factors
An investment in our ordinary shares involves risks and uncertainty, including, but not limited to, the risk factors described below. If any of the risks described below actually occur, our business, financial condition and results of operations could be materially and adversely affected. You should carefully consider the risks and uncertainties described below as well as our audited Consolidated Financial Statements and related notes, when evaluating the information contained in this report.
The success of our business is significantly related to general economic conditions and, accordingly, our business, operations and financial condition could be adversely affected by economic slowdowns, liquidity crises, fiscal or political uncertainty and possible subsequent downturns in commercial real estate asset values, property sales and leasing activities in one or more of the geographies or industry sectors that we or our clients serve.
Periods of economic weakness or recession, significantly rising interest rates, fiscal or political uncertainty, market volatility, declining employment levels, declining demand for commercial real estate, falling real estate values, disruption to the global capital or credit markets or the public perception that any of these events may occur may negatively affect the performance of some or all of our service lines.
Our results of operations are significantly impacted by economic trends, government policies and the global and regional real estate markets. These include the following: overall economic activity, changes in interest rates, the impact of tax and regulatory policies, the cost and availability of credit and the geopolitical environment.
Adverse economic conditions or political or regulatory uncertainty could also lead to a decline in property sales prices as well as a decline in funds invested in existing commercial real estate assets and properties planned for development, which in turn could reduce the commissions and fees that we earn. In addition, economic downturns may reduce demand for our Valuation and other service line and sales transactions and financing services in our Capital markets service line.
The performance of our property management services depends upon the performance of the properties we manage. This is because our fees are generally based on a percentage of rent collections from these properties. Rent collections may be affected by many factors, including: (1) real estate and financial market conditions prevailing generally and locally; (2) our ability to attract and retain creditworthy tenants, particularly during economic downturns; and (3) the magnitude of defaults by tenants under their respective leases, which may increase during distressed economic conditions.
Our service lines could also suffer from political or economic disruptions that affect interest rates or liquidity or create financial, market or regulatory uncertainty. For example, the U.K. has submitted formal notification under Article 50 of the Lisbon Treaty to the European Council of the U.K. to withdraw its membership in the European Union (commonly known as “Brexit”). The lack of clarity about applicable future laws, regulations or treaties as the United Kingdom negotiates the terms of withdrawal, as well as the operation of any such rules pursuant to any withdrawal terms, including financial laws and regulations, tax and free trade agreements, intellectual property rights, environmental, health and safety laws and regulations, immigration laws, employment laws and other rules that may apply to us, could increase our costs, restrict our access to capital within the United Kingdom and the European Union, and depress economic activity. Speculation about the terms and consequences of Brexit for the United Kingdom and other European Union members has caused and may continue to cause market volatility and currency fluctuations and adversely impact our clients’ confidence, which has resulted and may continue to result in a deterioration in our EMEA segment as leasing and investing activity slowed. Asset valuations, currency
10
exchange rates and credit ratings may be especially subject to increased market volatility.
In continental Europe and Asia Pacific, the economies in certain countries where we operate can be uncertain, which may adversely affect our financial performance. Economic, political and regulatory uncertainty as well as significant changes and volatility in the financial markets and business environment, and in the global landscape, make it increasingly difficult for us to predict our financial performance into the future. As a result, any guidance or outlook that we provide on our performance is based on then-current conditions, and there is a risk that such guidance may turn out to be inaccurate.
We have numerous local, regional and global competitors across all of our service lines and the geographies that we serve, and further industry consolidation, fragmentation or innovation could lead to significant future competition.
We compete across a variety of service lines within the commercial real estate services and investment industry, including Property, facilities and project management, Leasing, Capital markets (including representation of both buyers and sellers in real estate sales transactions and the arrangement of financing), and advisory on real estate debt and equity decisions. Although we are one of the largest commercial real estate services firms in the world as measured by
2018
revenue, our relative competitive position varies significantly across geographies, property types and service lines. Depending on the geography, property type or service line, we face competition from other commercial real estate services providers and investment firms, including outsourcing companies that have traditionally competed in limited portions of our property, facilities management and project management service line and have expanded their offerings from time to time, in-house corporate real estate departments, developers, institutional lenders, insurance companies, investment banking firms, investment managers, accounting firms and consulting firms. Some of these firms may have greater financial resources allocated to a particular geography, property type or service line than we have allocated to that geography, property type or service line. In addition, future changes in laws could lead to the entry of other new competitors, such as financial institutions. Although many of our existing competitors are local or regional firms that are smaller than we are, some of these competitors are larger on a local or regional basis. We are further subject to competition from large national and multinational firms that have similar service and investment competencies to ours, and it is possible that further industry consolidation could lead to much larger and more formidable competitors globally or in the particular geographies, property types, service lines that we serve. Our industry has continued to consolidate, as evidenced by CBRE Group, Inc.’s 2015 acquisition of the facilities management business of Johnson Controls, Inc., Jones Lang LaSalle Incorporated’s 2011 acquisition of King Sturge in Europe and other recent consolidations. Beyond our two direct competitors, CBRE Group, Inc. and Jones Lang LaSalle Incorporated, the sector is highly fragmented amongst regional, local and boutique providers. Although many of our competitors across our larger product and service lines are smaller local or regional firms, they may have a stronger presence in their core markets than we do. In addition, disruptive innovation by existing or new competitors could alter the competitive landscape in the future and require us to accurately identify and assess such changes and make timely and effective changes to our strategies and business model to compete effectively. There is no assurance that we will be able to compete effectively, to maintain current fee levels or margins, or maintain or increase our market share.
Adverse developments in the credit markets may harm our business, results of operations and financial condition.
Our Capital markets (including representation of buyers and sellers in sales transactions and the arrangement of financing) and Valuation and other service lines are sensitive to credit cost and availability as well as marketplace liquidity. Additionally, the revenues in all of our service lines are dependent to some extent on the overall volume of activity (and pricing) in the commercial real estate market.
Disruptions in the credit markets may adversely affect our advisory services to investors, owners, and occupiers of real estate in connection with the leasing, disposition and acquisition of property. If our clients are unable to procure credit on favorable terms, there may be fewer completed leasing transactions, dispositions and acquisitions of property. In addition, if purchasers of commercial real estate are not able to obtain favorable financing, resulting in the lack of disposition and acquisition opportunities for our projects, our Valuation and other and Capital markets service lines may be unable to generate incentive fees.
Our operations are subject to social, political and economic risks in different countries as well as foreign currency volatility.
We conduct a significant portion of our business and employ a substantial number of people outside of the United States and as a result, we are subject to risks associated with doing business globally. Our business consists of
11
service lines operating in multiple regions inside and outside of the United States. Outside of the United States, we generate earnings in other currencies and our operating performance is subject to fluctuations relative to the U.S. dollar, or USD. As we continue to grow our international operations through acquisitions and organic growth, these currency fluctuations have the potential to positively or adversely affect our operating results measured in USD. It can be difficult to compare period-over-period financial statements when the movement in currencies against the USD does not reflect trends in the local underlying business as reported in its local currency.
Due to the constantly changing currency exposures to which we are subject and the volatility of currency exchange rates, we cannot predict the effect of exchange rate fluctuations upon future operating results. For example, Brexit was associated with a significant decline in the value of the British pound sterling against the USD in 2016 and negotiations with respect to the terms of the U.K.’s withdrawal or other changes to the membership or policies of the European Union, or speculation about such events, may be associated with increased volatility in the British pound sterling or other foreign currency exchange rates against the USD.
In addition to exposure to foreign currency fluctuations, our international operations expose us to international economic trends as well as foreign government policy measures. Additional circumstances and developments related to international operations that could negatively affect our business, financial condition or results of operations include, but are not limited to, the following factors:
|
•
|
difficulties and costs of staffing and managing international operations among diverse geographies, languages and cultures;
|
|
•
|
currency restrictions, transfer pricing regulations and adverse tax consequences, which may affect our ability to transfer capital and profits;
|
|
•
|
adverse changes in regulatory or tax requirements and regimes or uncertainty about the application of or the future of such regulatory or tax requirements and regimes;
|
|
•
|
the responsibility of complying with numerous, potentially conflicting and frequently complex and changing laws in multiple jurisdictions, e.g., with respect to data protection, privacy regulations, corrupt practices, embargoes, trade sanctions, employment and licensing;
|
|
•
|
the responsibility of complying with the U.S. Foreign Corrupt Practices Act (the “FCPA”), the U.K. Bribery Act and other anti-bribery, anti-money laundering and corruption laws;
|
|
•
|
the impact of regional or country-specific business cycles and economic instability;
|
|
•
|
greater difficulty in collecting accounts receivable in some geographic regions such as Asia, where many countries have underdeveloped insolvency laws;
|
|
•
|
a tendency for clients to delay payments in some European and Asian countries;
|
|
•
|
political and economic instability in certain countries;
|
|
•
|
foreign ownership restrictions with respect to operations in certain countries, particularly in Asia Pacific and the Middle East, or the risk that such restrictions will be adopted in the future; and
|
|
•
|
changes in laws or policies governing foreign trade or investment and use of foreign operations or workers, and any negative sentiments as a result of any such changes to laws or policies or due to trends such as populism, economic nationalism and against multinational companies.
|
Our business activities are subject to a number of laws that prohibit various forms of corruption, including local laws that prohibit both commercial and governmental bribery and anti-bribery laws that have a global reach, such as the FCPA and the U.K. Bribery Act. Additionally, our business activities are subject to various economic and trade sanctions programs and import and export control laws, including (without limitation) the economic sanctions rules and regulations administered by the U.S. Treasury Department’s Office of Foreign Assets Control (“OFAC”), which prohibit or restrict transactions or dealings with specified countries and territories, their governments, and-in certain circumstances, their nationals, as well as with individuals and entities that are targeted by list-based sanctions programs. We maintain written policies and procedures and implement anti-corruption and anti-money laundering compliance programs, as well as programs designed to enable us to comply with applicable economic and trade sanctions programs and import and export control laws (“Compliance Programs”). However, coordinating our activities to address the broad range of complex legal and regulatory environments in which we operate
12
presents significant challenges. Our current Compliance Programs may not address the full scope of all possible risks, or may not be adhered to by our employees or other persons acting on our behalf. Accordingly, we may not be successful in complying with regulations in all situations and violations may result in criminal or civil sanctions, including material monetary fines, penalties, equitable remedies (including disgorgement), and other costs against us or our employees, and may have a material adverse effect on our reputation and business.
In addition, we have penetrated, and seek to continue to enter into, emerging markets to further expand our global platform. However, certain countries in which we operate may be deemed to present heightened business, operational, legal and compliance risks. We may not be successful in effectively evaluating and monitoring the key business, operational, legal and compliance risks specific to those markets. The political and cultural risks present in emerging countries could also harm our ability to successfully execute our operations or manage our service lines there.
Our success depends upon the retention of our senior management, as well as our ability to attract and retain qualified and experienced employees.
We are dependent upon the retention of our Leasing and Capital markets professionals, who generate a significant amount of our revenues, as well as other revenue producing professionals. The departure of any of our key employees, including our senior executive leadership, or the loss of a significant number of key revenue producers, if we are unable to quickly hire and integrate qualified replacements, could cause our business, financial condition and results of operations to suffer. Competition for these personnel is significant, and our industry is subject to a relatively high turnover of brokers and other key revenue producers, and we may not be able to successfully recruit, integrate or retain sufficiently qualified personnel. In addition, the growth of our business is largely dependent upon our ability to attract and retain qualified support personnel in all areas of our business. We and our competitors use equity incentives and sign-on and retention bonuses to help attract, retain and incentivize key personnel. As competition is significant for the services of such personnel, the expense of such incentives and bonuses may increase and we may be unable to attract or retain such personnel to the same extent that we have in the past. Any significant decline in, or failure to grow, our ordinary share price may result in an increased risk of loss of these key personnel. Furthermore, shareholder influence on our compensation practices, including our ability to issue equity compensation, may decrease our ability to offer attractive compensation to key personnel and make recruiting, retaining and incentivizing such personnel more difficult. If we are unable to attract and retain these qualified personnel, our growth may be limited and our business and operating results could suffer.
We rely on our Principal Shareholders.
We have in recent years depended on our relationship with our Principal Shareholders to help guide our business plan. Our Principal Shareholders have significant expertise in operational, financial, strategic and other matters. This expertise has been available to us through the representatives the Principal Shareholders have had on our board of directors and as a result of our previous management services agreement with the Principal Shareholders. In connection with the IPO, we ended our management services agreement with
TPG and PAG, which provided for management and transaction advisory services.
Pursuant to a shareholders’ agreement we have entered into with our Principal Shareholders, representatives of the Principal Shareholders have the ability to appoint five of the seats on our board of directors, and as a result Jonathan Coslet, Timothy Dattels, Qi Chen, Lincoln Pan, and Rajeev Ruparelia have been appointed to our board of directors.
In addition, the Principal Shareholders jointly have the right to designate for nomination one additional director, who must qualify as independent under the NYSE rules and must meet the independence requirements of Rule 10A-3 of the Securities Exchange Act of 1934, as amended (the “Exchange Act”). The Principal Shareholders nominated Jodie McLean, who qualifies as an independent director under Rule 10A-3 of the Exchange Act, to the board of directors pursuant to this right.
In the future, the Principal Shareholders may elect to reduce their ownership in our company or reduce their involvement on our board of directors, which could reduce or eliminate the benefits we have historically achieved through our relationship with them.
Pursuant to the registration rights agreement we entered into with our Principal Shareholders in connection with our IPO, the Principal Shareholders have the right from time to time to require us to register their ordinary shares under the Securities Act for sale into the public markets. If the Principal Shareholders exercise their registration rights and reduce their ownership in us, we could gradually lose their support, which may have adverse consequences on our business.
Our growth has benefited significantly from acquisitions, which may not perform as expected, and similar opportunities may not be available in the future.
A significant component of our growth over time has been generated by acquisitions. Starting in 2014, the Principal
13
Shareholders and management have built our company through the combination of DTZ, Cassidy Turley and C&W Group. Any future growth through acquisitions will depend in part upon the continued availability of suitable acquisition candidates at favorable prices and upon advantageous terms and conditions, which may not be available to us, as well as sufficient funds from our cash on hand, cash flow from operations, existing debt facilities and additional indebtedness to fund these acquisitions. We may incur significant additional debt from time to time to finance any such acquisitions, subject to the restrictions contained in the documents governing our then-existing indebtedness. If we incur additional debt, the risks associated with our leverage, including our ability to service our then-existing debt, would increase. Acquisitions involve risks that business judgments concerning the value, strengths and weaknesses of businesses acquired may prove incorrect. Future acquisitions and any necessary related financings also may involve significant transaction-related expenses, which include severance, lease termination, transaction and deferred financing costs, among others. See “- Despite our current indebtedness levels, we and our subsidiaries may still be able to incur substantially more debt, which could further exacerbate the risks associated with our substantial leverage.”
We have had, and may continue to experience, challenges in integrating operations, brands and information technology systems acquired from other companies. This could result in the diversion of management’s attention from other business concerns and the potential loss of our key employees or clients or those of the acquired operations. The integration process itself may be disruptive to our business and the acquired company’s businesses as it requires coordination of geographically diverse organizations and implementation of new branding, i.e., transitioning to the “Cushman & Wakefield” brand, and accounting and information technology systems. There is generally an adverse impact on net income for a period of time after the completion of an acquisition driven by transaction-related and integration expenses. Acquisitions also frequently involve significant costs related to integrating information technology and accounting and management services.
We complete acquisitions with the expectation that they will result in various benefits, including enhanced revenues, a strengthened market position, cross-selling opportunities, cost synergies and tax benefits. Achieving the anticipated benefits of these acquisitions is subject to a number of uncertainties, including the realization of accretive benefits in the timeframe anticipated, whether we will experience greater-than-expected attrition from professionals licensed or associated with acquired firms and whether we can successfully integrate the acquired business. Failure to achieve these anticipated benefits could result in increased costs, decreases in the amount of expected revenues and diversion of management’s time and energy, which could in turn materially and adversely affect our overall business, financial condition and operating results.
Our brand and reputation are key assets of our company, which will be affected by how we are perceived in the marketplace.
Our brand and its attributes are key assets, and we believe our continued success depends on our ability to preserve, grow and leverage the value of our brand. Our ability to attract and retain clients is highly dependent upon the external perceptions of our level of service, trustworthiness, business practices, management, workplace culture, financial condition, our response to unexpected events and other subjective qualities. Negative perceptions or publicity regarding these matters, even if related to seemingly isolated incidents and whether or not factually correct, could erode trust and confidence and damage our reputation among existing and potential clients, which could make it difficult for us to attract new clients and maintain existing ones. Negative public opinion could result from actual or alleged conduct in any number of activities or circumstances, including
the personal conduct of individuals associated with our brand,
handling of client complaints, regulatory compliance, such as compliance with the FCPA, the U.K. Bribery Act and other anti-bribery, anti-money laundering and corruption laws, the use and protection of client and other sensitive information and from actions taken by regulators or others in response to such conduct. Social media channels can also cause rapid, widespread reputational harm to our brand.
Our brand and reputation may also be harmed by actions taken by third parties that are outside our control. For example, any shortcoming of or controversy related to a third-party vendor may be attributed to us, thus damaging our reputation and brand value and increasing the attractiveness of our competitors’ services. Also, business decisions or other actions or omissions of our joint venture partners, the Principal Shareholders or management may adversely affect the value of our investments, result in litigation or regulatory action against us and otherwise damage our reputation and brand. Adverse developments with respect to our industry may also, by association, negatively impact our reputation, or result in greater regulatory or legislative scrutiny or litigation against us. Furthermore, as a company with headquarters and operations located in the United States, a negative perception of the United States arising from its political or other positions could harm the perception of our company and our brand. Although we monitor developments for areas of potential risk to our reputation and brand, negative perceptions or publicity could materially and adversely affect our revenues and profitability.
14
The protection of our brand, including related trademarks, may require the expenditure of significant financial and operational resources. Moreover, the steps we take to protect our brand may not adequately protect our rights or prevent third parties from infringing or misappropriating our trademarks. Even when we detect infringement or misappropriation of our trademarks, we may not be able to enforce all such trademarks. Any unauthorized use by third parties of our brand may adversely affect our brand. Furthermore, as we continue to expand our business, especially internationally, there is a risk we may face claims of infringement or other alleged violations of third-party intellectual property rights, which may restrict us from leveraging our brand in a manner consistent with our business goals.
Our 2018 First Lien Credit Agreement imposes operating and financial restrictions on us, and in an event of a default, all of our borrowings would become immediately due and payable.
The credit agreement, dated as of August 21, 2018 (the "2018 First Lien Credit Agreement"), which governs our $2.7 billion term loan (the "2018 First Lien Term Loan") and revolving credit facility (the "Revolver"), imposes, and the terms of any future debt may impose, operating and other restrictions on us and many of our subsidiaries. These restrictions affect, and in many respects limit or prohibit, our ability to:
|
•
|
plan for or react to market conditions;
|
|
•
|
meet capital needs or otherwise carry out our activities or business plans; and
|
|
•
|
finance ongoing operations, strategic acquisitions, investments or other capital needs or engage in other business activities that would be in our interest, including:
|
|
•
|
incurring or guaranteeing additional indebtedness;
|
|
•
|
granting liens on our assets;
|
|
•
|
undergoing fundamental changes;
|
|
•
|
making investments;
|
|
•
|
selling assets;
|
|
•
|
making acquisitions;
|
|
•
|
engaging in transactions with affiliates;
|
|
•
|
amending or modifying certain agreements relating to junior financing and charter documents;
|
|
•
|
paying dividends or making distributions on or repurchases of share capital;
|
|
•
|
repurchasing equity interests or debt;
|
|
•
|
transferring or selling assets, including the stock of subsidiaries; and
|
|
•
|
issuing subsidiary equity or entering into consolidations and mergers.
|
In addition, under certain circumstances we will be required to satisfy and maintain a specified financial ratio under the 2018 First Lien Credit Agreement
.
Our ability to comply with the terms of our 2018 First Lien Credit Agreement can be affected by events beyond our control, including prevailing economic, financial market and industry conditions, and we cannot give assurance that we will be able to comply when required. These terms could have an adverse effect on our business by limiting our ability to take advantage of financing, merger and acquisition or other opportunities. We continue to monitor our projected compliance with the terms of our 2018 First Lien Credit Agreement.
A breach of any restrictive covenants in our 2018 First Lien Credit Agreement could result in an event of default. If any such event of default occurs, the lenders under our 2018 First Lien Credit Agreement may elect to declare all outstanding borrowings, together with accrued interest and other fees, to be immediately due and payable. The lenders under our 2018 First Lien Credit Agreement also have the right in these circumstances to terminate any commitments they have to provide further borrowings and to foreclose on collateral pledged thereunder. In addition, an event of default under our 2018 First Lien Credit Agreement could trigger a cross-default or cross- acceleration under our other material debt instruments and credit agreements, if any.
15
The 2018 First Lien Loan is jointly and severally guaranteed by substantially all of our material subsidiaries organized in the United States, England and Wales, subject to certain exceptions. Each guarantee is secured by a pledge of substantially all of the assets of the subsidiary giving the pledge.
Moody’s Investors Service, Inc. and S&P Global Ratings rate our significant outstanding debt. These ratings, and any downgrades or any written notice of any intended downgrading or of any possible change, may affect our ability to borrow as well as the costs of our future borrowings.
We have a substantial amount of indebtedness, which may adversely affect our available cash flow and our ability to operate our business, remain in compliance with debt covenants and make payments on our indebtedness.
We have a substantial amount of indebtedness. As of
December 31, 2018
, our total debt was approximately
$2.7 billion
, nearly all of which consisted of the 2018 First Lien Loan. As of
December 31, 2018
, we had
0
outstanding funds drawn under our Revolver.
Our level of indebtedness increases the possibility that we may be unable to pay the principal amount of our indebtedness and other obligations when due. Our substantial indebtedness, combined with our other financial obligations and contractual commitments, could have important consequences. For example, it could:
|
•
|
make it more difficult for us to satisfy our obligations with respect to our indebtedness, and any failure to comply with the obligations under any of our debt instruments, including restrictive covenants, could result in an event of default under such instruments;
|
|
•
|
make us more vulnerable to adverse changes in general economic, industry and competitive conditions and adverse changes in government regulation;
|
|
•
|
require us to dedicate a substantial portion of our cash flow from operations to payments on our indebtedness, thereby reducing the availability of our cash flow to fund working capital, capital expenditures, acquisitions and other general corporate purposes;
|
|
•
|
expose us to the risk that if unhedged, or if our hedges are ineffective, interest expense on our variable rate indebtedness will increase;
|
|
•
|
limit our flexibility in planning for, or reacting to, changes in our business and the industry in which we operate;
|
|
•
|
place us at a competitive disadvantage compared to our competitors that are less highly leveraged and therefore able to take advantage of opportunities that our indebtedness prevents us from exploiting;
|
|
•
|
limit our ability to borrow additional amounts for working capital, capital expenditures, acquisitions, debt service requirements, execution of our business strategy or other purposes; and
|
|
•
|
cause us to pay higher rates if we need to refinance our indebtedness at a time when prevailing market interest rates are unfavorable.
|
Any of the above listed factors could have a material adverse effect on our business, prospects, results of operations and financial condition.
Furthermore, our interest expense would increase if interest rates increase because our debt under our 2018 First Lien Credit Agreement bears interest at floating rates, which could adversely affect our cash flows. If we do not have sufficient earnings to service our debt, we may be required to refinance all or part of our existing debt, including the 2018 First Lien Loan, sell assets, borrow more money or sell additional equity
.
There is no guarantee that we would be able to meet these requirements.
Despite our current indebtedness levels, we and our subsidiaries may still be able to incur substantially more debt, which could further exacerbate the risks associated with our substantial leverage.
We may incur additional debt from time to time to finance strategic acquisitions, investments, joint ventures or for other purposes, subject to the restrictions contained in the documents governing our indebtedness. Although our 2018 First Lien Credit Agreement contains restrictions on the incurrence of additional debt, these restrictions are subject to a number of significant qualifications and exceptions, and the debt incurred in compliance with these
16
restrictions could be substantial. If we incur additional debt, the risks associated with our leverage, including our ability to service our debt, would increase.
To service our indebtedness, we will require a significant amount of cash. Our ability to generate cash depends on many factors beyond our control, and any failure to meet our debt service obligations could have a material adverse effect on our business, prospects, results of operations and financial condition.
Our ability to pay interest on and principal of our debt obligations principally depends upon our operating performance. As a result, prevailing economic conditions and financial, business and other factors, many of which are beyond our control, will affect our ability to make these payments and reduce indebtedness over time.
In addition, we conduct our operations through our subsidiaries. Accordingly, repayment of our indebtedness is dependent on the generation of cash flow by our subsidiaries and their ability to make such cash available to us by dividend, debt repayment or otherwise. Our subsidiaries may not be able to, or may not be permitted to, make distributions to enable us to make payments in respect of our indebtedness. Each of our subsidiaries is a distinct legal entity and, under certain circumstances, legal and contractual restrictions may limit our ability to obtain cash from our subsidiaries.
If we do not generate sufficient cash flow from operations to satisfy our debt service obligations, we may have to undertake alternative financing plans, such as refinancing or restructuring our indebtedness, selling assets or seeking to raise additional capital. Our ability to restructure or refinance our indebtedness, if at all, will depend on the condition of the capital markets and our financial condition at such time. Any refinancing of our indebtedness could be at higher interest rates and may require us to comply with more onerous covenants, which could further restrict our business operations. In addition, the terms of existing or future debt instruments may restrict us from adopting some of these alternatives. Our inability to generate sufficient cash flow to satisfy our debt service obligations, or to refinance our obligations at all or on commercially reasonable terms, could affect our ability to satisfy our debt obligations and have a material adverse effect on our business, prospects, results of operations and financial condition.
The London Inter-bank Offered Rate ("LIBOR") and certain other interest "benchmarks" may be subject to regulatory guidance and/or reform that could cause interest rates under our current or future debt agreements to perform differently than in the past or cause other unanticipated consequences.
The majority of our debt, including our 2018 First Lien Loan and the Revolver, bears interest at variable interest rates. The LIBOR and certain other interest "benchmarks" may be subject to regulatory guidance and/or reform that could cause interest rates under our current or future debt agreements to perform differently than in the past or cause other unanticipated consequences. The United Kingdom’s Financial Conduct Authority, which regulates LIBOR, has announced that it intends to stop encouraging or requiring banks to submit LIBOR rates after 2021, and it is unclear if LIBOR will cease to exist or if new methods of calculating LIBOR will evolve. If LIBOR ceases to exist or if the methods of calculating LIBOR change from their current form, interest rates on our current or future debt obligations may be adversely affected.
We are subject to various litigation risks and may face financial liabilities and/or damage to our reputation as a result of litigation.
We are exposed to various litigation risks and from time to time are party to various legal proceedings that involve claims for substantial amounts of money. We depend on our business relationships and our reputation for high-caliber professional services to attract and retain clients. As a result, allegations against us, irrespective of the ultimate outcome of that allegation, may harm our professional reputation and as such materially damage our business and its prospects, in addition to any financial impact.
As a licensed real estate broker and provider of commercial real estate services, we and our licensed sales professionals and independent contractors that work for us are subject to statutory due diligence, disclosure and standard-of-care obligations. Failure to fulfill these obligations could subject us or our sales professionals or independent contractors to litigation from parties who purchased, sold or leased properties that we brokered or managed in the jurisdictions in which we operate.
We are subject to claims by participants in real estate sales and leasing transactions, as well as building owners and companies for whom we provide management services, claiming that we did not fulfill our obligations. We are also subject to claims made by clients for whom we provided appraisal and valuation services and/or third parties who perceive themselves as having been negatively affected by our appraisals and/or valuations. We also could
17
be subject to audits and/or fines from various local real estate authorities if they determine that we are violating licensing laws by failing to follow certain laws, rules and regulations.
In our Property, facilities and project management service line, we hire and supervise third-party contractors to provide services for our managed properties. We may be subject to claims for defects, negligent performance of work or other similar actions or omissions by third parties we do not control. Moreover, our clients may seek to hold us accountable for the actions of contractors because of our role as property or facilities manager or project manager, even if we have technically disclaimed liability as a contractual matter, in which case we may be pressured to participate in a financial settlement for purposes of preserving the client relationship.
Because we employ large numbers of building staff in facilities that we manage, we face the risk of potential claims relating to employment injuries, termination and other employment matters. While we are generally indemnified by the building owners in respect of such claims, we can provide no assurance that will continue to be the case. We also face employment-related claims as an employer with respect to our corporate and other employees for which we would bear ultimate responsibility in the event of an adverse outcome in such matters.
In addition, especially given the size of our operations, there is always a risk that a third party may claim that our systems or offerings, including those used by our brokers and clients, may infringe such third party’s intellectual property rights and may result in claims or suits by third parties. Any such claims or litigation, whether successful or unsuccessful, could require us to enter into settlement agreements with such third parties (which may not be on terms favorable to us), to stop or revise our use or sale of affected systems, products or services or to pay damages, which could materially negatively affect our business.
Adverse outcomes of property and facilities management disputes and related or other litigation could have a material adverse effect on our business, financial condition, results of operations and prospects, particularly to the extent we may be liable on our contracts, or if our liabilities exceed the amounts of the insurance coverage procured and maintained by us. Some of these litigation risks may be mitigated by any the commercial insurance policies we maintain in amounts we believe are appropriate. However, in the event of a substantial loss or certain types of claims, our insurance coverage and/or self-insurance reserve levels might not be sufficient to pay the full damages.
Adverse outcomes of property and facilities management disputes and related or other litigation could have a material adverse effect on our business, financial condition, results of operations and prospects, particularly to the extent we may be liable on our contracts, or if our liabilities exceed the amounts of the insurance coverage procured and maintained by us. Some of these litigation risks may be mitigated by the commercial insurance policies we maintain. However, in the event of a substantial loss or certain types of claims, our insurance coverage and/or self-insurance reserve levels might not be sufficient to pay the full damages. Additionally, in the event of grossly negligent or intentionally wrongful conduct, insurance policies that we may have may not cover us at all. Further, the value of otherwise valid claims we hold under insurance policies could become uncollectible in the event of the covering insurance company’s insolvency, although we seek to limit this risk by placing our commercial insurance only with highly rated companies. Any of these events could materially negatively impact our business, financial condition, results of operations and prospects.
We are substantially dependent on long-term client relationships and on revenue received for services under various service agreements.
Many of the service agreements we have with our clients may be canceled by the client for any reason with as little as 30 to 60 days’ notice, as is typical in the industry. Some agreements related to our Leasing service line may be rescinded without notice. In this competitive market, if we are unable to maintain long-term client relationships or are otherwise unable to retain existing clients and develop new clients, our business, results of operations and/or financial condition may be materially adversely affected. The global economic downturn and resulting weaknesses in the markets in which they themselves compete led to additional pricing pressure from clients as they came under financial pressure. These effects have continued to moderate, but they could increase again in the wake of the continuing political and economic uncertainties within the European Union, the United States and China, including as a result of volatility in oil and commodity prices, changes in trade policies and other political and commercial factors over which we have no control.
The concentration of business with corporate clients can increase business risk, and our business can be adversely affected due to the loss of certain of these clients.
We value the expansion of business relationships with individual corporate clients because of the increased
18
efficiency and economics that can result from developing recurring business from performing an increasingly broad range of services for the same client. Although our client portfolio is currently highly diversified, as we grow our business, relationships with certain corporate clients may increase, and our client portfolio may become increasingly concentrated. For example, part of our strategy is to increase our revenues from existing clients which may lead to an increase in corporate clients and therefore greater concentration of revenues. Having increasingly large and concentrated clients also can lead to greater or more concentrated risks if, among other possibilities, any such client (1) experiences its own financial problems; (2) becomes bankrupt or insolvent, which can lead to our failure to be paid for services we have previously provided or funds we have previously advanced; (3) decides to reduce its operations or its real estate facilities; (4) makes a change in its real estate strategy, such as no longer outsourcing its real estate operations; (5) decides to change its providers of real estate services; or (6) merges with another corporation or otherwise undergoes a change of control, which may result in new management taking over with a different real estate philosophy or in different relationships with other real estate providers.
Where we provide real estate services to firms in the financial services industry, including banks and investment banks, we are experiencing indirectly the increasing extent of the regulatory environment to which they are subject in the aftermath of the global financial crisis. This increases the cost of doing business with them, which we are not always able to pass on, as a result of the additional resources and processes we are required to provide as a critical supplier.
Significant portions of our revenue and cash flow are seasonal, which could cause our financial results and liquidity to fluctuate significantly.
A significant portion of our revenue is seasonal, especially for service lines such as Leasing and Capital markets, which impacts the comparison of our financial condition and results of operations on a quarter-by- quarter basis. Historically, our revenue and operating income tend to be lowest in the first quarter, and highest in the fourth quarter of each year. Also, we have historically relied on our internally generated cash flow to fund our working capital needs and ongoing capital expenditures on an annual basis. Our internally generated cash flow is seasonal and is typically lowest in the first quarter of the year, when revenue is lowest and largest in the fourth quarter of the year when revenue is highest. This variance among periods makes it difficult to compare our financial condition and results of operations on a quarter-by-quarter basis. In addition, the seasonal nature of our internally generated cash flow can result in a mismatch with funding needs for working capital and ongoing capital expenditures, which we manage using available cash on hand and, as necessary, our revolving credit facility. We are therefore dependent on the availability of cash on hand and our debt facilities, especially in the first and second quarters of the year. Further, as a result of the seasonal nature of our business, political, economic or other unforeseen disruptions occurring in the fourth quarter that impact our ability to close large transactions may have a disproportionate effect on our financial condition and results of operations.
A failure to appropriately address actual or perceived conflicts of interest could adversely affect our service lines.
Our company has a global business with different service lines and a broad client base and is therefore subject to numerous potential, actual or perceived conflicts of interests in the provision of services to our existing and potential clients. For example, conflicts may arise from our position as broker to both owners and tenants in commercial real estate lease transactions. We have adopted various policies, controls and procedures to address or limit actual or perceived conflicts, but these policies and procedures may not be adequate and may not be adhered to by our employees. Appropriately dealing with conflicts of interest is complex and difficult and our reputation could be damaged and cause us to lose existing clients or fail to gain new clients if we fail, or appear to fail, to identify, disclose and manage potential conflicts of interest, which could have an adverse effect on our business, financial condition and results of operations. In addition, it is possible that in some jurisdictions regulations could be changed to limit our ability to act for parties where conflicts exist even with informed consent, which could limit our market share in those markets. There can be no assurance that conflicts of interest will not arise in the future that could cause material harm to us.
Failure to maintain and execute information technology strategies and ensure that our employees adapt to changes in technology could materially and adversely affect our ability to remain competitive in the market.
Our business relies heavily on information technology, including on solutions provided by third parties, to deliver services that meet the needs of our clients. If we are unable to effectively execute and maintain our information technology strategies or adopt new technologies and processes relevant to our service platform, our ability to
19
deliver high-quality services may be materially impaired. In addition, we make significant investments in new systems and tools to achieve competitive advantages and efficiencies. Implementation of such investments in information technology could exceed estimated budgets and we may experience challenges that prevent new strategies or technologies from being realized according to anticipated schedules. If we are unable to maintain current information technology and processes or encounter delays, or fail to exploit new technologies, then the execution of our business plans may be disrupted. Similarly, our employees require effective tools and techniques to perform functions integral to our business. Our payroll and compensation technology systems are important to ensuring that key personnel, in particular commission-based personnel, are compensated accurately and on a timely basis. Failure to pay professionals the compensation they are due in a timely manner could result in higher attrition. Failure to successfully provide such tools and systems, or ensure that employees have properly adopted them, could materially and adversely impact our ability to achieve positive business outcomes.
Failure to maintain the security of our information and technology networks, including personally identifiable and client information, intellectual property and proprietary business information could significantly adversely affect us.
Security breaches and other disruptions of our information and technology networks could compromise our information and intellectual property and expose us to liability, reputational harm and significant remediation costs, which could cause material harm to our business and financial results. In the ordinary course of our business, we collect and store sensitive data, including our proprietary business information and intellectual property, and that of our clients and personally identifiable information of our employees, contractors and vendors, in our data centers and on our networks. The secure processing, maintenance and transmission of this information are critical to our operations. Despite our security measures, and those of our third-party service providers, our information technology and infrastructure may be vulnerable to attacks by third parties or breached due to employee error, malfeasance or other disruptions. A significant actual or potential theft, loss, corruption, exposure, fraudulent use or misuse of client, employee or other personally identifiable or proprietary business data, whether by third parties or as a result of employee malfeasance or otherwise, non-compliance with our contractual or other legal obligations regarding such data or intellectual property or a violation of our privacy and security policies with respect to such data could result in significant remediation and other costs, fines, litigation or regulatory actions against us. Such an event could additionally disrupt our operations and the services we provide to clients, harm our relationships with contractors and vendors, damage our reputation, result in the loss of a competitive advantage, impact our ability to provide timely and accurate financial data and cause a loss of confidence in our services and financial reporting, which could adversely affect our business, revenues, competitive position and investor confidence. Additionally, we rely on third parties to support our information and technology networks, including cloud storage solution providers, and as a result have less direct control over our data and information technology systems. Such third parties are also vulnerable to security breaches and compromised security systems, for which we may not be indemnified and which could materially adversely affect us and our reputation. Furthermore, our, or our third-party vendors’, inability to detect unauthorized use (for example, by current or former employees) or take appropriate or timely steps to enforce our intellectual property rights may have an adverse effect on our business.
Interruption or failure of our information technology, communications systems or data services could impair our ability to provide our services effectively, which could damage our reputation and materially harm our operating results.
Our business requires the continued operation of information technology and communication systems and network infrastructure. Our ability to conduct our global business may be materially adversely affected by disruptions to these systems or infrastructure. Our information technology and communications systems are vulnerable to damage or disruption from fire, power loss, telecommunications failure, system malfunctions, computer viruses, cyber-attacks, natural disasters such as hurricanes, earthquakes and floods, acts of war or terrorism, employee errors or malfeasance, or other events which are beyond our control. With respect to cyberattacks and viruses, these pose growing threats to many companies, and we have been a target and may continue to be a target of such threats, which could expose us to liability, reputational harm and significant remediation costs and cause material harm to our business and financial results. In addition, the operation and maintenance of our systems and networks is in some cases dependent on third-party technologies, systems and services providers for which there is no certainty of uninterrupted availability. Any of these events could cause system interruption, delays and loss, corruption or exposure of critical data or intellectual property and may also disrupt our ability to provide services to or interact with our clients, contractors and vendors, and we may not be able to successfully implement contingency plans that depend on communication or travel. Furthermore, any such event could result in substantial recovery and remediation costs and liability to customers, business partners and other third parties. We have business continuity and disaster recovery plans and backup systems to reduce the potentially adverse effect of
20
such events, but our disaster recovery planning may not be sufficient and cannot account for all eventualities, and a catastrophic event that results in the destruction or disruption of any of our data centers or our critical business or information technology systems could severely affect our ability to conduct normal business operations, and as a result, our future operating results could be materially adversely affected.
Our business relies heavily on the use of software and commercial real estate data, some of which is purchased or licensed from third-party providers for which there is no certainty of uninterrupted availability. A disruption of our ability to access such software, including an inability to renew such licenses on the same or similar terms, or provide data to our professionals and/or our clients, contractors and vendors or an inadvertent exposure of proprietary data could damage our reputation and competitive position, and our operating results could be adversely affected.
A material breach in security relating to our information systems and regulation related to such breaches could adversely affect us.
Information security risks have generally increased in recent years, in part because of the proliferation of new technologies and the use of the Internet, and the increased sophistication and activity of organized crime, hackers, terrorists, activists, cybercriminals and other external parties, some of which may be linked to terrorist organizations or hostile foreign governments. Cybersecurity attacks are becoming more sophisticated and include malicious software, phishing and spear phishing attacks, wire fraud and payment diversion, account and email takeover attacks, ransomware, attempts to gain unauthorized access to data and other electronic security breaches. Cybersecurity attacks, including attacks that are not ultimately successful, could lead to disruptions in our critical systems, unauthorized release of confidential or otherwise protected information or corruption of our data, and could also substantially damage our reputation. We have experienced cybersecurity attacks in the past, including ransomware attacks by cybercriminals, and we expect additional attacks in the future. Cybersecurity attacks like the ones we have experienced in the past could have a substantial impact on our reputation with our customers, clients and stakeholders, and may have a material adverse effect on our business.
Any person who circumvents our security measures could steal proprietary or confidential customer information or cause interruptions in our operations that could cause us to be unable to provide our services or operate our business and damage our reputation. We incur significant costs to protect against security breaches and other cybersecurity attacks and may incur significant additional costs to address issues caused by any breaches or cybersecurity attacks. Our failure to prevent future security breaches or cybersecurity attacks, or well-publicized security breaches affecting the Internet in general, could significantly harm our reputation and business and financial results.
Certain laws, regulations and standards regarding data security affecting our customers impose requirements regarding the security of information maintained by these customers, as well as notification to persons whose personal information is accessed by an unauthorized third party. Certain laws may also require us to protect the security of our employees’ personal data. As a result of any continuing legislative initiatives and customer demands, we may have to modify our operations with the goal of further improving data security. The cost of compliance with these laws, regulations and standards is high and is likely to increase in the future. Any such modifications may result in increased expenses and operating complexity, and we may be unable to increase the rates we charge for our services sufficiently to offset these increases. Any failure on our part to comply with these laws, regulations and standards can result in negative publicity and diversion of management time and effort and may subject us to significant liabilities and other penalties.
If customer confidential information, including material non-public information or personal data we maintain, is inappropriately disclosed due to an information security breach, or if any person, including any of our employees, negligently disregards or intentionally breaches our confidentiality policies or other controls or procedures with which we are responsible for complying with respect to such data or otherwise mismanages or misappropriates that data, we may incur substantial liabilities to our clients and be subject to fines or penalties imposed by governmental authorities. Any incidents with respect to the handling of such information could subject us to litigation or indemnification claims with our clients and other parties and harm our reputation. In addition, any breach or alleged breach of our confidentiality agreements with our clients may result in termination of their engagements, resulting in associated loss of revenue and increased costs.
21
Infrastructure disruptions may disrupt our ability to manage real estate for clients or may adversely affect the value of real estate investments we make on behalf of clients.
The buildings we manage for clients, which include some of the world’s largest office properties and retail centers, are used by numerous people daily. As a result, fires, earthquakes, floods, other natural disasters, defects and terrorist attacks can result in significant loss of life, and, to the extent we are held to have been negligent in connection with our management of the affected properties, we could incur significant financial liabilities and reputational harm.
Our goodwill and other intangible assets could become impaired, which may require us to take significant non-cash charges against earnings.
Under current accounting guidelines, we must assess, at least annually and potentially more frequently, whether the value of our goodwill and other intangible assets has been impaired. Any impairment of goodwill or other intangible assets as a result of such analysis would result in a non-cash charge against earnings, and such charge could materially adversely affect our reported results of operations, shareholders’ equity and our ordinary share price. A significant and sustained decline in our future cash flows, a significant adverse change in the economic environment, slower growth rates or if our ordinary share price falls below our net book value per share for a sustained period, could result in the need to perform additional impairment analysis in future periods. If we were to conclude that a future write-down of goodwill or other intangible assets is necessary, then we would record such additional charges, which could materially adversely affect our results of operations.
Our service lines, financial condition, results of operations and prospects could be adversely affected by new laws or regulations or by changes in existing laws or regulations or the application thereof. If we fail to comply with laws and regulations applicable to us, or make incorrect determinations in complex tax regimes, we may incur significant financial penalties.
We are subject to numerous federal, state, local and non-U.S. laws and regulations specific to the services we perform in our service lines. Brokerage of real estate sales and leasing transactions and the provision of valuation services requires us and our employees to maintain applicable licenses in each U.S. state and certain non-U.S. jurisdictions in which we perform these services. If we and our employees fail to maintain our licenses or conduct these activities without a license, or violate any of the regulations covering our licenses, we may be required to pay fines (including treble damages in certain states) or return commissions received or have our licenses suspended or revoked. A number of our services, including the services provided by certain of our indirect wholly-owned subsidiaries in the U.S., U.K., France and Japan, are subject to regulation or oversight by the SEC, F
inancial Industry Regulatory Authority ("FINRA")
, the Defense Security Service, the U.K. Financial Conduct Authority, the Autorité des Marchés Financiers (France), the Financial Services Agency (Japan), the Ministry of Land, Infrastructure, Transport and Tourism (Japan) or other self-regulatory organizations and foreign and state regulators. Compliance failures or regulatory action could adversely affect our business. We could be subject to disciplinary or other actions in the future due to claimed noncompliance with these regulations, which could have a material adverse effect on our operations and profitability.
We are also subject to laws of broader applicability, such as tax, securities, environmental, employment laws and anti-bribery, anti-money laundering and corruption laws, including the Fair Labor Standards Act, occupational health and safety regulations, U.S. state wage-and-hour laws, the FCPA and the U.K. Bribery Act. Failure to comply with these requirements could result in the imposition of significant fines by governmental authorities, awards of damages to private litigants and significant amounts paid in legal fees or settlements of these matters.
We operate in many jurisdictions with complex and varied tax regimes and are subject to different forms of taxation resulting in a variable effective tax rate. In addition, from time to time we engage in transactions across different tax jurisdictions. Due to the different tax laws in the many jurisdictions where we operate, we are often required to make subjective determinations. The tax authorities in the various jurisdictions where we carry on business may not agree with the determinations that are made by us with respect to the application of tax law. Such disagreements could result in disputes and, ultimately, in the payment of additional funds to the government authorities in the jurisdictions where we carry on business, which could have an adverse effect on our results of operations. In addition, changes in tax rules or the outcome of tax assessments and audits could have an adverse effect on our results in any particular quarter.
As the size and scope of our business has increased significantly during the past several years, both the difficulty of ensuring compliance with numerous licensing and other regulatory requirements and the possible loss resulting from non-compliance have increased. The global economic crisis has resulted in increased government and
22
legislative activities, including the introduction of new legislation and changes to rules and regulations, which we expect will continue into the future. New or revised legislation or regulations applicable to our business, both within and outside of the United States, as well as changes in administrations or enforcement priorities may have an adverse effect on our business, including increasing the costs of regulatory compliance or preventing us from providing certain types of services in certain jurisdictions or in connection with certain transactions or clients. For example, on May 25, 2018, the European General Data Protection Regulation became effective with a greater territorial reach than existing laws and applies to many of our contracts and agreements throughout the world. To the extent it applies, we updated and continue to update certain of our agreements
and data protection practices
, which may take significant time and cost. We are unable to predict how new laws, rules, regulations and proposals will be implemented or in what form, or whether any additional or similar changes to laws or regulations, including the interpretation or implementation thereof, will occur in the future. Any such action could affect us in substantial and unpredictable ways and could have an adverse effect on our service lines, financial condition, results of operations and prospects.
Any failure by us to execute on our strategy for operational efficiency successfully could result in total costs and expenses that are greater than expected.
We have an operating framework that includes a disciplined focus on operational efficiency. As part of this framework, we have adopted several initiatives, including development of our technology platforms, workflow processes and systems to improve client engagement and outcomes across our service lines
.
Our ability to continue to achieve the anticipated cost savings and other benefits from these initiatives within the expected time frame is subject to many estimates and assumptions. These estimates and assumptions are subject to significant economic, competitive and other uncertainties, some of which are beyond our control. In addition, we are vulnerable to increased risks associated with implementing changes to our tools, processes and systems given our varied service lines, the broad range of geographic regions in which we and our customers operate and the number of acquisitions that we have completed in recent years. If these estimates and assumptions are incorrect, if we are unsuccessful at implementing changes, if we experience delays, or if other unforeseen events occur, we may not achieve new or continue to achieve operational efficiencies and as a result our business and results of operations could be adversely affected.
We may be subject to environmental liability as a result of our role as a property or facility manager or developer of real estate.
Various laws and regulations impose liability on real property owners or operators for the cost of investigating, cleaning up or removing contamination caused by hazardous or toxic substances at a property. In our role as a property or facility manager or developer, we could be held liable as an operator for such costs. This liability may be imposed without regard to the legality of the original actions and without regard to whether we knew of, or were responsible for, the presence of the hazardous or toxic substances. If we fail to disclose environmental issues, we could also be liable to a buyer or lessee of a property. If we incur any such liability, our business could suffer significantly as it could be difficult for us to develop or sell such properties, or borrow funds using such properties as collateral. In the event of a substantial liability, our insurance coverage might be insufficient to pay the full damages, or the scope of available coverage may not cover certain of these liabilities. Additionally, liabilities incurred to comply with more stringent future environmental requirements could adversely affect any or all of service lines.
We are a “controlled company” within the meaning of the New York Stock Exchange ("NYSE ") corporate governance standards and, as a result, qualify for exemptions from certain corporate governance requirements. If we rely on these exemptions in the future, you will not have the same protections afforded to shareholders of companies that are subject to such requirements.
The Principal Shareholders control a majority of the voting power of our outstanding ordinary shares. As a result, we are a “controlled company” within the meaning of the NYSE corporate governance standards. Under these rules, a company of which more than 50% of the voting power is held by an individual, group or another company is a “controlled company” and may elect not to comply with certain corporate governance requirements, including the requirements that:
|
•
|
a majority of the board of directors consists of independent directors;
|
|
•
|
we have a nominating and corporate governance committee that is composed entirely of independent directors; and
|
23
|
•
|
we have a compensation committee that is composed entirely of independent directors.
|
We are currently not utilizing these exemptions. If, however, we utilize certain of these exemptions in the future, you will not have the same protections afforded to shareholders of companies that are subject to all of the NYSE corporate governance standards. The Principal Shareholders’ significant ownership interest could adversely affect investors’ perceptions of our corporate governance.
The Principal Shareholders have significant influence over us, including control over decisions that require the approval of shareholders, which could limit your ability to influence the outcome of key transactions, including a change of control, and which may result in conflicts with us or you in the future.
We are controlled by the Principal Shareholders. As of December 31, 2018, the Principal Shareholders owned approximately 64% of our total ordinary shares outstanding. Pursuant to the shareholders’ agreement with our Principal Shareholders, the Principal Shareholders have the right to designate five of the seats on our board of directors, and as a result Jonathan Coslet, Timothy Dattels, Qi Chen, Lincoln Pan and Rajeev Ruparelia have been appointed to our board of directors. In addition, the Principal Shareholders jointly have the right to designate for nomination one additional director, who must qualify as independent under the NYSE rules and must meet the independence requirements of Rule 10A-3 of the Exchange Act, so long as they collectively own at least 50% of our total ordinary shares outstanding. The Principal Shareholders nominated Jodie McLean, who qualifies as an independent director under Rule 10A-3 of the Exchange Act, to the board of directors pursuant to this right. The Principal Shareholders are thus able to exercise control over our affairs and policies, including the approval of certain actions such as amending our articles of association, commencing bankruptcy proceedings and taking certain actions (including, without limitation, incurring debt, issuing shares, selling assets, repurchasing shares, paying dividends and engaging in mergers and acquisitions), appointing members of our management, issuing equity under our management incentive plans and any transaction that requires shareholder approval regardless of whether others believe that such change or transaction is in our best interests. So long as the Principal Shareholders continue to hold a majority of our outstanding ordinary shares, the Principal Shareholders will have the ability to control the vote in any election of directors, amend our articles of association or take other actions requiring the vote of our shareholders. Even if the amount owned by the Principal Shareholders falls below 50%, the Principal Shareholders will continue to be able to strongly influence or effectively control our decisions. This control may also have the effect of deterring hostile takeovers, delaying or preventing changes of control or changes in management, or limiting the ability of our other shareholders to approve transactions that they may deem to be in the best interests of our company.
Additionally, the Principal Shareholders’ interests may not align with the interests of our other shareholders. The Principal Shareholders are in the business of making investments in companies and may acquire and hold interests in businesses that compete directly or indirectly with us. The Principal Shareholders may also pursue acquisition opportunities that may be complementary to our business, and, as a result, those acquisition opportunities may not be available to us.
Certain of our directors have relationships with the Principal Shareholders, which may cause conflicts of
interest with respect to our business.
Five of our nine directors are affiliated with the Principal Shareholders. These directors have fiduciary duties to us and, in addition, have duties to the applicable Principal Shareholder. As a result, these directors may face real or apparent conflicts of interest with respect to matters affecting both us and the affiliated Principal Shareholder, whose interests may be adverse to ours in some circumstances.
Certain of our shareholders have the right to engage or invest in the same or similar businesses as us.
The Principal Shareholders have other investments and business activities in addition to their ownership of us. The Principal Shareholders have the right, and have no duty to abstain from exercising such right, to engage or invest in the same or similar businesses as us, do business with any of our clients, customers or vendors or employ or otherwise engage any of our officers, directors or employees. If the Principal Shareholders or any of their officers, directors or employees acquire knowledge of a potential transaction that could be a corporate opportunity, they have no duty, to the fullest extent permitted by law, to offer such corporate opportunity to us, our shareholders or our affiliates.
In the event that any of our directors and officers who is also a director, officer or employee of the Principal Shareholders acquires knowledge of a corporate opportunity or is offered a corporate opportunity, provided that this knowledge was not acquired solely in such person’s capacity as our director or officer and such person acts in good
24
faith, then to the fullest extent permitted by law such person is deemed to have fully satisfied such person’s fiduciary duties owed to us and is not liable to us, if the Principal Shareholders pursue or acquire the corporate opportunity or if the Principal Shareholders do not present the corporate opportunity to us.
Additionally, the Principal Shareholders are in the business of making investments in companies and may currently hold, and may from time to time in the future acquire, controlling interests in businesses engaged in industries that complement or compete, directly or indirectly, with certain portions of our business. So long as the Principal Shareholders continue to indirectly own a significant amount of our equity, the Principal Shareholders will continue to be able to strongly influence or effectively control our decisions.
The rights of our shareholders may differ from the rights typically offered to shareholders of a U.S. corporation organized in Delaware.
We are incorporated under the laws of England and Wales. The rights of holders of our ordinary shares are governed by the laws of England and Wales, including the provisions of the U.K. Companies Act 2006, and by our articles of association. These rights, including rights relating to removing directors, calling general meetings or initiating litigation on behalf of the Company, differ in certain respects from the rights of shareholders in typical U.S. corporations organized in Delaware, and may in some instances be less favorable to our shareholders. For a discussion of these differences, see the section entitled “Description of Share Capital- Differences in Corporate Law” in our prospectus dated August 1, 2018, which is filed with the SEC.
U.S. investors may have difficulty enforcing civil liabilities against our company, our directors or members of senior management.
We are incorporated under the laws of England and Wales. The United States and the United Kingdom do not currently have a treaty providing for the recognition and enforcement of judgments, other than arbitration awards, in civil and commercial matters. The enforceability of any judgment of a U.S. federal or state court in the United Kingdom will depend on the laws and any treaties in effect at the time, including conflicts of laws principles (such as those bearing on the question of whether a U.K. court would recognize the basis on which a U.S. court had purported to exercise jurisdiction over a defendant). In this context, there is doubt as to the enforceability in the United Kingdom of civil liabilities based solely on the federal securities laws of the United States. In addition, awards for punitive damages in actions brought in the United States or elsewhere may be unenforceable in the United Kingdom. An award for monetary damages under U.S. securities laws would likely be considered punitive if it did not seek to compensate the claimant for loss or damage suffered and was intended to punish the defendant.
English law and provisions in our articles of association may have anti-takeover effects that could discourage an acquisition of us by others, even if an acquisition would be beneficial to our shareholders, and may prevent attempts by our shareholders to replace or remove our current management.
Certain provisions of the U.K. Companies Act 2006 and our articles of association may have the effect of delaying or preventing a change in control of us or changes in our management. For example, our articles of association include provisions that:
|
•
|
create a classified board of directors whose members serve staggered three-year terms (but remain subject to removal as provided in our articles of association);
|
|
•
|
establish an advance notice procedure for shareholder approvals to be brought before an annual meeting of our shareholders, including proposed nominations of persons for election to our board of directors;
|
|
•
|
provide our board of directors the ability to grant rights to subscribe for our ordinary shares and/or depositary interests representing our ordinary shares without shareholder approval, which could be used to, among other things, institute a rights plan that would have the effect of significantly diluting the share ownership of a potential hostile acquirer;
|
|
•
|
provide certain mandatory offer provisions, including, among other provisions, that a shareholder, together with persons acting in concert, that acquires 30 percent or more of our issued shares without making an offer to all of our other shareholders that is in cash or accompanied by a cash alternative would be at risk of certain sanctions from our board of directors unless they acted with the consent of our board of directors or the prior approval of the shareholders; and
|
25
|
•
|
provide that vacancies on our board of directors may be filled by a vote of the directors or by an ordinary resolution of the shareholders, including where the number of directors is reduced below the minimum number fixed in accordance with the articles of association.
|
In addition, public limited companies are prohibited under the U.K. Companies Act 2006 from taking shareholder action by written resolution.
These provisions, alone or together, could delay or prevent hostile takeovers and changes in control or changes in our management. See also “-Provisions in the U.K. City Code on Takeovers and Mergers may have anti-takeover effects that could discourage an acquisition of us by others, even if an acquisition would be beneficial to our shareholders.”
Provisions in the U.K. City Code on Takeovers and Mergers may have anti-takeover effects that could discourage an acquisition of us by others, even if an acquisition would be beneficial to our shareholders.
The U.K. City Code on Takeovers and Mergers (“Takeover Code”) applies, among other things, to an offer for a public company whose registered office is in the United Kingdom (or the Channel Islands or the Isle of Man) and whose securities are not admitted to trading on a regulated market in the United Kingdom (or the Channel Islands or the Isle of Man) if the company is considered by the Panel on Takeovers and Mergers (“Takeover Panel”) to have its place of central management and control in the United Kingdom (or the Channel Islands or the Isle of Man). This is known as the “residency test.” The test for central management and control under the Takeover Code is different from that used by the U.K. tax authorities. Under the Takeover Code, the Takeover Panel will determine whether we have our place of central management and control in the United Kingdom by looking at various factors, including the structure of our board of directors, the functions of the directors and where they are resident.
If at the time of a takeover offer the Takeover Panel determines that we have our place of central management and control in the United Kingdom, we would be subject to a number of rules and restrictions, including but not limited to the following: (1) our ability to enter into deal protection arrangements with a bidder would be extremely limited; (2) we might not, without the approval of our shareholders, be able to perform certain actions that could have the effect of frustrating an offer, such as issuing shares or carrying out acquisitions or disposals; and (3) we would be obliged to provide equality of information to all bona fide competing bidders.
As a public limited company incorporated in England and Wales, certain capital structure decisions will require shareholder approval, which may limit our flexibility to manage our capital structure.
The U.K. Companies Act 2006 provides that a board of directors of a public limited company may only allot shares (or grant rights to subscribe for or convertible into shares) with the prior authorization of shareholders, such authorization stating the maximum amount of shares that may be allotted under such authorization and specify the date on which such authorization will expire, being not more than five years, each as specified in the articles of association or relevant shareholder resolution. We have obtained authority from our shareholders to allot additional shares for a period of five years from July 18, 2018 (being the date on which the shareholder resolution was passed), which authorization will need to be renewed at least upon expiration (i.e., five years from July 18, 2018) but may be sought more frequently for additional five-year terms (or any shorter period).
Subject to certain limited exceptions, the U.K. Companies Act 2006 generally provides that existing shareholders of a company have statutory pre-emption rights when new shares in such company are allotted and issued for cash. However, it is possible for such statutory pre-emption right to be disapplied by either the articles of association of the company, or by shareholders passing a special resolution at a general meeting, being a resolution passed by at least 75% of the votes cast. Such a disapplication of statutory pre-emption rights may not be for more than five years from the date of adoption of the articles of association, if the disapplication is contained in the articles of association, or from the date of the special resolution, if the disapplication is by special resolution. We have obtained authority from our shareholders to disapply statutory pre-emption rights for a period of five years from July 18, 2018, which disapplication will need to be renewed upon expiration (i.e., at least every five years) to remain effective, but may be sought more frequently for additional five-year terms (or any shorter period).
Subject to certain limited exceptions, the U.K. Companies Act 2006 generally prohibits a public limited company from repurchasing its own shares without the prior approval of its shareholders by ordinary resolution, being a resolution passed by a simple majority of votes cast, and subject to compliance with other statutory formalities. Such authorization may not be for more than five years from the date on which such ordinary resolution is passed.
26
Our articles of association provide that the courts of England and Wales will be the exclusive forum for the resolution of all shareholder complaints other than complaints asserting a cause of action arising under the Securities Act of 1933, as amended (the "Securities Act"), and that the U.S. federal district courts will be the exclusive forum for the resolution of any shareholder complaint asserting a cause of action arising under the Securities Act.
Our articles of association provide that the courts of England and Wales will be the exclusive forum for resolving all shareholder complaints other than shareholder complaints asserting a cause of action arising under the Securities Act, and that the U.S. federal district courts will be the exclusive forum for resolving any shareholder complaint asserting a cause of action arising under the Securities Act. This choice of forum provision may limit a shareholder’s ability to bring a claim in a judicial forum that it finds favorable for disputes with us or our directors, officers or other employees, which may discourage such lawsuits. If a court were to find either choice of forum provision contained in our articles of association to be inapplicable or unenforceable in an action, we may incur additional costs associated with resolving such action in other jurisdictions, which could adversely affect our results of operations and financial condition.
The market price of our ordinary shares may fluctuate significantly.
The trading price of our ordinary shares may be volatile and subject to wide price fluctuations in response to various factors, many of which are beyond our control, including the following:
|
•
|
quarterly variations in our results of operations;
|
|
•
|
results of operations that vary from the expectations of securities analysts and investors;
|
|
•
|
results of operations that vary from those of our competitors;
|
|
•
|
changes in expectations as to our future financial performance, including financial estimates by securities analysts and investors;
|
|
•
|
strategic actions by us or our competitors;
|
|
•
|
announcements by us, our competitors or our vendors of significant contracts, acquisitions, joint marketing relationships, joint ventures or capital commitments;
|
|
•
|
changes in business or regulatory conditions;
|
|
•
|
investor perceptions or the investment opportunity associated with our ordinary shares relative to other investment alternatives;
|
|
•
|
the public’s response to press releases or other public announcements by us or third parties, including our filings with the SEC;
|
|
•
|
guidance, if any, that we provide to the public, any changes in this guidance or our failure to meet this guidance;
|
|
•
|
changes in accounting principles;
|
|
•
|
announcements by third parties or governmental entities of significant claims or proceedings against us;
|
|
•
|
a default under the agreements governing our indebtedness;
|
|
•
|
future sales of our ordinary shares by us, directors, executives and significant shareholders;
|
|
•
|
changes in domestic and international economic and political conditions and regionally in our markets; and
|
|
•
|
other events or factors, including those resulting from natural disasters, war, acts of terrorism or responses to these events.
|
Furthermore, the stock market has from time to time experienced extreme volatility that, in some cases, has been unrelated or disproportionate to the operating performance of particular companies. These broad market and industry fluctuations may adversely affect the market price of our ordinary shares, regardless of our actual operating performance. As a result, our ordinary shares may trade at a price significantly below the price at which any shareholder purchased his or her ordinary shares.
27
In the past, following periods of market volatility, shareholders have instituted securities class action litigation. If we were involved in securities litigation, it could have a substantial cost and divert resources and the attention of executive management from our business regardless of the outcome of such litigation.
If we or our existing investors sell additional ordinary shares, the market price of our ordinary shares could decline.
The market price of our ordinary shares could decline as a result of sales of a large number of ordinary shares in the market, or the perception that such sales could occur. These sales, or the possibility that these sales may occur, also might make it more difficult for us to sell equity securities in the future at a time and at a price that we deem appropriate.
As of
December 31, 2018
we had
216.6 million
ordinary shares outstanding. Of these outstanding ordinary shares, all of the ordinary shares sold in the IPO are freely tradable in the public market. All of our ordinary shares outstanding prior to the closing of the IPO and all of the ordinary shares sold in the private placement that closed concurrently with our IPO (the “Concurrent Private Placement”) are restricted securities as defined in Rule 144 under the Securities Act (“Rule 144”) and may be sold by the holders into the public market from time to time in accordance with and subject to Rule 144, including, where applicable, limitation on sales by affiliates under Rule 144. Refer to Note 1: Organization and Business Overview of our Consolidated Financial Statements for additional information on the Concurrent Private Placement.
In connection with our IPO, we entered into a registration rights agreement with the Principal Shareholders and Vanke Service, which provides the signatories thereto the right, under certain circumstances, to require us to register their ordinary shares under the Securities Act for sale into the public markets. See the information under the heading “Certain Relationships and Related Party Transactions—Registration Rights Agreement” for a more detailed description of the registration rights provided to the signatories thereto.
Currently, we have
3.3 million
shares and
1.5 million
shares issuable upon the exercise of outstanding options that vest on time-based and performance-based criteria, respectively, 8.4 million shares and
0.7 million
shares issuable upon vesting of RSUs that vest on time-based and performance-based criteria, respectively, and 9.9 million shares reserved for future grant under our equity incentive plans. Shares acquired upon the exercise of vested options or RSUs under our equity incentive plans may be sold by holders into the public market from time to time, in accordance with and subject to limitation on sales by affiliates under Rule 144. Sales of a substantial number of ordinary shares following the vesting of outstanding equity options or RSUs could cause the market price of our ordinary shares to decline.
Future offerings of debt or equity securities by us may adversely affect the market price of our ordinary shares.
In the future, we may attempt to obtain financing or to further increase our capital resources by issuing additional ordinary shares or offering debt or other equity securities, including commercial paper, medium-term notes, senior or subordinated notes, debt securities convertible into equity or preferred shares. Future acquisitions could require substantial additional capital in excess of cash from operations. We would expect to finance any future acquisitions through a combination of additional issuances of equity, corporate indebtedness, asset-backed acquisition financing and/or cash from operations.
Issuing additional ordinary shares or other equity securities or securities convertible into equity may dilute the economic and voting rights of our existing shareholders or reduce the market price of our ordinary shares or both. Upon liquidation, holders of such debt securities and preferred shares, if issued, and lenders with respect to other borrowings would receive a distribution of our available assets prior to the holders of our ordinary shares. Debt
securities convertible into equity could be subject to adjustments in the conversion ratio pursuant to which certain events may increase the number of equity securities issuable upon conversion. Preferred shares, if issued, could have a preference with respect to liquidating distributions or a preference with respect to dividend payments that could limit our ability to pay dividends to the holders of our ordinary shares. Our decision to issue securities in any future offering will depend on market conditions and other factors beyond our control, which may adversely affect
the amount, timing or nature of our future offerings. Thus, holders of our ordinary shares bear the risk that our future offerings may reduce the market price of our ordinary shares and dilute their shareholdings in us.
Because we do not currently intend to pay cash dividends on our ordinary shares for the foreseeable future, you may not receive any return on investment unless you sell your ordinary shares for a price greater than that which you paid for it.
28
We currently intend to retain future earnings, if any, for future operation, expansion and debt repayment and do not intend to pay any cash dividends for the foreseeable future. Under English law, any payment of dividends would be subject to relevant legislation and our articles of association, which provide that all dividends must be approved by our board of directors and, in some cases, our shareholders, and may only be paid from our distributable profits available for the purpose, determined on an unconsolidated basis. Any decision to declare and pay dividends in the future will be made at the discretion of our board of directors and will depend on, among other things, our results of operations, financial condition, cash requirements, contractual restrictions, restrictions imposed by applicable law or the SEC and other factors that our board of directors may deem relevant. In addition, our ability to pay dividends may be limited by covenants of any existing and future outstanding indebtedness we or our subsidiaries incur, including our 2018 First Lien Credit Agreement. Accordingly, investors must be prepared to rely on sales of their ordinary shares after price appreciation to earn an investment return, which may never occur. Investors seeking cash dividends should not purchase our ordinary shares. As a result, you may not receive any return on an investment in our ordinary shares unless you sell our ordinary shares for a price greater than that which you paid for it.
We are a holding company with nominal net worth and will depend on dividends and distributions from our subsidiaries to pay any dividends.
We are a holding company with nominal net worth. We do not have any assets or conduct any business operations other than our investments in our subsidiaries. Our business operations are conducted primarily out of our indirect operating subsidiary, DTZ Worldwide Limited. As a result, our ability to pay dividends, if any, will be dependent upon cash dividends and distributions or other transfers from our subsidiaries. Payments to us by our subsidiaries will be contingent upon their respective earnings and subject to any limitations on the ability of such entities to make payments or other distributions to us. See "Note 9: Long-term Debt and Other Borrowings". Our 2018 First Lien Credit Agreement imposes operating and financial restrictions on us, and in the event of a default, all of our borrowings would become immediately due and payable” for additional information regarding the limitations currently imposed by our credit agreement. In addition, our subsidiaries, including our indirect operating subsidiary, DTZ Worldwide Limited, are separate and distinct legal entities and have no obligation to make any funds available to us.
You may incur further dilution in the net tangible book value of the shares you have purchased.
We have a significant number of outstanding equity options to purchase ordinary shares with exercise prices that are below the share price at which we consummated our IPO. To the extent that these equity options are exercised, you will experience further dilution.
If we are unable to implement and maintain effective internal control over financial reporting in the future, investors may lose confidence in the accuracy and completeness of our financial reports and the trading price of our ordinary shares may be negatively affected.
Pursuant to Section 404 of the Sarbanes-Oxley Act (“Section 404”) and related rules and regulations, and beginning with our Annual Report on Form 10-K for the year ending December 31, 2019, our management will be required to report on
,
and our independent registered public accounting firm will be required to audit as of the end of each fiscal year
,
the effectiveness of our internal controls over financial reporting. In connection with the Section 404 requirements, both we and our independent registered public accounting firm could, as part of that documentation and testing, identify material weaknesses that we may not be able to remediate in time to meet the applicable deadline imposed upon us for compliance with the requirements of Section 404. In 2015, we identified material weaknesses in our internal controls over financial reporting resulting from the combination of DTZ, Cassidy Turley and C&W Group and the combination of legacy accounting practices and systems over a highly compressed period of time, which were remediated during our fiscal year ended December 31, 2016. We continue to identify and implement actions to improve the effectiveness of our internal control over financial reporting and disclosure controls and procedures, but there can be no assurance that such remediation efforts will be successful. Failure to remediate the material weaknesses could have a negative impact on our business and the market for our ordinary shares.
In addition, if we fail to achieve and maintain the adequacy of our internal controls, as such standards are modified, supplemented or amended from time to time, we may not be able to ensure that we can conclude on an ongoing basis that we have effective internal controls over financial reporting in accordance with Section 404. We cannot be certain as to the timing of completion of our evaluation, testing and any remediation actions or the impact of the same on our operations. If we are not able to implement the requirements of Section 404 in a timely manner or with
29
adequate compliance, our independent registered public accounting firm may issue an adverse opinion due to ineffective internal controls over financial reporting and we may be subject to sanctions or investigation by regulatory authorities, such as the SEC. As a result, there could be a negative reaction in the financial markets due to a loss of confidence in the reliability of our financial statements. In addition, we may be required to incur costs in improving our internal control system and the hiring of additional personnel. Any such action could have a material adverse effect on our business, prospects, results of operations and financial condition.
The requirements of being a public company may strain our resources and distract our management, which could make it difficult to manage our business.
Since the completion of our IPO, we have been required to comply with various regulatory and reporting requirements, including those required by the SEC. Complying with these reporting and other regulatory requirements is time-consuming and will result in increased costs to us and could have a material adverse effect on our business, results of operations and financial condition.
As a public company, we are subject to the reporting requirements of the Exchange Act, and are required to comply with the Sarbanes-Oxley Act. These requirements, along with adopting the new accounting standards for revenue recognition and leasing, may place a strain on our systems and resources. The Exchange Act requires that we file annual, quarterly and current reports with respect to our business and financial condition. The Sarbanes-Oxley Act requires that we maintain effective disclosure controls and procedures and internal controls over financial reporting. To maintain and improve the effectiveness of our disclosure controls and procedures, we will need to commit significant resources, hire additional staff and provide additional management oversight. We have implemented and will continue to implement, additional procedures and processes for the purpose of addressing the standards and requirements applicable to public companies. Sustaining our growth also will require us to commit additional management, operational and financial resources to identify new professionals to join our firm and to maintain appropriate operational and financial systems to adequately support expansion. These activities may divert management’s attention from other business concerns, which could have a material adverse effect on our business, financial condition, results of operations and cash flows.
If securities or industry analysts do not publish, cease publishing or publish inaccurate or unfavorable research about our business, or if they adversely change their recommendations regarding our ordinary shares, our ordinary share price and trading volume could decline.
The trading market for our ordinary shares depends in part on the research and reports that securities or industry analysts publish about us or our business. If securities or industry analysts do not establish and maintain adequate research coverage, or if one or more of the analysts who may cover us downgrades our ordinary shares or publishes inaccurate or unfavorable research about our business, our ordinary share price would likely decline. If one or more of these analysts ceases coverage of us or fails to publish reports on us regularly, demand for our ordinary shares could decrease, which could cause our ordinary share price and trading volume to decline.
30
CAUTIONARY NOTE REGARDING FORWARD-LOOKING STATEMENTS
Some of the statements under “Risk Factors,” “Management’s Discussion and Analysis of Financial Condition and Results of Operations” and elsewhere in this Annual Report on Form 10-K may contain forward-looking statements that reflect our current views with respect to, among other things, future events, results and financial performance, which are intended to be covered by the safe harbor provisions for forward-looking statements provided by the Private Securities Litigation Reform Act of 1995.
These statements can be identified by the fact that they do not relate strictly to historical or current facts, and you can often identify these forward-looking statements by the use of forward-looking words such as “outlook,” “believes,” “expects,” “potential,” “continues,” “may,” “will,” “should,” “could,” “seeks,” “approximately,” “predicts,” “intends,” “plans,” “estimates,” “anticipates,” “target,” “projects,” “forecasts,” “shall,” “contemplates” or the negative version of those words or other comparable words. Any forward-looking statements contained in this Annual Report are based upon our historical performance and on our current plans, estimates and expectations in light of information currently available to us. The inclusion of this forward-looking information should not be regarded as a representation by us, that the future plans, estimates or expectations contemplated by us will be achieved. Such forward-looking statements are subject to various risks and uncertainties and assumptions relating to our operations, financial results, financial condition, business, prospects, growth strategy and liquidity. Accordingly, there are or will be important factors that could cause our actual results to differ materially from those indicated in these statements. You should not place undue reliance on any forward-looking statements and should consider the following factors, as well as the factors discussed under “Risk Factors” beginning on page 10 [or Item 1A herein]. We believe that these factors include, but are not limited to:
|
•
|
disruptions in general economic, social and business conditions, particularly in geographies or industry sectors that we or our clients serve;
|
|
•
|
adverse developments in the credit markets;
|
|
•
|
our ability to compete globally, or in local geographic markets or service lines that are material to us, and the extent to which further industry consolidation, fragmentation or innovation could lead to significant future competition;
|
|
•
|
social, political and economic risks in different countries as well as foreign currency volatility;
|
|
•
|
our ability to retain our senior management and attract and retain qualified and experienced employees;
|
|
•
|
our reliance on our Principal Shareholders;
|
|
•
|
the inability of our acquisitions to perform as expected and the unavailability of similar future opportunities;
|
|
•
|
perceptions of our brand and reputation in the marketplace and our ability to appropriately address actual or perceived conflicts of interest;
|
|
•
|
the operating and financial restrictions that our 2018 First Lien Credit Agreement imposes on us and the possibility that in an event of default all of our borrowings may become immediately payable;
|
|
•
|
the substantial amount of our indebtedness, our ability and the ability of our subsidiaries to incur substantially more debt and our ability to generate cash to service our indebtedness;
|
|
•
|
the possibility we may face financial liabilities and/or damage to our reputation as a result of litigation;
|
|
•
|
our dependence on long-term client relationships and on revenue received for services under various service agreements;
|
|
•
|
the concentration of business with corporate clients;
|
|
•
|
the seasonality of significant portions of our revenue and cash flow;
|
|
•
|
our ability to execute information technology strategies, maintain the security of our information and technology networks and avoid or minimize the effect of a cyber attack or an interruption or failure of our information technology, communications systems or data services;
|
|
•
|
the possibility that infrastructure disruptions may disrupt our ability to manage real estate for clients;
|
31
|
•
|
the possibility that our goodwill and other intangible assets could become impaired;
|
|
•
|
our ability to comply with new laws or regulations and changes in existing laws or regulations and to make correct determinations in complex tax regimes;
|
|
•
|
our ability to execute on our strategy for operational efficiency successfully;
|
|
•
|
our status as a “controlled company” within the meaning of the NYSE corporate governance standards, which allows us to qualify for exemptions from certain corporate governance requirements;
|
|
•
|
the possibility we may be subject to environmental liability as a result of our role as a property or facility manager or developer of real estate;
|
|
•
|
the fact that the Principal Shareholders have significant influence over us and key decisions about our business that could limit other shareholders’ ability to influence the outcome of matters submitted to shareholders for a vote;
|
|
•
|
the fact that certain of our shareholders have the right to engage or invest in the same or similar businesses as us;
|
|
•
|
the possibility that the rights of our shareholders may differ from the rights typically offered to shareholders of a U.S. corporation organized in Delaware;
|
|
•
|
the possibility that U.S. investors may have difficulty enforcing civil liabilities against our company, our directors or members of senior management;
|
|
•
|
the possibility that English law and provisions in our articles of association may have anti-takeover effects that could discourage an acquisition of us by others and may prevent attempts by our shareholders to replace or remove our current management;
|
|
•
|
the possibility that provisions in the U.K. City Code on Takeovers and Mergers may have anti-takeover effects that could discourage an acquisition of us by others;
|
|
•
|
the possibility that given our status as a public limited company incorporated in England and Wales, certain capital structure decisions will require shareholder approval, which may limit our flexibility to manage our capital structure;
|
|
•
|
the fluctuation of the market price of our ordinary shares;
|
|
•
|
the fact that we do not currently anticipate paying any dividends in the foreseeable future;
|
|
•
|
the fact that our internal controls over financial reporting may not be effective and our independent registered public accounting firm may not be able to certify as to their effectiveness, and the possibility that the requirements of being a public company may strain our resources and distract our management; and
|
|
•
|
the possibility that securities or industry analysts may not publish research or may publish inaccurate or unfavorable research about our business.
|
The factors identified above should not be construed as exhaustive list of factors that could affect our future results, and should be read in conjunction with the other cautionary statements that are included in this Annual Report. The forward-looking statements made in this report are made only as of the date of this report. We do not undertake any obligation to publicly update or review any forward-looking statement except as required by law, whether as a result of new information, future developments or otherwise.
If one or more of these or other risks or uncertainties materialize, or if our underlying assumptions prove to be incorrect, our actual results may vary materially from what we may have expressed or implied by these forward-looking statements. You should specifically consider the factors identified in this report that could cause actual results to differ before making an investment decision to purchase our ordinary shares. Furthermore, new risks and uncertainties arise from time to time, and it is impossible for us to predict those events or how they may affect us.
32
Item 1B. Unresolved Staff Comments
None.
Item 2. Properties
Our principal executive offices are located at 125 Old Broad Street, London, United Kingdom, EC2N 1AR, and our telephone number is +44 20 3296 3000.
We operate from approximately
400
company and affiliated offices in
70
countries. We operate
215
offices in the Americas,
133
offices in EMEA and
53
offices in APAC.
Our strategy is to lease rather than own offices. In general, these leased offices are fully utilized. The most significant terms of the leasing arrangements for our offices are the term of the lease and the rent. Our leases have terms varying in duration. The rent payable under our office leases varies significantly from location to location as a result of differences in prevailing commercial real estate rates in different geographic locations. Our management believes that no single office lease is material to our business, results of operations or financial condition. In addition, we believe there is adequate alternative office space available at acceptable rental rates to meet our needs, although adverse movements in rental rates in some markets may negatively affect our profits in those markets when we enter into new leases.
Item 3. Legal Proceedings
We are party to a number of pending or threatened lawsuits arising out of, or incident to, the ordinary course of our business. The amounts claimed in these lawsuits can vary significantly, and some may be substantial. Our management believes that any liability imposed on us that may result from disposition of these lawsuits will not have a material effect on our consolidated financial position or results of operations. However, litigation is inherently uncertain and there could be a material adverse impact on our financial position and results of operations if one or more matters are resolved in a particular period in an amount materially in excess of what we anticipate. Refer to "
Risk Factors
" under Part I, Item 1A in this report. We are subject to various litigation risks and may face financial liabilities and/or damage to our reputation as a result of litigation” for a discussion of certain types of claims we are subject to and face from time to time.
We establish reserves in accordance with FASB guidance on Accounting for Contingencies should a liability arise that is both probable and reasonably estimable. We adjust these reserves as needed to respond to subsequent changes in events. Refer to
Note 14: Commitments and Contingencies
in our audited Consolidated Financial Statements.
Item 4. Mine Safety Disclosures
Not applicable.
33
PART II
Item 5. Market for the Registrant's Common Equity, Related Stockholder Matters and Issuer Purchases of Equity Securities
Stock Price Information
Our ordinary shares have been listed for trading on the NYSE under the symbol "CWK" since August 2, 2018. Prior to this, the share price was based off an internally calculated value developed based on the enterprise value of the Company. The approximate number of record holders of the Company's ordinary shares as of February 28, 2019 was
2
.
Dividend Policy
We have never declared or paid any cash dividends on our share capital. We do not expect to pay dividends on our ordinary shares for the foreseeable future. Instead, we anticipate that all of our earnings in the foreseeable future will be used for the operation and expansion of our business.
Under English law, any payment of dividends would be subject to relevant legislation and our articles of association, which provide that all dividends must be approved by our board of directors and, in some cases, our shareholders, and may only be paid from our distributable profits available for the purpose, determined on an unconsolidated basis. Future cash dividends, if any, will be at the discretion of our board of directors and will depend upon, among other things, our future operations and earnings, capital requirements and surplus, general financial condition, contractual restrictions and other factors the board of directors may deem relevant. The timing and amount of any future dividend payments will be at the discretion of our board of directors.
Recent Sales of Unregistered Securities
On October 11, 2018, Cushman & Wakefield plc issued 294,468 ordinary shares to employees and former employees in settlement of certain RSUs which vested on September 1, 2018. The issuance of the shares was exempt from registration pursuant to Section 4(a)(2) of the Securities Act, as transactions not involving a public offering.
Issuer Purchases of Equity Securities
For the year ended December 31, 2018, the Company did not repurchase any of its outstanding shares.
Equity Compensation Plans
The information required by this item is incorporated by reference to the information appearing in the Proxy Statement for our 2019 Annual Meeting.
Stock Performance Graph
The following graph shows our cumulative total shareholder return for the period beginning August 2, 2018, the day public trading of shares began, and ending on
December 31, 2018
. The graph also shows the cumulative total returns of the Standard & Poor’s 500 Stock Index, or S&P 500 Index, and our industry peer groups.
The comparison below assumes $100 was invested on August 2, 2018 in our ordinary shares and in each of the indices shown and assumes that all dividends were reinvested. Our stock price performance shown in the following graph is not necessarily indicative of future stock price performance. Our industry peer group is comprised of Jones Lang LaSalle (NYSE:JLL) and CBRE Group (NYSE: CBRE), global commercial real estate services companies publicly traded in the United States, as they represent our current primary competitors.
34
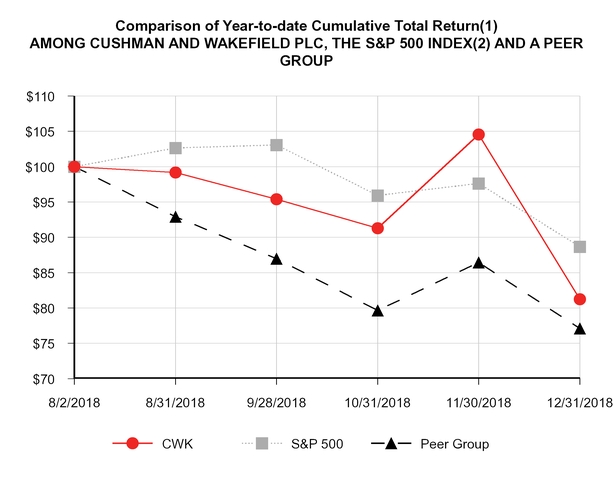
|
8/2/2018
|
|
8/31/2018
|
|
9/28/2018
|
|
10/31/2018
|
|
11/30/2018
|
|
12/31/2018
|
|
|
|
CWK
|
100.00
|
|
99.16
|
|
95.40
|
|
91.30
|
|
104.55
|
|
81.25
|
|
|
S&P 500
|
100.00
|
|
102.63
|
|
103.07
|
|
95.92
|
|
97.63
|
|
88.67
|
|
|
Peer Group
|
100.00
|
|
92.93
|
|
86.97
|
|
79.65
|
|
86.45
|
|
77.09
|
|
(1)
$100 invested on 8/2/18 in stock or index-including reinvestment of dividends and adjustment for stock splits
(2)
Copyright © 2019 Standard & Poor's, a division of S&P Global. All rights reserved.
This graph shall not be deemed incorporated by reference by any general statement incorporating by reference this Form 10-K into any filing under the Securities Act or under the Exchange Act, except to the extent that we specifically incorporate this information by reference therein, and shall not otherwise be deemed filed under the Securities Act or under the Exchange Act.
Item 6. Selected Financial Data
The selected financial data presented in the table below should be read in conjunction with "Risk Factors," “Management’s Discussion and Analysis of Financial Condition and Results of Operations” and our audited Consolidated Financial Statements and the related notes included elsewhere in this Form 10-K. The selected historical consolidated statements of operations data for the years ended
December 31, 2018
,
2017
and
2016
, and selected historical consolidated balance sheet data as of
December 31, 2018
and
2017
has been derived from our audited Consolidated Financial Statements included elsewhere in this Form 10-K. The selected historical consolidated balance sheet data as of
December 31, 2016
,
2015
and
2014
and historical consolidated statements of operations data for year ended
December 31, 2015
and the period from November 5, 2014 to December 31, 2014 (Successor) have been derived from our audited Consolidated Financial Statements not included in this Form 10-K. The selected historical consolidated statements of operations data for the period of July 1, 2014 to November 4, 2014 (Predecessor) has been derived from our audited Combined Consolidated Financial Statements not included in this Form 10-K. The selected historical Combined Consolidated statements of
35
operations and balance sheet data and for the period ended June 30, 2014 (Predecessor) have been derived from our Combined Consolidated Financial Statements not included in this Form 10-K.
On November 5, 2014, a private equity consortium comprised of TPG, PAG and OTPP, our Principal Shareholders, acquired DTZ. As a result of DTZ’s acquisition and resulting change in control and changes due to the impact of acquisition accounting, we are required to present separately the operating results for the Predecessor and Successor. We refer to the period through November 4, 2014 as the “Predecessor Period,” and the Combined Consolidated Financial Statements for that period include the accounts of the Predecessor. We refer to the period from November 5, 2014 as the “Successor Period,” and the Consolidated Financial Statements for that period include the accounts of the Successor. Due to the change in control and changes due to acquisition accounting, the Successor Period may not be comparable to the Predecessor Period. On July 13, 2015, the Company’s board of directors approved a change in fiscal year end from June 30 to December 31, effective with the year-end December 31, 2014. Unless otherwise noted, all references to “years” in this Form 10-K refer to the twelve-month period which ends on December 31 of each year. On December 31, 2014, we acquired Cassidy Turley. Our selected financial data beginning December 31, 2014 also includes Cassidy Turley’s selected financial data. On September 1, 2015, we acquired the C&W Group. Our selected financial data beginning September 1, 2015 also includes the C&W Group’s selected financial data.
On July 6, 2018, we completed the reorganization of our company through the Share Exchange and on July 19, 2018, we completed the Re-registration. Prior to the Share Exchange, our business was conducted by DTZ Jersey Holdings Limited and its consolidated subsidiaries. Following the Share Exchange and before the Re- registration, our business was conducted by Cushman & Wakefield Limited and its consolidated subsidiaries. Following the Re-registration, our business is conducted by Cushman & Wakefield plc and its consolidated subsidiaries. On July 20, 2018, the Company undertook the Share Consolidation, which resulted in a proportional decrease in the number of ordinary shares outstanding as well as corresponding adjustments to outstanding options and RSUs.
Historical results are not necessarily indicative of the results to be expected in the future.
|
Statement of Operations Data:
|
Successor
|
Predecessor
(a)
|
||||||||||||||||||||
|
Year Ended December 31,
|
Period from November 5, 2014 to December 31, 2014
|
Period from July 1, 2014 to November 4, 2014
|
Fiscal Year Ended
|
|||||||||||||||||||
|
(in millions, except for per share data)
|
2018
|
2017
|
2016
|
2015
|
June 30, 2014
|
|||||||||||||||||
|
Revenue
|
$
|
8,219.9
|
|
$
|
6,923.9
|
|
$
|
6,215.7
|
|
$
|
4,193.2
|
|
$
|
407.7
|
|
$
|
814.2
|
|
$
|
2,642.3
|
|
|
|
Operating income (loss)
|
$
|
12.6
|
|
$
|
(171.1
|
)
|
$
|
(295.4
|
)
|
$
|
(406.4
|
)
|
$
|
(57.7
|
)
|
$
|
1.7
|
|
$
|
86.4
|
|
|
|
Net (loss) income attributable to the Company
|
$
|
(185.8
|
)
|
$
|
(221.3
|
)
|
$
|
(434.2
|
)
|
$
|
(471.2
|
)
|
$
|
(21.8
|
)
|
$
|
0.4
|
|
$
|
58.4
|
|
|
|
Net loss per Share, Basic and Diluted (a):
|
||||||||||||||||||||||
|
Basic
|
$
|
(1.09
|
)
|
$
|
(1.54
|
)
|
$
|
(3.07
|
)
|
$
|
(5.43
|
)
|
$
|
(0.44
|
)
|
|||||||
|
Diluted
|
$
|
(1.09
|
)
|
$
|
(1.54
|
)
|
$
|
(3.07
|
)
|
$
|
(5.43
|
)
|
$
|
(0.44
|
)
|
|||||||
|
Weighted Average Shares Outstanding
|
||||||||||||||||||||||
|
Basic
|
171.2
|
|
143.9
|
|
141.4
|
|
86.8
|
|
50.0
|
|
||||||||||||
|
Diluted
|
171.2
|
|
143.9
|
|
141.4
|
|
86.8
|
|
50.0
|
|
||||||||||||
|
Balance sheet data (at period end):
|
||||||||||||||||||||||
|
Total cash and cash equivalents
|
$
|
895.3
|
|
$
|
405.6
|
|
$
|
382.3
|
|
$
|
530.4
|
|
$
|
191.9
|
|
$
|
122.7
|
|
||||
|
Total assets
|
$
|
6,546.0
|
|
$
|
5,793.4
|
|
$
|
5,677.3
|
|
$
|
5,440.7
|
|
$
|
2,407.2
|
|
$
|
1,674.0
|
|
||||
|
Total liabilities
|
$
|
5,185.9
|
|
$
|
5,294.0
|
|
$
|
5,091.9
|
|
$
|
4,415.2
|
|
$
|
1,840.2
|
|
$
|
1,073.0
|
|
||||
|
Total debt
|
$
|
2,684.1
|
|
$
|
2,843.5
|
|
$
|
2,660.1
|
|
$
|
2,328.7
|
|
$
|
931.1
|
|
$
|
279.1
|
|
||||
(a)
Prior to our acquisition by the Principal Shareholders, we operated as a part of UGL Limited and our combined consolidated financial information was derived from the Consolidated Financial Statements and accounting records of UGL Limited. Therefore, we did not have an existing share structure in place at that time and presentation of earnings per share for those periods prior to our acquisition on November 5, 2014 would not be meaningful to an investor.
36
|
Other Historical Data:
|
Year Ended December 31,
|
||||||||
|
(in millions)
|
2018
|
2017
|
2016
|
||||||
|
Americas Adjusted EBITDA
(1)
|
$
|
450.3
|
|
$
|
344.6
|
|
$
|
311.6
|
|
|
EMEA Adjusted EBITDA
(1)
|
107.9
|
|
108.8
|
|
90.8
|
|
|||
|
APAC Adjusted EBITDA
(1)
|
100.9
|
|
75.1
|
|
72.4
|
|
|||
|
Adjusted EBITDA
(1)
|
$
|
659.1
|
|
$
|
528.5
|
|
$
|
474.8
|
|
(1)
Adjusted EBITDA is a non-GAAP measure. See "Management's Discussion and Analysis of Financial Condition and Results of Operations-Results" for a reconciliation of total adjusted EBITDA to net loss attributable to the Company.
|
Statement of Cash Flows Data:
|
Year Ended December 31,
|
||||||||
|
(in millions)
|
2018
|
2017
|
2016
|
||||||
|
Net cash (used in) provided by operating activities
|
$
|
(2.2
|
)
|
$
|
4.4
|
|
$
|
(335.1
|
)
|
|
Net cash used in investing activities
|
(218.0
|
)
|
(143.2
|
)
|
(137.7
|
)
|
|||
|
Net cash provided by financing activities
|
725.9
|
|
167.7
|
|
356.5
|
|
|||
Item 7. Management's Discussion and Analysis of Financial Condition and Results of Operations
The following discussion and analysis of our financial condition and results of operations should be read in conjunction with our audited Consolidated Financial Statements and related notes included elsewhere in this Annual Report on Form 10-K.
As discussed in “Cautionary Note Regarding Forward-Looking Statements,” the following discussion and analysis contains forward-looking statements that involve risks and uncertainties. Our actual results may materially differ from those discussed in such forward-looking statements. Factors that could cause or contribute to these differences include, but are not limited to, those identified below and those discussed in “
Risk Factors
” under Part I, Item 1A in this report. Our fiscal year ends
December 31
. With respect to presentation, all statements asserting an "increase" or "decrease" relate to changes from prior applicable periods of comparison.
Overview
Cushman & Wakefield is a leading global commercial real estate services firm, built on a trusted brand and backed by approximately
51,000
employees and serving the world's real estate owners and occupiers through a scalable platform. We operate from approximately
400
offices in
70
countries, managing over
3.6 billion
square feet of commercial real estate space on behalf of institutional, corporate and private clients. Our business is focused on meeting the increasing demands of our clients across multiple service lines including Property, facilities and project management, Leasing, Capital markets and Valuation and other services.
Critical Accounting Policies
Our audited Consolidated Financial Statements included elsewhere in this report have been prepared in accordance with U.S. GAAP, which requires us to make estimates and assumptions that affect reported amounts. The estimates and assumptions are based on historical experience and on other factors that we believe to be reasonable. Actual results may differ from those estimates. We review these estimates on a periodic basis to ensure reasonableness. Although actual amounts may differ from such estimated amounts, we believe such differences are not likely to be material. For additional detail regarding our critical accounting policies, see
Note 2: Summary of Significant Accounting Policies
of the Notes to the audited Consolidated Financial Statements.
Recently Issued Accounting Pronouncements
See recently issued accounting pronouncements within
Note 2: Summary of Significant Accounting Policies
of the Notes to the audited Consolidated Financial Statements.
Revenue Recognition
The Company principally earns revenue from Property, facilities and project management, Leasing, Capital markets and Valuation and other.
As of January 1, 2018, the Company adopted Topic 606, which replaced most existing revenue recognition
37
guidance under U.S. GAAP. The core principle of Topic 606 requires companies to reevaluate when revenue is recorded on a transaction based upon newly defined criteria, either at a point in time or over time as goods or services are delivered. Topic 606 requires additional disclosures about the nature, amount, timing and uncertainty of revenue and cash flows arising from customer contracts, including significant judgments and estimates, and changes in those estimates. For further information regarding the impact of the adoption of this standard on the audited Consolidated Financial Statements and related disclosures, as well as significant judgments performed by the Company when applying Topic 606, refer to
Note 2: Summary of Significant Accounting Policies
and
Note 5: Revenue
from the Notes to the audited Consolidated Financial Statements for the year ended
December 31, 2018
.
Business Combinations, Goodwill and Indefinite-Lived Intangible Assets
The Company has grown, in part, through a series of acquisitions. See
Note 1: Organization and Business Overview
of the Notes to the audited Consolidated Financial Statements. We account for business combinations using the acquisition method of accounting, which requires that once control is obtained, all of the assets acquired and liabilities assumed, including amounts attributable to noncontrolling interests, be recorded at their respective fair values as of the acquisition date. Determination of the fair values of the assets and liabilities acquired requires estimates and the use of valuation techniques when market values are not readily available.
The Company recorded goodwill and intangible assets resulting from these acquisitions. Goodwill represents the excess of purchase consideration over the fair value of the net assets of businesses acquired.
Goodwill and indefinite-lived intangible assets are tested for impairment annually, or more frequently if events or changes in circumstances indicate that they may be impaired. The initial impairment evaluation of goodwill is a qualitative assessment and is performed to assess whether the fair value of a reporting unit (“RU”) is less than its carrying amount and only proceeds to the quantitative impairment test if it is more likely than not that the fair value of the RU is less than its carrying amount. If the Company determines the quantitative impairment test is required, the estimated fair value of the RU is compared to its carrying amount, including goodwill. If the estimated fair value of a RU exceeds its carrying value, goodwill is not considered to be impaired. If the carrying amount exceeds the estimated fair value, an impairment loss is recognized equal to that excess. The loss recognized cannot exceed the carrying amount of goodwill.
The Company records an impairment loss for other definite and indefinite-lived intangible assets if impairment triggers exist and the fair value of the asset is less than the asset’s carrying amount. For a detailed discussion of goodwill and indefinite-lived intangible assets, see
Note 6: Goodwill and Other Intangible Assets
of the Notes to the audited Consolidated Financial Statements.
Income Taxes
Income taxes are accounted for under the asset and liability method in accordance with US GAAP. Deferred tax assets and liabilities are recognized for the expected future tax consequences attributable to differences between carrying amounts of existing assets and liabilities and their respective tax bases and operating loss and tax credit carryforwards.
Deferred tax assets and liabilities are measured using enacted tax rates expected to apply to taxable income in the years in which those temporary differences are expected to be recovered or settled. The effect on deferred tax assets and liabilities of a change in tax rates is recognized in income in the period that the new rate is enacted. A valuation allowance is established against deferred tax assets when it is more likely than not that some portion or all of the deferred tax asset will not be realized in the future.
Accounting for tax positions requires judgments, including estimating reserves for potential uncertainties. We also assess our ability to utilize tax attributes, including those in the form of net operating loss carryforwards, for which the benefits have already been reflected in the financial statements. We do not record valuation allowances for deferred tax assets that we believe will be realized in future periods. While we believe the resulting tax balances as of
December 31, 2018
and
2017
are appropriately accounted for in accordance with US GAAP, as applicable, the ultimate outcome of such matters could result in favorable or unfavorable adjustments to our audited Consolidated Financial Statements and such adjustments could be material.
In determining the amount of current and deferred tax, the Company considers the impact of uncertain tax positions and whether additional taxes and interest may be due. New information may become available that causes the Company to change its judgment regarding the adequacy of existing tax liabilities; such changes to tax liabilities will impact tax expense in the period that such a determination is made.
38
On December 22, 2017, H.R. 1, the Tax Cuts and Jobs Act (“the Tax Act”) was enacted. The Tax Act significantly revised the U.S. corporate income tax regime by, among other things, lowering the U.S. federal corporate rate from 35% to 21% effective January 1, 2018 while also implementing a new tax system on non-US earnings and imposing a repatriation tax on deemed repatriated earnings of foreign subsidiaries. US GAAP requires the impact of tax legislation to be recognized in the period in which the law was enacted. Some amounts were recorded as a discrete item in the Benefit from income taxes in the consolidated statement of operations for the year ended
December 31, 2018
. Prior to
December 31, 2018
, changes as a result of the Tax Act were recorded as provisional amounts and the Company’s best estimates. Any adjustments recorded to the provisional amounts through the fourth quarter of 2018 were included in the statement of operations as an adjustment to income tax expense.
The provision for income taxes comprises current and deferred income tax expense and is recognized in the audited Consolidated Financial Statements. To the extent that the income taxes are for items recognized directly in equity, the related income tax effects are recognized in equity. The Company provides for the effects of income taxes on interim financial statements based on estimates of the effective tax rate for the full year, which is based on forecasted income by country and expected enacted tax rates. For additional discussion on income taxes, see
Note 12: Income Taxes
of the Notes to the audited Consolidated Financial Statements.
Items Affecting Comparability
When reading our financial statements and the information included in this Annual Report, it should be considered that we have experienced, and continue to experience, several material trends and uncertainties that have affected our financial condition and results of operations that could affect future performance. We believe that the following material trends and uncertainties are important to understand the variability of our historical earnings and cash flows and any potential future variability.
Macroeconomic Conditions
Our results of operations are significantly impacted by economic trends, government policies and the global and regional real estate markets. These include the following: overall economic activity; changes in interest rates; the impact of tax and regulatory policies; changes in employment rates; level of commercial construction spending; the cost and availability of credit; and the geopolitical environment.
Our operating model helps to partially mitigate the negative effect of difficult market conditions on our margins as a substantial portion of our costs are variable compensation expenses, specifically commissions and bonuses paid to our professionals in our Leasing and Capital market service lines. Nevertheless, adverse economic trends could pose significant risks to our operating performance and financial condition.
Acquisitions
Our results include the incremental impact of completed transactions from the date of acquisition, which may impact the comparability of our results on a year-over-year basis. Additionally, there is generally an adverse impact on net income for a period of time after the completion of an acquisition driven by transaction-related and integration expenses. We have historically used strategic and in-fill acquisitions to add new service capabilities, to increase our scale within existing capabilities and to expand our presence in new or existing geographic regions globally. We believe that strategic acquisitions will increase revenue, provide cost synergies and generate incremental income in the long term.
Seasonality
A significant portion of our revenue is seasonal, especially for service lines such as Leasing and Capital markets, which impacts the comparison of our financial condition and results of operations on a quarter-by-quarter basis. Generally, our industry is focused on completing transactions by calendar year-end with a significant concentration in the last quarter of the calendar year while certain expenses are recognized more evenly throughout the calendar year. Historically, our revenue and operating income tend to be lowest in the first quarter, and highest in the fourth quarter of each year. The Property, facilities and project management service line partially mitigates this intra-year seasonality, due to the recurring nature of this service line, which generates more stable revenues throughout the year.
Inflation
Our commission and other operating costs tied to revenue are primarily impacted by factors in the commercial real estate market. These factors have the potential to be affected by inflation. Other costs such as wages and costs of
39
goods and services provided by third parties also have the potential to be impacted by inflation. However, we do not believe that inflation has materially impacted our operations.
International Operations
Our business consists of service lines operating in multiple regions inside and outside of the U.S. Our international operations expose us to global economic trends as well as foreign government tax, regulatory and policy measures.
Additionally, outside of the U.S., we generate earnings in other currencies and are subject to fluctuations relative to the USD. As we continue to grow our international operations through acquisitions and organic growth, these currency fluctuations, most notably the Australian dollar, euro and British Pound Sterling, have the potential to positively or adversely affect our operating results measured in USD. It can be difficult to compare period-over-period financial statements when the movement in currencies against the USD does not reflect trends in the local underlying business as reported in its local currency.
In order to assist our investors and improve comparability of results, we present the year-over-year changes in certain of our non-GAAP financial measures, such as Fee revenue and Adjusted EBITDA, in "local" currency. The local currency change represents the year-over-year change assuming no movement in foreign exchange rates from the prior year. We believe that this provides our management and investors with a better view of comparability and trends in the underlying operating business.
Adoption of New Accounting Standards
On January 1, 2018, the Company adopted Topic 606 using the modified retrospective method. Results for reporting periods beginning after January 1, 2018 are presented under Topic 606. Comparative information continues to be reported under the accounting standards in effect for those periods.
The impact to revenue for the year ended
December 31, 2018
was an increase of
$432.8 million
, which included an increase of
$400.2 million
related to reimbursed expenses due to implementation of the updated principal versus agent considerations in Topic 606 and the acceleration in the timing of revenue recognition related to variable consideration primarily for Leasing services of
$32.6 million
. For further information regarding the impact of the adoption of this standard on the audited Consolidated Financial Statements and related disclosures, as well as significant judgments performed by the Company when applying Topic 606, refer to
Note 2: Summary of Significant Accounting Policies
and
Note 5: Revenue
from the Notes to the audited Consolidated Financial Statements for the year ended
December 31, 2018
.
Key Performance Measures
We regularly review a number of metrics to evaluate our business, measure our progress and make strategic decisions. The measures of Fee revenue, Fee-based operating expenses, Adjusted EBITDA, Adjusted EBITDA margin and local currency, which are non-GAAP measures are currently utilized by management to assess performance, and we disclose these measures to investors to assist them in providing a meaningful understanding of our performance. One of our current objectives is to identify the most relevant key performance indicators to stakeholders to allow them to analyze our business. See "Use of Non-GAAP Financial Measures" and "Results of Operations" below.
Use of Non-GAAP Financial Measures
We have used the following measures, which are considered "non-GAAP financial measures" under SEC guidelines:
|
i.
|
Fee revenue and Fee-based operating expenses;
|
|
ii.
|
Adjusted earnings before interest, taxes, depreciation and amortization ("Adjusted EBITDA") and Adjusted EBITDA margin; and
|
|
iii.
|
Local currency.
|
Our management principally uses these non-GAAP financial measures to evaluate operating performance, develop budgets and forecasts, improve comparability of results and assist our investors in analyzing the underlying performance of our business. These measures are not recognized measurements under GAAP. When analyzing our operating results, investors should use them in addition to, but not as an alternative for, the most directly comparable financial results calculated and presented in accordance with GAAP. Because the Company’s
40
calculation of these non-GAAP financial measures may differ from other companies, our presentation of these measures may not be comparable to similarly titled measures of other companies.
The Company believes that these measures provide a more complete understanding of ongoing operations, enhance comparability of current results to prior periods and may be useful for investors to analyze our financial performance. The measures eliminate the impact of certain items that may obscure trends in the underlying performance of our business. The Company believes that they are useful to investors, for the additional purposes described below.
Fee revenue:
The Company believes that investors may find this measure useful to analyze the financial performance of our Property, facilities and project management service line and our business generally. Fee revenue is GAAP revenue excluding costs reimbursable by clients which have substantially no margin, and as such provides greater visibility into the underlying performance of our business.
Additionally, pursuant to business combination accounting rules, certain fees that may have been deferred by the acquiree may be recorded as a receivable on the acquisition date by the Company. Such fees are included in Fee revenue as acquisition accounting adjustments based on when the acquiree would have recognized revenue in the absence of being acquired by the Company.
Fee-based operating expenses:
Consistent with GAAP, reimbursed costs for certain customer contracts are presented on a gross basis ("gross contract costs") in both revenue and operating expenses. As described above, gross contract costs are excluded from revenue in determining “Fee revenue.” Gross contract costs are similarly excluded from operating expenses in determining “Fee-based operating expenses.” Excluding gross contract costs from Fee-based operating expenses more accurately reflects how we manage our expense base and operating margins and, accordingly, is useful to investors and other external stakeholders for evaluating performance.
Adjusted EBITDA and Adjusted EBITDA margin:
We have determined Adjusted EBITDA to be our primary measure of segment profitability.
We believe that investors find this measure useful in comparing our operating performance to that of other companies in our industry because these calculations generally eliminate integration and other costs related to acquisitions, pre-IPO stock-based compensation, the deferred payment obligation related to the acquisition of Cassidy Turley and other items. Adjusted EBITDA also excludes the effects of financings, income tax and the non-cash accounting effects of depreciation and intangible asset amortization. Adjusted EBITDA margin, a non-GAAP measure of profitability as a percent of revenue, is calculated by dividing Adjusted EBITDA by Fee revenue.
Local currency:
In discussing our results, we refer to percentage changes in local currency. These metrics are calculated by holding foreign currency exchange rates constant in year-over-year comparisons. Management believes that this methodology provides investors with greater visibility into the performance of our business excluding the effect of foreign currency rate fluctuations.
41
Results of Operations
The following table sets forth items derived from our audited consolidated statements of operations for the
years ended
December 31, 2018
,
2017
and
2016
(in millions):
|
% Change in USD
|
% Change in Local Currency
|
|||||||||||||||||
|
Year Ended December 31, 2018
|
Year Ended December 31, 2017
|
Year Ended December 31, 2016
|
2018 v 2017
|
2017 v 2016
|
2018 v 2017
|
2017 v 2016
|
||||||||||||
|
Revenue:
|
||||||||||||||||||
|
Total revenue
|
$
|
8,219.9
|
|
$
|
6,923.9
|
|
$
|
6,215.7
|
|
19
|
%
|
11
|
%
|
19
|
%
|
11
|
%
|
|
|
Less: Gross contract costs
|
(2,271.8
|
)
|
(1,627.3
|
)
|
(1,406.0
|
)
|
40
|
%
|
16
|
%
|
40
|
%
|
15
|
%
|
||||
|
Acquisition accounting adjustments
|
2.5
|
|
23.2
|
|
30.1
|
|
n/m
|
|
(23
|
)%
|
n/m
|
|
(24
|
)%
|
||||
|
Total Fee revenue
|
$
|
5,950.6
|
|
$
|
5,319.8
|
|
$
|
4,839.8
|
|
12
|
%
|
10
|
%
|
12
|
%
|
10
|
%
|
|
|
Service Lines:
|
||||||||||||||||||
|
Property, facilities and project management
|
$
|
2,622.1
|
|
$
|
2,488.5
|
|
$
|
2,190.7
|
|
5
|
%
|
14
|
%
|
6
|
%
|
13
|
%
|
|
|
Leasing
|
1,920.7
|
|
1,650.8
|
|
1,498.9
|
|
16
|
%
|
10
|
%
|
16
|
%
|
10
|
%
|
||||
|
Capital markets
|
959.6
|
|
740.5
|
|
730.8
|
|
30
|
%
|
1
|
%
|
29
|
%
|
1
|
%
|
||||
|
Valuation and other
|
448.2
|
|
440.0
|
|
419.4
|
|
2
|
%
|
5
|
%
|
1
|
%
|
5
|
%
|
||||
|
Total Fee revenue
|
$
|
5,950.6
|
|
$
|
5,319.8
|
|
$
|
4,839.8
|
|
12
|
%
|
10
|
%
|
12
|
%
|
10
|
%
|
|
|
Costs and expenses:
|
||||||||||||||||||
|
Cost of services, operating and administrative expenses excluding gross contract costs
|
$
|
5,641.7
|
|
$
|
5,168.6
|
|
$
|
4,812.4
|
|
9
|
%
|
7
|
%
|
9
|
%
|
7
|
%
|
|
|
Gross contract costs
|
2,271.8
|
|
1,627.3
|
|
1,406.0
|
|
40
|
%
|
16
|
%
|
40
|
%
|
15
|
%
|
||||
|
Depreciation and amortization
|
290.0
|
|
270.6
|
|
260.6
|
|
7
|
%
|
4
|
%
|
7
|
%
|
4
|
%
|
||||
|
Restructuring, impairment and related charges
|
3.8
|
|
28.5
|
|
32.1
|
|
(87
|
)%
|
(11
|
)%
|
(87
|
)%
|
(8
|
)%
|
||||
|
Total costs and expenses
|
8,207.3
|
|
7,095.0
|
|
6,511.1
|
|
16
|
%
|
9
|
%
|
16
|
%
|
8
|
%
|
||||
|
Operating income/(loss)
|
$
|
12.6
|
|
$
|
(171.1
|
)
|
$
|
(295.4
|
)
|
(107
|
)%
|
(42
|
)%
|
(109
|
)%
|
(44
|
)%
|
|
|
Adjusted EBITDA
|
$
|
659.1
|
|
$
|
528.5
|
|
$
|
474.8
|
|
25
|
%
|
11
|
%
|
26
|
%
|
9
|
%
|
|
|
Adjusted EBITDA Margin
|
11.1
|
%
|
9.9
|
%
|
9.8
|
%
|
||||||||||||
|
n/m - not meaningful
|
||||||||||||||||||
Below is a reconciliation of Net loss attributable to the Company to Adjusted EBITDA (in millions):
|
Year Ended December 31, 2018
|
Year Ended December 31, 2017
|
Year Ended December 31, 2016
|
|||||||||
|
Net loss attributable to the Company
|
$
|
(185.8
|
)
|
$
|
(221.3
|
)
|
$
|
(434.2
|
)
|
||
|
Add/(less):
|
|
|
|||||||||
|
Depreciation and amortization
(1)
|
290.0
|
|
270.6
|
|
260.6
|
|
|||||
|
Interest expense, net of interest income
(2)
|
228.8
|
|
183.1
|
|
171.8
|
|
|||||
|
Provision (benefit) from income taxes
|
(25.0
|
)
|
(120.5
|
)
|
(24.3
|
)
|
|||||
|
Integration and other costs related to acquisitions
(3)
|
244.7
|
|
328.3
|
|
427.1
|
|
|||||
|
Pre-IPO stock-based compensation
(4)
|
63.4
|
|
27.1
|
|
23.2
|
|
|||||
|
Cassidy Turley deferred payment obligation
(5)
|
33.0
|
|
44.0
|
|
47.6
|
|
|||||
|
Other
(6)
|
10.0
|
|
17.2
|
|
3.0
|
|
|||||
|
Adjusted EBITDA
|
$
|
659.1
|
|
$
|
528.5
|
|
$
|
474.8
|
|
||
(1)
Depreciation and amortization includes merger and acquisition-related depreciation and amortization of
$205.8 million
,
$193.0 million
and
$182.0 million
for the
years ended
December 31, 2018
,
2017
and
2016
, respectively.
(2)
Interest expense, net of interest income includes one-time write-off of financing fees and other fees incurred in relation to debt extinguishments and modifications of
$53.8 million
, $0.0 million and
$9.0 million
for the
years ended
December 31, 2018
,
2017
and
2016
, respectively.
(3)
Integration and other costs related to acquisitions represents certain direct and incremental costs resulting from acquisitions and certain related integration efforts as a result of those acquisitions, as well as costs related to our restructuring efforts and initial public offering/private placement.
42
(4)
Pre-IPO stock-based compensation represents non-cash compensation expense associated with our pre-IPO equity compensation plans. Refer to
Note 10: Stock-based Payments
of the Notes to the audited Consolidated Financial Statements for the
year ended
December 31, 2018
for additional information.
(5)
Cassidy Turley deferred payment obligation represents expense associated with a deferred payment obligation related to the acquisition of Cassidy Turley on December 31, 2014, which was paid before
December 31, 2018
. Refer to
Note 10: Stock-based Payments
of the Notes to the audited Consolidated Financial Statements for the
year ended
December 31, 2018
for additional information.
(6)
Other includes sponsor monitoring fees of approximately
$3.4 million
,
$5.0 million
, and
$5.0 million
for the
years ended
December 31, 2018
,
2017
and
2016
respectively, accounts receivable securitization costs of approximately
$6.7 million
and
$8.2 million
for the
years ended
December 31, 2018
and
2017
, respectively; and
$(2.0) million
other items for the
year ended
December 31, 2016
.
Below is the reconciliation of Total costs and expenses to Fee-based operating expenses (in millions):
|
Year Ended December 31, 2018
|
Year Ended December 31, 2017
|
Year Ended December 31, 2016
|
|||||||||
|
Total costs and expenses
|
$
|
8,207.3
|
|
$
|
7,095.0
|
|
$
|
6,511.1
|
|
||
|
Less: Gross contract costs
|
(2,271.8
|
)
|
(1,627.3
|
)
|
(1,406.0
|
)
|
|||||
|
Fee-based operating expenses
|
$
|
5,935.5
|
|
$
|
5,467.7
|
|
$
|
5,105.1
|
|
||
Below is the reconciliation of Fee-based operating expenses by segment to Consolidated Fee-based operating expenses (in millions):
|
Year Ended December 31, 2018
|
Year Ended December 31, 2017
|
Year Ended December 31, 2016
|
|||||||||
|
Americas Fee-based operating expenses
|
$
|
3,592.4
|
|
$
|
3,251.7
|
|
$
|
2,992.4
|
|
||
|
EMEA Fee-based operating expenses
|
784.6
|
|
688.5
|
|
605.9
|
|
|||||
|
APAC Fee-based operating expenses
|
920.0
|
|
863.5
|
|
775.4
|
|
|||||
|
Segment Fee-based operating expenses
|
5,297.0
|
|
4,803.7
|
|
4,373.7
|
|
|||||
|
Depreciation and amortization
|
290.0
|
|
270.6
|
|
260.6
|
|
|||||
|
Integration and other costs related to acquisitions
(1)
|
242.1
|
|
305.1
|
|
397.0
|
|
|||||
|
Pre IPO stock-based compensation
|
63.4
|
|
27.1
|
|
23.2
|
|
|||||
|
Cassidy Turley deferred payment obligation
|
33.0
|
|
44.0
|
|
47.6
|
|
|||||
|
Other
|
10.0
|
|
17.2
|
|
3.0
|
|
|||||
|
Fee-based operating expenses
|
$
|
5,935.5
|
|
$
|
5,467.7
|
|
$
|
5,105.1
|
|
||
Year ended
December 31, 2018
compared to
year ended
December 31, 2017
Revenue
Revenue was
$8.2 billion
,
an increase
of
$1.3 billion
or
19%
. Gross contract costs, primarily in the Property, facilities and project management service line,
increased
$644.5 million
driven by the
$400.2 million
impact of the adoption of Topic 606.
Additionally, Fee revenue was
$6.0 billion
, an increase of
$643.0 million
or
12%
, on a local currency basis, reflecting increases in Leasing, Capital markets and Property, facilities and project management. Leasing Fee revenue increased by
$272.7 million
or
16%
, on a local currency basis driven primarily by the Americas. Capital markets Fee revenue increased by
$219.2 million
or
29%
, on a local currency basis, driven by an Americas increase of
$169.1 million
or
32%
, on a local currency basis, with the remainder of Fee revenue growth primarily in APAC. Property, facilities and project management increased by
$145.7 million
or
6%
, on a local currency basis, driven primarily by an Americas increase of
$72.0 million
or
4%
on a local currency basis, with the remainder of the Fee revenue growth primarily in EMEA.
43
Operating expenses
Operating expenses were
$8.2 billion
,
an increase
of
$1.1 billion
or
16%
. The increase in operating expenses reflected increased cost associated with revenue growth and the
$400.2 million
increase to gross contract costs resulting from the adoption of Topic 606 discussed above.
Additionally, Fee-based operating expenses, excluding Depreciation and amortization, integration and other costs related to acquisitions and stock-based compensation, were
$5.3 billion
, a
10%
increase
, on a local currency basis. The growth in Fee-based operating expenses reflected higher cost of services associated with Fee revenue growth.
Interest expense, net
Net interest expense was
$228.8 million
,
an increase
of
$45.7 million
, driven by
$53.8 million
of charges related to the 2018 debt refinancing and extinguishment activities. Net interest expense does not include accounts receivable securitization costs of
$6.7 million
and
$8.2 million
for the years ending
December 31, 2018
and 2017, respectively.
Benefit from income taxes
The benefit from income taxes was
$25.0 million
, a decrease of
$95.5 million
. The decrease was driven by the 2017 one-time deferred tax benefit received from the decrease in the U.S. corporate tax rate from 35% to 21% and the subsequent re-measurement of deferred tax liabilities, lower net loss before taxes in 2018 and the establishment of additional valuation allowances.
Net loss and Adjusted EBITDA
Net loss was
$185.8 million
, a
decrease
of
$35.5 million
, primarily driven by the increase in Fee revenue exceeding the increase in Fee-based operating expenses, partially offset by a lower benefit from income taxes and higher interest expense.
Adjusted EBITDA was
$659.1 million
,
an increase
of
$137.1 million
or
26%
, on a local currency basis, driven by the increase in Fee revenue exceeding the increase in Fee-based operating expenses and the
$10.9 million
local currency impact of the adoption of Topic 606. Adjusted EBITDA margin, calculated on a Fee revenue basis, was
11.1%
, compared to
9.9%
in the prior year, driven by Fee revenue mix and operating leverage.
Year Ended December 31, 2017
compared to
year ended
December 31, 2016
Revenue
Revenue was $6.9 billion, an increase of $708.2 million or 11%, which included an increase in gross contract costs of $221.3 million primarily in the Property, facilities and project management service line. Revenue growth also reflected the year-to-year increases in service line and segment Fee revenue discussed below. Foreign currency had a $44.2 million favorable impact on Revenue, driving approximately 1% growth of revenue.
Additionally, Fee revenue was $5.3 billion, an increase of $480.0 million. Fee revenue increased $447.7 million or 10%, on a local currency basis. Foreign currency had a $32.2 million favorable impact on Fee revenue, driving approximately 1% growth of Fee revenue.
Fee revenue reflected increases in Property, facilities and project management and Leasing. Property, facilities and project management Fee revenue increased $279.8 million or 13%, on a local currency basis, driven by an Americas increase of $187.5 million or 13%, on a local currency basis, and an APAC increase of $66.4 million or 12%, on a local currency basis. Leasing Fee revenue increased $143.4 million or 10%, on a local currency basis, driven by an Americas increase of $101.5 million or 9%, on a local currency basis, and an EMEA increase of $23.0 million or 11%, on a local currency basis.
Operating expenses
Operating expenses were $7.1 billion, an increase of
$583.9 million
or
8%
. The increase in operating expenses reflected increased cost associated with revenue growth, including gross contract costs, partially offset by lower integration and other costs related to acquisitions.
Additionally, Fee-based operating expenses, excluding Depreciation and amortization, integration and other costs related to acquisitions and stock-based compensation, were $4.8 billion, a 9% increase on a local currency basis. The growth in Fee-based operating expenses reflected higher costs in Property, facility and project management and Leasing associated with Fee revenue growth.
44
Interest expense, net
Net interest expense, increased by $11.3 million as a result of higher average annual borrowings. Average annual borrowings increased from $2.5 billion during 2016 to $2.7 billion during 2017 with Interest expense as a percentage of average outstanding debt remaining relatively unchanged.
Benefit from income taxes
The benefit from income taxes was
$120.5 million
, an increase of
$96.2 million
. The benefit included a discrete tax benefit of $60.9 million related to the Tax Act as well as the impact of valuation allowances and other discrete items. Refer to the Income Tax discussion in the Summary of Critical Accounting Policies and Estimates and Note 12 of the Notes to the audited Consolidated Financial Statements for a further discussion of our effective tax rate.
Net loss and Adjusted EBITDA
Net loss decreased from
$434.2 million
to
$221.3 million
in 2017 driven by the increase in Fee revenue exceeding the increase in Fee-based operating expenses, lower integration and other costs related to acquisitions and increased benefit from income taxes.
Adjusted EBITDA increased by $44.1 million or 9%, on a local currency basis, driven by the increase in Fee revenue exceeding the increase in Fee-based operating expenses. Adjusted EBITDA margin, calculated on a Fee revenue basis, was relatively unchanged from 2016 to 2017 at 10%.
Segment Operations
We report our operations through the following segments: (1) Americas, (2) Europe, Middle East and Africa ("EMEA") and (3) Asia Pacific ("APAC"). The Americas consists of operations located in the United States, Canada and key markets in Latin America. EMEA includes operations in the United Kingdom, France, Netherlands and other markets in Europe and the Middle East. APAC includes operations in Australia, Singapore, China and other markets in the Asia Pacific region.
For segment reporting, gross contract costs are excluded from revenue in determining Fee revenue. Gross contract costs are excluded from operating expenses in determining Fee-based operating expenses. Additionally, our measure of segment results, Adjusted EBITDA, excludes depreciation and amortization, as well as integration and other costs related to acquisitions, pre-IPO stock-based compensation, expense related to the Cassidy Turley deferred payment obligation and other items.
45
Americas Results
The following table summarizes our results of operations by our Americas operating segment for the
years ended
December 31, 2018
,
2017
and
2016
(in millions):
|
% Change USD
|
% Change in Local Currency
|
|||||||||||||||||
|
Year Ended December 31, 2018
|
Year Ended December 31, 2017
|
Year Ended December 31, 2016
|
2018 v 2017
|
2017 v 2016
|
2018 v 2017
|
2017 v 2016
|
||||||||||||
|
Total revenue
|
$
|
5,724.7
|
|
$
|
4,600.2
|
|
$
|
4,124.3
|
|
24
|
%
|
12
|
%
|
25
|
%
|
11
|
%
|
|
|
Less: Gross contract costs
|
(1,684.5
|
)
|
(1,023.4
|
)
|
(851.4
|
)
|
65
|
%
|
20
|
%
|
65
|
%
|
20
|
%
|
||||
|
Acquisition accounting adjustments
|
2.5
|
|
20.0
|
|
30.6
|
|
(88
|
)%
|
(35
|
)%
|
(88
|
)%
|
(35
|
)%
|
||||
|
Total Fee revenue
|
$
|
4,042.7
|
|
$
|
3,596.8
|
|
$
|
3,303.5
|
|
12
|
%
|
9
|
%
|
13
|
%
|
9
|
%
|
|
|
Service lines:
|
||||||||||||||||||
|
Property, facilities and project management
|
$
|
1,698.6
|
|
$
|
1,638.3
|
|
$
|
1,445.4
|
|
4
|
%
|
13
|
%
|
4
|
%
|
13
|
%
|
|
|
Leasing
|
1,481.6
|
|
1,244.6
|
|
1,140.7
|
|
19
|
%
|
9
|
%
|
19
|
%
|
9
|
%
|
||||
|
Capital markets
|
699.4
|
|
530.4
|
|
536.2
|
|
32
|
%
|
(1
|
)%
|
32
|
%
|
(1
|
)%
|
||||
|
Valuation and other
|
163.1
|
|
183.5
|
|
181.2
|
|
(11
|
)%
|
1
|
%
|
(10
|
)%
|
1
|
%
|
||||
|
Total Fee revenue
|
$
|
4,042.7
|
|
$
|
3,596.8
|
|
$
|
3,303.5
|
|
12
|
%
|
9
|
%
|
13
|
%
|
9
|
%
|
|
|
Segment operating expenses
|
$
|
5,276.9
|
|
$
|
4,275.1
|
|
$
|
3,843.8
|
|
23
|
%
|
11
|
%
|
24
|
%
|
11
|
%
|
|
|
Less: Gross contract costs
|
(1,684.5
|
)
|
(1,023.4
|
)
|
(851.4
|
)
|
65
|
%
|
20
|
%
|
65
|
%
|
20
|
%
|
||||
|
Total Fee-based operating expenses
|
$
|
3,592.4
|
|
$
|
3,251.7
|
|
$
|
2,992.4
|
|
10
|
%
|
9
|
%
|
11
|
%
|
8
|
%
|
|
|
Adjusted EBITDA
|
$
|
450.3
|
|
$
|
344.6
|
|
$
|
311.6
|
|
31
|
%
|
11
|
%
|
31
|
%
|
10
|
%
|
|
|
Adjusted EBITDA Margin
|
11.1
|
%
|
9.6
|
%
|
9.4
|
%
|
||||||||||||
Year ended December 31, 2018
compared to
year ended
December 31, 2017
Americas revenue was
$5.7 billion
, an increase of
$1.1 billion
or
24%
. The change in revenue includes higher gross contract costs of
$332.8 million
as a result of the adoption of Topic 606.
Additionally, Fee revenue was
$4.0 billion
, an increase of
$462.5 million
or
13%
, on a local currency basis. The increase in Fee revenue was driven primarily by growth in Leasing and Capital markets. The adoption of Topic 606 positively impacted Fee revenue in the Leasing service line by
$32.3 million
, on a local currency basis.
Fee-based operating expenses were
$3.6 billion
, an increase of
$355.3 million
or
11%
, on a local currency basis. The growth in Fee-based operating expenses was driven primarily by higher cost of services associated with Fee revenue growth.
Adjusted EBITDA was
$450.3 million
, an increase of
$107.4 million
or
31%
, on a local currency basis, driven by increases in Fee revenue exceeding the increases in Fee-based operating expenses and the
$13.5 million
local currency impact of the adoption of Topic 606. Adjusted EBITDA margin, calculated on a Fee revenue basis, was
11.1%
, compared to
9.6%
in the prior year.
Year ended
December 31, 2017
compared to
year ended
December 31, 2016
Americas revenue was $4.6 billion and Fee revenue was $3.6 billion, increases of $475.9 million and $293.3 million, respectively.
Additionally, Fee revenue increased $284.4 million or 9%, on a local currency basis, reflecting broad growth across all four service lines. The increase in Fee revenue was driven primarily by Property, facilities and project management and Leasing.
Fee-based operating expenses were $3.3 billion, an 8% increase on a local currency basis. The growth in Fee-based operating expenses was driven primarily by higher cost of services associated with Fee revenue growth.
Adjusted EBITDA increased by $32.0 million or 10%, on a local currency basis, driven by the increase in Fee revenue
46
exceeding the increase in Fee-based operating expenses. Adjusted EBITDA margin, calculated on a Fee revenue basis, was 9.6%, compared to 9.4%.
EMEA Results
The following table summarizes our results of operations by our EMEA operating segment for the
years ended
December 31, 2018
,
2017
and
2016
(in millions):
|
% Change in USD
|
% Change in Local Currency
|
|||||||||||||||||
|
Year Ended December 31, 2018
|
Year Ended December 31, 2017
|
Year Ended December 31, 2016
|
2018 v 2017
|
2017 v 2016
|
2018 v 2017
|
2017 v 2016
|
||||||||||||
|
Total revenue
|
$
|
999.8
|
|
$
|
863.3
|
|
$
|
755.5
|
|
16
|
%
|
14
|
%
|
13
|
%
|
14
|
%
|
|
|
Less: Gross contract costs
|
(111.9
|
)
|
(81.3
|
)
|
(65.0
|
)
|
38
|
%
|
25
|
%
|
33
|
%
|
28
|
%
|
||||
|
Acquisition accounting adjustments
|
—
|
|
3.2
|
|
(0.8
|
)
|
n/m
|
|
n/m
|
|
n/m
|
|
n/m
|
|
||||
|
Total Fee revenue
|
$
|
887.9
|
|
$
|
785.2
|
|
$
|
689.7
|
|
13
|
%
|
14
|
%
|
11
|
%
|
13
|
%
|
|
|
Service lines:
|
||||||||||||||||||
|
Property, facilities and project management
|
$
|
262.1
|
|
$
|
200.5
|
|
$
|
172.9
|
|
31
|
%
|
16
|
%
|
27
|
%
|
16
|
%
|
|
|
Leasing
|
265.0
|
|
256.5
|
|
229.1
|
|
3
|
%
|
12
|
%
|
2
|
%
|
11
|
%
|
||||
|
Capital markets
|
173.5
|
|
154.3
|
|
128.0
|
|
12
|
%
|
21
|
%
|
11
|
%
|
18
|
%
|
||||
|
Valuation and other
|
187.3
|
|
173.9
|
|
159.7
|
|
8
|
%
|
9
|
%
|
5
|
%
|
9
|
%
|
||||
|
Total Fee revenue
|
$
|
887.9
|
|
$
|
785.2
|
|
$
|
689.7
|
|
13
|
%
|
14
|
%
|
11
|
%
|
13
|
%
|
|
|
Segment operating expenses
|
$
|
896.5
|
|
$
|
769.8
|
|
$
|
670.9
|
|
16
|
%
|
15
|
%
|
15
|
%
|
15
|
%
|
|
|
Less: Gross contract costs
|
(111.9
|
)
|
(81.3
|
)
|
(65.0
|
)
|
38
|
%
|
25
|
%
|
33
|
%
|
28
|
%
|
||||
|
Total Fee-based operating expenses
|
$
|
784.6
|
|
$
|
688.5
|
|
$
|
605.9
|
|
14
|
%
|
14
|
%
|
13
|
%
|
14
|
%
|
|
|
Adjusted EBITDA
|
$
|
107.9
|
|
$
|
108.8
|
|
$
|
90.8
|
|
(1
|
)%
|
20
|
%
|
2
|
%
|
12
|
%
|
|
|
Adjusted EBITDA Margin
|
12.2
|
%
|
13.9
|
%
|
13.2
|
%
|
||||||||||||
Year ended
December 31, 2018
compared to
year ended
December 31, 2017
EMEA revenue was
$999.8 million
, an increase of
$136.5 million
or
16%
. Foreign currency had a
$15.2 million
or
2%
favorable impact on Revenue. The change in revenue includes higher gross contract costs of
$24.0 million
as a result of the adoption of Topic 606.
Additionally, Fee revenue was
$887.9 million
, an increase of
$90.1 million
or
11%
, on a local currency basis, driven primarily by growth in Property, facilities and project management and Capital markets.
Fee-based operating expenses were
$784.6 million
, an increase of
$90.3 million
or
13%
, on a local currency basis. The growth in Fee-based operating expenses was driven primarily by higher cost of services associated with Fee revenue growth.
Adjusted EBITDA was
$107.9 million
, remained relatively consistent on a local currency basis, driven by increases in Fee revenue approximately equaling the increases in Fee-based operating expenses. Adjusted EBITDA margin, calculated on a Fee revenue basis, was
12.2%
, compared to
13.9%
in the prior year.
Year ended
December 31, 2017
compared to
year ended
December 31, 2016
EMEA revenue was $863.3 million and Fee revenue was $785.2 million, increases of $107.8 million and $95.5 million, respectively.
Additionally, Fee revenue increased by $84.1 million or 13%, on a local currency basis, reflecting broad growth across all four service lines. The increase in Fee revenue was driven primarily by Property, facilities and project management, Leasing and Capital markets.
Fee-based operating expenses were $688.5 million, a 14% increase on a local currency basis. The growth in Fee-
47
based operating expenses was driven primarily by higher cost of services associated with Fee revenue growth.
Adjusted EBITDA increased by $10.3 million or 12%, on a local currency basis, driven by the increase in Fee revenue exceeding the increase in Fee-based operating expenses. Adjusted EBITDA margin, calculated on a Fee revenue basis, was 13.9%, compared to 13.2%.
APAC Results
The following table summarizes our results of operations by our APAC operating segment for the
years ended
December 31, 2018
,
2017
and
2016
(in millions):
|
% Change in USD
|
% Change in Local Currency
|
|||||||||||||||||
|
Year Ended December 31, 2018
|
Year Ended December 31, 2017
|
Year Ended December 31, 2016
|
2018 v 2017
|
2017 v 2016
|
2018 v 2017
|
2017 v 2016
|
||||||||||||
|
Total revenue
|
$
|
1,495.4
|
|
$
|
1,460.4
|
|
$
|
1,335.9
|
|
2
|
%
|
9
|
%
|
4
|
%
|
8
|
%
|
|
|
Less: Gross contract costs
|
(475.4
|
)
|
(522.6
|
)
|
(489.6
|
)
|
(9
|
)%
|
7
|
%
|
(7
|
)%
|
4
|
%
|
||||
|
Acquisition accounting adjustments
|
—
|
|
—
|
|
0.3
|
|
n/m
|
|
n/m
|
|
n/m
|
|
n/m
|
|
||||
|
Total Fee revenue
|
$
|
1,020.0
|
|
$
|
937.8
|
|
$
|
846.6
|
|
9
|
%
|
11
|
%
|
9
|
%
|
10
|
%
|
|
|
Service lines:
|
||||||||||||||||||
|
Property, facilities and project management
|
$
|
661.4
|
|
$
|
649.7
|
|
$
|
572.4
|
|
2
|
%
|
14
|
%
|
2
|
%
|
12
|
%
|
|
|
Leasing
|
174.1
|
|
149.7
|
|
129.1
|
|
16
|
%
|
16
|
%
|
18
|
%
|
15
|
%
|
||||
|
Capital markets
|
86.7
|
|
55.8
|
|
66.6
|
|
55
|
%
|
(16
|
)%
|
57
|
%
|
(16
|
)%
|
||||
|
Valuation and other
|
97.8
|
|
82.6
|
|
78.5
|
|
18
|
%
|
5
|
%
|
17
|
%
|
6
|
%
|
||||
|
Total Fee revenue
|
$
|
1,020.0
|
|
$
|
937.8
|
|
$
|
846.6
|
|
9
|
%
|
11
|
%
|
9
|
%
|
10
|
%
|
|
|
Segment operating expenses
|
$
|
1,395.4
|
|
$
|
1,386.1
|
|
$
|
1,265.0
|
|
1
|
%
|
10
|
%
|
2
|
%
|
8
|
%
|
|
|
Less: Gross contract costs
|
(475.4
|
)
|
(522.6
|
)
|
(489.6
|
)
|
(9
|
)%
|
7
|
%
|
(7
|
)%
|
4
|
%
|
||||
|
Total Fee-based operating expenses
|
$
|
920.0
|
|
$
|
863.5
|
|
$
|
775.4
|
|
7
|
%
|
11
|
%
|
7
|
%
|
10
|
%
|
|
|
Adjusted EBITDA
|
$
|
100.9
|
|
$
|
75.1
|
|
$
|
72.4
|
|
34
|
%
|
4
|
%
|
35
|
%
|
3
|
%
|
|
|
Adjusted EBITDA Margin
|
9.9
|
%
|
8.0
|
%
|
8.6
|
%
|
||||||||||||
Year ended
December 31, 2018
compared to
year ended
December 31, 2017
APAC revenue was
$1.5 billion
, an increase of
$35.0 million
. The change in revenue includes higher gross contract costs of
$43.4 million
as a result of the adoption of Topic 606.
Additionally, Fee revenue was
$1.0 billion
, an increase of
$90.4 million
or
9%
, on a local currency basis. The increase in Fee revenue was driven primarily by growth in Capital markets, Leasing and Valuation and other.
Fee-based operating expenses were
$920.0 million
, an increase of
$63.0 million
or
7%
, on a local currency basis. The growth in Fee-based operating expenses was driven primarily by higher cost of services associated with Fee revenue growth.
Adjusted EBITDA was
$100.9 million
, an increase of
$27.4 million
or
35%
, on a local currency basis, driven by the increase in Fee revenue exceeding the increase in Fee-based operating expenses. Adjusted EBITDA margin, calculated on a Fee revenue basis, was
9.9%
compared to
8.0%
in the prior year.
Year ended
December 31, 2017
compared to
year ended
December 31, 2016
APAC revenue was $1.5 billion and Fee revenue was $937.8 million, increases of $124.5 million and $91.2 million, respectively.
Additionally, Fee revenue increased by $79.2 million or 10% on a local currency basis. The increase in Fee revenue was driven primarily by Property, facilities and project management and Leasing, partially offset by Capital
48
markets.
Fee-based operating expenses were $863.5 million, a 10% increase on a local currency basis. The growth in Fee-based operating expenses was driven primarily by higher cost of services associated with Fee revenue growth.
Adjusted EBITDA increased by $1.9 million or 3%, on a local currency basis, driven by the increase in Fee revenue exceeding the increase in Fee-based operating expenses. Adjusted EBITDA margin, calculated on a Fee revenue basis, was 8.0% compared to 8.6%.
Liquidity and Capital Resources
We believe that we have adequate funds and liquidity to satisfy our working capital and other funding requirements with internally generated cash flow and, as necessary, cash on hand and borrowings under our revolving credit facility.
We have historically relied on our internally generated cash flow to fund our working capital needs and ongoing capital expenditures on an annual basis. Our internally generated cash flow is seasonal and is typically lowest in the first quarter of the year, when revenue is lowest, and greatest in the fourth quarter of the year, when revenue is highest. The seasonal nature of our internally generated cash flow can result in a mismatch with funding needs for working capital and ongoing capital expenditures, which we manage using available cash on hand and, as necessary, borrowings under our revolving credit facility.
In the absence of a large strategic acquisition or other extraordinary events, we believe our cash on hand, cash flow from operations and availability under our revolving credit facility will be sufficient to meet our anticipated cash requirements for the foreseeable future, and at a minimum for the next 12 months. We may seek to take advantage of opportunities to refinance existing debt instruments, as we have done in the past, with new debt instruments at interest rates, maturities and on terms we consider attractive.
As of
December 31, 2018
, the Company had
$1.7 billion
of liquidity, consisting of cash on hand of
$895.3 million
and our undrawn revolving credit facility of
$810.0 million
. In August 2018, the $450.0 million Second Lien Loan was repaid with IPO proceeds of approximately $1.0 billion; the new Credit Agreement was entered into to increase liquidity and extend maturity; the First Lien Loan was repaid; and the revolving credit facility was modified which expanded borrowing capacity from $486.0 million to $810.0 million. During 2018, we did not draw on our Revolver.
The Company had outstanding debt of
$2.7 billion
as of
December 31, 2018
, which net of cash on hand, provided for a net debt position of approximately
$1.8 billion
. The decrease in net debt of approximately
$0.6 billion
from
December 31, 2017
was driven by proceeds from the IPO.
Our level of indebtedness increases the possibility that we may be unable to pay the principal amount of our indebtedness and other obligations when due. In addition, we may incur additional debt from time to time to finance strategic acquisitions, investments, joint ventures or for other purposes, subject to the restrictions contained in the documents governing our indebtedness. If we incur additional debt, the risks associated with our leverage, including our ability to service our debt, would increase. See “Risk Factors." Despite our current indebtedness levels, we and our subsidiaries may still be able to incur substantially more debt, which could further exacerbate the risks associated with our substantial leverage.
The second long-term liquidity need is the payment of obligations related to acquisitions. For the year ended
December 31, 2018
, we paid
$44.2 million
in cash consideration for our various acquisitions. Our acquisition structures often include deferred and/or contingent payments in future periods that are subject to the passage of time, achievement of certain performance metrics and/or other conditions. As of
December 31, 2018
and 2017, we had accrued
$73.0 million
and $104.6 million, respectively, of deferred and earn-out consideration payable, which was included in Accounts payable and accrued expenses and in Other long-term liabilities in the accompanying audited consolidated balance sheets. Of the total balance as of
December 31, 2018
and 2017, we have accrued
$38.3 million
and
$51.3 million
for earn-out consideration, respectively. As of
December 31, 2018
, the maximum potential payment for these earn-outs was
$48.6 million
, subject to the achievement of certain performance conditions.
As a professional services firm, funding our operating activities is not capital intensive. Total capital expenditures for the year ended
December 31, 2018
were
$84.2 million
.
49
Historical Cash Flows
|
Cash Flow Summary
|
|||||||||
|
Year Ended December 31, 2018
|
Year Ended December 31, 2017
|
Year Ended December 31, 2016
|
|||||||
|
Net cash (used in) provided by operating activities
|
$
|
(2.2
|
)
|
$
|
4.4
|
|
$
|
(335.1
|
)
|
|
Net cash used in investing activities
|
(218.0
|
)
|
(143.2
|
)
|
(137.7
|
)
|
|||
|
Net cash provided by financing activities
|
725.9
|
|
167.7
|
|
356.5
|
|
|||
|
Effects of exchange rate fluctuations on cash, cash equivalents and restricted cash
|
(8.2
|
)
|
14.2
|
|
(6.8
|
)
|
|||
|
Total change in cash, cash equivalents and restricted cash
|
$
|
497.5
|
|
$
|
43.1
|
|
$
|
(123.1
|
)
|
Operating Activities
We
used
$2.2 million
of cash for operating activities for the
year ended
December 31, 2018
, a change of
$6.6 million
from the prior year. The change was driven by a $124.1 million payment related to our Cassidy Turley deferred purchase obligation partially offset by a decrease in net loss of
$35.5 million
and higher non-cash charges including for debt extinguishment in the amount of $50.4 million.
Operating activities provided
$4.4 million
in cash for the
year ended
December 31, 2017
, a change of $339.5 million from the prior year. This change was driven by a decrease of $229.0 million in the net loss from 2016 to 2017 as well as lower payments for integration-related activities.
Investing Activities
We
used
$218.0 million
in cash for investing activities for the
year ended
December 31, 2018
,
an increase
of
$74.8 million
from the prior year. The change was driven primarily by a return of beneficial interest in the A/R Securitization of
$85.0 million
. Refer to Note 17: Accounts Receivable Securitization for more information.
We used $143.2 million in cash in investing activities for the
year ended
December 31, 2017
, an increase of $5.5 million from the prior year. The increase was driven by increased capital expenditures primarily related to the continued integration of C&W Group.
Financing Activities
Financing activities
provided
$725.9 million
in cash for the
year ended
December 31, 2018
,
an increase
of
$558.2 million
from the prior year, driven by proceeds of approximately $1.0 billion from the IPO and Concurrent Private Placement, partially offset by the $450.0 million repayment of the Second Lien loan.
Financing activities provided $167.7 million in cash for the
year ended
December 31, 2017
, a decrease of $188.8 million from the prior year. This decrease was driven by lower net borrowings of $157.9 million and lower proceeds from the issuance of shares of $16.4 million in 2017.
Summary of Contractual Obligations
The following is a summary of our various contractual obligations and other commitments as of
December 31, 2018
(in millions):
|
Contractual Obligations
|
Total
|
Less than 1 year
|
1 - 3 years
|
3 - 5 years
|
More than 5 years
|
||||||||||||||
|
Debt obligations
|
$
|
2,693.6
|
|
$
|
27.1
|
|
$
|
54.2
|
|
$
|
54.0
|
|
$
|
2,558.3
|
|
||||
|
Capital lease obligations
|
18.4
|
|
9.3
|
|
8.7
|
|
0.4
|
|
—
|
|
|||||||||
|
Operating lease obligations
|
791.9
|
|
152.9
|
|
252.1
|
|
176.7
|
|
210.2
|
|
|||||||||
|
Defined benefit pension obligations
|
73.8
|
|
6.5
|
|
13.3
|
|
14.3
|
|
39.7
|
|
|||||||||
|
Total Contractual Obligations
|
$
|
3,577.7
|
|
$
|
195.8
|
|
$
|
328.3
|
|
$
|
245.4
|
|
$
|
2,808.2
|
|
||||
50
Debt obligations
- Represents the gross outstanding long-term debt balance payable at maturity, excluding unamortized discount and issuance costs. Because the majority of our debt bears interest at variable rates, the precise amount of annual interest payments cannot be determined and such amounts are therefore excluded from the table above. Using current rates expected annual interest payments would be approximately
$157.4 million
until our facility matures in 2025. See
Note 9: Long-term Debt and Other Borrowings
of the Notes to the audited Consolidated Financial Statements for further discussion.
Lease obligations
- Our lease obligations primarily consist of operating and capital leases of office space in various buildings for our own use. The total minimum rents expected to be received and recorded as sublease income in the future for operating subleases as of
December 31, 2018
was
$58.9 million
. See
Note 14: Commitments and Contingencies
of the Notes to the audited Consolidated Financial Statements for further discussion.
Defined benefit plan obligations
- Represents estimates of the expected benefits to be paid out by our defined benefit plans. These obligations will be funded from the assets held by these plans. If the assets these plans hold are not sufficient to fund these payments, we will fund the remaining obligations. We have historically funded pension costs as actuarially determined and as applicable laws and regulations require. We expect to contribute to our defined benefit pension plans in 2019; see
Note 10: Employee Benefits
of the Notes to the audited Consolidated Financial Statements for further discussion.
Other contractual obligations recorded on the balance sheet include deferred consideration of
$34.7 million
and contingent consideration of
$38.3 million
as of
December 31, 2018
. These items are not included in the table above, as timing and amount of payments cannot be determined due to their nature as estimates or outcomes having connection to future events.
As of
December 31, 2018
, our current and non-current tax liabilities, including interest and penalties, totaled
$62.7 million
. Of this amount, we can reasonably estimate that
$38.6 million
will require cash settlement in less than one year. We are unable to reasonably estimate the timing of the effective settlement of tax positions for the remaining
$24.1 million
. In addition, we recognized an estimated tax liability of
$1.2 million
related to the 2017 and 2018 transition tax on mandatory deemed repatriation due to the Tax Act, net of
$29.0 million
of foreign income tax credit carryforwards used to reduce the liability. The estimated state tax liability and a portion of the estimated federal tax liability totaling
$0.2 million
is payable in less than one year. The remainder of the federal tax liability of
$1.0 million
is payable over the following
six
years.
Off-Balance Sheet Arrangements
The Company’s guarantees primarily relate to requirements under certain client service contracts and have arisen through the normal course of business. Our current expectation is that future payment or performance related to non-performance under these guarantees is considered remote. See
Note 14: Commitments and Contingencies
of the Notes to the audited Consolidated Financial Statements for further information.
The Company is party to an A/R Securitization arrangement whereby it continuously sells trade receivables to an unaffiliated financial institution, which has an investment limit of
$125.0 million
. Receivables are derecognized from our balance sheet upon sale, for which we receive cash payment and record a deferred purchase price receivable. As of
December 31, 2018
, the Company has not reached the investment limit. The A/R Securitization terminates on August 20, 2021, unless extended or an earlier termination event occurs. See
Note 17: Accounts Receivable Securitization
of the Notes to the audited Consolidated Financial Statements for further information.
Indebtedness
We have incurred debt to finance the acquisitions of DTZ, Cassidy Turley and C&W Group, Inc. In addition, we may incur additional debt from time to time to finance strategic acquisitions, investments, joint ventures or for other purposes, subject to the restrictions contained in the documents governing our indebtedness.
2018 Credit Agreement
On August 21, 2018, we entered into a
$3.5 billion
credit agreement, comprised of a
$2.7 billion
term loan and an
$810.0 million
revolving facility. Net proceeds from the 2018 First Lien Loan were
$2.7 billion
(
$2.7 billion
aggregate principal amount less
$13.5 million
stated discount and
$20.4 million
in debt transaction costs). With the proceeds from the 2018 First Lien Loan, we subsequently paid off all outstanding principal and accrued interest of
$2.6 billion and $25.9 million, respectively, under the credit agreement dated as of November 4, 2014 (the “2014 Credit
51
Agreement”), respectively, which also resulted in the write-off of unamortized deferred financing fees of $39.2 million.
The 2018 Credit Agreement bears interest at a variable interest rate that we may select pursuant to the terms of the 2018 Credit Agreement. As of the
year ended
December 31, 2018
, the rate is equal to 1-month LIBOR plus 3.25%. The 2018 First Lien Loan matures on August 21, 2025. The effective interest rate of the 2018 First Lien Loan is
6.0%
as of
December 31, 2018
.
The 2018 Credit Agreement requires quarterly principal payments equal to 0.25% of the aggregate principal amount of the 2018 First Lien Loan, including incremental borrowings.
Revolver
As of
December 31, 2018
, we had
0
outstanding funds drawn under the Revolver, which matures on August 21, 2023. The Company did not draw on the Revolver at any point during 2018.
Financial Covenants and Terms
The 2018 Credit Agreement has a springing financial covenant, for the benefit of the Revolver lenders only that is tested on the last day of each fiscal quarter if the outstanding loans under the Revolver exceed an applicable threshold. If the financial covenant is triggered, the First Lien Net Leverage Ratio is tested for compliance not to exceed 5.80 to 1.00. The financial covenant has not been triggered since we entered into the 2018 Credit Agreement. Similarly, the financial covenant under our original First Lien Credit Agreement was not triggered in any period since its inception in 2014.
The Company was in compliance with all of its loan provisions under its 2018 First Lien Credit Agreement as of
December 31, 2018
.
Derivatives
We are exposed to certain risks arising from both business operations and economic conditions, including interest rate risk and foreign currency risk. We manage interest rate risk primarily by managing the amount, sources and duration of debt funding and by using derivative financial instruments. Derivative financial instruments are used to manage differences in the amount, timing and duration of known or expected cash payments principally related to borrowings under our 2018 First Lien Credit Agreement as well as certain foreign currency exposures.
See
Note 8: Derivative Financial Instruments and Hedging Activities
of the Notes to audited Consolidated Financial Statements as well as "Quantitative and Qualitative Disclosures About Market Risk" for additional information about risks managed through derivative activities.
Item 7A. Quantitative and Qualitative Disclosures About Market Risk
Market and Other Risk Factors
Market Risk
The principal market risks we are exposed to are:
|
i.
|
interest rates on debt obligations; and
|
|
ii.
|
foreign exchange risk.
|
We manage these risks primarily by managing the amount, sources, and duration of our debt funding and by using various derivative financial instruments such as interest rate hedges or foreign currency contracts. We enter into derivative instruments with trusted and diverse counterparties to reduce credit risk. These derivative instruments are strictly used for risk management purposes and, accordingly, are not used for trading or speculative purposes.
Interest Rates
We are exposed to interest rate volatility with regard to our 2018 First Lien Loan and revolving credit facility. We manage this interest rate risk by entering into interest rate derivative agreements to attempt to hedge the variability of future interest payments driven by fluctuations in interest rates.
Our 2018 First Lien Loan bears interest at an annual rate of 1-month LIBOR plus
3.25%
.
We continually assess interest rate sensitivity to estimate the impact of rising short-term interest rates on our variable rate debt. Our interest rate risk management strategy is focused on limiting the impact of interest rate
52
changes on earnings and cash flows to lower our overall borrowing cost. Historically, we have maintained the majority of our overall interest rate exposure on a fixed-rate basis. In order to achieve this, we have entered into derivative financial instruments such as interest rate swap agreements when appropriate and will continue to do so as appropriate. See
Note 8: Derivative Financial Instruments and Hedging Activities
of the Notes to audited Consolidated Financial Statements for additional information about interest rate risks managed through derivative activities and notional amounts of underlying hedged items.
Foreign Exchange
Our foreign operations expose us to fluctuations in foreign exchange rates. These fluctuations may impact the value of our cash receipts and payments in terms of USD, our reporting currency. Refer to the discussion of international operations, included in “Management’s Discussion and Analysis of Financial Condition and Results of Operations” for further detail.
Our foreign exchange risk management strategy is achieved by establishing local operations in the markets that we serve, invoicing customers in the same currency that costs are incurred and the use of derivative financial instruments such as foreign currency forwards. Translating expenses incurred in foreign currencies into USD offsets the impact of translating revenue earned in foreign currencies into USD. We enter into forward foreign currency exchange contracts to manage currency risks associated with intercompany transactions and cash management. See
Note 8: Derivative Financial Instruments and Hedging Activities
of the Notes to audited Consolidated Financial Statements for additional information about foreign currency risks managed through derivative activities and notional amounts of underlying hedged items.
53
Item 8. Financial Statements and Supplementary Data
INDEX TO CONSOLIDATED FINANCIAL STATEMENTS
|
Page
|
||
|
Report of Independent Registered Public Accounting Firm
|
||
|
Consolidated Balance Sheets as of December 31, 2018 and 2017
|
||
|
Consolidated Statements of Operations for the years ended December 31, 2018, 2017, and 2016
|
||
|
Consolidated Statements of Comprehensive Loss for the years ended December 31, 2018, 2017, and 2016
|
||
|
Consolidated Statements of Equity for the years ended December 31, 2018, 2017, and 2016
|
||
|
Consolidated Statements of Cash Flows for the years ended December 31, 2018, 2017, and 2016
|
||
|
Notes to the Consolidated Financial Statements
|
||
|
Quarterly Results of Operations (Unaudited)
|
||
|
FINANCIAL STATEMENT SCHEDULES:
|
||
|
Schedule II - Valuation and Qualifying Accounts
|
||
54
Report of Independent Registered Public Accounting Firm
To the Stockholders and Board of Directors
Cushman & Wakefield plc:
Opinion on the Consolidated Financial Statements
We have audited the accompanying consolidated balance sheets of Cushman & Wakefield plc and subsidiaries (the Company) as of December 31, 2018 and 2017, the related consolidated statements of operations, comprehensive loss, changes in equity, and cash flows for each of the years in the three-year period ended December 31, 2018, and the related notes and financial statement schedule II (collectively, the consolidated financial statements). In our opinion, the consolidated financial statements present fairly, in all material respects, the financial position of the Company as of December 31, 2018 and 2017, and the results of its operations and its cash flows for each of the years in the three-year period ended December 31, 2018, in conformity with U.S. generally accepted accounting principles.
Change in Accounting Principle
As discussed in Note 2 to the consolidated financial statements, the Company has changed its method of accounting for revenue recognition in 2018 due to the adoption of FASB ASC Topic 606
Revenue from
Contracts with Customers.
As discussed in Note 2 to the consolidated financial statements, the Company has elected to change its method of accounting for recognizing stock-based compensation expense for awards with service conditions only from the graded attribution method to the straight-line attribution method for each of the years in the three-year period ended December 31, 2018.
Basis for Opinion
These consolidated financial statements are the responsibility of the Company’s management. Our responsibility is to express an opinion on these consolidated financial statements based on our audits. We are a public accounting firm registered with the Public Company Accounting Oversight Board (United States) (PCAOB) and are required to be independent with respect to the Company in accordance with the U.S. federal securities laws and the applicable rules and regulations of the Securities and Exchange Commission and the PCAOB.
We conducted our audits in accordance with the standards of the PCAOB. Those standards require that we plan and perform the audit to obtain reasonable assurance about whether the consolidated financial statements are free of material misstatement, whether due to error or fraud. Our audits included performing procedures to assess the risks of material misstatement of the consolidated financial statements, whether due to error or fraud, and performing procedures that respond to those risks. Such procedures included examining, on a test basis, evidence regarding the amounts and disclosures in the consolidated financial statements. Our audits also included evaluating the accounting principles used and significant estimates made by management, as well as evaluating the overall presentation of the consolidated financial statements. We believe that our audits provide a reasonable basis for our opinion.
/s/ KPMG LLP
We have served as the Company’s auditor since 2015.
Chicago, Illinois
February 28, 2019
55
Cushman & Wakefield plc
Consolidated Balance Sheets
|
As of
|
||||||
|
(in millions, except per share data)
|
December 31, 2018
|
December 31, 2017
|
||||
|
Assets
|
||||||
|
Current assets:
|
||||||
|
Cash and cash equivalents
|
$
|
895.3
|
|
$
|
405.6
|
|
|
Trade and other receivables, net of allowance balance of $49.5 million and $35.3 million,
as of December 31, 2018 and 2017, respectively
|
1,463.5
|
|
1,314.0
|
|
||
|
Income tax receivable
|
41.1
|
|
14.6
|
|
||
|
Prepaid expenses and other current assets
|
343.4
|
|
176.3
|
|
||
|
Total current assets
|
2,743.3
|
|
1,910.5
|
|
||
|
Property and equipment, net
|
313.8
|
|
304.3
|
|
||
|
Goodwill
|
1,778.5
|
|
1,765.3
|
|
||
|
Intangible assets, net
|
1,128.2
|
|
1,306.0
|
|
||
|
Equity method investments
|
8.7
|
|
7.9
|
|
||
|
Deferred tax assets
|
84.0
|
|
66.6
|
|
||
|
Other non-current assets
|
489.5
|
|
432.8
|
|
||
|
Total assets
|
$
|
6,546.0
|
|
$
|
5,793.4
|
|
|
Liabilities and Shareholders' Equity
|
||||||
|
Current liabilities:
|
||||||
|
Short-term borrowings and current portion of long-term debt
|
$
|
39.9
|
|
$
|
59.5
|
|
|
Accounts payable and accrued expenses
|
1,047.7
|
|
771.2
|
|
||
|
Accrued compensation
|
817.9
|
|
864.8
|
|
||
|
Income tax payable
|
43.2
|
|
35.7
|
|
||
|
Other current liabilities
|
90.0
|
|
234.4
|
|
||
|
Total current liabilities
|
2,038.7
|
|
1,965.6
|
|
||
|
Long-term debt
|
2,644.2
|
|
2,784.0
|
|
||
|
Deferred tax liabilities
|
136.4
|
|
157.5
|
|
||
|
Other non-current liabilities
|
366.6
|
|
386.9
|
|
||
|
Total liabilities
|
5,185.9
|
|
5,294.0
|
|
||
|
Commitments and contingencies (See Note 14)
|
|
|
||||
|
Shareholders' Equity:
|
||||||
|
Ordinary shares, nominal value $0.10 per share, 216.6 shares issued and outstanding at December 31, 2018 and ordinary shares nominal value $10.00 per share, 145.1 shares issued and outstanding at December 31, 2017
|
21.7
|
|
1,451.3
|
|
||
|
Additional paid-in capital
|
2,791.2
|
|
283.8
|
|
||
|
Accumulated deficit
|
(1,298.4
|
)
|
(1,148.5
|
)
|
||
|
Accumulated other comprehensive loss
|
(154.4
|
)
|
(87.2
|
)
|
||
|
Total equity
|
1,360.1
|
|
499.4
|
|
||
|
Total liabilities and shareholders' equity
|
$
|
6,546.0
|
|
$
|
5,793.4
|
|
The accompanying notes form an integral part of these Consolidated Financial Statements.
56
Cushman & Wakefield plc
Consolidated Statements of Operations
|
Year Ended
|
|||||||||
|
(in millions, except per share data)
|
December 31, 2018
|
December 31, 2017
|
December 31, 2016
|
||||||
|
Revenue
|
$
|
8,219.9
|
|
$
|
6,923.9
|
|
$
|
6,215.7
|
|
|
Costs and expenses:
|
|||||||||
|
Cost of services (exclusive of depreciation and amortization)
|
6,642.4
|
|
5,639.8
|
|
5,067.8
|
|
|||
|
Operating, administrative and other
|
1,271.1
|
|
1,156.1
|
|
1,150.6
|
|
|||
|
Depreciation and amortization
|
290.0
|
|
270.6
|
|
260.6
|
|
|||
|
Restructuring, impairment and related charges
|
3.8
|
|
28.5
|
|
32.1
|
|
|||
|
Total costs and expenses
|
8,207.3
|
|
7,095.0
|
|
6,511.1
|
|
|||
|
Operating income (loss)
|
12.6
|
|
(171.1
|
)
|
(295.4
|
)
|
|||
|
Interest expense, net of interest income
|
(228.8
|
)
|
(183.1
|
)
|
(171.8
|
)
|
|||
|
Earnings from equity method investments
|
1.9
|
|
1.4
|
|
5.9
|
|
|||
|
Other income, net
|
3.5
|
|
11.0
|
|
2.4
|
|
|||
|
Loss before income taxes
|
(210.8
|
)
|
(341.8
|
)
|
(458.9
|
)
|
|||
|
Benefit from income taxes
|
(25.0
|
)
|
(120.5
|
)
|
(24.3
|
)
|
|||
|
Net loss
|
$
|
(185.8
|
)
|
$
|
(221.3
|
)
|
$
|
(434.6
|
)
|
|
Less: Net loss attributable to non-controlling interests
|
—
|
|
—
|
|
(0.4
|
)
|
|||
|
Net loss attributable to the Company
|
$
|
(185.8
|
)
|
$
|
(221.3
|
)
|
$
|
(434.2
|
)
|
|
Basic and diluted loss per share:
|
|||||||||
|
Loss per share attributable to common shareholders
|
$
|
(1.09
|
)
|
$
|
(1.54
|
)
|
$
|
(3.07
|
)
|
|
Weighted average shares outstanding for basic and diluted loss per share
|
171.2
|
|
143.9
|
|
141.4
|
|
|||
The accompanying notes form an integral part of these Consolidated Financial Statements.
57
Cushman & Wakefield plc
Consolidated Statements of Comprehensive Loss
|
Year Ended
|
|||||||||
|
(in millions)
|
December 31, 2018
|
December 31, 2017
|
December 31, 2016
|
||||||
|
Net loss
|
$
|
(185.8
|
)
|
$
|
(221.3
|
)
|
$
|
(434.6
|
)
|
|
Other comprehensive (loss) income, net of tax:
|
|||||||||
|
Designated hedge (losses) gains
|
(5.7
|
)
|
2.2
|
|
19.9
|
|
|||
|
Defined benefit plan actuarial gains (losses)
|
0.8
|
|
4.7
|
|
(10.9
|
)
|
|||
|
Foreign currency translation
|
(62.3
|
)
|
54.4
|
|
(85.3
|
)
|
|||
|
Total other comprehensive (loss) income
|
(67.2
|
)
|
61.3
|
|
(76.3
|
)
|
|||
|
Total comprehensive loss
|
$
|
(253.0
|
)
|
$
|
(160.0
|
)
|
$
|
(510.9
|
)
|
|
Less: Comprehensive (loss) income attributable to non-controlling interests
|
—
|
|
—
|
|
(0.7
|
)
|
|||
|
Comprehensive loss attributable to the Company
|
$
|
(253.0
|
)
|
$
|
(160.0
|
)
|
$
|
(510.2
|
)
|
The accompanying notes form an integral part of these Consolidated Financial Statements.
58
Cushman & Wakefield plc
Consolidated Statement of Changes in Equity
|
Accumulated Other Comprehensive Income (Loss)
|
||||||||||||||||||||||||||||||||
|
(in millions)
|
Ordinary Shares
|
Ordinary Shares ($)
|
Additional Paid-in Capital
|
Accumulated Deficit
|
Unrealized Hedging (Losses) Gains
|
Foreign Currency Translation
|
Defined Benefit Plans
|
Total Accumulated Other Comprehensive Loss, net of tax
|
Total Equity
|
Non- Controlling Interests
|
Total Equity
|
|||||||||||||||||||||
|
Balance as of December 31, 2015
|
139.5
|
|
$
|
1,394.9
|
|
$
|
187.2
|
|
$
|
(493.0
|
)
|
$
|
(2.5
|
)
|
$
|
(70.5
|
)
|
$
|
0.5
|
|
$
|
(72.5
|
)
|
$
|
1,016.6
|
|
$
|
9.0
|
|
$
|
1,025.6
|
|
|
Acquisition and disposal of non-controlling interest
|
—
|
|
—
|
|
(11.4
|
)
|
—
|
|
—
|
|
(2.4
|
)
|
—
|
|
(2.4
|
)
|
(13.8
|
)
|
(8.3
|
)
|
(22.1
|
)
|
||||||||||
|
Share issuances
|
3.1
|
|
31.1
|
|
8.6
|
|
—
|
|
—
|
|
—
|
|
—
|
|
—
|
|
39.7
|
|
—
|
|
39.7
|
|
||||||||||
|
Net loss
|
—
|
|
—
|
|
—
|
|
(434.2
|
)
|
—
|
|
—
|
|
—
|
|
—
|
|
(434.2
|
)
|
(0.4
|
)
|
(434.6
|
)
|
||||||||||
|
Stock-based compensation
|
0.5
|
|
4.8
|
|
46.0
|
|
—
|
|
—
|
|
—
|
|
—
|
|
—
|
|
50.8
|
|
—
|
|
50.8
|
|
||||||||||
|
Foreign currency translation
|
—
|
|
—
|
|
—
|
|
—
|
|
—
|
|
(82.6
|
)
|
—
|
|
(82.6
|
)
|
(82.6
|
)
|
(0.3
|
)
|
(82.9
|
)
|
||||||||||
|
Defined benefit plans actuarial gain
|
—
|
|
—
|
|
—
|
|
—
|
|
—
|
|
—
|
|
(11.0
|
)
|
(11.0
|
)
|
(11.0
|
)
|
—
|
|
(11.0
|
)
|
||||||||||
|
Unrealized gain on hedging instruments
|
—
|
|
—
|
|
—
|
|
—
|
|
31.0
|
|
—
|
|
—
|
|
31.0
|
|
31.0
|
|
—
|
|
31.0
|
|
||||||||||
|
Amounts reclassified from AOCI to the statement of operations
|
—
|
|
—
|
|
—
|
|
—
|
|
(11.1
|
)
|
—
|
|
0.1
|
|
(11.0
|
)
|
(11.0
|
)
|
—
|
|
(11.0
|
)
|
||||||||||
|
Balance as of December 31, 2016
|
143.1
|
|
$
|
1,430.8
|
|
$
|
230.4
|
|
$
|
(927.2
|
)
|
$
|
17.4
|
|
$
|
(155.5
|
)
|
$
|
(10.4
|
)
|
$
|
(148.5
|
)
|
$
|
585.5
|
|
$
|
—
|
|
$
|
585.5
|
|
|
Share issuances
|
1.3
|
|
13.9
|
|
3.7
|
|
—
|
|
—
|
|
—
|
|
—
|
|
—
|
|
17.6
|
|
—
|
|
17.6
|
|
||||||||||
|
Net loss
|
—
|
|
—
|
|
—
|
|
(221.3
|
)
|
—
|
|
—
|
|
—
|
|
—
|
|
(221.3
|
)
|
—
|
|
(221.3
|
)
|
||||||||||
|
Stock-based compensation
|
0.7
|
|
6.6
|
|
47.7
|
|
—
|
|
—
|
|
—
|
|
—
|
|
—
|
|
54.3
|
|
—
|
|
54.3
|
|
||||||||||
|
Foreign currency translation
|
—
|
|
—
|
|
—
|
|
—
|
|
—
|
|
54.4
|
|
—
|
|
54.4
|
|
54.4
|
|
—
|
|
54.4
|
|
||||||||||
|
Defined benefit plans actuarial gain
|
—
|
|
—
|
|
—
|
|
—
|
|
—
|
|
—
|
|
2.3
|
|
2.3
|
|
2.3
|
|
—
|
|
2.3
|
|
||||||||||
|
Unrealized loss on hedging instruments
|
—
|
|
—
|
|
—
|
|
—
|
|
(14.6
|
)
|
—
|
|
—
|
|
(14.6
|
)
|
(14.6
|
)
|
—
|
|
(14.6
|
)
|
||||||||||
|
Amounts reclassified from AOCI to the statement of operations
|
—
|
|
—
|
|
—
|
|
—
|
|
16.8
|
|
—
|
|
2.4
|
|
19.2
|
|
19.2
|
|
—
|
|
19.2
|
|
||||||||||
|
Other activity
|
—
|
|
—
|
|
2.0
|
|
—
|
|
—
|
|
—
|
|
—
|
|
—
|
|
2.0
|
|
—
|
|
2.0
|
|
||||||||||
|
Balance as of December 31, 2017
|
145.1
|
|
$
|
1,451.3
|
|
$
|
283.8
|
|
$
|
(1,148.5
|
)
|
$
|
19.6
|
|
$
|
(101.1
|
)
|
$
|
(5.7
|
)
|
$
|
(87.2
|
)
|
$
|
499.4
|
|
$
|
—
|
|
$
|
499.4
|
|
|
Capital reduction (see Note 1)
|
—
|
|
(1,436.7
|
)
|
1,436.7
|
|
—
|
|
—
|
|
—
|
|
—
|
|
—
|
|
—
|
|
—
|
|
—
|
|
||||||||||
|
Adoption of new revenue accounting standard (see Note 5)
|
—
|
|
—
|
|
—
|
|
35.9
|
|
—
|
|
—
|
|
—
|
|
—
|
|
35.9
|
|
—
|
|
35.9
|
|
||||||||||
|
Share issuances
|
8.0
|
|
0.8
|
|
8.8
|
|
—
|
|
—
|
|
—
|
|
—
|
|
—
|
|
9.6
|
|
—
|
|
9.6
|
|
||||||||||
|
Net loss
|
—
|
|
—
|
|
—
|
|
(185.8
|
)
|
—
|
|
—
|
|
—
|
|
—
|
|
(185.8
|
)
|
—
|
|
(185.8
|
)
|
||||||||||
|
Stock-based compensation
|
1.2
|
|
0.1
|
|
77.9
|
|
—
|
|
—
|
|
—
|
|
—
|
|
—
|
|
78.0
|
|
—
|
|
78.0
|
|
||||||||||
|
Foreign currency translation
|
—
|
|
—
|
|
|
|
—
|
|
—
|
|
(62.3
|
)
|
—
|
|
(62.3
|
)
|
(62.3
|
)
|
—
|
|
(62.3
|
)
|
||||||||||
|
Defined benefit plans actuarial gain
|
—
|
|
—
|
|
—
|
|
—
|
|
—
|
|
—
|
|
0.8
|
|
0.8
|
|
0.8
|
|
—
|
|
0.8
|
|
||||||||||
|
Unrealized gain on hedging instruments
|
—
|
|
—
|
|
—
|
|
—
|
|
7.5
|
|
—
|
|
—
|
|
7.5
|
|
7.5
|
|
—
|
|
7.5
|
|
||||||||||
|
Amounts reclassified from AOCI to the statement of operations
|
—
|
|
—
|
|
—
|
|
—
|
|
(13.2
|
)
|
—
|
|
—
|
|
(13.2
|
)
|
(13.2
|
)
|
—
|
|
(13.2
|
)
|
||||||||||
|
Proceeds from IPO and Concurrent Private Placement, net of underwriting and other expenses
|
62.3
|
|
6.2
|
|
987.4
|
|
—
|
|
—
|
|
—
|
|
—
|
|
—
|
|
993.6
|
|
—
|
|
993.6
|
|
||||||||||
|
Other activity
|
—
|
|
—
|
|
(3.4
|
)
|
—
|
|
—
|
|
—
|
|
—
|
|
—
|
|
(3.4
|
)
|
—
|
|
(3.4
|
)
|
||||||||||
|
Balance as of December 31, 2018
|
216.6
|
|
$
|
21.7
|
|
$
|
2,791.2
|
|
$
|
(1,298.4
|
)
|
$
|
13.9
|
|
$
|
(163.4
|
)
|
$
|
(4.9
|
)
|
$
|
(154.4
|
)
|
$
|
1,360.1
|
|
$
|
—
|
|
$
|
1,360.1
|
|
The accompanying notes form an integral part of these Consolidated Financial Statements.
59
Cushman & Wakefield plc
Consolidated Statements of Cash Flows
|
Year Ended
|
|||||||||
|
(in millions)
|
December 31, 2018
|
December 31, 2017
|
December 31, 2016
|
||||||
|
Cash flows from operating activities
|
|||||||||
|
Net loss
|
$
|
(185.8
|
)
|
$
|
(221.3
|
)
|
$
|
(434.6
|
)
|
|
Reconciliation of net loss to net cash used in operating activities:
|
|
||||||||
|
Depreciation and amortization
|
290.0
|
|
270.6
|
|
260.6
|
|
|||
|
Impairment charges
|
2.7
|
|
—
|
|
2.6
|
|
|||
|
Unrealized foreign exchange loss (gain)
|
8.4
|
|
(7.3
|
)
|
(10.7
|
)
|
|||
|
Stock-based compensation
|
81.9
|
|
52.4
|
|
49.0
|
|
|||
|
Loss on debt extinguishment
|
50.4
|
|
—
|
|
—
|
|
|||
|
Amortization of debt issuance costs
|
12.5
|
|
16.5
|
|
12.6
|
|
|||
|
Gain on pension curtailment
|
—
|
|
(10.0
|
)
|
—
|
|
|||
|
Fees incurred in conjunction with debt modification
|
—
|
|
—
|
|
(3.7
|
)
|
|||
|
Change in deferred taxes
|
(58.9
|
)
|
(170.3
|
)
|
(60.1
|
)
|
|||
|
Bad debt expense
|
21.7
|
|
3.9
|
|
11.9
|
|
|||
|
Other non-cash operating activities
|
(3.6
|
)
|
7.0
|
|
1.2
|
|
|||
|
Changes in assets and liabilities:
|
|
|
|
|
|
|
|||
|
Trade and other receivables
|
(235.5
|
)
|
(173.4
|
)
|
(146.9
|
)
|
|||
|
Income taxes payable
|
(19.6
|
)
|
10.1
|
|
2.7
|
|
|||
|
Prepaid expenses and other current assets
|
(26.9
|
)
|
(17.6
|
)
|
18.4
|
|
|||
|
Other non-current assets
|
84.6
|
|
44.0
|
|
(137.6
|
)
|
|||
|
Accounts payable and accrued expenses
|
74.9
|
|
42.6
|
|
118.3
|
|
|||
|
Accrued compensation
|
117.8
|
|
98.4
|
|
11.0
|
|
|||
|
Other current and non-current liabilities
|
(216.8
|
)
|
58.8
|
|
(29.8
|
)
|
|||
|
Net cash (used in) provided by operating activities
|
(2.2
|
)
|
4.4
|
|
(335.1
|
)
|
|||
|
Cash flows from investing activities
|
|
||||||||
|
Payment for property and equipment
|
(84.2
|
)
|
(129.1
|
)
|
(77.3
|
)
|
|||
|
Acquisitions of businesses, net of cash acquired
|
(35.5
|
)
|
(99.9
|
)
|
(57.1
|
)
|
|||
|
Sale of business, net of cash acquired
|
—
|
|
—
|
|
10.2
|
|
|||
|
Acquisition of non-controlling interests
|
—
|
|
—
|
|
(17.3
|
)
|
|||
|
Investments in equity securities
|
(8.7
|
)
|
—
|
|
—
|
|
|||
|
Return of beneficial interest in a securitization
|
(85.0
|
)
|
—
|
|
—
|
|
|||
|
Collection on beneficial interest in a securitization
|
—
|
|
84.8
|
|
—
|
|
|||
|
Other investing activities, net
|
(4.6
|
)
|
1.0
|
|
3.8
|
|
|||
|
Net cash used in investing activities
|
(218.0
|
)
|
(143.2
|
)
|
(137.7
|
)
|
|||
|
Cash flows from financing activities
|
|
||||||||
|
Net proceeds from issuance of shares
|
9.0
|
|
23.4
|
|
39.8
|
|
|||
|
Shares repurchased for payment of employee taxes on stock awards
|
(15.2
|
)
|
(4.5
|
)
|
(2.9
|
)
|
|||
|
Payment of contingent consideration
|
(22.3
|
)
|
(8.4
|
)
|
—
|
|
|||
|
Proceeds from long-term borrowings
|
2,936.5
|
|
318.7
|
|
639.8
|
|
|||
|
Repayment of borrowings
|
(3,133.2
|
)
|
(150.3
|
)
|
(313.5
|
)
|
|||
|
Debt issuance costs
|
(24.4
|
)
|
(4.4
|
)
|
—
|
|
|||
|
Proceeds from initial public offering, net of underwriting
|
831.4
|
|
—
|
|
—
|
|
|||
|
Proceeds from private placement
|
179.5
|
|
—
|
|
—
|
|
|||
|
Payments of initial offering and private placement costs
|
(17.3
|
)
|
—
|
|
—
|
|
|||
|
Payment of finance lease liabilities
|
(10.8
|
)
|
(9.1
|
)
|
(6.7
|
)
|
|||
|
Other financing activities, net
|
(7.3
|
)
|
2.3
|
|
—
|
|
|||
|
Net cash provided by financing activities
|
725.9
|
|
167.7
|
|
356.5
|
|
|||
|
Change in cash, cash equivalents and restricted cash
|
505.7
|
|
28.9
|
|
(116.3
|
)
|
|||
|
Cash, cash equivalents and restricted cash, beginning of the year
|
467.9
|
|
424.8
|
|
547.9
|
|
|||
|
Effects of exchange rate fluctuations on cash, cash equivalents and restricted cash
|
(8.2
|
)
|
14.2
|
|
(6.8
|
)
|
|||
|
Cash, cash equivalents and restricted cash, end of the year
|
$
|
965.4
|
|
$
|
467.9
|
|
$
|
424.8
|
|
The accompanying notes form an integral part of these Consolidated Financial Statements.
60
Cushman & Wakefield plc
Notes to Consolidated Financial Statements
Note 1: Organization and Business Overview
DTZ Jersey Holdings Limited, together with its subsidiaries, was formed on August 21, 2014, by investment funds affiliated with TPG Capital, L.P. (“TPG”), PAG Asia Capital Limited (“PAG”) and Ontario Teachers’ Pension Plan (“OTPP”) (collectively, the “Sponsors”). On November 5, 2014, DTZ Jersey Holdings Limited acquired
100%
of the combined DTZ group for
$1.1 billion
from UGL Limited (the “DTZ Acquisition”). On September 1, 2015, DTZ Jersey Holdings Limited acquired
100%
of C&W Group, Inc. (“Cushman & Wakefield” or “C&W” and also defined as the “C&W Group merger”) for
$1.9 billion
.
On July 6, 2018, the shareholders of DTZ Jersey Holdings Limited exchanged their shares in DTZ Jersey Holdings Limited for interests in newly issued shares of Cushman & Wakefield Limited, a private limited company incorporated in England and Wales (the “Share Exchange”). On July 12, 2018, Cushman & Wakefield Limited reduced the nominal value of each ordinary share issued to
$0.01
(“Capital Reduction”). On July 19, 2018, Cushman & Wakefield Limited re-registered as a public limited company organized under the laws of England and Wales (the “Re-registration”) named Cushman & Wakefield plc (together with its subsidiaries, “
the Company,
”
“we,” “ours” and “us”
). Following the Re-registration, the Company undertook a share consolidation of its outstanding ordinary shares (the “Share Consolidation”), which resulted in a proportional decrease in the number of ordinary shares outstanding as well as corresponding adjustments to outstanding options and restricted share units on a 10 for 1 basis. These financial statements have been retroactively adjusted to give effect to the Share Consolidation as it relates to all issued and outstanding ordinary shares and related per share amounts contained herein. The transactions described above are collectively referred to herein as the “Corporate Reorganization”.
On August 6, 2018, the Company completed an IPO of its ordinary shares in which it issued and sold
51.8 million
ordinary shares at a price of
$17.00
per share. On August 6 and 7, 2018, the Company completed a concurrent private placement (the "Concurrent Private Placement") of its ordinary shares in which it sold
10.6 million
shares to Vanke Service (Hong Kong) Co., Limited ("Vanke Service") at a price of
$17.00
per share. The IPO and Concurrent Private Placement resulted in net proceeds of approximately
$1.0 billion
after deducting offering fees and other direct incremental costs. Public trading in the Company's ordinary shares began on August 2, 2018.
As of
December 31, 2018
, the Company operated from
approximately
400
offices in
70
countries with approximately
51,000
employees. The Company’s business is focused on meeting the increasing demands of our clients across multiple service lines including Property, facilities and project management, Leasing, Capital markets and Valuation and other services. The Company primarily does business under the Cushman & Wakefield tradename.
Note 2: Summary of Significant Accounting Policies
a) Basis of Presentation
The Company maintains its accounting records on the accrual basis of accounting and its Consolidated Financial Statements have been prepared in accordance with accounting principles generally accepted in the United States of America (“U.S. GAAP”). The Consolidated Financial Statements are presented in U.S. dollars.
b) Principles of Consolidation
The accompanying Consolidated Financial Statements include the accounts of the Company and its consolidated subsidiaries, which include voting interest entities (“VOEs”) in which the Company has determined it has a controlling financial interest in accordance with the provisions of Accounting Standards Codification ("ASC") 810,
Consolidations
. The equity attributable to the non-controlling interests is shown separately in the accompanying consolidated balance sheets. All significant intercompany accounts and transactions have been eliminated in consolidation. When applying principles of consolidation, management will identify whether an investee entity is a variable interest entity (“VIE”) or a VOE. For VOEs, the interest holder with control through majority ownership and majority voting rights consolidates the entity. The Company has determined that it does not have any material interests in VIEs.
Entities in which the Company has significant influence over the entity’s financial and operating policies, but does not control, are accounted for using the equity method. The Consolidated Financial Statements include the Company’s share of the income and expenses and equity movements of investees accounted for under the equity method, after adjustments to align the accounting policies with those of the Company, from the date that significant
61
influence or joint control commences until the date that significant influence ceases. When the Company’s share of losses exceeds its interest in an investee accounted for under the equity method, the carrying amount of that interest (including any long-term loans) is reduced to zero and the recognition of further losses is discontinued, except to the extent that the Company has an obligation to make or has made payments on behalf of the investee.
Investments in which the Company does not exert significant influence are accounted for at cost less any impairment in value. As of
December 31, 2018
and
2017
, the Company had investments classified under the equity method of accounting of
$8.7 million
and
$7.9 million
, respectively.
The Company also holds investments in privately-held companies that are classified as equity securities which are not required to be consolidated. As of
December 31, 2018
and
2017
, investments in equity securities without readily determinable fair values had a carrying value of approximately
$14.6 million
and
$5.3 million
, respectively, in Other non-current assets on the consolidated balance sheets. The Company did not recognize any investment related impairment losses during the
years ended
December 31, 2018
and
2017
, respectively.
c) Use of Estimates
The preparation of financial statements in conformity with U.S. GAAP requires management to make estimates and assumptions about future events that affect the reported amounts of assets and liabilities, the disclosure of contingent assets and liabilities at the dates of the financial statements and the reported amounts of revenue and expenses during the reporting periods. Significant items subject to estimates and assumptions include, but are not limited to, the valuation of assets acquired and liabilities assumed in business combinations, including contingent consideration; the fair value of derivative instruments; the fair value of the Company’s defined benefit plan assets and obligations; the fair value of awards granted under stock-based compensation plans; valuation allowances for income taxes; self-insurance program liabilities; uncertain tax positions; probability of meeting performance conditions in share-based awards; impairment assessments related to goodwill, intangible assets and other long-lived assets and variable consideration subject to accelerated revenue recognition.
Although these estimates and assumptions are based on management’s judgment and best knowledge of current events and actions that the Company may undertake in the future, actual results may differ from those estimates. Estimates and underlying assumptions are evaluated on an ongoing basis and adjusted, as needed, using historical experience and other factors, including the current economic environment. Market factors, such as illiquid credit markets, volatile equity markets and foreign currency fluctuations can increase the uncertainty in such estimates and assumptions. The effects of such adjustments are reflected in the Consolidated Financial Statements in the periods in which they are determined.
d) Revenue Recognition
Under current revenue recognition, revenue is recognized upon transfer of control of promised services to clients in an amount that reflects the consideration the Company expects to receive in exchange for those services.
Under legacy revenue recognition, revenue is recognized when all of the following criteria is met: (1) persuasive evidence of an arrangement exists; (2) services have been rendered; (3) the amount is fixed or determinable; and (4) collectability is reasonably assured.
The Company enters into contracts and earns revenue from its Property, facilities and project management, Leasing, Capital markets and Valuation and other service lines. Revenue is recognized net of any taxes collected from customers.
A performance obligation is a promise in a contract to transfer a distinct service or a series of distinct services to the client and is the unit of account in Topic 606. A contract’s transaction price is allocated to each performance obligation and recognized as revenue when, or as, the performance obligation is satisfied. The Company allocates the contract’s transaction price to each performance obligation using the best estimate of the standalone selling price of each distinct service in the contract.
Nature of Services
Property, facilities and project management
Fees earned from the delivery of the Company’s Property, facilities and project management services are recognized over time when earned under the provisions of the related agreements and are generally based on a fixed recurring fee or a variable fee, which may be based on hours incurred, a percentage mark-up on actual costs incurred or a percentage of monthly gross receipts. The Company may also earn additional revenue based on
62
certain qualitative and quantitative performance measures, which can be based on certain key performance indicators. This additional revenue is recognized over time when earned as the performance obligation is satisfied and the fees are not deemed probable of significant reversal in future periods. Under legacy revenue recognition, revenue is recognized when the obligation is completed, the fees are fixed and determinable and fees are deemed collectible.
When accounting for reimbursements of third-party expenses incurred on a client’s behalf, the Company determines whether it is acting as a principal or an agent in the arrangement. When the Company is acting as a principal, the Company’s revenue is reported on a gross basis and comprises the entire amount billed to the client and reported cost of services includes all expenses associated with the client. When the Company is acting as an agent, the Company’s fee is reported on a net basis as revenue for reimbursed amounts is netted against the related expenses. Within Topic 606, control of the service before transfer to the customer is the focal point of the principal versus agent assessments. The Company is a principal if it controls the services before they are transferred to the client. Under legacy revenue recognition, the assessment of being the primary obligor of the service is the focal point of the principal versus agent assessments. The presentation of revenues and expenses pursuant to these arrangements under either a gross or net basis has no impact on Fee revenue, net loss or cash flows.
Leasing and Capital markets
The Company records commission revenue on real estate leases and sales at the point in time when the performance obligation is satisfied, which is generally upon lease execution or transaction closing. Terms and conditions of a commission agreement may include, but are not limited to, execution of a signed lease agreement and future contingencies, including tenant’s occupancy, payment of a deposit or payment of first month’s rent (or a combination thereof). The adoption of Topic 606 resulted in an acceleration of some revenues that are based, in part, on future contingent events. For the revenues related to Leasing services, the Company’s performance obligation will typically be satisfied upon execution of a lease and the portion of the commission that is contingent on a future event will likely be recognized if deemed not subject to significant reversal, based on the Company’s estimates and judgments. The acceleration of the timing of revenue recognition also results in the acceleration of expense relating to the Company’s commission expense. Under legacy revenue recognition, we defer recognition of revenue and commissions contingent on future events until the respective contingencies have been satisfied.
Valuation and other services
Valuation and advisory fees are earned upon completion of the service, which is generally upon delivery of a preliminary or final appraisal report. Consulting fees are recognized when earned under the provisions of the client contracts, which is generally upon completion of services.
If the Company has multiple contracts with the same customer, the Company assesses whether the contracts are linked or are separate arrangements. The Company considers several factors in this assessment, including the timing of negotiation, interdependence with other contracts or elements and pricing and payment terms. The Company and its customers typically view each contract as a separate arrangement, as each service has standalone value, selling prices of the separate services exist and are negotiated independently and performance of the services is distinct.
e) Cost of Services
Cost of services includes commission expenses, employee costs and other third-party transaction-related costs incurred directly in connection with the generation of revenue.
f) Advertising Costs
Advertising costs are expensed as incurred. For the years ended
December 31, 2018
,
2017
and
2016
, advertising costs of
$52.7 million
,
$54.7 million
and
$48.2 million
respectively, were included in Operating, administrative and other expenses in the consolidated statements of operations.
g) Debt Issuance Costs, Premiums and Discounts
Debt issuance costs, premiums and discounts are amortized into Interest expense over the terms of the related loan agreements using the effective interest method. Debt issuance costs, premiums and discounts related to non-revolving debt are presented on the consolidated balance sheets as a direct deduction from the carrying value of the associated debt liability. Debt issuance costs related to revolving credit facilities are presented on the consolidated balance sheets as Other non-current assets.
63
Refer to
Note 9: Long-term Debt and Other Borrowings
for additional information on debt issuance costs.
h) Income Taxes
Income taxes are accounted for under the asset and liability method. Deferred tax assets and liabilities are recognized for the expected future tax consequences attributable to differences between carrying amounts of existing assets and liabilities and their respective tax bases and operating loss and tax credit carryforwards. Deferred tax assets and liabilities are measured using enacted tax rates expected to apply to taxable income in the years in which those temporary differences are expected to be recovered or settled. The effect on deferred tax assets and liabilities of a change in tax rates is recognized in income in the period that the new rate is enacted. A valuation allowance is established against deferred tax assets when it is more likely than not that some portion or all of the deferred tax asset will not be realized in the future.
In determining the amount of current and deferred tax, the Company takes into account the impact of uncertain tax positions and whether additional taxes and interest may be due. New information may become available that causes the Company to change its judgment regarding the adequacy of existing tax liabilities; such changes to tax liabilities will impact tax expense in the period that such a determination is made.
The provision for income taxes comprises current and deferred income tax expense and is recognized in the consolidated statements of operations. To the extent that the income taxes are for items recognized directly in equity, the related income tax effects are recognized in equity.
Refer to
Note 12: Income Taxes
for additional information on income taxes.
i) Cash and Cash Equivalents
Cash and cash equivalents comprise cash balances and highly-liquid investments with original maturities of three months or less. The carrying amount of cash equivalents approximates fair value. Checks issued but not presented to banks may result in book overdraft balances for accounting purposes, which are classified within short-term borrowings and the change as a component of financing cash flows. The Company also manages certain cash and cash equivalents as an agent for its property and facilities management clients. These amounts are not included in the accompanying consolidated balance sheets.
Restricted cash
Included in the accompanying consolidated balance sheets within Prepaid expenses and other current assets is restricted cash of
$70.1 million
and
$62.3 million
as of
December 31, 2018
and
2017
, respectively. These balances primarily consist of legally restricted deposits related to contracts entered into with others, including clients, in the normal course of business.
j) Trade and Other Receivables
Trade and other receivables are presented on the consolidated balance sheets net of estimated uncollectable amounts. On a periodic basis, the Company evaluates its receivables and establishes an allowance for doubtful accounts based on historical experience and other currently available information. The allowance reflects the Company’s best estimate of collectability risks on outstanding receivables.
Accounts Receivable Securitization Program
In March 2017, the Company entered into a revolving trade accounts receivables securitization program, which it has been amended from time to time (“A/R Securitization“). The Company records the transactions as sales of receivables, derecognizes such receivables from its Consolidated Financial Statements and records a receivable for the deferred purchase price of such receivables.
Refer to
Note 16: Fair Value Measurements
and
Note 17: Accounts Receivable Securitization
for additional information about the A/R Securitization.
64
k) Concentration of Credit Risk
Concentrations that potentially subject the Company to credit risk consist principally of trade receivables. Exposure to credit risk is influenced by the individual characteristics of each customer. New customers are analyzed individually for creditworthiness, considering credit ratings where available, financial position, past experience and other factors. The risk associated with this concentration is limited due to ongoing monitoring and the large number and geographic dispersion of customers.
l) Property and Equipment
Property and equipment is stated at cost, net of accumulated depreciation, or in the case of capital leases, at the present value of the future minimum lease payments. Costs include expenditures that are directly attributable to the acquisition of the asset and costs incurred to prepare the asset for its intended use. Direct costs for internally developed software are capitalized during the application development stage. All costs during the preliminary project stage are expensed as incurred. The costs capitalized include consulting, licensing and direct labor costs and are amortized upon implementation of the software in production over the useful life of the software.
Repair and maintenance costs are expensed as incurred.
Depreciation of property and equipment is computed on a straight-line basis over the asset’s estimated useful life. Assets held under capital leases are depreciated over the shorter of the lease term or their useful lives unless it is reasonably certain that the Company will obtain ownership by the end of the lease term. The Company’s estimated useful lives are as follows:
|
Furniture and equipment
|
3 to 20 years
|
|
Leasehold improvements
|
2 to 19 years
|
|
Equipment under capital lease
|
Shorter of lease term or asset useful life
|
|
Software
|
1 to 10 years
|
The Company evaluates the reasonableness of the useful lives of property and equipment at least annually.
In addition, the Company reviews property and equipment for impairment whenever events or changes in circumstances indicate that the carrying amount of an asset may not be recoverable. If this review indicates that such assets are impaired, the impairment is recognized in the period the changes occur and represent the amount by which the carrying value exceeds the fair value.
m) Goodwill and Other Intangible Assets
Acquired identifiable assets, liabilities and any non-controlling interests are recorded at fair value at the date of acquisition. Any excess of the cost of the business combination over the fair value of those assets and liabilities is recognized as goodwill on the consolidated balance sheets.
Goodwill and indefinite-lived intangible assets are not amortized and are stated at cost. Definite-lived intangible assets are stated at cost less accumulated amortization.
Amortization of definite-lived intangible assets is recognized in the consolidated statements of operations on a straight-line basis over the estimated useful lives of intangible assets. The Company evaluates the reasonableness of the useful lives of these intangibles at least annually.
n) Impairment of Long-lived Assets
Goodwill and indefinite-lived intangible assets are tested for impairment annually, or more frequently if events or changes in circumstances indicate that they may be impaired.
On an annual basis, the Company assesses whether the fair value of a reporting unit (“RU”) is less than its carrying amount by performing a qualitative assessment ("step zero") or quantitative assessment. The Company can either elect to perform the step zero assessment first and then proceed with the quantitative impairment test if it is more likely than not that the fair value of the RU is less than its carrying amount, or the Company can perform just the quantitative assessment. If the Company determines the quantitative impairment test is required, the estimated fair value of the RU is compared to its carrying amount, including goodwill. If the estimated fair value of a RU exceeds its carrying value, goodwill is not considered to be impaired. If the carrying amount exceeds the estimated fair value, an impairment loss is recognized equal to that excess. The loss recognized cannot exceed the carrying amount of goodwill.
65
The Company has elected an annual goodwill impairment assessment date of October 1, and for the impairment test performed on October 1, 2018, the Company concluded that there were no indications of impairment.
The Company records an impairment loss for other definite and indefinite-lived intangible assets if the fair value of the asset is less than the asset’s carrying amount. No material impairments of intangible assets were recognized during any of the periods presented. Refer to
Note 6: Goodwill and Other Intangible Assets
for additional information regarding the Company's intangible assets.
o) Accrued Claims and Settlements
The Company is subject to various claims and contingencies related to lawsuits. A liability is recorded for claims and legal costs when risk of loss is probable and estimable.
The Company self-insures for various risks, including workers’ compensation and medical in some states. A liability is recorded for the Company’s obligations for both reported and incurred but not reported ("IBNR") insurance claims through assessments based on prior claims history. In addition, in the U.S. and Canada, the Company is self-insured against errors and omissions (“E&O”) claims through a primary insurance layer provided by its 100%-owned, consolidated, captive insurance subsidiary, Nottingham Indemnity, Inc., and an excess layer provided through a third-party insurance carrier. See
Note 14: Commitments and Contingencies
for additional information.
p) Derivatives and Hedging Activities
From time to time, the Company enters into derivative financial instruments, including foreign exchange forward contracts and interest rate swap or cap agreements, to manage its exposure to foreign exchange rate and interest rate risks. The Company views derivative financial instruments as a risk management tool and, accordingly, does not use derivatives for trading or speculative purposes. Derivatives
are initially recognized at fair value at the date the derivative contracts are executed and are subsequently remeasured to their fair value at the end of each reporting period. The resulting gain or loss is recognized in the consolidated statements of operations immediately unless the derivative is designated and effective as a hedging instrument, in which case hedge accounting is applied. Hedge accounting generally provides for the matching of the timing of gain or loss recognition on the hedging instrument with the recognition of the changes in the fair value of the hedged asset or liability that are attributable to the hedged risk in a fair value hedge or the earnings effect of the hedged forecasted transactions in a cash flow hedge.
Hedge accounting is discontinued when the Company revokes the hedging relationship, when the hedging instrument expires or is sold, terminated or exercised, or when it no longer qualifies for hedge accounting. Any gain or loss recognized in Other comprehensive income/(loss), net of applicable income taxes and accumulated in equity at that time, remains in equity and is recognized when the forecasted transaction is ultimately recognized in earnings. When a forecasted transaction is no longer expected to occur, the gain or loss accumulated in equity is recognized immediately in earnings.
Refer to
Note 8: Derivative Financial Instruments and Hedging Activities
for additional information on derivative instruments.
q) Comprehensive Income (Loss)
Comprehensive income (loss) comprises net income and changes in equity that are excluded from net income, such as foreign currency translation adjustments, unrealized actuarial gains and losses relating to the defined benefit pension plans, and unrealized gains and losses on derivatives designated as cash flow and net investment hedges, included related tax effects.
r) Foreign Currency Transactions
Foreign currency transactions are recorded in the functional currency at the exchange rate at the date of the transaction. Monetary assets and liabilities denominated in foreign currencies at the reporting date are recorded in the functional currency at the foreign exchange rate at that date, which may result in a foreign currency gain or loss.
Foreign currency gains or losses are recognized in the consolidated statements of operations, except for differences arising on the retranslation of a financial liability designated as a hedge of the net investment in a foreign operation, or qualifying cash flow hedges, which are recognized in Other comprehensive income/(loss) and accumulated within equity. For the years ended
December 31, 2018
,
2017
and
2016
, foreign currency transactions resulted in losses of
$5.6 million
and gains of
$2.6 million
and
$6.1 million
, respectively, and were recognized within Cost of services and Operating, administrative, and other expenses in the consolidated statements of operations.
66
Foreign Currency Translation
The assets and liabilities of foreign operations are translated into U.S. dollars at the balance sheet date. Income and expense items are translated at the monthly average rates. Translation adjustments are included in Accumulated other comprehensive income (loss).
s) Leases
The Company enters into various leasing arrangements in which it is the lessee. For operating leases, lease expense is recorded on a straight-line basis over the non-cancellable lease term. Lease incentives received are offset against the total lease expense and recognized over the lease term on a straight-line basis. Deferred lease incentive liabilities were
$7.7 million
and
$6.0 million
included in Other current liabilities and
$44.6 million
and
$49.2 million
included in Other non-current liabilities as of
December 31, 2018
and
2017
, respectively. Capital leases are recorded at the lower of the fair value of the leased asset or the present value of future minimum lease payments. Minimum lease payments are apportioned between the interest charge and reduction of the outstanding liability. Refer to
Note 14: Commitments and Contingencies
for additional information on leases.
t) Share-based Payments
The Company grants stock options and restricted stock awards to employees under both the Management Equity Investment and Incentive Plan ("MEIP"), and the 2018 Omnibus Plans. The grant date fair value of awards granted to employees is recognized as compensation expense using the straight-line vesting method over the vesting period, with a corresponding increase in equity or liabilities, depending on the balance sheet classification. The Company also from time to time, grants such awards to non-employees. Such awards are accordingly marked-to-market at the end of each reporting period
.
Refer to
Note 13: Stock-based Payments
for additional information on the Company’s stock-based compensation plans.
u) Employee Benefits
The Company’s defined benefit pension plans are actuarially evaluated, incorporating various critical assumptions including the discount rate and the expected rate of return on plan assets. Any difference between actual and expected plan experience, including asset return experience, in excess of a 10% corridor is recognized in net periodic pension cost over the expected average employee future service period. Other assumptions involve demographic factors such as retirement age, mortality, attrition and the rate of compensation increases. The Company evaluates these assumptions annually and modifies them as appropriate.
Refer to
Note 10: Employee Benefits
for additional information on actuarial assumptions.
v) Recently Issued Accounting Pronouncements
The Company has adopted the following new accounting standards that have been recently issued:
Revenue Recognition
In May 2014, the Financial Accounting Standards Board ("FASB") and the International Accounting Standards Board issued a converged standard on recognition of revenue from contracts with customers, Accounting Standard Update ("ASU") No. 2014-09,
Revenue from Contracts with Customers
(together with all subsequent amendments,
"Topic 606"
), which replaced most existing revenue recognition guidance under U.S. GAAP. The core principle of Topic 606 requires companies to reevaluate when revenue is recorded on a transaction based upon newly defined criteria, either at a point in time or over time as goods or services are delivered. Topic 606 requires additional disclosures about the nature, amount, timing and uncertainty of revenue and cash flows arising from customer contracts, including significant judgments and estimates, and changes in those estimates.
The Company adopted Topic 606 effective January 1, 2018 using the modified retrospective transition approach. Refer to
Note 5: Revenue
for the impact the adoption of these standards had on the Company's financial statements and related disclosures.
Stock Compensation
In May 2017, the FASB issued ASU No. 2017-09,
Scope of Modification Accounting (Topic 718)
. The ASU amends the scope of modification accounting for stock-based payment awards. Under the new guidance, modification accounting is required only if the fair value, vesting conditions or classification of the award (as equity or liability) changes as a result of the change in terms. The Company adopted this standard effective January 1, 2018 on a prospective basis, with no material impact on its financial statements or related disclosures.
67
Pension Cost
In March 2017, the FASB issued ASU No. 2017-07,
Improving the Presentation of Net Periodic Pension Cost and Net Periodic Postretirement Benefit Cost
. The new guidance is intended to classify costs according to their nature and better align the effect of defined benefit plans on operating income with International Financial Reporting Standards. The ASU also provides additional direction on the components eligible for capitalization. The new guidance is required to be applied retrospectively for the change in income statement presentation, while the change in capitalized benefit cost is to be applied prospectively. The ASU is effective for public companies for fiscal years beginning after December 15, 2017. The Company adopted this standard effective January 1, 2018 on a retrospective basis, reclassifying net periodic pension costs other than service cost to Other income, net. This standard had an immaterial impact on the audited consolidated statements of operations for the years ended December 31, 2018 and 2017.
Business Combinations
In January 2017, the FASB issued ASU No. 2017-01,
Business Combinations: Clarifying the Definition of a Business (Topic 805)
. The new guidance provides that when substantially all the fair value of the assets acquired is concentrated in a single identifiable asset or group of similar identifiable assets, the asset is not a business. The Company adopted this standard effective January 1, 2018 on a prospective basis, with no material impact on the Company's financial statements and related disclosures.
Cash Flows
In August 2016, the FASB issued ASU No. 2016-15,
Statement of Cash Flows (Topic 230): Classification of Certain Cash Receipts and Cash Payments
. The new guidance is intended to reduce the existing diversity in practice in how certain cash receipts and cash payments are presented and classified in the statement of cash flows. The ASU requires the classification of eight specific cash flow issues identified under ASC 230 to be presented as either financing, investing or operating, or some combination thereof, depending upon the nature of the issue. The new guidance is required to be adopted retrospectively for all of the issues identified to each period presented. The ASU is effective for public companies for fiscal years beginning after December 15, 2017. The Company adopted this standard effective January 1, 2018 on a retrospective basis.
As a result of adoption, for the year ended December 31, 2017, the Company classified a cash inflow of
$85.0 million
as investing activities within the audited consolidated statement of cash flows and classified
$41.9 million
as Non-cash investing activities as disclosed in
Note 18: Supplemental Cash Flow Information
related to the Company's Accounts Receivable Securitization program (the "A/R Securitization"). Refer to
Note 17: Accounts Receivable Securitization
for additional information. The other changes required by ASU No. 2016-15 were immaterial to the statement of cash flows.
In November 2016, the FASB issued ASU No. 2016-18,
Statement of Cash Flows (Topic 230): Restricted Cash
. The new guidance requires restricted cash to be presented with cash and cash equivalents in the statement of cash flows. The ASU is required to be adopted retrospectively and is effective for public companies for fiscal years beginning after December 15, 2017. The Company’s restricted cash balances are presented in the consolidated balance sheets within Prepaid expenses and other current assets. Under the new guidance, changes in the Company’s restricted cash will be classified as either operating activities or investing activities in the consolidated statements of cash flows, depending on the nature of the activities that gave rise to the restriction. The Company adopted this standard effective January 1, 2018 using the retrospective transition method.
Intangibles - Internal-Use Software
In August 2018, the FASB issued ASU 2018-15
, Intangibles - Goodwill and Other - Internal-Use Software (Subtopic 350-40)
. The ASU clarifies and aligns the accounting for implementation costs for hosting arrangements with the requirements for capitalizing implementation costs incurred to develop or obtain internal-use software. This ASU is effective for public companies for annual reporting periods and interim periods within those annual periods beginning after December 15, 2019. The Company has early adopted this standard effective July 1, 2018 on a prospective basis, with no material impact on its financial statements and related disclosures.
68
The following recently issued accounting standards are not yet required to be reflected in the Consolidated Financial Statements of the Company:
Leases
In February 2016, the FASB issued ASU No. 2016-02,
Leases (Topic 842)
. The ASU will replace most existing lease guidance under U.S. GAAP when it becomes effective. The new guidance requires a lessee to record a right of use (“ROU”) asset and a corresponding lease liability on the balance sheet for all leases with terms longer than 12 months. Companies will recognize expenses for real estate related leases on the statements of operations in a manner similar to current accounting guidance and, for lessors, the guidance remains substantially similar to current U.S. GAAP.
In July 2018, the FASB issued two additional amendments that affect the guidance issued in ASU 2016-02 as described in the following updates ASU 2018-10,
Codification Improvements to Topic 842, Leases
and ASU 2018-11,
Leases (Topic 842): Targeted Improvements
. The amendments in ASU 2018-10 affect narrow aspects of the guidance issued in ASU 2016-02. The amendments in ASU 2018-11 provide an alternative (and optional) transition method that allows entities to apply the transition provisions in ASU 2016-02 at the adoption date instead of at the earliest comparative period presented in the financial statements. The Company is electing to use the optional transition method. The new guidance is effective for public companies for annual reporting periods and interim periods within those annual periods beginning after December 15, 2018, with early adoption permitted. Upon adoption, the Company will not revise comparative financial statements or disclosures.
The Company has completed the identification of the operating lease portfolio, which is primarily comprised of real estate, motor vehicle and IT equipment leases. Upon adoption, the Company expects to recognize operating lease ROU assets ranging from
$515.0 million
to
$565.0 million
and lease liabilities ranging from
$595.0 million
to
$645.0 million
. In addition, the Company has made accounting policy elections for certain practical expedients offered by the new guidance, such as the practical expedients to not reassess lease classification, lease term or initial direct costs for the existing lease portfolio, as well as to not separate lease and non-lease components and to exclude short-term leases from the ROU assets and lease liabilities. Furthermore, the Company will utilize the portfolio approach in selecting the discount rate used to discount future minimum lease payments for the calculation of the ROU assets and operating lease liabilities for certain equipment leases.
Financial Instruments
In June 2016, the FASB issued ASU No. 2016-13,
Financial Instruments - Credit Losses (Topic 326)
, which replaces the incurred loss impairment methodology in current U.S. GAAP with a methodology that reflects expected credit losses. The new guidance is intended to improve information about the expected credit losses on financial instruments. The ASU is required to be applied through a modified-retrospective approach through a cumulative-effect adjustment to Retained earnings as of the beginning of the first reporting period in which the guidance is effective. The new guidance is effective for public companies for the fiscal years beginning after December 15, 2019. Early adoption is permitted as of the fiscal year beginning after December 31, 2018. The Company is currently evaluating the effect the guidance will have on its Consolidated Financial Statements.
Derivatives and Hedging
In August 2017, the FASB issued ASU No. 2017-12,
Targeted Improvements to Accounting for Hedging Activities (Topic 815)
. The new guidance eliminates the requirement to separately measure and report hedge ineffectiveness and is intended to reduce the complexity of applying hedge accounting by simplifying the designation and measurement of hedging instruments. The ASU is required to be applied retrospectively to eliminate the separate measurement of ineffectiveness through a cumulative-effect adjustment to Accumulated other comprehensive income with a corresponding adjustment to the opening balance of retained earnings. The ASU is effective for public companies for fiscal years beginning after December 15, 2018. Early adoption is permitted. The Company is currently evaluating the effect, if any, that the ASU will have on its Consolidated Financial Statements.
Income Taxes
In February 2018, the FASB issued ASU No. 2018-02,
Income Statement - Reporting Comprehensive Income (Topic 220): Reclassification of Certain Tax Effects from Accumulated Other Comprehensive Income
. The new guidance allows a reclassification from accumulated other comprehensive income to retained earnings for any stranded tax effects resulting from the H.R. 1, Tax Cuts and Jobs Act ("the Tax Act") that was enacted on December 22, 2017. The new guidance is effective for public companies for annual reporting periods and interim periods within those annual periods beginning after December 15, 2018. The ASU will not have a material impact on the Company's financial statements and related disclosures.
69
Stock Compensation
In June 2018, the FASB issued ASU No. 2018-07,
Compensation - Stock Compensation: Improvements to Nonemployee Share-Based Payment Accounting (Topic 718)
. The ASU supersedes ASC 505-50,
Equity-Based Payments to Non-Employees
and expands the scope of Topic 718 to include stock-based payments granted to non-employees. Under the new guidance, the measurement date and performance and vesting conditions for stock-based payments to non-employees are aligned with those of employees, most notably aligning the award measurement date with the grant date of an award. The new guidance is required to be adopted using the modified retrospective transition approach and is effective for public companies for annual reporting periods and interim periods within those annual periods beginning after December 15, 2018, with early adoption permitted. The Company is currently evaluating the effect, if any, that the ASU will have on its financial statements and related disclosures.
Fair Value
In August 2018, the FASB issued ASU 2018-13,
Fair Value Measurement (Topic 820): Disclosure Framework - Changes to the Disclosure Requirements for Fair Value Measurement.
The ASU modifies the disclosure requirements in Topic 820 by removing certain disclosure requirements related to the fair value hierarchy, modifying existing disclosure requirements related to measurement uncertainty and adding new disclosure requirements, such as disclosing the changes in unrealized gains and losses for the period included in other comprehensive income for recurring Level 3 fair value measurements held at the end of the reporting period and disclosing the range and weighted average of significant unobservable inputs used to develop Level 3 fair value measurements. This ASU is effective for public companies for annual reporting periods and interim periods within those annual periods beginning after December 15, 2019. The Company is currently evaluating the effect, if any, that the ASU will have on its financial statements and related disclosures.
Retirement Benefit Plans
In August 2018, the FASB issued ASU 2018-14
, Compensation - Retirement Benefits - Defined Benefit Plans - General (Topic 715-20): Disclosure Framework - Changes to the Disclosure Requirements for Defined Benefit Plans.
The ASU modifies the disclosure requirements for employers that sponsor defined benefit pension or other postretirement plans. This ASU is effective for public companies for annual reporting periods and interim periods within those annual periods beginning after December 15, 2020. The Company is currently evaluating the effect, if any, that the ASU will have on its financial statements and related disclosures.
Consolidation
In October 2018, the FASB issued ASU 2018-17,
Targeted Improvements to Related Party Guidance for Variable Interest Entities Consolidation (Topic 810).
This ASU amends the guidance surrounding the assessment and consolidation of variable interest entities. This ASU is effective for public companies for annual reporting periods and interim periods within those annual periods beginning after December 15, 2019. The Company is currently evaluating the effect, if any, that the ASU will have on its financial statements and related disclosures.
w) Change in Accounting Principle - Stock-based Compensation
In the fourth quarter of 2018, the Company changed its policy for recognizing stock-based compensation expense for awards with service conditions only from the graded attribution method to the straight-line attribution method. The Company views these awards as single awards and believes that the straight-line method of accounting more accurately reflects the pattern of service provided by the employee. Additionally, based on research and analysis, the Company believes the straight-line attribution method for stock-based compensation expense for service condition-only awards is the predominant method used in its industry. For these reasons, the Company has concluded that the straight-line attribution method for stock-based compensation is a preferable accounting policy in accordance with ASC 250,
Accounting Changes and Error Corrections
. We have applied this change retrospectively adjusting all periods presented.
The following tables present the effect of the change in accounting policy and its impact on key components of the Company’s consolidated financial statements:
70
|
Year ended December 31, 2018
|
|||||||||
|
As Computed Under Graded Attribution Method
|
As Computed Under Straight-line Attribution Method
|
Effect of Change
|
|||||||
|
Revenue
|
$
|
8,219.9
|
|
$
|
8,219.9
|
|
$
|
—
|
|
|
Costs and expenses:
|
|
|
|||||||
|
Cost of services (exclusive of depreciation and amortization)
|
6,640.0
|
|
6,642.4
|
|
(2.4
|
)
|
|||
|
Operating, administrative and other
|
1,278.2
|
|
1,271.1
|
|
7.1
|
|
|||
|
Depreciation and amortization
|
290.0
|
|
290.0
|
|
—
|
|
|||
|
Restructuring, impairment and related charges
|
3.8
|
|
3.8
|
|
—
|
|
|||
|
Total costs and expenses
|
8,212.0
|
|
8,207.3
|
|
4.7
|
|
|||
|
Operating income
|
7.9
|
|
12.6
|
|
(4.7
|
)
|
|||
|
Interest expense, net of interest income
|
(228.8
|
)
|
(228.8
|
)
|
—
|
|
|||
|
Earnings from equity method investments
|
1.9
|
|
1.9
|
|
—
|
|
|||
|
Other income, net
|
3.5
|
|
3.5
|
|
—
|
|
|||
|
Loss before income taxes
|
(215.5
|
)
|
(210.8
|
)
|
(4.7
|
)
|
|||
|
Benefit from income taxes
|
(26.1
|
)
|
(25.0
|
)
|
(1.1
|
)
|
|||
|
Net loss
|
(189.4
|
)
|
$
|
(185.8
|
)
|
$
|
(3.6
|
)
|
|
|
Less: Net loss attributable to non-controlling interests
|
—
|
|
—
|
|
—
|
|
|||
|
Net loss attributable to the Company
|
$
|
(189.4
|
)
|
$
|
(185.8
|
)
|
$
|
(3.6
|
)
|
|
Basic and diluted loss per share:
|
|||||||||
|
Loss per share attributable to common shareholders
|
$
|
(1.11
|
)
|
$
|
(1.09
|
)
|
$
|
0.02
|
|
|
Weighted average shares outstanding for basic and diluted loss per share
|
171.2
|
|
171.2
|
|
—
|
|
|||
|
Year ended December 31, 2017
|
|||||||||
|
As Reported Under Graded Attribution Method
|
As Adjusted Under Straight-line Attribution Method
|
Effect of Change
|
|||||||
|
Revenue
|
$
|
6,923.9
|
|
$
|
6,923.9
|
|
$
|
—
|
|
|
Costs and expenses:
|
|||||||||
|
Cost of services (exclusive of depreciation and amortization)
|
5,639.6
|
|
5,639.8
|
|
(0.2
|
)
|
|||
|
Operating, administrative and other
|
1,155.4
|
|
1,156.1
|
|
(0.7
|
)
|
|||
|
Depreciation and amortization
|
270.6
|
|
270.6
|
|
—
|
|
|||
|
Restructuring, impairment and related charges
|
28.5
|
|
28.5
|
|
—
|
|
|||
|
Total costs and expenses
|
7,094.1
|
|
7,095.0
|
|
(0.9
|
)
|
|||
|
Operating loss
|
(170.2
|
)
|
(171.1
|
)
|
0.9
|
|
|||
|
Interest expense, net of interest income
|
(183.1
|
)
|
(183.1
|
)
|
—
|
|
|||
|
Earnings from equity method investments
|
1.4
|
|
1.4
|
|
—
|
|
|||
|
Other income, net
|
11.0
|
|
11.0
|
|
—
|
|
|||
|
Loss before income taxes
|
(340.9
|
)
|
(341.8
|
)
|
0.9
|
|
|||
|
Benefit from income taxes
|
(120.4
|
)
|
(120.5
|
)
|
0.1
|
|
|||
|
Net loss
|
$
|
(220.5
|
)
|
$
|
(221.3
|
)
|
$
|
0.8
|
|
|
Basic and diluted loss per share:
|
|||||||||
|
Loss per share attributable to common shareholders
|
$
|
(1.53
|
)
|
$
|
(1.54
|
)
|
$
|
(0.01
|
)
|
|
Weighted average shares outstanding for basic and diluted loss per share
|
143.9
|
|
143.9
|
|
—
|
|
|||
71
|
Year ended December 31, 2016
|
|||||||||
|
As Reported Under Graded Attribution Method
|
As Adjusted Under Straight-line Attribution Method
|
Effect of Change
|
|||||||
|
Revenue
|
$
|
6,215.7
|
|
$
|
6,215.7
|
|
$
|
—
|
|
|
Costs and expenses:
|
|||||||||
|
Cost of services (exclusive of depreciation and amortization)
|
5,076.7
|
|
5,067.8
|
|
8.9
|
|
|||
|
Operating, administrative and other
|
1,159.7
|
|
1,150.6
|
|
9.1
|
|
|||
|
Depreciation and amortization
|
260.6
|
|
260.6
|
|
—
|
|
|||
|
Restructuring, impairment and related charges
|
32.1
|
|
32.1
|
|
—
|
|
|||
|
Total costs and expenses
|
6,529.1
|
|
6,511.1
|
|
18.0
|
|
|||
|
Operating loss
|
(313.4
|
)
|
(295.4
|
)
|
(18.0
|
)
|
|||
|
Interest expense, net of interest income
|
(171.8
|
)
|
(171.8
|
)
|
—
|
|
|||
|
Earnings from equity method investments
|
5.9
|
|
5.9
|
|
—
|
|
|||
|
Other income, net
|
2.4
|
|
2.4
|
|
—
|
|
|||
|
Loss before income taxes
|
(476.9
|
)
|
(458.9
|
)
|
(18.0
|
)
|
|||
|
Benefit from income taxes
|
(27.4
|
)
|
(24.3
|
)
|
(3.1
|
)
|
|||
|
Net loss
|
(449.5
|
)
|
$
|
(434.6
|
)
|
$
|
(14.9
|
)
|
|
|
Less: Net loss attributable to non-controlling interests
|
(0.4
|
)
|
(0.4
|
)
|
—
|
|
|||
|
Net loss attributable to the Company
|
$
|
(449.1
|
)
|
$
|
(434.2
|
)
|
$
|
(14.9
|
)
|
|
Basic and diluted loss per share:
|
|||||||||
|
Loss per share attributable to common shareholders
|
$
|
(3.18
|
)
|
$
|
(3.07
|
)
|
$
|
0.11
|
|
|
Weighted average shares outstanding for basic and diluted loss per share
|
141.4
|
|
141.4
|
|
—
|
|
|||
|
As of December 31, 2018
|
|||||||||
|
As Computed Under Graded Attribution Method
|
As Computed Under Straight-line Attribution Method
|
Effect of Change
|
|||||||
|
Deferred tax assets
|
$
|
89.6
|
|
$
|
84.0
|
|
$
|
5.6
|
|
|
Shareholders' Equity:
|
|||||||||
|
Ordinary shares
|
$
|
21.7
|
|
$
|
21.7
|
|
$
|
—
|
|
|
Additional paid-in capital
|
2,817.0
|
|
2,791.2
|
|
25.8
|
|
|||
|
Accumulated deficit
|
(1,318.6
|
)
|
(1,298.4
|
)
|
(20.2
|
)
|
|||
|
Accumulated other comprehensive loss
|
(154.4
|
)
|
(154.4
|
)
|
—
|
|
|||
|
Total equity
|
1,365.7
|
|
$
|
1,360.1
|
|
$
|
5.6
|
|
|
|
As of December 31, 2017
|
|||||||||
|
As Reported Under Graded Attribution Method
|
As Adjusted Under Straight-line Attribution Method
|
Effect of Change
|
|||||||
|
Deferred tax assets
|
$
|
71.1
|
|
$
|
66.6
|
|
$
|
4.5
|
|
|
|
|||||||||
|
Shareholders' Equity:
|
|
||||||||
|
Ordinary shares
|
$
|
1,451.3
|
|
1,451.3
|
|
—
|
|
||
|
Additional paid-in capital
|
305.0
|
|
283.8
|
|
21.2
|
|
|||
|
Accumulated deficit
|
(1,165.2
|
)
|
(1,148.5
|
)
|
(16.7
|
)
|
|||
|
Accumulated other comprehensive loss
|
(87.2
|
)
|
(87.2
|
)
|
—
|
|
|||
|
Total equity
|
$
|
503.9
|
|
$
|
499.4
|
|
$
|
4.5
|
|
As a result of the change in accounting principle, additional paid-in capital and accumulated deficit as of January 1, 2016 decreased from
$191.2 million
and
$495.6 million
, respectively, as originally reported using the graded attribution method, to
$187.2 million
and
$493.0 million
, respectively, using the straight-line method.
72
|
Year ended December 31, 2018
|
|||||||||
|
As Computed Under Graded Attribution Method
|
As Computed Under Straight-line Attribution Method
|
Effect of Change
|
|||||||
|
Cash flows from operating activities
|
|||||||||
|
Net loss
|
$
|
(189.4
|
)
|
$
|
(185.8
|
)
|
$
|
(3.6
|
)
|
|
Reconciliation of net loss to net cash used in operating activities:
|
|||||||||
|
Depreciation and amortization
|
290.0
|
|
290.0
|
|
—
|
|
|||
|
Impairment charges
|
2.7
|
|
2.7
|
|
—
|
|
|||
|
Unrealized foreign exchange loss (gain)
|
8.4
|
|
8.4
|
|
—
|
|
|||
|
Stock-based compensation
|
86.6
|
|
81.9
|
|
4.7
|
|
|||
|
Loss on debt extinguishment
|
50.4
|
|
50.4
|
|
—
|
|
|||
|
Amortization of debt issuance costs
|
12.5
|
|
12.5
|
|
—
|
|
|||
|
Change in deferred taxes
|
(60.0
|
)
|
(58.9
|
)
|
(1.1
|
)
|
|||
|
Bad debt expense
|
21.7
|
|
21.7
|
|
—
|
|
|||
|
Other non-cash operating activities
|
(3.6
|
)
|
(3.6
|
)
|
—
|
|
|||
|
Changes in assets and liabilities:
|
—
|
|
|||||||
|
Trade and other receivables
|
(235.5
|
)
|
(235.5
|
)
|
—
|
|
|||
|
Income taxes payable
|
(19.6
|
)
|
(19.6
|
)
|
—
|
|
|||
|
Prepaid expenses and other current assets
|
(26.9
|
)
|
(26.9
|
)
|
—
|
|
|||
|
Other non-current assets
|
84.6
|
|
84.6
|
|
—
|
|
|||
|
Accounts payable and accrued expenses
|
74.9
|
|
74.9
|
|
—
|
|
|||
|
Accrued compensation
|
117.8
|
|
117.8
|
|
—
|
|
|||
|
Other current and non-current liabilities
|
(216.8
|
)
|
(216.8
|
)
|
—
|
|
|||
|
Net cash used in operating activities
|
$
|
(2.2
|
)
|
$
|
(2.2
|
)
|
$
|
—
|
|
|
Year ended December 31, 2017
|
|||||||||
|
As Reported Under Graded Attribution Method
|
As Adjusted Under Straight-line Attribution Method
|
Effect of Change
|
|||||||
|
Cash flows from operating activities
|
|||||||||
|
Net loss
|
$
|
(220.5
|
)
|
$
|
(221.3
|
)
|
$
|
0.8
|
|
|
Reconciliation of net loss to net cash used in operating activities:
|
—
|
|
|||||||
|
Depreciation and amortization
|
270.6
|
|
270.6
|
|
—
|
|
|||
|
Unrealized foreign exchange loss (gain)
|
(7.3
|
)
|
(7.3
|
)
|
—
|
|
|||
|
Stock-based compensation
|
51.4
|
|
52.4
|
|
(1.0
|
)
|
|||
|
Amortization of debt issuance costs
|
16.5
|
|
16.5
|
|
—
|
|
|||
|
Gain on pension curtailment
|
(10.0
|
)
|
(10.0
|
)
|
—
|
|
|||
|
Change in deferred taxes
|
(170.1
|
)
|
(170.3
|
)
|
0.2
|
|
|||
|
Bad debt expense
|
3.9
|
|
3.9
|
|
—
|
|
|||
|
Other non-cash operating activities
|
7.0
|
|
7.0
|
|
—
|
|
|||
|
Changes in assets and liabilities:
|
—
|
|
|||||||
|
Trade and other receivables
|
(173.4
|
)
|
(173.4
|
)
|
—
|
|
|||
|
Income taxes payable
|
10.1
|
|
10.1
|
|
—
|
|
|||
|
Prepaid expenses and other current assets
|
(17.6
|
)
|
(17.6
|
)
|
—
|
|
|||
|
Other non-current assets
|
44.0
|
|
44.0
|
|
—
|
|
|||
|
Accounts payable and accrued expenses
|
42.6
|
|
42.6
|
|
—
|
|
|||
|
Accrued compensation
|
98.4
|
|
98.4
|
|
—
|
|
|||
|
Other current and non-current liabilities
|
58.8
|
|
58.8
|
|
—
|
|
|||
|
Net cash used in operating activities
|
$
|
4.4
|
|
$
|
4.4
|
|
$
|
—
|
|
73
|
Year ended December 31, 2016
|
|||||||||
|
As Reported Under Graded Attribution Method
|
As Adjusted Under Straight-line Attribution Method
|
Effect of Change
|
|||||||
|
Cash flows from operating activities
|
|||||||||
|
Net loss
|
(449.5
|
)
|
$
|
(434.6
|
)
|
$
|
(14.9
|
)
|
|
|
Reconciliation of net loss to net cash used in operating activities:
|
—
|
|
|||||||
|
Depreciation and amortization
|
260.6
|
|
260.6
|
|
—
|
|
|||
|
Impairment charges
|
2.6
|
|
2.6
|
|
—
|
|
|||
|
Unrealized foreign exchange loss (gain)
|
(10.7
|
)
|
(10.7
|
)
|
—
|
|
|||
|
Stock-based compensation
|
66.9
|
|
49.0
|
|
17.9
|
|
|||
|
Amortization of debt issuance costs
|
12.6
|
|
12.6
|
|
—
|
|
|||
|
Fees incurred in conjunction with debt modification
|
(3.7
|
)
|
(3.7
|
)
|
—
|
|
|||
|
Change in deferred taxes
|
(63.1
|
)
|
(60.1
|
)
|
(3.0
|
)
|
|||
|
Bad debt expense
|
11.9
|
|
11.9
|
|
—
|
|
|||
|
Other non-cash operating activities
|
1.2
|
|
1.2
|
|
—
|
|
|||
|
Changes in assets and liabilities:
|
—
|
|
|||||||
|
Trade and other receivables
|
(146.9
|
)
|
(146.9
|
)
|
—
|
|
|||
|
Income taxes payable
|
2.7
|
|
2.7
|
|
—
|
|
|||
|
Prepaid expenses and other current assets
|
18.4
|
|
18.4
|
|
—
|
|
|||
|
Other non-current assets
|
(137.6
|
)
|
(137.6
|
)
|
—
|
|
|||
|
Accounts payable and accrued expenses
|
118.3
|
|
118.3
|
|
—
|
|
|||
|
Accrued compensation
|
11.0
|
|
11.0
|
|
—
|
|
|||
|
Other current and non-current liabilities
|
(29.8
|
)
|
(29.8
|
)
|
—
|
|
|||
|
Net cash used in operating activities
|
$
|
(335.1
|
)
|
$
|
(335.1
|
)
|
$
|
—
|
|
Note 3: Segment Data
The Company reports its operations through the following segments: (1) Americas, (2) EMEA and (3) APAC. The Americas consists of operations located in the United States, Canada and key markets in Latin America. EMEA includes operations in the UK, France, Netherlands and other markets in Europe and the Middle East. APAC includes operations in Australia, Singapore, China and other markets in the Asia Pacific region. For segment reporting, gross contract costs are excluded from revenue in determining “Fee revenue”. Additionally, pursuant to business combination accounting rules, certain Fee revenue that was deferred by the acquiree may be recorded as a receivable on the acquisition date by the Company. Such contingent Fee revenue is recorded for segment reporting as an acquisition accounting adjustment to reflect the revenue recognition of the Company absent the application of acquisition accounting.
Corporate expenses are allocated to the segments based upon Fee revenue of each segment. Gross contract costs are excluded from operating expenses in determining “Fee-based operating expenses”.
Adjusted EBITDA is the profitability metric reported to the chief operating decision maker (“CODM”) for purposes of making decisions about allocation of resources to each segment and assessing performance of each segment. Adjusted EBITDA excludes depreciation and amortization, interest expense, net of interest income, income taxes, as well as integration and other costs related to acquisitions, expenses related to the Cassidy Turley deferred payment obligation (the "DPO"; refer to
Note 13: Stock-based Payments
for further discussion), stock-based compensation for plans enacted before the Company's IPO ("pre-IPO stock-based compensation") and other charges.
As segment assets are not reported to or used by the CODM to measure business performance or allocate resources, total segment assets and capital expenditures are not presented below.
74
Summarized financial information by segment is as follows (in millions):
|
Year Ended December 31,
|
|||||||||
|
Americas
|
2018
|
2017
|
2016
|
||||||
|
Total revenue
|
$
|
5,724.7
|
|
$
|
4,600.2
|
|
$
|
4,124.3
|
|
|
Less: Gross contract costs
|
(1,684.5
|
)
|
(1,023.4
|
)
|
(851.4
|
)
|
|||
|
Acquisition accounting adjustments
|
2.5
|
|
20.0
|
|
30.6
|
|
|||
|
Total Fee revenue
|
$
|
4,042.7
|
|
$
|
3,596.8
|
|
$
|
3,303.5
|
|
|
Service lines:
|
|||||||||
|
Property, facilities and project management
|
$
|
1,698.6
|
|
$
|
1,638.3
|
|
$
|
1,445.4
|
|
|
Leasing
|
1,481.6
|
|
1,244.6
|
|
1,140.7
|
|
|||
|
Capital markets
|
699.4
|
|
530.4
|
|
536.2
|
|
|||
|
Valuation and other
|
163.1
|
|
183.5
|
|
181.2
|
|
|||
|
Total Fee revenue
|
$
|
4,042.7
|
|
$
|
3,596.8
|
|
$
|
3,303.5
|
|
|
Segment operating expenses
|
$
|
5,276.9
|
|
$
|
4,275.1
|
|
$
|
3,843.8
|
|
|
Less: Gross contract costs
|
(1,684.5
|
)
|
(1,023.4
|
)
|
(851.4
|
)
|
|||
|
Total Fee-based operating expenses
|
$
|
3,592.4
|
|
$
|
3,251.7
|
|
$
|
2,992.4
|
|
|
Adjusted EBITDA
|
$
|
450.3
|
|
$
|
344.6
|
|
$
|
311.6
|
|
|
Year Ended December 31,
|
|||||||||
|
EMEA
|
2018
|
2017
|
2016
|
||||||
|
Total revenue
|
$
|
999.8
|
|
$
|
863.3
|
|
$
|
755.5
|
|
|
Less: Gross contract costs
|
(111.9
|
)
|
(81.3
|
)
|
(65.0
|
)
|
|||
|
Acquisition accounting adjustments
|
—
|
|
3.2
|
|
(0.8
|
)
|
|||
|
Total Fee revenue
|
$
|
887.9
|
|
$
|
785.2
|
|
$
|
689.7
|
|
|
Service lines:
|
|||||||||
|
Property, facilities and project management
|
$
|
262.1
|
|
$
|
200.5
|
|
$
|
172.9
|
|
|
Leasing
|
265.0
|
|
256.5
|
|
229.1
|
|
|||
|
Capital markets
|
173.5
|
|
154.3
|
|
128.0
|
|
|||
|
Valuation and other
|
187.3
|
|
173.9
|
|
159.7
|
|
|||
|
Total Fee revenue
|
$
|
887.9
|
|
$
|
785.2
|
|
$
|
689.7
|
|
|
Segment operating expenses
|
$
|
896.5
|
|
$
|
769.8
|
|
$
|
670.9
|
|
|
Less: Gross contract costs
|
(111.9
|
)
|
(81.3
|
)
|
(65.0
|
)
|
|||
|
Total Fee-based operating expenses
|
$
|
784.6
|
|
$
|
688.5
|
|
$
|
605.9
|
|
|
Adjusted EBITDA
|
$
|
107.9
|
|
$
|
108.8
|
|
$
|
90.8
|
|
75
|
Year Ended December 31,
|
|||||||||
|
APAC
|
2018
|
2017
|
2016
|
||||||
|
Total revenue
|
$
|
1,495.4
|
|
$
|
1,460.4
|
|
$
|
1,335.9
|
|
|
Less: Gross contract costs
|
(475.4
|
)
|
(522.6
|
)
|
(489.6
|
)
|
|||
|
Acquisition accounting adjustments
|
—
|
|
—
|
|
0.3
|
|
|||
|
Total Fee revenue
|
$
|
1,020.0
|
|
$
|
937.8
|
|
$
|
846.6
|
|
|
Service lines:
|
|||||||||
|
Property, facilities and project management
|
$
|
661.4
|
|
$
|
649.7
|
|
$
|
572.4
|
|
|
Leasing
|
174.1
|
|
149.7
|
|
129.1
|
|
|||
|
Capital markets
|
86.7
|
|
55.8
|
|
66.6
|
|
|||
|
Valuation and other
|
97.8
|
|
82.6
|
|
78.5
|
|
|||
|
Total Fee revenue
|
$
|
1,020.0
|
|
$
|
937.8
|
|
$
|
846.6
|
|
|
Segment operating expenses
|
$
|
1,395.4
|
|
$
|
1,386.1
|
|
$
|
1,265.0
|
|
|
Less: Gross contract costs
|
(475.4
|
)
|
(522.6
|
)
|
(489.6
|
)
|
|||
|
Total Fee-based operating expenses
|
$
|
920.0
|
|
$
|
863.5
|
|
$
|
775.4
|
|
|
Adjusted EBITDA
|
$
|
100.9
|
|
$
|
75.1
|
|
$
|
72.4
|
|
Adjusted EBITDA is calculated as follows (in millions):
|
Year Ended December 31,
|
|||||||||
|
2018
|
2017
|
2016
|
|||||||
|
Net loss attributable to the Company
|
$
|
(185.8
|
)
|
$
|
(221.3
|
)
|
$
|
(434.2
|
)
|
|
Add/(less):
|
|||||||||
|
Depreciation and amortization
|
290.0
|
|
270.6
|
|
260.6
|
|
|||
|
Interest expense, net of interest income
|
228.8
|
|
183.1
|
|
171.8
|
|
|||
|
Benefit from income taxes
|
(25.0
|
)
|
(120.5
|
)
|
(24.3
|
)
|
|||
|
Integration and other costs related to acquisitions
|
244.7
|
|
328.3
|
|
427.1
|
|
|||
|
Pre-IPO stock-based compensation
|
63.4
|
|
27.1
|
|
23.2
|
|
|||
|
Cassidy Turley deferred payment obligation
|
33.0
|
|
44.0
|
|
47.6
|
|
|||
|
Other
|
10.0
|
|
17.2
|
|
3.0
|
|
|||
|
Adjusted EBITDA
|
$
|
659.1
|
|
$
|
528.5
|
|
$
|
474.8
|
|
Below is the reconciliation of consolidated operating expenses to Fee-based operating expenses (in millions):
|
Year Ended December 31,
|
|||||||||
|
2018
|
2017
|
2016
|
|||||||
|
Total operating expenses
|
$
|
8,207.3
|
|
$
|
7,095.0
|
|
$
|
6,511.1
|
|
|
Less: Gross contract costs
|
(2,271.8
|
)
|
(1,627.3
|
)
|
(1,406.0
|
)
|
|||
|
Fee-based operating expenses
|
$
|
5,935.5
|
|
$
|
5,467.7
|
|
$
|
5,105.1
|
|
76
Below is the reconciliation of Fee-based operating expenses by segment to Consolidated Fee-based operating expenses (in millions):
|
Year Ended December 31,
|
|||||||||
|
2018
|
2017
|
2016
|
|||||||
|
Americas Fee-based operating expenses
|
$
|
3,592.4
|
|
$
|
3,251.7
|
|
$
|
2,992.4
|
|
|
EMEA Fee-based operating expenses
|
784.6
|
|
688.5
|
|
605.9
|
|
|||
|
APAC Fee-based operating expenses
|
920.0
|
|
863.5
|
|
775.4
|
|
|||
|
Segment Fee-based operating expenses
|
5,297.0
|
|
4,803.7
|
|
4,373.7
|
|
|||
|
Depreciation and amortization
|
290.0
|
|
270.6
|
|
260.6
|
|
|||
|
Integration and other costs related to acquisitions
(1)
|
242.1
|
|
305.1
|
|
397.0
|
|
|||
|
Pre-IPO stock-based compensation
|
63.4
|
|
27.1
|
|
23.2
|
|
|||
|
Cassidy Turley deferred payment obligation
|
33.0
|
|
44.0
|
|
47.6
|
|
|||
|
Other
|
10.0
|
|
17.2
|
|
3.0
|
|
|||
|
Fee-based operating expenses
|
$
|
5,935.5
|
|
$
|
5,467.7
|
|
$
|
5,105.1
|
|
(1)
Represents integration and other costs related to acquisitions, comprised of certain direct and incremental costs resulting from acquisitions and related integration efforts, as well as costs related to restructuring programs. Excludes the impact of acquisition accounting revenue adjustments as these amounts do not impact operating expenses.
Geographic Information
Revenue in the table below is allocated based upon the country in which services are performed (in millions):
|
|
Year Ended December 31,
|
||||||||
|
|
2018
|
2017
|
2016
|
||||||
|
United States
|
$
|
5,403.6
|
|
$
|
4,298.7
|
|
$
|
3,854.4
|
|
|
Australia
|
589.5
|
|
711.3
|
|
630.0
|
|
|||
|
United Kingdom
|
425.9
|
|
364.6
|
|
359.4
|
|
|||
|
All other countries
|
1,800.9
|
|
1,549.3
|
|
1,371.9
|
|
|||
|
|
$
|
8,219.9
|
|
$
|
6,923.9
|
|
$
|
6,215.7
|
|
The long-lived assets in the table below are comprised of property and equipment (in millions):
|
|
As of December 31,
|
|||||
|
|
2018
|
2017
|
||||
|
United States
|
$
|
216.9
|
|
$
|
211.6
|
|
|
United Kingdom
|
40.5
|
|
30.3
|
|
||
|
All other countries
|
56.4
|
|
62.4
|
|
||
|
|
$
|
313.8
|
|
$
|
304.3
|
|
Note 4: Earnings Per Share
Earnings (Loss) per Share ("EPS") is calculated by dividing the Net earnings or loss attributable to shareholders by the weighted average shares outstanding. As the Company was in a loss position for all reported periods, the Company has determined all potentially dilutive shares would be anti-dilutive and therefore are excluded from the calculation of diluted weighted average shares outstanding. This results in the calculation of weighted average shares outstanding to be the same for basic and diluted EPS.
Potentially dilutive securities of approximately
12.2 million
,
10.2 million
and
8.6 million
for the
years ended
December 31, 2018
,
2017
and
2016
, respectively, were not included in the computation of diluted EPS because their effect would have been anti-dilutive.
77
The following is a calculation of EPS (in millions, except per share amounts):
|
Year Ended December 31,
|
|||||||||
|
2018
|
2017
|
2016
|
|||||||
|
Basic and Diluted EPS
|
|||||||||
|
Net loss attributable to shareholders
|
$
|
(185.8
|
)
|
$
|
(221.3
|
)
|
$
|
(434.2
|
)
|
|
Weighted average shares outstanding for basic and diluted loss per share
|
171.2
|
|
143.9
|
|
141.4
|
|
|||
|
Basic and diluted loss per common share attributable to shareholders
|
$
|
(1.09
|
)
|
$
|
(1.54
|
)
|
$
|
(3.07
|
)
|
Note 5: Revenue
On January 1, 2018, the Company adopted and applied Topic 606 and all the related amendments to all contracts using the modified retrospective method. The Company recognized the cumulative effect on the consolidated balance sheet of applying the new revenue standard as an adjustment to the opening balance of Accumulated deficit of
$35.9 million
as of January 1, 2018. Comparative information continues to be reported under the accounting standards in effect for periods prior to 2018. The impact to revenue for the
year ended
December 31, 2018
was an increase of
$432.8 million
, which included an increase of
$400.2 million
related to reimbursed expenses due to implementation of the updated principal versus agent considerations in Topic 606 and the acceleration in the timing of revenue recognition related to variable consideration primarily for Leasing services of
$32.6 million
.
Contract Balances
The Company receives payments from customers based upon contractual billing schedules; accounts receivable are recorded when the right to consideration becomes unconditional. Contract assets include amounts related to the contractual right to consideration for completed performance not yet invoiced or able to be invoiced. Contract liabilities are recorded when cash payments are received in advance of performance, including amounts which are refundable. The Company had no material asset impairment charges related to contract assets in the period presented.
Changes in the contract assets and contract liabilities during the year are as follows (in millions):
|
Contract Assets
|
|||
|
Balance as of December 31, 2017
|
$
|
—
|
|
|
Contract assets recognized upon adoption
|
144.1
|
|
|
|
Contract assets from revenues earned, not yet invoiced
|
140.4
|
|
|
|
Contract assets transferred to accounts receivable
|
(98.1
|
)
|
|
|
Balance as of December 31, 2018
|
$
|
186.4
|
|
|
Contract Liabilities
|
|||
|
Balance as of December 31, 2017
|
$
|
46.4
|
|
|
Contract liabilities recognized upon adoption
|
—
|
|
|
|
Contract liabilities recognized for cash received in advance
|
607.7
|
|
|
|
Contract liabilities reduced due to revenue recognition criteria being satisfied
|
(587.3
|
)
|
|
|
Balance as of December 31, 2018
|
$
|
66.8
|
|
Before the adoption of Topic 606, the Company had no contract assets recorded. The Company's accounting for contract liabilities (deferred revenue) recorded as of
December 31, 2017
was not affected by the adoption of Topic 606.
Of the total ending balances as of
December 31, 2018
, contract assets of
$160.6 million
and
$25.8 million
were recorded as Prepaid expenses and other current assets and Other non-current assets, respectively, in the consolidated balance sheets. As of
December 31, 2018
and
2017
, the above contract liabilities were recorded in Accounts payable and accrued expenses in the consolidated balance sheets.
78
Disaggregation of Revenue
The following tables disaggregate revenue by reportable segment and service line (in millions):
|
Year Ended December 31, 2018
|
||||||||||||||||
|
Revenue recognition timing
|
Americas
|
EMEA
|
APAC
|
Total
|
||||||||||||
|
Property, facilities and project management
|
Over time
|
$
|
3,369.6
|
|
$
|
371.1
|
|
$
|
1,136.8
|
|
$
|
4,877.5
|
|
|||
|
Leasing
|
At a point in time
|
1,487.5
|
|
266.1
|
|
174.1
|
|
1,927.7
|
|
|||||||
|
Capital markets
|
At a point in time
|
702.4
|
|
173.6
|
|
86.7
|
|
962.7
|
|
|||||||
|
Valuation and other
|
At a point in time or over time
|
165.2
|
|
189.0
|
|
97.8
|
|
452.0
|
|
|||||||
|
Total revenue
|
$
|
5,724.7
|
|
$
|
999.8
|
|
$
|
1,495.4
|
|
$
|
8,219.9
|
|
||||
|
Year Ended December 31, 2017
|
||||||||||||||||
|
Revenue recognition timing
|
Americas
|
EMEA
|
APAC
|
Total
|
||||||||||||
|
Property, facilities and project management
|
Over time
|
$
|
2,650.3
|
|
$
|
278.6
|
|
$
|
1,172.2
|
|
$
|
4,101.1
|
|
|||
|
Leasing
|
At a point in time
|
1,229.3
|
|
256.9
|
|
149.7
|
|
1,635.9
|
|
|||||||
|
Capital markets
|
At a point in time
|
531.4
|
|
153.9
|
|
55.8
|
|
741.1
|
|
|||||||
|
Valuation and other
|
At a point in time or over time
|
189.2
|
|
173.9
|
|
82.7
|
|
445.8
|
|
|||||||
|
Total revenue
|
$
|
4,600.2
|
|
$
|
863.3
|
|
$
|
1,460.4
|
|
$
|
6,923.9
|
|
||||
|
Year Ended December 31, 2016
|
||||||||||||||||
|
Revenue recognition timing
|
Americas
|
EMEA
|
APAC
|
Total
|
||||||||||||
|
Property, facilities and project management
|
Over time
|
$
|
2,290.2
|
|
$
|
235.7
|
|
$
|
1,061.8
|
|
$
|
3,587.7
|
|
|||
|
Leasing
|
At a point in time
|
1,219.8
|
|
231.5
|
|
129.0
|
|
1,580.3
|
|
|||||||
|
Capital markets
|
At a point in time
|
431.5
|
|
128.0
|
|
66.6
|
|
626.1
|
|
|||||||
|
Valuation and other
|
At a point in time or over time
|
182.8
|
|
160.3
|
|
78.5
|
|
421.6
|
|
|||||||
|
Total revenue
|
$
|
4,124.3
|
|
$
|
755.5
|
|
$
|
1,335.9
|
|
$
|
6,215.7
|
|
||||
79
Impact of New Revenue Guidance and Financial Statement Line Items
The following table compares the reported audited consolidated balance sheet as of
December 31, 2018
and the audited consolidated statements of operations for the year ended
December 31, 2018
, as a result of the adoption of Topic 606 on January 1, 2018 compared to the pro forma presentation of each respective statement, which assumes the previous guidance remained in effect as of
December 31, 2018
(in millions):
|
Balance as of December 31, 2018
|
|||||||||
|
Balance Sheet
|
Balance Without Adoption of Topic 606
|
Adoption Impact
|
As Reported
|
||||||
|
Trade and other receivables
|
$
|
1,410.7
|
|
$
|
52.8
|
|
$
|
1,463.5
|
|
|
Prepaid expenses and other current assets
|
182.8
|
|
160.6
|
|
343.4
|
|
|||
|
Total current assets
|
2,529.9
|
|
213.4
|
|
2,743.3
|
|
|||
|
Other non-current assets
|
463.7
|
|
25.8
|
|
489.5
|
|
|||
|
Total assets
|
6,306.8
|
|
239.2
|
|
6,546.0
|
|
|||
|
Accounts payable and accrued expenses
|
994.9
|
|
52.8
|
|
1,047.7
|
|
|||
|
Accrued compensation
|
709.8
|
|
108.1
|
|
817.9
|
|
|||
|
Total current liabilities
|
1,877.8
|
|
160.9
|
|
2,038.7
|
|
|||
|
Deferred tax liabilities
|
119.3
|
|
17.1
|
|
136.4
|
|
|||
|
Other non-current liabilities
|
347.7
|
|
18.9
|
|
366.6
|
|
|||
|
Total liabilities
|
4,989.0
|
|
196.9
|
|
5,185.9
|
|
|||
|
Accumulated deficit
|
(1,341.2
|
)
|
42.8
|
|
(1,298.4
|
)
|
|||
|
Accumulated other comprehensive loss
|
(153.9
|
)
|
(0.5
|
)
|
(154.4
|
)
|
|||
|
Total equity
|
1,317.8
|
|
42.3
|
|
1,360.1
|
|
|||
|
Total liabilities and shareholders’ equity
|
6,306.8
|
|
239.2
|
|
6,546.0
|
|
|||
Total reported assets increased by
$239.2 million
due to a
$160.6 million
increase in Prepaid expenses and other assets and a
$25.8 million
increase in Other non-current assets in the consolidated balance sheets resulting from new contract assets recognized from acceleration of timing of revenue recognition, but contractually not able to be invoiced and
$52.8 million
due to an increase in client reimbursed receivables included in Trade and other receivables from contracts accounted for on a gross basis.
Total reported liabilities increased by
$196.9 million
primarily due to a
$108.1 million
increase related to accrued commissions and other employee related benefit payables related to the associated direct commissions resulting from the acceleration of the timing of revenues recognized,
$52.8 million
primarily related to the increase in client reimbursed payables related to contracts accounted for on a gross basis and
$17.1 million
for the net deferred tax liabilities as well as
$18.9 million
for Other non-current liabilities related to long-term accrued commissions.
|
Year Ended December 31, 2018
|
|||||||||
|
Statement of Operations
|
Balance Without Adoption of Topic 606
|
Adoption Impact
|
As Reported
|
||||||
|
Revenue
|
$
|
7,787.1
|
|
$
|
432.8
|
|
$
|
8,219.9
|
|
|
Cost of services
|
6,220.6
|
|
421.8
|
|
6,642.4
|
|
|||
|
Total costs and expenses
|
7,785.5
|
|
421.8
|
|
8,207.3
|
|
|||
|
Operating income
|
1.6
|
|
11.0
|
|
12.6
|
|
|||
|
Loss before income taxes
|
(221.8
|
)
|
11.0
|
|
(210.8
|
)
|
|||
|
Benefit for income taxes
|
(29.6
|
)
|
4.6
|
|
(25.0
|
)
|
|||
|
Net loss
|
$
|
(192.2
|
)
|
$
|
6.4
|
|
$
|
(185.8
|
)
|
Total reported net loss was
$6.4 million
lower than the pro forma statement of operations for the
year ended
December 31, 2018
. The decrease in net loss was due to the acceleration of the timing of revenue recognition in the Leasing service line.
80
The adoption of Topic 606 had offsetting impacts within the cash flows from operating activities of the consolidated statement of cash flows with no net impact on the Company’s cash flows from operations.
Practical Expedients and Exemptions
The Company incurs incremental costs to obtain new contracts across the majority of its service lines. As the amortization period of those expenses is 12 months or less, the Company expenses those incremental costs of obtaining the contracts in accordance with Topic 606.
Remaining performance obligations represent the aggregate transaction prices for contracts where the performance obligations have not yet been satisfied. In accordance with Topic 606, the Company does not disclose unsatisfied performance obligations for (i) contracts with an original expected length of one year or less and (ii) variable consideration for services performed as a series of daily performance obligations, such as those performed within the Property, facilities and project management services lines. Performance obligations within these businesses represent a significant portion of the Company's contracts with customers not expected to be completed within 12 months.
Note 6: Goodwill and Other Intangible Assets
The following table summarizes the changes in the carrying amount of goodwill for the
year ended
December 31, 2018
(in millions):
|
Americas
|
EMEA
|
APAC
|
Total
|
||||||||||||
|
Balance as of December 31, 2016
|
$
|
1,155.8
|
|
$
|
204.7
|
|
$
|
248.1
|
|
$
|
1,608.6
|
|
|||
|
Acquisitions
|
93.8
|
|
20.9
|
|
—
|
|
114.7
|
|
|||||||
|
Measurement period adjustments
|
(0.7
|
)
|
(2.2
|
)
|
—
|
|
(2.9
|
)
|
|||||||
|
Effect of movements in exchange rates and other
|
0.8
|
|
25.6
|
|
18.5
|
|
44.9
|
|
|||||||
|
Balance as of December 31, 2017
|
$
|
1,249.7
|
|
$
|
249.0
|
|
$
|
266.6
|
|
$
|
1,765.3
|
|
|||
|
Acquisitions
|
—
|
|
30.2
|
|
16.1
|
|
46.3
|
|
|||||||
|
Measurement period adjustments
|
12.7
|
|
0.1
|
|
2.1
|
|
14.9
|
|
|||||||
|
Effect of movements in exchange rates and other
|
(8.0
|
)
|
(13.2
|
)
|
(26.8
|
)
|
(48.0
|
)
|
|||||||
|
Balance as of December 31, 2018
|
$
|
1,254.4
|
|
$
|
266.1
|
|
$
|
258.0
|
|
$
|
1,778.5
|
|
|||
Portions of goodwill are denominated in currencies other than the U.S. dollar, therefore a portion of the movements in the reported book value of these balances is attributable to movements in foreign currency exchange rates.
The Company identified measurement period adjustments during the
years ended
December 31, 2018
and
2017
and adjusted the provisional goodwill amounts recognized.
For the
years ended
December 31, 2018
,
2017
and
2016
, the annual impairment assessment of goodwill has been completed resulting in no impairment, as estimated fair value of each of the identified reporting units was in excess of their carrying value.
81
The following tables summarize the carrying amounts and accumulated amortization of intangible assets (in millions):
|
As of December 31, 2018
|
|||||||||||||
|
Useful Life
(in years)
|
Gross Value
|
Accumulated Amortization
|
Net Value
|
||||||||||
|
C&W trade name
|
Indefinite
|
$
|
546.0
|
|
$
|
—
|
|
$
|
546.0
|
|
|||
|
Customer relationships
|
1 – 15
|
1,199.7
|
|
(637.1
|
)
|
562.6
|
|
||||||
|
Other intangible assets
|
2 – 13
|
32.8
|
|
(13.2
|
)
|
19.6
|
|
||||||
|
Total intangible assets
|
$
|
1,778.5
|
|
$
|
(650.3
|
)
|
$
|
1,128.2
|
|
||||
|
As of December 31, 2017
|
|||||||||||||
|
Useful Life
(in years)
|
Gross Value
|
Accumulated Amortization
|
Net Value
|
||||||||||
|
C&W trade name
|
Indefinite
|
$
|
546.0
|
|
$
|
—
|
|
$
|
546.0
|
|
|||
|
Customer relationships
|
1 – 15
|
1,211.5
|
|
(468.0
|
)
|
743.5
|
|
||||||
|
Other intangible assets
|
2 – 13
|
26.9
|
|
(10.4
|
)
|
16.5
|
|
||||||
|
Total intangible assets
|
$
|
1,784.4
|
|
$
|
(478.4
|
)
|
$
|
1,306.0
|
|
||||
Amortization expense was
$184.2 million
,
$180.2 million
and
$179.6 million
for the
years ended
December 31, 2018
,
2017
and
2016
respectively. The estimated annual future amortization expense for each of the years ending
December 31,
2019
through
December 31,
2023
is
$180.3 million
,
$131.6 million
,
$47.0 million
,
$44.7 million
and
$41.2 million
, respectively.
No material impairments of intangible assets were recorded for the years ended
December 31, 2018
,
2017
and
2016
, respectively.
Note 7: Property and Equipment
Property and equipment consist of the following (in millions):
|
As of December 31,
|
|||||||
|
2018
|
2017
|
||||||
|
Software
|
$
|
189.9
|
|
$
|
168.4
|
|
|
|
Plant and equipment
|
134.9
|
|
127.7
|
|
|||
|
Leasehold improvements
|
205.8
|
|
170.2
|
|
|||
|
Equipment under capital lease
|
43.6
|
|
29.8
|
|
|||
|
Software under development
|
20.2
|
|
11.7
|
|
|||
|
Construction in progress
|
12.2
|
|
11.7
|
|
|||
|
606.6
|
|
519.5
|
|
||||
|
Less: Accumulated depreciation
|
(292.8
|
)
|
(215.2
|
)
|
|||
|
Total property and equipment, net
|
$
|
313.8
|
|
$
|
304.3
|
|
|
Depreciation and amortization expense associated with property and equipment was
$105.8 million
,
$90.4 million
and
$81.0 million
for the
years ended
December 31, 2018
,
2017
and
2016
, respectively.
Note 8: Derivative Financial Instruments and Hedging Activities
The Company is exposed to certain risks arising from both business operations and economic conditions, including interest rate risk and foreign exchange risk. To mitigate the impact of interest rate and foreign exchange risk, the Company enters into derivative financial instruments. The Company maintains the majority of its overall interest rate exposure on floating rate borrowings to a fixed-rate basis, primarily with interest rate swap agreements. The Company manages exposure to foreign exchange fluctuations primarily through short-term forward contracts.
Interest Rate Derivative Instruments
As of
December 31, 2018
, the Company's active interest rate hedging instruments consist of
four
interest rate swap agreements designated as cash flow hedges, expiring in August 2025, further described below. The Company's hedge asset balances as
December 31, 2018
relate solely to these interest rate swaps.
82
During 2018, the Company made the below changes to its historical hedging program, which included terminating and monetizing all of its previous designated interest rate cash flow hedging instruments.
In February 2018, the Company elected to terminate and monetize eight interest rate cap agreements and received a
$34.5 million
cash settlement in exchange for its net hedge asset. Amounts relating to these terminated derivatives recorded in Accumulated other comprehensive income in the consolidated balance sheets will be amortized into earnings over the remaining life of the original contracts, which were scheduled to expire between October 2019 and August 2021. Subsequently, the Company entered into eight interest rate cap agreements with identical terms, one expiring October 2019, three expiring May 2021, one expiring July 2021 and three expiring August 2021.
In August 2018, the Company extinguished the 2014 Credit Agreement and as a result the Company de-designated hedge accounting on its eight interest rate cap and five interest rate swap agreements. Refer to
Note 9: Long-term Debt and Other Borrowings
for additional information. Subsequently, in September 2018, the Company elected to terminate its
eight
interest rate cap and
five
interest rate swap agreements, receiving a
$9.6 million
cash settlement in exchange for its net hedge asset. For the
year ended
December 31, 2018
, the Company recognized a
$0.7 million
gain directly in earnings as a result of the changes in the fair value of the interest rate caps and interest rate swaps from the date of de-designation to the date of termination. Amounts relating to these terminated derivatives recorded in Accumulated other comprehensive loss in the consolidated balance sheets will be amortized into earnings over the remaining life of the original contracts, which were scheduled to expire between October 2019 and August 2021. As discussed above, subsequently, the Company entered into
four
interest rate swap agreements designated as cash flow hedges, expiring in August 2025.
The Company did not recognize any significant income or loss due to hedge ineffectiveness related to interest rate swap and cap agreements for the
years ended
December 31, 2018
,
2017
and
2016
. The effective portion of changes in the fair value of derivatives designated and qualifying as cash flow hedges is recorded in Accumulated other comprehensive loss in the consolidated balance sheets and is subsequently reclassified into earnings in the period that the hedged forecasted transaction affects earnings. As of
December 31, 2018
and
2017
, there were
$16.5 million
and
$26.9 million
in pre-tax gains, respectively, included in Accumulated other comprehensive loss related to these agreements, which will be reclassified to Interest expense as interest payments are made in accordance with the 2018 Credit Agreement; refer to
Note 9: Long-term Debt and Other Borrowings
for discussion of these agreements. During the next twelve months, the Company estimates that pre-tax gains of
$12.8 million
will be reclassified to Interest expense on the consolidated statements of operations.
Foreign Exchange Derivative Instruments
In August and September 2018, the Company elected to terminate its cross-currency interest rate swap agreements and received a
$13.9 million
cash settlement in exchange for its net hedge asset. As a result of terminating the cross-currency interest rate swap agreements, a loss of
$0.9 million
was immediately recognized in earnings.
The Company did not recognize any significant income or loss due to hedge ineffectiveness related to cross-currency interest rate swap agreements for the
years ended
December 31, 2018
,
2017
and
2016
. The effective portion of changes in the fair value of derivatives designated and qualifying as cash flow or net investment hedges is recorded in Accumulated other comprehensive loss in the consolidated balance sheets and is subsequently reclassified into earnings in the period that the hedged forecasted transaction affects earnings. As of
December 31, 2018
and
2017
, there were
$0.3 million
and
$3.4 million
in pre-tax gains, respectively, included in Accumulated other comprehensive loss in the consolidated balance sheets related to these agreements. Amounts remaining as of
December 31, 2018
relate to net investments, which will remain in Accumulated other comprehensive loss in the consolidated balance sheets indefinitely until the Company disposes of the underlying investment.
Non-designated Foreign Exchange Derivative Instruments
Additionally, the Company enters into short-term forward contracts to mitigate the risk of fluctuations in foreign currency exchange rates that would adversely impact some of the Company’s foreign currency denominated transactions. Hedge accounting was not elected for any of these contracts. As such, changes in the fair values of these contracts are recorded directly in earnings. There were gains of
$1.0 million
, losses of
$3.1 million
and gains of
$1.7 million
included in the consolidated statements of operations for the
years ended
December 31, 2018
,
2017
and
2016
, respectively. As of
December 31, 2018
and
2017
, the Company had
23
and
24
foreign currency exchange forward contracts outstanding covering a notional amount of
$406.6 million
and
$277.5 million
, respectively. As of
December 31, 2018
and
2017
, the fair value of forward contracts disclosed above were included in Other current assets and Other current liabilities in the consolidated balance sheets. The Company does not net
83
these derivatives in the consolidated balance sheets. As of
December 31, 2018
and
2017
, the Company has not posted and does not hold any collateral related to these agreements.
The following table presents the fair value of derivatives as of
December 31, 2018
and
2017
(in millions):
|
December 31, 2018
|
December 31, 2017
|
|||||||||||||||||||
|
Assets
|
Liabilities
|
Assets
|
Liabilities
|
|||||||||||||||||
|
Derivative Instrument
|
Notional
|
Fair Value
|
Fair Value
|
Fair Value
|
Fair Value
|
|||||||||||||||
|
Designated:
|
||||||||||||||||||||
|
Cash flow hedges:
|
||||||||||||||||||||
|
Cross-currency interest rate swaps
|
$
|
—
|
|
$
|
—
|
|
$
|
—
|
|
$
|
7.1
|
|
$
|
0.4
|
|
|||||
|
Interest rate swaps
|
1,800.0
|
|
—
|
|
25.1
|
|
0.5
|
|
—
|
|
||||||||||
|
Interest rate caps
|
—
|
|
—
|
|
—
|
|
8.9
|
|
—
|
|
||||||||||
|
Net investment hedges:
|
||||||||||||||||||||
|
Foreign currency net investment hedges
|
—
|
|
—
|
|
—
|
|
—
|
|
0.7
|
|
||||||||||
|
Non-designated:
|
||||||||||||||||||||
|
Foreign currency forward contracts
|
406.6
|
|
0.5
|
|
0.8
|
|
0.8
|
|
2.2
|
|
||||||||||
The fair value of derivative assets is included within Other non-current assets and the fair value of derivative liabilities is included within Other non-current liabilities in the consolidated balance sheets. The Company does not net derivatives in the consolidated balance sheets.
The following tables presents the effect of derivatives designated as hedges, net of applicable income taxes, in the consolidated statements of operations for the
years ended
December 31, 2018
,
2017
and
2016
(in millions):
|
Beginning Accumulated Other Comprehensive Loss (Gain)
|
Amount of Loss (Gain) Recognized in Other Comprehensive Loss on Derivatives (Effective Portion)
(1)
|
Amount of (Loss) Gain Reclassified from Accumulated Other Comprehensive Loss into Statement of Operations (Effective Portion)
(2)
|
Ending Accumulated Other Comprehensive Loss (Gain)
|
||||||||||||
|
Year Ended December 31, 2016
|
|||||||||||||||
|
Foreign currency cash flow hedges
|
$
|
0.1
|
|
$
|
(13.2
|
)
|
$
|
14.0
|
|
$
|
0.9
|
|
|||
|
Foreign currency net investment hedges
|
(2.3
|
)
|
0.4
|
|
—
|
|
(1.9
|
)
|
|||||||
|
Interest rate cash flow hedges
|
4.7
|
|
(18.2
|
)
|
(2.9
|
)
|
(16.4
|
)
|
|||||||
|
|
$
|
2.5
|
|
$
|
(31.0
|
)
|
$
|
11.1
|
|
$
|
(17.4
|
)
|
|||
|
Year Ended December 31, 2017
|
|||||||||||||||
|
Foreign currency cash flow hedges
|
$
|
0.9
|
|
$
|
11.0
|
|
$
|
(9.7
|
)
|
$
|
2.2
|
|
|||
|
Foreign currency net investment hedges
|
(1.9
|
)
|
2.6
|
|
—
|
|
0.7
|
|
|||||||
|
Interest rate cash flow hedges
|
(16.4
|
)
|
1.0
|
|
(7.1
|
)
|
(22.5
|
)
|
|||||||
|
|
$
|
(17.4
|
)
|
$
|
14.6
|
|
$
|
(16.8
|
)
|
$
|
(19.6
|
)
|
|||
|
Year Ended December 31, 2018
|
|||||||||||||||
|
Foreign currency cash flow hedges
|
$
|
2.2
|
|
$
|
(7.3
|
)
|
$
|
5.1
|
|
$
|
—
|
|
|||
|
Foreign currency net investment hedges
|
0.7
|
|
(1.3
|
)
|
—
|
|
(0.6
|
)
|
|||||||
|
Interest rate cash flow hedges
|
(22.5
|
)
|
1.1
|
|
8.1
|
|
(13.3
|
)
|
|||||||
|
|
$
|
(19.6
|
)
|
$
|
(7.5
|
)
|
$
|
13.2
|
|
$
|
(13.9
|
)
|
|||
(1)
Amount is net of related income tax expense (benefit) of
$0.7 million
,
$(2.9) million
and
$5.2 million
for the
years ended
December 31, 2018
,
2017
and
2016
, respectively.
(2)
Amount is net of related income tax (expense) benefit of
$(1.9) million
,
$3.7 million
and
$(1.9) million
for the
years ended
December 31, 2018
,
2017
and
2016
, respectively.
Gains of
$9.8 million
, losses of
$8.4 million
and
$3.5 million
were reclassified into earnings during the
years ended
December 31, 2018
,
2017
and
2016
, respectively, relating to interest rate hedges and were recognized in Interest expense on the consolidated statements of operations.
84
Gains of
$0.2 million
and
$5.1 million
were reclassified into earnings during the
year ended
December 31, 2018
relating to foreign currency cash flow hedges and were recognized in Interest expense and Operating, administrative and other, respectively, in the consolidated statements of operations.
Losses of
$0.1 million
and
$12.0 million
were reclassified into earnings during the
year ended
December 31, 2017
relating to foreign currency cash flow hedges and were recognized in Interest expense and Operating, administrative and other, respectively, in the consolidated statements of operations.
Gains of
$0.2 million
and
$16.3 million
were reclassified into earnings during the
year ended
December 31, 2016
relating to foreign currency cash flow hedges and were recognized in Interest expense and Operating, administrative and other, respectively, in the consolidated statements of operations.
Note 9: Long-term Debt and Other Borrowings
Long-term debt consisted of the following (in millions):
|
As of
|
|||||||
|
December 31, 2018
|
December 31, 2017
|
||||||
|
Collateralized:
|
|||||||
|
2018 First Lien Loan, net of unamortized discount and issuance costs of $31.9 million and $0.0 million
|
$
|
2,661.3
|
|
$
|
—
|
|
|
|
First Lien Loan, as amended, net of unamortized discount and issuance costs of $0.0 million and $44.6 million
|
—
|
|
2,341.1
|
|
|||
|
Second Lien Loan, as amended, net of unamortized discount and issuance costs of $0.0 million and $10.0 million
|
—
|
|
460.0
|
|
|||
|
Capital lease liability
|
19.5
|
|
15.3
|
|
|||
|
Notes payable to former stockholders
|
0.4
|
|
21.2
|
|
|||
|
Total long-term debt
|
2,681.2
|
|
2,837.6
|
|
|||
|
Less current portion
|
(37.0
|
)
|
(53.6
|
)
|
|||
|
Total non-current long-term debt
|
$
|
2,644.2
|
|
$
|
2,784.0
|
|
|
2018 Credit Agreement
On August 21, 2018, the Company entered into a
$3.5 billion
credit agreement (the "2018 Credit Agreement"), comprised of a
$2.7 billion
term loan (the "2018 First Lien Loan") and an
$810.0 million
revolving facility (the "Revolver"). Net proceeds from the 2018 First Lien Loan were
$2.7 billion
(
$2.7 billion
aggregate principal amount less
$13.5 million
stated discount and
$20.4 million
in debt transaction costs).
The 2018 Credit Agreement bears interest at a variable interest rate that the Company may select per the terms of the 2018 Credit Agreement. As of
December 31, 2018
, the rate is equal to 1-month LIBOR plus
3.25%
. The 2018 First Lien Loan matures on
August 21, 2025
. As of
December 31, 2018
, the effective interest rate of the 2018 First Lien Loan is
6.0%
.
The 2018 Credit Agreement requires quarterly principal payments equal to
0.25%
of the aggregate principal amount of the 2018 First Lien Loan, including incremental borrowings.
2014 Credit Agreement
On August 8, 2018, the Company paid off the outstanding principal of
$450.0 million
of its Second Lien Loan under its previous credit agreement, as amended and originating in 2014 (the "2014 Credit Agreement"). This resulted in a loss on extinguishment related to the write-off of unamortized deferred financing fees of
$8.3 million
and a prepayment penalty of
$2.0 million
, which was recorded in Interest expense during the year ended
December 31, 2018
.
With the proceeds from the 2018 First Lien Loan, the Company subsequently paid off all outstanding principal and accrued interest under the First Lien under the 2014 Credit Agreement of
$2.6 billion
and
$25.9 million
, respectively, which also resulted in a loss on extinguishment related to the write-off of unamortized deferred financing fees of
$39.2 million
which was recorded in Interest expense during the year ended
December 31, 2018
.
85
Revolver
As part of entering into the 2018 Credit Agreement, the previous revolving facility was modified to increase borrowing capacity to
$810.0 million
. As of
December 31, 2018
, the Company had
no
outstanding funds drawn under the Revolver, which matures on August 21, 2023.
Borrowings under the Revolver, if any, bear interest at our option, at rates varying from
2.75%
to
2.00%
plus the Eurodollar Rate or
1.75%
to
1.00%
plus the Base Rate based on achievement of certain First Lien Net Leverage Ratios (as defined in the 2018 Credit Agreement).
The Revolver also includes capacity for letters of credit equal to the lesser of (a) $
220.0 million
and (b) any remaining amount not drawn down on the Revolver’s primary capacity. As of
December 31, 2018
and 2017, the Company had issued letters of credit with an aggregate face value of
$57.6 million
and
$65.5 million
, respectively. These letters of credit were issued in the normal course of business.
The Revolver is also subject to a commitment fee. The commitment fee varies based on the Company's First Lien Net Leverage Ratio. The Company was charged
$1.5 million
,
$1.4 million
and
$1.1 million
of commitment fees during the years ended December 31, 2018, 2017 and 2016, respectively.
Financial Covenants and Terms
The 2018 Credit Agreement has a springing financial covenant for the benefit of the Revolver lenders only that is tested on the last day of each fiscal quarter if the outstanding loans under the Revolver exceed an applicable threshold. If the financial covenant is triggered, the First Lien Net Leverage Ratio is tested for compliance not to exceed
5.80
to 1.00.
The Company was in compliance with all of its loan provisions under the 2018 Credit Agreement as of
December 31, 2018
.
Note 10: Employee Benefits
Defined contribution plans
The Company offers a variety of defined contribution plans across the world, in the U.S. benefit plans are pursuant to Section 401(k) of the Internal Revenue Code. For certain plans, the Company, at its discretion, can match eligible employee contributions of up to 100% of amounts contributed up to 3% of an individual’s annual compensation and subject to limitation under federal law. Additionally, the Company sponsors a number of defined contribution plans pursuant to the requirements of certain countries in which it has operations. Contributions to defined contribution plans are charged as an expense as the contributions are paid or become payable and are reflected in Cost of services and Operating, administrative and other on the consolidated statements of operations. Defined contribution plan expense was
$36.1 million
,
$27.8 million
and
$26.3 million
for the
years ended
December 31, 2018
,
2017
and
2016
, respectively.
Defined benefit plans
The Company offers defined benefit plans in certain jurisdictions. In the UK, the Company provides a funded defined benefit plan to certain employees and former employees and has an obligation to pay unfunded pensions to six former employees or their surviving spouses. The defined benefit plan provides benefits based on final pensionable salary and has been closed to new members and future accruals since October 31, 2009. Also, in the UK, the Company operates a hybrid pension plan that includes characteristics of both a defined contribution and a defined benefit plan (the “Hybrid Plan”). The Company formally gave notice to freeze this plan effective March 31, 2002 and, subject to certain transitional arrangements, introduced a defined contribution plan for employees from that date.
During the
year ended
December 31, 2017
, the Company elected to curtail and settle a pension plan, which the Company acquired as part of a business combination during the
year ended
December 31, 2016
, which resulted in a gain of
$10.0 million
.
86
The net asset/ liability for defined benefit plans is presented within Other non-current liabilities and is comprised of the following (in millions):
|
As of December 31, 2018
|
As of December 31, 2017
|
||||||
|
Present value of funded obligations
|
$
|
(182.9
|
)
|
$
|
(222.6
|
)
|
|
|
Fair value of defined benefit plan assets
|
188.2
|
|
213.6
|
|
|||
|
Net asset/(liability)
|
$
|
5.3
|
|
$
|
(9.0
|
)
|
|
The Company has no legal obligation to settle the liabilities with an immediate contribution or an additional one-off contribution. The Company intends to continue to contribute to its defined benefit plans at a rate in line with the latest recommendations provided by the plans’ actuaries and trustees.
Total employer contributions expected to be paid for the year ending
December 31,
2019
for the UK defined benefit plans are
$6.5 million
.
Changes in the net asset/ liability for defined benefit plans were as follows (in millions):
|
As of December 31, 2018
|
As of December 31, 2017
|
||||||
|
Change in pension benefit obligations:
|
|||||||
|
Balance at beginning of year
|
$
|
(222.6
|
)
|
$
|
(274.5
|
)
|
|
|
Service cost
|
—
|
|
(3.3
|
)
|
|||
|
Interest cost
|
(5.1
|
)
|
(7.2
|
)
|
|||
|
Actuarial gains (losses)
|
17.2
|
|
(7.2
|
)
|
|||
|
Benefits paid
|
14.3
|
|
16.1
|
|
|||
|
Curtailments, settlements and terminations
|
—
|
|
83.2
|
|
|||
|
Foreign exchange movement
|
13.3
|
|
(29.7
|
)
|
|||
|
Balance at end of year
|
(182.9
|
)
|
(222.6
|
)
|
|||
|
Change in pension plan assets:
|
|||||||
|
Balance at beginning of year
|
213.6
|
|
243.6
|
|
|||
|
Actual return on plan assets
|
(7.5
|
)
|
20.5
|
|
|||
|
Employer contributions
|
9.5
|
|
9.9
|
|
|||
|
Benefits paid
|
(14.3
|
)
|
(16.1
|
)
|
|||
|
Curtailments, settlements and terminations
|
—
|
|
(71.0
|
)
|
|||
|
Foreign exchange movement
|
(13.1
|
)
|
26.7
|
|
|||
|
Balance at end of year
|
188.2
|
|
213.6
|
|
|||
|
Over funded (unfunded) status at end of year
|
$
|
5.3
|
|
$
|
(9.0
|
)
|
|
Total amounts recognized in the consolidated statements of operations were as follows (in millions):
|
Year Ended December 31, 2018
|
Year Ended December 31, 2017
|
Year Ended December 31, 2016
|
|||||||||
|
Service and other cost
|
$
|
—
|
|
$
|
(2.6
|
)
|
$
|
(0.4
|
)
|
||
|
Interest cost
|
(5.1
|
)
|
(7.2
|
)
|
(7.0
|
)
|
|||||
|
Expected return on assets
|
8.4
|
|
8.9
|
|
9.0
|
|
|||||
|
Curtailments, settlements and terminations
|
—
|
|
9.6
|
|
—
|
|
|||||
|
Amortization of net loss
|
(0.1
|
)
|
(0.3
|
)
|
(0.1
|
)
|
|||||
|
Net periodic pension benefit
|
$
|
3.2
|
|
$
|
8.4
|
|
$
|
1.5
|
|
||
87
Total actuarial gains and losses recognized in Accumulated other comprehensive loss were as follows (in millions):
|
Year Ended December 31, 2018
|
Year Ended December 31, 2017
|
Year Ended December 31, 2016
|
|||||||||
|
Cumulative actuarial (losses) gains at beginning of year
|
$
|
(6.4
|
)
|
$
|
(10.8
|
)
|
$
|
0.5
|
|
||
|
Actuarial gains (losses) recognized during the period, net of tax
1
|
1.8
|
|
3.3
|
|
(12.7
|
)
|
|||||
|
Amortization of net loss
|
0.1
|
|
0.3
|
|
0.1
|
|
|||||
|
Curtailments, settlements and terminations
|
—
|
|
2.1
|
|
—
|
|
|||||
|
Foreign exchange movement
|
1.1
|
|
(1.3
|
)
|
1.3
|
|
|||||
|
Cumulative actuarial losses at end of year
|
$
|
(3.4
|
)
|
$
|
(6.4
|
)
|
$
|
(10.8
|
)
|
||
(1)
Actuarial (losses) gains recognized are reported net of tax benefit (expense) of
$0.6 million
,
$(1.1) million
and
$2.6 million
for the years ended
December 31, 2018
,
2017
and
2016
respectively.
For the year ended
December 31, 2017
, the Company reclassified losses of
$2.1 million
out of Accumulated other comprehensive income in relation to the settlement of the Netherlands pension plan. The Company anticipates that
$0.1 million
of the net actuarial loss in Accumulated other comprehensive loss will be recognized as a component of net periodic pension cost in
2019
.
The expected rate of return on plan assets has been calculated by taking a weighted average of the expected return on assets, weighted by the actual asset allocation at each reporting period. The Company uses investment services to assist with determining the overall expected rate of return on pension plan assets. Factors considered in this determination include historical long-term investment performance and estimates of future long-term returns by asset class.
The discount rate is determined using a cash flow matching method and a yield curve which is based on AA corporate bonds with extrapolation beyond 30 years in line with a gilt yield curve to 50 years. For beyond 50 years, due to absence of data, flat forward rates are assumed.
|
Principal actuarial assumptions
|
Year Ended December 31, 2018
|
Year Ended December 31, 2017
|
Year Ended December 31, 2016
|
||
|
Discount rate
|
2.9%
|
2.4%
|
2.5%
|
||
|
Expected return on plan assets
|
4.2%
|
4.3%
|
3.8%
|
||
The Company evaluates these assumptions on a regular basis taking into consideration current market conditions and historical market data. A lower discount rate would increase the present value of the benefit obligation. Other changes in actuarial assumptions, such as plan participants’ life expectancy, can also have a material impact on the net benefit obligation.
|
Major categories of plan assets:
|
As of December 31, 2018
|
As of December 31, 2017
|
|
|
Equity instruments
|
43%
|
55%
|
|
|
Debt, cash and other instruments
|
57%
|
45%
|
|
|
100%
|
100%
|
||
As of
December 31, 2018
and
2017
, plan assets of
$188.2 million
and
$213.6 million
were held within instruments whose fair values can be readily determinable, but do not have regular active market pricing (Level 2). Assets include marketable equity securities in both UK and U.S. companies, including U.S. and non-U.S. equity funds. Debt securities consist of mainly fixed income bonds, such as corporate or government bonds. For certain funds, the assets are valued using bid-market valuations provided by the funds’ investment managers. The plans do not invest directly in property occupied by the Company or in financial securities issued by the Company.
The investment strategies are set by the independent trustees of the plans and are established to achieve a reasonable balance between risk and return and to cover administrative expenses, as well as to maintain funds at a level to meet any applicable minimum funding requirements. The actual asset allocations as of
December 31, 2018
and
2017
approximate each plan’s target asset allocation percentages and are consistent with the objectives of the trustees, particularly in relation to diversification, risk, expected return and liquidity.
88
Expected future benefit payments for the defined benefit pension plans are as follows (in millions):
|
Year Ending
December 31, |
|||
|
2019
|
$
|
6.5
|
|
|
2020
|
6.7
|
|
|
|
2021
|
6.6
|
|
|
|
2022
|
6.8
|
|
|
|
2023
|
7.5
|
|
|
|
From 2024 to 2028
|
39.7
|
|
|
Other employee liabilities
In conjunction with the acquisition of CT on December 31, 2014, an additional payment of
$179.8 million
was to be made on
December 31, 2018
the fourth anniversary of the closing and which was tied to continuing employment. The additional payment was recognized as compensation expense over
four
years until payment. As of the acquisition date, selling shareholders were given the option to receive the additional payment in the form of the Company’s shares or cash. We settled
$128.7 million
in cash and
7.4 million
shares in lieu of cash, refer to
Note 13: Stock-based Payments
for details. The accrued value of the cash-settled portion was
$105.6 million
as of
December 31, 2017
, and included in Other current liabilities in the consolidated balance sheets.
Note 11: Restructuring
As a result of integration activities surrounding the C&W Group merger, the Company recognized restructuring charges of
$0.9 million
,
$28.5 million
and
$29.5 million
for the
years ended
December 31, 2018
,
2017
and
2016
, respectively. Charges primarily consisted of severance and employment-related costs due to reductions in headcount, along with lease exit costs and contract termination. Credits related to changes in estimates to previously reported accruals.
Charges for these restructuring actions were recorded in accordance with FASB guidance on employers’ accounting for post-employment benefits and guidance on accounting for costs associated with exit or disposal activities, as appropriate. All charges were classified as Restructuring, impairment and related charges in the consolidated statements of operations.
The following table details the Company’s severance and other restructuring accrual activity (in millions):
|
Severance Pay
and Benefits
|
Contract
Termination and
Other Costs
|
Total
|
|||||||||
|
Balance as of January 1, 2016
|
$
|
32.8
|
|
$
|
2.5
|
|
$
|
35.3
|
|
||
|
Restructuring Charges
|
18.5
|
|
11.0
|
|
29.5
|
|
|||||
|
Payments and other
(1)
|
(28.8
|
)
|
(7.5
|
)
|
(36.3
|
)
|
|||||
|
Balance as of December 31, 2016
|
22.5
|
|
6.0
|
|
28.5
|
|
|||||
|
Restructuring Charges
|
12.0
|
|
16.5
|
|
28.5
|
|
|||||
|
Payments and other
(1)
|
(8.2
|
)
|
(11.4
|
)
|
(19.6
|
)
|
|||||
|
Balance as of December 31, 2017
|
26.3
|
|
11.1
|
|
37.4
|
|
|||||
|
Restructuring (credits) charges
|
(5.5
|
)
|
6.4
|
|
0.9
|
|
|||||
|
Payments and other
(1)
|
(18.2
|
)
|
(7.4
|
)
|
(25.6
|
)
|
|||||
|
Balance as of December 31, 2018
|
$
|
2.6
|
|
$
|
10.1
|
|
$
|
12.7
|
|
||
(1)
Other consists of changes in the liability balance due to foreign currency translation.
Of the total ending balance as of
December 31, 2018
and
December 31, 2017
,
$6.5 million
and
$6.2 million
, and
$30.1 million
and
$7.3 million
were recorded as Other current liabilities and Other non-current liabilities, respectively, within the consolidated balance sheets.
89
Note 12: Income Taxes
The significant components of loss before income taxes and the income tax provision from continuing operations are as follows (in millions):
|
Year Ended
December 31, 2018 |
|
Year Ended
December 31, 2017 |
|
Year Ended
December 31, 2016 |
|||||||||
|
United States
|
$
|
(65.6
|
)
|
$
|
(231.4
|
)
|
$
|
(280.3
|
)
|
||||
|
Other countries
|
(145.2
|
)
|
(110.4
|
)
|
(178.6
|
)
|
|||||||
|
Loss before income tax
|
$
|
(210.8
|
)
|
$
|
(341.8
|
)
|
$
|
(458.9
|
)
|
||||
|
Year Ended
December 31, 2018 |
|
Year Ended
December 31, 2017 |
|
Year Ended
December 31, 2016 |
|||||||||
|
United States federal:
|
|||||||||||||
|
Current
|
$
|
(3.2
|
)
|
$
|
1.4
|
|
$
|
(4.9
|
)
|
||||
|
Deferred
|
(47.8
|
)
|
(180.4
|
)
|
(46.1
|
)
|
|||||||
|
Total United States federal income taxes
|
(51.0
|
)
|
(179.0
|
)
|
(51.0
|
)
|
|||||||
|
United States state and local:
|
|||||||||||||
|
Current
|
(0.2
|
)
|
17.1
|
|
2.4
|
|
|||||||
|
Deferred
|
(1.1
|
)
|
4.6
|
|
(4.7
|
)
|
|||||||
|
Total United States state and local income taxes
|
(1.3
|
)
|
21.7
|
|
(2.3
|
)
|
|||||||
|
All other countries:
|
|||||||||||||
|
Current
|
37.1
|
|
44.4
|
|
41.5
|
|
|||||||
|
Deferred
|
(9.8
|
)
|
(7.6
|
)
|
(12.5
|
)
|
|||||||
|
Total all other countries income taxes
|
27.3
|
|
36.8
|
|
29.0
|
|
|||||||
|
Total income tax benefit
|
$
|
(25.0
|
)
|
$
|
(120.5
|
)
|
$
|
(24.3
|
)
|
||||
Differences between income tax expense reported for financial reporting purposes and tax expense computed based upon the application of the United States federal tax rate to the reported loss before income taxes are as follows (in millions):
|
Year Ended
December 31, 2018 |
|
Year Ended
December 31, 2017 |
Year Ended
December 31, 2016 |
|||||||||||
|
Reconciliation of effective tax rate
|
||||||||||||||
|
Loss before income taxes
|
$
|
(210.8
|
)
|
$
|
(341.8
|
)
|
$
|
(458.9
|
)
|
|||||
|
Taxes at the statutory rate
|
(44.9
|
)
|
(119.7
|
)
|
(160.6
|
)
|
||||||||
|
Adjusted for:
|
||||||||||||||
|
State taxes, net of the federal benefit
|
(1.2
|
)
|
8.7
|
|
1.5
|
|
||||||||
|
Other permanent adjustments
|
11.3
|
|
(5.3
|
)
|
0.1
|
|
||||||||
|
Foreign tax rate differential
|
0.5
|
|
13.3
|
|
22.1
|
|
||||||||
|
Change in valuation allowance
|
41.1
|
|
30.5
|
|
79.5
|
|
||||||||
|
Impact of repatriation
|
(0.7
|
)
|
7.7
|
|
19.8
|
|
||||||||
|
Uncertain tax positions
|
0.7
|
|
11.3
|
|
5.2
|
|
||||||||
|
Transfer pricing
|
—
|
|
(13.1
|
)
|
—
|
|
||||||||
|
Other, net
|
(2.6
|
)
|
7.0
|
|
8.1
|
|
||||||||
|
Impact of US tax reform
|
(29.2
|
)
|
—
|
|
(60.9
|
)
|
—
|
|
||||||
|
Income tax benefit
|
$
|
(25.0
|
)
|
$
|
(120.5
|
)
|
$
|
(24.3
|
)
|
|||||
90
The tax effect of temporary differences that gave rise to deferred tax assets and liabilities are as follows (in millions):
|
As of December 31, 2018
|
As of December 31, 2017
|
|||||||
|
Deferred tax assets
|
||||||||
|
Liabilities
|
$
|
107.8
|
|
$
|
69.4
|
|
||
|
Deferred expenditures
|
73.6
|
|
36.8
|
|
||||
|
Employee benefits
|
45.5
|
|
66.9
|
|
||||
|
Tax losses / credits
|
199.2
|
|
259.7
|
|
||||
|
Intangible assets
|
18.5
|
|
20.1
|
|
||||
|
Other
|
10.8
|
|
7.6
|
|
||||
|
455.4
|
|
460.5
|
|
|||||
|
Less: valuation allowance
|
(206.6
|
)
|
(223.3
|
)
|
||||
|
Total deferred tax assets
|
$
|
248.8
|
|
$
|
237.2
|
|
||
|
Deferred tax liabilities
|
||||||||
|
Property, plant and equipment
|
$
|
(25.2
|
)
|
$
|
(17.4
|
)
|
||
|
Intangible assets
|
(259.7
|
)
|
(285.9
|
)
|
||||
|
Income recognition
|
(16.3
|
)
|
—
|
|
||||
|
Other
|
—
|
|
(24.8
|
)
|
||||
|
Total deferred tax liabilities
|
(301.2
|
)
|
(328.1
|
)
|
||||
|
Total net deferred tax liabilities
|
$
|
(52.4
|
)
|
$
|
(90.9
|
)
|
||
Valuation allowances of
$206.6 million
and
$223.3 million
were recorded at
December 31, 2018
and
2017
, respectively, as it was determined that it was more likely than not that certain deferred tax assets would not be realized. These valuation allowances relate to tax loss carryforwards, other tax attributes and temporary differences that are available to reduce future tax liabilities.
The total amount of gross unrecognized tax benefits was
$23.5 million
and
$26.3 million
at
December 31, 2018
and
2017
, respectively. It is reasonably possible that unrecognized tax benefits could change by approximately
$20.2 million
during the next twelve months. Accrued interest and penalties related to uncertain tax positions are included in the tax provision. The Company accrued interest and penalties of
$10.1 million
and
$10.5 million
as of
December 31, 2018
and
2017
, respectively, net of federal and state income tax benefits as applicable. The provision for income taxes includes expense for interest and penalties of
$1.2 million
,
$2.5 million
and
$8.1 million
in
2018
,
2017
and
2016
respectively, net of federal and state income tax benefits as applicable.
Changes in the Company’s unrecognized tax benefits are (in millions):
|
Year Ended
December 31, 2018 |
|
Year Ended
December 31, 2017 |
Year Ended
December 31, 2016 |
|||||||||
|
Beginning of year
|
$
|
26.3
|
|
$
|
21.1
|
|
$
|
17.8
|
|
|||
|
Increases from prior period tax positions
|
1.3
|
|
7.6
|
|
9.0
|
|
||||||
|
Decreases from prior period tax positions
|
(3.0
|
)
|
(0.7
|
)
|
(8.5
|
)
|
||||||
|
Decreases from statute of limitations expirations
|
—
|
|
—
|
|
(0.2
|
)
|
||||||
|
Increases from current period tax positions
|
0.2
|
|
4.4
|
|
4.9
|
|
||||||
|
Decreases relating to settlements with taxing authorities
|
(1.3
|
)
|
(6.1
|
)
|
(1.9
|
)
|
||||||
|
End of year
|
$
|
23.5
|
|
$
|
26.3
|
|
$
|
21.1
|
|
|||
The Company is subject to income taxation in various U.S. states and foreign jurisdictions. Generally, the Company’s open tax years include those from 2005 to the present, although audits by taxing authorities for more recent years have been completed or are in process in a number of jurisdictions. As of
December 31, 2018
, the Company is under examination in the U.S., Australia, Belgium, Philippines and India
.
On December 22, 2017, H.R. 1, the Tax Act was enacted. The Tax Act significantly revised the U.S. corporate income tax regime by, among other things, (i) lowering the U.S. corporate rate from 35% to 21% effective January
91
1, 2018, (ii) implementing a new tax system on non-U.S. earnings and imposing a one-time repatriation tax ("transition tax") on earnings of foreign subsidiaries not previously taxed in the U.S. payable over an eight-year period, (iii) limitations on the deductibility of interest expense and executive compensation, (iv) creation of a new minimum tax otherwise known as the Base Erosion Anti-Abuse Tax ("BEAT") and (v) a requirement that certain income such as Global Intangible Low-Taxed Income ("GILTI") earned by foreign subsidiaries be included in U.S. taxable income. U.S. GAAP requires the impact of tax legislation to be recognized in the period in which the law was enacted.
In December 2017, the Securities and Exchange Commission ("SEC") staff issued Staff Accounting Bulletin No. 118 ("SAB 118"),
“Income Tax Accounting Implications of the Tax Cuts and Jobs Act,”
which allows the Company to record provisional amounts during a measurement period not to extend beyond one year of the enactment date. The Company has completed its analysis of the impacts of the Tax Act and the SAB 118 measurement period ended on December 22, 2018. Final adjustments were recorded in the three months ending
December 31, 2018
will be included in the statement of operations as an adjustment to the tax provision.
As a result of additional information and analysis during 2018, the net benefit as of December 31, 2018 is
$89.3 million
, an increase of
$28.4 million
from December 31, 2017. The increased benefit is primarily due to a change to the transition tax and an increased foreign tax credit utilization. Amounts were recorded in Benefit from income taxes in the consolidated statement of operations.
Because of the complexity of the new GILTI tax rules, the Company continues to evaluate this provision of the Tax Act and the application of ASC 740,
Income Taxes
. Under U.S. GAAP, the Company is allowed to make an accounting policy choice of either (1) treating taxes due on future U.S. inclusions in taxable income related to GILTI as a current-period expense when incurred (the “period cost method”) or (2) factoring such amounts into the Company’s measurement of its deferred taxes (the “deferred method”). The Company has analyzed its structure and, as a result, has determined the effect of this provision of the Tax Act to be
$6.4 million
of expense in 2018.
The Company has elected to treat taxes due on U.S. inclusions in taxable income related to GILTI under the period cost method
.
The Company has determined it is not subject to BEAT in 2018.
In 2017 the European Commission (“EC”) announced it opened a formal State aid investigation into the group financing exemption contained within the UK controlled foreign corporation ("UK CFC") rules. The role of the European Union (“EU”) State aid control is to ensure EU Member States do not give certain companies a better tax treatment than others and the EU State aid control believes that this UK CFC exemption may amount to such a selective advantage. If the EC is successful, the UK would be ordered to recoup from companies the tax benefits derived from the exemption. The Company has relied on this exemption from the UK CFC rules and any perceived benefit through December 31, 2018 is approximately
$32.5 million
. The Company ultimately does not believe the EC will prevail in its argument and a reserve has not been provided at this time.
As of
December 31, 2018
, and
2017
, the Company has accumulated
$2.8 billion
and
$2.3 billion
of undistributed foreign earnings. These earnings do not meet the indefinite reinvestment criteria because the Company does not intend to permanently reinvest such earnings. The deferred tax liability of
$4.8 million
as of
December 31, 2018
relates to income taxes and withholding taxes on potential future distributions of cash balances in excess of working capital requirements.
As of
December 31, 2018
, and
2017
, the Company had available operating loss carryovers of
$191.0 million
and
$231.0 million
, respectively, which will begin to expire in 2019, and a foreign tax credit carryover of
$8.2 million
and
$28.7 million
, respectively.
The Company also had a U.S. interest expense disallowance carryforward of
$54.1 million
and
$19.7 million
as of December 31, 2018 and 2017, respectively, which has an indefinite carryforward.
The change in deferred tax balances for operating loss carryovers from 2017 to 2018 includes increases from current year losses and decreases from current year utilization. The jurisdictional location of the operating loss carryover is broken out as follows:
|
As of
December 31, 2018 |
Range of expiration dates
|
|||||
|
United States
|
$
|
68.0
|
|
2019 - Indefinite
|
||
|
All other countries
|
123.0
|
|
2019 - Indefinite
|
|||
|
Total
|
$
|
191.0
|
|
|||
92
Valuation allowances have been provided with regard to the tax benefit of certain net operating loss and tax credit carryovers, for which it has been concluded that it is more likely than not that the deferred tax asset will not be realized. Management assesses the positive and negative evidence to estimate whether sufficient future taxable income will be generated to permit use of the existing deferred tax assets. A significant piece of objective negative evidence evaluated was the cumulative loss incurred over a three-year period ended
December 31, 2018
. Such objective evidence limits the ability to consider other subjective evidence, such as the Company's projections for future growth.
On the basis of this evaluation, valuation allowances were decreased in 2018 by
$16.7 million
overall, primarily due to a
$29.4 million
valuation allowance release in the U.S. and release of valuation allowances against Germany and Luxembourg net operating losses in the amount of
$27.6 million
. These decreases in valuation allowance were partially offset by valuation allowance increases, primarily due to an increase in UK valuation allowances in the amount of
$49.6 million
. The amount of the deferred tax asset, however, could be adjusted if estimates of future taxable income during the carryforward period are reduced or increased or if objective evidence in the form of cumulative losses is no longer present and additional weight is given to subjective evidence such as the Company's projections for growth.
Note 13: Stock-based Payments
In May 2015, the Company adopted the MEIP, which authorized an unspecified number of equity awards for the Company’s ordinary shares to be granted to certain senior executives and management. The Company also issues individual grants of share-based compensation awards, subject to board approval, for purposes of recruiting and as part of its overall compensation strategy. The Company has granted both stock options and Restricted Stock Units (“RSUs”).
On August 6, 2018, the Company adopted the 2018 Omnibus Management Share and Cash Incentive Plan (the “Management Plan”) and the 2018 Omnibus Non-Employee Director Share and Cash Incentive Plan (the “Director Plan,” and together with the Management Plan, the “2018 Omnibus Plans”).
Stock Options
The Company has granted time-based options and performance-based options. Both time-based and performance-based options expire ten years from the date of grant and are classified as equity awards.
Time-Based Options
Time-based options vest over the requisite service period, which is generally
two
to
five
years. The compensation cost related to time-based options is recognized over the requisite service period using the straight-line vesting method. In accordance with ASU 2016-09, the Company will no longer estimate forfeitures, but instead record actual forfeiture activity as it occurs.
The fair value of time-based options granted during
2018
,
2017
and
2016
was
$6.13
,
$5.02
and
$4.81
per option, respectively. As there were multiple option grants during each period, assumptions below are calculated using a weighted average based on total shares issued. Fair value of time-based options was determined using the Black-Scholes model using the following assumptions:
|
2018
|
2017
|
2016
|
||||||||||
|
Exercise price
|
$
|
17.00
|
|
$
|
17.00
|
|
$
|
12.29
|
|
|||
|
Expected option life
|
6.4 years
|
|
5.5 years
|
|
6.3 years
|
|
||||||
|
Risk-free interest rate
|
2.8
|
%
|
2.3
|
%
|
1.8
|
%
|
||||||
|
Historical volatility rate
|
29.0
|
%
|
26.9
|
%
|
31.9
|
%
|
||||||
|
Dividend yield
|
—
|
%
|
—
|
%
|
—
|
%
|
||||||
The weighted average exercise prices of the time-based options granted during
2018
,
2017
and
2016
, respectively, are
$17.00
,
$17.00
and
$12.29
, which approximates the fair value of an ordinary share on the grant date. Because the Company has limited historic exercise behavior, the simplified method was used to determine the expected option life, which is calculated by averaging the contractual term and the vesting period. The risk-free interest rate is based on zero-coupon risk-free rates with a term equal to the expected option life. The historical volatility rate is based on the average historical volatility of a peer group over a period equal to the expected option life. The dividend yield is 0% as the Company has not paid any dividends nor does it plan to pay dividends in the near future.
93
In December 2017, the Company provided the ability for certain individuals to convert a specified number of performance-based options to time-based options which will vest over the course of the next
two
years, with the first tranche vesting as of the grant date. In total,
1.3 million
options were modified as part of this arrangement. Per ASC 718, the Company recorded incremental expense of
$3.7 million
during the year ended
December 31, 2017
for the modified shares. As the performance condition of the modified options was not considered probable, no expense had been recorded to date prior to the modification.
The tables below summarize the Company’s outstanding time-based stock options (in millions, except for per share amounts):
|
Time-Based Options
|
||||||||||||
|
Number of
Options
|
Weighted
Average
Exercise Price
per Share
|
Weighted
Average
Remaining
Contractual
Term (in years)
|
Aggregate Intrinsic Value
|
|||||||||
|
Outstanding as of December 31, 2015
|
1.6
|
|
$
|
10.00
|
|
9.4
|
$
|
3.3
|
|
|||
|
Granted
|
0.6
|
|
12.29
|
|
||||||||
|
Forfeited
|
0.0
|
12.00
|
|
|||||||||
|
Outstanding as of December 31, 2016
|
2.2
|
|
$
|
10.65
|
|
8.6
|
$
|
14.2
|
|
|||
|
Granted
|
0.1
|
|
17.00
|
|
||||||||
|
Granted through modification
|
1.3
|
|
11.06
|
|
||||||||
|
Exercised
|
0.0
|
12.00
|
|
|||||||||
|
Forfeited
|
(0.1
|
)
|
11.79
|
|||||||||
|
Outstanding as of December 31, 2017
|
3.5
|
|
$
|
10.88
|
|
8.5
|
$
|
13.8
|
|
|||
|
Granted
|
0.2
|
|
17.00
|
|
||||||||
|
Exercised
|
(0.3
|
)
|
10.19
|
|
||||||||
|
Forfeited
|
(0.1
|
)
|
12.58
|
|
||||||||
|
Outstanding as of December 31, 2018
|
3.3
|
|
$
|
11.23
|
|
6.8
|
$
|
11.8
|
|
|||
|
Exercisable as of December 31, 2018
|
1.9
|
|
$
|
10.35
|
|
6.6
|
$
|
7.6
|
|
|||
Total recognized compensation cost related to these stock option awards was
$6.0 million
,
$5.7 million
and
$1.9 million
for the
years ended
December 31, 2018
,
2017
and
2016
, respectively. At
December 31, 2018
, the total unrecognized compensation cost related to non-vested time-based option awards was
$6.5 million
, which is expected to be recognized over a weighted-average period of approximately
1.2
years.
Performance-Based Options
Vesting of the performance-based options is triggered by both a performance condition (a change in control or a liquidity event as defined in the award agreement) and a market condition (attainment of specified returns on capital invested by the majority stockholder). Vesting may be accelerated if certain return levels are achieved within defined time frames. In November 2018, all outstanding options were modified to include an additional market condition connected to the Company's share price, as return levels are achievable.
The fair value of performance-based options granted during
2018
,
2017
and
2016
was
$1.25
,
$2.23
and
$1.42
option, respectively. As the performance-based options contain a market condition, the Company has determined the fair value of these options using a Monte Carlo simulation model, which used the following assumptions:
|
2018
|
2017
|
2016
|
||||||||||
|
Exercise price
|
$
|
17.00
|
|
$
|
17.00
|
|
$
|
12.30
|
|
|||
|
Expected term (in years)
(1)
|
1.1 years
|
|
1.2 years
|
|
1.9 years
|
|
||||||
|
Risk-free interest rate
(2)
|
1.9% to 2.0%
|
|
0.4% to 1.5%
|
|
0.4% to 1.5%
|
|
||||||
|
Historical volatility rate
|
22.3% to 27.1%
|
|
25.4% to 29.0%
|
|
25.4% to 29.0%
|
|
||||||
|
Dividend yield
|
—
|
%
|
—
|
%
|
—
|
%
|
||||||
|
(1)
|
The expected term is an average expected term. The expected term assumption is based on an expected liquidity date probability distribution over the course of the next
one
to
two
years.
|
|
(2)
|
The rate used for the awards granted in
2018
,
2017
and
2016
is based on zero-coupon risk-free rates with a term equal to the expected term. The resulting rates range from
0.4%
to
2.0%
.
|
94
The Company considered achievement of the newly added share-price based market condition to be probable. The weighted average fair value of the awards as a result of the modification was
$9.13
. As such the Company began recognizing expense for all such options as of the modification date. The expense for the modified awards was recognized over the period in which the Company expected the new market condition to be obtained, which the Company determined to be one year.
The tables below summarize the Company’s outstanding performance-based stock options (in millions, except for per share amounts):
|
Performance-Based Options
|
|||||||||||||
|
Number of
Options
|
Weighted
Average
Exercise Price
per Share
|
Weighted
Average
Remaining
Contractual
Term (in years)
|
Aggregate Intrinsic Value
|
||||||||||
|
Outstanding as of December 31, 2015
|
2.4
|
|
$
|
10.00
|
|
9.4
|
|
$
|
4.7
|
|
|||
|
Granted
|
1.2
|
|
12.30
|
|
|||||||||
|
Forfeited
|
0.0
|
|
12.00
|
|
|||||||||
|
Outstanding as of December 31, 2016
|
3.6
|
|
$
|
10.90
|
|
8.6
|
|
$
|
22.2
|
|
|||
|
Granted
|
0.1
|
|
17.00
|
|
|||||||||
|
Modified
(1)
|
(1.3
|
)
|
11.06
|
|
|||||||||
|
Forfeited
|
(0.8
|
)
|
10.50
|
|
|||||||||
|
Outstanding as of December 31, 2017
|
1.6
|
|
$
|
11.23
|
|
7.8
|
|
$
|
9.5
|
|
|||
|
Granted
|
0.1
|
|
17.00
|
|
|||||||||
|
Forfeited
|
(0.2
|
)
|
11.98
|
|
|||||||||
|
Outstanding as of December 31, 2018
(2)
|
1.5
|
|
$
|
11.48
|
|
6.9
|
|
$
|
4.5
|
|
|||
|
Exercisable as of December 31, 2018, 2017 and 2016
|
—
|
|
$
|
—
|
|
—
|
|
$
|
—
|
|
|||
(1)
As discussed above,
1.3 million
shares were converted to time-based options during December 2017.
(2)
During 2018, the Company modified all outstanding performance-based options to include an additional market-based condition.
Total recognized compensation cost related to these stock option awards was
$1.4 million
for year ended
December 31, 2018
. At
December 31, 2018
, the total unrecognized compensation cost related to non-vested performance-based option awards was
$12.4 million
, which will be recognized over the course of the next year.
Restricted Stock Units
Co-Investment RSUs
In
2018
,
2017
and
2016
, the Company offered certain management employees two options to purchase or otherwise acquire shares. Management may purchase shares with cash, or they may elect to receive RSUs in lieu of all or a portion of their targeted cash bonus under the target Annual Incentive Plan (“AIP”). Participants choosing to receive RSUs under the AIP were granted a fixed number of RSUs based upon the fair value of an equity share at the grant date. 50% of the RSUs will vest on the annual AIP payment date in March of the following year, and the remaining 50% will vest one year later. If an individual’s actual bonus does not meet the total level of RSUs elected, any shortfall of shares will be forfeited. The Company recognizes compensation cost over the requisite service period using the straight-line vesting method. Since the co-investment RSUs are classified as equity awards, the fair value of the RSUs is the fair value of a limited liability share at the grant date. There are no vesting terms for shares purchased with cash, and as such, these awards are not considered compensation and are accounted for as an equity issuance.
Time-Based and Performance-Based RSUs
The Company may award certain individuals with RSUs. Time-based RSUs contain only a service condition, and the related compensation cost is recognized over the requisite service period of between
two
years and
five
years using the straight-line vesting method. The Company has determined the fair value of time-based RSUs as the fair value of an ordinary share on the grant date. For any shares granted to non-employees, the expense is adjusted for any changes in fair value at the end of each reporting period under the guidance in ASC 505-50.
As of
December 31, 2018
, the Company does not have any outstanding share awards that are liability classified as
95
all shares granted have been determined to be equity instruments and are recorded into equity based on the straight-line vesting method noted above.
Performance-based RSUs ("PBRSUs") vest upon the achievement of a performance condition (change of control or liquidity event as defined in the award agreements) and a market condition (specified return upon the completion of a change of control or liquidity event). As the PBRSUs contain a market condition, the fair value of PBRSUs at the grant date is determined using a Monte Carlo simulation using the assumptions described above. In November 2018, the majority of outstanding PBRSUs were modified to include an additional market condition connected to the Company's share price. The Company considered achievement of the newly added share-price based market condition to be probable. Based on this fact pattern, the Company began recognizing expense for all such awards as of the modification date.
The weighted average fair value of PBRSUs granted during the year ended
December 31, 2018
ranged from
$2.00
per award to
$3.68
per award. The Company considered achievement of the newly added share-price based market condition to be probable. As such the Company began recognizing expense for all such options as of the modification date. The expense for the modified awards will be fully recognized as of the modification date as the modification also removed any future service condition from the awards.
The following table summarizes the Company’s outstanding RSUs (in millions, except for per share amounts):
|
Co-Investment RSUs
|
Time-Based RSUs
|
Performance-Based
RSUs
|
||||||||||||||||||
|
Number of RSUs
|
Weighted
Average
Fair Value
per Share
|
Number of RSUs
|
Weighted
Average
Fair Value
per Share
|
Number of RSUs
|
Weighted
Average
Fair Value
per Share
|
|||||||||||||||
|
Unvested as of December 31, 2015
|
0.5
|
|
$
|
10.00
|
|
1.2
|
|
$
|
11.40
|
|
2.5
|
|
$
|
1.50
|
|
|||||
|
Granted
(1)
|
0.3
|
|
12.29
|
|
7.1
|
|
13.60
|
|
—
|
|
—
|
|
||||||||
|
Vested
|
—
|
|
—
|
|
(0.7
|
)
|
12.00
|
|
—
|
|
—
|
|
||||||||
|
Forfeited
|
0.0
|
|
12.00
|
|
—
|
|
12.00
|
|
—
|
|
—
|
|
||||||||
|
Unvested as of December 31, 2016
|
0.8
|
|
$
|
10.90
|
|
7.6
|
|
$
|
13.36
|
|
2.5
|
|
$
|
1.50
|
|
|||||
|
Granted
|
0.1
|
|
17.00
|
|
0.5
|
|
17.00
|
|
—
|
|
—
|
|
||||||||
|
Vested
|
(0.1
|
)
|
12.00
|
|
(0.9
|
)
|
11.81
|
|
—
|
|
—
|
|
||||||||
|
Forfeited
|
(0.1
|
)
|
12.00
|
|
(0.2
|
)
|
12.16
|
|
—
|
|
—
|
|
||||||||
|
Unvested as of December 31, 2017
|
0.7
|
|
$
|
11.28
|
|
7.0
|
|
$
|
13.48
|
|
2.5
|
|
$
|
1.50
|
|
|||||
|
Granted
|
0.1
|
17.00
|
|
0.7
|
|
17.09
|
|
0.2
|
|
3.18
|
||||||||||
|
Granted through modification
|
—
|
|
—
|
|
1.8
|
|
18.08
|
|
0.9
|
|
17.29
|
|
||||||||
|
Vested
|
(0.1)
|
10.32
|
|
(1.6
|
)
|
14.63
|
|
(0.2
|
)
|
17.29
|
|
|||||||||
|
Modified
|
—
|
|
—
|
|
—
|
|
—
|
|
(2.7
|
)
|
1.56
|
|
||||||||
|
Forfeited
|
(0.1)
|
11.77
|
|
(0.1
|
)
|
13.44
|
|
—
|
|
—
|
|
|||||||||
|
Unvested as of December 31, 2018
|
0.6
|
|
$
|
11.50
|
|
7.8
|
|
$
|
14.63
|
|
0.7
|
|
$
|
15.94
|
|
|||||
|
(1)
|
In November 2016,
1.8 million
shares granted were liability classified.
|
The following table summarizes the Company's compensation expense related to RSUs (in millions):
|
Year Ended December 31,
|
Unrecognized at December 31, 2018
|
|||||||||||||
|
2018
|
2017
|
2016
|
||||||||||||
|
Time-Based RSUs
|
$
|
43.8
|
|
$
|
20.0
|
|
$
|
18.2
|
|
$
|
66.0
|
|
||
|
Co-Investment RSUs
|
0.6
|
|
1.5
|
|
2.2
|
|
0.5
|
|
||||||
|
Performance-Based RSUs
|
15.4
|
|
—
|
|
—
|
|
0.3
|
|
||||||
|
Equity classified compensation cost
|
$
|
59.8
|
|
21.5
|
|
$
|
20.4
|
|
$
|
66.8
|
|
|||
|
Liability classified compensation cost
(1)
|
4.9
|
|
8.1
|
|
1.8
|
|
—
|
|
||||||
|
Total RSU stock-based compensation cost
|
64.7
|
|
$
|
29.6
|
|
$
|
22.2
|
|
$
|
66.8
|
|
|||
(1) In the third quarter of 2018, all liability classified awards were reclassified to equity, due to certain contingencies being lifted.
96
Cassidy Turley - Deferred Payment Obligation
The following table summarizes the Company's expense related to the DPO for those who elected to receive their consideration in shares (in millions):
|
Year Ended December 31,
|
||||||||||||
|
2018
|
2017
|
2016
|
||||||||||
|
Employees
|
$
|
9.9
|
|
$
|
9.5
|
|
$
|
10.8
|
|
|||
|
Non-employees
|
3.6
|
|
13.7
|
|
15.3
|
|
||||||
|
Total DPO expense
|
$
|
13.5
|
|
$
|
23.2
|
|
$
|
26.1
|
|
|||
The expense for non-employees is adjusted for changes in value of the Company's share price each reporting period. During 2016, the fair value of a share increased from
$12.00
per share to
$17.00
per share. Following the IPO, all non-employee shares were adjusted. At
December 31, 2018
, the service condition related to these shares was met and
7.4 million
shares vested and settled into equity.
Note 14: Commitments and Contingencies
Lease commitments and purchase obligations
The Company has entered into commercial operating leases on certain office premises and motor vehicles. There are no financial restrictions placed upon the Company by entering into these leases. Total net rent expense was
$136.0 million
,
$145.7 million
and
$138.5 million
for the
years ended
December 31, 2018
,
2017
and
2016
, respectively. These amounts are net of sublease income of
$13.2 million
,
$12.7 million
and
$13.9 million
for the
years ended
December 31, 2018
,
2017
and
2016
, respectively.
Additionally, the Company has entered into capital leases as a means of funding the acquisition of furniture and equipment and acquiring access to property and vehicles. Rental payments are generally fixed, with no special terms or conditions.
Long-term debt is comprised of the 2018 First Lien Loan. The details of the 2018 Credit Agreement is discussed in
Note 9: Long-term Debt and Other Borrowings
.
As of
December 31, 2018
, the obligations described above as well as the aggregate maturities of long-term debt are as summarized below (in millions):
|
|
Operating Leases
|
Capital Leases
|
Long-term Debt
|
Total
|
|||||||||||
|
2019
|
$
|
152.9
|
|
$
|
9.3
|
|
$
|
27.1
|
|
$
|
189.3
|
|
|||
|
2020
|
139.3
|
|
6.4
|
|
27.2
|
|
172.9
|
|
|||||||
|
2021
|
112.8
|
|
2.3
|
|
27.0
|
|
142.1
|
|
|||||||
|
2022
|
96.3
|
|
0.4
|
|
27.0
|
|
123.7
|
|
|||||||
|
2023
|
80.4
|
|
—
|
|
27.0
|
|
107.4
|
|
|||||||
|
Thereafter
|
210.2
|
|
—
|
|
2,558.3
|
|
2,768.5
|
|
|||||||
|
Totals
|
$
|
791.9
|
|
$
|
18.4
|
|
$
|
2,693.6
|
|
$
|
3,503.9
|
|
|||
Future minimum lease payments are net of total sub-lease rental income of
$58.9 million
. Capital lease obligations are shown net of
$1.1 million
of interest charges.
Refer to
Note 16: Fair Value Measurements
and
Note 10: Employee Benefits
for further information on obligations related to earn-out liabilities and projected payments associated with post-retirement benefit plans.
Guarantees
The Company’s guarantees primarily relate to requirements under certain client service contracts and have arisen through the normal course of business. These guarantees, with certain financial institutions, have both open and closed-ended terms; with remaining closed-ended terms up to
10
years and maximum potential future payments of approximately
$36.7 million
in the aggregate, with none of these guarantees being individually material to the Company’s operating results, financial position or liquidity. The Company’s current expectation is that future payment or performance related to non-performance under these guarantees is considered remote.
97
Contingencies
In the normal course of business, the Company is subject to various claims and litigation. Many of these claims are covered under the Company’s current insurance programs, subject to self-insurance levels and deductibles. The Company is also subject to threatened or pending legal actions arising from activities of contractors. Such liabilities include the potential costs to settle litigation. A liability is recorded for the potential costs of carrying out further works based on known claims and previous claims history, and for losses from litigation that are probable and estimable. A liability is also recorded for the Company’s incurred but not reported ("IBNR") claims, based on assessment using prior claims history.
Claims liabilities are presented as Other current liabilities and Other non-current liabilities in the consolidated balance sheets. As of
December 31, 2018
and
2017
, contingent liabilities recorded within Other current liabilities were
$69.5 million
and
$88.5 million
, respectively, and contingent liabilities recorded within Other non-current liabilities were
$23.4 million
and
$29.4 million
, respectively. These contingent liabilities are made up of errors and omissions ("E&O") claims, workers’ compensation insurance liabilities and other claims and contingent liabilities. At
December 31, 2018
and
2017
, E&O and other claims were
$32.8 million
and
$54.1 million
, respectively, and workers’ compensation liabilities were
$60.1 million
and
$63.8 million
, respectively, included within Other current liabilities and Other non-current liabilities in the consolidated balance sheets. The ultimate settlement of these matters may result in payments materially in excess of the amounts recorded due to their contingent nature and inherent uncertainties of settlement proceedings.
For a portion of these liabilities, the Company had indemnification assets as of
December 31, 2017
, totaling
$18.2 million
. The indemnification periods for all related agreements ended before December 31, 2017 and were settled during the third quarter of 2018, which resulted in a cash payout of
$5.4 million
in the fourth quarter of 2018.
The Company had insurance recoverable balances as of
December 31, 2018
and
December 31, 2017
totaling
$3.9 million
and
$17.6 million
.
Note 15: Related Party Transactions
TPG Capital, L.P. (“TPG”) and PAG Asia Capital Limited (“PAG”) previously provided management and transaction advisory services to the Company pursuant to a management services agreement. Transaction advisory fees related to integration and financing activities were
$1.1 million
,
$0.9 million
and
$0.7 million
for the
years ended
December 31, 2018
,
2017
and
2016
, respectively. Additionally, prior to its IPO the Company paid an annual fee of
$4.3 million
, payable quarterly, for management advisory services. In conjunction with the Company’s IPO, the management services agreement governing these payments was terminated and resulted in a termination fee of
$11.9 million
recorded in Operating, administrative and other in the consolidated statement of operations for the year ended
December 31, 2018
.
Transactions with equity accounted investees
Aggregate amounts included in the determination of income before income taxes that resulted from transactions with equity accounted investees were as follows (in millions):
|
Year Ended December 31,
|
||||||||||||
|
2018
|
2017
|
2016
|
||||||||||
|
Sales
|
$
|
0.4
|
|
$
|
0.5
|
|
$
|
1.2
|
|
|||
|
Purchases
|
0.7
|
|
0.1
|
|
0.8
|
|
||||||
As of
December 31, 2018
and
2017
, the Company had
no
material receivables or payables with equity accounted investees.
Receivables from affiliates
As of
December 31, 2018
and
2017
, the Company had receivables from affiliates of
$31.7 million
and
$34.1 million
and
$214.3 million
and
$232.8 million
that are included in Prepaid expenses and other current assets and Other non-current assets, respectively, in the consolidated balance sheets. These amounts primarily represent prepaid commissions, retention and sign-on bonuses to brokers and other items such as travel and other advances to employees.
98
Note 16: Fair Value Measurements
The Company measures certain assets and liabilities in accordance with ASC 820,
Fair Value Measurements and Disclosures
(“ASC 820”), which defines fair value as the price that would be received for an asset, or paid to transfer a liability, in an orderly transaction between market participants on the measurement date. In addition, ASC 820 establishes a three-level fair value hierarchy that prioritizes the inputs used to measure fair value as follows:
•
Level 1: quoted prices (unadjusted) in active markets for identical assets or liabilities;
•
Level 2: inputs other than quoted prices included within Level 1 that are observable for the asset or liability, either directly (i.e., as prices) or indirectly (i.e., derived from prices); and
|
•
|
Level 3: inputs for the asset or liability that are based on unobservable inputs in which there is little or no market data.
|
There were no significant transfers in or out of Level 1 and Level 2 during the
years ended
December 31, 2018
and
2017
. There have been no significant changes to the valuation techniques and inputs used to develop the recurring fair value measurements from those disclosed in the Company's consolidated financial statements for the year ended
December 31, 2017
.
Financial Instruments
The Company's financial instruments include cash and cash equivalents, trade and other receivables, deferred purchase price receivable ("DPP"), restricted cash, accounts payable and accrued expenses, short-term borrowings, long-term debt, interest rate swaps and foreign exchange contracts. The carrying amount of cash and cash equivalents approximates the fair value of these instruments. Certain money market funds in which the Company has invested are highly liquid and considered cash equivalents. These funds are valued at the per unit rate published as the basis for current transactions.
The estimated fair value of external debt was
$2.6 billion
and
$2.8 billion
as of
December 31, 2018
and
December 31, 2017
, respectively. These instruments were valued using dealer quotes that are classified as Level 2 inputs in the fair value hierarchy. The gross carrying value of the debt was
$2.7 billion
and
$2.9 billion
as of
December 31, 2018
and
2017
, respectively, which excludes debt issuance costs. See
Note 9: Long-term Debt and Other Borrowings
for additional information.
The estimated fair values of interest rate swaps and foreign currency forward contracts are determined based on the expected cash flows of each derivative. The valuation method reflects the contractual period and uses observable market-based inputs, including interest rate and foreign currency forward curves.
Recurring Fair Value Measurements
The following tables present information about the Company’s assets and liabilities that are measured at fair value on a recurring basis as of
December 31, 2018
and
2017
(in millions):
|
As of December 31, 2018
|
||||||||||||||||
|
Total
|
Level 1
|
Level 2
|
Level 3
|
|||||||||||||
|
Assets
|
||||||||||||||||
|
Cash equivalents - money market funds
|
$
|
173.5
|
|
$
|
173.5
|
|
$
|
—
|
|
$
|
—
|
|
||||
|
Deferred compensation plan assets
|
48.8
|
|
48.8
|
|
—
|
|
—
|
|
||||||||
|
Foreign currency forward contracts
|
0.5
|
|
—
|
|
0.5
|
|
—
|
|
||||||||
|
Deferred purchase price receivable
|
140.1
|
|
—
|
|
—
|
|
140.1
|
|
||||||||
|
Total
|
$
|
362.9
|
|
$
|
222.3
|
|
$
|
0.5
|
|
$
|
140.1
|
|
||||
|
Liabilities
|
||||||||||||||||
|
Deferred compensation plan liabilities
|
$
|
47.7
|
|
$
|
47.7
|
|
$
|
—
|
|
$
|
—
|
|
||||
|
Foreign currency forward contracts
|
0.8
|
|
—
|
|
0.8
|
|
—
|
|
||||||||
|
Interest rate swap agreements
|
25.1
|
|
—
|
|
25.1
|
|
—
|
|
||||||||
|
Earn-out liabilities
|
38.3
|
|
—
|
|
—
|
|
38.3
|
|
||||||||
|
Total
|
$
|
111.9
|
|
$
|
47.7
|
|
$
|
25.9
|
|
$
|
38.3
|
|
||||
99
|
As of December 31, 2017
|
||||||||||||||||
|
Total
|
Level 1
|
Level 2
|
Level 3
|
|||||||||||||
|
Assets
|
||||||||||||||||
|
Deferred compensation plan assets
|
$
|
59.7
|
|
$
|
59.7
|
|
$
|
—
|
|
$
|
—
|
|
||||
|
Foreign currency forward contracts
|
0.8
|
|
—
|
|
0.8
|
|
—
|
|
||||||||
|
Cross-currency interest rate swaps
|
7.1
|
|
—
|
|
7.1
|
|
—
|
|
||||||||
|
Interest rate cap agreements
|
8.9
|
|
—
|
|
8.9
|
|
—
|
|
||||||||
|
Interest rate swap agreements
|
0.5
|
|
—
|
|
0.5
|
|
—
|
|
||||||||
|
Deferred purchase price receivable
|
41.9
|
|
—
|
|
—
|
|
41.9
|
|
||||||||
|
Total
|
$
|
118.9
|
|
$
|
59.7
|
|
$
|
17.3
|
|
$
|
41.9
|
|
||||
|
Liabilities
|
||||||||||||||||
|
Deferred compensation plan liabilities
|
$
|
59.6
|
|
$
|
59.6
|
|
$
|
—
|
|
$
|
—
|
|
||||
|
Foreign currency forward contracts
|
2.2
|
|
—
|
|
2.2
|
|
—
|
|
||||||||
|
Cross-currency interest rate swaps
|
0.4
|
|
—
|
|
0.4
|
|
—
|
|
||||||||
|
Foreign currency net investment hedges
|
0.7
|
|
—
|
|
0.7
|
|
—
|
|
||||||||
|
Earn-out liabilities
|
51.3
|
|
—
|
|
—
|
|
51.3
|
|
||||||||
|
Total
|
$
|
114.2
|
|
$
|
59.6
|
|
$
|
3.3
|
|
$
|
51.3
|
|
||||
Deferred Compensation Plans
The Company provides a deferred compensation plan to certain U.S. employees whereby a portion of employee compensation is held in trust, enabling the employees to defer tax on compensation until payment is made to them from the trust. The employee is at risk for any investment fluctuations of the funds held in trust. The fair value of assets and liabilities are based on the value of the underlying investments using quoted prices in active markets at period end. In the event of insolvency of the entity, the trust’s assets are available to all general creditors of the entity.
Deferred compensation plan assets are presented within Prepaid expenses and other current assets and Other non-current assets in the consolidated balance sheets. Deferred compensation liabilities are presented within Accrued compensation and Other non-current liabilities in the consolidated balance sheets.
Foreign Currency Forward Contracts and Net Investment Hedges, and Interest Rate Swaps and Cap Agreements
Refer to
Note 8: Derivative Financial Instruments and Hedging Activities
for discussion of the fair value associated with these derivative assets and liabilities.
Deferred Purchase Price Receivable
The Company recorded a DPP under its A/R Securitization upon the initial sale of trade receivables. The DPP represents the difference between the fair value of the trade receivables sold and the cash purchase price and is recognized at fair value as part of the sale transaction. The DPP is subsequently remeasured each reporting period in order to account for activity during the period, such as the seller’s interest in any newly transferred receivables, collections on previously transferred receivables attributable to the DPP and changes in estimates for credit losses. Changes in the DPP attributed to changes in estimates for credit losses are expected to be immaterial, as the underlying receivables are short-term and of high credit quality. The DPP is included in Other non-current assets in the consolidated balance sheets and is valued using unobservable inputs (i.e., Level 3 inputs), primarily discounted cash flows. Refer to
Note 17: Accounts Receivable Securitization
for more information.
Earn-out Liabilities
The Company has various contractual obligations associated with the acquisition of several real estate service companies in the United States, Australia, Canada and Europe that were completed during the
years ended
December 31, 2018
and
2017
. These acquisitions included contingent consideration, comprised of earn-out payments to the sellers subject to achievement of certain performance criteria in accordance with the terms and conditions set forth in the purchase agreements. An increase to a probability of achievement would result in a higher fair value measurement.
These amounts disclosed above are included in Other current and other long-term liabilities within the consolidated balance sheets. As of
December 31, 2018
, the Company had the potential to make a maximum of
$48.6 million
and a minimum of
$0.0 million
(undiscounted) in earn out payments. Assuming the achievement of the applicable performance criteria, these earn-out payments will be made over the next four years.
100
Earn-out liabilities are classified within Level 3 in the fair value hierarchy because the methodology used to develop the estimated fair value includes significant unobservable inputs reflecting management’s own assumptions. The fair value of earn-out liabilities is based on the present value of probability-weighted expected return method related to the earn-out performance criteria on each reporting date. The probabilities of achievement assigned to the performance criteria are determined based on due diligence performed at the time of acquisition as well as actual performance achieved subsequent to acquisition. Adjustments to the earn-out liabilities in periods subsequent to the completion of acquisitions are reflected within Operating, administrative and other in the consolidated statements of operations.
The table below presents a reconciliation of liabilities measured at fair value on a recurring basis using significant unobservable inputs (Level 3) (in millions):
|
Earn-out Liabilities
|
|||||||
|
2018
|
2017
|
||||||
|
Balance as of January 1,
|
$
|
51.3
|
|
$
|
30.5
|
|
|
|
Purchases/additions
|
5.9
|
|
26.8
|
|
|||
|
Net change in fair value and other adjustments
|
3.4
|
|
7.2
|
|
|||
|
Payments
|
(22.3
|
)
|
(13.2
|
)
|
|||
|
Balance as of December 31,
|
$
|
38.3
|
|
$
|
51.3
|
|
|
Note 17: Accounts Receivable Securitization
On August 20, 2018, the Company amended the A/R Securitization that was initially entered into on March 8, 2017 to increase the investment limit from
$100.0 million
to
$125.0 million
and extended the termination date to August 20, 2021, unless extended or an earlier termination event occurs. Under the A/R Securitization, certain of the Company's wholly owned subsidiaries continuously sell (or contribute) receivables to wholly owned special purpose entities at fair market value. The special purpose entities then sell 100% of the receivables to an unaffiliated financial institution (“the Purchaser”). Although the special purpose entities are wholly owned subsidiaries of the Company, they are separate legal entities with their own separate creditors who will be entitled, upon their liquidation, to be satisfied out of their assets prior to any assets or value in such special purpose entities becoming available to their equity holders and their assets are not available to pay other creditors of the Company. As of
December 31, 2018
and
2017
, the Company had
$0.0 million
and
$85.0 million
drawn on the investment limit, respectively.
All transactions under the A/R Securitization are accounted for as a true sale in accordance with ASC 860,
Transfers and Servicing ("Topic 860")
. Following the sale and transfer of the receivables to the Purchaser, the receivables are legally isolated from the Company and its subsidiaries, and the Company sells, conveys, transfers and assigns to the Purchaser all its rights, title and interest in the receivables. Receivables sold are derecognized from the statement of financial position. The Company continues to service, administer and collect the receivables on behalf of the Purchaser, and recognizes a servicing liability in accordance with Topic 860. The Company has elected the amortization method for subsequent measurement of the servicing liability, which is assessed for impairment or increased obligation at each reporting date. As of
December 31, 2018
and
2017
, the Company reported servicing liabilities of
$3.4 million
and
$1.1 million
, and
$0.4 million
and
$1.3 million
in Other current liabilities and Other non-current liabilities, respectively, on the consolidated balance sheets. For years ended
December 31, 2018
and
2017
, the Company recorded servicing liability amortization of
$1.1 million
and
$0.9 million
, respectively.
This program allows the Company to receive a cash payment and a DPP for sold receivables. The DPP is paid to the Company in cash on behalf of the Purchaser as the receivables are collected; however, due to the revolving nature of the A/R Securitization, cash collected from the Company’s customers is reinvested by the Purchaser daily in new receivable purchases under the A/R Securitization. For the
years ended
December 31, 2018
and
2017
, receivables sold under the A/R securitization were
$1,143.5 million
and
$957.8 million
, respectively, and cash collections from customers on receivables sold were
$1,102.6 million
and
$825.0 million
, respectively, all of which were reinvested in new receivables purchases and are included in cash flows from operating activities in the consolidated statement of cash flows. As of
December 31, 2018
and
2017
, the outstanding principal on receivables sold under the A/R Securitization were
$173.7 million
and
$132.8 million
, respectively. Refer to
Note 16: Fair Value Measurements
for additional discussion on the fair value of the DPP as of
December 31, 2018
and
2017
.
101
For the
years ended
December 31, 2018
and
2017
, the Company recognized a loss related to receivables sold of
$0.0 million
and
$1.2 million
, respectively, that was recorded in Operating, administrative and other expenses in the consolidated statement of operations. Based on the Company’s collection history, the fair value of the receivables sold subsequent to the initial sale approximates carrying value.
Note 18: Supplemental Cash Flow Information
The following table provides a reconciliation of cash, cash equivalents, and restricted cash reported within the consolidated audited consolidated balance sheets to the sum of such amounts presented in the audited consolidated statements of cash flows (in millions):
|
Year Ended December 31,
|
|||||||||
|
2018
|
2017
|
2016
|
|||||||
|
Cash and cash equivalents, beginning of period
|
$
|
405.6
|
|
$
|
382.3
|
|
$
|
530.4
|
|
|
Restricted cash recorded in Prepaid expenses and other current assets, beginning of period
|
62.3
|
|
42.5
|
|
$
|
17.5
|
|
||
|
Total cash, cash equivalents and restricted cash in the statements of cash flows, beginning of period
|
$
|
467.9
|
|
$
|
424.8
|
|
$
|
547.9
|
|
|
Cash and cash equivalents, end of period
|
$
|
895.3
|
|
$
|
405.6
|
|
$
|
382.3
|
|
|
Restricted cash recorded in Prepaid expenses and other current assets, end of period
|
70.1
|
|
62.3
|
|
$
|
42.5
|
|
||
|
Total cash, cash equivalents and restricted cash shown in the statements of cash flows, end of period
|
$
|
965.4
|
|
$
|
467.9
|
|
$
|
424.8
|
|
Supplemental cash flows and non-cash investing and financing activities are as follows (in millions):
|
Year Ended December 31,
|
|||||||||
|
2018
|
2017
|
2016
|
|||||||
|
Cash paid for:
|
|||||||||
|
Interest
|
$
|
184.0
|
|
$
|
142.1
|
|
$
|
128.2
|
|
|
Income taxes
|
50.6
|
|
36.8
|
|
36.1
|
|
|||
|
Non-cash investing/financing activities:
|
|||||||||
|
Property and equipment acquired through capital leases
|
7.2
|
|
14.0
|
|
2.9
|
|
|||
|
Deferred and contingent payment obligation incurred through acquisitions
|
21.1
|
|
50.3
|
|
71.5
|
|
|||
|
Equity issued in conjunction with acquisitions
|
0.7
|
|
1.0
|
|
3.5
|
|
|||
|
Increase in beneficial interest in a securitization
|
13.2
|
|
41.9
|
|
—
|
|
|||
Note 19: Subsequent Events
The Company has evaluated subsequent events through
February 28, 2019
, the date on which these financial statements were issued, and has determined there are no material subsequent events to disclose, except as follows.
On January 2, 2019, the Company acquired Quality Solutions, Inc. (“QSI”), one of the top U.S. facilities management firms specializing in on-demand facility maintenance and project management services for cash consideration, net of cash acquired, of
$250.7 million
. As of the date of issuance of this report, the Company is still in the process of determining the fair value of acquired assets and liabilities and the calculation of the associated goodwill.
102
Note 20: Parent Company Information
|
Cushman & Wakefield plc
|
|||||||
|
Parent Company Information
|
|||||||
|
Condensed Balance Sheets
|
|||||||
|
|
|
|
|
||||
|
|
As of December 31,
|
||||||
|
(in millions, except per share data)
|
2018
|
2017
|
|||||
|
Assets
|
|
|
|||||
|
Cash
|
$
|
10.5
|
|
$
|
—
|
|
|
|
Accounts receivables
|
34.9
|
|
—
|
|
|||
|
Investments in subsidiaries
|
1,348.9
|
|
606.1
|
|
|||
|
Total assets
|
$
|
1,394.3
|
|
$
|
606.1
|
|
|
|
|
|
|
|||||
|
Liabilities and Equity
|
|
|
|||||
|
|
|
|
|||||
|
Liabilities
|
|
|
|||||
|
Trade and other payables
|
$
|
34.2
|
|
$
|
1.1
|
|
|
|
Other liabilities
|
—
|
|
105.6
|
|
|||
|
Total liabilities
|
34.2
|
|
106.7
|
|
|||
|
|
|
|
|||||
|
Equity
|
|
|
|||||
|
Ordinary shares, nominal value $0.10 per share, 216.6 shares issued and outstanding at December 31, 2018 and ordinary shares nominal value $10.00 per share, 145.1 shares issued and outstanding at December 31, 2017
|
21.7
|
|
1,451.3
|
|
|||
|
Additional paid-in-capital
|
2,791.2
|
|
283.8
|
|
|||
|
Accumulated deficit
|
(1,298.4
|
)
|
(1,148.5
|
)
|
|||
|
Accumulated other comprehensive loss
|
(154.4
|
)
|
(87.2
|
)
|
|||
|
Total equity
|
1,360.1
|
|
499.4
|
|
|||
|
|
|
|
|||||
|
Total liabilities and equity
|
$
|
1,394.3
|
|
$
|
606.1
|
|
|
|
Parent Company Information
|
|||||||||||
|
Condensed Statements of Operations and Comprehensive Income (Loss)
|
|||||||||||
|
|
Year Ended December 31,
|
||||||||||
|
(in millions)
|
2018
|
2017
|
2016
|
||||||||
|
Interest and other income
|
$
|
2.6
|
|
$
|
—
|
|
$
|
—
|
|
||
|
Interest and other expense
|
(17.9
|
)
|
(5.8
|
)
|
(5.5
|
)
|
|||||
|
Loss in earnings of subsidiaries
|
(170.5
|
)
|
(215.5
|
)
|
(428.7
|
)
|
|||||
|
Loss before taxes
|
(185.8
|
)
|
(221.3
|
)
|
(434.2
|
)
|
|||||
|
Tax
|
—
|
|
—
|
|
—
|
|
|||||
|
Net loss attributable to the Parent Company
|
(185.8
|
)
|
(221.3
|
)
|
(434.2
|
)
|
|||||
|
Other comprehensive income (loss), net of tax:
|
—
|
|
—
|
|
—
|
|
|||||
|
Other comprehensive income (loss) of subsidiaries
|
(67.2
|
)
|
61.3
|
|
(76.0
|
)
|
|||||
|
Comprehensive loss attributable to the Parent Company
|
$
|
(253.0
|
)
|
$
|
(160.0
|
)
|
$
|
(510.2
|
)
|
||
103
|
Cushman & Wakefield plc
|
|||||||||||
|
Parent Company Information
|
|||||||||||
|
Condensed Statements of Cash Flows
|
|||||||||||
|
|
|||||||||||
|
|
Year Ended December 31,
|
||||||||||
|
(in millions)
|
2018
|
2017
|
2016
|
||||||||
|
Cash flows from operating activities:
|
|
|
|
||||||||
|
Net loss
|
$
|
(185.8
|
)
|
$
|
(221.3
|
)
|
$
|
(434.2
|
)
|
||
|
Reconciliation of net loss to net cash (used in) provided by operating activities:
|
|
|
|
||||||||
|
Loss in earnings of subsidiaries
|
170.5
|
|
215.5
|
|
428.7
|
|
|||||
|
Unrealized foreign exchange gain
|
—
|
|
—
|
|
(0.2
|
)
|
|||||
|
Increase in trade and other receivables
|
(128.7
|
)
|
—
|
|
—
|
|
|||||
|
Increase in trade and other payables
|
20.0
|
|
0.5
|
|
0.7
|
|
|||||
|
Increase in other liabilities
|
6.2
|
|
5.8
|
|
5.7
|
|
|||||
|
Net cash provided by (used in) operating activities
|
(117.8
|
)
|
0.5
|
|
0.7
|
|
|||||
|
Cash flows from investing activities:
|
|
|
|
||||||||
|
Investment in subsidiaries
|
(865.5
|
)
|
(22.5
|
)
|
(33.9
|
)
|
|||||
|
Net cash used in investing activities
|
(865.5
|
)
|
(22.5
|
)
|
(33.9
|
)
|
|||||
|
Cash flows from financing activities:
|
|
|
|
||||||||
|
Proceeds from issuance of common stock
|
—
|
|
22.0
|
|
33.2
|
|
|||||
|
Proceeds from initial public offering, net of underwriting
|
831.4
|
|
—
|
|
—
|
|
|||||
|
Proceeds from private placement
|
179.5
|
|
—
|
|
—
|
|
|||||
|
Payments of initial public offering and private placement costs
|
(17.3
|
)
|
—
|
|
—
|
|
|||||
|
Other financing activities
|
0.2
|
|
—
|
|
—
|
|
|||||
|
Net cash provided by financing activities
|
993.8
|
|
22.0
|
|
33.2
|
|
|||||
|
Change in cash and cash equivalents
|
10.5
|
|
—
|
|
—
|
|
|||||
|
Cash and cash equivalents, beginning of year
|
—
|
|
—
|
|
—
|
|
|||||
|
Cash and cash equivalents, end of year
|
$
|
10.5
|
|
$
|
—
|
|
$
|
—
|
|
||
|
Supplemental disclosure of non-cash activities:
|
|
|
|
||||||||
|
Accretion of deferred purchase obligation
|
19.7
|
|
20.8
|
|
21.8
|
|
|||||
|
Capital contributions to subsidiaries
|
—
|
|
6.2
|
|
22.6
|
|
|||||
|
Stock-based compensation
|
51.4
|
|
43.3
|
|
44.5
|
|
|||||
|
Acquisition and disposal of non-controlling interest
|
—
|
|
2.0
|
|
(11.4
|
)
|
|||||
Background and basis of presentation
DTZ Jersey Holdings Limited (together with its subsidiaries, the “Company”) was formed on August 21, 2014, by investment funds affiliated with TPG Capital, L.P. (“TPG”), PAG Asia Capital Limited (“PAG”) and Ontario Teachers’ Pension Plan (“OTPP”) (collectively, the “Sponsors”). On November 5, 2014, DTZ Jersey Holdings Limited acquired 100% of the combined DTZ group for
$1.1 billion
from UGL Limited (the “DTZ Acquisition”). On September 1, 2015, the Company acquired 100% of C&W Group, Inc. (“Cushman & Wakefield” or “C&W” and also defined as the “C&W Group merger”) for
$1.9 billion
.
On July 6, 2018, the shareholders of DTZ Jersey Holdings Limited exchanged their shares in DTZ Jersey Holdings Limited for interests in newly issued shares of Cushman & Wakefield Limited, a private limited company incorporated in England and Wales (the “Share Exchange”). On July 12, 2018, Cushman & Wakefield Limited reduced the nominal value of each ordinary share issued to
$0.01
(“Capital Reduction”). On July 19, 2018, Cushman & Wakefield Limited re-registered as a public limited company organized under the laws of England and Wales (the “Re-registration”) named Cushman & Wakefield plc
(the “Parent Company”)
. Cushman & Wakefield plc
is a holding company that conducts substantially all of its business operations through its subsidiaries.
The accompanying condensed financial statements include the accounts of the Parent Company and reflect the activity of DTZ Jersey Holdings Limited though the date of the Re-registration. The investments in subsidiaries and affiliates are reported on an equity method basis. Accordingly, these condensed financial statements have been presented on a “parent-only” basis. These parent-only financial statements should be read in conjunction with
Cushman & Wakefield plc's
audited Consolidated Financial Statements included elsewhere herein.
104
The condensed parent-only financial statements have been prepared in accordance with Rule 12-04, Schedule I of Regulation S-X, as the restricted net assets of the subsidiaries of the Company exceed 25% of the consolidated net assets of the Company. The total restricted net assets as of
December 31, 2018
are
$1.2 billion
.
Dividends
The ability of the Parent Company’s operating subsidiaries to pay dividends may be restricted due to the terms of the subsidiaries’ financings agreements (see
Note 9: Long-term Debt and Other Borrowings
). During the fiscal years ended
December 31, 2018
,
2017
and
2016
, the Parent Company’s consolidated subsidiaries did not pay any cash dividends to the Parent Company.
105
Cushman & Wakefield plc
QUARTERLY RESULTS OF OPERATIONS
(Unaudited)
The tables on the following pages set forth certain consolidated statements of operations data for each of our past eight quarters. In management’s view, this information has been presented on the same basis as the audited consolidated financial statements and includes all adjustments, consisting only of normal recurring adjustments and accruals, we consider necessary for a fair presentation. The unaudited consolidated quarterly financial information includes where applicable, retrospective application of accounting standards that became effective in the first quarter of 2018. The unaudited consolidated quarterly financial information should be read in conjunction with our consolidated financial statements. The operating results for any quarter are not necessarily indicative of the results for any future period.
|
|
For the Three Months Ended
|
|||||||||||||
|
(in millions, except per share amounts)
|
March 31, 2018
|
June 30, 2018
|
September 30, 2018
|
December 31, 2018
|
||||||||||
|
Total revenue
|
$
|
1,767.7
|
|
$
|
1,974.3
|
|
$
|
2,076.0
|
|
2,401.9
|
|
|||
|
Operating (loss)/income
|
(81.9
|
)
|
30.6
|
|
20.6
|
|
43.2
|
|
||||||
|
Net loss
|
(92.9
|
)
|
(33.5
|
)
|
(41.4
|
)
|
(18.0
|
)
|
||||||
|
Net loss per share, basic
|
(0.64
|
)
|
(0.23
|
)
|
(0.22
|
)
|
(0.09
|
)
|
||||||
|
Net loss per share, diluted
|
(0.64
|
)
|
(0.23
|
)
|
(0.22
|
)
|
(0.09
|
)
|
||||||
In the fourth quarter of 2018, the Company changed its policy for recognizing stock-based compensation expense for awards with service conditions only from the graded attribution method to the straight-line attribution method. For the three months ended March 31, 2018, June 30, 2018 and September 30, 2018, net loss and net loss per share, basic and diluted, (increased)/decreased by
$(0.9) million
,
$(1.3) million
and
$7.3 million
and
$(0.01)
,
$(0.01)
and
$0.04
, respectively, as a result of the retrospective application of the policy.
|
For the Three Months Ended
|
|||||||||||||||
|
(in millions, except per share amounts)
|
March 31, 2017
|
June 30, 2017
|
September 30, 2017
|
December 31, 2017
|
|||||||||||
|
Total revenue
|
$
|
1,461.3
|
|
$
|
1,700.6
|
|
$
|
1,709.3
|
|
$
|
2,052.7
|
|
|||
|
Operating (loss)/income
|
$
|
(118.2
|
)
|
$
|
(35.6
|
)
|
$
|
(54.5
|
)
|
$
|
37.2
|
|
|||
|
Net (loss) income
|
(117.9
|
)
|
(47.0
|
)
|
(78.6
|
)
|
22.2
|
|
|||||||
|
Net (loss) earnings per share, basic
|
(0.82
|
)
|
(0.33
|
)
|
(0.55
|
)
|
0.15
|
|
|||||||
|
Net (loss) earnings per share, diluted
|
(0.82
|
)
|
(0.33
|
)
|
(0.55
|
)
|
0.14
|
|
|||||||
In the fourth quarter of 2018, the Company changed its policy for recognizing stock-based compensation expense for awards with service conditions only from the graded attribution method to the straight-line attribution method. For the three months ended March 31, 2017, June 30, 2017, September 30, 2017 and December 31, 2017, net (loss)/income and net loss per share, basic and diluted, decreased/(increased) by
$1.7 million
,
$0.4 million
,
$0.0 million
and
$(2.9) million
and
$0.01
,
$0.00
,
$0.00
and
$(0.02)
, respectively, as a result of the retrospective application of the policy.
106
Item 9. Changes in and Disagreements With Accountants on Accounting and Financial Disclosure
None noted.
Item 9A. Controls and Procedures
Disclosure Controls and Procedures
Rule 13a-15 of the Exchange Act requires that we conduct an evaluation of the effectiveness of our disclosure controls and procedures as of the end of the period covered by this Annual Report, and we have a disclosure policy in furtherance of the same. This evaluation is designed to ensure that all corporate disclosure is complete and accurate in all material respects. The evaluation is further designed to ensure that all information required to be disclosed in our SEC reports is accumulated and communicated to management to allow timely decisions regarding required disclosures and recorded, processed, summarized and reported within the time periods and in the manner specified in the SEC’s rules and forms. Any controls and procedures, no matter how well designed and operated, can provide only reasonable assurance of achieving the desired control objectives. Our Chief Executive Officer and Chief Financial Officer supervise and participate in this evaluation, and they are assisted by other members of our Disclosure Committee. Our Disclosure Committee consists of our General Counsel, our Global Head of Investor Relations, our Global Treasurer, our Global Head of Financial Planning and Analysis, our Global Controller, our senior officers of significant business lines and other select employees.
We conducted the required evaluation, and our Chief Executive Officer and Chief Financial Officer have concluded that our disclosure controls and procedures (as defined by Exchange Act Rule 13a-15(e)) were effective as of
December 31, 2018
to accomplish their objectives at the reasonable assurance level.
Changes in Internal Control Over Financial Reporting
There was no change in our internal control over financial reporting that occurred during the quarter ended
December 31, 2018
that has materially affected, or is reasonably likely to materially affect, our internal control over financial reporting.
Management's Report on Internal Control Over Financial Reporting
This annual report does not include a report of management's assessment regarding internal control over financial reporting or an attestation report of the Company's registered public accounting firm due to a transition period established by rule of the SEC for newly public companies.
Item 9B. Other Information
Not applicable.
PART III
Item 10. Directors, Executive Officers and Corporate Governance
The information required by this item is incorporated by reference to the information appearing under the heading "Directors, Executive Officers and Corporate Governance" in Cushman & Wakefield's Proxy Statement for the 2019 Annual Meeting of Shareholders (the "Proxy Statement"), which we will file with the SEC on or before the date that is 120 days after our 2018 fiscal year end.
Item 11. Executive Compensation
The information required by this item is incorporated by reference to the information appearing under the heading "Executive Compensation" in the Proxy Statement for our 2019 Annual Meeting.
Item 12. Security Ownership of Certain Beneficial Owners and Management and Related Stockholder Matters
107
The information required by this item is incorporated by reference to the information appearing under the heading "Security Ownership of Certain Beneficial Owners and Management and Related Stockholder Matters" in the Proxy Statement for our 2019 Annual Meeting.
Item 13. Certain Relationships and Related Transactions, and Director Independence
The information required by this item is incorporated by reference to the information appearing under the heading "Certain Relationships and Related Transactions, and Director Independence" in the Proxy Statement for our 2019 Annual Meeting.
Item 14. Principal Accountant Fees and Services
The information required by this item is incorporated by reference to the information appearing under the heading "Principal Accountant Fees and Services" in the Proxy Statement for our 2019 Annual Meeting.
PART IV
Item 15. Exhibits and Financial Statement Schedules
1. Financial Statements
See Index to Consolidated Financial Statements set forth on page 54.
2
. Financial Statement schedules
See Schedule II on page 109.
3. Exhibits
See Exhibit Index beginning on page 110.
108
Schedule II - Valuation & Qualifying Accounts
|
(in millions)
|
Allowance for Doubtful Accounts
|
|||
|
Balance, December 31, 2015
|
$
|
13.6
|
|
|
|
Charges to expense
|
11.9
|
|
||
|
Write-offs, payments and other
|
3.3
|
|
||
|
Balance, December 31, 2016
|
28.8
|
|
||
|
Charges to expense
|
3.9
|
|
||
|
Write-offs, payments and other
|
2.6
|
|
||
|
Balance, December 31, 2017
|
35.3
|
|
||
|
Charges to expense
|
21.7
|
|
||
|
Write-offs, payments and other
|
(7.5
|
)
|
||
|
Balance, December 31, 2018
|
$
|
49.5
|
|
|
109
|
EXHIBIT INDEX
|
|||
|
Exhibit Number
|
Description of Exhibits
|
Method of Filing
|
|
|
Articles of Association of Cushman & Wakefield plc
|
Incorporated by reference to Exhibit 3.1 to the Company’s Registration Statement on Form S-1 on July 23, 2018
|
||
|
Form of Ordinary Shares Certificate
|
Incorporated by reference to Exhibit 4.1 to the Registrant’s Registration Statement on Form S-1/A filed on July 25, 2018
|
||
|
Registration Rights Agreement, dated as of August 6, 2018, by and among Cushman & Wakefield plc and certain shareholders
|
Incorporated by reference to Exhibit 4.1 to the Form 8-K on August 9, 2018
|
||
|
Joinder Agreement to Registration Rights Agreement, dated as of August 6, 2018, by and between Cushman & Wakefield plc and Vanke Service (HongKong) Co., Limited
|
Incorporated by reference to Exhibit 4.2 to the Form 8-K on August 9, 2018
|
||
|
Shareholders Agreement, dated as of August 6, 2018, by and among Cushman & Wakefield plc and the shareholders party thereto
|
Incorporated by reference to Exhibit 10.1 to the Form 8-K on August 9, 2018
|
||
|
Purchase Agreement by and among Cushman & Wakefield plc and Vanke Service (Hong Kong) Co., Limited dates as of July 24, 2018
|
Incorporated by reference to Exhibit 10.45 to the Registrant’s Registration Statement on Form S-1/A filed on July 30, 2018
|
||
|
Shareholder Agreement, dated as of August 6, 2018, by and among Cushman & Wakefield plc and Vanke Service (HongKong) Co., Limited
|
Incorporated by reference to Exhibit 10.2 to the Registrant’s Current Report on Form 8-K filed on August 9, 2018
|
||
|
Syndicated Facility Agreement (First Lien), dated as of November 4, 2014, among DTZ UK Guarantor Limited, DTZ U.S. Borrower, LLC, DTZ Aus Holdco Pty Limited, UBS AG, Stamford Branch, as Administrative Agent and Collateral Agent, and the lenders party thereto
|
Incorporated by reference to Exhibit 10.1 to the Registrant’s Registration Statement on Form S-1 filed on June 20, 2018
|
||
|
Amendment No. 1 to the First Lien Credit Agreement, dated as of August 13, 2015, by and among DTZ UK Guarantor Limited, DTZ U.S. Borrower, LLC, DTZ Aus Holdco Pty Limited, UBS AG, the Lenders party thereto, the L/C Issuers party thereto and UBS AG, Stamford Branch, as Administrative Agent and Swing Line Lender
|
Incorporated by reference to Exhibit 10.2 to the Registrant’s Registration Statement on Form S-1 filed on June 20, 2018
|
||
|
First Lien Amendment No. 2, dated as of September 1, 2015, by and among DTZ UK Guarantor Limited, DTZ U.S. Borrower, LLC, DTZ Aus Holdco Pty Limited, the 2015-1 Additional Term Lenders party thereto, the 2015-1 Converting Term Lenders party thereto, the 2015-1 Incremental Term Lenders party thereto, the Consenting Revolving Lenders party thereto, the 2015-1 Incremental Revolving Credit Lenders party thereto, each L/C Issuer party thereto, UBS AG, Stamford Branch, as Administrative Agent and Swing Line Lender and, for purposes of Sections 5, 8, 9 and 11 through 15 thereof only, each of the other Loan Parties party as of the date thereof
|
Incorporated by reference to Exhibit 10.3 to the Registrant’s Registration Statement on Form S-1 filed on June 20, 2018
|
||
|
First Lien Amendment No. 3, dated as of December 22, 2015, by and among DTZ UK Guarantor Limited, DTZ U.S. Borrower, LLC, DTZ Aus Holdco Pty Limited, UBS AG, Stamford Branch, as the Incremental Term Lender and Administrative Agent and, for purposes of Sections 4, 8, 9, 10, 11, 12 and 13 thereof only, each of the other Loan Parties party as of the date thereof
|
Incorporated by reference to Exhibit 10.4 to the Registrant’s Registration Statement on Form S-1 filed on June 20, 2018
|
||
|
Amendment No. 4 to the First Lien Credit Agreement, dated as of April 28, 2016, by and among DTZ UK Guarantor Limited, DTZ U.S. Borrower, LLC, DTZ Aus Holdco Pty Limited, the Lenders party thereto, the L/C Issuers party thereto, and UBS AG, Stamford Branch, as Administrative Agent and Swing Line Lender
|
Incorporated by reference to Exhibit 10.5 to the Registrant’s Registration Statement on Form S-1 filed on June 20, 2018
|
||
|
First Lien Amendment No. 5, dated as of June 14, 2016, by and among DTZ UK Guarantor Limited, DTZ U.S. Borrower, LLC, DTZ Aus Holdco Pty Limited, UBS AG, Stamford Branch, as the Incremental Term Lender and Administrative Agent and, for purposes of Sections 4, 8, 9, 10, 11, 12 and 13 thereof only, each of the other Loan Parties party as of the date thereof
|
Incorporated by reference to Exhibit 10.6 to the Registrant’s Registration Statement on Form S-1 filed on June 20, 2018
|
||
|
First Lien Amendment No. 6, dated as of November 14, 2016, by and among DTZ UK Guarantor Limited, DTZ U.S. Borrower, LLC, DTZ Aus Holdco Pty Limited, UBS AG, Stamford Branch, as the Incremental Term Lender and Administrative Agent and, for purposes of Sections 4, 8, 9, 10, 11, 12 and 13 thereof only, each of the other Loan Parties party as of the date thereof
|
Incorporated by reference to Exhibit 10.7 to the Registrant’s Registration Statement on Form S-1 filed on June 20, 2018
|
||
|
Amendment No. 7 to the First Lien Credit Agreement, dated as of November 14, 2016, by and among DTZ UK Guarantor Limited, DTZ U.S. Borrower, LLC, DTZ Aus Holdco Pty Limited, the Lenders party thereto and UBS AG, Stamford Branch, as Administrative Agent
|
Incorporated by reference to Exhibit 10.8 to the Registrant’s Registration Statement on Form S-1 filed on June 20, 2018
|
||
|
First Lien Amendment No. 8, dated as of September 15, 2017, by and among DTZ UK Guarantor Limited, DTZ U.S. Borrower, LLC, DTZ Aus Holdco Pty Limited, the 2022 Revolving Credit Lenders party thereto, the L/C Issuers party thereto, UBS AG, Stamford Branch, as Administrative Agent and Swing Line Lender and, for purposes of Sections 4, 8, 9, 10, 11, 12 and 13 thereof only, each of the other Loan Parties party as of the date thereof
|
Incorporated by reference to Exhibit 10.9 to the Registrant’s Registration Statement on Form S-1 filed on June 20, 2018
|
||
|
Amendment No. 9 to the First Lien Credit Agreement, dated as of September 15, 2017, by and among DTZ UK Guarantor Limited, DTZ U.S. Borrower, LLC, DTZ Aus Holdco Pty Limited, the Lenders party thereto and UBS AG, Stamford Branch, as Administrative Agent
|
Incorporated by reference to Exhibit 10.10 to the Registrant’s Registration Statement on Form S-1 filed on June 20, 2018
|
||
|
First Lien Amendment No. 10, dated as of March 15, 2018, by and among DTZ UK Guarantor Limited, DTZ U.S. Borrower, LLC, DTZ Aus Holdco Pty Limited, UBS AG, Stamford Branch, as the Incremental Term Lender, Administrative Agent and Swing Line Lender, Barclays Bank Plc, Fifth Third Bank and Morgan Stanley Bank, N.A. as the Incremental Revolving Credit Lenders, each L/C Issuer party thereto and, for purposes of Sections 4, 8, 9, 10, 11, 12 and 13 thereof only, each of the other Loan Parties party as of the date thereof
|
Incorporated by reference to Exhibit 10.11 to the Registrant’s Registration Statement on Form S-1 filed on June 20, 2018
|
||
|
Amendment No. 11 to the First Lien Credit Agreement, dated as of March 15, 2018, by and among DTZ UK Guarantor Limited, DTZ U.S. Borrower, LLC, DTZ Aus Holdco Pty Limited, the Lenders party thereto and UBS AG, Stamford Branch, as Administrative Agent
|
Incorporated by reference to Exhibit 10.12 to the Registrant’s Registration Statement on Form S-1 filed on June 20, 2018
|
||
110
|
Syndicated Facility Agreement (Second Lien), dated as of November 4, 2014, among DTZ UK Guarantor Limited, DTZ U.S. Borrower, LLC, DTZ Aus Holdco Pty Limited, Bank of America, N.A., as Administrative Agent and Collateral Agent, and the lenders party thereto
|
Incorporated by reference to Exhibit 10.13 to the Registrant’s Registration Statement on Form S-1 filed on June 20, 2018
|
||
|
Amendment No. 1 to the Second Lien Credit Agreement, dated as of August 13, 2015, by and among DTZ UK Guarantor Limited, DTZ U.S. Borrower, LLC, DTZ Aus Holdco Pty Limited, the Lenders party thereto and Bank of America, N.A., as Administrative Agent
|
Incorporated by reference to Exhibit 10.14 to the Registrant’s Registration Statement on Form S-1 filed on June 20, 2018
|
||
|
Second Lien Amendment No. 2, dated as of September 1, 2015, by and among DTZ UK Guarantor Limited, DTZ U.S. Borrower, LLC, DTZ Aus Holdco Pty Limited, the 2015-2 Incremental Lenders party thereto, Bank of America, N.A., as Administrative Agent and, for purposes of Sections 6 and 9 through 15 thereof only, each of the other Loan Parties as of the date thereof
|
Incorporated by reference to Exhibit 10.15 to the Registrant’s Registration Statement on Form S-1 filed on June 20, 2018
|
||
|
Second Lien Amendment No. 3, dated as of December 22, 2015, by and among DTZ UK Guarantor Limited, DTZ U.S. Borrower, LLC, DTZ Aus Holdco Pty Limited, Bank of America, N.A., as the Incremental Lender and Administrative Agent and, for purposes of Sections 4, 8, 9, 10, 11, 12 and 13 thereof only, each of the other Loan Parties party as of the date thereof
|
Incorporated by reference to Exhibit 10.16 to the Registrant’s Registration Statement on Form S-1 filed on June 20, 2018
|
||
|
Amendment No. 4 to the Second Lien Credit Agreement, dated as of April 28, 2016, by and among DTZ UK Guarantor Limited, DTZ U.S. Borrower, LLC, DTZ Aus Holdco Pty Limited, the Lenders party thereto and Bank of America, N.A., as Administrative Agent
|
Incorporated by reference to Exhibit 10.17 to the Registrant’s Registration Statement on Form S-1 filed on June 20, 2018
|
||
|
Second Lien Amendment No. 5, dated as of May 19, 2017, by and among DTZ UK Guarantor Limited, DTZ U.S. Borrower, LLC, DTZ Aus Holdco Pty Limited, Owl Rock Capital Corporation and Owl Rock Capital Corporation II, as the Incremental Lenders and Bank of America, N.A., as Administrative Agent and, for purposes of Sections 4, 8, 9, 10, 11, 12 and 13 thereof only, each of the other Loan Parties party as of the date thereof
|
Incorporated by reference to Exhibit 10.18 to the Registrant’s Registration Statement on Form S-1 filed on June 20, 2018
|
||
|
Credit Agreement, dated as of August 21, 2018, by and among DTZ U.S. Borrower, LLC, DTZ UK Guarantor Limited and JPMorgan Chase Bank, N.A., as Administrative Agent, Collateral Agent, Issuing Bank and Swing Line Lender, and the other lenders party thereto
|
Incorporated by reference to Exhibit 10.3 to the Registrant’s Quarterly Report on Form 10-Q filed on September 6, 2018
|
||
|
Agreement for the Provision of Depositary Services and Custody Services, dated as of July 6, 2018, in respect of Cushman & Wakefield Limited Depositary Receipts among Computershare Trust Company, N.A., Cushman & Wakefield Limited, FTL Nominees 1 Limited, FTL Nominees 2 Limited and other Holders of Depositary Receipts
|
Incorporated by reference to Exhibit 10.23 to the Registrant’s Registration Statement on Form S-1/A filed on July 13, 2018
|
||
|
Form of Deed of Indemnity for Directors *
|
Incorporated by reference to Exhibit 10.19 to the Registrant’s Registration Statement on Form S-1/A filed on July 13, 2018
|
||
|
Form of Deed of Indemnity for Officers *
|
Incorporated by reference to Exhibit 10.20 to the Registrant’s Registration Statement on Form S-1/A filed on July 13, 2018
|
||
|
Form of Non-executive Director Appointment Letter *
|
Incorporated by reference to Exhibit 10.21 to the Registrant’s Registration Statement on Form S-1/A filed on July 13, 2018
|
||
|
Cushman & Wakefield plc 2018 Omnibus Management Share and Cash Incentive Plan, effective as of June 19, 2018 *
|
Incorporated by reference to Exhibit 10.24 to the Registrant’s Registration Statement on Form S-1/A filed on July 23, 2018
|
||
|
Form of Restricted Stock Unit Grant Agreement*
|
Incorporated by reference to Exhibit 10.2 to the Registrant’s Quarterly Report on Form 10-Q filed on September 6, 2018
|
||
|
Cushman & Wakefield plc 2018 Omnibus Non-Employee Director Share and Cash Incentive Plan, effective as of June 19, 2018 *
|
Incorporated by reference to Exhibit 10.25 to the Registrant’s Registration Statement on Form S-1/A filed on July 23, 2018
|
||
|
DTZ Jersey Holdings Limited Management Equity Incentive Plan, amended and restated effective as of January 7, 2016 *
|
Incorporated by reference to Exhibit 10.26 to the Registrant’s Registration Statement on Form S-1/A filed on July 13, 2018
|
||
|
Form of 2018 Stock Option Award Agreement under the DTZ Jersey Holdings Limited Management Equity Incentive Plan *
|
Incorporated by reference to Exhibit 10.27 to the Registrant’s Registration Statement on Form S-1/A filed on July 13, 2018
|
||
|
Form of Pre-2018 Stock Option Award Agreement under the DTZ Jersey Holdings Limited Management Equity Incentive Plan *
|
Incorporated by reference to Exhibit 10.28 to the Registrant’s Registration Statement on Form S-1/A filed on July 13, 2018
|
||
|
Form of Offer to Amend Certain Outstanding Stock Options in connection with the DTZ Jersey Holdings Limited Management Equity Incentive Plan *
|
Incorporated by reference to Exhibit 10.29 to the Registrant’s Registration Statement on Form S-1/A filed on July 13, 2018
|
||
|
Form of DTZ Jersey Holdings Limited Restricted Stock Unit Grant Agreement *
|
Incorporated by reference to Exhibit 10.30 to the Registrant’s Registration Statement on Form S-1/A filed on July 13, 2018
|
||
|
Form of Bonus Deferral and Co-Investment Restricted Stock Unit Grant Letter Agreement *
|
Incorporated by reference to Exhibit 10.31 to the Registrant’s Registration Statement on Form S-1/A filed on July 13, 2018
|
||
|
Form of DTZ Jersey Holdings Limited Management Stockholders’ Agreement *
|
Filed herewith
|
||
|
Form of Trust Over Shares and Nominee Shareholder Agreement *
|
Incorporated by reference to Exhibit 10.33 to the Registrant’s Registration Statement on Form S-1/A filed on July 13, 2018
|
||
|
Cushman & Wakefield, Inc. Executive Employee Severance Plan, effective June 14, 2018 *
|
Incorporated by reference to Exhibit 10.34 to the Registrant’s Registration Statement on Form S-1/A filed on July 23, 2018
|
||
|
Amended and Restated Employment Agreement between Brett White, Cushman & Wakefield Global, Inc. and DTZ Jersey Holdings Limited, dated June 8, 2018 *
|
Incorporated by reference to Exhibit 10.35 to the Registrant’s Registration Statement on Form S-1/A filed on July 13, 2018
|
||
|
Option Grant Agreement between Brett White and DTZ Jersey Holdings Limited, dated May 8, 2015 *
|
Incorporated by reference to Exhibit 10.36 to the Registrant’s Registration Statement on Form S-1/A filed on July 13, 2018
|
||
|
Restricted Stock Unit Grant Agreement between Brett White and DTZ Jersey Holdings Limited, dated May 8, 2015 *
|
Incorporated by reference to Exhibit 10.37 to the Registrant’s Registration Statement on Form S-1/A filed on July 13, 2018
|
||
|
Restricted Stock Unit Grant Agreement between Brett White and DTZ Jersey Holdings Limited, dated May 8, 2015 *
|
Incorporated by reference to Exhibit 10.38 to the Registrant’s Registration Statement on Form S-1/A filed on July 13, 2018
|
||
|
Restricted Stock Unit Grant Agreement between Brett White and DTZ Jersey Holdings Limited, dated October 5, 2015 *
|
Incorporated by reference to Exhibit 10.39 to the Registrant’s Registration Statement on Form S-1/A filed on July 13, 2018
|
||
111
|
Form of Restricted Stock Unit Grant Agreement for grants in 2018, 2019 and 2020 between Brett White and DTZ Jersey Holdings Limited *
|
Incorporated by reference to Exhibit 10.40 to the Registrant’s Registration Statement on Form S-1/A filed on July 13, 2018
|
||
|
Side Letter between Brett White and Cushman & Wakefield Global, Inc., dated June 8, 2018 *
|
Incorporated by reference to Exhibit 10.41 to the Registrant’s Registration Statement on Form S-1/A filed on July 13, 2018.
|
||
|
Employment Agreement between Duncan Palmer and DTZ US NewCo, Inc., dated March 16, 2015 *
|
Incorporated by reference to Exhibit 10.42 to the Registrant’s Registration Statement on Form S-1/A filed on July 13, 2018
|
||
|
Side Letter between Brett White and Cushman & Wakefield Global, Inc., dated November 19, 2018 *
|
Filed herewith
|
||
|
Employment Agreement between John Forrester and Cushman & Wakefield Debenham Tie Leung Limited dated February 19, 2019*
|
Filed herewith
|
||
|
Preferability Letter Regarding Change in Accounting Principle dated February 28, 2019 from KPMG LLP
|
Filed herewith
|
||
|
List of subsidiaries
|
Filed herewith
|
||
|
Consent of KPMG US LLP, Independent Registered Public Accounting Firm
|
Filed herewith
|
||
|
Certification by Chief Executive Officer pursuant to Rule 13a-14(a) or Rule 15d-14(a) of the Securities Exchange Act of 1934 and Section 302 of the Sarbanes-Oxley Act of 2002
|
Filed herewith
|
||
|
Certification by Chief Financial Officer pursuant to Rule 13a-14(a) or Rule 15d-14(a) of the Securities Exchange Act of 1934 and Section 302 of the Sarbanes-Oxley Act of 2002
|
Filed herewith
|
||
|
Certification of Chief Executive Officer pursuant to 18 U.S.C. Section 1350, as adopted pursuant to Section 906 of the Sarbanes-Oxley Act of 2002
|
Furnished herewith
|
||
|
Certification of Chief Financial Officer Pursuant to 18 U.S.C. Section 1350 as adopted pursuant to Section 906 of the Sarbanes-Oxley Act of 2002
|
Furnished herewith
|
||
|
101.INS
|
XBRL Instance Document
|
||
|
101.SCH
|
XBRL Taxonomy Extension Schema Document
|
||
|
101.CAL
|
XBRL Taxonomy Extension Calculation Linkbase Document
|
||
|
101.DEF
|
XBRL Taxonomy Extension Definition Linkbase Document
|
||
|
101.LAB
|
XBRL Taxonomy Extension Label Linkbase Document
|
||
|
101.PRE
|
XBRL Taxonomy Extension Presentation Linkbase Document
|
||
|
*
|
Management contract or compensatory plan
|
||
112
Signatures
Pursuant to the requirements of the Securities Exchange Act of 1934, as amended, the registrant has duly caused this report to be signed on its behalf by the undersigned thereunto duly authorized.
|
CUSHMAN & WAKEFIELD plc
|
|||||
|
/s/ Brett White
|
|||||
|
Brett White
|
|||||
|
Director, Executive Chairman and Chief Executive Officer
|
|||||
|
February 28, 2019
|
|||||
|
Pursuant to the requirements of the Securities Exchange Act of 1934, as amended, this report has been signed below by the following persons on behalf of the registrant an in the capacities and on the date indicated
|
|||||
|
Signature
|
Title
|
Date
|
|||
|
/s/ Brett White
|
Director, Executive Chairman and Chief Executive Officer (Principal Executive Officer and Authorized Representative in the United States)
|
February 28, 2019
|
|||
|
Brett White
|
|||||
|
/s/ Duncan Palmer
|
Chief Financial Officer (Principal Financial and Accounting Officer)
|
February 28, 2019
|
|||
|
Duncan Palmer
|
|||||
|
/s/ Qi Chen
|
Director
|
February 28, 2019
|
|||
|
Qi Chen
|
|||||
|
/s/ Jonathan Coslet
|
Director
|
February 28, 2019
|
|||
|
Jonathan Coslet
|
|||||
|
/s/ Timothy Dattels
|
Director
|
February 28, 2019
|
|||
|
Timothy Dattels
|
|||||
|
/s/ Michelle MacKay
|
Director
|
February 28, 2019
|
|||
|
Michelle MacKay
|
|||||
|
/s/ Jodie McLean
|
Director
|
February 28, 2019
|
|||
|
Jodie McLean
|
|||||
|
/s/ Lincoln Pan
|
Director
|
February 28, 2019
|
|||
|
Lincoln Pan
|
|||||
|
/s/ Rajeev Ruparelia
|
Director
|
February 28, 2019
|
|||
|
Rajeev Ruparelia
|
|||||
|
/s/ Billie Williamson
|
Director
|
February 28, 2019
|
|||
|
Billie Williamson
|
|||||
113
TABLE OF CONTENTS
Part IItem 1. Business OverviewItem 1A. Risk FactorsItem 1B. Unresolved Staff CommentsItem 2. PropertiesItem 3. Legal ProceedingsNote 14: Commitments and ContingenciesItem 4. Mine Safety DisclosuresPart IIItem 5. Market For The Registrant's Common Equity, Related Stockholder Matters and Issuer Purchases Of Equity SecuritiesItem 6. Selected Financial DataItem 7. Management's Discussion and Analysis Of Financial Condition and Results Of OperationsNote 2: Summary Of Significant Accounting PoliciesNote 5: RevenueNote 1: Organization and Business OverviewNote 6: Goodwill and Other Intangible AssetsNote 12: Income TaxesNote 10: Stock-based PaymentsNote 9: Long-term Debt and Other BorrowingsNote 10: Employee BenefitsNote 17: Accounts Receivable SecuritizationNote 8: Derivative Financial Instruments and Hedging ActivitiesItem 7A. Quantitative and Qualitative Disclosures About Market RiskItem 8. Financial Statements and Supplementary DataNote 16: Fair Value MeasurementsNote 13: Stock-based PaymentsNote 18: Supplemental Cash Flow InformationNote 3: Segment DataNote 4: Earnings Per ShareNote 7: Property and EquipmentNote 11: RestructuringNote 15: Related Party TransactionsNote 19: Subsequent EventsNote 20: Parent Company InformationItem 9. Changes in and Disagreements with Accountants on Accounting and Financial DisclosureItem 9A. Controls and ProceduresItem 9B. Other InformationPart IIIItem 10. Directors, Executive Officers and Corporate GovernanceItem 11. Executive CompensationItem 12. Security Ownership Of Certain Beneficial Owners and Management and Related Stockholder MattersItem 13. Certain Relationships and Related Transactions, and Director IndependenceItem 14. Principal Accountant Fees and ServicesPart IVItem 15. Exhibits and Financial Statement Schedules