CASELLA WASTE SYSTEMS INC
10-Ks and 10-Qs
|
|
|
|
|
|
|
|
|
|
|
|
|
|
|
|
|
|
|
|
|
|
|
|
|
|
|
|
|
|
|
|
|
|
|
|
|
|
|
|
|
|
|
|
|
|
|
|
|
|
|
|
|
|
|
|
SECURITIES AND EXCHANGE COMMISSION
Washington, D.C. 20549
____________________________________________________
FORM 10-K
____________________________________________________
(Mark One)
|
x
|
ANNUAL REPORT PURSUANT TO SECTION 13 OR 15(d) OF THE SECURITIES EXCHANGE ACT OF 1934
|
For the fiscal year ended
December 31, 2018
Or
|
¨
|
TRANSITION REPORT PURSUANT TO SECTION 13 OR 15(d) OF THE SECURITIES EXCHANGE ACT OF 1934
|
For the transition period from
to
Commission file number 000-23211
____________________________________________________
CASELLA WASTE SYSTEMS, INC.
(Exact name of registrant as specified in its charter)
____________________________________________________
|
Delaware
|
|
03-0338873
|
|
(State or other jurisdiction of
incorporation or organization)
|
|
(I.R.S. Employer
Identification No.)
|
|
25 Greens Hill Lane, Rutland, VT
|
|
05701
|
|
(Address of principal executive offices)
|
|
(Zip Code)
|
Registrant’s telephone number, including area code: (802) 775-0325
Securities registered pursuant to Section 12(b) of the Act:
|
Title of each class
|
|
Name of each exchange on which registered
|
|
Class A common stock, $.01 per share par value
|
|
The NASDAQ Stock Market LLC
(NASDAQ Global Select Market)
|
Securities registered pursuant to Section 12(g) of the Act:
None.
Indicate by check mark if the registrant is a well-known seasoned issuer, as defined in Rule 405 of the Securities Act. Yes
x
No
¨
Indicate by check mark if the registrant is not required to file reports pursuant to Section 13 or Section 15(d) of the Act. Yes
¨
No
x
Indicate by checkmark whether the registrant (1) has filed all reports required to be filed by Section 13 or 15(d) of the Securities Exchange Act of 1934 during the preceding 12 months (or for such shorter period that the registrant was required to file such reports), and (2) has been subject to such filing requirements for the past 90 days. Yes
x
No
¨
Indicate by check mark whether the registrant has submitted electronically every Interactive Data File required to be submitted pursuant to Rule 405 of Regulation S-T (§232.405 of this chapter) during the preceding 12 months (or for such shorter period that the registrant was required to submit such files). Yes
x
No
¨
Indicate by check mark if disclosure of delinquent filers pursuant to Item 405 of Regulation S-K (§ 229.405 of this chapter) is not contained herein, and will not be contained, to the best of registrant’s knowledge, in definitive proxy or information statements incorporated by reference in Part III of this Form 10-K or any amendment to this Form 10-K.
¨
Indicate by check mark whether the registrant is a large accelerated filer, an accelerated filer, a non-accelerated filer, a smaller reporting company, or an emerging growth company. See the definitions of “large accelerated filer,” “accelerated filer,” “smaller reporting company," and "emerging growth company” in Rule 12b-2 of the Exchange Act.
|
Large accelerated filer
|
|
x
|
|
Accelerated filer
|
|
¨
|
|
Non-accelerated filer
|
|
¨
|
|
Smaller reporting company
|
|
¨
|
|
Emerging growth company
|
¨
|
|||||
If an emerging growth company, indicate by check mark if the registrant has elected not to use the extended transition period for complying with any new or revised financial accounting standards provided pursuant to Section 13(a) of the Act.
¨
Indicate by check mark whether the registrant is a shell company (as defined in Rule 12b-2 of the Exchange Act). Yes
¨
No
x
The aggregate market value of the common equity held by non-affiliates of the registrant, based on the last reported sale price of the registrant’s Class A common stock on the NASDAQ Stock Market at the close of business on June 29,
2018
was approximately $1,017 million. The registrant does not have any non-voting common stock outstanding.
There were 45,510,572 shares of Class A common stock, $.01 par value per share, of the registrant outstanding at
February 14, 2019
. There were 988,200 shares of Class B common stock, $.01 par value per share, of the registrant outstanding at
February 14, 2019
.
Documents Incorporated by Reference
Part III of this Annual Report on Form 10-K incorporates by reference information from the definitive Proxy Statement for the registrant’s
2019
Annual Meeting of Stockholders or a Form10-K/A to be filed with the Securities and Exchange Commission not later than 120 days after the registrant’s fiscal year ended
December 31, 2018
.
|
|
||||
CASELLA WASTE SYSTEMS, INC.
ANNUAL REPORT ON FORM 10-K
TABLE OF CONTENTS
|
ITEM 1.
|
||
|
ITEM 1A.
|
||
|
ITEM 1B.
|
||
|
ITEM 2.
|
||
|
ITEM 3.
|
||
|
ITEM 4.
|
||
|
ITEM 5.
|
||
|
ITEM 6.
|
||
|
ITEM 7.
|
||
|
ITEM 7A.
|
||
|
ITEM 8.
|
||
|
ITEM 9.
|
||
|
ITEM 9A.
|
||
|
ITEM 9B.
|
||
|
ITEM 10.
|
||
|
ITEM 11.
|
||
|
ITEM 12.
|
||
|
ITEM 13.
|
||
|
ITEM 14.
|
||
|
ITEM 15.
|
||
|
ITEM 16.
|
||
PART I
Unless the context requires otherwise, all references in this Annual Report on Form 10-K to “Casella Waste Systems, Inc.”, “Casella”, the “Company”, “we”, “us” or “our” refer to Casella Waste Systems, Inc. and its consolidated subsidiaries.
Forward-Looking Statements
This Annual Report on Form 10-K contains or incorporates a number of forward-looking statements within the meaning of Section 27A of the Securities Act of 1933, as amended, and Section 21E of the Exchange Act of 1934, as amended, including statements regarding:
|
•
|
expected liquidity and financing plans;
|
|
•
|
expected future revenues, operations, expenditures and cash needs;
|
|
•
|
fluctuations in the commodity pricing of our recyclables, increases in landfill tipping fees and fuel costs and general economic and weather conditions;
|
|
•
|
projected future obligations related to final capping, closure and post-closure costs of our existing landfills and any disposal facilities which we may own or operate in the future;
|
|
•
|
our ability to use our net operating losses and tax positions;
|
|
•
|
our ability to service our debt obligations;
|
|
•
|
the projected development of additional disposal capacity or expectations regarding permits for existing capacity;
|
|
•
|
the recoverability or impairment of any of our assets or goodwill;
|
|
•
|
estimates of the potential markets for our products and services, including the anticipated drivers for future growth;
|
|
•
|
sales and marketing plans or price and volume assumptions;
|
|
•
|
the outcome of any legal or regulatory matter;
|
|
•
|
potential business combinations or divestitures; and
|
|
•
|
projected improvements to our infrastructure and the impact of such improvements on our business and operations.
|
In addition, any statements contained in or incorporated by reference into this report that are not statements of historical fact should be considered forward-looking statements. You can identify these forward-looking statements by the use of the words “believes”, “expects”, “anticipates”, “plans”, “may”, “will”, “would”, “intends”, “estimates” and other similar expressions, whether in the negative or affirmative. These forward-looking statements are based on current expectations, estimates, forecasts and projections about the industry and markets in which we operate, as well as management’s beliefs and assumptions, and should be read in conjunction with our consolidated financial statements and notes thereto. We cannot guarantee that we actually will achieve the plans, intentions or expectations disclosed in the forward-looking statements made. The occurrence of the events described and the achievement of the expected results depends on many events, some or all of which are not predictable or within our control. Actual results may differ materially from those set forth in the forward-looking statements.
There are a number of important risks and uncertainties that could cause our actual results to differ materially from those indicated by such forward-looking statements. These risks and uncertainties include, without limitation, those detailed in Item 1A, “
Risk Factors
” of this Annual Report on Form 10-K. We explicitly disclaim any obligation to update any forward-looking statements whether as a result of new information, future events or otherwise, except as otherwise required by law.
ITEM 1. BUSINESS
Overview
Founded in 1975 with a single truck, Casella Waste Systems, Inc. is a regional, vertically integrated solid waste services company. We provide resource management expertise and services to residential, commercial, municipal and industrial customers, primarily in the areas of solid waste collection and disposal, transfer, recycling and organics services. We provide integrated solid waste services in six states: Vermont, New Hampshire, New York, Massachusetts, Maine and Pennsylvania, with our headquarters located in Rutland, Vermont. We manage our solid waste operations on a geographic basis through two regional operating segments, the Eastern and Western regions, each of which provides a full range of solid waste services, and our larger-scale recycling and commodity brokerage operations through our Recycling segment. Organics services, ancillary operations, along with major account and industrial services, are included in our Other segment.
3
As of
January 31, 2019
, we owned and/or operated
37
solid waste collection operations,
49
transfer stations,
18
recycling facilities,
eight
Subtitle D landfills,
four
landfill gas-to-energy facilities and
one
landfill permitted to accept construction and demolition ("C&D") materials.
Strategy
Our goal is to build a sustainable and profitable company by providing exemplary service to our customers, while operating safe and environmentally sound facilities. Over the last several years, many of our customers have been seeking to reduce their environmental footprint by increasing their recycling rates, diverting organic materials out of the waste stream into beneficial use processes and exploring emerging methods to transform traditional waste streams into renewable resources. Since we first began operating in Vermont in 1975, our business strategy has been firmly tied to creating a sustainable resource management model and we continue to be rooted in these same tenets today. We strive to create long-term value for all of our stakeholders, including customers, employees, communities and shareholders.
Our primary objective is to maximize long-term shareholder value through a combination of financial performance and strategic asset positioning. Annually, we complete a comprehensive strategic planning process to assess and refine our strategic objectives in the context of our asset mix and the current market environment. This process helps the management team allocate resources to a range of business opportunities with the goal to maximize long-term financial returns and competitive positioning.
In early August 2017, we announced an updated long-term strategic plan through our fiscal year ending December 31, 2021 (the “2021 Plan”). The 2021 Plan remains focused on enhancing shareholder returns by improving cash flows and reducing debt leverage through the following strategic initiatives:
|
•
|
Increasing landfill returns by driving pricing in excess of inflation in the disposal capacity constrained markets in the Northeast and working to maximize capacity utilization.
|
|
•
|
Driving additional profitability in our collection operations through profitable revenue growth and operating efficiencies.
|
|
•
|
Creating incremental value through our resource solutions offerings in our recycling, organics, and customer solutions operations.
|
|
•
|
Using technology to drive profitable growth and efficiencies through our efforts to update key systems to drive back office transformation, operating efficiencies and sales force effectiveness.
|
|
•
|
Allocating capital to balance debt delevering with smart growth through continued capital discipline and selective acquisitions of complementary businesses and assets.
|
To support our efforts, we continue to invest in our employees through leadership development, our new career paths program, technical training, and incentive compensation structures that seek to align our employees’ incentives with our long-term goal to improve cash flows and returns on invested capital.
Increasing Landfill Returns
Disposal capacity continues to tighten in the Northeast market as permanent site closures are reducing capacity and stronger economic and construction activity are driving higher volumes. Given this supply-demand imbalance and the positioning of our assets, we were able to advance landfill pricing by 4.1% (or average price per ton by 6.4%) for the fiscal year ended December 31, 2018 ("fiscal year 2018").
We believe that this positive pricing backdrop will continue as additional site closures are expected over the next several years, and as we reset multi-year contracts we expect to advance pricing in excess of Consumer Price Index on a larger percentage of our inbound waste streams.
On the landfill development side, we continue to advance key permitting activities across our landfills to increase annual capacity limits at select sites and expand total permitted capacity across our footprint. We have been successful in advancing permit increases at Subtitle D landfills located in Angelica, New York (“Hyland Landfill”), Seneca, New York ("Ontario County Landfill"), Chemung, New York ("Chemung County Landfill"), West Old Town, Maine ("Juniper Ridge Landfill"), and Schuyler Falls, New York (“Clinton County Landfill”) over the last three years. Cumulatively, these efforts have added 462 thousand tons per year of permitted capacity and approximately 33.3 million cubic yards of permitted airspace.
Driving Additional Profitability in Collection Operations
4
Collection pricing was up 5.3% for fiscal year 2018, as compared to the fiscal year ended December 31, 2017 ("fiscal year 2017"), with sustained execution against our strategic pricing programs. On the operating side, we continue to advance several key areas, including route optimization, fleet standardization, and maintenance programs to further reduce our operating costs in the collection line-of-business. We are in the fourth year of our comprehensive fleet plan, which is designed to optimize our fleet and target truck replacements to maximize returns, reduce our operating expenses through lower maintenance costs, and improve our service levels through reduced down times.
The combination of these operating advancements and pricing programs are driving improved results in our collection line-of-business, with our cost of operations as a percentage of revenues down approximately 620 basis points from the twelve months ended December 31, 2014 to fiscal year 2018.
Creating Incremental Value Through Resource Solutions
One of the key objectives of our strategy is to differentiate ourselves in the marketplace by offering value-added resource solutions to our customers. These solutions range from our customer solutions business, which provides professional services to large industrial customers, to our organics business, which is a leader in organics processing and disposal in the Northeast, and to our large scale, technology-driven recycling business.
Our customer solutions business has continued to improve margins and returns through December 31, 2018, as we further transformed the business from the legacy brokerage model to a professional services organization focused on providing resource solutions to large industrial and institutional accounts.
Over the last two years, we have worked to reshape our recycling business model to drive higher returns in all market cycles and reduce exposure to recycling commodity volatility. We have accomplished much of this goal by restructuring several third-party processing contracts to limit downside risk through processing fees and with the implementation of our Sustainability Recycling Adjustment Fee (“SRA Fee”) for our collection customers. The SRA Fee floats inversely to changes in recycling commodity prices. Our risk mitigation programs have offset most of the recent commodity price declines driven primarily by China’s National Sword program that banned the import of certain recycled materials and imposed strict new contamination standards for others, and we expect these programs to continue to reduce our commodity risk exposure.
Using Technology to Drive Profitable Growth and Efficiencies
We launched a new 5-year technology plan in August 2017 to drive profitable growth and reduce our general and administration costs by 75 to 100 basis points as a percentage of revenues by 2021. We plan to focus our efforts on improving our overall technology platform, driving salesforce effectiveness, and increasing efficiencies in our back-office and across our operations.
To date as part of our technology plan, we have successfully implemented the Microsoft Dynamics CRM system to help manage and drive higher salesforce effectiveness, and we have successfully implemented the cloud-based NetSuite ERP system as the new financial backbone to our business.
Allocating Capital to Balance Debt Delevering with Smart Growth
Over the last five years we made significant progress in simplifying our business structure, improving cash flows and reducing risk exposure by: (1) divesting, or in certain cases, closing underperforming operations that did not enhance or complement our core operations; (2) refinancing debt to lower interest costs and improve financial flexibility; and (3) adhering to strict capital discipline and debt repayment.
Given our progress in each area and as part of the 2021 Plan, we shifted our capital strategy to use our capital in a manner that balances continued delevering with smart acquisition and development growth. As part of this new strategy, we set a goal of adding $20 million to $40 million per year of annualized revenues through acquisition or development activity. We believe that acquisition or development activity should be opportunistic, and we plan to strictly adhere to our disciplined capital return hurdles and rigorous review process.
We have made significant progress ramping up our strategic growth initiative, as we have acquired ten solid waste collection and transfer businesses during fiscal year 2018, with approximately $77 million of annualized revenues. Since September 30, 2018, we have acquired five solid waste collection and transfer businesses with approximately $28 million of annualized revenues. We expect revenue growth of approximately $40 million in 2019 from the impact of including a full year of revenue from acquisitions completed in 2018, but which contributed to our revenues for only part of the year in 2018.
We are focused on acquiring well-run businesses in strategic markets across our footprint that will drive additional internalization to our landfills and operating synergies. We are also focused on more effectively optimizing waste placement around the northeast as the ever-tightening disposal market is creating additional opportunities to source new volumes at higher prices.
5
Operational Overview
Our solid waste and recycling operations comprise a full range of non-hazardous solid waste services, including collections, transfer stations, material recovery facilities ("MRFs") and disposal facilities.
Collections.
A majority of our commercial and industrial collection services are performed under one-to-five year service agreements, with prices and fees determined by such factors as: collection frequency; type of equipment and containers furnished; type, volume and weight of solid waste collected; distance to the disposal or processing facility; and cost of disposal or processing. Our residential collection and disposal services are performed either on a subscription basis (with no underlying contract) with individuals, or through contracts with municipalities, homeowner associations, apartment building owners or mobile home park operators.
Transfer Stations.
Our transfer stations receive, compact and transfer solid waste, collected primarily by our various residential and commercial collection operations, for transport to disposal facilities by larger vehicles. We believe that transfer stations benefit us by: (1) increasing the size of the wastesheds which have access to our landfills; (2) reducing costs by improving utilization of collection personnel and equipment; and (3) helping us build relationships with municipalities and other customers by providing a local physical presence and enhanced local service capabilities.
Material Recovery Facilities.
Our MRFs receive, sort, bale and sell recyclable materials originating from the municipal solid waste stream, including newsprint, cardboard, office paper, glass, plastic, steel or aluminum containers and bottles. We operate eight large-scale, high volume MRFs within our Recycling region in geographic areas served by our collection divisions. Revenues are received from municipalities and customers in the form of processing fees, tipping fees and commodity sales. These MRFs, three of which are located in New York, two of which are located in Vermont, two of which are located in Massachusetts, and one of which is located in Maine, process over 0.5 million tons per year of recycled materials delivered to them by municipalities and commercial customers under long-term contracts. We also operate smaller MRFs, which generally process recyclables collected from our various residential collection operations.
Landfills.
We operate eight solid waste Subtitle D landfills and one landfill permitted to accept C&D materials. Revenues are received from municipalities and other customers in the form of tipping fees. The estimated capacity at our landfills is subject to change based on engineering factors, requirements of regulatory authorities, our ability to continue to operate our landfills in compliance with applicable regulations and our ability to successfully renew operating permits and obtain expansion permits at our sites.
The following table (in thousands) reflects the aggregate landfill capacity and airspace changes, in tons, for landfills we operated during fiscal years
2018
,
2017
and
2016
:
|
|
Fiscal Year 2018
|
Fiscal Year 2017
|
Fiscal Year 2016
|
|||||||||||||||||||||||
|
|
Estimated
Remaining
Permitted
Capacity
(1)
|
Estimated
Additional
Permittable
Capacity
(1)(2)
|
Estimated
Total
Capacity
|
Estimated
Remaining
Permitted
Capacity
(1)
|
Estimated
Additional
Permittable
Capacity
(1)(2)
|
Estimated
Total
Capacity
|
Estimated
Remaining
Permitted
Capacity
(1)
|
Estimated
Additional
Permittable
Capacity
(1)(2)
|
Estimated
Total
Capacity
|
|||||||||||||||||
|
Balance, beginning of year
|
36,159
|
|
46,301
|
|
82,460
|
|
31,022
|
|
59,089
|
|
90,111
|
|
23,208
|
|
74,443
|
|
97,651
|
|
||||||||
|
Permits granted (3)
|
—
|
|
—
|
|
—
|
|
9,273
|
|
(9,273
|
)
|
—
|
|
11,859
|
|
(11,859
|
)
|
—
|
|
||||||||
|
Airspace consumed
|
(4,160
|
)
|
—
|
|
(4,160
|
)
|
(3,958
|
)
|
—
|
|
(3,958
|
)
|
(3,899
|
)
|
—
|
|
(3,899
|
)
|
||||||||
|
Changes in engineering estimates (4)
|
3,811
|
|
752
|
|
4,563
|
|
(178
|
)
|
(3,515
|
)
|
(3,693
|
)
|
(146
|
)
|
(3,495
|
)
|
(3,641
|
)
|
||||||||
|
Balance, end of year
|
35,810
|
|
47,053
|
|
82,863
|
|
36,159
|
|
46,301
|
|
82,460
|
|
31,022
|
|
59,089
|
|
90,111
|
|
||||||||
|
(1)
|
We convert estimated remaining permitted capacity and estimated additional permittable capacity from cubic yards to tons generally by assuming a compaction factor derived from historical average compaction factors, with modification for future anticipated changes. In addition to a total capacity limit, certain permits place a daily and/or annual limit on capacity.
|
|
(2)
|
Represents capacity which we have determined to be “permittable” in accordance with the following criteria: (i) we control the land on which the expansion is sought; (ii) all technical siting criteria have been met or a variance has been obtained or is reasonably expected to be obtained; (iii) we have not identified any legal or political impediments which we believe will not be resolved in our favor; (iv) we are actively working on obtaining any necessary permits and we expect that all required permits will be received; and (v) senior management has approved the project.
|
6
|
(3)
|
The increase in remaining permitted airspace capacity in the fiscal year 2017 was the result of a permit received at the Juniper Ridge Landfill in our Eastern region. The increase in remaining permitted airspace capacity in the fiscal year ended December 31, 2016 ("fiscal year 2016") was a result of the receipt of expansion permits at Ontario County Landfill and the Chemung County Landfill in our Western region.
|
|
(4)
|
The variation in changes in airspace capacity associated with engineering estimates are primarily the result of changes in compaction at our landfills and estimated airspace changes associated with design changes at certain of our landfills, which in fiscal year 2017 includes the impact associated with the decision to close the Southbridge Landfill.
|
Eastern Region
NCES Landfill.
The North Country Environmental Services landfill is a Subtitle D landfill located in Bethlehem, New Hampshire ("NCES Landfill") that we purchased in 1994. NCES Landfill currently consists of approximately 50 acres of permitted or permittable landfill area, is permitted to accept municipal solid waste, C&D material and certain pre-approved special waste and has no annual tonnage limitations. In fiscal year 2017, NCES Landfill entered into an agreement for the construction of a landfill gas-to-energy plant, which will be constructed, owned and operated by a third-party.
Juniper Ridge Landfill.
The Juniper Ridge Landfill is a Subtitle D landfill located in West Old Town, Maine. In 2004, we completed transactions with the State of Maine and Georgia-Pacific Corporation (“Georgia Pacific”), pursuant to which the State of Maine took ownership of Juniper Ridge Landfill, formerly owned by Georgia Pacific, and we became the operator under a 30-year operating and services agreement between us and the State of Maine. Juniper Ridge Landfill currently consists of approximately 179 acres of permitted or permittable landfill area, which is sufficient to permit the additional airspace required for the term of the 30-year operating and services agreement, and is permitted to accept the following waste originating from the State of Maine: up to 0.1 million tons of municipal solid waste per year through March 2020, and C&D material, ash from municipal solid waste incinerators and fossil fuel boilers, front end processed residuals and bypass municipal solid waste from waste-to-energy facilities and certain pre-approved special waste. Outside of the limitations on municipal solid waste, there are no annual tonnage limitations at Juniper Ridge Landfill.
Closure Projects.
In 2005, we started closure operations at the Worcester, Massachusetts landfill ("Worcester Landfill"). These closure operations were completed in April 2014 when Worcester Landfill accepted its final tons of waste. We began final capping and closing of Worcester Landfill in May 2014 and completed final capping and closing in fiscal year 2016.
Western Region
Waste USA Landfill.
The Waste USA landfill is a Subtitle D landfill located in Coventry, Vermont ("Waste USA Landfill") that we purchased in 1995, is the only operating permitted Subtitle D landfill in the State of Vermont. Waste USA Landfill consists of approximately 148 acres of permitted or permittable landfill area and is permitted to accept up to 0.6 million tons of municipal solid waste, C&D material and certain pre-approved special waste annually. The Waste USA Landfill site houses a landfill gas-to-energy plant, which is owned and operated by a third-party, that has the capacity to generate 8.0 MW of energy.
Clinton County Landfill.
The Clinton County Landfill is a Subtitle D landfill located in Schuyler Falls, New York. Clinton County Landfill, which currently consists of approximately 197 acres of permitted or permittable landfill area portions of which are leased from Clinton County, is permitted to accept up to approximately 0.2 million tons of municipal solid waste, C&D material and certain pre-approved special waste annually. The Clinton County Landfill site houses a landfill gas-to-energy facility, which is owned by us and operated by a third-party, that has the capacity to generate 6.4 MW of energy.
Hyland Landfill.
The Hyland Landfill is a Subtitle D landfill located in Angelica, New York that we own, began accepting waste in 1998. Hyland Landfill currently consists of approximately 121 acres of permitted or permittable landfill area and is permitted to accept up to 0.5 million tons of municipal solid waste, C&D material and certain pre-approved special waste annually. The Hyland Landfill site houses a landfill gas-to-energy facility, which is owned by us and operated by a third-party, that has the capacity to generate 4.8 MW of energy.
Ontario County Landfill.
The Ontario County Landfill is a Subtitle D landfill located in Seneca, New York. In 2003, we entered into a 25-year operation, management and lease agreement for the Ontario County Landfill with the Ontario County Board of Supervisors. Ontario County Landfill currently consists of approximately 171 acres of permitted or permittable landfill area and is permitted to accept up to 0.9 million tons of municipal solid waste, C&D material and certain pre-approved special waste annually and is strategically situated to accept long haul volume from both the eastern and downstate New York markets. In January 2016, we received an expansion permit at the Ontario County Landfill, which is sufficient to permit the additional airspace required for the remaining term of the 25-year operation, management and lease agreement. The Ontario County Landfill site houses a Zero-Sort MRF, which is operated by us, and a landfill gas-to-energy facility, which is owned and operated by a third-party, that has the capacity to generate 11.2 MW of energy.
7
Hakes Landfill.
The Hakes landfill is a C&D landfill located in Campbell, New York (“Hakes Landfill”) that we purchased in 1998. Hakes Landfill currently consists of approximately 78 acres of permitted or permittable landfill area and is permitted to accept up to 0.5 million tons of C&D material annually.
Chemung County Landfill.
The Chemung County Landfill is a Subtitle D landfill located in Chemung, New York. In 2005, we entered into a 25-year operation, management and lease agreement for Chemung County Landfill and certain other facilities with Chemung County. Chemung County Landfill currently consists of approximately 113 acres of permitted or permittable landfill area strategically situated to accept long haul volume from both eastern and downstate New York markets and is permitted to accept up to 0.4 million tons of municipal solid waste and certain pre-approved special waste annually and 20.5 thousand tons of C&D material annually. In June 2016, we received an expansion permit at Chemung County Landfill, which is sufficient to permit the additional airspace required for the remaining term of the 25-year operation, management and lease agreement.
McKean Landfill.
The McKean landfill is a Subtitle D landfill located in Mount Jewett, Pennsylvania (“McKean Landfill”) that we purchased in 2011 as part of a bankruptcy reorganization. McKean Landfill currently consists of approximately 256 acres of permitted or permittable landfill area and is permitted to accept up to approximately 0.3 million tons of municipal solid waste, C&D material and certain pre-approved special waste annually. The facility permit authorizes the construction of the rail siding at the landfill which if completed, would expand the market reach for the landfill to other rail capable transfer facilities. We have not yet committed to the construction of the rail siding pending a determination of the economic viability. We believe that McKean Landfill is well situated to provide services to the oil and gas industry that explores natural gas resources in the Marcellus Shale region of Pennsylvania in the form of disposal capacity for residual materials.
Closed Landfills
In fiscal year 2017, we initiated a plan to cease operations of Southbridge Landfill and decided to not proceed with expansion efforts and to close Southbridge Landfill once the remaining capacity had been exhausted, which occurred in fiscal year 2018. Closure operations began in November 2018 when Southbridge Landfill reached its final capacity.
In addition to Southbridge Landfill, we own and/or manage five unlined landfills and three lined landfills that are not currently in operation. We are closing, in the case of Southbridge Landfill, or have closed and capped all of these landfills according to applicable environmental regulatory standards.
Operating Segments
We manage our solid waste operations, which include a full range of solid waste services, on a geographic basis through two regional operating segments, which we designate as our Eastern and Western regions. Our third operating segment is Recycling, which comprises our larger-scale recycling operations and our commodity brokerage operations. Organic services, ancillary operations, along with major accounts and industrial services, are included in our “Other” segment. See Note 19,
Segment Reporting
to our consolidated financial statements included under Item 8 of this Annual Report on Form 10-K for a summary of revenues, certain expenses, profitability, capital expenditures, goodwill, and total assets of our operating segments.
Within each geographic region, we organize our solid waste services around smaller areas that we refer to as “wastesheds.” A wasteshed is an area that comprises the complete cycle of activities in the solid waste services process, from collection to transfer operations and recycling to disposal in landfills, some of which may be owned and/or operated by third parties. We typically operate several divisions within each wasteshed, each of which provides a particular service, such as collection, recycling, disposal or transfer. Each division operates interdependently with the other divisions within the wasteshed. Each wasteshed generally operates autonomously from adjoining wastesheds.
Through the eight MRFs and commodity brokerage operation comprising our Recycling segment, we provide services to six anchor contracts, which have original terms ranging from five to twenty years and expire at various times through calendar year end 2028. The terms of each contract vary, but all of the contracts provide that the municipality or third-party delivers materials to our facility. These contracts may include a minimum volume guarantee by the municipality. We also have service agreements with individual towns and cities and commercial customers, including small solid waste companies and major competitors, that do not have processing capacity within a specific geographic region.
8
The following table provides information about each operating segment (as of January 31,
2019
except revenue information, which is for fiscal year
2018
):
|
|
Eastern
Region
|
Western
Region
|
Recycling
|
Other
|
|||
|
Revenues (in millions)
|
$206.5
|
$286.3
|
$42.2
|
$125.7
|
|||
|
Properties:
|
|||||||
|
Solid waste collection facilities
|
15
|
22
|
—
|
—
|
|||
|
Transfer stations
|
19
|
30
|
—
|
—
|
|||
|
Recycling facilities
|
3
|
4
|
9
|
2
|
|||
|
Subtitle D landfills
|
2
|
6
|
—
|
—
|
|||
|
C&D landfills
|
—
|
1
|
—
|
—
|
|||
See our consolidated financial statements included under Item 8 of this Annual Report on Form 10-K for our financial results for fiscal years
2018
,
2017
and
2016
, and our financial position as of
December 31, 2018
and
December 31, 2017
.
Eastern region
Our Eastern region consists of wastesheds located in Maine, northern, central and southeastern New Hampshire and central and eastern Massachusetts. Our Eastern region is vertically integrated, with transfer, landfill, processing and recycling assets serviced by our collection operations.
We entered the Maine market in 1996 and have grown organically and through acquisitions. We currently operate the Juniper Ridge Landfill under a 30-year agreement with the State of Maine.
We entered the southern New Hampshire market in 1999 and the eastern Massachusetts market in 2000 and since have grown organically and through acquisitions. In this market, we rely to a large extent on third-party disposal capacity, but our landfills and other assets have provided additional opportunities to internalize volumes. In fiscal year 2018, we acquired Complete Disposal Company, Inc. and its subsidiary United Material Management of Holyoke, Inc. (collectively, "Complete"). Complete provides residential and roll-off collection services, operates a C&D processing facility, and operates a solid waste transfer station with both truck and rail transfer capabilities. In fiscal year 2017, we initiated the plan to cease operations of our Southbridge Landfill and decided to not proceed with expansion efforts and to close the Southbridge Landfill once the remaining capacity had been exhausted, which occurred in fiscal year 2018. Closure operations at the Southbridge Landfill began in November 2018.
Western region
Our Western region includes wastesheds located in Vermont, southwestern New Hampshire, eastern, western and upstate New York and in Pennsylvania around McKean Landfill. The portion of eastern New York served by our Western region includes Clinton (operation of Clinton County), Franklin, Essex, Warren, Washington, Saratoga, Rennselaer and Albany counties.
Our Western region also consists of wastesheds in western New York, which includes Ithaca, Elmira, Oneonta, Lowville, Potsdam, Geneva, Auburn, Rochester, Dunkirk, Jamestown and Olean markets. We began entering into these wastesheds in 1997 and have expanded primarily through tuck-in acquisitions and organic growth. Our Western region collection operations include leadership positions in nearly every rural market outside of the larger metropolitan markets such as Syracuse, Buffalo and Albany.
We remain focused on increasing our vertical integration in our Western region through extension of our reach into new markets and managing new materials. We believe that maximizing these logistics through the use of rail, if implemented, long haul trucks and trailer tippers at our facilities will increase our reach.
Recycling
Our Recycling segment is one of the largest processors and marketers of recycled materials in the northeastern United States, comprised of eight MRFs that process and market recyclable materials that municipalities and commercial customers deliver under long-term contracts. Two of the eight MRFs are leased, three are owned, and three are operated by us under contracts with municipal third-parties. In fiscal year
2018
, our Recycling segment processed and/or marketed over 0.8 million tons of recyclable materials including tons marketed through our commodity brokerage division and our baling facilities located throughout our footprint. Recycling’s facilities are located in Vermont, New York, Maine, and Massachusetts.
9
A substantial portion of the material provided to Recycling is delivered pursuant to six anchor contracts. The anchor contracts have an original term of five to twenty years and expire at various times through 2028. The terms of the recycling contracts vary, but all of the contracts provide that the municipality or a third-party delivers the recycled materials to our facility. Under the recycling contracts, we charge the municipality a fee for each ton of material delivered to us. Some contracts contain revenue sharing arrangements under which the municipality receives a specified percentage of our revenues from the sale of the recovered materials.
Our Recycling segment has historically derived a significant portion of its revenues from the sale of recyclable materials. Since purchase and sale prices of recyclable materials, particularly newspaper, corrugated containers, plastics, ferrous and aluminum, can fluctuate based upon market conditions, we use long-term supply contracts with customers to reduce commodity risk. Under such contracts, we obtain a guaranteed minimum price for recyclable materials through the receipt of a tipping fee when commodity prices fall below agreed upon thresholds. Conversely, when prices for recyclable materials rise above agreed upon thresholds, we provide the counterparty with a portion of the related revenues. The contracts are generally with large domestic companies that use the recyclable materials in their manufacturing process, such as paper, packaging and consumer goods companies. In fiscal year
2018
, 39.5% of the revenues from the sale of residential recyclable materials were derived from sales under long-term contracts. At times, we also hedge against fluctuations in the commodity prices of recycled paper and corrugated containers in order to mitigate the variability in cash flows and earnings generated from the sales of recycled materials at floating prices. As of
December 31, 2018
, no such commodity hedges were in place. Also, we mitigate the impact from commodity price fluctuations through the use of a floating SRA fee charged to collection customers to offtake recycling commodity risk. The global recycling market has experienced negative commodity pricing pressure resulting from China's National Sword program in 2017. Markets continued to decline in 2018, leveling off at historical lows compared to prior years. We expect markets to remain depressed into the foreseeable future.
Other
Our Other segment derives a significant portion of its revenues from our Customer Solutions and Organics businesses. Our resource solutions strategy seeks to leverage our core competencies in materials processing, industrial recycling, clean energy, and organics service offerings in order to generate additional value from the waste stream for our customers. Our Customer Solutions business works with larger scale organizations (including multi-location customers, colleges and universities, municipalities, and industrial customers) to develop customized solid waste solutions. The focus of this business is to help these large-scale organizations achieve their economic and environmental objectives related to waste and residual management. We differentiate our services from our competitors by providing customized and comprehensive resource solutions, which enables us to win new business, including traditional solid waste collection and disposal customers.
Our Organics business has been working to develop and/or partner with firms that have developed innovative approaches to deriving incremental value from the organic portion of the waste stream. Through our Earthlife
®
soils products, we offer a wide array of organic fertilizers, composts, and mulches that help our customers recycle organic waste streams. We also have ownership interests in AGreen Energy, LLC and BGreen Energy, LLC, which we account for as cost method investments, that partner with other capital investors to build farm-based anaerobic digesters in the northeastern United States to generate electricity from farm and food waste streams.
Competition
The solid waste services industry is highly competitive. We compete for collection and disposal volume primarily on the basis of the quality, breadth and price of our services. From time to time, competitors may reduce the price of their services in an effort to expand market share or to win a competitively bid municipal contract. These practices may also lead to reduced pricing for our services or the loss of business. In addition, competition exists within the industry for potential acquisition candidates.
Our business strategy generally focuses on operating in secondary or tertiary markets where we have a leading market share. However, in the larger urban markets where we operate, we typically compete against one or more of the large national solid waste companies, including Waste Management, Inc., Republic Services, Inc. and Waste Connections, Inc., any of which may be able to achieve greater economies of scale than we can. We also compete with a number of regional and local companies that offer competitive prices and quality service. In addition, we compete with operators of alternative disposal facilities, including incinerators, and with certain municipalities, counties and districts that operate their own solid waste collection and disposal facilities. Public sector facilities may have certain advantages over us due to the availability of user fees, charges or tax revenues.
10
Marketing and Sales
We have fully integrated sales and marketing strategies with a primary focus on acquiring and retaining commercial, industrial, municipal and residential customers. Our business strategy focuses on creating a highly differentiated sustainable resource management model that meets customers’ unique needs and provides value “beyond the curb”.
Maintenance of a local presence and identity is an important aspect of our sales and marketing strategy, and many of our divisional managers are involved in local governmental, civic and business organizations. Our name and logo, or, where appropriate, that of our divisional operations, are displayed on all of our containers and trucks. We attend and make presentations at municipal and state meetings, and we advertise in a variety of media throughout our service footprint.
The Customer Solutions business serves customers with multiple locations and is focused on growing our share of business with municipal, institutional, commercial and industrial customers. This group provides customers with a broader set of solutions to augment our regional and divisional service capabilities.
Marketing activities are focused on retaining existing customers and attracting new commercial and residential customers directly on-route in order to enhance profitability. Marketing campaigns are integrated with divisional management teams, sales personnel and the centralized customer care center.
Employees
As of
January 31, 2019
, we employed approximately 2,300 people, including approximately 500 professionals or managers, sales, clerical, information systems or other administrative employees and approximately 1,800 employees involved in collection, transfer, disposal, recycling or other operations. Approximately 100 of our employees are covered by collective bargaining agreements. We believe relations with our employees are good.
Risk Management, Insurance and Performance or Surety Bonds
We actively maintain environmental and other risk management programs that we believe are appropriate for our business. Our environmental risk management program includes evaluating existing facilities, as well as potential acquisitions, for compliance with environmental law requirements. Operating practices at all of our operations are intended to reduce the possibility of environmental contamination, enforcement actions and litigation. We also maintain a worker safety program, which focuses on safe practices in the workplace.
We carry a range of insurance intended to protect our assets and operations, including a commercial general liability policy and a property damage policy. A partially or completely uninsured claim against us (including liabilities associated with cleanup or remediation at our facilities), if successful and of sufficient magnitude, could have a material adverse effect on our business, financial condition and results of operations. Any future difficulty in obtaining insurance could also impair our ability to secure future contracts, which may be conditioned upon the availability of adequate insurance coverage.
See also Item 3, “
Legal Proceedings
” and Note 11,
Commitments and Contingencies
to our consolidated financial statements included under Item 8 of this Annual Report on Form 10-K.
We self-insure for automobile and workers’ compensation coverage with reinsurance coverage limiting our maximum exposure. Our maximum exposure in fiscal year
2018
under the workers’ compensation plan was $1.0 million per individual event. Our maximum exposure in fiscal year
2018
under the automobile plan was $1.2 million per individual event.
Municipal solid waste collection contracts and landfill closure and post-closure obligations may require performance or surety bonds, letters of credit or other means of financial assurance to secure contractual performance. While we have not experienced difficulty in obtaining these financial instruments, if we are unable to obtain these financial instruments in sufficient amounts or at acceptable rates we could be precluded from entering into additional municipal contracts or obtaining or retaining landfill operating permits.
We hold a 19.9% ownership interest in Evergreen National Indemnity Company (“Evergreen”), a surety company which provides surety bonds to secure our contractual obligations for certain municipal solid waste collection contracts and landfill closure and post-closure obligations. Our ownership interest in Evergreen is pledged to Evergreen as security for our obligations under the bonds they provide on our behalf.
11
Customers
We provide our collection services to commercial, institutional, industrial and residential customers. A majority of our commercial and industrial collection services are performed under one-to-five year service agreements, and fees are determined by such factors as: professional or management services required; collection frequency; type of equipment and containers furnished; the type, volume and weight of the solid waste collected; the distance to the disposal or processing facility; and the cost of disposal or processing. Our residential collection and disposal services are performed either on a subscription basis (with no underlying contract) with individuals, or through contracts with municipalities, homeowners associations, apartment owners or mobile home park operators.
Our Recycling segment provides recycling services to municipalities, commercial haulers and commercial waste generators within the geographic proximity of the processing facilities.
Seasonality and Severe Weather
Our transfer and disposal revenues historically have been higher in the late spring, summer and early fall months. This seasonality reflects lower volumes of waste in the late fall, winter and early spring months because:
|
•
|
the volume of waste relating to C&D activities decreases substantially during the winter months in the northeastern United States; and
|
|
•
|
decreased tourism in Vermont, New Hampshire, Maine and eastern New York during the winter months tends to lower the volume of waste generated by commercial and restaurant customers, which is partially offset by increased volume from the ski industry.
|
Because certain of our operating and fixed costs remain constant throughout the fiscal year, operating income is therefore impacted by a similar seasonality. Our operations can be adversely affected by periods of inclement or severe weather, which could increase our operating costs associated with the collection and disposal of waste, delay the collection and disposal of waste, reduce the volume of waste delivered to our disposal sites, increase the volume of waste collected under our existing contracts (without corresponding compensation), decrease the throughput and operating efficiency of our materials recycling facilities, or delay construction or expansion of our landfill sites and other facilities. Our operations can also be favorably affected by severe weather, which could increase the volume of waste in situations where we are able to charge for our additional services provided.
Our Recycling segment experiences increased volumes of fiber in November and December due to increased newspaper advertising and retail activity during the holiday season.
Regulation
Introduction
We are subject to extensive federal, state and local environmental laws and regulations which have become increasingly stringent in recent years. The environmental regulations affecting us are administered by the United States Environmental Protection Agency (“EPA”) and other federal, state and local environmental, zoning, health and safety agencies. Failure to comply with such requirements could result in substantial costs, including civil and criminal fines and penalties. Except as described in this Annual Report on Form 10-K, we believe that we are currently in substantial compliance with applicable federal, state and local environmental laws, permits, orders and regulations. Other than as disclosed herein, we do not currently anticipate any material costs to bring our existing operations into environmental compliance, although there can be no assurance in this regard for the future. We expect that our operations in the solid waste services industry will be subject to continued and increased regulation, legislation and enforcement oversight. We attempt to anticipate future legal and regulatory requirements and to keep our operations in compliance with those requirements.
In order to transport, process, or dispose of solid waste, it is necessary for us to possess and comply with one or more permits from federal, state and/or local agencies. We must renew these permits periodically, and the permits may be modified or revoked by the issuing agency under certain circumstances.
The principal federal statutes and regulations applicable to our operations are as follows:
12
The Resource Conservation and Recovery Act of 1976, as amended (“RCRA”)
The RCRA regulates the generation, treatment, storage, handling, transportation and disposal of solid waste and requires states to develop programs to ensure the safe disposal of solid waste. The RCRA divides waste into two categories, hazardous and non-hazardous. Wastes are generally classified as hazardous if they either (a) are specifically included on a list of hazardous wastes, or (b) exhibit certain characteristics defined as hazardous and are not specifically designated as non-hazardous. Wastes classified as hazardous waste are subject to more extensive regulation than wastes classified as non-hazardous, and businesses that deal with hazardous waste are subject to regulatory obligations in addition to those imposed on businesses that deal with non-hazardous waste.
Among the wastes that are specifically designated as non-hazardous are household waste and “special” waste, including items such as petroleum contaminated soils, asbestos, foundry sand, shredder fluff and most non-hazardous industrial waste products.
The EPA regulations issued under Subtitle C of the RCRA impose a comprehensive “cradle to grave” system for tracking the generation, transportation, treatment, storage and disposal of hazardous wastes. Subtitle C regulations impose obligations on generators, transporters and disposers of hazardous wastes, and require permits that are costly to obtain and maintain for sites where those businesses treat, store or dispose of such material. Subtitle C requirements include detailed operating, inspection, training and emergency preparedness and response standards, as well as requirements for manifesting, record keeping and reporting, corrective action, facility closure, post-closure and financial responsibility. Most states have promulgated regulations modeled on some or all of the Subtitle C provisions issued by the EPA, and in many instances the EPA has delegated to those states the principal role in regulating businesses which are subject to those requirements. Some state regulations impose obligations different from and in addition to those the EPA imposes under Subtitle C.
Leachate generated at our landfills and transfer stations is tested on a regular basis, and generally is not regulated as a hazardous waste under federal law. However, there is no guarantee that leachate generated from our facilities in the future will not be classified as hazardous waste.
In October 1991, the EPA adopted the Subtitle D regulations under RCRA governing solid waste landfills. The Subtitle D regulations, which generally became effective in October 1993, include siting restrictions, facility design standards, operating criteria, closure and post-closure requirements, financial assurance requirements, groundwater monitoring requirements, groundwater remediation standards and corrective action requirements. In addition, the Subtitle D regulations require that new landfill sites meet more stringent liner design criteria (typically, composite soil and synthetic liners or two or more synthetic liners) intended to keep leachate out of groundwater and have extensive collection systems to carry away leachate for treatment prior to disposal. Regulations generally require us to install groundwater monitoring wells at virtually all landfills we operate, to monitor groundwater quality and, indirectly, the effectiveness of the leachate collection systems. The Subtitle D regulations also require facility owners or operators to control emissions of landfill gas (including methane) generated at landfills exceeding certain regulatory thresholds. State landfill regulations must meet those requirements or the EPA will impose such requirements upon landfill owners and operators in that state.
The Federal Water Pollution Control Act of 1972, as amended (“Clean Water Act”)
The Clean Water Act regulates the discharge of pollutants into the “waters of the United States” from a variety of sources, including solid waste disposal sites and transfer stations, processing facilities and waste-to-energy facilities (collectively, “solid waste management facilities”). If run-off or treated leachate from our solid waste management facilities is discharged into streams, rivers or other surface waters, the Clean Water Act would require us to apply for and obtain a discharge permit, conduct sampling and monitoring and, under certain circumstances, reduce the quantity of pollutants in such discharge. A permit also may be required if that run-off or leachate is discharged to an offsite treatment facility. Almost all solid waste management facilities must comply with the EPA’s storm water regulations, which govern the discharge of regulated storm water to surface waters.
Under federal regulation, facilities that have above ground and/or below ground petroleum storage capacities over certain thresholds may be subject to regulations and/or permitting under the Clean Water Act. Many of our facilities have petroleum storage and are required to have a spill, prevention, control and countermeasures (“SPCC”) plan to prevent petroleum release to waters of the U.S. due to a spill, rupture or leak.
Several states in which we operate have been delegated the authority to implement the Clean Water Act requirements and in some cases the regulations are more stringent than the federal regulations. We believe we are in compliance with the Clean Water Act regulations; however future changes to the law or regulations could have a material impact on our business.
13
The Comprehensive Environmental Response, Compensation, and Liability Act of 1980, as amended (“CERCLA”)
CERCLA established a regulatory and remedial program intended to provide for the investigation and remediation of facilities where, or from which, a release of any hazardous substance into the environment has occurred or is threatened. CERCLA has been interpreted to impose retroactive, strict, and under certain circumstances, joint and severable, liability for the costs to investigate and clean up facilities on current owners and operators of the site, former owners and operators of the site at the time of the disposal of the hazardous substances, as well as the generators and certain transporters of the hazardous substances. CERCLA imposes liability for the costs of evaluating and addressing damage to natural resources. The costs of CERCLA investigation and cleanup can be substantial. Liability under CERCLA does not depend upon the existence or disposal of “hazardous waste” as defined by RCRA, but can be based on the presence of any of more than 700 “hazardous substances” listed by the EPA, many of which can be found in household waste. The definition of “hazardous substances” in CERCLA incorporates substances designated as hazardous or toxic under the Federal Clean Water Act, Clean Air Act and Toxic Substances Control Act ("TSCA"). If we were found to be a responsible party for a CERCLA cleanup, under certain circumstances, the enforcing agency could pursue us or any other responsible party, for all investigative and remedial costs, even if others also were liable. CERCLA also authorizes the EPA to impose a lien in favor of the United States upon all real property subject to, or affected by, a remedial action for all costs for which the property owner is liable. CERCLA provides a responsible party with the right to bring a contribution action against other responsible parties for their allocable share of investigative and remedial costs. Our ability to obtain reimbursement for amounts we pay in excess of our allocable share of such costs would be limited by our ability to identify and locate other responsible parties and to prove the extent of their responsibility and by the financial resources of such other parties.
The Clean Air Act of 1970, as amended (“Clean Air Act”)
The Clean Air Act, generally through state implementation of federal requirements, regulates emissions of air pollutants from certain landfills based upon the date the landfill was constructed, the total capacity of the landfill and the annual volume of emissions. The EPA has promulgated new source performance standards regulating air emissions of certain regulated pollutants (non-methane organic compounds) from municipal solid waste landfills. Landfills located in areas where ambient levels of regulated pollutants exceed certain thresholds may be subject to more extensive air pollution controls and emission limitations. In addition, the EPA has issued standards regulating the disposal of asbestos-containing materials under the Clean Air Act.
The EPA is also focusing on the emissions of greenhouse gases, or GHG, including carbon dioxide and methane. In December 2009, the EPA issued its “endangerment finding” that carbon dioxide poses a threat to human health and welfare, providing the basis for the EPA to regulate GHG emissions. In December 2009 the EPA’s “Mandatory Reporting of Greenhouse Gases” rule went into effect, requiring facilities that emit twenty-five thousand metric tons or more per year of GHG emissions to submit annual reports to the EPA.
In June 2010, the EPA issued the so-called “GHG Tailoring Rule”, which described how certain sources that emit GHG would be subject to heightened Clean Air Act PSD / Title V regulation. In June 2014, the U.S. Supreme Court issued a decision partially invalidating EPA’s Tailoring Rule and in 2015, the D.C. Circuit directed the EPA to consider further revisions to its regulations. We do not know whether or when the EPA will finalize regulations following the Supreme Court and D.C. Circuit decisions, or what obligations such regulations will impose on our operations.
The adoption of other laws and regulations, which may include the imposition of fees or taxes, could adversely affect our collection and disposal operations. Additionally, certain of the states in which we operate are contemplating air pollution control regulations, including state or regional cap and trade systems, relating to GHG that may be more stringent than regulations the EPA may promulgate. Changing environmental regulations could require us to take any number of actions, including purchasing emission allowances or installing additional pollution control technology, and could make some operations less profitable, which could adversely affect our results of operations.
Congress has considered various options, including a cap and trade system, which could impose a limit on and establish a pricing mechanism for GHG emissions and emission allowances. There also is pressure for the United States to join international efforts to control GHG emissions.
The Clean Air Act regulates emissions of air pollutants from our processing facilities. The EPA has enacted standards that apply to those emissions. It is possible that the EPA, or a state where we operate, will enact additional or different emission standards in the future.
All of the federal statutes described above authorize lawsuits by private citizens to enforce certain provisions of the statutes. In addition to a penalty award to the United States, some of those statutes authorize an award of attorney’s fees to private parties successfully advancing such an action.
14
The Occupational Safety and Health Act of 1970, as amended (“OSHA”)
OSHA establishes employer responsibilities and authorizes the Occupational Safety and Health Administration to promulgate and enforce occupational health and safety standards, including the obligation to maintain a workplace free of recognized hazards likely to cause death or serious injury, to comply with adopted worker protection standards, to maintain certain records, to provide workers with required disclosures and to implement certain health and safety training programs. A variety of those promulgated standards may apply to our operations, including those standards concerning notices of hazards, safety in excavation and demolition work, the handling of asbestos and asbestos-containing materials, and worker training and emergency response programs.
The Public Utility Regulatory Policies Act of 1978, As Amended (“PURPA”)
PURPA exempts qualifying facilities from most federal and state laws governing the financial organization and rate regulation of electric utilities, and generally requires electric utilities to purchase electricity generated by qualifying facilities at a price equal to the utility’s full “avoided cost”. Our four landfill gas-to-energy facilities are self- certified as “qualifying facilities”.
State and Local Regulations
Each state in which we now operate or may operate in the future has laws and regulations governing (1) water and air pollution, and the generation, storage, treatment, handling, processing, transportation, incineration and disposal of solid waste and hazardous waste; (2) in most cases, the siting, design, operation, maintenance, closure and post-closure maintenance of solid waste management facilities; and (3) in some cases, vehicle emissions limits or fuel types, which impact our collection operations. Such standards typically are as stringent as, and may be more stringent and broader in scope than, federal regulations. Most of the federal statutes noted above authorize states to enact and enforce laws with standards that are more protective of the environment than the federal analog. In addition, many states have adopted statutes comparable to, and in some cases more stringent than, CERCLA. Those statutes impose requirements for investigation and remediation of contaminated sites and liability for costs and damages associated with such sites, and some authorize the state to impose liens to secure costs expended addressing contamination on property owned by responsible parties. Some of those liens may take priority over previously filed instruments. Some states have enacted statutes that impose liability for substances in addition to the “hazardous substances” listed by EPA under CERCLA.
Many municipalities in which we currently operate or may operate in the future also have ordinances, laws and regulations affecting our operations. These include zoning and health measures that limit solid waste management activities to specified sites or conduct, flow control provisions that direct the delivery of solid wastes to specific facilities or to facilities in specific areas, laws that grant the right to establish franchises for collection services and then put out for bid the right to provide collection services, and bans or other restrictions on the movement of solid wastes into a municipality.
Some states have enacted laws that allow agencies with jurisdiction over waste management facilities to deny or revoke permits based on the applicant’s or permit holder’s compliance status. Some states also consider the compliance history of the corporate parent, subsidiaries and affiliates of the applicant or permit holder.
Certain permits and approvals issued under state or local law may limit the types of waste that may be accepted at a solid waste management facility or the quantity of waste that may be accepted at a solid waste management facility during a specific time period. In addition, certain permits and approvals, as well as certain state and local regulations, may limit a solid waste management facility to accepting waste that originates from specified geographic areas or seek to restrict the importation of out-of-state waste or otherwise discriminate against out-of-state waste. Generally, restrictions on importing out-of-state waste have not withstood judicial challenge. However, from time to time federal legislation is proposed which would allow individual states to prohibit the disposal of out-of-state waste or to limit the amount of out-of-state waste that could be imported for disposal and would require states, under certain circumstances, to reduce the amounts of waste exported to other states. Although such legislation has not been passed by Congress, if similar legislation is enacted, states in which we operate solid waste management facilities could limit or prohibit the importation of out-of-state waste. Such actions could materially and adversely affect the business, financial condition and results of operations of any of our landfills within those states that receive a significant portion of waste originating from out-of-state.
15
Certain states and localities may restrict the export of waste from their jurisdiction, or require that a specified amount of waste be disposed of at facilities within their jurisdiction. In 1994, the U.S. Supreme Court rejected as unconstitutional and therefore invalid, a local ordinance that sought to limit waste going out of the locality by imposing a requirement that the waste be delivered to a particular privately-owned facility. However, in 2007, the U.S. Supreme Court upheld a U.S. District Court ruling that the flow control regulations in Oneida and Herkimer counties in New York requiring trash haulers to use publicly-owned transfer stations are constitutional, and therefore valid. Additionally, certain state and local jurisdictions continue to seek to enforce such restrictions. Some proposed federal legislation would allow states and localities to impose flow restrictions. Those restrictions could reduce the volume of waste going to solid waste management facilities in certain areas, which may materially adversely affect our ability to operate our facilities and/or affect the prices we can charge for certain services. Those restrictions also may result in higher disposal costs for our collection operations. Flow control restrictions could have a material adverse effect on our business, financial condition and results of operations.
There has been an increasing trend at the state and local levels to mandate or encourage both waste reduction at the source and waste recycling, and to prohibit or restrict the disposal in landfills of certain types of solid wastes, including yard wastes and leaves, certain construction or architectural wastes, food wastes, beverage containers, newspapers, household appliances and electronics such as computers, and batteries. Regulations reducing the volume and types of wastes available for transport to and disposal in landfills could affect our ability to operate our landfill facilities. Vermont, for example, enacted Act 148, containing among other things, a phased waste ban for recyclables, organics and leaf/yard waste. The law became effective July 1, 2012, with phased deadlines for compliance beginning 2014 through 2020. Vermont also passed a law requiring recycling of architectural waste from construction or demolition of a commercial project. The law became effective in January 2015.
Massachusetts revised its regulations governing solid waste management with a framework to encourage the re-use of organic waste material and prohibiting such material from disposal for large-scale commercial generators by October 2014.
New York State revised its regulations governing solid waste management, 6 NYCRR Part 360, effective in November 2017. The revised regulations, among other things, include requirements to conduct landfill liner integrity testing and install radiation detectors at certain facilities.
Although there is no federal law governing extended producer responsibility (“EPR”) regulations; many states have implemented EPR regulations for certain products. EPR regulations are intended to place responsibility for ultimate management or end-of-useful-life handling of the products they create. In addition to financial responsibility, an EPR program may include responsibility for local take-back or recycling programs. For example, several states in which we operate have EPR regulations for electronic waste. If broad EPR laws or regulations were adopted and managed under a manufacturer implemented program, it could have an impact on our business.
The EPA and environmental agencies within individual states in which we operate also consider and promulgate changes to water quality standards, action levels, remediation goals, and other federal or state regulatory standards for individual compounds or classes of compounds. These changes can also include the development of new or more stringent standards for “Emerging Contaminants”, including PFC compounds, pharmaceutical compounds, and a variety of synthetic chemical compounds used in manufacturing and industrial processes. In December 2016, EPA also designated ten chemical substances for risk evaluations under TSCA, based on the requirements of the
June 2016 Frank R. Lautenberg Chemical Safety for the 21
st
Century Act. Changes in regulatory standards for existing or emerging contaminants can result in higher levels of cost and effort associated with the performance of environmental investigations and ongoing compliance at our facilities.
Executive Officers of the Registrant
Our executive officers and their respective ages are as follows:
|
Name
|
Age
|
Position
|
||
|
John W. Casella
|
68
|
Chairman of the Board of Directors, Chief Executive Officer and Secretary
|
||
|
Edwin D. Johnson
|
62
|
President and Chief Operating Officer
|
||
|
Edmond “Ned” R. Coletta
|
43
|
Senior Vice President and Chief Financial Officer
|
||
|
Christopher B. Heald
|
54
|
Vice President and Chief Accounting Officer
|
||
|
David L. Schmitt
|
68
|
Senior Vice President and General Counsel
|
||
16
John W. Casella
has served as Chairman of our Board of Directors since July 2001 and as our Chief Executive Officer since 1993. Mr. Casella also served as our President from 1993 to July 2001 and as Chairman of our Board from 1993 to December 1999. In addition, Mr. Casella has served as Chairman of the Board of Directors of Casella Waste Management, Inc., a wholly-owned subsidiary of ours, since 1977. Mr. Casella is also an executive officer and director of Casella Construction, Inc., a company owned by Mr. Casella and his brother Douglas R. Casella, also a member of our Board of Directors, which specializes in general contracting, soil excavation and heavy equipment work, and which performs landfill-construction and related services for us. Mr. Casella has been a member of numerous industry-related and community service-related state and local boards and commissions, including the National Recycling Coalition, Board of Directors of the Associated Industries of Vermont, the Association of Vermont Recyclers, the Vermont State Chamber of Commerce, the Rutland Industrial Development Corporation and the Rutland Regional Medical Center. Mr. Casella has also served on various state task forces, serving in an advisory capacity to the Governors of Vermont and New Hampshire on solid waste issues. Mr. Casella holds an A.S. in Business Management from Bryant & Stratton College and a B.S. in Business Education from Castleton State College.
Edwin D. Johnson
has served as our President and Chief Operating Officer since December 2012 and as our Senior Vice President and Chief Financial Officer from July 2010 until December 2012. From March 2007 to July 2010, Mr. Johnson served as Executive Vice President, Chief Financial Officer and Chief Accounting Officer at Waste Services, Inc, a solid waste services company. From November 2004 to March 2007, Mr. Johnson served as Chief Financial Officer of Expert Real Estate Services, Inc., a full service real estate brokerage company. Mr. Johnson is a Certified Public Accountant and holds an MBA from Florida International University and a Bachelor of Science in Accounting and Administration from Washington & Lee University.
Edmond “Ned” R. Coletta
has served as our Senior Vice President, Chief Financial Officer and Treasurer since December 2012. Mr. Coletta joined us in December 2004 and has served in positions of increasing responsibility, including as our Vice President of Finance and Investor Relations from January 2011 to December 2012. Prior to that Mr. Coletta served as our Director of Finance and Investor Relations from August 2005 to January 2011. From 2002 until he joined us, Mr. Coletta served as the Chief Financial Officer and was a member of the Board of Directors of Avedro, Inc. (FKA ThermalVision, Inc.), an early stage medical device company that he co-founded. From 1997 to 2001, he served as a research and development engineer for Lockheed Martin Michoud Space Systems. Mr. Coletta holds an MBA from the Tuck School of Business at Dartmouth College and a Bachelor of Science in Materials Science Engineering from Brown University.
Christopher B. Heald
has served as our Vice President of Finance and Chief Accounting Officer since January 2013. Mr. Heald joined us in September 2001 and has served in positions of increasing responsibility, including as our Director of Financial Reporting and Analysis from July 2010 to January 2013 and as our Accounting Manager from August 2002 to July 2010. Mr. Heald is a Certified Public Accountant and holds a Bachelor of Science in Business Administration from the University of Vermont.
David L. Schmitt
has served as our Senior Vice President and General Counsel since June 2012. Mr. Schmitt joined us in May 2006 as our Vice President, General Counsel. Prior to that, Mr. Schmitt served as President of a privately held consulting firm, and further served from 2002 until 2005 as Vice President and General Counsel of BioEnergy International, LLC, (a predecessor company to Myriant Corporation), a firm specializing in the production of bio-succinic acid. He served from 1995 until 2001, as Senior Vice President, General Counsel and Secretary of Bradlees, Inc., a retailer in the northeast United States, and from 1986 through 1990, as Vice President and General Counsel of Wheelabrator Technologies, Inc., a multi-faceted corporation specializing in the development, ownership and operation of large-scale power facilities, fueled by solid waste and other alternative fuels. He is admitted to the Bar of Pennsylvania, and holds a Juris Doctor, cum laude, from Duquesne University School of Law and a Bachelor of Arts degree from The Pennsylvania State University.
Availability of Reports and Other Information
Our website is
www.casella.com
. We make available, free of charge through our website, our Annual and Transition Reports on Form 10-K and 10-KT, Quarterly Reports on Form 10-Q, Current Reports on Form 8-K, Proxy Statements on Schedule 14A, and any amendments to those materials filed pursuant to Sections 13(a) and 15(d) of the Securities Exchange Act of 1934, as amended. We make these reports available through our website as soon as reasonably practicable after we electronically file such materials with or furnish them to the Securities and Exchange Commission (“SEC”). The information found on our website is not part of this or any other report we file with or furnish to the SEC.
17
ITEM 1A. RISK FACTORS
The following important factors, among others, could cause actual results to differ materially from those indicated by forward-looking statements made in this Annual Report on Form 10-K and presented elsewhere by management from time to time. The risks and uncertainties described below are those that we have identified as material, but are not the only risks and uncertainties facing us. Our business is also subject to general risks and uncertainties that affect many other companies, including overall economic and industry conditions, especially in the northeastern United States, where our operations and customers are principally located, changes in laws or accounting rules or other disruptions of expected economic or business conditions. Additional risks and uncertainties not currently known to us or that we currently believe are not material also may impair our business’s results of operations and financial condition.
We have in place an Enterprise Risk Management process that involves systematic risk identification and mitigation covering the categories of strategic, financial, operational, and compliance risk. The goal of enterprise risk management is not to eliminate all risk, but rather to identify and assess risks; assign, mitigate and monitor risks; and report the status of our risks to the Board of Directors and its committees.
Risks Related to Our Business
We face substantial competition in the solid waste services industry, and if we cannot successfully compete in the marketplace, our business, financial condition and results of operations may be materially adversely affected.
The solid waste services industry is highly competitive, has undergone a period of consolidation and requires substantial labor and capital resources. The markets in which we compete are served by, or are adjacent to markets served by, one or more of the large national or super regional solid waste companies, as well as numerous regional and local solid waste companies. Intense competition exists not only to provide services to customers, but also to acquire other businesses within each market. Some of our competitors have significantly greater financial and other resources than we do. From time to time, competitors may reduce the price of their services in an effort to expand market share or to win a competitively bid contract. These practices may require us to reduce the pricing of our services and may result in a loss of business.
As is generally the case in our industry, municipal contracts are typically subject to periodic competitive bidding. We may not be the successful bidder to obtain or retain these contracts. If we are unable to compete with larger and better capitalized companies or replace municipal contracts lost through the competitive bidding process with comparable contracts or other revenue sources within a reasonable time period, our revenues would decrease and our operating results could be materially adversely affected.
In our solid waste disposal markets, we also compete with operators of alternative disposal and recycling facilities and with counties, municipalities and solid waste districts that maintain their own solid waste collection, recycling and disposal operations. We are also increasingly competing with companies which seek to use parts of the waste stream as feedstock for renewable energy supplies. Public entities may have financial advantages because of their ability to charge user fees or similar charges, impose taxes and apply resulting revenues, access tax-exempt financing and, in some cases, utilize government subsidies.
In addition, we may be impacted by the development and commercialization of disruptive technologies that may materially change how waste management services are provided. If we are unable to gain access to these technologies or to compete effectively against them, our financial results may suffer.
We also experience competition in our hiring of drivers and mechanics necessary to service our customers. This competition may come from other waste management companies, but it also comes from other employers who hire drivers and maintain fleets, such as companies that provide courier delivery services, including United Parcel Service, Inc. and FedEx Corporation, as well as from a tightening labor market. If we are unable to hire and retain sufficient numbers of drivers to service our collection and disposal routes and mechanics to maintain our trucks, our financial condition and operating results could be materially impacted.
Our growth strategy focuses on complementing or expanding our business through the acquisition of companies or assets, or the development of new operations. However, we may be unable to complete these transactions and, if executed, these transactions may not improve our business or may pose significant risks and could have a negative effect on our operations.
Our growth strategy includes engaging in acquisitions or developing operations or assets with the goal of complementing or expanding our business. These acquisitions may include “tuck-in” acquisitions within our existing markets, acquisitions of assets that are adjacent to or outside of our existing markets, or larger, more strategic acquisitions. In addition, from time to time we may acquire businesses that are complementary to our core business strategy. We may not be able to identify suitable acquisition candidates, and if we identify suitable acquisition candidates, we may be unable to successfully negotiate the acquisition at a price or on terms and conditions acceptable to us. Furthermore, we may be unable to obtain the necessary regulatory approval to complete potential acquisitions.
18
Our ability to achieve the benefits from any potential future acquisitions, including cost savings and operating efficiencies, depends in part on our ability to successfully integrate the operations of such acquired businesses with our operations. The integration of acquired businesses and other assets may require significant management time and resources that would otherwise be available for the ongoing management of our existing operations. Any operations, properties or facilities that we acquire may be subject to unknown liabilities, such as undisclosed environmental contamination, or other environmental liability, including off-site disposal liability for which we would have no recourse, or only limited recourse, to the former owners of such operations or properties. As a result, if a liability were asserted against us based upon ownership of an acquired property, we might be required to pay significant sums to settle it, which could adversely affect our financial results and cash flow.
The waste management industry is undergoing fundamental change as traditional waste streams are increasingly viewed as renewable resources, which may adversely affect volumes and tipping fees at our landfills.
As we continue to develop our landfill capacity, the waste management industry is recognizing the value of the waste stream as a renewable resource, and accordingly, alternatives to landfilling are being developed that seek to maximize the renewable energy and other resource benefits of solid waste. These alternatives affect the demand for landfill airspace, and could affect our ability to operate our landfills at full capacity, as well as the tipping fees and prices that waste management companies generally, and that we, in particular, can charge for landfill airspace. Reduced tipping fees can affect our willingness to incur the expenditures necessary to increase the permitted capacity of the landfills. As a result, our revenues and operating margins could be materially adversely affected due to these disposal alternatives.
The waste industry is subject to extensive government regulations, including environmental laws and regulations, and we incur substantial costs to comply with such laws and regulations. Failure to comply with environmental or other laws and regulations, as well as enforcement actions and litigation arising from an actual or perceived breach of such laws and regulations, could subject us to fines, penalties, and judgments, and impose limits on our ability to operate and expand.
We are subject to potential liability and restrictions under environmental laws and regulations, including potential liability and restrictions arising from or relating to the transportation, handling, recycling, generation, treatment, storage and disposal of wastes, the presence, release, discharge or emission of pollutants, and the investigation, remediation and monitoring of impacts to soil, surface water, groundwater and other environmental media including natural resources, as a result of the actual or alleged presence, release, discharge or emission of hazardous substances, pollutants or contaminants on, at, under or migrating from our properties, or in connection with our operations. The waste management industry has been and will continue to be subject to regulation, including permitting and related financial assurance requirements, as well as attempts to further regulate the industry, including efforts to regulate and limit the emission of greenhouse gases. Our solid waste operations are subject to a wide range of federal, state and, in some cases, local environmental, odor and noise and land use restrictions. If we are not able to comply with the requirements that apply to a particular facility or if we operate in violation of the terms and conditions of, or without the necessary approvals or permits, we could be subject to administrative or civil, and possibly criminal, fines and penalties, and we may be required to spend substantial capital to bring an operation into compliance, to temporarily or permanently discontinue activities, and/or take corrective actions, possibly including removal of landfilled materials. Those costs or actions could be significant to us and affect our results of operations, cash flows, and available capital. Environmental and land use laws and regulations also affect our ability to expand and, in the case of our solid waste operations, may dictate those geographic areas from which we must, or, from which we may not, accept solid waste. Those laws and regulations may limit the overall size and daily solid waste volume that may be accepted by a solid waste operation. If we are not able to expand or otherwise operate one or more of our facilities because of limits imposed under such laws, we may be required to increase our utilization of disposal facilities owned by third-parties, which could reduce our revenues and/or operating margins.
In addition to complying with environmental laws and regulations, we are required to obtain government permits to operate our facilities, including all of our landfills. There is no guarantee that we will be able to obtain the requisite permits and, even if we could, that any permit (and any existing permits we currently hold) will be renewed or modified as needed to fit our business needs. Localities where we operate generally seek to regulate some or all landfill and transfer station operations, including siting and expansion of operations. The laws and regulations adopted by municipalities in which our landfills and transfer stations are located may limit or prohibit the expansion of a landfill or transfer station, as well as the amount of solid waste that we can accept at the landfill or transfer station on a daily, quarterly or annual basis, and any effort to acquire or expand landfills and transfer stations, which typically involves a significant amount of time and expense. We may not be successful in obtaining new landfill or transfer station sites or expanding the permitted capacity of any of our current landfills and transfer stations. If we are unable to develop additional disposal and transfer station capacity, our ability to achieve economies from the internalization of our waste stream will be limited. If we fail to receive new landfill permits or renew existing permits, we may incur landfill asset impairment and other charges associated with accelerated closure.
19
We have historically grown through acquisitions, may make additional acquisitions in the future, and we have tried and will continue to try to evaluate and limit environmental risks and liabilities presented by businesses to be acquired prior to the acquisition. It is possible that some liabilities may prove to be more difficult or costly to address than we anticipate. It is also possible that government officials responsible for enforcing environmental laws and regulations may believe an issue is more serious than we expect, or that we will fail to identify or fully appreciate an existing liability before we become responsible for addressing it. Some of the legal sanctions to which we could become subject could cause the suspension or revocation of a permit, prevent us from, or delay us in, obtaining or renewing permits to operate or expand our facilities, or harm our reputation. As of
December 31, 2018
, we had recorded
$5.6 million
in environmental remediation liabilities for the estimated cost of our share of work associated with a consent order issued by the State of New York to remediate a scrap yard and solid waste transfer station owned by one of our acquired subsidiaries, including the recognition of accretion expense, and
$5.2 million
in environmental remediation liabilities for the estimated cost of the installation of a municipal waterline associated with Southbridge Recycling & Disposal Park, Inc.discussed in Item 3, "
Legal Proceedings
" of this Annual Report on Form 10-K, including the recognition of accretion expense in other accrued liabilities and other long-term liabilities. There can be no assurance that the cost of such cleanup or that our share of that cost will not exceed our estimates.
In addition to the costs of complying with environmental laws and regulations, we incur costs in connection with environmental proceedings and litigation brought against us by government agencies and private parties. We are, and may be in the future, a defendant in lawsuits brought by parties alleging environmental damage, including natural resource damage, personal injury, and/or property damage or impairment, or seeking to impose civil penalties, injunctive relief or overturn or prevent the issuance of an operating permit or authorization, all of which may result in us incurring significant liabilities. For information about the material outstanding claims against us and our subsidiaries, see Item 3. “
Legal Proceedings
” in this Annual Report on Form 10-K.
We may not have sufficient insurance coverage for our environmental liabilities, such coverage may not cover all of the potential liabilities we may be subject to and/or we may not be able to obtain insurance coverage in the future at reasonable expense, or at all.
The conduct of our businesses is also subject to various other laws and regulations administered by federal, state and local governmental agencies, including tax laws, employment laws and competition laws, among others. New laws, regulations or governmental policy and their related interpretations, or changes in any of the foregoing, including taxes or other limitations on our services, may alter the environment in which we do business and, therefore, may impact our results or increase our costs or liabilities.
In certain jurisdictions, we are subject to compliance with specific obligations under competition laws due to our competitive position in those jurisdictions. For example, in May 2002, we entered into an assurance of discontinuance with the Vermont Attorney General’s Office concerning, among other matters, the conduct of our business in Vermont relating to certain contract terms applicable to our small commercial container customers. In August 2011, a revised final judgment of consent and order was entered by the Vermont Superior Court Washington Unit, Civil Division, as a result of some of our small commercial container customers having been mistakenly issued contracts that did not strictly comply with the terms of the assurance of discontinuance. Pursuant to the order, we paid a civil penalty in an aggregate amount of $1.0 million. In July 2014, we entered into an assurance of discontinuance with the office of the New York Attorney General in connection with certain of our commercial practices in certain specified counties in New York, pursuant to which we paid the State of New York a sum of $0.1 million. The assurances of discontinuance and order provide for certain restrictions on our customer contract terms, certain conditions on our business acquisitions, sales and market share and require us to maintain an internal compliance program. Failure to comply with these requirements or other laws or regulations could subject us to enforcement actions or financial penalties which could have a material adverse effect on our business.
20
Our results of operations are affected by fluctuating commodity prices and market requirements for recyclable materials.
Our results of operations have been and will continue to be affected by changing purchase or resale prices or market requirements for recyclable materials. Our recycling business involves the purchase and sale of recyclable materials, some of which are priced on a commodity basis. The commodity markets continue to see ongoing negative pressure on pricing associated with the decline of the fiber market due to less use of paper products such as newspaper and office paper as a result of increased on-line reading. As a result of these market changes, domestic demand for various recycled fibers from mill buyers has steadily declined over the past decade, and as such we have exported more of these materials overseas to China. In 2017, China launched a campaign called National Sword which has imposed significant restrictions on the importation into China of recyclable materials, including a complete ban on the import into China of mixed paper and new quality standards for contaminants in recyclable materials commencing January 1, 2018. Furthermore, China has not issued import licenses for its mills to import recyclable commodities for 2018, resulting in a stoppage of essentially all imports of recyclable commodities into China. These factors have had a significant impact on our business and have required us to seek alternative export markets for recyclable commodities.
We seek to limit our exposure to fluctuating commodity prices through: our revenue sharing contracts that share commodity prices above a threshold level or charge a tipping fee below the threshold; our net commodity rate formula that allows us to pass back higher costs to sell commodities, including higher labor costs or equipment costs to meet new quality standards; our floating Sustainability Recycling Adjustment fee that passes back the cost of recycling to our collection customers; and as applicable, the use of hedging agreements, floor price contracts and long-term supply contracts with customers. Although we have introduced these risk mitigation programs to help offset volatility in commodity prices and to offset higher labor or capital costs to meet more stringent contamination standards, we cannot provide assurance that we can use these programs with our customers in all circumstances or that they will mitigate these risks in an evolving recycling environment.
Our business requires a high level of capital expenditures.
Our business is capital intensive. Our capital expenditure requirements include fixed asset purchases and capital expenditures for landfill development and cell construction, as well as site and cell closure. We use a substantial portion of our cash flows from operating activities toward capital expenditures, which reduces our flexibility to use such cash flows for other purposes, such as reducing our indebtedness. Our capital expenditures could increase if we make acquisitions or further expand our operations, or as a result of factors beyond our control, such as changes in federal, state or local governmental requirements. The amount that we spend on capital expenditures may exceed current expectations, which may require us to obtain additional funding for our operations or impair our ability to grow our business.
We are upgrading our technology infrastructure and there can be no assurance that our efforts will be completed on the projected timetable or that our investment will result in the expected gains.
We are upgrading our technology infrastructure, including an enterprise resource planning package and other systems that we believe will improve our internal processes and the productivity of our employees. These upgrades are complex and there can be no assurance that they will result in expected productivity gains and operating cost reductions on our anticipated timeline, if at all. In addition, if we are not able to maintain the security of our data, confidential information about us or our customers or suppliers could be inadvertently disclosed, subjecting us to possible expenses and other liabilities as well as adversely impacting customer and other third party relationships. If we are unable to benefit from new technologies, we may be at a competitive disadvantage to other companies in the waste management industry, in which case our operating results could suffer.
Cybersecurity incidents could negatively impact our business and our relationships with customers, adversely affecting our financial results and exposing us to litigation risk.
We use computer technology in substantially all aspects of our business operations. We also use mobile devices, social networking and other online activities to connect with our customers and our employees to be able to process transactions and provide information that we feel is necessary to manage our business. Such uses give rise to cybersecurity risks, including security breach, espionage, system disruption, theft and inadvertent release of information. Our business involves the storage and transmission of numerous classes of sensitive and/or confidential information and intellectual property, including customers’ personal information, private information about employees, and financial and strategic information about us and our business partners. We also rely on a Payment Card Industry compliant third party to protect our customers’ credit card information. Further, as we pursue our strategy to grow through acquisitions and to pursue new initiatives that improve our operations and cost structure, we are also expanding and improving our information technologies, resulting in a larger technological presence and corresponding exposure to cybersecurity risk. If we fail to assess and identify cyber security risks associated with acquisitions and new initiatives, we may become increasingly vulnerable to such risks. Additionally, while we have implemented measures to prevent security breaches and cyber incidents, our preventive or detection measures and incident response efforts may not be entirely effective, especially as cyber security attacks continue to evolve and become more sophisticated, often are not recognized until launched against a target and may be difficult to detect for a long time.
21
If company, personal or otherwise protected information is improperly accessed, tampered with or distributed, we may face significant financial exposure, including incurring significant costs to remediate possible injury to the affected parties. We may also be subject to sanctions and civil or criminal penalties if we are found to be in violation of the privacy or security rules under laws protecting confidential information. If our established network of security controls, policy enforcement mechanisms, educational awareness programs and monitoring systems that we use to address these threats to technology fail, the theft, destruction, loss, misappropriation, or release of sensitive and/or confidential information or intellectual property, or interference with our information technology systems or the technology systems of third parties on which we rely, could result in business disruption, negative publicity, brand damage, violation of privacy laws, loss of customers, potential litigation and liability and competitive disadvantage. While we have purchased insurance coverage for cybersecurity risks, there can be no assurance that any such coverage would be adequate to cover potential liability.
Our business is geographically concentrated and is therefore subject to regional economic downturns.
Our operations and customers are concentrated principally in New England and New York. Therefore, our business, financial condition and results of operations are susceptible to regional economic downturns and other regional factors, including state regulations and budget constraints and severe weather conditions. In addition, as we seek to expand in our existing markets, opportunities for growth within this region will become more limited and the geographic concentration of our business will increase.
Our results of operations and financial condition may be negatively affected if we inadequately accrue for final capping, closure and post-closure costs or by the timing of these costs for our waste disposal facilities.
We have material financial obligations relating to final capping, closure and post-closure costs of our existing owned or operated landfills and will have material financial obligations with respect to any disposal facilities that we may own or operate in the future. Once the permitted capacity of a particular landfill is reached and additional capacity is not authorized, or a determination is made to cease operations at a landfill due to other considerations, the landfill must be closed and capped, and we must begin post-closure maintenance. We establish accruals for the estimated costs associated with such final capping, closure and post-closure obligations over the anticipated useful life of each landfill on a per ton basis. We have provided and expect that we will in the future provide accruals for financial obligations relating to final capping, closure and post-closure costs of our owned or operated landfills, generally for a term of 30 years after closure of a landfill. Our financial obligations for final capping, closure or post-closure costs could exceed the amounts accrued or amounts otherwise receivable pursuant to trust funds established for this purpose. Such a circumstance could result in significant unanticipated charges that would have an adverse effect on our business.
In addition, the timing of any such final capping, closure or post-closure costs, which exceed established accruals, may further negatively affect our business. Since we will be unable to control the timing and amounts of such costs, we may be forced to delay investments or planned improvements in other parts of our business or we may be unable to meet applicable financial assurance requirements. Any of the foregoing would negatively affect our business and results of operations.
Fluctuations in fuel costs could affect our operating expenses and results.
The price and supply of fuel is unpredictable and fluctuates based on events beyond our control, including among others, geopolitical developments, supply and demand for oil and gas, actions by the Organization of the Petroleum Exporting Countries and other oil and gas producers, war and unrest in oil producing countries and regional production patterns. Because fuel is needed to run our fleet of trucks, price escalations for fuel increase our operating expenses. In fiscal year
2018
, we used approximately 5.3 million gallons of diesel fuel in our solid waste operations. Although we have a “fuel surcharge” program, based on a fuel index, to help offset increases in the cost of fuel, oil and lubricants arising from price volatility, contractual restrictions and competitive conditions may impact our opportunity to pass this fee on to our customers in all circumstances.
We could be precluded from entering into contracts or obtaining or maintaining permits or certain contracts if we are unable to obtain third-party financial assurance to secure our contractual obligations.
Public solid waste collection, recycling and disposal contracts, and obligations associated with landfill closure and post-closure typically require performance or surety bonds, letters of credit or other means of financial assurance to secure our contractual performance. We currently obtain performance and surety bonds from Evergreen National Indemnity Company, in which we hold a 19.9% equity interest. If we are unable to obtain the necessary financial assurance in sufficient amounts or at acceptable rates, we could be precluded from entering into additional municipal contracts or from obtaining or retaining landfill management contracts or operating permits. Any future difficulty in obtaining insurance could also impair our ability to secure future contracts conditioned upon having adequate insurance coverage.
We may be required to write-off or impair capitalized costs or intangible assets in the future or we may incur restructuring costs or other charges, each of which could harm our earnings.
22
In accordance with generally accepted accounting principles in the United States, we capitalize certain expenditures and advances relating to our acquisitions, pending acquisitions, landfills, cost method investments and development projects. In addition, we have considerable unamortized assets. From time to time in future periods, we may be required to incur a charge against earnings in an amount equal to any unamortized capitalized expenditures and advances, net of any portion thereof that we estimate will be recoverable, through sale or otherwise, relating to: (1) any operation or other asset that is being sold, permanently shut down or impaired or has not generated or is not expected to generate sufficient cash flow; (2) any pending acquisition that is not consummated; (3) any landfill or development project that is not expected to be successfully completed; and (4) any goodwill or other intangible assets that are determined to be impaired.
In response to such charges and costs and other market factors, we may be required to implement restructuring plans in an effort to reduce the size and cost of our operations and to better match our resources with our market opportunities. As a result of such actions, we would expect to incur restructuring expenses and accounting charges which may be material. Several factors could cause a restructuring to adversely affect our business, financial condition and results of operations. These include potential disruption of our operations, the development of our landfill capacity and recycling technologies and other aspects of our business. Employee morale and productivity could also suffer and result in unintended employee attrition. Any restructuring would require substantial management time and attention and may divert management from other important work. Moreover, we could encounter delays in executing any restructuring plans, which could cause further disruption and additional unanticipated expense.
Our revenues and our operating income experience seasonal fluctuations.
Our transfer and disposal revenues historically have been higher in the late spring, summer and early fall months. This seasonality reflects the lower volume of solid waste during the late fall, winter and early spring months primarily because:
|
•
|
the volume of waste relating to C&D activities decreases substantially during the winter months in the northeastern United States; and
|
|
•
|
decreased tourism in Vermont, Maine and eastern New York during the winter months tends to lower the volume of solid waste generated by commercial and restaurant customers, which is partially offset by increased volume from the ski industry.
|
Since certain of our operating and fixed costs remain constant throughout the fiscal year, operating income is impacted by a similar seasonality. In addition, particularly harsh weather conditions typically result in increased operating costs.
Adverse weather conditions may limit our operations and increase the costs of collection and disposal.
Our collection and landfill operations could be adversely impacted by extended periods of inclement weather, or by increased severity of weather. Adverse weather could increase our operating costs associated with the collection and disposal of waste, delay the collection and disposal of waste, reduce the volume of waste delivered to our disposal sites, increase the volume of waste collected under our existing contracts (without corresponding compensation), decrease the throughput and operating efficiency of our materials recycling facilities, or delay construction or expansion of our landfill sites and other facilities. In addition, adverse weather conditions may result in the temporary suspension of our operations, which can significantly affect our operating results in the affected regions during those periods.
Efforts by labor unions to organize our employees could divert management attention and increase our operating expenses.
Certain groups of our employees have chosen to be represented by unions, and we have negotiated collective bargaining agreements with these groups. The negotiation of collective bargaining agreements could divert management attention and result in increased operating expenses and lower net income (or increased net loss). If we are unable to negotiate acceptable collective bargaining agreements, we may be subject to union-initiated work stoppages, including strikes. Depending on the type and duration of any labor disruptions, our revenues could decrease and our operating expenses could increase, which could adversely affect our financial condition, results of operations and cash flows. As of
January 31, 2019
, approximately 5% of our employees were represented by unions.
Our enterprise risk management process may not be effective in mitigating the risks to which we are subject, or in reducing the potential for losses in connection with such risks.
Our enterprise risk management framework is designed to minimize or mitigate the risks to which we are subject, as well as any losses stemming from such risks. Although we seek to identify, measure, monitor, report, and control our exposure to such risks, and employ a broad and diversified set of risk monitoring and mitigation techniques in the process, those techniques are inherently limited in their ability to anticipate the existence or development of risks that are currently unknown and unanticipated. The ineffectiveness of our enterprise risk management framework in mitigating the impact of known risks or the emergence of previously unknown or unanticipated risks may result in our incurring losses in the future that could adversely impact our financial condition and results of operations.
23
Risks Related to Our Indebtedness
We have substantial debt and have the ability to incur additional debt. The principal and interest payment obligations of such debt may restrict our future operations.
As of
December 31, 2018
, we had approximately
$555.2 million
of outstanding principal indebtedness (excluding approximately
$22.5 million
of outstanding letters of credit issued under our new term loan A facility ("Term Loan Facility") and revolving line of credit facility (“Revolving Credit Facility” and, together with the Term Loan Facility, the "Credit Facility"). The Credit Facility consists of the Term Loan Facility with term loans in the outstanding principal amount of
$350.0 million
and the Revolving Credit Facility with loans thereunder being available up to an aggregate principal amount of $200.0 million, of which
$107.9 million
of unused commitments remain under the Revolving Credit Facility, subject to customary borrowing conditions. In addition, the terms of our existing indebtedness permit us to incur additional debt. Our substantial debt, among other things:
|
•
|
requires us to dedicate a substantial portion of any cash flow from operations to the payment of interest and principal due under our debt, which reduces funds available for other business purposes, including capital expenditures and acquisitions;
|
|
•
|
places us at a competitive disadvantage compared with some of our competitors that may have less debt and better access to capital resources; and
|
|
•
|
limits our ability to obtain additional financing required to fund working capital and capital expenditures and for other general corporate purposes, but does allow us to increase the amount of our debt substantially subject to the conditions in the Credit Facility.
|
Our ability to satisfy our obligations and to reduce our total debt depends on our future operating performance and on economic, financial, competitive and other factors, many of which are beyond our control. Our business may not generate sufficient cash flow, and future financings may not be available to provide sufficient net proceeds, to meet these obligations or to successfully execute our business strategy.
The Credit Facility
requires us to meet a number of financial ratios and covenants.
The Credit Facility contains certain affirmative and negative covenants which, among other things and subject, in certain cases, to certain basket amounts and other exceptions, limit the existence of additional indebtedness, the existence of liens or pledges, certain investments, acquisitions and sales or other transfers of assets, the payment of dividends and distributions and repurchases of equity, prepayments of certain junior indebtedness, and certain other transactions. Our ability to comply with these covenants may be affected by events beyond our control, including prevailing economic, financial and industry conditions. These covenants could have an adverse effect on our business by limiting our ability to take advantage of financing, merger and acquisition or other corporate opportunities. Additionally, the Credit Facility requires, solely for the benefit of the lenders under the Revolving Credit Facility, that we meet financial tests, including, without limitation:
|
•
|
minimum consolidated EBITDA to consolidated cash interest charges ratio; and
|
|
•
|
maximum consolidated funded debt (net of up to an agreed amount of cash and cash equivalents) to consolidated EBITDA ratio.
|
An event of default under any of our debt agreements could permit some of our lenders, including the lenders under the Credit Facility, to declare all amounts borrowed from them to be immediately due and payable, together with accrued and unpaid interest, or, in the case of the Credit Facility, terminate the commitment to make further credit extensions thereunder, which could, in turn, trigger cross-defaults under other debt obligations. If we were unable to repay debt to our lenders, or were otherwise in default under any provision governing our outstanding debt obligations, our secured lenders could proceed against us and against the collateral securing that debt.
Risks Related to Our Common Stock
Holders of our Class A common stock are entitled to one vote per share, and holders of our Class B common stock are entitled to ten votes per share. The lower voting power of the Class A common stock may negatively affect the attractiveness of our Class A common stock to investors and, as a result, its market value.
24
We have two classes of common stock: Class A common stock, which is entitled to one vote per share, and Class B common stock, all of which are beneficially owned by John W. Casella, our Chairman and Chief Executive Officer, and his brother, Douglas R. Casella, a member of our Board of Directors, and which is entitled to ten votes per share. Except for the election of one of our directors and in certain limited circumstances required by applicable law, holders of Class A common stock and Class B common stock vote together as a single class on all matters to be voted on by our stockholders. As of
January 31, 2019
, an aggregate of 988,200 shares of our Class B common stock, representing 9,882,000 votes, were outstanding. Based on the number of shares of common stock outstanding as of
January 31, 2019
, the shares of our Class A common stock and Class B common stock beneficially owned by John W. Casella and Douglas R. Casella represented approximately 19.8% of the aggregate voting power of our stockholders. Consequently, John W. Casella and Douglas R. Casella are able to substantially influence all matters for stockholder consideration and constitute, and are expected to continue to constitute, a significant portion of the shares entitled to vote on all matters requiring approval by our stockholders. The difference in the voting power of our Class A common stock and Class B common stock could diminish the market value of our Class A common stock if investors attribute value to the superior voting rights of our Class B common stock and the power those rights confer.
ITEM 1B. UNRESOLVED STAFF COMMENTS
None.
ITEM 2. PROPERTIES
Our headquarters is located at 25 Greens Hill Lane, Rutland, Vermont 05701, where we currently lease approximately 12,000 square feet of office space.
Our principal property and equipment consists of land, landfills, buildings, machinery and equipment, rolling stock and containers. At
January 31, 2019
, we operated
eight
subtitle D landfills,
four
of which we own and
four
of which we lease;
one
landfill permitted to accept C&D materials that we own;
49
transfer stations,
27
of which we own,
seven
of which we lease and
15
of which we operate under a contract;
37
solid waste collection facilities,
19
of which we own,
17
of which we lease and
one
of which we operate under a contract;
18
recycling processing facilities,
nine
of which we own,
five
of which we lease and
four
of which we operate under a contract;
four
landfill gas-to-energy facilities that we own; and
19
corporate office and other administrative facilities,
three
of which we own and
16
of which we lease (See Item 1, “
Business
” of this Annual Report on Form 10-K for property information by operating segment and location). We believe that our property and equipment are adequately maintained and sufficient for our current operations.
ITEM 3. LEGAL PROCEEDINGS
In the ordinary course of our business and as a result of the extensive governmental regulation of the solid waste industry, we are subject to various judicial and administrative proceedings involving state and local agencies. In these proceedings, an agency may seek to impose fines or to revoke or deny renewal of an operating permit held by us. From time to time, we may also be subject to actions brought by special interest or other groups, adjacent landowners or residents in connection with the permitting and licensing of landfills and transfer stations, or allegations of environmental damage or violations of the permits and licenses pursuant to which we operate. In addition, we may be named defendants in various claims and suits pending for alleged damages to persons and property, alleged violations of certain laws and alleged liabilities arising out of matters occurring during the ordinary operation of a waste management business.
Environmental Remediation Liability
We are subject to liability for environmental damage, including personal injury and property damage, that our solid waste, recycling and power generation facilities may cause to neighboring property owners, particularly as a result of the contamination of drinking water sources or soil, possibly including damage resulting from conditions that existed before we acquired the facilities. We may also be subject to liability for similar claims arising from off-site environmental contamination caused by pollutants or hazardous substances if we or our predecessors arrange or arranged to transport, treat or dispose of those materials. The following matters represent our material outstanding claims.
25
Southbridge Recycling & Disposal Park, Inc.
In October 2015, our Southbridge Recycling and Disposal Park, Inc. (“SRD”) subsidiary reported to the Massachusetts Department of Environmental Protection (“MADEP”) results of analysis of samples collected pursuant to our existing permit from private drinking water wells located near the Town of Southbridge, Massachusetts (“Town”) Landfill (“Southbridge Landfill”), which is operated by SRD. Those results indicated the presence of contaminants above the levels triggering notice and response obligations under MADEP regulations. In response to those results, we are carrying out an Immediate Response Action pursuant to Massachusetts General Law Chapter 21E (the "Charlton 21E Obligations") pursuant to state law. Further, we have implemented a plan to analyze and better understand the groundwater near the Southbridge Landfill and we are investigating with the objective of identifying the source or sources of the elevated levels of contamination measured in the well samples. If it is determined that some or all of the contamination originated at the Southbridge Landfill, we will work with the Town (the Southbridge Landfill owner and the former operator of an unlined portion of the Southbridge Landfill, which was used prior to our operation of a double-lined portion of the Southbridge Landfill commencing in 2004) to evaluate and allocate the liabilities related to the Charlton 21E Obligations. In July 2016, we sent correspondence to the Town pursuant to Chapter 21E of Massachusetts General Laws demanding that the Town reimburse us for the environmental response costs we had spent and that the Town be responsible for all such costs in the future, as well as any other costs or liabilities resulting from the release of contaminants from the unlined portion of the Southbridge Landfill. The Town responded in September 2016, denying that the Southbridge Landfill is the source of such contamination, and claiming that if it is, that we may owe an indemnity to the Town pursuant to the Operating Agreement between us and the Town dated May 29, 2007, as amended. We entered into a Tolling Agreement with the Town to delay any further administrative or legal actions until our work with MADEP more specifically defines the parties’ responsibilities for the Charlton 21E Obligations, if any. Please see below for further discussion of our relationship with the Town regarding the Charlton 21E Obligations.
In February 2016, we and the Town received a Notice of Intent to Sue under the Resource Conservation and Recovery Act ("RCRA") from a law firm purporting to represent residents proximate to the Southbridge Landfill (“Residents”), indicating its intent to file suit against us on behalf of the Residents alleging the groundwater contamination originated from the Southbridge Landfill. In February 2017, we received an additional Notice of Intent to Sue from the National Environmental Law Center under the Federal Clean Water Act ("CWA") and RCRA (collectively the “Acts”) on behalf of Environment America, Inc., d/b/a Environment Massachusetts, and Toxics Action Center, Inc., which have referred to themselves as the Citizen Groups. The Citizen Groups alleged that we had violated the Acts, and that they intended to seek appropriate relief in federal court for those alleged violations. On or about June 9, 2017, a lawsuit was filed against us, SRD and the Town in the United States District Court for the District of Massachusetts (the “Massachusetts Court”) by the Citizen Groups and the Residents alleging violations of the Acts (the “Litigation”), and demanding a variety of remedies under the Acts, including fines, remediation, mitigation and costs of litigation, and remedies for violations of Massachusetts civil law related to personal and property damages, including remediation, diminution of property values, compensation for lost use and enjoyment of properties, enjoinment of further operation of the Southbridge Landfill, and costs of litigation, plus interest on any damage award, on behalf of the Residents. We believe the Litigation to be factually inaccurate, and without legal merit, and we and SRD intend to vigorously defend the Litigation. Nevertheless, we believe it is reasonably possible that a loss will occur as a result of the Litigation although an estimate of loss cannot be reasonably provided at this time. We also continue to believe the Town should be responsible for costs or liabilities associated with the Litigation relative to alleged contamination originating from the unlined portion of the Southbridge Landfill, although there can be no assurance that we will not be required to incur some or all of such costs and liabilities.
In December 2017, we filed a Motion to Dismiss the Litigation, and on October 1, 2018, the Massachusetts Court granted our Motion to Dismiss, and accordingly, dismissed the Citizen Groups claims under the Acts. The Massachusetts Court has retained jurisdiction of the Residents claims. The Citizen Groups intend to appeal the Massachusetts Court’s decision to grant our Motion to Dismiss.
We entered into an Administrative Consent Order on April 26, 2017 (the “ACO”), with MADEP, the Town, and the Town of Charlton, committing us to equally share the costs with MADEP, of up to
$10.0 million
(
$5.0 million
each) for the Town to install a municipal waterline in the Town of Charlton ("Waterline"). Upon satisfactory completion of that Waterline, and other matters covered by the ACO, we and the Town will be released by MADEP from any future responsibilities for the Charlton 21E Obligations. We also entered into an agreement with the Town on April 28, 2017 entitled the “21E Settlement and Water System Construction Funding Agreement” (the “Waterline Agreement”), wherein we and the Town released each other from claims arising from the Charlton 21E Obligations. Pursuant to the Waterline Agreement, the Town will issue a twenty (
20
) year bond for our portion of the Waterline costs (up to
$5.0 million
). We have agreed to reimburse the Town for periodic payments under such bond. The Town has recently advised us that it has solicited and received proposals for the construction of the Waterline as contemplated by the ACO, and that construction of the Waterline has commenced.
26
We have recorded an environmental remediation liability associated with the future installation of the Waterline in other accrued liabilities and other long-term liabilities. We inflate the estimated costs in current dollars to the expected time of payment and discount the total cost to present value using a risk-free interest rate of
2.6%
. Our expenditures could be significantly higher if costs exceed estimates. The changes to the environmental remediation liability associated with the Southbridge Landfill are as follows (in millions):
|
|
Fiscal Year Ended
December 31, |
||||||
|
|
2018
|
2017
|
|||||
|
Beginning balance
|
$
|
5.9
|
|
$
|
—
|
|
|
|
Accretion expense
|
0.2
|
|
0.1
|
|
|||
|
Obligations incurred
|
—
|
|
6.3
|
|
|||
|
Obligations settled (1)
|
(0.9
|
)
|
(0.5
|
)
|
|||
|
Ending balance
|
$
|
5.2
|
|
$
|
5.9
|
|
|
|
(1)
|
Includes amounts that are being processed through accounts payable as a part of our disbursements cycle.
|
On June 13, 2017, Town voters rejected a non-binding ballot initiative intended to provide guidance to Town officials with respect to our pursuit of other landfill development opportunities at the Southbridge Landfill. Following such rejection by the Town voters, our board of directors and senior management determined after due consideration of all facts and circumstances that it is no longer likely that further development at the existing landfill site will generate an adequate risk adjusted return at the Southbridge Landfill, and accordingly we intended to cease operations at the Southbridge Landfill when no further capacity was available. We reached this conclusion after carefully evaluating the estimated future costs associated with the permitting, engineering and construction activities for the planned expansion of the Southbridge Landfill against the possible outcomes of the permitting process and the anticipated future benefits of successful expansions. Under our May 29, 2007 Extension Agreement with the Town ("Extension Agreement"), which we accounted for as an operating lease, there are potential contractual obligations and commitments, including future cash payments and services that extend beyond the current useful life of the Southbridge Landfill. We delivered correspondence to the Town to this effect on August 3, 2017, citing events of Change in Law and Force Majeure pursuant to our Extension Agreement and the impacts of such events on further expansion of the Southbridge Landfill. We advised the Town that we saw no economically feasible way to operate the Southbridge Landfill beyond its current permitted life and we have filed a closure plan with MADEP. In this respect, the Town had, on or about April 11, 2018, filed a motion for a declaratory judgment and injunctive relief in the Massachusetts Court seeking a judgment from the Massachusetts Court as to the rights of the parties pursuant to the Extension Agreement, and injunctive relief to prevent us from discontinuing free collection and disposal of the Town’s municipal waste when the Southbridge Landfill ceases to accept waste (the “Town Equity Litigation”). We vigorously defended the Town Equity Litigation on its merits, and further, on the grounds that the Town Equity Litigation is not in compliance with the procedures for dispute resolution as set forth in the Extension Agreement. On June 26, 2018, the Massachusetts Court denied the Town’s request for a preliminary injunction without prejudice. Subsequently, the Town filed a successor litigation to the Town Equity Litigation (the “Current Litigation”), again seeking equitable and legal relief. We vigorously contested the Current Litigation and on November 8, 2018, the Town approved a Settlement Agreement with us which shortened the period of time we were purportedly obligated to provide the Town with free collection and disposal of the Town’s municipal waste from September, 2027 to March 31, 2024. The Town also agreed that we could close the solid waste and recycling transfer station in the Town at the end of 2018. The current litigation has been dismissed. The Southbridge Landfill was closed in November 2018 (the "Closure"). Following the Closure, we have proceeded to conduct proper closure and other activities at the Southbridge Landfill in accordance with the Extension Agreement with the Town, and Federal, state and local law. In accordance with FASB ASC 420 - Exit or Disposal Cost Obligations, a liability for costs to be incurred under a contract for its remaining term without economic benefit shall be recognized when we cease using the right conveyed by the contract. As a result of the Closure and in consideration of the Settlement Agreement with the Town, we recorded a charge amounting to $8.7 million as a component of the Southbridge Landfill closure charge, net associated with the remaining future contractual obligations.
See Note 16,
Other Items and Charges
to our consolidated financial statements included under Item 8 of this Annual Report on Form 10-K for disclosure over the Southbridge Landfill closure charge.
The costs and liabilities we may be required to incur in connection with the foregoing Southbridge Landfill matters could be material to our results of operations, our cash flows and our financial condition.
North Country Environmental Services
27
On or about March 8, 2018, the Citizen Groups described above delivered correspondence to our subsidiary, North Country Environmental Services, Inc. ("NCES") and us, providing notice of the Citizen Groups' intent to sue NCES and us for violations of the CWA in conjunction with NCES's operation of its landfill in Bethlehem, New Hampshire. On May 14, 2018, the Citizen Groups filed a lawsuit against NCES and us in the United States District Court for the District of New Hampshire (the “New Hampshire Court”) alleging violations of the CWA, arguing that ground water discharging into the Ammonoosuc River is a "point source" under the CWA (the "New Hampshire Litigation"). The New Hampshire Litigation seeks remediation and fines under the CWA. On June 15, 2018, we and NCES filed a Motion to Dismiss the New Hampshire Litigation. On July 13, 2018, the Citizen Groups filed objections to our Motion to Dismiss. On July 27, 2018, we filed a reply in support of our Motion to Dismiss. On September 25, 2018, the New Hampshire Court denied our Motion to Dismiss. We intend to continue to vigorously defend against the New Hampshire Litigation, which we believe is without merit.
ITEM 4. MINE SAFETY DISCLOSURES
Not applicable.
28
PART II
ITEM 5. MARKET FOR REGISTRANT’S COMMON EQUITY, RELATED STOCKHOLDER MATTERS AND ISSUER PURCHASES OF EQUITY SECURITIES
Our Class A common stock trades on the NASDAQ Global Select Market (“NASDAQ Stock Market”) under the symbol CWST. There is no established trading market for our Class B common stock. As of
January 31, 2019
there were approximately 440 holders of record of our Class A common stock and two holders of record of our Class B common stock.
For purposes of calculating the aggregate market value of the shares of common stock held by non-affiliates, as shown on the cover page of this Annual Report on Form 10-K, we have assumed that all the outstanding shares of Class A common stock were held by non-affiliates except for the shares beneficially held by directors and executive officers and funds represented by them.
Dividends
No dividends have ever been declared or paid on our common stock and we do not anticipate paying any cash dividends on our common stock in the foreseeable future.
The information required by Item 201(d) of Regulation S-K is included in Part III of this Annual Report on Form 10-K.
Stock Performance Graph
The following performance graph and related information shall not be deemed “soliciting material” or “filed” with the SEC, nor shall such information be incorporated by reference into any future filing under the Securities Act of 1933 or the Securities Exchange Act of 1934, each as amended, except to the extent that we specifically incorporate it by reference into such filing.
The stock performance graph below compares the percentage change in cumulative stockholder return on our Class A common stock for the period from
April 30, 2013
through
December 31, 2018
, with the cumulative total return on the Russell 2000 Index and our Industry Peer Group ("Peer Group"). The stock performance graph assumes the investment on
April 30, 2013
of $100.00 in our Class A common stock at the closing price on such date, in the Russell 2000 Index and the Peer Group, and that dividends are reinvested. No dividends have been declared or paid on our Class A common stock.
29
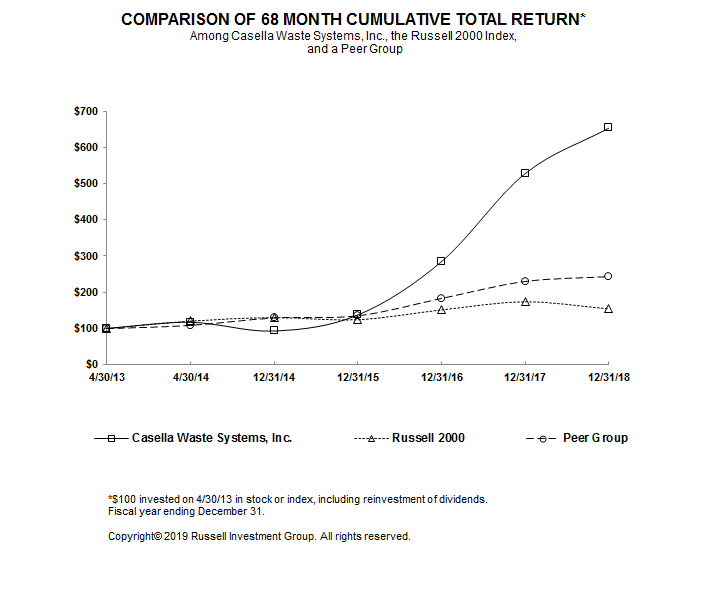
|
April 30, 2013
|
April 30, 2014
|
December 31, 2014
|
December 31, 2015
|
December 31, 2016
|
December 31, 2017
|
December 31, 2018
|
|||||||||||||||||||||
|
Casella Waste Systems, Inc.
|
$
|
100.00
|
|
$
|
116.97
|
|
$
|
92.66
|
|
$
|
137.16
|
|
$
|
284.63
|
|
$
|
527.98
|
|
$
|
653.44
|
|
||||||
|
Russell 2000
|
$
|
100.00
|
|
$
|
120.50
|
|
$
|
130.04
|
|
$
|
124.30
|
|
$
|
150.79
|
|
$
|
172.87
|
|
$
|
153.83
|
|
||||||
|
Peer Group (1)
|
$
|
100.00
|
|
$
|
109.03
|
|
$
|
129.44
|
|
$
|
135.33
|
|
$
|
183.10
|
|
$
|
230.07
|
|
$
|
243.36
|
|
||||||
|
(1)
|
The Peer Group is comprised of Waste Connections Inc., Covanta Holding Corp., Waste Management, Inc. and Republic Services, Inc.
|
30
ITEM 6. SELECTED FINANCIAL DATA
The selected consolidated financial and operating data set forth below was derived from the consolidated financial statements included in Item 8 of this Annual Report on Form 10-K and from the consolidated financial statements included in Item 8 of previous Annual Reports on Form 10-K and a Transition Report on Form 10-KT that we filed with the SEC. This information should be read in conjunction with Item 7, “
Management’s Discussion and Analysis of Financial Condition and Results of Operations
” and our consolidated financial statements and notes thereto included in Item 8 of this Annual Report on Form 10-K.
|
|
Fiscal Year Ended
December 31, |
Eight Months Ended December31, 2014 |
Fiscal Year Ended
April 30, 2014 |
||||||||||||||||||||
|
|
2018
|
2017
|
2016
|
2015
|
|||||||||||||||||||
|
Statement of Operations Data:
|
(in thousands, except per share data)
|
||||||||||||||||||||||
|
Revenues
|
$
|
660,660
|
|
$
|
599,309
|
|
$
|
565,030
|
|
$
|
546,500
|
|
$
|
368,374
|
|
$
|
497,633
|
|
|||||
|
Cost of operations
|
453,291
|
|
405,188
|
|
381,973
|
|
382,615
|
|
258,650
|
|
354,592
|
|
|||||||||||
|
General and administration
|
84,791
|
|
79,243
|
|
75,356
|
|
72,892
|
|
45,732
|
|
61,865
|
|
|||||||||||
|
Depreciation and amortization
|
70,508
|
|
62,102
|
|
61,856
|
|
62,704
|
|
41,485
|
|
60,339
|
|
|||||||||||
|
Southbridge Landfill closure charge, net
|
8,054
|
|
65,183
|
|
—
|
|
—
|
|
—
|
|
—
|
|
|||||||||||
|
Contract settlement charge
|
2,100
|
|
—
|
|
—
|
|
1,940
|
|
—
|
|
—
|
|
|||||||||||
|
Expense from acquisition activities and other items
|
1,872
|
|
176
|
|
—
|
|
—
|
|
—
|
|
144
|
|
|||||||||||
|
Development project charge
|
311
|
|
—
|
|
—
|
|
—
|
|
—
|
|
1,394
|
|
|||||||||||
|
Environmental remediation charge
|
—
|
|
—
|
|
900
|
|
—
|
|
950
|
|
400
|
|
|||||||||||
|
Divestiture transactions
|
—
|
|
—
|
|
—
|
|
(5,517
|
)
|
(553
|
)
|
7,455
|
|
|||||||||||
|
Severance and reorganization costs
|
—
|
|
—
|
|
—
|
|
—
|
|
—
|
|
586
|
|
|||||||||||
|
Gain on settlement of acquisition related contingent consideration
|
—
|
|
—
|
|
—
|
|
—
|
|
—
|
|
(1,058
|
)
|
|||||||||||
|
Operating income (loss)
|
39,733
|
|
(12,583
|
)
|
44,945
|
|
31,866
|
|
22,110
|
|
11,916
|
|
|||||||||||
|
Interest expense, net
|
26,021
|
|
24,887
|
|
38,652
|
|
40,090
|
|
25,392
|
|
37,863
|
|
|||||||||||
|
Other expense (income), net
|
7,676
|
|
(418
|
)
|
12,657
|
|
2,206
|
|
1,825
|
|
(436
|
)
|
|||||||||||
|
Income (loss) from continuing operations before income taxes and discontinued operations
|
6,036
|
|
(37,052
|
)
|
(6,364
|
)
|
(10,430
|
)
|
(5,107
|
)
|
(25,511
|
)
|
|||||||||||
|
(Benefit) provision for income taxes
|
(384
|
)
|
(15,253
|
)
|
494
|
|
1,351
|
|
703
|
|
1,799
|
|
|||||||||||
|
Income (loss) from continuing operations before discontinued operations
|
6,420
|
|
(21,799
|
)
|
(6,858
|
)
|
(11,781
|
)
|
(5,810
|
)
|
(27,310
|
)
|
|||||||||||
|
Income from discontinued operations
|
—
|
|
—
|
|
—
|
|
—
|
|
—
|
|
284
|
|
|||||||||||
|
Loss on disposal of discontinued operations
|
—
|
|
—
|
|
—
|
|
—
|
|
—
|
|
(378
|
)
|
|||||||||||
|
Net income (loss)
|
6,420
|
|
(21,799
|
)
|
(6,858
|
)
|
(11,781
|
)
|
(5,810
|
)
|
(27,404
|
)
|
|||||||||||
|
Less: Net (loss) income attributable to noncontrolling interests
|
—
|
|
—
|
|
(9
|
)
|
1,188
|
|
208
|
|
(4,309
|
)
|
|||||||||||
|
Net income (loss) attributable to common stockholders
|
$
|
6,420
|
|
$
|
(21,799
|
)
|
$
|
(6,849
|
)
|
$
|
(12,969
|
)
|
$
|
(6,018
|
)
|
$
|
(23,095
|
)
|
|||||
|
Basic earnings per share attributable to common stockholders:
|
|||||||||||||||||||||||
|
Weighted average common shares outstanding
|
42,688
|
|
41,846
|
|
41,233
|
|
40,642
|
|
40,262
|
|
39,820
|
|
|||||||||||
|
Basic earnings per common share (1)
|
$
|
0.15
|
|
$
|
(0.52
|
)
|
$
|
(0.17
|
)
|
$
|
(0.32
|
)
|
$
|
(0.15
|
)
|
$
|
(0.58
|
)
|
|||||
|
Diluted earnings per share attributable to common stockholders:
|
|||||||||||||||||||||||
|
Weighted average common shares outstanding
|
44,168
|
|
41,846
|
|
41,233
|
|
40,642
|
|
40,262
|
|
39,820
|
|
|||||||||||
|
Basic earnings per common share (1)
|
$
|
0.15
|
|
$
|
(0.52
|
)
|
$
|
(0.17
|
)
|
$
|
(0.32
|
)
|
$
|
(0.15
|
)
|
$
|
(0.58
|
)
|
|||||
31
|
Fiscal Year Ended
December 31, |
Eight Months
Ended
December31, 2014
|
Fiscal Year Ended
April 30, 2014 |
|||||||||||||||||||||
|
|
2018
|
2017
|
2016
|
2015
|
|||||||||||||||||||
|
Other Data:
|
|||||||||||||||||||||||
|
Capital expenditures
|
$
|
73,232
|
|
$
|
64,862
|
|
$
|
54,238
|
|
$
|
49,995
|
|
$
|
55,061
|
|
$
|
45,959
|
|
|||||
|
Cash flows provided by operating activities
|
$
|
120,834
|
|
$
|
107,538
|
|
$
|
80,434
|
|
$
|
70,507
|
|
$
|
38,286
|
|
$
|
49,642
|
|
|||||
|
Cash flows used in investing activities
|
$
|
(164,197
|
)
|
$
|
(76,447
|
)
|
$
|
(62,964
|
)
|
$
|
(48,784
|
)
|
$
|
(59,697
|
)
|
$
|
(57,910
|
)
|
|||||
|
Cash flows provided by (used in) financing activities
|
$
|
45,375
|
|
$
|
(31,640
|
)
|
$
|
(18,585
|
)
|
$
|
(26,087
|
)
|
$
|
25,141
|
|
$
|
9,008
|
|
|||||
|
Balance Sheet Data:
|
|||||||||||||||||||||||
|
Cash and cash equivalents
|
$
|
4,007
|
|
$
|
1,995
|
|
$
|
2,544
|
|
$
|
2,312
|
|
$
|
2,205
|
|
$
|
2,464
|
|
|||||
|
Restricted cash
|
$
|
—
|
|
$
|
—
|
|
$
|
—
|
|
$
|
1,347
|
|
$
|
5,819
|
|
$
|
—
|
|
|||||
|
Working capital, net (2)
|
$
|
(18,411
|
)
|
$
|
(6,184
|
)
|
$
|
(6,382
|
)
|
$
|
(10,990
|
)
|
$
|
(9,968
|
)
|
$
|
(21,405
|
)
|
|||||
|
Property, plant and equipment, net
|
$
|
404,577
|
|
$
|
361,547
|
|
$
|
398,466
|
|
$
|
402,252
|
|
$
|
414,542
|
|
$
|
403,424
|
|
|||||
|
Goodwill
|
$
|
162,734
|
|
$
|
122,605
|
|
$
|
119,899
|
|
$
|
118,976
|
|
$
|
119,170
|
|
$
|
119,139
|
|
|||||
|
Total assets
|
$
|
732,410
|
|
$
|
614,949
|
|
$
|
631,512
|
|
$
|
633,669
|
|
$
|
658,198
|
|
$
|
638,285
|
|
|||||
|
Long-term debt and capital leases, less current maturities
|
$
|
542,001
|
|
$
|
477,576
|
|
$
|
503,961
|
|
$
|
505,985
|
|
$
|
522,458
|
|
$
|
495,522
|
|
|||||
|
Total stockholders’ deficit
|
$
|
(15,832
|
)
|
$
|
(37,862
|
)
|
$
|
(24,550
|
)
|
$
|
(21,597
|
)
|
$
|
(12,020
|
)
|
$
|
(8,537
|
)
|
|||||
|
(1)
|
Computed as described in Note 3,
Summary of Significant Accounting Policies
to the consolidated financial statements included in Item 8 of this Annual Report on Form 10-K.
|
|
(2)
|
Working capital, net is defined as current assets, excluding cash and cash equivalents, minus current liabilities.
|
ITEM 7. MANAGEMENT’S DISCUSSION AND ANALYSIS OF FINANCIAL CONDITION AND RESULTS OF OPERATIONS
The following discussion of our financial condition and results of operations should be read in conjunction with the consolidated financial statements and notes thereto, and other financial information, included elsewhere in this Annual Report on Form 10-K. This discussion contains forward-looking statements and involves numerous risks and uncertainties. Our actual results may differ materially from those contained in any forward-looking statements.
Company Overview
Founded in 1975 with a single truck, Casella Waste Systems, Inc. is a regional, vertically integrated solid waste services company. We provide resource management expertise and services to residential, commercial, municipal and industrial customers, primarily in the areas of solid waste collection and disposal, transfer, recycling and organics services. We provide integrated solid waste services in six states: Vermont, New Hampshire, New York, Massachusetts, Maine and Pennsylvania, with our headquarters located in Rutland, Vermont. We manage our solid waste operations on a geographic basis through two regional operating segments, the Eastern and Western regions, each of which provides a full range of solid waste services, and our larger-scale recycling and commodity brokerage operations through our Recycling segment. Organics services, ancillary operations, along with major account and industrial services, are included in our Other segment.
As of
January 31, 2019
, we owned and/or operated
37
solid waste collection operations,
49
transfer stations,
18
recycling facilities,
eight
Subtitle D landfills,
four
landfill gas-to-energy facilities and
one
landfill permitted to accept construction and demolition materials.
Acquisitions and Divestitures
Acquisitions
We have a business development team that identifies acquisition candidates, categorizes the opportunity by strategic fit and perceived level of financial accretion, establishes contact with the appropriate representative of the acquisition candidate and gathers further information on the acquisition candidate.
32
We have made in the past, and we may make in the future, acquisitions in order to acquire or develop additional disposal capacity. These acquisitions may include “tuck-in” acquisitions within our existing markets, assets that are adjacent to or outside of our existing markets, or larger, more strategic acquisitions. In addition, from time to time, we may acquire businesses that are complementary to our core business strategy. We face competition for acquisition targets, particularly the larger and more meaningful targets, but we believe that our strong relationships and reputation in New England and the upstate New York area help to offset this factor.
In the fiscal year ended December 31 2018 ("fiscal year 2018"), we acquired six solid waste collection businesses and one transfer business in our Western region and two businesses comprised of solid waste collection and transfer operations in our Eastern region, with approximately $77.0 million of annualized revenues, for total consideration of $99.5 million, including $86.7 million in cash, $4.3 million in Class A common stock, and $8.5 million in contingent consideration and holdbacks to the sellers.
In the fiscal year ended December 31, 2017 ("fiscal year 2017"), we acquired one solid waste collection business in our Eastern region and three solid waste collection businesses in our Western region for total consideration of $8.1 million, including $4.8 million in cash, $2.4 million in notes payable, $0.8 million in holdbacks to the sellers and $0.1 million of other consideration.
In the fiscal year ended December 31, 2016 ("fiscal year 2016"), we acquired three transfer stations in our Western region for total consideration of $2.8 million, including $2.4 million in cash and $0.4 million in holdbacks to the sellers.
Divestitures
From time to time, we may sell or divest certain investments or other components of our business. These divestitures may be undertaken for a number of reasons, including: to generate proceeds to pay down debt; as a result of a determination that the specified asset will provide inadequate returns to us or that the asset no longer serves a strategic purpose in connection with our business; or as a result of a determination that the asset may be more valuable to a third-party. We will continue to look to divest certain activities and investments that no longer enhance or complement our core business if the right opportunity presents itself.
Results of Operations
Revenues
We manage our solid waste operations, which include a full range of solid waste services, on a geographic basis through two regional operating segments, which we designate as our Eastern and Western regions. Revenues in our Eastern and Western regions consist primarily of fees charged to customers for solid waste collection and disposal, landfill, landfill gas-to-energy, transfer and recycling services. We derive a substantial portion of our collection revenues from commercial, industrial and municipal services that are generally performed under service agreements or pursuant to contracts with municipalities. The majority of our residential collection services are performed on a subscription basis with individual households. Landfill and transfer customers are charged a tipping fee on a per ton basis for disposing of their solid waste at our disposal facilities and transfer stations. We also generate and sell electricity at certain of our landfill facilities. Revenues from our Recycling segment consist of revenues derived from municipalities and customers in the form of processing fees, tipping fees and commodity sales. Revenues from organics services, ancillary operations, and major account and industrial services are included in our Other segment. Our revenues are shown net of inter-company eliminations.
The table below shows revenue attributable to services provided (in millions) for the following periods:
|
|
Fiscal Year Ended
December 31, |
$
Change |
Fiscal Year Ended
December 31, |
$
Change |
|||||||||||||||||||
|
|
2018
|
2017
|
2017
|
2016
|
|||||||||||||||||||
|
Collection
|
$
|
303.4
|
|
$
|
263.7
|
|
$
|
39.7
|
|
$
|
263.7
|
|
$
|
249.6
|
|
$
|
14.1
|
|
|||||
|
Disposal
|
181.1
|
|
160.1
|
|
21.0
|
|
160.1
|
|
154.2
|
|
5.9
|
|
|||||||||||
|
Power
|
5.1
|
|
5.4
|
|
(0.3
|
)
|
5.4
|
|
5.9
|
|
(0.5
|
)
|
|||||||||||
|
Processing
|
7.2
|
|
7.9
|
|
(0.7
|
)
|
7.9
|
|
6.4
|
|
1.5
|
|
|||||||||||
|
Solid waste
|
496.8
|
|
437.1
|
|
59.7
|
|
437.1
|
|
416.1
|
|
21.0
|
|
|||||||||||
|
Organics
|
54.2
|
|
39.8
|
|
14.4
|
|
39.8
|
|
41.5
|
|
(1.7
|
)
|
|||||||||||
|
Customer solutions
|
67.5
|
|
60.1
|
|
7.4
|
|
60.1
|
|
54.5
|
|
5.6
|
|
|||||||||||
|
Recycling
|
42.2
|
|
62.3
|
|
(20.1
|
)
|
62.3
|
|
52.9
|
|
9.4
|
|
|||||||||||
|
Total revenues
|
$
|
660.7
|
|
$
|
599.3
|
|
$
|
61.4
|
|
$
|
599.3
|
|
$
|
565.0
|
|
$
|
34.3
|
|
|||||
33
Solid waste revenues
A summary of the period-to-period changes in solid waste revenues (dollars in millions) follows:
|
Period-to-Period
Change for Fiscal Year 2018 vs Fiscal Year 2017 |
Period-to-Period
Change for Fiscal Year 2017 vs Fiscal Year 2016 |
||||||||||||
|
|
Amount
|
% of Growth
|
Amount
|
% of Growth
|
|||||||||
|
Price
|
$
|
19.5
|
|
3.3
|
%
|
$
|
12.0
|
|
2.1
|
%
|
|||
|
Volume
|
6.6
|
|
1.1
|
%
|
4.3
|
|
0.8
|
%
|
|||||
|
Surcharges and other fees
|
7.3
|
|
1.2
|
%
|
0.5
|
|
0.1
|
%
|
|||||
|
Commodity price and volume
|
(0.7
|
)
|
(0.1
|
)%
|
0.8
|
|
0.1
|
%
|
|||||
|
Acquisitions
|
28.8
|
|
4.8
|
%
|
3.4
|
|
0.6
|
%
|
|||||
|
Closed landfill
|
(1.8
|
)
|
(0.3
|
)%
|
—
|
|
—
|
%
|
|||||
|
Solid waste revenues
|
$
|
59.7
|
|
10.0
|
%
|
$
|
21.0
|
|
3.7
|
%
|
|||
Price.
The price change component in fiscal year
2018
solid waste revenues
growth
from the prior year is a result of the following:
|
•
|
$13.9 million
from
favorable
collection pricing; and
|
|
•
|
$5.6 million
from
favorable
disposal pricing associated primarily with our landfills and transfer stations.
|
The price change component in fiscal year
2017
solid waste revenues
growth
from the prior year is a result of the following:
|
•
|
$7.7 million
from
favorable
collection pricing; and
|
|
•
|
$4.3 million
from
favorable
disposal pricing associated with our landfills and transfer stations.
|
Volume.
The volume change component in fiscal year
2018
solid waste revenues
growth
from the prior year is a result of the following:
|
•
|
$0.5 million
from
higher
collection volumes in our Eastern region; and
|
|
•
|
$6.4 million
from
higher
disposal volumes (of which $3.5 million relates to higher transportation volumes associated with a large contaminated soil project, $3.5 million relates to higher landfill volumes, and $(0.6) million relates to lower transfer station volumes associated with the temporary interruption of business due to a fire at one of our transfer stations); partially offset by
|
|
•
|
$(0.3) million
from
lower
processing volumes.
|
The volume change component in fiscal year
2017
solid waste revenues
growth
from the prior year is a result of the following:
|
•
|
$2.7 million
from
higher
collection volumes in our Eastern region;
|
|
•
|
$1.3 million
from
higher
disposal volumes (of which $0.5 million relates to higher landfill volumes, $0.3 million relates to higher transportation volumes, and $0.5 million relates to higher transfer station volumes); and
|
|
•
|
$0.3 million
from
higher
processing volumes.
|
Surcharges and other fees.
The fuel surcharge and other fees change component in fiscal year
2018
solid waste revenues
growth
from the prior year is a result of
$7.3 million
from higher recovery of the Energy component of the Energy and Environmental fee and a higher recovery from the Sustainability Recycling Adjustment fee ("SRA fee") that has anniversaried. The Energy component of the fee floats on a monthly basis based on diesel fuel prices. The Energy component of the fee increased due to both the further implementation of the program and higher diesel fuel pricing. The SRA fee floats on a monthly basis based on recycled commodity prices.
Commodity price and volume.
The commodity price and volume change component in fiscal year
2018
solid waste revenues
growth
from the prior year is a result of the following:
|
•
|
$(0.5) million from unfavorable energy pricing and $(0.5) million from lower volumes in processing; partially offset by
|
|
•
|
$0.3 million from higher landfill gas-to-energy volumes.
|
34
The commodity price and volume change component in fiscal year
2017
solid waste revenues
growth
from the prior year is a result of the following:
|
•
|
$1.3 million from favorable commodity pricing and higher volumes in processing; partially offset by
|
|
•
|
$(0.5) million from lower landfill gas-to-energy volumes.
|
Acquisitions.
The acquisitions change component in fiscal year
2018
solid waste revenues
growth
is a result of the acquisition of six solid waste collection businesses and one transfer business in our Western region and two businesses comprised of solid waste collection and transfer operations in our Eastern region in fiscal year 2018, combined to a lesser extent with roll over impact of acquisitions made in fiscal year 2017.
The acquisitions and divestitures change component in fiscal year
2017
solid waste revenues
growth
is a result of the acquisition of four solid waste collection businesses in fiscal year 2017, combined to a lesser extent with roll over impact of acquisitions made in fiscal year 2016.
Closed landfill.
The closed landfill change component in fiscal year
2018
total solid waste revenues
growth
from prior year is the result of the closure of the Southbridge Landfill in our Eastern region in the quarter ended December 31, 2018.
Organics revenues
Fiscal year
2018
organics revenues
increased
$14.4 million
from the prior year as a result of higher volumes, primarily related to a large new sludge transportation and disposal contract, and, to a lesser extent, favorable pricing.
Fiscal year
2017
organics revenues
decreased
$(1.7) million
from the prior year as a result of lower volumes.
Customer Solutions revenues
Fiscal year
2018
revenues
increased
$7.4 million
from the prior year as a result of higher volumes.
Fiscal year
2017
revenues
increased
$5.6 million
from the prior year as a result of higher volumes.
Recycling revenues
Fiscal year
2018
recycling revenues
decreased
from the prior year as a result of the following:
|
•
|
$(23.5) million
from
unfavorable
commodity pricing in the marketplace; and
|
|
•
|
$(7.2) million
from
lower
commodity volumes; partially offset by
|
|
•
|
$10.6 million
from
higher
tipping fees, as we increased variable tipping fees at our facilities as commodity prices declined.
|
Fiscal year
2017
recycling revenues
increased
from the prior year as a result of the following:
|
•
|
$10.4 million
from
favorable
commodity pricing in the marketplace; and
|
|
•
|
$0.2 million
from
higher
commodity volumes; partially offset by
|
|
•
|
$(1.2) million
from
lower
tipping fees, as we reduced variable tipping fees at our facilities as commodity prices increased.
|
35
Operating Expenses
A summary of our cost of operations, general and administration expenses and depreciation and amortization expenses is as follows (dollars in millions and as a percentage of total revenues):
|
|
Fiscal Years Ended
December 31, |
|||||||||||||||||||
|
|
2018
|
2017
|
2016
|
|||||||||||||||||
|
|
|
|
||||||||||||||||||
|
Cost of operations
|
$
|
453.3
|
|
68.6
|
%
|
$
|
405.2
|
|
67.6
|
%
|
$
|
382.0
|
|
67.6
|
%
|
|||||
|
General and administration
|
$
|
84.8
|
|
12.8
|
%
|
$
|
79.2
|
|
13.2
|
%
|
$
|
75.4
|
|
13.3
|
%
|
|||||
|
Depreciation and amortization
|
$
|
70.5
|
|
10.7
|
%
|
$
|
62.1
|
|
10.4
|
%
|
$
|
61.9
|
|
10.9
|
%
|
|||||
Cost of Operations
Cost of operations includes labor costs, tipping fees paid to third-party disposal facilities, fuel costs, maintenance and repair costs of vehicles and equipment, workers’ compensation and vehicle insurance costs, the cost of purchasing materials to be recycled, third-party transportation costs, district and state taxes, host community fees and royalties. Cost of operations also includes accretion expense related to final capping, closure and post-closure obligations, leachate treatment and disposal costs and depletion of landfill operating lease obligations.
Fiscal Year 2018 Compared to Fiscal Year 2017
An explanation of the period-to-period change in cost of operations is as follows:
Third-party direct costs in fiscal year
2018
increased
$23.5 million
from the prior year as a result of the following:
|
•
|
higher hauling and third-party transportation costs associated with: higher collection volumes related to acquisition activity; higher collection volumes related to organic business growth in our Eastern region; a large contaminated soil project in our Western region resulting in higher third-party costs for processing and transportation of soils; higher brokerage volumes in our Customer Solutions line-of-business with high pass through direct costs; and higher volumes being directed to third-party sites driven by a large new sludge transportation and disposal contract in our Organics line-of-business; and
|
|
•
|
higher disposal costs associated with: higher transportation volumes in our Western region; increased third-party disposal pricing in our Western region; acquisition activity; and the use of alternative third-party disposal sites in our Organics line-of-business; partially offset by
|
|
•
|
lower purchased material costs in our Recycling and Customer Solutions lines-of-business.
|
Labor and related benefit costs in fiscal year
2018
increased
$9.1 million
from the prior year as a result of the following:
|
•
|
higher labor costs related to acquisition activity;
|
|
•
|
higher labor costs related to higher collection volumes in our Eastern region;
|
|
•
|
higher labor costs related to higher wages in our Western region; and
|
|
•
|
higher labor costs as we slowed processing lines and added labor in an effort to improve product quality and reduce contamination in finished products in our Recycling line-of-business
.
|
Direct operational costs in fiscal year
2018
increased
$6.0 million
from the prior year as a result of the following:
|
•
|
higher host community fees on higher volumes associated with certain landfills in our Eastern and Western regions;
|
|
•
|
higher accretion expense associated with the acceleration of asset retirement obligations due to the closure of the Subtitle D landfill located in Southbridge, Massachusetts ("Southbridge Landfill") in our Eastern region;
|
|
•
|
higher landfill operating lease amortization associated primarily with increased landfill volumes at certain landfills in our Western region;
|
|
•
|
higher landfill operating costs at certain landfills in our Eastern and Western regions; and
|
|
•
|
higher supplies and consumables cost in our Organics and Recycling lines-of-business.
|
Maintenance and repair costs in fiscal year
2018
increased
$5.9 million
from the prior year as a result of higher fleet and facility maintenance costs due to acquisition activity and organic business growth.
36
Fuel costs in fiscal year
2018
increased
$3.5 million
from the prior year as a result of higher diesel fuel pricing in the marketplace combined with higher volumes primarily associated with acquisition activity. The impact of higher fuel costs in the periods was almost completely offset through higher revenues from fees associated with the Energy component of the Energy and Environmental fee.
Fiscal Year 2017 Compared to Fiscal Year 2016
An explanation of the period-to-period change in cost of operations is as follows:
Third-party direct costs in fiscal year
2017
increased
$9.1 million
from the prior year as a result of the following:
|
•
|
higher purchased material costs in our Recycling and Customer Solutions lines-of-business;
|
|
•
|
higher disposal costs associated with higher transfer station volumes in our Western region, and additional costs from the use of alternative disposal sites in our Organics line-of-business; and
|
|
•
|
higher hauling and transportation costs associated with higher collection volumes in our Eastern region and increased volumes on lower margin commercial work in our Customer Solutions line-of-business; partially offset by decreased transportation services provided in our Western region; and lower commodity volumes in our Organics line-of-business.
|
Labor and related benefit costs in fiscal year
2017
increased
$5.4 million
from the prior year as a result of the following:
|
•
|
higher healthcare costs of $1.7 million associated with claims experience;
|
|
•
|
higher labor costs associated with higher collection volumes in our Eastern region, higher landfill and transfer station volumes in our Western region, as well as customer growth related to several new municipal contracts; and
|
|
•
|
higher labor costs associated with higher product quality standards from commodity buyers resulting in lower throughput and additional manpower needs in our Recycling line-of-business, and to a lesser extent higher volumes.
|
Direct operational costs in fiscal year
2017
increased
$5.5 million
from the prior year as a result of the following:
|
•
|
higher leachate disposal costs and landfill operating costs at certain landfills in our Western region due to increased rainfall through early summer and the timing of various landfill construction projects;
|
|
•
|
higher host community fees associated with increased volumes at certain landfills in our Western region;
|
|
•
|
higher accretion expense associated with the acceleration of asset retirement obligations due to the closure of Southbridge Landfill; and
|
|
•
|
higher equipment rental costs in our Eastern region; partially offset by
|
|
•
|
lower landfill operating costs associated with certain landfills in our Eastern region.
|
Maintenance and repair costs in fiscal year
2017
increased
$2.3 million
from the prior year as a result of the following:
|
•
|
higher fleet maintenance costs in our Western region; and
|
|
•
|
higher facility maintenance costs in our Recycling region.
|
Fuel costs in fiscal year
2017
increased
$0.9 million
from the prior year as a result of higher consumption and increased diesel fuel prices.
General and Administration
General and administration expenses include management, clerical and administrative compensation and overhead, professional services and costs associated with marketing, sales force and community relations efforts.
Fiscal Year 2018 Compared to Fiscal Year 2017
An explanation of the period-to-period change in general and administration expense is as follows:
Labor and related benefit costs in fiscal year
2018
increased
$2.6 million
from the prior year as a result of higher labor costs associated with acquisition activity, and higher equity compensation expense associated with performance stock unit grants that incur expense based on actual and estimated operational performance, partially offset by lower accrued incentive compensation.
37
Professional fees in fiscal year
2018
increased
$1.4 million
as a result of higher legal fees associated with various legal proceedings, as discussed in Note 11,
Commitments and Contingencies
to our consolidated financial statements included under Item 8 of this Annual Report on Form 10-K, and higher consulting, accounting and audit fees associated with the implementation of an enterprise resource planning and accounting software solution and the adoption of new accounting guidance.
Bad debt expense in fiscal year
2018
increased
$1.3 million
due primarily to the impact of revenue growth, a large recovery in the prior year and several customer bankruptcies.
Fiscal Year 2017 Compared to Fiscal Year 2016
An explanation of the period-to-period change in general and administration expense is as follows:
Labor and related benefit costs in fiscal year
2017
increased
$3.9 million
from the prior year as a result of the following:
|
•
|
higher equity compensation expense of $3.0 million associated with the timing and assumptions used for market-based performance stock option and market-based performance stock unit grants; and
|
|
•
|
higher benefit costs with increased healthcare costs of $0.8 million.
|
Other general and administration expenses in fiscal year
2017
increased
$1.0 million
from the prior year as a result of higher recruiting and software and information technology consulting costs.
Bad debt expense in fiscal year 2017 decreased $(0.8) million due to improved credit processes and collectability issues associated with a disposal customer in the prior year.
Depreciation and Amortization
Depreciation and amortization expense includes: (i) depreciation of property and equipment (including assets recorded for capital leases) on a straight-line basis over the estimated useful lives of the assets; (ii) amortization of landfill costs (including those costs incurred and all estimated future costs for landfill development and construction, along with asset retirement costs arising from closure and post-closure obligations) on a units-of-consumption method as landfill airspace is consumed over the total estimated remaining capacity of a site, which includes both permitted capacity and unpermitted expansion capacity that meets certain criteria for amortization purposes; (iii) amortization of landfill asset retirement costs arising from final capping obligations on a units-of-consumption method as airspace is consumed over the estimated capacity associated with each final capping event; and (iv) amortization of intangible assets with a definite life, using either an economic benefit provided approach or on a straight-line basis over the definitive terms of the related agreements.
A summary of the components of depreciation and amortization expense (dollars in millions and as a percentage of total revenues) follows:
|
Fiscal Year Ended December 31,
|
||||||||||||||||||||
|
|
2018
|
2017
|
2016
|
|||||||||||||||||
|
|
|
|
||||||||||||||||||
|
Depreciation expense
|
$
|
35.4
|
|
5.4
|
%
|
$
|
32.1
|
|
5.4
|
%
|
$
|
33.2
|
|
5.9
|
%
|
|||||
|
Landfill amortization expense
|
31.8
|
|
4.8
|
%
|
27.9
|
|
4.7
|
%
|
26.5
|
|
4.7
|
%
|
||||||||
|
Other amortization expense
|
3.3
|
|
0.5
|
%
|
2.1
|
|
0.3
|
%
|
2.2
|
|
0.3
|
%
|
||||||||
|
$
|
70.5
|
|
10.7
|
%
|
$
|
62.1
|
|
10.4
|
%
|
$
|
61.9
|
|
10.9
|
%
|
||||||
Fiscal Year 2018 Compared to Fiscal Year 2017
An explanation of the period-to-period change in depreciation and amortization expense is as follows:
|
•
|
depreciation and other amortization expense increased due to acquisition activity; and
|
|
•
|
landfill amortization expense increased due to higher landfill volumes at certain landfills in our Eastern and Western regions, combined with an increase in our average overall amortization rate as a result of changes in cost estimates and other assumptions associated with our landfills.
|
Fiscal Year 2017 Compared to Fiscal Year 2016
38
An explanation of the period-to-period change in depreciation and amortization expense is as follows:
|
•
|
landfill amortization expense increased in fiscal year 2017 from the prior year due to the higher landfill volumes in our Western region combined with an increase in our average overall amortization rate as a result of changes in cost estimates and other assumptions associated with our landfills; partially offset by
|
|
•
|
lower depreciation expense due to the asset impairment associated with closure of the Southbridge Landfill, the timing of capital expenditures and acquisitions, and the related make-up of fixed assets.
|
39
Southbridge Landfill Closure Charge, Net
In June 2017, we initiated the plan to cease operations of our Southbridge Landfill
.
Accordingly, in fiscal years 2018 and 2017, we recorded charges associated with the closure of our Southbridge Landfill as follows:
|
|
Fiscal Year Ended
December 31, |
||||||
|
|
2018
|
2017
|
|||||
|
Asset impairment charge (1)
|
$
|
—
|
|
$
|
48.0
|
|
|
|
Project development charge (2)
|
—
|
|
9.1
|
|
|||
|
Environmental remediation charge (3)
|
—
|
|
6.4
|
|
|||
|
Contract settlement charge (4)
|
8.7
|
|
—
|
|
|||
|
Landfill closure project charge (5)
|
6.0
|
|
—
|
|
|||
|
Charlton settlement charge (6)
|
1.2
|
|
—
|
|
|||
|
Legal and transaction costs (7)
|
2.2
|
|
1.7
|
|
|||
|
Recovery on insurance settlement (8)
|
(10.0
|
)
|
—
|
|
|||
|
Southbridge Landfill closure charge, net
|
$
|
8.1
|
|
$
|
65.2
|
|
|
|
(1)
|
We performed a test of recoverability under Financial Accounting Standards Board ("FASB") Accounting Standards Codification ("ASC") 360, which indicated that the carrying value of our asset group that includes the Southbridge Landfill was no longer recoverable and, as a result, the asset group was assessed for impairment with an impairment charge allocated to the long-lived assets of the Southbridge Landfill in accordance with FASB ASC 360.
|
|
(2)
|
We wrote-off deferred costs associated with Southbridge Landfill permitting activities no longer deemed viable.
|
|
(3)
|
We recorded an environmental remediation charge associated with the installation of a municipal waterline.
|
|
(4)
|
We recorded a contract settlement charge associated with the closure of Southbridge Landfill and the remaining future obligations due to the Town of Southbridge under the landfill operating agreement with the Town of Southbridge.
|
|
(5)
|
We recorded a landfill closure project charge associated with increased costs under the revised closure plan at our Southbridge Landfill.
|
|
(6)
|
We established a reserve associated with settlement of the Town of Charlton's claim against us.
|
|
(7)
|
We incurred legal and other transaction costs associated with various matters as part of the Southbridge Landfill closure.
|
|
(8)
|
We recorded a recovery on an environmental insurance settlement associated with the Southbridge Landfill closure.
|
See Item 3, "
Legal Proceedings
" of this Annual Report on Form 10-K and Note 11,
Commitments and Contingencies
to our consolidated financial statements included under Item 8 of this Annual Report on Form 10-K for additional disclosure over the closure of Southbridge Landfill.
Contract Settlement Charge
In fiscal year 2018, we recorded contract settlement charges of $2.1 million associated with the termination and discounted buy-out of a commodities marketing and brokerage agreement.
Expense from Acquisition Activities and Other Items
In fiscal year 2018, we recorded a charge of $1.9 million associated with acquisition activities and the write-off of deferred costs related to the expiration of our shelf registration statement and, in fiscal year 2017, we recorded a charge of $0.2 million related to acquisition activities.
Development Project Charge
In fiscal year 2018, we recorded development project charges of $0.3 million associated with previously deferred costs that were written off as a result of the negative vote in a public referendum relating to the North Country Environmental Services landfill ("NCES Landfill").
Environmental Remediation Charge
40
We recorded an environmental remediation charge of $0.9 million in fiscal year 2016 due to changes in cost estimates associated with the Potsdam environmental remediation liability as discussed in Note 11,
Commitments and Contingencies
to our consolidated financial statements included in Item 8 of this Annual Report on Form 10-K.
Other expenses
Interest Expense, net
Our interest expense, net increased
$1.1 million
in fiscal year
2018
and decreased
$(13.8) million
in fiscal year
2017
from the prior years, respectively. As described below, we successfully lowered our borrowing costs in fiscal year 2017 through the refinancing of our previously outstanding senior secured credit facility and the early redemption, repurchase and retirement of the remaining $370.3 million of our 7.75% senior subordinated notes due February 2019 ("2019 Notes") in fiscal year 2016. We continued to lower our borrowing costs in fiscal year 2017 through the repricing of our previously outstanding senior secured credit facility and the eventual refinancing of our than existing senior secured credit facility in fiscal year 2018. In order to fix our interest rates and reduce our market risk, we completed the issuance or remarketing of various tax-exempt bonds from fiscal year 2016 to fiscal year 2018, and successfully hedged, up to $190.0 million as of December 31, 2018, the variable rate portion of our long-term debt by entering into interest rate derivative agreements. As a result, we have been able to reduce our borrowing costs and our exposure to market risk, while providing ourselves with more financial flexibility to pursue growth opportunities through acquisitions in fiscal year 2018. This acquisition activity resulted in higher average debt balances in fiscal year 2018 and, as a result, higher interest expense despite our lower borrowing costs.
Impairment of Investments
As of
December 31, 2018
, we owned
6.8%
of the outstanding common stock of Recycle Rewards, Inc. (“Recycle Rewards”), a company that markets an incentive based recycling service. In fiscal year 2018, it was determined based on the operating performance of Recycle Rewards that our cost method investment in Recycle Rewards was potentially impaired. As a result, we performed a valuation analysis in fiscal year 2018, which used an income approach based on discounted cash flows to determine an equity value for Recycle Rewards in order to properly value our cost method investment in Recycle Rewards. Based on this analysis, it was determined that the fair value of our cost method investment in Recycle Rewards was less than the carrying amount and, therefore, we recorded an other-than-temporary investment impairment charge of
$1.1 million
in fiscal year 2018.
Loss on Debt Extinguishment
In order to lower our borrowing costs and reduce our market risk we completed the following transactions that resulted in a loss on debt extinguishment in fiscal years
2018
,
2017
and
2016
of
$7.4 million
,
$0.5 million
and
$13.7 million
, respectively, associated with the following:
|
•
|
the write-off of debt issuance costs and unamortized discount, in the case of our term loan B facility ("Term Loan B Facility") in fiscal year 2018, associated with the refinancing of our previously outstanding senior secured credit facilities in fiscal year 2018 and fiscal year 2016 and an amendment to our previously outstanding senior secured credit facility in fiscal year 2017:
|
|
•
|
the write-off of debt issuance costs in connection with the remarketing of our Vermont Economic Development Authority Solid Waste Disposal Long-Term Revenue Bonds Series 2013 ("Vermont Bonds") in fiscal year 2018 and the remarketing of our Finance Authority of Maine Solid Waste Disposal Revenue Bonds Series 2005R-1 (“FAME Bonds 2005R-1”) and Finance Authority of Maine Solid Waste Disposal Revenue Bonds Series 2005R-2 (“FAME Bonds 2005R-2”) into the Finance Authority of Maine Solid Waste Disposal Revenue Bonds Series 2005R-3 ("FAME Bonds 2005R-3") in fiscal year 2017; and
|
|
•
|
the repurchase price premium and write-off of debt issuance costs and unamortized original issue discount associated with the early redemption, repurchase and retirement of our then outstanding 2019 Notes in fiscal years 2016.
|
(Benefit) Provision for Income Taxes
Our (benefit) provision for income taxes was $(0.4) million in fiscal year 2018, $(15.3) million in fiscal year 2017 and $0.5 million in fiscal year 2016. The (benefit) provision for income taxes for fiscal years 2018, 2017 and 2016 include a deferred tax provision (benefit) of $1.3 million, $(15.6) million and $0.6 million, respectively.
41
During fiscal year 2018, we recognized a $(0.9) million deferred tax benefit related to the acquisition of Complete Disposal Company, Inc. and its subsidiary United Material Management of Holyoke, Inc. (collectively, "Complete") due to a reduction of the valuation allowance, including a $(1.6) million deferred tax benefit in the quarter ended March 31, 2018, a $0.4 million deferred tax expense in the quarter ended September 30, 2018 and a $0.3 deferred tax expense in the quarter ended December 31, 2018. The valuation allowance decreased based upon the recognition of additional reversing temporary differences related to the $0.9 million deferred tax liability recorded through goodwill on the acquisition. The $0.9 million deferred tax liability related to the Complete acquisition was based on the impact of temporary differences between the amounts of assets and liabilities recognized for financial reporting purposes and the related tax basis. The $(1.6) million deferred tax benefit recognized in the quarter ended March 31, 2018 was based on initial estimates of the Complete temporary differences and was adjusted by $0.7 million in the subsequent quarters based on the availability of better estimates of the Complete temporary differences upon the filing of the prior year returns by Complete’s sellers and anticipated net operating loss carryforwards.
On December 22, 2017, the Tax Cuts and Jobs Act (the “Act”) was enacted. The Act, which is also commonly referred to as “US tax reform,” significantly changes US corporate income tax laws by, among other things, reducing the US corporate income tax rate from 35% to 21% starting in 2018. Under the Act, the alternative minimum tax has been repealed and minimum tax credit carryforwards become refundable beginning in 2018 and will be fully refunded, if not otherwise used to offset tax liabilities, in tax year 2021. Further, our $110.6 million in federal net operating loss carryforwards generated as of the end of 2017 continue to be carried forward for 20 years and are expected to be available to fully offset taxable income earned in future tax years. Federal net operating losses generated after 2017 are carried forward indefinitely, but generally may only offset up to 80% of taxable income earned in a tax year. In the quarter ending December 31, 2017, we revalued our deferred tax assets and liabilities for changes under the Act including (a) revaluing our federal net deferred taxes assets before valuation allowance using the 21% tax rate; (b) revaluing our federal valuation allowance using the 21% tax rate; and (c) recognizing a federal deferred tax benefit for 80% of indefinite lived deferred tax liabilities, which are anticipated to be available as a source of taxable income upon reversal of deferred tax assets that would also have indefinite lives.
The benefit for income taxes for fiscal year 2018 incorporates the changes under the Act, including use of the 21% US corporate income tax rate and applying the new federal net operating loss carryforward rules. We have $3.8 million minimum tax credit carryforwards of which $1.9 million is refundable for 2018, and recognized in fiscal year 2018 as a current income tax benefit of $1.9 million, offset by $1.9 million in the deferred tax provision.
The deferred tax provision for fiscal year 2016 was primarily related to the deferred tax liability for indefinite lived assets. Since we could not determine when the deferred tax liability related to indefinite lived assets would reverse, this amount could not be used as a future source of taxable income against which to benefit deferred tax assets.
Segment Reporting
A summary of revenues by operating segment (in millions) follows:
|
Fiscal Year Ended December 31,
|
$
Change |
Fiscal Year Ended December 31,
|
$
Change |
||||||||||||||||||||
|
|
2018
|
2017
|
2017
|
2016
|
|||||||||||||||||||
|
|
|
|
|||||||||||||||||||||
|
Eastern
|
$
|
206.5
|
|
$
|
181.2
|
|
$
|
25.3
|
|
$
|
181.2
|
|
$
|
176.5
|
|
$
|
4.7
|
|
|||||
|
Western
|
286.3
|
|
250.8
|
|
35.5
|
|
250.8
|
|
233.2
|
|
17.6
|
|
|||||||||||
|
Recycling
|
42.2
|
|
62.3
|
|
(20.1
|
)
|
62.3
|
|
52.9
|
|
9.4
|
|
|||||||||||
|
Other
|
125.7
|
|
105.0
|
|
20.7
|
|
105.0
|
|
102.4
|
|
2.6
|
|
|||||||||||
|
Total
|
$
|
660.7
|
|
$
|
599.3
|
|
$
|
61.4
|
|
$
|
599.3
|
|
$
|
565.0
|
|
$
|
34.3
|
|
|||||
42
Eastern Region
The following table provides details associated with the period-to-period change in revenues (dollars in millions) attributable to services provided:
|
Period-to-Period
Change for Fiscal Year 2018 vs Fiscal Year 2017 |
Period-to-Period
Change for Fiscal Year 2017 vs Fiscal Year 2016 |
||||||||||||
|
Amount
|
% of Growth
|
Amount
|
% of Growth
|
||||||||||
|
Price
|
$
|
8.1
|
|
4.5
|
%
|
$
|
5.4
|
|
3.1
|
%
|
|||
|
Volume
|
0.3
|
|
0.1
|
%
|
(2.4
|
)
|
(1.4
|
)%
|
|||||
|
Surcharges and other fees
|
2.8
|
|
1.6
|
%
|
—
|
|
—
|
%
|
|||||
|
Commodity price & volume
|
0.1
|
|
0.1
|
%
|
(0.6
|
)
|
(0.4
|
)%
|
|||||
|
Acquisitions
|
15.8
|
|
8.7
|
%
|
2.3
|
|
1.3
|
%
|
|||||
|
Closed landfill
|
(1.8
|
)
|
(1.0
|
)%
|
—
|
|
—
|
%
|
|||||
|
Solid waste revenues
|
$
|
25.3
|
|
14.0
|
%
|
$
|
4.7
|
|
2.6
|
%
|
|||
Price.
The price change component in fiscal year
2018
solid waste revenues
growth
from the prior year is a result of the following:
|
•
|
$6.0 million
from
favorable
collection pricing; and
|
|
•
|
$2.1 million
from
favorable
disposal pricing related to transfer stations and landfills.
|
The price change component in fiscal year
2017
solid waste revenues
growth
from the prior year is a result of the following:
|
•
|
$3.5 million
from
favorable
collection pricing; and
|
|
•
|
$1.9 million
from
favorable
disposal pricing related to transfer stations and landfills.
|
Volume.
The volume change component in fiscal year
2018
solid waste revenues
growth
from the prior year is a result of the following:
|
•
|
$1.6 million
from
higher
collection volumes; partially offset by
|
|
•
|
$(0.9) million
from
lower
disposal volumes (of which $(0.2) million relates to lower landfill volumes and $(0.7) million relates to lower transfer station volumes); and
|
|
•
|
$(0.4) million
from
lower
processing volumes.
|
The volume change component in fiscal year
2017
solid waste revenues
growth
from the prior year is a result of the following:
|
•
|
$(5.3) million
from
lower
disposal volumes (of which $(4.6) million relates to lower landfill volumes, mainly due to the ramp down of tons at our Southbridge Landfill, and $(0.7) million relates to lower transfer station volumes); partially offset by
|
|
•
|
$2.9 million
from
higher
collection volumes.
|
Surcharges and other fees.
The surcharges and other fees change component in in fiscal year
2018
solid waste revenues
growth
from the prior year is a result of higher recovery from the Energy component of the Energy and Environmental fee and a higher recovery from the SRA fee that has anniversaried. The Energy component of the fee floats on a monthly basis based on diesel fuel prices. The Energy component of the fee increased due to both the further implementation of the program and higher diesel fuel pricing. The SRA fee floats on a monthly basis based on recycled commodity prices.
Commodity price and volume.
The commodity price and volume change component in fiscal year
2018
total solid waste revenues
growth
is the result of higher energy volumes.
The commodity price and volume change component in fiscal year
2017
total solid waste revenues growth is the result of decreased energy pricing and volumes.
Acquisitions.
43
The acquisitions and divestitures change component in fiscal year
2018
solid waste revenues
growth
is a result of the acquisition of two business comprised of solid waste collection and transfer operations in fiscal year 2018, combined to a lesser extent with roll over impact of acquisitions made in fiscal year 2017.
The acquisitions and divestitures change component in fiscal year
2017
solid waste revenues
growth
is the result of the acquisition of a solid waste collection business in the quarter ended June 30, 2017.
Closed landfill.
The closed landfill change component in fiscal year
2018
total solid waste revenues
growth
from prior year is the result of the closure of our Southbridge Landfill in the quarter ended December 31, 2018.
Western Region
The following table provides details associated with the period-to-period change in revenues (dollars in millions) attributable to services provided:
|
Period-to-Period
Change for Fiscal Year 2018 vs Fiscal Year 2017 |
Period-to-Period
Change for Fiscal Year 2017 vs Fiscal Year 2016 |
||||||||||||
|
Amount
|
% of Growth
|
Amount
|
% of Growth
|
||||||||||
|
Price
|
$
|
11.3
|
|
4.5
|
%
|
$
|
6.6
|
|
2.8
|
%
|
|||
|
Volume
|
7.6
|
|
3.1
|
%
|
8.0
|
|
3.5
|
%
|
|||||
|
Surcharges and other fees
|
4.5
|
|
1.8
|
%
|
0.5
|
|
0.2
|
%
|
|||||
|
Commodity price & volume
|
(0.9
|
)
|
(0.4
|
)%
|
1.4
|
|
0.6
|
%
|
|||||
|
Acquisitions
|
13.0
|
|
5.2
|
%
|
1.1
|
|
0.5
|
%
|
|||||
|
Solid waste revenues
|
$
|
35.5
|
|
14.2
|
%
|
$
|
17.6
|
|
7.6
|
%
|
|||
Price.
The price change component in fiscal year
2018
solid waste revenues
growth
from the prior year is a result of the following:
|
•
|
$7.9 million
from
favorable
collection pricing; and
|
|
•
|
$3.4 million
from
favorable
disposal pricing related to transfer stations and landfills.
|
The price change component in fiscal year
2017
solid waste revenues
growth
from the prior year is a result of the following:
|
•
|
$4.2 million
from
favorable
collection pricing; and
|
|
•
|
$2.4 million
from
favorable
disposal pricing related to transfer stations and landfills.
|
Volume.
The volume change component in fiscal year
2018
solid waste revenues
growth
from the prior year is a result of the following:
|
•
|
$8.6 million
from
higher
disposal volumes (of which $3.8 million relates to higher landfill volumes and $4.8 million relates to higher transportation volumes associated with a large contaminated soil project); partially offset by
|
|
•
|
$(1.0) million
from
lower
collection volumes.
|
The volume change component in fiscal year
2017
solid waste revenues
growth
from the prior year is a result of the following:
|
•
|
$7.8 million
from
higher
disposal volumes disposal volumes (of which $5.1 million relates to higher landfill volumes, $1.2 million relates to higher transfer station volumes and $1.5 million relates to higher transportation volumes); and
|
|
•
|
$0.3 million
from
higher
processing volumes
.
|
Fuel surcharges and other fees.
The surcharges and other fees change component in fiscal year
2018
solid waste revenues
growth
from the prior year is a result of higher recovery from the Energy component of the Energy and Environmental fee and a higher recovery from the SRA fee that has anniversaried. The Energy component of the fee floats on a monthly basis based on diesel fuel prices. The Energy component of the fee increased due to both the further implementation of the program and higher diesel fuel pricing. The SRA fee floats on a monthly basis based on recycled commodity prices.
44
Commodity price and volume.
The commodity price and volume change component in fiscal year
2018
solid waste revenues
growth
from the prior year is the result of unfavorable energy pricing and lower commodity volumes within our processing operations, partially offset by higher landfill gas-to-energy volumes.
The commodity price and volume change component in fiscal year
2017
solid waste revenues
growth
from the prior year is the result of favorable commodity pricing and higher volumes within our processing operations, partially offset by lower landfill gas-to-energy volumes.
Acquisitions and divestitures.
The acquisitions and divestitures change component in fiscal year
2018
solid waste revenues
growth
from the prior year is the acquisition of six solid waste collection businesses and a transfer business in fiscal year 2018, combined to a lesser extent with roll over impact of acquisitions made in fiscal year 2017.
The acquisitions and divestitures change component in fiscal year
2017
solid waste revenues
growth
from the prior year is the result of the acquisition of three solid waste collection businesses in fiscal year 2017, combined to a lesser extent with roll over impact of acquisitions made in fiscal year 2016.
Operating Income (Loss)
A summary of operating income (loss) by operating segments (in millions) follows:
|
December 31,
|
$
Change |
December 31,
|
$
Change |
||||||||||||||||||||
|
|
2018
|
2017
|
2017
|
2016
|
|||||||||||||||||||
|
|
|
|
|||||||||||||||||||||
|
Eastern
|
$
|
4.7
|
|
$
|
(51.9
|
)
|
$
|
56.6
|
|
$
|
(51.9
|
)
|
$
|
9.7
|
|
$
|
(61.6
|
)
|
|||||
|
Western
|
41.5
|
|
35.0
|
|
6.5
|
|
35.0
|
|
30.6
|
|
4.4
|
|
|||||||||||
|
Recycling
|
(7.8
|
)
|
2.8
|
|
(10.6
|
)
|
2.8
|
|
2.5
|
|
0.3
|
|
|||||||||||
|
Other
|
1.3
|
|
1.5
|
|
(0.2
|
)
|
1.5
|
|
2.1
|
|
(0.6
|
)
|
|||||||||||
|
Total
|
$
|
39.7
|
|
$
|
(12.6
|
)
|
$
|
52.3
|
|
$
|
(12.6
|
)
|
$
|
44.9
|
|
$
|
(57.5
|
)
|
|||||
Eastern Region
Fiscal Year 2018 Compared to Fiscal Year 2017
Eastern region operating income increased
$56.6 million
in fiscal year
2018
from the prior year including the following items:
|
•
|
the $(8.1) million and $(65.2) million Southbridge Landfill closure charge, net in fiscal year 2018 and fiscal year 2017, respectively, associated with the closure of our Southbridge Landfill;
|
|
•
|
the $(0.6) million of expense from acquisition activities and other items associated with acquisition activities; and
|
|
•
|
the $(0.3) million development project charge associated with the write-off of deferred costs associated with our NCES Landfill.
|
Our operating performance in fiscal year
2018
improved as a result of the revenue changes outlined above considering the impact of the following cost changes:
Cost of operations
: Cost of operations increased
$23.3 million
in fiscal year
2018
from the prior year as a result of the following:
|
•
|
higher hauling and third-party transportation costs associated with higher collection volumes related to organic growth and acquisition activity;
|
|
•
|
higher disposal costs associated with the acquisition activity;
|
|
•
|
higher labor costs associated with acquisitions and higher collection volumes;
|
|
•
|
higher fuel costs driven by higher diesel fuel pricing, which was offset by increased revenues from fees associated with the Energy and Environmental fee, combined with higher volumes;
|
|
•
|
higher host community fees at certain landfills;
|
|
•
|
higher accretion expense associated with the acceleration of asset retirement obligations due to the closure of our Southbridge Landfill;
|
|
•
|
higher landfill operating costs primarily at the Southbridge Landfill and the Subtitle D landfill located in West Old Town, Maine; and
|
45
|
•
|
higher fleet and facility maintenance costs.
|
General and administration
: General and administration expense increased
$1.3 million
in fiscal year
2018
due to higher labor and related benefit costs associated with acquisition activity and business growth and higher shared overhead costs associated with equity compensation expense, partially offset by lower accrued incentive compensation.
Depreciation and amortization
: Depreciation and amortization expense increased
$2.7 million
in fiscal year
2018
due primarily to acquisition activity and higher landfill amortization expense associated with volume mix and changes to landfill amortization rates as a result of changes in cost estimates and other assumptions with certain of our landfills.
Fiscal Year 2017 Compared to Fiscal Year 2016
Eastern region operating income decreased
$(61.6) million
in fiscal year
2017
from the prior year including the following items:
|
•
|
the $(65.2) million Southbridge Landfill closure charge, net associated with the closure of our Southbridge Landfill; and
|
|
•
|
the $(0.2) million expense from acquisition activities and other items associated with legal costs for the acquisition of Complete in January 2018.
|
Our operating performance in fiscal year
2017
improved as a result of the revenue changes outlined above considering the impact of the following cost changes:
Cost of operations
: Cost of operations increased
$8.0 million
in fiscal year
2017
from the prior year as a result of the following:
|
•
|
higher hauling and transportation costs associated with higher collection volumes;
|
|
•
|
higher direct labor costs associated with higher collection volumes, customer growth related to several new municipal contracts, and higher healthcare costs of $0.8 million;
|
|
•
|
higher accretion expense associated with the acceleration of asset retirement obligations due to the closure of the Southbridge Landfill; and
|
|
•
|
higher equipment rental costs; partially offset by
|
|
•
|
lower landfill operating costs with certain landfills.
|
General and administration
: General and administration expenses increased by
$1.7 million
in fiscal year
2017
due to higher shared overhead costs associated with an increase in healthcare costs and higher equity compensation expense, partially offset by lower bad debt expense.
Depreciation and amortization
: Depreciation and amortization expense decreased by
$(3.2) million
in fiscal year
2017
due to lower landfill amortization expense associated with lower landfill volumes at the Southbridge Landfill and the NCES Landfill and changes to the asset retirement obligation amortization rate at the NCES Landfill, and lower depreciation expense due to the asset impairment associated with closure of the Southbridge Landfill.
Western Region
Fiscal Year 2018 Compared to Fiscal Year 2017
Western region operating income increased
$6.5 million
in fiscal year
2018
from the prior year including the following item:
|
•
|
the $(1.1) million of expense from acquisition activities and other items associated with acquisition activities.
|
Our operating performance in fiscal year
2018
improved as a result of the revenue changes outlined above considering the impact of the following cost changes:
Cost of operations
: Cost of operations increased
$28.9 million
in fiscal year
2018
from the prior year as a result of the following:
|
•
|
higher hauling and third-party transportation costs associated with higher collection volumes related to acquisition activity and a large contaminated soils project resulting in higher third-party costs for processing and transportation of soils;
|
|
•
|
higher disposal costs associated with higher transportation volumes, increased third-party disposal pricing and acquisition activity;
|
|
•
|
higher labor costs related primarily to acquisition activity and higher wages;
|
|
•
|
higher fuel costs driven by higher diesel fuel pricing, which was offset by increased revenues from fees associated with the Energy and Environmental fee;
|
|
•
|
higher landfill operating lease amortization associated primarily with increased landfill volumes at certain landfills;
|
46
|
•
|
higher landfill operating costs at certain landfills;
|
|
•
|
higher host community fees at certain landfills; and
|
|
•
|
higher fleet maintenance costs.
|
General and administration
: General and administration expense increased
$4.4 million
in fiscal year
2018
due to higher bad debt expense, higher accrued incentive compensation and an increase in shared overhead costs associated with higher equity compensation expense.
Depreciation and amortization
: Depreciation and amortization expense increased
$5.0 million
in fiscal year
2018
due to acquisition activity and higher landfill amortization expense attributed to higher landfill volumes and changes to landfill amortization rates as a result of changes in cost estimates and other assumptions with certain of our landfills.
Fiscal Year 2017 Compared to Fiscal Year 2016
Western region operating income increased
$4.4 million
in fiscal year
2017
from the prior year including the following items:
|
•
|
the $(0.9) million impact of the Potsdam environmental remediation liability charge in fiscal year 2016;
|
Our operating performance in fiscal year 2017 improved as a result of the revenue changes outlined above considering the impact of the following cost changes:
Cost of operations
: Cost of operations increased by
$12.3 million
in fiscal year
2017
from the prior year as a result of the following:
|
•
|
higher disposal costs associated with higher transfer station volumes and increased third-party disposal pricing;
|
|
•
|
higher direct labor costs associated with increased labor costs associated with higher landfill and transfer station volumes and increased healthcare costs of $0.7 million;
|
|
•
|
higher direct operational costs associated with increased leachate disposal and higher landfill operating costs due to: increased rainfall through early summer and the timing of various landfill construction projects; and higher host community fees associated with increased volumes at certain of our landfills;
|
|
•
|
higher fuel costs as a result of higher consumption and increased diesel fuel prices; and
|
|
•
|
higher fleet maintenance costs; partially offset by
|
|
•
|
lower hauling and transportation costs associated with decreased transportation services provided.
|
General and administration
: General and administration expenses increased by
$2.0 million
in fiscal year
2017
as a result of higher shared overhead costs associated with an increase in healthcare costs and higher equity compensation expense, partially offset by lower wages and personnel costs.
Depreciation and amortization
: Depreciation and amortization expenses increased
$3.3 million
in fiscal year
2017
from the prior year due to higher landfill amortization expense (associated with the higher landfill volumes, combined with the volume mix and changes to landfill amortization rates as a result of changes in cost estimates and other assumptions associated with our landfills) more than offsetting lower depreciation expense attributed to the timing of capital expenditures and related make-up of fixed assets.
Recycling
Recycling operating income decreased by
$(10.6) million
in fiscal year
2018
from the prior year including the following item:
|
•
|
the $(2.1) million impact of the contract settlement charge associated with the termination and discounted buy-out of a commodities marketing and brokerage agreement.
|
Our operating performance in fiscal year
2018
declined due to lower revenues associated with unfavorable commodity pricing in the marketplace, partially offset by lower purchased material costs, and the following cost changes:
|
•
|
higher operating costs associated with slower processing speeds and added labor in an effort to meet tighter quality standards and reduce contamination;
|
|
•
|
higher disposal costs as we pulled higher rates of residue out of the recycling processing stream;
|
|
•
|
higher supplies and consumables costs; and
|
|
•
|
higher shared overhead costs associated with equity compensation; partially offset by
|
|
•
|
lower accrued incentive compensation.
|
47
Recycling operating income increased by
$0.3 million
in fiscal year
2017
from the prior year. Our operating performance in fiscal year
2017
improved due to the revenue changes outlined above considering the impact of the following cost changes:
|
•
|
higher third-party purchased material costs of operations due to higher commodity prices on average year-over-year;
|
|
•
|
higher labor and related benefit costs of operations associated with higher healthcare costs, higher volumes, and higher product quality standards from commodity buyers resulting in lower throughput and additional manpower;
|
|
•
|
higher facility maintenance costs; and
|
|
•
|
higher general and administration expenses associated with higher labor costs and higher shared overhead costs associated with an increase in healthcare costs and higher equity compensation expense.
|
Other
Other operating income decreased by
$(0.2) million
in fiscal year
2018
from the prior year. Our operating performance in fiscal year
2018
declined based on the impact of intercompany profits in our Organics line-of-business now passing through to landfill disposal sites, combined with declining margins as higher revenues, which were driven by a large new sludge transportation and disposal contract, also resulted in higher third-party transportation and disposal costs as much of these new volumes were directed to third-party sites. This was partially offset by the improved operating performance of our Customer Solutions line-of-business, as increased volumes and lower purchased material costs outweighed higher cost of operations associated with increased hauling and transportation costs.
Other operating income decreased by
$(0.6) million
in fiscal year
2017
from the prior year. Our operating performance in fiscal year
2017
declined based on lower operating performance of our Organics line-of-business, as lower operating costs did not offset the decline in commodity volumes and higher disposal costs due to the use of alternative disposal sites; and the improved operating performance of our Customer Solutions line-of-business, as increased volumes outweighed higher cost of operations associated with increased purchased material, hauling and transportation, and healthcare costs.
Liquidity and Capital Resources
Recent Developments
On January 25, 2019, we completed a public offering of
3.6 million
share of our Class A common stock at a public offering price of
$29.50
per share. The offering resulted in net proceeds to us of
$100.9 million
, after deducting underwriting discounts and commissions and offering expenses. We intend to use the net proceeds from the offering for general corporate purposes, including potential acquisitions or development of new operations or assets with the goal of complementing or expanding our business, working capital and capital expenditures.
We continually monitor our actual and forecasted cash flows, our liquidity, and our capital requirements in order to properly manage our cash needs based on the capital intensive nature of our business. Our capital requirements include fixed asset purchases (including capital expenditures for vehicles), debt servicing, landfill development and cell construction, landfill site and cell closure, as well as acquisitions. We generally meet our liquidity needs from operating cash flows and borrowings from our
$200.0 million revolving line of credit facility ("Revolving Credit Facility" )
.
A summary of cash and cash equivalents, restricted assets and long-term debt balances, excluding any unamortized debt discount and debt issuance costs, (in millions) follows:
|
December 31,
|
|||||||
|
2018
|
2017
|
||||||
|
Cash and cash equivalents
|
$
|
4.0
|
|
$
|
2.0
|
|
|
|
Restricted assets:
|
|||||||
|
Restricted investments securities - landfill closure
|
$
|
1.2
|
|
$
|
1.2
|
|
|
|
Long-term debt:
|
|||||||
|
Current portion
|
$
|
2.3
|
|
$
|
4.9
|
|
|
|
Long-term portion
|
552.9
|
|
492.8
|
|
|||
|
Total long-term debt
|
$
|
555.2
|
|
$
|
497.7
|
|
|
Summary of Cash Flow Activity
A summary of cash flows (in millions) follows:
48
|
|
Fiscal Year Ended
December 31, |
||||||||||
|
|
2018
|
2017
|
2016
|
||||||||
|
Net cash provided by operating activities
|
$
|
120.8
|
|
$
|
107.5
|
|
$
|
80.4
|
|
||
|
Net cash used in investing activities
|
$
|
(164.2
|
)
|
$
|
(76.4
|
)
|
$
|
(63.0
|
)
|
||
|
Net cash provided by (used in) financing activities
|
$
|
45.4
|
|
$
|
(31.6
|
)
|
$
|
(18.6
|
)
|
||
Cash flows from operating activities.
A summary of operating cash flows (in millions) follows:
|
|
Fiscal Year Ended
December 31, |
||||||||||
|
|
2018
|
2017
|
2016
|
||||||||
|
Net income (loss)
|
$
|
6.4
|
|
$
|
(21.8
|
)
|
$
|
(6.9
|
)
|
||
|
Adjustments to reconcile net income (loss) to net cash provided by operating activities:
|
|||||||||||
|
Depreciation and amortization
|
70.5
|
|
62.1
|
|
61.9
|
|
|||||
|
Gain on sale of property and equipment
|
(0.5
|
)
|
—
|
|
(0.6
|
)
|
|||||
|
Depletion of landfill operating lease obligations
|
9.7
|
|
9.7
|
|
9.3
|
|
|||||
|
Interest accretion on landfill and environmental remediation liabilities
|
5.7
|
|
4.5
|
|
3.6
|
|
|||||
|
Stock-based compensation
|
8.4
|
|
6.4
|
|
3.4
|
|
|||||
|
Environmental remediation charge
|
—
|
|
—
|
|
0.9
|
|
|||||
|
Southbridge Landfill non-cash closure charge
|
16.2
|
|
63.5
|
|
—
|
|
|||||
|
Southbridge Landfill insurance settlement - investing activities
|
(3.5
|
)
|
—
|
|
—
|
|
|||||
|
Non-cash expense from acquisition activities and other items
|
0.8
|
|
—
|
|
—
|
|
|||||
|
Development project charge
|
0.3
|
|
—
|
|
—
|
|
|||||
|
Amortization of debt issuance costs and discount on long-term debt
|
2.4
|
|
2.7
|
|
3.9
|
|
|||||
|
Loss on debt extinguishment
|
7.4
|
|
0.5
|
|
13.7
|
|
|||||
|
Impairment of investments
|
1.1
|
|
—
|
|
—
|
|
|||||
|
Deferred income taxes
|
1.3
|
|
(15.5
|
)
|
0.6
|
|
|||||
|
126.2
|
|
112.1
|
|
89.8
|
|
||||||
|
Changes in assets and liabilities, net
|
(5.4
|
)
|
(4.6
|
)
|
(9.4
|
)
|
|||||
|
Net cash provided by operating activities
|
$
|
120.8
|
|
$
|
107.5
|
|
$
|
80.4
|
|
||
Fiscal Year 2018 Compared to Fiscal Year 2017
A summary of the most significant items affecting the changes in our operating cash flows follows:
Improved operational performance in fiscal year
2018
as compared to fiscal year
2017
due to the following:
|
•
|
higher revenues of $
61.3 million
associated with: acquisition activity and higher revenues in our collection line-of-business, our Western region disposal line-of-business, our Customer Solutions line-of-business, and our Organics line-of-business; partially offset by
|
|
•
|
higher cost of operations of $
48.1 million
due to business growth resulting in higher third-party direct costs, higher labor costs, higher direct operational costs, higher fuel costs and higher fleet maintenance costs; and
|
|
•
|
higher general and administration expenses of
$5.6 million
.
|
The unfavorable cash flow impact associated with the changes in our assets and liabilities, net of effects of acquisitions and divestitures, which are affected by both cost changes and the timing of payments, in fiscal year
2018
as compared to fiscal year
2017
was the result of the following:
|
•
|
an increase in cash outflows associated with the changes in accrued expenses and other liabilities;
|
|
•
|
a decrease in cash inflows associated with the changes in accounts receivable; partially offset by
|
|
•
|
a decrease in cash outflows associated with the changes in accounts payable; and
|
49
|
•
|
a decrease in cash outflows associated with the changes in prepaid expenses, inventories and other assets.
|
Fiscal Year 2017 Compared to Fiscal Year 2016
A summary of the most significant items affecting the changes in our operating cash flows follows:
Improved operational performance in fiscal year
2017
as compared to fiscal year
2016
due to the following:
|
•
|
higher revenues of $
34.3 million
driven by our Recycling line-of-business, our collection line-of-business, our Western region disposal line-of-business and our Customer Solutions line-of-business; partially offset by
|
|
•
|
higher cost of operations of $
23.2 million
driven by lower third-party direct costs, lower labor and related benefit costs, and lower fuel costs; partially offset by
|
|
•
|
higher general and administration expenses of $
3.8 million
driven by higher third-party direct costs, higher labor and related benefit costs, including significant healthcare cost increases, higher maintenance costs, and higher direct operational costs.
|
The favorable cash flow impact associated with the changes in our assets and liabilities, net of effects of acquisitions and divestitures, which are affected by both cost changes and the timing of payments, in fiscal year
2017
as compared to fiscal year
2016
was the result of the following:
|
•
|
a decrease in cash outflows associated with cash interest payments running through accrued expenses and other liabilities;
|
|
•
|
a decrease in cash outflows associated with the changes in prepaid expenses, inventories and other assets; and
|
|
•
|
a decrease in cash outflows associated with the changes in accounts payable; partially offset by
|
|
•
|
an increase in cash outflows associated with the changes in accrued payroll and incentive compensation; and
|
|
•
|
a decrease in cash inflows associated with the changes in accounts receivable.
|
Cash flows from investing activities
.
A summary of investing cash flows (in millions) follows:
|
Fiscal Year Ended
December 31, |
|||||||||||
|
2018
|
2017
|
2016
|
|||||||||
|
Acquisitions, net of cash acquired
|
$
|
(88.9
|
)
|
$
|
(5.1
|
)
|
$
|
(2.8
|
)
|
||
|
Additions to property, plant and equipment
|
(73.2
|
)
|
(64.9
|
)
|
(54.2
|
)
|
|||||
|
Payments on landfill operating lease contracts
|
(7.4
|
)
|
(7.2
|
)
|
(7.3
|
)
|
|||||
|
Proceeds from sale of property and equipment
|
0.8
|
|
0.7
|
|
1.3
|
|
|||||
|
Proceeds from Southbridge landfill insurance settlement
|
3.5
|
|
—
|
|
—
|
|
|||||
|
Proceeds from property insurance settlement
|
1.0
|
|
—
|
|
—
|
|
|||||
|
Net cash used in investing activities
|
$
|
(164.2
|
)
|
$
|
(76.5
|
)
|
$
|
(63.0
|
)
|
||
Fiscal Year 2018 Compared to Fiscal Year 2017
A summary of the most significant items affecting the change in our investing cash flows for fiscal year
2018
from the prior year follows:
Acquisitions, net of cash acquired
. We acquired six solid waste collection businesses and one transfer business in our Western region and two business comprised of solid waste collection and transfer operations in our Eastern region for total consideration of $99.5 million, including $86.7 million in cash. We also made payment on $2.3 million in holdback amounts in fiscal year 2018.
Capital expenditures
. Capital expenditures were
$8.3 million
higher in fiscal year
2018
as compared to fiscal year
2017
primarily due to business growth and acquisition activity.
Payments on landfill operating lease contracts
. Landfill operating lease payments increased $0.2 million in fiscal year
2018
as compared to fiscal year
2017
due to increased payments related to our landfill located in Chemung, New York.
50
Proceeds from Southbridge Landfill insurance recovery for investing activities.
We recorded a recovery on environmental insurance settlement associated with the Southbridge Landfill closure, of which $3.5 million of the $10.0 million recovered related to the recovery of net cash previously used in investing activities.
Proceeds from property insurance settlement.
We recovered insurance proceeds of $1.0 million pertaining to property damage related to a fire at a transfer station in our Western region.
Fiscal Year 2017 Compared to Fiscal Year 2016
A summary of the most significant items affecting the change in our investing cash flows for fiscal year
2017
from the prior year follows:
Acquisitions, net of cash acquired
. We acquired one solid waste collection business in our Eastern region and three solid waste collection businesses in our Western region for total consideration of $8.1 million, including $4.8 million in cash.
Capital expenditures
. Capital expenditures were $10.7 million higher in fiscal year 2017 as compared to fiscal year 2016 primarily due to timing differences with various landfill development projects and business growth.
Payments on landfill operating lease contracts
. Landfill operating lease payments decreased $(0.1) million in fiscal year 2017 as compared to fiscal year 2016 due to the timing of payments at certain of our landfills based on the terms of the operating lease contracts.
Proceeds from the sale of property and equipment
. Proceeds from the sale of property and equipment decreased $(0.6) million in fiscal year 2017 as compared to fiscal year 2016 due to the timing and make-up of various asset sales.
Cash flows from financing activities
.
A summary of financing cash flows (in millions) follows:
|
Fiscal Year Ended
December 31, |
|||||||||||
|
2018
|
2017
|
2016
|
|||||||||
|
Proceeds from long-term borrowings
|
$
|
634.7
|
|
$
|
185.5
|
|
$
|
604.9
|
|
||
|
Principal payments on long-term debt
|
(584.2
|
)
|
(217.0
|
)
|
(608.2
|
)
|
|||||
|
Payments of debt issuance costs
|
(5.6
|
)
|
(1.5
|
)
|
(8.2
|
)
|
|||||
|
Payments of debt extinguishment costs
|
—
|
|
—
|
|
(7.2
|
)
|
|||||
|
Proceeds from the exercise of share based awards
|
0.5
|
|
1.3
|
|
0.1
|
|
|||||
|
Net cash provided by (used in) financing activities
|
$
|
45.4
|
|
$
|
(31.7
|
)
|
$
|
(18.6
|
)
|
||
Fiscal Year 2018 Compared to Fiscal Year 2017
A summary of the most significant items affecting the change in our financing cash flows for fiscal year
2018
from the prior year follows:
Debt activity
. Debt borrowings increased by $449.2 million and debt payments increased by $367.2 million in fiscal year
2018
, resulting in an increase of long-term debt by
$50.5 million
. The increase in net financing cash flows related to debt activity is associated primarily with increased borrowings related to acquisition activity, and to a lesser extent debt issuance costs associated with financing activities. This is compared to fiscal year 2017 activity that resulted in a reduction of long-term debt by $(31.5) million associated with the repayment of $(30.1) million of long-term debt under the previously outstanding senior secured credit facility in fiscal year 2017
.
Payments of debt issuance costs.
We made $5.6 million of debt issuance cost payments in fiscal year 2018 related primarily to the issuance of Finance Authority of Maine Solid Waste Disposal Revenue Bonds Series 2015R-2 (“FAME Bonds 2015R-2”) and the refinancing of our Credit Facility as compared to $1.5 million in fiscal year 2017 related to the repricing of our $350.0 million aggregate principal amount Term Loan B Facility and the remarketing of the FAME Bonds 2005R-1 and the FAME Bonds 2005R-2 into the FAME Bonds 2005R-3.
51
Fiscal Year 2017 Compared to Fiscal Year 2016
A summary of the most significant items affecting the change in our financing cash flows for fiscal year
2017
from the prior year follows:
Debt activity
. Debt borrowings decreased by $419.4 million and debt payments decreased by $391.2 million in fiscal year 2017, resulting in a reduction of long-term debt by $(31.5) million primarily associated with the repayment of $(30.1) million of long-term debt under the previously outstanding senior secured credit facility in fiscal year 2017
.
This is compared to fiscal year 2016 activity that resulted in a reduction of long-term debt by $(3.3) million associated with the repurchase or redemption, as applicable, of $370.3 million our 2019 Notes; the refinancing of the previously outstanding senior secured asset-based revolving credit and letter of credit facility in fiscal year 2016; and the issuance of $15.0 million of Solid Waste Disposal Revenue Bonds Series 2014R-2 ("New York Bonds 2014R-2") in fiscal year 2016.
Payments of debt issuance costs
. We made $1.5 million of debt issuance cost payments in fiscal year 2017 related to the repricing and the remarketing of the FAME Bonds 2005R-1 and the FAME Bonds 2005R-2 into the FAME Bonds 2005R-3 as compared to $8.1 million in fiscal year 2016 related to the refinancing of our ABL Facility with our Credit Facility and the issuance of New York Bonds 2014R-2.
Proceeds from the exercise of share based awards.
We received $1.3 million of cash receipts associated with the exercise of stock options in fiscal year 2017 as compared to $0.1 million in fiscal year 2016 due primarily to the appreciation of our stock price and the expiration of certain management grants.
Outstanding Long-Term Debt
Credit Facility
In fiscal year 2018, we entered into a credit agreement ("Credit Agreement"), which provides for a
$350.0 million
aggregate principal amount term loan A facility ("Term Loan Facility") and a
$200.0 million
revolving line of credit facility ("Revolving Credit Facility" and, together with the Term Loan Facility, the "Credit Facility"). The net proceeds from this transaction were used to repay in full the amounts outstanding of the Term Loan B Facility and the $160.0 million revolving line of credit facility ("Refinanced Revolving Credit Facility") plus accrued and unpaid interest thereon and to pay related transaction expenses. We have the right to request, at our discretion, an increase in the amount of loans under the Credit Facility by an aggregate amount
$125.0 million
, subject to the terms and conditions set forth in the Credit Agreement.
The Credit Facility has a
5
-year term and will initially bear interest at a rate of LIBOR plus
2.00%
per annum, which will be reduced to a rate of LIBOR plus
1.25%
upon us reaching a consolidated net leverage ratio of less than
2.25
x. The Credit Facility is guaranteed jointly and severally, fully and unconditionally by all of our significant wholly-owned subsidiaries and secured by substantially all of our assets. As of
December 31, 2018
, further advances were available under the Credit Facility in the amount of
$107.9 million
. The available amount is net of outstanding irrevocable letters of credit totaling
$22.5 million
, at which date no amount had been drawn.
The Credit Agreement requires us to maintain a minimum interest coverage ratio and a maximum consolidated net leverage ratio, to be measured at the end of each fiscal quarter. As of
December 31, 2018
, we were in compliance with all financial covenants contained in the Credit Agreement as follows (in millions):
|
Credit Facility Covenant
|
Fiscal Year Ended December 31, 2018
|
Covenant Requirements at December 31, 2018
|
|||
|
Maximum consolidated net leverage ratio (1)
|
3.62
|
|
4.75
|
||
|
Minimum interest coverage ratio
|
6.35
|
|
3.00
|
||
52
(1)
The maximum consolidated net leverage ratio is calculated as consolidated funded debt, net of unencumbered cash and cash equivalents in excess of $2.0 million (calculated at $553.2 million as of
December 31, 2018
, or
$555.2 million
of consolidated funded debt less
$2.0 million
of cash and cash equivalents in excess of $2.0 million as of
December 31, 2018
), divided by minimum consolidated EBITDA. Minimum consolidated EBITDA is based on operating results for the twelve months preceding the measurement date of
December 31, 2018
. Consolidated funded debt, net unencumbered cash and cash equivalents in excess of $2.0 million, and minimum consolidated EBITDA are non-GAAP financial measures that should not be considered an alternative to any measure of financial performance calculated and presented in accordance with generally accepted accounting principles in the United States. A reconciliation of minimum consolidated EBITDA to net cash provided by operating activities is as follows (in millions):
|
|
Twelve Months Ended December 31, 2018
|
||
|
Net cash provided by operating activities
|
$
|
120.8
|
|
|
Changes in assets and liabilities, net of effects of acquisitions and divestitures
|
5.4
|
|
|
|
Gain on sale of property and equipment
|
0.5
|
|
|
|
Non-cash expense from acquisition activities and other items
|
(0.8
|
)
|
|
|
Developmental project charge
|
(0.3
|
)
|
|
|
Loss on debt extinguishment
|
(7.4
|
)
|
|
|
Stock based compensation
|
(8.4
|
)
|
|
|
Impairment of investments
|
(1.1
|
)
|
|
|
Southbridge landfill non-cash closure charge
|
(16.2
|
)
|
|
|
Southbridge Landfill insurance recovery for investing activities
|
3.5
|
|
|
|
Interest expense, less amortization of debt issuance costs
|
23.9
|
|
|
|
Benefit for income taxes, net of deferred income taxes
|
(1.6
|
)
|
|
|
Adjustments as allowed by the Credit Agreement
|
34.7
|
|
|
|
Minimum consolidated EBITDA
|
$
|
153.0
|
|
In addition to the financial covenants described above, the Credit Agreement also contains a number of important customary affirmative and negative covenants which restrict, among other things, our ability to sell assets, incur additional debt, create liens, make investments, and pay dividends. We do not believe that these restrictions impact our ability to meet future liquidity needs.
As of
December 31, 2018
, we were in compliance with the covenants contained in the Credit Agreement. An event of default under any of our debt agreements could permit some of our lenders, including the lenders under the Credit Facility, to declare all amounts borrowed from them to be immediately due and payable, together with accrued and unpaid interest, or, in the case of the Credit Facility, terminate the commitment to make further credit extensions thereunder, which could, in turn, trigger cross-defaults under other debt obligations. If we were unable to repay debt to our lenders, or were otherwise in default under any provision governing our outstanding debt obligations, our secured lenders could proceed against us and against the collateral securing that debt.
Based on the seasonality of our business, operating results in the late fall, winter and early spring months are generally lower than the remainder of our fiscal year. Given the cash flow impact that this seasonality, the capital intensive nature of our business and the timing of debt payments has on our business, we typically incur higher debt borrowings in order to meet our liquidity needs during these times. Consequently, our availability and performance against our financial covenants tighten during these times as well.
Tax-Exempt Financings
New York Bonds.
As of
December 31, 2018
, we had outstanding $25.0 million aggregate principal amount of Solid Waste Disposal Revenue Bonds Series 2014 ("New York Bonds 2014R-1") and $15.0 million aggregate principal amount of New York Bonds 2014R-2 issued by the New York State Environmental Facilities Corporation under the indenture dated December 1, 2014 (collectively, the “New York Bonds”). The New York Bonds 2014R-1 accrue interest at
3.75%
per annum through December 1, 2019, at which time they may be converted from a fixed rate to a variable rate. The New York Bonds 2014R-2 accrue interest at
3.125%
per annum through May 31, 2026, at which time they may be converted from a fixed rate to a variable rate. The New York Bonds, which are unsecured and guaranteed jointly and severally, fully and unconditionally by all of our significant wholly-owned subsidiaries, require interest payments on June 1 and December 1 of each year and mature on
December 1, 2044
. We borrowed the proceeds of the New York Bonds to finance or refinance certain capital projects in the state of New York and to pay certain costs of issuance of the New York Bonds.
53
Maine Bonds.
In fiscal year 2018, we completed the issuance of $15.0 million aggregate principal amount of Finance Authority of Maine Solid Waste Disposal Revenue Bonds Series 2015R-2 (“FAME Bonds 2015R-2”). As of December 31, 2018, we had outstanding $25.0 million aggregate principal amount of FAME Bonds 2005R-3, $15.0 million aggregate principal amount of Finance Authority of Maine Solid Waste Disposal Revenue Bonds Series 2015 (“FAME Bonds 2015R-1”), and $15.0 million aggregate principal amount of FAME Bonds 2015R-2 (collectively, the "FAME Bonds"). The FAME Bonds 2005R-3 accrue interest at 5.25% per annum, and interest is payable semiannually in arrears on February 1 and August 1 of each year until such bonds mature on January 1, 2025. The FAME Bonds 2015R-1 accrue interest at 5.125% per annum through August 1, 2025, at which time they may be converted from a fixed to a variable rate, and interest is payable semiannually in arrears on February 1 and August 1 of each year until the FAME Bonds 2015R-1 mature on August 1, 2035. The FAME Bonds 2015R-2 accrue interest at 4.375% per annum through July 31, 2025, at which time they may be converted from a fixed to a variable rate, and interest is payable semiannually each year on May 1 and November 1 until the FAME Bonds 2015R-2 mature on August 1, 2035. The FAME Bonds are unsecured and guaranteed jointly and severally, fully and unconditionally by all of our significant wholly-owned subsidiaries. We borrowed the proceeds of the offering of the FAME Bonds to finance or refinance the costs of certain of our solid waste landfill facilities and solid waste collection, organics and transfer, recycling and hauling facilities, and to pay certain costs of the issuance of the FAME Bonds.
Vermont Bonds.
In fiscal year 2018, we completed the remarketing of $16.0 million aggregate principal amount of senior unsecured Vermont Economic Development Authority Solid Waste Disposal Long-Term Revenue Bonds Series 2013 (“Vermont Bonds”). As of
December 31, 2018
, we had outstanding $16.0 million aggregate principal amount of Vermont Bonds. The Vermont Bonds, which are guaranteed jointly and severally, fully and unconditionally by all of our significant wholly-owned subsidiaries, accrue interest at
4.63%
per annum through April 2, 2028, after which time there is a mandatory tender. The Vermont Bonds mature on
April 1, 2036
. We borrowed the proceeds of the Vermont Bonds to finance or refinance certain qualifying property, plant and equipment assets purchased in the state of Vermont.
New Hampshire Bonds.
As of
December 31, 2018
, we had outstanding
$11.0 million
aggregate principal amount of senior unsecured Solid Waste Disposal Revenue Bonds Series 2013 issued by the Business Finance Authority of the State of New Hampshire (“New Hampshire Bonds”). The New Hampshire Bonds, which are guaranteed jointly and severally, fully and unconditionally by all of our significant wholly-owned subsidiaries, accrue interest at
4.00%
per annum through October 1, 2019, at which time they may be converted from a fixed rate to a variable rate. During the fixed interest rate period, the New Hampshire Bonds are not be supported by a letter of credit. Interest is payable in arrears on April 1 and October 1 of each year. The New Hampshire Bonds mature on
April 1, 2029
. We borrowed the proceeds of the New Hampshire Bonds to finance or refinance certain qualifying property, plant and equipment assets purchased in the state of New Hampshire.
Contractual Obligations
The following table summarizes our significant contractual obligations and commitments as of
December 31, 2018
(in thousands) and the anticipated effect of these obligations on our liquidity in future years:
|
Less than
one year
|
1 - 3 years
|
3 - 5 years
|
More than 5
years
|
Total
|
|||||||||||||||
|
Long-term debt and capital leases
|
$
|
2,298
|
|
$
|
4,823
|
|
$
|
422,673
|
|
$
|
125,455
|
|
$
|
555,249
|
|
||||
|
Interest obligations
(1)
|
25,157
|
|
49,953
|
|
48,432
|
|
63,710
|
|
187,252
|
|
|||||||||
|
Non-cancellable operating leases
|
9,871
|
|
11,789
|
|
3,197
|
|
4,616
|
|
29,473
|
|
|||||||||
|
Landfill operating lease contracts
|
5,701
|
|
11,006
|
|
11,006
|
|
60,529
|
|
88,242
|
|
|||||||||
|
FInal capping / closure / post-closure
|
10,340
|
|
14,904
|
|
16,585
|
|
134,401
|
|
176,230
|
|
|||||||||
|
Total contractual cash obligations
(2)
|
$
|
53,367
|
|
$
|
92,475
|
|
$
|
501,893
|
|
$
|
388,711
|
|
$
|
1,036,446
|
|
||||
|
(1)
|
Based on long-term debt and capital lease balances as of
December 31, 2018
. Interest obligations related to variable rate debt were calculated using variable rates in effect at
December 31, 2018
.
|
|
(2)
|
Contractual cash obligations do not include accounts payable or accrued liabilities, which will be paid in the fiscal year ending December 31,
2019
.
|
We have no contractual obligations related to unrecognized tax benefits at
December 31, 2018
. For a description of our commitments and contingencies, see Note 9,
Final Capping, Closure and Post-Closure Costs,
Note 11,
Commitments and Contingencies
and Note 15,
Income Taxes,
to our consolidated financial statements included in Item 8 of this Annual Report on Form 10-K.
54
Inflation
Although inflationary increases in costs have affected our historical operating margins, we believe that inflation generally has not had a significant impact on our operating results. Consistent with industry practice, most of our contracts provide for a pass-through of certain costs to our customers, including increases in landfill tipping fees and in some cases fuel costs, intended to mitigate the impact of inflation on our operating results. We have also implemented a number of operating efficiency programs that seek to improve productivity and reduce our service costs, and a fuel surcharge, which is designed to recover escalating fuel price fluctuations above an annually reset floor. Based on these implementations, we believe we should be able to sufficiently offset most cost increases resulting from inflation. However, competitive factors may require us to absorb at least a portion of these cost increases. Additionally, management’s estimates associated with inflation have had, and will continue to have, an impact on our accounting for landfill and environmental remediation liabilities.
Regional Economic Conditions
Our business is primarily located in the northeastern United States. Therefore, our business, financial condition and results of operations are susceptible to downturns in the general economy in this geographic region and other factors affecting the region, such as state regulations and severe weather conditions. We are unable to forecast or determine the timing and/or the future impact of a sustained economic slowdown.
Critical Accounting Estimates and Assumptions
Our consolidated financial statements have been prepared in accordance with GAAP and necessarily include certain estimates and judgments made by management. On an on-going basis, management evaluates its estimates and judgments which are based on historical experience and on various other factors that are believed to be reasonable under the circumstances. The results of their evaluation form the basis for making judgments about the carrying values of assets and liabilities. Actual results may differ from these estimates under different assumptions and circumstances. The following is a list of accounting policies that we believe are the most critical in understanding our consolidated financial position, results of operations and cash flows and that may require management to make subjective or complex judgments about matters that are inherently uncertain. Our significant accounting policies are more fully discussed in Note 3,
Summary of Significant Accounting Policies
of our consolidated financial statements included in Item 8 of this Annual Report on Form 10-K.
Landfill Accounting
Landfill Development Costs
We estimate the total cost to develop each of our landfill sites to its remaining permitted and expansion capacity (see landfill development costs discussed within the “
Property, Plant and Equipment
” accounting policy more fully discussed in Note 3,
Summary of Significant Accounting Policies
of our consolidated financial statements included in Item 8 of this Annual Report on Form 10-K). The projection of these landfill costs is dependent, in part, on future events. The remaining amortizable basis of each landfill includes costs to develop a site to its remaining permitted and expansion capacity and includes amounts previously expended and capitalized, net of accumulated airspace amortization, and projections of future purchase and development costs including capitalized interest. The interest capitalization rate is based on our weighted average interest rate incurred on borrowings outstanding during the period.
Under life-cycle accounting, all costs related to acquisition and construction of landfill sites are capitalized and charged to expense based on tonnage placed into each site. Landfill permitting, acquisition and preparation costs are amortized on the units-of-consumption method as landfill airspace is consumed. In determining the amortization rate for each of our landfills, preparation costs include the total estimated costs to complete construction of the landfills’ permitted and expansion capacity.
Final Capping, Closure and Post-Closure Costs
The cost estimates for final capping, closure and post-closure activities at landfills for which we have responsibility are estimated based on our interpretations of current requirements and proposed or anticipated regulatory changes. We also estimate additional costs based on the amount a third-party would charge us to perform such activities even when we expect to perform these activities internally. We estimate the airspace to be consumed related to each final capping event and the timing of construction related to each final capping event and of closure and post-closure activities. Because landfill final capping, closure and post-closure obligations are measured at estimated fair value using present value techniques, changes in the estimated timing of construction of future landfill final capping and closure and post-closure activities would have an effect on these liabilities, related assets and results of operations.
55
Final capping activities include the installation of liners, drainage, compacted soil layers and topsoil over areas of a landfill where total airspace has been consumed and waste is no longer being received. Final capping activities occur throughout the life of the landfill. Our engineering personnel estimate the cost for each final capping event based on the acreage to be capped, along with the final capping materials and activities required. The estimates also consider when these costs would actually be paid and factor in inflation and discount rates. The engineers then quantify the landfill capacity associated with each final capping event and the costs for each event are amortized over that capacity as waste is received at the landfill.
Closure and post-closure costs represent future estimated costs related to monitoring and maintenance of a solid waste landfill after a landfill facility ceases to accept waste and closes. We estimate, based on input from our engineers, accountants, lawyers, managers and others, our future cost requirements for closure and post-closure monitoring and maintenance based on our interpretation of the technical standards of the Subtitle D regulations and the air emissions standards under the Clean Air Act of 1970, as amended, as they are being applied on a state-by-state basis. Closure and post-closure accruals for the cost of monitoring and maintenance include site inspection, groundwater monitoring, leachate management, methane gas control and recovery, and operation and maintenance costs to be incurred for a period which is generally for a term of 30 years after final closure of a landfill. In determining estimated future closure and post-closure costs, we consider costs associated with permitted and permittable ai
r
space.
See Note 9,
Final Capping, Closure and Post-Closure Costs
to our consolidated financial statements included under Item 8 of this Annual Report on Form 10-K for further disclosure.
Remaining Permitted Airspace
Our engineers, in consultation with third-party engineering consultants and surveyors, are responsible for determining remaining permitted airspace at our landfills. The remaining permitted airspace is determined by an annual survey, which is then used to compare the existing landfill topography to the expected final landfill topography.
Expansion Airspace
We currently include unpermitted expansion airspace in our estimate of remaining permitted and expansion airspace in certain circumstances. To be considered expansion airspace all of the following criteria must be met:
|
•
|
we control the land on which the expansion is sought;
|
|
•
|
all technical siting criteria have been met or a variance has been obtained or is reasonably expected to be obtained;
|
|
•
|
we have not identified any legal or political impediments which we believe will not be resolved in our favor;
|
|
•
|
we are actively working on obtaining any necessary permits and we expect that all required permits will be received; and
|
|
•
|
senior management has approved the project.
|
For unpermitted airspace to be included in our estimate of remaining permitted and expansion airspace, the expansion effort must meet all of the criteria listed above. These criteria are evaluated annually by our engineers, accountants, lawyers, managers and others to identify potential obstacles to obtaining the permits. Once the remaining permitted and expansion airspace is determined in cubic yards, an airspace utilization factor (“AUF”) is established to calculate the remaining permitted and expansion capacity in tons. The AUF is established using a process that considers the measured density obtained from annual surveys. When we include the expansion airspace in our calculation of remaining permitted and expansion airspace, we include the projected costs for development, as well as the projected asset retirement costs related to final capping, closure and post-closure of the expansion airspace in the amortization basis of the landfill.
After determining the costs and the remaining permitted and expansion capacity at each of our landfills, we determine the per ton rates that will be expensed as waste is received and deposited at each of our landfills by dividing the costs by the corresponding number of tons. We calculate per ton amortization rates for assets associated with each final capping event, for assets related to closure and post-closure activities and for all other costs capitalized or to be capitalized in the future for each landfill. These rates per ton are updated annually, or more frequently, as significant facts change.
It is possible that actual results, including the amount of costs incurred, the timing of final capping, closure and post-closure activities, our airspace utilization or the success of our expansion efforts could ultimately turn out to be significantly different from our estimates and assumptions. To the extent that such estimates or related assumptions prove to be significantly different than actual results, lower profitability may be experienced due to higher amortization rates, higher final capping, closure or post-closure rates, or higher expenses. Higher profitability may result if the opposite occurs. Most significantly, if it is determined that the expansion capacity should no longer be considered in calculating the recoverability of the landfill asset, we may be required to recognize an asset impairment. If it is determined that the likelihood of receiving an expansion permit has become remote, the capitalized costs related to the expansion effort are expensed immediately.
Environmental Remediation Liabilities
56
We have recorded environmental remediation liabilities representing our estimate of the most likely outcome of the matters for which we have determined that a liability is probable. These liabilities include potentially responsible party investigations, settlements, certain legal and consultant fees, as well as costs directly associated with site investigation and clean up, such as materials and incremental internal costs directly related to the remedy. We provide for expenses associated with environmental remediation obligations when such amounts are probable and can be reasonably estimated. We estimate costs required to remediate sites where it is probable that a liability has been incurred based on site-specific facts and circumstances. Estimates of the cost for the likely remedy are developed using third-party environmental engineers or other service providers. Where we believe that both the amount of a particular environmental remediation liability and timing of payments are reliably determinable, we inflate the cost in current dollars until the expected time of payment and discount the cost to present value.
See Note 11,
Commitments and Contingencies
to our consolidated financial statements included under Item 8 of this Annual Report on Form 10-K for further disclosure.
Accounts Receivable – Trade, Net of Allowance for Doubtful Accounts
Accounts receivable – trade represent receivables from customers for collection, transfer, recycling, disposal and other services. Our accounts receivable – trade are recorded when billed or when related revenue is earned, if earlier, and represent claims against third-parties that will be settled in cash. The carrying value of our accounts receivable – trade, net of allowance for doubtful accounts, represents its estimated net realizable value. Estimates are used in determining our allowance for doubtful accounts based on our historical collection experience, current trends, credit policy and a review of our accounts receivable – trade by aging category. Our reserve is evaluated and revised on a monthly basis. Past-due accounts receivable-trade are written off when deemed to be uncollectible.
Goodwill and Other Intangibles
We annually assess goodwill for impairment at the end of our fiscal year or more frequently if events or circumstances indicate that impairment may exist. We may assess whether a goodwill impairment exists using either a qualitative or a quantitative assessment. If we perform a qualitative assessment, it involves determining whether events or circumstances exist that indicate it is more likely than not that the fair value of a reporting unit is less than its carrying amount, including goodwill. If based on this qualitative assessment we determine it is not more likely than not that the fair value of a reporting unit is less than its carrying amount, we will not perform a quantitative assessment. If the qualitative assessment indicates that it is more likely than not that the fair value of a reporting unit is less than its carrying amount, or if we elect not to perform a qualitative assessment, we perform a quantitative assessment, or two-step impairment test, to determine whether goodwill impairment exists at the reporting unit.
In the first step (defined as “Step 1”) of testing for goodwill impairment, we estimate the fair value of each reporting unit, which we have determined to be our geographic operating segments, our Recycling segment and our Customer Solutions business, which is included in the Other segment, and compare the fair value with the carrying value of the net assets of each reporting unit. If the fair value is less than its carrying value, then we would perform a second step (defined as “Step 2”) and determine the fair value of the goodwill. In Step 2, the fair value of goodwill is determined by deducting the fair value of a reporting unit’s identifiable assets and liabilities from the fair value of the reporting unit as a whole, as if that reporting unit had just been acquired and the purchase price were being initially allocated.
To determine the fair value of each of our reporting units as a whole we use discounted cash flow analyses, which require significant assumptions and estimates about the future operations of each reporting unit. Significant judgments inherent in this analysis include the determination of appropriate discount rates, the amount and timing of expected future cash flows and growth rates. The cash flows employed in our discounted cash flow analyses are based on financial forecasts developed internally by management. Our discount rate assumptions are based on an assessment of our risk adjusted discount rate, applicable for each reporting unit. In assessing the reasonableness of our determined fair values of our reporting units, we evaluate our results against our current market capitalization
If the fair value of goodwill is less than its carrying value for a reporting unit, an impairment charge would be recorded to earnings. The loss recognized cannot exceed the carrying amount of goodwill. After a goodwill impairment loss is recognized, the adjusted carrying amount of goodwill becomes its new accounting basis.
In addition to an annual goodwill impairment assessment, we would evaluate a reporting unit for impairment if events or circumstances change between annual tests indicating a possible impairment. Examples of such events or circumstances include the following:
|
•
|
a significant adverse change in legal status or in the business climate;
|
|
•
|
an adverse action or assessment by a regulator;
|
|
•
|
a more likely than not expectation that a segment or a significant portion thereof will be sold; or
|
57
|
•
|
the testing for recoverability of a significant asset group within the segment.
|
We elected to perform a quantitative analysis as part of our annual goodwill impairment test for fiscal year
2018
. As of
December 31, 2018
, the Step 1 testing for goodwill impairment performed for our Eastern, Western, Recycling and Customer Solutions reporting units indicated that the fair value of each reporting unit exceeded its carrying amount, including goodwill. Furthermore, the Step 1 test indicated that in each case the fair value of our Eastern, Western, Recycling and Customer Solutions reporting units exceeded its carrying value by in excess of 21.5%. We incurred no impairment of goodwill as a result of our annual goodwill impairment tests in fiscal years
2018
,
2017
and
2016
. However, there can be no assurance that goodwill will not be impaired at any time in the future.
Intangible assets consist primarily of covenants not-to-compete and customer lists. Intangible assets are recorded at fair value and are amortized based on the economic benefit provided or using the straight-line method over their estimated useful lives. Covenants not-to-compete and customer lists are typically amortized over a term of no more than 10 years.
See Note 8,
Goodwill and Intangible Assets
to our consolidated financial statements included under Item 8 of this Annual Report on Form 10-K for further disclosure.
Recovery of Long-Lived Assets
We continually assess whether events or changes in circumstances have occurred that may warrant revision of the estimated useful lives of our long-lived assets (other than goodwill) or whether the remaining balances of those assets should be evaluated for possible impairment. Long-lived assets include, for example, capitalized landfill costs, other property and equipment, and identifiable intangible assets. Events or changes in circumstances that may indicate that an asset may be impaired include the following:
|
•
|
a significant decrease in the market price of an asset or asset group;
|
|
•
|
a significant adverse change in the extent or manner in which an asset or asset group is being used or in its physical condition;
|
|
•
|
a significant adverse change in legal factors or in the business climate that could affect the value of an asset or asset group, including an adverse action or assessment by a regulator;
|
|
•
|
an accumulation of costs significantly in excess of the amount originally expected for the acquisition or construction of a long-lived asset;
|
|
•
|
a current period operating or cash flow loss combined with a history of operating or cash flow losses or a projection or forecast that demonstrates continuing losses associated with the use of a long-lived asset or asset group;
|
|
•
|
a current expectation that, more likely than not, a long-lived asset or asset group will be sold or otherwise disposed of significantly before the end of its previously estimated useful life; or
|
|
•
|
an impairment of goodwill at a reporting unit.
|
There are certain indicators listed above that require significant judgment and understanding of the waste industry when applied to landfill development or expansion. For example, a regulator may initially deny a landfill expansion permit application although the expansion permit is ultimately granted. In addition, management may periodically divert waste from one landfill to another to conserve remaining permitted landfill airspace. Therefore, certain events could occur in the ordinary course of business and not necessarily be considered indicators of impairment due to the unique nature of the waste industry.
If an impairment indicator occurs, we perform a test of recoverability by comparing the carrying value of the asset or asset group to its undiscounted expected future cash flows. We group our long-lived assets for this purpose at the lowest level for which identifiable cash flows are primarily independent of the cash flows of other assets or asset groups. If the carrying values are in excess of undiscounted expected future cash flows, we measure any impairment by comparing the fair value of the asset or asset group to its carrying value.
To determine fair value, we use discounted cash flow analyses and estimates about the future cash flows of the asset or asset group. This analysis includes a determination of an appropriate discount rate, the amount and timing of expected future cash flows and growth rates. The cash flows employed in our discounted cash flow analyses are typically based on financial forecasts developed internally by management. The discount rate used is commensurate with the risks involved. We may also rely on third-party valuations and or information available regarding the market value for similar assets.
If the fair value of an asset or asset group is determined to be less than the carrying amount of the asset or asset group, impairment in the amount of the difference is recorded in the period that the impairment occurs. Estimating future cash flows requires significant judgment and projections may vary from the cash flows eventually realized.
Investments in Unconsolidated Entities
58
Investments in unconsolidated entities over which we have significant influence over the investees’ operating and financing activities are accounted for under the equity method of accounting, as applicable. Investments in affiliates in which we do not have the ability to exert significant influence over the investees’ operating and financing activities are accounted for under the cost method of accounting.
We monitor and assess the carrying value of our investments throughout the year for potential impairment and write them down to their fair value when other-than-temporary declines exist. Fair value is generally based on (i) other third-party investors’ recent transactions in the securities; (ii) other information available regarding the current market for similar assets and/or (iii) a market or income approach, as deemed appropriate.
When we assess the carrying value of our investments for potential impairment, determining the fair value of our investments is reliant upon the availability of market information and/or other information provided by third-parties to be able to develop an estimate of fair value. Considerable judgment is required in interpreting market data to develop the estimates of fair value. Accordingly, our estimates are not necessarily indicative of the amounts that we, or other holders of these investments, could realize in a current market exchange. The use of different assumptions and/or estimation methodologies could have a significant effect on the estimated fair values. The current estimates of fair value could differ significantly from the amounts presented.
Self-Insurance Liabilities and Related Costs
We are self-insured for vehicles and workers’ compensation with reinsurance coverage limiting our maximum exposure. Our maximum exposure in fiscal year
2018
under the workers’ compensation plan was $1.0 million per individual event. Our maximum exposure in fiscal year
2018
under the automobile plan was $1.2 million per individual event. The liability for unpaid claims and associated expenses, including incurred but not reported losses, is determined by management with the assistance of a third-party actuary and reflected in our consolidated balance sheet as an accrued liability. We use a third-party to track and evaluate actual claims experience for consistency with the data used in the annual actuarial valuation. The actuarially determined liability is calculated based on historical data, which considers both the frequency and settlement amount of claims. Our estimated accruals for these liabilities could be significantly different than our ultimate obligations if variables such as the frequency or severity of future events differ significantly from our assumptions.
Income Taxes
We use estimates to determine our provision for income taxes and related assets and liabilities and any valuation allowance recorded against our net deferred tax assets. Valuation allowances have been established for the possibility that tax benefits may not be realized for certain deferred tax assets. Deferred income taxes are recognized based on the expected future tax consequences of differences between the financial statement basis and the tax basis of assets and liabilities, calculated using currently enacted tax rates. We record net deferred tax assets to the extent we believe these assets will more likely than not be realized. In making this determination, we consider all available positive and negative evidence, including scheduled reversals of deferred tax liabilities, projected future taxable income, tax planning strategies and recent financial operations. In the event we determine that we would be able to realize our deferred income tax assets in the future in excess of their net recorded amount, we will make an adjustment to the valuation allowance which would reduce the provision for income taxes.
We account for income tax uncertainties according to guidance on the recognition, de-recognition and measurement of potential tax benefits associated with tax positions. We recognize interest and penalties relating to income tax matters as a component of income tax expense.
On December 22, 2017, the Tax Cuts and Jobs Act (the “Act”) was enacted. The Act, which is also commonly referred to as “U.S. tax reform,” significantly changes United States corporate income tax laws by, among other things, reducing the US corporate income tax rate from 35% to 21% starting in 2018.
See Note 15,
Income Taxes
to our consolidated financial statements included under Item 8 of this Annual Report on Form 10-K for further disclosure, including the effect of the Act on income taxes.
Contingent Liabilities
59
We are subject to various legal proceedings, claims and regulatory matters, the outcomes of which are subject to significant uncertainty. We determine whether to disclose or accrue for loss contingencies based on an assessment of whether the risk of loss is remote, reasonably possible or probable, and whether it can be reasonably estimated. We analyze our litigation and regulatory matters based on available information to assess the potential liabilities. Management’s assessment is developed based on an analysis of possible outcomes under various strategies. We accrue for loss contingencies when such amounts are probable and reasonably estimable. If a contingent liability is only reasonably possible, we will disclose the potential range of the loss, if estimable. We record losses related to contingencies in cost of operations or general and administration expenses, depending on the nature of the underlying transaction leading to the loss contingency. Contingent liabilities accounted for under purchase accounting are recorded at their fair values. These fair values may be different from the values we would have otherwise recorded, had the contingent liability not been assumed as part of an acquisition of a business.
See Note 11,
Commitments and Contingencies
to our consolidated financial statements included under Item 8 of this Annual Report on Form 10-K for further disclosure.
Stock-Based Compensation
All share-based compensation cost is measured at the grant date, based on the estimated fair value of the award, and is recognized as expense-in general and administration expense over the employee’s requisite service period. For purposes of calculating stock-based compensation expense, forfeitures are accounted for as they occur. Our equity awards granted generally consist of stock options, including market-based performance stock options, restricted stock, restricted stock units and performance stock units, including market-based performance stock units.
The fair value of each stock option grant is estimated using a Black-Scholes option-pricing model, with the exception of market-based performance stock option grants which are valued using a Monte Carlo option-pricing model. The fair value of restricted stock, restricted stock unit and performance stock unit grants is at a price equal to the fair market value of our Class A common stock at the date of grant. The fair value of market-based performance stock unit grants is valued using a Monte Carlo pricing model.
See Note 12,
Stockholders Equity
to our consolidated financial statements included under Item 8 of this Annual Report on Form 10-K for further disclosure.
Defined Benefit Pension Plan
We currently make contributions to one qualified multiemployer defined benefit pension plan, the New England Teamsters and Trucking Industry Pension Fund ("Pension Plan"). The Pension Plan provides retirement benefits to participants based on their service to contributing employers. We do not administer this plan. The Pension Plan’s benefit formula is based on credited years of service and hours worked as defined in the Pension Plan document. However, the benefits accruals of all current plan participants are frozen. Our pension contributions are made in accordance with funding standards established by the Employee Retirement Income Security Act of 1974 and the Internal Revenue Code, as amended by the Pension Protection Act of 2006. The Pension Plan’s assets have been invested as determined by the Pension Plan's fiduciaries in accordance with the Pension Plan's investment policy. The Pension Plan’s asset allocation is based on the Pension Plan's investment policy and is reviewed as deemed necessary.
See Note 14,
Employee Benefit Plans
to our consolidated financial statements included under Item 8 of this Annual Report on Form 10-K for further disclosure.
New Accounting Standards
For a description of the new accounting standards that may affect us, see Note 2,
Accounting Changes
to our consolidated financial statements included in Item 8 of this Annual Report on Form 10-K.
ITEM 7A. QUANTITATIVE AND QUALITATIVE DISCLOSURE ABOUT MARKET RISK
In the normal course of business we are exposed to market risks, including changes in interest rates and certain commodity prices. We have a variety of strategies to mitigate these market risks, including at times using derivative instruments to hedge some portion of these risks.
60
Interest Rate Volatility
Our strategy to hedge against fluctuations in variable interest rates involves entering into interest rate derivative agreements to hedge against adverse movements in interest rates. As of
December 31, 2018
, we are party to nine interest rate derivative agreements to hedge interest rate risk associated with the variable rate portion of our long-term debt. The total notional amount of these hedging instruments is
$190.0 million
and we receive interest based on the 1-month LIBOR index, restricted by a 1.00% floor in certain instances, and pay interest at a weighted average fixed rate of approximately 2.54%. The agreements mature between February 2021 and May 2023. We have designated these derivative instruments as highly effective cash flow hedges, and therefore the change in fair value is recorded in our stockholders’ deficit as a component of accumulated other comprehensive income (loss) and included in interest expense at the same time as interest expense is affected by the hedged transactions. Differences paid or received over the life of the agreements are recorded as additions to or reductions of interest expense on the underlying debt.
We have
$135.6 million
of fixed rate debt as of
December 31, 2018
in addition to the
$190.0 million
fixed through our interest rate derivative agreements. We had interest rate risk relating to approximately
$229.6 million
of long-term debt as of
December 31, 2018
. The weighted average interest rate on the variable rate portion of long-term debt was approximately 4.5% at
December 31, 2018
. Should the average interest rate on the variable rate portion of long-term debt change by 100 basis points, we estimate that our annual interest expense would change by up to approximately
$2.3 million
. The remainder of our long-term debt is at fixed rates and not subject to interest rate risk.
Commodity Price Volatility
Through our Recycling operation, we market a variety of materials, including fibers such as old corrugated cardboard and old newsprint, plastics, glass, ferrous and aluminum metals. We may use a number of strategies to mitigate impacts from commodity price fluctuations including: (1) charging collection customers a floating sustainability recycling adjustment fee to offtake recycling commodity risks; (2) in-bound material recovery facilities ("MRF") customers receiving a revenue share or indexed materials purchases in higher commodity price markets, or charging these same customers a processing cost or tipping fee per ton in lower commodity price markets; (3) selling recycling commodities to out-bound MRF customers through floor price or fixed price agreements; or (4) entering into fixed price contracts or hedges that mitigate the variability in cash flows generated from the sales of recycled paper at floating prices. We do not use financial instruments for trading purposes and are not a party to any leveraged derivatives. As of
December 31, 2018
, we were not party to any commodity hedging agreements.
Should commodity prices change by $10 per ton, we estimate that our annual operating income margin would change by approximately $1.0 million annually. Our sensitivity to changes in commodity prices is complex because each customer contract is unique relative to revenue sharing, tipping or processing fees and other arrangements. The above operating income impact may not be indicative of future operating results and actual results may vary materially.
61
ITEM 8. FINANCIAL STATEMENTS AND SUPPLEMENTARY DATA
Report of Independent Registered Public Accounting Firm
To the Board of Directors of and Stockholders of Casella Waste Systems, Inc.
Opinions on the Financial Statements and Internal Control Over Financial Reporting
We have audited the accompanying consolidated balance sheets of Casella Waste Systems, Inc. and subsidiaries (the Company) as of December 31, 2018 and 2017, and the related consolidated statements of operations, comprehensive loss, stockholders' deficit and cash flows for each of the three years in the period ended December 31, 2018, and the related notes and schedules (collectively, the financial statements). We also have audited the Company’s internal control over financial reporting as of December 31, 2018, based on criteria established in
Internal Control - Integrated Framework
issued by the Committee of Sponsoring Organizations of the Treadway Commission in 2013.
In our opinion, the financial statements referred to above present fairly, in all material respects, the financial position of the Company as of December 31, 2018 and 2017, and the results of its operations and its cash flows for each of the years in the three-year period ended December 31, 2018, in conformity with accounting principles generally accepted in the United States of America. Also in our opinion, the Company maintained, in all material respects, effective internal control over financial reporting as of December 31, 2018, based on criteria established in
Internal Control - Integrated Framework
issued by the Committee of Sponsoring Organizations of the Treadway Commission in 2013.
As discussed in Management’s Report on Internal Control Over Financial Reporting, management has excluded Youngblood Disposal Enterprises and its wholly owned subsidiaries (collectively Youngblood), Silvarole Transfer, Inc. and select assets of Silvarole Trucking, Inc. (collectively Silvarole), Boon & Sons, Inc. (Boon), Oceanside Rubbish, Inc. (Oceanside) and Al’s Maintenance (Al’s), because they were acquired by the Company in purchase business combinations during the third and fourth quarters of 2018 and have not yet been fully incorporated into the Company’s internal controls over financial reporting. We have also excluded Youngblood, Silvarole, Boon, Oceanside and Al’s from our report of internal controls over financial reporting. Collectively, Youngblood, Silvarole, Boon, Oceanside, and Al’s represent total assets and revenues of approximately 11% and 1.5%, respectively, of the related consolidated financial statement amounts as of and for the year ended December 31, 2018.
Basis for Opinions
The Company's management is responsible for these financial statements, for maintaining effective internal control over financial reporting, and for its assessment of the effectiveness of internal control over financial reporting, included in the accompanying Management’s Report on Internal Control over Financial Reporting. Our responsibility is to express an opinion on the Company's financial statements and an opinion on the company's internal control over financial reporting based on our audits. We are a public accounting firm registered with the Public Company Accounting Oversight Board (United States) (PCAOB) and are required to be independent with respect to the Company in accordance with U.S. federal securities laws and the applicable rules and regulations of the Securities and Exchange Commission and the PCAOB.
We conducted our audits in accordance with the standards of the PCAOB. Those standards require that we plan and perform the audits to obtain reasonable assurance about whether the financial statements are free of material misstatement, whether due to error or fraud, and whether effective internal control over financial reporting was maintained in all material respects.
Our audits of the financial statements included performing procedures to assess the risks of material misstatement of the financial statements, whether due to error or fraud, and performing procedures that respond to those risks. Such procedures included examining, on a test basis, evidence regarding the amounts and disclosures in the financial statements. Our audits also included evaluating the accounting principles used and significant estimates made by management, as well as evaluating the overall presentation of the financial statements. Our audit of internal control over financial reporting included obtaining an understanding of internal control over financial reporting, assessing the risk that a material weakness exists, and testing and evaluating the design and operating effectiveness of internal control based on the assessed risk. Our audits also included performing such other procedures as we considered necessary in the circumstances. We believe that our audits provide a reasonable basis for our opinions.
Definition and Limitations of Internal Control Over Financial Reporting
62
A company's internal control over financial reporting is a process designed to provide reasonable assurance regarding the reliability of financial reporting and the preparation of financial statements for external purposes in accordance with generally accepted accounting principles. A company's internal control over financial reporting includes those policies and procedures that (1) pertain to the maintenance of records that, in reasonable detail, accurately and fairly reflect the transactions and dispositions of the assets of the company; (2) provide reasonable assurance that transactions are recorded as necessary to permit preparation of financial statements in accordance with generally accepted accounting principles, and that receipts and expenditures of the company are being made only in accordance with authorizations of management and directors of the company; and (3) provide reasonable assurance regarding prevention or timely detection of unauthorized acquisition, use or disposition of the company's assets that could have a material effect on the financial statements.
Because of its inherent limitations, internal control over financial reporting may not prevent or detect misstatements. Also, projections of any evaluation of effectiveness to future periods are subject to the risk that controls may become inadequate because of changes in conditions, or that the degree of compliance with the policies or procedures may deteriorate.
/s/ RSM US LLP
We have served as the Company's auditor since 2010.
Boston, Massachusetts
February 22, 2019
63
CASELLA WASTE SYSTEMS, INC. AND SUBSIDIARIES
CONSOLIDATED BALANCE SHEETS
(in thousands)
|
December 31,
2018 |
December 31,
2017 |
||||||
|
ASSETS
|
|||||||
|
CURRENT ASSETS:
|
|||||||
|
Cash and cash equivalents
|
$
|
4,007
|
|
$
|
1,995
|
|
|
|
Account receivables - trade, net of allowance for doubtful accounts of $931 and $809, respectively
|
74,937
|
|
65,953
|
|
|||
|
Refundable income taxes
|
2,254
|
|
522
|
|
|||
|
Prepaid expenses
|
7,345
|
|
8,299
|
|
|||
|
Inventory
|
6,542
|
|
6,534
|
|
|||
|
Other current assets
|
2,008
|
|
1,077
|
|
|||
|
Total current assets
|
97,093
|
|
84,380
|
|
|||
|
Property, plant and equipment, net of accumulated depreciation and amortization of $878,701 and $811,474, respectively
|
404,577
|
|
361,547
|
|
|||
|
Goodwill
|
162,734
|
|
122,605
|
|
|||
|
Intangible assets, net
|
34,767
|
|
8,149
|
|
|||
|
Restricted assets
|
1,248
|
|
1,220
|
|
|||
|
Cost method investments
|
11,264
|
|
12,333
|
|
|||
|
Deferred income taxes
|
9,594
|
|
11,567
|
|
|||
|
Other non-current assets
|
11,133
|
|
13,148
|
|
|||
|
Total assets
|
$
|
732,410
|
|
$
|
614,949
|
|
|
The accompanying notes are an integral part of these consolidated financial statements.
64
CASELLA WASTE SYSTEMS, INC. AND SUBSIDIARIES
CONSOLIDATED BALANCE SHEETS (Continued)
(in thousands, except for share and per share data)
|
December 31,
2018 |
December 31,
2017 |
||||||
|
LIABILITIES AND STOCKHOLDERS' DEFICIT
|
|||||||
|
CURRENT LIABILITIES:
|
|||||||
|
Current maturities of long-term debt and capital leases
|
$
|
2,298
|
|
$
|
4,926
|
|
|
|
Accounts payable
|
57,289
|
|
47,081
|
|
|||
|
Accrued payroll and related expenses
|
10,969
|
|
12,183
|
|
|||
|
Accrued interest
|
2,415
|
|
2,093
|
|
|||
|
Contract liabilities
|
3,074
|
|
1,823
|
|
|||
|
Current accrued capping, closure and post-closure costs
|
11,633
|
|
3,035
|
|
|||
|
Other accrued liabilities
|
23,819
|
|
17,428
|
|
|||
|
Total current liabilities
|
111,497
|
|
88,569
|
|
|||
|
Long-term debt and capital leases, less current portion
|
542,001
|
|
477,576
|
|
|||
|
Accrued capping, closure and post-closure costs, less current portion
|
61,442
|
|
59,255
|
|
|||
|
Deferred income taxes
|
2,519
|
|
2,305
|
|
|||
|
Other long-term liabilities
|
30,783
|
|
25,106
|
|
|||
|
COMMITMENTS AND CONTINGENCIES
|
|
|
|||||
|
STOCKHOLDERS' DEFICIT:
|
|||||||
|
Casella Waste Systems, Inc. stockholders' deficit:
|
|||||||
|
Class A commons stock, 0.01 par value per share; 100,000,000 shares authorized; 41,944,000 and 41,298,000 shares issued and outstanding, respectively
|
419
|
|
413
|
|
|||
|
Class B common stock, $0.01 par value per share; 1,000,000 shares authorized; 988,000 shares issued and outstanding; 10 votes per share
|
10
|
|
10
|
|
|||
|
Additional paid-in capital
|
373,716
|
|
356,638
|
|
|||
|
Accumulated deficit
|
(388,669
|
)
|
(395,107
|
)
|
|||
|
Accumulated other comprehensive (loss) income, net of tax
|
(1,308
|
)
|
184
|
|
|||
|
Total stockholders' deficit
|
(15,832
|
)
|
(37,862
|
)
|
|||
|
Total liabilities and stockholders' deficit
|
$
|
732,410
|
|
$
|
614,949
|
|
|
The accompanying notes are an integral part of these consolidated financial statements.
65
CASELLA WASTE SYSTEMS, INC. AND SUBSIDIARIES
CONSOLIDATED STATEMENTS OF OPERATIONS
(in thousands)
|
|
Fiscal Year Ended
December 31, |
||||||||||
|
|
2018
|
2017
|
2016
|
||||||||
|
Revenues
|
$
|
660,660
|
|
$
|
599,309
|
|
$
|
565,030
|
|
||
|
Operating expenses:
|
|||||||||||
|
Cost of operations
|
453,291
|
|
405,188
|
|
381,973
|
|
|||||
|
General and administration
|
84,791
|
|
79,243
|
|
75,356
|
|
|||||
|
Depreciation and amortization
|
70,508
|
|
62,102
|
|
61,856
|
|
|||||
|
Southbridge Landfill closure charge, net
|
8,054
|
|
65,183
|
|
—
|
|
|||||
|
Expense from acquisition activities and other items
|
1,872
|
|
176
|
|
—
|
|
|||||
|
Environmental remediation charge
|
—
|
|
—
|
|
900
|
|
|||||
|
Contract settlement charge
|
2,100
|
|
—
|
|
—
|
|
|||||
|
Development project charge
|
311
|
|
—
|
|
—
|
|
|||||
|
620,927
|
|
611,892
|
|
520,085
|
|
||||||
|
Operating income (loss)
|
39,733
|
|
(12,583
|
)
|
44,945
|
|
|||||
|
Other expense (income):
|
|||||||||||
|
Interest income
|
(273
|
)
|
(273
|
)
|
(290
|
)
|
|||||
|
Interest expense
|
26,294
|
|
25,160
|
|
38,942
|
|
|||||
|
Loss on debt extinguishment
|
7,352
|
|
517
|
|
13,747
|
|
|||||
|
Impairment of investments
|
1,069
|
|
—
|
|
—
|
|
|||||
|
Other income
|
(745
|
)
|
(935
|
)
|
(1,090
|
)
|
|||||
|
Other expense, net
|
33,697
|
|
24,469
|
|
51,309
|
|
|||||
|
Income (loss) before income taxes
|
6,036
|
|
(37,052
|
)
|
(6,364
|
)
|
|||||
|
(Benefit) provision for income taxes
|
(384
|
)
|
(15,253
|
)
|
494
|
|
|||||
|
Net income (loss)
|
6,420
|
|
(21,799
|
)
|
(6,858
|
)
|
|||||
|
Less: Net loss attributable to noncontrolling interests
|
—
|
|
—
|
|
(9
|
)
|
|||||
|
Net income (loss) attributable to common stockholders
|
$
|
6,420
|
|
$
|
(21,799
|
)
|
$
|
(6,849
|
)
|
||
The accompanying notes are an integral part of these consolidated financial statements.
66
CASELLA WASTE SYSTEMS, INC. AND SUBSIDIARIES
CONSOLIDATED STATEMENTS OF OPERATIONS (Continued)
(in thousands, except for per share data)
|
|
Fiscal Year Ended
December 31, |
||||||||||
|
|
2018
|
2017
|
2016
|
||||||||
|
Basic earnings per share attributable to common stockholders:
|
|||||||||||
|
Weighted average common shares outstanding
|
42,688
|
|
41,846
|
|
41,233
|
|
|||||
|
Basic earnings per common share
|
$
|
0.15
|
|
$
|
(0.52
|
)
|
$
|
(0.17
|
)
|
||
|
Diluted earnings per share attributable to common stockholders:
|
|||||||||||
|
Weighted average common shares outstanding
|
44,168
|
|
41,846
|
|
41,233
|
|
|||||
|
Diluted earnings per common share
|
$
|
0.15
|
|
$
|
(0.52
|
)
|
$
|
(0.17
|
)
|
||
The accompanying notes are an integral part of these consolidated financial statements.
67
CASELLA WASTE SYSTEMS, INC. AND SUBSIDIARIES
CONSOLIDATED STATEMENTS OF
COMPREHENSIVE INCOME (LOSS)
(in thousands)
|
|
Fiscal Year Ended
December 31, |
||||||||||
|
|
2018
|
2017
|
2016
|
||||||||
|
Net income (loss)
|
$
|
6,420
|
|
$
|
(21,799
|
)
|
$
|
(6,858
|
)
|
||
|
Other comprehensive (loss) income, before tax:
|
|||||||||||
|
Hedging activity:
|
|||||||||||
|
Interest rate swap settlements
|
(361
|
)
|
(410
|
)
|
—
|
|
|||||
|
Interest rate swap amounts reclassified into interest expense
|
363
|
|
421
|
|
—
|
|
|||||
|
Unrealized (loss) gain resulting from changes in fair value of derivative instruments
|
(1,476
|
)
|
267
|
|
—
|
|
|||||
|
Unrealized gain (loss) resulting from changes in fair value of marketable securities
|
—
|
|
59
|
|
(75
|
)
|
|||||
|
Other comprehensive (loss) income
|
(1,474
|
)
|
337
|
|
(75
|
)
|
|||||
|
Tax effect related to items of other comprehensive (loss) income
|
—
|
|
85
|
|
—
|
|
|||||
|
Other comprehensive (loss) income, net of tax
|
(1,474
|
)
|
252
|
|
(75
|
)
|
|||||
|
Comprehensive income (loss)
|
4,946
|
|
(21,547
|
)
|
(6,933
|
)
|
|||||
|
Less: Net loss attributable to noncontrolling interests
|
—
|
|
—
|
|
(9
|
)
|
|||||
|
Comprehensive income (loss) attributable to common stockholders
|
$
|
4,946
|
|
$
|
(21,547
|
)
|
$
|
(6,924
|
)
|
||
The accompanying notes are an integral part of these consolidated financial statements.
68
CASELLA WASTE SYSTEMS, INC. AND SUBSIDIARIES
CONSOLIDATED STATEMENT OF
STOCKHOLDERS' DEFICIT
|
|
Casella Waste Systems, Inc. Stockholders' Deficit
|
|
|||||||||||||||||||||||||||||||
|
|
|
Class A
Common Stock
|
Class B
Common Stock
|
Additional
Paid-In
Capital
|
Accumulated Deficit
|
Accumulated Other Comprehensive Income (Loss)
|
Noncontrolling
Interests
|
||||||||||||||||||||||||||
|
|
Total
|
Shares
|
Amount
|
Shares
|
Amount
|
||||||||||||||||||||||||||||
|
Balance, December 31, 2015
|
$
|
(21,597
|
)
|
40,064
|
|
$
|
401
|
|
988
|
|
$
|
10
|
|
$
|
344,518
|
|
$
|
(366,459
|
)
|
$
|
7
|
|
$
|
(74
|
)
|
||||||||
|
Net loss
|
(6,858
|
)
|
—
|
|
—
|
|
—
|
|
—
|
|
—
|
|
(6,849
|
)
|
—
|
|
(9
|
)
|
|||||||||||||||
|
Other comprehensive loss
|
(75
|
)
|
—
|
|
—
|
|
—
|
|
—
|
|
—
|
|
—
|
|
(75
|
)
|
—
|
|
|||||||||||||||
|
Issuances of Class A common stock
|
528
|
|
508
|
|
5
|
|
—
|
|
—
|
|
523
|
|
—
|
|
—
|
|
—
|
|
|||||||||||||||
|
Stock-based compensation
|
3,393
|
|
—
|
|
—
|
|
—
|
|
—
|
|
3,393
|
|
—
|
|
—
|
|
—
|
|
|||||||||||||||
|
Contributions from noncontrolling interest holder
|
59
|
|
—
|
|
—
|
|
—
|
|
—
|
|
—
|
|
—
|
|
—
|
|
59
|
|
|||||||||||||||
|
Balance, December 31, 2016
|
$
|
(24,550
|
)
|
40,572
|
|
$
|
406
|
|
988
|
|
$
|
10
|
|
$
|
348,434
|
|
$
|
(373,308
|
)
|
$
|
(68
|
)
|
$
|
(24
|
)
|
||||||||
|
Net loss
|
(21,799
|
)
|
—
|
|
—
|
|
—
|
|
—
|
|
—
|
|
(21,799
|
)
|
—
|
|
—
|
|
|||||||||||||||
|
Other comprehensive income
|
252
|
|
—
|
|
—
|
|
—
|
|
—
|
|
—
|
|
—
|
|
252
|
|
—
|
|
|||||||||||||||
|
Issuances of Class A common stock
|
1,779
|
|
726
|
|
7
|
|
—
|
|
—
|
|
1,772
|
|
—
|
|
—
|
|
—
|
|
|||||||||||||||
|
Stock-based compensation
|
6,432
|
|
—
|
|
—
|
|
—
|
|
—
|
|
6,432
|
|
—
|
|
—
|
|
—
|
|
|||||||||||||||
|
Other
|
24
|
|
—
|
|
—
|
|
—
|
|
—
|
|
—
|
|
—
|
|
—
|
|
24
|
|
|||||||||||||||
|
Balance, December 31, 2017
|
$
|
(37,862
|
)
|
41,298
|
|
$
|
413
|
|
988
|
|
$
|
10
|
|
$
|
356,638
|
|
$
|
(395,107
|
)
|
$
|
184
|
|
$
|
—
|
|
||||||||
|
Net income
|
6,420
|
|
—
|
|
—
|
|
—
|
|
—
|
|
—
|
|
6,420
|
|
—
|
|
—
|
|
|||||||||||||||
|
Other comprehensive loss
|
(1,474
|
)
|
—
|
|
—
|
|
—
|
|
—
|
|
—
|
|
—
|
|
(1,474
|
)
|
—
|
|
|||||||||||||||
|
Issuances of Class A common stock
|
1,017
|
|
496
|
|
5
|
|
—
|
|
—
|
|
1,012
|
|
—
|
|
—
|
|
—
|
|
|||||||||||||||
|
Stock-based compensation
|
8,445
|
|
—
|
|
—
|
|
—
|
|
—
|
|
8,445
|
|
—
|
|
—
|
|
—
|
|
|||||||||||||||
|
Issuance of Class A common stock - acquisition
|
7,622
|
|
150
|
|
1
|
|
—
|
|
—
|
|
7,621
|
|
—
|
|
—
|
|
—
|
|
|||||||||||||||
|
Cumulative effect of new accounting principle
|
—
|
|
—
|
|
—
|
|
—
|
|
—
|
|
—
|
|
18
|
|
(18
|
)
|
—
|
|
|||||||||||||||
|
Balance, December 31, 2018
|
$
|
(15,832
|
)
|
41,944
|
|
$
|
419
|
|
988
|
|
$
|
10
|
|
$
|
373,716
|
|
$
|
(388,669
|
)
|
$
|
(1,308
|
)
|
$
|
—
|
|
||||||||
The accompanying notes are an integral part of these consolidated financial statements.
69
CASELLA WASTE SYSTEMS, INC. AND SUBSIDIARIES
CONSOLIDATED STATEMENTS OF CASH FLOWS
(in thousands)
|
|
Fiscal Year Ended
December 31, |
||||||||||
|
|
2018
|
2017
|
2016
|
||||||||
|
Cash Flows from Operating Activities:
|
|||||||||||
|
Net income (loss)
|
$
|
6,420
|
|
$
|
(21,799
|
)
|
$
|
(6,858
|
)
|
||
|
Adjustments to reconcile net income (loss) to net cash provided by operating activities:
|
|||||||||||
|
Depreciation and amortization
|
70,508
|
|
62,102
|
|
61,856
|
|
|||||
|
Depletion of landfill operating lease obligations
|
9,724
|
|
9,646
|
|
9,295
|
|
|||||
|
Interest accretion on landfill and environmental remediation liabilities
|
5,708
|
|
4,482
|
|
3,606
|
|
|||||
|
Amortization of debt issuance costs and discounts on long-term debt
|
2,449
|
|
2,692
|
|
3,881
|
|
|||||
|
Stock-based compensation
|
8,445
|
|
6,432
|
|
3,393
|
|
|||||
|
Environmental remediation charge
|
—
|
|
—
|
|
900
|
|
|||||
|
(Gain) loss on sale of property and equipment
|
(492
|
)
|
49
|
|
(574
|
)
|
|||||
|
Southbridge Landfill non-cash closure charge
|
16,179
|
|
63,526
|
|
—
|
|
|||||
|
Southbridge Landfill insurance recovery for investing activities
|
(3,506
|
)
|
—
|
|
—
|
|
|||||
|
Non-cash expense from acquisition activities and other items
|
757
|
|
—
|
|
—
|
|
|||||
|
Development project charge
|
311
|
|
—
|
|
—
|
|
|||||
|
Loss on debt extinguishment
|
7,352
|
|
517
|
|
13,747
|
|
|||||
|
Impairment of investments
|
1,069
|
|
—
|
|
—
|
|
|||||
|
Deferred income taxes
|
1,250
|
|
(15,525
|
)
|
583
|
|
|||||
|
Changes in assets and liabilities, net of effects of acquisitions and divestitures:
|
|||||||||||
|
Accounts receivable
|
(5,833
|
)
|
(4,664
|
)
|
(1,029
|
)
|
|||||
|
Accounts payable
|
9,091
|
|
2,084
|
|
76
|
|
|||||
|
Prepaid expenses, inventories and other assets
|
535
|
|
(1,404
|
)
|
(2,256
|
)
|
|||||
|
Accrued expenses and other liabilities
|
(9,133
|
)
|
(600
|
)
|
(6,186
|
)
|
|||||
|
Net cash provided by operating activities
|
120,834
|
|
107,538
|
|
80,434
|
|
|||||
|
Cash Flows from Investing Activities:
|
|||||||||||
|
Acquisitions, net of cash acquired
|
(88,918
|
)
|
(5,056
|
)
|
(2,839
|
)
|
|||||
|
Additions to property, plant and equipment
|
(73,232
|
)
|
(64,862
|
)
|
(54,238
|
)
|
|||||
|
Payments on landfill operating lease contracts
|
(7,415
|
)
|
(7,240
|
)
|
(7,249
|
)
|
|||||
|
Proceeds from Southbridge Landfill insurance recovery for investing activities
|
3,506
|
|
—
|
|
—
|
|
|||||
|
Proceeds from sale of property and equipment
|
870
|
|
711
|
|
1,362
|
|
|||||
|
Proceeds from property insurance settlement
|
992
|
|
—
|
|
—
|
|
|||||
|
Net cash used in investing activities
|
(164,197
|
)
|
(76,447
|
)
|
(62,964
|
)
|
|||||
|
Cash Flows from Financing Activities:
|
|||||||||||
|
Proceeds from long-term borrowings
|
634,700
|
|
185,500
|
|
604,850
|
|
|||||
|
Principal payments on long-term debt
|
(584,223
|
)
|
(216,966
|
)
|
(608,198
|
)
|
|||||
|
Payments of debt issuance costs
|
(5,573
|
)
|
(1,452
|
)
|
(8,146
|
)
|
|||||
|
Payments of debt extinguishment costs
|
—
|
|
—
|
|
(7,219
|
)
|
|||||
|
Proceeds from the exercise of share based awards
|
471
|
|
1,278
|
|
128
|
|
|||||
|
Net cash provided by (used in) financing activities
|
45,375
|
|
(31,640
|
)
|
(18,585
|
)
|
|||||
|
Net increase (decrease) in cash, cash equivalents and restricted cash
|
2,012
|
|
(549
|
)
|
(1,115
|
)
|
|||||
|
Cash, cash equivalents and restricted cash, beginning of period
|
1,995
|
|
2,544
|
|
3,659
|
|
|||||
|
Cash, cash equivalents and restricted cash, end of period
|
$
|
4,007
|
|
$
|
1,995
|
|
$
|
2,544
|
|
||
The accompanying notes are an integral part of these consolidated financial statements.
CASELLA WASTE SYSTEMS, INC. AND SUBSIDIARIES
CONSOLIDATED STATEMENTS OF CASH FLOWS (Continued)
(in thousands)
|
|
Fiscal Year Ended
December 31, |
||||||||||
|
|
2018
|
2017
|
2016
|
||||||||
|
Supplemental Disclosures of Cash Flow Information:
|
|||||||||||
|
Cash paid during the period for:
|
|||||||||||
|
Interest
|
$
|
23,523
|
|
$
|
25,029
|
|
$
|
42,712
|
|
||
|
Income taxes, net of refunds
|
$
|
105
|
|
$
|
146
|
|
$
|
274
|
|
||
|
Supplemental Disclosures of Non-Cash Investing and Financing Activities:
|
|||||||||||
|
Non-current assets acquired through long-term obligations
|
$
|
7,092
|
|
$
|
3,564
|
|
$
|
2,299
|
|
||
The accompanying notes are an integral part of these consolidated financial statements.
70
CASELLA WASTE SYSTEMS, INC. AND SUBSIDIARIES
NOTES TO CONSOLIDATED FINANCIAL STATEMENTS
(in thousands, except for per share data)
1. BASIS OF PRESENTATION
Casella Waste Systems, Inc. (“Parent”), its consolidated subsidiaries and any partially owned entities over which it has a controlling financial interest (collectively, “we”, “us” or “our”), is a regional, vertically integrated solid waste services company that provides collection, transfer, disposal, landfill, landfill gas-to-energy, recycling and organics services in the northeastern United States. We market recyclable metals, aluminum, plastics, paper and corrugated cardboard, which have been processed at our recycling facilities, as well as recyclables purchased from third-parties. We manage our solid waste operations on a geographic basis through
two
regional operating segments, our Eastern and Western regions, each of which provides a full range of solid waste services, and our larger-scale recycling and commodity brokerage operations through our Recycling segment. Organics services, ancillary operations, along with major account and industrial services are included in our Other segment.
The accompanying consolidated financial statements, which include the accounts of the Parent, our wholly-owned subsidiaries and any partially owned entities over which we have a controlling financial interest, have been prepared in accordance with generally accepted accounting principles in the United States (“GAAP”) pursuant to the rules and regulations of the Securities and Exchange Commission (“SEC”). All significant intercompany accounts and transactions are eliminated in consolidation. Investments in entities in which we do not have a controlling financial interest are accounted for under either the equity method or the cost method of accounting, as appropriate.
2. ACCOUNTING CHANGES
|
Standard
|
|
Description
|
|
Effect on the Financial Statements or Other
Significant Matters |
|
Accounting standards updates ("ASU") that were adopted effective January 1, 2018
|
||||
|
ASU 2017-12: Derivatives and Hedging (Topic 815)
|
Requires that an entity align its risk management activities and financial reporting for hedging relationships through changes to both the designation and measurement guidance for qualifying hedging relationships and the presentation of hedge results. This guidance expands and refines hedge accounting for both financial and commodity risk components and aligns the recognition and presentation of the effects of the hedging instrument and the hedged item in the financial statements.
|
The adoption of this guidance affects the designation and measurement guidance for qualifying hedging relationships and the method of presenting hedge results, including the addition of a tabular disclosure related to the effect on the income statement of fair value and cash flow hedges and no longer measuring and reporting hedge ineffectiveness. We early adopted this guidance using a modified retrospective approach effective April 1, 2018 with an initial application date of January 1, 2018 with no adjustment to Accumulated Deficit. See Note 10,
Long-Term Debt and Capital Leases
for additional disclosure.
|
||
|
ASU 2017-09: Compensation - Stock Compensation (Topic 718)
|
Requires that an entity should account for the effects of a modification to an award unless all of the following conditions are met: the fair value of the modified award is the same as the fair value of the original award immediately before the original award is modified; the vesting conditions of the modified award are the same as the vesting conditions immediately before the original award is modified; and the classification of modified award as an equity instrument or a liability instrument is the same as the classification of the original award immediately before the original award is modified.
|
The adoption of this guidance could affect equity compensation expense and net income if there is a modification of an award.
|
||
71
|
ASU 2016-18: Statement of Cash Flows (Topic 230)
|
Requires that an entity should explain the change during the period of cash, cash equivalents, and amounts generally described as restricted cash or restricted cash equivalents when reconciling the beginning-of-period and end-of-period total amounts shown on the statement of cash flows.
|
The adoption of this guidance is retrospective to each period presented. As a result of this adoption, we reclassified $1,347 of restricted cash from net cash used in investing activities in fiscal year 2016.
|
||
|
ASU 2016-01, as amended through March 2018: Financial Instruments - Overall (Topic 825-10)
|
|
Requires the following: (1) equity investments (except those accounted for under the equity method of accounting, or those that result in consolidation of the investee) to be measured at fair value with changes in fair value recognized in net income; (2) entities to use the exit price notion when measuring the fair value of financial instruments for disclosure purposes; (3) separate presentation of financial assets and financial liabilities by measurement category and form of financial asset; and (4) the elimination of the disclosure requirement to disclose the method(s) and significant assumptions used to estimate the fair value that is required to be disclosed for financial instruments measured at amortized cost.
|
|
The adoption of this guidance resulted in a cumulative-effect adjustment to Accumulated Deficit, recognition of the change in fair value of certain equity investments in net income, and enhanced disclosure. The adoption of this guidance did not have a material impact on our consolidated financial statements.
|
|
ASU 2014-09, as amended through November 2017: Revenue from Contracts with Customers (Topic 606)
|
|
The core principle of the guidance is that using a five step methodology an entity should recognize revenue to depict the transfer of promised goods or services to customers in an amount that reflects the consideration to which the entity expects to be entitled in exchange for those goods or services. The standard also requires enhanced qualitative and quantitative disclosure regarding revenue recognition from customer contracts.
|
|
We adopted the guidance using the modified retrospective approach effective January 1, 2018 with no adjustment to Accumulated Deficit. We adopted the standard through the application of the portfolio approach. We selected a sample of customer contracts to assess under the guidance of the new standard that were characteristically representative of each portfolio. Upon completion of our review, the guidance did not result in a significant change to the timing of revenue recognition. We identified certain immaterial sales commissions, which represent costs of obtaining a contract, that should be capitalized as contract acquisition costs under the guidance and amortized to general and administration expense over the expected life of the customer contract. Based on the immateriality of these sales commissions, no adjustment to Accumulated Deficit nor the accounting of these costs was deemed necessary. See Note 4,
Revenue Recognition
for additional disclosure.
|
|
Standard
|
|
Description
|
|
Effect on the Financial Statements or Other
Significant Matters
|
|
Accounting standards that are pending adoption at December 31, 2018
|
||||
72
|
ASU 2018-16: Derivatives and Hedging (Topic 815)
|
Allows an entity to use the overnight index swap ("OIS") rate as a benchmark interest rate for hedge accounting purposes in conjunction with ASU 2017-12: Derivatives and Hedging.
|
The adoption of this guidance is not expected to have a material impact on our consolidated financial statements as we do not have any hedges that use the OIS as a benchmark interest rate. This guidance is effective January 1, 2019 because we early adopted ASU 2017-12: Derivatives and Hedging, with an initial application date of January 1, 2018.
|
||
|
ASU 2017-04: Intangibles - Goodwill and Other (Topic 350)
|
Requires that when an entity is performing its annual, or interim, goodwill impairment test, it should compare the fair value of the reporting unit with its carrying amount when calculating its impairment charge, noting that the loss recognized should not exceed the total amount of goodwill allocated to that reporting unit. Additionally, if applicable, an entity should consider income tax effects from any tax deductible goodwill on the carrying amount of the reporting unit when calculating its impairment charge.
|
As of December 31, 2018, we did not record a goodwill impairment charge related to our annual goodwill impairment test because at that time the fair value of each reporting unit exceeded its respective carrying value. Upon adoption, if the carrying value of any of these reporting units exceeds the fair value when we perform a goodwill impairment test, we would record an impairment charge equal to the amount by which the carrying value exceeds its fair value. This guidance is effective January 1, 2020 with early adoption permitted for interim or annual goodwill impairment tests performed after January 1, 2017.
|
||
73
|
ASU 2016-02, as amended through December 2018: Leases (Topic 842)
|
|
Requires that a lessee recognize at the commencement date: a lease liability, which is the obligation of the lessee to make lease payments arising from a lease, measured on a discounted basis; and a right-of-use asset, which is an asset that represents the lessee’s right to use, or control the use of, a specified asset for the lease term.
|
|
We adopted the guidance using the prospective optional transition method effective January 1, 2019, which allows us to elect not to restate comparative periods and recognize the effects of applying this guidance as a cumulative-effect adjustment to retained earnings as of January 1, 2019. Upon adopting this guidance, we will recognize a right-of-use asset and a lease liability for leases classified as operating leases with a term in excess of 12 months in our consolidated balance sheet. As a part of the implementation, we have applied the practical expedient package. The practical expedient package allowed us to: 1) not reassess lease classification for existing leases; 2) not reassess whether a contract contains a lease for existing contracts; and 3) not reassess initial direct costs for existing leases. With the assistance of third-party resources, we designed internal controls over the adoption of this guidance and implemented a third-party enterprise lease management software solution. In conjunction with this, we have modified our lease policy and internal business process to effectively manage and account for leases as well as support recognition and disclosure under the new standard. As of January 1, 2019, we expect to recognize a right-of-use asset for operating leases of between approximately $106,000 and $121,000 and a corresponding lease liability of between approximately $76,000 and $91,000 with the difference primarily associated with prepaid amounts for certain landfill operating leases that will be reclassified from property, plant and equipment. We do not expect to recognize a material cumulative effect adjustment to retained earnings and we do not expect the adoption of this guidance to have a material impact on our consolidated statements of operations or our consolidated statements of cash flows. We also do not expect that the adoption of this guidance will have a material impact on the accounting for our finance leases. This guidance will require additional disclosures over leases in order to comply with the standard.
|
3. SUMMARY OF SIGNIFICANT ACCOUNTING POLICIES
Management’s Estimates and Assumptions
Preparation of our consolidated financial statements in accordance with GAAP requires management to make certain estimates and assumptions. These estimates and assumptions affect the accounting for and recognition and disclosure of assets, liabilities, equity, revenues and expenses. We must make these estimates and assumptions because certain information that we use is dependent on future events, cannot be calculated with a high degree of precision given the available data or simply cannot be readily calculated. In some cases, these estimates are difficult to determine, and we must exercise significant judgment. In preparing our consolidated financial statements, the estimates and assumptions that we consider to be significant and that present the greatest amount of uncertainty relate to our accounting for landfills, environmental remediation liabilities, asset impairments, accounts receivable valuation allowance, self-insurance reserves, deferred taxes and uncertain tax positions, estimates of the fair values of assets acquired and liabilities assumed in any acquisition, contingent liabilities and stock-based compensation. Each of these items is discussed in more detail elsewhere in these notes to consolidated financial statements, as applicable. Actual results may differ materially from the estimates and assumptions that we use in the preparation of our consolidated financial statements.
74
Cash and Cash Equivalents
We consider all highly liquid investments purchased with original maturities of
three months
or less to be cash equivalents.
Concentrations of Credit Risk
Financial instruments that potentially subject us to concentrations of credit risk consist of cash and cash equivalents, restricted investment securities, accounts receivable-trade and derivative instruments. We maintain cash and cash equivalents and restricted investment securities with banks that at times exceed applicable insurance limits. We reduce our exposure to credit risk by maintaining such deposits with high quality financial institutions. Our concentration of credit risk with respect to accounts receivable-trade is limited because of the large number and diversity of customers we serve, thus reducing the credit risk associated with any one customer group. As of
December 31, 2018
, no single customer or customer group represented greater than
5%
of total accounts receivable - trade. We manage credit risk through credit evaluations, credit limits, and monitoring procedures, but generally do not require collateral to support accounts receivable - trade. We reduce our exposure to credit risk associated with derivative instruments by entering into agreements with high quality financial institutions and by evaluating and regularly monitoring their creditworthiness.
Accounts Receivable – Trade, Net of Allowance for Doubtful Accounts
Accounts receivable – trade represent receivables from customers for collection, transfer, recycling, disposal and other services. Our accounts receivable – trade are recorded when billed or when related revenue is earned, if earlier, and represent claims against third-parties that will be settled in cash. The carrying value of our accounts receivable – trade, net of allowance for doubtful accounts represents its estimated net realizable value. Estimates are used in determining our allowance for doubtful accounts based on our historical collection experience, current trends, credit policy and a review of our accounts receivable – trade by aging category. Our reserve is evaluated and revised on a monthly basis. Past due accounts receivable - trade are written off when deemed to be uncollectible.
Inventory
Inventory includes secondary fibers, recyclables ready for sale, and parts and supplies. Inventory is stated at the lower of cost (first-in, first-out) or market.
Property, Plant and Equipment
Property, plant and equipment is recorded at cost, less accumulated depreciation and amortization. We provide for depreciation and amortization using the straight-line method by charges to operations in amounts that allocate the cost of the assets over their estimated useful lives as follows:
|
Asset Classification
|
|
Estimated
Useful Life |
|
Buildings and improvements
|
|
10-30 years
|
|
Machinery and equipment
|
|
5-10 years
|
|
Rolling stock
|
|
5-10 years
|
|
Containers
|
|
5-12 years
|
|
Furniture and Fixtures
|
|
3-8 years
|
The cost of maintenance and repairs is charged to operations as incurred.
Landfill development costs are included in property, plant and equipment. Landfill development costs include costs to develop each of our landfill sites, including such costs related to landfill liner material and installation, excavation for airspace, landfill leachate collection systems, landfill gas collection systems, environmental monitoring equipment for groundwater and landfill gas, directly related engineering, capitalized interest, on-site road construction, and other capital infrastructure. Additionally, landfill development costs include all land purchases within the landfill footprint and the purchase of any required landfill buffer property. Under life-cycle accounting, these costs are capitalized and charged to expense based on tonnage placed into each site.
See the “
Landfill Accounting
” accounting policy below for additional disclosure over the amortization of landfill development costs and Note 7,
Property, Plant and Equipment
for disclosure over property, plant and equipment.
75
Landfill Accounting
Life Cycle Accounting
Under life-cycle accounting, all costs related to acquisition and construction of landfill sites are capitalized and charged to expense based on tonnage placed into each site. Landfill permitting, acquisition and preparation costs are amortized on the units-of-consumption method as landfill airspace is consumed. In determining the amortization rate for each of our landfills, preparation costs include the total estimated costs to complete construction of the landfills’ permitted and expansion capacity.
Landfill Development Costs
We estimate the total cost to develop each of our landfill sites to its remaining permitted and expansion capacity (see landfill development costs discussed within the “
Property, Plant and Equipment
” accounting policy above). The projection of these landfill costs is dependent, in part, on future events. The remaining amortizable basis of each landfill includes costs to develop a site to its remaining permitted and expansion capacity and includes amounts previously expended and capitalized, net of accumulated airspace amortization, and projections of future purchase and development costs including capitalized interest. The interest capitalization rate is based on our weighted average interest rate incurred on borrowings outstanding during the period. Interest capitalized during the fiscal years ended December 31,
2018
("fiscal year 2018"), December 31,
2017
("fiscal year 2017") and December 31,
2016
("fiscal year 2016") was
$140
,
$295
and
$273
, respectively.
Landfill Airspace
We apply the following guidelines in determining a landfill’s remaining permitted and expansion airspace:
Remaining Permitted Airspace.
Our engineers, in consultation with third-party engineering consultants and surveyors, are responsible for determining remaining permitted airspace at our landfills. The remaining permitted airspace is determined by an annual survey, which is then used to compare the existing landfill topography to the expected final landfill topography.
Expansion Airspace
. We currently include unpermitted expansion airspace in our estimate of remaining permitted and expansion airspace in certain circumstances. To be considered expansion airspace all of the following criteria must be met:
|
•
|
we control the land on which the expansion is sought;
|
|
•
|
all technical siting criteria have been met or a variance has been obtained or is reasonably expected to be obtained;
|
|
•
|
we have not identified any legal or political impediments which we believe will not be resolved in our favor;
|
|
•
|
we are actively working on obtaining any necessary permits and we expect that all required permits will be received; and
|
|
•
|
senior management has approved the project.
|
For unpermitted airspace to be included in our estimate of remaining permitted and expansion airspace, the expansion effort must meet all of the criteria listed above. These criteria are evaluated annually by our engineers, accountants, lawyers, managers and others to identify potential obstacles to obtaining the permits. Once the remaining permitted and expansion airspace is determined in cubic yards, an airspace utilization factor (“AUF”) is established to calculate the remaining permitted and expansion capacity in tons. The AUF is established using a process that considers the measured density obtained from annual surveys. When we include the expansion airspace in our calculation of remaining permitted and expansion airspace, we include the projected costs for development, as well as the projected asset retirement costs related to final capping, closure and post-closure of the expansion airspace in the amortization basis of the landfill.
After determining the costs and the remaining permitted and expansion capacity at each of our landfills, we determine the per ton rates that will be expensed as waste is received and deposited at each of our landfills by dividing the costs by the corresponding number of tons. We calculate per ton amortization rates for assets associated with each final capping event, for assets related to closure and post-closure activities and for all other costs capitalized or to be capitalized in the future for each landfill. These rates per ton are updated annually, or more frequently, as significant facts change.
It is possible that actual results, including the amount of costs incurred, the timing of final capping, closure and post-closure activities, our airspace utilization or the success of our expansion efforts, could ultimately turn out to be significantly different from our estimates and assumptions. To the extent that such estimates or related assumptions prove to be significantly different than actual results, lower profitability may be experienced due to higher amortization rates, higher final capping, closure or post-closure rates, or higher expenses. Higher profitability may result if the opposite occurs. Most significantly, if it is determined that the expansion capacity should no longer be considered in calculating the recoverability of the landfill asset, we may be required to recognize an asset impairment. If it is determined that the likelihood of receiving an expansion permit has become remote, the capitalized costs related to the expansion effort are expensed immediately.
76
Final Capping, Closure and Post-Closure Costs
The following is a description of our landfill asset retirement activities and related accounting:
Final Capping Costs.
Final capping activities include the installation of liners, drainage, compacted soil layers and topsoil over areas of a landfill where total airspace has been consumed and waste is no longer being received. Final capping activities occur throughout the life of the landfill. Our engineering personnel estimate the cost for each final capping event based on the acreage to be capped, along with the final capping materials and activities required. The estimates also consider when these costs would actually be paid and factor in inflation and discount rates. The engineers then quantify the landfill capacity associated with each final capping event and the costs for each event are amortized over that capacity as waste is received at the landfill.
Closure and Post-Closure Costs.
Closure and post-closure costs represent future estimated costs related to monitoring and maintenance of a solid waste landfill after a landfill facility ceases to accept waste and closes. We estimate, based on input from our engineers, accountants, lawyers, managers and others, our future cost requirements for closure and post-closure monitoring and maintenance based on our interpretation of the technical standards of the Subtitle D regulations and the air emissions standards under the Clean Air Act of 1970, as amended, as they are being applied on a state-by-state basis. Closure and post-closure accruals for the cost of monitoring and maintenance include site inspection, groundwater monitoring, leachate management, methane gas control and recovery, and operation and maintenance costs to be incurred for a period which is generally for a term of
30
years after final closure of a landfill. In determining estimated future closure and post-closure costs, we consider costs associated with permitted and permittable airspace.
Our estimated future final capping, closure and post-closure costs, based on our interpretation of current requirements and proposed regulatory changes, are intended to approximate fair value. Absent quoted market prices, our cost estimates are based on historical experience, professional engineering judgment and quoted or actual prices paid for similar work. Our estimate of costs to discharge final capping, closure and post-closure asset retirement obligations for landfills are developed in today’s dollars. These costs are then inflated to the period of performance using an estimate of inflation, which is updated annually (
1.5%
as of
December 31, 2018
). Final capping, closure and post-closure liabilities are discounted using the credit adjusted risk-free rate in effect at the time the obligation is incurred. The weighted average rate applicable to our asset retirement obligations as of
December 31, 2018
is between approximately
8.7%
and
9.8%
, the range of the credit adjusted risk free rates effective since the adoption of guidance associated with asset retirement obligations in the fiscal year ended April 30, 2004. Accretion expense is necessary to increase the accrued final capping, closure and post-closure liabilities to the future anticipated obligation. To accomplish this, we accrete our final capping, closure and post-closure accrual balances using the same credit-adjusted risk-free rate that was used to calculate the recorded liability. Accretion expense on recorded landfill liabilities is recorded to cost of operations from the time the liability is recognized until the costs are paid. Accretion expense on recorded landfill liabilities amounted to
$5,556
,
$4,401
and
$3,606
in fiscal years
2018
,
2017
and
2016
, respectively.
We provide for the accrual and amortization of estimated future obligations for closure and post-closure based on tonnage placed into each site. With regards to final capping, the liability is recognized and the costs are amortized based on the airspace related to the specific final capping event.
See Note 9,
Final Capping, Closure and Post-Closure Costs
for disclosure over asset retirement obligations related to final capping, closure and post-closure costs.
We operate in states which require a certain portion of landfill final capping, closure and post-closure obligations to be secured by financial assurance, which may take the form of surety bonds, letters of credit and restricted investment securities. Surety bonds securing closure and post-closure obligations at
December 31, 2018
and
December 31, 2017
totaled
$201,177
and
$164,893
, respectively. Letters of credit securing closure and post-closure obligations as of
December 31, 2018
and
December 31, 2017
totaled
$0
and
$0
, respectively. See Note 6,
Restricted Assets
for disclosure over restricted investment securities securing closure and post-closure obligations.
Landfill Operating Lease Contracts
We are party to
four
landfill operation and management agreements. These agreements are long-term landfill operating contracts with government bodies whereby we receive tipping revenue, pay normal operating expenses and assume future final capping, closure and post-closure obligations. The government body retains ownership of the landfill. There is no bargain purchase option and title to the property does not pass to us at the end of the lease term. We allocate the consideration paid to the landfill airspace rights and underlying land lease based on the relative fair values.
77
In addition to up-front or one-time payments, the landfill operating agreements may require us to make future minimum rental payments, including success/expansion fees, other direct costs and final capping, closure and post-closure costs. The value of all future minimum rental payments is amortized and charged to cost of operations over the life of the contract. We amortize the consideration allocated to airspace rights as airspace is utilized on a units-of-consumption basis and such amortization is charged to cost of operations as airspace is consumed (e.g., as tons are placed into the landfill). The underlying value of any land lease is amortized to cost of operations on a straight-line basis over the estimated life of the operating agreement. See Note 7,
Property, Plant and Equipment
for disclosure over depletion of landfill operating lease contracts.
Leases
In addition to landfill operating leases, we lease property and equipment in the ordinary course of our business. Our leases have varying terms and may include renewal or purchase options, escalation clauses, restrictions, lease concessions, capital project funding, penalties or other obligations that we consider in determining minimum rental payments. Leases are either classified as operating leases or capital leases, as appropriate.
Operating Leases.
Many of our leases are operating leases. This classification generally can be attributed to either (i) relatively low fixed minimum rental payments or (2) minimum lease terms that are much shorter than the assets’ economic useful lives. We expect that, in the normal course of business, our operating leases will be replaced by other leases, or replaced with fixed asset expenditures.
See Note 11,
Commitments and Contingencies
for disclosure over future minimum lease payments related to our operating leases.
Capital Leases.
We capitalize assets acquired under capital leases at the inception of each lease and amortize them to depreciation expense over the useful life of the asset or the lease term, as appropriate. The present value of the related lease payments is recorded as a debt obligation.
See Note 10,
Long-Term Debt and Capital Leases
for disclosure over our future maturities of debt, which includes capital lease payments.
Effective January 1, 2019, we adopted ASU 2016-02, as amended through December 2018: Leases (Topic 842). See Note 2,
Accounting Changes
for additional disclosure over our adoptions of this guidance.
Goodwill and Intangible Assets
Goodwill.
Goodwill is the excess of our purchase cost over the fair value of the net assets of acquired businesses. We do not amortize goodwill, but as discussed in the “
Asset Impairments
” accounting policy below, we assess our goodwill for impairment at least annually.
See Note 8,
Goodwill and Intangible Assets
for disclosure over goodwill.
Intangible Assets.
Intangible assets consist primarily of covenants not-to-compete and customer lists. Intangible assets are recorded at fair value and are amortized based on the economic benefit provided or using the straight-line method over their estimated useful lives. Covenants not-to-compete and customer lists are typically amortized over a term of no more than
10 years
.
See Note 8,
Goodwill and Intangible Assets
for disclosure over intangible assets.
Investments in Unconsolidated Entities
Investments in unconsolidated entities over which we have significant influence over the investees’ operating and financing activities are accounted for under the equity method of accounting. Investments in affiliates in which we do not have the ability to exert significant influence over the investees’ operating and financing activities are accounted for under the cost method of accounting. As of
December 31, 2018
and
December 31, 2017
, we had
no
investments accounted for under the equity method of accounting.
We monitor and assess the carrying value of our investments throughout the year for potential impairment and write them down to their fair value when other-than-temporary declines exist. Fair value is generally based on (i) other third-party investors’ recent transactions in the securities; (ii) other information available regarding the current market for similar assets and/or (iii) a market or income approach, as deemed appropriate.
78
When we assess the carrying value of our investments for potential impairment, determining the fair value of our investments is reliant upon the availability of market information and/or other information provided by third-parties to be able to develop an estimate of fair value. Considerable judgment is required in interpreting market data to develop the estimates of fair value. Accordingly, our estimates are not necessarily indicative of the amounts that we, or other holders of these investments, could realize in a current market exchange. The use of different assumptions and/or estimation methodologies could have a significant effect on the estimated fair values. The estimates of fair value could differ significantly from the amounts presented. See
“Asset Impairments”
accounting policy below.
Fair Value of Financial Instruments
Our financial instruments may include cash and cash equivalents, accounts receivable-trade, restricted investment securities held in trust on deposit with various banks as collateral for our obligations relative to our landfill final capping, closure and post-closure costs and restricted cash reserved to finance certain capital projects, interest rate derivatives, trade payables and long-term debt. Accounting standards include disclosure requirements around fair values used for certain financial instruments and establish a fair value hierarchy. The three-tier hierarchy prioritizes valuation inputs into three levels based on the extent to which inputs used in measuring fair value are observable in the market. Each fair value measurement is reported in one of three levels: Level 1, defined as quoted market prices in active markets for identical assets or liabilities; Level 2, defined as inputs other than Level 1 that are observable, either directly or indirectly, such as quoted prices for similar assets or liabilities; and Level 3, defined as unobservable inputs that are not corroborated by market data.
See Note 10,
Long-Term Debt and Capital Leases
and Note 13,
Fair Value of Financial Instruments
for fair value disclosure over long-term debt and financial instruments, respectively. See the “
Derivatives and Hedging
” accounting policy below for the fair value disclosure over interest rate derivatives.
Business Combinations
We acquire businesses in the waste industry, including non-hazardous waste collection, transfer station, recycling and disposal operations, as part of our growth strategy. Businesses are included in the consolidated financial statements from the date of acquisition.
We recognize, separately from goodwill, the identifiable assets acquired and liabilities assumed at their estimated acquisition-date fair values. We measure and recognize goodwill as of the acquisition date as the excess of: (a) the aggregate of the fair value of consideration transferred, the fair value of any noncontrolling interest in the acquiree (if any) and the acquisition date fair value of our previously held equity interest in the acquiree (if any), over (b) the fair value of net assets acquired and liabilities assumed. If information about facts and circumstances existing as of the acquisition date is incomplete by the end of the reporting period in which a business combination occurs, we will report provisional amounts for the items for which the accounting is incomplete. The measurement period ends once we receive the information we were seeking; however, this period will not extend beyond one year from the acquisition date. Any material adjustments recognized during the measurement period will be recognized retrospectively in the consolidated financial statements of the current period. All acquisition related transaction and restructuring costs are to be expensed as incurred.
See Note 5,
Business Combinations
for disclosure over business acquisitions
.
Environmental Remediation Liabilities
We have recorded environmental remediation liabilities representing our estimate of the most likely outcome of the matters for which we have determined that a liability is probable. These liabilities include potentially responsible party investigations, settlements, certain legal and consultant fees, as well as costs directly associated with site investigation and clean up, such as materials and incremental internal costs directly related to the remedy. We provide for expenses associated with environmental remediation obligations when such amounts are probable and can be reasonably estimated. We estimate costs required to remediate sites where it is probable that a liability has been incurred based on site-specific facts and circumstances. Estimates of the cost for the likely remedy are developed using third-party environmental engineers or other service providers. Where we believe that both the amount of a particular environmental remediation liability and timing of payments are reliably determinable, we inflate the cost in current dollars until the expected time of payment and discount the cost to present value.
See Note 11,
Commitments and Contingencies
for disclosure over environmental remediation liabilities.
79
Self-Insurance Liabilities and Related Costs
We are self-insured for vehicles and workers’ compensation with reinsurance coverage limiting our maximum exposure. Our maximum exposure in fiscal year
2018
under the workers’ compensation plan was
$1,000
per individual event. Our maximum exposure in fiscal year
2018
under the automobile plan was
$1,200
per individual event. The liability for unpaid claims and associated expenses, including incurred but not reported losses, is determined by management with the assistance of a third-party actuary and reflected in our consolidated balance sheet as an accrued liability. We use a third-party to track and evaluate actual claims experience for consistency with the data used in the annual actuarial valuation. The actuarially determined liability is calculated based on historical data, which considers both the frequency and settlement amount of claims. Our self-insurance reserves totaled
$15,040
and
$14,480
as of
December 31, 2018
and
December 31, 2017
, respectively. Our estimated accruals for these liabilities could be significantly different than our ultimate obligations if variables such as the frequency or severity of future events differ significantly from our assumptions.
Income Taxes
We use estimates to determine our provision for income taxes and related assets and liabilities and any valuation allowance recorded against our net deferred tax assets. Valuation allowances have been established for the possibility that tax benefits may not be realized for certain deferred tax assets. Deferred income taxes are recognized based on the expected future tax consequences of differences between the financial statement basis and the tax basis of assets and liabilities, calculated using currently enacted tax rates. We record net deferred tax assets to the extent we believe these assets will more likely than not be realized. In making this determination, we consider all available positive and negative evidence, including scheduled reversals of deferred tax liabilities, projected future taxable income, tax planning strategies and recent financial operations. In the event we determine that we would be able to realize our deferred income tax assets in the future in excess of their net recorded amount, we will make an adjustment to the valuation allowance which would reduce the provision for income taxes.
We account for income tax uncertainties according to guidance on the recognition, de-recognition and measurement of potential tax benefits associated with tax positions. We recognize interest and penalties relating to income tax matters as a component of income tax expense.
On December 22, 2017, the Tax Cuts and Jobs Act (the “Act”) was enacted. The Act, which is also commonly referred to as “U.S. tax reform,” significantly changes United States corporate income tax laws by, among other things, reducing the US corporate income tax rate from 35% to 21% starting in 2018.
See Note 15,
Income Taxes
for disclosure related to income taxes, including the effect of the Act on income taxes.
Derivatives and Hedging
We account for derivatives and hedging activities in accordance with derivatives and hedging accounting guidance that establishes accounting and reporting standards requiring that every derivative instrument (including certain derivative instruments embedded in other contracts) be recorded in the balance sheet as either an asset or liability measured at its fair value. The guidance requires that changes in the derivative’s fair value be recognized currently in earnings unless specific hedge accounting criteria are met.
Our objective for utilizing derivative instruments is to reduce our exposure to fluctuations in cash flows due to changes in the commodity prices of recycled paper and adverse movements in interest rates.
Our strategy to hedge against fluctuations in the commodity prices of recycled paper is to enter into hedges to mitigate the variability in cash flows generated from the sales of recycled paper at floating prices, resulting in a fixed price being received from these sales. We evaluate the hedges and ensure that these instruments qualify for hedge accounting pursuant to derivative and hedging guidance. Designated as highly effective cash flow hedges, both the effective and ineffective portion of the change in the fair value of these derivatives is recorded in our stockholders’ deficit as a component of accumulated other comprehensive income (loss) until the hedged item is settled and recognized as part of commodity revenue. If the price per short ton of the underlying commodity, as reported on the Official Board Market, is less than the contract price per short ton, we receive the difference between the average price and the contract price (multiplied by the notional tons) from the respective counter-party. If the price per short ton of the underlying commodity exceeds the contract price per short ton, we pay the calculated difference to the counter-party. The fair value of commodity hedges are obtained or derived from our counter-parties using valuation models that take into consideration market price assumptions for commodities based on underlying active markets. We were not party to any commodity hedge contracts as of
December 31, 2018
.
Our strategy to hedge against fluctuations in variable interest rates involves entering into interest rate derivative agreements to hedge against adverse movements in interest rates. For interest rate derivatives deemed to be highly effective cash flow hedges, both the effective and ineffective portion of the change in fair value of these derivatives is recorded in our stockholders’ deficit as a component of accumulated other comprehensive income (loss) and reclassified into earnings through interest expense in the same period or periods during which the hedged transaction affects earnings.
80
See Note 13,
Fair Value of Financial Instruments
for fair value disclosure over derivative instruments and Note 10,
Long Term Debt and Capital Leases
for further disclosure over interest rate derivatives. We also early adopted ASU 2017-12: Derivatives and Hedging (Topic815) with an initial application date of January 1, 2018. See Note 2,
Accounting Changes
for further disclosure.
Contingent Liabilities
We are subject to various legal proceedings, claims and regulatory matters, the outcomes of which are subject to significant uncertainty. We determine whether to disclose or accrue for loss contingencies based on an assessment of whether the risk of loss is remote, reasonably possible or probable, and whether it can be reasonably estimated. We analyze our litigation and regulatory matters based on available information to assess the potential liabilities. Management’s assessment is developed based on an analysis of possible outcomes under various strategies. We accrue for loss contingencies when such amounts are probable and reasonably estimable. If a contingent liability is only reasonably possible, we will disclose the potential range of the loss, if estimable. We record losses related to contingencies in cost of operations or general and administration expenses, depending on the nature of the underlying transaction leading to the loss contingency.
See Note 11,
Commitments and Contingencies
for disclosure over loss contingencies, as applicable. Contingent liabilities accounted for under purchase accounting are recorded at their fair values. These fair values may be different from the values we would have otherwise recorded, had the contingent liability not been assumed as part of an acquisition of a business.
See Note 5,
Business Combinations
for disclosure over a contingent liability assumed as part of the acquisition of a business.
Revenue Recognition
We adopted ASU 2014-09, as amended, Revenue from Contracts with Customers (Topic 606) effective January 1, 2018. We adopted this guidance using the modified retrospective approach, noting that no cumulative effect adjustment to the beginning balance of Accumulated Deficit was needed. The comparative periods have not been restated and continue to be reported under Revenue Recognition (Topic 605). We applied this guidance to contracts that were not substantially completed contracts at the date of adoption. Additionally, contract modifications that occurred before the adoption date were not separately evaluated, rather the guidance was applied to the current version of the contract only. We disaggregate our revenues by applicable service line: collection, landfill, transfer, customer solutions, recycling, organics, transportation and landfill gas-to-energy.
Under the new revenue recognition guidance, revenues are measured based on the consideration specified in a contract with a customer. The circumstances that impact the timing and amount of revenue recognized for each applicable service line may vary based on the nature of the service performed. We generally recognize revenues for services over time as we satisfy the performance obligation by transferring control over the service to the customer as the service is performed and the benefit is received and consumed by the customer. Services are typically delivered in a series as a single bundled performance obligation over either a designated period of time or for specified number of services. Services may also be delivered as a single bundled service, on a period-to-period basis, or in a spot transaction. Consideration may be variable on a per ton basis and/or fixed. Fixed consideration is allocated to each distinct service and variable consideration is allocated to the increment of time that the service is performed and we have the contractual right to the fee. Fees are typically billed weekly, monthly, quarterly or in advance. Generally, the amount of consideration that we have the right to receive that is invoiced to the customer directly corresponds to the value of our performance completed to date. We elected the optional exemption, to not disclose the amount of variable consideration included in the transaction price that is allocated to outstanding performance obligations when the variable consideration is allocated entirely to unsatisfied performance obligations or to a wholly unsatisfied promise to transfer a distinct good or service that forms part of a single performance obligation. Revenues that are not satisfied over time are recognized at a point-in-time. This typically includes the sale of recycled or organic materials, as well as renewable energy credits ("RECs"). Revenues from the sale of organic or recycled materials are recognized at a point-in-time as control of the materials transfers to the customer upon shipment or pick-up by the customer. Revenues from the sale of RECs are recognized at a point-in-time as the trade is executed and control transfers to the customer.
Payments to customers that are not in exchange for a distinct good or service are recorded as a reduction of revenues. Rebates to certain customers associated with payments for recycled or organic materials that are received and subsequently processed and sold to other third-parties amounted to
$6,279
in fiscal year
2018
. Rebates are generally recorded as a reduction of revenues upon the sale of such materials, or upon receipt of the recycled materials at our facilities. These payments were previously recorded as a cost of operations. We did not record any revenues in fiscal year
2018
from performance obligations satisfied in previous periods.
Contract receivables, which are included in Accounts receivable - trade, net are recorded when billed or when related revenue is earned, if earlier, and represent claims against third-parties that will be settled in cash. Accounts receivable - trade, net includes gross receivables from contracts of
$73,500
and
$66,227
as of
December 31, 2018
and
December 31, 2017
, respectively. Certain customers are billed in advance and, accordingly, recognition of the related revenues is deferred as a contract liability until the services are provided and control transferred to the customer. Contract liabilities of
$3,074
and
$1,823
as of
81
December 31, 2018
and
December 31, 2017
, respectively, were reclassified out of Other accrued liabilities and presented separately on the face of the Consolidated Balance Sheets. Due to the short term nature of advanced billings, substantially all of the deferred revenue recognized as a contract liability as of December 31, 2017 was recognized as revenue during fiscal year
2018
when the services were performed.
See Note 2,
Accounting Changes
and Note 4,
Revenue Recognition
for disclosure over the new guidance.
Asset Impairments
Recovery of Long-Lived Assets.
We continually assess whether events or changes in circumstances have occurred that may warrant revision of the estimated useful lives of our long-lived assets (other than goodwill) or whether the remaining balances of those assets should be evaluated for possible impairment. Long-lived assets include, for example, capitalized landfill costs, other property, plant and equipment, and identifiable intangible assets. Events or changes in circumstances that may indicate that an asset may be impaired include the following:
|
•
|
a significant decrease in the market price of an asset or asset group;
|
|
•
|
a significant adverse change in the extent or manner in which an asset or asset group is being used or in its physical condition;
|
|
•
|
a significant adverse change in legal factors or in the business climate that could affect the value of an asset or asset group, including an adverse action or assessment by a regulator;
|
|
•
|
an accumulation of costs significantly in excess of the amount originally expected for the acquisition or construction of a long-lived asset;
|
|
•
|
a current period operating or cash flow loss combined with a history of operating or cash flow losses or a projection or forecast that demonstrates continuing losses associated with the use of a long-lived asset or asset group;
|
|
•
|
a current expectation that, more likely than not, a long-lived asset or asset group will be sold or otherwise disposed of significantly before the end of its previously estimated useful life; or
|
|
•
|
an impairment of goodwill at a reporting unit.
|
There are certain indicators listed above that require significant judgment and understanding of the waste industry when applied to landfill development or expansion. For example, a regulator may initially deny a landfill expansion permit application although the expansion permit is ultimately granted. In addition, management may periodically divert waste from one landfill to another to conserve remaining permitted landfill airspace. Therefore, certain events could occur in the ordinary course of business and not necessarily be considered indicators of impairment due to the unique nature of the waste industry.
If an impairment indicator occurs, we perform a test of recoverability by comparing the carrying value of the asset or asset group to its undiscounted expected future cash flows. We group our long-lived assets for this purpose at the lowest level for which identifiable cash flows are primarily independent of the cash flows of other assets or asset groups. If the carrying values are in excess of undiscounted expected future cash flows, we measure any impairment by comparing the fair value of the asset or asset group to its carrying value.
To determine fair value, we use discounted cash flow analyses and estimates about the future cash flows of the asset or asset group. This analysis includes a determination of an appropriate discount rate, the amount and timing of expected future cash flows and growth rates. The cash flows employed in our discounted cash flow analyses are typically based on financial forecasts developed internally by management. The discount rate used is commensurate with the risks involved. We may also rely on third-party valuations and or information available regarding the market value for similar assets.
If the fair value of an asset or asset group is determined to be less than the carrying amount of the asset or asset group, impairment in the amount of the difference is recorded in the period that the impairment occurs. Estimating future cash flows requires significant judgment and projections may vary from the cash flows eventually realized.
See Note 16,
Other Items and Charges
for disclosure related to long-lived asset impairments recognized during the reporting periods.
Goodwill.
We annually assess goodwill for impairment at the end of our fiscal year or more frequently if events or circumstances indicate that impairment may exist.
82
We may assess whether a goodwill impairment exists using either a qualitative or a quantitative assessment. If we perform a qualitative assessment, it involves determining whether events or circumstances exist that indicate it is more likely than not that the fair value of a reporting unit is less than its carrying amount, including goodwill. If based on this qualitative assessment we determine it is not more likely than not that the fair value of a reporting unit is less than its carrying amount, we will not perform a quantitative assessment. If the qualitative assessment indicates that it is more likely than not that the fair value of a reporting unit is less than its carrying amount, or if we elect not to perform a qualitative assessment, we perform a quantitative assessment, or two-step impairment test, to determine whether goodwill impairment exists at the reporting unit.
In the first step (defined as “Step 1”) of testing for goodwill impairment, we estimate the fair value of each reporting unit, which we have determined to be our geographic operating segments, our Recycling segment and our Customer Solutions business, which is included in the Other segment, and compare the fair value with the carrying value of the net assets of each reporting unit. If the fair value is less than its carrying value, then we would perform a second step (defined as “Step 2”) and determine the fair value of the goodwill. In Step 2, the fair value of goodwill is determined by deducting the fair value of a reporting unit’s identifiable assets and liabilities from the fair value of the reporting unit as a whole, as if that reporting unit had just been acquired and the purchase price were being initially allocated.
To determine the fair value of each of our reporting units as a whole we use discounted cash flow analyses, which require significant assumptions and estimates about the future operations of each reporting unit. Significant judgments inherent in this analysis include the determination of appropriate discount rates, the amount and timing of expected future cash flows and growth rates. The cash flows employed in our discounted cash flow analyses are based on financial forecasts developed internally by management. Our discount rate assumptions are based on an assessment of our risk adjusted discount rate, applicable for each reporting unit. In assessing the reasonableness of our determined fair values of our reporting units, we evaluate our results against our current market capitalization.
If the fair value of goodwill is less than its carrying value for a reporting unit, an impairment charge would be recorded to earnings. The loss recognized cannot exceed the carrying amount of goodwill. After a goodwill impairment loss is recognized, the adjusted carrying amount of goodwill becomes its new accounting basis.
In addition to an annual goodwill impairment assessment, we would evaluate a reporting unit for impairment if events or circumstances change between annual tests indicating a possible impairment. Examples of such events or circumstances include the following:
|
•
|
a significant adverse change in legal status or in the business climate;
|
|
•
|
an adverse action or assessment by a regulator;
|
|
•
|
a more likely than not expectation that a segment or a significant portion thereof will be sold; or
|
|
•
|
the testing for recoverability of a significant asset group within the segment.
|
We elected to perform a quantitative analysis as part of our annual goodwill impairment test for fiscal year
2018
. As of
December 31, 2018
, the Step 1 testing for goodwill impairment performed for our Eastern, Western, Recycling and Customer Solutions reporting units indicated that the fair value of each reporting unit exceeded its carrying amount, including goodwill. Furthermore, the Step 1 test indicated that in each case the fair value of our Eastern, Western, Recycling and Customer Solutions reporting units exceeded its carrying value by in excess of
21.5%
. We incurred
no
impairment of goodwill as a result of our annual goodwill impairment tests in each of fiscal years
2018
,
2017
and
2016
. However, there can be no assurance that goodwill will not be impaired at any time in the future.
Cost Method Investments.
As of
December 31, 2018
, we owned
6.8%
of the outstanding common stock of Recycle Rewards, Inc. (“Recycle Rewards”), a company that markets an incentive based recycling service. In fiscal year 2018, it was determined based on the operating performance of Recycle Rewards that our cost method investment in Recycle Rewards was potentially impaired. As a result, we performed a valuation analysis in fiscal year 2018, which used an income approach based on discounted cash flows to determine an equity value for Recycle Rewards in order to properly value our cost method investment in Recycle Rewards. Based on this analysis, it was determined that the fair value of our cost method investment in Recycle Rewards was less than the carrying amount and, therefore, we recorded an other-than-temporary investment impairment charge of
$1,069
in fiscal year 2018. As of
December 31, 2018
, the carrying amount of our cost method investment in Recycle Rewards was
$0
.
As of
December 31, 2018
, we owned
5.2%
of the outstanding equity value of GreenerU, Inc. (“GreenerU”), a services company focused on providing energy efficiency, sustainability and renewable energy solutions to colleges and universities. As of
December 31, 2018
, the carrying amount of our cost method investment in GreenerU was
$309
.
83
As of
December 31, 2018
, we owned
17.0%
and
16.2%
of the outstanding common stock of AGreen Energy LLC (“AGreen”) and BGreen Energy LLC (“BGreen”), respectively. Through AGreen and BGreen, we partner with other capital investors to build farm-based anaerobic digester's in the Northeast to generate electricity from farm and food waste streams. As of
December 31, 2018
, the carrying amount of our cost method investments in AGreen and BGreen was
$297
.
Defined Benefit Pension Plan
We make contributions to
one
qualified multiemployer defined benefit pension plan, the New England Teamsters and Trucking Industry Pension Fund ("Pension Plan"). The Pension Plan provides retirement benefits to participants based on their service to contributing employers. We do not administer this plan. The Pension Plan’s benefit formula is based on credited years of service and hours worked as defined in the Pension Plan document. However, the benefits accruals of all current plan participants are frozen. Our pension contributions are made in accordance with funding standards established by the Employee Retirement Income Security Act of 1974 and the Internal Revenue Code, as amended by the Pension Protection Act of 2006. The Pension Plan’s assets have been invested as determined by the Pension Plan's fiduciaries in accordance with the Pension Plan's investment policy. The Pension Plan’s asset allocation is based on the Pension Plan's investment policy and is reviewed as deemed necessary.
See Note 14,
Employee Benefit Plans
for disclosure over the multiemployer defined benefit pension plan.
Stock-Based Compensation
All share-based compensation cost is measured at the grant date based on the estimated fair value of the award, and is recognized as expense-in general and administration expense over the employee’s requisite service period. For purposes of calculating stock-based compensation expense, forfeitures are accounted for as they occur. Our equity awards granted generally consist of stock options, including market-based performance stock options, restricted stock, restricted stock units and performance stock units, including market-based performance stock units.
The fair value of each stock option grant is estimated using a Black-Scholes option-pricing model, with the exception of market-based performance stock option grants which are valued using a Monte Carlo option-pricing model. The fair value of restricted stock, restricted stock unit and performance stock unit grants is at a price equal to the fair market value of our Class A common stock at the date of grant. The fair value of market-based performance stock unit grants is valued using a Monte Carlo pricing model.
See Note 12,
Stockholders' Equity
for disclosure over stock-based compensation.
Earnings per Share
Basic earnings per share is computed by dividing the net income (loss) from continuing operations attributable to common stockholders by the weighted average number of common shares outstanding during the period. Diluted earnings per share is calculated based on the combined weighted average number of common shares and potentially dilutive shares. Dilutive shares include the assumed exercise of employee stock options, including market-based performance stock options based on the expected achievement of performance targets, unvested restricted stock awards, unvested restricted stock units and unvested performance stock units, including market-based performance units based on the expected achievement of performance targets. In computing diluted earnings per share, we utilize the treasury stock method.
See Note 17,
Earnings Per Share
for disclosure over the calculation of earnings per share.
Subsequent Events
Except as disclosed, no material subsequent events have occurred since
December 31, 2018
through the date of this filing that would require recognition or disclosure in our consolidated financial statements.
|
4.
|
REVENUE RECOGNITION
|
We disaggregate our revenues by applicable service line as follows: collection, landfill, transfer, customer solutions, recycling, organics, transportation and landfill gas-to-energy.
Collection
Collection revenues are principally generated by providing waste collection and disposal services to our customers. Services may be provided as needed or as scheduled. We derive a substantial portion of our collection revenues from commercial and industrial services, which typically have a standard contract duration of three years, along with municipal services that are generally performed pursuant to contracts with municipalities with varying terms. The majority of our residential collection services are performed on a subscription basis with individual households.
Landfill
84
Landfill disposal services primarily consist of receiving some form of acceptable solid waste materials at one of our landfills and appropriately disposing of it. Landfill customers are typically charged a tipping fee on a per ton basis for disposing of their solid waste at our disposal facilities. In general, these fees are variable in nature.
Transfer Station
Transfer station disposal services primarily consist of receiving some form of acceptable solid waste materials at one of our transfer stations and appropriately disposing of it by transporting it to an appropriate disposal site. Transfer station customers are charged a tipping fee on a per ton basis for disposing of their solid waste at our transfer stations. In general, these fees are variable in nature.
Transportation
Transportation services consist of the transportation of large volumes of waste or recycled materials from a customer designated location to another location or disposal facility. Transportation customers are charged a fee on a per ton basis for transporting and/or disposal of the materials. In general, these fees are variable in nature.
Recycling
Recycling services primarily consist of the collection and/or receipt of recycled materials at one of our materials recovery facilities; the processing or sorting of the recycled materials; and the disposal or sale of the recycled materials. Revenues from recycling services consist of revenues derived from municipalities and customers in the form of processing fees, tipping fees and commodity sales. In brokerage arrangements, we act as an agent that facilitates the sale of recyclable materials between an inbound customer and an outbound customer. Revenues from the brokerage of recycled materials are recognized on a net basis at the time of shipment. In general, these fees are variable in nature.
Customer Solutions
Customer solutions services consist of commercial and industrial offerings. Commercial services consist of traditional collection, disposal and recycling services provided to large account multi-site customers. Industrial services consist of overall resource management services provided to large and complex organizations, such as universities, hospitals, manufacturers and municipalities, delivering a wide range of environmental services and zero waste solutions.
Organics
Organics services primarily consist of the collection and/or receipt of organic materials at one of our processing or disposal facilities; the processing of the organic materials; and the disposal or sale of the organic materials.
Landfill Gas-to-Energy
Landfill gas-to-energy services primarily consist of the generation and sale of electricity from landfill gas-to-energy facilities located at certain of our landfills; the reservation of electric generating capacity to be used by a customer on demand; and the sale of RECs.
85
A table of revenues disaggregated by service line and timing of revenue recognition by operating segment follows:
Fiscal Year Ended December 31, 2018
|
Eastern
|
Western
|
Recycling
|
Other
|
Total Revenues
|
|||||||||||||||
|
Collection
|
$
|
136,661
|
|
$
|
170,278
|
|
$
|
—
|
|
$
|
—
|
|
$
|
306,939
|
|
||||
|
Landfill
|
28,419
|
|
66,567
|
|
—
|
|
—
|
|
94,986
|
|
|||||||||
|
Transfer
|
39,991
|
|
27,592
|
|
—
|
|
—
|
|
67,583
|
|
|||||||||
|
Customer solutions
|
—
|
|
—
|
|
—
|
|
67,464
|
|
67,464
|
|
|||||||||
|
Recycling
|
5
|
|
3,823
|
|
42,191
|
|
—
|
|
46,019
|
|
|||||||||
|
Organics
|
—
|
|
—
|
|
—
|
|
54,174
|
|
54,174
|
|
|||||||||
|
Transportation
|
—
|
|
14,270
|
|
—
|
|
4,096
|
|
18,366
|
|
|||||||||
|
Landfill gas-to-energy
|
1,397
|
|
3,732
|
|
—
|
|
—
|
|
5,129
|
|
|||||||||
|
Total Revenues
|
$
|
206,473
|
|
$
|
286,262
|
|
$
|
42,191
|
|
$
|
125,734
|
|
$
|
660,660
|
|
||||
|
Transferred at a point-in-time
|
$
|
648
|
|
$
|
1,145
|
|
$
|
27,260
|
|
$
|
3,921
|
|
$
|
32,974
|
|
||||
|
Transferred over time
|
205,825
|
|
285,117
|
|
14,931
|
|
121,813
|
|
627,686
|
|
|||||||||
|
Total revenues
|
$
|
206,473
|
|
$
|
286,262
|
|
$
|
42,191
|
|
$
|
125,734
|
|
$
|
660,660
|
|
||||
86
5. BUSINESS COMBINATIONS
In fiscal year 2018, we acquired
six
solid waste collection and
one
transfer business in our Western region and
two
businesses comprised of solid waste collection and transfer operations in our Eastern region. In fiscal year 2017, we acquired
one
solid waste collection business in our Eastern region and
three
solid waste collection businesses in our Western region, and in fiscal year 2016 we acquired three transfer operations. The operating results of these businesses are included in the accompanying audited consolidated statements of operations from each date of acquisition, and the purchase price has been allocated to the net assets acquired based on fair values at each date of acquisition, with the residual amounts recorded as goodwill. Acquired intangible assets other than goodwill that are subject to amortization include client lists and non-compete covenants. These are amortized over a
five
to
ten
year period from the date of acquisition. All amounts recorded to goodwill in fiscal years
2018
and
2017
, except goodwill related to the acquisition of Complete Disposal Company, Inc. and its subsidiary United Material Management of Holyoke, Inc. (collectively, "Complete"), are expected to be deductible for tax purposes.
The purchase price paid for these acquisitions and the allocation of the purchase price is as follows:
|
|
Fiscal Year Ended
December 31, |
||||||||||
|
|
2018
|
2017
|
2016
|
||||||||
|
Purchase Price:
|
|||||||||||
|
Cash used in acquisitions, net of cash acquired
|
$
|
86,686
|
|
$
|
4,823
|
|
$
|
2,439
|
|
||
|
Notes payable
|
—
|
|
2,400
|
|
—
|
|
|||||
|
Class A common stock issued
|
4,258
|
|
—
|
|
—
|
|
|||||
|
Other non-cash considerations
|
—
|
|
101
|
|
—
|
|
|||||
|
Contingent consideration and holdbacks
|
8,521
|
|
736
|
|
400
|
|
|||||
|
Total
|
99,465
|
|
8,060
|
|
2,839
|
|
|||||
|
Current assets
|
3,276
|
|
93
|
|
40
|
|
|||||
|
Land
|
—
|
|
—
|
|
353
|
|
|||||
|
Buildings
|
7,889
|
|
—
|
|
1,360
|
|
|||||
|
Equipment
|
23,882
|
|
2,994
|
|
269
|
|
|||||
|
Other liabilities, net
|
(4,708
|
)
|
(49
|
)
|
(106
|
)
|
|||||
|
Deferred tax liability
|
(937
|
)
|
—
|
|
—
|
|
|||||
|
Intangible assets
|
29,934
|
|
2,334
|
|
—
|
|
|||||
|
Fair value of assets acquired and liabilities assumed
|
59,336
|
|
5,372
|
|
1,916
|
|
|||||
|
Excess purchase price to be allocated to goodwill
|
$
|
40,129
|
|
$
|
2,688
|
|
$
|
923
|
|
||
The following unaudited pro forma combined information shows our operational results as though each of the acquisitions completed had occurred as of January 1, 2016.
|
|
Fiscal Year Ended
December 31, |
||||||||||
|
|
2018
|
2017
|
2016
|
||||||||
|
Revenues
|
$
|
699,659
|
|
$
|
672,898
|
|
$
|
642,773
|
|
||
|
Operating income (loss)
|
$
|
43,561
|
|
$
|
(6,601
|
)
|
$
|
50,970
|
|
||
|
Net income (loss) attributable to common stockholders
|
$
|
8,579
|
|
$
|
(18,408
|
)
|
$
|
(3,446
|
)
|
||
|
Basic earnings per common share attributable to common stockholders
|
$
|
0.20
|
|
$
|
(0.44
|
)
|
$
|
(0.08
|
)
|
||
|
Basic weighted average shares outstanding
|
42,688
|
|
41,846
|
|
41,233
|
|
|||||
|
Diluted earnings per common share attributable to common stockholders
|
$
|
0.19
|
|
$
|
(0.44
|
)
|
$
|
(0.08
|
)
|
||
|
Diluted weighted average shares outstanding
|
44,168
|
|
41,846
|
|
41,233
|
|
|||||
The pro forma results have been prepared for comparative purposes only and are not necessarily indicative of the actual results of operations had the acquisitions taken place as of January 1, 2016 or the results of our future operations. Furthermore, the pro forma results do not give effect to all cost savings or incremental costs that may occur as a result of the integration and consolidation of the completed acquisitions.
6. RESTRICTED ASSETS
87
Restricted assets consist of investment securities held in trust on deposit with various banks as collateral for our obligations relative to our landfill final capping, closure and post-closure costs.
A summary of restricted assets is as follows:
|
|
December 31,
|
||||||
|
Non Current:
|
2018
|
2017
|
|||||
|
Restricted investment securities - landfill closure
|
$
|
1,248
|
|
$
|
1,220
|
|
|
7. PROPERTY, PLANT AND EQUIPMENT
A summary of property, plant and equipment is as follows:
|
|
December 31,
|
||||||
|
|
2018
|
2017
|
|||||
|
Land
|
$
|
25,490
|
|
$
|
24,224
|
|
|
|
Landfills
|
544,663
|
|
513,548
|
|
|||
|
Landfill operating lease contracts
|
121,877
|
|
114,462
|
|
|||
|
Buildings and improvements
|
150,885
|
|
140,155
|
|
|||
|
Machinery and equipment
|
153,222
|
|
139,029
|
|
|||
|
Rolling stock
|
163,758
|
|
138,102
|
|
|||
|
Containers
|
123,383
|
|
103,501
|
|
|||
|
1,283,278
|
|
1,173,021
|
|
||||
|
Less: accumulated depreciation and amortization
|
(878,701
|
)
|
(811,474
|
)
|
|||
|
$
|
404,577
|
|
$
|
361,547
|
|
||
Depreciation expense for fiscal years
2018
,
2017
and
2016
was
$35,351
,
$32,131
and
$33,186
, respectively. Landfill amortization expense for fiscal years
2018
,
2017
and
2016
was
$31,841
,
$27,910
and
$26,529
, respectively. Depletion expense on landfill operating lease contracts for fiscal years
2018
,
2017
and
2016
was
$9,724
,
$9,646
and
$9,295
, respectively, and was recorded in cost of operations.
8. GOODWILL AND INTANGIBLE ASSETS
A summary of the activity and balances related to goodwill by reporting segment is as follows:
|
|
December 31, 2017
|
Acquisitions
|
December 31, 2018
|
||||||||
|
Eastern
|
$
|
19,192
|
|
$
|
8,962
|
|
$
|
28,154
|
|
||
|
Western
|
89,369
|
|
31,167
|
|
120,536
|
|
|||||
|
Recycling
|
12,315
|
|
—
|
|
12,315
|
|
|||||
|
Other
|
1,729
|
|
—
|
|
1,729
|
|
|||||
|
Total
|
$
|
122,605
|
|
$
|
40,129
|
|
$
|
162,734
|
|
||
|
|
December 31, 2016
|
Acquisitions
|
December 31, 2017
|
||||||||
|
Eastern
|
$
|
17,429
|
|
$
|
1,763
|
|
$
|
19,192
|
|
||
|
Western
|
88,426
|
|
943
|
|
89,369
|
|
|||||
|
Recycling
|
12,315
|
|
—
|
|
12,315
|
|
|||||
|
Other
|
1,729
|
|
—
|
|
1,729
|
|
|||||
|
Total
|
$
|
119,899
|
|
$
|
2,706
|
|
$
|
122,605
|
|
||
A summary of intangible assets is as follows:
|
|
Covenants
Not-to-Compete
|
Client Lists
|
Total
|
||||||||
|
Balance, December 31, 2018
|
|||||||||||
|
Intangible assets
|
$
|
21,750
|
|
$
|
44,363
|
|
$
|
66,113
|
|
||
|
Less accumulated amortization
|
(17,584
|
)
|
(13,762
|
)
|
(31,346
|
)
|
|||||
|
$
|
4,166
|
|
$
|
30,601
|
|
$
|
34,767
|
|
|||
88
|
|
Covenants
Not-to-Compete
|
Client Lists
|
Total
|
||||||||
|
Balance, December 31, 2017
|
|||||||||||
|
Intangible assets
|
$
|
18,092
|
|
$
|
18,087
|
|
$
|
36,179
|
|
||
|
Less accumulated amortization
|
(16,851
|
)
|
(11,179
|
)
|
(28,030
|
)
|
|||||
|
$
|
1,241
|
|
$
|
6,908
|
|
$
|
8,149
|
|
|||
Intangible amortization expense for fiscal years
2018
,
2017
and
2016
was
$3,316
,
$2,061
and
$2,141
, respectively.
The intangible amortization expense estimated for the five fiscal years following fiscal year
2018
and thereafter is as follows:
|
Estimated Future Amortization Expense as of December 31, 2018
|
|||
|
For the fiscal year ending December 31, 2019
|
$
|
5,601
|
|
|
For the fiscal year ending December 31, 2020
|
$
|
4,997
|
|
|
For the fiscal year ending December 31, 2021
|
$
|
4,094
|
|
|
For the fiscal year ending December 31, 2022
|
$
|
3,534
|
|
|
For the fiscal year ending December 31, 2023
|
$
|
3,231
|
|
|
Thereafter
|
$
|
13,310
|
|
9. FINAL CAPPING, CLOSURE AND POST-CLOSURE COSTS
Accrued final capping, closure and post-closure costs include the current and non-current portion of costs associated with obligations for final capping closure and post-closure of our landfills. We estimate our future final capping, closure and post-closure costs in order to determine the final capping, closure and post-closure expense per ton of waste placed into each landfill as further described in Note 3,
Summary of Significant Accounting Policies
. The anticipated time frame for paying these costs varies based on the remaining useful life of each landfill, as well as the duration of the post-closure monitoring period.
The changes to accrued final capping, closure and post-closure liabilities are as follows:
|
Fiscal Year Ended December 31,
|
|||||||
|
2018
|
2017
|
||||||
|
Beginning balance
|
$
|
62,290
|
|
$
|
44,207
|
|
|
|
Obligations incurred
|
3,713
|
|
3,022
|
|
|||
|
Revisions in estimates (1)
|
5,095
|
|
11,498
|
|
|||
|
Accretion expense
|
5,556
|
|
4,401
|
|
|||
|
Obligations settled (2)
|
(3,579
|
)
|
(838
|
)
|
|||
|
Ending balance
|
$
|
73,075
|
|
$
|
62,290
|
|
|
|
(1)
|
Relates to changes in estimates and assumptions concerning anticipated waste flow, cost and timing of future final capping, closure and post-closure activities at certain landfills, including the Subtitle D landfill in Southbridge, Massachusetts ("Southbridge Landfill"), as well as changes to expansion airspace. See Note 11,
Commitments and Contingencies
and Note 16,
Other Items and Charges
for disclosure regarding Southbridge Landfill.
|
|
(2)
|
Includes amounts paid and amounts that are being processed through accounts payable as a part of our disbursement cycle.
|
89
10. LONG TERM DEBT AND CAPITAL LEASES
A summary of long-term debt and capital leases is as follows:
|
|
December 31,
|
||||||
|
|
2018
|
2017
|
|||||
|
Senior Secured Credit Facility:
|
|||||||
|
Revolving Credit Facility due May 2023; bearing interest at LIBOR plus 2.00%
|
$
|
69,600
|
|
$
|
—
|
|
|
|
Refinanced Revolving Credit Facility due October 2021; bore interest at LIBOR plus 2.75%
|
—
|
|
36,000
|
|
|||
|
Term Loan Facility due May 2023; bearing interest at LIBOR plus 2.00%
|
350,000
|
|
—
|
|
|||
|
Term Loan B Facility due October 2023; bore interest at LIBOR plus 2.50%
|
—
|
|
346,500
|
|
|||
|
Tax-Exempt Bonds:
|
|||||||
|
New York State Environmental Facilities Corporation Solid Waste Disposal Revenue Bonds Series 2014R-1 due December 2044 - fixed rate interest period through 2019; bearing interest at 3.75%
|
25,000
|
|
25,000
|
|
|||
|
New York State Environmental Facilities Corporation Solid Waste Disposal Revenue Bonds Series 2014R-2 due December 2044 - fixed rate interest period through 2026; bearing interest at 3.125%
|
15,000
|
|
15,000
|
|
|||
|
Finance Authority of Maine Solid Waste Disposal Revenue Bonds Series 2005R-3 due January 2025 - fixed rate interest period through 2025; bearing interest at 5.25%
|
25,000
|
|
25,000
|
|
|||
|
Finance Authority of Maine Solid Waste Disposal Revenue Bonds Series 2015R-1 due August 2035 - fixed rate interest period through 2025; bearing interest at 5.125%
|
15,000
|
|
15,000
|
|
|||
|
Finance Authority of Maine Solid Waste Disposal Revenue Bonds Series 2015R-2 due August 2035 - fixed rate interest period through 2025; bearing interest at 4.375%
|
15,000
|
|
—
|
|
|||
|
Vermont Economic Development Authority Solid Waste Disposal Long-Term Revenue Bonds Series 2013 due April 2036 - fixed rate interest period through 2028; bearing interest at 4.625%
|
16,000
|
|
16,000
|
|
|||
|
Business Finance Authority of the State of New Hampshire Solid Waste Disposal Revenue Bonds Series 2013 due April 2029 - fixed rate interest period through 2019; bearing interest at 4.00%
|
11,000
|
|
11,000
|
|
|||
|
Other:
|
|||||||
|
Capital leases maturing through December 2107; bearing interest at a weighted average of 5.37%
|
11,248
|
|
5,595
|
|
|||
|
Notes payable maturing through June 2027; bearing interest at a weighted average of 2.97%
|
2,401
|
|
2,585
|
|
|||
|
Principal amount of long-term debt and capital leases
|
555,249
|
|
497,680
|
|
|||
|
Less—unamortized discount and debt issuance costs (1)
|
10,950
|
|
15,178
|
|
|||
|
Long-term debt and capital leases less unamortized discount and debt issuance costs
|
544,299
|
|
482,502
|
|
|||
|
Less—current maturities of long-term debt
|
2,298
|
|
4,926
|
|
|||
|
$
|
542,001
|
|
$
|
477,576
|
|
||
|
(1)
|
A summary of unamortized discount and debt issuance costs by debt instrument follows:
|
|
December 31,
|
|||||||
|
2018
|
2017
|
||||||
|
Credit Facility
|
$
|
7,118
|
|
$
|
—
|
|
|
|
Refinanced Revolving Credit Facility
|
—
|
|
3,938
|
|
|||
|
Term Loan B Facility (including unamortized discount of $0 and $1,482)
|
—
|
|
7,392
|
|
|||
|
New York State Environmental Facilities Corporation Solid Waste Disposal Revenue Bonds Series 2014R-1
|
847
|
|
1,034
|
|
|||
|
New York State Environmental Facilities Corporation Solid Waste Disposal Revenue Bonds Series 2014R-2
|
450
|
|
511
|
|
|||
|
Finance Authority of Maine Solid Waste Disposal Revenue Bonds Series 2005R-3
|
517
|
|
603
|
|
|||
|
Finance Authority of Maine Solid Waste Disposal Revenue Bonds Series 2015R-1
|
622
|
|
691
|
|
|||
|
Finance Authority of Maine Solid Waste Disposal Revenue Bonds Series 2015R-2
|
493
|
|
—
|
|
|||
|
Vermont Economic Development Authority Solid Waste Disposal Long-Term Revenue Bonds Series 2013
|
595
|
|
573
|
|
|||
|
Business Finance Authority of the State of NH Solid Waste Disposal Revenue Bonds Series 2013
|
308
|
|
436
|
|
|||
|
$
|
10,950
|
|
$
|
15,178
|
|
||
90
Credit Facility
In fiscal year 2018, we entered into a credit agreement ("Credit Agreement"), which provides for a
$350,000
aggregate principal amount term loan A facility ("Term Loan Facility") and a
$200,000
revolving line of credit facility ("Revolving Credit Facility" and, together with the Term Loan Facility, the "Credit Facility"). The net proceeds from this transaction were used to repay in full the amounts outstanding of the
$350,000
aggregate principal amount term loan B facility ("Term Loan B Facility") and the
$160,000
revolving line of credit facility ("Refinanced Revolving Credit Facility") plus accrued and unpaid interest thereon and to pay related transaction expenses. We have the right to request, at our discretion, an increase in the amount of loans under the Credit Facility by an aggregate amount
$125,000
, subject to the terms and conditions set forth in the Credit Agreement.
The Credit Facility has a
5
-year term and will bears interest at a rate of LIBOR plus
2.00%
per annum, which will be reduced to a rate of LIBOR plus
1.25%
upon us reaching a consolidated net leverage ratio of less than
2.25
x. The Credit Facility is guaranteed jointly and severally, fully and unconditionally by all of our significant wholly-owned subsidiaries and secured by substantially all of our assets. As of
December 31, 2018
, further advances were available under the Credit Facility in the amount of
$107,879
. The available amount is net of outstanding irrevocable letters of credit totaling
$22,521
, at which date no amount had been drawn.
The Credit Agreement requires us to maintain a minimum interest coverage ratio and a maximum consolidated net leverage ratio, to be measured at the end of each fiscal quarter. As of
December 31, 2018
, we were in compliance with the covenants contained in the Credit Agreement. In addition to these financial covenants, the Credit Agreement also contains a number of important customary affirmative and negative covenants which restrict, among other things, our ability to sell assets, incur additional debt, create liens, make investments, and pay dividends. We do not believe that these restrictions impact our ability to meet future liquidity needs. An event of default under any of our debt agreements could permit some of our lenders, including the lenders under the Credit Facility, to declare all amounts borrowed from them to be immediately due and payable, together with accrued and unpaid interest, or, in the case of the Credit Facility, terminate the commitment to make further credit extensions thereunder, which could, in turn, trigger cross-defaults under other debt obligations. If we were unable to repay debt to our lenders, or were otherwise in default under any provision governing our outstanding debt obligations, our secured lenders could proceed against us and against the collateral securing that debt.
Tax-Exempt Financings
New York Bonds.
As of
December 31, 2018
, we had outstanding
$25,000
aggregate principal amount of Solid Waste Disposal Revenue Bonds Series 2014 ("New York Bonds 2014R-1") and
$15,000
aggregate principal amount of Solid Waste Disposal Revenue Bonds Series 2014R-2 ("New York Bonds 2014R-2") issued by the New York State Environmental Facilities Corporation under the indenture dated December 1, 2014 (collectively, the “New York Bonds”). The New York Bonds 2014R-1 accrue interest at
3.75%
per annum through December 1, 2019, at which time they may be converted from a fixed rate to a variable rate. The New York Bonds 2014R-2 accrue interest at
3.125%
per annum through May 31, 2026, at which time they may be converted from a fixed rate to a variable rate. The New York Bonds, which are unsecured and guaranteed jointly and severally, fully and unconditionally by all of our significant wholly-owned subsidiaries, require interest payments on June 1 and December 1 of each year and mature on
December 1, 2044
. We borrowed the proceeds of the New York Bonds to finance or refinance certain capital projects in the state of New York and to pay certain costs of issuance of the New York Bonds.
Maine Bonds.
In fiscal year 2018, we completed the issuance of
$15,000
aggregate principal amount of Finance Authority of Maine Solid Waste Disposal Revenue Bonds Series 2015R-2 (“FAME Bonds 2015R-2”). As of
December 31, 2018
, we had outstanding
$25,000
aggregate principal amount of Finance Authority of Maine Solid Waste Disposal Revenue Bonds Series 2005R-3 (“FAME Bonds 2005R-3”),
$15,000
aggregate principal amount of Finance Authority of Maine Solid Waste Disposal Revenue Bonds Series 2015 (“FAME Bonds 2015R-1”), and
$15,000
aggregate principal amount of FAME Bonds 2015R-2 (collectively, the "FAME Bonds"). The FAME Bonds 2005R-3 accrue interest at
5.25%
per annum, and interest is payable semiannually in arrears on February 1 and August 1 of each year until such bonds mature on
January 1, 2025
. The FAME Bonds 2015R-1 accrue interest at
5.125%
per annum through August 1, 2025, at which time they may be converted from a fixed to a variable rate, and interest is payable semiannually in arrears on February 1 and August 1 of each year until the FAME Bonds 2015R-1 mature on
August 1, 2035
. The FAME Bonds 2015R-2 accrue interest at
4.375%
per annum through July 31, 2025, at which time they may be converted from a fixed to a variable rate, and interest is payable semiannually each year on May 1 and November 1 until the FAME Bonds 2015R-2 mature on
August 1, 2035
. The FAME Bonds are unsecured and guaranteed jointly and severally, fully and unconditionally by all of our significant wholly-owned subsidiaries. We borrowed the proceeds of the offering of the FAME Bonds to finance or refinance the costs of certain of our solid waste landfill facilities and solid waste collection, organics and transfer, recycling and hauling facilities, and to pay certain costs of the issuance of the FAME Bonds.
91
Vermont Bonds.
In fiscal year 2018, we completed the remarketing of
$16,000
aggregate principal amount of
4.75%
fixed rate senior unsecured Vermont Economic Development Authority Solid Waste Disposal Long-Term Revenue Bonds Series 2013 (“Vermont Bonds”). As of
December 31, 2018
, we had outstanding
$16,000
aggregate principal amount of Vermont Bonds. The Vermont Bonds, which are guaranteed jointly and severally, fully and unconditionally by all of our significant wholly-owned subsidiaries, accrue interest at
4.625%
per annum through April 2, 2028, after which time there is a mandatory tender. The Vermont Bonds mature on
April 1, 2036
. We borrowed the proceeds of the Vermont Bonds to finance or refinance certain qualifying property, plant and equipment assets purchased in the state of Vermont.
New Hampshire Bonds.
As of
December 31, 2018
, we had outstanding
$11,000
aggregate principal amount of senior unsecured Solid Waste Disposal Revenue Bonds Series 2013 issued by the Business Finance Authority of the State of New Hampshire (“New Hampshire Bonds”). The New Hampshire Bonds, which are guaranteed jointly and severally, fully and unconditionally by all of our significant wholly-owned subsidiaries, accrue interest at
4.00%
per annum through October 1, 2019, at which time they may be converted from a fixed rate to a variable rate. During the fixed interest rate period, the New Hampshire Bonds are not be supported by a letter of credit. Interest is payable in arrears on April 1 and October 1 of each year. The New Hampshire Bonds mature on
April 1, 2029
. We borrowed the proceeds of the New Hampshire Bonds to finance or refinance certain qualifying property, plant and equipment assets purchased in the state of New Hampshire.
Loss on Debt Extinguishment
In order to lower our borrowing costs and reduce our market risk we completed the following transactions that resulted in a loss on debt extinguishment in fiscal years
2018
,
2017
and
2016
of
$7,352
,
$517
and
$13,747
, respectively:
|
•
|
the write-off of debt issuance costs and unamortized discount, in the case of our Term Loan B Facility in fiscal year 2018, associated with the refinancing of our previously outstanding senior secured credit facilities in fiscal year 2018 and fiscal year 2016 and an amendment to our previously outstanding senior secured credit facility in fiscal year 2017:
|
|
•
|
the write-off of debt issuance costs in connection with the remarketing of our Vermont Bonds in fiscal year 2018 and the remarketing of our Finance Authority of Maine Solid Waste Disposal Revenue Bonds Series 2005R-1 (“FAME Bonds 2005R-1”) and Finance Authority of Maine Solid Waste Disposal Revenue Bonds Series 2005R-2 (“FAME Bonds 2005R-2”) into the FAME Bonds 2005R-3 in fiscal year 2017; and
|
|
•
|
the repurchase price premium and write-off of debt issuance costs and unamortized original issue discount associated with the early redemption, repurchase and retirement of our then outstanding
7.75%
senior subordinated notes due February 2019 in fiscal years 2016.
|
Interest Expense
The components of interest expense are as follows:
|
|
Fiscal Year Ended
December 31, |
||||||||||
|
|
2018
|
2017
|
2016
|
||||||||
|
Interest expense on long-term debt and capital leases
|
$
|
23,816
|
|
$
|
22,060
|
|
$
|
34,741
|
|
||
|
Amortization of debt issuance costs and discount on long-term debt
|
2,449
|
|
2,692
|
|
3,881
|
|
|||||
|
Letter of credit fees
|
169
|
|
703
|
|
593
|
|
|||||
|
Less: capitalized interest
|
(140
|
)
|
(295
|
)
|
(273
|
)
|
|||||
|
Total interest expense
|
$
|
26,294
|
|
$
|
25,160
|
|
$
|
38,942
|
|
||
Cash Flow Hedges
The refinancing of our Credit Facility in fiscal year 2018 resulted in us dedesignating the original hedging relationship between
three
interest rate derivative agreements and the variable rate interest payments related to the Term Loan B Facility. We subsequently designated new hedging relationships between the
three
interest rate derivative agreements and the variable rate interest payments related to the Term Loan Facility based on a quantitative assessment using regression analysis, which indicated that the hedging relationships were highly effective. Because the interest rate payments associated with the variable rate portion of our long-term debt will still occur, the net gain of
$1,383
associated with the interest rate derivative agreements in accumulated other comprehensive income was not reclassified into earnings. Instead, this gain will continue to be reclassified from accumulated other comprehensive income into interest expense as the interest payments affect earnings.
92
In fiscal year 2018, we also entered into
six
additional interest rate derivative agreements to further hedge interest rate risk associated with the variable rate portion of our long-term debt. The hedging relationships between these interest rate derivative agreements and the variable rate interest payments related to the Term Loan Facility were considered highly effective based on a quantitative assessment using regression analysis and, therefore, are accounted for as highly effective cash flow hedges.
The total notional amount of all of our interest rate derivative agreements is
$190,000
and according to the terms of the agreements, we receive interest based on the 1-month LIBOR index and pay interest at a weighted average rate of approximately
2.54%
. The agreements mature between February 2021 and May 2023. We have designated these derivative instruments as effective cash flow hedges.
A summary of the effect of cash flow hedges related to derivative instruments on the consolidated balance sheet follows:
|
Fair Value
|
|||||||||
|
Balance Sheet Location
|
December 31,
2018 |
December 31,
2017 |
|||||||
|
Interest rate swaps
|
Other current assets
|
$
|
338
|
|
$
|
—
|
|
||
|
Interest rate swaps
|
Other non-current assets
|
482
|
|
401
|
|
||||
|
Total
|
$
|
820
|
|
$
|
401
|
|
|||
|
Interest rate swaps
|
Other accrued liabilities
|
$
|
387
|
|
$
|
123
|
|
||
|
Interest rate swaps
|
Other long-term liabilities
|
1,555
|
|
—
|
|
||||
|
Total
|
$
|
1,942
|
|
$
|
123
|
|
|||
|
Interest rate swaps
|
Accumulated other comprehensive (loss) income, net
|
$
|
(1,196
|
)
|
$
|
278
|
|
||
|
Interest rate swaps - tax provision
|
Accumulated other comprehensive (loss) income, net
|
$
|
(112
|
)
|
$
|
(112
|
)
|
||
|
$
|
(1,308
|
)
|
$
|
166
|
|
||||
A summary of the amount of gain or (loss) on cash flow hedging relationships related to interest rate swaps reclassified from accumulated other comprehensive (loss) income into earnings follows:
|
|
Fiscal Year Ended
December 31, |
|||||||||||
|
2018
|
2017
|
2016
|
||||||||||
|
Statement of Operations Location
|
(Expense) Income
|
|||||||||||
|
Interest expense
|
$
|
(363
|
)
|
$
|
(421
|
)
|
$
|
—
|
|
|||
Fair Value of Debt
As of
December 31, 2018
, the fair value of our fixed rate debt, including the FAME Bonds, Vermont Bonds, New York Bonds and New Hampshire Bonds was approximately
$121,722
and the carrying value was
$122,000
. The fair value of the FAME Bonds, Vermont Bonds, New York Bonds and New Hampshire Bonds is considered to be Level 2 within the fair value hierarchy as the fair value is determined using market approach pricing provided by a third-party that utilizes pricing models and pricing systems, mathematical tools and judgment to determine the evaluated price for the security based on the market information of each of the bonds or securities with similar characteristics.
As of
December 31, 2018
, the carrying value of our Term Loan Facility was
$350,000
and the carrying value of our Revolving Credit Facility was
$69,600
. Their fair values are based on current borrowing rates for similar types of borrowing arrangements, or Level 2 inputs, and approximate their carrying values.
Although we have determined the estimated fair value amounts of the FAME Bonds, Vermont Bonds, New York Bonds and New Hampshire Bonds using available market information and commonly accepted valuation methodologies, a change in available market information, and/or the use of different assumptions and/or estimation methodologies could have a material effect on the estimated fair values. These amounts have not been revalued, and current estimates of fair value could differ significantly from the amounts presented.
93
Future Maturities of Debt
Aggregate principal maturities of long-term debt and capital leases are as follows:
|
Estimated Future Payments as of December 31, 2018
|
|||
|
2019
|
$
|
2,298
|
|
|
2020
|
2,648
|
|
|
|
2021
|
2,175
|
|
|
|
2022
|
1,652
|
|
|
|
2023
|
421,021
|
|
|
|
Thereafter
|
125,455
|
|
|
|
$
|
555,249
|
|
|
11. COMMITMENTS AND CONTINGENCIES
Lease Commitments
We lease operating facilities and equipment in the ordinary course of our business under various operating leases with monthly payments varying up to approximately
$23
. Future minimum rental payments are recognized on a straight-line basis over the minimum lease term. Total rent expense under operating leases charged to operations was
$10,571
,
$12,242
and
$11,437
in fiscal years
2018
,
2017
and
2016
, respectively.
Future minimum rental payments under non-cancellable operating leases, which include landfill operating leases, are as follows:
|
Estimated Future Minimum Lease Payments as of December 31, 2018
|
|||
|
2019
|
$
|
15,572
|
|
|
2020
|
12,678
|
|
|
|
2021
|
10,117
|
|
|
|
2022
|
7,953
|
|
|
|
2023
|
6,250
|
|
|
|
Thereafter
|
65,145
|
|
|
|
Total minimum lease payments
|
$
|
117,715
|
|
Legal Proceedings
In the ordinary course of our business and as a result of the extensive governmental regulation of the solid waste industry, we are subject to various judicial and administrative proceedings involving state and local agencies. In these proceedings, an agency may seek to impose fines or to revoke or deny renewal of an operating permit held by us. From time to time, we may also be subject to actions brought by special interest or other groups, adjacent landowners or residents in connection with the permitting and licensing of landfills and transfer stations, or allegations of environmental damage or violations of the permits and licenses pursuant to which we operate. In addition, we may be named defendants in various claims and suits pending for alleged damages to persons and property, alleged violations of certain laws and alleged liabilities arising out of matters occurring during the ordinary operation of a waste management business.
In accordance with FASB ASC 450 - Contingencies, we accrue for legal proceedings, inclusive of legal costs, when losses become probable and reasonably estimable. As of the end of each applicable reporting period, we review each of our legal proceedings to determine whether it is probable, reasonably possible or remote that a liability has been incurred and, if it is at least reasonably possible, whether a range of loss can be reasonably estimated under the provisions of FASB ASC 450-20. In instances where we determine that a loss is probable and we can reasonably estimate a range of loss we may incur with respect to such a matter, we record an accrual for the amount within the range that constitutes our best estimate of the possible loss. If we are able to reasonably estimate a range, but no amount within the range appears to be a better estimate than any other, we record an accrual in the amount that is the low end of such range. When a loss is reasonably possible, but not probable, we will not record an accrual, but we will disclose our estimate of the possible range of loss where such estimate can be made in accordance with FASB ASC 450-20.
94
Environmental Remediation Liability
We are subject to liability for environmental damage, including personal injury and property damage, that our solid waste, recycling and power generation facilities may cause to neighboring property owners, particularly as a result of the contamination of drinking water sources or soil, possibly including damage resulting from conditions that existed before we acquired the facilities. We may also be subject to liability for similar claims arising from off-site environmental contamination caused by pollutants or hazardous substances if we or our predecessors arrange or arranged to transport, treat or dispose of those materials. The following matters represent our material outstanding claims.
Southbridge Recycling & Disposal Park, Inc.
In October 2015, our Southbridge Recycling and Disposal Park, Inc. (“SRD”) subsidiary reported to the Massachusetts Department of Environmental Protection (“MADEP”) results of analysis of samples collected pursuant to our existing permit from private drinking water wells located near the Town of Southbridge, Massachusetts (“Town”) Landfill (“Southbridge Landfill”), which is operated by SRD. Those results indicated the presence of contaminants above the levels triggering notice and response obligations under MADEP regulations. In response to those results, we are carrying out an Immediate Response Action pursuant to Massachusetts General Law Chapter 21E (the "Charlton 21E Obligations") pursuant to state law. Further, we have implemented a plan to analyze and better understand the groundwater near the Southbridge Landfill and we are investigating with the objective of identifying the source or sources of the elevated levels of contamination measured in the well samples. If it is determined that some or all of the contamination originated at the Southbridge Landfill, we will work with the Town (the Southbridge Landfill owner and the former operator of an unlined portion of the Southbridge Landfill, which was used prior to our operation of a double-lined portion of the Southbridge Landfill commencing in 2004) to evaluate and allocate the liabilities related to the Charlton 21E Obligations. In July 2016, we sent correspondence to the Town pursuant to Chapter 21E of Massachusetts General Laws demanding that the Town reimburse us for the environmental response costs we had spent and that the Town be responsible for all such costs in the future, as well as any other costs or liabilities resulting from the release of contaminants from the unlined portion of the Southbridge Landfill. The Town responded in September 2016, denying that the Southbridge Landfill is the source of such contamination, and claiming that if it is, that we may owe an indemnity to the Town pursuant to the Operating Agreement between us and the Town dated May 29, 2007, as amended. We entered into a Tolling Agreement with the Town to delay any further administrative or legal actions until our work with MADEP more specifically defines the parties’ responsibilities for the Charlton 21E Obligations, if any. Please see below for further discussion of our relationship with the Town regarding the Charlton 21E Obligations.
In February 2016, we and the Town received a Notice of Intent to Sue under the Resource Conservation and Recovery Act ("RCRA") from a law firm purporting to represent residents proximate to the Southbridge Landfill (“Residents”), indicating its intent to file suit against us on behalf of the Residents alleging the groundwater contamination originated from the Southbridge Landfill. In February 2017, we received an additional Notice of Intent to Sue from the National Environmental Law Center under the Federal Clean Water Act ("CWA") and RCRA (collectively the “Acts”) on behalf of Environment America, Inc., d/b/a Environment Massachusetts, and Toxics Action Center, Inc., which have referred to themselves as the Citizen Groups. The Citizen Groups alleged that we had violated the Acts, and that they intended to seek appropriate relief in federal court for those alleged violations. On or about June 9, 2017, a lawsuit was filed against us, SRD and the Town in the United States District Court for the District of Massachusetts (the “Massachusetts Court”) by the Citizen Groups and the Residents alleging violations of the Acts (the “Litigation”), and demanding a variety of remedies under the Acts, including fines, remediation, mitigation and costs of litigation, and remedies for violations of Massachusetts civil law related to personal and property damages, including remediation, diminution of property values, compensation for lost use and enjoyment of properties, enjoinment of further operation of the Southbridge Landfill, and costs of litigation, plus interest on any damage award, on behalf of the Residents. We believe the Litigation to be factually inaccurate, and without legal merit, and we and SRD intend to vigorously defend the Litigation. Nevertheless, we believe it is reasonably possible that a loss will occur as a result of the Litigation although an estimate of loss cannot be reasonably provided at this time. We also continue to believe the Town should be responsible for costs or liabilities associated with the Litigation relative to alleged contamination originating from the unlined portion of the Southbridge Landfill, although there can be no assurance that we will not be required to incur some or all of such costs and liabilities.
In December 2017, we filed a Motion to Dismiss the Litigation, and on October 1, 2018, the Massachusetts Court granted our Motion to Dismiss, and accordingly, dismissed the Citizen Groups claims under the Acts. The Massachusetts Court has retained jurisdiction of the Residents claims. The Citizen Groups intend to appeal the Massachusetts Court’s decision to grant our Motion to Dismiss.
We entered into an Administrative Consent Order on April 26, 2017 (the “ACO”), with MADEP, the Town, and the Town of Charlton, committing us to equally share the costs with MADEP, of up to
$10,000
(
$5,000
each) for the Town to install a municipal waterline in the Town of Charlton ("Waterline"). Upon satisfactory completion of that Waterline, and other matters covered by the ACO, we and the Town will be released by MADEP from any future responsibilities for the Charlton 21E Obligations. We also entered into an agreement with the Town on April 28, 2017 entitled the “21E Settlement and Water
95
System Construction Funding Agreement” (the “Waterline Agreement”), wherein we and the Town released each other from claims arising from the Charlton 21E Obligations. Pursuant to the Waterline Agreement, the Town will issue a twenty (
20
) year bond for our portion of the Waterline costs (up to
$5,000
). We have agreed to reimburse the Town for periodic payments under such bond. The Town has recently advised us that it has solicited and received proposals for the construction of the Waterline as contemplated by the ACO, and that construction of the Waterline has commenced.
We have recorded an environmental remediation liability associated with the future installation of the Waterline in other accrued liabilities and other long-term liabilities. We inflate the estimated costs in current dollars to the expected time of payment and discount the total cost to present value using a risk-free interest rate of
2.6%
. Our expenditures could be significantly higher if costs exceed estimates. The changes to the environmental remediation liability associated with the Southbridge Landfill are as follows:
|
|
Fiscal Year Ended
December 31, |
||||||
|
|
2018
|
2017
|
|||||
|
Beginning balance
|
$
|
5,936
|
|
$
|
—
|
|
|
|
Accretion expense
|
152
|
|
82
|
|
|||
|
Obligations incurred
|
—
|
|
6,379
|
|
|||
|
Obligations settled (1)
|
(915
|
)
|
(525
|
)
|
|||
|
Ending balance
|
$
|
5,173
|
|
$
|
5,936
|
|
|
|
(1)
|
Includes amounts that are being processed through accounts payable as a part of our disbursements cycle.
|
In November 2016, SRD received a cease and desist order (“Order”) from the Charlton alternate zoning enforcement officer, alleging that
two
storm water detention basins on SRD’s property in Charlton existed in violation of Charlton zoning requirements. SRD appealed the Order to the Charlton Zoning Board of Appeals, which upheld the Order. In June 2018, the Massachusetts Land Court approved a settlement reached between SRD and Charlton resolving all issues associated with the Order. Based on this settlement with Charlton, we paid a total of
$850
in cash, and will provide ancillary services to Charlton over the next five (
5
) years for a total of cash and services of approximately
$1,200
. This matter is now resolved. We have a remaining reserve of
$226
as of
December 31, 2018
. This settlement is recorded as part of the Southbridge Landfill closure charge, net in the fiscal year ended
December 31, 2018
. See Note 16,
Other Items and Charges
for additional disclosure.
In August 2016, we filed a complaint against Steadfast Insurance Company (“Steadfast”) in the Superior Court of Suffolk County, Massachusetts (the "Court"), alleging among other things, that Steadfast breached its Pollution Liability Policy (“Policy”) purchased by us in April 2015, by refusing to acknowledge coverage under the Policy, and refusing to cover any of the costs and liabilities incurred by us as described above as well as costs and liabilities that we may incur in the future. Steadfast filed an answer and counterclaim in September 2016, denying that it has any obligations to us under the Policy, and seeking a declaratory judgment of Steadfast’s obligations under the Policy. Steadfast filed a Motion to Dismiss (the "Motion") our litigation against it, and we filed our response on July 11, 2017. On September 7, 2017, the Court denied the Motion. On July 17, 2018, we reached an agreement with Steadfast settling this litigation (the “Settlement”). Pursuant to the Settlement, Steadfast agreed to partially reimburse us for direct costs incurred or to be incurred by us under the ACO, as well as for substantial investigative costs associated with our efforts to ascertain the source of contaminants and other costs related to the Charlton 21E Obligations. Additionally, the Settlement payment is intended to reimburse us for all costs and liabilities arising out of the Litigation. Steadfast agreed to pay us
$10,000
, and we received the Settlement funds in the quarter ended September 30, 2018. The recovery of funds is recorded as part of the Southbridge Landfill closure charge, net in the nine months ended
December 31, 2018
. See Note 16,
Other Items and Charges
for additional disclosure.
On June 13, 2017, Town voters rejected a non-binding ballot initiative intended to provide guidance to Town officials with respect to our pursuit of other landfill development opportunities at the Southbridge Landfill. Following such rejection by the Town voters, our board of directors and senior management determined after due consideration of all facts and circumstances that it is no longer likely that further development at the existing landfill site will generate an adequate risk adjusted return at the Southbridge Landfill, and accordingly we intended to cease operations at the Southbridge Landfill when no further capacity was available. We reached this conclusion after carefully evaluating the estimated future costs associated with the permitting, engineering and construction activities for the planned expansion of the Southbridge Landfill against the possible outcomes of the permitting process and the anticipated future benefits of successful expansions. Under our May 29, 2017 Extension Agreement with the Town ("Extension Agreement"), which we accounted for as an operating lease, there are potential contractual obligations and commitments, including future cash payments and services that extend beyond the current useful life of the Southbridge Landfill, at that time expected by no later than early 2019. We delivered correspondence to the Town to this effect on August 3, 2017, citing events of Change in Law and Force Majeure pursuant to the Extension Agreement and the impacts of such events on further expansion of the Southbridge Landfill. We advised the Town that we saw no economically
96
feasible way to operate the Southbridge Landfill beyond its current permitted life and we have filed a closure plan with MADEP. In this respect, the Town had, on or about April 11, 2018, filed a motion for a declaratory judgment and injunctive relief in the Massachusetts Court seeking a judgment from the Massachusetts Court as to the rights of the parties pursuant to the Extension Agreement, and injunctive relief to prevent us from discontinuing free collection and disposal of the Town’s municipal waste when the Southbridge Landfill ceases to accept waste (the “Town Equity Litigation”). We vigorously defended the Town Equity Litigation on its merits, and further, on the grounds that the Town Equity Litigation is not in compliance with the procedures for dispute resolution as set forth in the Extension Agreement. On June 26, 2018, the Massachusetts Court denied the Town’s request for a preliminary injunction without prejudice. Subsequently, the Town filed a successor litigation to the Town Equity Litigation (the “Current Litigation”), again seeking equitable and legal relief. We vigorously contested the Current Litigation and on November 8, 2018, the Town approved a Settlement Agreement with us which shortened the period of time we were purportedly obligated to provide the Town with free collection and disposal of the Town’s municipal waste from September, 2027 to March 31, 2024. The Town also agreed that we could close the solid waste and recycling transfer station in the Town at the end of 2018. The current litigation has been dismissed. The Southbridge Landfill was closed in November 2018 (the "Closure"). Following the Closure, we have proceeded to conduct proper closure and other activities at the Southbridge Landfill in accordance with the Extension Agreement with the Town, and Federal, state and local law. In accordance with FASB ASC 420 - Exit or Disposal Cost Obligations, a liability for costs to be incurred under a contract for its remaining term without economic benefit shall be recognized when we cease using the right conveyed by the contract. As a result of the Closure and in consideration of the Settlement Agreement with the Town, we recorded a charge amounting to
$8,724
as a component of the Southbridge Landfill closure charge, net associated with the remaining future contractual obligations. See Note 16,
Other Items and Charges
for disclosure over the Southbridge Landfill closure charge, net.
The costs and liabilities we may be required to incur in connection with the foregoing Southbridge Landfill matters could be material to our results of operations, our cash flows and our financial condition.
Potsdam Environmental Remediation Liability
On December 20, 2000, the State of New York Department of Environmental Conservation (“DEC”) issued an Order on Consent (“Order”) which named Waste-Stream, Inc. (“WSI”), our subsidiary, General Motors Corporation (“GM”) and Niagara Mohawk Power Corporation (“NiMo”) as Respondents. The Order required that the Respondents undertake certain work on a
25
-acre scrap yard and solid waste transfer station owned by WSI in Potsdam, New York, including the preparation of a Remedial Investigation and Feasibility Study (“Study”). A draft of the Study was submitted to the DEC in January 2009 (followed by a final report in May 2009). The Study estimated that the undiscounted costs associated with implementing the preferred remedies would be approximately
$10,219
. On February 28, 2011, the DEC issued a Proposed Remedial Action Plan for the site and accepted public comments on the proposed remedy through March 29, 2011. We submitted comments to the DEC on this matter. In April 2011, the DEC issued the final Record of Decision (“ROD”) for the site. The ROD was subsequently rescinded by the DEC for failure to respond to all submitted comments. The preliminary ROD, however, estimated that the present cost associated with implementing the preferred remedies would be approximately
$12,130
. The DEC issued the final ROD in June 2011 with proposed remedies consistent with its earlier ROD. An Order on Consent and Administrative Settlement naming WSI and NiMo as Respondents was executed by the Respondents and DEC with an effective date of October 25, 2013. On January 29, 2016, a Cost-Sharing Agreement was executed between WSI, NiMo, Alcoa Inc. (“Alcoa”) and Reynolds Metal Company (“Reynolds”) whereby Alcoa and Reynolds elected to voluntarily participate in the onsite remediation activities at a combined
15%
participant share. It is likely that significant expenditures relating to onsite remediation will be incurred in fiscal year ending December 31, 2019. WSI is jointly and severally liable with NiMo, Alcoa and Reynolds for the total cost to remediate.
We have recorded an environmental remediation liability associated with the Potsdam site based on incurred costs to date and estimated costs to complete the remediation in other accrued liabilities and other long-term liabilities. Our expenditures could be significantly higher if costs exceed estimates. We inflate the estimated costs in current dollars to the expected time of payment and discount the total cost to present value using a risk-free interest rate of
1.5%
.
A summary of the changes to the environmental remediation liability associated with the Potsdam environmental remediation liability follows:
|
Fiscal Year Ended
December 31, |
|||||||
|
2018
|
2017
|
||||||
|
Beginning balance
|
$
|
5,758
|
|
$
|
5,866
|
|
|
|
Payments
|
(171
|
)
|
(108
|
)
|
|||
|
Obligations incurred
|
27
|
|
—
|
|
|||
|
Ending balance
|
$
|
5,614
|
|
$
|
5,758
|
|
|
97
North Country Environmental Services
On or about March 8, 2018, the Citizen Groups described above, delivered correspondence to our subsidiary, North Country Environmental Services, Inc. ("NCES") and us, providing notice of the Citizen Groups' intent to sue NCES and us for violations of the CWA in conjunction with NCES's operation of its landfill in Bethlehem, New Hampshire. On May 14, 2018, the Citizen Groups filed a lawsuit against NCES and us in the United States District Court for the District of New Hampshire (the “New Hampshire Court”) alleging violations of the CWA, arguing that ground water discharging into the Ammonoosuc River is a "point source" under the CWA (the "New Hampshire Litigation"). The New Hampshire Litigation seeks remediation and fines under the CWA. On June 15, 2018, we and NCES filed a Motion to Dismiss the New Hampshire Litigation. On July 13, 2018, the Citizen Groups filed objections to our Motion to Dismiss. On July 27, 2018, we filed a reply in support of our Motion to Dismiss. On September 25, 2018, the New Hampshire Court denied our Motion to Dismiss. We intend to continue to vigorously defend against the New Hampshire Litigation, which we believe is without merit.
The total expected environmental remediation payments, in today’s dollars, for each of the five succeeding fiscal years and the aggregate amount thereafter are as follows:
|
Estimated Future Environmental Remediation Payments as of December 31, 2018
|
|||
|
2019
|
$
|
3,974
|
|
|
2020
|
1,289
|
|
|
|
2021
|
398
|
|
|
|
2022
|
372
|
|
|
|
2023
|
383
|
|
|
|
Thereafter
|
5,250
|
|
|
|
Total
|
$
|
11,666
|
|
A reconciliation of the expected aggregate non-inflated, undiscounted environmental remediation liability to the amount recognized in the statement of financial position is as follows:
|
Undiscounted liability
|
$
|
11,666
|
|
|
Less discount, net
|
(879
|
)
|
|
|
Liability balance - December 31, 2018
|
$
|
10,787
|
|
Any substantial liability incurred by us arising from environmental damage could have a material adverse effect on our business, financial condition and results of operations. We are not presently aware of any other situations that would have a material adverse impact on our business, financial condition, results of operations or cash flows.
Employment Contracts
We have entered into employment contracts with
five
of our executive officers. The contracts are dated June 18, 2001, March 31, 2006, July 6, 2010, September 1, 2012 and March 1, 2016. Each contract had an initial term between
one
and
three
years and a covenant not-to-compete ranging from
one
to
two
years from the date of termination. These contracts automatically extend for a
one
year period at the end of the initial term and any renewal period. Total annual commitments for salaries under these contracts are
$1,821
. In the event of a change in control of us, or in the event of involuntary termination without cause, the employment contracts provide for a payment ranging from
one
to
three
years of salary and bonuses. We also have other employment contracts or arrangements with employees who are not executive officers.
12. STOCKHOLDERS' EQUITY
Recent Developments
On January 25, 2019, we completed a public offering of
3,565
share of our Class A common stock at a public offering price of
$29.50
per share. The offering resulted in net proceeds to us of
$100,943
, after deducting underwriting discounts and commissions and offering expenses. We intend to use the net proceeds from the offering for general corporate purposes, including potential acquisitions or development of new operations or assets with the goal of complementing or expanding our business, working capital and capital expenditures.
Common Stock
98
The holders of the Class A common stock are entitled to
one
vote for each share held. The holders of the Class B common stock are entitled to
ten
votes for each share held, except for the election of one director, who is elected by the holders of the Class A common stock exclusively. The Class B common stock is convertible into Class A common stock on a share-for-share basis at the option of the shareholder.
Preferred Stock
We are authorized to issue up to
944
shares of preferred stock in one or more series. As of
December 31, 2018
and
December 31, 2017
, we had
no
shares issued.
Stock Based Compensation
Stock Incentive Plans
2006 Stock Incentive Plan.
In the fiscal year ended April 30, 2007, we adopted the 2006 Stock Incentive Plan (“2006 Plan”). The 2006 Plan was amended in the fiscal year ended April 30, 2010. The 2006 Plan terminated as of October 9, 2016 and as a result no additional awards may be made pursuant to the 2006 Plan. Outstanding shares which are not actually issued under the 2006 Plan because such awards expire or otherwise result in shares not being issued are reserved for issuance under the 2016 Plan.
2016 Incentive Plan.
In fiscal year 2016, we adopted the 2016 Incentive Plan (“2016 Plan”). Under the 2016 Plan, we may grant awards up to an aggregate amount of shares equal to the sum of: (i)
2,250
shares of Class A common stock (subject to adjustment in the event of stock splits and other similar events), plus (ii) such additional number of shares of Class A common stock as is equal to the sum of the number of shares of Class A common stock that remained available for grant under the 2006 Plan immediately prior to the expiration of the 2006 Plan and the number of shares of Class A common stock subject to awards granted under the 2006 Plan that expire or otherwise result in shares not being issued.
As of
December 31, 2018
, there were
1,615
Class A common stock equivalents available for future grant under the 2016 Plan, inclusive of additional Class A common stock equivalents that were previously issued under terminated plans and have become available for grant because such awards expired or otherwise resulted in shares not being issued.
Our equity awards granted consist of stock options, including market-based performance stock options, restricted stock, restricted stock units and performance stock units, including market-based performance stock units.
Stock options are granted at a price equal to the prevailing fair value of our Class A common stock at the date of grant. Generally, stock options granted have a term not to exceed
ten years
and vest over a
one year
to
four
year period from the date of grant.
The fair value of each stock option granted, with the exception of market-based performance stock option grants, is estimated using a Black-Scholes option-pricing model, which requires extensive use of accounting judgment and financial estimation, including estimates of the expected term stock option holders will retain their vested stock options before exercising them and the estimated volatility of our Class A common stock price over the expected term. The fair value of each market-based performance stock option granted is estimated using a Monte Carlo option-pricing model, which also requires extensive use of accounting judgment and financial estimation, including estimates of the expected term stock option holders will retain their vested stock options before exercising them and the estimated volatility of our Class A common stock price over the expected term, but also including estimates of share price appreciation of our Class A common stock as compared to the Russell 2000 Index over the requisite service period.
Restricted stock, restricted stock units and performance stock units are granted at a price equal to the fair value of our Class A common stock at the date of grant. The fair value of each market-based performance stock unit is estimated using a Monte Carlo pricing model, which requires extensive use of accounting judgment and financial estimation, including the estimated share price appreciation plus the value of dividends of our Class A common stock as compared to the Russell 2000 Index over the requisite service period.
Restricted stock granted to non-employee directors vest incrementally over a
three
year period beginning on the first anniversary of the date of grant. Restricted stock units granted to non-employee directors vest in full on the first anniversary of the grant date. Restricted stock units vest incrementally over an identified service period beginning on the grant date based on continued employment. Performance stock units and market-based performance stock units vest at a future date following the grant date and are based on the attainment of performance targets and market achievements.
Stock Options
99
A summary of stock option activity is as follows:
|
Stock Options
|
Weighted
Average
Exercise Price
|
Weighted
Average
Remaining
Contractual
Term (years)
|
Aggregate
Intrinsic Value
|
|||||||||
|
Outstanding, December 31, 2017
|
727
|
|
$
|
5.82
|
|
|||||||
|
Granted
|
—
|
|
$
|
—
|
|
|||||||
|
Exercised
|
(98
|
)
|
$
|
4.80
|
|
|||||||
|
Forfeited or expired
|
—
|
|
$
|
—
|
|
|||||||
|
Market-based stock options vested
(1)
|
40
|
|
$
|
12.48
|
|
7.9
|
||||||
|
Outstanding, December 31, 2018
|
669
|
|
$
|
6.37
|
|
5.6
|
$
|
14,788
|
|
|||
|
Exercisable, December 31, 2018
|
669
|
|
$
|
6.37
|
|
5.6
|
$
|
14,788
|
|
|||
|
(1)
|
Market-based performance stock option grants were included at
100%
until they vested on December 31, 2018, at which point the actual number of options vested was adjusted based on the actual attainment of performance targets and market achievements.
|
During fiscal years
2018
,
2017
and
2016
, stock-based compensation expense for stock options was
$473
,
$644
and
$605
, respectively.
During fiscal years
2018
,
2017
and
2016
, the aggregate intrinsic value of stock options exercised was
$1,916
,
$4,664
and
$22
, respectively.
As of
December 31, 2018
, there was no remaining unrecognized stock-based compensation expense related to outstanding stock options.
Our calculation of stock-based compensation expense associated with stock options granted, with the exception of market-based performance stock option grants which are valued using a Monte Carlo option-pricing model, was made using the Black-Scholes valuation model. With the exception of market-based performance stock options granted in fiscal year 2016 discussed below, we did not grant any new stock options in fiscal years 2018, 2017 and 2016.
The weighted average fair value of market-based performance stock options granted during fiscal year 2016 was
$6.70
per option, which was calculated using a Monte Carlo option-pricing model assuming an expected life of
7.4
years, a risk free interest rate of
2.15%
, and an expected volatility of
43.10%
assuming
no
expected dividend yield.
Expected life is calculated based on the weighted average historical life of the vested stock options, giving consideration to vesting schedules and historical exercise patterns. Risk-free interest rate is based on the U.S. Treasury yield curve for the period of the expected life of the stock option. Expected volatility is calculated using the weekly historical volatility of our Class A common stock over the expected life, except in the case of market-based performance stock option where the daily historical volatility of our Class A common stock over the expected life is used.
The Black-Scholes valuation model and the Monte Carlo option-pricing model each require extensive use of accounting judgment and financial estimation. Application of alternative assumptions could produce significantly different estimates of the fair value of stock-based compensation and consequently, the related amounts recognized in the consolidated statements of operations.
Other Stock Awards
A summary of restricted stock, restricted stock unit and performance stock unit activity is as follows:
|
Restricted Stock,
Restricted Stock Units,
and Performance Stock
Units (1)
|
Weighted
Average
Grant Price
|
Weighted Average
Remaining
Contractual Term
(years)
|
Aggregate Intrinsic
Value
|
|||||||||
|
Outstanding, December 31, 2017
|
1,091
|
|
$
|
9.81
|
|
|||||||
|
Granted
|
230
|
|
$
|
24.92
|
|
|||||||
|
Class A common stock vested
|
(632
|
)
|
$
|
9.04
|
|
|||||||
|
Forfeited or canceled
|
(3
|
)
|
$
|
13.73
|
|
|||||||
|
Outstanding, December 31, 2018
|
686
|
|
$
|
15.56
|
|
1.2
|
$
|
8,877
|
|
|||
|
Unvested, December 31, 2018
|
951
|
|
$
|
15.95
|
|
1.3
|
$
|
11,929
|
|
|||
100
|
(1)
|
Market-based performance stock unit grants are included at
100%
. Attainment of maximum performance targets and market achievements would result in the issuance of an additional
265
shares of Class A common stock currently included in unvested. The market-based performance stock unit grants that vested in fiscal year 2018 resulted in the issuance of
185
additional shares of Class A common stock.
|
During fiscal years
2018
,
2017
and
2016
, stock-based compensation expense related to restricted stock, restricted stock units and performance stock units was
$7,821
,
$5,652
and
$2,673
, respectively.
During fiscal years
2018
,
2017
and
2016
, the total fair value of other stock awards vested was
$10,529
,
$5,706
and
$3,238
, respectively.
As of
December 31, 2018
, total unrecognized stock-based compensation expense related to restricted stock and restricted stock units was
$3,024
, which will be recognized over a weighted average period of
1.1
years. Total unrecognized stock-based compensation expense related to performance stock units, assuming the attainment of maximum performance targets, was
$4,516
, which will be recognized over a weighted average period of
1.3
years.
The weighted average fair value of market-based performance stock units granted during fiscal year
2018
was
$26.02
per award, which was calculated using a Monte Carlo pricing model assuming a risk free interest rate of
2.39%
and an expected volatility of
32.70%
assuming
no
expected dividend yield. Risk-free interest rate is based on the U.S. Treasury yield curve for the expected service period of the award. Expected volatility is calculated using the daily volatility of our Class A common stock over the expected service period of the award.
The Monte Carlo pricing model requires extensive use of accounting judgment and financial estimation. Application of alternative assumptions could produce significantly different estimates of the fair value of stock-based compensation and consequently, the related amounts recognized in the consolidated statements of operations.
We also recorded
$150
,
$136
and
$115
of stock-based compensation expense related to our Amended and Restated 1997 Employee Stock Purchase Plan during fiscal years
2018
,
2017
and
2016
, respectively.
There was
$(23)
of tax benefit in the (benefit) provision for income taxes associated with stock-based compensation during fiscal year
2018
. There was
$117
and
$0
of tax provision in the (benefit) provision for income taxes associated with stock-based compensation expense in fiscal years
2017
and
2016
, respectively.
Accumulated Other Comprehensive (Loss) Income
Accumulated other comprehensive (loss) income
is a component of
stockholders' deficit
included in the accompanying consolidated balance sheets and includes, as applicable, the effective portion of changes in the fair value of our cash flow hedges and the changes in fair value of our marketable securities.
The changes in the balances of each component of
accumulated other comprehensive (loss) income
are as follows:
|
Marketable
Securities
|
Interest Rate Swaps
|
Total
|
|||||||||
|
Balance as of December 31, 2015
|
$
|
7
|
|
$
|
—
|
|
$
|
7
|
|
||
|
Other comprehensive loss
|
(75
|
)
|
—
|
|
(75
|
)
|
|||||
|
Balance as of December 31, 2016
|
(68
|
)
|
—
|
|
(68
|
)
|
|||||
|
Other comprehensive income (loss) before reclassifications
|
59
|
|
(143
|
)
|
(84
|
)
|
|||||
|
Amounts reclassified from accumulated other comprehensive income (loss)
|
—
|
|
421
|
|
421
|
|
|||||
|
Income tax expense related to items in other comprehensive income (loss)
|
27
|
|
(112
|
)
|
(85
|
)
|
|||||
|
Other comprehensive income, net
|
86
|
|
166
|
|
252
|
|
|||||
|
Balance as of December 31, 2017
|
18
|
|
166
|
|
184
|
|
|||||
|
Cumulative effect of new accounting principle
|
(18
|
)
|
—
|
|
(18
|
)
|
|||||
|
Other comprehensive loss before reclassifications
|
—
|
|
(1,837
|
)
|
(1,837
|
)
|
|||||
|
Amounts reclassified from accumulated other comprehensive loss
|
—
|
|
363
|
|
363
|
|
|||||
|
Income tax expense related to items in other comprehensive income
|
—
|
|
—
|
|
—
|
|
|||||
|
Other comprehensive loss, net
|
—
|
|
(1,474
|
)
|
(1,474
|
)
|
|||||
|
Balance as of December 31, 2018
|
$
|
—
|
|
$
|
(1,308
|
)
|
$
|
(1,308
|
)
|
||
A summary of reclassifications out of
accumulated other comprehensive (loss) income
for fiscal years
2018
,
2017
and
2016
is as follows:
101
|
Fiscal Year Ended
December 31, |
|||||||||||||
|
|
2018
|
2017
|
2016
|
|
|||||||||
|
Details About Accumulated Other Comprehensive Income (Loss) Components
|
Amounts Reclassified Out of Accumulated Other Comprehensive Income (Loss)
|
Affected Line Item in the Consolidated
Statements of Operations
|
|||||||||||
|
Interest rate swaps
|
$
|
363
|
|
$
|
421
|
|
$
|
—
|
|
Interest expense
|
|||
|
363
|
|
421
|
|
—
|
|
Income (loss) before income taxes
|
|||||||
|
—
|
|
—
|
|
—
|
|
(Benefit) provision for income taxes
|
|||||||
|
$
|
363
|
|
$
|
421
|
|
$
|
—
|
|
Net income (loss)
|
||||
13. FAIR VALUE OF FINANCIAL INSTRUMENTS
We use a three-tier fair value hierarchy to classify and disclose all assets and liabilities measured at fair value on a recurring basis, as well as assets and liabilities measured at fair value on a non-recurring basis, in periods subsequent to their initial measurement. These tiers include: Level 1, defined as quoted market prices in active markets for identical assets or liabilities; Level 2, defined as inputs other than Level 1 that are observable, either directly or indirectly, such as quoted prices for similar assets or liabilities; and Level 3, defined as unobservable inputs that are not corroborated by market data.
We use valuation techniques that maximize the use of market prices and observable inputs and minimize the use of unobservable inputs. In measuring the fair value of our financial assets and liabilities, we rely on market data or assumptions that we believe market participants would use in pricing an asset or a liability.
Assets and Liabilities Accounted for at Fair Value on a Recurring Basis
Our financial instruments include cash and cash equivalents, accounts receivable-trade, restricted investment securities held in trust on deposit with various banks as collateral for our obligations relative to our landfill final capping, closure and post-closure costs, interest rate derivatives, trade payables and long-term debt. The carrying values of cash and cash equivalents, accounts receivable - trade and trade payables approximate their respective fair values due to their short-term nature. The fair value of restricted investment securities held in trust, which are valued using quoted market prices, are included as restricted assets in the Level 1 tier below. The fair value of the interest rate derivatives included in the Level 2 tier below is calculated using discounted cash flow valuation methodologies based upon the one month LIBOR yield curves that are observable at commonly quoted intervals for the full term of the swaps. We recognize all derivatives accounted for on the balance sheet at fair value.
See Note 10,
Long Term Debt and Capital Leases
for disclosure over the fair value of debt.
Recurring Fair Value Measurements
Summaries of our financial assets and liabilities that are measured at fair value on a recurring basis are as follows:
|
|
Fair Value Measurement at December 31, 2018 Using:
|
||||||||||
|
Quoted Prices in
Active Markets for Identical Assets (Level 1) |
Significant Other
Observable Inputs (Level 2) |
Significant
Unobservable Inputs (Level 3) |
|||||||||
|
Assets:
|
|||||||||||
|
Restricted investment securities - landfill closure
|
$
|
1,248
|
|
$
|
—
|
|
$
|
—
|
|
||
|
Interest rate swaps
|
—
|
|
820
|
|
—
|
|
|||||
|
$
|
1,248
|
|
$
|
820
|
|
$
|
—
|
|
|||
|
Liabilities:
|
|||||||||||
|
Interest rate swaps
|
$
|
—
|
|
$
|
1,942
|
|
$
|
—
|
|
||
102
|
Fair Value Measurement at December 31, 2017 Using:
|
|||||||||||
|
Quoted Prices in
Active Markets for Identical Assets (Level 1) |
Significant Other
Observable Inputs (Level 2) |
Significant
Unobservable Inputs (Level 3) |
|||||||||
|
Assets:
|
|||||||||||
|
Restricted investment securities - landfill closure
|
$
|
1,220
|
|
$
|
—
|
|
$
|
—
|
|
||
|
Interest rate swaps
|
—
|
|
401
|
|
—
|
|
|||||
|
$
|
1,220
|
|
$
|
401
|
|
$
|
—
|
|
|||
|
Liabilities:
|
|||||||||||
|
Interest rate swaps
|
$
|
—
|
|
$
|
123
|
|
$
|
—
|
|
||
14. EMPLOYEE BENEFIT PLANS
Defined Contribution Plan
We offer our eligible employees the opportunity to contribute to a 401(k) plan (“401(k) Plan”). Under the provisions of the 401(k) Plan participants may direct us to defer a portion of their compensation to the 401(k) Plan, subject to Internal Revenue Code limitations.
We provide an employer matching contribution equal to fifty cents for every dollar an employee invests in the 401(k) Plan up to our maximum match of one thousand dollars per employee per calendar year, subject to revision.
Participants vest in employer contributions ratable over a
three
year period. Employer contributions for fiscal years
2018
,
2017
and
2016
amounted to
$1,319
,
$1,187
and
$1,119
, respectively.
Employee Stock Purchase Plan
We offer our eligible employees the opportunity to participate in an employee stock purchase plan. Under this plan, qualified employees may purchase shares of Class A common stock by payroll deduction at a
15%
discount from the market price. During fiscal years
2018
,
2017
and
2016
,
26
,
41
and
70
shares, respectively, of Class A common stock were issued under this plan. As of
December 31, 2018
,
117
shares of Class A common stock were available for distribution under this plan.
Multiemployer Pension Plan
We make contributions to a multiemployer defined benefit pension plan, the New England Teamsters and Trucking Industry Pension Fund, under the terms of a collective bargaining agreement that covers our union represented employees. The Pension Plan provides retirement benefits to participants based on their service to contributing employers. We do not administer this plan. The risks of participating in a multiemployer plan are different from a single-employer plan in that: (i) assets contributed to the multiemployer plan by one employer may be used to provide benefits to employees or former employees of other participating employers; (ii) if a participating employer stops contributing to the plan, the unfunded obligations of the plan may be required to be assumed by the remaining participating employers; and (iii) if we choose to stop participating in our multiemployer plan, we may be required to pay the plan a withdrawal amount based on the underfunded status of the plan.
The following table outlines our participation in the multiemployer defined benefit pension plan:
|
Pension Fund
|
EIN/Pension
Plan Number
|
Pension Protection Act Zone Status
|
Funding Improvement or Rehabilitation Plan Status
|
Contributions to Plan
|
Expiration Date of CBA
|
|||||||||||||||||
|
Fiscal Year Ended
December 31, |
||||||||||||||||||||||
|
2018
|
2017
|
2018
|
2017
|
2016
|
||||||||||||||||||
|
New England Teamsters and Trucking Industry Pension Fund
|
04-6372430
|
Critical and declining
|
Critical and declining
|
Implemented
|
$
|
726
|
|
$
|
627
|
|
$
|
523
|
|
June 30, 2020
|
||||||||
103
The status is based on the latest plan information for the plan year ended September 30, 2018 that we received from the pension plan and is certified by the pension plans’ actuary. Plans with a “critical and declining” status are funded at less than 65%, have a projected funding deficiency in the current or next four plan years and have a projected insolvency date which is less than the 20-year minimum statutory requirement. Our contributions to the multiemployer pension plan represent less than 5% of total contributions to such plan for the plan year ended September 30, 2017 and a rehabilitation plan has been implemented with no surcharge imposed. Under current law regarding multiemployer benefit plans, a plan’s termination, our voluntary withdrawal, or the withdrawal of all contributing employers from any under-funded multiemployer pension plan would require us to make payments to the plan for our proportionate share of the multiemployer plan’s unfunded vested liabilities. We could have adjustments to estimates for these matters in the near term that could have a material effect on its consolidated financial position, results of operations or cash flows. At the date these financial statements were issued, a Form 5500 was not available for the plan year ended September 30, 2018.
15. INCOME TAXES
A summary of the (benefit) provision for income taxes is as follows:
|
|
Fiscal Year Ended
December 31, |
||||||||||
|
|
2018
|
2017
|
2016
|
||||||||
|
Federal
|
|||||||||||
|
Current
|
$
|
(1,902
|
)
|
$
|
—
|
|
$
|
—
|
|
||
|
Deferred
|
1,255
|
|
(15,614
|
)
|
458
|
|
|||||
|
(647
|
)
|
(15,614
|
)
|
458
|
|
||||||
|
State
|
|||||||||||
|
Current
|
2,575
|
|
301
|
|
(90
|
)
|
|||||
|
Current benefit of loss carryforwards
|
(2,307
|
)
|
(28
|
)
|
—
|
|
|||||
|
Deferred
|
(5
|
)
|
88
|
|
126
|
|
|||||
|
263
|
|
361
|
|
36
|
|
||||||
|
(Benefit) provision for income taxes
|
$
|
(384
|
)
|
$
|
(15,253
|
)
|
$
|
494
|
|
||
During fiscal year 2018, we recognized a
$(937)
deferred tax benefit related to the Complete acquisition due to a reduction of the valuation allowance. In determining the need for a valuation allowance, we have assessed the available means of recovering deferred tax assets, including the existence of reversing temporary differences. The valuation allowance decreased due to the recognition of additional reversing temporary differences from the
$937
deferred tax liability recorded through goodwill on the acquisition. The
$937
deferred tax liability related to the Complete acquisition was based on the impact of temporary differences between the amounts of assets and liabilities recognized for financial reporting purposes and such amounts recognized for income tax purposes. The valuation allowance was reduced by
$(1,635)
in the quarter ended March 31, 2018, with the offsetting increase in the Complete goodwill, based on initial estimates of the Complete temporary differences. The valuation allowance was increased by
$406
in quarter ended September 30, 2018 and
$292
in quarter ended December 31, 2018, with an offsetting decrease in the Complete goodwill, based on the availability of better estimates of the Complete temporary differences upon the filing of the prior year returns by Complete’s sellers in the quarter and anticipated net operating loss carryforwards.
On December 22, 2017, the Act was enacted. The Act, which is also commonly referred to as “U.S. tax reform,” significantly changes United States corporate income tax laws by, among other things, reducing the US corporate income tax rate from 35% to 21% starting in 2018. Under the Act, federal net operating loss carryforwards generated as of the end of 2017 continue to be carried forward for 20 years and are generally available to fully offset taxable income earned in a tax year. Federal net operating losses generated after 2017 will be carried forward indefinitely, but generally may only offset up to 80% of taxable income earned in future tax years. In fiscal year 2017, we revalued our deferred taxes due to these changes, including (a) revaluing our federal net deferred taxes before valuation allowance using the 21% tax rate resulting in an increased net federal deferred tax provision of
$33,700
; (b) revaluing our federal valuation allowance using the 21% tax rate, including the impact of tax planning strategies, resulting in a federal deferred tax benefit to continuing operations of
$(36,556)
; and (c) recognizing a federal deferred tax benefit of
$(12,758)
for 80% of indefinite lived deferred tax liabilities, which are anticipated to be available as a source of taxable income upon reversal of deferred tax assets that would also have indefinite lives.
104
In fiscal year 2016, we elected early adoption of ASU 2016-09 using the prospective transition method related to stock compensation which contains several amendments that simplify the accounting for employee share-based payment transactions. Related to the accounting for income taxes, the new standard eliminates the accounting for excess tax benefits to be recognized in additional paid-in capital and tax deficiencies recognized either in the income tax provision or in additional paid-in capital. Under the new standard, all excess tax benefits and tax deficiencies are recorded in the income tax provision. We recognized no net tax impact upon adoption due to the valuation allowance position and prior periods were not adjusted.
The differences in the (benefit) provision for income taxes and the amounts determined by applying the Federal statutory rate to income before provision for income taxes are as follows:
|
|
Fiscal Year Ended
December 31, |
||||||||||
|
|
2018
|
2017
|
2016
|
||||||||
|
Federal statutory rate
|
21
|
%
|
35
|
%
|
35
|
%
|
|||||
|
Tax at statutory rate
|
$
|
1,268
|
|
$
|
(12,968
|
)
|
$
|
(2,228
|
)
|
||
|
State income taxes, net of federal benefit
|
(89
|
)
|
(1,959
|
)
|
(265
|
)
|
|||||
|
Decrease in net federal deferred tax assets before valuation allowance change due to federal rate change
|
—
|
|
33,700
|
|
—
|
|
|||||
|
Decrease in valuation allowance by 80% of indefinite lived deferred liabilities due to US tax reform
|
—
|
|
(12,758
|
)
|
—
|
|
|||||
|
Other changes in valuation allowance, including the federal rate change in fiscal year 2017
|
(1,613
|
)
|
(18,848
|
)
|
4,370
|
|
|||||
|
Non-deductible officer compensation
|
2,214
|
|
—
|
|
—
|
|
|||||
|
Deductible stock awards
|
(2,048
|
)
|
(1,825
|
)
|
—
|
|
|||||
|
Tax credits
|
(686
|
)
|
(1,000
|
)
|
(1,085
|
)
|
|||||
|
Non-deductible expenses
|
633
|
|
542
|
|
100
|
|
|||||
|
Other, net
|
(63
|
)
|
(137
|
)
|
(398
|
)
|
|||||
|
(Benefit) provision for income taxes
|
$
|
(384
|
)
|
$
|
(15,253
|
)
|
$
|
494
|
|
||
Deferred income taxes reflect the impact of temporary differences between the amounts of assets and liabilities recognized for financial reporting purposes and such amounts recognized for income tax purposes. A summary of deferred tax assets and liabilities is as follows:
|
|
December 31,
|
||||||
|
|
2018
|
2017
|
|||||
|
Deferred tax assets:
|
|||||||
|
Accrued expenses and reserves
|
$
|
34,647
|
|
$
|
26,572
|
|
|
|
Net operating loss carryforwards
|
31,241
|
|
33,228
|
|
|||
|
Book over tax depreciation of property and equipment
|
19,048
|
|
25,615
|
|
|||
|
General business tax credit carryforwards
|
6,192
|
|
5,439
|
|
|||
|
Stock awards
|
2,310
|
|
1,958
|
|
|||
|
Alternative minimum tax credit carryforwards
|
1,902
|
|
3,804
|
|
|||
|
Other
|
3,023
|
|
2,050
|
|
|||
|
Total deferred tax assets
|
98,363
|
|
98,666
|
|
|||
|
Less: valuation allowance
|
(69,189
|
)
|
(68,355
|
)
|
|||
|
Total deferred tax assets after valuation allowance
|
29,174
|
|
30,311
|
|
|||
|
Deferred tax liabilities:
|
|||||||
|
Amortization of intangibles
|
(22,026
|
)
|
(20,904
|
)
|
|||
|
Other
|
(73
|
)
|
(145
|
)
|
|||
|
Total deferred tax liabilities
|
(22,099
|
)
|
(21,049
|
)
|
|||
|
Net deferred tax asset
|
$
|
7,075
|
|
$
|
9,262
|
|
|
The net deferred tax asset at
December 31, 2018
is reflected on the balance sheet as a long-term deferred federal tax asset of
$9,594
and a long-term deferred state tax liability of
$(2,519)
.
105
As of
December 31, 2018
, we have, for federal income tax purposes, net operating loss carryforwards of approximately
$110,586
that expire in the fiscal years ending December 31,
2031 through 2037
and
$3,209
, which do not expire. We have state net operating loss carryforwards of approximately
$86,312
that expire in the fiscal years ending December 31,
2019 through 2038
. In addition, we have
$1,902
minimum tax credit carryforwards which are fully refundable for tax years 2019 through 2021, if not otherwise used to offset tax liabilities. We also have
$6,192
general business credit carryforwards which expire in the fiscal years ending December 31,
2022 through 2038
. Sections 382 and 383 of the Internal Revenue Code can limit the amount of net operating loss and credit carryforwards which may be used in a tax year in the event of certain stock ownership changes. With the exception of
$1,320
federal net operating losses we acquired with the Complete acquisition, we are not currently subject to these limitations but could become subject to them if there were significant changes in the ownership of our stock.
In assessing the realizability of carryforwards and other deferred tax assets, management considers whether it is more likely than not that some portion or all of the deferred tax assets will not be realized. We adjust the valuation allowance in the period management determines it is more likely than not that deferred tax assets will or will not be realized. The change in the valuation allowance was an increase of
$834
for fiscal year 2018 and a decrease of
$(29,234)
for fiscal year 2017. In determining the need for a valuation allowance, we have assessed the available means of recovering deferred tax assets, including the ability to carryback net operating losses, the existence of reversing temporary differences, and available sources of future taxable income. We have also considered the ability to implement certain strategies, such as a potential sale of assets that would, if necessary, be implemented to accelerate taxable income and use expiring deferred tax assets.
The net deferred tax assets include deferred tax liabilities related to amortizable goodwill, which are anticipated to reverse in an indefinite future period and to generate future taxable income upon reversal. Prior to the Act, federal net operating losses, including potential losses from the reversal of deferred tax assets, could only be carried forward for 20 years. The reversal of the indefinite lived goodwill was not available as a source of future taxable income since it was uncertain whether the income generated would be available in the same tax periods in which losses from the reversal of deferred tax assets could be utilized. As such, prior to the Act we did not treat the reversal of amortizable goodwill as an available source of taxable income in determining the valuation allowance.
Beginning in 2018 under the Act, future federal net operating losses generated may be carried forward indefinitely and generally may offset up to 80% of taxable income earned in a tax year. Because potential losses from the reversal of deferred tax assets in future years may be carried forward indefinitely, we consider it more likely than not that 80% of the reversal of deferred tax liabilities for amortizable goodwill will be available as a source of taxable income.
In the fourth quarter of 2017, we revalued our net federal deferred tax assets using the 21% tax rate as enacted under the Act. The valuation allowance was also adjusted in this quarter due to the federal tax rate change and to recognize a
$(12,758)
federal deferred tax benefit for 80% of deferred tax liabilities for amortizable goodwill. Due to the Act, we recognized a
$(15,614)
federal deferred tax benefit in 2017 and decreased our total valuation allowance by
$(29,234)
. We believe we are able to support the deferred tax assets recognized as of the end of fiscal years 2018 and 2017 based on all of the available evidence.
The provisions of FASB ASC 740-10-25-5 prescribe the minimum recognition threshold that a tax position is required to meet before being recognized in the financial statements. Additionally, FASB ASC 740-10-25-5 provides guidance on de-recognition, measurement, classification, interest and penalties, accounting in interim periods, disclosure and transition. Under FASB ASC 740-10-25-5, an entity may only recognize or continue to recognize tax positions that meet a “more likely than not” threshold.
A reconciliation of the beginning and ending amount of gross unrecognized tax benefits is as follows:
|
Fiscal Year Ended December 31,
|
|||||||
|
2018
|
2017
|
||||||
|
Unrecognized tax benefits at beginning of period
|
$
|
1,941
|
|
$
|
3,107
|
|
|
|
Gross increases for tax positions of prior years
|
—
|
|
1
|
|
|||
|
Gross decreases for tax positions of prior years
|
—
|
|
(1,165
|
)
|
|||
|
Reductions resulting from lapse of statute of limitations
|
(1,939
|
)
|
—
|
|
|||
|
Settlements
|
—
|
|
(2
|
)
|
|||
|
Unrecognized tax benefits at end of period
|
$
|
2
|
|
$
|
1,941
|
|
|
106
The fiscal year 2018 reductions resulting from a lapse of the statute of limitations primarily related to unrecognized benefits which had reduced net operating loss carryforwards. The tax positions primarily related to fiscal years 2007 and prior and based on administrative practice of the tax authorities, we have reduced the unrecognized tax benefits. The gross decreases for tax positions of prior years for fiscal year 2017 are due to the reduction in the federal corporate tax rate to 21%. Since the majority of our unrecognized benefits reduce net operating loss carryforwards, the amounts were reduced consistent with the overall rate reduction related to the net operating loss deferred asset.
Included in the balances at December 31, 2018 and December 31, 2017 are
$2
and
$6
, respectively, of unrecognized tax benefits (net of the federal benefit on state issues) that, if recognized, would favorably affect the effective income tax rate in future periods. We anticipate
$2
of unrecognized tax benefits to reverse within the next 12 months due to the expiration of the applicable statute of limitations.
Our continuing practice is to recognize interest and penalties related to income tax matters in income tax expense. Related to uncertain tax positions during fiscal years
2018
,
2017
and
2016
, we have accrued interest of
$2
,
$3
and
$5
and penalties of
$1
,
$2
and
$4
, respectively. We accrued
$(2)
,
$(3)
and
$(91)
for interest and penalties in income tax expense related to uncertain tax positions during fiscal years
2018
,
2017
and
2016
, respectively.
To the extent interest and penalties are not assessed with respect to uncertain tax positions, amounts accrued will be reduced and reflected as a reduction of the overall income tax provision.
We are subject to U.S. federal income tax, as well as income tax of multiple state jurisdictions. Due to Federal and state net operating loss carryforwards, income tax returns from years ending in 1998 through 2018 remain open for examination, with limited exceptions.
16. OTHER ITEMS AND CHARGES
Southbridge Landfill Closure Charge, Net
In June 2017, we initiated the plan to cease operations of our Southbridge Landfill as disclosed in Note 11,
Commitments and Contingencie
s
.
Accordingly, in fiscal years 2018 and 2017, we recorded charges associated with the closure of our Southbridge Landfill as follows:
|
|
Fiscal Year Ended
December 31, |
||||||
|
|
2018
|
2017
|
|||||
|
Asset impairment charge (1)
|
$
|
—
|
|
$
|
47,999
|
|
|
|
Project development charge (2)
|
—
|
|
9,149
|
|
|||
|
Environmental remediation charge (3)
|
—
|
|
6,379
|
|
|||
|
Contract settlement charge (4)
|
8,724
|
|
—
|
|
|||
|
Landfill closure project charge (5)
|
6,012
|
|
—
|
|
|||
|
Charlton settlement charge (6)
|
1,216
|
|
—
|
|
|||
|
Legal and transaction costs (7)
|
2,102
|
|
1,656
|
|
|||
|
Recovery on insurance settlement (8)
|
(10,000
|
)
|
—
|
|
|||
|
Southbridge Landfill closure charge, net
|
$
|
8,054
|
|
$
|
65,183
|
|
|
|
(1)
|
We performed a test of recoverability under FASB ASC 360, which indicated that the carrying value of our asset group that includes the Southbridge Landfill was no longer recoverable and, as a result, the asset group was assessed for impairment with an impairment charge allocated to the long-lived assets of the Southbridge Landfill in accordance with FASB ASC 360.
|
|
(2)
|
We wrote-off deferred costs associated with Southbridge Landfill permitting activities no longer deemed viable.
|
|
(3)
|
We recorded an environmental remediation charge associated with the installation of a municipal waterline. See Note 11,
Commitments and Contingencies
for additional disclosure.
|
|
(4)
|
We recorded a contract settlement charge associated with the closure of Southbridge Landfill and the remaining future obligations due to the Town of Southbridge under the landfill operating agreement with the Town of Southbridge. See Note 11,
Commitments and Contingencies
for additional disclosure.
|
|
(5)
|
We recorded a landfill closure project charge associated with increased costs under the revised closure plan at our Southbridge Landfill.
|
107
|
(6)
|
We established a reserve associated with settlement of the Town of Charlton's claim against us. See Note 11,
Commitments and Contingencies
for additional disclosure.
|
|
(7)
|
We incurred legal and other transaction costs associated with various matters as part of the Southbridge Landfill closure. See Note 11,
Commitments and Contingencies
for additional disclosure.
|
|
(8)
|
We recorded a recovery on an environmental insurance settlement associated with the Southbridge Landfill closure. See Note 11, Commitments and Contingencies for additional disclosure.
|
Contract Settlement Charge
In fiscal year 2018, we recorded contract settlement charges of
$2,100
associated with the termination and discounted buy-out of a commodities marketing and brokerage agreement.
Expense from Acquisition Activities and Other Items
In fiscal year 2018, we recorded a charge of
$1,872
associated with acquisition activities and the write-off of deferred costs related to the expiration of our shelf registration statement, and in fiscal year 2017, we recorded a charge of
$176
related to acquisition activities. See Note 5,
Business Combinations
for disclosure over acquisition activity.
Development Project Charge
In fiscal year 2018, we recorded development project charges of
$311
associated with previously deferred costs that were written off as a result of the negative vote in a public referendum relating to the NCES Landfill.
Environmental Remediation Charge
We recorded an environmental remediation charge of
$900
in fiscal year 2016 due to changes in cost estimates associated with the Potsdam environmental remediation liability. See Note 11,
Commitments and Contingencies
for further disclosure.
17. EARNINGS PER SHARE
A summary of the numerator and denominators used in the computation of earnings per share is as follows:
|
|
Fiscal Year Ended
December 31, |
||||||||||
|
|
2018
|
2017
|
2016
|
||||||||
|
Numerator:
|
|||||||||||
|
Net income (loss) attributable to common stockholders
|
$
|
6,420
|
|
$
|
(21,799
|
)
|
$
|
(6,849
|
)
|
||
|
Denominator:
|
|||||||||||
|
Class A common stock
|
41,944
|
|
41,298
|
|
40,572
|
|
|||||
|
Class B common stock
|
988
|
|
988
|
|
988
|
|
|||||
|
Shares to be issued - acquisition
|
103
|
|
—
|
|
—
|
|
|||||
|
Unvested restricted stock
|
(9
|
)
|
(38
|
)
|
(88
|
)
|
|||||
|
Effect of weighted average shares outstanding
|
(338
|
)
|
(402
|
)
|
(239
|
)
|
|||||
|
Basic weighted average common shares outstanding
|
42,688
|
|
41,846
|
|
41,233
|
|
|||||
|
Impact of potentially dilutive securities:
|
|||||||||||
|
Dilutive effect of stock options and stock awards
|
1,480
|
|
—
|
|
—
|
|
|||||
|
Diluted weighted average common shares outstanding
|
44,168
|
|
41,846
|
|
41,233
|
|
|||||
|
Antidilutive potentially issuable shares
|
2
|
|
2,219
|
|
2,442
|
|
|||||
18. RELATED PARTY TRANSACTIONS
Services
During fiscal years
2018
,
2017
and
2016
, we retained the services of Casella Construction, Inc. ("CCI"), a company substantially owned by sons of John Casella, our Chairman and Chief Executive Officer, and Douglas Casella, a member of our Board of Directors, as a contractor in developing or closing certain landfills owned by us as well as providing transportation services. Total purchased services charged to operations or capitalized to landfills for fiscal years
2018
,
2017
and
2016
were
$3,421
,
$3,377
and
$4,024
, respectively, of which
$32
and
$30
were outstanding and included in either accounts payable or other current liabilities as of
December 31, 2018
and
December 31, 2017
, respectively.
108
In addition to the total purchased services, we provided various waste collection and disposal services to CCI. Total revenues recorded for fiscal years
2018
,
2017
and
2016
were
$156
,
$237
and
$307
, respectively.
Leases
In the fiscal year ended April 30, 1994, we entered into
two
leases for operating facilities with a partnership of which John Casella, our Chairman and Chief Executive Officer, and Douglas Casella, a member of our Board of Directors, are the general partners. The leases have since been extended through
August 2023
. The terms of the lease agreements require monthly payments of approximately
$28
. Total expense charged to operations for fiscal years
2018
,
2017
and
2016
under these agreements was
$349
,
$360
and
$371
, respectively.
Landfill Post-closure
We have agreed to pay the cost of post-closure on a landfill owned by John Casella, our Chairman and Chief Executive Officer, and Douglas Casella, a member of our Board of Directors. We paid the cost of closing this landfill in 1992, and the post-closure maintenance obligations are expected to last until the fiscal year ending December 31, 2024. In fiscal years
2018
,
2017
and
2016
, we paid
$14
,
$27
and
$10
, respectively, pursuant to this agreement. As of
December 31, 2018
and
December 31, 2017
, we have accrued
$48
and
$60
, respectively, for costs associated with its post-closure obligations.
19. SEGMENT REPORTING
We report selected information about operating segments in a manner consistent with that used for internal management reporting. We classify our solid waste operations on a geographic basis through regional operating segments, our Western and Eastern regions. Revenues associated with our solid waste operations are derived mainly from solid waste collection and disposal, landfill, landfill gas-to-energy, transfer and recycling services in the northeastern United States. Our revenues in the Recycling segment are derived from municipalities and customers in the form of processing fees, tipping fees and commodity sales. Organics services, ancillary operations, along with major account and industrial services, are included in our Other segment.
Fiscal Year Ended
December 31, 2018
|
Segment
|
Outside
revenues
|
Inter-company
revenue
|
Depreciation and
amortization
|
Operating income (loss)
|
Interest
expense, net
|
Capital
expenditures
|
Goodwill
|
Total assets
|
|||||||||||||||||||||||
|
Eastern
|
$
|
206,473
|
|
$
|
52,866
|
|
$
|
26,538
|
|
$
|
4,684
|
|
$
|
12
|
|
$
|
23,393
|
|
$
|
28,154
|
|
$
|
184,679
|
|
|||||||
|
Western
|
286,262
|
|
81,515
|
|
35,843
|
|
41,529
|
|
(148
|
)
|
41,850
|
|
120,536
|
|
428,934
|
|
|||||||||||||||
|
Recycling
|
42,191
|
|
6,426
|
|
4,345
|
|
(7,805
|
)
|
140
|
|
4,476
|
|
12,315
|
|
48,629
|
|
|||||||||||||||
|
Other
|
125,734
|
|
1,982
|
|
3,782
|
|
1,325
|
|
26,017
|
|
3,513
|
|
1,729
|
|
70,168
|
|
|||||||||||||||
|
Eliminations
|
—
|
|
(142,789
|
)
|
—
|
|
—
|
|
—
|
|
—
|
|
—
|
|
—
|
|
|||||||||||||||
|
Total
|
$
|
660,660
|
|
$
|
—
|
|
$
|
70,508
|
|
$
|
39,733
|
|
$
|
26,021
|
|
$
|
73,232
|
|
$
|
162,734
|
|
$
|
732,410
|
|
|||||||
Fiscal Year Ended
December 31, 2017
|
Segment
|
Outside
revenues |
Inter-company
revenue |
Depreciation and
amortization |
Operating income (loss)
|
Interest
expense, net |
Capital
expenditures |
Goodwill
|
Total assets
|
|||||||||||||||||||||||
|
Eastern
|
$
|
181,170
|
|
$
|
50,335
|
|
$
|
23,815
|
|
$
|
(51,867
|
)
|
$
|
3
|
|
$
|
17,153
|
|
$
|
19,192
|
|
$
|
157,248
|
|
|||||||
|
Western
|
250,771
|
|
71,510
|
|
30,766
|
|
35,035
|
|
(220
|
)
|
42,082
|
|
89,369
|
|
344,324
|
|
|||||||||||||||
|
Recycling
|
62,307
|
|
246
|
|
4,125
|
|
2,805
|
|
143
|
|
2,006
|
|
12,315
|
|
48,612
|
|
|||||||||||||||
|
Other
|
105,061
|
|
1,881
|
|
3,396
|
|
1,444
|
|
24,961
|
|
3,621
|
|
1,729
|
|
64,765
|
|
|||||||||||||||
|
Eliminations
|
—
|
|
(123,972
|
)
|
—
|
|
—
|
|
—
|
|
—
|
|
—
|
|
—
|
|
|||||||||||||||
|
Total
|
$
|
599,309
|
|
$
|
—
|
|
$
|
62,102
|
|
$
|
(12,583
|
)
|
$
|
24,887
|
|
$
|
64,862
|
|
$
|
122,605
|
|
$
|
614,949
|
|
|||||||
109
Fiscal Year Ended
December 31, 2016
|
Segment
|
Outside
revenues |
Inter-company
revenue |
Depreciation and
amortization |
Operating income (loss)
|
Interest
expense, net |
Capital
expenditures |
Goodwill
|
Total assets
|
|||||||||||||||||||||||
|
Eastern
|
$
|
176,539
|
|
$
|
45,728
|
|
$
|
27,036
|
|
$
|
9,697
|
|
$
|
(16
|
)
|
$
|
18,363
|
|
$
|
17,429
|
|
$
|
202,420
|
|
|||||||
|
Western
|
233,168
|
|
67,985
|
|
27,511
|
|
30,576
|
|
(248
|
)
|
31,637
|
|
88,426
|
|
327,628
|
|
|||||||||||||||
|
Recycling
|
52,911
|
|
1,003
|
|
4,212
|
|
2,542
|
|
156
|
|
2,218
|
|
12,315
|
|
49,931
|
|
|||||||||||||||
|
Other
|
102,412
|
|
1,615
|
|
3,097
|
|
2,130
|
|
38,760
|
|
2,020
|
|
1,729
|
|
51,533
|
|
|||||||||||||||
|
Eliminations
|
—
|
|
(116,331
|
)
|
—
|
|
—
|
|
—
|
|
—
|
|
—
|
|
—
|
|
|||||||||||||||
|
Total
|
$
|
565,030
|
|
$
|
—
|
|
$
|
61,856
|
|
$
|
44,945
|
|
$
|
38,652
|
|
$
|
54,238
|
|
$
|
119,899
|
|
$
|
631,512
|
|
|||||||
Amount of our total revenue attributable to services provided are as follows:
|
|
Fiscal Year Ended
December 31, |
|||||||||||||||||||
|
|
2018
|
2017
|
2016
|
|||||||||||||||||
|
Collection
|
$
|
303,418
|
|
45.9
|
%
|
$
|
263,688
|
|
44.0
|
%
|
$
|
249,640
|
|
44.2
|
%
|
|||||
|
Disposal
|
181,110
|
|
27.4
|
%
|
160,073
|
|
26.7
|
%
|
154,211
|
|
27.3
|
%
|
||||||||
|
Power generation
|
5,129
|
|
0.8
|
%
|
5,375
|
|
0.9
|
%
|
5,921
|
|
1.0
|
%
|
||||||||
|
Processing
|
7,174
|
|
1.1
|
%
|
7,994
|
|
1.3
|
%
|
6,282
|
|
1.1
|
%
|
||||||||
|
Solid waste operations
|
496,831
|
|
75.2
|
%
|
437,130
|
|
72.9
|
%
|
416,054
|
|
73.6
|
%
|
||||||||
|
Organics
|
54,174
|
|
8.2
|
%
|
39,815
|
|
6.6
|
%
|
41,587
|
|
7.4
|
%
|
||||||||
|
Customer solutions
|
67,464
|
|
10.2
|
%
|
60,057
|
|
10.1
|
%
|
54,478
|
|
9.6
|
%
|
||||||||
|
Recycling
|
42,191
|
|
6.4
|
%
|
62,307
|
|
10.4
|
%
|
52,911
|
|
9.4
|
%
|
||||||||
|
Total revenues
|
$
|
660,660
|
|
100.0
|
%
|
$
|
599,309
|
|
100.0
|
%
|
$
|
565,030
|
|
100.0
|
%
|
|||||
20. QUARTERLY FINANCIAL INFORMATION (UNAUDITED)
The following is a summary of certain items in the consolidated statements of operations by quarter:
|
Fiscal Year 2018
|
First
Quarter
|
Second
Quarter
|
Third
Quarter
|
Fourth
Quarter
|
|||||||||||
|
Revenues
|
$
|
147,455
|
|
$
|
165,649
|
|
$
|
172,832
|
|
$
|
174,724
|
|
|||
|
Operating income (loss)
|
$
|
838
|
|
$
|
15,149
|
|
$
|
28,884
|
|
$
|
(5,138
|
)
|
|||
|
Net (loss) income
|
$
|
(3,910
|
)
|
$
|
1,704
|
|
$
|
22,302
|
|
$
|
(13,676
|
)
|
|||
|
Earnings per common share:
|
—
|
|
|||||||||||||
|
Basic weighted average common shares outstanding
|
42,370
|
|
42,661
|
|
42,779
|
|
42,936
|
|
|||||||
|
Basic earnings per share
|
$
|
(0.09
|
)
|
$
|
0.04
|
|
$
|
0.52
|
|
$
|
(0.32
|
)
|
|||
|
Diluted weighted average common shares outstanding
|
42,370
|
|
43,916
|
|
44,175
|
|
42,936
|
|
|||||||
|
Diluted earnings per share
|
$
|
(0.09
|
)
|
$
|
0.04
|
|
$
|
0.50
|
|
$
|
(0.32
|
)
|
|||
110
|
Fiscal Year 2017
|
First
Quarter
|
Second
Quarter
|
Third
Quarter
|
Fourth
Quarter
|
|||||||||||
|
Revenues
|
$
|
133,802
|
|
$
|
154,016
|
|
$
|
160,269
|
|
$
|
151,222
|
|
|||
|
Operating income (loss)
|
$
|
6,564
|
|
$
|
(47,279
|
)
|
$
|
18,277
|
|
$
|
9,855
|
|
|||
|
Net (loss) income
|
$
|
(224
|
)
|
$
|
(53,675
|
)
|
$
|
12,080
|
|
$
|
20,020
|
|
|||
|
Earnings per common share:
|
|||||||||||||||
|
Basic weighted average common shares outstanding
|
41,584
|
|
41,811
|
|
41,951
|
|
42,033
|
|
|||||||
|
Basic earnings per share
|
$
|
(0.01
|
)
|
$
|
(1.28
|
)
|
$
|
0.29
|
|
$
|
0.48
|
|
|||
|
Diluted weighted average common shares outstanding
|
41,584
|
|
41,811
|
|
43,295
|
|
43,394
|
|
|||||||
|
Diluted earnings per share
|
$
|
(0.01
|
)
|
$
|
(1.28
|
)
|
$
|
0.28
|
|
$
|
0.46
|
|
|||
Our transfer and disposal revenues historically have been lower from the months of November through March. This seasonality reflects the lower volume of waste during the late fall, winter and early spring months. Since certain of our operating and fixed costs remain constant throughout fiscal year, operating income is impacted by a similar seasonality. In addition, particularly harsh weather conditions typically result in increased operating costs.
Our recycling business experiences increased volumes of newspaper in November and December due to increased newspaper advertising and retail activity during the holiday season.
ITEM 9. CHANGES IN AND DISAGREEMENTS WITH ACCOUNTANTS ON ACCOUNTING AND FINANCIAL DISCLOSURE
None.
ITEM 9A. CONTROLS AND PROCEDURES
Evaluation of Disclosure Controls and Procedures
Our management, with the participation of our chief executive officer and chief financial officer, evaluated the effectiveness of our disclosure controls and procedures as of
December 31, 2018
. The term “disclosure controls and procedures,” as defined in Rules 13a-15(e) and 15d-15(e) under the Securities Exchange Act of 1934, as amended, means controls and other procedures of a company that are designed to ensure that information required to be disclosed by a company in the reports that it files or submits under the Securities Exchange Act of 1934, as amended, is recorded, processed, summarized and reported, within the time periods specified in the SEC’s rules and forms. Disclosure controls and procedures include, without limitation, controls and procedures designed to ensure that information required to be disclosed by a company in the reports that it files or submits under the Securities Exchange Act of 1934, as amended, is accumulated and communicated to the company’s management, including its principal executive and principal financial officers, as appropriate to allow timely decisions regarding required disclosure. Management recognizes that any controls and procedures, no matter how well designed and operated, can provide only reasonable assurance of achieving their objectives and management necessarily applies its judgment in evaluating the cost-benefit relationship of possible controls and procedures. Based on the evaluation of our disclosure controls and procedures as of
December 31, 2018
, our chief executive officer and chief financial officer concluded that, as of such date, our disclosure controls and procedures were effective at the reasonable assurance level.
Management’s Report on Internal Control Over Financial Reporting
Our management is responsible for establishing and maintaining adequate internal control over financial reporting, as defined in Rule 13a-15(f) under the Securities Exchange Act of 1934, as amended. Because of its inherent limitations, internal control over financial reporting may not prevent or detect misstatements. Also, projections of any evaluation of effectiveness to future periods are subject to the risk that controls may become inadequate because of changes in conditions, or that the degree of compliance with the policies or procedures may deteriorate. Our management assessed the effectiveness of our internal control over financial reporting as of
December 31, 2018
. In making this assessment, our management used the criteria set forth by the Committee of Sponsoring Organizations of the Treadway Commission in Internal Control-Integrated Framework in 2013. Based on its assessment, management concluded that, as of
December 31, 2018
, our internal control over financial reporting is effective based on those criteria. The effectiveness of our internal control over financial reporting as of
December 31, 2018
has been audited by RSM US LLP, an independent registered public accounting firm. RSM US LLP has issued an attestation report on our internal control over financial reporting, which is included herein.
111
We completed the acquisitions of Youngblood Disposal Enterprises of Western New York, LLC and its wholly owned subsidiaries (collectively “Youngblood”) on August 31, 2018, Silvarole Transfer, Inc. and select assets of Silvarole Trucking, Inc. (collectively “Silvarole”) on August 31, 2018, Boon & Sons, Inc. (“Boon”) on November 1, 2018, Oceanside Rubbish, Inc. (“Oceanside”) on November 1, 2018 and Al’s Maintenance (“Al’s”) on December 1, 2018. Since we have not yet fully incorporated the internal controls and procedures of Youngblood, Silvarole, Boon, Oceanside or Al’s into our internal control over financial reporting, management excluded Youngblood, Silvarole, Boon, Oceanside and Al’s from its assessment of the effectiveness of the Company’s internal control over financial reporting as of December 31, 2018. Collectively, Youngblood, Silvarole, Boon, Oceanside or Al’s constituted less than 11% of our total assets as of December 31, 2018 and less than 1.5% of the our total revenues for the year ended December 31, 2018.
Changes in Internal Control Over Financial Reporting
No change in our internal control over financial reporting occurred during the fiscal quarter ended
December 31, 2018
that has materially affected, or is reasonably likely to materially affect, our internal control over financial reporting.
ITEM 9B. OTHER INFORMATION
None.
PART III
ITEM 10. DIRECTORS, EXECUTIVE OFFICERS AND CORPORATE GOVERNANCE
The information required by this Item (except for information required with respect to our executive officers which is set forth under “Executive Officers of the Registrant” in Item 1 of Part I of this Annual Report on Form 10-K and with respect to equity compensation plan information which is set forth under the section captioned “Equity Compensation Plan Information” below) has been omitted from this Annual Report on Form 10-K, and is incorporated herein by reference from our definitive proxy statement for the 2019 Annual Meeting of Stockholders that we intend to file with the Securities and Exchange Commission within 120 days after the end of our fiscal year ended
December 31, 2018
(the "Proxy Statement"), under the sections captioned "Board of Directors", "Corporate Governance" and "Ownership of Our Common Stock".
ITEM 11. EXECUTIVE COMPENSATION
The information required by this Item is incorporated herein by reference from the Proxy Statement under the sections captioned "Executive and Director Compensation and Related Matters" and "Corporate Governance".
ITEM 12. SECURITY OWNERSHIP OF CERTAIN BENEFICIAL OWNERS AND MANAGEMENT AND RELATED STOCKHOLDER MATTERS
The information required by this Item (except for the information required with respect to equity compensation plan information, which is set forth under “Equity Compensation Plan Information” below) is incorporated herein by reference from the Proxy Statement under the section captioned “Ownership of Our Common Stock".
Equity Compensation Plan Information
The following table shows information about the securities authorized for issuance under our equity compensation plans as of
December 31, 2018
:
|
(a)
|
(b)
|
(c)
|
|||||||
|
Plan Category
|
Number of
securities
to be issued upon
exercise of
outstanding
options, warrants
and rights (1)
|
Weighted-average
exercise price of
outstanding
options, warrants
and rights (2)
|
Number of securities
remaining
available for future
issuance
under equity
compensation
plans (excluding
securities reflected
in column (a) (3))
|
||||||
|
Equity compensation plans approved by security holders
|
1,345,146
|
|
$
|
6.37
|
|
1,732,278
|
|
||
|
Equity compensation plans not approved by security holders
|
—
|
|
—
|
|
—
|
|
|||
|
Total
|
1,345,146
|
|
$
|
6.37
|
|
1,732,278
|
|
||
|
(1)
|
Performance stock units, including market-based performance stock units are included at the 100% attainment level. Attainment of maximum performance targets and market achievements could result in the issuance of an additional 264,721 shares of Class A common stock.
|
112
|
(2)
|
The weighted average exercise price of outstanding options, warrants and rights excludes restricted stock units and other equity-based awards that do not have an exercise price.
|
|
(3)
|
Includes 1,615,423 shares of our Class A common stock issuable under our 2016 Incentive Plan and 116,855 shares of our Class A common stock issuable under our Amended and Restated 1997 Employee Stock Purchase Plan.
|
ITEM 13. CERTAIN RELATIONSHIPS AND RELATED TRANSACTIONS, AND DIRECTOR INDEPENDENCE
The information required by this Item is incorporated herein by reference from the Proxy Statement under the section captioned "Corporate Governance".
ITEM 14. PRINCIPAL ACCOUNTING FEES AND SERVICES
The information required by this Item is incorporated herein by reference from the Proxy Statement under the section captioned "Proposal 3 - Ratification of the Appointment of Independent Auditors".
113
PART IV
ITEM 15. EXHIBITS AND FINANCIAL STATEMENT SCHEDULES
|
(a)(1)
|
|
Consolidated Financial Statements included under Item 8.
|
|
|
Report of Independent Registered Public Accounting Firm – RSM US LLP.
|
|
|
|
Consolidated Balance Sheets as of December 31, 2018 and December 31, 2017.
|
|
|
|
Consolidated Statements of Operations for fiscal years 2018, 2017 and 2016.
|
|
|
|
Consolidated Statements of Comprehensive Income (Loss) for fiscal years 2018, 2017 and 2016.
|
|
|
|
Consolidated Statement of Stockholders’ Deficit for fiscal years 2018, 2017 and 2016.
|
|
|
|
Consolidated Statements of Cash Flows for fiscal years 2018, 2017 and 2016.
|
|
|
|
Notes to Consolidated Financial Statements.
|
|
|
(a)(2)
|
|
Financial Statement Schedules:
|
|
|
Schedule II – Valuation and Qualifying Accounts.
|
|
|
|
All other schedules have been omitted because the required information is not significant or is included in the consolidated financial statements or notes thereto, or is not applicable.
|
|
|
(a)(3)
|
|
Exhibits:
|
|
Exhibit
No.
|
|
Description
|
|
2.1
|
|
|
|
2.2
|
|
|
|
2.3
|
|
|
|
2.4
|
|
|
|
3.1
|
|
|
|
3.2
|
|
|
|
4.1
|
|
|
|
4.2
|
|
|
|
4.7
|
|
|
114
|
Exhibit
No.
|
|
Description
|
|
4.8
|
|
|
|
4.9
|
|
|
|
4.10
|
|
|
|
4.11
|
|
|
|
4.12
|
|
|
|
4.13
|
|
|
|
4.14
|
|
|
|
4.15
|
|
|
|
4.16
|
|
|
|
4.17
|
||
|
4.18
|
|
|
|
10.1*
|
|
|
|
10.2*
|
|
|
|
10.3*
|
|
|
|
10.4*
|
|
|
|
10.5
|
|
|
115
|
Exhibit
No.
|
|
Description
|
|
10.6
|
|
|
|
10.7
|
|
|
|
10.8
|
|
|
|
10.9
|
|
|
|
10.10
|
|
|
|
10.11*
|
|
|
|
10.12*
|
|
|
|
10.13*
|
|
|
|
10.14*
|
|
|
|
10.15*
|
|
|
|
10.16*
|
|
|
|
10.17*
|
|
|
|
10.18*
|
|
|
|
10.19*
|
|
|
|
10.20*
|
|
|
|
10.21*
|
|
|
116
|
Exhibit
No.
|
|
Description
|
|
10.22*
|
||
|
10.23*
|
|
|
|
10.24*
|
|
|
|
10.25*
|
|
|
|
10.26*
|
|
|
|
10.27*
|
|
|
|
10.28
|
||
|
10.30
|
||
|
10.31
|
||
|
10.32*
|
||
|
10.33*
|
||
|
10.34*
|
||
|
10.35*
|
||
|
10.36*
|
||
|
10.37*
|
||
|
10.38*
|
||
|
10.39*
|
||
117
|
Exhibit
No.
|
|
Description
|
|
10.40*
|
||
|
10.41*
|
||
|
10.42*
|
||
|
10.43*
|
||
|
10.44*
|
||
|
10.45*
|
||
|
10.46
|
||
|
|
Subsidiaries of Casella Waste Systems, Inc.
|
|
|
|
Consent of RSM US LLP
|
|
|
|
Certification of Principal Executive Officer required by Rule 13a-14(a) or Rule 15d-14(a) of the Securities Exchange Act of 1934, as amended.
|
|
|
|
Certification of Principal Financial Officer required by Rule 13a-14(a) or Rule 15d-14(a) of the Securities Exchange Act of 1934, as amended.
|
|
|
|
Certification of Chief Executive Officer and Chief Financial Officer pursuant to 18 U.S.C. Section 1350, as adopted pursuant to Section 906 of the Sarbanes- Oxley Act of 2002.
|
|
|
101.INS
|
|
XBRL Instance Document.**
|
|
101.SCH
|
|
XBRL Taxonomy Extension Schema Document.**
|
|
101.CAL
|
|
XBRL Taxonomy Calculation Linkbase Document.**
|
|
101.LAB
|
|
XBRL Taxonomy Label Linkbase Document.**
|
|
101.PRE
|
|
XBRL Taxonomy Presentation Linkbase Document.**
|
|
101.DEF
|
|
XBRL Taxonomy Extension Definition Linkbase Document.**
|
____________________
+ Filed Herewith
* This is a management contract or compensatory plan or arrangement.
** Submitted Electronically Herewith. Attached as Exhibit 101 to this report are the following formatted in XBRL (Extensible Business Reporting Language): (i) Consolidated Balance Sheets as of
December 31, 2018
and
December 31, 2017
, (ii) Consolidated Statements of Operations for fiscal years
2018
,
2017
and
2016
, (iii) Consolidated Statements of Comprehensive Income (Loss) for fiscal years
2018
,
2017
, and
2016
, (iv) Consolidated Statement of Stockholders’ Deficit for fiscal years
2018
,
2017
and
2016
, (v) Consolidated Statements of Cash Flows for fiscal years
2018
,
2017
and
2016
, and (vi) Notes to Consolidated Financial Statements.
118
ITEM 16. FORM 10-K SUMMARY
Not applicable.
119
SIGNATURES
Pursuant to the requirements of the Section 13 or 15(d) of Securities Exchange Act of 1934, the Registrant has duly caused this report to be signed on its behalf by the undersigned, thereunto duly authorized.
|
Casella Waste Systems, Inc.
|
|
|
Dated: February 22, 2019
|
By: /s/ John W. Casella
|
|
John W. Casella
|
|
|
Chairman of the Board of Directors and Chief
Executive Officer
(Principal Executive Officer)
|
|
Pursuant to the requirements of the Securities Exchange Act of 1934, this report has been signed below by the following persons on behalf of the registrant and in the capacities and on the date indicated.
|
Signature
|
|
Title
|
|
Date
|
|
/s/ John W. Casella
|
|
Chairman of the Board of Directors and Chief Executive Officer
|
|
February 22, 2019
|
|
John W. Casella
|
(Principal Executive Officer)
|
|||
|
/s/ Edmond R. Coletta
|
|
Senior Vice President and Chief Financial Officer
|
|
February 22, 2019
|
|
Edmond R. Coletta
|
(Principal Financial Officer)
|
|||
|
/s/ Christopher B. Heald
|
|
Vice President and Chief Accounting Officer
|
|
February 22, 2019
|
|
Christopher B. Heald
|
(Principal Accounting Officer)
|
|||
|
/s/ Douglas R. Casella
|
|
Director
|
|
February 22, 2019
|
|
Douglas R. Casella
|
||||
|
/s/ Joseph G. Doody
|
|
Director
|
|
February 22, 2019
|
|
Joseph G. Doody
|
||||
|
/s/ Gregory B. Peters
|
|
Director
|
|
February 22, 2019
|
|
Gregory B. Peters
|
||||
|
/s/ James F. Callahan, Jr.
|
|
Director
|
|
February 22, 2019
|
|
James F. Callahan, Jr.
|
||||
|
/s/ James E. O’Connor
|
|
Director
|
|
February 22, 2019
|
|
James E. O’Connor
|
||||
|
/s/ William P. Hulligan
|
|
Director
|
|
February 22, 2019
|
|
William P. Hulligan
|
||||
|
/s/ Michael K. Burke
|
|
Director
|
|
February 22, 2019
|
|
Michael K. Burke
|
||||
|
/s/ Emily Nagle Green
|
|
Director
|
|
February 22, 2019
|
|
Emily Nagle Green
|
||||
120
FINANCIAL STATEMENT SCHEDULES
Schedule II
Valuation Accounts
Allowance for Doubtful Accounts
(in thousands)
|
Fiscal Year Ended
December 31, |
|||||||||||
|
2018
|
2017
|
2016
|
|||||||||
|
Balance at beginning of period
|
$
|
809
|
|
$
|
1,069
|
|
$
|
988
|
|
||
|
Additions—charged to expense
|
1,620
|
|
290
|
|
1,107
|
|
|||||
|
Deductions—bad debts written off, net of recoveries
|
(1,498
|
)
|
(550
|
)
|
(1,026
|
)
|
|||||
|
Balance at end of period
|
$
|
931
|
|
$
|
809
|
|
$
|
1,069
|
|
||
121
TABLE OF CONTENTS
Part IItem 1. BusinessItem 1A. Risk FactorsItem 1B. Unresolved Staff CommentsItem 2. PropertiesItem 3. Legal ProceedingsItem 4. Mine Safety DisclosuresPart IIItem 5. Market For Registrant S Common Equity, Related Stockholder Matters and Issuer Purchases Of Equity SecuritiesItem 6. Selected Financial DataItem 7. Management S Discussion and Analysis Of Financial Condition and Results Of OperationsItem 7A. Quantitative and Qualitative Disclosure About Market RiskItem 8. Financial Statements and Supplementary DataItem 9. Changes in and Disagreements with Accountants on Accounting and Financial DisclosureItem 9A. Controls and ProceduresItem 9B. Other InformationPart IIIItem 10. Directors, Executive Officers and Corporate GovernanceItem 11. Executive CompensationItem 12. Security Ownership Of Certain Beneficial Owners and Management and Related Stockholder MattersItem 13. Certain Relationships and Related Transactions, and Director IndependenceItem 14. Principal Accounting Fees and ServicesPart IVItem 15. Exhibits and Financial Statement SchedulesItem 16. Form 10-k Summary