UNITED STATES
SECURITIES AND EXCHANGE COMMISSION
Washington, D.C. 20549
FORM 20-F
(Mark One)
| o |
REGISTRATION STATEMENT PURSUANT TO SECTION 12(b) OR (g) OF THE SECURITIES EXCHANGE ACT OF 1934
|
OR
|
x
|
ANNUAL REPORT PURSUANT TO SECTION 13 OR 15(d) OF THE SECURITIES EXCHANGE ACT OF 1934
|
|
|
for the fiscal year ended December 31, 2014
|
OR
|
o
|
TRANSITION REPORT PURSUANT TO SECTION 13 OR 15(d) OF THE SECURITIES EXCHANGE ACT OF 1934
|
|
|
For the transition period from ________________ to ________________
|
OR
|
o
|
SHELL COMPANY REPORT PURSUANT TO SECTION 13 OR 15(d) OF THE SECURITIES EXCHANGE ACT OF 1934
|
|
|
Date of event requiring this shell company report
|
Commission file number: 001-36582
AURIS MEDICAL HOLDING AG
(Exact name of Registrant as specified in its charter)
Switzerland
(Jurisdiction of incorporation)
Bahnhofstrasse 21
6300 Zug
Switzerland
(Address of principal executive offices)
Thomas Meyer
Tel: +41 (0)41 729 71 94
Bahnhofstrasse 21
6300 Zug
Switzerland
(Name, Telephone, E-mail and/or Facsimile number and Address of Company Contact Person)
Copies to:
Sophia Hudson
Davis Polk & Wardwell LLP
450 Lexington Avenue
New York, NY 10017
Phone: (212) 450 4000
Fax: (212) 701 5800
Securities registered or to be registered pursuant to Section 12(b) of the Act:
|
Title of each class
|
Name of each exchange on which registered
|
|
|
Common Shares, nominal value CHF 0.40 per share
|
The NASDAQ Stock Market LLC
|
Securities registered or to be registered pursuant to Section 12(g) of the Act:
None
(Title of Class)
Securities for which there is a reporting obligation pursuant to Section 15(d) of the Act:
None
(Title of Class)
Indicate the number of outstanding shares of each of the issuer’s classes of capital stock or common stock as of the close of the period covered by the annual report.
Common shares: 29,010,391
Indicate by check mark if the registrant is a well-known seasoned issuer, as defined in Rule 405 of the Securities Act.
o
Yes
x
No
If this report is an annual or transition report, indicate by check mark if the registrant is not required to file reports pursuant to Section 13 or
15(d) of the Securities Exchange Act of 1934.
o
Yes
x
No
Indicate by check mark whether the registrant (1) has filed all reports required to be filed by Section 13 or 15(d) of the Securities Exchange Act of 1934 during the preceding 12 months (or for such shorter period that the registrant was required to file such reports), and (2) has been subject to such filing requirements for the past 90 days.
x
Yes
o
No
Indicate by check mark whether the registrant has submitted electronically and posted on its corporate Web site, if any, every Interactive Data File required to be submitted and posted pursuant to Rule 405 of Regulation S-T during the preceding 12 months (or for such shorter period that the registrant was required to submit and post such files).
o
Yes
x
No
Indicate by check mark whether the registrant is a large accelerated filer, an accelerated filer, or a non-accelerated filer. See definition of “accelerated filer and large accelerated filer” in Rule 12b-2 of the Exchange Act. (Check one):
|
Large accelerated filer
o
|
Accelerated filer
o
|
Non-accelerated filer
x
|
Indicate by check mark which basis of accounting the registrant has used to prepare the financial statements included in this filing:
|
US GAAP
o
|
International Financial Reporting Standards as issued by the
International Accounting Standards Board x |
Other
o
|
If “Other” has been checked in response to the previous question indicate by check mark which financial statement item the registrant has elected to follow.
o
Item 17
o
Item 18
If this is an annual report, indicate by check mark whether the registrant is a shell company (as defined in Rule 12b-2 of the Exchange Act).
o
Yes
x
No
AURIS MEDICAL HOLDING AG
Page
Unless otherwise indicated or the context otherwise requires, all references in this annual report on Form 20-F (the “Annual Report”) to “Auris Medical Holding AG” or “Auris,” the “Company,” “we,” “our,” “ours,” “us” or similar terms refer to Auris Medical Holding AG (formerly Auris Medical AG), together with its subsidiaries. The trademarks, trade names and service marks appearing in this Annual Report are property of their respective owners.
The terms “dollar,” “USD” or “$” refer to U.S. dollars and the term “Swiss Franc” and “CHF” refer to the legal currency of Switzerland.
This Annual Report contains statements that constitute forward-looking statements. Many of the forward-looking statements contained in this Annual Report can be identified by the use of forward-looking words such as “anticipate,” “believe,” “could,” “expect,” “should,” “plan,” “intend,” “will,” “estimate” and “potential,” among others.
Forward-looking statements appear in a number of places in this Annual Report and include, but are not limited to, statements regarding our intent, belief or current expectations. Forward-looking statements are based on our management’s beliefs and assumptions and on information currently available to our management. Such statements are subject to risks and uncertainties, and actual results may differ materially from those expressed or implied in the forward-looking statements due to various factors, including, but not limited to, those identified under the section “Item 3. Key Information—D. Risk factors” in this Annual Report. These risks and uncertainties include factors relating to:
|
|
·
|
our operation as a development stage company with limited operating history and a history of operating losses;
|
|
|
·
|
our need for substantial additional funding before we can expect to become profitable from sales of our products;
|
|
|
·
|
our dependence on the success of AM-101 and AM-111, which are still in clinical development and may eventually prove to be unsuccessful;
|
|
|
·
|
the chance that we may become exposed to costly and damaging liability claims resulting from the testing of our product candidates in the clinic or in the commercial stage;
|
|
|
·
|
uncertainty surrounding whether any of our product candidates will receive regulatory approval, which is necessary before they can be commercialized;
|
|
|
·
|
if our product candidates obtain regulatory approval, our being subject to expensive ongoing obligations and continued regulatory overview;
|
|
|
·
|
enacted and future legislation may increase the difficulty and cost for us to obtain marketing approval and commercialization;
|
|
|
·
|
the chance that we do not obtain orphan drug exclusivity for AM-111, which would allow our competitors to sell products that treat the same conditions;
|
|
|
·
|
dependence on governmental authorities and health insurers establishing adequate reimbursement levels and pricing policies;
|
|
|
·
|
our products may not gain market acceptance, in which case we may not be able to generate product revenues;
|
|
|
·
|
our reliance on our current strategic relationships with INSERM or Xigen and the potential failure to enter into new strategic relationships;
|
|
|
·
|
our reliance on third parties to conduct our nonclinical and clinical trials and on third-party single-source suppliers to supply or produce our product candidates; and
|
|
|
·
|
other risk factors discussed under “Item 3. Key Information—D. Risk factors.”
|
Forward-looking statements speak only as of the date they are made, and we do not undertake any obligation to update them in light of new information or future developments or to release publicly any revisions to these statements in order to reflect later events or circumstances or to reflect the occurrence of unanticipated events.
Not applicable.
|
B.
|
Not applicable.
|
C.
|
Not applicable.
Not applicable.
Not applicable.
The following tables summarize our consolidated financial data as at the dates and for the periods indicated. The consolidated financial statement data as of December 31, 2014 and 2013 and for each of the three years in the period ended December 31, 2014 has been derived from our consolidated financial statements presented elsewhere in this Annual Report, which have been prepared in accordance with International Financial Reporting Standards as issued by the International Accounting Standards Board (“IFRS”). The consolidated financial data as of December 31, 2012 has been derived from our consolidated financial statements which are not presented herein.
This financial information should be read in conjunction with “Item 5—Operating and Financial Review and Prospects” and our consolidated audited financial statements, including the notes thereto, included in this Annual Report.
|
For the years ended December 31,
|
||||||||||||
|
2014
|
2013
|
2012
|
||||||||||
|
(in thousands of CHF except for share and per share data)
|
||||||||||||
|
Profit or Loss and Other Comprehensive Loss:
|
||||||||||||
|
Research and development
|
(17,705 | ) | (13,254 | ) | (3,987 | ) | ||||||
|
General and administrative
|
(4,489 | ) | (1,362 | ) | (624 | ) | ||||||
|
Operating loss
|
(22,194 | ) | (14,616 | ) | (4,611 | ) | ||||||
|
Finance expense
|
(208 | ) | (159 | ) | (2 | ) | ||||||
|
Finance income
|
4,216 | 76 | 10 | |||||||||
|
Loss before tax
|
(18,185 | ) | (14,699 | ) | (4,602 | ) | ||||||
|
Income tax expense
|
— | (306 | ) | — | ||||||||
|
Net loss attributable to owners of the Company
|
(18,185 | ) | (15,005 | ) | (4,602 | ) | ||||||
|
Other comprehensive income:
|
||||||||||||
|
Items that will never be reclassified to profit or loss:
|
||||||||||||
|
Remeasurements of defined benefits liability
|
(1,102 | ) | (58 | ) | (55 | ) | ||||||
|
Items that are or may be reclassified to profit or loss:
|
||||||||||||
|
Foreign currency translation differences
|
(105 | ) | 32 | 22 | ||||||||
|
Other comprehensive loss
|
(1,207 | ) | (26 | ) | (32 | ) | ||||||
|
Total comprehensive loss attributable to owners of the Company
|
(19,392 | ) | (15,031 | ) | (4,635 | ) | ||||||
|
Net loss per share(1)
|
||||||||||||
|
Net loss per share, basic and diluted(2)
|
(0.66 | ) | (1.01 | ) | (0.40 | ) | ||||||
|
Weighted-average number of shares used to compute net loss per common share, basic and diluted
|
27,692,494 | 14,917,064 | 11,581,450 | |||||||||
|
(1)
|
For periods prior to the closing of our initial public offering, net loss per share includes preferred shares, which were converted on a one-for-one basis upon the closing of our initial public offering. See Note 12 to our audited financial statements included elsewhere in this Annual Report.
|
|
(2)
|
Basic net loss per common share and diluted net loss per common share are the same because outstanding options and convertible loans (to the extent outstanding during the applicable time period) would be anti-dilutive due to our net loss in these periods.
|
|
As of December 31,
|
||||||||||||
|
2014
|
2013
|
2012
|
||||||||||
|
Statement of Financial Position Data:
|
(in thousands of CHF)
|
|||||||||||
|
Cash and cash equivalents
|
56,934 | 23,866 | 64 | |||||||||
|
Total assets
|
59,493 | 26,252 | 866 | |||||||||
|
Total liabilities
|
6,210 | 17,219 | 1,110 | |||||||||
|
Share capital
|
11,604 | 6,487 | 4,633 | |||||||||
|
Total shareholders’ equity attributable to owners of the Company
|
53,283 | 9,034 | (244 | ) | ||||||||
Exchange Rate Information
The following table sets forth, for the periods indicated, the high, low, average and period-end exchange rates for the purchase of U.S. dollars expressed in CHF per U.S. Dollar. The average rate is calculated by using the average of the U.S. Federal Reserve Bank’s reported exchange rates on each day during a monthly period and on the last day of each month during an annual period. On March 20, 2015, the exchange rate as reported by the U.S. Federal Reserve Bank was CHF 0.9766 to $1.00.
|
Period-end
|
Average for
period
|
Low
|
High
|
|||||||||||||
|
(CHF per U.S. dollar)
|
||||||||||||||||
|
Year Ended December 31:
|
||||||||||||||||
|
2010
|
0.9369 | 1.0264 | 0.9369 | 1.1614 | ||||||||||||
|
2011
|
0.9374 | 0.8802 | 0.7296 | 0.9755 | ||||||||||||
|
2012
|
0.9155 | 0.9314 | 0.8949 | 0.9957 | ||||||||||||
|
2013
|
0.8904 | 0.9241 | 0.8856 | 0.9814 | ||||||||||||
|
2014
|
0.9934 | 0.9195 | 0.8712 | 0.9934 | ||||||||||||
|
Month Ended:
|
||||||||||||||||
|
September 30, 2014
|
0.9554 | 0.9370 | 0.9186 | 0.9554 | ||||||||||||
|
October 31, 2014
|
0.9623 | 0.9528 | 0.9425 | 0.9670 | ||||||||||||
|
November 28, 2014
|
0.9658 | 0.9642 | 0.9572 | 0.9702 | ||||||||||||
|
December 31, 2014
|
0.9934 | 0.9753 | 0.9604 | 0.9934 | ||||||||||||
|
January 31, 2015
|
0.9210 | 0.9443 | 0.8488 | 1.0195 | ||||||||||||
|
February 28, 2015
|
0.9513 | 0.9361 | 0.9228 | 0.9540 | ||||||||||||
|
March, 2015 (through March 20, 2015)
|
0.9766 | 0.9876 | 0.9553 | 1.0074 | ||||||||||||
Not applicable.
Not applicable.
|
D.
|
You should carefully consider the risks and uncertainties described below and the other information in this Annual Report. Our business, financial condition or results of operations could be materially and adversely affected if any of these risks occurs, and as a result, the market price of our common shares could decline. This Annual Report also contains forward-looking statements that involve risks and uncertainties. See “Forward-Looking Statements.” Our actual results could differ materially and adversely from those anticipated in these forward-looking statements as a result of certain factors.
Risks Related to Our Business and Industry
We are a development stage company and have a limited operating history and a history of operating losses. We anticipate that we will continue to incur losses for the foreseeable future.
We are a development-stage biopharmaceutical company with limited operating history. Since inception, we have incurred significant operating losses. We incurred net losses (defined as net loss attributable to owners of the Company) of CHF 18.2 million, CHF 15.0 million and CHF 4.6 million for the years ended December 31, 2014, 2013 and 2012, respectively. As of December 31, 2014, we had an accumulated deficit of CHF 52.1 million.
Our losses have resulted principally from expenses incurred in research and development of our product candidates and from general and administrative expenses that we have incurred while building our business infrastructure. We expect to continue to incur significant operating losses in the future as we continue our research and development efforts for our product candidates in clinical development AM-101 and AM-111 and seek to obtain regulatory approval and commercialization of our product candidates. In our financial year ended December 31,
2014, we incurred CHF 17.7 million in research and development costs, and we expect that our total operating expense in 2015 will be in the range of CHF 25.0 to 30.0 million (excluding AM-111 clinical Phase 3 expenses to enroll patients in either REACH or HEALOS (each as defined below)).
To date, we have financed our operations through the initial public offering of our common shares, private placements of equity securities and short term loans. We have no products approved for commercialization and have never generated any revenues from product sales. Biopharmaceutical product development is a highly speculative undertaking and involves a substantial degree of risk. We are in the late stages of clinical development for our product candidates, but it may be several years, if ever, before we complete pivotal clinical trials and have a product candidate approved for commercialization and begin to generate revenues from product sales.
We have never generated any revenue from product sales and may never be profitable.
We have no products approved for commercialization and have never generated any revenue. Our ability to generate revenue and achieve profitability depends on our ability to successfully complete the development of, and obtain the marketing approvals necessary to commercialize, one or more of our product candidates. We do not anticipate generating revenue from product sales unless and until we obtain regulatory approval for, and commercialize, AM-101 or AM-111. Our ability to generate future revenue from product sales depends heavily on our success in many areas, including but not limited to:
|
|
·
|
completing research and clinical development of our product candidates, including successfully completing Phase 3 clinical trials of AM-101 or AM-111;
|
|
|
·
|
obtaining marketing approvals for our product candidates, including AM-101 or AM-111, for which we complete clinical trials;
|
|
|
·
|
developing a sustainable and scalable manufacturing process for any approved product candidates and maintaining supply and manufacturing relationships with third parties that can conduct the process and provide adequate (in amount and quality) products to support clinical development and the market demand for our product candidates, if approved;
|
|
|
·
|
launching and commercializing product candidates for which we obtain marketing approval, either directly or with a collaborator or distributor;
|
|
|
·
|
obtaining market acceptance of our product candidates as viable treatment options;
|
|
|
·
|
addressing any competing technological and market developments;
|
|
|
·
|
identifying, assessing, acquiring and/or developing new product candidates;
|
|
|
·
|
negotiating favorable terms in any collaboration, licensing, or other arrangements into which we may enter;
|
|
|
·
|
maintaining, protecting, and expanding our portfolio of intellectual property rights, including patents, trade secrets, and know-how; and
|
|
|
·
|
attracting, hiring, and retaining qualified personnel.
|
Even if one or more of the product candidates that we develop is approved for commercial sale, we anticipate incurring significant costs associated with commercializing any approved product candidate. Because of the numerous risks and uncertainties with pharmaceutical product development, we are unable to accurately predict the timing or amount of increased expenses or when, or if, we will be able to achieve profitability. Our expenses could increase beyond expectations if we are required by the U.S. Food and Drug Administration, or the FDA, the European Medicines Agency, or the EMA, or other regulatory agencies, domestic or foreign, to change our manufacturing processes, or to perform clinical, nonclinical, or other types of trials in addition to those that we currently anticipate. In cases where we are successful in obtaining regulatory approvals to market one or more of our product candidates, our revenue will be dependent, in part, upon the size of the markets in the territories for which we gain regulatory approval, the accepted price for the product, the ability to obtain coverage and reimbursement at any price, and whether we own the commercial rights for that territory. If the number of our addressable patients is not as significant as we estimate, the indication approved by regulatory authorities is narrower than we expect, or the
treatment population is narrowed by competition, physician choice or treatment guidelines, we may not generate significant revenue from sales of such products, even if approved. Additionally, if we are not able to generate sufficient revenue from the sale of any approved products, we may never become profitable.
We may be unable to develop and commercialize AM-101, AM-111 or any other product candidate and, even if we do, may never achieve profitability. Even if we do achieve profitability, we may not be able to sustain or increase profitability on a quarterly or annual basis. Our failure to become and remain profitable would decrease the value of our company and could impair our ability to raise capital, expand our business or continue our operations.
We expect that we will need substantial additional funding before we can expect to become profitable from sales of our products. If we are unable to raise capital when needed, we could be forced to delay, reduce or eliminate our product development programs or commercialization efforts.
We are currently advancing our product candidates AM-101 and AM-111 through clinical development. We expect our research and development expenses to increase in connection with our ongoing activities, particularly as we continue our ongoing and initiate new trials of AM-101 and AM-111 and initiate preclinical and clinical development of other product candidates. We expect that our total operating expense in 2015 will be in the range of CHF 25.0 to 30.0 million (excluding AM-111 clinical Phase 3 expenses to enroll patients in either REACH or HEALOS (each as defined below)). As of December 31, 2014, our cash and cash equivalents were CHF 56.9 million. We believe that our existing cash and cash equivalents will enable us to fund our operating expenses and capital expenditure requirements until at least fall 2016. We have based this estimate on assumptions that may prove to be wrong, and we could use our capital resources sooner than we currently expect. Our future funding requirements will depend on many factors, including but not limited to:
|
|
·
|
the scope, rate of progress, results and cost of our clinical trials, nonclinical testing, and other related activities;
|
|
|
·
|
the cost of manufacturing clinical supplies, and establishing commercial supplies, of our product candidates and any products that we may develop;
|
|
|
·
|
the number and characteristics of product candidates that we pursue;
|
|
|
·
|
the cost, timing, and outcomes of regulatory approvals;
|
|
|
·
|
the cost and timing of establishing sales, marketing, and distribution capabilities; and
|
|
|
·
|
the terms and timing of any collaborative, licensing, and other arrangements that we may establish, including any required milestone and royalty payments thereunder.
|
We expect that we will require additional funding to advance our late-stage AM-111 clinical program in 2015. In addition, we expect that we will require additional capital to commercialize our product candidates AM-101 and AM-111. If we receive regulatory approval for AM-101 or AM-111, and if we choose to not grant any licenses to partners, we expect to incur significant commercialization expenses related to product manufacturing, sales, marketing and distribution, depending on where we choose to commercialize. We also expect to continue to incur additional costs associated with operating as a public company. Additional funds may not be available on a timely basis, on favorable terms, or at all, and such funds, if raised, may not be sufficient to enable us to continue to implement our long-term business strategy. If we are not able to raise capital when needed, we could be forced to delay, reduce or eliminate our product development programs or commercialization efforts.
Raising additional capital may cause dilution to our shareholders, restrict our operations or require us to relinquish rights to our intellectual property or future revenue streams.
Until such time, if ever, as we can generate substantial product revenue, we expect to finance our cash needs through a combination of equity offerings, debt financings, grants and license and development agreements in connection with any collaborations. We do not have any committed external source of funds. In the event we need to seek additional funds we may raise additional capital through the sale of equity or convertible debt securities. In such an event, our shareholders’ ownership interests will be diluted, and the terms of these new securities may include liquidation or other preferences that adversely affect our shareholders’ rights as holders of our common
shares. Debt financing, if available, may involve agreements that include covenants limiting or restricting our ability to take specific actions, such as incurring additional debt, making capital expenditures or declaring dividends.
If we raise additional funds through collaborations, strategic alliances or marketing, distribution or licensing arrangements with third parties, we may have to relinquish valuable rights to our intellectual property or future revenue streams. If we are unable to raise additional funds when needed, we may be required to delay, limit, reduce or terminate our product development or future commercialization efforts or grant rights to develop and market product candidates that we would otherwise prefer to develop and market ourselves.
We have a limited operating history and no history of commercializing pharmaceutical products, which may make it difficult to evaluate the prospects for our future viability.
We began our current operations in 2003. Our operations to date have been limited to financing and staffing our company, developing our technology and developing AM-101, AM-111 and our other product candidates. We have not yet demonstrated an ability successfully to complete a large-scale, pivotal clinical trial, obtain marketing approval, manufacture a commercial scale product or conduct sales and marketing activities necessary for successful product commercialization. Consequently, predictions about our future success or viability may not be as accurate as they could be if we had a history of successfully developing and commercializing pharmaceutical products.
Risks Related to the Development and Clinical Testing of our Product Candidates
We depend entirely on the success of AM-101 and AM-111, which are still in clinical development. If our clinical trials are unsuccessful, we do not obtain regulatory approval or we are unable to commercialize AM-101 and AM-111, or we experience significant delays in doing so, our business, financial condition and results of operations will be materially adversely affected.
We currently have no products approved for sale and have invested a significant portion of our efforts and financial resources in the development of AM-101 and AM-111, which are still in clinical development. Our ability to generate product revenues, which we do not expect will occur for at least the next several years, if ever, will depend heavily on successful clinical development, obtaining regulatory approval and eventual commercialization of these product candidates. We currently generate no revenues from sales of any drugs, and we may never be able to develop or commercialize a marketable drug. The success of AM-101 and AM-111 will depend on several factors, including the following:
|
|
·
|
completing clinical trials that demonstrate the efficacy and safety of our product candidates;
|
|
|
·
|
receiving marketing approvals from applicable regulatory authorities;
|
|
|
·
|
establishing commercial manufacturing capabilities;
|
|
|
·
|
launching commercial sales, marketing and distribution operations;
|
|
|
·
|
acceptance of our product candidates by patients, the medical community and third-party payors,
|
|
|
·
|
a continued acceptable safety profile following approval;
|
|
|
·
|
competing effectively with other therapies; and
|
|
|
·
|
qualifying for, maintaining, enforcing and defending our intellectual property rights and claims.
|
If we do not achieve one or more of these factors in a timely manner or at all, we could experience significant delays or an inability to successfully commercialize AM-101 or AM-111, which would materially adversely affect our business, financial condition and results of operations.
Clinical drug development involves a lengthy and expensive process with uncertain timelines and uncertain outcomes, and results of earlier studies and trials may not be predictive of future trial results. If clinical trials of our product candidates are prolonged or delayed, we may be unable to obtain required regulatory approvals, and therefore be unable to commercialize our product candidates on a timely basis or at all.
To obtain the requisite regulatory approvals to market and sell any of our product candidates, we must demonstrate through extensive preclinical studies and clinical trials that our products are safe and effective in humans. Clinical testing is expensive and can take many years to complete, and its outcome is inherently uncertain. Failure can occur at any time during the clinical trial process. The results of preclinical studies and early clinical trials of our product candidates may not be predictive of the results of later-stage clinical trials. For example, the positive results generated to date in clinical trials for our product candidates do not ensure that later clinical trials will demonstrate similar results. Product candidates in later stages of clinical trials may fail to show the desired safety and efficacy traits despite having progressed through preclinical studies and initial clinical trials. A number of companies in the biopharmaceutical industry have suffered significant setbacks in advanced clinical trials due to lack of efficacy or adverse safety profiles, notwithstanding promising results in earlier trials. Our future clinical trial results may not be successful.
Clinical trials must be conducted in accordance with FDA, EMA and comparable foreign regulatory authorities’ legal requirements, regulations or guidelines, and are subject to oversight by these governmental agencies and Institutional Review Boards, or IRBs, at the medical institutions where the clinical trials are conducted. In addition, clinical trials must be conducted with supplies of our product candidates produced under current good manufacturing practices, or cGMP, and other requirements. We depend on medical institutions and clinical research organizations, or CROs, to conduct our clinical trials in compliance with current good clinical practice, or cGCP, standards. To the extent the CROs fail to enroll participants for our clinical trials, fail to conduct the trial to cGCP standards or are delayed for a significant time in the execution of trials, including achieving full enrollment, we may be affected by increased costs, program delays or both, which may harm our business.
To date, we have not completed all clinical trials required for the approval of any of our product candidates. AM-101 is in Phase 3 clinical development for acute inner ear tinnitus under a special protocol assessment, or SPA, from the FDA. The FDA held a pre-IND meeting with us in September 2014 and provided formal feedback and guidance on our pre-clinical and Chemistry, Manufacturing and Control, or CMC, development and specifically on our pivotal Phase 3 trial entitled Efficacy and Safety of AM-111 in the treatment of Acute Inner Ear Hearing Loss, or HEALOS. In response to this feedback, we are in the process of finalizing the design of HEALOS. In addition, the FDA opened an IND for our planned Phase 2/3 trial entitled Efficacy and Safety of AM-111 in the Treatment of Surgery-Induced Hearing Loss following Cochlear Implantation, or REACH. We plan to conduct REACH in the U.S., comparing a single 0.4 mg/mL dose of AM-111 to a placebo. If we obtain sufficient funding, we intend to start HEALOS in the second half of 2015 and REACH in 2016. The development of our other product candidates is less advanced and trials have not yet started.
The completion of clinical trials for our clinical product candidates may be delayed, suspended or terminated as a result of many factors, including but not limited to:
|
|
·
|
the delay or refusal of regulators or IRBs to authorize us to commence a clinical trial at a prospective trial site and changes in regulatory requirements, policies and guidelines;
|
|
|
·
|
delays or failure to reach agreement on acceptable terms with prospective CROs and clinical trial sites, the terms of which can be subject to extensive negotiation and may vary significantly among different CROs and trial sites;
|
|
|
·
|
delays in patient enrollment and variability in the number and types of patients available for clinical trials;
|
|
|
·
|
the inability to enroll a sufficient number of patients in trials to ensure adequate statistical power to detect statistically significant treatment effects;
|
|
|
·
|
negative or inconclusive results, which may require us to conduct additional preclinical or clinical trials or to abandon projects that we expect to be promising;
|
|
|
·
|
safety or tolerability concerns could cause us to suspend or terminate a trial if we find that the participants are being exposed to unacceptable health risks;
|
|
|
·
|
regulators or IRBs requiring that we or our investigators suspend or terminate clinical research for various reasons, including noncompliance with regulatory requirements or safety concerns, among others;
|
|
|
·
|
lower than anticipated retention rates of patients and volunteers in clinical trials;
|
|
|
·
|
our CROs or clinical trial sites failing to comply with regulatory requirements or meet their contractual obligations to us in a timely manner, or at all, deviating from the protocol or dropping out of a trial;
|
|
|
·
|
delays relating to adding new clinical trial sites;
|
|
|
·
|
difficulty in maintaining contact with patients after treatment, resulting in incomplete data;
|
|
|
·
|
delays in establishing the appropriate dosage levels;
|
|
|
·
|
the quality or stability of the product candidate falling below acceptable standards;
|
|
|
·
|
the inability to produce or obtain sufficient quantities of the product candidate to complete clinical trials; and
|
|
|
·
|
exceeding budgeted costs due to difficulty in accurately predicting costs associated with clinical trials.
|
Any delays in completing our clinical trials will increase our costs, slow down our product candidate development and approval process and jeopardize our ability to commence product sales and generate revenues. Any of these occurrences may harm our business, financial condition and prospects significantly. In addition, many of the factors that cause, or lead to, a delay in the commencement or completion of clinical trials may also ultimately lead to the denial of regulatory approval of our product candidates.
Positive or timely results from preclinical or early stage trials do not ensure positive or timely results in late stage clinical trials or product approval by the FDA, the EMA or comparable foreign regulatory authorities. Products that show positive preclinical or early clinical results may not show sufficient safety or efficacy in later stage clinical trials and therefore may fail to obtain regulatory approvals. For example, although AM-101 achieved favorable results in our Phase 2 efficacy trial, we may nonetheless fail to achieve success in Phase 3 clinical trials of AM-101. In addition, preclinical and clinical data are often susceptible to varying interpretations and analyses. Many companies that believed their product candidates performed satisfactorily in preclinical studies and clinical trials have nonetheless failed to obtain marketing approval for the product candidates. The FDA, the EMA and comparable foreign regulatory authorities have substantial discretion in the approval process and in determining when or whether regulatory approval will be obtained for any of our product candidates. Even if we believe the data collected from clinical trials of our product candidates are promising, such data may not be sufficient to support approval by the FDA, the EMA or any other regulatory authority.
In some instances, there can be significant variability in safety and/or efficacy results between different trials of the same product candidate due to numerous factors, including changes in trial procedures set forth in protocols, differences in the size and type of the patient populations, adherence to the dosing regimen and other trial protocols and the rate of dropout among clinical trial participants. In the case of our late stage clinical product candidates, results may differ in general on the basis of the larger number of clinical trial sites and additional countries and languages involved in Phase 3 clinical trials.
In the case of AM-101 our endpoints in Phase 3 clinical trials are based on patient reported outcomes, some of which are captured daily from trial participants with electronic diaries. We have no assurance and cannot rely on past experience that the high frequency of questioning is not influencing the measured outcome. In addition, low compliance with daily reporting requirements may impact the trials’ validity or statistical power. Under the SPA with the FDA we agreed to use the Tinnitus Functional Index, or TFI, as a co-primary efficacy endpoint in the TACTT2 trial; we also use the questionnaire as a secondary efficacy endpoint in the TACTT3 trial. We used a different tinnitus questionnaire in the previous clinical trials with AM-101 (Tinnitus Handicap Inventory 12, THI-12). Unlike the THI-12, the TFI was developed and validated broadly in accordance with the FDA’s guidance for
patient-reported outcome measures and with the explicit aim of measuring treatment-related changes in tinnitus. In addition, the TFI covers all important domains of negative tinnitus impact including sleep difficulties, whereas the THI-12 does not include any sleep-related item. However, in spite of the methodological superiority of the TFI, there is no assurance that outcomes with the TFI will be qualitatively and quantitatively similar or the same as those that would result with the THI-12. In the case of AM-111 we are evaluating the safety and efficacy in an idiopathic condition which implies a considerable heterogeneity in the etiology and natural history of the condition. This may have an impact on the safety and efficacy outcomes of our Phase 3 clinical trial. In addition, we extended the time window for enrollment into the study, from up to 48 hours to up to 72 hours, in response to results from the Phase 2 trial showing an increasing treatment effect the later the treatment was given. This was due to declining spontaneous recovery rates while the effects with active treatment held steady. Although spontaneous recovery is expected to decline further between 48 and 72 hours, we have no assurance that improvement achieved with the active treatment will remain stable. We cannot assure you that any Phase 2, Phase 3 or other clinical trials that we may conduct will demonstrate consistent or adequate efficacy and safety to obtain regulatory approval to market our product candidates.
If we are required to conduct additional clinical trials or other testing of AM-101, AM-111 or any other product candidate that we develop beyond the trials and testing that we contemplate, if we are unable to successfully complete clinical trials of our product candidates or other testing, if the results of these trials or tests are unfavorable or are only modestly favorable or if there are safety concerns associated with AM-101, AM-111 or our other product candidates, we may:
|
|
·
|
be delayed in obtaining marketing approval for our product candidates;
|
|
|
·
|
not obtain marketing approval at all;
|
|
|
·
|
obtain approval for indications or patient populations that are not as broad as intended or desired;
|
|
|
·
|
obtain approval with labeling that includes significant use or distribution restrictions or significant safety warnings, including boxed warnings;
|
|
|
·
|
be subject to additional post-marketing testing or other requirements; or
|
|
|
·
|
remove the product from the market after obtaining marketing approval.
|
Our product development costs will also increase if we experience delays in testing or marketing approvals and we may be required to obtain additional funds to complete clinical trials. We cannot assure you that our clinical trials will begin as planned or be completed on schedule, if at all, or that we will not need to restructure our trials after they have begun. Significant clinical trial delays also could shorten any periods during which we may have the exclusive right to commercialize our product candidates or allow our competitors to bring products to market before we do or shorten any periods during which we have the exclusive right to commercialize our product candidates, which may harm our business and results of operations. In addition, some of the factors that cause, or lead to, clinical trial delays may ultimately lead to the denial of regulatory approval of AM-101, AM-111 or any other product candidate.
If serious adverse, undesirable or unacceptable side effects are identified during the development of our product candidates or following approval, if any, we may need to abandon our development of such product candidates, the commercial profile of any approved label may be limited, or we may be subject to other significant negative consequences following marketing approval, if any.
If our product candidates are associated with serious adverse, undesirable or unacceptable side effects, we may need to abandon their development or limit development to certain uses or sub-populations in which such side effects are less prevalent, less severe or more acceptable from a risk-benefit perspective. Many compounds that initially showed promise in preclinical or early stage testing have later been found to cause side effects that restricted their use and prevented further development of the compound for larger indications.
In our clinical trials of AM-101 and AM-111 to date, adverse events have included procedure-related transient changes in tinnitus loudness, muffled hearing, ear discomfort or pain, incision site complications, and middle ear infections. A limited number of serious adverse events were observed (in 2.4% of patients enrolled in the AM-101
Phase 2 program and in 4.5% of patients in the AM-111 Phase 2 study); all (AM-101) or most (AM-111) were considered unrelated or unlikely related to the treatment. Occurrence of serious procedure-or treatment-related side effects could impede clinical trial enrollment and receipt of marketing approval from the FDA, the EMA and comparable foreign regulatory authorities. They could also adversely affect physician or patient acceptance of our product candidates.
Additionally if one or more of our product candidates receives marketing approval, and we or others later identify undesirable side effects caused by such products, a number of potentially significant negative consequences could result, including:
|
|
·
|
regulatory authorities may withdraw approvals of such product;
|
|
|
·
|
regulatory authorities may require additional warnings on the label;
|
|
|
·
|
we may be required to create a medication guide outlining the risks of such side effects for distribution to patients;
|
|
|
·
|
we could be sued and held liable for harm caused to patients; and
|
|
|
·
|
our reputation and physician or patient acceptance of our products may suffer.
|
Any of these events could prevent us from achieving or maintaining market acceptance of the particular product candidate, if approved, and could significantly harm our business, results of operations and prospects.
We depend on enrollment of patients in our clinical trials for our product candidates. If we are unable to enroll patients in our clinical trials, our research and development efforts could be materially adversely affected.
Successful and timely completion of clinical trials will require that we enroll a sufficient number of patient candidates. Trials may be subject to delays as a result of patient enrollment taking longer than anticipated or patient withdrawal. Patient enrollment depends on many factors, including the size and nature of the patient population, eligibility criteria for the trial, the proximity of patients to clinical sites, the design of the clinical protocol, the availability of competing clinical trials, the availability of new drugs approved for the indication the clinical trial is investigating, and clinicians’ and patients’ perceptions as to the potential advantages of the drug being studied in relation to other available therapies. In our Phase 3 clinical trials of AM-101, we seek to enroll patients with acute inner ear tinnitus, meaning patients with symptom duration of three months or less, due to traumatic injury to their cochlea or otitis media. Thus, we must identify, recruit, enroll and dose patients with tinnitus caused by a pre-determined universe of factors in a limited time frame. Our product candidate AM-111, which is intended for patients with acute inner ear hearing loss, which is also known as acute sensorineural hearing loss or ASNHL, has orphan drug designation for the treatment of ASNHL, which means that the potential patient ,population is more limited. In our late stage clinical program with AM-111 we anticipate that the enrollment window will be 72 hours from onset, meaning that we must enroll patients in a short time frame.
The specific target population of patients and therapeutic time windows may make it difficult for us to enroll enough patients to complete our clinical trials in a timely and cost-effective manner. Delays in the completion of any clinical trial of our product candidates will increase our costs, slow down our product candidate development and approval process and delay or potentially jeopardize our ability to commence product sales and generate revenue. In addition, many of the factors that cause, or lead to, a delay in the commencement or completion of clinical trials may also ultimately lead to the denial of regulatory approval of our product candidates.
We may become exposed to costly and damaging liability claims, either when testing our product candidates in the clinic or at the commercial stage; and our product liability insurance may not cover all damages from such claims.
We are exposed to potential product liability and professional indemnity risks that are inherent in the research, development, manufacturing, marketing and use of pharmaceutical products. Currently we have no products that have been approved for commercial sale; however, the current and future use of product candidates by us in clinical trials, and the sale of any approved products in the future, may expose us to liability claims. These claims might be made by patients that use the product, healthcare providers, pharmaceutical companies or others selling such products. Any claims against us, regardless of their merit, could be difficult and costly to defend and could
materially adversely affect the market for our product candidates or any prospects for commercialization of our product candidates.
Although the clinical trial process is designed to identify and assess potential side effects, it is always possible that a drug, even after regulatory approval, may exhibit unforeseen side effects. If any of our product candidates were to cause adverse side effects during clinical trials or after approval of the product candidate, we may be exposed to substantial liabilities. Physicians and patients may not comply with any warnings that identify known potential adverse effects and patients who should not use our product candidates.
We purchase liability insurance in connection with each of our clinical trials. It is possible that our liabilities could exceed our insurance coverage. We intend to expand our insurance coverage to include the sale of commercial products if we obtain marketing approval for any of our product candidates. However, we may not be able to maintain insurance coverage at a reasonable cost or obtain insurance coverage that will be adequate to satisfy any liability that may arise. If a successful product liability claim or series of claims is brought against us for uninsured liabilities or in excess of insured liabilities, our assets may not be sufficient to cover such claims and our business operations could be impaired.
Should any of the events described above occur, this could have a material adverse effect on our business, financial condition and results of operations.
We have obtained orphan drug designation for AM-111 for the treatment of ASNHL by the FDA and the EMA, and we may rely on obtaining and maintaining orphan drug exclusivity for AM-111, if approved. Orphan drug designation may not ensure that we will enjoy market exclusivity in a particular market, and if we fail to obtain or maintain orphan drug exclusivity for AM-111, we may be subject to earlier competition and our potential revenue will be reduced.
AM-111 has been granted orphan drug designation for the treatment of ASNHL by the FDA and EMA. Under the Orphan Drug Act, the FDA may designate a product as an orphan drug if it is intended to treat a rare disease or condition, defined as a patient population of fewer than 200,000 in the United States, or a patient population greater than 200,000 in the United States where there is no reasonable expectation that the cost of developing the drug will be recovered from sales in the United States. In the European Union, the EMA’s Committee for Orphan Medicinal Products, or COMP, grants orphan drug designation to promote the development of products that are intended for the diagnosis, prevention, or treatment of a life-threatening or chronically debilitating condition affecting not more than five in 10,000 persons in the European Union. Additionally, designation is granted for products intended for the diagnosis, prevention, or treatment of a life-threatening, seriously debilitating or serious and chronic condition when, without incentives, it is unlikely that sales of the drug in the European Union would be sufficient to justify the necessary investment in developing the drug or biological product or where there is no satisfactory method of diagnosis, prevention, or treatment, or, if such a method exists, the medicine must be of significant benefit to those affected by the condition.
In the United States, orphan drug designation entitles a party to financial incentives such as opportunities for grant funding towards clinical trial costs, tax advantages and user-fee waivers. In addition, if a product receives the first FDA approval for the indication for which it has orphan designation, the product is entitled to orphan drug exclusivity, which means the FDA may not approve any other application to market the same drug for the same indication for a period of seven years, except in limited circumstances, such as a showing of clinical superiority over the product with orphan exclusivity or where the manufacturer is unable to assure sufficient product quantity. In the European Union, orphan drug designation entitles a party to financial incentives such as reduction of fees or fee waivers and ten years of market exclusivity following drug or biological product approval. This period may be reduced to six years if the orphan drug designation criteria are no longer met, including where it is shown that the product is sufficiently profitable not to justify maintenance of market exclusivity.
Even though we have obtained orphan drug designation for AM-111 for the treatment of ASNHL in the United States and Europe, we may not be the first to obtain marketing approval for any particular orphan indication due to the uncertainties associated with developing pharmaceutical products. Further, even if we obtain orphan drug designation for a product, that exclusivity may not effectively protect the product from competition because different drugs with different active moieties can be approved for the same condition. Orphan drug designation neither shortens the development time or regulatory review time of a drug nor gives the drug any advantage in the regulatory review or approval process.
Due to our limited resources and access to capital, we must and have in the past decided to prioritize development of certain product candidates; these decisions may prove to have been wrong and may adversely affect our revenues.
Because we have limited resources and access to capital to fund our operations, we must decide which product candidates to pursue and the amount of resources to allocate to each. As such, we are currently primarily focused on the development of AM-101 and AM-111 for the treatment of acute inner ear tinnitus and acute inner ear hearing loss, respectively. Our decisions concerning the allocation of research, collaboration, management and financial resources toward particular compounds, product candidates or therapeutic areas may not lead to the development of viable commercial products and may divert resources away from better opportunities. Similarly, our potential decisions to delay, terminate or collaborate with third parties in respect of certain product development programs may also prove not to be optimal and could cause us to miss valuable opportunities. If we make incorrect determinations regarding the market potential of our product candidates or misread trends in the biopharmaceutical industry, in particular for inner ear disorders, our business, financial condition and results of operations could be materially adversely affected.
Our research and development activities could be affected or delayed as a result of possible restrictions on animal testing.
Certain laws and regulations require us to test our product candidates on animals before initiating clinical trials involving humans. Animal testing activities have been the subject of controversy and adverse publicity. Animal rights groups and other organizations and individuals have attempted to stop animal testing activities by pressing for legislation and regulation in these areas and by disrupting these activities through protests and other means. To the extent the activities of these groups are successful, our research and development activities may be interrupted, delayed or become more expensive.
Risks Related to Regulatory Approval of our Product Candidates
We cannot give any assurance that any of our product candidates will receive regulatory approval, which is necessary before they can be commercialized.
Our future success is dependent on our ability to successfully develop, obtain regulatory approval for, and then successfully commercialize one or more product candidates. We currently have two product candidates that have completed Phase 2 clinical trials. AM-101 is in Phase 3 clinical development for acute inner ear tinnitus under a SPA from the FDA and based on scientific advice from the EMA. For HEALOS, we received protocol assistance from the EMA and feedback from the FDA through a pre-IND meeting in September 2014. In response to this feedback, we are in the process of finalizing the design of HEALOS. In addition, the FDA opened an IND for REACH. We plan to conduct REACH in the U.S., comparing a single 0.4 mg/mL dose of AM-111 to a placebo. If we obtain sufficient funding, we intend to start HEALOS in the second half of 2015 and REACH in 2016. We are not permitted to market or promote any of our product candidates before we receive regulatory approval from the FDA, EMA or comparable foreign regulatory authorities, and we may never receive such regulatory approval for any of our product candidates.
Although certain of our employees have prior experience with submitting marketing applications to the FDA, EMA or comparable foreign regulatory authorities, we as a company have not submitted such applications for our product candidates. We cannot be certain that any of our product candidates will be successful in clinical trials or receive regulatory approval. Applications for our product candidates could fail to receive regulatory approval for many reasons, including but not limited to the following:
|
|
·
|
the FDA, EMA or comparable foreign regulatory authorities may disagree with the design or implementation of our clinical trials;
|
|
|
·
|
the population studied in the clinical program may not be sufficiently broad or representative to assure safety in the full population for which we seek approval;
|
|
|
·
|
the FDA, EMA or comparable foreign regulatory authorities may disagree with our interpretation of data from nonclinical trials or clinical trials;
|
|
|
·
|
the data collected from clinical trials of our product candidates may not be sufficient to support the submission of a new drug application, or NDA, or other submission or to obtain regulatory approval in the United States or elsewhere;
|
|
|
·
|
we may be unable to demonstrate to the FDA, EMA or comparable foreign regulatory authorities that a product candidate’s risk-benefit ratio for its proposed indication is acceptable;
|
|
|
·
|
the FDA, EMA or other regulatory authorities may fail to approve the manufacturing processes, test procedures and specifications, or facilities of third-party manufacturers with which we contract for clinical and commercial supplies; and
|
|
|
·
|
the approval policies or regulations of the FDA, EMA or comparable foreign regulatory authorities may significantly change in a manner rendering our clinical data insufficient for approval.
|
In addition, no product for the treatment of acute inner ear tinnitus or acute inner ear hearing loss has been approved by the FDA or the EMA. Accordingly, our current product candidates or any of our other future product candidates could take a significantly longer time to gain regulatory approval than expected or may never gain regulatory approval. This could delay or eliminate any potential product revenue by delaying or terminating the potential commercialization of our product candidates.
We generally plan to seek regulatory approval to commercialize our product candidates in the United States, the European Union and in additional foreign countries where we have commercial rights. To obtain regulatory approval in other countries, we must comply with numerous and varying regulatory requirements of such other countries regarding safety, efficacy, chemistry, manufacturing and controls, clinical trials, commercial sales, pricing, and distribution of our product candidates. Even if we are successful in obtaining approval in one jurisdiction, we cannot ensure that we will obtain approval in any other jurisdictions. Failure to obtain marketing authorization for our product candidates will result in our being unable to market and sell such products, which would materially adversely affect our business, financial conditional and results of operation. If we fail to obtain approval in any jurisdiction, the geographic market for our product candidates could be limited. Similarly, regulatory agencies may not approve the labeling claims that are necessary or desirable for the successful commercialization of our product candidates.
Because we are developing therapies for which there is little clinical experience and, in some cases, using new endpoints, there is more risk that the outcome of our clinical trials will not be favorable. Even if the results of our trials are favorable, there is risk that they will not be acceptable to regulators or physicians.
There are currently no drugs with proven efficacy for acute inner ear tinnitus or acute inner ear hearing loss. In addition, there has been limited historical clinical trial experience generally for the development of drugs to treat these conditions. Regulatory authorities in the United States and European Union have not issued definitive guidance as to how to measure the efficacy of treatments for acute inner ear tinnitus or acute inner ear hearing loss, and regulators have not yet established what is required to be demonstrated in a clinical trial in order to signify a clinically meaningful result and/or obtain marketing approval. We have designed our Phase 3 trials for AM-101 and AM-111 to include endpoints that we believe are clinically justified and meaningful. With regard to AM-101, the EMA indicated that a statistically significant improvement in tinnitus loudness that is supported by several secondary variables would demonstrate a clinically meaningful result. The FDA indicated that an improvement in tinnitus loudness supported by a co-primary efficacy point, such as the TFI questionnaire, would be clinically meaningful. However, no product has been approved for marketing based upon such guidance and we cannot be certain that AM-101 will be approved even if it were to demonstrate such results in its Phase 3 trial. With regard to AM-111, the FDA and EMA have indicated that a 10 dB improvement in hearing thresholds is clinically significant, in line with clinical practice. However, no product has been approved for marketing based upon such guidance and we cannot be certain that AM-111 will be approved even if it were to demonstrate such results in its Phase 3 trial.
Safety issues with isomers of our product candidates or with approved products of third parties that are similar to our product candidates, could delay or prevent the regulatory approval process or result in restrictions on labeling.
Discovery of previously unknown problems, or increased focus on a known problem, with an approved product may result in restrictions on its permissible uses, including withdrawal of the medicine from the market. Esketamine,
the active substance of AM-101, is an isomer of Ketamine, and may be affected by the safety of the drugs related to them. Although Ketamine has been used successfully in patients for many years, newly observed toxicities or worsening of known toxicities, in preclinical studies of, or in patients receiving, Ketamine, or reconsideration of known toxicities of Ketamine in the setting of new indications, could result in increased regulatory scrutiny of AM-101. For example, Ketamine is regulated by the Drug Enforcement Administration, or DEA, under the Controlled Substances Act as a Schedule III drug. DEA scheduling is a separate process that can delay when a drug may become available to patients beyond an NDA approval date, and the timing and outcome of such DEA process is uncertain. Although we have observed no abuse liability associated with AM-101 to date, if AM-101 were to be scheduled under the Controlled Substances Act, such scheduling could negatively impact the ability or willingness of physicians to prescribe AM-101 and our ability to commercialize it.
Our special protocol assessment agreement with the FDA for our Phase 3 study of AM-101 does not guarantee any particular outcome from regulatory review, including ultimate approval and may not lead to a faster development or regulatory review or approval process.
We have obtained agreement from the FDA on a SPA for the design of our U.S. Phase 3 trial of AM-101. We also designed our Phase 3 clinical trials for AM-101 based on scientific advice that we received from the EMA. The FDA’s SPA process is designed to facilitate the FDA’s review and approval of drugs by allowing the FDA to evaluate the proposed design and size of Phase 3 clinical trials that are intended to form the primary basis for determining a drug product’s efficacy. Upon specific request by a clinical trial sponsor, the FDA will evaluate the protocol and respond to a sponsor’s questions regarding, among other things, primary efficacy endpoints, trial conduct and data analysis, within 45 days of receipt of the request. The FDA ultimately assesses whether the protocol design and planned analysis of the trial are acceptable to support regulatory approval of the product candidate with respect to the effectiveness of the indication studied. All agreements and disagreements between the FDA and the sponsor regarding a SPA must be clearly documented in a SPA letter or the minutes of a meeting between the sponsor and the FDA. However, a SPA agreement does not guarantee approval of a product candidate, and even if the FDA agrees to the design, execution, and analysis proposed in protocols reviewed under the SPA process, the FDA may revoke or alter its agreement in certain circumstances. In particular, a SPA agreement is not binding on the FDA if public health concerns emerge that were unrecognized at the time of the SPA agreement, other new scientific concerns regarding product safety or efficacy arise, the sponsor company fails to comply with the agreed upon trial protocols, or the relevant data, assumptions or information provided by the sponsor in a request for the SPA change or are found to be false or omit relevant facts. In addition, even after a SPA agreement is finalized, the SPA agreement may be modified, and such modification will be deemed binding on the FDA review division, except under the circumstances described above, if the FDA and the sponsor agree in writing to modify the protocol and such modification is intended to improve the study. The FDA retains significant latitude and discretion in interpreting the terms of the SPA agreement and the data and results from any study that is the subject of the SPA agreement.
We cannot assure you that our Phase 3 clinical trial of AM-101 will succeed, will be deemed binding by the FDA under our SPA, or will result in any FDA approval for AM-101. The TACTT2 Phase 3 clinical trial is being primarily conducted in the United States and Canada and is expected to enroll a total of approximately 330 patients. We expect that the FDA will review our compliance with the protocol under our SPA agreement and that it will conduct inspections of some of the approximately 60 sites where the trial will be conducted. We cannot assure you that each of the clinical trial sites will pass such FDA inspections, and negative inspection results could significantly delay or prevent any potential approval for AM-101. If the FDA revokes or alters its agreement under the SPA, or interprets the data collected from the clinical trial differently than we do, the FDA may not deem the data sufficient to support an application for regulatory approval, which could materially adversely affect our business, financial condition and results of operations. A revocation or alteration in our existing SPA could significantly delay or prevent approval of our application. Our SPA with the FDA and the scientific advice from the EMA does not ensure that AM-101 will receive marketing approval or that the approval process will be faster than conventional regulatory procedures.
We do not have control over the actual number of study participants that are willing and eligible for enrollment in the open label follow-on safety studies, AMPACT1 and AMPACT2. Hence, the number of patients with safety data may fail to reach the levels specified and requested by the FDA.
The FDA has requested from us safety data from chronic intermittent use of AM-101 by a minimum of 300 patients treated for six months and a minimum of 100 patients treated for one year, to support a new drug application
filing for AM-101 in the treatment of acute peripheral tinnitus. We are seeking to address this request by offering all participants completing the TACTT2 and TACTT3 studies and continuing to meet certain criteria the option to roll over into an open label follow-on safety study (AMPACT1 and AMPACT2, respectively) and receive up to three treatment cycles with AM-101 over a period of up to nine months. Together with the three month TACTT study duration, this would cover up to 12 months of exposure. Although we believe that a substantial number of TACTT study participants will be willing and eligible for enrollment into the AMPACT studies, we have no control over the actual number and over the number of treatment cycles that the AMPACT participants will choose. Hence the number of patients with safety data over six months and over 12 months may or may not fail to reach the levels specified and requested by the FDA. In case of insufficient numbers, this will become a review issue at the time of the NDA. Although we plan to apply for an indication of acute inner ear tinnitus, rather than chronic inner ear tinnitus, we cannot ensure that the FDA will be satisfied with the data supporting our NDA if we are not able to enroll sufficient numbers of patients in AMPACT1 and AMPACT2.
Even if our product candidates obtain regulatory approval, we will be subject to ongoing obligations and continued regulatory review, which may result in significant additional expense. Additionally, our product candidates, if approved, could be subject to labeling and other restrictions and market withdrawal and we may be subject to penalties if we fail to comply with regulatory requirements or experience unanticipated problems with our products.
If marketing authorization is obtained for any of our product candidates, the product will remain subject to continual regulatory review and therefore authorization could be subsequently withdrawn or restricted. Any regulatory approvals that we receive for our product candidates may also be subject to limitations on the approved indicated uses for which the product may be marketed or to the conditions of approval, or contain requirements for potentially costly post-marketing testing, including Phase 4 clinical trials and surveillance to monitor the safety and efficacy of the product candidate. In addition, if the FDA or a comparable foreign regulatory authority approves any of our product candidates, we will be subject to ongoing regulatory obligations and oversight by regulatory authorities, including with respect to the manufacturing processes, labeling, packing, distribution, adverse event reporting, storage, advertising and marketing restrictions, and recordkeeping and, potentially, other post-marketing obligations, all of which may result in significant expense and limit our ability to commercialize such products. These requirements include submissions of safety and other post-marketing information and reports, registration, as well as continued compliance with cGMPs and cGCPs for any clinical trials that we conduct post-approval. Later discovery of previously unknown problems with a product, including adverse events of unanticipated severity or frequency, or with our third-party manufacturers or manufacturing processes, or failure to comply with regulatory requirements, may result in, among other things:
|
|
·
|
restrictions on the marketing or manufacturing of the product, withdrawal of the product from the market, or voluntary or mandatory product recalls;
|
|
|
·
|
fines, warning letters or holds on clinical trials;
|
|
|
·
|
refusal by the FDA to approve pending applications or supplements to approved applications filed by us, or suspension or revocation of product license approvals;
|
|
|
·
|
product seizure or detention, or refusal to permit the import or export of products; and
|
|
|
·
|
injunctions or the imposition of civil or criminal penalties.
|
If any of these events occurs, our ability to sell such product may be impaired, and we may incur substantial additional expense to comply with regulatory requirements, which could materially adversely affect our business, financial condition and results of operations. The FDA’s policies may change and additional government regulations may be enacted that could prevent, limit or delay regulatory approval of our product candidates. If we are slow or unable to adapt to changes in existing requirements or the adoption of new requirements or policies, or if we are not able to maintain regulatory compliance, we may lose any marketing approval that we may have obtained, which would adversely affect our business, prospects and ability to achieve or sustain profitability.
Enacted and future legislation may increase the difficulty and cost for us to obtain marketing approval of and commercialize our product candidates and may affect the prices we may set.
In the United States and the European Union, there have been a number of legislative and regulatory changes and proposed changes regarding the healthcare system. These changes could prevent or delay marketing approval of our product candidates, restrict or regulate post-approval activities and affect our ability to profitably sell any products for which we obtain marketing approval.
In the United States, the Medicare Prescription Drug, Improvement, and Modernization Act of 2003, or the Medicare Modernization Act, changed the way Medicare covers and pays for pharmaceutical products. The legislation expanded Medicare coverage for drug purchases by the elderly and introduced a new reimbursement methodology based on average sale prices for physician-administered drugs. In addition, this legislation provided authority for limiting the number of drugs that will be covered in any therapeutic class. Cost-reduction initiatives and other provisions of this legislation could decrease the coverage and price that we receive for any approved products. While the Medicare Modernization Act applies only to drug benefits for Medicare beneficiaries, private payors often follow Medicare coverage policy and payment limitations in setting their own reimbursement rates. Therefore, any reduction in reimbursement that results from the Medicare Modernization Act may result in a similar reduction in payments from private payors.
More recently, in March 2010, President Obama signed into law the Patient Protection and Affordable Care Act, as amended by the Health Care and Education Reconciliation Act, or collectively, the Health Care Reform Law, a sweeping law intended to broaden access to health insurance, reduce or constrain the growth of healthcare spending, enhance remedies against fraud and abuse, add new transparency requirements for health care and health insurance industries, impose new taxes and fees on the health industry and impose additional health policy reforms. The Health Care Reform Law, among other things, increased rebates a manufacturer must pay to the Medicaid program, addressed a new methodology by which rebates owed by manufacturers under the Medicaid Drug Rebate Program are calculated for drugs that are inhaled, infused, instilled, implanted or injected, established a new Medicare Part D coverage gap discount program, in which manufacturers must provide 50% point-of-sale discounts on products covered under Part D and implemented payment system reforms including a national pilot program on payment bundling to encourage hospitals, physicians and other providers to improve the coordination, quality and efficiency of certain healthcare services through bundled payment models. Further, the new law imposed a significant annual fee on companies that manufacture or import branded prescription drug products. Substantial new provisions affecting compliance were enacted, which may affect our business practices with health care practitioners. Although we will not know the full effects of the Health Care Reform Law until applicable federal and state agencies issue regulations or guidance under the new law, the new law appears likely to continue the pressure on pharmaceutical pricing and may also increase our regulatory burdens and operating costs.
Moreover, other legislative changes have also been proposed and adopted in the United States since the Health Care Reform Law was enacted. On August 2, 2011, the Budget Control Act of 2011, among other things, created measures for spending reductions by Congress. A Joint Select Committee on Deficit Reduction, tasked with recommending a targeted deficit reduction of at least $1.2 trillion for the years 2013 through 2021, was unable to reach required goals, thereby triggering the legislation’s automatic reduction to several government programs. This includes aggregate reductions to Medicare payments to providers of 2% per fiscal year, which went into effect on April 1, 2013. On January 2, 2013, President Obama signed into law the American Taxpayer Relief Act of 2012, or the ATRA, which, among other things, further reduced Medicare payments to several providers, including hospitals, imaging centers and cancer treatment centers, and increased the statute of limitations period for the government to recover overpayments to providers from three to five years. These new laws may result in additional reductions in Medicare and other health care funding, which could have a material adverse effect on our customers and accordingly, our financial operations.
In the European Union, proposed new clinical trial regulations will centralize clinical trial approval, which eliminates redundancy, but in some cases this may extend timelines for clinical trial approvals due to potentially longer wait times. Proposals to require specific consents for use of data in research, among other measures, may increase the costs and timelines for our product development efforts. Austerity measures in certain European nations may also affect the prices we are able to seek if our products are approved, as discussed below.
Both in the United States and in the European Union, legislative and regulatory proposals have been made to expand post-approval requirements and restrict sales and promotional activities for pharmaceutical products. We do
not know whether additional legislative changes will be enacted, or whether the regulations, guidance or interpretations will be changed, or what the impact of such changes on the marketing approvals of our product candidates, if any, may be.
Our relationships with customers and payors will be subject to applicable anti-kickback, fraud and abuse and other healthcare laws and regulations, which, if violated, could expose us to criminal sanctions, civil penalties, exclusion from government healthcare programs, contractual damages, reputational harm and diminished profits and future earnings.
Healthcare providers, physicians and others play a primary role in the recommendation and prescription of any products for which we obtain marketing approval. Our future arrangements with third-party payors and customers may expose us to broadly applicable fraud and abuse and other healthcare laws and regulations, primarily in the United States, that may constrain the business or financial arrangements and relationships through which we market, sell and distribute our products for which we obtain marketing approval. Restrictions under applicable healthcare laws and regulations, include the following:
|
|
·
|
the U.S. healthcare anti-kickback statute prohibits, among other things, persons from knowingly and willfully soliciting, offering, receiving or providing remuneration, directly or indirectly, in cash or in kind, to induce or reward either the referral of an individual for, or the purchase, order or recommendation of, any good or service, for which payment may be made under U.S. government healthcare programs such as Medicare and Medicaid;
|
|
|
·
|
the U.S. False Claims Act imposes criminal and civil penalties, including civil whistleblower or qui tam actions, against individuals or entities for knowingly presenting, or causing to be presented, to the U.S. government, claims for payment that are false or fraudulent or making a false statement to avoid, decrease or conceal an obligation to pay money to the federal government;
|
|
|
·
|
the U.S. Health Insurance Portability and Accountability Act of 1996, or HIPAA, imposes criminal and civil liability for executing a scheme to defraud any healthcare benefit program or making false statements relating to healthcare matters;
|
|
|
·
|
HIPAA, as amended by the Health Information Technology for Economic and Clinical Health Act, imposes obligations, including mandatory contractual terms, with respect to safeguarding the privacy, security and transmission of individually identifiable health information;
|
|
|
·
|
the transparency requirements under the Health Care Reform Law require manufacturers of drugs, devices, biologics and medical supplies to report to the U.S. Department of Health and Human Services information related to payments and other transfers of value made by such manufacturers to physicians and teaching hospitals, and ownership and investment interests held by physicians or their immediate family members; and
|
|
|
·
|
analogous laws and regulations, such as state anti-kickback and false claims laws, may apply to sales or marketing arrangements and claims involving healthcare items or services reimbursed by non-governmental third-party payors, including private insurers, and some state laws require pharmaceutical companies to comply with the pharmaceutical industry’s voluntary compliance guidelines and the relevant compliance guidance promulgated by the federal government in addition to requiring manufacturers to report information related to payments to physicians and other health care providers or marketing expenditures.
|
Because of the breadth of these laws and the narrowness of the statutory exceptions and safe harbors available under the U.S. federal Anti-Kickback Statute, it is possible that some of our future business activities could be subject to challenge under one or more of such laws. In addition, recent health care reform legislation has strengthened these laws. For example, the Health Care Reform Law, among other things, amends the intent requirement of the federal anti-kickback and criminal healthcare fraud statutes. A person or entity no longer needs to have actual knowledge of this statute or specific intent to violate it. Moreover, the Health Care Reform Law provides that the government may assert that a claim including items or services resulting from a violation of the federal anti-kickback statute constitutes a false or fraudulent claim for purposes of the False Claims Act.
Efforts to ensure that our business arrangements with third parties will comply with applicable healthcare laws and regulations will involve substantial costs. It is possible that governmental authorities will conclude that our business practices may not comply with current or future statutes, regulations or case law involving applicable fraud and abuse or other healthcare laws and regulations. If our operations are found to be in violation of any of these laws or any other governmental regulations that may apply to us, we may be subject to significant civil, criminal and administrative penalties, damages, fines, exclusion from U.S. government funded healthcare programs, such as Medicare and Medicaid, and the curtailment or restructuring of our operations. If any of the physicians or other providers or entities with whom we expect to do business with are found to be not in compliance with applicable laws, they may be subject to criminal, civil or administrative sanctions, including exclusions from government funded healthcare programs.
Risks Related to Commercialization of Our Product Candidates
We operate in highly competitive and rapidly changing industries, which may result in others discovering, developing or commercializing competing products before or more successfully than we do.
The biopharmaceutical and pharmaceutical industries are highly competitive and subject to significant and rapid technological change. Our success is highly dependent on our ability to discover, develop and obtain marketing approval for new and innovative products on a cost-effective basis and to market them successfully. In doing so, we face and will continue to face intense competition from a variety of businesses, including large, fully integrated pharmaceutical companies, specialty pharmaceutical companies and biopharmaceutical companies, academic institutions, government agencies and other private and public research institutions in Europe, the United States and other jurisdictions. These organizations may have significantly greater resources than we do and conduct similar research, seek patent protection and establish collaborative arrangements for research, development, manufacturing and marketing of products that compete with our product candidates.
We believe that our key competitors are Otonomy, Inc., or Otonomy, and Sound Pharmaceuticals, Inc., or Sound Pharma, both U.S. companies developing pharmaceutical treatments for ear disorders. In October 2013, Otonomy announced the launch of a development program for the treatment of tinnitus, OTO-311, which may directly compete with our AM-101 product candidate. For OTO-311 the Company acquired certain assets and rights to intellectual property related to the use of the NMDA receptor antagonist gacyclidine for the treatment of tinnitus from NeuroSystec Corporation. NeuroSystec was founded in 2004 and sought to develop a drug-device combination product that could provide sustained delivery of gacyclidine (NST-001) to the inner ear. A 2010 article in
European Archives of Otorhinolaryngology
by Wenzel et al. described how in a compassionate use study in Europe four out of six tinnitus patients receiving a constant perfusion of gacyclidine onto their round window membrane for 40 to 63 hours reported temporary relief, and one among them lasting relief. NeuroSystec initiated a Phase 1b trial with NST-001 in January 2009, but never published outcomes thereof and ceased activities in 2013. According to a recent public filing, Otonomy intends to develop a sustained-exposure formulation of gacyclidine that will provide a full course of treatment from a single i.t. injection and plans to file an IND with the FDA for OTO-311 and initiate a Phase 1 trial in 2015. OTO-311’s competitive strength will ultimately depend on the demonstration of clinical efficacy and safety and its comparison with AM-101. Further, we intend to rely on our patent applications with broad disclosures to pursue claims relating to the use of polymers with NMDA antagonists in controlled-release topical compositions for the treatment of tinnitus.
As we plan to test AM-111’s efficacy in Meniere’s Disease, an inner ear disorder that affects balance and hearing, we will enter into competition with an Otonomy project, OTO-104. Otonomy completed a Phase 2b clinical trial in the United States and Canada and, according to public filings, expects to report results in the second quarter of 2015 and to initiate a second pivotal trial of OTO-104 in 2015. OTO-104 is a poloxamer-based gel formulation of micronized dexamethasone which is injected intratympanically in a single dose into the middle ear for the treatment of Meniere’s Disease. Results from a 44-patient Phase 1b clinical trial with OTO-104 were reported by Lambert et al. in a 2012 article in Otology and Neurotology. The trial enrolled patients with unilateral Meniere’s Disease who had experienced at least two vertigo episodes during a 28-day lead-in period (with an average of seven to eight vertigo episodes during that period). In the three months following the treatment, the frequency of vertigo episodes decreased in all treatment groups, ranging from 3.6 episodes in the placebo group to -4.2 episodes in the 3 mg treatment group and -3.9 episodes in the 12 mg treatment group. Although the article did not provide a definition of clinically meaningful change, it stated that the clinical trial demonstrated a clinically meaningful reduction for the active treatment groups because, after three months, there was a larger decrease in the number of vertigo episodes, relative to baseline, in the 12 mg group than in the placebo group. We intend to rely on our patent applications with
broad disclosures to pursue claims relating to the use of poloxamers with steroids in controlled-release topical compositions for the treatment of Meniere’s Disease.
In June 2006, Sound Pharma began clinical testing of an oral treatment for hearing loss (SPI-1005, ebselen). Its active substance mimics and prompts production of the glutathione peroxidase enzyme. In February 2014, Sound Pharma announced positive outcomes from a placebo-controlled Phase 2 clinical trial with SPI-1005 in the prevention and treatment of temporary inner ear hearing loss from listening to loud music with a mobile digital media player. Although AM-111 targets permanent rather than transient hearing loss, SPI-1005 may become a competing product if Sound Pharma seeks and manages to demonstrate clinical efficacy also in the prevention and treatment of permanent inner ear hearing loss.
The highly competitive nature of and rapid technological changes in the biotechnology and pharmaceutical industries could render our product candidates or our technology obsolete or non-competitive. Our competitors may, among other things:
|
|
·
|
develop and commercialize products that are safer, more effective, less expensive, or more convenient or easier to administer;
|
|
|
·
|
obtain quicker regulatory approval;
|
|
|
·
|
establish superior proprietary positions;
|
|
|
·
|
have access to more manufacturing capacity;
|
|
|
·
|
implement more effective approaches to sales and marketing; or
|
|
|
·
|
form more advantageous strategic alliances.
|
Should any of these occur, our business, financial condition and results of operations could be materially adversely affected.
The successful commercialization of our product candidates will depend in part on the extent to which governmental authorities and health insurers establish adequate coverage and reimbursement levels and pricing policies.
The successful commercialization of AM-101, AM-111 or our other product candidates will depend, in part, on the extent to which coverage and reimbursement for our products or procedures using our products will be available from government and health administration authorities, private health insurers and other third-party payors. To manage healthcare costs, many governments and third-party payors increasingly scrutinize the pricing of new technologies and require greater levels of evidence of favorable clinical outcomes and cost-effectiveness before extending coverage. In light of such challenges to prices and increasing levels of evidence of the benefits and clinical outcomes of new technologies, we cannot be sure that coverage will be available for AM-101, AM-111 or any other product candidate that we commercialize and, if available, that the reimbursement rates will be adequate. If we are unable to obtain adequate levels of coverage and reimbursement for our product candidates, their marketability will be negatively and materially impacted.
Our customers, including hospitals, physicians and other healthcare providers that purchase certain injectable drugs administered during a procedure, such as our product candidates, generally rely on third-party payors to pay for all or part of the costs and fees associated with the drug and the procedures administering the drug. These third-party payors may pay separately for the drug or may bundle or otherwise include the costs of the drug in the payment for the procedure. We are unable to predict at this time whether our product candidates, if approved, will be eligible for such separate payments. Nor can we predict at this time the adequacy of payments, whether made separately for the drug and procedure or with a bundled or otherwise aggregate payment amount for the drug and procedure. In addition, obtaining and maintaining adequate coverage and reimbursement status is time-consuming and costly.
Third party payors may deny coverage and reimbursement status altogether of a given drug product, or cover the product but may also establish prices at levels that are too low to enable us to realize an appropriate return on our investment in product development. Because the rules and regulations regarding coverage and reimbursement
change frequently, in some cases at short notice, even when there is favorable coverage and reimbursement, future changes may occur that adversely impact the favorable status. Further, the net reimbursement for drug products may be subject to additional reductions if there are changes to laws that presently restrict imports of drugs from countries where they may be sold at lower prices than in the United States.
The unavailability or inadequacy of third-party coverage and reimbursement could have a material adverse effect on the market acceptance of our product candidates and the future revenues we may expect to receive from those products. In addition, we are unable to predict what additional legislation or regulation relating to the healthcare industry or third-party coverage and reimbursement may be enacted in the future, or what effect such legislation or regulation would have on our business.
Our products may not gain market acceptance, in which case we may not be able to generate product revenues, which will materially adversely affect our business, financial condition and results of operations.
Even if the FDA, the EMA or other regulatory authority approves the marketing of any product candidates that we develop, physicians, healthcare providers, patients or the medical community may not accept or use them. Efforts to educate the medical community and third-party payors on the benefits of our product candidates may require significant resources and may not be successful. If AM-101, AM-111 or any other product candidate that we develop does not achieve an adequate level of acceptance, we may not generate significant product revenues or any profits from operations. The degree of market acceptance of AM-101, AM-111 or any of our product candidates that is approved for commercial sale will depend on a variety of factors, including:
|
|
·
|
how clinicians and potential patients perceive our novel products;
|
|
|
·
|
the timing of market introduction;
|
|
|
·
|
the number and clinical profile of competing products;
|
|
|
·
|
our ability to provide acceptable evidence of safety and efficacy;
|
|
|
·
|
the prevalence and severity of any side effects;
|
|
|
·
|
relative convenience and ease of administration, particularly as AM-101 and AM-111 require multiple outpatient procedures to administer the drug;
|
|
|
·
|
cost-effectiveness;
|
|
|
·
|
patient diagnostics and screening infrastructure in each market, particularly as AM-101 and AM-111 are being developed for the treatment of acute inner ear disorders and are thus dependent on a relatively rapid diagnosis and dosing process;
|
|
|
·
|
marketing and distribution support;
|
|
|
·
|
availability of coverage, reimbursement and adequate payment from health maintenance organizations and other third-party payors, both public and private; and
|
|
|
·
|
other potential advantages over alternative treatment methods.
|
If our product candidates fail to gain market acceptance, this will have a material adverse impact on our ability to generate revenues to provide a satisfactory, or any, return on our investments. Even if some products achieve market acceptance, the market may prove not to be large enough to allow us to generate significant revenues.
In addition, the potential market opportunity of AM-101 and AM-111 are difficult to precisely estimate. Our estimates of the potential market opportunity are predicated on several key assumptions such as industry knowledge and publications, third-party research reports and other surveys. While we believe that our internal assumptions are reasonable, these assumptions involve the exercise of significant judgment on the part of our management, are inherently uncertain and the reasonableness of these assumptions could not have been assessed by an independent source in every detail. If any of the assumptions proves to be inaccurate, then the actual market for AM-101 and AM-111 could be smaller than our estimates of the potential market opportunity. If the actual market for AM-101
and AM-111 is smaller than we expect, or if the products fail to achieve an adequate level of acceptance by physicians, health care payors and patients, our product revenue may be limited and it may be more difficult for us to achieve or maintain profitability.
We have never commercialized a product candidate before and may lack the necessary expertise, personnel and resources to successfully commercialize our products on our own or together with suitable partners.
We have never commercialized a product candidate, and we currently have no sales force, marketing or distribution capabilities. To achieve commercial success for AM-101, AM-111 and our other product candidates, we will have to develop our own sales, marketing and supply organization or outsource these activities to a third party.
Factors that may affect our ability to commercialize our product candidates on our own include recruiting and retaining adequate numbers of effective sales and marketing personnel, obtaining access to or persuading adequate numbers of physicians to prescribe our drug candidates and other unforeseen costs associated with creating an independent sales and marketing organization. Developing a sales and marketing organization requires significant investment, is time-consuming and could delay the launch of our product candidates. We may not be able to build an effective sales and marketing organization. If we are unable to build our own distribution and marketing capabilities or to find suitable partners for the commercialization of our product candidates, we may not generate revenues from them or be able to reach or sustain profitability.
Risks Related to Our Reliance on Third Parties
We have several areas of disagreement with Xigen, and consequently our relationship with Xigen may be adversely affected, we could potentially lose our right to commercialize AM-111 and our business, commercialization prospects and financial condition may be adversely affected.
We have several areas of disagreement with Xigen S.A., or Xigen, with whom we have an agreement pursuant to which Xigen granted us an exclusive worldwide license to use specified compounds to develop, manufacture and commercialize “pharmaceutical products as well as drug delivery devices and formulations for local administration of therapeutic substances to the inner ear for the treatment of ear disorders” (the Area). We differ from Xigen in our interpretation of the definition of the Area. We interpret “Area,” as it pertains to pharmaceutical products, as not limited to local administration to the inner ear, but inclusive of the use of pharmaceutical products generally for the treatment of ear disorders (and that the limitation of “local administration to the inner ear” applies only to “drug delivery devices and formulations”). Xigen has adopted the interpretation that the license is limited to local administration for both pharmaceutical products and drug delivery and formulations. This difference in interpretation has no impact on our current or planned use of AM-111 delivered locally via intratympanic treatment.
In addition, in October 2013, Xigen assigned certain of the patents relevant to the agreement to Xigen Inflammation Ltd., an unaffiliated entity organized in Cyprus. We consider this transfer to be in breach of the agreement since our prior written approval was not sought, although Xigen Inflammation Ltd. has confirmed to us that the assignment of patents is without prejudice to our license for local administration. Xigen has also requested from us quantities of AM-111 for certain analyses, although we believe the quantities requested exceed what laboratories would generally require for such tests.
The agreement contains a confidentiality provision restricting the disclosure of the terms of the agreement. We believe that Xigen may have waived the confidentiality provision of the agreement by disclosing the terms of the agreement to Xigen Inflammation Ltd., although Xigen has denied that any disclosure of the agreement has been made to the assignee despite the assignee’s assurance that the assignment was without prejudice to our license for local administration. Despite this, in connection with our initial public offering, we sought Xigen’s consent to disclose certain provisions of the agreement and file a redacted version of the agreement with the SEC. Xigen, however, was only willing to provide its consent if we agreed to limit the scope of the definition of “Area,” desist from claims that the transfer of patents to Xigen Inflammation Ltd. was in breach of the agreement and provide Xigen with their requested quantities of AM-111 for analysis.
We believe Xigen’s demands were unreasonable and unwarranted, and therefore we were not able to come to an agreement with Xigen prior to disclosing certain provisions of the agreement in the prospectus relating to our initial public offering and filing a redacted version of the agreement. Xigen may consider such disclosure to be a breach of the confidentiality provision of the agreement. The agreement is governed by Swiss law, and the venue is Solothurn,
Switzerland. In the opinion of our Swiss counsel, while there can be no assurances, this disclosure by us does not rise to the level of material breach that would allow Xigen to repudiate the agreement.
We cannot predict the result of these disagreements with Xigen and any litigation that may result. While Xigen has taken no action as of the date of this Annual Report, Xigen may attempt to repudiate the contract and initiate a claim for damages against us. According to our Swiss counsel, Xigen would have to show that it had suffered a loss due to the disclosure of the redacted agreement and certain provisions of the agreement in the prospectus associated with our initial public offering, and the damages could be equal to the amount of the effective direct damage that Xigen proves it has suffered.
These disagreements, and in particular any resulting litigation, could result in substantial legal expenses, distraction to our management and employees and potentially the loss of our right to commercialize AM-111. No assurance can be given that these disagreements and any resulting litigation will not have a material adverse effect on our business, commercialization prospects for AM-111 and our other product candidates and our financial condition. For a description of our agreement with Xigen, please see “Item 4. Information on the Company—B. Business overview—Collaboration and License Agreements
—
Xigen.”
If we fail to maintain our current strategic relationships with INSERM and Xigen, our business, commercialization prospects and financial condition may be materially adversely affected.
We have a co-ownership/exploitation agreement with the Institut National de la Santé et de la Recherche Médicale, or INSERM, governing the exploitation of any products derived from patents that resulted from our joint research program with INSERM that was conducted in 2003 to 2005. Under this agreement with INSERM, we are given the exclusive right to exploit the patents issuing from the filed patent applications for all claimed applications, including the treatment of tinnitus, in order to develop, promote, manufacture, cause to be manufactured, use, sell and distribute any products, processes or services deriving from such patents, including AM-101, in any country in which these patent applications have been filed during the term of the agreement. We alone are entitled to grant manufacturing or sales licenses for any patents to our subsidiaries and/or third parties. INSERM is entitled to use the inventions covered by the patents and applications for its own research purposes, free of charge, but may not generate any direct or indirect profits from such use. We have agreed to finance any additional research and development work necessary to obtain marketing authorizations for inventions covered by these patents and applications. If we fail to use reasonable efforts in carrying out this additional research, then INSERM may revoke the exclusivity of exploitation granted to us under this agreement. Additionally, we have an exclusive worldwide license from Xigen for the application of Xigen’s novel intracellular peptide therapeutics in the area of ear disorders. These intellectual property rights have been the basis of our research and development of AM-101 and AM-111.
Good relationships with INSERM and Xigen are important for our business prospects. If our relationships with INSERM or Xigen were to deteriorate substantially or INSERM or Xigen were to challenge our use of their intellectual property or our calculations of the payments we owe under our agreements, our business, financial condition, commercialization prospects and results of operations could be materially adversely affected.
We may seek to form additional strategic alliances in the future with respect to our product candidates, and if we do not realize the benefits of such alliance, our business, financial condition, commercialization prospects and results of operations may be materially adversely affected.
Our product development programs and the potential commercialization of our product candidates will require substantial additional cash to fund expenses and may require expertise, such as sales and marketing expertise, which we do not currently possess. Therefore, in addition to our relationships with INSERM and Xigen, for our AM-101 and AM-111 product candidates respectively, for one or more of our product candidates, we may decide to enter into strategic alliances, or create joint ventures or collaborations with pharmaceutical or biopharmaceutical companies for the further development and potential commercialization of those product candidates.
We face significant competition in seeking appropriate collaborators. Collaborations are complex and time-consuming to negotiate and document. Any delays in entering into new strategic partnership agreements related to our product candidates could delay the development and commercialization of our product candidates and reduce their competitiveness even if they reach the market. We may also be restricted under existing and future collaboration agreements from entering into strategic partnerships or collaboration agreements on certain terms with other potential collaborators. We may not be able to negotiate collaborations on acceptable terms, or at all, for any
of our existing or future product candidates and programs because the potential partner may consider that our research and development pipeline is insufficiently developed to justify a collaborative effort, or that our product candidates and programs do not have the requisite potential to demonstrate safety and efficacy in the target population. If we are unsuccessful in establishing and maintaining a collaboration with respect to a particular product candidate, we may have to curtail the development of that product candidate, reduce the scope of or delay its development program or one or more of our other development programs, delay its potential commercialization or reduce the scope of our sales or marketing activities, or increase our expenditures and undertake development or commercialization activities at our own expense for which we have not budgeted. If we elect to increase our expenditures to fund development or commercialization activities on our own, we may need to obtain additional capital, which may not be available to us on acceptable terms or at all. If we do not have sufficient funds, we will not be able to bring our product candidates to market and generate product revenue. Even if we are successful in establishing a new strategic partnership or entering into a collaboration agreement, we cannot be certain that, following such a strategic transaction or license, we will be able to progress the development and commercialization of the applicable product candidates as envisaged, or that we will achieve the revenues that would justify such transaction, and we could be subject to the following risks, each of which may materially harm our business, commercialization prospects and financial condition:
|
|
·
|
we may not be able to control the amount and timing of resources that the collaboration partner devotes to the product development program;
|
|
|
·
|
the collaboration partner may experience financial difficulties;
|
|
|
·
|
we may be required to relinquish important rights such as marketing, distribution and intellectual property rights;
|
|
|
·
|
a collaboration partner could move forward with a competing product developed either independently or in collaboration with third parties, including our competitors; or
|
|
|
·
|
business combinations or significant changes in a collaboration partner’s business strategy may adversely affect our willingness to complete our obligations under any arrangement.
|
We rely on third parties to conduct our nonclinical and clinical trials and perform other tasks for us. If these third parties do not successfully carry out their contractual duties, meet expected deadlines, or comply with regulatory requirements, we may not be able to obtain regulatory approval for or commercialize our product candidates and our business could be substantially harmed.
We have relied upon and plan to continue to rely upon third-party CROs to monitor and manage data for our ongoing nonclinical and clinical programs, including the clinical trials of AM-101 and AM-111. We rely on these parties for execution of our nonclinical and clinical studies and control only certain aspects of their activities. Nevertheless, we are responsible for ensuring that each of our trials is conducted in accordance with the applicable protocol, legal, regulatory, and scientific standards and our reliance on the CROs does not relieve us of our regulatory responsibilities. We and our CROs and other vendors are required to comply with cGMP, cGCP, and Good Laboratory Practice, or GLP, which are regulations and guidelines enforced by the FDA, the Competent Authorities of the Member States of the European Union and comparable foreign regulatory authorities for all of our product candidates in nonclinical and clinical development. Regulatory authorities enforce these regulations through periodic inspections of study sponsors, principal investigators, trial sites and other contractors. If we or any of our CROs or vendors fail to comply with applicable regulations, the data generated in our nonclinical and clinical trials may be deemed unreliable and the EMA, FDA, other regulatory authorities may require us to perform additional nonclinical and clinical trials before approving our marketing applications. We cannot assure you that upon inspection by a given regulatory authority, such regulatory authority will determine that all of our clinical trials comply with cGCP regulations. In addition, our clinical trials must be conducted with product produced under cGMP regulations. Our failure to comply with these regulations may require us to repeat clinical trials, which would delay the regulatory approval process.
If any of our relationships with these third-party CROs terminates, we may not be able to enter into arrangements with alternative CROs or do so on commercially reasonable terms. In addition, our CROs are not our employees, and except for remedies available to us under our agreements with such CROs, we cannot control whether or not they devote sufficient time and resources to our on-going nonclinical and clinical programs. If CROs
do not successfully carry out their contractual duties or obligations or meet expected deadlines, if they need to be replaced or if the quality or accuracy of the data they obtain is compromised due to the failure to adhere to our protocols, regulatory requirements, or for other reasons, our clinical trials may be extended, delayed, or terminated and we may not be able to obtain regulatory approval for or successfully commercialize our product candidates. CROs may also generate higher costs than anticipated. As a result, our results of operations and the commercial prospects for our product candidates would be harmed, our costs could increase, and our ability to generate revenue could be delayed.
Switching or adding additional CROs involves additional cost and requires management time and focus. In addition, there is a natural transition period when a new CRO commences work. As a result, delays occur, which can materially impact our ability to meet our desired clinical development timelines. Though we carefully manage our relationships with our CROs, there can be no assurance that we will not encounter similar challenges or delays in the future or that these delays or challenges will not have a material adverse impact on our business, financial condition, and prospects.
We currently rely on third-party suppliers and other third parties for production of our product candidates and our dependence on these third parties may impair the advancement of our research and development programs and the development of our product candidates.
We currently rely on and expect to continue to rely on third parties, for the manufacturing and supply of chemical compounds for the clinical trials of our product candidates, including AM-101 and AM-111, and others for the manufacturing and supply of pre-filled syringes. For the foreseeable future, we expect to continue to rely on such third parties for the manufacture of any of our product candidates on a clinical or commercial scale, if any of our product candidates receives regulatory approval. Reliance on third-party providers may expose us to different risks than if we were to manufacture product candidates ourselves. The facilities used by our contract manufacturers to manufacture our product candidates must be approved by the FDA or other regulatory authorities pursuant to inspections that will be conducted after we submit our NDA or comparable marketing application to the FDA or other regulatory authority. Although we have auditing rights with all our manufacturing counterparties, we do not have control over a supplier’s or manufacturer’s compliance with these laws, regulations and applicable cGMP standards and other laws and regulations, such as those related to environmental health and safety matters. If our contract manufacturers cannot successfully manufacture material that conforms to our specifications and the strict regulatory requirements of the FDA or others, they will not be able to secure and/or maintain regulatory approval for their manufacturing facilities. In addition, we have no control over the ability of our contract manufacturers to maintain adequate quality control, quality assurance and qualified personnel. If the FDA or a comparable foreign regulatory authority does not approve these facilities for the manufacture of our product candidates or if it withdraws any such approval in the future, we may need to find alternative manufacturing facilities, which would significantly impact our ability to develop, obtain regulatory approval for or market our product candidates, if approved. Any failure to achieve and maintain compliance with these laws, regulations and standards could subject us to the risk that we may have to suspend the manufacturing of our product candidates or that obtained approvals could be revoked, which would adversely affect our business and reputation. Furthermore, third-party providers may breach agreements they have with us because of factors beyond our control. They may also terminate or refuse to renew their agreements because of their own financial difficulties or business priorities, potentially at a time that is costly or otherwise inconvenient for us. If we were unable to find adequate replacement or another acceptable solution in time, our clinical trials could be delayed or our commercial activities could be harmed.
In addition, the fact that we are dependent on our suppliers and other third parties for the manufacture, storage and distribution of our product candidates means that we are subject to the risk that our product candidates and, if approved, commercial products may have manufacturing defects that we have limited ability to prevent or control. The sale of products containing such defects could result in recalls or regulatory enforcement action that could adversely affect our business, financial condition and results of operations.
Growth in the costs and expenses of components or raw materials may also adversely influence our business, financial condition and results of operations. Supply sources could be interrupted from time to time and, if interrupted, that supplies could be resumed (whether in part or in whole) within a reasonable timeframe and at an acceptable cost or at all.
Our current and anticipated future dependence upon others for the manufacturing of AM-101, AM-111 and any other product candidate that we develop may adversely affect our future profit margins and our ability to commercialize any products that receive marketing approval on a timely and competitive basis.
The drug substance and drug product for our product candidates are currently acquired from single-source suppliers. The loss of these suppliers, or their failure to supply us with the drug substance or drug product, could materially and adversely affect our business.
We do not currently, and do not expect to in the future, independently conduct manufacturing activities for our product candidates, including AM-101 and AM-111. We currently have a relationship with one supplier each, for the supply of the active pharmaceutical ingredients and the hyaluronic acid component of AM-101 and AM-111. We are reliant upon single source third party contract manufacturing organizations to manufacture and supply the drug substance and drug product and components thereof for each of AM-101 and AM-111. We do not currently have any other suppliers for the drug substance or drug product of our product candidates and, although we believe that there are alternate sources of supply that could satisfy our clinical and commercial requirements, and we have performed some preliminary investigations to assess this availability, we cannot assure you that identifying alternate sources and establishing relationships with such sources would not result in significant delay in the development of our product candidates. Additionally, we may not be able to enter into supply arrangements with alternative suppliers on commercially reasonable terms, or at all. A delay in the development of our product candidates or having to enter into a new agreement with a different third party on less favorable terms than we have with our current suppliers could have a material adverse impact upon on our business.
Risks Related to Intellectual Property
If we or our licensors are unable to obtain and maintain effective patent rights for our technologies, product candidates or any future product candidates, or if the scope of the patent rights obtained is not sufficiently broad, we may not be able to compete effectively in our markets.
We rely upon a combination of patents, trade secret protection, and confidentiality agreements to protect the intellectual property related to our technologies and product candidates. Our success depends in large part on our and our licensors’ ability to obtain and maintain patent and other intellectual property protection in the United States and in other countries with respect to our proprietary technology and products.
We have sought to protect our proprietary position by filing patent applications in the United States and abroad related to our novel technologies and products that are important to our business. This process is expensive and time consuming, and we may not be able to file and prosecute all necessary or desirable patent applications at a reasonable cost, in a timely manner or in all jurisdictions. It is also possible that we will fail to identify patentable aspects of our research and development output before it is too late to obtain patent protection. Moreover, in some circumstances, we do not have the right to control the preparation, filing and prosecution of patent applications, or to maintain the patents, covering technology that we license from third parties. Therefore, these patents and applications may not be prosecuted and enforced in a manner consistent with the best interests of our business.
The patent position of biotechnology and pharmaceutical companies generally is highly uncertain and involves complex legal and factual questions for which legal principles remain unsolved. The patent applications that we own or in-license may fail to result in issued patents with claims that cover our product candidates in the United States or in other foreign countries. Publications of discoveries in the scientific literature often lag behind the actual discoveries, and patent applications in the United States and other jurisdictions remain confidential for a period of time after filing, and some remain so until issued, we cannot be certain that we were the first to file any patent application related to our product candidates, or whether we were the first to make the inventions claimed in our owned patents or pending patent applications, nor can we know whether those from whom we license patents were the first to make the inventions claimed or were the first to file. As a result, the issuance, scope, validity, enforceability and commercial value of our patent rights are highly uncertain. There is no assurance that all potentially relevant prior art relating to our patents and patent applications has been found, which can invalidate a patent or prevent a patent from issuing from a pending patent application. Even if patents do successfully issue, and even if such patents cover our product candidates, third parties may challenge their validity, enforceability, or scope, which may result in such patents being narrowed, found unenforceable or invalidated, which could allow third parties to commercialize our technology or products and compete directly with us, without payment to us, or result in our inability to manufacture or commercialize products without infringing third party patent rights. Furthermore,
even if they are unchallenged, our patents and patent applications may not adequately protect our intellectual property, provide exclusivity for our product candidates, prevent others from designing around our claims or provide us with a competitive advantage. Any of these outcomes could impair our ability to prevent competition from third parties, which may have an adverse impact on our business.
We, independently or together with our licensors, have filed several patent applications covering various aspects of our product candidates. We cannot offer any assurances about which, if any, patents will issue, the breadth of any such patent or whether any issued patents will be found invalid and unenforceable or will be challenged by third parties. Any successful opposition to these patents or any other patents owned by or licensed to us after patent issuance could deprive us of rights necessary for the successful commercialization of any product candidates that we may develop. Further, if we encounter delays in regulatory approvals, the period of time during which we could market a product candidate under patent protection could be reduced.
We may not have sufficient patent terms to effectively protect our products and business.
Patents have a limited lifespan. In the United States, the natural expiration of a patent is generally 20 years after it is filed. Although various extensions may be available, the life of a patent, and the protection it affords, is limited. Given the amount of time required for the development, testing and regulatory review of new product candidates, patents protecting such candidates might expire before or shortly after such candidates are commercialized. As a result, our owned and licensed patent portfolio may not provide us with sufficient rights to exclude others from commercializing products similar or identical to ours or otherwise provide us with a competitive advantage. Even if patents covering our product candidates are obtained, once the patent life has expired for a product, we may be open to competition from generic medications.
While patent term extensions under the Hatch-Waxman Act in the United States and under supplementary protection certificates in Europe may be available to extend the patent exclusivity term for AM-101 and AM-111, we cannot provide any assurances that any such patent term extension will be obtained and, if so, for how long. Specifically, Xigen is concurrently developing another indication for XG-102, the active substance of AM-111. Since for each product only a single patent can be selected for patent term extension, there may be a conflict of interest with respect to patent selection for extending patent terms covering two different indications of XG-102. It is possible that Xigen may select a patent that does not provide the longest patent term for the AM-111 indication developed by us. In addition, upon issuance in the United States any patent term can be adjusted based on certain delays caused by the applicant(s) or USPTO. For example, a patent term can be reduced based on certain delays caused by the patent applicant during patent prosecution.
While in both the United States and Europe there is a possibility to obtain market protection independent from any patent protection for up to 5 and 10 years from approval, respectively, there is no assurance that we can obtain such data exclusivity with respect to AM-101, AM-111, or any of our other product candidates. Our issued patents and pending patent applications are expected to expire for AM-101 between 2024 and 2028 and for AM-111 between 2020 and 2027, prior to any patent term extensions to which we may be entitled under applicable laws.
Patent policy and rule changes could increase the uncertainties and costs surrounding the prosecution of our patent applications and the enforcement or defense of our issued patents.
Changes in either the patent laws or interpretation of the patent laws in the United States and other countries may diminish the value of our patents or narrow the scope of our patent protection. The laws of foreign countries may not protect our rights to the same extent as the laws of the United States. Assuming the other requirements for patentability are met, in the United States prior to March 15, 2013, the first to make the claimed invention is entitled to the patent, while outside the United States, the first to file a patent application is entitled to the patent. After March 15, 2013, under the Leahy-Smith America Invents Act, or the Leahy-Smith Act, enacted on September 16, 2011, the United States has moved to a first to file system. The Leahy-Smith Act also includes a number of significant changes that affect the way patent applications will be prosecuted and may also affect patent litigation. The effects of these changes are currently unclear as the USPTO must still implement various regulations, the courts have yet to address any of these provisions and the applicability of the act and new regulations on specific patents discussed herein have not been determined and would need to be reviewed. In general, the Leahy-Smith Act and its implementation could increase the uncertainties and costs surrounding the prosecution of our patent applications and the enforcement or defense of our issued patents, all of which could have a material adverse effect on our business and financial condition. In addition, recent U.S. Supreme Court rulings have narrowed the scope of patent protection
available in certain circumstances and weakened the rights of patent owners in certain situations. In addition to increasing uncertainty with regard to our ability to obtain patents in the future, this combination of events has created uncertainty with respect to the value of patents, once obtained. Depending on future actions by the U.S. Congress, the federal courts, and the USPTO, the laws and regulations governing patents could change in unpredictable ways that would weaken our ability to obtain new patents or to enforce our existing patents and patents that we might obtain in the future.
If we are unable to maintain effective proprietary rights for our technologies, product candidates or any future product candidates, we may not be able to compete effectively in our markets.
In addition to the protection afforded by patents, we rely on trade secret protection and confidentiality agreements to protect proprietary know-how that is not patentable or that we elect not to patent, processes for which patents are difficult to enforce and any other elements of our product candidate discovery and development processes that involve proprietary know-how, information or technology that is not covered by patents. However, trade secrets can be difficult to protect. We seek to protect our proprietary technology and processes, in part, by entering into confidentiality agreements with our employees, consultants, scientific advisors, and contractors. We also seek to preserve the integrity and confidentiality of our data and trade secrets by maintaining physical security of our premises and physical and electronic security of our information technology systems. While we have confidence in these individuals, organizations and systems, agreements or security measures may be breached, and we may not have adequate remedies for any breach. Moreover, if any of our trade secrets were to be lawfully obtained or independently developed by a competitor, we would have no right to prevent such competitor from using that technology or information to compete with us, which could harm our competitive position.
Although we expect all of our employees and consultants to assign their inventions to us, and all of our employees, consultants, advisors, and any third parties who have access to our proprietary know-how, information or technology to enter into confidentiality agreements, we cannot provide any assurances that all such agreements have been duly executed or that our trade secrets and other confidential proprietary information will not be disclosed or that competitors will not otherwise gain access to our trade secrets or independently develop substantially equivalent information and techniques. Misappropriation or unauthorized disclosure of our trade secrets could impair our competitive position and may have a material adverse effect on our business. Additionally, if the steps taken to maintain our trade secrets are deemed inadequate, we may have insufficient recourse against third parties for misappropriating such trade secrets. In addition, others may independently discover our trade secrets and proprietary information. For example, the FDA, as part of its Transparency Initiative, is currently considering whether to make additional information publicly available on a routine basis, including information that we may consider to be trade secrets or other proprietary information, and it is not clear at the present time how the FDA’s disclosure policies may change in the future, if at all.
Further, the laws of some foreign countries do not protect proprietary rights to the same extent or in the same manner as the laws of the U.S. As a result, we may encounter significant problems in protecting and defending our intellectual property both in the U.S. and abroad. If we are unable to prevent material disclosure of the intellectual property related to our technologies to third parties, we will not be able to establish or maintain a competitive advantage in our market, which could materially adversely affect our business, financial condition and results of operations.
Third-party claims of intellectual property infringement may expose us to substantial liability or prevent or delay our development and commercialization efforts.
Our commercial success depends in part on our ability to develop, manufacture, market and sell our product candidates and use our proprietary technology without alleged or actual infringement, misappropriation, or other violation of the patents and proprietary rights of third parties. There have been many lawsuits and other proceedings involving patent and other intellectual property rights in the biotechnology and pharmaceutical industries, including patent infringement lawsuits, interferences, oppositions, and reexamination proceedings before the USPTO and corresponding foreign patent offices. Numerous U.S. and foreign issued patents and pending patent applications, which are owned by third parties, exist in the fields in which we are developing product candidates. Some claimants may have substantially greater resources than we do and may be able to sustain the costs of complex intellectual property litigation to a greater degree and for longer periods of time than we could. In addition, patent holding companies that focus solely on extracting royalties and settlements by enforcing patent rights may target us. As the
biotechnology and pharmaceutical industries expand and more patents are issued, the risk increases that our product candidates may be subject to claims of infringement of the patent rights of third parties.
Third parties may assert that we are employing their proprietary technology without authorization. There may be third-party patents or patent applications with claims to materials, formulations, methods of manufacture, or methods of treatment related to the use or manufacture of our product candidates. Although we generally conduct certain freedom to operate search and review with respect to our product candidates, we cannot guarantee that any of our search and review is complete and thorough, nor can we be sure that we have identified each and every patent and pending application in the United States and abroad that is relevant or necessary to the commercialization of our product candidates. Because patent applications can take many years to issue, there may be currently pending patent applications that may later result in issued patents that our product candidates may infringe. In addition, third parties may obtain patents in the future and claim that use of our technologies infringes upon these patents. If any third-party patents were held by a court of competent jurisdiction to cover the manufacturing process of any of our product candidates, any molecules formed during the manufacturing process or any final product itself, the holders of any such patents may be able to block our ability to commercialize such product candidate unless we obtained a license under the applicable patents, or until such patents expire or are finally determined to be invalid or unenforceable. Similarly, if any third-party patents were held by a court of competent jurisdiction to cover aspects of our formulations, processes for manufacture, or methods of use, the holders of any such patents may be able to block our ability to develop and commercialize the applicable product candidate unless we obtained a license or until such patent expires or is finally determined to be invalid or unenforceable. In either case, such a license may not be available on commercially reasonable terms or at all. Even if we were able to obtain a license, it could be non-exclusive, thereby giving our competitors access to the same technologies licensed to us.
Parties making claims against us may obtain injunctive or other equitable relief, which could effectively block our ability to further develop and commercialize one or more of our product candidates. Defense of these claims, regardless of their merit, would involve substantial litigation expense and would be a substantial diversion of employee resources from our business. In the event of a successful claim of infringement against us, we may have to pay substantial damages, including treble damages and attorneys’ fees for willful infringement, pay royalties, redesign our infringing products or obtain one or more licenses from third parties, which may be impossible or require substantial time and monetary expenditure.
Additional competitors could enter the market with generic versions of our products, which may result in a material decline in sales of affected products.
Under the Hatch-Waxman Act, a pharmaceutical manufacturer may file an abbreviated new drug application, or ANDA, seeking approval of a generic copy of an approved innovator product. Under the Hatch-Waxman Act, a manufacturer may also submit an NDA under section 505(b)(2) that references the FDA’s prior approval of the innovator product. A 505(b)(2) NDA product may be for a new or improved version of the original innovator product. Hatch-Waxman also provides for certain periods of regulatory exclusivity, which preclude FDA approval (or in some circumstances, FDA filing and reviewing) of an ANDA or 505(b)(2) NDA. These include, subject to certain exceptions, the period during which an FDA-approved drug is subject to orphan drug exclusivity. In addition to the benefits of regulatory exclusivity, an innovator NDA holder may have patents claiming the active ingredient, product formulation or an approved use of the drug, which would be listed with the product in the FDA publication, “Approved Drug Products with Therapeutic Equivalence Evaluations,” known as the “Orange Book.” If there are patents listed in the Orange Book, a generic or 505(b)(2) applicant that seeks to market its product before expiration of the patents must include in the ANDA what is known as a “Paragraph IV certification,” challenging the validity or enforceability of, or claiming non-infringement of, the listed patent or patents. Notice of the certification must be given to the innovator, too, and if within 45 days of receiving notice the innovator sues to protect its patents, approval of the ANDA is stayed for 30 months, or as lengthened or shortened by the court.
Accordingly, if AM-101 and AM-111 are approved, competitors could file ANDAs for generic versions of AM-101 and AM-111, or 505(b)(2) NDAs that reference AM-101 and AM-111, respectively. If there are patents listed for AM-101 and AM-111 in the Orange Book, those ANDAs and 505(b)(2) NDAs would be required to include a certification as to each listed patent indicating whether the ANDA applicant does or does not intend to challenge the patent. We cannot predict whether any patents issuing from our pending patent applications will be eligible for listing in the Orange Book, how any generic competitor would address such patents, whether we would sue on any such patents, or the outcome of any such suit.
We may not be successful in securing or maintaining proprietary patent protection for products and technologies we develop or license. Moreover, if any patents that are granted and listed in the Orange Book are successfully challenged by way of a Paragraph IV certification and subsequent litigation, the affected product could immediately face generic competition and its sales would likely decline rapidly and materially. Should sales decline, we may have to write off a portion or all of the intangible assets associated with the affected product and our results of operations and cash flows could be materially and adversely affected.
Obtaining and maintaining our patent protection depends on compliance with various procedural, document submission, fee payment and other requirements imposed by governmental patent agencies, and our patent protection could be reduced or eliminated for non-compliance with these requirements.
Periodic maintenance fees on any issued patent are due to be paid to the USPTO and foreign patent agencies in several stages over the lifetime of the patent. The USPTO and various foreign governmental patent agencies require compliance with a number of procedural, documentary, fee payment and other similar provisions during the patent application process. While an inadvertent lapse can in many cases be cured by payment of a late fee or by other means in accordance with the applicable rules, there are situations in which noncompliance can result in abandonment or lapse of the patent or patent application, resulting in partial or complete loss of patent rights in the relevant jurisdiction. Non-compliance events that could result in abandonment or lapse of a patent or patent application include, but are not limited to, failure to respond to official actions within prescribed time limits, non-payment of fees and failure to properly legalize and submit formal documents. In such an event, our competitors might be able to enter the market, which would have a material adverse effect on our business.
The patent protection and patent prosecution for some of our product candidates is dependent on third parties.
While we normally seek to obtain the right to control prosecution, maintenance and enforcement of the patents relating to our product candidates, there may be times when the filing and prosecution activities for patents relating to our product candidates are controlled by our licensors. This is the case under our agreement with Xigen, where Xigen is entirely responsible for the prosecution and maintenance of the licensed patents and patent applications directed to AM-111. Xigen has no obligation to provide us any information with respect to such prosecution and we will not have access to any patent prosecution or maintenance information that is not publicly available. Although we monitor Xigen’s ongoing prosecution and maintenance of the licensed patents, if Xigen or any of our future licensing partners fail to prosecute, maintain and enforce such patents and patent applications in a manner consistent with the best interests of our business, including by payment of all applicable fees for patents covering AM-111 or any of our product candidates, we could lose our rights to the intellectual property or our exclusivity with respect to those rights, our ability to develop and commercialize those product candidates may be adversely affected and we may not be able to prevent competitors from making, using, and selling competing products. Specifically Xigen is concurrently developing another indication for XG-102, the active substance of AM-111. This may cause a conflict of interest and adversely affect Xigen’s ability to prosecute the patent portfolio licensed to us in the best interest of our business. In addition, even where we have the right to control patent prosecution of patents and patent applications we have licensed from third parties including with respect to the patents and applications licensed to us under our co-ownership and exploitation agreement with INSERM for AM-101, we may still be adversely affected or prejudiced by actions or inactions of our licensors and their counsel that took place prior to the date upon which we assumed control over patent prosecution. We are required to consult and cooperate with INSERM regarding the prosecution, maintenance, and enforcement of, and in certain instances INSERM has the right to independently enforce, the relevant patents, which may place those patients at risk or hinder our ability to develop and commercialize those product candidates or protect our patent rights.
If we fail to comply with the obligations in our intellectual property agreements, including those under which we license intellectual property and other rights from third parties, or otherwise experience disruptions to our business relationships with our licensors and partners, we could lose intellectual property rights that are important to our business.
We are a party to a number of intellectual property license and co-ownership agreements that are important to our business and expect to enter into additional such agreements in the future. Our existing agreements impose, and we expect that future agreements will impose, various diligence, commercialization, milestone payment, royalty, and other obligations on us. If we fail to comply with our obligations under these agreements, or we are subject to a bankruptcy, we may be required to make certain payments to the licensor, we may lose the exclusivity of our license, or the licensor may have the right to terminate the license, in which event we would not be able to develop or market
products covered by the license. Moreover, if we fail to comply with our obligations under our co-ownership and exploitation agreement with INSERM for AM-101, including certain commercialization requirements, or we are subject to a bankruptcy, INSERM may terminate the agreement and we may lose our rights to exclusively exploit and commercialize the applicable patents. In such event we would not be able to prevent INSERM from exploiting or licensing to the third parties the rights to exploit the applicable patents, which would have a material adverse effect on our ability to successfully commercialize the affected product candidates. Under our co-ownership agreement with INSERM we may be required to assign our rights in the relevant patents to INSERM if we choose not to or fail to continue to prosecute maintain or patents or patent applications in a given country or countries, in which event we would not be able to develop or market products covered by the applicable patents.
Licensing of intellectual property is of critical importance to our business and involves complex legal, business, and scientific issues. Disputes may arise regarding intellectual property subject to a licensing or co-ownership agreement, including:
|
|
·
|
the scope of rights granted under the agreement and other interpretation-related issues;
|
|
|
·
|
the extent to which our technology and processes infringe on intellectual property of the licensor or partner that is not subject to the agreement;
|
|
|
·
|
the sublicensing of patent and other rights;
|
|
|
·
|
our diligence and commercialization obligations under the agreement and what activities satisfy those obligations;
|
|
|
·
|
the ownership of inventions and know-how resulting from the joint creation or use of intellectual property by our licensors or partners and us and our collaborators; and
|
|
|
·
|
the priority of invention of patented technology.
|
If disputes over intellectual property and other rights that we have licensed or co-own prevent or impair our ability to maintain our current licensing or exclusivity arrangements on acceptable terms, we may be unable to successfully develop and commercialize the affected product candidates.
We may not be successful in obtaining or maintaining necessary rights to our product candidates through acquisitions and in-licenses.
We currently have rights to the intellectual property, through licenses from third parties and under patents that we own, to develop our product candidates. Because our programs may require the use of proprietary rights held by third parties, the growth of our business will likely depend in part on our ability to acquire, in-license, maintain or use these proprietary rights. In addition, our product candidates may require specific formulations to work effectively and efficiently and the rights to these formulations may be held by others. We may be unable to acquire or in-license any compositions, methods of use, processes, or other third-party intellectual property rights from third parties that we identify as necessary for our product candidates. The licensing and acquisition of third-party intellectual property rights is a competitive area, and a number of more established companies are also pursuing strategies to license or acquire third-party intellectual property rights that we may consider attractive. These established companies may have a competitive advantage over us due to their size, cash resources, and greater clinical development and commercialization capabilities.
For example, we sometimes collaborate with U.S. and foreign academic institutions to accelerate our preclinical research or development under written agreements with these institutions. Typically, these institutions provide us with an option to negotiate a license to any of the institution’s rights in technology resulting from the collaboration. Regardless of such option, we may be unable to negotiate a license within the specified timeframe or under terms that are acceptable to us. If we are unable to do so, the institution may offer the intellectual property rights to other parties, potentially blocking our ability to pursue our applicable product candidate or program.
In addition, companies that perceive us to be a competitor may be unwilling to assign or license rights to us. We also may be unable to license or acquire third-party intellectual property rights on terms that would allow us to make an appropriate return on our investment. If we are unable to successfully obtain a license to third-party intellectual
property rights necessary for the development of a product candidate or program, we may have to abandon development of that product candidate or program and our business and financial condition could suffer.
We may be involved in lawsuits to protect or enforce our patents or the patents of our licensors, which could be expensive, time consuming, and unsuccessful.
Competitors may infringe our patents or the patents of our licensors. To counter such infringement, we may be required to file claims against those competitors, which can be expensive and time-consuming. If we or one of our licensing partners were to initiate legal proceedings against a third party to enforce a patent covering one of our product candidates, the defendant could counterclaim that the patent covering our product candidate is invalid, overbroad and/or unenforceable, or that we infringe the defendant’s patents. In patent litigation in the United States, defendant counterclaims alleging invalidity, overbreadth and/or unenforceability are commonplace. Grounds for a validity challenge could be an alleged failure to meet any of several statutory requirements, including lack of novelty, obviousness, or non-enablement. Grounds for an unenforceability assertion could be an allegation that someone connected with prosecution of the patent withheld relevant information from the USPTO, or made a misleading statement, during prosecution. The outcome following legal assertions of invalidity and unenforceability is unpredictable. A court may decide that a patent of ours is invalid or unenforceable, in whole or in part, construe the patent’s claims narrowly or refuse to stop a third party from using the technology in question on the grounds that our patents do not cover that technology. An adverse result in any litigation proceeding could put one or more of our patents at risk of being invalidated or interpreted narrowly, which could adversely affect us.
Interference proceedings provoked by third parties or brought by us or declared by the USPTO may be necessary to determine the priority of inventions with respect to our patents or patent applications or those of our licensors. An unfavorable outcome could require us to cease using the related technology or to attempt to license rights to it from the prevailing party. Our business could be harmed if the prevailing party does not offer us a license on commercially reasonable terms or at all. Our defense of litigation or interference proceedings may fail and, even if successful, may result in substantial costs and distract our management and other employees. In addition, the uncertainties associated with litigation could have a material adverse effect on our ability to raise the funds necessary to continue our clinical trials, continue our research programs, license necessary technology from third parties, or enter into development partnerships that would help us bring our product candidates to market. We may not be able to prevent, alone or with our licensors, misappropriation of our intellectual property rights, particularly in countries where the laws may not protect those rights as fully as in the United States.
Furthermore, because of the substantial amount of discovery required in connection with intellectual property litigation, there is a risk that some of our confidential information could be compromised by disclosure during this type of litigation. There could also be public announcements of the results of hearings, motions, or other interim proceedings or developments. If securities analysts or investors perceive these results to be negative, it could have a material adverse effect on the price of our common shares.
We may be subject to claims that our employees, consultants, or independent contractors have wrongfully used or disclosed confidential information of third parties or that our employees have wrongfully used or disclosed alleged trade secrets of their former employers.
We employ and utilize the services of individuals who were previously employed or provided services to universities or other biotechnology or pharmaceutical companies. Although we try to ensure that our employees, consultants, and independent contractors do not use the proprietary information or know-how of others in their work for us, we may be subject to claims that we or our employees, consultants, or independent contractors have inadvertently or otherwise used or disclosed intellectual property, including trade secrets or other proprietary information, of any of our employee’s, consultant’s or independent contractor’s former employer or other third parties. Litigation may be necessary to defend against these claims. If we fail in defending any such claims, in addition to paying monetary damages, we may lose valuable intellectual property rights or personnel, which could adversely impact our business. Even if we are successful in defending against such claims, litigation could result in substantial costs and be a distraction to management and other employees.
Our reliance on our advisors, employees and third parties requires us to share our intellectual property and trade secrets, which increases the possibility that a competitor will discover them or that our intellectual property will be misappropriated or disclosed.
Because we rely on our advisors, employees and third-party contractors and consultants to research and develop and to manufacture our product candidates, we must, at times, share our intellectual property with them. We seek to protect our intellectual property and other proprietary technology in part by entering into confidentiality agreements and, if applicable, material transfer agreements, consulting agreements or other similar agreements with our advisors, employees, third-party contractors and consultants prior to beginning research or disclosing proprietary information. These agreements typically limit the rights of these advisors, employees and third parties to use or disclose our confidential information, including our intellectual property and trade secrets. Despite the contractual provisions employed when working with these advisors, employees and third parties, the need to share intellectual property and other confidential information increases the risk that such confidential information becomes known by our competitors, are inadvertently incorporated into the product development of others or are disclosed or used in violation of these agreements. Given that our proprietary position is based, in part, on our know-how, intellectual property and trade secrets, a competitor’s discovery of our intellectual property or trade secrets or other unauthorized use or disclosure would impair our competitive position and may have a material adverse effect on our business.
In addition, these agreements typically restrict the ability of our advisors, employees, third-party contractors and consultants to publish data potentially relating to our intellectual property, although our agreements may contain certain limited publication rights. For example, any academic institution that we may collaborate with in the future may expect to be granted rights to publish data arising out of such collaboration, provided that we are notified in advance and given the opportunity to delay publication for a limited time period in order for us to secure patent protection of intellectual property rights arising from the collaboration, in addition to the opportunity to remove confidential or trade secret information from any such publication. In the future, we may also conduct joint research and development programs that may require us to share intellectual property under the terms of our research and development or similar agreements. Despite our efforts to protect our intellectual property, our competitors may discover our trade secrets, either through breach of our agreements with third parties, independent development or publication of information by any of our third-party collaborators. A competitor’s discovery of our intellectual property would impair our competitive position and have an adverse impact on our business.
We may be subject to claims challenging the inventorship of our patents and other intellectual property.
We may be subject to claims that former employees, collaborators or other third parties have an interest in our patents or other intellectual property as an inventor or co-inventor. For example, we may have inventorship disputes arise from conflicting obligations of consultants or others who are involved in developing our product candidates. Litigation may be necessary to defend against these and other claims challenging inventorship or our ownership of our patents or other intellectual property. If we fail in defending any such claims, in addition to paying monetary damages, we may lose valuable intellectual property rights, such as exclusive ownership of, or right to use, valuable intellectual property. Such an outcome could have a material adverse effect on our business. Even if we are successful in defending against such claims, litigation could result in substantial costs and be a distraction to management and other employees.
We may not be able to protect our intellectual property rights throughout the world.
Filing, prosecuting, and defending patents on product candidates in all countries throughout the world would be prohibitively expensive, and our intellectual property rights in some countries outside the United States can be less extensive than those in the United States. In addition, the laws of some foreign countries do not protect intellectual property rights to the same extent as federal and state laws in the United States. Consequently, we may not be able to prevent third parties from practicing our inventions in all countries outside the United States, or from selling or importing products made using our inventions in and into the United States or other jurisdictions. As part of ordinary course prosecution and maintenance activities, we determine whether to seek patent protection outside the U.S. and in which countries. This also applies to patents we have acquired or in-licensed from third parties. In some cases this means that we, or our predecessors in interest or licensors of patents within our portfolio, have sought patent protection in a limited number of countries for patents covering our product candidates. Competitors may use our technologies in jurisdictions where we have not obtained or are unable to adequately enforce patent protection to develop their own products and further, may export otherwise infringing products to territories where we have patent
protection, but enforcement is not as strong as that in the United States. These products may compete with our products and our patents or other intellectual property rights may not be effective or sufficient to prevent them from competing.
Many companies have encountered significant problems in protecting and defending intellectual property rights in foreign jurisdictions. The legal systems of certain countries, particularly certain developing countries, do not favor the enforcement of patents, trade secrets, and other intellectual property protection, particularly those relating to biotechnology products, which could make it difficult for us to stop the infringement of our patents, the reproduction of our manufacturing or other know-how or marketing of competing products in violation of our proprietary rights generally. Proceedings to enforce our patent rights in foreign jurisdictions, whether or not successful, could result in substantial costs and divert our efforts and attention from other aspects of our business, could put our patents at risk of being invalidated or interpreted narrowly and our patent applications at risk of not issuing and could provoke third parties to assert claims against us. We may not prevail in any lawsuits that we initiate and the damages or other remedies awarded, if any, may not be commercially meaningful. Accordingly, our efforts to enforce our intellectual property rights around the world may be inadequate to obtain a significant commercial advantage from the intellectual property that we develop or license.
Risks Related to Employee Matters and Managing Growth
Our future growth and ability to compete depends on retaining our key personnel and recruiting additional qualified personnel.
Our success depends upon the continued contributions of our key management, scientific and technical personnel, many of whom have substantial experience with or been instrumental for us and our projects. Key management includes our executive officers Thomas Meyer, our founder, Chairman and Chief Executive Officer, Sven Zimmermann, our Chief Financial Officer and Bettina Stubinski, our Chief Medical Officer.
The loss of key managers and senior scientists could delay our research and development activities. Laws and regulations on executive compensation, including legislation in our home country, Switzerland, may restrict our ability to attract, motivate and retain the required level of qualified personnel. In Switzerland, new legislation affecting public companies has been passed that, among other things, (a) imposes an annual binding shareholders’ “say on pay” vote with respect to the compensation of executive management, including executive officers and the board of directors, (b) prohibits severance, advances, transaction premiums and similar payments to executive officers and directors and (c) requires companies to specify various compensation-related matters in their articles of association, thus requiring them to be approved by a shareholders’ vote. In addition, the competition for qualified personnel in the biopharmaceutical and pharmaceutical field is intense, and our future success depends upon our ability to attract, retain and motivate highly-skilled scientific, technical and managerial employees. We face competition for personnel from other companies, universities, public and private research institutions and other organizations. If our recruitment and retention efforts are unsuccessful in the future, it may be difficult for us to implement business strategy, which could have a material adverse effect on our business.
We expect to expand our sales and marketing, development, and regulatory capabilities, and as a result, we may encounter difficulties in managing our growth, which could disrupt our operations.
We expect to experience significant growth in the number of our employees and the scope of our operations, particularly in the areas of sales and marketing, and to a lesser extent, drug development and regulatory affairs. To manage our anticipated future growth, we must continue to implement and improve our managerial, operational and financial systems, expand our facilities and continue to recruit and train additional qualified personnel. Due to our limited financial resources, we may not be able to effectively manage the expansion of our operations or recruit and train additional qualified personnel. The expansion of our operations may lead to significant costs and may divert our management and business development resources. Any inability to manage growth could delay the execution of our business plans or disrupt our operations.
Risks Related to our Common Shares
The price of our common shares may be volatile and may fluctuate due to factors beyond our control.
The share price of publicly traded emerging biopharmaceutical and drug discovery and development companies has been highly volatile and is likely to remain highly volatile in the future. The market price of our common shares may fluctuate significantly due to a variety of factors, including:
|
|
·
|
positive or negative results of testing and clinical trials by us, strategic partners, or competitors;
|
|
|
·
|
delays in entering into strategic relationships with respect to development and/or commercialization of our product candidates or entry into strategic relationships on terms that are not deemed to be favorable to us;
|
|
|
·
|
technological innovations or commercial product introductions by us or competitors;
|
|
|
·
|
changes in government regulations;
|
|
|
·
|
developments concerning proprietary rights, including patents and litigation matters;
|
|
|
·
|
public concern relating to the commercial value or safety of any of our product candidates;
|
|
|
·
|
financing or other corporate transactions;
|
|
|
·
|
publication of research reports or comments by securities or industry analysts;
|
|
|
·
|
general market conditions in the pharmaceutical industry or in the economy as a whole; or
|
|
|
·
|
other events and factors beyond our control.
|
In addition, the stock market in general has recently experienced extreme price and volume fluctuations that have often been unrelated or disproportionate to the operating performance of individual companies. Broad market and industry factors may materially affect the market price of companies’ stock, including ours, regardless of actual operating performance.
Certain principal shareholders and members of our executive team and board of directors own a majority of our common shares and as a result will be able to exercise significant control over us, and your interests may conflict with the interests of such shareholders.
Certain principal shareholders and their affiliated entities as well as members of our executive team and board of directors own approximately 88.3% of our common shares. Depending on the level of attendance at our general meetings of shareholders, these shareholders may be in a position to determine the outcome of decisions taken at any such general meeting. Any shareholder or group of shareholders controlling more than 50% of the shares represented at our general meetings of shareholders may control any shareholder resolution requiring an absolute majority of the shares represented, including the election of members to the board of directors of our company, certain decisions relating to our capital structure, the approval of certain significant corporate transactions and certain amendments to our articles of association. To the extent that the interests of these shareholders may differ from the interests of the Company’s other shareholders, the latter may be disadvantaged by any action that these shareholders may seek to pursue. Among other consequences, this concentration of ownership may have the effect of delaying or preventing a change in control and might therefore negatively affect the market price of our common shares.
Future sales, or the possibility of future sales, of a substantial number of our common shares could adversely affect the price of our common shares.
Future sales of a substantial number of our common shares, or the perception that such sales will occur, could cause a decline in the market price of our common shares. Approximately 62.2% of our common shares outstanding are held by affiliates. If these shareholders sell substantial amounts of common shares in the public market, or the market perceives that such sales may occur, the market price of our common shares and our ability to raise capital through an issue of equity securities could be adversely affected. We have also entered into a registration rights
agreement pursuant to which we have agreed under certain circumstances to file a registration statement to register the resale of common shares held by certain of our shareholders, as well as to cooperate in certain public offerings of such common shares. We have also filed registration statements to register all common shares and other equity securities that we have issued under our prior equity incentive plans or may issue under our new omnibus equity compensation plan. These common shares may be freely sold in the public market upon issuance, subject to certain limitations applicable to affiliates. If a large number of our common shares are sold in the public market, the sales could reduce the trading price of our common shares and impede our ability to raise future capital.
We have broad discretion in the use of our cash and cash equivalents and may not use them effectively.
Our management has broad discretion in the use of our cash and cash equivalents and could spend them in ways that do not improve our results of operations or enhance the value of our common shares. The failure by our management to apply these funds effectively could result in financial losses that could have a material adverse effect on our business, cause the price of our common shares to decline and delay the development of our product candidates. Pending their use, we may invest our cash and cash equivalents in a manner that does not produce income or that loses value.
We do not expect to pay dividends in the foreseeable future.
We have not paid any dividends since our incorporation. Even if future operations lead to significant levels of distributable profits, we currently intend that any earnings will be reinvested in our business and that dividends will not be paid until we have an established revenue stream to support continuing dividends. The proposal to pay future dividends to shareholders will in addition effectively be at the discretion of our board of directors and shareholders after taking into account various factors including our business prospects, cash requirements, financial performance and new product development. In addition, payment of future dividends is subject to certain limitation pursuant to Swiss law or by our articles of association. Accordingly, investors cannot rely on dividend income from our common shares and any returns on an investment in our common shares will likely depend entirely upon any future appreciation in the price of our common shares.
We are a holding company with no material direct operations
We are a holding company with no material direct operations. As a result, we would be dependent on dividends, other payments or loans from our subsidiaries in order to pay a dividend. Our subsidiaries are subject to legal requirements of their respective jurisdictions of organization that may restrict their paying dividends or other payments, or making loans, to us.
We are a Swiss corporation. The rights of our shareholders may be different from the rights of shareholders in companies governed by the laws of U.S. jurisdictions.
We are a Swiss corporation. Our corporate affairs are governed by our articles of association and by the laws governing companies incorporated in Switzerland. The rights of our shareholders and the responsibilities of members of our board of directors may be different from the rights and obligations of shareholders and directors of companies governed by the laws of U.S. jurisdictions. In the performance of its duties, our board of directors is required by Swiss law to consider the interests of our company, our shareholders, our employees and other stakeholders, in all cases with due observation of the principles of reasonableness and fairness. It is possible that some of these parties will have interests that are different from, or in addition to, your interests as a shareholder. Swiss corporate law limits the ability of our shareholders to challenge resolutions made or other actions taken by our board of directors in court. Our shareholders generally are not permitted to file a suit to reverse a decision or an action taken by our board of directors but are instead only permitted to seek damages for breaches of fiduciary duty. As a matter of Swiss law, shareholder claims against a member of our board of directors for breach of fiduciary duty would have to be brought in Zug, Switzerland, or where the relevant member of our board of directors is domiciled. In addition, under Swiss law, any claims by our shareholders against us must be brought exclusively in Zug, Switzerland.
Our common shares are issued under the laws of Switzerland, which may not protect investors in a similar fashion afforded by incorporation in a U.S. state.
We are organized under the laws of Switzerland. There can be no assurance that Swiss law will not change in the future or that it will serve to protect investors in a similar fashion afforded under corporate law principles in the U.S., which could adversely affect the rights of investors.
U.S. shareholders may not be able to obtain judgments or enforce civil liabilities against us or our executive officers or members of our board of directors.
We are organized under the laws of Switzerland and our jurisdiction of incorporation is Zug, Switzerland. Moreover, a number of our directors and executive officers and a number of directors of each of our subsidiaries are not residents of the United States, and all or a substantial portion of the assets of such persons are located outside the United States. As a result, it may not be possible for investors to effect service of process within the United States upon us or upon such persons or to enforce against them judgments obtained in U.S. courts, including judgments in actions predicated upon the civil liability provisions of the federal securities laws of the United States. We have been advised by our Swiss counsel that there is doubt as to the enforceability in Switzerland of original actions, or in actions for enforcement of judgments of U.S. courts, of civil liabilities to the extent predicated upon the federal and state securities laws of the United States. Original actions against persons in Switzerland based solely upon the U.S. federal or state securities laws are governed, among other things, by the principles set forth in the Swiss Federal Act on International Private Law. This statute provides that the application of provisions of non-Swiss law by the courts in Switzerland shall be precluded if the result is incompatible with Swiss public policy. Also, mandatory provisions of Swiss law may be applicable regardless of any other law that would otherwise apply.
Switzerland and the United States do not have a treaty providing for reciprocal recognition and enforcement of judgments in civil and commercial matters. The recognition and enforcement of a judgment of the courts of the United States in Switzerland is governed by the principles set forth in the Swiss Federal Act on Private International Law. This statute provides in principle that a judgment rendered by a non-Swiss court may be enforced in Switzerland only if:
|
|
·
|
the non-Swiss court had jurisdiction pursuant to the Swiss Federal Act on Private International Law;
|
|
|
·
|
the judgment of such non-Swiss court has become final and non-appealable;
|
|
|
·
|
the judgment does not contravene Swiss public policy;
|
|
|
·
|
the court procedures and the service of documents leading to the judgment were in accordance with the due process of law; and
|
|
|
·
|
no proceeding involving the same position and the same subject matter was first brought in Switzerland, or adjudicated in Switzerland, or was earlier adjudicated in a third state and this decision is recognizable in Switzerland.
|
Our status as a Swiss corporation means that our shareholders enjoy certain rights that may limit our flexibility to raise capital, issue dividends and otherwise manage ongoing capital needs.
Swiss law reserves for approval by shareholders certain corporate actions over which a board of directors would have authority in some other jurisdictions. For example, the payment of dividends and cancellation of treasury shares must be approved by shareholders. Swiss law also requires that our shareholders themselves resolve to, or authorize our board of directors to, increase our share capital. While our shareholders may authorize share capital that can be issued by our board of directors without additional shareholder approval, Swiss law limits this authorization to 50% of the issued share capital at the time of the authorization. The authorization, furthermore, has a limited duration of up to two years and must be renewed by the shareholders from time to time thereafter in order to be available for raising capital. Additionally, subject to specified exceptions, including exceptions explicitly described in our articles of association, Swiss law grants pre-emptive rights to existing shareholders to subscribe for new issuances of shares. Swiss law also does not provide as much flexibility in the various rights and regulations that can attach to different categories of shares as do the laws of some other jurisdictions. These Swiss law requirements relating to our capital management may limit our flexibility, and situations may arise where greater flexibility would have provided benefits to our shareholders.
We are a foreign private issuer and, as a result, we are not subject to U.S. proxy rules and are subject to Exchange Act reporting obligations that, to some extent, are more lenient and less frequent than those of a U.S. domestic public company.
We report under the Securities Exchange Act of 1934, as amended, or the Exchange Act, as a non-U.S. company with foreign private issuer status. Because we qualify as a foreign private issuer under the Exchange Act and although we are subject to Swiss laws and regulations with regard to such matters and intend to furnish quarterly financial information to the SEC, we are exempt from certain provisions of the Exchange Act that are applicable to U.S. domestic public companies, including (i) the sections of the Exchange Act regulating the solicitation of proxies, consents or authorizations in respect of a security registered under the Exchange Act; (ii) the sections of the Exchange Act requiring insiders to file public reports of their stock ownership and trading activities and liability for insiders who profit from trades made in a short period of time; and (iii) the rules under the Exchange Act requiring the filing with the SEC of quarterly reports on Form 10-Q containing unaudited financial and other specified information, or current reports on Form 8-K, upon the occurrence of specified significant events. In addition, foreign private issuers are not required to file their annual report on Form 20-F until four months after the end of each financial year, while U.S. domestic issuers that are accelerated filers are required to file their annual report on Form 10-K within 75 days after the end of each fiscal year. Foreign private issuers are also exempt from the Regulation Fair Disclosure, aimed at preventing issuers from making selective disclosures of material information. As a result of the above, you may not have the same protections afforded to shareholders of companies that are not foreign private issuers.
As a foreign private issuer and as permitted by the listing requirements of Nasdaq, we follow certain home country governance practices rather than the corporate governance requirements of Nasdaq.
We are a foreign private issuer. As a result, in accordance with Nasdaq Listing Rule 5615(a)(3), we comply with home country governance requirements and certain exemptions thereunder rather than complying with certain of the corporate governance requirements of Nasdaq.
Swiss law does not require that a majority of our board of directors consist of independent directors. Our board of directors therefore may include fewer independent directors than would be required if we were subject to Nasdaq Listing Rule 5605(b)(1). In addition, we are not subject to Nasdaq Listing Rule 5605(b)(2), which requires that independent directors regularly have scheduled meetings at which only independent directors are present.
Although Swiss law also requires that we adopt a compensation committee, we follow home country requirements with respect to such committee. As a result, our practice varies from the requirements of Nasdaq Listing Rule 5605(d), which sets forth certain requirements as to the responsibilities, composition and independence of compensation committees. In addition, in accordance with Swiss law, we have opted not to implement a nominating committee. To this extent, our practice varies from the independent director oversight of director nominations requirements of Nasdaq Listing Rule 5605(e).
Furthermore, in accordance with Swiss law and generally accepted business practices, our articles of association do not provide quorum requirements generally applicable to general meetings of shareholders. Our practice thus varies from the requirement of Nasdaq Listing Rule 5620(c), which requires an issuer to provide in its bylaws for a generally applicable quorum, and that such quorum may not be less than one-third of the outstanding voting stock. Our articles of association provide for an independent proxy holder elected by our shareholders, who may represent our shareholders at a general meeting of shareholders, and we must provide shareholders with an agenda and other relevant documents for the general meeting of shareholders. However, Swiss law does not have a regulatory regime for the solicitation of proxies and company solicitation of proxies is prohibited for public companies in Switzerland, thus our practice varies from the requirement of Nasdaq Listing Rule 5620(b), which sets forth certain requirements regarding the solicitation of proxies. In addition, we have opted out of shareholder approval requirements for the issuance of securities in connection with certain events such as the acquisition of stock or assets of another company, the establishment of or amendments to equity-based compensation plans for employees, a change of control of us and certain private placements. To this extent, our practice varies from the requirements of Nasdaq Listing Rule 5635, which generally requires an issuer to obtain shareholder approval for the issuance of securities in connection with such events.
As a result of the above, you may not have the same protections afforded to shareholders of companies that are not foreign private issuers.
We may lose our foreign private issuer status, which would then require us to comply with the Exchange Act’s domestic reporting regime and cause us to incur significant legal, accounting and other expenses.
We are a foreign private issuer and therefore we are not required to comply with all of the periodic disclosure and current reporting requirements of the Exchange Act applicable to U.S. domestic issuers. We may no longer be a foreign private issuer as of June 30, 2015 (the end of our second fiscal quarter in the fiscal year after our initial public offering), which would require us to comply with all of the periodic disclosure and current reporting requirements of the Exchange Act applicable to U.S. domestic issuers as of January 1, 2016. In order to maintain our current status as a foreign private issuer, either (a) a majority of our common shares must be either directly or indirectly owned of record by non-residents of the United States or (b)(i) a majority of our executive officers or directors may not be United States citizens or residents, (ii) more than 50 percent of our assets cannot be located in the United States and (iii) our business must be administered principally outside the United States. If we lost this status, we would be required to comply with the Exchange Act reporting and other requirements applicable to U.S. domestic issuers, which are more detailed and extensive than the requirements for foreign private issuers. We may also be required to make changes in our corporate governance practices in accordance with various SEC and stock exchange rules. The regulatory and compliance costs to us under U.S. securities laws if we are required to comply with the reporting requirements applicable to a U.S. domestic issuer may be significantly higher than the cost we would incur as a foreign private issuer. As a result, we expect that a loss of foreign private issuer status would increase our legal and financial compliance costs and would make some activities highly time consuming and costly. We also expect that if we were required to comply with the rules and regulations applicable to U.S. domestic issuers, it would make it more difficult and expensive for us to obtain director and officer liability insurance, and we may be required to accept reduced coverage or incur substantially higher costs to obtain coverage. These rules and regulations could also make it more difficult for us to attract and retain qualified members of our board of directors.
We are an “emerging growth company,” and we cannot be certain if the reduced reporting requirements applicable to “emerging growth companies” will make our common shares less attractive to investors.
We are an “emerging growth company,” as defined in the JOBS Act. For as long as we continue to be an “emerging growth company,” we may take advantage of exemptions from various reporting requirements that are applicable to other public companies that are not “emerging growth companies,” including not being required to comply with the auditor attestation requirements of Section 404 of the Sarbanes-Oxley Act of 2002, exemptions from the requirements of holding a nonbinding advisory vote on executive compensation and shareholder approval of any golden parachute payments not previously approved. We could be an “emerging growth company” until 2019, although circumstances could cause us to lose that status earlier, including if the market value of our common shares held by non-affiliates exceeds $700 million as of any June 30 (the end of our second fiscal quarter) before that time, in which case we would no longer be an “emerging growth company” as of the following December 31 (our fiscal year end). We cannot predict if investors will find our common shares less attractive because we may rely on these exemptions. If some investors find our common shares less attractive as a result, there may be a less active trading market for our common shares and the price of our common shares may be more volatile.
If we fail to maintain an effective system of internal control over financial reporting, we may not be able to accurately report our financial results or prevent fraud. As a result, shareholders could lose confidence in our financial and other public reporting, which would harm our business and the trading price of our common shares.
Effective internal controls over financial reporting are necessary for us to provide reliable financial reports and, together with adequate disclosure controls and procedures, are designed to prevent fraud. Any failure to implement required new or improved controls, or difficulties encountered in their implementation could cause us to fail to meet our reporting obligations. In addition, any testing by us conducted in connection with Section 404 of the Sarbanes-Oxley Act of 2002, or any subsequent testing by our independent registered public accounting firm, may reveal deficiencies in our internal controls over financial reporting that are deemed to be material weaknesses or that may require prospective or retroactive changes to our financial statements or identify other areas for further attention or improvement. Inferior internal controls could also subject us to regulatory scrutiny and sanctions, impair our ability to raise revenue and cause investors to lose confidence in our reported financial information, which could have a negative effect on the trading price of our common shares.
We will be required to disclose changes made in our internal controls and procedures and our management will be required to assess the effectiveness of these controls annually. However, for as long as we are an “emerging
growth company” under the JOBS Act, our independent registered public accounting firm will not be required to attest to the effectiveness of our internal controls over financial reporting pursuant to Section 404. We could be an “emerging growth company” until 2019. An independent assessment of the effectiveness of our internal controls could detect problems that our management’s assessment might not. Undetected material weaknesses in our internal controls could lead to financial statement restatements and require us to incur the expense of remediation.
If securities or industry analysts do not publish research, or publish inaccurate or unfavorable research, about our business, the price of our common shares and our trading volume could decline.
The trading market for our common shares depends in part on the research and reports that securities or industry analysts publish about us or our business. We do not have any control over these analysts. We cannot assure you that analysts will cover us or provide favorable coverage. If one or more of the analysts who cover us downgrade our common shares or publish inaccurate or unfavorable research about our business, the price of our common shares would likely decline. If one or more of these analysts cease coverage of our company or fail to publish reports on us regularly, demand for our common shares could decrease, which might cause the price of our common shares and trading volume to decline.
We believe that we were a “passive foreign investment company,” or PFIC, for U.S. federal income tax purposes for our 2013 and 2014 taxable years, and we expect to be a PFIC for our current year and for the foreseeable future.
We believe that we were a “passive foreign investment company,” or PFIC, for U.S. federal income tax purposes for our 2013 and 2014 taxable years, and we expect to be a PFIC for our current year and for the foreseeable future. In addition, we may, directly or indirectly, hold equity interests in other PFICs, or Lower-tier PFICs. Under the Internal Revenue Code of 1986, as amended, or the Code, we will be a PFIC for any taxable year in which (i) 75% or more of our gross income consists of passive income or (ii) 50% or more of the average quarterly value of our assets consists of assets that produce, or are held for the production of, passive income. For purposes of the above calculations, a non-U.S. corporation that directly or indirectly owns at least 25% by value of the shares of another corporation is treated as if it held its proportionate share of the assets of the other corporation and received directly its proportionate share of the income of the other corporation. Passive income generally includes dividends, interest, rents, royalties and capital gains.
If we are a PFIC for any taxable year during which a U.S. investor holds our shares, the U.S. investor may be subject to adverse tax consequences, including (i) the treatment of all or a portion of any gain on disposition as ordinary income, (ii) the application of a deferred interest charge on such gain and the receipt of certain dividends and (iii) compliance with certain reporting requirements. For additional information, see “Item 10. Material U.S. Federal Income Tax Consideration for U.S. Holders.”
We are a clinical-stage biopharmaceutical company focused on the development of novel products for the treatment of inner ear disorders. Our most advanced product candidate, AM-101, is in Phase 3 clinical development for acute inner ear tinnitus under a special protocol assessment, or SPA, from the FDA. In two recently completed Phase 2 clinical trials, AM-101 demonstrated a favorable safety profile and statistically significant improvement in tinnitus loudness and other patient reported outcomes. We expect to have top-line Phase 3 clinical data for AM-101 in early 2016. We are also developing AM-111 for acute inner ear hearing loss. The FDA held a pre-IND meeting with us in September 2014 and provided formal feedback and guidance on our pre-clinical and CMC development and specifically on HEALOS. In response to this feedback, we are in the process of finalizing the design of HEALOS. In addition, we obtained an open IND from the FDA for REACH. We plan to conduct REACH in the U.S., comparing a single 0.4 mg/mL dose of AM-111 to a placebo. If we obtain sufficient funding, we intend to start HEALOS in the second half of 2015 and REACH in 2016. Both acute inner ear tinnitus and hearing loss are conditions for which there is high unmet medical need, and we believe that we have the potential to be the first to market in these indications.
We believe we are currently the clinically most advanced company working on inner ear therapeutics. We believe that AM-101 and AM-111 are the only drug candidates that have demonstrated positive efficacy in randomized placebo-controlled clinical trials in acute inner ear tinnitus and acute inner ear hearing loss. Our products are protected through intellectual property rights and, in addition, orphan drug status has been granted to AM-111.
Our product candidates are injected under local anesthesia into the middle ear by a technique called intratympanic, or i.t., injection. Once injected into the middle ear, the active substance, which is formulated in a biocompatible gel, diffuses into the inner ear. The procedure is short, safe, has a long history of use and allows for highly targeted drug delivery with minimal systemic exposure. It is performed by an ear, nose and throat, or ENT, specialist on an outpatient basis over one or more visits.
Our lead product candidate, AM-101, is targeting acute inner ear tinnitus. Tinnitus, frequently perceived as a ringing in the ears, is the perception of sound when no external sound is present. Similar to pain, it is an unwanted, unpleasant and thus distressing sensation. Tinnitus may result in further symptoms such as inability to concentrate, irritability, anxiety, insomnia, and clinical depression. In many cases, tinnitus significantly impairs quality of life and affects normal day-to-day activities.
Tinnitus is categorized as acute during the three months after onset and chronic when it persists for more than three months. Approximately 25% of American adults (50 million people) have experienced tinnitus with nearly 8% of American adults (16 million people) having frequent occurrences. Epidemiological studies reveal comparable prevalence rates for Europe. Among the tinnitus patients seen by general practitioners and ENT specialists in the United States and the top five European markets who reported seeing at least one tinnitus patient in the previous three months, approximately 36% of patients sought medical treatment during the first three months following tinnitus onset.
Possible causes of acute inner ear tinnitus include traumatic insult such as exposure to excessive noise, or middle ear infection (otitis media, or OM). We have conducted Phase 2 trials in this specific tinnitus population with AM-101, which demonstrated a favorable safety profile. Furthermore, in our Phase 2 clinical trials, AM-101 showed a dose dependent, persistent and clinically relevant improvement, as compared to the placebo, in subjective tinnitus loudness as well as other patient reported outcomes, such as tinnitus annoyance, tinnitus severity, sleep difficulties and general tinnitus impact. Our Phase 3 clinical program, which is similar in design to our Phase 2 trial design, is being conducted under a SPA from the FDA and also incorporates guidance from the European Medicines Agency, or EMA. We expect to have top-line data in early 2016. We believe that AM-101 has the potential to become the first product approved for the treatment of acute inner ear tinnitus.
Our second product candidate, AM-111, is being developed for the treatment of ASNHL. In sensorineural hearing loss, which is also referred to as inner ear hearing loss, there is damage to the sensory cells of the inner ear or the auditory nerve. Hearing loss is a heterogeneous disorder of many forms with a variety of causes. ASNHL may be triggered by a variety of insults, such as exposure to excessively loud sound, infection, inflammation or certain
ototoxic drugs. These insults may also result in tinnitus. In the United States, approximately 67,000 patients covered by health insurance are treated for sudden deafness annually. There are no currently approved pharmaceutical treatments for this patient population in the United States.
In our Phase 2 clinical trial, AM-111 showed a favorable safety profile. Furthermore, in patients with severe to profound ASNHL, we observed a clinically relevant improvement in hearing threshold, speech discrimination and a higher rate of complete tinnitus remission compared with placebo. The FDA held a pre-IND meeting with us in September 2014 and provided formal feedback and guidance on our pre-clinical and CMC development and specifically on HEALOS. In response to this feedback, we are in the process of finalizing the design of HEALOS. In addition, we obtained an open IND from the FDA for REACH. We plan to conduct REACH in the U.S., comparing a single 0.4 mg/mL dose of AM-111 to a placebo. If we obtain sufficient funding, we intend to start HEALOS in the second half of 2015 and REACH in 2016. We believe that, if approved, AM-111 could become the first approved pharmaceutical treatment for ASNHL. AM-111 received orphan drug designation for the treatment of ASNHL from both the FDA and the EMA.
We are a stock corporation organized under the laws of Switzerland. We began our current operations in 2003. On April 22, 2014, we changed our name from Auris Medical AG to Auris Medical Holding AG and transferred our operational business to our newly incorporated subsidiary Auris Medical AG, which is now our main operating subsidiary. Our principal office is located at Bahnhofstrasse 21, 6300 Zug, Switzerland, telephone number +41 729 71 94. On August 11, 2014, we completed our initial public offering of common shares, selling an aggregate of 10,113,235 common shares, which included 713,235 common shares sold on August 19, 2014 pursuant to an over-allotment option granted to the underwriters. All of these common shares were sold at a price to the public of $6.00 per share, yielding gross proceeds of $60.7 million.
Strengths
We believe we are a leader in the development of novel therapeutic products for inner ear disorders due to several factors.
|
|
·
|
First mover advantage.
With two product candidates in late stage clinical development, we believe we are currently the clinically most advanced company working on inner ear therapeutics. We believe that AM-101 and AM-111 are the only drug candidates that have demonstrated positive efficacy in randomized placebo-controlled clinical trials in acute inner ear tinnitus and acute inner ear hearing loss. As a result, we believe we will be the first to market with FDA or EMA-approved products for these indications.
|
|
|
·
|
Barriers to entry.
Our products are protected not only through intellectual property rights but also by the orphan drug status granted to AM-111 as well as by the know-how across several disciplines that is required to formulate and reliably deliver drugs to the inner ear. Our proprietary gel formulation, its manufacturing and its application are part of our intellectual property, know-how and competitive advantage. In addition, we believe that our intellectual property broadly directed to polymer-based formulations for the treatment of middle or inner ear disorders will serve as barriers to entry beyond our current products.
|
|
|
·
|
Efficient commercialization.
Given that the market for our therapeutic product candidates can be efficiently accessed through a limited number of specialist ENT physicians and specialist neurotologists, we intend to build our own sales force in order to commercialize these products in the United States and key European markets.
|
|
|
·
|
Experienced management.
Having been focused on developing therapeutic products for inner ear indications for over a decade, we believe that our senior management provides us with significant capabilities. Our Chief Executive Officer and founder, Thomas Meyer, has played several pivotal roles in our development and evolution. Prior to Auris Medical, he was the CEO of Disetronic, a fast growing Swiss diabetes care company sold to Roche in 2003. Other key members of our management team bring significant experience in clinical, product and business development in biopharmaceutical companies.
|
Strategy
Our goal is to become the leading biopharmaceutical company focused on developing and commercializing novel therapeutics to treat inner ear disorders. The key elements of our strategy to achieve this goal are:
|
|
·
|
Target inner ear disorders that have a defined pathophysiology and that are amenable to treatment.
We are focusing on inner ear disorders for which the pathophysiology is well characterized, can be effectively targeted and where affected patients seek medical attention proactively.
|
|
|
·
|
Use drug delivery techniques and proprietary drug formulations for effective, safe and rapid local administration to the inner ear.
We are developing treatments for inner ear disorders based on i.t. injections into the middle ear. This short outpatient procedure allows us to deliver therapeutic concentrations of drug in a highly targeted fashion with only minimal systemic exposure. We are using proprietary, fully biocompatible and biodegradable gel formulations for optimum middle ear tolerance and effective diffusion of active substances into the inner ear.
|
|
|
·
|
Bring AM-101 and AM-111 to market.
We plan to focus most of our resources on the development and commercialization of our two lead product candidates. AM-101 is in two Phase 3 clinical trials, based on a SPA from the FDA and guidance from the EMA. The FDA held a pre-IND meeting with us in September 2014 and provided formal feedback and guidance on our pre-clinical and CMC development and specifically on HEALOS. In response to this feedback, we are in the process of finalizing the design of HEALOS. In addition, we obtained an open IND from the FDA for REACH. We plan to conduct REACH in the U.S., comparing a single 0.4 mg/mL dose of AM-111 to a placebo. If we obtain sufficient funding, we intend to start HEALOS in the second half of 2015 and REACH in 2016.
|
|
|
·
|
Build an efficient commercial infrastructure to maximize the value of our product candidates.
We intend to build commercial operations in the North American market and in select European markets. In those markets, we expect our commercial operations to include specialty sales forces targeting ENTs and specialists in neurotology both in hospitals and in private practice. In other markets, we expect to seek partnerships that would maximize our products’ commercial potential.
|
|
|
·
|
Expand our pipeline through internal development, academic collaborations, in-licensing and acquisitions.
Through our work with academic research partners on the pathophysiology of tinnitus and hearing loss and clinical development we have gained novel insights that will help us both to create new pipeline products that act by way of novel mechanisms as well as to expand the therapeutic focus for our existing product candidates beyond their current indications. We plan to further maximize our commercial potential through product life cycle management, and with licensing or acquisition of compounds that could augment our product offering in ENT disorders.
|
The Inner Ear
We have focused our drug discovery and development efforts on targeting the cochlea, which together with the vestibular system constitutes the inner ear. The snail-shaped cochlea is the sensory organ at the periphery of the auditory system, which transmits sound along the auditory pathway up to the brain for hearing. Acute insults to the cochlea from a variety of sources – for example, loud noise, infection or insufficient blood supply – may lead to excessive levels of glutamate, the principal neurotransmitter in the cochlea as well as other pathological processes. This in turn may damage cochlear hair cells, which tune and amplify sound inside the cochlea or convert mechanical movement into neural signals, as well as cochlear neurons. Such damage may result in the symptoms of inner ear hearing loss and/or inner ear tinnitus that can be transitory as natural repair mechanisms set in or that become permanent when hair cells or neurons die or are permanently injured.
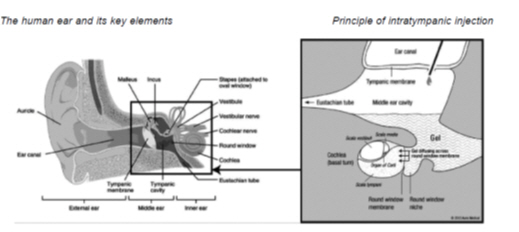
The human ear and its key elements Principle of intratympanic injection The human ear and its key elements (left). The external ear captures sound waves, amplifies and directs them through the ear canal to the ear drum, also known as the tympanic membrane, which transfers them further via the three small bones of the ossicular chain to the oval window of the inner ear. Here, the sound waves enter the fluid filled cochlea, travel up the turns and down again and are dissipated by the round window membrane. On their way through the cochlea, the sound waves are transduced by inner hair cells into neural activity by excitation of the cochlear nerve.
Principle of intratympanic injection (right). For the administration, the patient is positioned with the ear pointing up to ensure that the round window membrane is at the bottom of the middle ear. Following local anesthesia of the ear drum the drug is injected by the ENT into the middle ear, where it collects in the bottom part, allowing for diffusion of the active substance across the round window membrane.
Because the cochlea is located deep inside the head and because it is separated from the middle ear by a combination of bone and membranes, the interior of the cochlea is a challenging location for drug delivery. We have chosen to deliver our products via i.t. injection across the ear drum (also known as the tympanic membrane) into the middle ear cavity. By formulating our products with biocompatible gels, we facilitate the diffusion of active substances across the round window membrane into the cochlea at clinically meaningful concentrations.
Market
Inner ear disorders, including hearing loss, tinnitus, Meniere’s Disease and balance disorders, are common and often inter-related conditions. Chronic inner ear disorders such as tinnitus and hearing loss are highly prevalent. According to a 2012 publication by Langguth and Elgoyhen in the journal
Expert Opinion in Pharmacotherapy
,
approximately 25% of American adults (50 million people) have experienced tinnitus with nearly 8% of American adults (16 million people) having frequent occurrences. According to the National Institute on Deafness and Other Communication Disorders (NIDCD), 36 million Americans, or 17% of the adult U.S. population, have a hearing loss. Epidemiological studies reveal comparable prevalence rates for Europe.
According to a 2011 publication by Hall et al. in the journal BMC Health Services Research, among the tinnitus patients seen by physicians who reported seeing at least one tinnitus patient in the previous three months, approximately 36% of patients sought medical treatment during the first three months following the onset of the disorder. Over 60,000 people in the United States are affected by sudden deafness annually.
The market for ear disorders is underserved despite the fact that according to a 2007 report by the consulting firm NeuroInsights, hearing loss ranks among the top ten neurologic disorders by worldwide prevalence, ranking above attention deficit disorders, Alzheimer’s disease and multiple sclerosis. There are three main reasons for this:
Inner ear physiology.
It has been extremely challenging for pharmaceutical companies to deliver drugs at effective concentrations to the inner ear. Like the eye, the inner ear is a protected space. Systemically administered drugs such as intravenous or oral formulations in doses high enough to reach effective inner-ear concentrations often bring unacceptable systemic toxicity.
Heterogeneity of inner ear disorders.
Hearing loss and tinnitus are symptoms of many different underlying etiologies, and they manifest themselves in many different ways. For example, tinnitus may be provoked by such different proximal causes as whiplash injury, excessive noise exposure, the flu or even certain dental problems. In some cases, the tinnitus originates inside the cochlea, but then becomes “centralized,” that is, the phantom sound persists even long after the initial source of the sensation has been removed. There has been a dearth of knowledge about the pathophysiology of tinnitus and hearing loss, which has hindered the pharmaceutical industry in pursuing therapeutics in this area.
Lack of clinical trial paradigms.
Historically, there have been challenges regarding the clinical endpoints used in measuring changes in tinnitus. Since tinnitus usually is perceived only by the patient affected by it, there is no direct way of measuring it. Like pain, tinnitus assessments have to rely on subjective endpoints. Tinnitus assessments consist either of psychoacoustic measures, performed by audiologists and other hearing specialists and sometimes considered as “semi-objective,” or they are based on patient reported outcomes, or PROs. Unlike in pain, there has been a lack of guidelines and validation work on these PROs, and the relevance and reliability of psychoacoustic measures as efficacy outcome variables have been questioned.
For these reasons, the industry’s discovery and development of novel therapies for inner ear disorders has lagged far behind efforts in other therapeutic areas.
We are addressing each of these issues with our approach to developing therapeutics targeting the inner ear. Using i.t. injection to deliver our product candidates to the inner ear reduces systemic exposure. We target specific types of tinnitus and hearing loss that are addressable with drug-based therapies. We have worked with regulatory agencies to develop an acceptable clinical trial paradigm assessing subjective endpoints culminating, for example, in our SPA for AM-101.
Our Localized Delivery Solution for the Inner Ear
The inner ear is a protected part of the body, analogous to the eye. It is hidden in the temporal bone, behind the middle ear and the ear drum. In addition, it is very tiny: the cochlea measures about the size of the fingernail on the little finger. Therefore, therapeutically targeting the inner ear is not easy. There is currently no FDA or EMA approved drug therapy for the treatment of inner ear disorders on the market.
The blood labyrinth barrier is a major physiological divider separating the inner ear from systemic circulation, critically preserving the inner ear’s microenvironment. Systemic drug dose levels capable of having a therapeutic effect on the inner ear are often high enough to cause adverse side effects.
An alternative approach is to administer drugs locally through i.t. injection to maximize efficacy and minimize systemic side effects. With i.t. administration, the drug is injected via a needle through the anesthetized ear drum into the middle ear cavity. The drug then diffuses across the semi-permeable round window membrane (RWM) into the inner ear. Our lead product candidates are administered by i.t. injection. We chose this approach after thorough evaluation of all available alternatives because it offers the optimal combination of access, convenience, physician familiarity and safety. We formulated our product candidates specifically with i.t. delivery in mind.
One of the key shortcomings of current i.t. approaches is the use of injectable solutions that may easily drain off via the Eustachian tube, thus preventing or reducing effective diffusion into the cochlea. With our proprietary gel formulations for i.t. injections we overcome this “draining off,” facilitate contact with the RWM and achieve effective diffusion into the cochlea.
Both AM-101 and AM-111 are formulated in a viscous gel of sodium hyaluronate that is biocompatible, biodegradable, and isotonic (that is, having the same salt concentration and therefore not causing any pressure build up on either side of the RWM). The gel has a neutral pH which helps minimize potential irritation to the ear. We selected its viscosity in a way that the free movement of the ossicular chain, which transfers the vibrations of the eardrum to the inner ear, is not impacted. The presence of highly viscous gels in the middle ear may cause transient conductive hearing loss.
In addition, in the case of AM-111, we are employing D-TAT, a peptidic active transporter technology that allows the transport of a large molecule to the inner ear that would normally be blocked by the RWM. This novel use of D-TAT brings peptides not only behind the RWM but inside cells in the inner ear. To our knowledge, we are the first company to be delivering intracellular peptides to the inner ear using an active transporter such as D-TAT.
The i.t. injection procedure by which our therapeutics are delivered to the RWM is a minimally invasive procedure that is relatively simple to perform by an experienced ENT specialist. Most ENT physicians and neurotologists have a high degree of comfort with i.t. injection and it is well-accepted by patients. A billable procedure, i.t. injection is routinely reimbursed under a broader reimbursement code. For the injection, patients lie on a stretcher or on a reclined exam chair, treated ear up; the injection is performed under local anesthesia of the eardrum by an ENT specialist using a microscope. Following the procedure, patients rest for 20 to 30 minutes to ensure maximum physical contact of the drug with the RWM. The tympanic membrane heals rapidly, usually within a few days, and the procedure may be performed several times. Often performed in children suffering from ear infections, the reversible opening of the eardrum is one of the most frequent ENT procedures.
Our Product Candidates
The following table summarizes our product development pipeline:
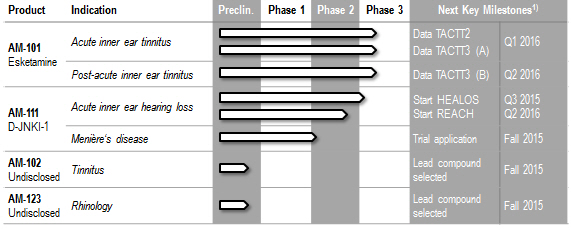
_______________
|
|
(1)
|
Dates of key milestones are indicative and subject to change.
|
AM-101 in Tinnitus
Our most advanced clinical program is AM-101, Esketamine hydrochloride gel, which has commenced Phase 3 clinical trials in acute inner ear tinnitus in both the United States under a SPA from the FDA and in Europe. Esketamine hydrochloride is a potent, small molecule non-competitive NMDA, or N-methyl-D-aspartate, receptor antagonist. AM-101 is formulated in a biocompatible gel and delivered via i.t. injection. It has demonstrated safety and efficacy in two Phase 2 clinical trials. Based on our SPA agreement with the FDA and scientific advice from the EMA, we have initiated two pivotal clinical trials with highly similar design, one in North America (Efficacy and Safety of AM-101 in the Treatment of Acute Peripheral Tinnitus 2, or TACTT2) and one in Europe, which we refer to as TACTT3. AM-101 has the potential to be the first drug to gain approval for treating acute inner ear tinnitus.
Tinnitus
Tinnitus, frequently perceived as a ringing in the ears, is the perception of sound when no external sound is present. Similar to pain, it is an unwanted, unpleasant and thus distressing sensation. Tinnitus may result in further symptoms such as inability to concentrate, irritability, anxiety, insomnia, and clinical depression. In many cases, tinnitus significantly impairs quality of life and affects normal day-to-day activities.
Tinnitus is categorized as acute during the first three months and chronic when it persists for more than three months. The distinction between acute and chronic is based on the clinical observation that spontaneous recovery or complete remission of tinnitus is much more likely to occur in the first days, weeks and months following its onset. The chances of spontaneous recovery decline exponentially as the acute phase progresses. In the chronic stage, improvement is much more unlikely, and the therapeutic focus shifts from curing to managing the disorder. In some cases, tinnitus originates inside the cochlea, or the periphery of the auditory system, but then becomes “centralized,” that is, the phantom sound persists even long after the initial source of the sensation has been removed.
Tinnitus is a symptom that can be triggered by a variety of diseases or incidents such as noise trauma, infection, inflammation, vascular problems, temporomandibular joint dysfunction, head trauma or whiplash injury. In the majority of cases the tinnitus originates in the cochlea, but the precise mechanisms of tinnitus generation are still the subject of considerable debate and remain to be fully elucidated. In our development we are focusing on one particular, well-defined type of tinnitus generation based on glutamate excitotoxicity.
Acoustic trauma and other insults to the inner ear may trigger increased levels of extra-cellular glutamate, which in turn cause excessive activation of cochlear NMDA receptors. This process results in damage or killing of sensory cells and is thought to be responsible for abnormal spontaneous “firing” of auditory nerves, which may be perceived as tinnitus. Under normal circumstances, the NMDA receptors are thought to play no role in the auditory nerve’s transmission of nerve pulses that carry sound information. In case of a trauma such as excessive sound exposure these receptors are activated and thus tinnitus is triggered.
Current Therapies and Unmet Need
Tinnitus treatments may be categorized according to whether they treat the underlying cause or provide symptomatic relief. It is rarely possible to treat the underlying cause. When it is possible, treatment often involves a surgical procedure to resect tumors or vascular abnormalities. In contrast, treatments to provide symptomatic relief are highly diverse, reflecting the general lack of understanding of the underlying pathophysiology.
Currently, the most widely employed treatment options include counseling, cognitive behavioral therapy, various forms of sound therapies, tinnitus retraining therapy, or TRT, herbal and vitamin supplements, ginkgo biloba, vasodilators, steroids, benzodiazepines and tricyclic antidepressants.
Sound-based therapies and TRT are some of the most commonly employed treatments for tinnitus. TRT is a non-pharmacological intervention that employs low-level sound emitted by a so-called “masking device” worn behind or in the ear. TRT also incorporates patient counseling to help habituate patients to their tinnitus. In those cases in which it is effective, TRT takes one to two years before patients “learn” to ignore tinnitus without the aid of a masking device. TRT can cost $2,500 to $3,000, including the masking devices. After an initial period of enthusiasm in the 1980s, masking devices declined in popularity among clinicians because it became clear that many patients who agreed to try them were nonusers six months later. While classic sound based therapies are based on broadband sound, newer therapies use sound individually tailored to the hearing loss and tinnitus characteristics.
Although there are no approved drugs in the United States for the treatment of tinnitus, there is widespread off-label use of drugs approved for other indications. The U.K. Royal National Institute for the Deaf reports that more than three million prescriptions are written each year in the United States and Europe for drugs that purport to offer tinnitus relief, drugs for which there is no proven efficacy.
The local anesthetic and antiarrhythmic drug lidocaine is the only substance to date that is known to attenuate tinnitus, albeit only temporarily. This illustrates that tinnitus can be addressed using pharmacological intervention. However, lidocaine causes severe vertigo and other side effects, preventing its widespread clinical use.
Our Solution – AM-101
Therapeutic rationale for AM-101 in tinnitus
The active pharmaceutical ingredient of AM-101 is Esketamine hydrochloride, a well-known small molecule non-competitive NMDA receptor antagonist. As described above, acoustic trauma and other insults to the inner ear have been shown in animal studies to activate cochlear NMDA receptors. The antagonist effect of Esketamine towards the NMDA receptor aims to suppress the aberrant activity of the auditory nerve and thus diminish tinnitus.
The NMDA receptor was first validated as a target for the treatment of tinnitus using an animal behavioral model of tinnitus triggered by salicylate, the active substance of aspirin. Salicylate is known to trigger temporary tinnitus when administered in high doses. The animal model demonstrated that local administration of different NMDA antagonists to the inner ear allowed for suppression of salicylate induced tinnitus. Together with INSERM, we developed a much more clinically relevant model of tinnitus induced by acute acoustic trauma, or AAT. Unlike salicylate-induced tinnitus, AAT triggers glutamate excitotoxicity and may lead to irreversible damage to sensory cells. It does not result in tinnitus in all cases, but where it sets in, it may be permanent. In our pre-clinical trials, we
demonstrated that AM-101 was able to suppress this type of tinnitus. Further preclinical work demonstrated that tinnitus could be suppressed even when drug was administered after the onset of tinnitus.
Toxicology and tolerability studies confirmed that AM-101 had no impact on hearing, even at much higher doses than those needed for suppressing tinnitus. Animal biodistribution studies showed rapid diffusion of the active substance into the cochlea. Concentrations decreased over several days due to clearance.
Ketamine has been used clinically for decades as an anesthetic and analgesic. Esketamine is the S-enantiomer of Ketamine and was introduced in a small number of markets outside the United States as a more potent NMDA receptor antagonist with more favorable side effects than racemic Ketamine. The development of AM-101 has benefitted from the long-standing clinical use of Ketamine and Esketamine as well as the wealth of published pharmacology, pharmacokinetic and safety data. We are using Esketamine in doses that result in systemic exposure several orders of magnitude lower than those seen when Esketamine is used as an anesthetic at clinically safe doses.
Tinnitus endpoints
Given the lack of existing tinnitus treatments, there have been no fully validated or universally accepted outcome measures for clinical trials. There are two fundamental types of efficacy outcome variables. Patient reported outcomes, or PROs, such as the visual or numerical rating of tinnitus loudness or tinnitus questionnaires provide direct subjective measures of tinnitus and its impact on sleep, relaxation, communication, emotions, social interactions and other factors. For example patients are asked a single question to rate the loudness of their tinnitus “right now” on a scale from 0 (“no tinnitus heard”) to 100 (“tinnitus extremely loud”). Among several tinnitus questionnaires, the 25 item TFI is the most recent. It was developed and validated broadly in line with the PRO guidelines of the FDA and was introduced in 2011 by Meikle et al. following extensive validation work in the journal Ear & Hearing. Alternatively, measures commonly referred to as psychoacoustic may be performed by an audiologist, which is why they are considered “semi-objective.” They seek to determine how loud a masking sound has to be to cover the tinnitus (minimum masking level, or MML) or how loud the tinnitus is compared to reference sound (equal loudness match).
In our Phase 2 clinical trials, PROs showed good responsiveness and consistent results, whereas psychoacoustic measures proved highly variable and unreliable. Therefore, following discussions with the FDA and EMA, it was agreed that our Phase 3 clinical program for AM-101 will be based on PROs with the improvement of subjective tinnitus loudness being defined as the primary efficacy endpoint. As part of the SPA with the FDA, it was agreed that improvement as measured by the TFI questionnaire will serve as a co-primary efficacy endpoint in our TACTT2 trial.
AM-101 Clinical Development
Phase 1/2
We conducted the first clinical evaluation of AM-101 in a Phase 1/2 double blind, randomized, placebo-controlled trial that included dose escalation from 0.03 to 0.81 mg/mL. The trial enrolled 24 patients suffering for up to three months from severe or disabling permanent inner ear tinnitus caused by AAT or sudden deafness and after unsuccessful steroid treatment. The primary objective of the trial was to evaluate the safety of intratympanically delivered AM-101. This first clinical trial showed that single doses of intratympanically administered AM-101 were well tolerated up to the highest tested dose of 0.81 mg/mL. Only small traces of Esketamine and its primary metabolite were detected in blood samples within the first hours following treatment administration.
Phase 2
Following successful completion of our Phase 1/2 trial, we conducted two multi-center Phase 2 trials, one in Europe (Treatment of Acute Inner Ear Tinnitus 0 or TACTT0) and the other in Europe and the United States (which we refer to as TACTT1).
TACTT0
TACTT0 was conducted at 28 European sites between March 2009 and May 2011. This trial was a double-blind, randomized, placebo controlled, multiple dose, parallel group, Phase 2 clinical trial. It enrolled patients with persistent inner ear tinnitus as a result of AAT, OM, or idiopathic inner ear hearing loss, or ISSNHL, occurring not
more than three months prior, and with a MML of at least 5 dB. Trial participants received three i.t. administrations of AM-101 at dose levels of either 0.27 mg/mL or 0.81 mg/mL or placebo over three consecutive days. A total of 248 patients were randomized (approximately eighty per treatment group). The improvement in the MML was the primary efficacy endpoint. The improvement in subjective tinnitus loudness and in tinnitus annoyance were co-primary efficacy endpoints.
In this trial, AM-101 further demonstrated a favorable safety profile. AM-101 was well tolerated and had no negative impact on hearing. Adverse events were mostly local and related primarily to anticipated temporary changes in tinnitus loudness and muffled hearing following the i.t. injection procedure. These effects usually resolved with closure of the ear drum. In 93% of cases, the ear drum was fully closed five days after the last injection. Seven patients experienced a total of nine nonfatal serious adverse events, of which four occurred in the placebo group. All serious adverse events were considered either not related or unlikely related to treatment. In the placebo group, one patient died because of cardiomyopathy, which was considered unrelated.
Efficacy analysis revealed a differentiated picture. Overall, the trial failed to demonstrate a treatment benefit based on the change in the MML as there was no difference in outcomes between treatment groups. However, further analysis of certain pre-specified outcome variables and subgroups revealed consistent differences between changes in the MML and changes in PROs and substantial variability in MML measures. Unlike the MML, the PROs, including tinnitus loudness and tinnitus annoyance, indicated different outcomes in treatment groups. In addition, outcomes differed consistently between patients with tinnitus triggered by AAT or OM, and those with tinnitus caused by ISSNHL. In case of the latter, no treatment effects were evident. Lastly, outcomes in unilateral tinnitus patients (one ear affected) were superior to those in bilateral tinnitus patients.
The further efficacy analysis focused on the subgroup of patients with tinnitus caused by AAT or OM (n=118), that is, patients with well-established cochlear origin of tinnitus. It also focused primarily on unilateral tinnitus patients (n=84) since they allowed for a direct measure of a treatment effect, free from any interference arising from the other, untreated ear in bilateral tinnitus. For this AAT-and OM-subgroup, the trial demonstrated a dose-dependent and persistent improvement in PROs. Patients in this subgroup who received AM-101 at a dose level of 0.81 mg/mL showed a statistically significant improvement 90 days post-treatment in subjective tinnitus loudness and tinnitus annoyance as well as in tinnitus-related sleep difficulties and overall tinnitus impact compared with placebo. The improvement was dose dependent and statistically significant across all PROs in the analysis of covariance, or ANCOVA, statistical test. The ANCOVA model is commonly used in statistics for testing for differences between multiple treatment groups, and takes into account the baseline value of the respective test variable (covariate). Similar, but less pronounced outcomes were observed when also bilateral tinnitus cases were included; the improvement in tinnitus loudness, sleep difficulties and overall tinnitus impact in the enlarged subgroup was still statistically significant.
Improvement in tinnitus PROs
|
AM-101
|
|||||
|
Placebo
|
Low Dose
|
High Dose
|
|||
|
Point improvement in tinnitus loudness (0-100 point scale)
|
|||||
|
LS means (n)
|
1.4 (23)
|
16.0 (25)
|
24.1 (29)
|
||
|
LS mean difference (95% confidence interval)
|
14.6 (1.4, 27.7)
|
22.7 (10.3, 35.1)
|
|||
|
P-value
|
0.0308*
|
0.0005***
|
|||
|
Point improvement in tinnitus annoyance (0-100 point scale)
|
|||||
|
LS means (n)
|
10.8 (23)
|
21.7 (25)
|
27.8 (29)
|
||
|
LS mean difference (95% confidence interval)
|
10.9 (1.4, 23.2)
|
17.0 (5.4, 28.6)
|
|||
|
P-value
|
0.0805
|
0.0047**
|
|||
|
Point improvement in difficulties falling asleep (0-100 point scale)
|
|||||
|
LS means (n)
|
11.8 (21)
|
29.8 (15)
|
38.7 (22)
|
||
|
LS mean difference (95% confidence interval)
|
18.1 (2.5, 33.6)
|
26.9 (13.0, 40.9)
|
|||
|
P-value
|
0.0234*
|
0.0003***
|
|||
|
Point improvement in tinnitus impact (0-24 point scale)
|
|||||
|
LS means (n)
|
2.5 (22)
|
5.5 (25)
|
5.9 (27)
|
||
|
LS mean difference (95% confidence interval)
|
3.0 (0.1, 5.8)
|
3.4 (0.8, 6.0)
|
|||
|
P-value
|
0.0400*
|
0.0124*
|
|||
ANCOVA results for changes in PROs from baseline to Day 90 in patients with unilateral tinnitus following AAT or OM. Shown are least square (LS) means for treatment groups, differences for the active groups compared with placebo including 95% confidence interval and the p-value: * significant at 0.05 level; ** significant at 0.01 level; *** significant at 0.001 level. P-value is a conventional statistical method for measuring the statistical significance of clinical results. In clinical trials, the “p-value” is the probability that the result was obtained by chance. By convention, a “p-value” that is less than 0.05 is considered statistically significant. Tinnitus loudness, annoyance and difficulties falling asleep were rated by patients on a scale from 0 to 100 and tinnitus impact by the THI-12 questionnaire (maximum score 24 points).
The improvement in PROs was gradual over the 90 day observation period. At Day 90 the mean improvement in tinnitus loudness was 48% in the AM-101 0.81 mg/mL group compared to 9% in the placebo group.
Improvement in tinnitus loudness over time
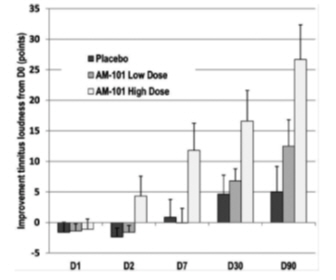
Mean improvement of tinnitus loudness from baseline in patients with unilateral tinnitus following AAT or OM (n=84). Shown are changes from baseline D0 (before first injection) to D1 (before second injection), D2 (before third injection) and the follow-up visits at D7, D30 and D90. Whiskers: standard error mean.
64% of patients in the high dose group rated their tinnitus severity at day 90 compared to baseline as “much improved” or “very much improved”, compared with 34% of patients in the placebo group. The majority of placebo treated patients reported only “somewhat improved” tinnitus severity.
Global patient impression of change in tinnitus severity
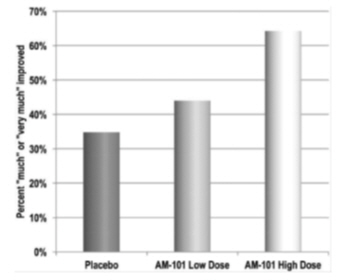
Percentage of patients with unilateral tinnitus following AAT or OM (n=76) reporting at Day 90 “much improved” or “very much improved” tinnitus severity compared with baseline.
Further analysis of efficacy results in the ISSNHL subgroup showed an unexpectedly high rate of spontaneous remission and substantial heterogeneity in outcomes. When patients with certain pre-specified tinnitus characteristics were excluded, a treatment effect was even observed with a majority of ISSNHL-tinnitus patients. Given the high variability and the uncertainty over the precise trigger of the tinnitus in ISSNHL, we decided to continue clinical development exclusively in tinnitus with established cochlear origin (such as AAT and OM).
TACTT1
TACTT1, our second double-blind, randomized, placebo-controlled Phase 2 clinical trial, was conducted between 2011 and 2013 in the United States, Belgium, Germany and Poland to complement the TACTT0 trial. The trial was not powered to demonstrate statistical significance between treatment groups, but rather designed to evaluate whether repeated doses were better than a single dose in attenuating tinnitus. Therefore no statistical hypotheses were defined, but the trial was expected to indicate relevant efficacy trends.
Enrollment consisted of 85 patients suffering from acute inner ear tinnitus following AAT or OM. Tinnitus after barotrauma and middle ear surgery were added as traumatic cases in addition to AAT.
Patients received single (Cohort 1) or multiple (Cohort 2: three injections over two weeks) doses of AM-101 at a dose level of 0.81 mg/mL or placebo. Each cohort had its own placebo group, and the placebo groups were pooled for certain statistical analyses describes below. Unlike TACTT0, this trial allowed bilateral treatment where tinnitus was present in both ears. The outcome measures in TACTT1 reflected insights gained from TACTT0. Specifically, subjective tinnitus loudness was selected as the primary efficacy measure, while the highly variable MML was monitored as a secondary read out.
TACTT1 demonstrated the safety and tolerability outcomes observed in the preceding trials. Again, there were no systemic side effects. One non-fatal serious adverse event was observed in the active treatment group; it was considered unrelated to the treatment. It further demonstrated the gradual improvement in PROs in AM-101 treated groups that had already been observed in TACTT0. The ANCOVA model in the primary efficacy analysis showed no statistically significant trend for improvement in subjective tinnitus loudness related to the number of injections (single dose AM-101, triple dose AM-101 and placebo pooled; p=0.084).
When comparing the improvement in tinnitus loudness in patients with unilateral tinnitus following traumatic injury to the cochlea or OM, treatment effects in TACTT1 were smaller than in TACTT0. The effect size was 0.83 where AM-101 had been administered three times over three consecutive days in TACTT0, 0.47 for three injections in weekly intervals (TACTT1) and 0.39 with single dose administration (TACTT1). The effect size is a commonly
used standardized measure of the magnitude of observed effect to compare outcomes across different trials. Effect sizes between 0.5 and 0.8 are considered moderate, and above 0.8 as large. The observed differences in effect sizes suggest that repeated and concentrated application of AM-101 and hence concentrated inhibition of cochlear NMDA receptors provides superior treatment benefits. Over the two Phase 2 clinical trials, AM-101 0.81 mg/mL showed a statistically significant improvement in the AAT and OM group of patients when compared against placebo (p=0.002).
Effect size of tinnitus loudness improvement in TACTT0 and TACTT1
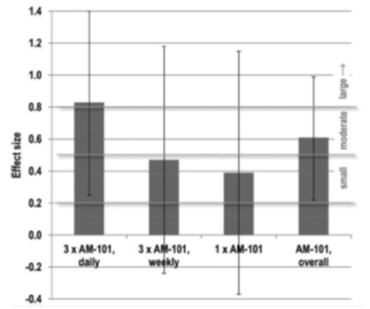
Effect size of tinnitus loudness improvement from baseline to 90 days after last treatment administration for three different dose regimens – three doses over three consecutive days, three doses over two weeks, single dose – and pooled together in patients with unilateral tinnitus following AAT or OM (n=118) in the TACTT0 and TACTT1 trials. Effect size is calculated as mean difference in tinnitus loudness improvement between patients treated with AM-101 0.81 mg/mL and patients treated with placebo, standardized by the standard deviation. Whiskers: 95% confidence interval.
As in the TACTT0 trial, psychoacoustic measures such as MML were marked by high variability, confirming their limited suitability and reliability as efficacy outcome measure.
AM-101 Phase 3 Clinical Program
With a clear regulatory plan in place based on our SPA with the FDA and scientific advice from the EMA, we have initiated two pivotal trials with AM-101 with highly similar designs, one in North America (TACTT2) and one in Europe (TACTT3). TACTT2 will enroll 330 patients, while TACTT3 (Europe) will enroll 300 patients, both during the acute stage. Trial participants will receive three injections of AM-101 0.87 mg/mL or placebo over three to five days and will be followed for 84 days. Enrollment of patients in the acute stage is expected to be completed in fall 2015, and no interim analysis is planned.
In addition, TACTT3 is exploring the potential efficacy of AM-101 during the post-acute stage (tinnitus onset between three and 12 months) since data from our Phase 2 clinical program suggest that AM-101 may be effective beyond the three month acute stage. An Independent Data Review Committee conducted an interim analysis after enrollment of 150 patients. The interim analysis showed positive efficacy signals, with higher activity levels observed in the early post-acute stage (three to six months) compared to the late post-acute stage (six to 12 months). Based on recommendations from the Independent Data Review Committee, this part of TACTT 3 will continue solely with enrollment of patients with tinnitus onset three to six months prior. In total, approximately 330 patients will be enrolled in the stratum pre- and post-interim analysis.
The same, well-defined patient population we used in Phase 2 (acute inner ear tinnitus following traumatic injury to the cochlea or OM) is selected in our Phase 3 clinical trials. Furthermore, based on the data we have gathered on the various subjective clinical read outs, we believe we have identified the most reliable and relevant measures for efficacy. Efficacy endpoints include PRO measures of loudness and annoyance, the TFI as well as global patient scores of tinnitus status and change. Based on our discussions with the FDA and EMA, we agreed that psychoacoustic measures were not relevant or reliable enough for the purpose of measuring clinical efficacy of AM-101.
Based on our estimates regarding patient enrollment, we expect to have top-line data from this Phase 3 clinical program in early 2016.
Two further trials, AMPACT1 and AMPACT2 (AM-101 in the Post-Acute Treatment of Peripheral Tinnitus) will be nine-month open label extension trials conducted at the same sites as for TACTT2 and TACTT3. These extension trials will be open to participants who complete the TACTT2 or the TACTT3 trial and will evaluate the safety and local tolerance of up to three treatment cycles, each with three repeated doses of AM-101 0.87 mg/mL.
The extension trials were designed in response to the FDA’s request for safety data from chronic intermittent use by tinnitus patients in support of a new drug application, or NDA, filing. Although we do not have any plans to seek a label for such use, the FDA considered such unintended use likely to occur. Therefore, we have designed these trials to provide further evidence of safety over a longer duration and also to study the effect of repeated administration over up to four treatment cycles in total.
AM-111 in Hearing Loss
AM-111 is being developed for the treatment of ASNHL. In sensorineural hearing loss, there is damage to the sensory cells of the inner ear or the auditory nerve. Sensorineural hearing loss is also called “inner ear hearing loss”. Hearing loss is a heterogeneous disorder of many forms with a variety of causes. ASNHL may be triggered by a variety of insults, such as exposure to excessively loud sound, infection, inflammation or certain ototoxic drugs. These insults may also result in tinnitus. According to an article by Rauch and Geller published in the Journal of Comparative Effectiveness Research in 2012, over 60,000 people in the United States are affected by sudden deafness annually. There are no currently approved treatments for this patient population.
AM-111 contains a synthetic D-form peptide (D-JNKI-1) that protects sensorineural structures in the inner ear from stress-induced damage. AM-111 has been granted orphan drug status by both EMA and FDA for the treatment of ASNHL.
Hearing Loss
Hearing loss, like tinnitus, is a heterogeneous disorder of many forms with diverse etiology. There are two general categories: conductive hearing loss in which sound waves are not conducted efficiently to the inner ear due to build-up of earwax, fluid, or a punctured eardrum; and sensorineural hearing loss, in which there is damage to the inner ear or the auditory nerve. Acute hearing loss can occur in either category. Hearing loss is amenable to pharmaceutical intervention (and thus relevant to our drug development) only when it is sensorineural in origin. ASNHL is often accompanied by tinnitus.
There are two main types of acute hearing loss: hearing loss induced by trauma, such as from a loud rock concert or an explosion; and hearing loss that arises from unknown origins, that is, idiopathically, based on causes suspected to include changes in blood flow to the inner ear, bacterial and viral infections, autoimmune disease and others. The former is known as AAT for acute acoustic trauma. The latter is known as ISSNHL for idiopathic sudden sensorineural hearing loss. Together they can be defined as acute sensorineural hearing loss or ASNHL. In both cases, the onset is sudden. And in both cases, part of the initial hearing loss tends to recover naturally in the days and weeks following the loss; however, some of the loss may remain and, over time, become chronic in nature and less amenable to therapeutic intervention.
ASNHL differs from age-related hearing loss or hearing loss driven by chronic exposure to noise. Those types of hearing loss arise more slowly or on the basis of repeated insults, in slow motion. By contrast, in the case of ASNHL, the effects are felt immediately. This difference in the speed of progression is significant since sudden hearing losses are noticed much more readily.
ASNHL involves a variety of pathologic processes such as massive release of free reactive oxygen species, excessive and pathological stimulation of receptors on neurons by neurotransmitters like glutamate, and inflammation. These reactions, in turn, can damage sensorineural structures of the inner ear such as the sensitive inner and outer hair cells and nerve cells that line the interior of the cochlea. If the stress incident is severe enough, it may lead to permanent cochlear injury with irreversible loss of hair cells and nerve cells. Cell death occurs primarily through so-called programmed cell death, which is driven by damaged cells (apoptosis), and to a lesser extent also through necrosis, which is a passive consequence of gross injury to the cell.
The enzyme JNK is a signal transmitting enzyme that is stress-activated and regulates a number of important cellular activities. Stresses to the cochlea such as those described above, if severe enough, can activate the JNK signal transduction pathway, leading to the activation of transcription factors such as c-jun and c-fos that are found in the cell nucleus. This activation, in turn, activates genes encoding inflammatory molecules or promoting cell death.
Current Therapies and Unmet Need
Hearing loss may have a serious impact on people’s personal and professional lives. Severe to profound hearing loss can result in high societal costs, mostly due to reduced work productivity, as reported in 2000 in the International Journal of Technology Assessment in Healthcare. Yet no treatment currently exists that has unequivocal evidence of efficacy for AAT or ISSNHL. There is no FDA- or EMA-approved drug on the market for hearing loss. The only remaining therapeutic option is a hearing aid or, in cases of deafness or near-deafness, a cochlear implant.
A patient with the acute form of hearing loss may recover on his or her own, especially if the loss is of low or moderate intensity and severity. This is due to intrinsic repair mechanisms inside the cochlea. However, in other cases the patient may recover only partially or not at all. In those cases, in the absence of effective treatment, acute hearing loss will become chronic and irreversible. There is currently no possibility to regrow or replace sensory structures inside the inner ear that are not recovered in the weeks immediately following the loss.
For ASNHL, non-specific treatments are frequently prescribed, mostly on an off-label empirical basis. These may include glucocorticoids and steroids such as prednisolone or dexamethasone; vasodilators such as pentoxyfilline; rheologics; ionotropics and local anesthetics; antioxidants and thrombolytics.
In the United States, most frequently oral prednisolone is administered for the treatment of ASNHL. Corticosteroids are intended to reduce inflammation and swelling in the ear that may be related to hearing loss. The U.S. treatment guideline issued in 2012 by the American Academy of Otolaryngology/Head & Neck Surgery for ISSNHL recommends oral steroids and hyperbaric oxygen as treatment options, but refrains from prescribing them in light of the low evidence level for their efficacy. Indeed, Nosrati-Zarenoe and colleagues presented in 2012 in the journal Otology and Neurotology the results of a Swedish placebo controlled trial with oral prednisolone in the treatment of ISSNHL that showed no therapeutic effect on hearing loss from active treatment.
Our Solution – AM-111
We are developing AM-111 as a treatment for acute inner ear hearing loss. AM-111 contains a synthetic D-form peptide (D-JNKI-1) that acts as a c-Jun N-terminal Kinase (JNK) ligand, thereby protecting sensorineural structures in the inner ear from stress-induced damage. We are developing D-JNKI-1 under a worldwide exclusive license for the treatment of ear disorders from Xigen S.A. (Switzerland). Like AM-101, AM-111 is delivered in a biocompatible gel formulation via i.t. injection. We have established the safety and preliminary efficacy of AM-111 in a Phase 2 clinical trial. We are preparing for the late stage clinical development of AM-111 in acute inner ear hearing loss. The acute stage of hearing loss represents a window in time in which the inner ear can be protected from permanent hearing loss. AM-111 received orphan drug designation by both EMA and FDA in 2005 and 2006, respectively.
Therapeutic rationale for AM-111 in hearing loss
The proprietary active pharmaceutical ingredient of AM-111 is D-JNKI-1, a 31 amino acid synthetic D-form peptide that binds to JNK and inhibits activation of transcription factors such as c-jun and c-fos, thereby protecting sensorineural structures from stress-induced inflammation and apoptosis. D-JNKI-1 comprises an active transporter sequence, or D-TAT, that enables AM-111 to cross the round window membrane quickly, diffuse widely throughout
the cochlea, transfect sensorineural cells effectively and reach its target inside the cell nucleus. The D-form of the peptide provides for protease resistance and hence enhanced stability. AM-111 was shown to remain pharmacologically active for several days inside the cochlea. The D-form is necessary for AM-111 to cross the RWM.
By attenuating inflammation and protecting cells from apoptosis, we believe that AM-111 reinforces natural recovery processes and helps to prevent or minimize permanent damage respectively chronic hearing loss. AM-111’s otoprotective effect has been demonstrated in various animal models of cochlear stress, including AAT, acute labyrinthitis (inflammation), drug ototoxicity (aminoglycosides), bacterial infection, cochlear ischemia and cochlear implantation trauma.
We conducted our preclinical development program for AM-111 in close collaboration with academic partners and various contract research organizations, or CROs. D-JNKI-1 was invented by Xigen S.A. in Lausanne, Switzerland. In 2003, we signed a Collaboration and License Agreement with Xigen, under which we in-licensed worldwide exclusive rights for use of D-JNKI-1 in the treatment of ear disorders. Under the agreement with Xigen, we have exchanged various preclinical and clinical data.
Hearing loss endpoints
Unlike tinnitus, where measures of therapeutic outcomes have to rely on PROs, the evaluation of hearing is based on psychoacoustic measures performed by audiologists. Audiometric procedures and equipment are highly standardized around the world; hearing thresholds are typically determined by presenting pure tones in the 250 Hz to 8 kHz range through headphones or ear inserts (air conduction) or through a vibrator placed behind the ear or on the forehead (bone conduction). An increase in volume of 10 dB is perceived as twice as loud. In other words, a person whose hearing thresholds improved by 10 dB can hear sounds at half the intensity level that was necessary before. A change of this magnitude is generally considered to be clinically relevant. In addition to pure tone audiometry usually speech audiometry is conducted, in which the audiologist measures a patient’s ability to hear and correctly understand a series of monosyllabic words.
The primary efficacy endpoint in our Phase 2 clinical trial was hearing loss recovery from baseline to Day 7 at the three worst affected frequencies. The percentage improvement of the patient’s hearing across an average of three frequencies was measured relative to baseline hearing loss. This percentage improvement and the percentage of patients with complete remission (hearing recovery to within 10 dB of the pre-ASNHL level) at Day 7 were co-primary endpoints. We also monitored change in the speech discrimination score, or SDS, which measures the correct understanding of 20 monosyllabic words presented to patients, as well as subjective tinnitus loudness as secondary outcome variables.
AM-111 Clinical Development
We have successfully completed two clinical trials of AM-111 that demonstrated its safety and efficacy. We have benefited several times from engaging in a protocol assistance procedure with the EMA, most recently for the design of the Phase 3 clinical development. The FDA held a pre-IND meeting with us in September 2014 and provided formal feedback and guidance on our pre-clinical and CMC development and specifically on HEALOS. In response to this feedback, we are in the process of finalizing the design of HEALOS. In addition, we obtained an open IND from the FDA for REACH. We plan to conduct REACH in the U.S., comparing a single 0.4 mg/mL dose of AM-111 to a placebo. If we obtain sufficient funding, we intend to start HEALOS in the second half of 2015 and REACH in 2016.
Our pivotal Phase 3 clinical trial design will be based on the outcomes from our Phase 2 clinical trial and our discussions with the EMA and FDA. We have decided to make some adjustments to the definition of the target patient population to ensure that the trial enrolls only those subjects who have a clear medical need and in whom a clinically meaningful therapeutic benefit can be shown.
Phase 1/2 Clinical Trial
A Phase 1/2 clinical trial was conducted at two centers in Germany in January 2006, with 11 patients suffering from AAT due to New Year’s firecracker accidents. Patients had at least 30 dB hearing loss by pure tone audiometry (average of 4 and 6 kHz) and were treated within 24 hours of onset.
Trial participants received a single dose of AM-111 at either 0.4 mg/mL or 2 mg/mL in a biocompatible gel formulation by i.t. injection into the most affected ear. The primary endpoint of the trial was the recovery of hearing thresholds from baseline to Day 30. AM-111 was well tolerated by all trial participants, regardless of the dose. Adverse events occurred in only small numbers and were either unrelated or considered unlikely to be related to the treatment. The Phase 1/2 trial provided the first indications of therapeutic benefit of AM-111 in humans.
Phase 2 Clinical Trial
To further evaluate the efficacy and safety of AM-111 we conducted a Phase 2b clinical trial between March 2009 and 2012. Since preclinical tests had demonstrated AM-111’s otoprotective effects in many different types of cochlear stress, the patient population was expanded from AAT cases to also include patients affected by ISSNHL. In addition, based on observations from our Phase 1 clinical trial, we expanded the allowed time window from 24 to 48 hours from onset. The design for this Phase 2b trial was discussed with the EMA under a protocol assistance procedure.
The trial enrolled 210 participants who suffered from ASNHL (unilateral ISSNHL, uni-or bilateral AAT) with hearing loss of at least 30 dB at the average of the three worst affected frequencies (pure tone average; PTA) and onset not more than 48 hours previously. AM-111 was dosed at 0 mg/mL (placebo), 0.4 mg/mL (Low Dose) and 2.0 mg/mL (High Dose). All patients without a clinically relevant hearing recovery on Day 7 were given the option to take a course of oral prednisolone as a reserve therapy.
The trial consisted of a baseline assessment and four follow-up visits on Days 3, 7, 30, and 90. The primary efficacy endpoint was hearing loss recovery from baseline to Day 7 at the three worst affected frequencies. The percentage improvement of PTA relative to baseline hearing loss and the percentage of patients with complete remission (PTA recovering to within 10 dB of the pre-ASNHL level) at Day 7 were co-primary endpoints. We also monitored change in the speech discrimination score, or SDS, measuring the correct understanding of 20 monosyllabic words presented to patients, and subjective tinnitus loudness as secondary outcome variables.
AM-111 was safe and well tolerated in this trial. There were no statistically significant differences in the occurrence of clinically relevant hearing deterioration in the treated ear. Also, there were no apparent differences in the frequency of adverse events between placebo and AM-111 treated patients at any time points, no systemic side effects and no negative impact on balance or tinnitus. There were transient procedure related effects such as ear discomfort or pain, incision site complications or middle ear infection in less than 5% of cases. For nine patients, non-fatal serious adverse events were recorded (two, four and three patients in the placebo, AM-111 Low Dose and AM-111 High Dose, respectively). All serious adverse events were considered unlikely related or not related to the treatment with the exception of two (“deafness neurosensory”, one in the placebo and one in the AM-111 High Dose group). All serious adverse events except two (diagnosis of internal auditory canal tumor, respectively neurofibromatosis type II, not related) had recovered or were recovering. The most common serious adverse event was “deafness neurosensory,” as some severe or profound hearing loss patients with insufficient recovery, acute relapse or ongoing deterioration were hospitalized in Poland for infusion therapy in line with customary medical practice.
The trial demonstrated a statistically significant and clinically relevant improvement for the primary as well as the co-primary endpoints in patients with severe to profound ASNHL (those patients with hearing loss of at least 60 dB) treated with AM-111 0.4 mg/mL compared with placebo.
Improvement in hearing and speech discrimination
|
AM-111
|
|||||
|
Placebo
|
Low Dose
|
High Dose
|
|||
|
Absolute hearing improvement, dB
|
17.9 (30)
|
29.9 (29)
|
22.7 (33)
|
||
|
LS means (n)
|
|||||
|
LS mean difference (95% confidence interval)
|
12.1 (2.2, 22.0)
|
4.9 (-4.8, 14.6)
|
|||
|
P-value
|
0.017*
|
0.319
|
|||
|
Relative hearing improvement, %
|
|||||
|
LS means (n)
|
30.9 (30)
|
50.4 (29)
|
37.6 (33)
|
||
|
LS mean difference (95% confidence interval)
|
19.5 (3.0, 35.9)
|
6.6 (-9.6, 22.8)
|
|||
|
P-value
|
0.021*
|
0.419
|
|||
|
Frequency complete hearing recovery, %
|
|
AM-111
|
|||||
|
Placebo
|
Low Dose
|
High Dose
|
|||
|
Mean (n)
|
13.3 (30)
|
31.0 (29)
|
24.2 (33)
|
||
|
Odds ratio (95% confidence interval)
|
5.5 (1.1, 29.0)
|
1.6 (0.4, 6.7)
|
|||
|
P-value
|
0.044*
|
0.530
|
|||
|
Speech discrimination score improvement, % points
|
|||||
|
LS means (n)
|
9.1 (29)
|
27.4 (29)
|
23.2 (33)
|
||
|
LS mean difference (95% confidence interval)
|
18.3 (3.1, 33.4)
|
14.1 (0.7, 28.9)
|
|||
|
P-value
|
0.019*
|
0.061*
|
ANCOVA results for changes in hearing (absolute and relative to initial hearing loss) and speech discrimination score from baseline to Day 7 as well as frequency of complete hearing recovery in patients with severe to profound hearing loss. Shown are mean values for treatment groups (least square (LS) means for ANCOVA), differences for the active groups compared with placebo (odds ratio from logistic regression for frequency of complete hearing recovery) including 95% confidence interval and the p-value: * significant at 0.05 level.
A clinically relevant and statistically significant therapeutic effect of AM-111 Low Dose was apparent at Day 3; it continued to Day 30 and leveled off somewhat by Day 90, but still remained clinically relevant.
Improvement in hearing over time
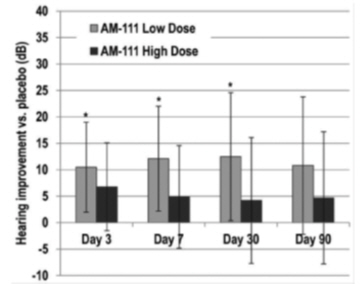
Treatment effect of AM-111 as difference in hearing recovery over placebo from baseline to follow-up visits in patients with severe to profound hearing loss (n=92). A difference of 10 dB is considered clinically relevant. Whiskers: 95% confidence interval. * Significant at 5% level when compared to placebo.
At Day 90, 42% of patients had achieved complete recovery as compared to 26% in the placebo group. The High Dose group overall showed improvement between the Low Dose and the placebo groups, without reaching statistical significance. Sensitivity analysis showed that the therapeutic effect did not depend on early treatment: in patients who were treated more than 24 hours after ASNHL onset the treatment effect actually was larger as the rate of spontaneous recovery decreased.
Improvement in hearing over time – ASNHL onset 24 to 48 hours before
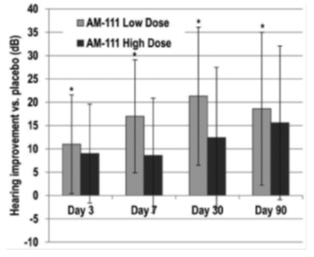
Treatment effect of AM-111 as difference in hearing recovery over placebo from baseline to follow-up visits in patients with severe to profound hearing loss treated 24 to 48 hours post ASNHL onset (n=66). A difference of 10 dB is considered clinically relevant. Whiskers: 95% confidence interval. * Significant at 5% level when compared to placebo.
The superior hearing recovery in the AM-111 0.4 mg/mL group vs. placebo was supported by more frequent complete tinnitus remission. The latter finding, which was not yet apparent in the previous smaller Phase 1/2 clinical trial, suggests that preservation of sensory cochlear cells may help to prevent permanent tinnitus and hearing loss at the same time.
Complete tinnitus remission
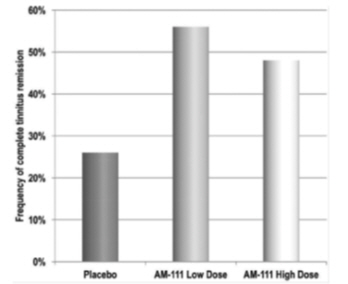
Percentage of severe to profound hearing loss patients and tinnitus at baseline whose tinnitus was completely resolved by Day 90 (n=77).
In contrast to the patients with severe to profound hearing loss at baseline, there was no therapeutic benefit observed in patients with mild to moderate hearing loss (i.e. less than 60 dB) due to unexpectedly strong spontaneous recovery. Patients with mild hearing loss recovered essentially all of their initial hearing loss naturally, and those with moderate levels recovered most of it. In hindsight, the inclusion criteria for hearing loss severity had
been set too low. Although there is consensus that spontaneous recovery can be substantial in ISSNHL, no reliable data had been available prior to our Phase 2b clinical trial, partly due to the dearth of placebo-controlled trials.
In the present trial, patients in the Low Dose group initially appeared to show greater improvement than those in the High Dose group. The difference, however, was not statistically significant for absolute PTA improvement and was much smaller or absent for the other efficacy outcomes.
Planned Late Stage Clinical Program
Based on Phase 2 clinical trial outcomes and after obtaining guidance from the EMA and FDA, we have been preparing a late stage clinical program. We are planning to conduct confirmatory testing of AM-111 0.4 mg/mL as well as to explore potential incremental therapeutic benefits from the use of a higher concentration in ISSNHL patients. Since a “bell shaped” dose response curve was observed in animal studies, a concentration between 0.4 and 2.0 mg/mL may be even more effective than the low dose. In addition, we are planning to test AM-111 for protection against surgery-induced hearing loss in cochlear implant surgery.
We have been preparing for a pivotal Phase 3 trial called HEALOS (Efficacy and Safety of AM-111 in the treatment of Acute Inner Ear Hearing Loss) in European and Asian countries with approximately 255 patients. A single dose of either 0.4 mg/mL or 0.8 mg/mL of AM-111 would be compared to placebo in patients suffering from acute severe to profound hearing loss with ISSNHL as the onset factor and an enrollment time window that is extended from 48 to 72 hours. The FDA held a pre-IND meeting with us in September 2014 and provided formal feedback and guidance on our pre-clinical and CMC development and specifically on HEALOS. In response to this feedback, we are in the process of finalizing the design of HEALOS. In addition, we obtained an open IND from the FDA for REACH. We plan to conduct REACH in the U.S., comparing a single 0.4 mg/mL dose of AM-111 to a placebo. If we obtain sufficient funding, we intend to start HEALOS in the second half of 2015 and REACH in 2016.
AM-111 in Meniere’s Disease
We are also planning to evaluate AM-111’s efficacy and safety in Meniere’s Disease. Meniere’s Disease is an inner ear disorder that affects balance and hearing whose exact cause is unknown. It manifests with the following symptoms: vertigo, aural fullness, hearing loss and tinnitus. The symptoms primarily affect the low-frequency hearing range and, although they may fluctuate, in general they progress. The most prominent symptom is recurrent vertigo attacks. The primary cause of Meniere’s Disease is thought to be an imbalance in the production and absorption of endolymph, one of two cochlear fluids. This results in endolymphatic hydrops, a condition where there are abnormalities in the quantity, composition and pressure of the endolymph within the inner ear. While it appears that all patients with the classical symptoms of Meniere’s Disease have an endolymphatic hydrops the opposite is not true, as not all patients with hydrops have Meniere’s Disease symptoms. It has been postulated that Meniere’s Disease is caused by a latent Herpes Simplex Virus, or HSV, infection in sensory nerve ganglia. Specifically, it is proposed that Meniere’s Disease is triggered by the reactivation of the HSV by stressful stimuli, viral replication and spread of the HSV resulting in inflammatory responses.
According to the National Institute on Deafness and Other Communication Disorders, there are 615,000 patients with Meniere’s Disease in the United States, with 45,500 new cases diagnosed per year. There is no cure for Meniere’s Disease. Management of the disorder includes treatment with anti-emetics or anti-histamines, low-salt diet and administration of diuretics to relieve endolymphatic pressure. In case of unresponsive first-line therapy, surgical interventions such as endolymphatic sac surgery or dissection of the vestibular nerve, or chemical destruction of vestibular hair cells by i.t. injections of the ototoxic drug gentamicin are considered.
By protecting sensory cells in the stress-injured cochlea we believe that AM-111 has the potential to be effective in attenuating some of the symptoms and long-term outcomes of Meniere’s Disease, such as progressive sensorineural hearing loss. In addition to its anti-apoptotic and anti-inflammatory effects, AM-111’s active substance has also been shown in vitro to attenuate replication of HSV and other types of viruses. Based on preclinical data, AM-111 has demonstrated that following round window membrane administration it is able to reach even the most remote part of the cochlea, which is most affected in Meniere’s Disease, and is able to transfect sensory cells there. We are planning to evaluate AM-111’s therapeutic potential for the treatment of Meniere’s Disease first in an open-label clinical trial.
Competition
We believe that we are the clinically most advanced company in the emerging field of inner ear therapeutics and that our innovative technology, knowledge, experience and scientific resources provide us with competitive advantages. However, we may face competition from different sources with respect to our product candidates AM-101 and AM-111 and our pipeline products or any product candidates that we may seek to develop or commercialize in the future. Because there are a variety of means to block the activity of NMDA receptors or the JNK pathway, our patents and other proprietary protections for AM-101 and AM-111 may not prevent development or commercialization of all viable product candidates that are different from our lead product candidates.
Any product candidates that we successfully develop and commercialize will compete with existing therapies, even if they are not licensed specifically for use in our target therapeutic indications or if they lack clear proof of efficacy. There exist no FDA or EMA approved products for the treatment of acute inner ear tinnitus or acute inner ear hearing loss; however, some drug products such as pentoxifylline, gingko biloba, corticosteroids, betahistine, trimetazidine or piracetam are frequently prescribed off-label. Some of them are even licensed as tinnitus or hearing loss treatments in certain countries of the European Union. We therefore may have to expend particular efforts in order to overcome established prescribing behavior.
Possible competitors may be biotechnology and pharmaceutical companies as well as academic institutions, government agencies and private and public research institutions, which may in the future develop products to treat acute inner ear tinnitus or acute inner ear hearing loss. Any product candidates that we successfully develop and commercialize will compete with new therapies that may become available in the future. We believe that the key competitive factors affecting the success of our product candidates, if approved, are likely to be efficacy, safety, convenience, price, tolerability and the availability of reimbursement from government and other third-party payors.
Acute inner ear tinnitus
There are a number of products in preclinical research and clinical development by third parties to treat tinnitus in the broader sense. Most of them are aiming to provide symptomatic relief (without treating the underlying cause) and targeting chronic rather than acute tinnitus. Examples include Tinnitus Retraining Therapy (TRT) or tinnitus maskers as well as more recent approaches like transcranial magnetic stimulation, vagus nerve stimulation, or customized sound therapy. Based on publicly available information, we have further identified, among others, the following drug product candidates that are currently in clinical development:
|
|
·
|
Merz Pharmaceuticals GmbH has a product candidate that is a low affinity NMDA receptor antagonist and nicotinic acetylcholine receptor antagonist (neramexane) designed for oral treatment of tinnitus. In November 2011 Merz Pharma announced the suspension of its tinnitus development program with neramexane due to lack of efficacy in Phase 3 clinical trials in post-acute tinnitus; the product candidate is currently still being evaluated in a Phase 2 clinical trial by Merz’s Japanese collaboration partner Kyorin Pharmaceutical Co., Ltd.
|
|
|
·
|
Novartis Pharmaceuticals AG has a product candidate that is an AMPA receptor antagonist designed for oral administration (BGG492) and that has been tested in chronic tinnitus patients in a phase 2 clinical trial. The trial was completed in January 2012 with no outcomes being reported to date.
|
|
|
·
|
Autifony Therapeutics Ltd. has a Kv3 potassium channel agonist product candidate (AUT00063) that is designed for oral administration. In 2014 Autifony initiated a Phase 2 study with AUT00063 in patients with post-acute tinnitus. The trial is expected to complete enrollment in summer 2015.
|
Since AM-101 targets a particular tinnitus generating mechanism during the acute stage, we consider these less specific products or product candidates as complementary rather than competing. Further progress in the development of AM-101 and in particular market approval may attract increased interest in developing treatments for acute inner ear tinnitus and may lead to the arrival of new competitors. For example, Otonomy Inc. acquired an early stage NMDA receptor antagonist product candidate (NST-001, gacyclidine) from Neurosystec Inc. in October 2013 and is planning to develop it as OTO-311 for i.t. injection. Otonomy is expected to submit an IND and initiate a Phase 1 clinical trial for OTO-311 in 2015.
Acute inner ear hearing loss
There are a number of product candidates in preclinical research and clinical development by third parties that aim to prevent or treat acute inner ear hearing loss. Based on publicly available information, we have identified, among others, the following product candidates:
|
|
·
|
AudioCure Pharma GmbH has a ß-carboline product candidate (AC-002) in preclinical development that is designed for i.t. treatment of noise induced hearing loss in a gel-based formulation.
|
|
|
·
|
Autifony Therapeutics Ltd. has a Kv3 potassium channel agonist product candidate (AUT00063) that is designed for oral administration. Autifony is expected to initiate a Phase 2 trial with AUT00063 in the treatment of speech-in-noise deficits in elderly patients.
|
|
|
·
|
Sound Pharmaceuticals, Inc. has a product candidate (SPI-1005, ebselen), that mimics and prompts production of the enzyme glutathione peroxidase and is designed for oral administration, and that has been tested for the prevention and treatment of temporary inner ear hearing loss in a Phase 2 clinical trial.
|
|
|
·
|
Otologic Pharmaceutics, Inc. has a product candidate (HPN-07) designed for treatment of acute hearing loss by way of oral administration. A Phase 1 trial was initiated in 2014.
|
|
|
·
|
Southern Illinois University has an antioxidant product candidate (D-methionine) that is designed for oral administration in the prevention and treatment of noise induced hearing loss and currently being tested in a late stage study with the Department of Defense.
|
We believe that AM-111 is the only product candidate administered after an incidence of hearing loss that so far has demonstrated in a randomized, placebo controlled clinical trial a clinically relevant and statistically significant improvement in patients with severe to profound ASNHL and to have a therapeutic effect on tinnitus as well. To our knowledge, we are also the only company to have obtained orphan drug designation for a product candidate in the treatment of ASNHL in both the United States and the European Union. To the extent that other drug developers demonstrate clinical efficacy for their product candidates in the prevention and treatment of permanent hearing loss from ASNHL, our competitive position may be weakened, and the market exclusivity under the orphan drug designation may be circumvented.
Meniere’s Disease
There are a number of other product candidates in preclinical research and clinical development that aim to treat Meniere’s Disease. Based on publicly available information, we have identified, among others, the following product candidates:
|
|
·
|
Otonomy Inc.’s product candidate OTO-104 is a micronized dexamethasone formulated in a poloxamer gel designed for single dose i.t. injection for which results of a Phase 2b clinical trial in the United States and Canada are expected to be reported in the second quarter of 2015. If successful, Otonomy is expected to initiate a second pivotal trial for OTO-104 in 2015.
|
|
|
·
|
Synphora AB is evaluating a latanoprost product candidate designed for i.t. injections in a Phase 2 clinical trial in Meniere’s Disease patients in Sweden.
|
We believe that AM-111, due to its ability to protect sensory cells in the stress-injured cochlea which has been demonstrated in various preclinical studies, and its ability to reach even the most remote, apical part of the cochlea, may offer therapeutic benefits in the treatment of Meniere’s Disease. In the absence of animal models for the disorder, however, such potential may only be evaluated in clinical trials for which the outcome is uncertain at this point. To the extent that other drug developers may demonstrate clinical efficacy for their product candidates in the treatment of Meniere’s Disease and receive market approval before us, we may have to demonstrate efficacy and safety as compared to such marketed product.
Intellectual Property
Patents
We seek regulatory approval for our products in disease areas with high unmet medical need, great market potential and where we have a proprietary position through patents covering various aspects of our products, e.g., composition, dosage, formulation, and use, etc. Our success depends on an intellectual property portfolio that supports our future revenue streams as well as erects barriers to our competitors. For example, we have broad disclosures in our patent applications and can pursue patent claims directed to our own leading product candidates as well as claims directed to certain potentially competing products. In addition, our earlier filed patent applications are prior art to others including certain of our competitors who filed their patent applications later than ours. We are maintaining and building our patent portfolio through: filing new patent applications; prosecuting existing applications and licensing and acquiring new patents and patent applications.
Despite these measures, any of our intellectual property and proprietary rights could be challenged, invalidated, circumvented, infringed or misappropriated, or such intellectual property and proprietary rights may not be sufficient to permit us to take advantage of current market trends or otherwise to provide competitive advantages. For more information, please see “Item 3. Key Information—D. Risk factors –Intellectual property.”
As of December 31, 2014, we own two (2) issued U.S. patents and seven (7) pending U.S. patent applications along with foreign counterparts of such patents and applications in various jurisdictions. We co-own both of our issued U.S. patents, and one of our pending patent applications with INSERM, along with their foreign counterparts, pursuant to the terms of our co-ownership and exploitation agreement. In addition, we co-own two of our pending applications with Xigen pursuant to the terms of our collaboration and license agreement.
In addition, as of December 31, 2014, we have exclusively licensed from Xigen eleven (11) issued U.S. patents and three (3) pending U.S. patent applications, along with their foreign counterparts in various jurisdictions that cover the composition of matter or method of use of JNK ligand peptides in a limited field including the intratympanic treatment of acute sensorineural hearing loss.
With respect to our issued patents in the United States and Europe, we may also be entitled to obtain a patent term extension to extend the patent expiration date. For example, in the United States, we can apply for a patent term extension of up to 5 years for one of the patents covering a product once the product is approved by the FDA. The exact duration of the extension depends on the time we spend in clinical trials as well as getting a new drug application approval from the FDA.
The patent portfolios for our two (2) leading product candidates as of December 31, 2014 are summarized below.
AM-101
We are the owner or co-owner of patents and patent applications relating to Ketamine or its use in inner ear tinnitus. In particular, we have an agreement entitled “Co-Ownership/Exploitation Agreement” with INSERM with respect to its Ketamine patent portfolio. We have rights to two (2) issued U.S. patents and three (3) pending U.S. applications and corresponding patents and applications in other jurisdictions including, Europe, Eurasia, Australia, Canada, Japan, Brazil, China, South Korea, Israel, India, Mexico, Philippines, Russia, South Africa and New Zealand, covering formulation and use of Ketamine. Our issued patents and pending patent applications relating to AM-101 are expected to expire between 2024 and 2028, prior to any patent term extensions to which we may be entitled under applicable laws.
AM-111
We are the exclusive licensee under our agreement with Xigen of a portfolio of patents and patent applications that relate, among other things, to JNK ligand peptides or their use in hearing loss. This portfolio includes eleven (11) issued U.S. patents and three (3) pending U.S. applications along with their foreign counterparts in various jurisdictions including, Europe, Australia, Brazil, Canada, Eurasia, South Korea, Israel, India, Mexico, Ukraine and Japan, that cover the composition of matter or method of use of the JNK ligand peptides. These licensed patents and patent applications relating to AM-111 are expected to expire between 2020 and 2027, prior to any patent term
extensions to which we may be entitled under applicable laws. In addition, we co-own two patent families with Xigen related to use of JNK ligand peptides for the treatment of Meniere’s disease or tinnitus.
We have several areas of disagreement with Xigen, including (i) our interpretation of the scope of the exclusive worldwide license granted to us by Xigen, (ii) the assignment by Xigen of certain of the patents covered by the license and (iii) Xigen’s refusal to grant its consent for the disclosure of certain provisions of our agreement in the prospectus associated with our initial public offering and the filing of a redacted version of the agreement with the SEC. Although the difference in interpretation over the scope of the license has no impact on our current or planned use of AM-111 and we have been assured by Xigen and its assignee that the assignment of patents is without prejudice to our license, these areas of disagreement could adversely affect our relationship with Xigen and our business, commercialization prospects and financial conditions. Although Xigen has not taken any action as of the date of this Annual Report, any resulting litigation could result in substantial legal expenses and potentially the loss of our right to commercialize AM-111. For a discussion of these issues, please refer to “Item 3. Key Information—D. Risk factors —Risks Related to our Reliance on Third Parties—We have several areas of disagreement with Xigen, and consequently our relationship with Xigen may be adversely affected, we could potentially lose our right to commercialize AM-111 and our business, commercialization prospects and financial condition may be adversely affected.”
Proprietary Rights
In addition to patent protection, we intend to use other means to protect our proprietary rights. We may pursue marketing exclusivity periods that are available under regulatory provisions in certain countries, including the US, Europe and Japan. For example, if we are the first to obtain market approval of a small molecule product in the United States, we would expect to receive at least 5 years of market exclusivity in the US.
Furthermore, orphan drug exclusivity has been or may be sought where available. Such exclusivity has a term of 7 years in the United States and 10 years in Europe. We have obtained orphan drug designation for AM-111 for the treatment of ASNHL in the United States and Europe. Orphan drug protection has been or may be sought where available if such protection also grants 7 years of market exclusivity.
We have obtained U.S. trademark registrations for Auris Medical Cochlear Therapies (and Design) and AURILIUM.
In addition, we rely upon unpatented trade secrets, know-how, and continuing technological innovation to develop and maintain our competitive position. We seek to protect our ownership of know-how and trade secrets through an active program of legal mechanism including assignments, confidentiality agreements, material transfer agreements, research collaborations and licenses.
Collaboration and License Agreements
INSERM
In 2006, we entered into a co-ownership/exploitation agreement with the Institut National de la Santé et de la Recherche Médicale, or INSERM, a publicly funded government science and technology agency in France. Pursuant to the terms of the agreement, we were granted the exclusive right to exploit any products derived from patents that resulted from our joint research program with INSERM that was conducted in 2003 to 2005 and led to the development of AM-101. Pursuant to the terms of the co-ownership/exploitation agreement, we are given the exclusive right to exploit the patents issuing from the filed patent applications for all claimed applications, including the treatment of tinnitus, in order to develop, promote, manufacture, cause to be manufactured, use, sell and distribute any products, processes or services deriving from such patents, including AM-101, in any country in which these patent applications have been filed during the term of the agreement. We alone are entitled to grant manufacturing or sales licenses for any patents to our subsidiaries and/or third parties. INSERM is entitled to use the inventions covered by the patents and applications for its own research purposes, free of charge, but may not generate any direct or indirect profits from such use. Pursuant to the terms of our agreement with INSERM, we are required to finance research and development work towards achieving certain specified marketing authorizations, and to use best efforts in so far as commercially and financially feasible to develop, market, and obtain regulatory authorization for products covered by such patents.
As consideration for the exclusive rights granted to us under the agreement, we have agreed to pay INSERM a two tiered low single digit royalty (where the higher rate is due on any net sales above a certain threshold) on the net sales of any product covered by the patents (including the use of AM-101 in the treatment of tinnitus triggered by cochlear glutamate excitotoxicity) earned in each country in which these patent applications have been filed during the term of the agreement. We have also agreed to pay INSERM a low double digit fee on any sums of any nature (except royalties and certain costs) collected by us in respect of the granting of licenses to third parties.
The agreement will remain in force until the last of the patents covered by the agreement expires or becomes invalid. The patent covered by the agreement with the latest expiration date expires in 2028. The agreement will be terminated if we cease operations or are liquidated, may be terminated by either party in case of non-performance by the other party and may be terminated by INSERM in the absence of sales of a product deriving from the patents for a period from when it first marketed and if such a product is not marketed for a period from the date when marketing authorization is obtained.
Xigen
In October 2003, we entered into a collaboration and license agreement with Xigen S.A., or Xigen, pursuant to which Xigen granted us an exclusive worldwide license to use specified compounds to develop, manufacture and commercialize “pharmaceutical products as well as drug delivery devices and formulations for local administration of therapeutic substances to the inner ear for the treatment of ear disorders” (the Area). We also have a right of first refusal to license certain additional compounds developed by Xigen which may be used for the Area, specifically any cell permeable inhibitors to effectively block certain signal pathways in apoptotic processes.
Under this agreement, we made an upfront payment to Xigen of CHF 200,000 and we are obligated to make development milestone payments on an indication-by-indication basis of up to CHF 1.5 million and regulatory milestone payments on a product-by-product basis of up to CHF 2.5 million, subject to a mid-twenties percentage reduction for smaller indications, e.g., those qualifying for orphan drug status. To date, we have paid CHF 1.325 million to Xigen under the agreement. We will be required to pay Xigen a mid-single digit percentage royalty on net sales of each licensed product that uses a compound licensed under the agreement, which royalty for a given indication shall be partially offset by milestone payments we have paid for such indication, until the later of 10 years after the first commercial sale of any licensed product using such licensed compound in any country, and the first expiration of a patent owned by or exclusively licensed to Xigen that covers the use of such licensed compound in any country, subject to our obligation to enter into good faith negotiations with Xigen, upon expiration of the relevant patent on a licensed compound, about the conditions of our further use of such licensed compound.
Under this agreement we and Xigen grant each other access to non-clinical or clinical data relating to the compounds licensed under the agreement free of charge for use in the other party’s proprietary development programs. We have also agreed, upon Xigen’s request, to offer third parties access to our non-clinical and clinical data relating to compounds licensed under the agreement for use outside the field of our license, provided that with respect to third party access, we are compensated for a portion of our costs in obtaining such data. Further, pursuant to our agreement, we and Xigen agreed to enter into a supply agreement within a specified period after the date of the agreement, which period has since passed, pursuant to which Xigen would supply us with licensed compounds. We did not enter into such a supply agreement with Xigen. Xigen supplied us with the active pharmaceutical ingredient for AM-111 for a period of time, but we presently are receiving our supply from an alternative supplier.
Xigen is responsible for maintaining the patents licensed to us under our agreement. New patents filed by us for specific inner ear indications or formulations of compounds licensed under our agreement are jointly owned by us and Xigen, and exclusively licensed to us in our field. We retain all know-how and other results from our development of compounds licensed under the agreement.
Our agreement with Xigen remains in effect until terminated. Either we or Xigen may terminate the agreement for the other party’s material breach or bankruptcy, in the event of force majeure, or after a specified period following the date of the agreement, if we are not progressing any activities with respect to the licensed compound. This period has passed for AM-111. In October 2013, Xigen assigned certain of the patents relevant to the agreement to Xigen Inflammation Ltd, Cyprus, an unaffiliated party.
There have been several areas of disagreement with Xigen, primarily related to interpreting the definition of the Area, the transfer of patents to Xigen Inflammation Ltd. and to the disclosure of certain provisions of the agreement
in the context of our initial public offering. For a discussion of these issues, please refer to “Item 3. Key Information—D. Risk factors —Risks Related to our Reliance on Third Parties—We have several areas of disagreement with Xigen, and consequently our relationship with Xigen may be adversely affected, we could potentially lose our right to commercialize AM-111 and our business, commercialization prospects and financial condition may be adversely affected.”
Manufacturing
We currently rely on and expect to continue to rely on third parties for the supply of raw materials and to manufacture drug supplies for clinical trials of our product candidates, including AM-101 and AM-111. For the foreseeable future, we expect to continue to rely on such third parties for the manufacture of any of our product candidates on a clinical or commercial scale, if any of our product candidates receives regulatory approval. Reliance on third-party providers may expose us to more risk than if we were to manufacture product candidates ourselves. The facilities used by our contract manufacturers to manufacture our product candidates must be approved by the FDA or other regulatory authorities pursuant to inspections that will be conducted after we submit our NDA or comparable marketing application to the FDA or other regulatory authority. We do not have control over a supplier’s or manufacturer’s compliance with these laws, regulations and applicable cGMP standards and other laws and regulations, such as those related to environmental health and safety matters. If our contract manufacturers cannot successfully manufacture material that conforms to our specifications and the strict regulatory requirements of the FDA or others, they will not be able to secure and/or maintain regulatory approval for their manufacturing facilities. In addition, we have no control over the ability of our contract manufacturers to maintain adequate quality control, quality assurance and qualified personnel. If the FDA or a comparable foreign regulatory authority does not approve these facilities for the manufacture of our product candidates or if it withdraws any such approval in the future, we may need to find alternative manufacturing facilities, which would significantly impact our ability to develop, obtain regulatory approval for or market our product candidates, if approved. Any failure to achieve and maintain compliance with these laws, regulations and standards could subject us to the risk that we may have to suspend the manufacturing of our product candidates or that obtained approvals could be revoked, which would adversely affect our business and reputation. Furthermore, third-party providers may breach agreements they have with us because of factors beyond our control. They may also terminate or refuse to renew their agreements because of their own financial difficulties or business priorities, potentially at a time that is costly or otherwise inconvenient for us. If we were unable to find adequate replacement or another acceptable solution in time, our clinical trials could be delayed or our commercial activities could be harmed.
In addition, the fact that we are dependent on our suppliers and other third parties for the manufacture, storage and distribution of our product candidates means that we are subject to the risk that the products may have manufacturing defects that we have limited ability to prevent or control. The sale of products containing such defects could result in recalls or regulatory enforcement action that could adversely affect our business, financial condition and results of operations.
Growth in the costs and expenses of components or raw materials may also adversely influence our business, financial condition and results of operations. Supply sources could be interrupted from time to time and, if interrupted, that supplies could be resumed (whether in part or in whole) within a reasonable timeframe and at an acceptable cost or at all.
Commercialization Strategy
Given our current stage of product development, we currently do not have a commercialization infrastructure. If any of our product candidates is granted marketing approval, we intend to focus our initial commercial efforts in the United States and select European markets, which we believe represent the largest market opportunities for us. In those markets, we expect our commercial operations to include our own specialty sales force that we will specifically develop to target ENTs and specialists in neurotology, both in hospitals and in private practice. In other markets, we expect to seek partnerships that would maximize our products’ commercial potential.
Government Regulation
Product Approval Process
The clinical testing, manufacturing, labeling, storage, distribution, record keeping, advertising, promotion, import, export and marketing, among other things, of our product candidates are subject to extensive regulation by
governmental authorities in the United States and other countries. The U.S. Food and Drug Administration, or FDA, under the Federal Food, Drug, and Cosmetic Act, or FDCA, regulates pharmaceutical products in the United States. The steps required before a drug may be approved for marketing in the United States generally include:
|
|
·
|
the completion of preclinical laboratory tests and animal tests conducted under GLP regulations;
|
|
|
·
|
the submission to the FDA of an Investigational New Drug, or IND, application for human clinical testing, which must become effective before human clinical trials commence;
|
|
|
·
|
the performance of adequate and well-controlled human clinical trials to establish the safety and efficacy of the product candidate for each proposed indication and conducted in accordance with cGCP;
|
|
|
·
|
the submission to the FDA of a New Drug Application, or NDA;
|
|
|
·
|
the FDA’s acceptance of the NDA;
|
|
|
·
|
satisfactory completion of an FDA inspection of the manufacturing facilities at which the product is made to assess compliance with cGMPs; and
|
|
|
·
|
the FDA’s review and approval of an NDA prior to any commercial marketing or sale of the drug in the United States.
|
The testing and approval process requires substantial time, effort and financial resources, and the receipt and timing of any approval is uncertain.
Preclinical studies include laboratory evaluations of the product candidate, as well as animal studies to assess the potential safety and efficacy of the product candidate. The results of the preclinical studies, together with manufacturing information and analytical data, are submitted to the FDA as part of the IND, which must become effective before clinical trials may be commenced. The IND will become effective automatically 30 days after receipt by the FDA, unless the FDA raises concerns or questions about the conduct of the trials as outlined in the IND prior to that time. In this case, the IND sponsor and the FDA must resolve any outstanding concerns before clinical trials can proceed.
Clinical trials involve the administration of the product candidates to healthy volunteers or patients with the disease to be treated under the supervision of a qualified principal investigator. Clinical trials are conducted under protocols detailing, among other things, the objectives of the study, the parameters to be used in monitoring safety, and the efficacy criteria to be evaluated. A protocol for each clinical trial and any subsequent protocol amendments must be submitted to the FDA as part of the IND. Further, each clinical trial must be reviewed and approved by an independent institutional review board, or IRB, either centrally or individually at each institution at which the clinical trial will be conducted. The IRB will consider, among other things, ethical factors, the safety of human subjects and the possible liability of the institution. There are also requirements governing the reporting of ongoing clinical trials and clinical trial results to public registries. The FDA, the IRB or the clinical trial sponsor may suspend or terminate clinical trials at any time on various grounds, including a finding that the subjects or patients are being exposed to an unacceptable health risk. Additionally, some clinical trials are overseen by an independent group of qualified experts organized by the clinical trial sponsor, known as a data safety monitoring board or committee. This group provides authorization for whether or not a trial may move forward at designated check points based on access to certain data from the study. We may also suspend or terminate a clinical trial based on evolving business objectives and/or competitive climate.
Clinical trials typically are typically conducted in three sequential phases prior to approval, but the phases may overlap. These phases generally include the following:
|
|
Phase 1.
|
Phase 1 clinical trials represent the initial introduction of a product candidate into human subjects, frequently healthy volunteers. In Phase 1, the product candidate is usually tested for safety, including adverse effects, dosage tolerance, absorption, distribution, metabolism, excretion and pharmacodynamics.
|
|
|
Phase 2.
|
Phase 2 clinical trials usually involve studies in a limited patient population to (1) evaluate the efficacy of the product candidate for specific indications, (2) determine dosage tolerance and optimal dosage and (3) identify possible adverse effects and safety risks.
|
|
|
Phase 3.
|
If a product candidate is found to be potentially effective and to have an acceptable safety profile in Phase 2 studies, the clinical trial program will be expanded to Phase 3 clinical trials to further demonstrate clinical efficacy, optimal dosage and safety within an expanded patient population at geographically dispersed clinical study sites.
|
Phase 4 clinical trials are conducted after approval to gain additional experience from the treatment of patients in the intended therapeutic indication and to document a clinical benefit in the case of drugs approved under accelerated approval regulations, or when otherwise requested by the FDA in the form of post-market requirements or commitments. Failure to promptly conduct any required Phase 4 clinical trials could result in withdrawal of approval.
The results of preclinical studies and clinical trials, including negative or ambiguous results as well as positive findings, together with detailed information on the manufacture, composition and quality of the product, are submitted to the FDA in the form of an NDA requesting approval to market the product. The NDA must be accompanied by a significant user fee payment. The FDA has substantial discretion in the approval process and may refuse to accept any application or decide that the data is insufficient for approval and require additional preclinical, clinical or other studies.
In addition, under the Pediatric Research Equity Act, or PREA, an NDA or supplement to an NDA must contain data to assess the safety and effectiveness of the drug for the claimed indications in all relevant pediatric subpopulations and to support dosing and administration for each pediatric subpopulation for which the product is safe and effective. The FDA may grant deferrals for submission of data or full or partial waivers. Unless otherwise required by regulation, PREA does not apply to any drug for an indication for which orphan designation has been granted. However, if only one indication for a product has orphan designation, a pediatric assessment may still be required for any applications to market that same product for the non-orphan indication(s).
Once the NDA submission has been submitted, the FDA has 60 days after submission of the NDA to conduct an initial review to determine whether it is sufficient to accept for filing. Under the Prescription Drug User Fee Act, or PDUFA, the FDA sets a goal date by which it plans to complete its review. This is typically 12 months from the date of submission of the NDA application. The review process is often extended by FDA requests for additional information or clarification. Before approving an NDA, the FDA will inspect the facilities at which the product is manufactured and will not approve the product unless the manufacturing facility complies with cGMPs and may also inspect clinical trial sites for integrity of data supporting safety and efficacy. The FDA may also convene an advisory committee of external experts to provide input on certain review issues relating to risk, benefit and interpretation of clinical trial data. The FDA is not bound by the recommendations of an advisory committee, but generally follows such recommendations in making its decisions. The FDA may delay approval of an NDA if applicable regulatory criteria are not satisfied and/or the FDA requires additional testing or information. The FDA may require post-marketing testing and surveillance to monitor safety or efficacy of a product.
After the FDA evaluates the NDA and conducts inspections of manufacturing facilities where the drug product and/or its API will be produced, it may issue an approval letter or a Complete Response Letter. An approval letter authorizes commercial marketing of the drug with specific prescribing information for specific indications. A Complete Response Letter indicates that the review cycle of the application is complete and the application is not ready for approval. A Complete Response Letter may require additional clinical data and/or an additional pivotal Phase 3 clinical trial(s), and/or other significant, expensive and time-consuming requirements related to clinical trials, preclinical studies or manufacturing. Even if such additional information is submitted, the FDA may ultimately decide that the NDA does not satisfy the criteria for approval. The FDA could also approve the NDA with a Risk Evaluation and Mitigation Strategy, or REMS, plan to mitigate risks, which could include medication guides, physician communication plans, or elements to assure safe use, such as restricted distribution methods, patient registries and other risk minimization tools. The FDA also may condition approval on, among other things, changes to proposed labeling, development of adequate controls and specifications, or a commitment to conduct one or more post-market studies or clinical trials. Such post-market testing may include Phase 4 clinical trials and surveillance to further assess and monitor the product’s safety and effectiveness after commercialization.
Special Protocol Assessment
The FDA and an IND sponsor may agree in writing on the design and size of clinical studies intended to form the primary basis of a claim of effectiveness in an NDA. This process is known as a special protocol assessment, or SPA. Upon a specific request for a SPA by an IND sponsor, the FDA will evaluate the protocol. If a SPA agreement is reached, however, it is not a guarantee of product approval by the FDA or approval of any permissible claims about the product. The FDA retains significant latitude and discretion in interpreting the terms of the SPA agreement and the data and results from any study that is the subject of the SPA agreement. In particular, the SPA agreement is not binding on the FDA if previously unrecognized public health concerns later come to light, other new scientific concerns regarding product safety or efficacy arise, the IND sponsor fails to comply with the protocol agreed upon, or the relevant data, assumptions, or information provided by the IND sponsor when requesting a SPA agreement change, are found to be false statements or misstatements, or are found to omit relevant facts. A SPA agreement may not be changed by the sponsor or the FDA after the trial begins except with the written agreement of the sponsor and the FDA, or if the FDA determines that a substantial scientific issue essential to determining the safety or effectiveness of the drug was identified after the testing began.
Orphan Drug Designation
Under the Orphan Drug Act, the FDA may grant orphan designation to a drug or biological product intended to treat a rare disease or condition, which is a disease or condition that affects fewer than 200,000 individuals in the US, or if it affects more than 200,000 individuals in the US there is no reasonable expectation that the cost of developing and making a drug product available in the US for this type of disease or condition will be recovered from sales of the product. Orphan product designation must be requested before submitting an NDA. After the FDA grants orphan product designation, the identity of the therapeutic agent and its potential orphan use are disclosed publicly by the FDA. Orphan product designation does not convey any advantage in or shorten the duration of the regulatory review and approval process.
If a product that has orphan designation subsequently receives the first FDA approval for the disease or condition for which it has such designation, the product is entitled to orphan product exclusivity, which means that the FDA may not approve any other applications to market the same drug or biological product for the same indication for seven years, except in limited circumstances, such as a showing of clinical superiority to the product with orphan exclusivity. The designation of such drug also entitles a party to financial incentives such as opportunities for grant funding towards clinical trial costs, tax advantages and user-fee waivers. Competitors, however, may receive approval of different products for the indication for which the orphan product has exclusivity or obtain approval for the same product but for a different indication for which the orphan product has exclusivity. Orphan product exclusivity also could block the approval of one of our products for seven years if a competitor obtains approval of the same drug or biological product as defined by the FDA or if our drug candidate is determined to be contained within the competitor’s product for the same indication or disease. If a drug product designated as an orphan product receives marketing approval for an indication broader than what is designated, it may not be entitled to orphan product exclusivity. Orphan drug status in the European Union has similar but not identical benefits in that jurisdiction.
DEA Regulation
The Drug Enforcement Administration, or DEA, regulates drugs that are controlled substances. Controlled substances are those drugs that appear on one of the five schedules promulgated and administered by the DEA under the Controlled Substances Act, or CSA, such as Ketamine, which is a Schedule III controlled substance. The CSA governs, among other things, the inventory, distribution, recordkeeping, handling, security and disposal of controlled substances. Any drug that acts on the central nervous system has the potential to become a controlled substance, and scheduling by the DEA is a separate process that may delay the commercial launch of a drug even after FDA approval of the NDA. Companies with a scheduled drug are subject to periodic and ongoing inspections by the DEA and similar state drug enforcement authorities to assess ongoing compliance with the DEA’s regulations. Any failure to comply with these regulations could lead to a variety of sanctions, including the revocation or a denial of renewal of any DEA registration, injunctions, or civil or criminal penalties.
Post-Approval Requirements
Drugs manufactured or distributed pursuant to FDA approvals are subject to pervasive and continuing regulation by the FDA, including, among other things, requirements relating to recordkeeping, periodic reporting, product distribution, advertising and promotion and reporting of adverse experiences with the product. After approval, most changes to the approved product, such as adding new indications or other labeling claims are subject to prior FDA review and approval. There also are continuing, annual user fee requirements for any marketed products and the establishments at which such products are manufactured, as well as new application fees for supplemental applications with clinical data.
In addition, drug manufacturers and other entities involved in the manufacture and distribution of approved drugs are required to register their establishments with the FDA and state agencies, and are subject to periodic unannounced inspections by the FDA and these state agencies for compliance with cGMP requirements. Changes to the manufacturing process are strictly regulated and often require prior FDA approval before being implemented. FDA regulations also require investigation and correction of any deviations from cGMP and impose reporting and documentation requirements upon the sponsor and any third-party manufacturers that the sponsor may decide to use. Accordingly, manufacturers must continue to expend time, money, and effort in the area of production and quality control to maintain cGMP compliance.
Once an approval is granted, the FDA may withdraw the approval if compliance with regulatory requirements and standards is not maintained or if problems occur after the product reaches the market. Later discovery of previously unknown problems with a product, including adverse events of unanticipated severity or frequency, or with manufacturing processes, or failure to comply with regulatory requirements, may result in revisions to the approved labeling to add new safety information; imposition of post-market studies or clinical trials to assess new safety risks; or imposition of distribution or other restrictions under a REMS program. Other potential consequences include, among other things:
|
|
·
|
restrictions on the marketing or manufacturing of the product, complete withdrawal of the product from the market or product recalls;
|
|
|
·
|
fines, warning letters or holds on post-approval clinical trials;
|
|
|
·
|
refusal of the FDA to approve pending NDAs or supplements to approved NDAs, or suspension or revocation of product license approvals;
|
|
|
·
|
product seizure or detention, or refusal to permit the import or export of products; or
|
|
|
·
|
injunctions or the imposition of civil or criminal penalties.
|
The FDA strictly regulates marketing, labeling, advertising and promotion of products that are placed on the market. Drugs may be promoted only for the approved indications and in accordance with the provisions of the approved label. The FDA and other agencies actively enforce the laws and regulations prohibiting the promotion of off-label uses, and a company that is found to have improperly promoted off-label uses may be subject to significant liability.
Foreign Regulation
In order to market any product outside of the United States, we would need to comply with numerous and varying regulatory requirements of other countries and jurisdictions regarding quality, safety and efficacy and governing, among other things, clinical trials, marketing authorization, commercial sales and distribution of our products. Whether or not we obtain FDA approval for a product, we would need to obtain the necessary approvals by the comparable foreign regulatory authorities before we can commence clinical trials or marketing of the product in foreign countries and jurisdictions. Although many of the issues discussed above with respect to the United States apply similarly in the context of the European Union, the approval process varies between countries and jurisdictions and can involve additional product testing and additional administrative review periods. The time required to obtain approval in other countries and jurisdictions might differ from and be longer than that required to obtain FDA approval. Regulatory approval in one country or jurisdiction does not ensure regulatory approval in another, but a failure or delay in obtaining regulatory approval in one country or jurisdiction may negatively impact the regulatory process in others.
Other Healthcare Laws
In addition to FDA restrictions on marketing of pharmaceutical products, federal and state healthcare laws restrict certain business practices in the biopharmaceutical industry. These laws include, but are not limited to, anti-kickback, false claims, data privacy and security, and transparency statutes and regulations.
The federal Anti-Kickback Statute prohibits, among other things, knowingly and willfully offering, paying, soliciting or receiving remuneration, directly or indirectly, to induce, or in return for, purchasing, leasing, ordering or arranging for the purchase, lease or order of any good, facility, item or service reimbursable under Medicare, Medicaid or other federal healthcare programs. The term “remuneration” has been broadly interpreted to include anything of value, including for example, gifts, discounts, the furnishing of supplies or equipment, credit arrangements, payments of cash, waivers of payment, ownership interests and providing anything at less than its fair market value. The Anti-Kickback Statute has been interpreted to apply to arrangements between pharmaceutical manufacturers on one hand and prescribers, purchasers and formulary managers on the other. Although there are a number of statutory exceptions and regulatory safe harbors protecting certain common activities from prosecution, the exceptions and safe harbors are drawn narrowly, and our practices may not in all cases meet all of the criteria for a statutory exception or safe harbor protection. Practices that involve remuneration that may be alleged to be intended to induce prescribing, purchases or recommendations may be subject to scrutiny if they do not qualify for an exception or safe harbor. Failure to meet all of the requirements of a particular applicable statutory exception or regulatory safe harbor does not make the conduct per se illegal under the Anti-Kickback Statute. Instead, the legality of the arrangement will be evaluated on a case-by-case basis based on a cumulative review of all of its facts and circumstances. Several courts have interpreted the statute’s intent requirement to mean that if any one purpose of an arrangement involving remuneration is to induce referrals of federal healthcare covered business, the statute has been violated. The Patient Protection and Affordable Care Act as amended by the Health Care and Education Reconciliation Act, or collectively, PPACA, amended the intent requirement under the Anti-Kickback Statute and criminal healthcare fraud statutes (discussed below) such that a person or entity no longer needs to have actual knowledge of the statute or the specific intent to violate it in order to have committed a violation. In addition, PPACA provides that the government may assert that a claim including items or services resulting from a violation of the federal Anti-Kickback Statute constitutes a false or fraudulent claim for purposes of the civil False Claims Act (discussed below). Further, the civil monetary penalties statute imposes penalties against any person or entity who, among other things, is determined to have presented or caused to be presented a claim to a federal health program that the person knows or should know is for an item or service that was not provided as claimed or is false or fraudulent.
The federal false claims laws prohibit, among other things, any person or entity from knowingly presenting, or causing to be presented, a false or fraudulent claim for payment or approval to the federal government or knowingly making, using or causing to be made or used a false record or statement material to a false or fraudulent claim to the federal government. As a result of a modification made by the Fraud Enforcement and Recovery Act of 2009, a claim includes “any request or demand” for money or property presented to the U.S. government. Recently, several pharmaceutical and other healthcare companies have been prosecuted under these laws for, among other things, allegedly providing free product to customers with the expectation that the customers would bill federal programs for the product. Other companies have been prosecuted for causing false claims to be submitted because of the companies’ marketing of the product for unapproved, and thus non-covered, uses. The federal Health Insurance Portability and Accountability Act of 1996, or HIPAA, created new federal criminal statutes that prohibit knowingly and willfully executing, or attempting to execute, a scheme to defraud any healthcare benefit program, including private third-party payors and knowingly and willfully falsifying, concealing or covering up a material fact or making any materially false, fictitious or fraudulent statement in connection with the delivery of, or payment for, healthcare benefits, items or services.
In addition, we may be subject to data privacy and security regulation by both the federal government and the states in which we conduct our business. HIPAA, as amended by the Health Information Technology for Economic and Clinical Health Act, or HITECH, and its implementing regulations, imposes certain requirements relating to the privacy, security and transmission of individually identifiable health information. Among other things, HITECH makes HIPAA’s privacy and security standards directly applicable to business associates — independent contractors or agents of covered entities that receive or obtain protected health information in connection with providing a service on behalf of a covered entity. HITECH also created four new tiers of civil monetary penalties, amended HIPAA to make civil and criminal penalties directly applicable to business associates, and gave state attorneys general new authority to file civil actions for damages or injunctions in federal courts to enforce the federal HIPAA
laws and seek attorney’s fees and costs associated with pursuing federal civil actions. In addition, state laws govern the privacy and security of health information in certain circumstances, many of which differ from each other in significant ways and may not have the same effect, thus complicating compliance efforts.
Additionally, the PPACA also included the federal Physician Payments Sunshine Act, which requires that certain manufacturers of drugs, devices, biologicals and medical supplies for which payment is available under Medicare, Medicaid or the Children’s Health Insurance Program (with certain exceptions) to report information related to certain payments or other transfers of value made or distributed to physicians and teaching hospitals, or to entities or individuals at the request of, or designated on behalf of, the physicians and teaching hospitals and to report annually certain ownership and investment interests held by physicians and their immediate family members.
Also, many states have similar healthcare statutes or regulations that apply to items and services reimbursed under Medicaid and other state programs, or, in several states, apply regardless of the payor. Certain states require the posting of information relating to clinical studies, pharmaceutical companies to implement a comprehensive compliance program that includes a limit on expenditures for, or payments to, individual medical or health professionals and track and report gifts and other payments made to physicians and other healthcare providers. If our operations are found to be in violation of any of the health regulatory laws described above or any other laws that apply to us, we may be subject to penalties, including potentially significant criminal, civil and/or administrative penalties, damages, fines, disgorgement, individual imprisonment, exclusion of products from reimbursement under government programs, contractual damages, reputational harm, administrative burdens, diminished profits and future earnings and the curtailment or restructuring of our operations, any of which could adversely affect our ability to operate our business and our results of operations. To the extent that any of our products will be sold in a foreign country, we may be subject to similar foreign laws and regulations, which may include, for instance, applicable post-marketing requirements, including safety surveillance, anti-fraud and abuse laws and implementation of corporate compliance programs and reporting of payments or transfers of value to healthcare professionals.
Pharmaceutical Coverage, Pricing and Reimbursement
In both domestic and foreign markets, our sales of any approved products will depend in part on the availability of coverage and adequate reimbursement from third-party payors. Third-party payors include government authorities, managed care providers, private health insurers and other organizations. Patients who are prescribed treatments for their conditions and providers performing the prescribed services generally rely on third-party payors to reimburse all or part of the associated healthcare costs. Patients are unlikely to use our products, if approved, unless coverage is provided and reimbursement is adequate to cover a significant portion of the cost of our products. Sales of our products will therefore depend substantially, both domestically and abroad, on the extent to which the costs of our products will be paid by third-party payors. These third-party payors are increasingly focused on containing healthcare costs by challenging the price and examining the cost-effectiveness of medical products and services.
In addition, significant uncertainty exists as to the coverage and reimbursement status of newly approved healthcare product candidates. The market for our product candidates for which we may receive regulatory approval will depend significantly on access to third-party payors’ drug formularies, or lists of medications for which third-party payors provide coverage and reimbursement. The industry competition to be included in such formularies often leads to downward pricing pressures on pharmaceutical companies. Also, third-party payors may refuse to include a particular branded drug in their formularies or otherwise restrict patient access to a branded drug when a less costly generic equivalent or other alternative is available. Furthermore, third-party payor reimbursement to providers for our product candidates may be subject to a bundled payment that also includes the procedure administering our products. To the extent there is no separate payment for our product candidates, there may be further uncertainty as to the adequacy of reimbursement amounts. Because each third-party payor individually approves coverage and reimbursement levels, obtaining coverage and adequate reimbursement is a time-consuming, costly and sometimes unpredictable process. We may be required to provide scientific and clinical support for the use of any product to each third-party payor separately with no assurance that approval would be obtained, and we may need to conduct expensive pharmacoeconomic studies in order to demonstrate the cost-effectiveness of our products. This process could delay the market acceptance of any product and could have a negative effect on our future revenues and operating results. We cannot be certain that our product candidates will be considered cost-effective. Because coverage and reimbursement determinations are made on a payor-by-payor basis, obtaining acceptable coverage and reimbursement from one payor does not guarantee the Company will obtain similar acceptable coverage or reimbursement from another payor. If we are unable to obtain coverage of, and adequate reimbursement and payment levels for, our product candidates from third-party payors, physicians may limit how
much or under what circumstances they will prescribe or administer them and patients may decline to purchase them. This in turn could affect our ability to successfully commercialize our products and impact our profitability, results of operations, financial condition and future success.
Furthermore, in many foreign countries, particularly the countries of the European Union, the pricing of prescription drugs is subject to government control. In some non-U.S. jurisdictions, the proposed pricing for a drug must be approved before it may be lawfully marketed. The requirements governing drug pricing vary widely from country to country. For example, the European Union provides options for its member states to restrict the range of medicinal products for which their national health insurance systems provide reimbursement and to control the prices of medicinal products for human use. A member state may approve a specific price for the medicinal product or it may instead adopt a system of direct or indirect controls on the profitability of the Company placing the medicinal product on the market. We may face competition for our product candidates from lower-priced products in foreign countries that have placed price controls on pharmaceutical products. In addition, there may be importation of foreign products that compete with our own products, which could negatively impact our profitability.
Healthcare Reform
In the United States and foreign jurisdictions, there have been, and we expect there will continue to be, a number of legislative and regulatory changes to the healthcare system that could affect our future results of operations as we begin to directly commercialize our products.
In particular, there have been and continue to be a number of initiatives at the U.S. federal and state level that seek to reduce healthcare costs. Initiatives to reduce the federal deficit and to reform healthcare delivery are increasing cost-containment efforts. We anticipate that Congress, state legislatures and the private sector will continue to review and assess alternative benefits, controls on healthcare spending through limitations on the growth of private health insurance premiums and Medicare and Medicaid spending, the creation of large insurance purchasing groups, price controls on pharmaceuticals and other fundamental changes to the healthcare delivery system. Any proposed or actual changes could limit or eliminate our spending on development projects and affect our ultimate profitability.
In March 2010, PPACA was signed into law. PPACA has the potential to substantially change the way healthcare is financed by both governmental and private insurers. PPACA, among other things, established: an annual, nondeductible fee on any entity that manufactures or imports certain branded prescription drugs and biologic agents; revised the methodology by which rebates owed by manufacturers for covered outpatient drugs under the Medicaid Drug Rebate Program are calculated; increased the minimum Medicaid rebates owed by most manufacturers under the Medicaid Drug Rebate Program; extended the Medicaid Drug Rebate program to utilization of certain injectable outpatient drugs, as well as prescriptions of individuals enrolled in Medicaid managed care organizations; required manufacturers to offer 50% point-of-sale discounts on negotiated prices of applicable brand drugs to eligible beneficiaries during their coverage gap period, as a condition for the manufacturer’s outpatient drugs to be covered under Medicare Part D; and implemented payment system reforms including a national pilot program on payment bundling to encourage hospitals, physicians and other providers to improve the coordination, quality and efficiency of certain healthcare services through bundled payment models.
In the future, there may continue to be additional proposals relating to the reform of the United States healthcare system, some of which could further limit the prices we are able to charge for our products candidates, or the amounts of reimbursement available for our product candidates. If future legislation were to impose direct governmental price controls and access restrictions, it could have a significant adverse impact on our business. Managed care organizations, as well as Medicaid and other government agencies, continue to seek price discounts. Some states have implemented, and other states are considering, price controls or patient access constraints under the Medicaid program, and some states are considering price-control regimes that would apply to broader segments of their populations that are not Medicaid-eligible. Due to the volatility in the current economic and market dynamics, we are unable to predict the impact of any unforeseen or unknown legislative, regulatory, payor or policy actions, which may include cost containment and healthcare reform measures. Such policy actions could have a material adverse impact on our profitability.
Moreover, the recently enacted federal Drug Supply Chain Security Act imposes new obligations on manufacturers of pharmaceutical products, among others, related to product tracking and tracing. Among the requirements of this new federal legislation, manufacturers will be required to provide certain information regarding
the drug product to individuals and entities to which product ownership is transferred, label drug product with a product identifier, and keep certain records regarding the drug product. Further, under this new legislation, manufacturers will have drug product investigation, quarantine, disposition, and notification responsibilities related to counterfeit, diverted, stolen, and intentionally adulterated products, as well as products that are the subject of fraudulent transactions or which are otherwise unfit for distribution such that they would be reasonably likely to result in serious health consequences or death.
The registrant corporation, Auris Medical Holding AG, has four wholly owned subsidiaries which are each listed in Exhibit 8.1 filed hereto. We primarily operate our business out our operating subsidiary Auris Medical AG.
Our headquarters are in Zug, Switzerland. We also lease approximately 3,250 square feet of office space in Basel, Switzerland. This property serves as the corporate headquarters of our principal operating subsidiary. We believe that our existing facility is adequate to meet our current needs, and that suitable additional alternative spaces will be available in the future on commercially reasonable terms.
Not applicable.
You should read the following discussion and analysis of our financial condition and results of operations together with the information under “Item 3. Key Information—A. Selected Financial Data” and our consolidated audited financial statements, including the notes thereto, included in this Annual Report. The following discussion is based on our financial information prepared in accordance with IFRS as issued by the IASB, which might differ in material respects from generally accepted accounting principles in other jurisdictions. The following discussion includes forward-looking statements that involve risks, uncertainties and assumptions. Our actual results may differ materially from those anticipated in these forward-looking statements as a result of many factors, including but not limited to those described under “Item 3. Key Information—D. Risk Factors” and elsewhere in this Annual Report.
Overview
We are a clinical-stage biopharmaceutical company focused on the development of novel products for the treatment of inner ear disorders. Our most advanced product candidate, AM-101, is in Phase 3 clinical development for acute inner ear tinnitus under a special protocol assessment, or SPA, from the FDA. In two recently completed Phase 2 clinical trials, AM-101 demonstrated a favorable safety profile and statistically significant improvement in tinnitus loudness and other patient reported outcomes. We expect to have top-line Phase 3 clinical data for AM-101 in early 2016. We are also developing AM-111 for acute inner ear hearing loss. The FDA held a pre-IND meeting with us in September 2014 and provided formal feedback and guidance on our pre-clinical and CMC development and specifically on the HEALOS trial. In response to this feedback, we are in the process of finalizing the design of HEALOS. In addition, we obtained an open IND from the FDA for the REACH trial. We plan to conduct REACH in the U.S., comparing a single 0.4 mg/mL dose of AM-111 to a placebo. If we obtain sufficient funding, we intend to start HEALOS in the second half of 2015 and REACH in 2016. Both acute inner ear tinnitus and hearing loss are conditions for which there is high unmet medical need, and we believe that we have the potential to be the first to market in these indications.
To date, we have financed our operations through the initial public offering of our common shares, private placements of equity securities and short term loans. We have no products approved for commercialization and have never generated any revenues from royalties or product sales. As of December 31, 2014, we had cash and cash equivalents of CHF 56.9 million. Based on our current plans, we do not expect to generate royalty or product revenues unless and until we obtain marketing approval for, and commercialize, AM-101, AM-111 or any of our other product candidates.
Since inception, we have incurred significant operating losses. We incurred net losses (defined as net losses attributable to the owners of the Company) of CHF 18.2 million and CHF 15.0 million for the years ended December 31, 2014 and 2013, respectively. As of December 31, 2014, we had an accumulated deficit of CHF 52.1 million. We expect to continue incurring losses as we continue our clinical and preclinical development programs, apply for marketing approval for our product candidates and, subject to obtaining regulatory approval of our product candidates, build a sales and marketing force in preparation for the potential commercialization of our product candidates.
Collaboration and License Agreements
INSERM
In 2006, we entered into a co-ownership/exploitation agreement with the Institut National de la Santé et de la Recherche Médicale, or INSERM, a publicly funded government science and technology agency in France. Pursuant to the terms of the agreement, we were granted the exclusive right to exploit any products derived from patents that resulted from our joint research program with INSERM that was conducted in 2003 to 2005 and led to the development of AM-101. Pursuant to the terms of the co-ownership/exploitation agreement, we were given the exclusive right to exploit the patents issuing from the filed patent applications for all claimed applications, including the treatment of tinnitus, in order to develop, promote, manufacture, cause to be manufactured, use, sell and distribute any products, processes or services deriving from such patents, including AM-101, in any country in which these patent applications have been filed during the term of the agreement.
As consideration for the exclusive rights granted to us under the agreement, we agreed to pay INSERM a two tiered low single digit royalty (where the higher rate is due on any net sales above a certain threshold) on the net sales of any product covered by the patents (including the use of AM-101 in the treatment of tinnitus triggered by cochlear glutamate excitotoxicity) earned in each country in which these patent applications have been filed during the term of the agreement. We have also agreed to pay INSERM a low double digit fee on any sums of any nature (except royalties and certain costs) collected by us in respect of the granting of licenses to third parties.
Xigen
In October 2003, we entered into a collaboration and license agreement with Xigen S.A., or Xigen, pursuant to which Xigen granted us an exclusive worldwide license to use specified compounds to develop, manufacture and commercialize “pharmaceutical products as well as drug delivery devices and formulations for local administration of therapeutic substances to the inner ear for the treatment of ear disorders” (the Area). We also have a right of first refusal to license certain additional compounds developed by Xigen which may be used for the Area, specifically any cell permeable inhibitors to effectively block certain signal pathways in apoptotic processes.
Under this agreement, we made an upfront payment to Xigen of CHF 200,000 and we are obligated to make development milestone payments on an indication-by-indication basis of up to CHF 1.5 million and regulatory milestone payments on a product-by-product basis of up to CHF 2.5 million, subject to a mid-twenties percentage reduction for smaller indications, e.g., those qualifying for orphan drug status. To date, we have paid CHF 1.325 million to Xigen under the agreement. We will be required to pay Xigen a mid-single digit percentage royalty on net sales of each licensed product that uses a compound licensed under the agreement, which royalty for a given indication shall be partially offset by milestone payments we have paid for such indication, until the later of 10 years after the first commercial sale of any licensed product using such licensed compound in any country, and the first expiration of a patent owned by or exclusively licensed to Xigen that covers the use of such licensed compound in any country, subject to our obligation to enter into good faith negotiations with Xigen, upon expiration of the relevant patent on a licensed compound, about the conditions of our further use of such licensed compound.
Financial Operations Overview
Research and development expense
Research and development expense consists principally of:
|
|
·
|
salaries for research and development staff and related expenses, including employee benefits;
|
|
|
·
|
costs for production of preclinical compounds and drug substances by contract manufacturers;
|
|
|
·
|
fees and other costs paid to contract research organizations in connection with additional preclinical testing and the performance of clinical trials;
|
|
|
·
|
costs of related facilities, materials and equipment;
|
|
|
·
|
costs associated with obtaining and maintaining patents;
|
|
|
·
|
costs related to the preparation of regulatory filings and fees; and
|
|
|
·
|
depreciation and amortization of tangible and intangible fixed assets used to develop our product candidates.
|
We expect that our operating expenses in 2015 will be in the range of CHF 25.0 to 30.0 million (excluding AM-111 clinical Phase 3 expenses to enroll patients in either REACH or HEALOS), the majority of which we expect to be research and development expense. Our research and development expense mainly relates to the following key programs:
|
|
·
|
AM-101
. We have commenced a Phase 3 program of AM-101 comprising two Phase 3 studies and expect top-line data in early 2016. These two studies are extended into two open label extension studies. We anticipate that our research and development expenses will increase substantially in connection with these clinical trials.
|
|
|
·
|
AM-111
. We participated in a pre-IND meeting with the FDA in September 2014 in which the FDA provided formal feedback and guidance on our pre-clinical and CMC development and specifically on the planned HEALOS trial. In response to this feedback, we are in the process of finalizing the design of HEALOS. In addition, we obtained an open IND from the FDA for the REACH trial. We plan to conduct REACH in the U.S., comparing a single 0.4 mg/mL dose of AM-111 to a placebo. If we obtain sufficient funding, we intend to start HEALOS in the second half of 2015 and REACH in 2016. We anticipate that our research and development expenses will increase substantially in connection with commencement of additional clinical trials of AM-111.
|
|
|
·
|
Other development programs
. Other research and development expenses mainly relate to our preclinical studies of AM-102 and AM-123. The expenses mainly consist of salaries, costs for production of the preclinical compounds and costs paid to academic research institutions in conjunction with preclinical testing.
|
Since inception of the Company in 2003, we cumulatively have spent a cash amount of approximately CHF 55.7 million on research and development activities which we would now group under research and development expenses for our IFRS accounts. Due to the absence of IFRS figures for the years prior to 2012, this amount is an estimate only. For the years ended December 31, 2014, 2013 and 2012, we spent CHF 12.5 million, CHF 10.6 million and CHF 1.9 million, respectively, on research and development expenses related to AM-101. For the same time periods, we spent CHF 4.8 million, CHF 1.0 million and CHF 1.0 million, respectively, on research and development expenses related to AM-111. In addition, we incurred research and development expenses related to our earlier stage projects. These expenses exclude the milestone payment to Xigen for AM-111 as it was capitalized. Research and development expense is expected to increase as we advance the clinical development of AM-101 and AM-111 and to further advance the research and development of our pre-clinical product candidates. The successful development of our product candidates is highly uncertain. At this time we cannot reasonably estimate the nature, timing and estimated costs of the efforts that will be necessary to complete the development of, or the period, if any, in which material net cash inflows may commence from, any of our product candidates. This is due to numerous risks and uncertainties associated with developing drugs, including the uncertainty of:
|
|
·
|
the scope, rate of progress, results and cost of our clinical trials, nonclinical testing, and other related activities;
|
|
|
·
|
the cost of manufacturing clinical supplies, and establishing commercial supplies, of our product candidates and any products that we may develop;
|
|
|
·
|
the number and characteristics of product candidates that we pursue;
|
|
|
·
|
the cost, timing, and outcomes of regulatory approvals;
|
|
|
·
|
the cost and timing of establishing sales, marketing, and distribution capabilities; and
|
|
|
·
|
the terms and timing of any collaborative, licensing, and other arrangements that we may establish, including any required milestone and royalty payments thereunder.
|
A change in the outcome of any of these variables with respect to the development of AM-101, AM-111 or any other product candidate that we may develop could mean a significant change in the costs and timing associated with the development of such product candidate. For example, if the FDA or other regulatory authority were to require us to conduct preclinical and clinical studies beyond those which we currently anticipate will be required for the completion of clinical development or if we experience significant delays in enrollment in any clinical trials, we could be required to expend significant additional financial resources and time on the completion of the clinical development.
General and administrative expense
Our general and administrative expense consists principally of:
|
|
·
|
salaries for general and administrative staff and related expenses, including employee benefits;
|
|
|
·
|
business development expenses, including travel expenses;
|
|
|
·
|
administration costs including professional fees for auditors and other consulting expenses not related to research and development activities, professional fees for lawyers not related to the protection and maintenance of our intellectual property and IT expenses;
|
|
|
·
|
cost of facilities, communication and office expenses; and
|
|
|
·
|
depreciation and amortization of tangible and intangible fixed assets not related to research and development activities.
|
We expect that our general and administrative expense will increase in the future as our business expands and we incur additional costs associated with operating as a public company. These public company-related increases will likely include costs of additional personnel, additional legal fees, accounting and audit fees, managing directors’ and supervisory directors’ liability insurance premiums and costs related to investor relations.
Finance income
Our policy is to invest funds in low risk investments including interest bearing deposits. Saving and deposit accounts generate a small amount of interest income. We expect to continue this investment philosophy.
Finance expense
Our finance expense consists principally of commercial banking fees and foreign exchange losses.
Other comprehensive loss
Remeasurements of the net defined benefit liability, which comprise actuarial gains and losses, the return on plan assets (excluding interest) and the effect of the asset ceiling (if any, excluding interest), are recognized in other comprehensive loss.
We determine the net interest expense or income on the net defined benefit liability or asset for the period by applying the discount rate used to measure the defined benefit obligation at the beginning of the annual period to the then-net defined benefit liability or asset, taking into account any changes in the net defined benefit liability or asset during the period as a result of contributions and benefit payments. Net interest expense and other expenses related to defined benefit plans are recognized in profit or loss.
Assets and liabilities of our subsidiaries with functional currency other than CHF are included in our consolidated financial statements by translating the assets and liabilities into CHF at the exchange rates applicable at the end of the reporting period. Income and expenses for each consolidated statement of profit or loss and other comprehensive income are translated at average exchange rates (unless this average is not a reasonable approximation of the cumulative effect of the rates prevailing on the transaction dates, in which case income and expenses are translated at the dates of the transaction).
Foreign currency differences arising from translating the financial statements of our subsidiaries from currencies other than CHF are recognized in other comprehensive income and presented in the foreign currency translation reserve under equity in the statement of financial position. When a foreign operation is disposed of such that control, significant influence or joint control is lost, the cumulative amount in the translation reserve related to that foreign operation is reclassified to profit or loss as part of the gain or loss on disposal.
Results of Operations
The numbers below have been derived from our consolidated financial statements included elsewhere herein. The discussion below should be read along with these consolidated financial statements and it is qualified in its entirety by reference to them.
Comparison of the years ended December 31, 2014 and 2013
|
Year Ended December 31,
|
||||||||||||
|
2014
|
2013
|
Change
|
||||||||||
|
(in thousands of CHF)
|
%
|
|||||||||||
|
Research and development
|
(17,705 | ) | (13,254 | ) | 34 | % | ||||||
|
General and administrative
|
(4,489 | ) | (1,362 | ) | 230 | % | ||||||
|
Operating loss
|
(22,194 | ) | (14,616 | ) | 52 | % | ||||||
|
Finance expense
|
(208 | ) | (159 | ) | 31 | % | ||||||
|
Finance income
|
4,217 | 76 | 5,466 | % | ||||||||
|
Loss before tax
|
(18,185 | ) | (14,699 | ) | 24 | % | ||||||
|
Income tax expense
|
0 | (306 | ) | (100 | )% | |||||||
|
Net loss attributable to owners of the Company
|
(18,185 | ) | (15,005 | ) | 21 | % | ||||||
|
Other comprehensive loss:
|
||||||||||||
|
Items that will never be reclassified to profit or loss
|
||||||||||||
|
Remeasurements of defined benefits liability, net of taxes of CHF 0
|
(1,102 | ) | (58 | ) | 1,080 | % | ||||||
|
Items that are or may be reclassified to profit or loss
|
||||||||||||
|
Foreign currency translation differences, net of taxes of CHF 0
|
(105 | ) | 32 | (431 | )% | |||||||
|
Other comprehensive loss
|
(1,207 | ) | (26 | ) | 4,541 | % | ||||||
|
Total comprehensive loss attributable to owners of the Company
|
(19,392 | ) | (15,031 | ) | 29 | % | ||||||
Research and development expense
|
Year Ended December 31,
|
||||||||||||
|
2014
|
2013
|
Change
|
||||||||||
|
(in thousands of CHF)
|
%
|
|||||||||||
|
Research and development expense
|
||||||||||||
|
Clinical projects
|
(12,142 | ) | (8,753 | ) | 39 | % | ||||||
|
Preclinical projects
|
(1,160 | ) | (2,078 | ) | (44 | )% | ||||||
|
Drug manufacture and substance
|
(1,384 | ) | (1,036 | ) | 34 | % | ||||||
|
Employee benefits
|
(1,718 | ) | (1,074 | ) | 60 | % | ||||||
|
Other research and development expenses
|
(1,301 | ) | (313 | ) | 316 | % | ||||||
|
Total
|
(17,705 | ) | (13,254 | ) | 34 | % | ||||||
Research and development expense increased 34% from CHF 13.3 million in 2013 to CHF 17.7 million in 2014. Our research and development expense is dependent on the development phases of our research projects and
therefore fluctuates significantly from year to year. The variances in expense between 2013 and 2014 are mainly due to the following factors:
|
|
·
|
Clinical projects
. Beginning in February and March 2014 we enrolled patients in two AM-101 Phase 3 trials, namely TACTT2 and TACTT3. In addition, roll-over of study participants into the open-label follow-on studies AMPACT1 and AMPACT2 started in May/June 2014. This resulted in the incurrence of substantial service and pass through costs from our CROs and other service providers. In 2013, AM-101 clinical costs were lower as Phase 2 completed in February and we mainly incurred costs related to the preparation for the Phase 3 trials (notably for feasibility assessments, investigator and site selections, investigator meetings, validation and translation work on questionnaires and other study documents, procurement of electronic patient diaries, set-up of electronic data capture systems, databases and procedures as well as submissions to regulatory agencies and institutional review boards) . For AM-111, in 2014, we incurred significantly higher clinical costs for the preparation of the Phase 3 program, most notably, feasibility assessments, as well as investigator and site selections. In contrast, in 2013 expense levels related to the AM-111 project were lower because a Phase 2 clinical trial had been completed.
|
|
|
·
|
Preclinical projects
. In 2014 we finished toxicology studies with repeated AM-101 dosing and therefore incurred lower expenses as compared to 2013. In contrast, in 2014 we incurred higher expenses for AM-111 as we started a repeated dose toxicology study and finalized the analytical assay development. Costs incurred in 2013 related to project AM-102, including screening of compounds for a new pharmacological target in tinnitus. In addition, we initiated additional toxicology studies with repeated AM-101 dosing in rodents, and conducted reproduction toxicology studies with AM-111.
|
|
|
·
|
Drug manufacture and substance
. In 2014 we incurred substantial costs related to the manufacture of clinical supplies for AM-111 in preparation for the Phase 3 trial program as well as for analytical development and validation. In contrast, in 2013 we mainly incurred costs related to the manufacture, labelling and packaging of supplies for the AM-101 Phase 3 trials.
|
|
|
·
|
Employee benefits
. Headcount continued to increase in 2014 in line with the expansion of our research and development activities as well as our administrative functions.
|
General and administrative expense
|
Year Ended December 31,
|
||||||||||||
|
2014
|
2013
|
Change
|
||||||||||
|
General and administrative expense
|
(in thousands of CHF)
|
%
|
||||||||||
|
Employee benefits
|
(1,137 | ) | (196 | ) | 481 | % | ||||||
|
Administration costs
|
(2,014 | ) | (556 | ) | 262 | % | ||||||
|
Initial public offering costs, expensed
|
(822 | ) | 0 | 100 | % | |||||||
|
Other
|
(516 | ) | (610 | ) | (15 | )% | ||||||
|
Total
|
(4,489 | ) | (1,362 | ) | 230 | % | ||||||
General and administrative expense increased 229% from CHF 1.4 million in 2013 to CHF 4.5 million in 2014.
|
|
·
|
Employee benefits
. Headcount continued to increase in 2014 in line with the expansion of our administrative staff after becoming a publicly listed company.
|
|
|
·
|
Administration costs
. The increase reflects higher legal and auditing expenses in connection with the preparation for our initial public offering and expenses associated with operating as a public company after August 2014.
|
|
|
·
|
Initial public offering costs, expensed
. These initial public offering costs expensed in the three months ended March, 31, 2014, as management determined that successful completion was not deemed more likely than not. No such costs were incurred in 2013.
|
|
|
·
|
Other
. These costs were on aggregate broadly in line with 2013 and comprise facility, business development and travel costs.
|
We expect that general and administrative expense will increase significantly in the future as our business expands and we continue to increase headcount as well as incur additional costs associated with operating as a public company.
Finance income
Finance income increased from CHF 75,747 in 2013 to CHF 4.2 million 2014. Finance income in 2013 consisted primarily of interest income recognized on short-term deposits
Finance income increased substantially in 2014 primarily because of unrealized exchange gains due to the appreciation of the U.S. dollar (in which most of our cash was denominated after the initial public offering) against the CHF (our functional currency) as well as a result of an increase in average cash and cash equivalents following our initial public offering of common shares.
Finance expense
Finance expense increased from CHF 158,641 in 2013 to CHF 207,825 in 2014. Higher finance expenses were mainly due to net foreign exchange losses on our financial liabilities.
Income tax expense
As we have never generated revenue or other taxable income, there have been no income taxes paid so far. In 2014, we recorded a deferred income tax loss of CHF 32,761, which was offset with an income tax gain of CHF 32,761.
Remeasurements of defined benefits liability
Remeasurements of the net defined benefits liability, which comprise actuarial gains and losses, the return on plan assets (excluding interest) and the effect of the asset ceiling (if any, excluding interest), increased 1,808% from 2013 to 2014. The increase was primarily related to a higher actuarial loss arising from changes in financial assumptions and experience adjustments, partially offset by a higher return on plan assets.
Foreign currency translation differences
Foreign currency translation differences decreased by 431% from 2013 to 2014. The decrease was primarily related to changes in the opening and closing balance of the group’s currency translation adjustments.
Comparison of the years ended December 31, 2013 and 2012
|
Year Ended December 31,
|
||||||||||||
|
2013
|
2012
|
Change
|
||||||||||
|
(in thousands of CHF)
|
%
|
|||||||||||
|
Research and development
|
(13,254 | ) | (3,987 | ) | 232 | % | ||||||
|
General and administrative
|
(1,362 | ) | (624 | ) | 118 | % | ||||||
|
Operating loss
|
(14,616 | ) | (4,611 | ) | 217 | % | ||||||
|
Finance expense
|
(159 | ) | (2 | ) | 8,713 | % | ||||||
|
Finance income
|
76 | 10 | 666 | % | ||||||||
|
Loss before tax
|
(14,699 | ) | (4,602 | ) | 219 | % | ||||||
|
Income tax expense
|
(306 | ) | — | |||||||||
|
Net loss attributable to owners of the Company
|
(15,005 | ) | (4,602 | ) | 226 | % | ||||||
|
Other comprehensive loss:
|
||||||||||||
|
Items that will never be reclassified to profit or loss
|
||||||||||||
|
Remeasurements of defined benefit liability, net of taxes of CHF 0
|
(58 | ) | (55 | ) | 6 | % | ||||||
|
Items that are or may be reclassified to profit or loss
|
||||||||||||
|
Foreign currency translation differences, net of taxes of CHF 0
|
32 | 22 | 42 | % | ||||||||
|
Other comprehensive loss, net of taxes of CHF 0
|
(26 | ) | (32 | ) | (20 | )% | ||||||
|
Total comprehensive loss attributable to owners of the Company
|
(15,031 | ) | (4,635 | ) | 224 | % | ||||||
Research and development expense
|
Year Ended December 31,
|
||||||||||||
|
2013
|
2012
|
Change
|
||||||||||
|
(in thousands of CHF)
|
%
|
|||||||||||
|
Research and development expense
|
||||||||||||
|
Clinical projects
|
(8,753 | ) | (1,687 | ) | 419 | % | ||||||
|
Preclinical projects
|
(2,078 | ) | (298 | ) | 598 | % | ||||||
|
Drug manufacture and substance
|
(1,036 | ) | (915 | ) | 13 | % | ||||||
|
Employee benefits
|
(1,074 | ) | (770 | ) | 40 | % | ||||||
|
Other research and development expenses
|
(313 | ) | (317 | ) | (1 | )% | ||||||
|
Total
|
(13,254 | ) | (3,987 | ) | 232 | % | ||||||
Research and development expense increased 232% from CHF 4.0 million in 2012 to CHF 13.3 million in 2013. Our research and development expense is highly dependent on the development phases of our research projects and therefore fluctuates highly from year to year. The variances in expense between 2012 and 2013 are mainly due to the following factors:
|
|
·
|
Clinical Projects
. In 2013 we completed the second Phase 2 study with AM-101. At the same time we incurred substantial costs related to the preparation of the AM-101 Phase 3 program (TACTT2 and TACTT3), notably for feasibility assessments, investigator and site selections, investigator meetings, validation and translation work on questionnaires and other study documents, procurement of electronic patient diaries, set-up of electronic data capture systems, databases and procedures as well as submissions to regulatory agencies and institutional review boards. In contrast, expense levels related to the AM-111 project decreased from 2012 levels because Phase 2 clinical trial work was completed.
|
|
|
·
|
Preclinical projects
. In 2013, we stepped up our activities related to project AM-102, including screening of compounds for a new pharmacological target in tinnitus. In addition, we initiated additional toxicology studies with repeated AM-101 dosing in rodents, and conducted reproduction toxicology studies with AM-111.
|
|
|
·
|
Drug manufacture and substance
. In 2013 we incurred substantial costs related to the manufacture, labeling and packaging of supplies for the AM-101 Phase 3 trials.
|
|
|
·
|
Employee benefits
. Headcount continued to increase in 2013 in line with the expansion of our research and development activities.
|
General and administrative expense
General and administrative expense increased 118% from CHF 0.6 million in 2012 to CHF 1.4 million in 2013. The increase reflects higher business activity levels as well as additional business development activities.
Finance income
Finance income increased from CHF 9,894 in 2012 to CHF 75,747 in 2013. Finance income in these periods consisted primarily of interest income recognized on short-term deposits.
Finance income increased in 2013 as a result of an increase in average cash and cash equivalents following our private placement of preferred equity securities to new investors with total net proceeds of CHF 24.1 million in April 2013, and, to a lesser extent, a subsequent convertible loan from the same investors with total net proceeds of CHF 13.8 million in December 2013.
Finance expense
Finance expense increased from CHF 1,800 in 2012 to CHF 158,641 in 2013. Higher finance expenses were mainly due to adverse currency movements in 2013.
Income tax expense
As we have never generated revenue or other taxable income, there have been no income taxes paid so far. We have recorded a deferred income tax expense of CHF 305,750 (related to taxable temporary differences) for 2013.
Remeasurements of defined benefits liability
Remeasurements of the net defined benefits liability, which comprise actuarial gains and losses, the return on plan assets (excluding interest) and the effect of the asset ceiling (if any, excluding interest), increased 6% from 2012 to 2013. The increase was primarily related to a higher actuarial loss partially offset by a higher return on plan assets.
Foreign currency translation differences
Foreign currency translation differences increased by 42% from 2012 to 2013. The increase was primarily related to unfavorable movements in the CHF/USD exchange. The average and the year-end CHF/USD exchange rates for the years ended December 31, 2013 and December 31, 2012 were CHF 0.9391, CHF 0.8894, CHF 0.9481 and CHF 0.9154, respectively. The average and the year-end CHF /EUR exchange rates for years ended December 31, 2013 and December 31, 2012 were CHF 1.2414, CHF 1.2255, CHF 1.2196 and CHF 1.2068, respectively.
Since inception, we have incurred significant operating losses. To date, we have not generated any revenue. We have financed our operations through the initial public offering of our common shares, private placements of equity securities and short term loans.
Cash flows
Comparison of the year ended December 31, 2014 and 2013
The table below summarizes our consolidated statement of cash flows for the years ended December 31, 2014 and 2013:
|
Year Ended December 31,
|
||||||||
|
2014
|
2013
|
|||||||
|
(in thousands of CHF)
|
||||||||
|
Cash used in operating activities
|
(19,316 | ) | (14,044 | ) | ||||
|
Net cash used in investing activities
|
(1,186 | ) | (35 | ) | ||||
|
Net cash from financing activities
|
49,609 | 37,881 | ||||||
|
Net effect of currency translation on cash
|
3,961 | 0 | ||||||
|
Cash and cash equivalents at the beginning of the period
|
23,866 | 64 | ||||||
|
Cash and cash equivalents at the end of the period
|
56,934 | 23,866 | ||||||
The increase in cash used in operating activities by 38% from CHF 14.0 million in 2013 to CHF 19.3 million in 2014 was mainly due to an increase in research and development expenses as well as general and administrative spending.
Cash used in investing activities reflects, in both 2014 and 2013, cash used in the purchase of property, plant and equipment (manufacturing equipment and office furniture) offset by interest received. In 2014, it also includes a CHF 1.125 million cash milestone payment to Xigen.
Cash from financial activities, in 2014, is primarily driven by a net inflow of CHF 50.04 million from our initial public offering in August 2014. In 2013 net cash from financing activities reflects proceeds from the private placement of our Series C preferred shares to new investors providing total net proceeds of CHF 24.1 million in April 2013 as well as a convertible loan from Series C shareholders providing CHF 13.8 million in December 2013.
Comparison of the years ended December 31, 2013 and 2012
The table below summarizes our consolidated statement of cash flows for the years ended December 31, 2013 and 2012:
|
Year Ended December 31,
|
||||||||
|
2013
|
2012
|
|||||||
|
(in thousands of CHF)
|
||||||||
|
Cash used in operating activities
|
(14,044 | ) | (4,499 | ) | ||||
|
Net cash used in investing activities
|
(35 | ) | (53 | ) | ||||
|
Net cash from financing activities
|
37,881 | 3,862 | ||||||
|
Net effect of currency translation on cash
|
0 | 1 | ||||||
|
Cash and cash equivalents at the beginning of the period
|
64 | 753 | ||||||
|
Cash and cash equivalents at the end of the period
|
23,866 | 64 | ||||||
The increase in cash used in operating activities by 212% from CHF 4.5 million in 2012 to CHF 14.0 million in 2013 was mainly due to the substantial increase in development activities, notably clinical projects. The increase was partially offset by an increase in trade payables and accrued expenses.
The decrease in net cash used in investing activities by 34% from 2012 to 2013 reflected lower capital expenditures in dedicated manufacturing equipment.
The increase in net cash from financing activities from CHF 3.9 million in 2012 to CHF 37.9 million in 2013 is due to the private placement of our Series C preferred shares to new investors providing total net proceeds of CHF 24.1 million in April 2013 as well as a convertible loan from Series C shareholders providing CHF 13.8 million in December 2013.
Cash and funding sources
The table below summarizes our sources of financing for the years ended December 31, 2014, 2013 and 2012.
|
Equity Capital and Preferred Shares
|
Loans
|
Total
|
||||||||||
|
(in thousands of CHF)
|
||||||||||||
|
2014
|
50,038 | — | 50,038 | |||||||||
|
2013
|
24,111 | 13,770 | 37,881 | |||||||||
|
2012
|
3,862 | — | 3,862 | |||||||||
|
Total
|
78,011 | 13,770 | 91,781 | |||||||||
Our sources of financing in 2014 included the initial public offering of 10,113,235 common shares providing net proceeds (after underwriting fees, initial public offering and share issuance costs) of CHF 50.04 million.
Our sources of financing in 2013 included the private placement of our Series C preferred shares providing total net proceeds of CHF 24.1 million as well as a convertible loan from Series C shareholders providing CHF 13.8 million. Prior to the closing of the Series C financing round in April 2013, a bridge loan was provided by Altamira Pharma GmbH, a company wholly owned by our CEO; a portion of the net proceeds from our Series C financing were used to repay that loan.
Under the terms of the Series C investment agreement, we agreed that up to two additional closings resulting in further capital increase and issuance of new Series C preferred shares may be completed (the “Second Closing” and/or, the “Third Closing”, respectively). Pursuant to the terms of the convertible loan agreement, on January 13, 2014 the lenders exercised their right to convert the full amount of the loan into Series C preferred shares, replacing the Second Closing of the Series C financing. The obligation to effect the Third Closing was waived by the Company and the Series C investors.
Our sources from financing in 2012 were the payment of additional premiums on Series B preferred shares originally issued in 2011 as well as the placement of Series B preferred shares held in treasury.
As of December 31, 2014, we had no long-term debt.
We have no ongoing material financial commitments, such as lines of credit or guarantees that are expected to affect our liquidity over the next five years, other than leases.
Funding requirements
We believe that our existing cash and cash equivalents will enable us to fund our operating expenses and capital expenditure requirements until at least the fall of 2016. We have based this estimate on assumptions that may prove to be wrong, and we could use our capital resources sooner than we currently expect. Our future funding requirements will depend on many factors, including but not limited to:
|
|
·
|
the scope, rate of progress, results and cost of our clinical trials, nonclinical testing, and other related activities;
|
|
|
·
|
the cost of manufacturing clinical supplies, and establishing commercial supplies, of our product candidates and any products that we may develop;
|
|
|
·
|
the number and characteristics of product candidates that we pursue;
|
|
|
·
|
the cost, timing, and outcomes of regulatory approvals;
|
|
|
·
|
the cost and timing of establishing sales, marketing, and distribution capabilities; and
|
|
|
·
|
the terms and timing of any collaborative, licensing, and other arrangements that we may establish, including any required milestone and royalty payments thereunder.
|
We expect that we will require additional funding to advance our late-stage AM-111 clinical program in 2015. In addition, we expect that we will require additional capital to commercialize our product candidates AM-101 and AM-111. If we receive regulatory approval for AM-101 or AM-111, and if we choose not to grant any licenses to partners, we expect to incur significant commercialization expenses related to product manufacturing, sales, marketing and distribution, depending on where we choose to commercialize. Additional funds may not be available on a timely basis, on favorable terms, or at all, and such funds, if raised, may not be sufficient to enable us to continue to implement our long-term business strategy. If we are not able to raise capital when needed, we could be forced to delay, reduce or eliminate our product development programs or commercialization efforts.
We may raise additional capital through the sale of equity or convertible debt securities. In such an event, your ownership interest will be diluted, and the terms of these new securities may include liquidation or other preferences that adversely affect your rights as a holder of our common shares.
For more information as to the risks associated with our future funding needs, see “Item 3. Key Information—D. Risk factors.”
Significant accounting policies and use of estimates and judgment
Our management’s discussion and analysis of our financial condition and results of operations is based on our financial statements, which we have prepared in accordance with IFRS. The preparation of these financial statements requires us to make judgments, estimates and assumptions that affect the application of accounting policies and the reported amounts of assets, liabilities, income and expenses. Actual results may differ from these estimates.
While our significant accounting policies are more fully described in the notes to our audited consolidated financial statements appearing elsewhere in this Annual Report, we believe that the following accounting policies are the most critical to aid you in fully understanding and evaluating our financial condition and results of operations.
Intangible assets
Research and development
Expenditures on the research programs of the Company are not capitalized, they are expensed when incurred.
Expenditures on the Company’s development programs are generally not capitalized except if development costs can be measured reliably, the product or process is technically and commercially feasible, future economic benefits are probable, and the Company intends to and has sufficient resources to complete development and to use or sell the asset. For the development projects of the Company, these criteria are generally only met when regulatory approval for commercialization is obtained. Given the current stage of the development projects, no development expenditures have yet been capitalized. Intellectual property-related costs for patents are part of the expenditure for the research and development projects. Therefore, registration costs for patents are expensed when incurred as long as the research and development project concerned does not meet the criteria for capitalization.
Licenses
Intellectual property rights that are acquired by the Company are capitalized as intangible assets if they are controlled by the Company, are separately identifiable and are expected to generate future economic benefits, even if uncertainty exists as to whether the research and development will ultimately result in a marketable product. Consequently, upfront and milestone payments to third parties for the exclusive use of pharmaceutical compounds in specified areas of treatment are recognized as intangible assets.
Measurement
Intangible assets acquired that have finite useful lives are measured at cost less accumulated amortization and any accumulated impairment losses.
Subsequent expenditure
Subsequent expenditure is capitalized only when it increases the future economic benefits embodied in the specific asset to which it relates. All other expenditure, including expenditure on internally generated goodwill and brands, is recognized in profit or loss as incurred.
Amortization
All licenses of the Company have finite lives. Amortization will start once the Company’s intangible assets are available for use. Amortization of licenses is calculated on a straight line basis over the period of the expected benefit or until the license expires. The estimated useful life of the Company’s licenses is 10 years from the date first available for use or the remaining term of patent protection. The Company assesses at each balance sheet date whether intangible assets which are not yet ready for use are impaired.
Income tax
Income tax expense comprises current and deferred tax. It is recognized in profit or loss except to the extent that it relates to a business combination, or items recognized directly in equity or in OCI.
Current tax
Current tax comprises the expected tax payable or receivable on the taxable income or loss for the year and any adjustment to tax payable or receivable in respect of previous years. It is measured using tax rates enacted or substantively enacted at the reporting date.
Deferred tax
Deferred income tax is recognized, using the balance sheet liability method, on temporary differences arising between the tax bases of assets and liabilities and their carrying amounts in the consolidated financial statements. Deferred tax is not recognized for:
|
|
·
|
temporary differences on the initial recognition of assets or liabilities in a transaction that is not a business combination and that affects neither accounting nor taxable profit or loss;
|
|
|
·
|
temporary differences related to investments in subsidiaries to the extent that the Company is able to control the timing of the reversal of the temporary differences and it is probable that they will not reverse in the foreseeable future; and
|
|
|
·
|
taxable temporary differences arising on the initial recognition of goodwill.
|
Deferred income tax is determined using tax rates and laws that have been enacted or substantively enacted by the balance sheet date and are expected to apply when the related deferred income tax asset is realized or the deferred income tax liability is settled.
Deferred income tax assets are recognized to the extent that it is probable that future taxable profit will be available against which the temporary differences can be utilized. Deferred tax assets are reviewed at each reporting date and are reduced to the extent that it is no longer probable that the related tax benefit will be realized.
Deferred tax assets and liabilities are offset when there is a legally enforceable right to set off tax assets against tax liabilities and when they relate to income taxes levied by the same taxation authority and the Company intends to settle its tax assets and liabilities on a net basis.
Employee benefits
The Company maintains a pension plan for all employees in Switzerland through payments to a legally independent collective foundation. This pension plan qualifies under IFRS as defined benefit pension plan. There are no pension plans for the subsidiaries in Ireland and the United States.
The Company’s net obligation in respect of defined benefit plans is calculated by estimating the amount of future benefit that employees have earned in return for their service in the current and prior periods, discounting that amount and deducting the fair value of any plan assets.
The recognized asset is limited to the present value of economic benefits available in the form of any future refunds from the plan or reductions in future contributions to the plan. In order to calculate the present value of economic benefits, consideration is given to any minimum funding requirements.
Remeasurements of the net defined benefit liability, which comprise actuarial gains and losses, the return on plan assets (excluding interest) and the effect of the asset ceiling (if any, excluding interest), are recognized immediately in OCI. The Company determines the net interest expense (income) on the net defined benefit liability (asset) for the period by applying the discount rate used to measure the defined benefit obligation at the beginning of the annual period to the then-net defined benefit liability (asset), taking into account any changes in the net defined benefit liability (asset) during the period as a result of contributions and benefit payments. Net interest expense and other expenses related to defined benefit plans are recognized in profit or loss.
Share-based compensation
Share Options
The Company maintains various share-based payment plans in the form of stock option plans for its employees, members of the board of directors as well as key service providers. Stock options are granted at the Board’s discretion without any contractual or recurring obligations.
The share-based compensation plans qualify as equity settled plans. The grant-date fair value of share-based payment awards granted to employees is recognized as an expense, with a corresponding increase in equity, over the period that the employees become unconditionally entitled to the awards. The vesting of share options is conditional on the employee completing a period of service of three and four years respectively, from the grant date, in accordance with Plans A and C. Under the Auris Medical Holding AG Long Term Incentive Plan (“the 2014 Plan”), 50% of granted share options vest after a period of service of two years from the grant date and the remaining 50% vest after a period of service of three years from the grant date. Plan B was created to provide shares for share based compensation plans; it was used in the years 2008, 2009 and 2014 and is still in force. However, no options are currently outstanding under Plan B.
The amount recognized as an expense is adjusted to reflect the number of awards for which the related service and non-market performance conditions are expected to be met, such that the amount ultimately recognized as an expense is based on the number of awards that meet the related service and non-market performance conditions at the vesting date. Share-based payments that are not subject to any further conditions are expensed immediately at grant date. In the year the options are exercised the proceeds received net of any directly attributable transaction costs are credited to share capital (nominal value) and share premium.
Valuation of share options
The fair value of our shares is determined by our management and our board of directors, and takes into account numerous factors to determine a best estimate of the fair value of our common shares as of each grant date.
In our historic financing rounds we have mainly relied on the prior sale of stock method where the Company and new investors negotiate the Company’s valuation at arm’s length. Typical considerations in this method may include the type and amount of equity sold, the estimated volatility, the estimated time to liquidity, the relationship of the parties involved, the timing compared to the common shares valuation date and the financial condition and structure of the Company at the time of the sale.
In this process, we have taken into consideration the guidance recommended by the American Institute of Certified Public Accountants, or AICPA, Audit and Accounting Practice Aid, specifically the Valuation of Privately-Held-Company Equity Securities Issued as Compensation. The most frequent types of private transactions and their relevance to the derived fair value of our shares are the “Simple preferred stock financing transaction” (AICPA 8.03 a. i. and ii.) with new investors. Our assumptions and estimates are highly complex and involve subjective assumptions. Changes in these underlying assumptions and estimates could significantly change our reported or expected financial performance.
Following the completion of our initial public offering, option pricing and values are determined based on quoted market prices of our common shares.
Recent accounting pronouncements
See Note 4 to our audited financial statements included elsewhere in this Annual Report for a full description of recent accounting pronouncements, including the expected dates of adoption and effects on the Company’s financial condition, results of operations and cash flows.
JOBS Act exemptions
On April 5, 2012, the JOBS Act was signed into law. The JOBS Act contains provisions that, among other things, reduce certain reporting requirements for an “emerging growth company.” As an emerging growth company, we are electing to take advantage of the following exemptions:
|
|
·
|
not providing an auditor attestation report on our system of internal controls over financial reporting;
|
|
|
·
|
not providing all of the compensation disclosure that may be required of non-emerging growth public companies under the U.S. Dodd-Frank Wall Street Reform and Consumer Protection Act;
|
|
|
·
|
not disclosing certain executive compensation-related items such as the correlation between executive compensation and performance and comparisons of the Chief Executive Officer’s compensation to median employee compensation; and
|
|
|
·
|
not complying with any requirement that may be adopted by the Public Company Accounting Oversight Board regarding mandatory audit firm rotation or a supplement to the auditor’s report providing additional information about the audit and the financial statements (auditor discussion and analysis).
|
These exemptions will apply until 2019 or until we no longer meet the requirements of being an “emerging growth company,” whichever is earlier. We would cease to be an emerging growth company if we have more than $1.0 billion in annual revenue, have more than $700 million in market value of our common shares held by non-affiliates or issue more than $1.0 billion of non-convertible debt over a three-year period.
See “Item 4. Information on the Company—A. History and Development of the Company,” “Item 4. Information on the Company—B. Business Overview” and Item 5. Operating and Financial Review and Prospects—A. Operating Results—Results of Operations.”
See “Item 5. Operating and Financial Review and Prospects.”
As of the date of this Annual Report, we do not have any, and during the periods presented we did not have any, off-balance sheet arrangements except for the operating lease mentioned below.
The following table presents information relating to our contractual obligations as of December 31, 2014:
|
Payments Due by Period
|
||||||||||||
|
Less Than
1 Year
|
Between 1 and 5 Years
|
Total
|
||||||||||
|
(in thousands of CHF)
|
||||||||||||
|
Operating lease obligations(1)
|
104 | 59 | 163 | |||||||||
|
Total
|
104 | 59 | 163 | |||||||||
|
(1)
|
Operating lease obligations consist of payments pursuant to non-cancellable operating lease agreements relating to our lease of office space and are not accounted for on the balance sheet. The lease term is 5 years with an early termination option as of March 2016.
|
Under the terms of our collaboration and license agreement with Xigen, we are obliged to make development milestone payments on an indication-by-indication basis of up to CHF 1.5 million upon the successful completion of a Phase 2 clinical trial and regulatory milestone payments on a product-by-product basis of up to CHF 2.5 million, subject to a mid-twenties percentage reduction for smaller indications, e.g., those qualifying for orphan drug status, upon receiving marketing approval for a product. The milestones are not included in the table above as they have not met the recognition criteria for provisions and the timing of these is not yet determinable as it is dependent upon the achievement of earlier mentioned milestones.
|
G.
|
See “Forward-Looking Statements.”
The following table presents information about our executive officers and directors. The term of each of our directors is one year and, accordingly, will expire at the time of our 2015 annual shareholder meeting.
|
Name
|
Position
|
Age
|
Initial Year of Appointment
|
|||||||
|
Executive Officers
|
||||||||||
|
Thomas Meyer
|
Chairman and Chief Executive Officer
|
47 | 2003 | |||||||
|
Bettina Stubinski
|
Chief Medical Officer
|
48 | 2013 | |||||||
|
Sven Zimmermann
|
Chief Financial Officer
|
44 | 2014 | |||||||
|
Non-Executive Directors
|
||||||||||
|
Wolfgang Arnold
|
Director
|
73 | 2007 | |||||||
|
James I. Healy
|
Director
|
50 | 2013 | |||||||
|
Oliver Kubli
|
Director
|
42 | 2010 | |||||||
|
Alain Munoz
|
Director
|
65 | 2007 | |||||||
|
Antoine Papiernik
|
Director
|
48 | 2013 | |||||||
Unless otherwise indicated, the current business addresses for our executive officers and directors is Auris Medical Holding AG, Bahnhofstrasse 21, 6300 Zug, Switzerland.
Executive Officers
Thomas Meyer, Founder, Chairman and Chief Executive Officer:
Mr. Meyer founded Auris Medical in April 2003. Prior to founding us, he was the Chief Executive Officer of Disetronic Group, a leading Swiss supplier of precision infusion and injection systems. He worked for Disetronic in various functions starting in 1988, becoming member of the board of directors in 1996, Deputy Chief Executive Officer in 1999 and Chief Executive Officer in early 2000. Prior to joining Disetronic, he advised several Swiss companies in strategy, marketing and corporate finance. He holds a Ph.D. (Dr.rer.pol.) in business administration from the University of Fribourg, Switzerland.
Bettina Mirella Stubinski, Chief Medical Officer:
Dr. Stubinski has served as our Chief Medical Officer since September 2013. She previously spent nine years with Merck Serono, Geneva (Switzerland), her last position there being Head of Global Clinical Development Multiple Sclerosis. Prior to Serono she was employed with Novartis Consumer Health, and previous to that led the Clinical Research department of Berlin Chemie, a division of the Menarini Group, which she joined in 1996. Dr. Stubinski holds an M.D. with specialization in Clinical Neurophysiology from the Medical Faculty of the University of Genova, Italy, and started her career as a practicing Neurologist. In 2014 Dr. Stubinski obtained an M.B.A. at MIT’s Sloan School of Management.
Sven Zimmermann, Chief Financial Officer:
Mr. Zimmermann has served as our Chief Financial Officer since January 2014. He has over 10 years of experience in finance and equity capital markets. Before joining Auris Medical, Mr. Zimmermann was Chief Financial Officer of PregLem SA from June 2008 to March 2014 where he contributed to its acquisition by Gedeon Richter Plc in October 2010. Prior to PregLem SA, he worked as a Sell and Buy Side analyst for UBS in London and Zurich from March 2001 to June 2008. He has a degree in Biochemistry from the University of Fribourg, Switzerland and a PhD in Molecular Biology from the University of Zurich, Switzerland.
Non-Executive Directors
Wolfgang Arnold, Director:
Dr. Arnold has been a member of our board of directors since 2007. He is a professor emeritus in otolaryngology and head and neck surgery, and an internationally renowned expert in the field of inner ear disorders. Dr. Arnold has authored or co-authored more than 365 peer-reviewed scientific and medical articles and more than 10 textbooks. From 1992-2007, he served as Director of the Department of Otolaryngology, Head and Neck Surgery of the Technical University of Munich, Germany. He is still practicing today. Dr. Arnold holds an M.D. from the University of Munich.
James I. Healy, Director:
Dr. Healy has been a member of our board of directors since April 2013. Dr. Healy has been a General Partner of Sofinnova Ventures, a venture capital firm, since June 2000. Prior to June 2000, Dr. Healy held various positions at Sanderling Ventures, Bayer Healthcare Pharmaceuticals (as successor to Miles Laboratories) and ISTA Pharmaceuticals, Inc. Dr. Healy is currently on the board of directors of Hyperion Therapeutics, Inc., Amarin Corporation, plc., Ascendis Pharma A/S, Coherus Bioscience, Inc. and several private companies. Previously, he served as a board member of CoTherix, Inc., Durata Therapeutics, Inc., InterMune, Inc. Movetis NV and several private companies. Dr. Healy was nominated to our board of directors by Sofinnova Ventures. Dr. Healy holds an M.D. and a Ph.D. in Immunology from the Stanford School of Medicine and holds a B.A. in molecular biology and a B.A. in Scandinavian Studies from the University of California at Berkeley.
Oliver Kubli, Vice-Chairman:
Mr. Kubli has been a member of our board of directors since June 2010. He is a Managing Director and Head of the Portfolio Management of Adamant Biomedical Investments AG, a life science asset management boutique, which will be merged with Bellevue Asset Management AG end of March 2015. Mr. Kubli is the Senior Portfolio Manager for several public health care funds. Prior to joining Adamant in 2008, he held various management positions at ZKB and was responsible for the global health care sector within the bank’s Asset Management Division. Mr. Kubli started his career as a financial analyst and portfolio manager with UBS and Swiss Re. Mr. Kubli was nominated to our board of directors by Adamant. He is a chartered financial analyst (CFA) and holds a B.A. in Business Administration from the University of Applied Sciences, Zürich/Winterthur, Switzerland.
Alain Munoz, Director:
Dr. Munoz has been a member of our board of directors since December 2007. He is an independent management consultant in the pharmaceutical industry and Venture Partner with Kurma Biofund, Paris. From 1990 to 2000, Dr. Munoz held various management positions with the Fournier Group, including Senior Vice President of the Pharmaceutical Division. He joined Fournier from Sanofi Research, where he first started as Director in the cardiovascular and anti-thrombotic products business and then as Vice President international development. Dr. Munoz is qualified in cardiology and anesthesiology from the University Hospital of Montpellier, France. He serves on the Board of Valneva SA, Umecrine Mood AB, Hybrigenics S.A. and Zealand Pharma A/S. He was nominated to our board of directors by Idinvest.
Antoine Papiernik, Director:
Mr. Papiernik has been a member of our board of directors since April 2013. He is a Managing Partner at Sofinnova Partners, a French venture capital firm, which he joined in 1997. He serves on the boards of directors of Shockwave Medical, Inc., Pixium Vision, Stentys S.A., ReCord Medical, ProQR Therapeutics BV and Mainstay Medical Ltd. Mr. Papiernik was nominated to our board of directors by Sofinnova Partners. He has an MBA from the Wharton School of Business.
|
B.
|
For the year ended December 31, 2014, the aggregate compensation accrued or paid to the members of our board of directors and our executive officers for services in all capacities was CHF 1,008,817.
The amount set aside or accrued by us to provide pension, retirement or similar benefits to members of our board of directors or executive officers amounted to a total of CHF 63,386 in the year ended December 31, 2014.
Employment Agreements
We have entered into employment agreements with our executive officers, Thomas Meyer, Bettina Stubinski and Sven Zimmermann. The employment agreements provide for the compensation that our executive officers are entitled to receive, including certain equity grants, and contain termination notice periods of four weeks for the first three months and then afterwards six-months’ notice. The Company will have title to the intellectual property rights developed in connection with the executive officer’s employment, if any. There is an 18 month non-compete period following the end of employment in our agreement with Mr. Meyer.
None of our directors have entered into service agreements with the Company. However, we may in the future enter into employment or services agreements with such individuals, the terms of which may provide for, among other things, cash or equity-based compensation and benefits.
Equity Incentive Plans
Following our initial public offering, we ceased issuing any new grants under Stock Option Plan C and adopted a new omnibus equity incentive plan under which we have the discretion to grant a broad range of equity-based awards to eligible participants.
Equity Incentive Plan
In August 2014, we established the 2014 Plan with the purpose of motivating and rewarding those employees and other individuals who are expected to contribute significantly to our success, and advancing the interests of our shareholders by enhancing our ability to attract, retain and motivate individuals. The maximum number of shares available for issuance under the 2014 Plan is 1,500,000 common shares as provided in our articles of incorporation. The option exercise price for options under the 2014 Plan is determined by the compensation committee at the time of grant, but shall not be less than the nominal value of a share of common stock on the grant date.
Plan administration
. The 2014 Plan is administered by our compensation committee. Approval of the committee is required for all grants of awards under the 2014 Plan. The committee may delegate to one or more officers the authority to grant opinions and stock appreciation rights, and the committee may delegate to another committee (which may consist of solely one director) the authority to grant all types of awards.
Eligibility
.
Any employee, consultant or any other individual who provides services to us or any of our affiliates is eligible to be selected to receive an award under the 2014 Plan
.
Awards
. Awards include options, stock appreciation rights, restricted stock, restricted stock units, performance awards and other stock-based awards.
Vesting period
. The committee determines
the time or times at which an option becomes vested and exercisable,
provided that the minimum vesting period is 12 months. The committee may
specify in an award agreement that an “in-the-money” option be automatically exercised on its expiration date.
For restricted stock and restricted stock units, the award agreement will specify the vesting schedule and, with respect to restricted stock units, the delivery schedule.
Accelerated vesting
. Subject to any additional vesting conditions that may be specified in an individual award agreement, the 2014 Plan provides that upon a change of control of the Company (as defined in the 2014 Plan) the committee may cause options and stock appreciation rights to be cancelled in consideration of full acceleration of the award or a substitute award with equal intrinsic value (as defined in the 2014 Plan). It also provides that the committee may decide, or include in any award agreement,
the circumstances in which, and the extent to which, an award may be exercised, settled, vested, paid or forfeited
in the event of a participant’s termination of service prior to exercise or settlement of an award.
Amendment
. Our board of directors has the authority to amend the 2014 Plan subject, in certain circumstances, to required shareholder approval or the consent of an affected participant.
Prior Plans
In 2013 we established Plan C, and in 2008 we established Plan A and Plan B. We refer to Plan A, Plan B and Plan C together as the Prior Plans. Each of the Prior Plans permits the grant of options, or Options, which are subject to transfer restrictions. As of December 31, 2014, there were 146,000 common shares underlying outstanding Options granted pursuant to Plan A and 173,750 common shares underlying outstanding Options granted pursuant to Plan C. There are no outstanding Options under Plan B.
Plan Administration
. Under each of the Prior Plans, an Option, which can only be granted with the approval of our board of directors, is evidenced by an option agreement signed by the participant to indicate his or her acceptance of the Option subject to the terms and conditions of the applicable Prior Plan.
Eligibility
. Under Plan A and Plan C, Options may be granted to directors, employees, advisors and agents of the Company. Under Plan B, Options may be granted to employees entitled to receive a portion of their remuneration in equity.
Option Exercise Price
. The exercise price of each Option is set forth in the applicable option agreement. The exercise prices for currently granted and unexercised Options range from CHF 3.20 to CHF 5.28.
Vesting Period
. Under Plan A and Plan C, the option period commences on the date of grant and lasts for five years and six years, respectively. Under Plan B, the option period commences on the date of grant and lasts for three months. Under Plan A and Plan C, Options vest after three years and four years, respectively. Options granted under Plan B are exercisable at any time during their term. Options granted under Plan A vested and became immediately exercisable upon the closing of our initial public offering.
Amendment
. Our board of directors has the authority to amend each of the Prior Plans.
Indemnification
Subject to Swiss law, Article 17 of our articles of association provides for indemnification of the existing and former members of our board of directors, executive management, and their heirs, executors and administrators, against liabilities arising in connection with the performance of their duties in such capacity, and permits us to advance the expenses of defending any act, suit or proceeding to members of our board of directors and executive management. We also have entered into indemnification agreements with each of the members of our board of directors and executive officers in the form filed as Exhibit 4.9 to this Annual Report.
Insofar as indemnification for liabilities arising under the Securities Act of 1933, as amended, may be permitted to directors, officers and controlling persons of the Company, the Company has been advised that, in the opinion of the Securities and Exchange Commission, such indemnification is against public policy as expressed in the Securities Act of 1933, as amended, and is, therefore, unenforceable.
Board Composition and Election of Directors
Our board of directors is composed of six members, see “Item 6. Directors, Senior Management and Employees—A. Directors and senior management.” Each director is elected for a one year term. Our articles of association require our directors to retire once they have reached 75 years of age, subject to a special exception being granted by the general meeting of shareholders for up to two additional terms of office. The current members of our board of directors were appointed at a shareholders’ meeting held on April 22, 2014 to serve until their successors are duly elected and qualified.
We are a foreign private issuer. As a result, in accordance with the Nasdaq stock exchange listing requirements, we will rely on home country governance requirements and certain exemptions thereunder rather than relying on the stock exchange corporate governance requirements. For an overview of our corporate governance principles, see “Item 16G. Corporate governance.”
Committees of the Board of Directors
Audit Committee
The audit committee, which consists of Oliver Kubli, Alain Munoz and James I. Healy, assists our board of directors in overseeing our accounting and financial reporting processes and the audits of our financial statements. In addition, the audit committee is directly responsible for the appointment, compensation, retention and oversight of the work of our independent registered public accounting firm. Mr. Kubli serves as Chairman of the committee. The audit committee consists exclusively of members of our supervisory board who are financially literate, and Mr. Kubli is considered an “audit committee financial expert” as defined by the SEC. Our board of directors has determined that Mr. Kubli and Mr. Munoz satisfy the “independence” requirements set forth in Rule 10A-3 under the Exchange Act.
The audit committee is governed by a charter that complies with Nasdaq rules. The audit committee is responsible for, among other things:
|
|
·
|
the appointment, compensation, retention and oversight of any auditor or accounting firm engaged for the purpose of preparing or issuing an audit report or performing other audit, review or attest services;
|
|
|
·
|
pre-approving the audit services and non-audit services to be provided by our independent auditor before the auditor is engaged to render such services;
|
|
|
·
|
reviewing and discussing with the independent auditor its responsibilities under generally accepted auditing standards, the planned scope and timing of the independent auditor’s annual audit plan(s) and significant findings from the audit;
|
|
|
·
|
obtaining and reviewing a report from the independent auditor describing all relationships between the independent auditor and the Company consistent with the applicable PCAOB requirements regarding the independent auditor’s communications with the audit committee concerning independence;
|
|
|
·
|
confirming and evaluating the rotation of the audit partners on the audit engagement team as required by law;
|
|
|
·
|
reviewing with management and the independent auditor, in separate meetings whenever the Audit Committee deems appropriate, any analyses or other written communications prepared by the Management and/or the independent auditor setting forth significant financial reporting issues and judgments made in connection with the preparation of the financial statements, including analyses of the effects of alternative IFRS methods on the financial statements; and other critical accounting policies and practices of the Company;
|
|
|
·
|
reviewing, in conjunction with the Chief Executive Officer and Chief Financial Officer of the Company, the Company’s disclosure controls and procedures and internal control over financial reporting;
|
|
|
·
|
establishing procedures for the receipt, retention and treatment of complaints received by the Company regarding accounting, internal accounting controls or auditing matters, and the confidential, anonymous submission by employees of the Company of concerns regarding questionable accounting or auditing matters;
|
|
|
·
|
approving or ratifying any related person transaction (as defined in our related person transaction policy) in accordance with our related person transaction policy.
|
The audit committee meets at least four times per year.
Compensation Committee
The compensation committee, which consists of Antoine Papiernik and Wolfgang Arnold, assists our board of directors in overseeing our cash compensation and equity award recommendations for our executive officers along with the rationale for such recommendations, as well as summary information regarding the aggregate compensation provided to our executive officers. Swiss law requires that we adopt a compensation committee, so in accordance with Nasdaq Listing Rule 5615(a)(3), follow home country requirements with respect to the compensation committee. As a result, our practice varies from the requirements of Nasdaq Listing Rule 5605(d), which sets forth certain requirements as to the responsibilities, composition and independence of compensation committees.
|
D.
|
As of December 31, 2014, we had 16 employees, eight of whom hold M.D. or Ph.D. degrees. None of our employees is subject to a collective bargaining agreement or represented by a trade or labor union. We consider our relations with our employees to be good.
See “Item 7. Major Shareholders and Related Party Transactions—A. Major shareholders.”
The following table presents information relating to the beneficial ownership of our common shares as of March 20, 2015, by:
|
|
·
|
each person, or group of affiliated persons, known by us to own beneficially 5% or more of our outstanding common shares;
|
|
|
·
|
each of our executive officers and directors; and
|
|
|
·
|
all executive officers and directors as a group.
|
The number of common shares beneficially owned by each entity, person, executive officer or director is determined in accordance with the rules of the SEC, and the information is not necessarily indicative of beneficial ownership for any other purpose. Under such rules, beneficial ownership includes any common shares over which the individual has sole or shared voting power or investment power as well as any common shares that the individual has the right to acquire within 60 days of March 20, 2015 through the exercise of any option, warrant or other right. Except as otherwise indicated, and subject to applicable community property laws, the persons named in the table have sole voting and investment power with respect to all common shares held by that person.
Common shares that a person has the right to acquire within 60 days of March 20, 2015 are deemed outstanding for purposes of computing the percentage ownership of the person holding such rights, but are not deemed outstanding for purposes of computing the percentage ownership of any other person, except with respect to the percentage ownership of all executive officers and directors as a group. As of March 20, 2015, 9,151,509 common shares, or approximately 31.5%, are held by three holders in the United States. Unless otherwise indicated below, the address for each beneficial owner is Auris Medical Holding AG, Bahnhofstrasse 21, 6300 Zug, Switzerland.
The percentage of common shares beneficially owned is based on 29,010,391 common shares issued and outstanding as of March 20, 2015.
|
Shares Beneficially Owned
|
||||||||
|
Shareholder
|
Number
|
Percent
|
||||||
|
5% Shareholders
|
||||||||
|
Sofinnova Venture
Partners VIII, L.P.(1)
|
5,818,175 | 20.1 | % | |||||
|
Sofinnova Capital VII FCPR(2)
|
5,384,450 | 18.6 | % | |||||
|
Entities affiliated with ZKB(3)
|
2,169,625 | 7.5 | % | |||||
|
Entities affiliated with Idinvest Partners(4)
|
2,065,233 | 7.1 | % | |||||
|
Clifton Park Capital Management, LLC(5)
|
1,666,667 | 5.7 | % | |||||
|
FMR LLC (6)
|
1,666,667 | 5.7 | % | |||||
|
Executive Officers and Directors
|
||||||||
|
Thomas Meyer, Ph.D.(11)
|
6,742,500 | 23.2 | % | |||||
|
Wolfgang Arnold, M.D.(11)
|
12,500 | * | ||||||
|
Alain Munoz, M.D.(7)(11)
|
12,500 | * | ||||||
|
James I. Healy, M.D., Ph.D.(8)
|
5,818,175 | 20.1 | % | |||||
|
Oliver Kubli(9)(11)
|
2,188,375 | 7.5 | % | |||||
|
Antoine Papiernik(10)
|
5,384,450 | 18.6 | % | |||||
|
Bettina Stubinski, M.D.
|
25,862 | * | ||||||
|
Sven Zimmermann, Ph.D.
|
29,019 | * | ||||||
|
*
|
Indicates beneficial ownership of less than 1% of the total outstanding common shares.
|
|
(1)
|
James I. Healy and the other managing members of Sofinnova Management VIII, L.L.C., which is the general partner of Sofinnova Venture Partners VIII, L.P., share the power to vote or dispose of these shares and therefore may be deemed to have voting and investment power with respect to such shares. Each of the managing members disclaims beneficial ownership of such shares except to the extent of his pecuniary interest
|
|
|
therein, if any. The address for Sofinnova Venture Partners VIII, L.P. and Sofinnova Management VIII, L.L.C. is 2800 Sand Hill Road, Suite 150, Menlo Park, California 94025, USA.
|
|
(2)
|
Consists of 5,384,450 common shares held by Sofinnova Capital VII FCPR. Sofinnova Partners SAS, a French corporation and the management company of Sofinnova Capital VII FCPR, may be deemed to have sole voting and investment power, and Denis Lucquin, Antoine Papiernik, Rafaele Tordjman and Monique Saulnier, the managing partners of Sofinnova Partners SAS, may be deemed to have shared voting and investment power with respect to such shares. All of the managing partners of Sofinnova Partners SAS disclaim beneficial ownership of such shares except to the extent of their pecuniary interest therein. The address for Sofinnova Capital VII FCPR is 16-18 Rue du Quatre Septembre, 75002 Paris, France.
|
|
(3)
|
Consists of 575,000 common shares held by Adamant Global Generika Funds, 418,750 common shares held by Adamant Global Biotech Funds and 238,375 shares held by Adamant Global Medtech Funds (collectively, the “AG Funds”) and 937,500 common shares held by ZKB Pharma Vision Funds. Voting and investment power over the shares is exercised by Balfidor Fondsleitung AG, Peter Merian-Strasse 47, 4002 Basel, Switzerland. The address for the AG Funds is c/o Adamant Biomedical Investments AG, Freischützgasse 3, 8004 Zürich, Switzerland. The address for ZKB Pharma Vision Funds is c/o Zurcher Kantonalbank, Bahnhofstrasse 9, 8001 Zurich, Switzerland.
|
|
(4)
|
Consists of 805,481 common shares held by Allianz Innovation 8 FCPI; 578,257 common shares held by Idinvest Croissance 2005 FCPI; 454,360 shares held by Allianz Innovation 7 FCPI and 227,135 shares held by La Banque Postale Innovation 3 FCPI. These entities are collectively referred to as the “Idinvest Funds.” Idinvest Partners is the investment management company to the Idinvest Funds. Christophe Baviere and Benoist Grossmann are respectively CEO and Managing Partner of Idinvest Partners and as such represent the interests of the Idinvest Funds over the common shares held by them. Each of Christophe Baviere and Benoist Grossmann disclaim beneficial ownership of all applicable shares except to the extent of any pecuniary interest therein. The address for each of the Idinvest Funds is c/o Idinvest Partners, 117, avenue des Champs Elysées, 75008 Paris, France.
|
|
(5)
|
Based on a Schedule 13G filed with the SEC on February 13, 2015 by FMR LLC. Members of the family of Edward C. Johnson 3d, Director and Chairman of FMR LLC, including Abigail P. Johnson, Vice Chairman, Chief Executive Officer and President of FMR LLC, are the predominant owners, directly or through trusts, of 49% of the voting power of FMR LLC. FMR LLC reports that members of the Johnson family may be deemed, under the Investment Company Act of 1940, to form a controlling group with respect to FMR LLC. FMR LLC reports that neither FMR LLC nor Edward C. Johnson 3d nor Abigail P. Johnson has the sole power to vote or direct the voting of the shares owned directly by the various investment companies registered under the Investment Company Act (“Fidelity Funds”) advised by Fidelity Management & Research Company (“Fidelity”), a wholly owned subsidiary of FMR LLC, which power resides with the Fidelity Funds’ Boards of Trustees. Fidelity carries out the voting of the shares under written guidelines established by the Fidelity Funds’ Boards of Trustees. FMR LLC reports that the shares it beneficially owns do not reflect securities, if any, beneficially owned by certain other companies whose beneficial ownership of securities is disaggregated from that of its subsidiaries, affiliates and other companies in accordance with Securities and Exchange Commission Release No. 34-39538 (January 12, 1998). The address of FMR LLC and Fidelity is 245 Summer Street, Boston, Massachusetts 02210.
|
|
(6)
|
Based on a Schedule 13G filed with the SEC on February 13, 2015 by Clifton Park Capital Management, LLC. The address of Clifton Park Capital Management, LLC is 2711 Centerville Road, Suite 400, Wilmington, Delaware 19808-1645.
|
|
(7)
|
Consists of 12,500 common shares held by Dr. Munoz.
|
|
(8)
|
Consists of 5,818,175 common shares held by Sofinnova Venture Partners VIII, L.P. Dr. Healy is a managing member of Sofinnova Management VIII, L.L.C., the general partner of Sofinnova Venture Partners VIII, L.P., and may be considered to have beneficial ownership of Sofinnova Venture Partners VIII, L.P.’s interest in us. Dr. Healy disclaims beneficial ownership of all shares held by Sofinnova Venture Partners VIII, L.P., except to the extent of his pecuniary interest therein.
|
|
(9)
|
Consists of 1,232,125 common shares held by the AG Funds and 937,500 common shares held by the ZKB Pharma Vision Funds. Mr. Kubli is a Senior Portfolio manager for the AG Funds and the ZKB Fonds Aktien Gesundheit. He disclaims beneficial ownership of such shares except to the extent of his pecuniary interest therein. Also consists of 18,750 common shares acquired by Mr. Kubli pursuant to the exercise of Plan A options.
|
|
(10)
|
Consists of 5,384,450 common shares held by Sofinnova Capital VII FCPR. Mr. Papiernik disclaims any beneficial ownership of the shares held by Sofinnova Capital VII FCPR except to the extent of his pecuniary interest therein.
|
|
(11)
|
Upon the closing of our initial public offering, all 181,000 options outstanding under our Stock Option Plan A vested and became immediately exercisable. Mr. Meyer, Dr. Arnold, Dr. Munoz and Mr. Kubli own 50,000, 18,750, 18,750 and 6,250 Stock Option Plan A options, respectively.
|
Holders
As of March 20, 2015, we had 22 shareholders of record of our common stock.
Significant Changes in Ownership by Major Shareholders
We have experienced significant changes in the percentage ownership held by major shareholders as a result of our initial public offering. Prior to our initial public offering in August 2014, our principal shareholders were Thomas Meyer (34.9%), Sofinnova Venture Partners VIII, L.P. (19.3%), Sofinnova Capital VII FCPR (18.6%), entities affiliated with Zurcher Kantonalbank, Bahnhofstrasse (ZKB) (11.4%) and entities affiliated with Idinvest Partners (9.1%).
In August 2014, we completed our initial public offering and listed our common shares on the Nasdaq Global Market. In the initial public offering, we issued and sold 10,113,325 common shares, including 713,235 common shares sold to the underwriters pursuant to the underwriters’ over-allotment option. While none of our existing shareholders sold common shares in the initial public offering, the percentage ownership held by certain shareholders decreased as a result of the issuance of the common shares sold by us in the initial public offering.
The following is a description of related party transactions we have entered into since January 1, 2014 with any of our members of our supervisory board or management board and the holders of more than 5% of our common shares.
Series C Financing
In April 2013, we entered into an investment agreement pursuant to which we issued and sold an aggregate of 185,455 of our Series C preferred shares at a price per share of CHF 132 for an aggregate purchase price of CHF 24,480,060 (the “Initial Closing”) to certain investors. Pursuant to a 25:1 forward stock split, the shares issued in the Initial Closing were converted into 4,636,375 Series C preferred shares, and in connection with our initial public offering, such Series C shares were converted into common shares.
Under the terms of the Series C investment agreement, we agreed that up to two further closings resulting in further capital increase and issuance of new Series C preferred shares may be completed (the “Second Closing” and/or, the “Third Closing”, respectively). Pursuant to the terms of a convertible loan agreement, on January 13, 2014 the lenders thereunder exercised their right to convert the full amount of the loan into Series C preferred shares, replacing the Second Closing of the Series C financing. The obligation to effect the Third Closing was waived by the Company and the Series C investors.
The following table sets forth the number of our Series C preferred shares purchased by our 5% shareholders and their affiliates at the Initial Closing and upon the conversion of the convertible loan into Series C preferred shares, which replaced the Second Closing and taking into account the 25:1 forward stock split.
|
Name and Address of Beneficial Owner
|
C Shares
|
Purchase Price (CHF)
|
||||||
|
Sofinnova Venture Partners VIII, L.P (1)
|
3,693,175 | 5.28 | ||||||
|
Sofinnova Capital VII FCPR (2)
|
3,551,150 | 5.28 | ||||||
|
(1)
|
James I. Healy and the other managing members of Sofinnova Management VIII, L.L.C., which is the general partner of Sofinnova Venture Partners VIII, L.P., share the power to vote or dispose of these shares and therefore may be deemed to have voting and investment power with respect to such shares. Each of the
|
|
|
managing members disclaims beneficial ownership of such shares except to the extent of his pecuniary interest therein, if any.
|
|
(2)
|
Consists of 3,551,150 shares held by Sofinnova Capital VII FCPR. Sofinnova Partners SAS, a French corporation and the management company of Sofinnova Capital VII FCPR, may be deemed to have sole voting and investment power, and Denis Lucquin, Antoine Papiernik, Rafaele Tordjman and Monique Saulnier, the managing partners of Sofinnova Partners SAS, may be deemed to have shared voting and investment power with respect to such shares. All of the managing partners of Sofinnova Partners SAS disclaim beneficial ownership of such shares except to the extent of their pecuniary interest therein.
|
Convertible Loan Agreement
On December 9, 2013, the Company entered into a non-interest bearing convertible loan with Sofinnova Venture Partners VIII, L.P. and Sofinnova Capital VII FCPR, the lenders, with a nominal value of CHF 13,769,976 and a maximum term of 12 months. On January 13, 2014, the convertible loan lenders exercised their conversion option, and the total loan amount of CHF 13,769,976 was converted into 2,607,950 Series C preferred shares of the Company, which were subsequently converted into common shares in connection with our initial public offering at a one-for-one conversion rate.
Altamira Pharma GmbH Service Agreement
In January 2011, we entered into a service agreement with Altamira Pharma GmbH, Zuchwil, or Altamira, for the provision of strategic management services and support to the Company. Altamira is owned by our Chairman and CEO, Thomas Meyer. This agreement was terminated on January 31, 2014 with a final payment of CHF 14,500. During the years ended December 31, 2013, 2012 and 2011, we paid CHF 248,000, CHF 247,200 and CHF 247,200 respectively, to Altamira pursuant to the agreement.
Registration Rights Agreement
We have entered into a registration rights agreement with certain of our existing shareholders pursuant to which granted them customary registration rights for the resale of the common shares held by certain of our existing shareholders.
Demand registration rights.
Certain of our shareholders that are party to the Registration Rights Agreement (the “RRA Shareholders”) are entitled to request that we effect up to an aggregate of two demand registrations under the Registration Rights Agreement, covering the RRA Shareholders’ ordinary shares that are subject to transfer restrictions under Rule 144 (“registrable securities”). The demand registration rights are subject to certain customary conditions and limitations, including customary underwriter cutback rights and deferral rights. No demand registration rights exist while a shelf registration is in effect.
Piggyback registration rights.
If we propose to register any ordinary shares (other than in a shelf registration or on a registration statement on Form F-4, S-4 or S-8), the RRA Shareholders are entitled to notice of such registration and to include their registrable securities in that registration. The registration of RRA Shareholders’ registrable securities pursuant to a piggyback registration does not relieve us of the obligation to effect a demand registration. The managing underwriter has the right to limit the number of registrable securities included in a piggyback registration if the managing underwriter believes it would interfere with the successful marketing of the ordinary shares.
Form F-3 registration rights.
When we are eligible to use Form F-3, one or more RRA Shareholders have the right to request that we file a registration statement on Form F-3. RRA Shareholders will have the right to cause us to undertake underwritten offerings from the shelf registration, but no more than one underwritten offering in a six-month period. Each underwritten takedown constitutes a demand registration for purposes of the maximum number of demand registrations we are obligated to effectuate.
Subject to limited exceptions, the Registration Rights Agreement provides that we must pay all registration expenses in connection with a demand, piggyback or shelf registration. The Registration Rights Agreement contains customary indemnification and contribution provisions.
Related Person Transaction Policy
Prior to our initial public offering, we entered into a new related person transaction policy under which any such transaction must be approved or ratified by the audit committee.
Indemnification Agreements
We have entered into indemnification agreements with our directors and executive officers. The indemnification agreements and our articles of association require us to indemnify our directors and executive officers to the fullest extent permitted by law.
Employment Agreements
Certain of our executive officers have entered into employment agreements with the Company, certain of which provide for notice of termination periods and include restrictive covenants. None of our directors have entered into service agreements with the Company. See “Item 6. Directors, Senior Management and Employees—B. Compensation—Employment Agreements.”
Participation in our Initial Public Offering
Thomas Meyer, our founder, Chairman and Chief Executive Officer, Bettina Stubinski, our Chief Medical Officer, Sven Zimmermann, our Chief Financial Officer, and Sofinnova Venture Partners VIII, L.P., Sofinnova Capital VII FCPR and Idinvest Partners, which were principal shareholders of ours prior to our initial public offering, or their affiliates, purchased an aggregate of 4,405,633 shares of our common stock in our initial public offering at the initial public offering price in the following amounts: Mr. Meyer: 80,000 shares; Dr. Stubinski: 17,000 shares; Mr. Zimmermann: 17,000 shares; Sofinnova Venture Partners VIII, L.P.: 2,125,000 shares; Sofinnova Capital VII FCPR: 1,833,300 shares; and Idinvest Partners: 333,333 shares.
Not applicable.
Financial statements
See “Item 18. Financial Statements,” which contains our financial statements prepared in accordance with IFRS.
Legal Proceedings
From time to time we may become involved in legal proceedings that arise in the ordinary course of business. During the period covered by the financial statements contained herein, we have not been a party to or paid any damages in connection with litigation that has had a material adverse effect on our financial position. No assurance can be given that future litigation will not have a material adverse effect on our financial position. See “Item 3. Key Information—D. Risk factors.”
Dividends and Dividend Policy
We have never paid or declared any cash dividends on our shares, and we do not anticipate paying any cash dividends on our common shares in the foreseeable future. Any future determination related to our dividend policy will be made at the discretion of our board of directors.
A discussion of the significant changes in our business can be found under “Item 4. Information on the Company—A. History and development of the Company” and “Item 4. Information on the Company—B. Business Overview.”
Not applicable.
Not applicable.
|
C.
|
Our common shares began trading on the Nasdaq Global Market on August 11, 2014 under the symbol “EARS.” The following table sets forth the high and low sales prices as reported by NASDAQ for each quarter:
|
High
|
Low
|
|||||||
|
Year Ended December 31, 2014:
|
||||||||
|
Third Quarter
|
7.23 | 5.37 | ||||||
|
Fourth Quarter
|
5.75 | 3.505 | ||||||
|
Month Ended:
|
||||||||
|
September 30, 2014
|
7.23 | 5.37 | ||||||
|
October 31, 2014
|
5.75 | 4.17 | ||||||
|
November 28, 2014
|
4.67 | 4.19 | ||||||
|
December 31, 2014
|
4.66 | 3.505 | ||||||
|
January 31, 2015
|
4.00 | 3.81 | ||||||
|
February 28, 2015
|
5.75 | 5.44 | ||||||
|
March, 2015 (through March 20, 2015)
|
6.70 | 5.67 | ||||||
Not applicable.
|
E.
|
Not applicable.
Not applicable.
Not applicable.
On March 27, 2015, we adopted the Articles of Association filed as Exhibit 1.1 hereto.
We incorporate by reference into this annual report on Form 20-F the description of our Articles of Association contained in our F-1 registration statement (File No. 333-197105) originally filed with the SEC on June 27, 2014, as amended. Such description sets forth a summary of certain provisions of our articles of association as currently in effect.
Except as otherwise disclosed in this annual report on Form 20-F (including the Exhibits), we are not currently, and have not been in the last two years, party to any material contract, other than contracts entered into in the ordinary course of business.
There are no Swiss governmental laws, decrees or regulations that restrict, in a manner material to us, the export or import of capital, including any foreign exchange controls, or that generally affect the remittance of dividends or other payments to non-residents or non-citizens of Switzerland who hold our common shares.
|
E.
|
The following summary contains a description of the material Swiss and U.S. federal income tax consequences of the acquisition, ownership and disposition of common shares, but it does not purport to be a comprehensive description of all the tax considerations that may be relevant to a decision to purchase common shares. The summary is based upon the tax laws of Switzerland and regulations thereunder and on the tax laws of the United States and regulations thereunder as of the date hereof, which are subject to change.
Swiss Tax Considerations
This summary of material Swiss tax consequences is based on Swiss law and regulations and the practice of the Swiss tax administration as in effect on the date hereof, all of which are subject to change (or subject to changes in interpretation), possibly with retroactive effect. The summary does not purport to take into account the specific circumstances of any particular shareholder or potential investor and does not relate to persons in the business of buying and selling common shares or other securities. The summary is not intended to be, and should not be interpreted as, legal or tax advice to any particular potential shareholder/s, and no representation with respect to the tax consequences to any particular shareholder/s is made.
Current and prospective shareholders are advised to consult their own tax advisers in light of their particular circumstances as to the Swiss tax laws, regulations and regulatory practices that could be relevant for them in connection with the acquiring, owning and selling or otherwise disposing of common shares and receiving dividends and similar cash or in-kind distributions on common shares (including dividends on liquidation proceeds and stock dividends) or distributions on common shares based upon a capital reduction (
Nennwertrückzahlungen
) or reserves paid out of capital contributions (
Reserven aus Kapitaleinlagen
) and the consequences thereof under the tax laws, regulations and regulatory practices of Switzerland.
Taxation of common shares Swiss Federal Withholding Tax on Dividends and Distributions
Dividend payments and similar cash or in-kind distributions on the common shares (including dividends on liquidation proceeds and stock dividends) that the Company makes to shareholders are subject to Swiss federal withholding tax (
Verrechnungssteuer
) at a rate of 35% on the gross amount of the dividend. The Company is required to withhold the Swiss federal withholding tax from the dividend and remit it to the Swiss Federal Tax Administration. Distributions based upon a capital reduction (
Nennwertrückzahlungen
) and reserves paid out of capital contributions (
Reserven aus Kapitaleinlagen
) are not subject to Swiss federal withholding tax.
The Swiss federal withholding tax may also apply to gains realized upon a repurchase of shares by the Company, on the difference between the repurchase price and the nominal value of the shares (
Nennwertprinzip
); a different basis of taxation may apply under the capital contribution principle (
Kapitaleinlageprinzip
).
The Swiss federal withholding tax is refundable or creditable in full to a Swiss tax resident corporate and individual shareholder as well as to a non-Swiss tax resident corporate or individual shareholder who holds the common shares as part of a trade or business carried on in Switzerland through a permanent establishment or fixed place of business situated for tax purposes in Switzerland, if such person is the beneficial owner of the distribution and, in the case of a Swiss tax resident individual who holds the common shares as part of his private assets, duly reports the gross distribution received in his individual income tax return or, in the case of a person who holds the common shares as part of a trade or business carried on in Switzerland through a permanent establishment or fixed place of business situated for tax purposes in Switzerland, recognizes the gross dividend distribution for tax purposes as earnings in the income statements and reports the annual profit in the income tax return.
If a shareholder who is not a Swiss resident for tax purposes and does not hold the common shares in connection with the conduct of a trade or business in Switzerland through a permanent establishment or fixed place of business situated, for tax purposes in Switzerland, receives a distribution from the Company, the shareholder may be entitled to a full or partial refund or credit of Swiss federal withholding tax incurred on a taxable distribution if
the country in which such shareholder is resident for tax purposes has entered into a treaty for the avoidance of double taxation with Switzerland and the further prerequisites of the treaty for a refund have been met. Shareholders not resident in Switzerland should be aware that the procedures for claiming treaty benefits (and the time required for obtaining a refund or credit) may differ from country to country.
Besides the bilateral treaties Switzerland has entered into an agreement with the European Community providing for measures equivalent to those laid down in Council Directive 2003/48/EC on taxation of savings income in the form of interest payments. This agreement contains in its Article 15 provisions on taxation of dividends which apply with respect to EU member states and provides for an exemption of Withholding Tax for companies under certain circumstances.
On January 1, 2013, treaties on final withholding taxes entered into by Switzerland with the United Kingdom and Austria came into force (each a “Contracting State”). The treaties require a Swiss paying agent, as defined in the treaties, to levy a flat-rate final withholding tax at rates specified in the treaties on certain capital gains and income items (including dividends), all as defined in the treaties, deriving from assets, including the common shares held in account or deposits with a Swiss paying agent by (i) an individual resident in a Contracting State, or (ii) if certain requirements are met, by a domiciliary company (
Sitzgesellschaft
), an insurance company in connection with a so-called insurance wrapper (
Lebensversicherungsmantel
) or other individuals if the beneficial owner is an individual resident in a Contracting State. Under the treaty with the UK, the tax rate for individuals resident and domiciled in the UK is 35% on dividends and 27% on capital gains, and, under the treaty with Austria, 25% on dividends and capital gains. The flat-rate tax withheld substitutes the ordinary capital gains tax and income tax on the relevant capital gains and income items in the Contracting State where the individuals are tax resident, unless the individuals elect for the flat-rate tax withheld to be treated as if it were a credit allowable against the income tax or, as the case may be, capital gains tax, due for the relevant tax year in the relevant Contracting State. Alternatively, instead of paying the flat-rate tax, such individuals may opt for a disclosure or the relevant capital gains and income items to the tax authorities of the Contracting State where they are tax residents. If Swiss federal withholding tax of 35% has been withheld on dividends, the Swiss paying agent will – to the extent provided in the applicable bilateral treaty for the avoidance of double taxation between Switzerland and the Contracting State – in its own name and on behalf of the relevant shareholder file with the Swiss tax authorities a request for the partial refund of the Swiss federal withholding tax. The Swiss federal withholding tax which is not refundable according to the bilateral tax treaty (residual tax) is credited against the flat-rate final withholding tax.
Individual and Corporate Income Tax on Dividends
Swiss resident individuals holding the common shares as part of their private assets who receive dividends and similar distributions (including stock dividends and liquidation proceeds), which are not repayments of the nominal value (
Nennwertrückzahlungen
) of the common shares or reserves paid out of capital contributions (
Reserven aus Kapitaleinlagen
) are required to report such payments in their individual income tax returns and are liable to Swiss federal, cantonal and communal income taxes on any net taxable income for the relevant tax period. Furthermore, for the purpose of the Direct Federal Tax, dividends, shares in profits, liquidation proceeds and pecuniary benefits from shares (including bonus shares) are included in the tax base for only 60% of their value (
Teilbesteuerung
), if the investment amounts to at least 10% of nominal capital of the Company. All cantons, save for Neuenburg, have introduced similar partial taxation measures at cantonal and communal levels.
Swiss resident individuals as well as non-Swiss resident individual taxpayers holding the common shares in connection with the conduct of a trade or business in Switzerland through a permanent establishment or fixed place of business situated, for tax purposes, in Switzerland, are required to recognize dividends, distributions based upon a capital reduction (
Nennwertrückzahlungen
) and reserves paid out of capital contributions (
Reserven aus Kapitaleinlagen
) in their income statements for the relevant tax period and are liable to Swiss federal, cantonal and communal individual or corporate income taxes, as the case may be, on any net taxable earnings accumulated (including the payment of dividends) for such period. Furthermore, for the purpose of the Direct Federal Tax, dividends, shares in profits, liquidation proceeds and pecuniary benefits from shares (including bonus shares) are included in the tax base for only 50% (
Teilbesteuerung
), if the investment is held in connection with the conduct of a trade or business or qualifies as an opted business asset (
gewillkürtes Geschäftsvermögen
) according to Swiss tax law and amounts to at least 10% of nominal capital of the Company. All cantons have introduced similar partial taxation measures at cantonal and communal levels.
Swiss resident corporate taxpayers as well as non-Swiss resident corporate taxpayers holding the common shares in connection with the conduct of a trade or business through a permanent establishment or fixed place of business situated, for tax purposes, in Switzerland, are required to recognize dividends, distributions based upon a capital reduction (
Nennwertrückzahlungen
) and reserves paid out of capital contributions (
Reserven aus Kapitaleinlagen
) in their income statements for the relevant tax period and are liable to Swiss federal, cantonal and communal corporate income taxes on any net taxable earnings accumulated for such period. Swiss resident corporate taxpayers as well as non-Swiss resident corporate taxpayers holding the common shares in connection with the conduct of a trade or business through a permanent establishment or fixed place of business situated, for tax purposes, in Switzerland may be eligible for participation relief (
Beteiligungsabzug
) in respect of dividends and distributions based upon a capital reduction (
Nennwertrückzahlungen
) and reserves paid out of capital contributions (
Reserven aus Kapitaleinlagen
) if the common shares held by them as part of a Swiss business have an aggregate market value of at least CHF 1 million or represent at least 10% of the share capital of the Company or give entitlement to at least 10% of the profits and reserves of the Company, respectively.
Recipients of dividends and similar distributions on the common shares (including stock dividends and liquidation proceeds) who neither are residents of Switzerland nor during the current taxation year have engaged in a trade or business in Switzerland and who are not subject to taxation in Switzerland for any other reason are not subject to Swiss federal, cantonal or communal individual or corporate income taxes in respect of dividend payments and similar distributions because of the mere holding of the common shares.
Wealth and Annual Capital Tax on Holding of Common Shares
Swiss resident individuals and non-Swiss resident individuals holding the common shares in connection with the conduct of a trade or business in Switzerland through a permanent establishment or fixed place of business situated, for tax purposes, in Switzerland, are required to report their common shares as part of their wealth and will be subject to cantonal and communal wealth tax to the extent the aggregate taxable net wealth is allocable to Switzerland.
Swiss resident corporate taxpayers and non-Swiss resident corporate taxpayers holding the common shares in connection with the conduct of a trade or business in Switzerland through a permanent establishment or fixed place of business situated, for tax purposes, in Switzerland, will be subject to cantonal and communal annual capital tax on the taxable capital to the extent the aggregate taxable capital is allocable to Switzerland.
Individuals and corporate taxpayers not resident in Switzerland for tax purposes and not holding the common shares in connection with the conduct of a trade or business in Switzerland through a permanent establishment or fixed place of business situated, for tax purposes, in Switzerland, are not subject to wealth or annual capital tax in Switzerland because of the mere holding of the common shares.
Capital Gains on Disposal of Common Shares
Swiss resident individuals who sell or otherwise dispose of the common shares realize a tax-free capital gain, or a non-deductible capital loss, as the case may be, provided that they hold the common shares as part of their private assets.
Capital gains realized on the sale of the common shares held by Swiss resident individuals, Swiss resident corporate taxpayers as well as non-Swiss resident individuals and corporate taxpayers holding the common shares in connection with the conduct of a trade or business in Switzerland through a permanent establishment or fixed place of business situated, for tax purposes, in Switzerland, will be subject to Swiss federal, cantonal and communal individual or corporate income tax, as the case may be. This also applies to Swiss resident individuals who, for individual income tax purposes, are deemed to be professional securities dealers for reasons of, inter alia, frequent dealing and debt-financed purchases. Capital gains realized by resident individuals who hold the common shares as business assets might be entitled to reductions or partial taxations similar to those mentioned above for dividends (
Teilbesteuerung
) if certain conditions are met (e.g. holding period of at least one year and participation of at least 10% of nominal capital).
Swiss resident corporate taxpayers as well as non-Swiss resident corporate taxpayers holding the common shares in connection with the conduct of a trade or business, through a permanent establishment or fixed place of business situated, for tax purposes, in Switzerland, are required to recognize such capital gain in their income statements for the relevant tax period. Corporate taxpayers may qualify for participation relief on capital gains
(
Beteiligungsabzug
), if the common shares sold during the tax period reflect an interest of at least 10% in the Company’s share capital or if the common shares sold give entitlement to at least 10% of the Company’s profit and reserve and were held for at least one year. The tax relief applies to the difference between the sale proceeds of common shares by the Company and the initial costs of the participation (
Gestehungskosten
).
Individuals and corporations not resident in Switzerland for tax purposes and not holding the common shares in connection with the conduct of a trade or business in Switzerland through a permanent establishment or fixed place of business situated, for tax purposes, in Switzerland, are not subject to Swiss federal, cantonal and communal individual income or corporate income tax, as the case may be, on capital gains realized on the sale of the common shares.
Gift and Inheritance Tax
Transfers of common shares may be subject to cantonal and/or communal inheritance or gift taxes if the deceased or the donor or the recipient were resident in a Canton levying such taxes and, in international circumstances where residency requirements are satisfied, if the applicable tax treaty were to allocate the right to tax to Switzerland.
Swiss Issuance Stamp Duty
The Company is subject to paying to the Swiss Federal Tax Administration a 1% Swiss federal issuance stamp tax (
Emissionsabgabe
) on the consideration received by it for the issuance of the Shares less certain costs incurred in connection with the issuance.
Swiss Securities Transfer Tax
The purchase or sale of the common shares, whether by Swiss residents or non-Swiss residents, may be subject to Swiss securities transfer tax of up to 0.15%, calculated on the purchase price or the proceeds if the purchase or sale occurs through or with a Swiss bank or other Swiss securities dealer as defined in the Swiss Federal Stamp Duty Act as an intermediary or party to the transaction unless an exemption applies.
Material U.S. Federal Income Tax Considerations for U.S. Holders
The following is a description of the material U.S. federal income tax consequences to the U.S. Holders described below of owning and disposing of common shares, but it does not purport to be a comprehensive description of all tax considerations that may be relevant to a particular person’s decision to acquire the common shares. This discussion applies only to a U.S. Holder that holds common shares as capital assets for U.S. federal income tax purposes. In addition, it does not describe all of the tax consequences that may be relevant in light of the U.S. Holder’s particular circumstances, including alternative minimum tax consequences, the potential application of the provisions of the Internal Revenue Code of 1986, as amended, or the Code, known as the Medicare contribution tax and tax consequences applicable to U.S. Holders subject to special rules, such as:
|
|
·
|
certain financial institutions;
|
|
|
·
|
dealers or traders in securities who use a mark-to-market method of tax accounting;
|
|
|
·
|
persons holding common shares as part of a hedging transaction, straddle, wash sale, conversion transaction or integrated transaction or persons entering into a constructive sale with respect to the common shares;
|
|
|
·
|
persons whose functional currency for U.S. federal income tax purposes is not the U.S. dollar;
|
|
|
·
|
entities classified as partnerships for U.S. federal income tax purposes;
|
|
|
·
|
tax-exempt entities, including an “individual retirement account” or “Roth IRA”;
|
|
|
·
|
persons that own or are deemed to own ten percent or more of our voting stock;
|
|
|
·
|
persons who acquired our common shares pursuant to the exercise of an employee stock option or otherwise as compensation; or
|
|
|
·
|
persons holding shares in connection with a trade or business conducted outside of the United States.
|
If an entity that is classified as a partnership for U.S. federal income tax purposes holds common shares, the U.S. federal income tax treatment of a partner will generally depend on the status of the partner and the activities of the partnership. Partnerships holding common shares and partners in such partnerships should consult their tax advisers as to their particular U.S. federal income tax consequences of holding and disposing of the common shares.
This discussion is based on the Code, administrative pronouncements, judicial decisions, final, temporary and proposed Treasury regulations, and the income tax treaty between Switzerland and the United States, or the Treaty, all as of the date hereof, any of which is subject to change, possibly with retroactive effect.
A “U.S. Holder” is a holder who, for U.S. federal income tax purposes, is a beneficial owner of common shares who is eligible for the benefits of the Treaty and is:
|
|
·
|
an individual who is a citizen or resident of the United States;
|
|
|
·
|
a corporation, or other entity taxable as a corporation, created or organized in or under the laws of the United States, any state therein or the District of Columbia; or
|
|
|
·
|
an estate or trust the income of which is subject to U.S. federal income taxation regardless of its source.
|
U.S. Holders should consult their tax advisers concerning the U.S. federal, state, local and non-U.S. tax consequences of owning and disposing of common shares in their particular circumstances.
Passive Foreign Investment Company Rules
We believe that we were a “passive foreign investment company,” or PFIC, for U.S. federal income tax purposes for our 2013 and 2014 taxable years, and we expect to be a PFIC for our current taxable year and for the foreseeable future. In addition, we may, directly or indirectly, hold equity interests in other PFICs, or Lower-tier PFICs. In general, a non-U.S. corporation will be considered a PFIC for any taxable year in which (i) 75% or more of its gross income consists of passive income or (ii) 50% or more of the average quarterly value of its assets consists of assets that produce, or are held for the production of, passive income. For purposes of the above calculations, a non-U.S. corporation that directly or indirectly owns at least 25% by value of the shares of another corporation is treated as if it held its proportionate share of the assets of the other corporation and received directly its proportionate share of the income of the other corporation. Passive income generally includes dividends, interest, rents, royalties and capital gains.
Under attribution rules, if we are a PFIC, U.S. Holders will be deemed to own their proportionate shares of Lower-tier PFICs and will be subject to U.S. federal income tax according to the rules described in the following paragraphs on (i) certain distributions by a Lower-tier PFIC and (ii) a disposition of shares of a Lower-tier PFIC, in each case as if the U.S. Holder held such shares directly, even though holders have not received the proceeds of those distributions or dispositions directly.
If we are a PFIC for any taxable year during which a U.S. Holder holds our shares, the U.S. Holder may be subject to certain adverse tax consequences. Unless a holder makes a timely “mark to market” election or “qualified electing fund” election, each as discussed below, gain recognized on a disposition (including, under certain circumstances, a pledge) of common shares by the U.S. Holder, or on an indirect disposition of shares of a Lower-tier PFIC, will be allocated ratably over the U.S. Holder’s holding period for the shares. The amounts allocated to the taxable year of disposition and to years before we became a PFIC will be taxed as ordinary income. The amounts allocated to each other taxable year will be subject to tax at the highest rate in effect for that taxable year for individuals or corporations, as appropriate, and an interest charge will be imposed on the tax attributable to the allocated amounts. Further, to the extent that any distribution received by a U.S. Holder on our common shares (or a distribution by a Lower-tier PFIC to its shareholder that is deemed to be received by a U.S. Holder) exceeds 125% of the average of the annual distributions on the shares received during the preceding three years or the U.S. Holder’s holding period, whichever is shorter, the distribution will be subject to taxation in the same manner as gain, described immediately above.
If we are a PFIC for any year during which a U.S. Holder holds common shares, we generally will continue to be treated as a PFIC with respect to the holder for all succeeding years during which the U.S. Holder holds common
shares, even if we cease to meet the threshold requirements for PFIC status. U.S. Holders should consult their tax advisers regarding the potential availability of a “deemed sale” election that would allow them to eliminate this continuing PFIC status under certain circumstances.
If the common shares are “regularly traded” on a “qualified exchange,” a U.S. Holder may make a mark-to-market election that would result in tax treatment different from the general tax treatment for PFICs described above. The common shares will be treated as “regularly traded” in any calendar year in which more than a de minimis quantity of the common shares is traded on a qualified exchange on at least 15 days during each calendar quarter. Nasdaq, on which the common shares are listed, is a qualified exchange for this purpose. U.S. Holders should consult their tax advisers regarding the availability and advisability of making a mark-to-market election in their particular circumstances. In particular, U.S. Holders should consider carefully the impact of a mark-to-market election with respect to their common shares given that we may have Lower-tier PFICs for which a mark-to-market election may not be available.
If a U.S. Holder makes the mark-to-market election, the holder generally will recognize as ordinary income any excess of the fair market value of the common shares at the end of each taxable year over their adjusted tax basis, and will recognize an ordinary loss in respect of any excess of the adjusted tax basis of the common shares over their fair market value at the end of the taxable year (but only to the extent of the net amount of income previously included as a result of the mark-to-market election). If a U.S. Holder makes the election, the holder’s tax basis in the common shares will be adjusted to reflect the income or loss amounts recognized. Any gain recognized on the sale or other disposition of common shares in a year when we are a PFIC will be treated as ordinary income and any loss will be treated as an ordinary loss (but only to the extent of the net amount of income previously included as a result of the mark to-market election). Distributions paid on common shares will be treated as discussed below under “
Taxation of Distributions
.”
Alternatively, a U.S. Holder can make an election, if we provide the necessary information, to treat us and each Lower-tier PFIC as a qualified electing fund (a “QEF Election”) in the first taxable year that we are treated as a PFIC with respect to the holder. A U.S. Holder must make the QEF Election for each PFIC by attaching a separate properly completed IRS Form 8621 for each PFIC to the holder’s timely filed U.S. federal income tax return. Upon request of a U.S. Holder, we will provide the information necessary for a U.S. Holder to make a QEF Election with respect to us and will use commercially reasonable efforts to cause each Lower-tier PFIC which we control to provide such information with respect to such Lower-tier PFIC. However, no assurance can be given that such QEF information will be available for any Lower-tier PFIC.
If a U.S. Holder makes a QEF Election with respect to a PFIC, the holder will be currently taxable on its pro rata share of the PFIC’s ordinary earnings and net capital gain (at ordinary income and capital gain rates, respectively) for each taxable year that the entity is classified as a PFIC. If a U.S. Holder makes a QEF Election with respect to us, any distributions paid by us out of our earnings and profits that were previously included in the holder’s income under the QEF Election would not be taxable to the holder. A U.S. Holder will increase its tax basis in its common shares by an amount equal to any income included under the QEF Election and will decrease its tax basis by any amount distributed on the common shares that is not included in the holder’s income. In addition, a U.S. Holder will recognize capital gain or loss on the disposition of common shares in an amount equal to the difference between the amount realized and the holder’s adjusted tax basis in the common shares. U.S. Holders should note that if they make QEF Elections with respect to us and Lower-tier PFICs, they may be required to pay U.S. federal income tax with respect to their common shares for any taxable year significantly in excess of any cash distributions received on the shares for such taxable year. U.S. Holders should consult their tax advisers regarding making QEF Elections in their particular circumstances.
Furthermore, if we were a PFIC or, with respect to a particular U.S. Holder, were treated as a PFIC for the taxable year in which we paid a dividend or the prior taxable year, the preferential dividend rate with respect to dividends paid to certain non-corporate U.S. Holders would not apply.
If we were a PFIC for any taxable year during which a U.S. Holder held common shares, such U.S. Holder would be required to file an annual information report with such U.S. Holder’s U.S. Federal income tax return on IRS Form 8621.
U.S. Holders should consult their tax advisers concerning our PFIC status and the tax considerations relevant to an investment in a PFIC.
Taxation of Distributions
As discussed above under “Item 8. Dividends and Dividend Policy,” we do not currently expect to make distributions on our common shares. In the event that we do make distributions of cash or other property, subject to the passive foreign investment company rules described above, distributions paid on common shares, other than certain
pro rata
distributions of common shares, will be treated as dividends to the extent paid out of our current or accumulated earnings and profits (as determined under U.S. federal income tax principles). The amount of a dividend will include any amounts withheld by us in respect of Swiss taxes. The amount of the dividend will be treated as foreign-source dividend income to U.S. Holders and will not be eligible for the dividends-received deduction generally available to U.S. corporations under the Code. Dividends will be included in a U.S. Holder’s income on the date of the U.S. Holder’s receipt of the dividend. The amount of any dividend income paid in Swiss Francs will be the U.S. dollar amount calculated by reference to the exchange rate in effect on the date of receipt, regardless of whether the payment is in fact converted into U.S. dollars. If the dividend is converted into U.S. dollars on the date of receipt, a U.S. Holder should not be required to recognize foreign currency gain or loss in respect of the dividend income. A U.S. Holder may have foreign currency gain or loss if the dividend is converted into U.S. dollars after the date of receipt.
Subject to applicable limitations, some of which vary depending upon the U.S. Holder’s circumstances, Swiss income taxes withheld from dividends on common shares at a rate not exceeding the rate provided by the Treaty may be creditable against the U.S. Holder’s U.S. federal income tax liability. Swiss taxes withheld in excess of the rate applicable under the Treaty will not be eligible for credit against a U.S. Holder’s federal income tax liability. The rules governing foreign tax credits are complex, and U.S. Holders should consult their tax advisers regarding the creditability of foreign taxes in their particular circumstances. In lieu of claiming a foreign tax credit, U.S. Holders may, at their election, deduct foreign taxes, including the Swiss tax, in computing their taxable income, subject to generally applicable limitations under U.S. law. An election to deduct foreign taxes instead of claiming foreign tax credits applies to all foreign taxes paid or accrued in the taxable year.
Sale or Other Disposition of Common Shares
Subject to the passive foreign investment company rules described above, for U.S. federal income tax purposes, gain or loss realized on the sale or other disposition of common shares will be capital gain or loss, and will be long-term capital gain or loss if the U.S. Holder held the common shares for more than one year. The amount of the gain or loss will equal the difference between the U.S. Holder’s tax basis in the common shares disposed of and the amount realized on the disposition, in each case as determined in U.S. dollars. This gain or loss will generally be U.S.-source gain or loss for foreign tax credit purposes.
Information Reporting and Backup Withholding
Payments of dividends and sales proceeds that are made within the United States or through certain U.S.-related financial intermediaries generally are subject to information reporting, and may be subject to backup withholding, unless (i) the U.S. Holder is a corporation or other exempt recipient or (ii) in the case of backup withholding, the U.S. Holder provides a correct taxpayer identification number and certifies that it is not subject to backup withholding.
The amount of any backup withholding from a payment to a U.S. Holder will be allowed as a credit against the holder’s U.S. federal income tax liability and may entitle it to a refund, provided that the required information is timely furnished to the IRS.
Information With Respect to Foreign Financial Assets
Certain U.S. Holders who are individuals (and, under proposed regulations, certain entities) may be required to report information relating to an interest in our common shares, subject to certain exceptions (including an exception for common shares held in accounts maintained by certain U.S. financial institutions). U.S. Holders should consult their tax advisers regarding the effect, if any, of this legislation on their ownership and disposition of the common shares.
Not applicable.
Not applicable.
We are subject to the informational requirements of the Exchange Act. Accordingly, we are required to file reports and other information with the SEC, including annual reports on Form 20-F and reports on Form 6-K. You may inspect and copy reports and other information filed with the SEC at the Public Reference Room at 100 F Street, N.E., Washington, D.C. 20549. Information on the operation of the Public Reference Room may be obtained by calling the SEC at 1-800-SEC-0330. In addition, the SEC maintains an Internet website that contains reports and other information about issuers, like us, that file electronically with the SEC. The address of that website is www.sec.gov.
As a foreign private issuer, we are exempt under the Exchange Act from, among other things, the rules prescribing the furnishing and content of proxy statements, and our executive officers, directors and principal shareholders are exempt from the reporting and short-swing profit recovery provisions contained in Section 16 of the Exchange Act. In addition, we will not be required under the Exchange Act to file periodic reports and financial statements with the SEC as frequently or as promptly as U.S. companies whose securities are registered under the Exchange Act.
Not applicable.
Credit Risk
We manage credit risk on a group basis. Credit risk arises from cash and cash equivalents and deposits with banks, as well as from other receivables. Our policy is to invest funds in low risk investments including interest bearing deposits. For banks and financial institutions, only independently rated parties with a minimum S&P rating of “A” are accepted. Receivables are not past due and not impaired and include only well-known counterparties.
We hold cash and cash equivalents in our principal operating currencies (CHF, USD and EUR).
Market Risk
In the ordinary course of our business activities, we are exposed to various market risks that are beyond our control, including fluctuations in foreign exchange rates, and which may have an adverse effect on the value of our financial assets and liabilities, future cash flows and profit. As a result of these market risks, we could suffer a loss due to adverse changes in foreign exchange rates. Our policy with respect to these market risks is to assess the potential of experiencing losses and the consolidated impact thereof, and to mitigate these market risks.
Interest rate risk
We are not currently exposed to significant interest rate risk because we have no borrowings at variable interest rates, no fixed rate financial liabilities at fair value through profit or loss and no derivatives. Our only variable interest-bearing financial asset is cash at banks. The effect of an increase or decrease in interest rates would only have an immaterial effect in profit or loss.
Currency Risk
We operate internationally and are exposed to foreign exchange risk arising from various exposures, primarily with respect to the US Dollar and Euro. Foreign exchange risk arises from future commercial transactions, recognized assets and liabilities and net investments in foreign operations. To manage foreign exchange risk we maintain foreign currency cash balances to cover anticipated future purchases of materials and services in foreign currencies.
As of December 31, 2014, a 5% increase or decrease in the USD/CHF exchange rate with all other variables held constant would have resulted in a CHF 2,212,604 (2013: CHF 175,115) increase or decrease in the net result. A 5% increase or decrease in the EUR/CHF exchange rate with all other variables held constant would have resulted in a CHF 32,375 (2013: CHF 107,672) increase or decrease in the net result.
We have subsidiaries in the United States and Ireland, whose net assets are exposed to foreign currency translation risk. Due to the small size of these subsidiaries the translation risk is not significant. In the future we intend to maintain foreign exchange balances matched to the currencies required to fund our primary costs, that is the conduct of our clinical trials.
Not applicable.
Not applicable.
Not applicable.
Not applicable.
|
A.
|
No matters to report.
No matters to report.
Not applicable.
As of the end of the period covered by this Annual Report, an evaluation of the effectiveness of the design and operation of our disclosure controls and procedures (as defined in Rule 13a-15(e) under the Exchange Act) was performed under the supervision and with the participation of our management, including our Chief Executive Officer and Chief Financial Officer, our principal executive officer and principal financial officer, respectively.
There are inherent limitations to the effectiveness of any system of disclosure controls and procedures, including the possibility of human error and the circumvention or overriding of the controls and procedures. Accordingly, even effective disclosure controls and procedures can only provide reasonable assurance of achieving their control objectives.
Based on the evaluation, our Chief Executive Officer and Chief Financial Officer concluded that our disclosure controls and procedures were effective, as of the end of the period covered by this Annual Report, in providing a reasonable level of assurance that information we are required to disclose in reports that we file or submit under the Exchange Act is recorded, processed, summarized, and reported within the time periods in SEC rules and forms, including providing a reasonable level of assurance that information required to be disclosed by us in such reports is accumulated and communicated to our management, including our principal executive officer and our principal financial officer, as appropriate to allow timely decisions regarding required disclosure.
This Annual Report does not include a report of management's assessment regarding internal control over financial reporting due to a transition period established by rules of the SEC for newly public companies.
This Annual Report does not include an attestation report of our registered public accounting firm due to a transition period established by rules of the SEC for newly public companies.
There has been no change in our internal control over financial reporting (as defined in Rule 13a-15(f) under the Exchange Act) that occurred during the period covered by this Annual Report that has materially affected, or is reasonably likely to materially affect, internal control over financial reporting.
Our board of directors has determined that Oliver Kubli is an audit committee financial expert, as that term is defined by the SEC, and is independent for the purposes of SEC and Nasdaq rules.
Code of Business Conduct and Ethics
We have adopted a Code of Business Conduct and Ethics which covers a broad range of matters including the handling of conflicts of interest, compliance issues and other corporate policies such as insider trading and equal opportunity and non-discrimination standards. Our Code of Business Conduct applies to all of our directors, executive officers and employees. We have published our Code of Business Conduct and Ethics on our website,
www.aurismedical.com
. The information contained on our website is not a part of this Annual Report.
|
2014
|
2013
|
|||||||
|
Audit Fees
|
870 | 15 | ||||||
|
Total fees
|
870 | 15 | ||||||
For the year ending December 31, 2013, KPMG AG was the Company’s auditor for the IFRS and statutory accounts. At the ordinary annual general meeting on April 22, 2014, the shareholders appointed Deloitte AG as the Company’s auditor for the year ending December 31, 2014.
In 2013, we were billed by KPMG AG, our predecessor auditor, CHF 15,000.
In 2014, we
were billed CHF 748,219 by KPMG AG for audit fees including audit fees in connection with the Company’s initial public offering in August 2014. We were billed CHF 121,500 by Deloitte AG for audit fees in 2014.
Pre-Approval Policies and Procedures
To ensure the independence and objectivity of the Company’s external auditors, the provision of all non-audit services by the external auditors are pre- approved by the Audit Committee.
We rely on an exemption in connection with our initial public offering pursuant to Rule 10A-3(b)(1)(iv)(A) of the Securities Exchange Act in connection with James I. Healy’s membership on the audit committee.
The NASDAQ listing rules mandated by Rule 10A-3(b) of the Exchange Act require, among other things, that each member of the audit committee be independent. A company listing in connection with its initial public offering may phase in its compliance with the independent committee requirement pursuant to Rule 10A-3(b)(1)(iv)(A) of the Exchange Act. Accordingly, a company listing in connection with its initial public offering is permitted to phase in its compliance with the independent committee requirements as follows: (1) one independent member at the time of listing; (2) a majority of independent members within 90 days of listing; and (3) all independent members within one year of listing.
Immediately after our initial public offering, our audit committee consisted of Oliver Kubli, Alain Munoz and James I. Healy. Our audit committee currently consists of these same individuals. Mr. Kubli and Mr. Munoz meet the independence standards of NASDAQ Listing Rule 5605(a)(2) and satisfied the criteria for independence set forth in Section 10A(m)(3) of the Exchange Act. Within one year from the date of effectiveness of our Registration Statement on Form F-1, as required by Rule 10A-3(b)(1)(iv)(A), we intend for all members of our audit committee to qualify as independent members of the audit committee.
We do not believe that our reliance on the temporary exemption permitted by Rule 10A-3(b)(1)(iv)(A) materially adversely affects the ability of our audit committee to act independently or to satisfy the requirements of Rule 10A-3 under the Exchange Act.
In 2014, no purchases of our equity securities were made by or on behalf of Auris Medical Holding AG or any affiliated purchaser.
Not applicable.
Summary of Significant Corporate Governance Differences From Nasdaq Listing Standards
Our common shares are listed on the Nasdaq Global Market, or Nasdaq. We are therefore required to comply with certain of the Nasdaq’s corporate governance listing standards, or the Nasdaq Standards. As a foreign private issuer, we may follow our home country’s corporate governance practices in lieu of certain of the Nasdaq Standards. Our corporate governance practices differ in certain respects from those that U.S. companies must adopt in order to maintain a Nasdaq listing. A brief, general summary of those differences is provided as follows.
Independent Directors
Swiss law does not require that a majority of our board of directors consist of independent directors. Our board of directors therefore may include fewer independent directors than would be required if we were subject to Nasdaq Listing Rule 5605(b)(1). In addition, we will not be subject to Nasdaq Listing Rule 5605(b)(2), which requires that independent directors must regularly have scheduled meetings at which only independent directors are present.
Audit Committee
We rely on the phase-in rules of the SEC and Nasdaq with respect to the independence of our audit committee. These rules require all members of our audit committee must meet the independence standard for audit committee members within one year of our initial public offering.
Compensation Committee
Although Swiss law also requires that we have a compensation committee, we will follow home country requirements with respect to such committee. As a result, our practice will vary from the requirements of Nasdaq Listing Rule 5605(d), which sets forth certain requirements as to the responsibilities, composition and independence of compensation committees.
Nominating and Corporate Governance Committee
As permitted by the listing requirements of Nasdaq, we have also opted out of the requirements of Nasdaq Listing Rule 5605(e), which requires an issuer to have independent director oversight of director nominations.
Quorum requirements
In accordance with Swiss law and generally accepted business practices, our articles of association do not provide quorum requirements generally applicable to general meetings of shareholders. Our practice thus varies from the requirement of Nasdaq Listing Rule 5620(c), which requires an issuer to provide in its bylaws for a generally applicable quorum, and that such quorum may not be less than one-third of the outstanding voting stock.
Solicitation of proxies
Our articles of association provide for an independent proxy holder elected by our shareholders, who may represent our shareholders at a general meeting of shareholders, and we must provide shareholders with an agenda and other relevant documents for the general meeting of shareholders. However, Swiss law does not have a regulatory regime for the solicitation of proxies and company solicitation of proxies is prohibited for public companies in Switzerland, thus our practice will vary from the requirement of Nasdaq Listing Rule 5620(b), which sets forth certain requirements regarding the solicitation of proxies.
Shareholder approval
We have opted out of shareholder approval requirements for the issuance of securities in connection with certain events such as the acquisition of stock or assets of another company, the establishment of or amendments to equity-based compensation plans for employees, a change of control of us and certain private placements. To this extent, our practice varies from the requirements of Nasdaq Listing Rule 5635, which generally requires an issuer to obtain shareholder approval for the issuance of securities in connection with such events.
Not applicable.
We have responded to Item 18 in lieu of this item.
Financial Statements are filed as part of this Annual Report, see page F-1.
(a) The following documents are filed as part of this registration statement:
|
|
1.1*
|
Articles of Association of Auris Medical Holding AG
|
|
|
2.1
|
Form of Registration Rights Agreement between Auris Medical Holding AG and the shareholders listed therein (incorporated by reference to exhibit 4.1 of the Auris Medical Holding AG registration statement on Form F-1 (Registration no. 333-197105) filed with the Commission on July 21, 2014)
|
|
|
4.1†
|
Collaboration and License Agreement, dated October 21, 2003, between Auris Medical AG and Xigen SA (incorporated by reference to exhibit 10.1 of the Auris Medical Holding AG registration statement on Form F-1 (Registration no. 333-197105) filed with the Commission on June 27, 2014)
|
|
|
4.2†
|
Co-Ownership and Exploitation Agreement, dated September 29, 2003, between Auris Medical AG and INSERM (incorporated by reference to exhibit 10.2 of the Auris Medical Holding AG registration statement on Form F-1 (Registration no. 333-197105) filed with the Commission on June 27, 2014)
|
|
|
4.3
|
Series C Investment Agreement, dated April 5, 2013 (incorporated by reference to exhibit 10.3 of the Auris Medical Holding AG registration statement on Form F-1 (Registration no. 333-197105) filed with the Commission on June 27, 2014)
|
|
|
4.4
|
Series C Shareholders’ Agreement, dated April 5, 2013 (incorporated by reference to exhibit 10.4 of the Auris Medical Holding AG registration statement on Form F-1 (Registration no. 333-197105) filed with the Commission on June 27, 2014)
|
|
|
4.5
|
Convertible Loan Agreement, dated December 2013, between Auris Medical AG and Sofinnova Venture Partners VIII, L.P. and Sofinnova Capital VII FCPR (incorporated by reference to exhibit 10.5 of the Auris Medical Holding AG registration statement on Form F-1 (Registration no. 333-197105) filed with the Commission on June 27, 2014)
|
|
|
4.6
|
Service Agreement, dated January 2011 between Auris Medical AG and Altamira Pharma GmbH (incorporated by reference to exhibit 10.6 of the Auris Medical Holding AG registration statement on Form F-1 (Registration no. 333-197105) filed with the Commission on June 27, 2014)
|
|
|
4.7
|
Termination of Service Agreement, dated February 2014 between Auris Medical AG and Altamira Pharma GmbH (incorporated by reference to exhibit 10.7 of the Auris Medical Holding AG registration statement on Form F-1 (Registration no. 333-197105) filed with the Commission on June 27, 2014)
|
|
|
4.8
|
Loan Agreement, dated January 2013 between Auris Medical AG and Altamira Pharma GmbH (incorporated by reference to exhibit 10.8 of the Auris Medical Holding AG registration statement on Form F-1 (Registration no. 333-197105) filed with the Commission on June 27, 2014)
|
|
|
4.9
|
Form of Indemnification Agreement (incorporated by reference to exhibit 10.9 of the Auris Medical Holding AG registration statement on Form F-1 (Registration no. 333-197105) filed with the Commission on July 21, 2014)
|
|
|
4.10
|
English language translation of Lease Agreement between Auris Medical AG and Privera AG (incorporated by reference to exhibit 10.10 of the Auris Medical Holding AG registration statement on Form F-1 (Registration no. 333-197105) filed with the Commission on June 27, 2014)
|
|
|
4.11
|
Stock Option Plan A (incorporated by reference to exhibit 10.11 of the Auris Medical Holding AG registration statement on Form F-1 (Registration no. 333-197105) filed with the Commission on June 27, 2014)
|
|
|
4.12
|
Stock Option Plan C (incorporated by reference to exhibit 10.12 of the Auris Medical Holding AG registration statement on Form F-1 (Registration no. 333-197105) filed with the Commission on June 27, 2014)
|
|
|
8.1
|
List of subsidiaries (incorporated by reference to exhibit 21.1 of the Auris Medical Holding AG registration statement on Form F-1 (Registration no. 333-197105) filed with the Commission on June 27, 2014)
|
|
|
12.1*
|
Certification of Thomas Meyer pursuant to 17 CFR 240.13a-14(a)
|
|
|
12.2*
|
Certification of Sven Zimmermann pursuant to 17 CFR 240.13a-14(a).
|
|
|
13.1*
|
Certification of Thomas Meyer pursuant to 17 CFR 240.13a-14(b) and 18 U.S.C.1350
|
|
|
13.2*
|
Certification of Sven Zimmermann pursuant to 17 CFR 240.13a-14(b) and 18 U.S.C.1350
|
|
|
15.1*
|
Consent of
Deloitte AG
|
|
|
15.2*
|
Consent of KPMG AG
|
|
*
|
Filed herewith
|
|
†
|
Confidential treatment requested as to portions of the exhibit. Confidential materials omitted and filed separately with the Securities and Exchange Commission.
|
(b) Financial Statement Schedules
None.
Signatures
The registrant hereby certifies that it meets all of the requirements for filing on Form 20-F and that it has duly caused and authorized the undersigned to sign this Annual Report on its behalf.
|
AURIS MEDICAL HOLDING AG
|
|||
|
By:
|
/s/ Thomas Meyer
|
||
|
Name:
|
Thomas Meyer
|
||
|
Title:
|
Chief Executive Officer
|
||
Date: March 30, 2015
Index to CONSOLIDATED Financial Statements
Audited Consolidated Financial Statements—Auris Medical Holding AG (formerly Auris Medical AG)
As at December 31, 2014 and 2013 and for the years ended December 31, 2014, 2013, and 2012
The Board of Directors
Auris Medical Holding AG:
To the Board of Directors and Shareholders of Auris Medical Holding AG (formerly: Auris Medical AG)
We have audited the accompanying consolidated statement of financial position of
Auris Medical Holding AG and its subsidiaries (the “Company”) as of December 31, 2014, and the related consolidated statements of profit or loss and other comprehensive loss, changes in equity, cash flows, and notes for the year then ended (pages F-4 to F-35). These financial statements are the responsibility of the Company’s management. Our responsibility is to express an opinion on these financial statements based on our audit.
We conducted our audit in accordance with the standards of the Public Company Accounting Oversight Board (United States). Those standards require that we plan and perform the audit to obtain reasonable assurance about whether the financial statements are free of material misstatement. The Company is not required to have, nor were we engaged to perform, an audit of its internal control over financial reporting. An audit includes consideration of internal control over financial reporting as a basis for designing audit procedures that are appropriate in the circumstances, but not for the purpose of expressing an opinion on the Company’s internal control over financial reporting. Accordingly, we express no such opinion. An audit also includes examining, on a test basis, evidence supporting the amounts and disclosures in the financial statements. An audit also includes assessing the accounting principles used and significant estimates made by management, as well as evaluating the overall financial statement presentation. We believe that our audits provide a reasonable basis for our opinion.
In our opinion, the consolidated financial statements referred to above present fairly, in all material respects, the financial position of Auris Medical Holding AG and its subsidiaries as of December 31, 2014, and the results of its operations, cash flows, and notes for the year ended, in conformity with International Financial Reporting Standards as issued by the International Accounting Standards Board.
Deloitte AG
|
/s/ James D. Horiguchi
|
/s/ Matthias Gschwend
|
|
Partner
|
Director
|
|
Auditor in Charge
|
Zurich, Switzerland
March 30, 2015
Report of Independent Registered Public Accounting Firm
The Board of Directors
Auris Medical AG:
We have audited the accompanying consolidated statement of financial position of Auris Medical AG and subsidiaries (the “Company”) as of December 31, 2013, and the related consolidated statements of profit or loss and other comprehensive loss, changes in equity and cash flows, for each of the years in the two-year period ended December 31, 2013. These consolidated financial statements are the responsibility of the Company’s management. Our responsibility is to express an opinion on these consolidated financial statements based on our audits.
We conducted our audits in accordance with the standards of the Public Company Accounting Oversight Board (United States). Those standards require that we plan and perform the audit to obtain reasonable assurance about whether the financial statements are free of material misstatement. An audit includes examining, on a test basis, evidence supporting the amounts and disclosures in the financial statements. An audit also includes assessing the accounting principles used and significant estimates made by management, as well as evaluating the overall financial statement presentation. We believe that our audits provide a reasonable basis for our opinion.
In our opinion, the consolidated financial statements referred to above present fairly, in all material respects, the financial position of Auris Medical AG and subsidiaries as of December 31, 2013, and the results of their operations and their cash flows for each of the years in the two-year period ended December 31, 2013, in conformity with International Financial Reporting Standards as issued by the International Accounting Standards Board.
KPMG AG
|
/s/ Martin Rohrbach
|
/s/ Charles Errico
|
|
|
Martin Rohrbach
|
Charles Errico
|
Zurich, Switzerland
March 18, 2014
AURIS MEDICAL HOLDING AG (formerly Auris Medical AG)
For the Years Ended December 31, 2014, 2013 and 2012
(in CHF)
|
Note
|
2014
|
2013
|
2012
|
|||||||||||||
|
Research and development
|
17 | -17,704,461 | -13,253,638 | -3,986,691 | ||||||||||||
|
General and administrative
|
18 | -4,489,051 | -1,362,211 | -623,812 | ||||||||||||
|
Operating loss
|
-22,193,512 | -14,615,849 | -4,610,503 | |||||||||||||
|
Finance expense
|
20 | -207,825 | -158,641 | -1,800 | ||||||||||||
|
Finance income
|
20 | 4,216,322 | 75,747 | 9,894 | ||||||||||||
|
Loss before tax
|
-18,185,015 | -14,698,743 | -4,602,409 | |||||||||||||
|
Income tax expense
|
21 | – | -305,750 | – | ||||||||||||
|
Net loss attributable to owners of the Company
|
-18,185,015 | -15,004,493 | -4,602,409 | |||||||||||||
|
Other comprehensive loss:
|
||||||||||||||||
|
Items that will never be reclassified to profit or loss
*
|
||||||||||||||||
|
Remeasurements of defined benefit liability, net of taxes of CHF 0
|
19 | -1,101,468 | -57,716 | -54,577 | ||||||||||||
|
Items that are or may be reclassified to profit or loss
|
||||||||||||||||
|
Foreign currency translation differences, net of taxes of CHF 0
|
-105,104 | 31,720 | 22,275 | |||||||||||||
|
Other comprehensive loss, net of taxes of CHF 0
*
|
-1,206,572 | -25,996 | -32,302 | |||||||||||||
|
Total comprehensive loss attributable to owners of the Company
|
-19,391,587 | -15,030,489 | -4,634,711 | |||||||||||||
|
Basic and diluted loss per share
|
22 | -0.66 | -1.01 | -0.40 | ||||||||||||
|
*
|
the net effect of taxes was CHF 0 for 2013 and 2012
|
The accompanying notes form an integral part of these consolidated financial statements.
AURIS MEDICAL HOLDING AG (formerly Auris Medical AG)
As of December 31, 2014 and 2013
(in CHF)
|
Note
|
December 31,
2014
|
December 31,
2013
|
||||||||
|
ASSETS
|
||||||||||
|
Non-current assets
|
||||||||||
|
Property and equipment
|
7 | 235,427 | 195,915 | |||||||
|
Intangible assets
|
8 | 1,482,520 | 1,482,520 | |||||||
|
Deferred Tax Asset
|
21 | 32,761 | – | |||||||
|
Total non-current assets
|
1,750,708 | 1,678,435 | ||||||||
|
Current assets
|
||||||||||
|
Other receivables
|
9 | 542,538 | 524,786 | |||||||
|
Prepayments
|
10 | 265,170 | 183,137 | |||||||
|
Cash and cash equivalents
|
11 | 56,934,325 | 23,865,842 | |||||||
|
Total current assets
|
57,742,033 | 24,573,765 | ||||||||
|
Total assets
|
59,492,741 | 26,252,200 | ||||||||
|
EQUITY AND LIABILITIES
|
||||||||||
|
Equity
|
||||||||||
|
Share capital
|
12 | 11,604,156 | 6,487,130 | |||||||
|
Share premium
|
93,861,171 | 35,608,210 | ||||||||
|
Foreign currency translation reserve
|
-51,108 | 53,995 | ||||||||
|
Accumulated deficit
|
-52,131,426
|
-3,115,689 | ||||||||
|
Total shareholders’ equity attributable to owners of the Company
|
53,282,793 | 9,033,646 | ||||||||
|
Non-current liabilities
|
||||||||||
|
Employee benefits
|
19 | 1,410,598 | 328,342 | |||||||
|
Deferred tax liabilities
|
21 | 360,398 | 327,637 | |||||||
|
Total non-current liabilities
|
1,770,996 | 655,979 | ||||||||
|
Current liabilities
|
||||||||||
|
Convertible loans
|
14 | – | 13,711,200 | |||||||
|
Trade and other payables
|
15 | 3,234,384 | 954,257 | |||||||
|
Accrued expenses
|
16 | 1,204,568 | 1,897,118 | |||||||
|
Total current liabilities
|
4,438,952 | 16,562,575 | ||||||||
|
Total liabilities
|
6,209,948 | 17,218,554 | ||||||||
|
Total equity and liabilities
|
59,492,741 | 26,252,200 | ||||||||
The accompanying notes form an integral part of these consolidated financial statements.
AURIS MEDICAL HOLDING AG (formerly Auris Medical AG)
For the Years Ended December 31, 2014, 2013, and 2012
(in CHF)
|
Attributable to Owners of the Company
|
||||||||||||||||||||||||||
|
Note
|
Share Capital
|
Share Premium
|
Treasury Shares
|
Foreign Currency Translation Reserve
|
Accumulated Deficit
|
Total Equity
|
||||||||||||||||||||
|
As of January 1, 2012
|
4,632,580 | 10,006,179 | -526,320 | – | -13,639,857 | 472,582 | ||||||||||||||||||||
|
Total comprehensive loss
|
||||||||||||||||||||||||||
|
Net loss
|
– | – | – | – | -4,602,409 | -4,602,409 | ||||||||||||||||||||
|
Other comprehensive income (loss)
|
– | – | – | 22,275 | -54,577 | -32,302 | ||||||||||||||||||||
|
Total comprehensive loss
|
– | – | – | 22,275 | -4,656,986 | -4,634,711 | ||||||||||||||||||||
|
Transactions with owners of the Company
|
||||||||||||||||||||||||||
|
Additional paid in capital
|
– | 3,335,763 | – | – | – | 3,335,763 | ||||||||||||||||||||
|
Share based payments
|
– | – | – | – | 56,013 | 56,013 | ||||||||||||||||||||
|
Treasury shares sold
|
– | – | 526,320 | – | – | 526,320 | ||||||||||||||||||||
|
Balance at December 31, 2012
|
4,632,580 | 13,341,942 | – | 22,275 | -18,240,831 | -244,034 | ||||||||||||||||||||
|
As of January 1, 2013
|
4,632,580 | 13,341,942 | – | 22,275 | -18,240,831 | -244,034 | ||||||||||||||||||||
|
Total comprehensive loss
|
– | |||||||||||||||||||||||||
|
Net loss
|
– | – | – | – | -15,004,493 | -15,004,493 | ||||||||||||||||||||
|
Other comprehensive income (loss)
|
– | – | – | 31,720 | -57,716 | -25,996 | ||||||||||||||||||||
|
Total comprehensive loss
|
– | – | – | 31,720 | -15,062,209 | -15,030,489 | ||||||||||||||||||||
|
Transactions with owners of the Company
|
||||||||||||||||||||||||||
|
Issue of ordinary shares
|
1,854,550 | 22,625,510 | – | – | – | 24,480,060 | ||||||||||||||||||||
|
Share issuance costs
|
– | -359,242 | – | – | – | -359,242 | ||||||||||||||||||||
|
Convertible loans - equity component
|
14 | – | – | – | – | 99,038 | 99,038 | |||||||||||||||||||
|
Convertible loans - deferred tax
|
14 | – | – | – | – | -21,886 | -21,886 | |||||||||||||||||||
|
Share based payments
|
13 | 110,198 | 110,198 | |||||||||||||||||||||||
|
Balance at December 31, 2013
|
6,487,130 | 35,608,210 | – | 53,995 | -33,115,689 | 9,033,646 | ||||||||||||||||||||
|
As of January 1, 2014
|
6,487,130 | 35,608,210 | – | 53,995 | -33,115,689 | 9,033,646 | ||||||||||||||||||||
|
Total comprehensive loss
|
||||||||||||||||||||||||||
|
Net loss
|
– | – | – | – | -18,185,015 | -18,185,015 | ||||||||||||||||||||
|
Other comprehensive loss
|
– | – | – | -105,104 | -1,101,468 | -1,206,572 | ||||||||||||||||||||
|
Total comprehensive loss
|
– | – | – | -105,104 | -19,286,483 | -19,391,587 | ||||||||||||||||||||
|
Transactions with owners of the Company
|
||||||||||||||||||||||||||
|
Issue of ordinary shares associated with Initial Public Offering (“IPO”)
|
12 | 4,045,294 | 47,261,446 | – | – | – | 51,306,740 | |||||||||||||||||||
|
Issuance costs associated with IPO
|
12 | – | -1,815,056 | – | – | – | -1,815,056 | |||||||||||||||||||
|
Conversion of convertible loan
|
14 | 1,043,180 | 12,717,655 | – | – | – | 13,760,835 | |||||||||||||||||||
|
Share issuance costs
|
– |
-136,697
|
– | – | – | -136,697 | ||||||||||||||||||||
|
Share based payments
|
13 | – | – | – | – | 270,747 | 270,747 | |||||||||||||||||||
|
Share options exercised
|
13 | 28,552 | 225,613 | – | – | – | 254,165 | |||||||||||||||||||
|
Balance at December 31, 2014
|
11,604,156 | 93,861,171 | – | -51,109 | -52,131,426 | 53,282,793 | ||||||||||||||||||||
The accompanying notes form an integral part of these consolidated financial statements.
AURIS MEDICAL HOLDING AG (formerly Auris Medical AG)
For the Years Ended December 31, 2014, 2013 and 2012
(in CHF)
|
Note
|
2014
|
2013
|
2012
|
|||||||||||
|
Cash flows from operating activities
|
||||||||||||||
|
Net loss
|
-18,185,015 | -15,004,493 | -4,602,409 | |||||||||||
|
Adjustments for:
|
||||||||||||||
|
Depreciation
|
17,18 | 73,984 | 37,517 | 9,242 | ||||||||||
|
Unrealized Net foreign currency exchange (gains) loss
|
-4,066,452 | 32,076 | 20,920 | |||||||||||
|
Net interest income
|
20 | -2,498 | -23,859 | -5,825 | ||||||||||
|
Share option costs
|
13 | 270,747 | 110,198 | 56,013 | ||||||||||
|
Employee benefits
|
-19,211 | 27,980 | 9,545 | |||||||||||
|
Income tax expense
|
21 | – | 305,750 | 0 | ||||||||||
| -21,928,445 | -14,514,831 | -4,512,514 | ||||||||||||
|
Changes in:
|
||||||||||||||
|
Other receivables
|
-17,634 | -288,765 | -125,782 | |||||||||||
|
Prepayments
|
-82,033 | -98,812 | -15,659 | |||||||||||
|
Trade and other payables
|
2,279,626 | 530,080 | 254,063 | |||||||||||
|
Accrued expenses
|
432,449 | 328,719 | -98,575 | |||||||||||
|
Cash used in operating activities
|
-19,316,037 | -14,043,609 | -4,498,467 | |||||||||||
|
Cash flows from investing activities
|
||||||||||||||
|
Purchase of property and equipment
|
7 | -113,496 | -108,936 | -131,751 | ||||||||||
|
Purchase of intangibles
|
-1,125,000 | – | – | |||||||||||
|
Sale of financial asset
|
– | – | 72,850 | |||||||||||
|
Interest received
|
20 | 52,133 | 74,036 | 5,825 | ||||||||||
|
Net cash used in investing activities
|
-1,186,363 | -34,900 | -53,076 | |||||||||||
|
Cash flows from financing activities
|
||||||||||||||
|
Proceeds from share capital increase
|
13 | – | 24,120,818 | 3,335,762 | ||||||||||
|
Proceeds from exercise of options
|
13 | 254,165 | – | – | ||||||||||
|
Share issuance costs
|
-136,697 | – | – | |||||||||||
|
Proceeds from issue of convertible loans
|
14 | – | 13,769,976 | – | ||||||||||
|
Proceeds from IPO, net (net of underwriting fees and IPO costs)
|
12 | 50,037,847 | – | – | ||||||||||
|
Share issuance costs IPO
|
12 | -546,163 | – | – | ||||||||||
|
Sale of treasury shares
|
– | – | 526,320 | |||||||||||
|
Interest paid
|
20 | – | -9,915 | – | ||||||||||
|
Net cash from financing activities
|
49,609,152 | 37,880,879 | 3,862,082 | |||||||||||
|
Net increase in cash and cash equivalents
|
29,106,752 | 23,802,370 | -689,461 | |||||||||||
|
Cash and cash equivalents at beginning of the period
|
23,865,842 | 63,967 | 752,874 | |||||||||||
|
Net effect of currency translation on cash
|
3,961,731 | -495 | 554 | |||||||||||
|
Cash and cash equivalents at end of the period
|
56,934,325 | 23,865,842 | 63,967 | |||||||||||
The accompanying notes form an integral part of these consolidated financial statements.
Notes to the Consolidated Financial Statements
as of December 31, 2014, 2013
and for the Years Ended December 31, 2014, 2013 and 2012 (in CHF)
1. Reporting entity
Auris Medical Holding AG (the “Company”) is domiciled in Switzerland. The Company’s registered address is Bahnhofstrasse 21, 6300 Zug. These consolidated financial statements comprise the Company and its subsidiaries (together referred to as the “Group” and individually as “Group entities”). The Company is the ultimate parent of the following Group entities:
|
·
|
Auris Medical AG, Basel, Switzerland (100%)
|
|
·
|
Otolanum AG, Zug, Switzerland (100%)
|
|
·
|
Auris Medical Inc., Chicago, United States (100%)
|
|
·
|
Auris Medical Ltd., Dublin, Ireland (100%)
|
On April 22, 2014, we changed our name from Auris Medical AG to Auris Medical Holding AG. On May 21, 2014 the domicile of Auris Medical Holding AG was transferred from Basel to Zug.
The Group is primarily involved in the development of pharmaceutical products for the treatment of inner ear disorders, in particular tinnitus and hearing loss. Its most advanced projects are in the late stage of clinical development.
2. Basis of preparation
Statement of compliance
These consolidated financial statements have been prepared in accordance with International Financial Reporting Standards as issued by the International Accounting Standards Board (“IFRS”).
These consolidated financial statements were approved by the Board of Directors of the Company on March 30, 2015.
Basis of measurement
The consolidated financial statements are prepared on the historical cost basis, except for the revaluation to fair value of certain financial assets. Historical cost is generally based on the fair value of the consideration given in exchange for goods and services. The principal accounting policies adopted are set out below.
Functional and reporting currency
These consolidated financial statements are presented in Swiss Francs (“CHF”), which is the Company’s functional
(“functional currency”) and the Group’s reporting currency.
Use of estimates and judgments
The preparation of financial statements in conformity with IFRS requires management to make judgments, estimates and assumptions that affect the application of accounting policies and the reported amounts of assets, liabilities, income and expenses. Actual results may differ from these estimates.
Estimates and underlying assumptions are reviewed on an ongoing basis. Revisions of accounting estimates are recognized in the period in which the estimates are revised and in any future periods affected.
Information about judgments made in applying accounting policies that have the most significant effects on the amounts recognized in the consolidated financial statements are described below.
Income taxes
As disclosed in Note 21 the Group has significant tax losses in Switzerland. These tax losses represent potential value to the Group to the extent that the Group is able to create taxable profits in Switzerland prior to expiry of such losses. The Group also has tax losses in the United States which may be used within 20 years of the end of the year in which losses arose, or for a shorter time period in accordance with prevailing federal and state law. The Group has not recorded any deferred tax assets in relation to these tax losses. The key factors which have influenced management in arriving at this evaluation are the fact that the business is still in a development phase and the Group has not yet a history of making profits. Should management’s assessment of the likelihood of future taxable profits change, a deferred tax asset will be recorded.
Development expenditures
The project stage forms the basis for the decision as to whether costs incurred for the Group’s development projects can be capitalized. Generally clinical development expenditures are not capitalized until the Group obtains regulatory approval (i.e. approval to commercially use the product), as this is considered to be essentially the first point in time where it becomes probable that future revenues can be generated. Given the current stage of the Group’s development projects, no development expenditures have yet been capitalized. The Group has capitalized certain milestone payments with regard to license payments.
As of each reporting date, the Group estimates the level of service performed by the vendors and the associated costs incurred for the services performed. As part of the process of preparing the Group’s financial statements, the Group is required to estimate its accrued expenses. This process involves reviewing contracts, identifying services that have been performed on the Group’s behalf and estimating the level of service performed and the associated cost incurred for the service when it has not yet been invoiced or otherwise notified of the actual cost.
Employee benefits
The Group maintains a pension plan for all employees in Switzerland through payments to a legally independent collective foundation. This pension plan qualifies under IFRS as defined benefit pension plan.
The Group’s net obligation in respect of defined benefit plans is calculated by estimating the amount of future benefit that employees have earned in return for their service in the current and prior periods, discounting that amount and deducting the fair value of any plan assets. The Company makes relevant actuarial assumptions with regard to the discount rate, future salary increases and life expectancy.
3. Significant accounting policies
The accounting policies set out below have been applied consistently to all periods presented in these consolidated financial statements, unless otherwise indicated.
Basis of consolidation
Subsidiaries
Subsidiaries are entities controlled by the Group. The Group controls an entity when it is exposed to, or has rights to, variable returns from its involvement with the entity and has the ability to affect those returns through its power over the entity. The financial statements of subsidiaries are included in the consolidated financial statements from the date on which control commences until the date on which control ceases.
Transactions eliminated on consolidation
All inter-company balances, transactions and unrealized gains on transactions have been eliminated in consolidation. Unrealized losses are also eliminated unless the transaction provides evidence of an impairment of the asset transferred.
Segment reporting
A segment is a distinguishable component of the Group that engages in business activities from which it may earn revenues and incur expenses, including revenues and expenses that relate to transactions with any of the Group’s other components.
The Chief Executive Officer is determined to be the Group’s Chief Operating Decision Maker (“CODM”). The CODM assesses the performance and allocates the resources of the Group as a whole, as all of the Group’s activities are focusing on the development of pharmaceutical products for the treatment of inner ear disorder. Financial information is only available for the Group as a whole. Therefore, management considers there is only one operating segment under the requirements of IFRS 8, Operating Segments.
Foreign currency
Foreign currency transactions
Items included in the financial statements of Group entities are measured using the currency of the primary economic environment in which the entity operates. Foreign currency transactions are translated into the functional currency using the exchange rates prevailing at the dates of the transactions. Foreign exchange gains and losses resulting from the settlement of such transactions and from the translation at year-end exchange rates of monetary assets and liabilities denominated in foreign currencies are recognized in profit or loss. Non-monetary items that are measured based on historical cost in a foreign currency are not re-translated.
Foreign operations
Assets and liabilities of Group entities whose functional currency is other than CHF are included in the consolidation by translating the assets and liabilities into the reporting currency at the exchange rates applicable at the end of the reporting period. Income and expenses are translated at average exchange rates (unless this average is not a reasonable approximation of the cumulative effect of the rates prevailing on the transaction dates, in which case income and expenses are translated at the dates of the transaction).
Foreign currency differences are recognized in Other Comprehensive Loss and presented in the foreign currency translation reserve in equity. When a foreign operation is disposed of such that control is lost, the cumulative amount in the translation reserve related to that foreign operation is reclassified to profit or loss as part of the gain or loss on disposal.
Closing rates for the most significant foreign currencies:
|
Currency
|
Geographical area
|
Reporting
entities
|
December 31,
2014
|
December 31,
2013
|
December 31,
2012
|
|||||||||||||||
|
CHF
|
Swiss Franc
|
Switzerland
|
3/1 | * | 1.0000 | 1.0000 | 1.0000 | |||||||||||||
|
USD
|
Dollar
|
United States
|
1 | 0.9895 | 0.8894 | 0.9154 | ||||||||||||||
|
EUR
|
Euro
|
Europe
|
1 | 1.2027 | 1.2255 | 1.2068 | ||||||||||||||
|
*
There were three operating entities in 2014 and one operating entity in each of 2013 and 2012.
|
Average exchange rates for the year for the most significant foreign currencies:
|
Currency
|
Geographical area
|
Reporting
entities
|
2014
|
2013
|
2012
|
|||||||||||||||
|
CHF
|
Swiss Franc
|
Switzerland
|
3/1 | * | 1.0000 | 1.0000 | 1.0000 | |||||||||||||
|
USD
|
Dollar
|
United States
|
1 | * | 0.9150 | 0.9391 | 0.9481 | |||||||||||||
|
EUR
|
Euro
|
Europe
|
1 | * | 1.2144 | 1.2414 | 1.2196 | |||||||||||||
|
*
There were three operating entities in 2014 and one operating entity in each of 2013 and 2012.
|
Property and equipment
Property and equipment is measured at historical costs less accumulated depreciation and any accumulated impairment losses. Historical costs include expenditures that are directly attributable to the acquisition of the items. When parts of an item of tangible assets have different useful lives, they are accounted for as separate tangible asset items (major components). Depreciation is calculated on a straight-line basis over the expected useful life of the individual asset or the shorter remaining lease term for leasehold improvements. The applicable estimated useful lives are as follows:
|
Production equipment
|
5 years
|
|
Office furniture and electronic data processing equipment (“EDP”)
|
3 years
|
|
Leasehold improvements
|
5 years
|
Subsequent costs are included in the asset’s carrying amount or recognized as a separate asset, as appropriate, only when it is probable that future economic benefits associated with the item will flow to the Group and the cost of the item can be measured reliably. The carrying amount of the replaced part is derecognized. All other repairs and maintenance are charged to profit or loss during the financial period in which they are incurred.
Depreciation methods, useful lives and residual values are reviewed at each reporting date and adjusted if appropriate. When an asset is reviewed for impairment, the asset’s carrying amount may be written down immediately to its recoverable amount, provided the asset’s carrying amount is greater than its estimated recoverable amount. Management assesses the recoverable amount by assessing the higher of its fair value less costs to sell or its value in use.
Cost and accumulated depreciation related to assets retired or otherwise disposed are removed from the accounts at the time of retirement or disposal and any resulting gain or loss is included in profit or loss in the period of disposition.
Intangible assets
Research and development
Expenditures on the Group’s research programs are not capitalized, they are expensed when incurred.
Expenditures on the Group’s development programs are generally not capitalized except if development costs can be measured reliably, the product or process is technically and commercially feasible, future economic benefits are probable, and the Group intends to and has sufficient resources to complete development and to use or sell the asset. For the development projects of the Group, these criteria are generally only met when regulatory approval for commercialization is obtained. Given the current stage of the development projects, no development expenditures except certain milestone payments have yet been capitalized in 2013 and 2014. Intellectual property-related costs for patents are part of the expenditure for research and development projects. Therefore, registration costs for patents are expensed when incurred as long as the research and development project concerned does not meet the criteria for capitalization.
Licenses
Intellectual property rights that are acquired by the Group are capitalized as intangible assets if they are controlled by the Group, are separately identifiable and are expected to generate future economic benefits, even if uncertainty exists as to whether the research and development will ultimately result in a marketable product. Consequently, upfront and milestone payments to third parties for the exclusive use of pharmaceutical compounds in specified areas of treatment are recognized as intangible assets.
Measurement
Intangible assets acquired that have finite useful lives are measured at cost less accumulated amortization and any accumulated impairment losses.
Subsequent expenditure
Subsequent expenditure is capitalized only when it increases the future economic benefits embodied in the specific asset to which it relates. All other expenditure, including expenditure on internally generated goodwill and brands, is recognized in profit or loss as incurred.
Amortization
All licenses of the Group have finite lives. Amortization will commence once the Group’s intangible assets are available for use. Amortization of licenses is calculated on a straight line basis over the period of the expected benefit or until the license expires, whichever is shorter. The estimated useful life is 10 years or the remaining term of patent protection. The Group assesses at each statement of financial position date whether intangible assets which are not yet ready for use are impaired.
Impairment of non-financial assets
Property and equipment and intangible assets are reviewed for impairment whenever events or changes in circumstances indicate that the carrying amount may not be recoverable. For the purpose of assessing impairment, assets are grouped at the lowest levels for which there are separately identifiable cash flows (cash-generating units). An impairment loss is recognized as the amount by which the asset’s carrying amount exceeds its recoverable amount. The recoverable amount is the higher of an asset’s fair value less costs to sell or value in use. Impairment losses are recognized in profit or loss. Assets that were previously impaired are reviewed for possible reversal of the impairment at each reporting date. Any increase in the carrying amount of an asset will be based on the depreciated historical costs had the initial impairment not been recognized.
Financial instruments
The Group classifies its financial assets in the following categories: loans and receivables and available-for-sale financial assets. The classification depends on the nature and purpose of the financial assets and is determined at the time of initial recognition.
The Company classifies non-derivative financial liabilities as other liabilities.
Recognition and derecognition of non-derivative financial assets and liabilities
The Group initially recognizes loans and receivables and debt securities issued on the date when they are originated. All other financial assets and financial liabilities are initially recognized on the trade date.
The Group derecognizes a financial asset when the contractual rights to the cash flows from the asset expire, or it transfers the rights to receive the contractual cash flows in a transaction in which substantially all of the risks and rewards of ownership of the financial asset are transferred, or it neither transfers nor retains substantially all of the risks and rewards of ownership and does not retain control over the transferred asset. Any interest in such derecognized financial assets that is created or retained by the Group is recognized as a separate asset or liability.
The Group derecognizes a financial liability when its contractual obligations are discharged or cancelled, or expire.
Financial assets and financial liabilities are offset and the net amount presented in the statement of financial position when, and only when, the Group has a legal right to offset the amounts and intends either to settle them on a net basis or to realize the asset and settle the liability simultaneously.
Non-derivative financial assets and liabilities—measurement
Loans and receivables
These are non-derivative financial assets with fixed or determinable payments that are not quoted in an active market. Loans and receivables are initially recognized at fair value plus any directly attributable transaction costs. Subsequent to initial recognition, they are measured at amortized cost using the effective interest method, less any impairment losses. Loans and receivables are mainly comprised of other receivables and cash and cash equivalents.
Cash and cash equivalents
The Group considers all short-term, highly liquid investments that are readily convertible into known amounts of cash and which are subject to an insignificant risk of changes in value with original maturities of three months or less at the date of the purchase to be cash equivalents.
Available-for-sale financial assets
Available-for-sale financial assets are non-derivatives that are either designated in this category or not classified in any of the other categories. They are included in non-current assets unless the investment matures or management intends to dispose of it within 12 months of the end of the reporting period. These assets are initially recognized at fair value plus any directly attributable transaction costs. Subsequent to initial recognition, they are measured at fair value and changes therein, other than impairment losses and foreign currency differences on debt instruments, are recognized in other comprehensive loss. When these assets are derecognized, the gain or loss accumulated in equity is reclassified to profit or loss.
Non-derivative financial liabilities - measurement
Non-derivative financial liabilities are initially recognized at fair value less any directly attributable transaction costs. Subsequent to initial recognition, these liabilities are measured at amortized cost using the effective interest method.
Share capital
All shares of the Company are registered shares and classified as part of shareholders’ equity. Incremental costs directly attributable to the issue of the Company’s shares, net of any tax effects, are recognized as a deduction from equity. The Company has not paid any dividends since its inception and does not anticipate paying dividends in the foreseeable future.
Repurchase and reissue of ordinary shares (treasury shares)
When shares recognized as equity are repurchased, the amount of the consideration paid, which includes directly attributable costs, net of any tax effects, is recognized as a deduction from equity. Repurchased shares are classified as treasury shares and are presented in the treasury share reserve. When treasury shares are sold or reissued subsequently, the amount received is recognized as an increase in equity and the resulting surplus or deficit (calculated as the difference between initial cost and fair value) on the transaction is presented within share premium.
Convertible loans
The component parts of convertible loans issued by the Company are classified separately as financial liabilities and equity in accordance with the substance of the contractual arrangement. At the date of issue, the fair value of the liability component is estimated using the prevailing market interest rate for a similar non-convertible instrument. This amount is recorded as a liability on an amortized cost basis using the effective interest method until extinguished upon conversion or at the instrument’s maturity date. The equity component is determined by deducting the amount of the liability component from the fair value of the compound instrument as a whole. This is recognized and included in equity, net of income tax effects, and is not subsequently remeasured.
Impairment of non-derivative financial assets
Financial assets are assessed at each reporting date to determine whether there is objective evidence of impairment.
Objective evidence that financial assets are impaired includes:
|
·
|
default or delinquency by a debtor;
|
|
·
|
indications that a debtor or issuer will enter bankruptcy;
|
|
·
|
adverse changes in the payment status of borrowers or issuers;
|
|
·
|
the disappearance of an active market for a security; or
|
|
·
|
observable data indicating that there is measurable decrease in expected cash flows from a group of financial assets.
|
For an investment in an equity security, the Group assesses at the end of each reporting period whether there is objective evidence of impairment including a significant or prolonged decline in its fair value below its cost. An equity security is impaired and impairment losses are incurred only if there is objective evidence of impairment as a result of one or more events that occurred after the initial recognition of the asset (a “loss event”) and that loss event (or events) has an impact on the estimated future cash flows of the financial asset or group of financial assets that can be reliably estimated.
Financial assets measured at amortized cost
The Group considers evidence of impairment for these assets at an individual asset level. An impairment loss is calculated as the difference between an asset’s carrying amount and the present value of the estimated future cash flows discounted at the asset’s original effective interest rate. Losses are recognized in profit or loss and reflected in an allowance account. When the Group considers that there are no realistic prospects of recovery of the asset, the relevant amounts are written off. If the amount of impairment loss subsequently decreases and the decrease can be related objectively to an event occurring after the impairment was recognized, then the previously recognized impairment loss is reversed through profit or loss.
Available-for-sale financial assets
Impairment losses on available-for-sale financial assets are recognized by reclassifying the losses accumulated in the fair value reserve to profit or loss. The amount reclassified is the difference between the acquisition cost (net of any principal repayment and amortization) and the current fair value, less any impairment loss previously recognized in profit or loss.
Income tax
Income tax expense comprises current and deferred tax. It is recognized in profit or loss except to the extent that it relates to a business combination, or items recognized directly in equity or in OCI.
Current tax
Current tax comprises the expected tax payable or receivable on the taxable income or loss for the year and any adjustment to tax payable or receivable in respect of previous years. It is measured using tax rates enacted or substantively enacted at the reporting date.
Deferred tax
Deferred income tax is recognized, using the balance sheet liability method, on temporary differences arising between the tax bases of assets and liabilities and their carrying amounts in the consolidated financial statements. Deferred tax is not recognized for:
|
·
|
temporary differences on the initial recognition of assets or liabilities in a transaction that is not a business combination and that affects neither accounting nor taxable profit or loss;
|
|
·
|
temporary differences related to investments in subsidiaries to the extent that the Group is able to control the timing of the reversal of the temporary differences and it is probable that they will not reverse in the foreseeable future; and
|
|
·
|
taxable temporary differences arising on the initial recognition of goodwill.
|
Deferred income tax is determined using tax rates and laws that have been enacted or substantively enacted by the reporting date and are expected to apply when the related deferred income tax asset is realized or the deferred income tax liability is settled.
Deferred income tax assets are recognized to the extent that it is probable that future taxable profit will be available against which the temporary differences can be utilized. Deferred tax assets are reviewed at each reporting date and are reduced to the extent that it is no longer probable that the related tax benefit will be realized.
Deferred tax assets and liabilities are offset when there is a legally enforceable right to set off tax assets against tax liabilities and when they relate to income taxes levied by the same taxation authority and the Group intends to settle its tax assets and liabilities on a net basis.
Employee benefits
The Group maintains a pension plan for all employees in Switzerland through payments to a legally independent collective foundation. This pension plan qualifies under IFRS as defined benefit pension plan. There are no pension plans for the subsidiaries in Ireland and the United States.
The Group’s net obligation in respect of defined benefit plans is calculated by estimating the amount of future benefit that employees have earned in return for their service in the current and prior periods, discounting that amount and deducting the fair value of any plan assets.
The recognized asset is limited to the present value of economic benefits available in the form of any future refunds from the plan or reductions in future contributions to the plan. In order to calculate the present value of economic benefits, consideration is given to any minimum funding requirements.
Remeasurements of the net defined benefit liability, which comprise actuarial gains and losses, the return on plan assets (excluding interest) and the effect of the asset ceiling (if any, excluding interest), are recognized immediately in OCI. Past service costs, including curtailment gains or losses, are recognized immediately in general and administrative expenses within the operating results. Settlement gains or losses are recognized in general and administrative expenses within the operating results. The Group determines the net interest expense (income) on the net defined benefit liability (asset) for the period by applying the discount rate used to measure the defined benefit obligation at the beginning of the annual period or in case of any significant events between measurement dates to the then-net defined benefit liability (asset), taking into account any changes in the net defined benefit liability (asset) during the period as a result of contributions and benefit payments. Net interest expense and other expenses related to defined benefit plans are recognized in profit or loss.
Share-based compensation
The Group maintains various share-based payment plans in the form of stock option plans for its employees, members of the Board of Directors as well as key service providers. Stock options are granted at the Board’s discretion without any contractual or recurring obligations.
The Group’s share-based compensation plans qualify as equity settled plans. The grant-date fair value of share-based payment awards granted to employees is recognized as an expense, with a corresponding increase in equity, over the period that the employees become unconditionally entitled to the awards. The vesting of share options is conditional on the employee completing a period of service of three and four years respectively in accordance with Stock Option Plans A and C as well as two and three years for 50% of an option award under the Company’s Equity Incentive Plan. Stock Option Plan B was created to provide shares for share based compensation plans; it was used in the years 2008, 2009 and 2014 and is still in force. However, no options are currently outstanding under Stock Option Plan B.
The amount recognized as an expense is adjusted to reflect the number of awards for which the related service and non-market performance conditions are expected to be met, such that the amount ultimately recognized as an expense is based on the number of awards that meet the related service and non-market performance conditions at the vesting date. Share-based payments that are not subject to any further conditions are expensed immediately at grant date. In the year the options are exercised the proceeds received net of any directly attributable transaction costs are credited to share capital (nominal value) and share premium. Costs are credited to share capital (nominal value) and share premium.
Valuation of share options
The fair value of our shares is determined by our management and our board of directors, and takes into account numerous factors to determine a best estimate of the fair value of our common shares as of each grant date.
In our historic financing rounds we have mainly relied on the prior sale of stock method where the Company and new investors negotiate the Company’s valuation at arm’s length. Typical considerations in this method may include the type and amount of equity sold, the estimated volatility, the estimated time to liquidity, the relationship of the parties involved, the timing compared to the common shares valuation date and the financial condition and structure of the Company at the time of the sale.
Following the completion of our initial public offering, option pricing and values are determined based on quoted market prices of our common shares.
Provisions
Provisions are recognized when the Group has a present obligation (legal or constructive) as a result of a past event, where it is more likely than not that an outflow of resources will be required to settle the obligation, and where a reliable estimate can be made of the amount of the obligation. Provisions are not recognized for future operating losses. Provisions are measured at the present value of the expenditures expected to be required to settle the obligation using a pre-tax rate that reflects current market assessments of the time value of money and the risks specific to the liability. The unwinding of the discount is recognized as finance cost.
Leases
Leases in which a significant portion of the risks and rewards of ownership are retained by the lessor are classified as operating leases. Payments made under operating leases (net of any incentives received from the lessor) are charged to profit or loss on a straight-line basis over the period of the lease.
Earnings/(loss) per share
Basic earnings/(loss) per share are calculated by dividing the net profit/(loss) attributable to owners of the Company by the weighted average number of shares outstanding during the period. Diluted earnings/(loss) per share are calculated by dividing the net profit/(loss) attributable to the owners of the Company by the weighted average number of shares outstanding during the period adjusted for the conversion of all dilutive potential ordinary shares.
4. New standards, amendments and interpretations adopted by the group
In the current year, the following revised standards have been adopted in these financial statements. Adoption has not had a significant impact on the amounts reported in these financial statements but may impact the accounting for future transactions and arrangements.
Amendments to IAS 32 (December 2011) Offsetting financial assets and financial liabilities
Amendments to IAS 36 (May 2013) Recoverable Amount Disclosures for Non-Financial Assets
Amendments to IAS 39 (Jun 2013) Novation of Derivatives and Continuation of Hedge Accounting
Amendments to IFRS 10, IFRS 12 and IAS 27 (Oct 2012) Investment Entities
IFRIC 21 Levies (May 2013)
A number of new standards, amendments to standards and interpretations are effective for annual periods beginning after January 1, 2015, and have not been applied in preparing these consolidated financial statements.
|
Standard/Interpretation
|
Impact
|
Effective date
|
Planned
application by the Group
|
|||||
|
New standards, interpretations or amendments
|
||||||||
|
IAS 19
|
Employee Contributions (Amendments)
|
1)
|
July 1, 2014
|
Reporting year 2015
|
||||
|
Various
|
Annual Improvements to IFRSs 2010-2012 Cycle
|
1)
|
July 1, 2014
|
Reporting year 2015
|
||||
|
Various
|
Annual Improvements to IFRSs 2011-2013 Cycle
|
1)
|
July 1, 2014
|
Reporting year 2015
|
||||
|
IFRS 9
|
Financial Instruments
|
2)
|
January 1, 2016
|
To be determined
|
||||
|
IFRS 14
|
Regulatory Deferral Accounts
|
2)
|
January 1, 2016
|
To be determined
|
||||
|
IFRS 15
|
Revenue from contract with customers
|
2)
|
January 1, 2017
|
To be determined
|
||||
|
IFRS 11 amendment
|
Joint Arrangement
|
2)
|
January 1, 2016
|
To be determined
|
||||
|
IAS 16 & 38
|
Property Plant and Equipment, Intangible Assets
|
2)
|
January 1, 2016
|
To be determined
|
||||
|
IAS 16 & 41 amendments
|
Property Plant and Equipment, Agriculture
|
2)
|
January 1, 2016
|
To be determined
|
||||
|
IAS 27 amendments
|
Consolidated and Separate Financial Statements
|
2)
|
January 1, 2016
|
To be determined
|
||||
|
Various
|
Annual Improvements to IFRSs:2012-2014 Cycle
|
2)
|
January 1, 2016
|
To be determined
|
||||
|
IFRS 10,12, & 28 amendments
|
Consolidated Financial Statements, Disclosure of Interests in Other Entities
|
2)
|
January 1, 2016
|
To be determined
|
||||
|
IAS 1 amendments
|
Presentation of Financial Statements
|
2)
|
January 1, 2016
|
To be determined
|
||||
|
1)
|
No or no significant impacts are expected on the consolidated financial statements of the Group.
|
|
2)
|
The impact on the consolidated financial statements of Group cannot yet be determined with sufficient reliability.
|
5. Financial instruments and risk management
The following table shows the carrying amounts of financial assets and financial liabilities:
|
December 31,
2014
|
December 31,
2013
|
|||||||
|
Financial assets
|
||||||||
|
Available for sale
|
||||||||
|
Current financial assets
|
— | — | ||||||
|
Loans and receivables
|
||||||||
|
Cash and cash equivalents
|
56,934,325 | 23,865,842 | ||||||
|
Other receivables
|
451,355 | 451,206 | ||||||
|
Total financial assets
|
57,385,680 | 24,317,048 | ||||||
|
Financial liabilities
|
||||||||
|
At amortized cost
|
||||||||
|
Convertible loans from shareholders
|
— | 13,711,200 | ||||||
|
Trade and other accounts payable
|
3,234,383 | 954,257 | ||||||
|
Accrued expenses
|
1,162,988 | 1,871,598 | ||||||
|
Total financial liabilities
|
4,397,371 | 16,537,055 | ||||||
Fair values
The carrying amount of cash and cash equivalents, other receivables, trade and other payables and accrued expenses is a reasonable approximation of their fair value due to the short term nature of these instruments.
The fair value of any other financial assets and liabilities for disclosure purposes is estimated by discounting the future contractual cash flows at the current market interest rate that is available to the Group for similar financial instruments.
Financial risk factors
The Group’s activities expose it to a variety of financial risks: market risk, credit risk and liquidity risk. The Group’s overall risk management program focuses on the unpredictability of financial markets and seeks to minimize
potential adverse effects on the Group’s financial performance. Management identifies, evaluates and controls financial risks. No financial derivatives have been used in 2014 and 2013 to hedge risk exposures. The Group invests its available cash in instruments with the main objectives of preserving principal, meeting liquidity needs and minimizing foreign exchange risks. The Group allocates its liquid assets to first tier Swiss or international banks with an S&P credit rating of at least A.
Liquidity risk
The Group’s principal source of liquidity is its cash reserves which are mainly obtained through the issuance of new shares. The Group has succeeded in raising capital to fund its development activities to date and has raised funds that will allow it to meet short term development expenditures. The Company will require regular capital injections to continue its development work, which may be dependent on meeting development milestones, technical results and/or commercial success. Management monitors rolling forecasts of the Group’s liquidity requirements to ensure it has sufficient cash to meet operational needs. The ability of the Group to maintain adequate cash reserves to sustain its activities in the medium term is highly dependent on the Group’s ability to raise further funds. Consequently, the Group is exposed to continued liquidity risk.
The table below analyses the remaining contractual maturities of financial liabilities, including estimated interest payments as at December 31, 2014 and 2013. The amounts disclosed in the table are the undiscounted cash flows:
|
Carrying
amount
|
Less than 3
months
|
Between 3
months and
2 years
|
2 years
and later
|
Total
|
||||||||||||||||
|
December 31, 2014
|
||||||||||||||||||||
|
Convertible loans from shareholders
|
— | — | — | — | — | |||||||||||||||
|
Trade and other accounts payable
|
3,234,383 | 3,234,383 | — | — | 3,234,383 | |||||||||||||||
|
Accrued expenses
|
1,162,988 | 1,162,988 | — | — | 1,162,988 | |||||||||||||||
|
Total
|
4,397,371 | 4,397,371 | — | — | 4,397,371 | |||||||||||||||
|
Carrying
amount
|
Less than 3
months
|
Between 3
months and
2 years
|
2 years
and later
|
Total
|
||||||||||||||||
|
December 31, 2013
|
||||||||||||||||||||
|
Convertible loans from shareholders
|
13,711,200 | 13,769,976 | — | — | 13,769,976 | |||||||||||||||
|
Trade and other accounts payable
|
954,257 | 954,257 | — | — | 954,257 | |||||||||||||||
|
Accrued expenses
|
1,871,598 | 1,871,598 | — | — | 1,871,598 | |||||||||||||||
|
Total
|
16,537,055 | 16,595,831 | — | — | 16,595,831 | |||||||||||||||
Credit risk
Credit risk is managed on a Group basis. Credit risk arises from cash and cash equivalents and deposits with banks, as well as from other receivables. The Company’s policy is to invest funds in low risk investments including interest bearing deposits. For banks and financial institutions, only independently rated parties with a minimum rating of “A” are accepted. Other receivables were current as of December 31, 2014 and December 31, 2013, not impaired and included only well-known counterparties.
The Group has been holding cash and cash equivalents in the Group’s principal operating currencies (CHF, USD and EUR) with international banks of high credit rating.
The Group’s maximum exposure to credit risk is represented by the carrying amount of each financial asset in the consolidated statement of financial position:
|
December 31,
2014
|
December 31,
2013
|
|||||||
|
Financial assets
|
||||||||
|
Cash and cash equivalents
|
56,934,325 | 23,865,842 | ||||||
|
Other receivables
|
451,355 | 451,206 | ||||||
|
Total
|
57,385,680 | 24,317,048 | ||||||
As of December 31, 2014 and December 31, 2013 other receivables consisted of advance payments to suppliers, and deposits for rent (see Note 9).
Market risk
Currency risk
The Group operates internationally and is exposed to foreign exchange risk arising from various exposures, primarily with respect to US Dollar and Euro. Foreign exchange risk arises from future commercial transactions, recognized assets and liabilities and net investments in foreign operations. To manage foreign exchange risk management maintains foreign currency cash balances to cover anticipated future purchases of materials and services in foreign currencies. The summary of quantitative data about the exposure of the Group’s financial assets and liabilities to currency risk was as follows:
|
2014
|
2013
|
|||||||||||||||
|
in CHF
|
USD
|
EUR
|
USD
|
EUR
|
||||||||||||
|
Prepayments
|
183,779 | 11,489 | 11,321 | 112,133 | ||||||||||||
|
Other receivables
|
145,636 | 267,533 | 145,636 | 273,438 | ||||||||||||
|
Cash and cash equivalents
|
46,433,371 | 1,949,684 | 4,267,768 | 2,309,318 | ||||||||||||
|
Trade and other accounts payable
|
-1,686,733 | -1,238,171 | -334,896 | -502,645 | ||||||||||||
|
Accrued expenses
|
-354,397 | -590,001 | -219,304 | -435,046 | ||||||||||||
|
Net
statement of financial position exposure - asset/(liability)
|
44,721,656
|
400,534 | 3,870,525 | 1,757,198 | ||||||||||||
As at December 31, 2014, a 5% increase or decrease in the USD/CHF exchange rate with all other variables held constant would have resulted in a CHF 2,212,604 (2013: CHF 175,115) increase or decrease in the net result. Also, a 5% increase or decrease in the EUR/CHF exchange rate with all other variables held constant would have resulted in a CHF 24,086 (2013: CHF 107,672) increase or decrease in the net result.
The Company has subsidiaries in the United States and Ireland, whose net assets are exposed to foreign currency translation risk. Due to the small size of the subsidiaries the translation risk is not significant.
Interest rate risk
In the period under review, the Group had no borrowings at variable interest rates. The Group had no fixed rate financial liabilities at fair value through profit or loss and no derivatives. Therefore a change in interest rates at the end of the reporting period would not affect profit or loss.
The only variable interest-bearing financial asset of the Group is cash at banks. As at December 31, 2014 an increase or decrease in interest rates by 50 basis points with all other variables held constant would have resulted in a CHF 169,455 (2013: CHF 119,329) increase or decrease in the net result.
Capital risk management
The Company and its subsidiaries are subject to capital maintenance requirements under local law in the country in which it operates. To ensure that statutory capital requirements are met, the Company monitors capital, at the entity level, on an interim basis as well as annually. From time to time the Company may take appropriate measures or propose capital increases to ensure the necessary capital remains intact.
6. Segment information
Geographical information
The Group’s non-current assets by the Company’s country of domicile were as follows:
|
December 31,
2014
|
December 31,
2013
|
|||||||
|
Switzerland
|
1,750,708
|
1,678,435 | ||||||
|
Total
|
1,750,708
|
1,678,435 |
Non-current assets exclude financial instruments.
7. Property and Equipment
|
Production
equipment
|
Office
furniture
and EDP
|
Leasehold
improvements
|
Total
|
|||||||||||||
|
At cost
|
||||||||||||||||
|
As at January 1, 2013
|
123,330 | 83,661 | — | 206,991 | ||||||||||||
|
Additions
|
43,420 | 48,384 | 17,132 | 108,936 | ||||||||||||
|
As at December 31, 2013
|
166,750 | 132,045 | 17,132 | 315,927 | ||||||||||||
|
Additions
|
63,499 | 49,997 | — | 113,496 | ||||||||||||
|
As at December 31, 2014
|
230,249 | 182,042 | 17,132 | 429,423 | ||||||||||||
|
Accumulated depreciation
|
||||||||||||||||
|
As at January 1, 2013
|
-5,787 | -76,708 | — | -82,495 | ||||||||||||
|
Charge for the year
|
- 25,575 | - 9,580 | - 2,362 | - 37,517 | ||||||||||||
|
As at December 31, 2013
|
-31,362 | -86,288 | -2,362 | -120,012 | ||||||||||||
|
Charge for the year
|
- 42,230 | - 28,251 | - 3,503 |
-73,984
|
||||||||||||
|
As at December 31, 2014
|
-73,592 | -114,539 | -5,865 |
-193,996
|
||||||||||||
|
Net book value
|
||||||||||||||||
|
As at December 31, 2013
|
135,388 | 45,757 | 14,770 | 195,915 | ||||||||||||
|
As at December 31, 2014
|
156,657 | 67,502 | 11,267 |
235,427
|
||||||||||||
As at December 31, 2014, and 2013 no items of property and equipment were pledged.
8. Intangible assets
|
Licenses
|
||||
|
At cost
|
||||
|
As at January 1, 2013
|
357,520 | |||
|
Additions
|
1,125,000 | |||
|
As at December 31, 2013
|
1,482,520 | |||
|
As at December 31, 2014
|
1,482,520 | |||
|
Accumulated amortization and impairment losses
|
||||
|
As at December 31, 2013
|
— | |||
|
As at December 31, 2014
|
— | |||
|
Net book value
|
||||
|
As at December 31, 2013
|
1,482,520 | |||
|
As at December 31, 2014
|
1,482,520 | |||
Intangible assets comprise upfront and milestone payments related to licenses. In 2013 a milestone of CHF 1,125,000 related to the AM-111 program was recorded. Amortization will commence once the intangible assets are available for use, which will be the case after regulatory approvals are obtained and the related products are available for use.
No amortization or impairment was recorded in 2014, 2013 and 2012.
9. Other receivables
|
December 31,
2014
|
December 31,
2013
|
|||||||
|
Advance payments to suppliers
|
413,169 | 413,169 | ||||||
|
Value added tax receivable
|
74,065 | 47,714 | ||||||
|
Withholding tax receivable
|
17,118 | 25,866 | ||||||
|
Deposit for rent
|
38,066 | 38,037 | ||||||
|
Other
|
120 | — | ||||||
|
Total other receivables
|
542,538 | 524,786 | ||||||
Other receivables were not considered impaired in the years under review.
10. Prepayments
|
December 31,
2014
|
December 31,
2013
|
|||||||
|
Clinical projects and related activities
|
85,299 | 114,076 | ||||||
|
Insurance
|
179,871 | 4,323 | ||||||
|
Social charges
|
— | 22,450 | ||||||
|
Capital taxes
|
— | 32,910 | ||||||
|
Other
|
— | 9,378 | ||||||
|
Total prepayments
|
265,170 | 183,137 | ||||||
11. Cash and cash equivalents
|
December 31,
2014
|
December 31,
2013
|
|||||||
|
Cash in bank accounts
|
56,932,993 | 23,865,165 | ||||||
|
Petty cash
|
1,332 | 677 | ||||||
|
Total cash and cash equivalents
|
56,934,325 | 23,865,842 | ||||||
12. Capital and reserves
Share capital
Effective December 27, 2013, the nominal value of all shares was reduced from CHF 10.00 to CHF 0.40 each, by way of a 25:1 stock split. All shares are fully paid in.
All disclosed numbers and nominal value of shares in these financial statements are adjusted for the 25:1 stock split effected in December 2013 unless otherwise indicated.
The issued share capital of the Company at December 31 consisted of:
|
December 31, 2014
|
December 31, 2013
|
|||||||||||||||
|
Number
|
CHF
|
Number
|
CHF
|
|||||||||||||
|
Common shares with a nominal value of CHF 0.40 each
|
29,010,391 | 11,604,156 | 72,600 | 29,040 | ||||||||||||
|
Preferred shares Series A with a nominal value of CHF 0.40 each
|
— | — | 5,999,750 | 2,399,900 | ||||||||||||
|
Preferred shares Series B with a nominal value of CHF 0.40 each
|
— | — | 5,509,100 | 2,203,640 | ||||||||||||
|
Preferred shares Series C with a nominal value of CHF 0.40 each
|
— | — | 4,636,375 | 1,854,550 | ||||||||||||
|
Total
|
29,010,391 | 11,604,156 | 16,217,825 | 6,487,130 | ||||||||||||
|
Common Shares (Number)
|
Preferred Shares (Number)
|
|||||||||||||||
|
2014
|
2013
|
2014
|
2013
|
|||||||||||||
|
As of January 1
|
72,600 | 72,600 | 16,145,225 | 11,508,850 | ||||||||||||
|
Common share stock options with a nominal value of CHF 0.40 each
|
71,381 | — | — | — | ||||||||||||
|
Shares issued for cash
|
— | — | — | 4,636,375 | ||||||||||||
|
Preferred shares C issued for conversion of convertible loans with a nominal value of CHF 0.40 each
|
— | — | 2,607,950 | — | ||||||||||||
|
Common share issued for the IPO with a nominal value of CHF 0.40 each cash
|
10,113,235 | — | — | — | ||||||||||||
|
Common share issued with a nominal value of CHF 0.40 each resulting from conversion of preference shares at the IPO
|
18,753,175 | — | -18,753,175 | — | ||||||||||||
|
Total, as at December 31
|
29,010,391 | 72,600 | — | 16,145,225 | ||||||||||||
IPO on NASDAQ Global Market
In August, 2014, the Company completed its IPO issuing 10,113,235 shares, including the underwriter’s overallotment option, yielding total net proceeds of CHF 51.3 million (USD 56.4 million). Offering costs associated with the IPO were CHF 2,091,259. As of March 31, 2014, management determined that successful completion of the IPO was not deemed to be more likely than not, thus CHF 822,367 was expensed in the first quarter of 2014.
Following the IPO there were 28,954,510 common shares of the Company outstanding. At December 31 2014 there were 29,010,391 share outstanding due to exercise of options.
Pursuant to the agreements related to the preferred shares, all preferred shares outstanding at the time of the IPO converted automatically into common shares at the ratio of 1:1 upon consummation of the IPO.
Issuance of common shares upon exercise of options
In 2014, a total of 50,500 stock options were exercised under Stock Option Plan A at an exercise price of CHF 3.20 per common share with a nominal value of CHF 0.40. This resulted in an increase in the share capital of CHF 20,200. Total proceeds from the exercise to the Company were CHF 161,600.
Issuance of common shares with restrictions
In 2014, 20,881 restricted common shares with a nominal value of CHF 0.40 each were issued under Stock Option Plan B for the purpose of share based bonus payments. This resulted in a further increase in share capital of CHF 8,352 and proceeds to the Company of CHF 92,565. The shares will vest December 31, 2017.
Issuance of preferred shares
In April 2013, 4,636,375 preferred shares Series C with a nominal value of CHF 0.40 each were issued at CHF 5.28 per share.
In January 2014, a convertible loan was converted into 2,607,950 preferred shares Series C with a nominal value of CHF 0.40 at a conversion price of CHF 5.28 each. See Note 14.
Authorized share capital
Prior to the IPO, the Company’s authorized share capital consisted of common shares and preferred shares. Preferred shares (Series A, B, and C) had the same voting rights and dividend rights as common shares but enjoyed a liquidation preference.
In April 2013, the shareholders approved an extension and increase of the authorized capital of the Company. The Board was authorized to increase the share capital at any time until April 5, 2015, by the maximum amount of CHF 1,715,450 by issuing no more than 4,288,625 registered preferred shares Series C with a nominal value of CHF 0.40 each. These shares had to be fully paid-in and had the same preference rights as Series C shares.
In August 2014, the shareholders approved an extension and increase of the authorized capital of the Company. The Board is authorized to increase the share capital at any time until June 30, 2016 by the maximum amount of CHF 3,314,706 by issuing not more than 8,286,765 registered shares with a nominal value of CHF 0.40 each. The shares will have to be fully paid-in.
Conditional share capital
The share capital may be increased by the issuance of up to 1,500,000 fully paid registered Common Shares with a nominal value of CHF 0.40 per share and to the maximum amount of CHF 600,000 in execution of subscription rights, which may be granted to employees, members of the Board of Directors as well as key service providers (see Note 13 for further reference). As of December 31, 2014, 55,881 share options had been exercised to reduce the available share capital.
The Company’s share capital may be further increased by the issuance of up to 5,000,000 fully paid registered Common Shares with a nominal value of CHF 0.40 per share and to the maximum amount of CHF 2,000,000 in execution of conversion rights in connection with warrants and convertible bonds of the Company.
13. Share based compensation
Description
On November 21, 2008, one of the Company’s subsidiaries established share option programs (“Stock Option Plans A and B”) for employees, members of the Board of Directors as well as key service providers to purchase shares in the Company. Stock Option Plan A was amended and superseded by an updated version effective November 24, 2009, and replaced with amendments by Plan C for any future option grants effective April 5, 2013. Grants under Stock Option Plan A and subsequently under Stock Option Plan C were offered in each year with vesting periods of three and four years; grants under Plan B were made in 2008, 2009 and 2014 only. In 2014, the Group introduced a further stock option plan, the Equity Incentive Plan.
The Company granted 20,881 shares (2013 & 2012: 0) to employees under Stock Option Plan B in 2014. The options were exercised on the grant date. There were no Stock Option Plan B options outstanding as of December 31, 2014, or December 31, 2013. The exercise price for the 2014 awards was CHF 4.43 per share and resulted in a total payroll charge of CHF 92,565 (2013 & 2012: 0).These shares vested immediately and have sale restriction for a period of 3 years. The fair value of the shares was defined in the pre-IPO Phase based on DCF-valuation and historical shares transactions and discounted for the fact the shares cannot be sold during the restriction period of three years.
In accordance with all of these programs, holders of vested options are entitled to purchase common shares of the Company at an exercise price equal to the value per share at the most recent financing round or the publicly quoted market price of the Company shares at the day of grant. All options are to be settled by the physical delivery of shares. The key terms and conditions related to the grants under these programs are as follows:
| Plan |
Number of
instruments awarded (1)
|
Vesting conditions
|
Contractual
life of
options
|
||||
|
Stock option plan A
|
236,500 |
3 years’ service from grant date
|
5 years
|
||||
|
Stock
option plan B
|
93,231 |
Immediately
|
3 months
|
||||
|
Stock option plan C
|
173,750 |
4 years’ service from grant date
|
6 years
|
||||
|
Equity Incentive Plan
|
99,260 |
2 years’ service from grant date (50%),
3 years’ service from grant date (50%)
|
8 years
|
||||
|
(1)
|
Number of instruments adjusted for the increase in the number of issued shares resulting from the 25:1 stock split in December 2013.
|
Measurement of fair values
The fair value of the options was measured based on the Black-Scholes formula.
|
Stock Option Plan
|
|||||||
|
Equity Incentive Plan2014
|
Plan C 2014
(CHF)
|
Plan C 2013
(CHF)
|
Plan A 2013
(CHF)
|
||||
|
Fair value at grant date
|
USD 1.572 (2 years vesting); USD 1.902 (3 year vesting)
|
3.03
|
3.03
|
2.43
|
|||
|
Share price at grant date
|
USD 3.92
|
5.28
|
5.28
|
4.80
|
|||
|
Exercise price
|
USD 4.05
|
5.28
|
5.28
|
4.80
|
|||
|
Expected volatility
|
74%
|
74%
|
78%
|
78%
|
|||
|
Expected life
|
2 and 3 years
|
4 years
|
4 years
|
3 years
|
|||
|
Expected dividends
|
—
|
—
|
—
|
—
|
|||
|
Risk-free interest rate
|
2.22%
|
0.96%
|
1.0%
|
1.0%
|
|||
The Company has historically been a private company and only recently started trading publicly. Therefore the Company lacks significant Company-specific historical and implied volatility information. The Company estimates our expected volatility based on comparable public company data. The expected life of all options is assumed to correspond to the vesting period.
The total expense recognized for equity-settled share-based payment transactions were CHF 56,013 in 2012, CHF 110,198 in 2013 and CHF 270,747 in 2014.
The number and weighted average exercise prices (in CHF) of options under the share option programs for Plan A, Plan C and the Equity Incentive Plan are as follows:
|
2014
|
2013
|
2012
|
||||||||||||||||||||||||||||||||||
|
Number of
options
|
Weighted
average
exercise
price
|
Weighted
average
remaining term
|
Number of
options
|
Weighted
average
exercise
price
|
Weighted
average
remaining term
|
Number of
options
|
Weighted
average
exercise
price
|
Weighted
average
remaining term
|
||||||||||||||||||||||||||||
|
Outstanding at January 1
|
272,750 | 4.32 |
3.64
|
146,500 | 3.66 | 3.29 | 109,000 | 3.20 | 3.70 | |||||||||||||||||||||||||||
|
Forfeited during the year
|
— | — | — | — | — | — | -10,000 |
4.00
|
— | |||||||||||||||||||||||||||
|
Exercised during the year
|
50,500 | 3.20 | — | — | — | — | — | — | ||||||||||||||||||||||||||||
|
Granted during the year
|
196,760 | 4.64 | 6.71 | 126,250 | 5.09 | 5.24 | 47,500 | 4.80 | 4.77 | |||||||||||||||||||||||||||
|
Outstanding at December 31
|
419,010 | 4.61 | 4.86 | 272,750 | 4.32 | 3.64 | 146,500 | 3.66 | 3.29 | |||||||||||||||||||||||||||
|
Exercisable at December 31
|
146,000 | 4.21 | 2.33 | 69,000 | 3.20 | 1.12 | 38,000 | 3.20 | 1.60 | |||||||||||||||||||||||||||
The range of exercise prices for outstanding options was CHF 3.20 to CHF 5.28 as of December 31, 2014, CHF 3.20 to CHF 5.28 as of December 2013, and CHF 3.20 to CHF 4.80 as of December 2012.
14. Convertible loans
On December 9, 2013, the Company issued non-interest bearing convertible loans to two shareholders with a nominal value of CHF 13,769,976 and a maximum term of 12 months. Between January 10 and January 17, 2014, the lenders as well as the Company had the right to convert the loans into new registered preferred shares Series C with a nominal value of CHF 0.40 each for CHF 5.28 per share. In case of non-conversion, the Company had the
right to repay the convertible loans any time after February 1, 2014, and the obligation to repay by December 8, 2014.
The fair value of the convertible loans, recorded at initial recognition in “current liabilities,” was calculated using a market interest rate for an equivalent non-convertible loan (5% p.a.). The residual amount, representing the difference between the fair value and nominal value, was included in shareholders’ equity as a transaction with a shareholder in its capacity as shareholder. Subsequent to initial recognition, the convertible loan was measured at amortized cost using the effective interest method.
Convertible loan notes recognized in the December 31, 2013 statement of financial position were calculated as follows:
|
December 31,
2013
|
||||
|
Nominal value of the convertible loans
|
13,769,976 | |||
|
Difference to fair value, recognized in equity
|
-99,038 | |||
|
Fair value on initial recognition
|
13,670,938 | |||
|
Imputed interest expense
|
40,262 | |||
|
Convertible loans at December 31
|
13,711,200 | |||
On January 27, 2014, the loans were converted into new preferred shares Series C with a nominal value of CHF 0.40 each for CHF 5.28 per share. The Company issued 2,607,950 preferred shares Series C associated with this conversion.
On the conversion date of the loan, the liability was derecognized and CHF 1,043,180 was recognized as share capital and CHF 12,717,655 as share premium.
|
December 31,
2014
|
||||
|
Convertible loans balance at January 1, 2014
|
13,711,200 | |||
|
Loss on de-recognition
|
9,141 | |||
|
Imputed interest expense
|
49,635 | |||
|
De-recognition of liability at conversion into equity
|
13,769,976 | |||
|
Convertible loans at December 31
|
— |
15. Trade and other payables
|
December 31,
2014
|
December 31,
2013
|
|||||||
|
Trade accounts payable - third parties
|
3,141,194 | 946,215 | ||||||
|
Other
|
93,190 | 8,042 | ||||||
|
Total trade and other payables
|
3,234,384 | 954,257 | ||||||
16. Accrued expenses
|
December 31,
2014
|
December 31,
2013
|
|||||||
|
Accrued research and development costs including milestone payments
|
949,561 | 1,791,638 | ||||||
|
Professional fees
|
178,000 | 57,950 | ||||||
|
Accrued vacation & overtime
|
41,580 | 25,520 | ||||||
|
Board of Directors fees
|
32,056 | 9,836 | ||||||
|
Social security
|
— | 10,700 | ||||||
|
Other
|
3,371 | 1,474 | ||||||
|
Total accrued expenses
|
1,204,568 | 1,897,118 | ||||||
17. Research and development expense
|
2014
|
2013
|
2012
|
||||||||||
|
Pre-clinical projects
|
1,160,058 | 2,078,407 | 297,960 | |||||||||
|
Clinical projects
|
12,141,571 | 8,753,398 | 1,687,368 | |||||||||
|
Drug manufacturing and substance
|
1,383,581
|
1,036,152 | 915,368 | |||||||||
|
Employee benefits
|
1,718,212 | 1,074,398 | 770,124 | |||||||||
|
Lease expenses
|
68,082 | 74,065 | 35,556 | |||||||||
|
Patents and trademarks
|
665,023 | 100,702 | 53,473 | |||||||||
|
Regulatory projects
|
519,104 | 106,325 | 219,106 | |||||||||
|
Depreciation tangible assets
|
48,830
|
30,191 | 7,736 | |||||||||
|
Total research and development expense
|
17,704,461 | 13,253,638 | 3,986,691 | |||||||||
18. General and administrative expense
|
2014
|
2013
|
2012
|
||||||||||
|
Employee benefits
|
1,136,677 | 195,739 | 116,251 | |||||||||
|
Business development
|
237,720 | 479,027 | 86,231 | |||||||||
|
Travel expenses
|
169,602 | 77,616 | 9,551 | |||||||||
|
Administration costs
|
2,014,178
|
556,445 | 375,155 | |||||||||
|
IPO costs, expensed
|
822,367 | — | — | |||||||||
|
Lease expenses
|
35,072 | 3,968 | 2,340 | |||||||||
|
Depreciation tangible assets
|
25,153 | 7,326 | 1,506 | |||||||||
|
Capital tax expenses
|
48,281 | 42,090 | 32,778 | |||||||||
|
Total general and administrative expenses
|
4,489,051 | 1,362,211 | 623,812 | |||||||||
As of March 31, 2014, management determined that successful completion of the IPO was not deemed to be more likely than not thus CHF 822,367 was expensed in the first quarter of 2014.
19. Employee benefits
|
2014
|
2013
|
2012
|
||||||||||
|
Salaries
|
2,259,112 | 836,686 | 711,883 | |||||||||
|
Pension costs
|
118,755 | 78,917 | 50,046 | |||||||||
|
Other social benefits
|
131,939 | 71,878 | 39,921 | |||||||||
|
Share option costs
|
270,748 | 110,198 | 56,013 | |||||||||
|
Other
|
74,334 | 172,458 | 28,512 | |||||||||
|
Total employee benefits
|
2,854,888 | 1,270,137 | 886,375 | |||||||||
Benefit plans
The Company participates in a retirement plan (the “Plan”) organized through enrollment in an independent collective foundation, that covers all of its employees in Switzerland, including management. The collective foundation is governed by a foundation board. The board is made up of an equal number of employee and employer representatives of the different affiliated companies. The Company has no direct influence on the investment strategy of the collective foundation. Moreover, certain elements of the employee benefits are defined in the same way for all affiliated companies. This is mainly related to the annuity factors at retirement and to interest allocated on retirement savings. The employer itself cannot determine the benefits or how they are financed directly. The foundation board of the collective foundation is responsible for defining the investment strategy, for making changes to the pension fund regulations and in particular, also for defining the financing of the pension benefits.
The old age benefits are based on retirement savings for each employee, coupled with annual retirement credits and interest (there is no possibility to credit negative interest). At retirement age, the insured members can choose whether to take a pension for life, which includes a spouse’s pension, or a lump sum. In addition to retirement benefits, the plan benefits also include disability and death benefits. Insured members may also buy into the scheme to improve their pension provision up to the maximum amount permitted under the rules of the plan and may withdraw funds early for the purchase of a residential property for their own use subject to limitations under Swiss law. On leaving the Company, retirement savings are transferred to the pension institution of the new employer or to a vested benefits institution. This type of benefit may result in pension payments varying considerably between individual years. In defining the benefits, the minimum requirements of the Swiss Law on Occupational Retirement, Survivors and Disability Pension Plans (BVG) and its implementing provisions must be observed. The BVG defines the minimum pensionable salary and the minimum retirement credits. In Switzerland, the minimum interest rate applicable to these minimum retirement savings is set by the Swiss Federal Council at least once every two years. In 2013 the rate was 1.5% and in 2014 it was 1.75%.
The assets are invested by the collective foundation in a diversified portfolio that respects the requirements of the Swiss BVG. Under the Plan, both the Company and the employee share the costs equally. The structure of the plan and the legal provisions of the BVG mean that the employer is exposed to actuarial risks. The main risks are investment risk, interest risk, disability risk and the risk of longevity. Through the affiliation to a collective foundation, the Company has minimized these risks, since they are shared between a much greater number of participants.
The following tables present information about the net defined benefit liability and its components:
|
2014
|
2013
|
|||||||
|
Defined benefit obligation at January 1
|
1,626,241 | 1,030,145 | ||||||
|
Service cost
|
111,513 | 72,803 | ||||||
|
Plan participants’ contribution
|
137,966 | 50,937 | ||||||
|
Interest cost
|
52,097 | 23,133 | ||||||
|
Actuarial losses
|
1,484,222 | 136,933 | ||||||
|
Benefits paid
|
-539,920 | -107,303 | ||||||
|
Transfer-in amounts of new employees
|
2,023,548 | 419,593 | ||||||
|
Defined benefit obligation at December 31
|
4,895,667 | 1,626,241 | ||||||
The
defined benefit obligation includes only liabilities for active employees. The weighted average modified duration of the defined benefit obligation at December 31, 2014 is 22.6 years (2013: 19.9 years).
Change in fair value of plan assets
|
2014
|
2013
|
|||||||
|
Fair value of plan assets at January 1
|
1,297,899 | 787,499 | ||||||
|
Interest income
|
47,909 | 19,394 | ||||||
|
Return on plan assets excluding interest income
|
382,755 | 79,217 | ||||||
|
Employer contributions
|
137,966 | 50,937 | ||||||
|
Plan participants’ contributions
|
137,966 | 50,937 | ||||||
|
Benefits paid
|
-539,920 | -107,303 | ||||||
|
Transfer-in amounts of new employees
|
2,023,548 | 419,593 | ||||||
|
Administration expense
|
-3,054 | -2,375 | ||||||
|
Fair value of plan assets at December 31
|
3,485,069 | 1,297,899 | ||||||
Net defined benefit liability recognized in the statement of financial position
|
December 31,
2014
|
December 31,
2013
|
|||||||
|
Present value of funded defined benefit obligation
|
4,895,667 | 1,626,241 | ||||||
|
Fair value of plan assets
|
-3,485,069 | -1,297,899 | ||||||
|
Net defined benefit liability
|
1,410,598 | 328,342 | ||||||
Defined Benefit Cost
|
2014
|
2013
|
2012
|
||||||||||
|
Service cost
|
111,513 | 72,803 | 45,036 | |||||||||
|
Net interest expense
|
4,188 | 3,739 | 3,313 | |||||||||
|
Administration expense
|
3,054 | 2,375 | 1,697 | |||||||||
|
Total defined benefit cost for the year recognized in profit or loss
|
118,755 | 78,917 | 50,046 | |||||||||
Remeasurement of the Defined Benefit Liability
|
2014
|
2013
|
2012
|
||||||||||
|
Actuarial loss (gain) arising from changes in financial assumptions
|
699,456 | -44,737 | 49,754 | |||||||||
|
Actuarial loss arising from experience adjustments
|
784,766 | 181,670 | 57,684 | |||||||||
|
Return on plan assets excluding interest income
|
-382,755 | -79,217 | -52,861 | |||||||||
|
Total defined benefit cost for the year recognized in other comprehensive loss
|
1,101,467 | 57,716 | 54,577 | |||||||||
In 2015, the Group anticipates to contribute CHF 164,040 to the Plan.
Assumptions
|
At December 31
|
2014
|
2013
|
2012
|
|||||||||
|
Discount rate
|
1.20 | % | 2.20 | % | 1.95 | % | ||||||
|
Future salary increase
|
1.50 | % | 1.50 | % | 1.50 | % | ||||||
|
Pension indexation
|
0.00 | % | 0.00 | % | 0.00 | % | ||||||
|
Mortality and disability rates
|
BVG 2010G
|
BVG 2010G
|
BVG 2010G
|
|||||||||
Sensitivity analysis
Reasonably possible changes at the reporting date to one of the relevant actuarial assumptions, holding other assumptions constant, would have affected the defined benefit obligation by the amounts shown below.
|
December 31, 2014
|
||||||||
|
Change in assumption
|
0.25% increase
|
0.25% decrease
|
||||||
|
Discount rate
|
-228,394 | 249,899 | ||||||
|
Salary increase
|
29,192 | -33,212 | ||||||
|
Pension indexation
|
135,368 | N/A | ||||||
|
Change in assumption
|
+1 year
|
-1
year
|
||||||
|
Life expectancy
|
99,859 | -101,889 | ||||||
20. Finance income and finance expense
|
2014
|
2013
|
2012
|
||||||||||
|
Interest income
|
52,133 | 74,036 | 5,825 | |||||||||
|
Investment income
|
— | — | 1,216 | |||||||||
|
Net foreign exchange gain
|
4,164,189 | 1,711 | 2,853 | |||||||||
|
Total finance income
|
4,216,322 | 75,747 | 9,894 | |||||||||
|
Interest expense related parties
|
49,635 | 50,177 | — | |||||||||
|
Bank charges
|
6,175 | 2,454 | 1,800 | |||||||||
|
Net foreign exchange loss
|
152,015 | 106,010 | — | |||||||||
|
Total finance expense
|
207,825 | 158,641 | 1,800 | |||||||||
|
Finance income/(expense), net
|
4,008,497 | -82,894 | 8,094 | |||||||||
Interest expense on convertible loans of CHF 49,635 (2013: CHF 40,262; 2012: 0) was not cash relevant. In 2014, net foreign exchange gains contains gains of CHF 3,961,731 which arose on the Company’s cash and cash equivalents, which are held in USD.
21. Taxation
The Group’s income tax expense recognized in the consolidated statement of profit or loss and other comprehensive loss was as follows:
|
2014
|
2013
|
|||||||
|
Deferred income tax expense
|
-32,761 | -305,750 | ||||||
|
Deferred income tax gain
|
32,761 | — | ||||||
|
Total income tax expense
|
— | -305,750 | ||||||
The Group’s effective income tax expense differed from the expected theoretical amount computed by applying the Group’s applicable statutory tax rates of 23.0% (2013: 23.7%; 2012: 23.3%) as summarized in the following table:
|
Reconciliation
|
2014
|
2013
|
2012
|
|||||||||
|
Loss before income tax
|
-18,185,015 | -14,698,743 | -4,602,409 | |||||||||
|
Income tax at statutory tax rates applicable to results in the respective countries
|
4,177,780 | 3,488,916 | 1,071,976 | |||||||||
|
Effect of unrecognized temporary differences
|
-273,073 | 1,343,556 | 823,403 | |||||||||
|
Effect of unrecognized taxable losses
|
-4,160,118 | -5,160,108 | -1,895,379 | |||||||||
|
Effect of unrecognized taxable losses in equity
|
-99,406 | — | ||||||||||
|
Effect on unrecognized deferred tax due to change in income tax rate
|
156,005 | — | — | |||||||||
|
Deferred tax recognized directly in equity
|
— | 21,886 | — | |||||||||
|
Income tax expense
|
— | -305,750 | — | |||||||||
The tax effect of taxable temporary differences that give rise to deferred income tax liabilities or to deferred income tax assets as at December 31 is presented below:
|
Deferred Tax Liabilities
|
December 31,
2014
|
December 31,
2013
|
||||||
|
Intangible assets
|
-327,637 | -327,637 | ||||||
|
Provisions
|
-32,761 | — | ||||||
|
Total
|
-360,398 | -327,637 | ||||||
|
Deferred Tax Asset
|
||||||||
|
Net operating loss (NOL)
|
32,761 | — | ||||||
|
Total
|
32,761 | — | ||||||
|
Deferred Tax, net
|
-327,637 | -327,637 | ||||||
|
Deferred Tax 2014
|
Opening Balance
|
Recognized in Profit or Loss
|
Recognized in Equity
|
Closing Balance
|
||||||||||||
|
Intangible assets
|
-327,637 | — | — | -327,637 | ||||||||||||
|
Provisions
|
— | -32,761 | — | -32,761 | ||||||||||||
|
Net operating loss (NOL)
|
— | 32,761 | 32,761 | |||||||||||||
|
Total
|
-327,637 | — | — | -327,637 | ||||||||||||
|
Deferred Tax 2013
|
Opening Balance
|
Recognized in Profit or Loss
|
Recognized in Equity
|
Closing Balance
|
||||||||||||
|
Intangible assets/
Convertible loan
|
— | -305,751 | -21,886 | -327,637 | ||||||||||||
|
Total
|
— |
-305,751
|
-21,886 | -327,637 | ||||||||||||
As of December 31, 2014, the Group had total gross tax loss carry forwards amounting to CHF 58.6 million (2013: 38.9 million), of which CHF 57.5 million related to Auris Medical AG and Otolanum AG in Switzerland and CHF 1.1 million (2013: CHF 0.9 million) to Auris Medical Inc. in the United States.
The Group’s tax loss carry-forwards with their expiry dates are as follows:
|
December 31,
2014
|
December 31,
2013
|
December 31,
2012
|
||||||||||
|
Within 1 year
|
2,068,441 | 18,568 | 32,654 | |||||||||
|
Between 1 and 3 years
|
3,456,587 | 3,755,427 | 2,087,009 | |||||||||
|
Between 3 and 7 years
|
51,963,606 | 34,194,937 | 13,474,978 | |||||||||
|
More than 7 years
|
1,056,556 | 938,560 | 785,439 | |||||||||
|
Total
|
58,635,190 | 38,907,492 | 16,380,080 | |||||||||
The tax effect of the major unrecognized temporary differences and loss carry-forwards is presented in the table below:
|
December 31,
2014
|
December 31,
2013
|
|||||||
|
Deductible temporary differences
|
||||||||
|
Employee benefit plan
|
311,742 | 75,174 | ||||||
|
Stock option plans
|
114,145 | 56,262 | ||||||
|
Accrued expenses
|
— | 26,097 | ||||||
|
Total potential tax assets
|
425,887 | 157,533 | ||||||
|
Taxable unrecognized temporary differences
|
||||||||
|
Property and equipment
|
— | 4,719 | ||||||
|
Total unrecognized potential tax liabilities
|
— | 4,719 | ||||||
|
Offsetting potential tax liabilities with potential tax assets
|
— | 4,719 | ||||||
|
Net potential tax assets from temporary differences not recognized
|
425,887 | 152,814 | ||||||
|
Potential tax assets from loss carry-forwards not recognized
|
13,067,988 | 8,907,870 | ||||||
|
Total potential tax assets from loss carry-forwards and temporary differences not recognized
|
13,493,874 | 9,060,684 | ||||||
22. Loss per share
|
December 31,
2014
|
December 31,
2013
|
|||||||
|
Loss attributable to owners of the Company
|
-18,185,015 | -15,004,493 | ||||||
|
Weighted average number of shares outstanding
|
27,692,494 | 14,917,064 | ||||||
|
Basic and diluted loss per share
|
-0.66 | -1.01 | ||||||
For the years ended December 31, 2014, 2013 and 2012 basic and diluted loss per share is based on the weighted average number of shares issued and outstanding and excludes shares to be issued under the Stock Option Plans (Note 13) and conversion rights related to the convertible loans (Note 14) as they would be anti-dilutive.
23. Commitments and contingencies
Operating lease commitments
On April 1, 2013, the Group entered into a lease for office space under an operating lease agreement with a cancelation option at the Company’s discretion in March 2016. The lease agreement expires in March 31, 2018 with an option to extend it for a further 5 years.
The future minimum lease payments under non-cancellable operating leases that are not accounted for in the statement of financial position were as follows:
|
December 31,
2014
|
December 31,
2013
|
|||||||
|
Within one year
|
103,572 | 91,572 | ||||||
|
Between one and five years
|
58,893 | 122,096 | ||||||
|
Total
|
162,465 | 213,668 | ||||||
Office lease expense of CHF 99,072 were booked in 2014 and of CHF 78,033 and CHF 37,896 in 2013 and 2012, respectively, in the consolidated statement of profit or loss and other comprehensive loss.
24. Related party transactions
For purposes of these consolidated financial statements, parties are considered to be related if one party has the ability to control the other party or exercise significant influence over the other party in making financial or operational decisions. Also, parties under common control of the Group are considered to be related. Key management personnel are also related parties. In considering each possible related party relationship, attention is directed to the substance of the relationship, and not merely the legal form.
Compensation of the members of the Board of Directors and Management
In 2014 total compensation paid to directors and management was CHF 1,008,817 (2013: CHF 418,332, 2012: 287,320).
The fees paid to members of the Board of Directors in 2014 for their activities as board members totaled CHF 81,567 (2013: recorded CHF 10,500; 2012: 8,750).
Up to the Company’s IPO, non-executive directors received part or all of their remuneration in stock options; travel and out of pocket expenses were reimbursed in cash by the Group. Executive directors and directors delegated and remunerated by a shareholder for its representation on the Board were not entitled to any specific remuneration for their Board membership and work. Following the IPO, the Board’s remuneration policy was modified in that all non-executive directors received remuneration for their work as members of the Board as well as of the newly constituted Compensation Committee and Audit Committee.
The Chief Executive Officer was compensated in 2013 by means of a management agreement between Auris Medical AG and Altamira Pharma GmbH, a company fully owned by the CEO. During 2013, the Group paid CHF 248,000 (2012: 247,200), for the management services rendered.
In 2014, CHF 210,554 (2013: CHF 74,145; 2012: 31,370) was expensed for grants of stock options to Members of the Board of Directors and management. Contributions to post employment schemes amounted to CHF 63,386 and CHF 6,836 during the years 2014 and 2013. No termination benefits or other long term benefits were paid.
Members of the Board of Directors and management held 287,510, 187,500 and 87,500 stock options as of December 31, 2014, 2013 and 2012, respectively.
In January 2013 Auris Medical AG obtained bridge financing from Altamira Pharma GmbH through unsecured revolving credit facilities of up to CHF 1,400,000 and up to EUR 300,000 at an interest rate of 5% p.a. The bridge financing was repaid by the Company on April 10, 2013. Interest of CHF 6,386 and EUR 2,847 was paid in 2013 under the agreements to the lender.
Liabilities to related parties
|
December 31,
2014
|
December 31,
2013
|
|||||||
|
Convertible loans from shareholders
|
— | 13,711,200 | ||||||
|
Trade and other payables
|
— | 22 | ||||||
|
Total liabilities to related parties
|
— | 13,711,222 | ||||||
The convertible loans from shareholders with a nominal value of CHF 13,769,976 were subordinated to any other indebtedness of the Company; they bore no interest (see Note 14).
|
2014
|
2013
|
|||||||
|
Interest expense related parties
|
-49,635 | -50,177 | ||||||
|
Net interest expense—related parties
|
-49,635 | -50,177 | ||||||
In 2014 and 2013, interest expense to related parties includes the calculated effective interest on the convertible loans from shareholders. In 2013, interest expense also includes the interest on a bridge loan from a related party.
There were no significant subsequent events after the date of the statement of financial position.
No events that would require adjustments to or disclosure in the consolidated financial statements occurred between the date of the statement of financial position and the date the consolidated financial statements were approved by the Board of Directors of the Company.
F-35
TABLE OF CONTENTS
Part IItem 1. Identity Of Directors, Senior Management and AdvisersItem 2. Offer Statistics and Expected TimetableItem 3. Key InformationItem 4. Information on The CompanyItem 4A. Unresolved Staff CommentsItem 5. Operating and Financial Review and ProspectsItem 6. Directors, Senior Management and EmployeesItem 7. Major Shareholders and Related Party TransactionsItem 8. Financial InformationItem 9. The Offer and ListingItem 10. Additional InformationItem 11. Quantitative and Qualitative Disclosures About Market RiskItem 12. Description Of Securities Other Than Equity SecuritiesPart IIItem 13. Defaults, Dividend Arrearages and DelinquenciesItem 14. Material Modifications To The Rights Of Security Holders and Use Of ProceedsItem 15. Controls and ProceduresItem 16. [reserved]Item 16A. Audit Committee Financial ExpertItem 16B. Code Of EthicsItem 16C. Principal Accountant Fees and ServicesItem 16D. Exemptions From The Listing Standards For Audit CommitteesItem 16E. Purchases Of Equity Securities By The Issuer and Affiliated PurchasersItem 16F. Change in Registrant S Certifying AccountantItem 16G. Corporate GovernanceItem 16H. Mine Safety DisclosurePart IIIItem 17. Financial StatementsItem 18. Financial StatementsItem 19. Exhibits