CITIZENS & NORTHERN CORP
10-Ks and 10-Qs
|
|
|
|
|
|
|
|
|
|
|
|
|
|
|
|
|
|
|
|
|
|
|
|
|
|
|
|
|
|
|
|
|
|
|
|
|
|
|
|
|
|
|
|
|
|
|
|
|
|
|
|
|
|
|
|
UNITED STATES
SECURITIES AND EXCHANGE COMMISSION
Washington, D.C. 20549
FORM 10-K
(Mark One)
x
ANNUAL REPORT PURSUANT TO SECTION 13 OR 15(d) OF THE SECURITIES EXCHANGE ACT OF 1934
For the fiscal year ended
December 31, 2010
OR
¨
TRANSITION REPORT PURSUANT TO SECTION 13 OR 15(d) OF THE SECURITIES EXCHANGE ACT OF 1934
For the transition period from _______________ to _________________________.
Commission file number: 0-16084
CITIZENS & NORTHERN CORPORATION
(Exact name of Registrant as specified in its charter)
|
PENNSYLVANIA
|
23-2451943
|
|
(State or other jurisdiction of
|
(I.R.S. Employer
|
|
incorporation or organization)
|
Identification No.)
|
90-92 MAIN STREET, WELLSBORO, PA 16901
(Address of principal executive offices) (Zip code)
570-724-3411
(Registrant's telephone number including area code)
Securities registered pursuant to Section 12(b) of the Act:
|
Title of Each Class
|
Name of Exchange Where Registered
|
|
|
Common Stock Par Value $1.00
|
The NASDAQ Stock Market LLC
|
Securities registered pursuant to section 12(g) of the Act:
None
Indicate by check mark whether the registrant is a well-known seasoned issuer, as defined in Rule 405 of the Securities Act. Yes
¨
No
x
Indicate by check mark if the registrant is not required to file reports pursuant to Section 13 or Section 15(d) of the Act. Yes
¨
No
x
Indicate by check mark whether the registrant (1) has filed all reports required to be filed by Section 13 or 15(d) of the Securities Exchange Act of 1934 during the preceding 12 months (or for such shorter period that the registrant was required to file such reports), and (2) has been subject to such filing requirements for the past 90 days. Yes
x
No
¨
Indicate by check mark whether the registrant has submitted electronically and posted on its corporate Web site, if any, every Interactive Data File required to be submitted and posted pursuant to Rule 405 of Regulation S-T (Section 232.405 of this chapter) during the preceding 12 months (or for such shorter period that the registrant was required to submit and post such files). Yes
¨
No
¨
Indicate by check mark if disclosure of delinquent filers pursuant to Item 405 of Regulation S-K is not contained herein, and will not be contained, to the best of registrant's knowledge, in definitive proxy or information statements incorporated by reference in Part III of this Form 10-K or any amendment to this Form 10-K.
¨
Indicate by check mark whether the registrant is a large accelerated filer, an accelerated filer, a non-accelerated filer, or a smaller reporting company. See definitions of “large accelerated filer,” “accelerated filer “and “smaller reporting company” in Rule 12b-2 of the Exchange Act.
(Check one:) Large accelerated filer
¨
Accelerated filer
x
Non-accelerated filer
¨
Smaller reporting company
¨
Indicate by check mark whether the registrant is a shell company (as defined in Rule 12b-2 of the Exchange Act).
Yes
¨
No
x
The aggregate market value of the registrant's common stock held by non-affiliates at June 30, 2010, the registrant’s most recently completed second fiscal quarter, was $127,336,891.
The number of shares of common stock outstanding at February 25, 2011 was 12,181,184.
DOCUMENTS INCORPORATED BY REFERENCE
Portions of the registrant’s proxy statement for the annual meeting of its shareholders to be held April 19, 2011 are incorporated by reference into Parts III and IV of this report.
Citizens & Northern Corporation (“Corporation”) is a holding company whose principal activity is community banking. The Corporation’s principal office is located in Wellsboro, Pennsylvania. The largest subsidiary is Citizens & Northern Bank (“C&N Bank” or the “Bank”). In 2005, the Corporation acquired Canisteo Valley Corporation and its subsidiary, First State Bank, a New York State chartered commercial bank with offices in Canisteo and South Hornell, NY. Management considers the New York State branches, which are located in the southern tier of New York State in close proximity to some of the Pennsylvania branches, to be part
of the same community banking operating segment as the Pennsylvania locations. Effective September 1, 2010, the First State Bank operations were merged into C&N Bank, and later in September 2010, Canisteo Valley Corporation was merged into the Corporation. The Corporation’s other wholly-owned subsidiaries are Citizens & Northern Investment Corporation and Bucktail Life Insurance Company (“Bucktail”). Citizens & Northern Investment Corporation was formed in 1999 to engage in investment activities. Bucktail reinsures credit and mortgage life and accident and health insurance on behalf of C&N Bank.
C&N Bank is a Pennsylvania banking institution that was formed by the consolidation of Northern National Bank of Wellsboro and Citizens National Bank of Towanda on October 1, 1971. Subsequent mergers included: First National Bank of Ralston in May 1972; Sullivan County National Bank in October 1977; Farmers National Bank of Athens in January 1984; and First National Bank of East Smithfield in May 1990. On May 1, 2007, the Corporation acquired Citizens Bancorp, Inc. (“Citizens”), with banking offices in Coudersport, Emporium and Port Allegany, Pennsylvania. Citizens Trust Company, the banking subsidiary of Citizens, was merged with and into C&N Bank as part of the
transaction. C&N Bank has held its current name since May 6, 1975, at which time C&N Bank changed its charter from a national bank to a Pennsylvania bank.
C&N Bank provides an extensive range of banking services, including deposit and loan products for personal and commercial customers. The Bank also maintains a trust division that provides a wide range of financial services, such as 401(k) plans, retirement planning, estate planning, estate settlements and asset management. In January 2000, C&N Bank formed a subsidiary, C&N Financial Services Corporation (“C&NFSC”). C&NFSC is a licensed insurance agency that provides insurance products to individuals and businesses. In 2001, C&NFSC added a broker-dealer division, which offers mutual funds, annuities, educational savings accounts and other
investment products through registered agents. C&NFSC’s operations are not significant in relation to the total operations of the Corporation.
All phases of the Bank’s business are competitive. The Bank primarily competes in Tioga, Bradford, Sullivan, Lycoming, Potter, Cameron and McKean counties in Pennsylvania, and Steuben and Allegany counties in New York. The Bank competes with local commercial banks headquartered in our market area as well as other commercial banks with branches in our market area. Some of the banks that have branches in our market area are larger in overall size. With respect to lending activities and attracting deposits, the Bank also competes with savings banks, savings and loan associations, insurance companies, regulated small loan companies and credit unions. Also, the Bank competes with
mutual funds for deposits. C&N Bank competes with insurance companies, investment counseling firms, mutual funds and other business firms and individuals for trust, investment management, brokerage and insurance services. The Bank is generally competitive with all financial institutions in our service area with respect to interest rates paid on time and savings deposits, service charges on deposit accounts and interest rates charged on loans. The Bank serves a diverse customer base, and is not economically dependent on any small group of customers or on any individual industry.
Major initiatives within the last 5 years included the following:
|
·
|
constructed and opened a branch facility in Old Lycoming Township, PA, which opened in March 2006;
|
|
·
|
constructed an administration building in Wellsboro, PA, which opened in March 2006;
|
|
·
|
as described above, in May 2007, acquired Citizens Bancorp, Inc.;
|
|
·
|
implemented an overdraft privilege program in 2008;
|
|
·
|
underwent an operational process review in 2008, resulting in identification of opportunities for increases in revenue and decreases in expenses, including a net reduction in work force of 15.9%, to 297 full-time equivalent employees at December 31, 2008 from 353 at December 31, 2007;
|
2
|
·
|
in 2009, raised capital of $26.440 million by issuing preferred stock and a warrant to sell 194,794 shares of common stock to the U.S. Department of the Treasury under the Troubled Asset Relief Program (“TARP”) Capital Purchase Program;
|
|
·
|
in 2009, issued common stock, which raised a total of $24.585 million of capital, net of offering costs;
|
|
·
|
repurchased in 2010 all of the preferred stock and redeemed the warrant from the TARP Capital Purchase Program; and
|
|
·
|
merged the operations of First State Bank into C&N Bank and Canisteo Valley Corporation into Citizens & Northern Corporation in 2010.
|
At December 31, 2010, C&N Bank had total assets of $1,306,012,000, total deposits of $1,005,244,000, net loans outstanding of $721,304,000 and 281 full-time equivalent employees.
Most activities of the Corporation and its subsidiaries are regulated by federal or state agencies. The primary regulatory relationships are described as follows:
|
·
|
The Corporation is a bank holding company formed under the provisions of Section 3 of the Federal Reserve Act. The Corporation is under the direct supervision of the Federal Reserve and must comply with the reporting requirements of the Federal Bank Holding Company Act.
|
|
·
|
C&N Bank is a state-chartered, nonmember bank, supervised by the Federal Deposit Insurance Corporation and the Pennsylvania Department of Banking.
|
|
·
|
C&NFSC is a Pennsylvania corporation. The Pennsylvania Department of Insurance regulates C&NFSC’s insurance activities. Brokerage products are offered through a third party networking agreement between C&N Bank and UVEST Financial Services, Inc.
|
|
·
|
Bucktail is incorporated in the state of Arizona and supervised by the Arizona Department of Insurance.
|
A copy of the Corporation’s annual report on Form 10-K, quarterly reports on Form 10-Q, current events reports on Form 8-K, and amendments to these reports, will be furnished without charge upon written request to the Corporation’s Treasurer at P.O. Box 58, Wellsboro, PA 16901. Copies of these reports will be furnished as soon as reasonably possible, after they are filed electronically with the Securities and Exchange Commission. The information is also available through the Corporation’s web site at www.cnbankpa.com.
The Corporation is subject to the many risks and uncertainties applicable to all banking companies, as well as risks specific to the Corporation’s geographic locations. Although the Corporation seeks to effectively manage risks, and maintains a level of equity that exceeds the banking regulatory agencies’ thresholds for being considered “well capitalized” (see Note 18 to the consolidated financial statements), management cannot predict the future and cannot eliminate the possibility of credit, operational or other losses. Accordingly, actual results may differ materially from management's expectations. Some of the Corporation’s significant risks and uncertainties
are discussed below.
Credit Risk from Lending Activities -
A significant source of risk is the possibility that losses will be sustained because borrowers, guarantors and related parties may fail to perform in accordance with the terms of their loan agreements. Most of the Corporation’s loans are secured, but some loans are unsecured. With respect to secured loans, the collateral securing the repayment of these loans may be insufficient to cover the obligations owed under such loans. Collateral values may be adversely affected by changes in economic, environmental and other conditions, including declines in the value of real estate, changes in interest rates,
changes in monetary and fiscal policies of the federal government, wide-spread disease, terrorist activity, environmental contamination and other external events. In addition, collateral appraisals that are out of date or that do not meet industry recognized standards may create the impression that a loan is adequately collateralized when it is not. The Corporation has adopted underwriting and credit monitoring procedures and policies, including regular reviews of appraisals and borrower financial statements, that management believes are appropriate to mitigate the risk of loss. Also, as discussed further in the “Provision and Allowance for Loan Losses” section of Management’s Discussion and Analysis, the Corporation attempts to estimate the amount of losses that may be inherent in the portfolio through a quarterly evaluation process that includes several
members of management and that addresses specifically identified problem loans, as well as other quantitative data and qualitative factors. Such risk management and accounting policies and procedures, however, may not prevent unexpected losses that could have a material adverse effect on the Corporation’s financial condition, results of operations or liquidity.
3
Interest Rate Risk -
Business risk arising from changes in interest rates is an inherent factor in operating a banking organization. The Corporation’s assets are predominantly long-term, fixed rate loans and debt securities. Funding for these assets comes principally from shorter-term deposits and borrowed funds. Accordingly, there is an inherent risk of lower future earnings or decline in fair value of the Corporation’s financial instruments when interest rates change. Significant fluctuations in interest rates could have a material adverse effect on the Corporation’s financial condition, results of
operations or liquidity. For additional information regarding interest rate risk, see Part II, Item 7A, "Quantitative and Qualitative Disclosures About Market Risk."
Mortgage Banking
– In September 2009, the Corporation entered into an agreement to originate and sell residential mortgage loans to the secondary market through the MPF Xtra program administered by the Federal Home Loan Banks of Pittsburgh and Chicago. The Corporation’s mortgage sales activity under this program was not significant in 2009, but increased in 2010. At December 31, 2010, total residential mortgages serviced amounted to $25,716,000. The Corporation must strictly adhere to the MPF Xtra program guidelines for origination, underwriting and servicing loans, and failure to do so could result in the
Corporation being forced to repurchase loans or being dropped from the program. If such a forced repurchase of loans were to occur, or if the Corporation were to be dropped from the program, it could have a material adverse effect on the Corporation’s financial condition, results of operations or liquidity.
Equity Securities Risk
- The Corporation’s equity securities portfolio consists of investments in stocks of banks and bank holding companies. Investments in bank stocks are subject to the risk factors affecting the banking industry, and that could cause a general market decline in the value of bank stocks. Also, losses could occur in individual stocks held by the Corporation because of specific circumstances related to each bank. These factors could have a material adverse effect on the Corporation’s financial condition, results of operations or liquidity. For additional information regarding equity
securities risk, including management’s assessment of equity securities for other-than-temporary impairment as of December 31, 2010, see Part II, Item 7A, "Quantitative and Qualitative Disclosures About Market Risk."
Realization of Deferred Tax Asset –
The Corporation recognizes deferred tax assets and liabilities based on differences between the financial statement carrying amounts and the tax bases of assets and liabilities. At December 31, 2010, the net deferred tax asset was $16.1 million, down from a balance of approximately $22.0 million at December 31, 2009. The decrease in the net deferred tax asset was primarily attributed to a reduction in the net deferred tax asset as of December 31, 2010 related to other-than-temporary impairment losses on securities to $5.8 million at December 31, 2010 from $16.1 million at December 31, 2009. In addition, the deferred
tax asset as of December 31, 2010 includes $2.8 million of net operating loss carryforwards available after the carryback of both ordinary and capital losses. The Corporation currently expects to fully realize all available tax benefits from the carryforward losses, and therefore has eliminated the valuation allowance of $373,000 previously established at December 31, 2009.
The Corporation regularly reviews deferred tax assets for recoverability based on history of earnings, expectations for future earnings and expected timing of reversals of temporary differences. Realization of deferred tax assets ultimately depends on the existence of sufficient taxable income, including taxable income in prior carryback years, as well as future taxable income. Based on current conditions, management believes the recorded net deferred tax asset at December 31, 2010 is fully realizable, including amounts classified as capital losses from securities. However, if management determines the Corporation will be unable to realize all or part of the net deferred tax asset, the Corporation would adjust the
deferred tax asset, which would negatively impact earnings.
4
Federal Home Loan Bank of Pittsburgh Common Stock -
We own common stock of the Federal Home Loan Bank of Pittsburgh, or the FHLB, in order to qualify for membership in the Federal Home Loan Bank system, which enables us to borrow funds under the Federal Home Loan Bank advance program. The carrying value and fair market value of our FHLB common stock, which is included in Other Assets in the consolidated balance sheet, was $8.2 million as of December 31, 2010. Published reports indicate that certain member banks of the Federal Home Loan Bank system may be subject to asset quality risks that could result in materially lower regulatory capital levels.
In December 2008, the FHLB had notified its member banks that it had suspended dividend payments and the repurchase of capital stock until further notice is provided. In an extreme situation, it is possible that the capitalization of a Federal Home Loan Bank, including the FHLB, could be substantially diminished or reduced to zero. Consequently, given that there is no market for our FHLB common stock, we believe that there is a risk that our investment could be deemed other-than-temporarily impaired at some time in the future. If this occurs, it may adversely affect our results of operations and financial condition. If the FHLB were to cease operations, or if we were required to write-off our investment in the FHLB, our business, financial condition, liquidity, capital and results of operations may be materially adversely affected.
FDIC Insurance Assessments -
In 2008 and 2009, higher levels of bank failures dramatically increased the resolution costs of the Federal Deposit Insurance Corporation, or the FDIC, and depleted the deposit insurance fund. In addition, the FDIC and the U.S. Congress have taken action to increase federal deposit insurance coverage, placing additional stress on the deposit insurance fund. In order to maintain a strong funding position and restore reserve ratios of the deposit insurance fund, the FDIC increased assessment rates of insured institutions uniformly by seven cents for every $100 of deposits beginning with the first quarter of 2009, with
additional changes beginning April 1, 2009, which require riskier institutions to pay a larger share of premiums by factoring in rate adjustments based on secured liabilities and unsecured debt levels. To further support the rebuilding of the deposit insurance fund, the FDIC imposed a special assessment on each insured institution, equal to five basis points of the institution’s total assets minus Tier 1 capital as of September 30, 2009. For our banks, an aggregate charge of $589,000 was recorded as a charge to operating costs in 2009. The FDIC has indicated that future special assessments are possible, although it has not determined the magnitude or timing of any future assessments. In December 2009, we paid a pre-payment of the FDIC’s estimated assessment total for the next three years, totaling approximately $5.5 million. The
pre-payment amount has been included in Other Assets in the consolidated balance sheet, with approximately one-third amortized in 2010 and the remaining two-thirds to be amortized, subject to adjustments imposed by the FDIC, over the next two years.
We are generally unable to control the amount of premiums that we are required to pay for FDIC insurance. If additional bank or financial institution failures occur, we may be required to pay even higher FDIC premiums. Our expenses, especially for 2009, have been significantly and adversely affected by the increased premiums and the special assessment. These increases and assessment and any future increases in insurance premiums or additional special assessments may materially adversely affect our results of operations.
Breach of Information Security and Technology Dependence -
The Corporation relies on software, communication, and information exchange on a variety of computing platforms and networks and over the Internet. Despite numerous safeguards, the Corporation cannot be certain that all of its systems are entirely free from vulnerability to attack or other technological difficulties or failures. The Corporation relies on the services of a variety of vendors to meet its data processing and communication needs. If information security is breached or other technology difficulties or failures occur, information may be lost or misappropriated, services and operations may
be interrupted and the Corporation could be exposed to claims from customers. Any of these results could have a material adverse effect on the Corporation’s financial condition, results of operations or liquidity.
Limited Geographic Diversification -
The Corporation grants commercial, residential and personal loans to customers primarily in the Pennsylvania Counties of Tioga, Bradford, Sullivan, Lycoming, Potter, Cameron and McKean, and in Steuben and Allegany Counties in New York State. Although the Corporation has a diversified loan portfolio, a significant portion of its debtors’ ability to honor their contracts is dependent on the local economic conditions within the region. Deterioration in economic conditions could adversely affect the quality of the Corporation's loan portfolio and the demand for its products and services, and
accordingly, could have a material adverse effect on the Corporation's financial condition, results of operations or liquidity.
Growth Strategy
– In recent years, the Corporation has expanded its operations by acquisitions and by building and opening new branches. The Corporation’s future financial performance will depend on its ability to execute its strategic plan and manage its future growth. Failure to execute these plans could have a material adverse effect on the Corporation’s financial condition, results of operations or liquidity.
5
Competition -
All phases of the Corporation’s business are competitive. Some competitors are much larger in total assets and capitalization than the Corporation, have greater access to capital markets and can offer a broader array of financial services. There can be no assurance that the Corporation will be able to compete effectively in its markets. Furthermore, developments increasing the nature or level of competition could have a material adverse effect on the Corporation's financial condition, results of operations or liquidity.
Government Regulation and Monetary Policy -
The Corporation and the banking industry are subject to extensive regulation and supervision under federal and state laws and regulations. The requirements and limitations imposed by such laws and regulations limit the manner in which the Corporation conducts its business, undertakes new investments and activities and obtains financing. These regulations are designed primarily for the protection of the deposit insurance funds and consumers and not to benefit the Corporation's shareholders. Financial institution regulation has been the subject of significant legislation in recent years and may
be the subject of further significant legislation in the future, none of which is in the control of the Corporation. Significant new laws or changes in, or repeals of, existing laws could have a material adverse effect on the Corporation's financial condition, results of operations or liquidity. Further, federal monetary policy, particularly as implemented through the Federal Reserve System, significantly affects short-term interest rates and credit conditions, and any unfavorable change in these conditions could have a material adverse effect on the Corporation's financial condition, results of operations or liquidity.
Bank Secrecy Act and Related Laws and Regulations -
These laws and regulations have significant implications for all financial institutions. They increase due diligence requirements and reporting obligations for financial institutions, create new crimes and penalties, and require the federal banking agencies, in reviewing merger and other acquisition transactions, to consider the effectiveness of the parties to such transactions in combating money laundering activities. Even innocent noncompliance and inconsequential failure to follow the regulations could result in significant fines or other penalties, which could have a material
adverse impact on the Corporation's financial condition, results of operations or liquidity.
Dodd-Frank Wall Street Reform and Consumer Protection Act (the “Act”)
- On July 21, 2010, President Obama signed the Act into law. The Act contains numerous and wide-ranging changes to the structure of the U.S. financial system. Portions of the Act are effective at different times, and many of the provisions require follow-on, more detailed rulemaking by regulators. Consequently, the Act’s impact on the financial system in general and the Corporation in particular cannot be predicted at this time. Some of the Act’s provisions management believes may impact the Corporation’s financial
condition and results of operations over the next few years are as follows:
|
|
·
|
requires the establishment of minimum leverage and risk-based capital requirements applicable to bank holding companies that are not less than those currently applicable to insured depository institutions (currently 5%, 6% and 10% to be “well capitalized”, and 4%, 4% and 8% to be “adequately capitalized”);
|
|
|
·
|
alters the FDIC’s base for determining deposit insurance assessments by requiring the assessments be determined based on “average consolidated total assets” less the institution’s “average tangible equity,” rather than on a bank’s deposits;
|
|
|
·
|
increases the FDIC’s minimum reserve ratio for the deposit insurance fund from 1.15% to 1.35% of estimated deposits with no upward limit. The FDIC is required to “offset the effect” of the increased minimum reserve ratio on institutions with less than $10 billion in total consolidated assets. The intent appears to be to require the FDIC to impose higher premiums on larger banks in order to get from the old minimum of 1.15% to the new 1.35%, but given that the current reserve ratio is negative, all institutions can expect assessments to remain significant for the foreseeable future. The Act allows the FDIC until September 30, 2020 to reach 1.35%;
|
|
|
·
|
eliminates the prohibition against paying interest on commercial checking accounts, effective one year after enactment; and
|
|
|
·
|
requires the Federal Reserve, within nine months of enactment, to prescribe regulations to establish standards for determining that interchange transaction fees meet the new statutory standard of reasonable and proportional to the cost, which may lead to reductions in the Corporation’s non-interest revenue from interchange fees.
|
6
The Act has other significant features, some of which are as follows: (i) makes permanent the 2008 increase in the maximum deposit insurance amount to $250,000, and extends until December 31, 2012 full deposit insurance coverage for qualifying noninterest-bearing transaction accounts, (ii) within the Act is the Mortgage Reform and Anti-Predatory Lending Act, a broad piece of legislation intended to curtail abusive residential mortgage lending practices that contributed to the mortgage/housing crisis, (iii) requires the formation of the Bureau of Consumer Financial Protection as a new, independent bureau within the Federal Reserve, with very broad rulemaking and supervisory authority with respect to federal
consumer financial laws, (iv) establishes the Financial Stability Oversight Council, to serve as an early warning system identifying risks in firms and market activities, to enhance oversight of the financial system as a whole and to harmonize prudential standards across financial regulatory agencies, and (v) establishes several requirements related to executive compensation and corporate governance.
Not applicable.
The Bank owns each of its properties, except for the facility located at 2 East Mountain Avenue, South Williamsport, which is leased. All of the properties are in good condition. None of the owned properties are subject to encumbrance.
A listing of properties is as follows:
Main administrative offices:
|
90-92 Main Street
|
or
|
10 Nichols Street
|
|
|
Wellsboro, PA 16901
|
Wellsboro, PA 16901
|
Branch offices – Citizens & Northern Bank:
|
428 S. Main Street
|
514 Main Street
|
2 East Mountain Avenue
|
|||
|
Athens, PA 18810
|
Laporte, PA 18626
|
South Williamsport, PA 17702
|
|||
|
10 N. Main Street
|
4534 Williamson Trail
|
41 Main Street
|
|||
|
Coudersport, PA 16915
|
Liberty, PA 16930
|
Tioga, PA 16946
|
|||
|
111 W. Main Street
|
1085 S. Main Street
|
428 Main Street
|
|||
|
Dushore, PA 18614
|
Mansfield, PA 16933
|
Towanda, PA 18848
|
|||
|
563 Main Street
|
612 James Monroe Avenue
|
64 Elmira Street
|
|||
|
East Smithfield, PA 18817
|
Monroeton, PA 18832
|
Troy, PA 16947
|
|||
|
104 Main Street
|
3461 Route 405 Highway
|
90-92 Main Street
|
|||
|
Elkland, PA 16920
|
Muncy, PA 17756
|
Wellsboro, PA 16901
|
|||
|
135 East Fourth Street
|
100 Maple Street
|
1510 Dewey Avenue
|
|||
|
Emporium, PA 15834
|
Port Allegany, PA 16743
|
Williamsport, PA 17701
|
|||
|
230 Railroad Street
|
24 Thompson Street
|
130 Court Street
|
|||
|
Jersey Shore, PA 17740
|
Ralston, PA 17763
|
Williamsport, PA 17701
|
|||
|
102 E. Main Street
|
1827 Elmira Street
|
1467 Golden Mile Road
|
|||
|
Knoxville, PA 16928
|
Sayre, PA 18840
|
Wysox, PA 18854
|
|||
|
3 Main Street
|
6250 County Rte 64, East Avenue Ext.
|
||||
|
Canisteo, NY 14823
|
Hornell, NY 14843
|
Facilities management office:
13 Water Street
Wellsboro, PA 16901
7
The Corporation and the Bank are involved in various legal proceedings incidental to their business. Management believes the aggregate liability, if any, resulting from such pending and threatened legal proceedings will not have a material adverse effect on the Corporation’s financial condition or results of operations.
QUARTERLY SHARE DATA
Trades of the Corporation’s stock are executed through various brokers who maintain a market in the Corporation’s stock. The Corporation’s stock is listed on the NASDAQ Capital Market with the trading symbol CZNC. As of December 31, 2010, there were 2,564 shareholders of record of the Corporation’s common stock.
The following table sets forth the high and low sales prices of the common stock during 2010 and 2009.
|
2010
|
2009
|
|||||||||||||||||||||||
|
Dividend
|
Dividend
|
|||||||||||||||||||||||
|
Declared
|
Declared
|
|||||||||||||||||||||||
|
per
|
per
|
|||||||||||||||||||||||
|
|
High
|
Low
|
Quarter
|
High
|
Low
|
Quarter
|
||||||||||||||||||
|
First quarter
|
$ | 12.95 | $ | 8.76 | $ | 0.08 | $ | 20.94 | $ | 14.06 | $ | 0.24 | ||||||||||||
|
Second quarter
|
13.86 | 10.70 | 0.09 | 22.46 | 16.46 | 0.24 | ||||||||||||||||||
|
Third quarter
|
13.30 | 10.15 | 0.10 | 22.06 | 14.50 | 0.24 | ||||||||||||||||||
|
Fourth quarter
|
15.84 | 12.45 | 0.12 | 15.14 | 8.15 | 0.00 | ||||||||||||||||||
In December 2009, the Corporation announced that the Board of Directors was delaying until January 2010 a decision regarding the size of the dividend on common stock to be declared for the fourth quarter of 2009. This was a departure from the Corporation’s customary practice which had been to declare a dividend for the fourth quarter of the year in mid-December, with a dividend payment date in mid- to late January. In January 2010, the Board of Directors declared a dividend of $0.08 per share on common stock, which was paid in February 2010. As a result of this change in timing of the quarterly dividend payment, the table above presents the quarterly dividend as paid one
quarter later.
Future dividend payments will depend upon maintenance of a strong financial condition, future earnings and capital and regulatory requirements. Also, the Corporation and C&N Bank are subject to restrictions on the amount of dividends that may be paid without approval of banking regulatory authorities. These restrictions are described in Note 18 to the consolidated financial statements.
8
PERFORMANCE GRAPH
Set forth below is a chart comparing the Corporation’s cumulative return to stockholders against the cumulative return of the Russell 2000 and a Peer Group Index of similar banking organizations selected by the Corporation for the five-year period commencing December 31, 2005 and ended December 31, 2010. The index values are market-weighted dividend-reinvestment numbers, which measure the total return for investing $100.00 five years ago. This meets Securities & Exchange Commission requirements for showing dividend reinvestment share performance over a five-year period and measures the return to an investor for placing $100.00 into a group of bank stocks and reinvesting any and all
dividends into the purchase of more of the same stock for which dividends were paid.
COMPARISON OF 5-YEAR CUMULATIVE RETURN
Citizens & Northern Corporation
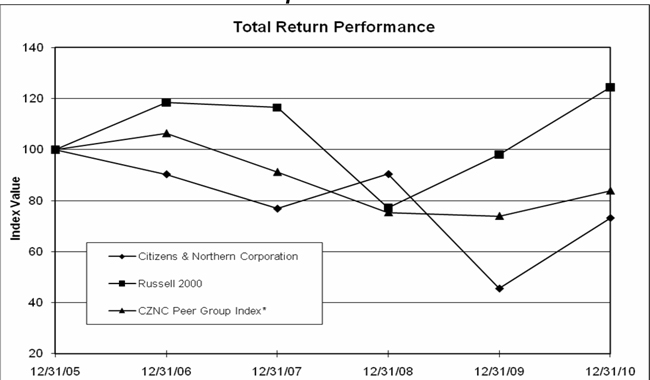
| Period Ending | ||||||||||||||||||||||||
|
Index
|
12/31/05
|
12/31/06
|
12/31/07
|
12/31/08
|
12/31/09
|
12/31/10
|
||||||||||||||||||
|
Citizens & Northern Corporation
|
100.00 | 90.32 | 76.84 | 90.37 | 45.49 | 73.16 | ||||||||||||||||||
|
Russell 2000
|
100.00 | 118.37 | 116.51 | 77.15 | 98.11 | 124.46 | ||||||||||||||||||
|
CZNC Peer Group Index*
|
100.00 | 106.37 | 91.20 | 75.37 | 73.92 | 83.87 | ||||||||||||||||||
9
The C&N peer group consists of banks headquartered in Pennsylvania with total assets of $500 million to $1.3 billion. This peer group consists of 1
st
Summit Bancorp of Johnstown, Inc., Johnstown; ACNB Corporation, Gettysburg; American Bank Incorporated, Allentown; AmeriServ Financial, Inc., Johnstown; CCFNB Bancorp, Inc., Bloomsburg; Citizens Financial Services, Inc., Mansfield; Codorus Valley Bancorp, York; Customers Bank, Phoenixville; Dimeco, Inc., Honesdale; DNB Financial Corporation, Downingtown; Embassy Bancorp, Inc., Bethlehem; ENB Financial Corp., Ephrata; Fidelity D & D Bancorp, Inc., Dunmore; First Keystone
Corporation, Berwick; FNB Bancorp, Inc., Newtown; Franklin Financial Services Corporation, Chambersburg; Honat Bancorp, Inc., Honesdale; Kish Bancorp, Inc., Reedsville; Mid Penn Bancorp, Inc., Millersburg; Norwood Financial Corp., Honesdale; Penns Woods Bancorp, Inc., Williamsport; Penseco Financial Services Corporation, Scranton; Peoples Financial Services Corp., Hallstead; QNB Corp., Quakertown; Republic First Bancorp, Inc., Philadelphia; Royal Bancshares of Pennsylvania, Inc., Narberth; Somerset Trust Holding Company, Somerset.
The data for this graph was obtained from SNL Financial LC, Charlottesville, VA.
EQUITY COMPENSATION PLAN INFORMATION
The following table sets forth information concerning the Stock Incentive Plan and Independent Directors Stock Incentive Plan, both of which have been approved by the Corporation’s shareholders. The figures shown in the table below are as of December 31, 2010.
|
Number of
|
||||||||||||
|
Number of
|
Weighted-
|
Securities
|
||||||||||
|
Securities to be
|
average
|
Remaining
|
||||||||||
|
Issued Upon
|
Exercise
|
for Future
|
||||||||||
|
Exercise of
|
Price of
|
Issuance Under
|
||||||||||
|
Outstanding
|
Outstanding
|
Equity Compen-
|
||||||||||
|
Options
|
Options
|
sation Plans
|
||||||||||
|
Equity compensation plans approved by shareholders
|
226,894 | $ | 20.54 | 595,609 | ||||||||
|
Equity compensation plans not approved by shareholders
|
0 | N/A | 0 | |||||||||
More details related to the Corporation’s equity compensation plans are provided in Notes 1 and 13 to the consolidated financial statements.
10
| As of or for the Year Ended December 31, | ||||||||||||||||||||
|
|
2010
|
2009
|
2008
|
2007
|
2006
|
|||||||||||||||
| INCOME STATEMENT (In Thousands) | ||||||||||||||||||||
|
Interest and fee income
|
$ | 62,114 | $ | 67,976 | $ | 74,237 | $ | 70,221 | $ | 64,462 | ||||||||||
|
Interest expense
|
19,245 | 24,456 | 31,049 | 33,909 | 30,774 | |||||||||||||||
|
Net interest income
|
42,869 | 43,520 | 43,188 | 36,312 | 33,688 | |||||||||||||||
|
Provision for loan losses
|
1,191 | 680 | 909 | 529 | 672 | |||||||||||||||
|
Net interest income after provision for loan losses
|
41,678 | 42,840 | 42,279 | 35,783 | 33,016 | |||||||||||||||
|
Noninterest income excluding securities gains (losses) and gains from sale of credit card loans
|
13,917 | 13,021 | 13,140 | 10,440 | 7,970 | |||||||||||||||
|
Net impairment losses recognized in earnings from available-for-sale securities
|
(433 | ) | (85,363 | ) | (10,088 | ) | 0 | 0 | ||||||||||||
|
Net realized gains on available-for-sale securities
|
1,262 | 1,523 | 750 | 127 | 5,046 | |||||||||||||||
|
Gain from sale of credit card loans
|
0 | 0 | 0 | 0 | 340 | |||||||||||||||
|
Noninterest expense
|
31,569 | 34,011 | 33,703 | 33,283 | 31,614 | |||||||||||||||
|
Income (loss) before income tax provision (credit)
|
24,855 | (61,990 | ) | 12,378 | 13,067 | 14,758 | ||||||||||||||
|
Income tax provision (credit)
|
5,800 | (22,655 | ) | 2,319 | 2,643 | 2,772 | ||||||||||||||
|
Net income (loss)
|
19,055 | (39,335 | ) | 10,059 | 10,424 | 11,986 | ||||||||||||||
|
U.S. Treasury preferred dividends
|
1,474 | 1,428 | 0 | 0 | 0 | |||||||||||||||
|
Net income (loss) available to common shareholders
|
$ | 17,581 | $ | (40,763 | ) | $ | 10,059 | $ | 10,424 | $ | 11,986 | |||||||||
|
PER COMMON SHARE: (1)
|
||||||||||||||||||||
|
Basic earnings per share
|
$ | 1.45 | $ | (4.40 | ) | $ | 1.12 | $ | 1.19 | $ | 1.42 | |||||||||
|
Diluted earnings per share
|
$ | 1.45 | $ | (4.40 | ) | $ | 1.12 | $ | 1.19 | $ | 1.42 | |||||||||
|
Cash dividends declared per share
|
$ | 0.39 | $ | 0.72 | $ | 0.96 | $ | 0.96 | $ | 0.96 | ||||||||||
|
Stock dividend
|
None
|
None
|
None
|
1 | % | 1 | % | |||||||||||||
|
Book value per common share at period-end
|
$ | 11.43 | $ | 10.46 | $ | 13.66 | $ | 15.34 | $ | 15.51 | ||||||||||
|
Tangible book value per common share at period-end
|
$ | 10.42 | $ | 9.43 | $ | 12.22 | $ | 13.85 | $ | 15.13 | ||||||||||
|
Weighted average common shares outstanding - basic
|
12,131,039 | 9,271,869 | 8,961,805 | 8,784,134 | 8,422,495 | |||||||||||||||
|
Weighted average common shares outstanding - diluted
|
12,131,039 | 9,271,869 | 8,983,300 | 8,795,366 | 8,448,169 | |||||||||||||||
|
END OF PERIOD BALANCES (In Thousands)
|
||||||||||||||||||||
|
Available-for-sale securities
|
$ | 443,956 | $ | 396,288 | $ | 419,688 | $ | 432,755 | $ | 356,665 | ||||||||||
|
Gross loans
|
730,411 | 721,011 | 743,544 | 735,941 | 687,501 | |||||||||||||||
|
Allowance for loan losses
|
9,107 | 8,265 | 7,857 | 8,859 | 8,201 | |||||||||||||||
|
Total assets
|
1,316,588 | 1,321,795 | 1,281,637 | 1,283,746 | 1,127,368 | |||||||||||||||
|
Deposits
|
1,004,348 | 926,789 | 864,057 | 838,503 | 760,349 | |||||||||||||||
|
Borrowings
|
166,908 | 235,471 | 285,473 | 300,132 | 228,440 | |||||||||||||||
|
Stockholders' equity
|
138,944 | 152,410 | 122,026 | 137,781 | 129,888 | |||||||||||||||
|
Common stockholders' equity (stockholders' equity, excluding preferred stock)
|
138,944 | 126,661 | 122,026 | 137,781 | 129,888 | |||||||||||||||
|
AVERAGE BALANCES (In Thousands)
|
||||||||||||||||||||
|
Total assets
|
1,326,145 | 1,296,086 | 1,280,924 | 1,178,904 | 1,134,689 | |||||||||||||||
|
Earning assets
|
1,205,608 | 1,208,280 | 1,202,872 | 1,090,035 | 1,055,103 | |||||||||||||||
|
Gross loans
|
723,318 | 728,748 | 743,741 | 729,269 | 662,714 | |||||||||||||||
|
Deposits
|
965,615 | 886,703 | 847,714 | 812,255 | 750,982 | |||||||||||||||
|
Stockholders' equity
|
150,133 | 141,787 | 130,790 | 138,669 | 131,082 | |||||||||||||||
11
|
As of or for the Year Ended December 31,
|
||||||||||||||||||||
|
|
2010
|
2009
|
2008
|
2007
|
2006
|
|||||||||||||||
| KEY RATIOS | ||||||||||||||||||||
|
Return on average assets
|
1.44 | % | -3.03 | % | 0.79 | % | 0.88 | % | 1.06 | % | ||||||||||
|
Return on average equity
|
12.69 | % | -27.74 | % | 7.69 | % | 7.52 | % | 9.14 | % | ||||||||||
|
Average equity to average assets
|
11.32 | % | 10.94 | % | 10.21 | % | 11.76 | % | 11.55 | % | ||||||||||
|
Net interest margin (2)
|
3.81 | % | 3.84 | % | 3.77 | % | 3.51 | % | 3.42 | % | ||||||||||
|
Efficiency (3)
|
52.73 | % | 57.22 | % | 57.59 | % | 68.39 | % | 71.73 | % | ||||||||||
|
Cash dividends as a % of diluted earnings per share
|
26.90 | % |
NM
|
85.71 | % | 80.67 | % | 67.61 | % | |||||||||||
|
Tier 1 leverage
|
9.20 | % | 9.86 | % | 10.12 | % | 10.91 | % | 11.22 | % | ||||||||||
|
Tier 1 risk-based capital
|
15.87 | % | 16.70 | % | 13.99 | % | 15.46 | % | 16.51 | % | ||||||||||
|
Total risk-based capital
|
17.17 | % | 17.89 | % | 14.84 | % | 16.52 | % | 17.97 | % | ||||||||||
|
Tangible common equity/tangible assets
|
9.71 | % | 8.72 | % | 8.61 | % | 9.79 | % | 11.27 | % | ||||||||||
|
Nonperforming assets/total assets
|
0.92 | % | 0.76 | % | 0.69 | % | 0.66 | % | 0.78 | % | ||||||||||
|
Nonperforming loans/total loans
|
1.58 | % | 1.27 | % | 1.14 | % | 1.11 | % | 1.46 | % | ||||||||||
|
Allowance for loan losses/total loans
|
1.25 | % | 1.15 | % | 1.06 | % | 1.20 | % | 1.19 | % | ||||||||||
|
Net charge-offs/average loans
|
0.05 | % | 0.04 | % | 0.26 | % | 0.06 | % | 0.13 | % | ||||||||||
|
NM = Not a meaningful ratio.
|
||||||||||||||||||||
|
|
(1)
|
All share and per share data have been restated to give effect to stock dividends and splits.
|
|
|
(2)
|
Rates of return on tax-exempt securities and loans are calculated on a fully-taxable equivalent basis.
|
|
|
(3)
|
The efficiency ratio is calculated by dividing total noninterest expense by the sum of net interest income (including income from tax-exempt securities and loans on a fully-taxable equivalent basis) and noninterest income excluding securities gains and gains from sale of credit card loans.
|
Certain statements in this section and elsewhere in this Annual Report on Form 10-K are forward-looking statements. Citizens & Northern Corporation and its wholly-owned subsidiaries (collectively, the Corporation) intend such forward-looking statements to be covered by the safe harbor provisions for forward-looking statements contained in the Private Securities Reform Act of 1995. Forward-looking statements, which are not historical facts, are based on certain assumptions and describe future plans, business objectives and expectations, and are generally identifiable by the use of words such as, "should", “likely”, "expect", “plan”, "anticipate", “target”,
“forecast”, and “goal”. These forward-looking statements are subject to risks and uncertainties that are difficult to predict, may be beyond management’s control and could cause results to differ materially from those expressed or implied by such forward-looking statements. Factors which could have a material, adverse impact on the operations and future prospects of the Corporation include, but are not limited to, the following:
|
·
|
changes in monetary and fiscal policies of the Federal Reserve Board and the U.S. Government, particularly related to changes in interest rates
|
|
·
|
changes in general economic conditions
|
|
·
|
legislative or regulatory changes
|
|
·
|
downturn in demand for loan, deposit and other financial services in the Corporation’s market area
|
|
·
|
increased competition from other banks and non-bank providers of financial services
|
|
·
|
technological changes and increased technology-related costs
|
|
·
|
changes in accounting principles, or the application of generally accepted accounting principles.
|
These risks and uncertainties should be considered in evaluating forward-looking statements and undue reliance should not be placed on such statements.
12
EARNINGS OVERVIEW
For the year ended December 31, 2010, net income available to common shareholders was reported of $17,581,000, or $1.45 per share (basic and diluted). The Corporation reported a net loss of $40,763,000 ($4.40 per share-basic and diluted) in 2009, while net income was $10,059,000 ($1.12 per share – basic and diluted) in 2008. The net loss for the year ended December 31, 2009 included the impact of after-tax other-than-temporary impairment (OTTI) charges on available-for-sale securities (adjusted for realized gains on some securities subsequently sold) of $55,849,000. In 2008, the after-tax impact of OTTI charges was $6,638,000.
Core Earnings is an earnings performance measurement which the Corporation’s management has defined to exclude the effects of OTTI losses on available-for-sale securities and realized gains on securities for which OTTI has previously been recognized. Core Earnings is a performance measurement that is not based on U.S. generally accepted accounting principles. Management believes Core Earnings information is meaningful for evaluating the Corporation’s operating performance, because it excludes some of the impact of market volatility as it relates to investments in pooled trust-preferred securities and other securities. More information concerning Core Earnings, including a
reconciliation to the Corporation’s earnings results based on U.S. generally accepted accounting principles, is provided in the following section of Management’s Discussion and Analysis. Core Earnings available to common shareholders were $17,027,000 for 2010 or $1.40 per diluted share. The Corporation’s results for 2009 included positive Core Earnings available to common shareholders of $15,086,000 ($1.63 per diluted share), reduced by after-tax OTTI charges on available-for-sale securities (net of subsequent gains from selling some of the securities) of $55,849,000. In 2008, the Corporation had Core Earnings of $16,697,000 ($1.86 per diluted share). Core earnings per share in 2010 have been impacted by a higher number of weighted average common shares outstanding than in the previous two years, resulting from the issuance of common shares in a
public offering in December 2009.
Pre-tax OTTI charges totaled $433,000 in 2010 compared with $85,363,000 in 2009 and $10,088,000 in 2008. Management evaluates securities for OTTI at least on a quarterly basis, and more frequently when economic or market conditions warrant such evaluation. The Corporation’s process for evaluating all available-for-sale securities for OTTI is described in more detail in Note 7 to the consolidated financial statements.
As described in more detail in Note 7 to the consolidated financial statements, the Corporation adopted new accounting principles in 2009, which resulted in the impairment of debt securities being separated into (a) the amount of the total impairment related to credit loss, which is recognized in the income statement, and (b) the amount of the total impairment related to all other factors, which is recognized in other comprehensive income. In 2009, the effect of the new principles was to increase impairment losses recognized in earnings by $3,451,000, and decrease the income tax provision by $1,173,000, resulting in a decrease in net income (larger net loss) of $2,275,000, or $0.25 per average common
share.
13
STATEMENT REGARDING NON-GAAP FINANCIAL MEASUREMENT
This report contains supplemental financial information determined by a method other than in accordance with Accounting Principles Generally Accepted in the United States of America (“GAAP”). Management uses this non-GAAP measure in its analysis of the Corporation’s performance. This measure, Core Earnings, excludes the effects of OTTI losses on available-for-sale securities and realized gains on securities for which OTTI has previously been recognized. Management believes the presentation of this financial measure, which excludes the impact of the specified items, provides useful supplemental information that is essential to a proper understanding of the
financial results of the Corporation. The Core Earnings measure provides a method to assess operating performance excluding the impact of market volatility related to investments in pooled trust-preferred securities and other securities. This disclosure should not be viewed as a substitute for results determined in accordance with GAAP, nor is it necessarily comparable to non-GAAP performance measures that may be presented by other companies.
RECONCILIATION OF NON-GAAP MEASURE (UNAUDITED)
For years ended December 31,
(In thousands, except per-share data)
|
2010
|
2009
|
2008
|
||||||||||
|
Net (loss) income available to common shareholders
|
$ | 17,581 | $ | (40,763 | ) | $ | 10,059 | |||||
|
Other-than-temporary impairment losses on available-for-sale securities
|
(433 | ) | (85,363 | ) | (10,088 | ) | ||||||
|
Realized gains on assets previously written down
|
707 | 1,308 | 31 | |||||||||
|
Other-than-temporary impairment losses on available-for-sale securities, net of related gains
|
274 | (84,055 | ) | (10,057 | ) | |||||||
|
Income taxes (1)
|
280 | 28,206 | 3,419 | |||||||||
|
Other-than-temporary impairment losses, net
|
554 | (55,849 | ) | (6,638 | ) | |||||||
|
Core earnings available to common shareholders
|
$ | 17,027 | $ | 15,086 | $ | 16,697 | ||||||
|
Net income (loss) per share – diluted
|
$ | 1.45 | $ | (4.40 | ) | $ | 1.12 | |||||
|
Core earnings per share – diluted
|
$ | 1.40 | $ | 1.63 | $ | 1.86 | ||||||
|
Weighted average shares outstanding – diluted
|
12,131,039 | 9,271,869 | 8,983,300 | |||||||||
|
Weighted average shares outstanding - diluted - used in core earnings per share calculations
|
12,131,039 | 9,272,489 | 8,983,300 | |||||||||
(1) Income tax has been allocated to the non-core losses at 34%, adjusted for a valuation allowance on deferred tax assets associated with losses from securities classified as capital assets for federal income tax reporting purposes. The valuation allowance was recorded at $373,000 in 2009 and was eliminated in the fourth quarter of 2010. The valuation allowance is described in more detail in Note 14 to the consolidated financial statements.
2010 vs. 2009
Net income available to common shareholders was $17,581,000 ($1.45 per share) in 2010 compared to a net loss of $40,763,000 ($4.40 per share) in 2009. Core Earnings available to common shareholders were $17,027,000 for 2010, or $1.40 per diluted share, compared to Core Earnings in 2009 of $15,086,000 ($1.63 per diluted share). The most significant fluctuations in the components of Core Earnings for 2010 compared to 2009 are as follows:
|
|
·
|
Net interest income was $42,869,000 for the year ended December 31, 2010, down 1.5% from 2009 net interest income of $43,520,000. On a fully taxable equivalent basis, net interest income was 1.0% lower in 2010 than in 2009. While the Corporation’s interest margin benefited in 2010 from a lower cost of funds, the average yield on available-for-sale securities dropped significantly as compared to 2009. Also, the Corporation held approximately $25 million more in average overnight investments (mainly at the Federal Reserve) in 2010 than in 2009, which gave the Corporation a great deal of flexibility from a liquidity standpoint but which generated an average yield of only 0.23%.
|
14
|
|
·
|
The provision for loan losses was $1,191,000, up from $680,000 in 2009. In 2010, management increased the estimated allowance for loan losses related to individually impaired loans.
|
|
|
·
|
Non-interest revenue for 2010 was $896,000, or 6.9%, higher than in 2009, reflecting substantial increases for 2010 in revenue from sales of mortgages, as well as from debit card-related interchange fees.
|
|
|
·
|
Non-interest expense was $2,442,000, or 7.2%, lower than in 2009. The decrease reflects the impact of lower FDIC assessments, lower furniture and equipment expense primarily associated with much of the core banking system software and equipment becoming fully depreciated, as well as reductions in several other categories of operating costs.
|
|
|
·
|
The provision for income taxes for 2010 was $5,800,000, or 23.3% of pre-tax income. In 2009, the Corporation recorded a credit provision for income taxes based on an effective tax rate of 36.5%. Fluctuations in the tax provision/ pre-tax income rate for these periods include the impact of changes in the average holdings of tax-exempt securities and loans. Also, the 2010 provision includes the reversal of a valuation allowance established in 2009 on certain deferred tax assets.
|
2009 vs. 2008
The most significant changes in components of the Corporation's Core Earnings results for 2009, as compared to 2008, were as follows:
|
|
·
|
Net interest income increased $332,000, or 0.8%. On a fully taxable-equivalent basis, net interest income increased $1,032,000, or 2.3%. The interest margin has been positively impacted by lower short-term market interest rates, which have reduced interest rates paid on deposits and borrowings. The interest margin has also been positively impacted by increased levels of investments and high yields on municipal bonds. The interest margin has been negatively impacted by weak consumer loan demand, as average loans outstanding shrunk approximately $15.0 million in 2009 as compared to 2008.
|
|
|
·
|
The provision for loan losses was $229,000 lower in 2009 than in 2008. The ratio of nonperforming loans (including nonaccrual loans and loans 90 days or more past due and still accruing interest) and other real estate owned, as a percentage of assets, was 0.76% at December 31, 2009, higher than the 0.69% level at December 31, 2008, but still relatively low by historical standards.
|
|
|
·
|
Non-interest income decreased $214,000, or 1.7%. In 2008, non-interest income included a gain of $533,000 from redemption of restricted shares of Visa, resulting from Visa’s initial public offering. Also, in 2009, the Corporation received no dividend income on its investment in restricted stock issued by the Federal Home Loan Bank of Pittsburgh, while dividend income on this stock was $334,000 in 2008.
|
|
|
·
|
Non-interest expense increased $213,000, or 0.6%. FDIC insurance assessments increased $1,784,000 in 2009, to $2,092,000 from $308,000. The higher FDIC assessments included the effects of premium increases and a special assessment of $589,000. Excluding FDIC costs, total non-interest expense was 4.7% lower in 2009 than in 2008.
|
|
|
·
|
Core Earnings for 2009 were reduced by dividends on preferred stock issued to the U.S. Treasury under the TARP Capital Purchase Program of $1,428,000.
|
More detailed information concerning fluctuations in the Corporation’s earnings results are provided in other sections of Management’s Discussion and Analysis.
15
CRITICAL ACCOUNTING POLICIES
The presentation of financial statements in conformity with U.S. generally accepted accounting principles requires management to make estimates and assumptions that affect many of the reported amounts and disclosures. Actual results could differ from these estimates.
A material estimate that is particularly susceptible to significant change is the determination of the allowance for loan losses. Management believes that the allowance for loan losses is adequate and reasonable. The Corporation’s methodology for determining the allowance for loan losses is described in a separate section later in Management’s Discussion and Analysis. Given the very subjective nature of identifying and valuing loan losses, it is likely that well-informed individuals could make materially different assumptions, and could, therefore calculate a materially different allowance value. While management uses available information to recognize losses on loans,
changes in economic conditions may necessitate revisions in future years. In addition, various regulatory agencies, as an integral part of their examination process, periodically review the Corporation’s allowance for loan losses. Such agencies may require the Corporation to recognize adjustments to the allowance based on their judgments of information available to them at the time of their examination.
Another material estimate is the calculation of fair values of the Corporation’s debt securities. For most of the Corporation’s debt securities, the Corporation receives estimated fair values of debt securities from an independent valuation service, or from brokers. In developing fair values, the valuation service and the brokers use estimates of cash flows, based on historical performance of similar instruments in similar interest rate environments. Based on experience, management is aware that estimated fair values of debt securities tend to vary among brokers and other valuation services.
As described in Note 6 to the consolidated financial statements, management calculates the fair values of pooled trust-preferred securities by applying discount rates to estimated cash flows for each security. Management estimated the cash flows expected to be received from each security, taking into account estimated levels of deferrals and defaults by the underlying issuers, and used discount rates considered reflective of a market participant’s expectations regarding the extent of credit and liquidity risk inherent in the securities. Management’s estimates of cash flows and discount rates used to calculate fair values of pooled trust-preferred securities were based on sensitive
assumptions, and use of different assumptions could result in calculations of fair values that would be substantially different than the amounts calculated by management.
As described in Note 7 to the consolidated financial statements, management evaluates securities for OTTI. In making that evaluation, consideration is given to (1) the length of time and the extent to which the fair value has been less than cost, (2) the financial condition and near-term prospects of the issuer, and (3) whether the Corporation intends to sell the security or more likely than not will be required to sell the security before its anticipated recovery. Management’s assessments of the likelihood and potential for recovery in value of securities are subjective and based on sensitive assumptions. Also, management’s estimates of cash flows used to evaluate OTTI
of pooled trust-preferred securities are based on sensitive assumptions, and use of different assumptions could produce different conclusions for each security.
16
NET INTEREST INCOME
The Corporation’s primary source of operating income is net interest income, which is equal to the difference between the amounts of interest income and interest expense. Tables I, II and III include information regarding the Corporation’s net interest income in 2010, 2009, and 2008. In each of these tables, the amounts of interest income earned on tax-exempt securities and loans have been adjusted to a fully taxable-equivalent basis. Accordingly, the net interest income amounts reflected in these tables exceed the amounts presented in the consolidated financial statements. The discussion that follows is based on amounts in the tables.
2010 vs. 2009
Fully taxable equivalent net interest income was $45,954,000 in 2010, $464,000 (1.0%) lower than in 2009. As shown in Table III, net changes in volume had the effect of increasing net interest income $816,000 in 2010 compared to 2009, and interest rate changes had the effect of decreasing net interest income $1,280,000. The most significant components of the volume change in net interest income in 2010 were: a decrease in interest income of $1,260,000 attributable to a reduction in the balance of taxable available-for-sale securities and a decrease in interest expense of $1,902,000 attributable to a reduction in the balance of long-term borrowed funds. The most significant components of the rate change
in net interest income in 2010 were: a decrease in interest income of $3,895,000 attributable to lower rates earned on taxable available-for-sale securities and a decrease in interest expense of $3,315,000 due to lower rates paid on interest-bearing deposits. As presented in Table II, the “Interest Rate Spread” (excess of average rate of return on earning assets over average cost of funds on interest-bearing liabilities) was 3.53% in 2010, as compared to 3.47% in 2009.
INTEREST INCOME AND EARNING ASSETS
Interest income totaled $65,199,000 in 2010, a decrease of 8.0% from 2009. Income from available-for-sale securities decreased $4,540,000 (19.7%), while interest and fees from loans decreased $1,102,000, or 2.3%. As indicated in Table II, total average available-for-sale securities (at amortized cost) in 2010 decreased to $427,520,000, a decrease of $12,303,000, or 2.8% from 2009. During 2009 and 2010, the Corporation increased the size of its tax-exempt municipal security portfolio, while shrinking the average taxable available-for-sale securities portfolio. The Corporation’s yield on taxable securities fell in 2009 and 2010 primarily because of low market interest rates,
including the effects of management’s decision to limit purchases of taxable securities to investments that mature or are expected to repay a substantial portion of principal within approximately four years or less. In addition to the impact of falling rates, the Corporation’s yield on taxable securities was also negatively affected in 2010 by higher-than-expected prepayments on mortgage-backed securities; these prepayments were caused by procedural changes by the U.S. Government agencies that issued the securities. The average rate of return on available-for-sale securities was 4.33% for 2010 and 5.24% in 2009.
The average balance of gross loans decreased 0.7% to $723,318,000 in 2010 from $728,748,000 in 2009. Due to the challenging economic environment and the Corporation’s decision to sell a portion of its newly originated residential mortgages on the secondary market, the Corporation experienced contraction in the balance of its mortgage and consumer loan portfolios, with modest growth in average commercial loan balances. The Corporation’s yield on loans fell as rates on new loans as well as existing, variable-rate loans have decreased. The average rate of return on loans was 6.44% in 2010 and 6.54% in 2009.
The average balance of interest-bearing due from banks increased to $54,655,000 in 2010 from $29,348,000 in 2009. In the last half of 2009 and all of 2010, this consisted primarily of balances held by the Federal Reserve. In early 2009, more overnight funds were invested in federal funds sold to other banks, which decreased to an average balance of $48,000 in 2010 from $8,983,000 in 2009. Although the rates of return on balances with the Federal Reserve are low, the Corporation maintained relatively high levels of liquid assets in 2009 and 2010 (as opposed to increasing long-term, available-for-sale securities at higher yields) in order to maximize flexibility for dealing with possible
fluctuations in cash requirements, and due to management’s concern about the possibility of substantial increases in interest rates within the next few years. Also, in 2010, management maintained a portion of the balance with the Federal Reserve in anticipation of repurchasing the TARP Preferred Stock and Warrant. These repurchases were completed during the third quarter 2010.
17
INTEREST EXPENSE AND INTEREST-BEARING LIABILITIES
Interest expense fell $5,211,000, or 21.3%, to $19,245,000 in 2010 from $24,456,000 in 2009. Table II shows that the overall cost of funds on interest-bearing liabilities fell to 1.88% in 2010 from 2.40% in 2009.
Total average deposits (interest-bearing and noninterest-bearing) increased 8.9%, to $965,615,000 in 2010 from $886,703,000 in 2009. This increase came mainly in interest checking, savings, individual retirement accounts, and demand deposits. Consistent with substantial reductions in short-term global interest rates, the average rates incurred on deposit accounts have decreased significantly in 2010 as compared to 2009. As shown in Table III, decreases in rates reduced interest expense on deposits by $3,315,000.
Total average borrowed funds decreased $57,621,000 to $202,792,000 in 2010 from $260,413,000 in 2009. During 2009 and 2010, the Corporation paid off long-term borrowings as they matured using the cash flow received from loans, mortgage-backed securities, and growth in deposit balances. The average rate on borrowed funds was 3.62% in 2010, down from 3.77% in 2009. This change primarily reflects lower rates being paid on customer repurchase agreements, which make up most of the Corporation’s short-term borrowed funds.
2009 vs. 2008
Interest income totaled $70,874,000 in 2009, a decrease of 7.3% from 2008. Income from available-for-sale securities decreased $1,912,000 (7.7%), while interest and fees from loans decreased $3,505,000, or 6.9%. As indicated in Table II, total average available-for-sale securities (at amortized cost) in 2009 fell to $439,823,000, a decrease of $9,408,000, or 2.1% from 2008. During 2009, the Corporation increased the size of its tax-exempt municipal security portfolio, while shrinking the taxable available-for-sale securities portfolio. The Corporation’s yield on taxable securities fell in 2009 primarily because of low market interest rates, including the effects of management’s decision to limit
purchases of taxable securities to investments that mature or are expected to repay a substantial portion of principal within approximately four years or less. Also, interest rates on variable-rate trust preferred securities decreased consistent with short-term global interest rates. The average rate of return on available-for-sale securities was 5.24% for 2009 and 5.55% in 2008.
INTEREST INCOME AND EARNING ASSETS
The average balance of gross loans decreased 2.0% to $728,748,000 in 2009 from $743,741,000 in 2008. Due to the challenging economic environment, the Corporation experienced contraction in the balance of its mortgage and consumer loan portfolios, with slight growth in average commercial and tax-exempt loan balances. The Corporation’s yield on loans fell as rates on new loans as well as existing, variable-rate loans decreased. The average rate of return on loans was 6.54% in 2009 and 6.88% in 2008.
The average balance of interest-bearing due from banks, which in 2009 consisted primarily of balances held by the Federal Reserve, increased to $29,348,000 in 2009 from $2,385,000 in 2008. Also, the average balance of federal funds sold increased to $8,983,000 in 2009 from $5,038,000 in 2008. Although the rates of return are low, the Corporation maintained relatively high levels of these liquid assets in 2009 (as opposed to increasing long-term, available-for-sale securities at higher yields) due to management’s concern about the possibility of substantial increases in interest rates in 2010 or 2011.
INTEREST EXPENSE AND INTEREST-BEARING LIABILITIES
Interest expense fell $6,593,000, or 21.2%, to $24,456,000 in 2009 from $31,049,000 in 2008. Table II shows that the overall cost of funds on interest-bearing liabilities fell to 2.40% in 2009 from 3.05% in 2008.
Total average deposits (interest-bearing and noninterest-bearing) increased 4.6%, to $886,703,000 in 2009 from $847,714,000 in 2008. This increase came mainly in interest checking, money market, and individual retirement accounts and is partially offset by a reduction in the balance of certificates of deposit. Consistent with substantial reductions in short-term global interest rates, the average rates incurred on deposit accounts decreased significantly in 2009 as compared to 2008.
18
Total average borrowed funds decreased $34,275,000 to $260,413,000 in 2009 from $294,688,000 in 2008. During 2008 and 2009, the Corporation generally paid off long-term borrowings as they matured using the cash flow received from loans, mortgage-backed securities, and growth in deposit balances. The average rate on borrowed funds was 3.77% in 2009, down from 3.98% in 2008. This change primarily reflects lower rates being paid on customer repurchase agreements, which make up most of the Corporation’s short-term borrowed funds.
As presented in Table II, the “interest rate spread” (excess of average rate of return on interest-bearing assets over average cost of funds on interest-bearing liabilities) was 3.47% in 2009, up significantly from 3.30% in 2008. As shown in Table III, changes in volume decreased net interest income by $89,000, and changes in rates increased net interest income by $1,121,000. The most significant components of changes in volume were decreases of $1,041,000 in interest and fees on loans and $1,379,000 in interest expense on borrowed funds. The most significant components of changes in rates were decreases of $1,934,000 in income on taxable available-for-sale securities, $2,464,000 in interest and fees
on loans, and $5,138,000 in interest expense on deposits.
19
TABLE I - ANALYSIS OF INTEREST INCOME AND EXPENSE
|
Years Ended December 31,
|
Increase/(Decrease)
|
|||||||||||||||||||
|
(In Thousands)
|
2010
|
2009
|
2008
|
2010/2009 | 2009/2008 | |||||||||||||||
|
INTEREST INCOME
|
||||||||||||||||||||
|
Available-for-sale securities:
|
||||||||||||||||||||
|
Taxable
|
$ | 11,342 | $ | 16,497 | $ | 20,347 | $ | (5,155 | ) | $ | (3,850 | ) | ||||||||
|
Tax-exempt
|
7,157 | 6,542 | 4,604 | 615 | 1,938 | |||||||||||||||
|
Total available-for-sale securities
|
18,499 | 23,039 | 24,951 | (4,540 | ) | (1,912 | ) | |||||||||||||
|
Held-to-maturity securities,
|
||||||||||||||||||||
|
Taxable
|
2 | 21 | 23 | (19 | ) | (2 | ) | |||||||||||||
|
Trading securities
|
2 | 64 | 129 | (62 | ) | (65 | ) | |||||||||||||
|
Interest-bearing due from banks
|
124 | 61 | 33 | 63 | 28 | |||||||||||||||
|
Federal funds sold
|
0 | 15 | 120 | (15 | ) | (105 | ) | |||||||||||||
|
Loans:
|
||||||||||||||||||||
|
Taxable
|
44,229 | 45,236 | 48,933 | (1,007 | ) | (3,697 | ) | |||||||||||||
|
Tax-exempt
|
2,343 | 2,438 | 2,246 | (95 | ) | 192 | ||||||||||||||
|
Total loans
|
46,572 | 47,674 | 51,179 | (1,102 | ) | (3,505 | ) | |||||||||||||
|
Total Interest Income
|
65,199 | 70,874 | 76,435 | (5,675 | ) | (5,561 | ) | |||||||||||||
|
INTEREST EXPENSE
|
||||||||||||||||||||
|
Interest-bearing deposits:
|
||||||||||||||||||||
|
Interest checking
|
798 | 901 | 1,047 | (103 | ) | (146 | ) | |||||||||||||
|
Money market
|
872 | 2,004 | 4,162 | (1,132 | ) | (2,158 | ) | |||||||||||||
|
Savings
|
194 | 272 | 335 | (78 | ) | (63 | ) | |||||||||||||
|
Certificates of deposit
|
5,060 | 6,672 | 8,993 | (1,612 | ) | (2,321 | ) | |||||||||||||
|
Individual Retirement Accounts
|
4,977 | 4,796 | 4,777 | 181 | 19 | |||||||||||||||
|
Other time deposits
|
6 | 6 | 6 | 0 | 0 | |||||||||||||||
|
Total interest-bearing deposits
|
11,907 | 14,651 | 19,320 | (2,744 | ) | (4,669 | ) | |||||||||||||
|
Borrowed funds:
|
||||||||||||||||||||
|
Short-term
|
177 | 544 | 986 | (367 | ) | (442 | ) | |||||||||||||
|
Long-term
|
7,161 | 9,261 | 10,743 | (2,100 | ) | (1,482 | ) | |||||||||||||
|
Total borrowed funds
|
7,338 | 9,805 | 11,729 | (2,467 | ) | (1,924 | ) | |||||||||||||
|
Total Interest Expense
|
19,245 | 24,456 | 31,049 | (5,211 | ) | (6,593 | ) | |||||||||||||
|
Net Interest Income
|
$ | 45,954 | $ | 46,418 | $ | 45,386 | $ | (464 | ) | $ | 1,032 | |||||||||
|
(1)
|
Interest income from tax-exempt securities and loans has been adjusted to a fully taxable-equivalent basis, using the Corporation’s marginal federal income tax rate of 34%.
|
|
(2)
|
Fees on loans are included with interest on loans and amounted to $1,207,000 in 2010, $1,176,000 in 2009 and $1,061,000 in 2008.
|
20
Table II - Analysis of Average Daily Balances and Rates
(Dollars in Thousands)
|
Year
|
Year
|
Year
|
||||||||||||||||||||||
|
Ended
|
Rate of
|
Ended
|
Rate of
|
Ended
|
Rate of
|
|||||||||||||||||||
|
12/31/2010
|
Return/
|
12/31/2009
|
Return/
|
12/31/2008
|
Return/
|
|||||||||||||||||||
|
Average
|
Cost of
|
Average
|
Cost of
|
Average
|
Cost of
|
|||||||||||||||||||
|
Balance
|
Funds %
|
Balance
|
Funds %
|
Balance
|
Funds %
|
|||||||||||||||||||
|
EARNING ASSETS
|
||||||||||||||||||||||||
|
Available-for-sale securities, at amortized cost:
|
||||||||||||||||||||||||
|
Taxable
|
$ | 314,462 | 3.61 | % | $ | 342,332 | 4.82 | % | $ | 379,999 | 5.35 | % | ||||||||||||
|
Tax-exempt
|
113,058 | 6.33 | % | 97,491 | 6.71 | % | 69,232 | 6.65 | % | |||||||||||||||
|
Total available-for-sale securities
|
427,520 | 4.33 | % | 439,823 | 5.24 | % | 449,231 | 5.55 | % | |||||||||||||||
|
Held-to-maturity securities,
|
||||||||||||||||||||||||
|
Taxable
|
38 | 5.27 | % | 373 | 5.63 | % | 408 | 5.64 | % | |||||||||||||||
|
Trading securities
|
29 | 6.99 | % | 1,005 | 6.37 | % | 2,069 | 6.23 | % | |||||||||||||||
|
Interest-bearing due from banks
|
54,655 | 0.23 | % | 29,348 | 0.21 | % | 2,385 | 1.38 | % | |||||||||||||||
|
Federal funds sold
|
48 | 0.00 | % | 8,983 | 0.17 | % | 5,038 | 2.38 | % | |||||||||||||||
|
Loans:
|
||||||||||||||||||||||||
|
Taxable
|
687,520 | 6.43 | % | 689,275 | 6.56 | % | 709,377 | 6.90 | % | |||||||||||||||
|
Tax-exempt
|
35,798 | 6.55 | % | 39,473 | 6.18 | % | 34,364 | 6.54 | % | |||||||||||||||
|
Total loans
|
723,318 | 6.44 | % | 728,748 | 6.54 | % | 743,741 | 6.88 | % | |||||||||||||||
|
Total Earning Assets
|
1,205,608 | 5.41 | % | 1,208,280 | 5.87 | % | 1,202,872 | 6.35 | % | |||||||||||||||
|
Cash
|
17,505 | 17,042 | 19,299 | |||||||||||||||||||||
|
Unrealized gain/loss on securities
|
2,555 | (24,334 | ) | (24,877 | ) | |||||||||||||||||||
|
Allowance for loan losses
|
(8,552 | ) | (7,914 | ) | (8,765 | ) | ||||||||||||||||||
|
Bank premises and equipment
|
23,522 | 25,239 | 27,044 | |||||||||||||||||||||
|
Intangible Asset - Core Deposit Intangible
|
417 | 669 | 1,113 | |||||||||||||||||||||
|
Intangible Asset - Goodwill
|
11,942 | 11,953 | 12,023 | |||||||||||||||||||||
|
Other assets
|
73,148 | 65,151 | 52,215 | |||||||||||||||||||||
|
Total Assets
|
$ | 1,326,145 | $ | 1,296,086 | $ | 1,280,924 | ||||||||||||||||||
|
INTEREST-BEARING LIABILITIES
|
||||||||||||||||||||||||
|
Interest-bearing deposits:
|
||||||||||||||||||||||||
|
Interest checking
|
$ | 147,494 | 0.54 | % | $ | 104,444 | 0.86 | % | $ | 82,795 | 1.26 | % | ||||||||||||
|
Money market
|
203,191 | 0.43 | % | 200,982 | 1.00 | % | 193,800 | 2.15 | % | |||||||||||||||
|
Savings
|
78,012 | 0.25 | % | 69,002 | 0.39 | % | 67,276 | 0.50 | % | |||||||||||||||
|
Certificates of deposit
|
225,542 | 2.24 | % | 226,913 | 2.94 | % | 238,316 | 3.77 | % | |||||||||||||||
|
Individual Retirement Accounts
|
162,754 | 3.06 | % | 154,340 | 3.11 | % | 139,321 | 3.43 | % | |||||||||||||||
|
Other time deposits
|
1,242 | 0.48 | % | 1,276 | 0.47 | % | 1,306 | 0.46 | % | |||||||||||||||
|
Total interest-bearing deposits
|
818,235 | 1.46 | % | 756,957 | 1.94 | % | 722,814 | 2.67 | % | |||||||||||||||
|
Borrowed funds:
|
||||||||||||||||||||||||
|
Short-term
|
27,563 | 0.64 | % | 38,731 | 1.40 | % | 41,524 | 2.37 | % | |||||||||||||||
|
Long-term
|
175,229 | 4.09 | % | 221,682 | 4.18 | % | 253,164 | 4.24 | % | |||||||||||||||
|
Total borrowed funds
|
202,792 | 3.62 | % | 260,413 | 3.77 | % | 294,688 | 3.98 | % | |||||||||||||||
|
Total Interest-bearing Liabilities
|
1,021,027 | 1.88 | % | 1,017,370 | 2.40 | % | 1,017,502 | 3.05 | % | |||||||||||||||
|
Demand deposits
|
147,380 | 129,746 | 124,900 | |||||||||||||||||||||
|
Other liabilities
|
7,605 | 7,183 | 7,732 | |||||||||||||||||||||
|
Total Liabilities
|
1,176,012 | 1,154,299 | 1,150,134 | |||||||||||||||||||||
|
Stockholders' equity, excluding other comprehensive income/loss
|
148,735 | 158,120 | 147,535 | |||||||||||||||||||||
|
Other comprehensive income/loss
|
1,398 | (16,333 | ) | (16,745 | ) | |||||||||||||||||||
|
Total Stockholders' Equity
|
150,133 | 141,787 | 130,790 | |||||||||||||||||||||
|
Total Liabilities and Stockholders' Equity
|
$ | 1,326,145 | $ | 1,296,086 | $ | 1,280,924 | ||||||||||||||||||
|
Interest Rate Spread
|
3.53 | % | 3.47 | % | 3.30 | % | ||||||||||||||||||
|
Net Interest Income/Earning Assets
|
3.81 | % | 3.84 | % | 3.77 | % | ||||||||||||||||||
|
Total Deposits (Interest-bearing and Demand)
|
$ | 965,615 | $ | 886,703 | $ | 847,714 | ||||||||||||||||||
|
(1)
|
Rates of return on tax-exempt securities and loans are calculated on a fully-taxable equivalent basis, using the Corporation’s marginal federal income tax rate of 34%.
|
|
(2)
|
Nonaccrual loans are included in the loan balances above.
|
21
TABLE III - ANALYSIS OF VOLUME AND RATE CHANGES
|
(In Thousands)
|
Year Ended 12/31/10 vs. 12/31/09
|
Year Ended 12/31/09 vs. 12/31/08
|
||||||||||||||||||||||
|
Change in
|
Change in
|
Total
|
Change in
|
Change in
|
Total
|
|||||||||||||||||||
|
Volume
|
Rate
|
Change
|
Volume
|
Rate
|
Change
|
|||||||||||||||||||
|
EARNING ASSETS
|
||||||||||||||||||||||||
|
Available-for-sale securities:
|
||||||||||||||||||||||||
|
Taxable
|
$ | (1,260 | ) | $ | (3,895 | ) | $ | (5,155 | ) | $ | (1,916 | ) | $ | (1,934 | ) | $ | (3,850 | ) | ||||||
|
Tax-exempt
|
1,001 | (386 | ) | 615 | 1,896 | 42 | 1,938 | |||||||||||||||||
|
Total available-for-sale securities
|
(259 | ) | (4,281 | ) | (4,540 | ) | (20 | ) | (1,892 | ) | (1,912 | ) | ||||||||||||
|
Held-to-maturity securities,
|
||||||||||||||||||||||||
|
Taxable
|
(18 | ) | (1 | ) | (19 | ) | (2 | ) | 0 | (2 | ) | |||||||||||||
|
Trading securities
|
(64 | ) | 2 | (62 | ) | (68 | ) | 3 | (65 | ) | ||||||||||||||
|
Interest-bearing due from banks
|
57 | 6 | 63 | 78 | (50 | ) | 28 | |||||||||||||||||
|
Federal funds sold
|
(7 | ) | (8 | ) | (15 | ) | 54 | (159 | ) | (105 | ) | |||||||||||||
|
Loans:
|
||||||||||||||||||||||||
|
Taxable
|
(115 | ) | (892 | ) | (1,007 | ) | (1,362 | ) | (2,335 | ) | (3,697 | ) | ||||||||||||
|
Tax-exempt
|
(236 | ) | 141 | (95 | ) | 321 | (129 | ) | 192 | |||||||||||||||
|
Total loans
|
(351 | ) | (751 | ) | (1,102 | ) | (1,041 | ) | (2,464 | ) | (3,505 | ) | ||||||||||||
|
Total Interest Income
|
(642 | ) | (5,033 | ) | (5,675 | ) | (999 | ) | (4,562 | ) | (5,561 | ) | ||||||||||||
|
INTEREST-BEARING LIABILITIES
|
||||||||||||||||||||||||
|
Interest-bearing deposits:
|
||||||||||||||||||||||||
|
Interest checking
|
299 | (402 | ) | (103 | ) | 235 | (381 | ) | (146 | ) | ||||||||||||||
|
Money market
|
22 | (1,154 | ) | (1,132 | ) | 149 | (2,307 | ) | (2,158 | ) | ||||||||||||||
|
Savings
|
32 | (110 | ) | (78 | ) | 9 | (72 | ) | (63 | ) | ||||||||||||||
|
Certificates of deposit
|
(40 | ) | (1,572 | ) | (1,612 | ) | (413 | ) | (1,908 | ) | (2,321 | ) | ||||||||||||
|
Individual Retirement Accounts
|
258 | (77 | ) | 181 | 489 | (470 | ) | 19 | ||||||||||||||||
|
Other time deposits
|
0 | 0 | 0 | 0 | 0 | 0 | ||||||||||||||||||
|
Total interest-bearing deposits
|
571 | (3,315 | ) | (2,744 | ) | 469 | (5,138 | ) | (4,669 | ) | ||||||||||||||
|
Borrowed funds:
|
||||||||||||||||||||||||
|
Short-term
|
(127 | ) | (240 | ) | (367 | ) | (62 | ) | (380 | ) | (442 | ) | ||||||||||||
|
Long-term
|
(1,902 | ) | (198 | ) | (2,100 | ) | (1,317 | ) | (165 | ) | (1,482 | ) | ||||||||||||
|
Total borrowed funds
|
(2,029 | ) | (438 | ) | (2,467 | ) | (1,379 | ) | (545 | ) | (1,924 | ) | ||||||||||||
|
Total Interest Expense
|
(1,458 | ) | (3,753 | ) | (5,211 | ) | (910 | ) | (5,683 | ) | (6,593 | ) | ||||||||||||
|
Net Interest Income
|
$ | 816 | $ | (1,280 | ) | $ | (464 | ) | $ | (89 | ) | $ | 1,121 | $ | 1,032 | |||||||||
(1) Changes in interest income on tax-exempt securities and loans are presented on a fully taxable-equivalent basis, using the Corporation’s marginal federal income tax rate of 34%.
(2) The change in interest due to both volume and rates has been allocated to volume and rate changes in proportion to the relationship of the absolute dollar amounts of the change in each.
22
NON-INTEREST INCOME
Years 2010, 2009 and 2008
The table below presents a comparison of non-interest income and excludes realized gains (losses) on available for sale securities, which are discussed in the “Earnings Overview” section of Management’s Discussion and Analysis.
TABLE IV - COMPARISON OF NON-INTEREST INCOME
|
(In Thousands)
|
2010
|
%
Change
|
2009
|
%
Change
|
2008
|
|||||||||||||||
|
Service charges on deposit accounts
|
$ | 4,579 | (4.4 | ) | $ | 4,791 | 7.7 | $ | 4,447 | |||||||||||
|
Service charges and fees
|
858 | 7.8 | 796 | 2.4 | 777 | |||||||||||||||
|
Trust and financial management revenue
|
3,475 | 6.5 | 3,262 | (5.3 | ) | 3,443 | ||||||||||||||
|
Insurance commissions, fees and premiums
|
248 | (15.4 | ) | 293 | (11.7 | ) | 332 | |||||||||||||
|
Increase in cash surrender value of life insurance
|
466 | (7.0 | ) | 501 | (33.9 | ) | 758 | |||||||||||||
|
Interchange revenue from debit card transactions
|
1,678 | 25.4 | 1,338 | 19.3 | 1,122 | |||||||||||||||
|
Net gains from sales of loans
|
761 | 617.9 | 106 | 51.4 | 70 | |||||||||||||||
|
Brokerage revenue
|
465 | 0.2 | 464 | 5.7 | 439 | |||||||||||||||
|
Other operating income
|
1,387 | (5.6 | ) | 1,470 | (16.1 | ) | 1,752 | |||||||||||||
|
Total other operating income before realized gains(losses) on available-for-sale securities, net
|
$ | 13,917 | 6.9 | $ | 13,021 | (0.9 | ) | $ | 13,140 | |||||||||||
Total non-interest income, as shown in Table IV, increased $896,000 (6.9%) in 2010 compared to 2009. In 2009, total non-interest income decreased $119,000 or less than 1% from 2008. Items of significance are as follows:
2010 vs. 2009
Service charges on deposit accounts decreased $212,000 or 4.4% in 2010 compared to 2009. Overdraft fee revenues associated with an overdraft privilege program decreased $215,000 reflecting the impact of limitations imposed on such fees by 2009 federal legislation that requires all consumers to affirmatively “opt in” to the program. The program change became effective in the third quarter of 2010.
Trust and financial management revenue increased $213,000 (6.5%) in 2010 compared to 2009. The value of assets under management is currently $608,843,000 at December 31, 2010, an increase of less than 1% compared to similar values 12 months ago. Fluctuations in the value of assets under management during the year have been mainly associated with fluctuations in the market values of equity securities. Also in 2010, Trust revenues included fees from the settlement of several large estates.
Interchange revenue from debit card transactions has been segregated within the Table IV presentation of “Other operating income” for all periods presented. Interchange revenues are generally associated with the secure processing of electronic banking transactions for both business and individual retail customers. The increase in interchange revenue in 2010 reflects the ongoing national trend for consumers’ increasing usage of debit cards. The significance of this source of revenue, and the 2010 increase, also reflects the impact of the Corporation’s “E-Z Money” checking product, which pays an attractive rate of interest, provided customers use their debit
cards at least 10 times per month and meet other requirements. Management believes this source of revenue may be significantly reduced in the future, perhaps beginning as early as the third quarter 2011, depending on the final resolution of the Federal Reserve’s proposal to greatly reduce the rate the Corporation and other financial institutions will receive from interchange transactions.
Annual totals for net gains from sales of loans are similarly shown in Table IV to illustrate the impact of management’s decision to sell a significant amount of residential mortgage originations into the secondary market. For 2010, the increase in the net gains from sales of loans is almost entirely associated with the Corporation’s participation in the MPF Xtra program administered by the Federal Home Loan Banks of Pittsburgh and Chicago.
Other operating income decreased $83,000 in 2010 compared to 2009. In 2010, the category includes a first quarter gain of $448,000 from the sale of a parcel adjacent to one of the bank operating locations. In 2009, other operating income included $306,000 of rental revenues from the temporary operation of a foreclosed commercial real estate property, as well as a gain of $325,000 on disposition of the property. Net gains from the sale of foreclosed real estate properties in 2010 totaled $108,000, or $202,000 less than the aggregate of these sales in 2009.
23
2009 vs. 2008
Service charges on deposit accounts increased $344,000, or 7.7%, in 2009 as compared to 2008. In 2009, overdraft fee revenues associated with a new overdraft privilege program implemented in the first quarter of 2008 increased $335,000.
Trust and financial management revenue decreased $181,000, or 5.3%, in 2009 as compared to 2008. Trust and financial management revenues are significantly affected by the value of assets under management which were generally lower throughout most of 2009 as compared to 2008.
The increase in the cash surrender value of life insurance decreased $257,000, or 33.9%, in 2009 over 2008. The decrease primarily relates to the changes in the earnings credit rate for the underlying contracts.
Interchange revenue from debit card transactions increased $216,000, or 19.3%, in 2009 as compared to 2008. The increase in 2009 resulted from the same described in the “2010 vs. 2009” section of the Non-interest income discussion.
Other operating income decreased $282,000, or 16.1%, in 2009 as compared to 2008. In 2009, the Corporation received no dividend income on its investment in restricted stock issued by the Federal Home Loan Bank of Pittsburgh, while dividend income on this stock was $334,000 in 2008. In 2008, this category included a gain of $533,000 from the redemption of restricted shares of Visa, resulting from Visa’s initial public offering. In 2009, other operating income included $306,000 of rental revenues from the temporary operation of a foreclosed commercial real estate property, as well as a gain of $325,000 on disposition of the property. Net gains from the sale of
foreclosed real estate properties in 2009 totaled $310,000, or $272,000 more, than the aggregate of these sales in 2008.
NON-INTEREST EXPENSE
Years 2010, 2009 and 2008
As shown in Table V below, total non-interest expense decreased $2,442,000 or 7.2% in 2010 compared to 2009. In 2009, total non-interest expense increased $213,000 or 0.9% in 2009 compared to 2008. Changes of significance are discussed in the narrative that follows:
TABLE V - COMPARISON OF NON-INTEREST EXPENSE
|
(In Thousands)
|
2010
|
% Change
|
2009
|
% Change
|
2008
|
|||||||||||||||
|
Salaries and wages
|
$ | 13,063 | 2.6 | $ | 12,737 | (12.5 | ) | $ | 14,561 | |||||||||||
|
Pensions and other employee benefits
|
3,840 | (2.9 | ) | 3,956 | (5.9 | ) | 4,202 | |||||||||||||
|
Occupancy expense, net
|
2,645 | (3.5 | ) | 2,741 | (4.2 | ) | 2,861 | |||||||||||||
|
Furniture and equipment expense
|
2,103 | (21.5 | ) | 2,679 | 0.7 | 2,661 | ||||||||||||||
|
FDIC Assessments
|
1,450 | (30.7 | ) | 2,092 | 579.2 | 308 | ||||||||||||||
|
Pennsylvania shares tax
|
1,222 | (3.9 | ) | 1,272 | 8.8 | 1,169 | ||||||||||||||
|
Other operating expense
|
7,246 | (15.1 | ) | 8,534 | 7.5 | 7,941 | ||||||||||||||
|
Total Other Expense
|
$ | 31,569 | (7.2 | ) | $ | 34,011 | 0.9 | $ | 33,703 | |||||||||||
2010 vs. 2009
Salaries and wages increased $326,000 or 2.6%. Incentive bonus compensation totaled $1,260,000 in 2010, an increase of $926,000 over 2009. The Corporation’s incentive bonus program includes approximately 70 management employees and provides opportunities for awards based on individual, unit and corporate performance, subject to the Board of Directors’ discretion. In 2009, incentive bonus compensation excluded all senior executives, including the 5 highest compensated as required by the TARP program, and there was no award to any participants for the corporate performance-based portion of the plan for 2009. Base salary costs have been reduced in 2010 due to
net reductions in full-time equivalent employees (281 “FTEs” at December 31, 2010 as compared to 293 FTEs at December 31, 2009), including elimination of one senior executive position. No stock options were awarded in 2010 and, as a result, there was no officers’ incentive stock option expense compared to $205,000 in 2009.
24
Pensions and other employee benefits decreased $116,000 or 2.9%. Within this category, group health insurance costs were $74,000 lower primarily due to favorable rate adjustments determined based on 2009 claims experience.
Occupancy expense decreased $96,000 (3.5%) in 2010 and is associated with reductions in certain building maintenance costs ($49,000), and reductions of seasonal fuel and snow removal costs ($48,000).
Furniture and equipment expense decreased $576,000 (21.5%), with decreases in depreciation ($449,000) related to the core operating system. Also, equipment maintenance costs decreased $82,000 compared to 2009.
FDIC insurance costs decreased $642,000 to $1,450,000 in 2010. The 2009 FDIC insurance costs reflect the impact of a $589,000 special assessment imposed by the FDIC.
Other operating costs decreased $1,288,000 or 15.1%. The category includes a variety of expenses, and the most significant increases and decreases of individual expenses are as follows:
|
|
·
|
Expenses related to foreclosed properties decreased in 2010 by $316,000 compared to 2009, primarily from lower operating expenses associated with one large commercial property that was sold in the fourth quarter of 2009.
|
|
|
·
|
Professional fees associated with the overdraft privilege program decreased $147,000 in 2010.
|
|
|
·
|
Amortization of core deposit intangibles decreased $148,000.
|
|
|
·
|
No stock option expense was incurred in 2010 under the Independent Directors Stock Incentive Plan compared with costs of $68,000 in 2009.
|
|
|
·
|
Certain operating costs, which are substantially discretionary, are lower in 2010. Advertising, certain public relations costs, and certain professional membership dues decreased $176,000 in 2010. Bucktail Life Insurance Company’s operating expenses, primarily for estimated GAAP policy reserves were reduced by $324,000 compared to 2009.
|
2009 vs. 2008
Salaries and wages decreased $1,824,000, or 12.5%. The decrease in salaries and wages reflects the reductions in personnel from an operational process review initiated in 2008. In addition, salaries and wages for 2009 includes a reduction of $848,000 in certain incentive and other compensation costs.
Pension and other employee benefit costs decreased $246,000 in 2009 with $209,000 attributed to a 50% reduction in the employer matching contribution to the Savings and Retirement Plan. Also, the 2008 termination of the defined benefit plan reduced pension costs by an additional $85,000 in 2009.
FDIC Insurance costs increased $1,784,000 to $2,092,000 in 2009. The 2009 FDIC insurance costs reflect the impact of higher rates and higher levels of insured deposits, as well as additional costs of $589,000 associated with a special assessment imposed by the FDIC.
Other operating expense increased $593,000, or 7.5%. This category includes many varieties of expenses, with the most significant increases and decreases in some of the individual expenses, as follows:
|
|
·
|
Other operating expenses include an increase of $353,000 in foreclosed real estate expenses in 2009, primarily associated with one large commercial property.
|
|
|
·
|
Attorney fees increased $71,000 in 2009, primarily as a result of commercial loan collection activities.
|
|
|
·
|
Professional fees associated with an operational process review initiated in 2008 decreased $211,000; however, fees associated with the overdraft privilege program increased $42,000 in 2009.
|
|
|
·
|
Amortization of core deposit intangibles decreased $228,000 in 2009.
|
|
|
·
|
Operating expenses in 2008 were reduced by an insurance claim recovery of $174,000 related to expense that had originally been recorded in the third quarter of 2007.
|
25
INCOME TAXES
In 2010, the provision for income tax was $5,800,000, or 23.3% of pre-tax income. In 2009, the credit for income tax was ($22,655,000), or 36.6% of the pre-tax loss, and in 2008, the provision for income tax was $2,319,000, or 18.7% of pre-tax income. Fluctuations in the tax provision/ pre-tax income rate for these periods include the impact of changes in the average holdings of tax-exempt securities and loans.
The Corporation recognizes deferred tax assets and liabilities based on differences between the financial statement carrying amounts and the tax bases of assets and liabilities. At December 31, 2010, the net deferred tax asset was $16.1 million, down from a balance of approximately $22.0 million at December 31, 2009. The decrease in the net deferred tax asset was primarily attributed to a reduction in the net deferred tax asset as of December 31, 2010 related to other-than-temporary impairment losses on securities to $5.8 million at December 31, 2010 from $16.1 million at December 31, 2009. In addition, the deferred tax asset as of December 31, 2010 includes $2.8 million of net operating loss carryforwards
available after the carryback of both ordinary and capital losses. The Corporation currently expects to fully realize all available tax benefits from the carryforward losses, and therefore has eliminated the valuation allowance of $373,000 previously established at December 31, 2009.
The Corporation regularly reviews deferred tax assets for recoverability based on history of earnings, expectations for future earnings and expected timing of reversals of temporary differences. Realization of deferred tax assets ultimately depends on the existence of sufficient taxable income, including taxable income in prior carryback years, as well as future taxable income. Based on current conditions, management believes the recorded net deferred tax asset at December 31, 2010 is fully realizable, including amounts classified as capital losses from securities.
In the fourth quarter 2009, the Corporation sold some securities for which other-than-temporary impairment losses (OTTI) had been recognized for financial reporting purposes in 2008 and the first nine months of 2009. As a result of these sales, the Corporation realized both ordinary and capital tax losses for 2009, and filed net operating loss carryback returns resulting in tax refunds totaling $4,352,000 received in 2010 from recovery of some of the taxes previously paid for 2006, 2007 and 2008. The Internal Revenue Service (IRS) sent the Corporation an information document request related to the Corporation’s 2009 federal return, as part of an evaluation to determine whether the
return will be examined or accepted without examination. The Corporation has responded to the information document request, and has not yet received a determination from the IRS.
In 2010, the Corporation sold some additional securities for which OTTI losses were recorded in prior years for financial reporting purposes. As a result, management expects the Corporation to have ordinary and capital tax losses for 2010, and the Corporation expects to file a net operating loss carryback return to recover additional taxes previously paid for 2007 and 2008. As reflected in a table in Note 14 to the consolidated financial statements, the refundable tax provision recorded in 2010 totaled approximately $735,000.
A more complete analysis of income taxes is presented in Note 14 to the consolidated financial statements.
SECURITIES
Table VI shows the composition of the investment portfolio at December 31, 2010, 2009 and 2008. Comparison of the amortized cost totals of available-for-sale securities at each year-end presented reflects a reduction of $57,652,000 to $397,055,000 at December 31, 2009 from December 31, 2008. This change was followed by an increase of $48,946,000 to $446,001,000 at December 31, 2010. In 2009, the Corporation shrank its available-for-sale investment portfolio through a combination of sales, not reinvesting cash flow from amortizing securities, and recognition of OTTI on certain securities. This overall contraction was partially offset by purchases of agency bonds, agency collateralized mortgage obligations, and
municipal bonds with relatively short expected lives. During 2010, the Corporation grew its available-for-sale investment portfolio through purchases of municipal bonds and agency collateralized mortgage obligations and continued to focus on purchasing investments with relatively short expected lives. Changes in the investment portfolio are discussed in more detail in the Net Interest Income section of Management’s Discussion and Analysis. As discussed in more detail in Note 7 to the financial statements, in 2010 the Corporation reported net realized gains from available-for-sale securities of $829,000, including the effect of other-than-temporary impairment write-downs of trust preferred securities issued by individual institutions by $320,000, pooled trust-preferred securities by $103,000 and equity securities by $10,000. Management has reviewed the Corporation’s holdings
as of December 31, 2010, and concluded that unrealized losses on all of the securities in an unrealized position are considered temporary. Notes 6 and 7 to the consolidated financial statements provide more detail concerning the Corporation’s processes for evaluating securities for other-than-temporary impairment, and for valuation of trust-preferred securities. Management will continue to closely monitor the status of impaired securities in 2011.
26
TABLE VI - INVESTMENT SECURITIES
|
As of December 31,
|
||||||||||||||||||||||||
|
(In Thousands)
|
2010
|
2009
|
2008
|
|||||||||||||||||||||
|
Amortized
|
Fair
|
Amortized
|
Fair
|
Amortized
|
Fair
|
|||||||||||||||||||
|
Cost
|
Value
|
Cost
|
Value
|
Cost
|
Value
|
|||||||||||||||||||
|
AVAILABLE-FOR-SALE SECURITIES:
|
||||||||||||||||||||||||
|
Obligations of other U.S. Government agencies
|
$ | 44,005 | $ | 44,247 | $ | 48,949 | $ | 48,993 | $ | 15,500 | $ | 16,201 | ||||||||||||
|
Obligations of states and political subdivisions
|
135,018 | 127,542 | 109,109 | 104,990 | 80,838 | 74,223 | ||||||||||||||||||
|
Mortgage-backed securities
|
113,176 | 118,386 | 150,700 | 156,378 | 171,453 | 173,856 | ||||||||||||||||||
|
Collateralized mortgage obligations:
|
||||||||||||||||||||||||
|
Issued by U.S. Government agencies
|
131,040 | 130,826 | 47,083 | 47,708 | 24,082 | 24,262 | ||||||||||||||||||
|
Private label
|
0 | 0 | 15,465 | 15,494 | 46,537 | 43,972 | ||||||||||||||||||
|
Corporate bonds
|
1,000 | 1,027 | 1,000 | 1,041 | 1,000 | 1,117 | ||||||||||||||||||
|
Trust preferred securities issued by individual institutions
|
6,535 | 7,838 | 7,043 | 6,018 | 10,436 | 7,601 | ||||||||||||||||||
|
Collateralized debt obligations:
|
||||||||||||||||||||||||
|
Pooled trust preferred securities - senior tranches
|
9,957 | 7,400 | 11,383 | 8,199 | 11,938 | 8,642 | ||||||||||||||||||
|
Pooled trust preferred securities - mezzanine tranches
|
0 | 0 | 266 | 115 | 70,826 | 50,272 | ||||||||||||||||||
|
Other collateralized debt obligations
|
681 | 681 | 690 | 690 | 692 | 692 | ||||||||||||||||||
|
Total debt securities
|
441,412 | 437,947 | 391,688 | 389,626 | 433,302 | 400,838 | ||||||||||||||||||
|
Marketable equity securities
|
4,589 | 6,009 | 5,367 | 6,662 | 21,405 | 18,850 | ||||||||||||||||||
|
Total
|
$ | 446,001 | $ | 443,956 | $ | 397,055 | $ | 396,288 | $ | 454,707 | $ | 419,688 | ||||||||||||
|
HELD-TO-MATURITY SECURITIES:
|
||||||||||||||||||||||||
|
Obligations of the U.S. Treasury
|
$ | 0 | $ | 0 | $ | 300 | $ | 302 | $ | 304 | $ | 320 | ||||||||||||
|
Obligations of other U.S. Government agencies
|
0 | 0 | 0 | 0 | 100 | 104 | ||||||||||||||||||
|
Mortgage-backed securities
|
0 | 0 | 0 | 0 | 2 | 2 | ||||||||||||||||||
|
Total
|
$ | 0 | $ | 0 | $ | 300 | $ | 302 | $ | 406 | $ | 426 | ||||||||||||
The following table shows the amortized cost and maturity distribution of the available-for-sale debt securities portfolio, along with weighted-average yields, at December 31, 2010:
|
(In Thousands, Except for Percentages)
|
Within
|
One-
|
Five-
|
After
|
||||||||||||||||||||||||||||||||||||
|
One
|
Five
|
Ten
|
Ten
|
|||||||||||||||||||||||||||||||||||||
|
Year
|
Yield
|
Years
|
Yield
|
Years
|
Yield
|
Years
|
Yield
|
Total
|
Yield
|
|||||||||||||||||||||||||||||||
|
AVAILABLE-FOR-SALE SECURITIES:
|
||||||||||||||||||||||||||||||||||||||||
|
Obligations of other U.S. Government agencies
|
$ | 0 | 0.00 | % | $ | 35,928 | 1.45 | % | $ | 8,077 | 3.10 | % | $ | 0 | 0.00 | % | $ | 44,005 | 1.75 | % | ||||||||||||||||||||
|
Obligations of states and political subdivisions
|
6,150 | 1.59 | % | 12,484 | 1.98 | % | 15,437 | 2.37 | % | 100,947 | 4.53 | % | 135,018 | 3.91 | % | |||||||||||||||||||||||||
|
Mortgage-backed securities
|
0 | 0.00 | % | 65 | 3.60 | % | 14,266 | 2.96 | % | 98,845 | 4.24 | % | 113,176 | 4.08 | % | |||||||||||||||||||||||||
|
Collateralized mortgage obligations,
|
||||||||||||||||||||||||||||||||||||||||
|
Issued by U.S. Government agencies
|
0 | 0.00 | % | 0 | 0.00 | % | 20,713 | 1.71 | % | 110,327 | 2.63 | % | 131,040 | 2.49 | % | |||||||||||||||||||||||||
|
Corporate bonds
|
1,000 | 8.09 | % | 0 | 0.00 | % | 0 | 0.00 | % | 0 | 0.00 | % | 1,000 | 8.09 | % | |||||||||||||||||||||||||
|
Trust preferred securities issued by individual institutions
|
0 | 0.00 | % | 320 | 146.72 | % | 0 | 0.00 | % | 6,215 | 9.09 | % | 6,535 | 15.83 | % | |||||||||||||||||||||||||
|
Collateralized debt obligations:
|
||||||||||||||||||||||||||||||||||||||||
|
Pooled trust preferred securities - senior tranches
|
0 | 0.00 | % | 0 | 0.00 | % | 0 | 0.00 | % | 9,957 | 7.09 | % | 9,957 | 7.09 | % | |||||||||||||||||||||||||
|
Other collateralized debt obligations
|
0 | 0.00 | % | 0 | 0.00 | % | 0 | 0.00 | % | 681 | 0.00 | % | 681 | 0.00 | % | |||||||||||||||||||||||||
|
Total
|
$ | 7,150 | 2.50 | % | $ | 48,797 | 2.54 | % | $ | 58,493 | 2.38 | % | $ | 326,972 | 3.96 | % | $ | 441,412 | 3.57 | % | ||||||||||||||||||||
27
In 2009, the Corporation recorded OTTI of $3,209,000 on its holding of a trust preferred security issued by Carolina First Mortgage Loan Trust, a subsidiary of The South Financial Group, Inc., and the Corporation also ceased accruing interest income on the security. In January 2010, The South Financial Group, Inc. began deferring its interest payments on the security. In April 2010, the Corporation sold half of its investment in the security, and in the first quarter 2010 recorded OTTI of $320,000 to further write down amortized cost based on the selling price of the April transaction.
In the fourth quarter 2010, The Toronto-Dominion Bank acquired The South Financial Group, Inc., made a payment for the full amount of previously deferred interest totaling $88,000, and resumed quarterly payments on the security. The Corporation recognized a material change in the expected cash flows and began recording accretion income (included in interest income) to offset the previous OTTI charges as an adjustment to the security’s yield over its remaining life. The estimated yield to maturity, reflected in the table above, is 146.72%. The security has a face amount of $2 million, matures in May 2012, and has an interest rate which adjusts quarterly based on 3-month LIBOR. The security had an amortized
cost of $320,000 and a fair value of $2,014,000 at December 31, 2010.
The actual and estimated future amounts of accretion income from this security are as follows:
|
(In Thousands)
|
||||
|
Accretion of
|
||||
|
Prior OTTI
|
||||
|
4th Quarter 2010 (Actual)
|
$ | 83 | ||
|
1st Quarter 2011 (Estimated)
|
112 | |||
|
2nd Quarter 2011 (Estimated)
|
160 | |||
|
3rd Quarter 2011 (Estimated)
|
229 | |||
|
4th Quarter 2011 (Estimated)
|
325 | |||
|
1st Quarter 2012 (Estimated)
|
457 | |||
|
2nd Quarter 2012 (Estimated)
|
397 | |||
|
Total
|
$ | 1,763 | ||
28
FINANCIAL CONDITION
Significant changes in the average balances of the Corporation’s earning assets and interest-bearing liabilities are described in the Net Interest Income section of Management’s Discussion and Analysis. The discussion provides useful information regarding changes in the Corporation’s balance sheet over the 2-year period ended December 31, 2010, including discussions related to available-for-sale securities, loans, deposits and borrowings. Other significant balance sheet items - the allowance for loan losses and stockholders’ equity - are discussed in separate sections of Management’s Discussion and Analysis. Other Assets decreased significantly at
December 31, 2010, to $21,503,000 from $30,678,000 at December 31, 2009. Other Assets at December 31, 2009 included a balance receivable for income taxes paid in 2009, as well as carry-back for recovery of some tax paid for 2006-2008, totaling approximately $8.1 million which was collected in 2010.
The total of loans outstanding (without consideration of the allowance for loan losses) reflects total growth of $42,910,000 from the balance at December 31, 2006 to the total outstanding of $730,411,000 at December 31, 2010. The most significant increase of $60,151,000 came from balances acquired from Citizens Bancorp, Inc. in 2007. Total loans have fallen slightly (0.8%) since the end of 2007. Loan volumes are heavily dependent on economic conditions in the Corporation’s market area, and are significantly influenced by interest rates. Since the end of 2007, the Corporation experienced a net decrease in total loans outstanding under the consumer mortgage segment
($23,309,000) with more residential mortgage originations than in previous years sold into the secondary market. In September 2009, the Corporation initiated participation in the MPF Xtra program administered by the Federal Home Loan Banks of Pittsburgh and Chicago for the sale of mortgage loans to the secondary market. Also, in the last three years, consumer loans have steadily decreased ($22,197,000) to the December 31, 2010 balance of $14,996,000. Total commercial segment loans have increased $39,976,000 from December 31, 2007 to December 31, 2010.
Table VIII presents loan maturity data as of October 31, 2010 (the last date in 2010 for which the Corporation ran the interest rate simulation model used to generate the loan maturities information included in Table VIII). The interest rate simulation model classifies certain loans under different categories than they appear in Table VII. Fixed rate loans are included in Table VIII based on their contractually scheduled principal repayments, while variable rate loans are included based on contractual principal repayments, with the remaining balance reflected in the Table as of the date of the next change in rate. Table VIII shows that fixed rate loans are approximately 43% of the
loan portfolio. Of the 57% of the portfolio made up of variable rate loans, a significant portion (31%) will re-price after more than one year. Variable rate loans re-pricing after more than one year include significant amounts of residential and commercial real estate loans. The Corporation’s substantial investment in long-term, fixed rate loans and variable rate loans with extended periods until re-pricing is one of the concerns management attempts to address through interest rate risk management practices. See Part II, Item 7A for a more detailed discussion of the Corporation’s interest rate risk.
Total future capital purchases in 2011 are estimated at approximately $1.9 million. Management does not expect capital expenditures to have a material, detrimental effect on the Corporation’s financial condition during 2011.
29
TABLE VII - FIVE-YEAR SUMMARY OF LOANS BY TYPE
(In Thousands)
|
2010
|
%
|
2009
|
%
|
2008
|
%
|
2007
|
%
|
2006
|
%
|
|||||||||||||||||||||||||||||||
|
Consumer mortgage:
|
||||||||||||||||||||||||||||||||||||||||
|
Residential mortgage loans - first liens
|
$ | 333,012 | 45.6 | $ | 340,268 | 47.2 | $ | 353,909 | 47.6 | $ | 363,467 | 49.4 | $ | 325,107 | 47.3 | |||||||||||||||||||||||||
|
Residential mortgage loans - junior liens
|
31,590 | 4.3 | 35,734 | 5.0 | 40,657 | 5.5 | 40,392 | 5.5 | 30,074 | 4.4 | ||||||||||||||||||||||||||||||
|
Home equity lines of credit
|
26,853 | 3.7 | 23,577 | 3.3 | 21,304 | 2.9 | 20,542 | 2.8 | 18,472 | 2.7 | ||||||||||||||||||||||||||||||
|
1-4 Family residential construction
|
14,379 | 2.0 | 11,452 | 1.6 | 11,262 | 1.5 | 4,742 | 0.6 | 0 | 0.0 | ||||||||||||||||||||||||||||||
|
Total consumer mortgage
|
405,834 | 55.6 | 411,031 | 57.0 | 427,132 | 57.4 | 429,143 | 58.3 | 373,653 | 54.3 | ||||||||||||||||||||||||||||||
|
Commercial:
|
||||||||||||||||||||||||||||||||||||||||
|
Commercial loans secured by real estate
|
167,094 | 22.9 | 163,483 | 22.7 | 165,979 | 22.3 | 144,742 | 19.7 | 178,260 | 25.9 | ||||||||||||||||||||||||||||||
|
Commercial and industrial
|
59,005 | 8.1 | 49,753 | 6.9 | 48,295 | 6.5 | 52,241 | 7.1 | 39,135 | 5.7 | ||||||||||||||||||||||||||||||
|
Political subdivisions
|
36,480 | 5.0 | 37,598 | 5.2 | 38,790 | 5.2 | 33,013 | 4.5 | 32,407 | 4.7 | ||||||||||||||||||||||||||||||
|
Commercial construction
|
24,004 | 3.3 | 15,264 | 2.1 | 13,730 | 1.8 | 17,755 | 2.4 | 10,365 | 1.5 | ||||||||||||||||||||||||||||||
|
Loans secured by farmland
|
11,353 | 1.6 | 11,856 | 1.6 | 9,140 | 1.2 | 8,287 | 1.1 | 6,968 | 1.0 | ||||||||||||||||||||||||||||||
|
Multi-family (5 or more) residential
|
7,781 | 1.1 | 8,338 | 1.2 | 8,367 | 1.1 | 9,004 | 1.2 | 6,790 | 1.0 | ||||||||||||||||||||||||||||||
|
Agricultural loans
|
3,472 | 0.5 | 3,848 | 0.5 | 4,495 | 0.6 | 3,553 | 0.5 | 2,705 | 0.4 | ||||||||||||||||||||||||||||||
|
Other commercial loans
|
392 | 0.1 | 638 | 0.1 | 884 | 0.1 | 1,010 | 0.1 | 1,226 | 0.2 | ||||||||||||||||||||||||||||||
|
Total
commercial
|
309,581 | 42.4 | 290,778 | 40.3 | 289,680 | 39.0 | 269,605 | 36.6 | 277,856 | 40.4 | ||||||||||||||||||||||||||||||
|
Consumer
|
14,996 | 2.1 | 19,202 | 2.7 | 26,732 | 3.6 | 37,193 | 5.1 | 35,992 | 5.2 | ||||||||||||||||||||||||||||||
|
Total
|
730,411 | 100.0 | 721,011 | 100.0 | 743,544 | 100.0 | 735,941 | 100.0 | 687,501 | 100.0 | ||||||||||||||||||||||||||||||
|
Less: allowance for loan losses
|
(9,107 | ) | (8,265 | ) | (7,857 | ) | (8,859 | ) | (8,201 | ) | ||||||||||||||||||||||||||||||
|
Loans, net
|
$ | 721,304 | $ | 712,746 | $ | 735,687 | $ | 727,082 | $ | 679,300 | ||||||||||||||||||||||||||||||
TABLE VIII – LOAN MATURITY DISTRIBUTION
(In Thousands) As of October 31, 2010
|
Fixed Rate Loans
|
Variable or Adjustable Rate Loans
|
|||||||||||||||||||||||||||||||
|
1 Year
|
1-5 |
>5
|
1 Year
|
1-5 |
>5
|
|||||||||||||||||||||||||||
|
or Less
|
Years
|
Years
|
Total
|
or Less
|
Years
|
Years
|
Total
|
|||||||||||||||||||||||||
|
Real Estate
|
$ | 663 | $ | 30,466 | $ | 227,922 | $ | 259,051 | $ | 116,356 | $ | 203,885 | $ | 1,243 | $ | 321,484 | ||||||||||||||||
|
Commercial
|
16,479 | 15,541 | 7,363 | 39,383 | 68,461 | 22,306 | 1,767 | 92,534 | ||||||||||||||||||||||||
|
Consumer
|
3,811 | 7,242 | 3,944 | 14,997 | 340 | 26 | 0 | 366 | ||||||||||||||||||||||||
|
Total
|
$ | 20,953 | $ | 53,249 | $ | 239,229 | $ | 313,431 | $ | 185,157 | $ | 226,217 | $ | 3,010 | $ | 414,384 | ||||||||||||||||
PROVISION AND ALLOWANCE FOR LOAN LOSSES
The Corporation maintains an allowance for loan losses that represents management’s estimate of the losses inherent in the loan portfolio as of the balance sheet date and recorded as a reduction of the investment in loans. Notes 1 and 8 to the consolidated financial statements provide an overview of the process management uses for evaluating and determining the allowance for loan losses.
While management uses available information to recognize losses on loans, changes in economic conditions may necessitate revisions in future years. In addition, various regulatory agencies, as an integral part of their examination process, periodically review the Corporation’s allowance for loan losses. Such agencies may require the Corporation to recognize adjustments to the allowance based on their judgments of information available to them at the time of their examination.
30
The allowance for loan losses of $9,107,000 at December 31, 2010 increased $842,000 from the total of $8,265,000 at December 31, 2009. The specific component related to impaired loans increased $1,162,000 during 2010 and was primarily attributed to five unrelated commercial relationships. The provision for loan losses increased to $1,191,000 in 2010 from $680,000 in 2009, with the higher provision in 2010 attributable to the increased allowance required on impaired commercial loans. The total amount of the provision for loan losses for each year is determined based on the amount required to maintain an appropriate allowance in light of all of the factors described above
and in the notes to the consolidated financial statements. As shown in Table IX, net charge-offs in 2010 were $349,000 compared to $272,000 in 2009 and $1,911,000 in 2008. Net charge-offs in 2008 were substantially higher by comparison with other recent historical levels of $458,000 in 2007 and $832,000 in 2006 as a result of charge-offs in 2008 of $1,414,000 from four large commercial relationships.
The allocation of the allowance for loan losses table (Table X) includes the specific (FASB ASC 310) component of the allowance on the line item called “Impaired Loans.” The general component (FASB ASC 450) of estimated losses, including both the portion determined based on historical net charge-off results, as well as the portion based on management’s assessment of qualitative factors, are allocated in Table X to the applicable segments of consumer mortgage, commercial or consumer loans. As of December 31, 2010, the specific valuation allowance on impaired loans includes $1,671,000 related to five unrelated commercial relationships compared with $716,000 related to two
unrelated commercial relationships at the end of 2009. Table X reflects a reduction in the collectively evaluated allowance on consumer mortgage loans, primarily because the three-year average rate of net charge-offs (used in the general allowance calculation) for that category of loans was lower at December 31, 2010 than it was as of the previous year-end. Table X shows an increase in the collectively evaluated allowance on commercial loans, mainly because of an increase in the balance of commercial loans outstanding.
Table XI presents information related to past due and impaired loans, and nonperforming assets. As of December 31, 2010, total impaired loans amounted to $5,457,000, which is comparable to total impaired loans of $5,947,000 at December 31, 2009 as well as the previous year levels of $5,665,000 in 2008, $6,218,000 in 2007, and $8,011,000 in 2006. Total nonperforming assets increased to $12,073,000 at December 31, 2010 from $9,996,000 at December 31, 2009. The level of nonperforming assets as a percentage of assets of 0.92% at December 31, 2010 is low by current banking industry standards, but slightly higher than the Corporation’s levels over 2006-2009. Over the period
2006-2010, each period includes a few large commercial relationships that have required significant monitoring and workout efforts. As a result, a limited number of relationships have significantly impacted category fluctuations within Table XI.
Management believes it has been conservative in its decisions concerning identification of impaired loans, estimates of loss, and nonaccrual status; however, the actual losses realized from these relationships could vary materially from the allowances calculated as of December 31, 2010. Management continues to closely monitor its commercial loan relationships for possible credit losses, and will adjust its estimates of loss and decisions concerning nonaccrual status, if appropriate.
Tables IX through XII present historical data related to the allowance for loan losses.
31
TABLE IX - ANALYSIS OF THE ALLOWANCE FOR LOAN LOSSES
| (In Thousands) | Years Ended December 31, | |||||||||||||||||||
|
2010
|
2009
|
2008
|
2007
|
2006
|
||||||||||||||||
|
Balance, beginning of year
|
$ | 8,265 | $ | 7,857 | $ | 8,859 | $ | 8,201 | $ | 8,361 | ||||||||||
|
Charge-offs:
|
||||||||||||||||||||
|
Commercial
|
(38 | ) | (36 | ) | (323 | ) | (127 | ) | (200 | ) | ||||||||||
|
Commercial real estate
|
(53 | ) | (3 | ) | (1,284 | ) | (47 | ) | 0 | |||||||||||
|
Consumer mortgage
|
(340 | ) | (146 | ) | (173 | ) | (149 | ) | (611 | ) | ||||||||||
|
Consumer
|
(188 | ) | (293 | ) | (259 | ) | (221 | ) | (281 | ) | ||||||||||
|
Total charge-offs
|
(619 | ) | (478 | ) | (2,039 | ) | (544 | ) | (1,092 | ) | ||||||||||
|
Recoveries:
|
||||||||||||||||||||
|
Commercial
|
113 | 77 | 21 | 28 | 143 | |||||||||||||||
|
Commercial real estate
|
0 | 0 | 1 | 3 | 16 | |||||||||||||||
|
Consumer mortgage
|
55 | 8 | 19 | 5 | 11 | |||||||||||||||
|
Consumer
|
102 | 121 | 87 | 50 | 90 | |||||||||||||||
|
Total recoveries
|
270 | 206 | 128 | 86 | 260 | |||||||||||||||
|
Net charge-offs
|
(349 | ) | (272 | ) | (1,911 | ) | (458 | ) | (832 | ) | ||||||||||
|
Allowance recorded in acquisition
|
0 | 0 | 0 | 587 | 0 | |||||||||||||||
|
Provision for losses
|
1,191 | 680 | 909 | 529 | 672 | |||||||||||||||
|
Balance, end of year
|
$ | 9,107 | $ | 8,265 | $ | 7,857 | $ | 8,859 | $ | 8,201 | ||||||||||
TABLE X - ALLOCATION OF THE ALLOWANCE FOR LOAN LOSSES
(In Thousands)
|
2010
|
2009
|
2008
|
2007
|
2006
|
||||||||||||||||
|
Impaired loans
|
$ | 2,288 | $ | 1,126 | $ | 456 | $ | 2,255 | $ | 1,726 | ||||||||||
|
Consumer mortgage
|
3,227 | 3,859 | 3,920 | 4,201 | 3,556 | |||||||||||||||
|
Commercial
|
3,047 | 2,677 | 2,654 | 1,870 | 2,372 | |||||||||||||||
|
Consumer
|
232 | 281 | 399 | 533 | 523 | |||||||||||||||
|
Unallocated
|
313 | 322 | 428 | 0 | 24 | |||||||||||||||
|
Total Allowance
|
$ | 9,107 | $ | 8,265 | $ | 7,857 | $ | 8,859 | $ | 8,201 | ||||||||||
The above allocation is based on estimates and subjective judgments and is not necessarily indicative of the specific amounts or loan categories in which losses may occur.
TABLE XI – PAST DUE AND IMPAIRED LOANS AND NONPERFORMING ASSETS
(In Thousands)
|
2010
|
2009
|
2008
|
2007
|
2006
|
||||||||||||||||
|
Impaired loans with a valuation allowance
|
$ | 5,457 | $ | 2,690 | $ | 2,230 | $ | 5,361 | $ | 5,337 | ||||||||||
|
Impaired loans without a valuation allowance
|
0 | 3,257 | 3,435 | 857 | 2,674 | |||||||||||||||
|
Total impaired loans
|
$ | 5,457 | $ | 5,947 | $ | 5,665 | $ | 6,218 | $ | 8,011 | ||||||||||
|
Restructured loans (troubled debt restructurings)
|
$ | 645 | $ | 326 | $ | 0 | $ | 0 | $ | 111 | ||||||||||
|
Total loans past due 30-89 days and still accruing
|
$ | 7,125 | $ | 9,445 | $ | 9,875 | $ | 10,822 | $ | 8,580 | ||||||||||
|
Nonperforming assets:
|
||||||||||||||||||||
|
Total loans past due 90 days or more and
|
||||||||||||||||||||
|
still accruing
|
$ | 727 | $ | 31 | $ | 1,305 | $ | 1,200 | $ | 1,559 | ||||||||||
|
Total nonaccrual loans
|
10,809 | 9,092 | 7,200 | 6,955 | 8,506 | |||||||||||||||
|
Foreclosed assets held for sale (real estate)
|
537 | 873 | 298 | 258 | 264 | |||||||||||||||
|
Total nonperforming assets
|
$ | 12,073 | $ | 9,996 | $ | 8,803 | $ | 8,413 | $ | 10,329 | ||||||||||
|
Total nonperforming assets as a % of assets
|
0.92 | % | 0.76 | % | 0.69 | % | 0.66 | % | 0.78 | % | ||||||||||
32
TABLE XII - FIVE-YEAR HISTORY OF LOAN LOSSES (In Thousands)
|
2010
|
2009
|
2008
|
2007
|
2006
|
Average
|
|||||||||||||||||||
|
Average gross loans
|
$ | 723,318 | $ | 728,748 | $ | 743,741 | $ | 729,269 | $ | 662,714 | $ | 717,558 | ||||||||||||
|
Year-end gross loans
|
730,411 | 721,603 | 743,544 | 735,941 | 687,501 | 723,800 | ||||||||||||||||||
|
Year-end allowance for loan losses
|
9,107 | 8,265 | 7,857 | 8,859 | 8,201 | 8,458 | ||||||||||||||||||
|
Year-end nonaccrual loans
|
10,809 | 9,092 | 7,200 | 6,955 | 8,506 | 8,512 | ||||||||||||||||||
|
Year-end loans 90 days or more
|
||||||||||||||||||||||||
|
past due and still accruing
|
727 | 31 | 1,305 | 1,200 | 1,559 | 964 | ||||||||||||||||||
|
Net charge-offs
|
349 | 272 | 1,911 | 458 | 832 | 764 | ||||||||||||||||||
|
Provision for loan losses
|
1,191 | 680 | 909 | 529 | 672 | 796 | ||||||||||||||||||
|
Earnings coverage of charge-offs
|
55 | (145 | ) | 5 | 23 | 14 | 3 | |||||||||||||||||
|
Allowance coverage of charge-offs
|
26 | 30 | 4 | 19 | 10 | 11 | ||||||||||||||||||
|
Net charge-offs as a % of
|
||||||||||||||||||||||||
|
provision for loan losses
|
29.30 | % | 40.00 | % | 210.23 | % | 86.58 | % | 123.81 | % | 95.98 | % | ||||||||||||
|
Net charge-offs as a % of
|
||||||||||||||||||||||||
|
average gross loans
|
0.05 | % | 0.04 | % | 0.26 | % | 0.06 | % | 0.13 | % | 0.11 | % | ||||||||||||
|
Net income (loss)
|
19,055 | (39,335 | ) | 10,059 | 10,424 | 11,986 | 2,438 | |||||||||||||||||
CONTRACTUAL OBLIGATIONS AND OFF-BALANCE SHEET ARRANGEMENTS
Table XIII presents the Corporation’s significant fixed and determinable contractual obligations as of December 31, 2010
by payment date. The payment amounts represent the principal amounts of time deposits and borrowings, and do not include interest.
TABLE XIII – CONTRACTUAL OBLIGATIONS
(In Thousands)
|
1 Year
|
1-3 | 3-5 |
Over 5
|
|||||||||||||||||
|
Contractual Obligations
|
or Less
|
Years
|
Years
|
Years
|
Total
|
|||||||||||||||
|
Time deposits
|
$ | 196,052 | $ | 157,328 | $ | 25,748 | $ | 39 | $ | 379,167 | ||||||||||
|
Long-term borrowings:
|
||||||||||||||||||||
|
Federal Home Loan Bank of Pittsburgh
|
15,000 | 27,412 | 0 | 13,583 | 55,995 | |||||||||||||||
|
Repurchase agreements
|
7,500 | 5,000 | 0 | 80,000 | 92,500 | |||||||||||||||
|
Total
|
$ | 218,552 | $ | 189,740 | $ | 25,748 | $ | 93,622 | $ | 527,662 | ||||||||||
In addition to the amounts described in Table XIII, the Corporation has obligations related to deposits without a stated maturity with outstanding principal balances totaling $625,181,000 at December 31, 2010. The Corporation also has obligations related to overnight customer repurchase agreements with principal balances totaling $18,413,000 at December 31, 2010.
The Corporation’s significant off-balance sheet arrangements consist of commitments to extend credit and standby letters of credit. Off-balance sheet arrangements are described in Note 16 to the consolidated financial statements.
33
LIQUIDITY
Liquidity is the ability to quickly raise cash at a reasonable cost. An adequate liquidity position permits the Corporation to pay creditors, compensate for unforeseen deposit fluctuations and fund unexpected loan demand. At December 31, 2010, the Corporation maintained overnight interest-bearing deposits with the Federal Reserve Bank of Philadelphia and other correspondent banks totaling $29,461,000.
The Corporation maintains overnight borrowing facilities with several correspondent banks that provide a source of day-to-day liquidity. Also, the Corporation maintains borrowing facilities with the Federal Home Loan Bank of Pittsburgh, secured by various mortgage loans.
The Corporation has a line of credit with the Federal Reserve Bank of Philadelphia’s Discount Window. Management intends to use this line of credit as a contingency funding source. As collateral for the line, the Corporation has pledged available-for-sale securities with a carrying value of $27,655,000 at December 31, 2010.
The Corporation’s outstanding, available, and total credit facilities are presented in the following table.
TABLE XIV – CREDIT FACILITIES
|
Outstanding
|
Available
|
Total Credit
|
||||||||||||||||||||||
|
(In Thousands)
|
Dec. 31,
|
Dec. 31,
|
Dec. 31,
|
Dec. 31,
|
Dec. 31,
|
Dec. 31,
|
||||||||||||||||||
|
2010
|
2009
|
2010
|
2009
|
2010
|
2009
|
|||||||||||||||||||
|
Federal Home Loan Bank of Pittsburgh
|
$ | 55,995 | $ | 133,602 | $ | 304,584 | $ | 210,954 | $ | 360,579 | $ | 344,556 | ||||||||||||
|
Federal Reserve Bank Discount Window
|
0 | 0 | 26,274 | 25,802 | 26,274 | 25,802 | ||||||||||||||||||
|
Other correspondent banks
|
0 | 0 | 25,000 | 29,722 | 25,000 | 29,722 | ||||||||||||||||||
|
Total credit facilities
|
$ | 55,995 | $ | 133,602 | $ | 355,858 | $ | 266,478 | $ | 411,853 | $ | 400,080 | ||||||||||||
At December 31, 2010, the Corporation’s outstanding credit facilities with the Federal Home Loan Bank of Pittsburgh consisted of long-term borrowings. No letters of credit were outstanding. At December 31, 2009, the Corporation’s outstanding credit facilities with the Federal Home Loan Bank of Pittsburgh consisted of long-term borrowings with a total notional amount of $103,602,000 and a letter of credit in the amount of $30,000,000.
Additionally, the Corporation uses repurchase agreements placed with brokers to borrow funds secured by investment assets, and uses “RepoSweep” arrangements to borrow funds from commercial banking customers on an overnight basis. If required to raise cash in an emergency situation, the Corporation could sell non-pledged investment securities to meet its obligations. At December 31, 2010, the carrying value of non-pledged available-for-sale securities was $53,424,000.
Management believes the Corporation is well-positioned to meet its short-term and long-term obligations.
STOCKHOLDERS’ EQUITY AND CAPITAL ADEQUACY
The Corporation and C&N Bank are subject to various regulatory capital requirements administered by the federal banking agencies. Details concerning regulatory capital amounts and ratios are presented in Note 18 to the consolidated financial statements. As reflected in Note 18, at December 31, 2010 and 2009, the ratios of total capital to risk-weighted assets, tier 1 capital to risk-weighted assets and tier 1 capital to average total assets are well in excess of regulatory capital requirements.
In January 2009, the Corporation issued Preferred Stock and a Warrant to purchase up to 194,794 shares of common stock at an exercise price of $20.36 per share to the United States Department of the Treasury under the TARP Program for an aggregate price of $26,440,000. The Preferred Stock paid a cumulative dividend rate of 5% per annum. On August 4, 2010, the Corporation redeemed all of the Preferred Stock. Subsequently, the Corporation negotiated with the Treasury for repurchase of the Warrant on September 1, 2010 for a total cash cost of $400,000, which was recorded as a reduction in paid-in capital. As a result, the Corporation is no longer subject to the requirements
and limitations of the TARP program.
34
In 2009, the Corporation issued approximately 3,090,000 shares of common stock, raising a total of $24,585,000, net of related offering costs. Of this total, 2,875,000 shares were issued at a price of $8.00 per share in a public offering that was completed in December 2009, and which resulted in net proceeds of $21,410,000 (included in the $24,585,000 for the year). The additional $3,175,000 was raised through the issuance of shares under our dividend reinvestment plan. Although the Corporation maintained capital ratios that exceeded regulatory requirements to be considered well capitalized throughout 2009, the additional capital provides flexibility to absorb any additional,
unexpected securities losses or other economic issues that might arise. Further, the additional capital provided funding for repayment of the TARP Preferred Stock in 2010, and improves the Corporation’s ability to respond to any opportunities that could arise for branch or full-bank acquisitions.
Future dividend payments will depend upon maintenance of a strong financial condition, future earnings and capital and regulatory requirements. In addition, the Corporation, and C&N Bank are subject to restrictions on the amount of dividends that may be paid without approval of banking regulatory authorities. These restrictions are described in Note 19 to the consolidated financial statements.
The Corporation’s total stockholders’ equity is affected by fluctuations in the fair values of available-for-sale securities. The difference between amortized cost and fair value of available-for-sale securities, net of deferred income tax, is included in “Accumulated Other Comprehensive (Loss) Income” within stockholders’ equity. The balance in Accumulated Other Comprehensive (Loss) Income related to unrealized gains or losses on available-for-sale securities, net of deferred income tax, amounted to ($1,351,000) at December 31, 2010 and ($522,000) at December 31, 2009. Changes in accumulated other comprehensive income are excluded from earnings and
directly increase or decrease stockholders’ equity. If available-for-sale securities are deemed to be other-than-temporarily impaired, unrealized losses are recorded as a charge against earnings, and amortized cost for the affected securities is reduced. Note 7 to the consolidated financial statements provides additional information concerning management’s evaluation of available-for-sale securities for other-than-temporary impairment at December 31, 2010.
Stockholders’ equity is also affected by the underfunded or overfunded status of defined benefit pension and postretirement plans. The balance in Accumulated Other Comprehensive (Loss) Income related to underfunded defined benefit plans, net of deferred income tax, was ($250,000) at December 31, 2010 and ($369,000) at December 31, 2009.
COMPREHENSIVE INCOME (LOSS)
Comprehensive income or loss is a measure of the change in equity of a corporation, excluding transactions with owners in their capacity as owners (such as proceeds from issuances of stock and dividends). The difference between net income and comprehensive income is termed "Other Comprehensive Income (Loss)". Comprehensive income or loss should not be construed to be a measure of net income. For the Corporation, other comprehensive income includes unrealized gains and losses on available-for-sale securities, net of deferred income tax. The amount of unrealized gains or losses reflected in comprehensive income may vary widely from period-to-period, depending on the financial markets
as a whole and how the portfolio of available-for-sale securities is affected by interest rate movements. The change in accumulated other comprehensive income attributable to the underfunded or overfunded status of defined benefit plans is also included in other comprehensive income. In 2010, total comprehensive income was $18,345,000, while in 2009 total comprehensive loss was $14,634,000, and in 2008 total comprehensive loss was $6,098,000. Other comprehensive income (loss) amounted to ($710,000) in 2010, $24,701,000 in 2009, and ($16,157,000) in 2008.
INFLATION
The Corporation is significantly affected by the Federal Reserve Board’s efforts to control inflation through changes in short-term interest rates. Beginning in September 2007, in response to concerns about weakness in the U.S. economy, the Federal Reserve lowered the fed funds target rate numerous times; in December 2008, it took the unusual step of establishing a target range of 0% to 0.25%, which it has maintained throughout 2009 and 2010. Also, the Federal Reserve has injected massive amounts of liquidity into the nation’s monetary system through a variety of programs. The Federal Reserve has purchased large amounts of securities in an effort to keep interest rates low and stimulate economic
growth. Further, the Federal Reserve expressed its concern that deflation is currently more of a concern than inflation.
Despite the current low short-term rate environment and liquidity injections, inflation statistics indicate that the overall rate of inflation is minimal. Although management cannot predict future changes in the rates of inflation, management monitors the impact of economic trends, including any indicators of inflationary pressures, in managing interest rate and other financial risks.
35
RECENT ACCOUNTING PRONOUNCEMENTS
See Note 2 to the consolidated financial statements for a description of recent accounting pronouncements and their recent or potential future effects on the Corporation’s financial statements.
MARKET RISK
Market risk is the risk of loss arising from adverse changes in market rates and prices of the Corporation’s financial instruments. In addition to the effects of interest rates, the market prices of the Corporation’s debt securities within the available-for-sale securities portfolio are affected by fluctuations in the risk premiums (amounts of spread over risk-free rates) demanded by investors.
Management cannot control changes in market prices of securities based on fluctuations in the risk premiums demanded by investors, nor can management control the volume of deferrals or defaults by other entities on trust-preferred securities. However, management attempts to limit the risk that economic conditions would force the Corporation to sell securities for realized losses by maintaining a strong capital position (discussed in the “Stockholders’ Equity and Capital Adequacy” section of Management’s Discussion and Analysis) and ample sources of liquidity (discussed in the “Liquidity” section of Management’s Discussion and Analysis).
The Corporation’s two major categories of market risk are interest rate risk and equity securities risk, which are discussed in the following sections.
INTEREST RATE RISK
Business risk arising from changes in interest rates is an inherent factor in operating a bank. The Corporation’s assets are predominantly long-term, fixed rate loans and debt securities. Funding for these assets comes principally from shorter-term deposits and borrowed funds. Accordingly, there is an inherent risk of lower future earnings or decline in fair value of the Corporation’s financial instruments when interest rates change.
The Corporation uses a simulation model to calculate the potential effects of interest rate fluctuations on net interest income and the market value of portfolio equity. For purposes of these calculations, the market value of portfolio equity includes the fair values of financial instruments, such as securities, loans, deposits and borrowed funds, and the book values of nonfinancial assets and liabilities, such as premises and equipment and accrued expenses. The model measures and projects potential changes in net interest income, and calculates the discounted present value of anticipated cash flows of financial instruments, assuming an immediate increase or decrease in interest rates. Management ordinarily runs a
variety of scenarios within a range of plus or minus 50-300 basis points of current rates.
The Corporation’s Board of Directors has established policy guidelines for acceptable levels of interest rate risk, based on an immediate increase or decrease in interest rates. The policy provides limits at +/- 100, 200 and 300 basis points from current rates for fluctuations in net interest income from the baseline (flat rates) one-year scenario. The policy also limits acceptable market value variances from the baseline values based on current rates.
Table XV, which follows this discussion, is based on the results of the simulation model as of October 31, 2010 and November 30, 2009. The 2009 figures include a pro forma adjustment to increase equity by $21,410,000, which represents the proceeds received from the Corporation’s sale of common stock in December 2009 net of issuance costs. The table also includes pro forma adjustments to reflect the Corporation’s December 2009 purchases of several investment securities. The securities purchased totaled approximately $22,382,000 and included obligations of U.S. Government agencies and a collateralized mortgage obligation issued by a U.S. Government agency.
As indicated in the table, the Corporation is liability sensitive, and therefore net interest income and market value generally increase when interest rates fall and decrease when interest rates rise. The table shows that as of October 31, 2010, the changes in net interest income and changes in market value were within the policy limits in all scenarios except an immediate rate decrease of 300 basis points, which management considers to be highly unrealistic. As of November 30, 2009, the changes in net interest income and changes in market value were within the policy limits in all scenarios.
36
In December 2007, the Corporation entered into repurchase agreements (borrowings) totaling $80 million to fund the purchase of investment securities. The borrowings include embedded caps providing that, if 3-month LIBOR were to exceed 5.15%, the interest rate payable on the repurchase agreements would fall, down to a minimum of 0%, based on parameters included in the repurchase agreements. Three-month LIBOR has not exceeded 5.15% since the embedded caps were acquired; therefore, they have not affected interest expense to date. The embedded cap on one of the $40 million borrowings expired in December 2010, and the embedded cap on the other $40 million borrowing expires in December 2012. The 3-month LIBOR was 0.29%
at October 31, 2010 and 0.26% at November 30, 2009. Since the embedded caps are effective only when 3-month LIBOR exceeds 5.15%, the Corporation would be unable to realize an interest expense reduction in any of the scenarios shown in Table XV at October 2010 or November 2009.
The model makes estimates, at each level of interest rate change, regarding cash flows from principal repayments on loans and mortgage-backed securities and call activity on other investment securities. Actual results could vary significantly from these estimates, which could result in significant differences in the calculations of projected changes in net interest margin and market value of portfolio equity. Also, the model does not make estimates related to changes in the composition of the deposit portfolio that could occur due to rate competition, and the table does not necessarily reflect changes that management would make to realign the portfolio as a result of changes in interest rates.
37
TABLE XV - THE EFFECT OF HYPOTHETICAL CHANGES IN INTEREST RATES
|
October 31, 2010 Data
|
||||||||||||||||||||
|
(In Thousands)
|
Period Ending October 31, 2011 | |||||||||||||||||||
|
Interest
|
Interest
|
Net Interest
|
NII
|
NII
|
||||||||||||||||
|
Basis Point Change in Rates
|
Income
|
Expense
|
Income (NII)
|
% Change
|
Risk Limit
|
|||||||||||||||
|
+300
|
$ | 66,098 | $ | 27,402 | $ | 38,696 | -9.3 | % | 20.0 | % | ||||||||||
|
+200
|
63,465 | 23,146 | 40,319 | -5.5 | % | 15.0 | % | |||||||||||||
|
+100
|
60,661 | 18,891 | 41,770 | -2.1 | % | 10.0 | % | |||||||||||||
|
0
|
57,307 | 14,638 | 42,669 | 0.0 | % | 0.0 | % | |||||||||||||
|
-100
|
54,005 | 13,794 | 40,211 | -5.8 | % | 10.0 | % | |||||||||||||
|
-200
|
51,995 | 13,732 | 38,263 | -10.3 | % | 15.0 | % | |||||||||||||
|
-300
|
51,507 | 13,732 | 37,775 | -11.5 | % | 20.0 | % | |||||||||||||
|
Market Value of Portfolio Equity
|
||||||||||||||||||||
|
at October 31, 2010
|
||||||||||||||||||||
|
Present
|
Present
|
Present
|
||||||||||||||||||
|
Value
|
Value
|
Value
|
||||||||||||||||||
|
Basis Point Change in Rates
|
Equity
|
% Change
|
Risk Limit
|
|||||||||||||||||
|
+300
|
$ | 90,782 | -28.4 | % | 45.0 | % | ||||||||||||||
|
+200
|
104,337 | -17.7 | % | 35.0 | % | |||||||||||||||
|
+100
|
116,495 | -8.1 | % | 25.0 | % | |||||||||||||||
|
0
|
126,789 | 0.0 | % | 0.0 | % | |||||||||||||||
|
-100
|
135,342 | 6.7 | % | 25.0 | % | |||||||||||||||
|
-200
|
162,919 | 28.5 | % | 35.0 | % | |||||||||||||||
|
-300
|
194,064 | 53.1 | % | 45.0 | % | |||||||||||||||
|
November 30, 2009 Data
|
||||||||||||||||||||
|
(In Thousands)
|
Period Ending November 30, 2010 | |||||||||||||||||||
|
Interest
|
Interest
|
Net Interest
|
NII
|
NII
|
||||||||||||||||
|
Basis Point Change in Rates
|
Income
|
Expense
|
Income (NII)
|
% Change
|
Risk Limit
|
|||||||||||||||
|
+300
|
$ | 70,171 | $ | 34,669 | $ | 35,502 | -12.0 | % | 20.0 | % | ||||||||||
|
+200
|
67,254 | 29,536 | 37,718 | -6.5 | % | 15.0 | % | |||||||||||||
|
+100
|
64,419 | 24,412 | 40,007 | -0.8 | % | 10.0 | % | |||||||||||||
|
0
|
61,041 | 20,700 | 40,341 | 0.0 | % | 0.0 | % | |||||||||||||
|
-100
|
57,581 | 19,579 | 38,002 | -5.8 | % | 10.0 | % | |||||||||||||
|
-200
|
55,240 | 19,215 | 36,025 | -10.7 | % | 15.0 | % | |||||||||||||
|
-300
|
54,360 | 19,008 | 35,352 | -12.4 | % | 20.0 | % | |||||||||||||
|
Market Value of Portfolio Equity
|
||||||||||||||||||||
|
at November 30, 2009
|
||||||||||||||||||||
|
Present
|
Present
|
Present
|
||||||||||||||||||
|
Value
|
Value
|
Value
|
||||||||||||||||||
|
Basis Point Change in Rates
|
Equity
|
% Change
|
Risk Limit
|
|||||||||||||||||
|
+300
|
$ | 98,045 | -28.8 | % | 45.0 | % | ||||||||||||||
|
+200
|
116,071 | -15.8 | % | 35.0 | % | |||||||||||||||
|
+100
|
131,202 | -4.8 | % | 25.0 | % | |||||||||||||||
|
0
|
137,770 | 0.0 | % | 0.0 | % | |||||||||||||||
|
-100
|
137,307 | -0.3 | % | 25.0 | % | |||||||||||||||
|
-200
|
146,347 | 6.2 | % | 35.0 | % | |||||||||||||||
|
-300
|
172,390 | 25.1 | % | 45.0 | % | |||||||||||||||
38
EQUITY SECURITIES RISK
The Corporation’s equity securities portfolio consists of investments in stock of banks and bank holding companies. Investments in bank stocks are subject to risk factors that affect the banking industry in general, including credit risk, competition from non-bank entities, interest rate risk and other factors, which could result in a decline in market prices. Also, losses could occur in individual stocks held by the Corporation because of specific circumstances related to each bank. As discussed further in Note 7 of the consolidated financial statements, the Corporation recognized OTTI charges on bank stocks totaling $10,000 in 2010 compared to $6,324,000 in 2009 and $1,878,000 in 2008.
During the fourth quarter of 2009, management decided to sell some bank stocks and liquidate the Corporation’s portfolio of non-bank equity securities and mutual funds. This decision was made primarily to generate capital losses, which could be carried back and offset against capital gains generated in 2006, 2007 and 2008 to realize tax refunds. As a result of these sales, the Corporation’s aggregate exposure to equities is significantly lower than in prior periods. These sales were executed in the fourth quarter of 2009 and the first half of 2010.
Equity securities held as of December 31, 2010 and December 31, 2009 are presented in Table XVI. Table XVI presents quantitative data concerning the effects of a decline in fair value of the Corporation’s equity securities of 10% or 20%. The data in Table XVI does not reflect the effects of any appreciation in value that may occur, nor does it present the Corporation’s maximum exposure to loss on equity securities, which would be 100% of their fair value as of December 31, 2010.
|
TABLE XVI - EQUITY SECURITIES RISK
|
||||||||
|
(In Thousands)
|
||||||||
|
As of December 31,
|
||||||||
|
2010
|
2009
|
|||||||
|
Cost
|
$ | 4,589 | $ | 5,367 | ||||
|
Fair Value
|
6,009 | 6,662 | ||||||
|
Hypothetical 10% Decline In Market Value
|
(601 | ) | (666 | ) | ||||
|
Hypothetical 20% Decline In Market Value
|
(1,202 | ) | (1,332 | ) | ||||
39
|
|
||||||||
|
|
December 31,
|
December 31,
|
||||||
|
(In Thousands Except Share Data)
|
2010
|
2009
|
||||||
|
ASSETS
|
||||||||
|
Cash and due from banks:
|
||||||||
|
Noninterest-bearing
|
$ | 16,840 | $ | 18,247 | ||||
|
Interest-bearing
|
29,461 | 73,818 | ||||||
|
Total cash and cash equivalents
|
46,301 | 92,065 | ||||||
|
Trading securities
|
0 | 1,045 | ||||||
|
Available-for-sale securities, at fair value
|
443,956 | 396,288 | ||||||
|
Held-to-maturity securities
|
0 | 300 | ||||||
|
Loans held for sale
|
5,247 | 592 | ||||||
|
Loans, net of allowance for loan losses of $9,107 at December 31, 2010
|
||||||||
|
and $8,265 at December 31, 2009.
|
721,304 | 712,746 | ||||||
|
Bank-owned life insurance
|
21,822 | 22,798 | ||||||
|
Accrued interest receivable
|
4,960 | 5,613 | ||||||
|
Bank premises and equipment, net
|
22,636 | 24,316 | ||||||
|
Foreclosed assets held for sale
|
537 | 873 | ||||||
|
Deferred tax asset, net
|
16,054 | 22,037 | ||||||
|
Intangible asset - Core deposit intangibles
|
326 | 502 | ||||||
|
Intangible asset - Goodwill
|
11,942 | 11,942 | ||||||
|
Other assets
|
21,503 | 30,678 | ||||||
|
TOTAL ASSETS
|
$ | 1,316,588 | $ | 1,321,795 | ||||
|
LIABILITIES
|
||||||||
|
Deposits:
|
||||||||
|
Noninterest-bearing
|
$ | 158,767 | $ | 137,470 | ||||
|
Interest-bearing
|
845,581 | 789,319 | ||||||
|
Total deposits
|
1,004,348 | 926,789 | ||||||
|
Dividends payable
|
0 | 169 | ||||||
|
Short-term borrowings
|
18,413 | 39,229 | ||||||
|
Long-term borrowings
|
148,495 | 196,242 | ||||||
|
Accrued interest and other liabilities
|
6,388 | 6,956 | ||||||
|
TOTAL LIABILITIES
|
1,177,644 | 1,169,385 | ||||||
|
STOCKHOLDERS' EQUITY
|
||||||||
|
Preferred stock, $1,000 par value; authorized 30,000 shares; $1,000 liquidation
|
||||||||
|
preference per share; no shares issued at December 31, 2010 and
|
||||||||
|
26,440 shares issued at December 31, 2009
|
0 | 25,749 | ||||||
|
Common stock, par value $1.00 per share; authorized 20,000,000 shares in 2010 and
|
||||||||
|
2009; issued 12,408,212 at December 31, 2010 and 12,374,481 at December 31, 2009
|
12,408 | 12,374 | ||||||
|
Paid-in capital
|
66,648 | 66,726 | ||||||
|
Retained earnings
|
65,920 | 53,027 | ||||||
|
Treasury stock, at cost; 254,614 shares at December 31, 2010
|
||||||||
|
and 262,780 shares at December 31, 2009
|
(4,431 | ) | (4,575 | ) | ||||
|
Sub-total
|
140,545 | 153,301 | ||||||
|
Accumulated other comprehensive loss:
|
||||||||
|
Unrealized losses on available-for-sale securities
|
(1,351 | ) | (522 | ) | ||||
|
Defined benefit plans
|
(250 | ) | (369 | ) | ||||
|
Total accumulated other comprehensive loss
|
(1,601 | ) | (891 | ) | ||||
|
TOTAL STOCKHOLDERS' EQUITY
|
138,944 | 152,410 | ||||||
|
TOTAL LIABILITIES & STOCKHOLDERS' EQUITY
|
$ | 1,316,588 | $ | 1,321,795 | ||||
The accompanying notes are an integral part of the consolidated financial statements
40
|
|
Years Ended December 31,
|
|||||||||||
|
(In Thousands Except Per Share Data)
|
2010
|
2009
|
2008
|
|||||||||
|
INTEREST INCOME
|
||||||||||||
|
Interest and fees on loans
|
$ | 44,229 | $ | 45,236 | $ | 48,933 | ||||||
|
Interest on balances with depository institutions
|
124 | 61 | 33 | |||||||||
|
Interest on loans to political subdivisions
|
1,582 | 1,660 | 1,539 | |||||||||
|
Interest on federal funds sold
|
0 | 15 | 120 | |||||||||
|
Interest on trading securities
|
1 | 43 | 89 | |||||||||
|
Income from available-for-sale and held-to-maturity securities:
|
||||||||||||
|
Taxable
|
11,092 | 15,926 | 19,516 | |||||||||
|
Tax-exempt
|
4,834 | 4,443 | 3,153 | |||||||||
|
Dividends
|
252 | 592 | 854 | |||||||||
|
Total interest and dividend income
|
62,114 | 67,976 | 74,237 | |||||||||
|
INTEREST EXPENSE
|
||||||||||||
|
Interest on deposits
|
11,907 | 14,651 | 19,320 | |||||||||
|
Interest on short-term borrowings
|
177 | 544 | 986 | |||||||||
|
Interest on long-term borrowings
|
7,161 | 9,261 | 10,743 | |||||||||
|
Total interest expense
|
19,245 | 24,456 | 31,049 | |||||||||
|
Net interest income
|
42,869 | 43,520 | 43,188 | |||||||||
|
Provision for loan losses
|
1,191 | 680 | 909 | |||||||||
|
Net interest income after provision for loan losses
|
41,678 | 42,840 | 42,279 | |||||||||
|
OTHER INCOME
|
||||||||||||
|
Service charges on deposit accounts
|
4,579 | 4,791 | 4,447 | |||||||||
|
Service charges and fees
|
858 | 796 | 777 | |||||||||
|
Trust and financial management revenue
|
3,475 | 3,262 | 3,443 | |||||||||
|
Insurance commissions, fees and premiums
|
248 | 293 | 332 | |||||||||
|
Increase in cash surrender value of life insurance
|
466 | 501 | 758 | |||||||||
|
Other operating income
|
4,291 | 3,378 | 3,383 | |||||||||
|
Sub-total
|
13,917 | 13,021 | 13,140 | |||||||||
|
Total other-than-temporary impairment losses on available-for-sale securities
|
(381 | ) | (81,912 | ) | (10,088 | ) | ||||||
|
Portion of (gain) recognized in other comprehensive loss (before taxes)
|
(52 | ) | (3,451 | ) | 0 | |||||||
|
Net impairment losses recognized in earnings
|
(433 | ) | (85,363 | ) | (10,088 | ) | ||||||
|
Realized gains on available-for-sale securities, net
|
1,262 | 1,523 | 750 | |||||||||
|
Net realized gains (impairment losses) recognized in earnings
|
||||||||||||
|
on available-for-sale securities
|
829 | (83,840 | ) | (9,338 | ) | |||||||
|
Total other income
|
14,746 | (70,819 | ) | 3,802 | ||||||||
|
OTHER EXPENSES
|
||||||||||||
|
Salaries and wages
|
13,063 | 12,737 | 14,561 | |||||||||
|
Pensions and other employee benefits
|
3,840 | 3,956 | 4,202 | |||||||||
|
Occupancy expense, net
|
2,645 | 2,741 | 2,861 | |||||||||
|
Furniture and equipment expense
|
2,103 | 2,679 | 2,661 | |||||||||
|
FDIC Assessments
|
1,450 | 2,092 | 308 | |||||||||
|
Pennsylvania shares tax
|
1,222 | 1,272 | 1,169 | |||||||||
|
Other operating expense
|
7,246 | 8,534 | 7,941 | |||||||||
|
Total other expenses
|
31,569 | 34,011 | 33,703 | |||||||||
|
Income (loss) before income tax provision (credit)
|
24,855 | (61,990 | ) | 12,378 | ||||||||
|
Income tax provision (credit)
|
5,800 | (22,655 | ) | 2,319 | ||||||||
|
Net income (loss)
|
19,055 | (39,335 | ) | 10,059 | ||||||||
|
U.S. Treasury preferred dividends
|
1,474 | 1,428 | 0 | |||||||||
|
NET INCOME (LOSS) AVAILABLE TO COMMON SHAREHOLDERS
|
$ | 17,581 | $ | (40,763 | ) | $ | 10,059 | |||||
|
NET INCOME (LOSS) PER SHARE - BASIC AND DILUTED
|
$ | 1.45 | $ | (4.40 | ) | $ | 1.12 | |||||
The accompanying notes are an integral part of the consolidated financial statements.
41
|
Consolidated Statements of Changes in Stockholders’ Equity
|
||||||||||||||||||||||||||||||||
|
(In Thousands Except Per Share Data)
|
Accumulated
|
|||||||||||||||||||||||||||||||
|
Stock
|
Other
|
|||||||||||||||||||||||||||||||
|
Preferred
|
Common
|
Dividend
|
Paid-in
|
Retained
|
Comprehensive
|
Treasury
|
||||||||||||||||||||||||||
|
Stock
|
Stock
|
Distributable
|
Capital
|
Earnings
|
(Loss)
|
Stock
|
Total
|
|||||||||||||||||||||||||
|
Balance, January 1, 2008
|
$ | 0 | $ | 9,193 | $ | 1,571 | $ | 42,438 | $ | 96,628 | $ | (7,057 | ) | $ | (4,992 | ) | $ | 137,781 | ||||||||||||||
|
Comprehensive (loss) income:
|
||||||||||||||||||||||||||||||||
|
Net income
|
10,059 | 10,059 | ||||||||||||||||||||||||||||||
|
Unrealized loss on securities, net of
net of reclassification and tax
|
(16,466 | ) | (16,466 | ) | ||||||||||||||||||||||||||||
|
Other comprehensive income related
to defined benefit plans
|
309 | 309 | ||||||||||||||||||||||||||||||
|
Total comprehensive loss
|
(6,098 | ) | ||||||||||||||||||||||||||||||
|
Cash dividends declared, $.96 per share
|
(8,590 | ) | (8,590 | ) | ||||||||||||||||||||||||||||
|
Shares issued for dividend reinvestment plan
|
158 | 758 | 916 | |||||||||||||||||||||||||||||
|
Treasury stock purchased
|
(2,135 | ) | (2,135 | ) | ||||||||||||||||||||||||||||
|
Shares issued from treasury related to
exercise of stock options
|
(17 | ) | 237 | 220 | ||||||||||||||||||||||||||||
|
Restricted stock granted
|
(82 | ) | 82 | 0 | ||||||||||||||||||||||||||||
|
Forfeiture of restricted stock
|
11 | (11 | ) | 0 | ||||||||||||||||||||||||||||
|
Stock-based compensation expense
|
294 | 294 | ||||||||||||||||||||||||||||||
|
Tax benefit from employee benefit plan
|
23 | 23 | ||||||||||||||||||||||||||||||
|
Tax charge from stock-based compensation
|
(5 | ) | (5 | ) | ||||||||||||||||||||||||||||
|
Stock dividend issued
|
91 | (1,571 | ) | 1,463 | (17 | ) | ||||||||||||||||||||||||||
|
Recognize postretirement split-dollar life
insurance liability
|
(363 | ) | (363 | ) | ||||||||||||||||||||||||||||
|
Balance, December 31, 2008
|
0 | 9,284 | 0 | 44,260 | 97,757 | (23,214 | ) | (6,061 | ) | 122,026 | ||||||||||||||||||||||
|
Comprehensive (loss) income:
|
||||||||||||||||||||||||||||||||
|
Net loss
|
(39,335 | ) | (39,335 | ) | ||||||||||||||||||||||||||||
|
Unrealized gain on securities, net
of reclassification and tax
|
24,976 | 24,976 | ||||||||||||||||||||||||||||||
|
Other comprehensive loss related
to defined benefit plans
|
(275 | ) | (275 | ) | ||||||||||||||||||||||||||||
|
Total comprehensive loss
|
(14,634 | ) | ||||||||||||||||||||||||||||||
|
Reclassify non-credit portion of other-
than-temporary impairment losses recognized in prior period
|
2,378 | (2,378 | ) | 0 | ||||||||||||||||||||||||||||
|
Issuance of U.S. Treasury preferred stock
|
25,588 | 821 | 26,409 | |||||||||||||||||||||||||||||
|
Accretion of discount associated with
U.S. Treasury preferred stock
|
161 | (161 | ) | 0 | ||||||||||||||||||||||||||||
|
Cash dividends on U.S. Treasury preferred stock
|
(1,267 | ) | (1,267 | ) | ||||||||||||||||||||||||||||
|
Cash dividends declared on common
stock, $.72 per share
|
(6,487 | ) | (6,487 | ) | ||||||||||||||||||||||||||||
|
Common shares issued
|
3,090 | 21,495 | 24,585 | |||||||||||||||||||||||||||||
|
Common shares issued for dividend
reinvestment plan
|
(71 | ) | 1,388 | 1,317 | ||||||||||||||||||||||||||||
|
Common shares issued from treasury
related to exercise of stock options
|
(4 | ) | 34 | 30 | ||||||||||||||||||||||||||||
|
Restricted stock granted
|
(69 | ) | 69 | 0 | ||||||||||||||||||||||||||||
|
Forfeiture of restricted stock
|
5 | (5 | ) | 0 | ||||||||||||||||||||||||||||
|
Stock-based compensation expense
|
286 | 286 | ||||||||||||||||||||||||||||||
|
Tax benefit from stock-based compensation
|
3 | 3 | ||||||||||||||||||||||||||||||
|
Tax benefit from employee benefit plan
|
142 | 142 | ||||||||||||||||||||||||||||||
|
Balance, December 31, 2009
|
$ | 25,749 | $ | 12,374 | $ | 0 | $ | 66,726 | $ | 53,027 | $ | (891 | ) | $ | (4,575 | ) | $ | 152,410 | ||||||||||||||
42
|
Consolidated Statements of Changes in Stockholders' Equity
|
||||||||||||||||||||||||||||||||
|
(In Thousands Except Per Share Data)
|
Accumulated
|
|||||||||||||||||||||||||||||||
|
(Continued)
|
Stock
|
Other
|
||||||||||||||||||||||||||||||
|
Preferred
|
Common
|
Dividend
|
Paid-in
|
Retained
|
Comprehensive
|
Treasury
|
||||||||||||||||||||||||||
|
Stock
|
Stock
|
Distributable
|
Capital
|
Earnings
|
(Loss)
|
Stock
|
Total
|
|||||||||||||||||||||||||
|
Balance, December 31, 2009
|
$ | 25,749 | $ | 12,374 | $ | 0 | $ | 66,726 | $ | 53,027 | $ | (891 | ) | $ | (4,575 | ) | $ | 152,410 | ||||||||||||||
|
Comprehensive income:
|
||||||||||||||||||||||||||||||||
|
Net income
|
19,055 | 19,055 | ||||||||||||||||||||||||||||||
|
Unrealized loss on securities, net
of reclassification and tax
|
(829 | ) | (829 | ) | ||||||||||||||||||||||||||||
|
Other comprehensive income related
to defined benefit plans
|
119 | 119 | ||||||||||||||||||||||||||||||
|
Total comprehensive income
|
18,345 | |||||||||||||||||||||||||||||||
|
Accretion of discount associated with
U.S. Treasury preferred stock
|
691 | (691 | ) | 0 | ||||||||||||||||||||||||||||
|
Cash dividends on U.S. Treasury
preferred stock
|
(783 | ) | (783 | ) | ||||||||||||||||||||||||||||
|
Redemption of U.S. Treasury preferred stock
|
(26,440 | ) | (26,440 | ) | ||||||||||||||||||||||||||||
|
Redemption of U.S. Treasury warrant
|
(400 | ) | (400 | ) | ||||||||||||||||||||||||||||
|
Cash dividends declared on common
stock, $.39 per share
|
(4,730 | ) | (4,730 | ) | ||||||||||||||||||||||||||||
|
Common shares issued for dividend
reinvestment plan
|
34 | 399 | 433 | |||||||||||||||||||||||||||||
|
Restricted stock granted
|
(159 | ) | 159 | 0 | ||||||||||||||||||||||||||||
|
Forfeiture of restricted stock
|
15 | (15 | ) | 0 | ||||||||||||||||||||||||||||
|
Stock-based compensation expense
|
67 | 67 | ||||||||||||||||||||||||||||||
|
Tax benefit from employee benefit plan
|
42 | 42 | ||||||||||||||||||||||||||||||
|
Balance, December 31, 2010
|
$ | 0 | $ | 12,408 | $ | 0 | $ | 66,648 | $ | 65,920 | $ | (1,601 | ) | $ | (4,431 | ) | $ | 138,944 | ||||||||||||||
The accompanying notes are an integral part of the consolidated financial statements.
43
|
|
Years Ended December 31,
|
|||||||||||
|
(In Thousands)
|
2010
|
2009
|
2008
|
|||||||||
|
CASH FLOWS FROM OPERATING ACTIVITIES:
|
||||||||||||
|
Net income (loss)
|
$ | 19,055 | $ | (39,335 | ) | $ | 10,059 | |||||
|
Adjustments to reconcile net income (loss) to net cash provided by operating activities:
|
||||||||||||
|
Provision for loan losses
|
1,191 | 680 | 909 | |||||||||
|
Realized (gains) losses on available-for-sale securities, net
|
(829 | ) | 83,840 | 9,338 | ||||||||
|
Gain on sale of foreclosed assets, net
|
(108 | ) | (310 | ) | (38 | ) | ||||||
|
Depreciation expense
|
2,339 | 2,816 | 2,885 | |||||||||
|
(Gain) loss on disposition of premises and equipment
|
(445 | ) | 30 | 0 | ||||||||
|
Accretion and amortization on securities, net
|
2,233 | 455 | (63 | ) | ||||||||
|
Accretion and amortization on loans, deposits and borrowings, net
|
(262 | ) | (357 | ) | (421 | ) | ||||||
|
Amortization of mortgage servicing rights
|
12 | 0 | 0 | |||||||||
|
Increase in cash surrender value of life insurance
|
(466 | ) | (501 | ) | (758 | ) | ||||||
|
Stock-based compensation
|
67 | 286 | 294 | |||||||||
|
Amortization of core deposit intangibles
|
176 | 324 | 552 | |||||||||
|
Deferred income taxes
|
6,371 | (18,383 | ) | (2,147 | ) | |||||||
|
Gains on sales of mortgage loans, net
|
(545 | ) | (106 | ) | (70 | ) | ||||||
|
Origination of mortgage loans for sale
|
(30,720 | ) | (11,776 | ) | (7,940 | ) | ||||||
|
Proceeds from sales of mortgage loans
|
26,610 | 11,396 | 8,010 | |||||||||
|
Net decrease (increase) in trading securities
|
1,045 | (382 | ) | (2,398 | ) | |||||||
|
Decrease (increase) in accrued interest receivable and other assets
|
9,624 | (14,632 | ) | (3,070 | ) | |||||||
|
(Decrease) increase in accrued interest payable and other liabilities
|
(302 | ) | (1,077 | ) | 2,975 | |||||||
|
Net Cash Provided by Operating Activities
|
35,046 | 12,968 | 18,117 | |||||||||
|
CASH FLOWS FROM INVESTING ACTIVITIES:
|
||||||||||||
|
Proceeds from maturity of held-to-maturity securities
|
300 | 106 | 3 | |||||||||
|
Proceeds from sales of available-for-sale securities
|
53,115 | 41,242 | 23,295 | |||||||||
|
Proceeds from calls and maturities of available-for-sale securities
|
163,618 | 68,432 | 51,781 | |||||||||
|
Purchase of available-for-sale securities
|
(267,082 | ) | (131,203 | ) | (93,150 | ) | ||||||
|
Purchase of Federal Home Loan Bank of Pittsburgh stock
|
0 | (4 | ) | (3,280 | ) | |||||||
|
Redemption of Federal Home Loan Bank of Pittsburgh stock
|
429 | 0 | 4,327 | |||||||||
|
Net (increase) decrease in loans
|
(10,330 | ) | 20,470 | (9,749 | ) | |||||||
|
Proceeds from bank-owned life insurance
|
1,442 | 0 | 0 | |||||||||
|
Purchase of premises and equipment
|
(707 | ) | (1,253 | ) | (998 | ) | ||||||
|
Proceeds from disposition of premises and equipment
|
103 | 0 | 0 | |||||||||
|
Return of principal on limited partnership investment
|
66 | 18 | 47 | |||||||||
|
Proceeds from sale of foreclosed assets
|
1,169 | 1,564 | 462 | |||||||||
|
Net Cash Used in Investing Activities
|
(57,877 | ) | (628 | ) | (27,262 | ) | ||||||
|
CASH FLOWS FROM FINANCING ACTIVITIES:
|
||||||||||||
|
Net increase in deposits
|
77,537 | 62,706 | 25,518 | |||||||||
|
Net (decrease) increase in short-term borrowings
|
(20,816 | ) | (9,318 | ) | 7,869 | |||||||
|
Proceeds from long-term borrowings
|
0 | 0 | 29,703 | |||||||||
|
Repayments of long-term borrowings
|
(47,607 | ) | (40,445 | ) | (52,003 | ) | ||||||
|
Issuance of US Treasury preferred stock and warrant
|
0 | 26,409 | 0 | |||||||||
|
Redemption of US Treasury preferred stock and warrant
|
(26,840 | ) | 0 | 0 | ||||||||
|
Issuance of common stock
|
0 | 24,585 | 0 | |||||||||
|
Purchase of treasury stock
|
0 | 0 | (2,135 | ) | ||||||||
|
Sale of treasury stock
|
0 | 30 | 220 | |||||||||
|
Tax benefit from compensation plans
|
42 | 145 | 18 | |||||||||
|
US Treasury preferred dividends paid
|
(952 | ) | (1,098 | ) | 0 | |||||||
|
Common dividends paid
|
(4,297 | ) | (7,317 | ) | (7,678 | ) | ||||||
|
Net Cash (Used in) Provided by Financing Activities
|
(22,933 | ) | 55,697 | 1,512 | ||||||||
|
(DECREASE) INCREASE IN CASH AND CASH EQUIVALENTS
|
(45,764 | ) | 68,037 | (7,633 | ) | |||||||
|
CASH AND CASH EQUIVALENTS, BEGINNING OF YEAR
|
92,065 | 24,028 | 31,661 | |||||||||
|
CASH AND CASH EQUIVALENTS, END OF YEAR
|
$ | 46,301 | $ | 92,065 | $ | 24,028 | ||||||
The accompanying notes are an integral part of the consolidated financial statements.
44
Consolidated Statements of Cash Flows (Continued)
|
(In Thousands)
|
Years Ending December 31,
|
|||||||||||
|
2010
|
2009
|
2008
|
||||||||||
|
SUPPLEMENTAL DISCLOSURES OF CASH FLOW INFORMATION:
|
||||||||||||
|
Assets acquired through foreclosure of real estate loans
|
$ | 725 | $ | 1,829 | $ | 464 | ||||||
|
Securities transferred from trading to available-for-sale
|
$ | 0 | $ | 1,643 | $ | 3,072 | ||||||
|
Interest paid
|
$ | 19,614 | $ | 24,944 | $ | 31,406 | ||||||
|
Income taxes (refunded) paid
|
$ | (8,134 | ) | $ | 3,475 | $ | 4,713 | |||||
The accompanying notes are an integral part of the consolidated financial statements.
45
NOTES TO CONSOLIDATED FINANCIAL STATEMENTS
1
.
NATURE OF OPERATIONS AND SUMMARY OF SIGNIFICANT ACCOUNTING POLICIES
BASIS OF CONSOLIDATION -
The consolidated financial statements include the accounts of Citizens & Northern Corporation and its subsidiaries, Citizens & Northern Bank (“C&N Bank”), Bucktail Life Insurance Company and Citizens & Northern Investment Corporation (collectively, “Corporation”), as well as C&N Bank’s wholly-owned subsidiary, C&N Financial Services Corporation. The consolidated financial statements also include the accounts of the former Canisteo Valley Corporation (merged into Citizens & Northern Corporation in September 2010) and its former wholly-owned subsidiary, First State
Bank (merged into C&N Bank, effective September 1, 2010). All material intercompany balances and transactions have been eliminated in consolidation.
NATURE OF OPERATIONS -
The Corporation is primarily engaged in providing a full range of banking and mortgage services to individual and corporate customers in North Central Pennsylvania and Southern New York State. Lending products include mortgage loans, commercial loans and consumer loans, as well as specialized instruments such as commercial letters-of-credit. Deposit products include various types of checking accounts, passbook and statement savings, money market accounts, interest checking accounts, individual retirement accounts and certificates of deposit. The Corporation also offers non-insured “Repo Sweep” accounts.
The Corporation provides Trust and Financial Management services, including administration of trusts and estates, retirement plans, and other employee benefit plans, and investment management services. The Corporation offers a variety of personal and commercial insurance products through C&N Financial Services Corporation. C&N Financial Services Corporation also has a broker-dealer division, which offers mutual funds, annuities, educational savings accounts and other investment products through registered agents. Management has determined that the Corporation has one reportable segment, “Community Banking.” All of the Corporation’s activities
are interrelated, and each activity is dependent and assessed based on how each of the activities of the Corporation supports the others.
The Corporation is subject to competition from other financial institutions. It is also subject to regulation by certain federal and state agencies and undergoes periodic examination by those regulatory authorities. As a consequence, the Corporation’s business is particularly susceptible to being affected by future federal and state legislation and regulations.
USE OF ESTIMATES -
The financial information is presented in accordance with generally accepted accounting principles and general practice for financial institutions in the United States of America. In preparing financial statements, management is required to make estimates and assumptions that affect the reported amount of assets and liabilities and disclosure of contingent assets and liabilities as of the date of the financial statements. In addition, these estimates and assumptions affect revenues and expenses in the financial statements and as such, actual results could differ from those estimates.
Material estimates that are particularly susceptible to change include: (1) the allowance for loan losses, (2) fair values of debt securities based on estimates from independent valuation services or from brokers, (3) fair values of debt securities based on unobservable inputs, as determined using management’s estimates of cash flows and applicable discount rates and (4) assessment of impaired securities to determine whether or not the securities are other-than-temporarily impaired.
INVESTMENT SECURITIES -
Investment securities are accounted for as follows:
Trading securities
– includes municipal bonds, carried at their fair values. Realized and unrealized gains and losses on trading securities are recognized in the consolidated statement of income as they occur. Quoted market prices are used to determine the fair value of trading instruments.
Available-for-sale securities -
includes debt securities not classified as held-to-maturity or trading, and unrestricted equity securities. Such securities are reported at fair value, with unrealized gains and losses excluded from earnings and reported separately through accumulated other comprehensive income, net of tax. Amortization of premiums and accretion of discounts on available-for-sale securities are recorded using the level yield method over the remaining contractual life of the securities, adjusted for actual prepayments. Realized gains and losses on sales of available-for-sale securities are computed on the basis of specific
identification of the adjusted cost of each security. Securities within the available-for-sale portfolio may be used as part of the Corporation’s asset and liability management strategy and may be sold in response to changes in interest rate risk, prepayment risk or other factors.
46
Held-to-maturity securities -
includes debt securities that the Corporation has the positive intent and ability to hold to maturity. These securities are reported at cost adjusted for amortization of premiums and accretion of discounts, computed using the level-yield method.
Other-than-temporary impairment –
Declines in the fair value of available-for-sale and held-to-maturity securities that are deemed to be other-than-temporary are reflected in earnings as realized losses. In estimating other-than-temporary impairment losses, management considers (1) the length of time and the extent to which the fair value has been less than cost, (2) the financial condition and near-term prospects of the issuer, (3) the intent and ability of the Corporation to retain its investment in the issuer for a period of time sufficient to allow for any anticipated recovery in fair value, and (4) whether the Corporation intends to sell
the security or if it is more likely than not that the Corporation will be required to sell the security before the recovery of its amortized cost basis. The credit-related impairment is recognized in earnings, and is the difference between a security’s amortized cost basis and the present value of expected future cash flows discounted at the security’s effective interest rate. For debt securities classified as held-to-maturity, the amount of noncredit-related impairment is recognized in other comprehensive income and accreted over the remaining life of the debt security as an increase in the carrying value of the security. In addition, the risk of future other-than-temporary impairment may be influenced by additional bank failures, prolonged recession in the U.S. economy, changes to real estate values, interest deferrals and whether the
federal government provides assistance to financial institutions.
Restricted equity securities
- Restricted equity securities consist primarily of Federal Home Loan Bank of Pittsburgh stock, and are carried at cost and evaluated for impairment. Holdings of restricted equity securities are included in Other Assets in the Consolidated Balance Sheet, and dividends received on restricted securities are included in Other Income in the Consolidated Statement of Income.
LOANS HELD FOR SALE –
Mortgage loans held for sale are reported at the lower of cost or market, determined in the aggregate. Gains from sales of mortgage loans are included in Other Operating Income in the Consolidated Statement of Operations.
LOANS RECEIVABLE -
Loans receivable which management has the intent and ability to hold for the foreseeable future or until maturity or payoff are stated at unpaid principal balances, less the allowance for loan losses and net deferred loan fees. Interest income is accrued on the unpaid principal balance. Loan origination and commitment fees, as well as certain direct origination costs, are deferred and amortized as a yield adjustment over the lives of the related loans using the interest method.
The loans receivable portfolio is segmented into consumer mortgage, commercial and consumer loans. The consumer mortgage segment includes the following classes: first and junior lien residential mortgages, home equity lines of credit and residential construction loans. The most significant classes of commercial loans are commercial loans secured by real estate, non-real estate secured commercial and industrial loans, loans to political subdivisions, commercial construction, and loans secured by farmland.
Loans are placed on nonaccrual status for all classes of loans when, in the opinion of management, collection of interest is doubtful. Any unpaid interest previously accrued on those loans is reversed from income. Interest income is not recognized on specific impaired loans unless the likelihood of further loss is remote. Interest payments received on loans for which the risk of further loss is greater than remote are applied as a reduction of the loan principal balance. Interest income on other nonaccrual loans is recognized only to the extent of interest payments received. Generally, loans are restored to accrual status when the obligation is brought current, has performed in accordance with the
contractual terms for a reasonable period of time (generally six months) and the ultimate collectability of the total contractual principal and interest is no longer in doubt. The past due status of all classes of loans receivable is determined based on contractual due dates for loan payments. Also, the amortization of deferred loan fees is discontinued when a loan is placed on nonaccrual status.
ALLOWANCE FOR LOAN LOSSES –
The allowance for loan losses represents management’s estimate of losses inherent in the loan portfolio as of the balance sheet date and is recorded as a reduction to loans. The allowance for loan losses is increased by the provision for loan losses, and decreased by charge-offs, net of recoveries. Loans deemed to be uncollectible are charged against the allowance for loan losses, and subsequent recoveries, if any, are credited to the allowance. All, or part, of the principal balance of loans receivable are charged off to the allowance as soon as it is determined that the repayment of all, or part, of the
principal balance is highly unlikely. Non-residential consumer loans are generally charged off no later than 120 days past due on a contractual basis, earlier in the event of bankruptcy, or if there is an amount deemed uncollectible.
47
The allowance for loan losses is maintained at a level considered adequate to provide for losses that can be reasonably anticipated. Management performs a quarterly evaluation of the adequacy of the allowance. The allowance is based on the Corporation’s past loan loss experience, known and inherent risks in the portfolio, adverse situations that may affect the borrower’s ability to repay, the estimated value of any underlying collateral, composition of the loan portfolio, current economic conditions and other relevant factors. This evaluation is inherently subjective as it requires material estimates that may be susceptible to significant revision as more information becomes available. In
the process of evaluating the loan portfolio, management also considers the Corporation’s exposure to losses from unfunded loan commitments. As of December 31, 2010 and 2009, management determined that no allowance for credit losses related to unfunded loan commitments was required.
The allowance consists primarily of two major components – (1) a specific component based on a detailed assessment of certain larger loan relationships, mainly commercial purpose, determined on a loan-by-loan basis; and (2) a general component for the remainder of the portfolio based on a collective evaluation of pools of loans with similar risk characteristics. The general component is assigned to each pool of loans based on both historical net charge-off experience, and an evaluation of certain qualitative factors. An unallocated component is maintained to cover uncertainties that could affect management’s estimate of probable losses. The unallocated component of the allowance reflects the margin of
imprecision inherent in the underlying assumptions used in the above methodologies for estimating specific and general losses in the portfolio.
The specific component relates to loans that are classified as impaired based on a detailed assessment of certain larger loan relationships evaluated by a management committee referred to as the Watch List Committee. Specific loan relationships are identified for evaluation based on the related credit risk rating. For individual loans classified as impaired, an allowance is established when the collateral value, present value of discounted cash flows or observable market price of the impaired loan is lower than the carrying value of that loan.
The general component covers pools of loans by loan class including commercial loans not considered individually impaired, as well as smaller balance homogeneous classes of loans, such as residential real estate, home equity lines of credit and other consumer loans. Accordingly, the Corporation generally does not separately identify individual consumer and residential loans for impairment disclosures, unless such loans are subject to a restructuring agreement. The pools of loans for each loan segment are evaluated for loss exposure based upon three-year average historical net charge-off rates, adjusted for qualitative factors. Qualitative risk factors (described in the following paragraph)
are evaluated for the impact on each of the three distinct segments (consumer mortgage, commercial and consumer) within the loan portfolio. Each qualitative factor is assigned a value to reflect improving, stable or declining conditions based on management’s judgment using relevant information available at the time of the evaluation. Any adjustments to the factors are supported by a narrative documentation of changes in conditions accompanying the allowance for loan loss calculation.
The qualitative factors used in the general component calculations are designed to address credit risk characteristics associated with each segment. The Corporation’s credit risk associated with all of the segments is significantly impacted by these factors, which include economic conditions within its market area, the Corporation’s lending policies, changes or trends in the portfolio, risk profile, competition, regulatory requirements and other factors. Further, the consumer mortgage segment is significantly affected by the values of residential real estate that provide collateral for the loans. The majority of the Corporation’s commercial segment loans
(approximately 68% at December 31, 2010) is secured by real estate, and accordingly, the Corporation’s risk for the commercial segment is significantly affected by commercial real estate values. The consumer segment includes a wide mix of loans for different purposes, primarily secured loans, including loans secured by motor vehicles, manufactured housing and other types of collateral.
Loans are classified as impaired, when, based on current information and events, it is probable that the Corporation will be unable to collect the scheduled payments of principal or interest when due according to the contractual terms of the loan agreement. Factors considered by management in determining impairment include payment status, collateral value and the probability of collecting scheduled principal and interest payments when due. Loans that experience insignificant payment delays and payment shortfalls generally are not classified as impaired. Management determines the significance of payment delays and payment shortfalls on a case-by-case basis, taking into consideration
all of the circumstances surrounding the loan and the borrower, including the length of the delay, the reasons for the delay, the borrower’s prior payment record and the amount of shortfall in relation to the principal and interest owed. Impairment is measured on a loan-by-loan basis for commercial loans by the fair value of the collateral (if the loan is collateral dependent), by future cash flows discounted at the loan’s effective rate or by the loan’s observable market price.
48
For commercial loans secured by real estate, estimated fair values are determined primarily through third-party appraisals. When a real estate secured loan becomes impaired, a decision is made regarding whether an updated certified appraisal of the real estate is necessary. This decision is based on various considerations, including the age of the most recent appraisal, the loan-to-value ratio based on the original appraisal and the condition of the property. Appraised values are discounted to arrive at the estimated selling price of the collateral, which is considered to be the estimated fair value. The discounts also include estimated costs to sell the property.
For commercial and industrial loans secured by non-real estate collateral, such as accounts receivable, inventory and equipment, estimated fair values are determined based on the borrower’s financial statements, inventory reports, accounts receivable agings or equipment appraisals or invoices. Indications of value from these sources are generally discounted based on the age of the financial information or the quality of the assets.
Loans whose terms are modified are classified as troubled debt restructurings if the Company grants such borrowers concessions and it is deemed that those borrowers are experiencing financial difficulty. Concessions granted under a troubled debt restructuring generally involve an extension of a loan’s stated maturity date or a temporary reduction in interest rate. Non-accrual troubled debt restructurings are restored to accrual status if principal and interest payments, under the modified terms, are current for six consecutive months after modification. Loans classified as troubled debt restructurings are designated as impaired.
BANK PREMISES AND EQUIPMENT
- Bank premises and equipment are stated at cost less accumulated depreciation. Repair and maintenance expenditures which extend the useful lives of assets are capitalized, and other repair and maintenance expenditures are expensed as incurred. Depreciation expense is computed using the straight-line method.
IMPAIRMENT OF LONG-LIVED ASSETS
– The Corporation reviews long-lived assets, such as premises and equipment and intangibles, for impairment whenever events or changes in circumstances indicate the carrying amount of an asset may not be recoverable. These changes in circumstances may include a significant decrease in the market value of an asset or the manner in which an asset is used. If there is an indication the carrying value of an asset may not be recoverable, future undiscounted cash flows expected to result from use of the asset are estimated. If the sum of the expected cash flows is less than the carrying value of
the asset, a loss is recognized for the difference between the carrying value and fair market value of the asset.
INTEREST COSTS
– The Corporation capitalizes interest as a component of the cost of premises and equipment constructed or acquired for its own use. The amount of capitalized interest in 2010, 2009, and 2008 was not significant.
FORECLOSED ASSETS HELD FOR SALE
- Foreclosed assets held for sale consist of real estate acquired by foreclosure and are initially recorded at fair value, less estimated selling costs. Subsequent to foreclosure, revenues are included in Other Operating income and expenses from operations and lower of cost or market changes in the valuation are included in Other Operating Expenses.
GOODWILL AND CORE DEPOSIT INTANGIBLE ASSETS
-
Goodwill represents the excess of the cost of acquisitions over the fair value of the net assets acquired. Goodwill is tested at least annually for impairment, or more often if events or circumstances indicate there may be impairment. Core deposit intangibles are being amortized over periods of time that represent the expected lives using a method of amortization that reflects the pattern of economic benefit. Core deposit intangibles
are subject to impairment testing whenever events or changes in circumstances indicate their carrying amounts may not be recoverable
.
SERVICING RIGHTS
– The estimated fair value of servicing rights related to mortgage loans sold and serviced by the Corporation is recorded as an asset upon the sale of such loans. Servicing rights are amortized as expense over the estimated lives of the underlying loans. The servicing rights asset is included in Other Assets in the consolidated balance sheet, with a balance of $204,000 at December 31, 2010. Servicing rights are evaluated for impairment by comparing the carrying amount to the estimated fair value, as determined through a discounted cash flows valuation. Significant inputs to the valuation
include expected net servicing income to be received, the expected life of the underlying loans and the discount rate. If the amortized cost of the servicing rights were to exceed fair value, a valuation allowance would be established through a charge against servicing income (included in Other Income in the consolidated statement of operations). At December 31, 2010, no such valuation allowance against the carrying value of servicing rights has been established.
49
INCOME TAXES
- Deferred tax assets and liabilities are recognized for the future tax consequences attributable to differences between the financial statement carrying amount of existing assets and liabilities and their respective tax bases given the provisions of the enacted tax laws. Deferred tax assets are reduced, if necessary, by the amount of such benefits that are not expected to be realized based upon available evidence.
The Corporation includes income tax penalties in the provision for income tax. The Corporation has no accrued interest related to unrecognized tax
benefits.
STOCK COMPENSATION PLANS
- The Corporation’s stock-based compensation policy applies to all forms of stock-based compensation including stock options and restricted stock units. All stock-based compensation is accounted for under the fair value method as required by generally accepted accounting principles in the United States. The expense associated with stock-based compensation is recognized over the vesting period of each individual arrangement.
The fair value of each stock option is estimated on the date of grant using the Black-Scholes-Merton option valuation model. The fair value of restricted stock is based on the current market price on the date of grant.
OFF-BALANCE SHEET FINANCIAL INSTRUMENTS -
In the ordinary course of business, the Corporation has entered into off-balance sheet financial instruments consisting of commitments to extend credit and standby letters of credit. Such financial instruments are recorded in the financial statements when they become payable.
CASH FLOWS
- The Corporation utilizes the net reporting of cash receipts and cash payments for certain deposit and lending activities. The Corporation considers all cash and amounts due from depository institutions, interest-bearing deposits in other banks, and federal funds sold to be cash equivalents.
TRUST ASSETS AND INCOME
- Assets held by the Corporation in a fiduciary or agency capacity for its customers are not included in the financial statements since such items are not assets of the Corporation. Trust income is recorded on a cash basis, which is not materially different from the accrual basis.
2. RECENT ACCOUNTING PRONOUNCEMENTS:
This section provides a summary description of recent accounting standards that have significant implications (elected or required) within the consolidated financial statements, or that management expects may have a significant impact on financial statements issued in the near future.
In July 2010, the Financial Accounting Standards Board (“FASB”) issued new authoritative guidance under “FASB Accounting Standards Codification” (“ASC”) Topic 310, “Receivables,” amending prior guidance to provide a greater level of disaggregated information about the credit quality of loans and leases and the allowance for loan and lease losses (the “allowance”). The new authoritative guidance also requires additional disclosures related to credit quality indicators, past due information, and information related to loans modified in a troubled debt restructuring. The new authoritative guidance amends only the disclosure requirements
for loans and leases and the allowance. The Corporation adopted the period end disclosure provisions of the new ASC 310 in the reporting period ending December 31, 2010. Adoption of the new guidance did not have an impact on the Corporation’s consolidated financial statements. The disclosures related to activity that occurs within the allowance will be effective for reporting periods beginning after December 15, 2010, and will not have any impact on the Corporation’s consolidated financial statements.
New disclosure requirements under ASC Topic 310 related to troubled debt restructurings that would have been effective for the Corporation as of December 31, 2010 have been delayed. The delay is intended to allow the FASB time to complete deliberations on what constitutes a troubled debt restructuring. The effective date of the new disclosures about troubled debt restructurings for public entities and the guidance for determining what constitutes a troubled debt restructuring will then be coordinated. Currently, that guidance, which will affect the Corporation’s disclosures related to loans, is anticipated to be effective for periods ending after June 15, 2011.
FASB ASC 310, sub-topic 310-30, “Loans and Debt Securities Acquired With Deteriorated Credit Quality” was amended to clarify the modifications of loans that are accounted for within a pool under sub-topic 310-30 do not result in the removal of those loans from the pool even if the modifications would otherwise be considered a troubled debt restructuring. The amendments do not affect the accounting for loans under the scope of sub-topic 310-30 that are not accounted for within pools. Loans accounted for individually under sub-topic 310-30 continue to be subject to the troubled debt restructuring accounting provisions within ASC 310 sub-topic 310-40 “Troubled Debt
Restructurings by Creditors.” The new authoritative accounting guidance under sub-topic 310-30 became effective in the third quarter of 2010 and did not have an impact on the Corporation’s consolidated financial statements.
50
FASB ASC 820, sub-topic 820-10, “Improving Disclosures about Fair Value Measurements” was amended to require: (1) separate disclosure of the amounts of significant transfers in and out of Level 1 and Level 2 fair value measurements and the reasons for the transfers, and (2) in the reconciliation for fair value measurements using significant unobservable inputs, separate information about purchases, sales, issuances and settlements. The amendment is effective for interim and annual periods beginning after December 15, 2009, except for the disclosures about purchases, sales, issuances and settlements in the roll forward of Level 3 fair value measurements, which are effective for interim and
annual periods beginning after December 15, 2010. These amendments affected the Corporation’s disclosures regarding fair value measurements in 2010 and will further affect fair value-related disclosures beginning in the first quarter 2011.
Transfers and Servicing:
ASC 860
Transfers and Servicing
improves the relevance, representational faithfulness, and comparability of the information that a reporting entity provides in its financial statements about a transfer of financial assets; the effects of a transfer on its financial position, financial performance, and cash flows; and a transferor’s continuing involvement, if any, in transferred financial assets. The adoption of ASC 860, effective January 1, 2010, had no significant impact on the Corporation’s financial condition and
results of operations in the current year.
Consolidation:
ASC 810
Consolidation
improves financial reporting by enterprises involved with variable interest entities and any significant changes in risk exposure due to that involvement as well as its affect on the entity’s financial statements. The Corporation adopted the provisions of ASC 810, effective January 1, 2010, with no significant impact on the Corporation’s financial condition and results of operations.
3. COMPREHENSIVE INCOME
Comprehensive income (loss) is the total of (1) net income (loss), and (2) all other changes in equity from non-stockholder sources, which are referred to as other comprehensive income. The components of other comprehensive (loss) income, and the related tax effects, are as follows:
|
(In Thousands)
|
2010
|
2009
|
2008
|
|||||||||
|
Net income (loss)
|
$ | 19,055 | $ | (39,335 | ) | $ | 10,059 | |||||
|
Unrealized holding losses on available-for-sale securities
|
(448 | ) | (45,998 | ) | (34,286 | ) | ||||||
|
Reclassification adjustment for (gains) losses realized in income
|
(829 | ) | 83,840 | 9,338 | ||||||||
|
Other comprehensive (loss) gain before income tax
|
(1,277 | ) | 37,842 | (24,948 | ) | |||||||
|
Income tax related to other comprehensive (loss) gain
|
(448 | ) | 12,866 | (8,482 | ) | |||||||
|
Other comprehensive (loss) gain on available-for-sale securities
|
(829 | ) | 24,976 | (16,466 | ) | |||||||
|
Unfunded pension and postretirement obligations:
|
||||||||||||
|
Change in items from defined benefit plans included in
|
||||||||||||
|
accumulated other comprehensive loss
|
126 | (511 | ) | 509 | ||||||||
|
Amortization of net transition obligation, prior service cost and net
|
||||||||||||
|
actuarial loss included in net periodic benefit cost
|
53 | 94 | (43 | ) | ||||||||
|
Other comprehensive gain (loss) before income tax
|
179 | (417 | ) | 466 | ||||||||
|
Income tax related to other comprehensive gain (loss)
|
60 | (142 | ) | 157 | ||||||||
|
Other comprehensive gain (loss) on unfunded retirement obligations
|
119 | (275 | ) | 309 | ||||||||
|
Net other comprehensive (loss) income
|
(710 | ) | 24,701 | (16,157 | ) | |||||||
|
Comprehensive income (loss)
|
$ | 18,345 | $ | (14,634 | ) | $ | (6,098 | ) | ||||
The Corporation recognized other comprehensive income of $52,000 before income tax ($34,000 after income tax) related to available-for-sale debt securities for which a portion of an other-than-temporary impairment (OTTI) loss has been recognized in earnings in 2010. In 2009, the Corporation recognized other comprehensive income of $3,451,000 before income tax ($2,278,000 after income tax) related to available-for-sale debt securities for which a portion of an OTTI loss has been recognized in earnings.
51
The components of accumulated other comprehensive income (loss), included in stockholders’ equity, are as follows:
|
Dec. 31
|
Dec. 31,
|
|||||||
|
2010
|
2009
|
|||||||
|
Net unrealized loss on available-for-sale securities
|
$ | (2,046 | ) | $ | (769 | ) | ||
|
Tax effect
|
695 | 247 | ||||||
|
Net-of-tax amount
|
(1,351 | ) | (522 | ) | ||||
|
Unrealized loss on defined benefit plans
|
(384 | ) | (563 | ) | ||||
|
Tax effect
|
134 | 194 | ||||||
|
Net-of-tax amount
|
(250 | ) | (369 | ) | ||||
|
Total accumulated other comprehensive loss
|
$ | (1,601 | ) | $ | (891 | ) | ||
4. PER SHARE DATA
Net income per share is based on the weighted-average number of shares of common stock outstanding. The following data show the amounts used in computing basic and diluted net income per share. As shown in the table that follows, diluted earnings per share is computed using weighted average common shares outstanding, plus weighted-average common shares available from the exercise of all dilutive stock options, less the number of shares that could be repurchased with the proceeds of stock option exercises based on the average share price of the Corporation's common stock during the period. Weighted average common shares available from stock options and a warrant totaling 359,092
shares in 2010 and 518,480 in 2009 were not included in the calculation because their effects were anti-dilutive.
|
Weighted-
|
||||||||||||
|
Net
|
Average
|
Earnings
|
||||||||||
|
Income
|
Common
|
Per
|
||||||||||
|
(Loss)
|
Shares
|
Share
|
||||||||||
|
2010
|
||||||||||||
|
Earnings per common share – basic and diluted
|
$ | 17,581,000 | 12,131,039 | $ | 1.45 | |||||||
|
2009
|
||||||||||||
|
Earnings per common share – basic and diluted
|
$ | (40,763,000 | ) | 9,271,869 | $ | (4.40 | ) | |||||
|
2008
|
||||||||||||
|
Earnings per share – basic
|
$ | 10,059,000 | 8,961,805 | $ | 1.12 | |||||||
|
Dilutive effect of potential common stock
|
||||||||||||
|
arising from stock options:
|
||||||||||||
|
Exercise of outstanding stock options
|
142,208 | |||||||||||
|
Hypothetical share repurchase at $ 20.25
|
(120,713 | ) | ||||||||||
|
Earnings per share – diluted
|
$ | 10,059,000 | 8,983,300 | $ | 1.12 | |||||||
5. CASH AND DUE FROM BANKS
The Corporation is required to maintain reserves against deposit liabilities in the form of cash and balances with the Federal Reserve Bank. The reserves are based on deposit levels during the year, account activity, and other services provided by the Federal Reserve Bank. Required reserves as of December 31, 2010 and 2009 were $13,279,000 and $10,138,000.
In 2008, the FDIC temporarily increased the amount of insured deposits from $100,000 to $250,000. In 2010, the FDIC made this increase permanent. The Corporation maintains cash and cash equivalents with certain financial institutions in excess of the insured amount.
52
6. FAIR VALUE MEASUREMENTS AND FAIR VALUES OF FINANCIAL INSTRUMENTS
The Corporation measures certain assets at fair value on a recurring basis. Fair value is defined as the price that would be received to sell an asset in an orderly transaction between market participants at the measurement date. FASB ASC topic 820, “Fair Value Measurements and Disclosures” (formerly Statement of Financial Accounting Standards No. 157) establishes a framework for measuring fair value that includes a hierarchy used to classify the inputs used in measuring fair value. The hierarchy prioritizes the inputs used in determining valuations into three levels. The level in the fair value hierarchy within which the fair value measurement falls is
determined based on the lowest level input that is significant to the fair value measurement. The levels of the fair value hierarchy are as follows:
Level 1 – Fair value is based on unadjusted quoted prices in active markets that are accessible to the Corporation for identical assets. These generally provide the most reliable evidence and are used to measure fair value whenever available.
Level 2 – Fair value is based on significant inputs, other than Level 1 inputs, that are observable either directly or indirectly for substantially the full term of the asset through corroboration with observable market data. Level 2 inputs include quoted market prices in active markets for similar assets, quoted market prices in markets that are not active for identical or similar assets and other observable inputs.
Level 3 – Fair value is based on significant unobservable inputs. Examples of valuation methodologies that would result in Level 3 classification include option pricing models, discounted cash flows and other similar techniques.
At December 31, 2010 and 2009, assets measured at fair value on a recurring basis and the valuation methods used are as follows:
|
December 31, 2010
|
||||||||||||||||
|
Market Values Based on:
|
||||||||||||||||
|
Quoted Prices
|
Other
|
|||||||||||||||
|
in Active
|
Observable
|
Unobservable
|
Total
|
|||||||||||||
|
(In Thousands)
|
Markets
|
Inputs
|
Inputs
|
Fair
|
||||||||||||
|
(Level 1)
|
(Level 2)
|
(Level 3)
|
Value
|
|||||||||||||
|
AVAILABLE-FOR-SALE SECURITIES:
|
||||||||||||||||
|
Obligations of other U.S. Government agencies
|
$ | 0 | $ | 44,247 | $ | 0 | $ | 44,247 | ||||||||
|
Obligations of states and political subdivisions
|
5,699 | 121,843 | 0 | 127,542 | ||||||||||||
|
Mortgage-backed securities
|
0 | 118,386 | 0 | 118,386 | ||||||||||||
|
Collateralized mortgage obligations,
|
||||||||||||||||
|
Issued by U.S. Government agencies
|
9,117 | 121,709 | 0 | 130,826 | ||||||||||||
|
Corporate bonds
|
0 | 1,027 | 0 | 1,027 | ||||||||||||
|
Trust preferred securities issued by individual institutions
|
0 | 7,838 | 0 | 7,838 | ||||||||||||
|
Collateralized debt obligations:
|
||||||||||||||||
|
Pooled trust preferred securities - senior tranches
|
0 | 0 | 7,400 | 7,400 | ||||||||||||
|
Other collateralized debt obligations
|
0 | 681 | 0 | 681 | ||||||||||||
|
Total debt securities
|
14,816 | 415,731 | 7,400 | 437,947 | ||||||||||||
|
Marketable equity securities
|
6,009 | 0 | 0 | 6,009 | ||||||||||||
|
Total available-for-sale securities
|
$ | 20,825 | $ | 415,731 | $ | 7,400 | $ | 443,956 | ||||||||
53
|
December 31, 2009
|
||||||||||||||||
|
Market Values Based on:
|
||||||||||||||||
|
Quoted Prices
|
Other
|
|||||||||||||||
|
(In Thousands)
|
in Active
|
Observable
|
Unobservable
|
Total
|
||||||||||||
|
Markets
|
Inputs
|
Inputs
|
Fair
|
|||||||||||||
|
(Level 1)
|
(Level 2)
|
(Level 3)
|
Value
|
|||||||||||||
|
AVAILABLE-FOR-SALE SECURITIES:
|
||||||||||||||||
|
Obligations of other U.S. Government agencies
|
$ | 13,512 | $ | 35,481 | $ | 0 | $ | 48,993 | ||||||||
|
Obligations of states and political subdivisions
|
0 | 104,990 | 0 | 104,990 | ||||||||||||
|
Mortgage-backed securities
|
5,212 | 151,166 | 0 | 156,378 | ||||||||||||
|
Collateralized mortgage obligations:
|
||||||||||||||||
|
Issued by U.S. Government agencies
|
5,095 | 42,613 | 0 | 47,708 | ||||||||||||
|
Private label
|
0 | 15,494 | 0 | 15,494 | ||||||||||||
|
Corporate bonds
|
0 | 1,041 | 0 | 1,041 | ||||||||||||
|
Trust preferred securities issued by individual institutions
|
0 | 5,218 | 800 | 6,018 | ||||||||||||
|
Collateralized debt obligations:
|
||||||||||||||||
|
Pooled trust preferred securities - senior tranches
|
0 | 0 | 8,199 | 8,199 | ||||||||||||
|
Pooled trust preferred securities - mezzanine tranches
|
0 | 0 | 115 | 115 | ||||||||||||
|
Other collateralized debt obligations
|
0 | 690 | 0 | 690 | ||||||||||||
|
Total debt securities
|
23,819 | 356,693 | 9,114 | 389,626 | ||||||||||||
|
Marketable equity securities
|
6,662 | 0 | 0 | 6,662 | ||||||||||||
|
Total available-for-sale securities
|
30,481 | 356,693 | 9,114 | 396,288 | ||||||||||||
|
TRADING SECURITIES,
|
||||||||||||||||
|
Obligations of states and political subdivisions
|
0 | 1,045 | 0 | 1,045 | ||||||||||||
|
Total
|
$ | 30,481 | $ | 357,738 | $ | 9,114 | $ | 397,333 | ||||||||
Management determined there have been few trades of pooled trust-preferred securities since the first half of 2008, except for a limited number of transactions that have taken place as a result of bankruptcies, forced liquidations or similar circumstances. Also, in management’s judgment, there were no available quoted market prices in active markets for assets sufficiently similar to the Corporation’s pooled trust-preferred securities to be reliable as observable inputs. Accordingly, in the third quarter of 2008, the Corporation changed its method of valuing pooled trust-preferred securities from a Level 2 methodology that had been used in prior periods, based on price quotes
received from pricing services, to a Level 3 methodology, using discounted cash flows.
At December 31, 2010, management calculated the fair value of the Corporation’s senior tranche pooled trust-preferred security by applying a discount rate to the estimated cash flows. Management used the cash flow estimates determined using the process described in Note 7 for evaluating pooled trust-preferred securities for other-than-temporary impairment (OTTI). Management used a discount rate considered reflective of a market participant’s expectations regarding the extent of credit and liquidity risk inherent in the security. In establishing the discount rate, management considered: (1) the implied discount rate as of the end of 2007, prior to the market for
trust-preferred securities becoming inactive; (2) adjustment to the year-end 2007 discount rate for the change in the spread between indicative market rates over corresponding risk-free rates in 2010; and (3) an additional adjustment – an increase of 2% in the discount rate – for liquidity risk. Management considered the additional 2% increase in the discount rate necessary in order to give some consideration to price estimates based on trades made under distressed conditions, as reported by brokers and pricing services. Management’s estimate of cash flows and the discount rate used to calculate the fair value of the pooled trust-preferred security were based on sensitive assumptions, and market participants might use substantially different assumptions, which could result in calculations of a fair value that would be substantially different than
the amount calculated by management.
In the fourth quarter 2009, the Corporation transferred a trust preferred security issued by a financial institution (The South Financial Group, Inc.) to Level 3 from Level 2. This security was transferred to Level 3 because management had been trying to sell the security since October 2009, but had not been able to obtain a bid from a potential buyer nor otherwise been able to find a price quote. In April 2010, management sold a portion of the security held for total proceeds of $240,000. During the fourth quarter 2010, The Toronto-Dominion Bank acquired The South Financial Group, Inc., and the Corporation’s security became an obligation of The Toronto-Dominion Bank. Management
received several broker price quotes on the security, which were used to determine a Level 2 valuation at December 31, 2010. There were no other transfers between levels in 2010 or 2009.
54
Following is a reconciliation of activity for available-for-sale securities measured at fair value based on significant unobservable information:
|
(In Thousands)
|
2010
|
2009
|
2008
|
|||||||||
|
Balance, beginning of period
|
$ | 9,114 | $ | 58,914 | $ | 0 | ||||||
|
Transfers
|
(240 | ) | 800 | 73,018 | ||||||||
|
Purchases, issuances and settlements
|
(1,588 | ) | (242 | ) | 100 | |||||||
|
Proceeds from sales
|
(550 | ) | (620 | ) | 0 | |||||||
|
Realized gains (losses), net
|
310 | (182 | ) | 0 | ||||||||
|
Unrealized losses included in earnings
|
(423 | ) | (73,674 | ) | (8,210 | ) | ||||||
|
Unrealized gains (losses) included in other
comprehensive income
|
777 | 24,118 | (5,994 | ) | ||||||||
|
Balance, end of period
|
$ | 7,400 | $ | 9,114 | $ | 58,914 | ||||||
Unrealized losses included in earnings are from the Corporation’s other-than-temporary impairment analysis of securities, as described in Note 7, and are included in net impairment losses recognized in earnings in the consolidated statement of operations.
Assets measured at fair value on a nonrecurring basis include impaired commercial loans, foreclosed real estate assets held for sale and servicing rights. All of the Corporation’s impaired commercial loans for which a valuation allowance was necessary at December 31, 2010 and 2009 were valued based on the estimated amount of net proceeds from liquidation of real estate and other collateral, or based on the estimated present value of cash flows to be received. The Corporation considers the fair value of such impaired commercial loans to be based on unobservable inputs (Level 3), and the balance of impaired loans for which a valuation allowance was recorded, net of allowance for loan
losses, was $3,169,000 at December 31, 2010 and $1,564,000 at December 31, 2009. Similarly, the carrying values of foreclosed real estate assets held for sale were based on unobservable inputs (Level 3), with a balance of $537,000 at December 31, 2010 and $873,000 at December 31, 2009. The carrying value of servicing rights of $204,000 at December 31, 2010 was also based on unobservable inputs (Level 3).
Certain of the Corporation’s financial instruments are not measured at fair value in the consolidated financial statements. In cases where quoted market prices are not available, fair values are based on estimates using present value or other valuation techniques. Those techniques are significantly affected by the assumptions used, including the discount rate and estimates of future cash flows. Accordingly, the fair value estimates may not be realized in an immediate settlement of the instrument. Certain financial instruments and all nonfinancial instruments are excluded from disclosure requirements. Therefore, the aggregate fair value amounts presented may not represent the underlying fair value
of the Corporation.
The Corporation used the following methods and assumptions in estimating fair value disclosures for financial instruments:
CASH AND CASH EQUIVALENTS
- The carrying amounts of cash and short-term instruments approximate fair values.
SECURITIES
- Fair values for securities, excluding restricted equity securities, are based on quoted market prices or other methods as described above. The carrying value of restricted equity securities approximates fair value based on applicable redemption provisions.
LOANS HELD FOR SALE
- Fair values of loans held for sale are determined based on applicable sales price available under the Federal Home Loan Banks’ MPF Xtra program.
LOANS
- Fair values are estimated for portfolios of loans with similar financial characteristics. Loans are segregated by type such as commercial, commercial real estate, residential mortgage and other consumer. Each loan category is further segmented into fixed and adjustable rate interest terms and by performing and nonperforming categories. The fair value of performing loans is calculated by discounting contractual cash flows, adjusted for estimated prepayments based on historical experience, using estimated market discount rates that reflect the credit and interest rate risk inherent in the loans. Fair value of nonperforming loans is based on recent
appraisals or estimates prepared by the Corporation’s lending officers.
55
SERVICING RIGHTS
– The fair value of servicing rights is determined through a discounted cash flow valuation. Significant inputs include expected net servicing income, the discount rate and the expected life of the underlying loans.
DEPOSITS
- The fair value of deposits with no stated maturity, such as noninterest-bearing demand deposits, savings, money market and interest checking accounts, is (by definition) equal to the amount payable on demand at December 31, 2010 and December 31, 2009. The fair value of all other deposit categories is based on the discounted value of contractual cash flows. The discount rate is estimated using the rates currently offered for deposits of similar remaining maturities. The fair value estimates of deposits do not include the benefit that results from the low-cost funding provided by the deposit liabilities compared to the cost of borrowing
funds in the market, commonly referred to as the core deposit intangible.
BORROWED FUNDS
- The fair value of borrowings is estimated using discounted cash flow analyses based on rates currently available to the Corporation for similar types of borrowing arrangements.
ACCRUED INTEREST
- The carrying amounts of accrued interest receivable and payable approximate fair values.
OFF-BALANCE SHEET COMMITMENTS
- The Corporation has commitments to extend credit and has issued standby letters of credit. Standby letters of credit are conditional guarantees of performance by a customer to a third party. Estimates of the fair value of these off-balance sheet items were not made because of the short-term nature of these arrangements and the credit standing of the counterparties.
The estimated fair values, and related carrying amounts, of the Corporation’s financial instruments are as follows:
|
(In Thousands)
|
December 31, 2010
|
December 31, 2009
|
||||||||||||||
|
Carrying
|
Fair
|
Carrying
|
Fair
|
|||||||||||||
|
Amount
|
Value
|
Amount
|
Value
|
|||||||||||||
|
Financial assets:
|
||||||||||||||||
|
Cash and cash equivalents
|
$ | 46,301 | $ | 46,301 | $ | 92,065 | $ | 92,065 | ||||||||
|
Trading securities
|
0 | 0 | 1,045 | 1,045 | ||||||||||||
|
Available-for-sale securities
|
443,956 | 443,956 | 396,288 | 396,288 | ||||||||||||
|
Held-to-maturity securities
|
0 | 0 | 300 | 302 | ||||||||||||
|
Restricted equity securities
|
8,286 | 8,286 | 8,970 | 8,970 | ||||||||||||
|
Loans held for sale
|
5,247 | 5,249 | 592 | 592 | ||||||||||||
|
Loans, net
|
721,304 | 728,744 | 712,746 | 719,097 | ||||||||||||
|
Accrued interest receivable
|
4,960 | 4,960 | 5,613 | 5,613 | ||||||||||||
|
Servicing rights
|
204 | 204 | 0 | 0 | ||||||||||||
|
|
||||||||||||||||
|
Financial liabilities:
|
||||||||||||||||
|
Deposits
|
1,004,348 | 1,012,247 | 926,789 | 935,380 | ||||||||||||
|
Short-term borrowings
|
18,413 | 18,240 | 39,229 | 38,970 | ||||||||||||
|
Long-term borrowings
|
148,495 | 171,877 | 196,242 | 218,767 | ||||||||||||
|
Accrued interest payable
|
430 | 430 | 681 | 681 | ||||||||||||
56
7. SECURITIES
Amortized cost and fair value of securities at December 31, 2010 and 2009 are summarized as follows:
|
December 31, 2010
|
||||||||||||||||
|
Gross
|
Gross
|
|||||||||||||||
|
Unrealized
|
Unrealized
|
|||||||||||||||
|
Amortized
|
Holding
|
Holding
|
Fair
|
|||||||||||||
|
(In Thousands)
|
Cost
|
Gains
|
Losses
|
Value
|
||||||||||||
|
AVAILABLE-FOR-SALE SECURITIES:
|
||||||||||||||||
|
Obligations of other U.S. Government agencies
|
$ | 44,005 | $ | 270 | $ | (28 | ) | $ | 44,247 | |||||||
|
Obligations of states and political subdivisions
|
135,018 | 547 | (8,023 | ) | 127,542 | |||||||||||
|
Mortgage-backed securities
|
113,176 | 5,381 | (171 | ) | 118,386 | |||||||||||
|
Collateralized mortgage obligations,
|
||||||||||||||||
|
Issued by U.S. Government agencies
|
131,040 | 869 | (1,083 | ) | 130,826 | |||||||||||
|
Corporate bonds
|
1,000 | 27 | 0 | 1,027 | ||||||||||||
|
Trust preferred securities issued by individual institutions
|
6,535 | 1,694 | (391 | ) | 7,838 | |||||||||||
|
Collateralized debt obligations:
|
||||||||||||||||
|
Pooled trust preferred securities - senior tranches
|
9,957 | 0 | (2,557 | ) | 7,400 | |||||||||||
|
Other collateralized debt obligations
|
681 | 0 | 0 | 681 | ||||||||||||
|
Total debt securities
|
441,412 | 8,788 | (12,253 | ) | 437,947 | |||||||||||
|
Marketable equity securities
|
4,589 | 1,496 | (76 | ) | 6,009 | |||||||||||
|
Total
|
$ | 446,001 | $ | 10,284 | $ | (12,329 | ) | $ | 443,956 | |||||||
|
December 31, 2009
|
||||||||||||||||
|
Gross
|
Gross
|
|||||||||||||||
|
Unrealized
|
Unrealized
|
|||||||||||||||
|
Amortized
|
Holding
|
Holding
|
Fair
|
|||||||||||||
|
(In Thousands)
|
Cost
|
Gains
|
Losses
|
Value
|
||||||||||||
|
AVAILABLE-FOR-SALE SECURITIES:
|
||||||||||||||||
|
Obligations of other U.S. Government agencies
|
$ | 48,949 | $ | 131 | $ | (87 | ) | $ | 48,993 | |||||||
|
Obligations of states and political subdivisions
|
109,109 | 1,487 | (5,606 | ) | 104,990 | |||||||||||
|
Mortgage-backed securities
|
150,700 | 5,700 | (22 | ) | 156,378 | |||||||||||
|
Collateralized mortgage obligations:
|
||||||||||||||||
|
Issued by U.S. Government agencies
|
47,083 | 898 | (273 | ) | 47,708 | |||||||||||
|
Private label
|
15,465 | 50 | (21 | ) | 15,494 | |||||||||||
|
Corporate bonds
|
1,000 | 41 | 0 | 1,041 | ||||||||||||
|
Trust preferred securities issued by individual institutions
|
7,043 | 0 | (1,025 | ) | 6,018 | |||||||||||
|
Collateralized debt obligations:
|
||||||||||||||||
|
Pooled trust preferred securities - senior tranches
|
11,383 | 0 | (3,184 | ) | 8,199 | |||||||||||
|
Pooled trust preferred securities - mezzanine tranches
|
266 | 0 | (151 | ) | 115 | |||||||||||
|
Other collateralized debt obligations
|
690 | 0 | 0 | 690 | ||||||||||||
|
Total debt securities
|
391,688 | 8,307 | (10,369 | ) | 389,626 | |||||||||||
|
Marketable equity securities
|
5,367 | 1,295 | 0 | 6,662 | ||||||||||||
|
Total
|
$ | 397,055 | $ | 9,602 | $ | (10,369 | ) | $ | 396,288 | |||||||
|
HELD-TO-MATURITY SECURITIES,
|
||||||||||||||||
|
Obligations of the U.S. Treasury
|
$ | 300 | $ | 2 | $ | 0 | $ | 302 | ||||||||
57
The following table presents gross unrealized losses and fair value of investments with unrealized loss positions that are not deemed to be other-than-temporarily impaired, aggregated by length of time that individual securities have been in a continuous unrealized loss position at December 31, 2010 and 2009:
|
December 31, 2010
|
Less Than 12 Months
|
12 Months or More
|
Total
|
|||||||||||||||||||||
|
(In Thousands)
|
Fair
|
Unrealized
|
Fair
|
Unrealized
|
Fair
|
Unrealized
|
||||||||||||||||||
|
Value
|
Losses
|
Value
|
Losses
|
Value
|
Losses
|
|||||||||||||||||||
|
AVAILABLE-FOR-SALE SECURITIES:
|
||||||||||||||||||||||||
|
Obligations of other U.S. Government agencies
|
$ | 10,230 | $ | (28 | ) | $ | 0 | $ | 0 | $ | 10,230 | $ | (28 | ) | ||||||||||
|
Obligations of states and political subdivisions
|
59,661 | (2,674 | ) | 28,622 | (5,349 | ) | 88,283 | (8,023 | ) | |||||||||||||||
|
Mortgage-backed securities
|
13,141 | (171 | ) | 0 | 0 | 13,141 | (171 | ) | ||||||||||||||||
|
Collateralized mortgage obligations,
|
||||||||||||||||||||||||
|
Issued by U.S. Government agencies
|
56,257 | (1,083 | ) | 0 | 0 | 56,257 | (1,083 | ) | ||||||||||||||||
|
Trust preferred securities issued by individual institutions
|
0 | 0 | 5,825 | (391 | ) | 5,825 | (391 | ) | ||||||||||||||||
|
Collateralized debt obligations,
|
||||||||||||||||||||||||
|
Pooled trust preferred securities - senior tranches
|
0 | 0 | 7,400 | (2,557 | ) | 7,400 | (2,557 | ) | ||||||||||||||||
|
Total debt securities
|
139,289 | (3,956 | ) | 41,847 | (8,297 | ) | 181,136 | (12,253 | ) | |||||||||||||||
|
Marketable equity securities
|
710 | (76 | ) | 0 | 0 | 710 | (76 | ) | ||||||||||||||||
|
Total temporarily impaired available-for-sale
securities
|
$ | 139,999 | $ | (4,032 | ) | $ | 41,847 | $ | (8,297 | ) | $ | 181,846 | $ | (12,329 | ) | |||||||||
|
December 31, 2009
|
Less Than 12 Months
|
12 Months or More
|
Total
|
|||||||||||||||||||||
|
(In Thousands)
|
Fair
|
Unrealized
|
Fair
|
Unrealized
|
Fair
|
Unrealized
|
||||||||||||||||||
|
Value
|
Losses
|
Value
|
Losses
|
Value
|
Losses
|
|||||||||||||||||||
|
AVAILABLE-FOR-SALE SECURITIES:
|
||||||||||||||||||||||||
|
Obligations of other U.S. Government agencies
|
$ | 17,796 | $ | (87 | ) | $ | 0 | $ | 0 | $ | 17,796 | $ | (87 | ) | ||||||||||
|
Obligations of states and political subdivisions
|
19,001 | (422 | ) | 36,939 | (5,184 | ) | 55,940 | (5,606 | ) | |||||||||||||||
|
Mortgage-backed securities
|
3,544 | (21 | ) | 20 | (1 | ) | 3,564 | (22 | ) | |||||||||||||||
|
Collateralized mortgage obligations:
|
||||||||||||||||||||||||
|
Issued by U.S. Government agencies
|
18,229 | (273 | ) | 0 | 0 | 18,229 | (273 | ) | ||||||||||||||||
|
Private label
|
0 | 0 | 3,219 | (21 | ) | 3,219 | (21 | ) | ||||||||||||||||
|
Trust preferred securities issued by individual institutions
|
0 | 0 | 5,218 | (1,025 | ) | 5,218 | (1,025 | ) | ||||||||||||||||
|
Collateralized debt obligations:
|
||||||||||||||||||||||||
|
Pooled trust preferred securities - senior tranches
|
0 | 0 | 8,199 | (3,184 | ) | 8,199 | (3,184 | ) | ||||||||||||||||
|
Pooled trust preferred securities - mezzanine tranches
|
0 | 0 | 115 | (151 | ) | 115 | (151 | ) | ||||||||||||||||
|
Total temporarily impaired available-for-sale
securities
|
$ | 58,570 | $ | (803 | ) | $ | 53,710 | $ | (9,566 | ) | $ | 112,280 | $ | (10,369 | ) | |||||||||
Gross realized gains and losses from available-for-sale securities (including OTTI losses in gross realized losses), and the related income tax provision (credit), for 2010, 2009 and 2008 were as follows:
|
(In Thousands)
|
||||||||||||
|
2010
|
2009
|
2008
|
||||||||||
|
Gross realized gains
|
$ | 1,270 | $ | 2,205 | $ | 780 | ||||||
|
Gross realized losses
|
(441 | ) | (86,045 | ) | (10,118 | ) | ||||||
|
Net realized gains (losses)
|
$ | 829 | $ | (83,840 | ) | $ | (9,338 | ) | ||||
|
Income tax provision (credit) related to net realized gains (losses)
|
$ | 282 | $ | (28,506 | ) | $ | (3,175 | ) | ||||
58
The maturities of available-for-sale debt securities at December 31, 2010 are summarized as follows:
|
December 31, 2010
|
||||||||
|
Amortized
|
Fair
|
|||||||
|
(In Thousands)
|
Cost
|
Value
|
||||||
|
Due in one year or less
|
$ | 7,150 | $ | 7,193 | ||||
|
Due after one year through five years
|
48,797 | 50,567 | ||||||
|
Due after five years through ten years
|
58,493 | 58,445 | ||||||
|
Due after ten years
|
326,972 | 321,742 | ||||||
|
Total
|
$ | 441,412 | $ | 437,947 | ||||
Investment securities carried at $216,828,000 at December 31, 2010 and $140,604,000 at December 31, 2009 were pledged as collateral for public deposits, trusts and certain other deposits as provided by law. Also, the Federal Home Loan Bank of Pittsburgh (FHLB-Pittsburgh) had issued a $30,000,000 letter of credit on the Corporation’s behalf for security on certain public deposits as of December 31, 2009. No such letters of credit were outstanding at December 31, 2010. See Note 12 for information concerning securities pledged to secure borrowing arrangements.
Management evaluates securities for OTTI at least on a quarterly basis, and more frequently when economic or market conditions warrant such evaluation. Consideration is given to (1) the length of time and the extent to which the fair value has been less than cost, (2) the financial condition and near-term prospects of the issuer, and (3) whether the Corporation intends to sell the security or more likely than not will be required to sell the security before its anticipated recovery.
The Corporation recognized net impairment losses in earnings, as follows:
|
(In Thousands)
|
||||||||||||
|
2010
|
2009
|
2008
|
||||||||||
|
Trust preferred securities issued by individual institutions
|
$ | (320 | ) | $ | (3,209 | ) | $ | 0 | ||||
|
Pooled trust preferred securities - mezzanine tranches
|
(103 | ) | (73,674 | ) | (8,210 | ) | ||||||
|
Marketable equity securities (bank stocks)
|
(10 | ) | (6,324 | ) | (1,878 | ) | ||||||
|
Private label collateralized mortgage obligations
|
0 | (2,156 | ) | 0 | ||||||||
|
Net impairment losses recognized in earnings
|
$ | (433 | ) | $ | (85,363 | ) | $ | (10,088 | ) | |||
A summary of information management considered in evaluating debt and equity securities for OTTI at December 31, 2010 is provided below.
Debt Securities
At December 31, 2010, management performed an assessment for possible OTTI of the Corporation’s debt securities on an issue-by-issue basis, relying on information obtained from various sources, including publicly available financial data, ratings by external agencies, brokers and other sources. The extent of individual analysis applied to each security depended on the size of the Corporation’s investment, as well as management’s perception of the credit risk associated with each security. Based on the results of the assessment, management believes impairment of these debt securities, including municipal bonds with no external ratings, at December 31, 2010 to be
temporary.
The credit rating agencies have withdrawn their ratings on numerous municipal bonds held by the Corporation. At December 31, 2010, the total amortized cost basis of municipal bonds with no external credit ratings was $26,338,000, with an aggregate unrealized loss of $3,529,000. At the time of purchase, each of these bonds was considered investment grade and had been rated by at least one credit rating agency. The bonds for which the ratings were removed were almost all insured by an entity that has reported significant financial problems and declines in its regulatory capital ratios. However, the insurance remains in effect on the bonds, and none of the affected municipal bonds has failed to
make a scheduled interest payment.
59
The following table provides information related to trust preferred securities issued by individual institutions as of December 31, 2010:
|
(In Thousands)
|
Cumulative
|
Moody’s/
|
|||||||||||||||||
|
Unrealized
|
Realized
|
S&P/Fitch
|
|||||||||||||||||
|
Amortized
|
Fair
|
Gain
|
Credit
|
Credit
|
|||||||||||||||
|
Name of Issuer
|
Issuer's Parent Company
|
Cost
|
Value
|
(Loss)
|
Losses
|
Ratings
|
|||||||||||||
|
Astoria Capital Trust I
|
Astoria Financial Corporation
|
$ | 5,215 | $ | 4,954 | $ | (261 | ) | $ | 0 |
Baa3/BB-/BB-
|
||||||||
|
Carolina First Mortgage Loan Trust
|
The Toronto-Dominion Bank
|
320 | 2,014 | 1,694 | (1,769 | ) |
NR
|
||||||||||||
|
Patriot Capital Trust I
|
Susquehanna Bancshares, Inc.
|
1,000 | 870 | (130 | ) | 0 |
NR
|
||||||||||||
|
Total
|
$ | 6,535 | $ | 7,838 | $ | 1,303 | $ | (1,769 | ) | ||||||||||
NR = not rated.
Management assesses each of the trust preferred securities issued by individual institutions for the possibility of OTTI by reviewing financial information that is publicly available. Neither Astoria Financial Corporation nor Susquehanna Bancshares, Inc. has deferred or defaulted on payments associated with the Corporation’s securities.
The Corporation recognized OTTI charges in 2009 and 2010 related to the Carolina First Mortgage Loan Trust security. In the fourth quarter 2010, The Toronto-Dominion Bank acquired The South Financial Group, Inc., the parent company of Carolina First. After the acquisition, The Toronto-Dominion Bank made a payment for the full amount of previously deferred interest and resumed quarterly payments on the security. The Corporation recognized a material change in the expected cash flows and recorded $83,000 in accretion income during the fourth quarter 2010. Management expects to book accretion income to offset the previous OTTI charges over the security’s remaining life, through May 2012.
Pooled trust-preferred securities are very long-term (usually 30-year maturity) instruments, mainly issued by banks. The Corporation’s investments in pooled trust-preferred securities are each made up of companies with geographic and size diversification. Almost all of the Corporation’s pooled trust-preferred securities are composed of debt issued by banking companies, with lesser amounts issued by insurance companies. Some of the issuers of trust-preferred securities that are included in the Corporation’s pooled investments have elected to defer payment of interest on these obligations (trust-preferred securities typically permit deferral of quarterly interest
payments for up to five years), and some issuers have defaulted.
Management evaluated pooled trust-preferred securities for OTTI by estimating the cash flows expected to be received from each security, taking into account estimated levels of deferrals and defaults by the underlying issuers. In determining cash flows, management assumed all issuers currently deferring or in default would make no future payments, and assigned estimated future default levels for the remaining issuers in each security based on financial strength ratings assigned by a national ratings service. Management calculated the present value of each security based on the current book yield, adjusted for future changes in 3-month LIBOR (which is the index rate on the Corporation’s
adjustable-rate pooled trust-preferred securities) based on the applicable forward curve.
In the third quarter 2009, management made significant changes in assumptions regarding future deferrals and defaults, in comparison to assumptions used in the previous quarters’ analyses. These changes had the effect of increasing estimated future defaults, which resulted in lower levels of future cash flows expected to be received, as compared to estimated future cash flows to be received based on the assumptions used in previous quarters. Management selected several of the trust preferred offerings in which the Corporation holds securities, and analyzed the change in deferral or default status, and the change in financial strength rating from the national ratings service used in its
quarterly analyses, over the period starting in the third quarter 2008 (which was the first quarter in which the Corporation performed the detailed cash flow analysis for each security) through the second quarter 2009. Management believes the results of its analysis of the securities selected to be similar to the results that would be produced in an analysis of all of the Corporation’s pooled trust-preferred securities. The analysis demonstrated that significant credit deterioration had occurred over the previous four quarterly periods, as evidenced in the data by average higher deferrals and defaults, and lower financial strength ratings. In determining how to apply the results of this analysis, management made two critical assumptions: (1) the deteriorating trend will continue at approximately the same rate over the next four quarters, and (2)
every issuer (bank) that would be assumed to defer payment within the next four quarters, based on the trend reflected in the data, would eventually default with no recovery. At December 31, 2010, management’s assumptions regarding future deferrals and defaults were consistent with the revisions established in the third quarter 2009.
60
Management’s estimates of cash flows used to evaluate other-than-temporary impairment of pooled trust-preferred securities were based on sensitive assumptions regarding the timing and amounts of defaults that may occur, and changes in those assumptions could produce different conclusions for each security.
During the third quarter 2010, management evaluated the Corporation’s holdings of mezzanine tranche pooled trust preferred securities, which had all been completely written off as OTTI. After this evaluation, management determined that future recoveries were unlikely for seven of the securities and solicited competitive bids to sell the securities. The securities were sold for aggregate pretax proceeds of $250,000, which was recorded as a gain on the sale of securities in the third quarter. The Corporation also sold several mezzanine tranche pooled trust preferred securities in the fourth quarter 2009, and recorded a gain of $153,000 from the sales, determined based on the excess of the aggregate sales
proceeds over the amortized cost bases of the securities, as adjusted for OTTI. The remaining securities continue to be carried at an amortized cost of zero.
The following table provides detailed information related to pooled trust preferred securities – mezzanine tranches held as of December 31, 2010:
|
Amortized
|
Fair
|
Unrealized
|
2010
|
Cumulative
|
||||||||||||||||
|
Description
|
Cost
|
Value
|
Gain
|
OTTI
|
OTTI
|
|||||||||||||||
|
MMCAPS Funding I, Ltd.
|
$ | 0 | $ | 0 | $ | 0 | $ | (2 | ) | $ | (5,833 | ) | ||||||||
|
U.S. Capital Funding II, Ltd. (B-1)
|
0 | 0 | 0 | (40 | ) | (1,992 | ) | |||||||||||||
|
U.S. Capital Funding II, Ltd. (B-2)
|
0 | 0 | 0 | (61 | ) | (2,973 | ) | |||||||||||||
|
ALESCO Preferred Funding IX, Ltd.
|
0 | 0 | 0 | 0 | (2,988 | ) | ||||||||||||||
|
Total
|
$ | 0 | $ | 0 | $ | 0 | $ | (103 | ) | $ | (13,786 | ) | ||||||||
As of December 31, 2010, the Corporation’s investment in a senior tranche security (the senior tranche of MMCAPS Funding I, Ltd., for which the Corporation also owns an investment in the mezzanine tranche security) had an investment grade rating. The senior tranche security, with an amortized cost of $9,957,000, has been subjected to impairment analysis based on estimated cash flows (using the process described above), and management has determined that impairment was temporary as of December 31, 2010. The table that follows provides additional information related to the senior tranche of MMCAPS Funding I, Ltd.:
|
Number of Banks Currently Performing
|
20 | |||
|
Moody's/Fitch Credit Ratings
|
A3/BBB
|
(1) | ||
|
Actual Deferrals and Defaults as % of Outstanding Collateral
|
27.7 | % | ||
|
Expected Additional Net Deferrals and Defaults as % of Performing Collateral
|
40.2 | % | ||
|
Excess Subordination as % of Performing Collateral
|
24.5 | % | ||
(1) Ratings information is as of December 31, 2010. Fitch has the senior tranche of MMCAPS Funding I, Ltd. on negative outlook.
In the table above, “Excess Subordination as % of Performing Collateral” (Excess Subordination Ratio) was calculated as follows: (Total face value of performing collateral – Face value of all outstanding note balances not subordinate to our investment)/Total face value of performing collateral.
The Excess Subordination Ratio measures the extent to which there may be tranches within the pooled trust preferred structure available to absorb credit losses before the Corporation’s security would be impacted. The positive Excess Subordination Ratio signifies there is some support from subordinate tranches available to absorb losses before the Corporation’s investment would be impacted.
The Corporation separates OTTI related to the trust-preferred securities into (a) the amount of the total impairment related to credit loss, which is recognized in the statement of earnings, and (b) the amount of the total impairment related to all other factors, which is recognized in other comprehensive income. The Corporation measures the credit loss component of OTTI based on the difference between: (1) the present value of estimated cash flows, at the book yield in effect prior to recognition of any OTTI, as of the most recent balance sheet date, and (2) the present value of estimated cash flows as of the previous quarter-end balance sheet date based on management’s cash flow assumptions at
that time.
Total OTTI from pooled trust-preferred securities in 2010 amounted to $51,000, including a pre-tax loss reflected in earnings of $103,000, with a pre-tax other comprehensive gain of $52,000 included in other comprehensive income. In 2009, total OTTI from pooled trust-preferred securities was $70,313,000, including a pre-tax loss reflected in earnings of $73,764,000 and a pre-tax other comprehensive gain of $3,451,000.
61
A roll-forward of the credit losses from securities for which a portion of OTTI has been recognized in other comprehensive income is as follows:
|
(In Thousands)
|
||||||||
|
2010
|
2009
|
|||||||
|
Balance of credit losses on debt securities for which a portion
|
||||||||
|
of OTTI was recognized in other comprehensive income,
|
||||||||
|
beginning of period (as measured effective January 1, 2009
|
||||||||
|
upon adoption of ASC Topic 320)
|
$ | (10,695 | ) | $ | (2,362 | ) | ||
|
Additional credit loss for which an OTTI was not previously recognized
|
0 | (62,085 | ) | |||||
|
Reduction for securities losses realized during the period
|
10,798 | 65,341 | ||||||
|
Additional credit loss for which an OTTI was previously
|
||||||||
|
recognized when the Corporation does not intend to sell
|
||||||||
|
the security and it is not more likely than not the Corporation
|
||||||||
|
will be required to sell the security before recovery of its
|
||||||||
|
amortized cost basis
|
(103 | ) | (11,589 | ) | ||||
|
Balance of credit losses on debt securities for which a portion
|
||||||||
|
of OTTI was recognized in other comprehensive income,
|
||||||||
|
end of period
|
$ | 0 | $ | (10,695 | ) | |||
The line item labeled “Reduction for securities losses realized during the period” in the table immediately above includes OTTI write-downs associated with securities the Corporation continues to hold, but which have been deemed worthless.
Equity Securities
The Corporation’s marketable equity securities at December 31, 2010 and December 31, 2009 consisted exclusively of stocks of banking companies. The Corporation recorded OTTI totaling $10,000 in 2010 and $6,324,000 in 2009. Management’s decision to record OTTI losses on bank stocks was based on a combination of: (1) significant market depreciation in market prices in the first quarter 2009 (with some improvement subsequent to March 31, 2009), and (2) management’s intent to sell some of the stocks to generate capital losses, which could be carried back and offset against capital gains generated in previous years to realize tax refunds. At December 31, 2010,
management did not intend to sell impaired bank stocks, and based on the intent to hold the securities for the foreseeable future and other factors specific to the securities, has determined that none of the Corporation’s bank stock holdings at December 31, 2010 were other than temporarily impaired.
Realized gains from sales of bank stocks totaled $588,000 in 2010 including $397,000 of realized gains from sales of stocks for which an OTTI had been previously recognized. Realized gains from sales of bank stocks totaled $1,689,000 in 2009, including $956,000 of realized gains from sales of stocks for which an OTTI had been previously recognized.
C&N Bank is a member of the Federal Home Loan Bank of Pittsburgh (FHLB-Pittsburgh), which is one of 12 regional Federal Home Loan Banks. As a member, C&N Bank is required to purchase and maintain stock in FHLB-Pittsburgh in an amount determined based on outstanding advances, unused borrowing capacity and other factors. There is no active market for FHLB-Pittsburgh stock, and it must ordinarily be redeemed by FHLB-Pittsburgh in order to be liquidated. C&N Bank’s investment in FHLB-Pittsburgh stock, which was included in Other Assets in the consolidated balance sheet, was $8,156,000 at December 31, 2010 and $8,585,000 at December 31, 2009. The Corporation
evaluated its holding of FHLB-Pittsburgh stock for impairment and deemed the stock to not be impaired at December 31, 2010 and December 31, 2009. In making this determination, management concluded that recovery of total outstanding par value, which equals the carrying value, is expected. The decision was based on review of financial information that FHLB-Pittsburgh has made publicly available.
62
8. LOANS
Loans outstanding at December 31, 2010 and 2009 are summarized as follows:
|
(In Thousands)
|
December 31,
|
% of
|
December 31,
|
% of
|
||||||||||||
|
2010
|
Total
|
2009
|
Total
|
|||||||||||||
|
Consumer mortgage:
|
||||||||||||||||
|
Residential mortgage loans - first liens
|
$ | 333,012 | 45.59 | % | $ | 340,268 | 47.19 | % | ||||||||
|
Residential mortgage loans - junior liens
|
31,590 | 4.32 | % | 35,734 | 4.96 | % | ||||||||||
|
Home equity lines of credit
|
26,853 | 3.68 | % | 23,577 | 3.27 | % | ||||||||||
|
1-4 Family residential construction
|
14,379 | 1.97 | % | 11,452 | 1.59 | % | ||||||||||
|
Total consumer mortgage
|
405,834 | 55.56 | % | 411,031 | 57.01 | % | ||||||||||
|
Commercial:
|
||||||||||||||||
|
Commercial loans secured by real estate
|
167,094 | 22.88 | % | 163,483 | 22.67 | % | ||||||||||
|
Commercial and industrial
|
59,005 | 8.08 | % | 49,753 | 6.90 | % | ||||||||||
|
Political subdivisions
|
36,480 | 4.99 | % | 37,598 | 5.21 | % | ||||||||||
|
Commercial construction
|
24,004 | 3.29 | % | 15,264 | 2.12 | % | ||||||||||
|
Loans secured by farmland
|
11,353 | 1.55 | % | 11,856 | 1.64 | % | ||||||||||
|
Multi-family (5 or more) residential
|
7,781 | 1.07 | % | 8,338 | 1.16 | % | ||||||||||
|
Agricultural loans
|
3,472 | 0.48 | % | 3,848 | 0.53 | % | ||||||||||
|
Other commercial loans
|
392 | 0.05 | % | 638 | 0.09 | % | ||||||||||
|
Total commercial
|
309,581 | 42.38 | % | 290,778 | 40.33 | % | ||||||||||
|
Consumer
|
14,996 | 2.05 | % | 19,202 | 2.66 | % | ||||||||||
|
Total
|
730,411 | 100.00 | % | 721,011 | 100.00 | % | ||||||||||
|
Less: allowance for loan losses
|
(9,107 | ) | (8,265 | ) | ||||||||||||
|
Loans, net
|
$ | 721,304 | $ | 712,746 | ||||||||||||
The Corporation grants loans to individuals as well as commercial and tax-exempt entities. Commercial, residential and personal loans are made to customers geographically concentrated in the Pennsylvania and New York counties that comprise the market serviced by Citizens & Northern Bank. Although the Corporation has a diversified loan portfolio, a significant portion of its debtors’ ability to honor their contracts is dependent on the local economic conditions within the region. There is no concentration of loans to borrowers engaged in similar businesses or activities that exceed 10% of total loans at December 31, 2010.
The Corporation maintains an allowance for loan losses that represents management’s estimate of the losses inherent in the loan portfolio as of the balance sheet date and recorded as a reduction of the investment in loans.
Transactions in the allowance for loan losses were as follows:
| (In Thousands) | ||||||||||||
|
2010
|
2009
|
2008
|
||||||||||
|
Balance at beginning of year
|
$ | 8,265 | $ | 7,857 | $ | 8,859 | ||||||
|
Provision charged to operations
|
1,191 | 680 | 909 | |||||||||
|
Loans charged off
|
(619 | ) | (478 | ) | (2,039 | ) | ||||||
|
Recoveries
|
270 | 206 | 128 | |||||||||
|
Balance at end of year
|
$ | 9,107 | $ | 8,265 | $ | 7,857 | ||||||
In the evaluation of the loan portfolio, management determines two major components for the allowance for loan losses – (1) a specific component based on an assessment of certain larger relationships, mainly commercial purpose loans, on a loan-by-loan basis; and (2) a general component for the remainder of the portfolio based on a collective evaluation of pools of loans with similar risk characteristics.
63
In determining the larger loan relationships for detailed assessment under the specific allowance component, the Corporation uses an internal risk rating system. Under the risk rating system, the Corporation classifies problem or potential problem loans as “Special Mention,” “Substandard,” or “Doubtful” on the basis of currently existing facts, conditions and values. Substandard loans include those characterized by the distinct possibility that the Corporation will sustain some loss if the deficiencies are not corrected. Loans classified as Doubtful have all the weaknesses inherent in those classified as Substandard with the added characteristic
that the weaknesses present make collection or liquidation in full, on the basis of currently existing facts, conditions and values, highly questionable and improbable. Loans that do not currently expose the Corporation to sufficient risk to warrant classification as Substandard or Doubtful, but possess weaknesses that deserve management’s close attention, are deemed to be Special Mention. Risk ratings are updated any time that conditions or the situation warrants. Loans not classified are included in the “Pass” column in the table below.
The following table summarizes the aggregate credit quality classification of outstanding loans by risk rating as of December 31, 2010:
|
(In Thousands)
|
Pass
|
Special Mention
|
Substandard
|
Doubtful
|
Total
|
|||||||||||||||
|
Consumer mortgage:
|
||||||||||||||||||||
|
Residential mortgage loans - first liens
|
$ | 318,813 | $ | 2,197 | $ | 11,778 | $ | 224 | $ | 333,012 | ||||||||||
|
Residential mortgage loans - junior liens
|
30,072 | 551 | 959 | 8 | 31,590 | |||||||||||||||
|
Home equity lines of credit
|
26,569 | 32 | 252 | 0 | 26,853 | |||||||||||||||
|
1-4 Family residential construction
|
13,582 | 0 | 797 | 0 | 14,379 | |||||||||||||||
|
Total consumer mortgage
|
389,036 | 2,780 | 13,786 | 232 | 405,834 | |||||||||||||||
|
Commercial:
|
||||||||||||||||||||
|
Commercial loans secured by real estate
|
152,157 | 6,671 | 6,472 | 1,794 | 167,094 | |||||||||||||||
|
Commercial and industrial
|
45,779 | 8,235 | 4,533 | 458 | 59,005 | |||||||||||||||
|
Political subdivisions
|
36,480 | 0 | 0 | 0 | 36,480 | |||||||||||||||
|
Commercial construction
|
22,430 | 314 | 1,260 | 0 | 24,004 | |||||||||||||||
|
Loans secured by farmland
|
8,877 | 1,248 | 1,188 | 40 | 11,353 | |||||||||||||||
|
Multi-family (5 or more) residential
|
7,781 | 0 | 0 | 0 | 7,781 | |||||||||||||||
|
Agricultural loans
|
3,219 | 209 | 44 | 0 | 3,472 | |||||||||||||||
|
Other commercial loans
|
260 | 132 | 0 | 0 | 392 | |||||||||||||||
|
Total commercial
|
276,983 | 16,809 | 13,497 | 2,292 | 309,581 | |||||||||||||||
|
Consumer
|
14,696 | 33 | 265 | 2 | 14,996 | |||||||||||||||
|
Totals
|
$ | 680,715 | $ | 19,622 | $ | 27,548 | $ | 2,526 | $ | 730,411 | ||||||||||
The scope of loans evaluated individually for impairment include all loan relationships greater than $200,000 for which there is at least one extension of credit graded Special Mention, Substandard or Doubtful. Also, loan relationships less than $200,000 in the aggregate, but with an estimated loss of $100,000 or more, are individually evaluated for impairment. Loans that are individually evaluated for impairment, but which are not determined to be impaired, are combined with all remaining loans that are not reviewed on a specific basis, and such loans are included within larger pools of loans based on similar risk and loss characteristics for purposes of determining the general component of the
allowance. The loans that have been individually evaluated, but which have not been determined to be impaired, are included in the “Collectively Evaluated” column in the table summarizing the allowance and associated loan balances as of December 31, 2010.
64
The following table presents a summary of loan balances and the related allowance for loan losses summarized by portfolio segment and class for each impairment method used as of December 31, 2010:
|
(In Thousands)
|
Individually
Evaluated
|
Collectively
Evaluated
|
Totals
|
|||||||||
|
Loans:
|
||||||||||||
|
Consumer mortgage:
|
||||||||||||
|
Residential mortgage loans - first liens
|
$ | 442 | $ | 332,570 | $ | 333,012 | ||||||
|
Residential mortgage loans - junior liens
|
239 | 31,351 | 31,590 | |||||||||
|
Home equity lines of credit
|
0 | 26,853 | 26,853 | |||||||||
|
1-4 Family residential construction
|
994 | 13,385 | 14,379 | |||||||||
|
Total consumer mortgage
|
1,675 | 404,159 | 405,834 | |||||||||
|
Commercial:
|
||||||||||||
|
Commercial loans secured by real estate
|
3,818 | 163,276 | 167,094 | |||||||||
|
Commercial and industrial
|
931 | 58,074 | 59,005 | |||||||||
|
Political subdivisions
|
0 | 36,480 | 36,480 | |||||||||
|
Commercial construction
|
1,197 | 22,807 | 24,004 | |||||||||
|
Loans secured by farmland
|
931 | 10,422 | 11,353 | |||||||||
|
Multi-family (5 or more) residential
|
0 | 7,781 | 7,781 | |||||||||
|
Agricultural loans
|
39 | 3,433 | 3,472 | |||||||||
|
Other commercial loans
|
0 | 392 | 392 | |||||||||
|
Total commercial
|
6,916 | 302,665 | 309,581 | |||||||||
|
Consumer
|
57 | 14,939 | 14,996 | |||||||||
|
Total Loans
|
$ | 8,648 | $ | 721,763 | $ | 730,411 | ||||||
|
(In Thousands)
|
Individually
Evaluated
|
Collectively
Evaluated
|
Totals
|
|||||||||
|
Allowance for Loan Losses:
|
||||||||||||
|
Consumer mortgage:
|
||||||||||||
|
Residential mortgage loans - first liens
|
$ | 98 | $ | 2,647 | $ | 2,745 | ||||||
|
Residential mortgage loans - junior liens
|
80 | 254 | 334 | |||||||||
|
Home equity lines of credit
|
0 | 218 | 218 | |||||||||
|
1-4 Family residential construction
|
100 | 108 | 208 | |||||||||
|
Total consumer mortgage
|
278 | 3,227 | 3,505 | |||||||||
|
Commercial:
|
||||||||||||
|
Commercial loans secured by real estate
|
1,335 | 1,979 | 3,314 | |||||||||
|
Commercial and industrial
|
202 | 660 | 862 | |||||||||
|
Political subdivisions
|
0 | 0 | 0 | |||||||||
|
Commercial construction
|
380 | 210 | 590 | |||||||||
|
Loans secured by farmland
|
36 | 103 | 139 | |||||||||
|
Multi-family (5 or more) residential
|
0 | 63 | 63 | |||||||||
|
Agricultural loans
|
0 | 32 | 32 | |||||||||
|
Other commercial loans
|
0 | 0 | 0 | |||||||||
|
Total commercial
|
1,953 | 3,047 | 5,000 | |||||||||
|
Consumer
|
57 | 232 | 289 | |||||||||
|
Unallocated
|
313 | |||||||||||
|
Total Allowance for Loan Losses
|
$ | 2,288 | $ | 6,506 | $ | 9,107 | ||||||
65
Summary information related to impaired and nonaccrual loans, and loans past due 90 days or more, as of December 31, 2010 and 2009 is as follows:
|
(In Thousands)
|
||||||||
|
2010
|
2009
|
|||||||
|
Impaired loans with a valuation allowance
|
$ | 5,457 | $ | 2,690 | ||||
|
Impaired loans without a valuation allowance
|
3,191 | 3,257 | ||||||
|
Total impaired loans
|
$ | 8,648 | $ | 5,947 | ||||
|
Valuation allowance related to impaired loans
|
$ | 2,288 | $ | 1,126 | ||||
|
Total loans restructured (troubled debt restructurings)
|
$ | 645 | $ | 326 | ||||
|
Total nonaccrual loans
|
$ | 10,809 | $ | 9,092 | ||||
|
Total loans past due 90 days or more and still accruing
|
$ | 727 | $ | 31 | ||||
No additional funds are committed to be advanced in connection with impaired loans.
Additional summary information related to impaired loans for 2010, 2009 and 2008 is as follows:
| (In Thousands) | ||||||||||||
|
2010
|
2009
|
2008
|
||||||||||
|
Average investment in impaired loans
|
$ | 6,142 | $ | 5,996 | $ | 5,771 | ||||||
|
Interest income recognized on impaired loans
|
$ | 204 | $ | 322 | $ | 327 | ||||||
|
Interest income recognized on a cash basis on impaired loans
|
$ | 204 | $ | 322 | $ | 327 | ||||||
At December 31, 2010 the breakdown by portfolio segment and class of nonaccrual loans and loans past due ninety days or more and still accruing is as follows:
|
Past Due
|
||||||||
|
(In Thousands)
|
90+ Days and
|
|||||||
|
Accruing
|
Nonaccrual
|
|||||||
|
Consumer mortgage:
|
||||||||
|
Residential mortgage loans - first liens
|
$ | 571 | $ | 3,301 | ||||
|
Residential mortgage loans - junior liens
|
0 | 218 | ||||||
|
1-4 Family residential construction
|
0 | 797 | ||||||
|
Total consumer mortgage
|
571 | 4,316 | ||||||
|
Commercial:
|
||||||||
|
Commercial loans secured by real estate
|
60 | 3,666 | ||||||
|
Commercial and industrial
|
0 | 611 | ||||||
|
Commercial construction
|
0 | 1,197 | ||||||
|
Loans secured by farmland
|
90 | 932 | ||||||
|
Agricultural loans
|
0 | 40 | ||||||
|
Total commercial
|
150 | 6,446 | ||||||
|
Consumer
|
6 | 47 | ||||||
|
Totals
|
$ | 727 | $ | 10,809 | ||||
66
The table below presents a summary of the contractual aging of loans as of December 31, 2010:
|
Current and
|
||||||||||||||||
|
(In Thousands)
|
Past Due
|
Past Due
|
Past Due
|
|||||||||||||
|
Less than
|
30-89 | 90+ | ||||||||||||||
|
30 Days
|
Days
|
Days
|
Total
|
|||||||||||||
|
Consumer mortgage:
|
||||||||||||||||
|
Residential mortgage loans - first liens
|
325,567 | 5,132 | 2,313 | 333,012 | ||||||||||||
|
Residential mortgage loans - junior liens
|
30,997 | 436 | 157 | 31,590 | ||||||||||||
|
Home equity lines of credit
|
26,744 | 109 | 0 | 26,853 | ||||||||||||
|
1-4 Family residential construction
|
14,379 | 0 | 0 | 14,379 | ||||||||||||
|
Total consumer mortgage
|
397,687 | 5,677 | 2,470 | 405,834 | ||||||||||||
|
Commercial:
|
||||||||||||||||
|
Commercial loans secured by real estate
|
163,343 | 940 | 2,811 | 167,094 | ||||||||||||
|
Commercial and industrial
|
58,474 | 319 | 212 | 59,005 | ||||||||||||
|
Political subdivisions
|
36,480 | 0 | 0 | 36,480 | ||||||||||||
|
Commercial construction
|
23,674 | 330 | 0 | 24,004 | ||||||||||||
|
Loans secured by farmland
|
10,294 | 77 | 982 | 11,353 | ||||||||||||
|
Multi-family (5 or more) residential
|
7,769 | 12 | 0 | 7,781 | ||||||||||||
|
Agricultural loans
|
3,422 | 10 | 40 | 3,472 | ||||||||||||
|
Other commercial loans
|
77 | 315 | 0 | 392 | ||||||||||||
|
Total commercial
|
303,533 | 2,003 | 4,045 | 309,581 | ||||||||||||
|
Consumer
|
14,686 | 289 | 21 | 14,996 | ||||||||||||
|
Totals
|
$ | 715,906 | $ | 7,969 | $ | 6,536 | $ | 730,411 | ||||||||
Nonaccrual loans are included in the contractual aging immediately above. A summary of the contractual aging of nonaccrual loans at December 31, 2010 is as follows:
|
(In Thousands)
|
Current and
|
|||||||||||||||
|
Past Due
|
Past Due
|
Past Due
|
||||||||||||||
|
Less than
|
30-89 | 90+ | ||||||||||||||
|
30 Days
|
Days
|
Days
|
Total
|
|||||||||||||
|
Total nonaccrual loans
|
$ | 4,156 | $ | 844 | $ | 5,809 | $ | 10,809 | ||||||||
9. BANK PREMISES AND EQUIPMENT
Bank premises and equipment are summarized as follows:
|
(In Thousands)
|
December 31,
|
|||||||
|
2010
|
2009
|
|||||||
|
Land
|
$ | 2,100 | $ | 2,100 | ||||
|
Buildings and improvements
|
30,579 | 30,498 | ||||||
|
Furniture and equipment
|
16,099 | 15,735 | ||||||
|
Construction in progress
|
33 | 24 | ||||||
|
Total
|
48,811 | 48,357 | ||||||
|
Less: accumulated depreciation
|
(26,175 | ) | (24,041 | ) | ||||
|
Net
|
$ | 22,636 | $ | 24,316 | ||||
67
Depreciation expense included in occupancy expense and furniture and equipment expense was as follows:
|
(In Thousands)
|
||||||||||||
|
2010
|
2009
|
2008
|
||||||||||
|
Occupancy expense
|
$ | 1,238 | $ | 1,237 | $ | 1,261 | ||||||
|
Furniture and equipment expense
|
1,101 | 1,579 | 1,624 | |||||||||
|
Total
|
$ | 2,339 | $ | 2,816 | $ | 2,885 | ||||||
10. INTANGIBLE ASSETS
Changes in the carrying amount of goodwill in 2010 and 2009 are summarized in the following table:
|
(In Thousands)
|
December 31, | |||||||
|
|
2010
|
2009 | ||||||
|
Balance, beginning of year
|
$ | 11,942 | $ | 12,014 | ||||
|
Reduction in total purchase price for difference
|
||||||||
|
in estimated and actual accrued expenses and
|
||||||||
|
legal and professional costs
|
0 | (72 | ) | |||||
|
Balance, end of year
|
$ | 11,942 | $ | 11,942 | ||||
The Corporation did not complete any acquisitions in 2010 or 2009.
Evaluation of goodwill for impairment involves 2 steps: (1) Step 1, which is to identify potential impairment by comparing the fair value of a reporting unit with its carrying amount, including goodwill; and (2) Step 2, which is to measure the amount of goodwill loss by comparing the implied fair value of the reporting unit goodwill with the carrying amount of that goodwill and recognize a loss if the fair value would be less than book value. As of December 31, 2010, the Corporation performed a Step 1 analysis and determined that the fair value of its only reporting unit, its community banking operation, exceeded its book value. Accordingly, there was no goodwill impairment as of December 31,
2010 and no Step 2 analysis was required.
Information related to the core deposit intangibles are as follows:
|
(In Thousands)
|
December 31, | |||||||
| 2010 | 2009 | |||||||
|
Gross amount
|
$ | 2,034 | $ | 2,034 | ||||
|
Less: accumulated amortization
|
(1,708 | ) | (1,532 | ) | ||||
|
Net
|
$ | 326 | $ | 502 | ||||
Amortization expense was $176,000 in 2010, $324,000 in 2009, and $552,000 in 2008. Estimated amortization expense for each of the ensuing five years is as follows:
|
(In Thousands)
|
||||
|
2011
|
$ | 115 | ||
|
2012
|
74 | |||
|
2013
|
51 | |||
|
2014
|
35 | |||
|
2015
|
22 | |||
68
11. DEPOSITS
At December 31, 2010, the scheduled maturities of time deposits are as follows:
|
(In Thousands)
|
|||||
|
2011
|
$ | 196,052 | |||
|
2012
|
98,931 | ||||
|
2013
|
58,397 | ||||
|
2014
|
14,952 | ||||
|
2015
|
10,796 | ||||
|
Thereafter
|
39 | ||||
| $ | 379,167 | ||||
Included in interest-bearing deposits are time deposits in the amount of $100,000 or more. As of December 31, 2010, the remaining maturities or repricing frequency of time deposits of $100,000 or more are as follows:
|
(In Thousands)
|
||||
|
Three months or less
|
$ | 76,663 | ||
|
Over 3 months through 12 months
|
14,737 | |||
|
Over 1 year through 3 years
|
32,120 | |||
|
Over 3 years
|
6,851 | |||
|
Total
|
$ | 130,371 | ||
Interest expense from deposits of $100,000 or more amounted to $3,454,000 in 2010, $3,781,000 in 2009 and $4,108,000 in 2008.
12. BORROWED FUNDS
SHORT-TERM BORROWINGS
Short-term borrowings include the following:
|
(In Thousands)
|
At December 31,
|
|||||||
|
2010
|
2009
|
|||||||
|
Overnight borrowings (a)
|
$ | 0 | $ | 0 | ||||
|
Customer repurchase agreements (b)
|
18,413 | 34,229 | ||||||
|
Other repurchase agreements (c)
|
0 | 5,000 | ||||||
|
Total short-term borrowings
|
$ | 18,413 | $ | 39,229 | ||||
The weighted average interest rate on total short-term borrowings outstanding was 0.16% at December 31, 2010 and 1.04% at December 31, 2009. The maximum amount of total short-term borrowings outstanding at any month-end was $40,600,000 in 2010 and $45,769,000 in 2009.
(a) Overnight borrowings are available from the FHLB-Pittsburgh, federal funds purchased overnight from other banks, and from the Federal Reserve Bank of Philadelphia’s Discount Window.
There were no overnight borrowings outstanding at December 31, 2010 or December 31, 2009.
The Corporation had available credit with other correspondent banks totaling $25,000,000 at December 31, 2010 and $29,722,000 at December 31, 2009. These lines of credit are primarily unsecured. No amounts were outstanding at December 31, 2010 or December 31, 2009.
69
The Corporation has a line of credit with the Federal Reserve Bank of Philadelphia’s Discount Window. At December 31, 2010, the Corporation had available credit in the amount of $26,274,000 on this line with no outstanding advances. At December 31, 2009, the Corporation had available credit in the amount of $25,802,000 on this line with no outstanding advances. As collateral for the line, the Corporation has pledged available-for-sale securities with a carrying value of $27,655,000 at December 31, 2010 and $27,938,000 at December 31, 2009.
(b) Customer repurchase agreements mature overnight, and are collateralized by securities with a carrying value of $29,633,000 at December 31, 2010 and $48,510,000 at December 31, 2009.
(c) Other repurchase agreements included in short-term borrowings at December 31, 2009 consisted of a three-year adjustable-rate repurchase agreement issued in April 2007. For the first year, the rate was adjusted quarterly to the three-month LIBOR less 50 basis points. In April 2008, the issuer exercised its option to convert the repurchase agreement to a fixed rate of 4.74% and retained the option to put it quarterly prior to the April 2010 scheduled maturity. This borrowing matured in April 2010.
The terms and collateral related to repurchase agreements are described under the “Long-term Borrowings” section of this note.
LONG-TERM BORROWINGS
Long-term borrowings are as follows:
|
(In Thousands)
|
At December 31,
|
|||||||
|
2010
|
2009
|
|||||||
|
FHLB-Pittsburgh borrowings (d)
|
$ | 55,995 | $ | 103,742 | ||||
|
Repurchase agreements (e)
|
92,500 | 92,500 | ||||||
|
Total long-term borrowings
|
$ | 148,495 | $ | 196,242 | ||||
(d) Long-term borrowings from FHLB-Pittsburgh are as follows:
|
(In Thousands)
|
At December 31,
|
|||||||
|
2010
|
2009
|
|||||||
|
Loans that matured in 2010 with rates ranging from 3.65% to 4.95%
|
$ | 0 | $ | 47,140 | ||||
|
Loans maturing in 2011 with rates ranging from 3.00% to 4.98%
|
15,000 | 15,000 | ||||||
|
Loans maturing in 2012 with rates ranging from 3.66% to 4.82%
|
23,528 | 23,547 | ||||||
|
Loans maturing in 2013 with rates ranging from 2.86% to 3.62%
|
3,884 | 4,206 | ||||||
|
Loan maturing in 2016 with a rate of 6.86%
|
274 | 309 | ||||||
|
Loans maturing in 2017 with rates ranging from 3.81% to 6.83%
|
10,036 | 10,041 | ||||||
|
Loans maturing in 2020 with rates ranging from 4.67% to 4.79%
|
2,072 | 2,242 | ||||||
|
Loan maturing in 2025 with a rate of 4.91%
|
1,201 | 1,257 | ||||||
|
Total long-term FHLB-Pittsburgh borrowings
|
$ | 55,995 | $ | 103,742 | ||||
The FHLB-Pittsburgh loan facilities are collateralized by qualifying loans secured by real estate with a book value totaling $554,216,000 at December 31, 2010 and $522,201,000 at December 31, 2009. Also, the FHLB-Pittsburgh loan facilities require the Corporation to invest in established amounts of FHLB-Pittsburgh stock. The carrying values of the Corporation’s holdings of FHLB-Pittsburgh stock (included in Other Assets) were $8,156,000 at December 31, 2010 and $8,585,000 at December 31, 2009.
(e) Repurchase agreements included in long-term borrowings are as follows:
|
(In Thousands)
|
At December 31,
|
|||||||
|
2010
|
2009
|
|||||||
|
Agreements maturing in 2011 with rates ranging from 3.48% to 4.09%
|
$ | 7,500 | $ | 7,500 | ||||
|
Agreement maturing in 2013 with a rate of 3.13%
|
5,000 | 5,000 | ||||||
|
Agreements maturing in 2017 with rates ranging from 3.60% to 4.27%
|
80,000 | 80,000 | ||||||
|
Total long-term repurchase agreements
|
$ | 92,500 | $ | 92,500 | ||||
70
In December 2007, the Corporation entered into two repurchase agreements of $40,000,000 each with embedded caps. These repurchase agreements mature in 2017. One of these borrowings has an interest rate of 3.60% and is putable by the issuer at quarterly intervals starting in December 2010. The other borrowing has an interest rate of 4.27% and is putable by the issuer at quarterly intervals starting in December 2012. Each of these borrowings contain an embedded cap, providing that on the quarterly anniversary of the transaction settlement date, if three-month LIBOR is higher than 5.15%, the Corporation’s interest rate payable will decrease by twice the amount of the excess, down to a minimum rate of 0%. The
embedded cap on one of the agreements expired on its initial put date in December 2010, and the embedded cap on the other agreement will expire on the initial put date in 2012.
Securities sold under repurchase agreements were delivered to the broker-dealers who arranged the transactions. The broker-dealers may have sold, loaned or otherwise disposed of such securities to other parties in the normal course of their operations, and have agreed to resell to the Corporation substantially identical securities at the maturities of the agreements. The carrying value of the underlying securities was $116,416,000 at December 31, 2010 and $116,127,000 at December 31, 2009. Average daily repurchase agreement borrowings amounted to $94,097,000 in 2010, $97,500,000 in 2009 and $99,492,000 in 2008. The maximum amounts of outstanding borrowings under repurchase agreements with
broker-dealers were $97,500,000 in 2010, $97,500,000 in 2009, and $99,500,000 in 2008. The weighted average interest rate on repurchase agreements was 3.93% in 2010, 3.97% in 2009, and 3.94% in 2008.
13. EMPLOYEE AND POSTRETIREMENT BENEFIT PLANS
DEFINED BENEFIT PLANS
The Corporation sponsors a defined benefit health care plan that provides postretirement medical benefits and life insurance to employees who meet certain age and length of service requirements. This plan contains a cost-sharing feature, designed to cause participants to pay for all future increases in premiums (after January 1, 1993) related to benefit coverage. Accordingly, actuarial assumptions related to health care cost trend rates do not significantly affect the liability balance at December 31, 2010 and December 31, 2009, and are not expected to significantly affect the Corporation's future expenses. The Corporation uses a December 31 measurement date for the postretirement plan.
The Corporation’s defined benefit pension plan applicable to most employees was frozen and terminated, effective December 31, 2007. In 2008, the Corporation funded and settled substantially all of its obligations under this plan. There was no activity related to this plan in 2010 and 2009. Information is included in the tables below for 2008 related to this plan.
In 2007, the Corporation assumed the Citizens Trust Company Retirement Plan, a defined benefit pension plan for which benefit accruals and participation were frozen in 2002. Information related to the Citizens Trust Company Retirement Plan has been included in the tables that follow. The Corporation uses a December 31 measurement date for this plan.
The following table shows the funded status of the defined benefit plans:
|
Pension
|
Postretirement
|
|||||||||||||||
|
(In Thousands)
|
Benefits
|
Benefits
|
||||||||||||||
|
2010
|
2009
|
2010
|
2009
|
|||||||||||||
|
CHANGE IN BENEFIT OBLIGATION:
|
||||||||||||||||
|
Benefit obligation at beginning of year
|
$ | 1,236 | $ | 1,076 | $ | 1,710 | $ | 1,378 | ||||||||
|
Service cost
|
0 | 0 | 68 | 74 | ||||||||||||
|
Interest cost
|
67 | 65 | 89 | 94 | ||||||||||||
|
Plan participants' contributions
|
0 | 0 | 255 | 190 | ||||||||||||
|
Actuarial loss (gain)
|
68 | 111 | (153 | ) | 293 | |||||||||||
|
Benefits paid
|
(32 | ) | (16 | ) | (353 | ) | (319 | ) | ||||||||
|
Benefit obligation at end of year
|
$ | 1,339 | $ | 1,236 | $ | 1,616 | $ | 1,710 | ||||||||
71
|
2010
|
2009
|
2010
|
2009
|
|||||||||||||
|
CHANGE IN PLAN ASSETS:
|
||||||||||||||||
|
Fair value of plan assets at beginning of year
|
$ | 953 | $ | 602 | $ | 0 | $ | 0 | ||||||||
|
Actual return on plan assets
|
106 | 147 | 0 | 0 | ||||||||||||
|
Employer contribution
|
53 | 220 | 98 | 129 | ||||||||||||
|
Plan participants' contributions
|
0 | 0 | 255 | 190 | ||||||||||||
|
Benefits paid
|
(32 | ) | (16 | ) | (353 | ) | (319 | ) | ||||||||
|
Fair value of plan assets at end of year
|
$ | 1,080 | $ | 953 | $ | 0 | $ | 0 | ||||||||
|
Funded status at end of year
|
$ | (259 | ) | $ | (283 | ) | $ | (1,616 | ) | $ | (1,710 | ) | ||||
At December 31, 2010 and 2009, the following pension plan and postretirement plan asset and liability amounts were recognized in the consolidated balance sheet:
|
(In Thousands)
|
Pension:
|
Postretirement:
|
||||||||||||||
|
2010
|
2009
|
2010
|
2009
|
|||||||||||||
|
Accrued interest and other liabilities
|
$ | 259 | $ | 283 | $ | 1,616 | $ | 1,710 | ||||||||
At December 31, 2010 and 2009, the following items included in accumulated other comprehensive loss had not been recognized as components of expense:
|
(In Thousands)
|
Pension:
|
Postretirement:
|
||||||||||||||
|
2010
|
2009
|
2010
|
2009
|
|||||||||||||
|
Net transition obligation
|
$ | 0 | $ | 0 | $ | 73 | $ | 109 | ||||||||
|
Prior service cost
|
0 | 0 | 121 | 135 | ||||||||||||
|
Net actuarial loss (gain)
|
198 | 173 | (6 | ) | 147 | |||||||||||
|
Total
|
$ | 198 | $ | 173 | $ | 188 | $ | 391 | ||||||||
For the defined benefit pension plan, amortization of the net actuarial loss is expected to be $4,000 in 2011. For the postretirement plan, there is no amortization of the net actuarial gain expected in 2011, and the estimated amount of transition obligation and prior service cost that will be amortized from accumulated other comprehensive loss into net periodic benefit cost in 2011 are $36,000 and $14,000, respectively.
The accumulated benefit obligation for the defined benefit pension plan was $1,339,000 at December 31, 2010 and $1,236,000 at December 31, 2009.
The components of net periodic benefit costs from defined benefit plans are as follows:
(In Thousands)
|
Pension:
|
Postretirement:
|
|||||||||||||||||||||||
|
2010
|
2009
|
2008
|
2010
|
2009
|
2008
|
|||||||||||||||||||
|
Service cost
|
$ | 0 | $ | 0 | $ | 29 | $ | 68 | $ | 74 | $ | 69 | ||||||||||||
|
Interest cost
|
67 | 65 | 542 | 89 | 94 | 78 | ||||||||||||||||||
|
Expected return on plan assets
|
(66 | ) | (44 | ) | (329 | ) | 0 | 0 | 0 | |||||||||||||||
|
Amortization of transition (asset) obligation
|
0 | 0 | (17 | ) | 36 | 37 | 36 | |||||||||||||||||
|
Amortization of prior service cost
|
0 | 0 | 0 | 14 | 14 | 9 | ||||||||||||||||||
|
Recognized net actuarial loss
|
3 | 4 | 0 | 0 | 0 | 0 | ||||||||||||||||||
|
Net periodic benefit cost, excluding effects of pension plan settlement
|
4 | 25 | 225 | 207 | 219 | 192 | ||||||||||||||||||
|
Loss (gain) on pension plan settlement
|
0 | 39 | (32 | ) | 0 | 0 | 0 | |||||||||||||||||
|
Total net periodic benefit cost
|
$ | 4 | $ | 64 | $ | 193 | $ | 207 | $ | 219 | $ | 192 | ||||||||||||
72
The weighted-average assumptions used to determine net periodic benefit cost are as follows:
|
Pension:
|
Postretirement:
|
|||||||||||||||||||||||
|
2010
|
2009
|
2008
|
2010
|
2009
|
2008
|
|||||||||||||||||||
|
Citizens Trust Company Retirement Plan and postretirement plan:
|
||||||||||||||||||||||||
|
Discount rate
|
5.50 | % | 6.25 | % | 5.80 | % | 6.00 | % | 6.00 | % | 6.00 | % | ||||||||||||
|
Expected return on plan assets
|
7.50 | % | 7.50 | % | 7.50 | % | N/A | N/A | N/A | |||||||||||||||
|
Rate of compensation increase
|
N/A | N/A | N/A | N/A | N/A | N/A | ||||||||||||||||||
|
Defined benefit pension plan terminated at
December 31, 2007 and settled in 2008:
|
||||||||||||||||||||||||
|
Discount rate
|
N/A | N/A | 4.77 | % | ||||||||||||||||||||
|
Expected return on plan assets
|
N/A | N/A | 2.75 | % | ||||||||||||||||||||
|
Rate of compensation increase
|
N/A | N/A | 0.00 | % | ||||||||||||||||||||
The weighted-average assumptions used to determine benefit obligations as of December 31, 2010 and 2009 are as follows:
|
Pension:
|
Postretirement:
|
|||||||||||||||
|
2010
|
2009
|
2010
|
2009
|
|||||||||||||
|
Citizens Trust Company Retirement Plan and postretirement plan:
|
||||||||||||||||
|
Discount rate
|
5.50 | % | 5.50 | % | 5.50 | % | 6.00 | % | ||||||||
|
Expected return on plan assets
|
7.50 | % | 7.50 | % | N/A | N/A | ||||||||||
|
Rate of compensation increase
|
N/A | N/A | N/A | N/A | ||||||||||||
Estimated future benefit payments, including only estimated employer contributions for the postretirement plan, which reflect expected future service, are as follows:
|
(In Thousands)
|
Pension
|
Postretirement
|
||||||
|
Benefits
|
Benefits
|
|||||||
|
2011
|
$ | 21 | $ | 115 | ||||
|
2012
|
20 | 109 | ||||||
|
2013
|
20 | 108 | ||||||
|
2014
|
187 | 110 | ||||||
|
2015
|
18 | 110 | ||||||
|
2016-2020
|
1,185 | 676 | ||||||
At this time, the Corporation cannot estimate the amount it will contribute to the defined benefit pension plan in 2011.
The expected return on pension plan (Citizens Trust Company Retirement Plan) assets is a significant assumption used in the calculation of net periodic benefit cost. This assumption reflects the average long-term rate of earnings expected on the funds invested or to be invested to provide for the benefits included in the projected benefit obligation.
The pension plan weighted-average asset allocations at December 31, 2010 and 2009 are as follows:
|
2010
|
2009
|
|||||||
|
Cash and cash equivalents
|
7 | % | 1 | % | ||||
|
Debt securities
|
33 | % | 37 | % | ||||
|
Equity securities
|
45 | % | 62 | % | ||||
|
Alternative funds
|
15 | % | 0 | % | ||||
|
Total
|
100 | % | 100 | % | ||||
73
C&N Bank’s Trust and Financial Management Department manages the investment of the Citizens Trust Company Retirement Plan (pension plan) assets. Most of the Plan’s securities are mutual funds, including mutual funds principally invested in debt securities, mutual funds invested in a diversified mix of large, mid- and small-capitalization U.S. stocks, foreign stocks, and mutual funds invested in alternative asset classes such as real estate, commodities and inflation-protected securities. The fair values of plan assets are determined based on Level 1 inputs (as described in Note 6). In 2010, the targeted asset allocation for the pension plan was changed to
include an allocation to alternative asset classes. The targeted asset allocation at December 31, 2010 is 46% equity securities, 38% debt securities, 14% alternative assets and 2% cash. The targeted asset allocation in 2009 was 60% equity securities, 38% debt securities and 2% cash. The targeted asset allocation reflects an attempt to generate a long-term average rate of return necessary to meet the projected benefit obligation, and considers the need for ongoing liquidity necessary to fund benefit payments. The pension plan’s assets do not include any shares of the Corporation’s common stock.
PROFIT SHARING AND DEFERRED COMPENSATION PLANS
The Corporation has a profit sharing plan that incorporates the deferred salary savings provisions of Section 401(k) of the Internal Revenue Code. The Corporation’s matching contributions to the Plan depend upon the tax deferred contributions of employees. The Corporation’s total basic and matching contributions were $511,000 in 2010, $573,000 in 2009 and $574,000 in 2008.
The Corporation has an Employee Stock Ownership Plan (ESOP). Contributions to the ESOP are discretionary, and the ESOP uses funds contributed to purchase Corporation stock for the accounts of ESOP participants. These purchases are made on the market (not directly from the Corporation), and employees are not permitted to purchase Corporation stock under the ESOP. The ESOP includes a diversification feature, which allows participants, upon reaching age 55 and 10 years of service (as defined), to sell up to 50% of their Corporation shares back to the ESOP over a period of 6 years. As of December 31, 2010 and 2009, there were no shares allocated for repurchase by the
ESOP.
Dividends paid on shares held by the ESOP are charged to retained earnings. All Corporation shares owned through the ESOP are included in the calculation of weighted-average shares outstanding for purposes of calculating earnings per share - basic and diluted. The ESOP held 319,253 shares of Corporation stock at December 31, 2010 and 293,872 shares at December 31, 2009, all of which had been allocated to Plan participants. The Corporation’s contributions to the ESOP totaled $454,000 in 2010, $247,000 in 2009 and $457,000 in 2008.
The Corporation also has a nonqualified supplemental deferred compensation arrangement with its key officers. Charges to operating expense for officers’ supplemental deferred compensation were $95,000 in 2010, $107,000 in 2009 and $97,000 in 2008.
STOCK-BASED COMPENSATION PLANS
The Corporation has a Stock Incentive Plan for a selected group of senior officers. A total of 850,000 shares of common stock may be issued under the Stock Incentive Plan. Awards may be made under the Stock Incentive Plan in the form of qualified options (“Incentive Stock Options,” as defined in the Internal Revenue Code), nonqualified options, stock appreciation rights or restricted stock. Through 1999, all awards under the Stock Incentive Plan were Incentive Stock Options, with exercise prices equal to the market price of the stock at the date of grant, ratable vesting over 5 years and a contractual expiration of 10 years. In 2000 through 2009, except for 2006 when
there were no awards, there were annual awards of Incentive Stock Options and restricted stock. The Incentive Stock Options granted in 2000 and thereafter have an exercise price equal to the market value of the stock at the date of grant, vest after 6 months and expire after 10 years. The restricted stock awards vest ratably over 3 years. For restricted stock awards granted under the Stock Incentive Plan in 2009 and 2008, the Corporation must meet an annual targeted return on average equity (“ROAE”) performance ratio, as defined, in order for participants to vest. The Corporation met the ROAE target for the 2010 and 2008 plan years, but did not meet the ROAE target for the 2009 plan year. In 2010, the only award under the Stock Incentive Plan was 9,125 shares of restricted stock to the Chief Executive Officer. The 2010
award provides that vesting will occur upon the earliest of (i) the third anniversary of the date of grant, (ii) death or disability or (iii) the occurrence of a change in control of the Corporation. There are 531,801 shares available for issuance under the Stock Incentive Plan as of December 31, 2010.
Also, the Corporation has an Independent Directors Stock Incentive Plan. This plan permits awards of nonqualified stock options and/or restricted stock to non-employee directors. A total of 135,000 shares of common stock may be issued under the Independent Directors Stock Incentive Plan. The recipients’ rights to exercise stock options under this plan expire 10 years from the date of grant. The exercise prices of all stock options awarded under the Independent Directors Stock Incentive Plan are equal to market value as of the dates of grant. The restricted stock awards vest ratably over 3 years. There were no awards made under the Independent Directors
Stock Incentive Plan in 2010. There are 63,808 shares available for issuance under the Independent Directors Stock Incentive Plan as of December 31, 2010.
74
The Corporation records stock option expense based on estimated fair value calculated using the Black-Scholes-Merton option-pricing model with the following assumptions:
|
2010
|
2009
|
2008
|
||||||||||
|
Volatility
|
N/A | 28 | % | 23 | % | |||||||
|
Expected option lives
|
N/A |
9 Years
|
9 Years
|
|||||||||
|
Risk-free interest rate
|
N/A | 3.15 | % | 4.05 | % | |||||||
|
Dividend yield
|
N/A | 3.94 | % | 3.74 | % | |||||||
Management estimated the lives for options based on the Corporation’s average historical experience with both plans. The Corporation utilized its historical volatility and dividend yield over the immediately prior 9-year period to estimate future levels of volatility and dividend yield for the 2009 and 2008 awards. The risk-free interest rate was based on the published yield of zero-coupon U.S. Treasury strips as of the grant date, with a maturity coinciding with the estimated option lives.
Total stock-based compensation expense is as follows:
|
(In Thousands)
|
||||||||||||
|
2010
|
2009
|
2008
|
||||||||||
|
Stock options
|
$ | 0 | $ | 273 | $ | 209 | ||||||
|
Restricted stock
|
67 | 13 | 85 | |||||||||
|
Total
|
$ | 67 | $ | 286 | $ | 294 | ||||||
A summary of stock option activity is presented below:
|
2010
|
2009
|
2008
|
||||||||||||||||||||||
|
Weighted
|
Weighted
|
Weighted
|
||||||||||||||||||||||
|
Average
|
Average
|
Average
|
||||||||||||||||||||||
|
Exercise
|
Exercise
|
Exercise
|
||||||||||||||||||||||
|
Shares
|
Price
|
Shares
|
Price
|
Shares
|
Price
|
|||||||||||||||||||
|
Outstanding, beginning of year
|
306,358 | $ | 20.53 | 261,562 | $ | 20.59 | 221,954 | $ | 21.76 | |||||||||||||||
|
Granted
|
0 | 79,162 | $ | 19.88 | 83,257 | $ | 17.50 | |||||||||||||||||
|
Exercised
|
0 | (2,035 | ) | $ | 15.26 | (17,680 | ) | $ | 15.94 | |||||||||||||||
|
Forfeited
|
(76,331 | ) | $ | 20.74 | (13,881 | ) | $ | 21.22 | (9,910 | ) | $ | 23.11 | ||||||||||||
|
Expired
|
(3,133 | ) | $ | 14.11 | (18,450 | ) | $ | 18.66 | (16,059 | ) | $ | 24.26 | ||||||||||||
|
Outstanding, end of year
|
226,894 | $ | 20.54 | 306,358 | $ | 20.53 | 261,562 | $ | 20.59 | |||||||||||||||
|
Options exercisable at year-end
|
226,894 | $ | 20.54 | 306,358 | $ | 20.53 | 261,562 | $ | 20.59 | |||||||||||||||
|
Weighted-average fair value of options granted
|
N/A | $ | 4.21 | $ | 3.15 | |||||||||||||||||||
|
Weighted-average fair value of options forfeited
|
$ | 3.03 | $ | 2.89 | $ | 3.35 | ||||||||||||||||||
The weighted-average remaining contractual term of outstanding stock options at December 31, 2010 was 5.8 years. The aggregate intrinsic value of stock options outstanding (excluding options issued at exercise prices greater than the final closing price of the Corporation’s stock in 2010) was less than $1,000 at December 31, 2010 and $0 at December 31, 2009. There were no options exercised in 2010, and the total intrinsic value of options exercised was $9,000 in 2009 and $146,000 in 2008.
75
The following summarizes non-vested stock options and restricted stock activity as of and for the year ended December 31, 2010:
|
Stock Options
|
Restricted Stock
|
||||||||||||
|
Weighted
|
|||||||||||||
|
Weighted
|
Average
|
||||||||||||
|
Weighted
|
Average
|
Grant Date
|
|||||||||||
|
Average
|
Fair
|
Number
|
Fair
|
||||||||||
|
Number
|
Value
|
of Shares
|
Value
|
||||||||||
|
Outstanding, December 31, 2009
|
0 | 8,703 | $ | 19.58 | |||||||||
|
Granted
|
0 | 9,125 | $ | 11.75 | |||||||||
|
Vested
|
0 | (2,611 | ) | $ | 21.19 | ||||||||
|
Forfeited
|
0 | (959 | ) | $ | 18.85 | ||||||||
|
Outstanding, December 31, 2010
|
0 | 14,258 | $ | 14.32 | |||||||||
Compensation cost related to restricted stock is recognized based on the market price of the stock at the grant date over the vesting period. As of December 31, 2010, there was $123,000 total unrecognized compensation costs related to restricted stock, which is expected to be recognized over a weighted average period of 1.5 years.
Effective January 4, 2011, the Corporation granted options to purchase a total of 93,674 shares of common stock through the Stock Incentive and Independent Directors Stock Incentive Plans. The exercise price for these options is $15.06 per share, which was the market price at the date of grant, as determined under the Plans. The Corporation’s preliminary estimate of stock option compensation expense in 2011 is approximately $274,000. Management expects to use the Black-Scholes-Merton option-pricing model to measure compensation cost for these options. Also, effective January 4, 2011, the Corporation awarded a total of 15,622 shares of restricted stock under the
Stock Incentive and Independent Directors Stock Incentive Plans. Total estimated restricted stock expense for 2011 is $146,000. The stock options and restricted stock awards made in January 2011 are not included in the tables above.
The Corporation has issued shares from treasury stock for all stock option exercises through December 31, 2010. Management does not anticipate that stock repurchases will be necessary to accommodate stock option exercises in 2011.
76
14. INCOME TAXES
The following temporary differences gave rise to the net deferred tax asset at December 31, 2010 and 2009:
|
(In thousands)
|
2010
|
2009
|
||||||
|
Deferred tax assets:
|
||||||||
|
Unrealized holding losses on securities
|
$ | 695 | $ | 247 | ||||
|
Defined benefit plans - ASC 835
|
134 | 194 | ||||||
|
Net realized losses on securities
|
5,755 | 16,052 | ||||||
|
Allowance for loan losses
|
3,186 | 2,871 | ||||||
|
Credit for alternative minimum tax paid
|
3,287 | 3,495 | ||||||
|
Net operating loss carryforwards
|
2,794 | 0 | ||||||
|
General business credit carryforwards
|
815 | 685 | ||||||
|
Other deferred tax assets
|
1,347 | 1,097 | ||||||
| 18,013 | 24,641 | |||||||
|
Valuation allowance
|
0 | (373 | ) | |||||
|
Total deferred tax assets
|
18,013 | 24,268 | ||||||
|
Deferred tax liabilities:
|
||||||||
|
Bank premises and equipment
|
1,649 | 1,798 | ||||||
|
Core deposit intangibles
|
114 | 175 | ||||||
|
Other deferred tax liabilities
|
196 | 258 | ||||||
|
Total deferred tax liabilities
|
1,959 | 2,231 | ||||||
|
Deferred tax asset, net
|
$ | 16,054 | $ | 22,037 | ||||
The provision for income taxes includes the following:
|
(In thousands)
|
2010
|
2009
|
2008
|
|||||||||
|
Currently payable (refundable)
|
$ | (735 | ) | $ | (4,508 | ) | $ | 4,336 | ||||
|
Tax expense resulting from allocations of certain tax benefits to equity or as a reduction in goodwill or other assets
|
164 | 236 | 130 | |||||||||
|
Deferred
|
6,371 | (18,383 | ) | (2,147 | ) | |||||||
|
Total provision for income taxes
|
$ | 5,800 | $ | (22,655 | ) | $ | 2,319 | |||||
A reconciliation of income tax at the statutory rate to the Corporation’s effective rate is as follows (amounts in thousands):
|
(Amounts in thousands)
|
2010
|
2009
|
2008
|
|||||||||||||||||||||
|
Amount
|
%
|
Amount
|
%
|
Amount
|
%
|
|||||||||||||||||||
|
Expected provision
|
$ | 8,699 | 35.00 | $ | (21,697 | ) | 35.00 | $ | 4,332 | 35.00 | ||||||||||||||
|
Valuation allowance on deferred tax assets
|
(373 | ) | (1.50 | ) | 373 | (0.60 | ) | 0 | 0.00 | |||||||||||||||
|
Tax-exempt interest income
|
(2,208 | ) | (8.88 | ) | (2,118 | ) | 3.42 | (1,643 | ) | (13.27 | ) | |||||||||||||
|
Nondeductible interest expense
|
169 | 0.68 | 198 | (0.32 | ) | 182 | 1.47 | |||||||||||||||||
|
Dividends received deduction
|
(64 | ) | (0.26 | ) | (146 | ) | 0.24 | (206 | ) | (1.66 | ) | |||||||||||||
|
Increase in cash surrender value of life insurance
|
(163 | ) | (0.66 | ) | (175 | ) | 0.28 | (265 | ) | (2.14 | ) | |||||||||||||
|
Employee stock option compensation
|
0 | 0.00 | 72 | (0.12 | ) | 63 | 0.51 | |||||||||||||||||
|
Other, net
|
(80 | ) | (0.32 | ) | 153 | (0.25 | ) | (79 | ) | (0.64 | ) | |||||||||||||
|
Surtax exemption
|
(180 | ) | (0.72 | ) | 685 | (1.10 | ) | (65 | ) | (0.53 | ) | |||||||||||||
|
Effective income tax provision
|
$ | 5,800 | 23.34 | $ | (22,655 | ) | 36.55 | $ | 2,319 | 18.73 | ||||||||||||||
77
Realization of deferred tax assets ultimately depends on the existence of sufficient taxable income, including taxable income in prior carryback years, as well as future taxable income. The deferred tax asset from realized losses on securities resulted primarily from OTTI charges for financial statement purposes that were not deductible for income tax reporting purposes through December 31, 2010. Of the total deferred tax asset from realized losses on securities, a portion is from securities that, if the Corporation were to sell them, would be classified as capital losses for income tax reporting purposes. At December 31, 2009, a valuation allowance was established to reflect the excess of the tax benefit that
would be generated from selling all of the capital assets, over the amount that could be realized from available carryback and offset against capital gains generated in 2007 and 2008. In 2010, the Corporation has demonstrated the reasonable ability to realize sufficient current or short-term future tax benefits associated with capital assets. As a result, the valuation allowance on deferred tax assets has been eliminated.
In the year ended December 31, 2010, the Corporation realized ordinary and capital losses for income tax reporting purposes, including the effects of selling some securities for which OTTI charges were recognized for financial statement purposes prior to 2010. The Corporation has available at December 31, 2010 estimated total unused operating loss carryforwards of $2,794,000, including a capital loss carryforward of $157,000 expiring in 2015, and an estimated ordinary loss carryforward of $2,637,000 expiring in 2030.
The Corporation has available at December 31, 2010, unused general business tax credits, principally arising from investments in low income housing and elderly housing projects. These tax credits may provide future tax benefits and expire as follows:
|
Year of
|
||||||
|
(In thousands)
|
Expiration
|
Amount
|
||||
|
2024
|
$ | 10 | ||||
|
2025
|
130 | |||||
|
2026
|
155 | |||||
|
2027
|
130 | |||||
|
2028
|
130 | |||||
|
2029
|
130 | |||||
|
2030
|
130 | |||||
|
Total
|
$ | 815 | ||||
The Corporation has no unrecognized tax benefits, nor pending examination issues related to tax positions taken in preparation of its income tax returns. The Corporation is no longer subject to examination by the Internal Revenue Service for years prior to 2006.
15. RELATED PARTY TRANSACTIONS
Loans to executive officers, directors of the Corporation and its subsidiaries and any associates of the foregoing persons are as follows:
|
(In Thousands)
|
Beginning
|
New
|
Other
|
Ending
|
||||||||||||||||
|
Balance
|
Loans
|
Repayments
|
Changes
|
Balance
|
||||||||||||||||
|
12 directors, 6 executive officers 2010
|
$ | 9,914 | $ | 1,939 | $ | (1,700 | ) | $ | 1,192 | $ | 11,345 | |||||||||
|
13 directors, 6 executive officers 2009
|
$ | 12,864 | $ | 1,983 | $ | (1,771 | ) | $ | (3,162 | ) | $ | 9,914 | ||||||||
|
14 directors, 6 executive officers 2008
|
$ | 14,225 | $ | 249 | $ | (1,808 | ) | $ | 198 | $ | 12,864 | |||||||||
The above transactions were made in the ordinary course of business on substantially the same terms, including interest rates and collateral, as those prevailing at the time for comparable transactions with other persons and do not involve more than normal risks of collectability. Other changes represent net increases in existing lines of credit and transfers in and out of the related party category.
Deposits from related parties held by the Corporation amounted to $3,651,000 at December 31, 2010 and $4,503,000 at December 31, 2009.
78
16. OFF-BALANCE SHEET RISK
The Corporation is a party to financial instruments with off-balance sheet risk in the normal course of business to meet the financial needs of its customers. These financial instruments include commitments to extend credit and standby letters of credit. These instruments involve, to varying degrees, elements of credit, interest rate or liquidity risk in excess of the amount recognized in the consolidated balance sheet. The contract amounts of these instruments express the extent of involvement the Corporation has in particular classes of financial instruments.
The Corporation’s exposure to credit loss from nonperformance by the other party to the financial instruments for commitments to extend credit and standby letters of credit is represented by the contractual amount of these instruments. The Corporation uses the same credit policies in making commitments and conditional obligations as it does for on-balance sheet instruments.
Financial instruments whose contract amounts represent credit risk at December 31, 2010 and 2009 are as follows:
|
(In Thousands)
|
2010
|
2009
|
||||||
|
Commitments to extend credit
|
$ | 176,626 | $ | 157,560 | ||||
|
Standby letters of credit
|
29,977 | 31,709 | ||||||
Commitments to extend credit are legally binding agreements to lend to customers. Commitments generally have fixed expiration dates or other termination clauses and may require payment of fees. Since many of the commitments are expected to expire without being drawn upon, the total commitment amounts do not necessarily represent future liquidity requirements. The Corporation evaluates each customer’s creditworthiness on a case-by-case basis. The amount of collateral obtained, if deemed necessary by the Corporation, for extensions of credit is based on management’s credit assessment of the counterparty.
Standby letters of credit are conditional commitments issued by the Corporation guaranteeing performance by a customer to a third party. Those guarantees are issued primarily to support public and private borrowing arrangements, including commercial paper, bond financing and similar transactions. The credit risk involved in issuing letters of credit is essentially the same as that involved in extending loan facilities to customers. Some of the standby letters of credit are collateralized by real estate or other assets, while others are unsecured. The extent to which proceeds from liquidation of collateral would be expected to cover the maximum potential amount of future payments related to
standby letters of credit is not estimable. The Corporation has recorded no liability associated with standby letters of credit as of December 31, 2010 and 2009.
Standby letters of credit as of December 31, 2010 expire as follows:
|
(In Thousands)
|
||||
|
Year of Expiration
|
Amount
|
|||
|
2011
|
$ | 22,128 | ||
|
2012
|
885 | |||
|
2013
|
488 | |||
|
2014
|
235 | |||
|
2015
|
151 | |||
|
Thereafter
|
6,090 | |||
|
Total
|
$ | 29,977 | ||
17. CONTINGENCIES
In the normal course of business, the Corporation is subject to pending and threatened litigation in which claims for monetary damages are asserted. In management’s opinion, the Corporation’s financial position and results of operations would not be materially affected by the outcome of these legal proceedings.
79
18. REGULATORY MATTERS
The Corporation (on a consolidated basis) and C&N Bank are subject to various regulatory capital requirements administered by the federal banking agencies. Failure to meet minimum capital requirements can initiate certain mandatory - and possibly additional discretionary - actions by regulators that, if undertaken, could have a direct material effect on the Corporation’s financial statements. Under capital adequacy guidelines and the regulatory framework for prompt corrective action, the Corporation and C&N Bank must meet specific capital guidelines that involve quantitative measures of their assets, liabilities and certain off-balance sheet items as calculated under regulatory accounting practices.
The capital amounts and classification are also subject to qualitative judgments by the regulators about components, risk weightings and other factors. Prompt corrective action provisions are not applicable to bank holding companies.
Quantitative measures established by regulation to ensure capital adequacy require the Corporation and C&N Bank to maintain minimum amounts and ratios (set forth in the following table) of total and Tier I capital (as defined in the regulations) to risk-weighted assets (as defined) and of Tier I capital (as defined) to average assets (as defined). Management believes, as of December 31, 2010 and 2009, that the Corporation, C&N Bank and First State Bank meet all capital adequacy requirements to which they are or were subject.
To be categorized as well capitalized, an institution must maintain minimum total risk based, Tier I risk based and Tier I leverage ratios as set forth in the following table. The Corporation’s, C&N Bank’s and First State Bank’s actual capital amounts and ratios are also presented in the following table:
|
Minimum
|
||||||||||||||||||||||||
|
(Dollars in Thousands)
|
To Be Well
|
|||||||||||||||||||||||
|
Minimum
|
Capitalized Under
|
|||||||||||||||||||||||
|
Capital
|
Prompt Corrective
|
|||||||||||||||||||||||
|
Actual
|
Requirement
|
Action Provisions
|
||||||||||||||||||||||
|
Amount
|
Ratio
|
Amount
|
Ratio
|
Amount
|
Ratio
|
|||||||||||||||||||
|
December 31, 2010:
|
||||||||||||||||||||||||
|
Total capital to risk-weighted assets:
|
||||||||||||||||||||||||
|
Consolidated
|
$ | 128,527 | 17.17 | % | $ | 59,874 | ³8 | % | n/a | n/a | ||||||||||||||
|
C&N Bank
|
117,576 | 15.85 | % | 59,342 | ³8 | % | $ | 74,177 | ³10 | % | ||||||||||||||
|
Tier 1 capital to risk-weighted assets:
|
||||||||||||||||||||||||
|
Consolidated
|
118,781 | 15.87 | % | 29,937 | ³4 | % | n/a | n/a | ||||||||||||||||
|
C&N Bank
|
108,445 | 14.62 | % | 29,671 | ³4 | % | 44,506 | ³6 | % | |||||||||||||||
|
Tier 1 capital to average assets:
|
||||||||||||||||||||||||
|
Consolidated
|
118,781 | 9.20 | % | 51,664 | ³4 | % | n/a | n/a | ||||||||||||||||
|
C&N Bank
|
108,445 | 8.50 | % | 51,063 | ³4 | % | 63,828 | ³5 | % | |||||||||||||||
|
December 31, 2009:
|
||||||||||||||||||||||||
|
Total capital to risk-weighted assets:
|
||||||||||||||||||||||||
|
Consolidated
|
$ | 133,311 | 17.89 | % | $ | 59,628 | ³8 | % | n/a | n/a | ||||||||||||||
|
C&N Bank
|
117,320 | 16.22 | % | 57,869 | ³8 | % | $ | 72,337 | ³10 | % | ||||||||||||||
|
First State Bank
|
4,545 | 24.73 | % | 1,470 | ³8 | % | 1,838 | ³10 | % | |||||||||||||||
|
Tier 1 capital to risk-weighted assets:
|
||||||||||||||||||||||||
|
Consolidated
|
124,463 | 16.70 | % | 29,814 | ³4 | % | n/a | n/a | ||||||||||||||||
|
C&N Bank
|
109,112 | 15.08 | % | 28,935 | ³4 | % | 43,402 | ³6 | % | |||||||||||||||
|
First State Bank
|
4,395 | 23.92 | % | 735 | ³4 | % | 1,103 | ³6 | % | |||||||||||||||
|
Tier 1 capital to average assets:
|
||||||||||||||||||||||||
|
Consolidated
|
124,463 | 9.86 | % | 50,513 | ³4 | % | n/a | n/a | ||||||||||||||||
|
C&N Bank
|
109,112 | 9.02 | % | 48,393 | ³4 | % | 60,491 | ³5 | % | |||||||||||||||
|
First State Bank
|
4,395 | 9.33 | % | 1,885 | ³4 | % | 2,356 | ³5 | % | |||||||||||||||
80
Banking regulators limit the amount of dividends that may be paid by the Citizens & Northern Bank to the Corporation. Retained earnings against which dividends may be paid without prior approval of the banking regulators amounted to approximately $55,170,000 at December 31, 2010, subject to the minimum capital ratio requirements noted above.
Restrictions imposed by federal law prohibit the Corporation from borrowing from C&N Bank unless the loans are secured in specific amounts. Such secured loans to the Corporation are generally limited to 10% of C&N Bank’s tangible stockholder’s equity (excluding accumulated other comprehensive income) or $11,757,000 at December 31, 2010.
19. PARENT COMPANY ONLY
The following is condensed financial information for Citizens & Northern Corporation:
|
CONDENSED BALANCE SHEET
|
December 31,
|
|||||||
|
(In Thousands)
|
2010
|
2009
|
||||||
|
ASSETS
|
||||||||
|
Cash
|
$ | 758 | $ | 1,826 | ||||
|
Investment in subsidiaries:
|
||||||||
|
Citizens & Northern Bank
|
127,570 | 133,498 | ||||||
|
Citizens & Northern Investment Corporation
|
7,597 | 6,947 | ||||||
|
Canisteo Valley Corporation
|
0 | 7,536 | ||||||
|
Bucktail Life Insurance Company
|
2,947 | 2,761 | ||||||
|
Other assets
|
134 | 79 | ||||||
|
TOTAL ASSETS
|
$ | 139,006 | $ | 152,647 | ||||
|
LIABILITIES AND STOCKHOLDERS' EQUITY
|
||||||||
|
Dividends payable
|
$ | 0 | $ | 169 | ||||
|
Other liabilities
|
62 | 68 | ||||||
|
Stockholders' equity
|
138,944 | 152,410 | ||||||
|
TOTAL LIABILITIES AND STOCKHOLDERS' EQUITY
|
$ | 139,006 | $ | 152,647 | ||||
|
CONDENSED INCOME STATEMENT
|
||||||||||||
|
(In Thousands)
|
2010
|
2009
|
2008
|
|||||||||
|
Dividends from Citizens & Northern Bank
|
$ | 31,170 | $ | 5,414 | $ | 8,984 | ||||||
|
Dividends from non-bank subsidiaries
|
3 | 21,439 | 401 | |||||||||
|
Other income
|
10 | 0 | 0 | |||||||||
|
Expenses
|
(188 | ) | (159 | ) | (163 | ) | ||||||
|
Income before equity in undistributed income of subsidiaries
|
30,995 | 26,694 | 9,222 | |||||||||
|
Equity in undistributed (loss) income of subsidiaries
|
(11,940 | ) | (66,029 | ) | 837 | |||||||
|
NET INCOME (LOSS)
|
$ | 19,055 | $ | (39,335 | ) | $ | 10,059 | |||||
81
|
CONDENSED STATEMENT OF CASH FLOWS
|
||||||||||||
|
(In Thousands)
|
2010
|
2009
|
2008
|
|||||||||
|
CASH FLOWS FROM OPERATING ACTIVITIES:
|
||||||||||||
|
Net income (loss)
|
$ | 19,055 | $ | (39,335 | ) | $ | 10,059 | |||||
|
Adjustments to reconcile net income (loss) to net cash provided by operating activities:
|
||||||||||||
|
Equity in undistributed net loss (income) of Subsidiaries
|
11,940 | 66,029 | (837 | ) | ||||||||
|
(Increase) decrease in other assets
|
(55 | ) | (56 | ) | 15 | |||||||
|
(Decrease) increase in other liabilities
|
(6 | ) | (20 | ) | 77 | |||||||
|
Net Cash Provided by Operating Activities
|
30,934 | 26,618 | 9,314 | |||||||||
|
CASH FLOWS FROM INVESTING ACTIVITIES:
|
||||||||||||
|
Proceeds from merger with Canisteo Valley Corporation
|
47 | 0 | 0 | |||||||||
|
Investments in subsidiaries
|
0 | (67,615 | ) | 0 | ||||||||
|
Net Cash Provided by (Used in) Investing Activities
|
47 | (67,615 | ) | 0 | ||||||||
|
CASH FLOWS FROM FINANCING ACTIVITIES:
|
||||||||||||
|
Issuance of US Treasury preferred stock and warrant
|
0 | 26,409 | 0 | |||||||||
|
Issuance of common stock
|
0 | 24,585 | 0 | |||||||||
|
Proceeds from sale of treasury stock
|
0 | 30 | 220 | |||||||||
|
Tax benefit from compensation plans, net
|
40 | 145 | 18 | |||||||||
|
Purchase of treasury stock
|
0 | 0 | (2,135 | ) | ||||||||
|
Payment to repurchase preferred stock and warrant
|
(26,840 | ) | 0 | 0 | ||||||||
|
Dividends paid
|
(5,249 | ) | (8,415 | ) | (7,678 | ) | ||||||
|
Net Cash (Used in) Provided by Financing Activities
|
(32,049 | ) | 42,754 | (9,575 | ) | |||||||
|
(DECREASE) INCREASE IN CASH AND CASH EQUIVALENTS
|
(1,068 | ) | 1,757 | (261 | ) | |||||||
|
CASH AND CASH EQUIVALENTS, BEGINNING OF YEAR
|
1,826 | 69 | 330 | |||||||||
|
CASH AND CASH EQUIVALENTS, END OF YEAR
|
$ | 758 | $ | 1,826 | $ | 69 | ||||||
82
20. SUMMARY OF QUARTERLY CONSOLIDATED FINANCIAL DATA (Unaudited)
The following table presents summarized quarterly financial data for 2010 and 2009:
|
In Thousands, Except Per Share Data
|
2010 Quarter Ended
|
|||||||||||||||
|
Mar. 31,
|
June 30,
|
Sept. 30,
|
Dec. 31,
|
|||||||||||||
|
Interest income
|
$ | 15,733 | $ | 15,386 | $ | 15,495 | $ | 15,500 | ||||||||
|
Interest expense
|
5,260 | 5,036 | 4,639 | 4,310 | ||||||||||||
|
Net interest income
|
10,473 | 10,350 | 10,856 | 11,190 | ||||||||||||
|
Provision for loan losses
|
207 | 76 | 189 | 719 | ||||||||||||
|
Net interest income after provision for loan losses
|
10,266 | 10,274 | 10,667 | 10,471 | ||||||||||||
|
Other income
|
3,548 | 3,314 | 3,575 | 3,480 | ||||||||||||
|
Net gains on available-for-sale securities
|
58 | 319 | 388 | 64 | ||||||||||||
|
Other expenses
|
7,997 | 7,757 | 8,095 | 7,720 | ||||||||||||
|
Income before income tax provision
|
5,875 | 6,150 | 6,535 | 6,295 | ||||||||||||
|
Income tax provision
|
1,437 | 1,281 | 1,671 | 1,411 | ||||||||||||
|
Net income
|
4,438 | 4,869 | 4,864 | 4,884 | ||||||||||||
|
US Treasury preferred dividends
|
373 | 372 | 729 | 0 | ||||||||||||
|
Net income available to common shareholders
|
$ | 4,065 | $ | 4,497 | $ | 4,135 | $ | 4,884 | ||||||||
|
Net income per share – basic
|
$ | 0.34 | $ | 0.37 | $ | 0.34 | $ | 0.40 | ||||||||
|
Net income per share – diluted
|
$ | 0.34 | $ | 0.37 | $ | 0.34 | $ | 0.40 | ||||||||
|
In Thousands, Except Per Share Data
|
2009 Quarter Ended
|
|||||||||||||||
|
Mar. 31,
|
June 30,
|
Sept. 30,
|
Dec. 31,
|
|||||||||||||
|
Interest income
|
$ | 17,571 | $ | 17,341 | $ | 16,808 | $ | 16,256 | ||||||||
|
Interest expense
|
6,606 | 6,164 | 6,016 | 5,670 | ||||||||||||
|
Net interest income
|
10,965 | 11,177 | 10,792 | 10,586 | ||||||||||||
|
(Credit) provision for loan losses
|
(173 | ) | 93 | 634 | 126 | |||||||||||
|
Net interest income after provision for loan losses
|
11,138 | 11,084 | 10,158 | 10,460 | ||||||||||||
|
Other income
|
2,844 | 3,140 | 3,374 | 3,663 | ||||||||||||
|
Net (losses) on available-for-sale securities
|
(16,679 | ) | (18,995 | ) | (47,848 | ) | (318 | ) | ||||||||
|
Other expenses
|
8,716 | 9,244 | 8,369 | 7,682 | ||||||||||||
|
(Loss) income before income tax provision
|
(11,413 | ) | (14,015 | ) | (42,685 | ) | 6,123 | |||||||||
|
Income tax (credit) provision
|
(4,388 | ) | (5,284 | ) | (14,491 | ) | 1,508 | |||||||||
|
Net (loss) income
|
(7,025 | ) | (8,731 | ) | (28,194 | ) | 4,615 | |||||||||
|
US Treasury preferred dividends
|
309 | 373 | 373 | 373 | ||||||||||||
|
Net (loss) income available to common shareholders
|
$ | (7,334 | ) | $ | (9,104 | ) | $ | (28,567 | ) | $ | 4,242 | |||||
|
Net (loss) income per share – basic
|
$ | (0.82 | ) | $ | (1.01 | ) | $ | (3.17 | ) | $ | 0.42 | |||||
|
Net (loss) income per share – diluted
|
$ | (0.82 | ) | $ | (1.01 | ) | $ | (3.17 | ) | $ | 0.42 | |||||
83
21. PREFERRED STOCK AND WARRANT UNDER THE TARP CAPITAL PURCHASE PROGRAM
On January 16, 2009, the Corporation issued 26,440 shares of Series A Preferred Stock (“Preferred Stock”) and a Warrant to purchase up to 194,794 shares of common stock at an exercise price of $20.36 per share. The Corporation sold the Preferred Stock and Warrant to the United States Department of the Treasury (“Treasury”) under the TARP Capital Purchase Program (the “Program”) for an aggregate price of $26,440,000. The Preferred Stock paid a cumulative dividend rate of 5% per annum. On August 4, 2010, the Corporation redeemed all of the Preferred Stock. After repurchasing the Preferred Stock, the Corporation negotiated with the Treasury for
repurchase of the Warrant on September 1, 2010 for a total cash cost of $400,000, which was recorded as a reduction in paid-in capital.
In 2009, the Corporation recorded issuance of the Preferred Stock and Warrant as increases in stockholders’ equity. Proceeds from the transaction, net of direct issuance costs of $31,000, were allocated between Preferred Stock and the Warrant based on their respective fair values at the date of issuance. The fair value of the Preferred Stock was estimated based on dividend rates on recent preferred stock and other capital issuances by banking companies, and the fair value of the Warrant was estimated using the Black-Scholes-Merton option model. The amount allocated to the Warrant (recorded as an increase in Paid in Capital) was $821,000, and the amount initially allocated to
Preferred Stock was $25,588,000. As a result, the Preferred Stock’s initial carrying value was at a discount to the liquidation value or stated value of $26,440,000. In accordance with the SEC’s Staff Accounting Bulletin No. 68, “Increasing Rate Preferred Stock,” the discount is considered an unstated dividend cost that shall be accreted over the period preceding commencement of the perpetual dividend using the effective interest method, by charging the imputed dividend cost against retained earnings and increasing the carrying amount of the Preferred Stock by a corresponding amount. The discount was therefore being accreted over five years, resulting in an effective dividend rate (including stated dividends and the accretion of the discount on Preferred Stock) of 5.80%. Total dividends on Preferred Stock have been deducted
from net income to arrive at net income available to common shareholders in the Consolidated Statements of Operations. Dividends on Preferred Stock include quarterly dividends paid, plus dividends accrued based on the stated value and the accretion of the discount on Preferred Stock. The accretion of the discount on Preferred Stock was $691,000 in 2010 (including accelerated discount of $607,000 related to the redemption) and $161,000 in 2009.
84
Report of Independent Registered Public Accounting Firm
Stockholders and Board of Directors of Citizens & Northern Corporation:
We have audited the accompanying consolidated balance sheets of Citizens & Northern Corporation and subsidiaries as of December 31, 2010 and 2009 and the related consolidated statements of operations, changes in stockholders’ equity, and cash flows for each of the years in the three-year period ended December 31, 2010. Citizens & Northern Corporation and subsidiaries’ management is responsible for these financial statements. Our responsibility is to express an opinion on these financial statements based on our audits.
We conducted our audits in accordance with the standards of the Public Company Accounting Oversight Board (United States). Those standards require that we plan and perform the audit to obtain reasonable assurance about whether the financial statements are free of material misstatement. An audit includes examining, on a test basis, evidence supporting the amounts and disclosures in the financial statements. An audit also includes assessing the accounting principles used and significant estimates made by management, as well as evaluating the overall financial statement presentation. We believe that our audits provide a reasonable basis for our opinion.
In our opinion, the consolidated financial statements referred to above present fairly, in all material respects, the financial position of Citizens & Northern Corporation and subsidiaries as of December 31, 2010 and 2009, and the results of their operations and their cash flows for each of the years in the three-year period ended December 31, 2010 in conformity with accounting principles generally accepted in the United States of America.
We also have audited, in accordance with the standards of the Public Company Accounting Oversight Board (United States), Citizens & Northern Corporation and subsidiaries’ internal control over financial reporting as of December 31, 2010, based on criteria established in
Internal Control-Integrated Framework
issued by the Committee of Sponsoring Organizations of the Treadway Commission (COSO), and our report dated February 28, 2011 expressed an unqualified opinion.
/s/ParenteBeard LLC
Williamsport, Pennsylvania
February 28, 2011
85
None
EVALUATION OF DISCLOSURE CONTROLS AND PROCEDURES
The Corporation’s management, under the supervision of and with the participation of the Corporation’s Chief Executive Officer and Chief Financial Officer, has carried out an evaluation of the design and effectiveness of the Corporation’s disclosure controls and procedures as defined in Rule 13a-15(e) and Rule 15d-15(e) of the Securities Exchange Act of 1934 as of the end of the period covered by this report. Based upon that evaluation, the Chief Executive Officer and Chief Financial Officer have concluded that, as of the end of such period, the Corporation’s disclosure controls and procedures are effective to ensure that all material information required to be disclosed in
reports the Corporation files or submits under the Securities Exchange Act of 1934 is recorded, processed, summarized and reported, within the time periods specified in the Securities and Exchange Commission’s rules and forms.
There were no significant changes in the Corporation’s internal control over financial reporting that occurred during the period covered by this report that has materially affected, or that is reasonably likely to affect, our internal control over financial reporting.
MANAGEMENT’S REPORT ON INTERNAL CONTROL OVER FINANCIAL REPORTING
The Corporation’s management is responsible for establishing and maintaining adequate internal control over financial reporting, as that term is defined in Exchange Act Rules 13a-15(f) and 15d-15(f). The Corporation’s system of internal control over financial reporting has been designed to provide reasonable assurance to the Corporation’s management and board of directors regarding the reliability of financial reporting and the preparation and fair presentation of financial statements for external purposes in accordance with accounting principles generally accepted in the United States of America.
Any system of internal control over financial reporting, no matter how well designed, has inherent limitations, including the possibility that a control can be circumvented or overridden and misstatements due to error or fraud may occur and not be detected. Also, because of changes in conditions, internal control effectiveness may vary over time. Accordingly, even an effective system of internal control will provide only reasonable assurance with respect to financial statement preparation and presentation.
The Corporation’s management has assessed the effectiveness of the Corporation’s internal control over financial reporting as of December 31, 2010. To make this assessment, we used the criteria for effective internal control over financial reporting described in Internal Control – Integrated Framework, issued by the Committee of Sponsoring Organizations of the Treadway Commission. Based on our assessment and based on such criteria, we believe that, as of December 31, 2010, the Corporation’s internal control over financial reporting was effective.
ParenteBeard LLC, the independent registered public accounting firm that audited the Corporation’s consolidated financial statements, has issued an audit report on the Corporation’s internal control over financial reporting as of December 31, 2010. That report appears below.
|
February 28, 2011
|
By:
|
/s/ Charles H. Updegraff, Jr.
|
| Date |
|
President and Chief Executive Officer
|
|
February 28, 2011
|
By:
|
/s/ Mark A. Hughes
|
| Date |
|
Treasurer and Chief Financial Officer
|
86
Report Of Independent Registered Public Accounting Firm
Stockholders and Board of Directors of Citizens & Northern Corporation:
We have audited Citizens & Northern Corporation and subsidiaries’ internal control over financial reporting as of December 31, 2010, based on criteria established in
Internal Control-Integrated Framework
issued by the Committee of Sponsoring Organizations of the Treadway Commission (COSO). Citizens & Northern Corporation and subsidiaries’ management is responsible for maintaining effective internal control over financial reporting and for its assessment of the effectiveness of internal control over financial reporting included in the accompanying Management’s Report on Internal Control Over Financial
Reporting. Our responsibility is to express an opinion on the company's internal control over financial reporting based on our audit.
We conducted our audit in accordance with the standards of the Public Company Accounting Oversight Board (United States). Those standards require that we plan and perform the audit to obtain reasonable assurance about whether effective internal control over financial reporting was maintained in all material respects. Our audit of internal control over financial reporting included obtaining an understanding of internal control over financial reporting, assessing the risk that a material weakness exists, and testing and evaluating the design and operating effectiveness of internal control based on the assessed risk. Our audit also included performing such other procedures as we considered necessary in the
circumstances. We believe that our audit provides a reasonable basis for our opinion.
A company's internal control over financial reporting is a process designed to provide reasonable assurance regarding the reliability of financial reporting and the preparation of financial statements for external purposes in accordance with generally accepted accounting principles. A company's internal control over financial reporting includes those policies and procedures that (1) pertain to the maintenance of records that, in reasonable detail, accurately and fairly reflect the transactions and dispositions of the assets of the company; (2) provide reasonable assurance that transactions are recorded as necessary to permit preparation of financial statements in accordance with generally accepted
accounting principles, and that receipts and expenditures of the company are being made only in accordance with authorizations of management and directors of the company; and (3) provide reasonable assurance regarding prevention or timely detection of unauthorized acquisition, use, or disposition of the company's assets that could have a material effect on the financial statements.
87
Because of its inherent limitations, internal control over financial reporting may not prevent or detect misstatements. Also, projections of any evaluation of effectiveness to future periods are subject to the risk that controls may become inadequate because of changes in conditions, or that the degree of compliance with the policies or procedures may deteriorate.
In our opinion, Citizens and Northern Corporation and subsidiaries maintained, in all material respects, effective internal control over financial reporting as of December 31, 2010, based on criteria established in
Internal Control – Integrated Framework
issued by the Committee of Sponsoring Organizations of the Treadway Commission (COSO).
We have also audited, in accordance with the standards of the Public Company Accounting Oversight Board (United States), the consolidated balance sheets and the related consolidated statements of operations, changes in stockholders’ equity, and cash flows of Citizens & Northern Corporation and subsidiaries, and our report dated February 28, 2011 expressed an unqualified
/s/ ParenteBeard LLC
Williamsport, Pennsylvania
February 28, 2011
88
There was no information the Corporation was required to disclose in a report on Form 8-K during the fourth quarter 2010 that was not disclosed.
Information concerning Directors and Executive Officers is incorporated herein by reference to disclosure under the captions “Proposal 1 - Election of Directors,” “Corporation’s and C&N Bank’s Executive Officers,” “Section 16(a) Beneficial Ownership Reporting Compliance,” “Board of Directors Committees, Leadership and Attendance,”“Director Compensation,” and “Stockholder Proposals” of the Corporation’s proxy statement dated March 9, 2011 for the annual meeting of stockholders to be held on April 19, 2011.
The Corporation’s Board of Directors has adopted a Code of Ethics, available on the Corporation’s web site at
www.cnbankpa.com
for the Corporation’s employees, officers and directors. (The provisions of the Code of Ethics are also included in the Corporation’s employee handbook.)
Information concerning executive compensation is incorporated herein by reference to disclosure under the captions “Compensation Discussion and Analysis,” “Executive Compensation,” “Outstanding Equity Awards at Fiscal Year-end,” “Options Exercised and Stock Vested,” “Pension Plans,” “401(k) Savings Plan,” “Employer Stock Ownership Plan (“ESOP”),” and “Change in Control Agreements” of the Corporation’s proxy statement dated March 9, 2011 for the annual meeting of stockholders to be held on April 19, 2011.
Information concerning security ownership of certain beneficial owners and management is incorporated herein by reference to disclosure under the caption “Security Ownership of Management” of the Corporation’s proxy statement dated March 9, 2011 for the annual meeting of stockholders to be held on April 19, 2011.
“Equity Compensation Plan Information” as required by Item 201(d) of Regulation S-K is incorporated by reference herein from Item 5 (Market for Registrant’s Common Equity and Related Stockholder Matters) of this Form 10-K.
Information concerning loans and deposits with Directors and Executive Officers is provided in Note 16 to the Consolidated Financial Statements, which is included in Part II, Item 8 of this Annual Report on Form 10-K. Additional information, including information concerning director independence, is incorporated herein by reference to disclosure appearing under the caption "Certain Transactions," “Proposal 1 – Election of Directors” and “Board of Directors Committees, Leadership Structure and Attendance” of the Corporation's proxy statement dated March 9, 2011 for the annual meeting of stockholders to be held on April 19, 2011.
Information concerning services provided by the Corporation’s independent auditors, ParenteBeard LLC, the audit committee’s pre-approval policies and procedures for such services, and fees paid by the Corporation to that firm, is incorporated herein by reference to disclosure under the caption “Audit Committee” of the Corporation’s proxy statement dated March 9, 2011 for the annual meeting of stockholders to be held on April 19, 2011.
89
(a) (1). The following consolidated financial statements are set forth in Part II, Item 8:
|
Page
|
||
|
|
||
|
Report of Independent Registered Public Accounting Firm
|
85
|
|
|
Financial Statements:
|
||
|
Consolidated Balance Sheets - December 31, 2010 and 2009
|
40
|
|
|
Consolidated Statements of Operations - Years Ended
|
||
|
December 31, 2010, 2009, and 2008
|
41
|
|
|
Consolidated Statements of Changes in Stockholders' Equity -
|
||
|
Years Ended December 31, 2010, 2009, and 2008
|
42 -43
|
|
|
Consolidated Statements of Cash Flows - Years Ended
|
||
|
December 31, 2010, 2009, and 2008
|
44 - 45
|
|
|
Notes to Consolidated Financial Statements
|
46 - 84
|
(a)(2) Financial statement schedules are not applicable or included in the financial statements or related notes.
|
2. Plan of acquisition, reorganization, arrangement,
|
Not applicable
|
|
|
liquidation or succession
|
||
|
3. (i) Articles of Incorporation
|
Incorporated by reference to Exhibit 3.1 of
|
|
|
the Corporation's Form 8-K filed
|
||
|
September 21, 2009
|
||
|
3. (ii) By-laws
|
Incorporated by reference to Exhibit 3.2 of the
|
|
|
Corporation's Form 8-K filed September 21, 2009
|
||
|
9. Voting trust agreement
|
Not applicable
|
|
|
10. Material contracts:
|
||
|
10.1 Repurchase Agreement, dated August 4, 2010, between
|
Incorporated by reference to Exhibit 10.1 of
|
|
|
the United States Department of Treasury and Citizens &
|
the Corporation’s Form 8-K filed August 4, 2010
|
|
|
Northern Corporation for the redemption of the Corporation’s
|
||
|
Series A Preferred Stock
|
||
|
10.2 Form of Stock Option and Restricted Stock agreement
|
Filed herewith
|
|
|
dated January 4, 2011 between the Corporation and its
|
||
|
independent directors pursuant to the Citizens & Northern
|
||
|
Corporation Independent Directors Stock Incentive Plan
|
||
|
10.3 Form of Stock Option agreement dated January 4, 2011
|
Filed herewith
|
|
|
between the Corporation and certain officers pursuant
|
||
|
to the Citizens & Northern Corporation Stock Incentive Plan
|
||
|
10.4 Form of Restricted Stock agreement dated January 4, 2011
|
Filed herewith
|
|
|
between the Corporation and certain officers pursuant to
|
||
|
the Citizens & Northern Corporation Stock Incentive Plan
|
||
|
10.5 Restricted Stock Agreement dated March 5, 2010 between
|
Incorporated by reference to Exhibit 10.1 of the
|
|
|
the Corporation and Charles H. Updegraff, Jr.
|
Corporation’s Form 10-Q filed August 6, 2010
|
90
|
10.6 Executive Agreement dated March 25, 2010 between the
Corporation, Citizens and Northern Bank and Charles H.
Updegraff, Jr.
|
Incorporated by reference to Exhibit 10.1 of the
Corporation’s Form 8-K filed on March 26, 2010
|
||
|
10.7 Form of Indemnification Agreements dated May 2004
|
Incorporated by reference to Exhibit 10.1
|
||
|
between the Corporation and the Directors and certain officers
|
filed with the Corporation's Form 10-K
|
||
|
on March 11, 2005
|
|||
|
10.8 Form of Indemnification Agreement dated January 19,
|
Filed herewith
|
||
|
2011 between the Corporation and John M. Reber
|
|||
|
10.9 Change in Control Agreement dated March 1, 2010
|
Incorporated by reference to Exhibit 10.1
|
||
|
between the Corporation and Charles H. Updegraff, Jr.
|
of the Corporation’s Form 8-K filed on March 1,
|
||
|
2010
|
|||
|
10.10 Change in Control Agreement dated April 15, 2008
|
Incorporated by reference to Exhibit 10.9
|
||
|
between the Corporation and George M. Raup
|
filed with the Corporation's Form 10-K
|
||
|
on March 6, 2009
|
|||
|
10.11 Change in Control Agreement dated July 21, 2005
|
Incorporated by reference to Exhibit 10.1
|
||
|
between the Corporation and Harold F. Hoose, III
|
filed with the Corporation's Form 10-K
|
||
|
on March 3, 2006
|
|||
|
10.12 Change in Control Agreement dated December 31, 2003
|
Incorporated by reference to Exhibit 10.2
|
||
|
between the Corporation and Thomas L. Rudy, Jr.
|
filed with the Corporation's Form 10-K
|
||
|
on March 11, 2005
|
|||
|
10.13 Change in Control Agreement dated December 31, 2003
|
Incorporated by reference to Exhibit 10.2
|
||
|
between the Corporation and Mark A. Hughes
|
filed with the Corporation's Form 10-K
|
||
|
on March 10, 2004
|
|||
|
10.14 Change in Control Agreement dated December 31, 2003
|
Incorporated by reference to Exhibit 10.4
|
||
|
between the Corporation and Deborah E. Scott
|
filed with the Corporation's Form 10-K
|
||
|
on March 10, 2004
|
|||
|
10.15 Third Amendment to Citizens & Northern Corporation
|
Incorporated by reference to Exhibit A to
|
||
|
Stock Incentive Plan
|
the Corporation's proxy statement
|
||
|
dated March 18, 2008 for the annual
|
|||
|
meeting of stockholders held on April 15, 2008
|
|||
|
10.16 Second Amendment to Citizens & Northern Corporation
|
Incorporated by reference to Exhibit 10.5
|
||
|
Stock Incentive Plan
|
filed with the Corporation's Form 10-K
|
||
|
on March 10, 2004
|
|||
|
10.17 First Amendment to Citizens & Northern Corporation
|
Incorporated by reference to Exhibit 10.6
|
||
|
Stock Incentive Plan
|
filed with the Corporation's Form 10-K
|
||
|
on March 10, 2004
|
|||
|
10.18 Citizens & Northern Corporation Stock Incentive Plan
|
Incorporated by reference to Exhibit 10.7
|
||
|
filed with the Corporation's Form 10-K
|
|||
|
on March 10, 2004
|
|||
91
|
10.19 First Amendment to Citizens & Northern Corporation
|
Incorporated by reference to Exhibit B to
|
|
|
Independent Directors Stock Incentive Plan
|
the Corporation's proxy statement
|
|
|
dated March 18, 2008 for the annual
|
||
|
meeting of stockholders held on April 15, 2008
|
||
|
10.20 Citizens & Northern Corporation Independent Directors
|
Incorporated by reference to Exhibit A to
|
|
|
Stock Incentive Plan
|
the Corporation's proxy statement
|
|
|
dated March 19, 2001 for the annual
|
||
|
meeting of stockholders held on
|
||
|
April 17, 2001.
|
||
|
10.21 Citizens & Northern Corporation Supplemental Executive
|
Incorporated by reference to Exhibit 10.21
|
|
|
Retirement Plan (as amended and restated)
|
filed with the Corporation's Form 10-K
|
|
|
on March 6, 2009
|
||
|
11. Statement re: computation of per share earnings
|
Information concerning the computation of
|
|
|
earnings per share is provided in Note 4
|
||
|
to the Consolidated Financial Statements,
|
||
|
which is included in Part II, Item 8 of Form 10-K
|
||
|
12. Statements re: computation of ratios
|
Not applicable
|
|
|
13. Annual report to security holders, Form 10-Q or
|
Not applicable
|
|
|
quarterly report to security holders
|
||
|
14. Code of ethics
|
The Code of Ethics is available through the
|
|
|
Corporation's website at www.cnbankpa.com.
|
||
|
To access the Code of Ethics, click on
|
||
|
"Shareholder News," followed by "Corporate
|
||
|
Governance Policies" and "Code of Ethics."
|
||
|
16. Letter re: change in certifying accountant
|
Not applicable
|
|
|
18. Letter re: change in accounting principles
|
Not applicable
|
|
|
21. Subsidiaries of the registrant
|
Filed herewith
|
|
|
22. Published report regarding matters submitted to
|
Not applicable
|
|
|
vote of security holders
|
||
|
23. Consents of experts and counsel
|
Filed herewith
|
|
|
24. Power of attorney
|
Not applicable
|
|
|
31. Rule 13a-14(a)/15d-14(a) certifications:
|
||
|
31.1 Certification of Chief Executive Officer
|
Filed herewith
|
|
|
31.2 Certification of Chief Financial Officer
|
Filed herewith
|
|
|
32. Section 1350 certifications
|
Filed herewith
|
|
|
33. Report on assessment of compliance with servicing criteria for
|
||
|
asset-backed securities
|
Not applicable
|
|
|
34. Attestation report on assessment of compliance with servicing
|
||
|
criteria for asset-backed securities
|
Not applicable |
92
|
35. Service compliance statement
|
Not applicable
|
|
|
99. Additional exhibits:
|
||
|
99.1 Additional information mailed or made available online to
|
Filed herewith
|
|
|
shareholders with proxy statement and Form 10-K on
|
||
|
March 10, 2011
|
||
|
100. XBRL-related documents
|
Not applicable
|
SIGNATURES
Pursuant to the requirements of Section 13 or 15(d) of the Securities Exchange Act of 1934, Citizens & Northern Corporation has duly caused this report to be signed on its behalf by the undersigned, thereunto duly authorized:
|
By:
|
/s/ Charles H. Updegraff, Jr.
|
|
President and Chief Executive Officer
|
|
|
Date: February 28, 2011
|
|
|
By:
|
/s/ Mark A. Hughes
|
|
Treasurer and Principal Accounting Officer
|
|
Date: February 28, 2011
Pursuant to the requirements of the Securities Exchange Act of 1934, this report has been signed below by the following persons on behalf of the registrant and in the capacities and on the dates indicated.
BOARD OF DIRECTORS
|
/s/
|
Dennis F. Beardslee
|
/s/
|
Raymond R. Mattie
|
|
Dennis F. Beardslee
|
Raymond R. Mattie
|
||
|
Date: February 28, 2011
|
Date: February 28, 2011
|
||
|
/s/
|
Jan E. Fisher
|
/s/
|
Edward H. Owlett, III
|
|
Jan E. Fisher
|
Edward H. Owlett, III
|
||
|
Date: February 28, 2011
|
Date: February 28, 2011
|
||
|
/s/
|
R. Bruce Haner
|
/s/
|
Leonard Simpson
|
|
R. Bruce Haner
|
Leonard Simpson
|
||
|
Date: February 28, 2011
|
Date: February 28, 2011
|
||
|
/s/
|
Susan E. Hartley
|
/s/
|
James E. Towner
|
|
Susan E. Hartley
|
James E. Towner
|
||
|
Date: February 28, 2011
|
Date: February 28, 2011
|
||
|
/s/
|
Leo F. Lambert
|
/s/
|
Ann M. Tyler
|
|
Leo F. Lambert
|
Ann M. Tyler
|
||
|
Date: February 28, 2011
|
Date: February 28, 2011
|
||
|
/s/
|
Edward L. Learn
|
/s/
|
Charles H. Updegraff, Jr.
|
|
Edward L. Learn
|
Charles H. Updegraff, Jr.
|
||
|
Date: February 28, 2011
|
Date: February 28, 2011
|
93
TABLE OF CONTENTS
Part IItem 1. BusinessItem 1A. Risk FactorsItem 1B. Unresolved Staff CommentsItem 2. PropertiesItem 3. Legal ProceedingsItem 4. (removed and Reserved)Part IIItem 5. Market For Registrant's Common Equity, Related Stockholder Matters and Issuer Purchases Of Equity SecuritiesItem 6. Selected Financial DataItem 6. Selected Financial Data, ContinuedItem 7. Management's Discussion and Analysis Of Financial Condition and Results Of OperationsItem 7A. Quantitative and Qualitative Disclosures About Market RiskItem 8. Financial Statements and Supplementary DataItem 9. Changes in and Disagreements with Accountants on Accounting and Financial DisclosureItem 9A. Controls and ProceduresItem 9B. Other InformationPart IIIItem 10. Directors, Executive Officers and Corporate GovernanceItem 11. Executive CompensationItem 12. Security Ownership Of Certain Beneficial Owners and Management and Related Stockholder MattersItem 13. Certain Relationships and Related Transactions, and Director IndependenceItem 14. Principal Accountant Fees and ServicesPart IVItem 15. Exhibits and Financial Statement Schedules