|
|
|
|
|
|
|
|
|
|
|
|
|
|
|
|
|
|
|
|
|
|
|
|
|
|
|
|
|
|
|
|
|
|
|
|
|
|
|
|
|
|
|
|
|
|
|
|
|
|
|
|
|
|
|
|
UNITED STATES
SECURITIES AND EXCHANGE COMMISSION
Washington, D.C. 20549
FORM 10-K
(Mark One)
| x | ANNUAL REPORT PURSUANT TO SECTION 13 OR 15(d) OF THE SECURITIES EXCHANGE ACT OF 1934 |
For the fiscal year ended December 31, 2017
OR
| ¨ | TRANSITION REPORT PURSUANT TO SECTION 13 OR 15(d) OF THE SECURITIES EXCHANGE ACT OF 1934 |
For the transition period from _____________ to _____________.
Commission file number: 0-16084
CITIZENS & NORTHERN CORPORATION
(Exact name of Registrant as specified in its charter)
| PENNSYLVANIA | 23-2451943 | |
| (State or other jurisdiction of | (I.R.S. Employer | |
| incorporation or organization) | Identification No.) |
90-92 MAIN STREET, WELLSBORO, PA 16901
(Address of principal executive offices) (Zip code)
570-724-3411
(Registrant’s telephone number including area code)
Securities registered pursuant to Section 12(b) of the Act:
| Title of Each Class | Name of Exchange Where Registered | |
| C ommon Stock Par Value $1.00 | The NASDAQ Stock Market LLC |
Securities registered pursuant to section 12(g) of the Act: None
Indicate by check mark whether the registrant is a well-known seasoned issuer, as defined in Rule 405 of the Securities Act. Yes ¨ No x
Indicate by check mark if the registrant is not required to file reports pursuant to Section 13 or Section 15(d) of the Act. Yes ¨ No x
Indicate by check mark whether the registrant (1) has filed all reports required to be filed by Section 13 or 15(d) of the Securities Exchange Act of 1934 during the preceding 12 months (or for such shorter period that the registrant was required to file such reports), and (2) has been subject to such filing requirements for the past 90 days. Yes x No ¨
Indicate by check mark whether the registrant has submitted electronically and posted on its corporate Web site, if any, every Interactive Data File required to be submitted and posted pursuant to Rule 405 of Regulation S-T (Section 232.405 of this chapter) during the preceding 12 months (or for such shorter period that the registrant was required to submit and post such files). Yes x No ¨
Indicate by check mark if disclosure of delinquent filers pursuant to Item 405 of Regulation S-K is not contained herein, and will not be contained, to the best of registrant’s knowledge, in definitive proxy or information statements incorporated by reference in Part III of this Form 10-K or any amendment to this Form 10-K. x
Indicate by check mark whether the registrant is a large accelerated filer, an accelerated filer, a non-accelerated filer, smaller reporting company, or an emerging growth company. See the definitions of “large accelerated filer,” “accelerated filer,” “smaller reporting company,” and “emerging growth company” in Rule 12b-2 of the Exchange Act.
(Check one): Large accelerated filer ¨ Accelerated filer x Non-accelerated filer ¨ Smaller reporting company ¨ Emerging growth company ¨
If an emerging growth company, indicate by check mark if the registrant has elected not to use the extended transition period for complying with any new or revised financial accounting standards provided pursuant to Section 13(a) of the Exchange Act. ¨
Indicate by check mark whether the registrant is a shell company (as defined in Rule 12b-2 of the Exchange Act). Yes ¨ No x
The aggregate market value of the registrant’s common stock held by non-affiliates at June 30, 2017, the registrant’s most recently completed second fiscal quarter, was $274,571,344.
The number of shares of common stock outstanding at February 8, 2018 was 12,246,834.
DOCUMENTS INCORPORATED BY REFERENCE
Portions of the registrant’s proxy statement for the annual meeting of its shareholders to be held April 19, 2018 are incorporated by reference into Parts III and IV of this report.
TABLE OF CONTENTS
| 2 |
Citizens & Northern Corporation (“Corporation”) is a holding company whose principal activity is community banking. The Corporation’s principal office is located in Wellsboro, Pennsylvania. The largest subsidiary is Citizens & Northern Bank (“C&N Bank” or the “Bank”). The Corporation’s other wholly-owned subsidiaries are Citizens & Northern Investment Corporation and Bucktail Life Insurance Company (“Bucktail”). Citizens & Northern Investment Corporation was formed in 1999 to engage in investment activities. Bucktail reinsures credit and mortgage life and accident and health insurance on behalf of C&N Bank.
C&N Bank is a Pennsylvania banking institution that was formed by the consolidation of Northern National Bank of Wellsboro and Citizens National Bank of Towanda on October 1, 1971. Subsequent mergers included: First National Bank of Ralston in May 1972; Sullivan County National Bank in October 1977; Farmers National Bank of Athens in January 1984; and First National Bank of East Smithfield in May 1990. In 2005, the Corporation acquired Canisteo Valley Corporation and its subsidiary, First State Bank, a New York State chartered commercial bank with offices in Canisteo and South Hornell, NY. In 2010, the First State Bank operations were merged into C&N Bank and Canisteo Valley Corporation was merged into the Corporation. On May 1, 2007, the Corporation acquired Citizens Bancorp, Inc. (“Citizens”), with banking offices in Coudersport, Emporium and Port Allegany, Pennsylvania. Citizens Trust Company, the banking subsidiary of Citizens, was merged with and into C&N Bank as part of the transaction. C&N Bank has held its current name since May 6, 1975, at which time C&N Bank changed its charter from a national bank to a Pennsylvania bank.
C&N Bank provides an extensive range of banking services, including deposit and loan products for personal and commercial customers. The Bank also maintains a trust division that provides a wide range of financial services, such as 401(k) plans, retirement planning, estate planning, estate settlements and asset management. In January 2000, C&N Bank formed a subsidiary, C&N Financial Services Corporation (“C&NFSC”). C&NFSC is a licensed insurance agency that provides insurance products to individuals and businesses. In 2001, C&NFSC added a broker-dealer division, which offers mutual funds, annuities, educational savings accounts and other investment products through registered agents. C&NFSC’s operations are not significant in relation to the total operations of the Corporation.
In December 2017, C&N Bank established a new entity, Northern Tier Holding LLC, for the purpose of acquiring, holding and disposing of real property acquired by the Bank. C&N Bank is the sole member of Northern Tier Holding LLC, which had no transactions in 2017.
All phases of the Bank’s business are competitive. The Bank primarily competes in Tioga, Bradford, Sullivan, Lycoming, Potter, Cameron and McKean counties in Pennsylvania, and Steuben and Chemung counties in New York. The Bank competes with local commercial banks headquartered in our market area as well as other commercial banks with branches in our market area. Some of the banks that have branches in our market area are larger in overall size. With respect to lending activities and attracting deposits, the Bank also competes with savings banks, savings and loan associations, insurance companies, regulated small loan companies and credit unions. Also, the Bank competes with mutual funds for deposits. C&N Bank competes with insurance companies, investment counseling firms, mutual funds and other business firms and individuals for trust, investment management, brokerage and insurance services. The Bank is generally competitive with all financial institutions in our service area with respect to interest rates paid on time and savings deposits, service charges on deposit accounts and interest rates charged on loans. The Bank serves a diverse customer base, and is not economically dependent on any small group of customers or on any individual industry.
Major initiatives within the last 5 years included the following:
| · | in 2013, worked with consultants on projects which resulted in ongoing increases in revenues from service charges on deposit accounts, starting primarily in the fourth quarter 2013, and ongoing reductions in electronic funds processing expenses; |
| · | in 2014, approved a treasury stock repurchase program for repurchase of up to 622,500 shares of the Corporation’s common stock, or approximately 5% of the Corporation’s outstanding shares at July 16, 2014. In total, 622,500 shares were repurchased for a total cost of $12,140,000, at an average price of $19.50 per share; |
| · | in 2015, began an organization-wide effort to enhance customer relationships, growth and profitability, including working with consultants on enhanced employee engagement and customer service training, and hiring additional lending personnel to provide more access to commercial and mortgage lending opportunities; |
| 3 |
| · | in 2016, approved a new treasury stock repurchase program authorizing repurchase of up to 600,000 shares of the Corporation’s common stock. Through December 31, 2017, there have been no repurchases of shares under this program; and |
| · | in March 2017, opened a loan production office in Elmira, New York. |
Virtually all of the Corporation’s banking offices are located in the “Marcellus Shale,” an area extending across portions of New York State, Pennsylvania, Ohio, Maryland, West Virginia and Virginia. In recent years, most of the Pennsylvania counties in which the Corporation operates were significantly affected by an upsurge in natural gas exploration, as technological developments made exploration of the Marcellus Shale commercially feasible. After a surge of activity in 2009 through most of 2011, the market price of natural gas declined, causing Marcellus Shale natural gas exploration activity to slow, though some activity has continued to occur throughout the Corporation’s market area. Through December 31, 2017, the Corporation has not experienced significant credit issues as a result of the expansion and subsequent reduction in Marcellus Shale-related activity.
At December 31, 2017, C&N Bank had total assets of $1,262,642,000, total deposits of $1,016,035,000, net loans outstanding of $806,857,000 and 296 full-time equivalent employees.
Most activities of the Corporation and its subsidiaries are regulated by federal or state agencies. The primary regulatory relationships are described as follows:
| · | The Corporation is a bank holding company formed under the provisions of Section 3 of the Federal Reserve Act. The Corporation is under the direct supervision of the Federal Reserve and must comply with the reporting requirements of the Federal Bank Holding Company Act. |
| · | C&N Bank is a state-chartered, nonmember bank, supervised by the Federal Deposit Insurance Corporation and the Pennsylvania Department of Banking and Securities. |
| · | C&NFSC is a Pennsylvania corporation. The Pennsylvania Department of Insurance regulates C&NFSC’s insurance activities. Brokerage products are offered through third party networking agreements. |
| · | Bucktail is incorporated in the state of Arizona and supervised by the Arizona Department of Insurance. |
A copy of the Corporation’s annual report on Form 10-K, quarterly reports on Form 10-Q, current events reports on Form 8-K, and amendments to these reports, will be furnished without charge upon written request to the Corporation’s Treasurer at P.O. Box 58, Wellsboro, PA 16901. Copies of these reports will be furnished as soon as reasonably possible, after they are filed electronically with the Securities and Exchange Commission. The information is also available through the Corporation’s web site at www.cnbankpa.com.
The Corporation is subject to the many risks and uncertainties applicable to all banking companies, as well as risks specific to the Corporation’s geographic locations. Although the Corporation seeks to effectively manage risks, and maintains a level of equity that exceeds the banking regulatory agencies’ thresholds for being considered “well capitalized” (see Note 18 to the consolidated financial statements), management cannot predict the future and cannot eliminate the possibility of credit, operational or other losses. Accordingly, actual results may differ materially from management’s expectations. Some of the Corporation’s significant risks and uncertainties are discussed below.
Credit Risk from Lending Activities – A significant source of risk is the possibility that losses will be sustained because borrowers, guarantors and related parties may fail to perform in accordance with the terms of their loan agreements. Most of the Corporation’s loans are secured, but some loans are unsecured. With respect to secured loans, the collateral securing the repayment of these loans may be insufficient to cover the obligations owed under such loans. Collateral values may be adversely affected by changes in economic, environmental and other conditions, including declines in the value of real estate, changes in interest rates, changes in monetary and fiscal policies of the federal government, wide-spread disease, terrorist activity, environmental contamination and other external events. In addition, collateral appraisals that are out of date or that do not meet industry recognized standards may create the impression that a loan is adequately collateralized when it is not. The Corporation has adopted underwriting and credit monitoring procedures and policies, including regular reviews of appraisals and borrower financial statements, that management believes are appropriate to mitigate the risk of loss. Also, as discussed further in the “Provision and Allowance for Loan Losses” section of Management’s Discussion and Analysis, the Corporation attempts to estimate the amount of losses that may be inherent in the portfolio through a quarterly evaluation process that includes several members of management and that addresses specifically identified problem loans, as well as other quantitative data and qualitative factors. Such risk management and accounting policies and procedures, however, may not prevent unexpected losses that could have a material adverse effect on the Corporation’s financial condition, results of operations or liquidity.
| 4 |
Interest Rate Risk – Business risk arising from changes in interest rates is an inherent factor in operating a banking organization. The Corporation’s assets are predominantly long-term, fixed-rate loans and debt securities. Funding for these assets comes principally from shorter-term deposits and borrowed funds. Accordingly, there is an inherent risk of lower future earnings or decline in fair value of the Corporation’s financial instruments when interest rates change. Significant fluctuations in interest rates could have a material adverse effect on the Corporation’s financial condition, results of operations or liquidity. For additional information regarding interest rate risk, see Part II, Item 7A, “Quantitative and Qualitative Disclosures About Market Risk.”
Breach of Information Security and Technology Dependence – The Corporation relies on software, communication, and information exchange on a variety of computing platforms and networks and over the Internet. Despite numerous safeguards, the Corporation cannot be certain that all of its systems are entirely free from vulnerability to attack or other technological difficulties or failures. The Corporation relies on the services of a variety of vendors to meet its data processing and communication needs. If information security is breached or other technology difficulties or failures occur, information may be lost or misappropriated, services and operations may be interrupted and the Corporation could be exposed to claims from customers. Any of these results could have a material adverse effect on the Corporation’s financial condition, results of operations or liquidity.
Limited Geographic Diversification – The Corporation grants commercial, residential and personal loans to customers primarily in the Pennsylvania counties of Tioga, Bradford, Sullivan, Lycoming, Potter, Cameron and McKean, and in Steuben and Chemung Counties in New York State. Although the Corporation has a diversified loan portfolio, a significant portion of its debtors’ ability to honor their contracts is dependent on the local economic conditions within the region. Deterioration in economic conditions could adversely affect the quality of the Corporation’s loan portfolio and the demand for its products and services, and accordingly, could have a material adverse effect on the Corporation’s financial condition, results of operations or liquidity.
Competition – All phases of the Corporation’s business are competitive. Some competitors are much larger in total assets and capitalization than the Corporation, have greater access to capital markets and can offer a broader array of financial services. There can be no assurance that the Corporation will be able to compete effectively in its markets. Furthermore, developments increasing the nature or level of competition could have a material adverse effect on the Corporation’s financial condition, results of operations or liquidity.
Government Regulation and Monetary Policy – The Corporation and the banking industry are subject to extensive regulation and supervision under federal and state laws and regulations. The requirements and limitations imposed by such laws and regulations limit the manner in which the Corporation conducts its business, undertakes new investments and activities and obtains financing. These regulations are designed primarily for the protection of the deposit insurance funds and consumers and not to benefit the Corporation’s shareholders. Financial institution regulation has been the subject of significant legislation in recent years and may be the subject of further significant legislation in the future, none of which is in the control of the Corporation. Significant new laws or changes in, or repeals of, existing laws could have a material adverse effect on the Corporation’s financial condition, results of operations or liquidity. Further, federal monetary policy, particularly as implemented through the Federal Reserve System, significantly affects short-term interest rates and credit conditions, and any unfavorable change in these conditions could have a material adverse effect on the Corporation’s financial condition, results of operations or liquidity.
Mortgage Banking – Since 2009, the Corporation has originated and sold residential mortgage loans to the secondary market through the MPF Xtra program. Since 2014, the Corporation has also originated and sold residential mortgage loans to the secondary market through the MPF Original program. Both of these programs are administered by the Federal Home Loan Banks of Pittsburgh and Chicago. At December 31, 2017, the total outstanding balance of residential mortgages sold and serviced through the two programs amounted to $169,725,000. The Corporation must strictly adhere to the MPF Xtra and MPF Original program guidelines for origination, underwriting and servicing loans, and failure to do so may result in the Corporation being forced to repurchase loans or being dropped from the program. As of December 31, 2017, the total outstanding balance of residential mortgage loans the Corporation has repurchased as a result of identified instances of noncompliance amounted to $1,805,000. If the volume of such forced repurchases of loans were to increase significantly, or if the Corporation were to be dropped from the programs, it could have a material adverse effect on the Corporation’s financial condition, results of operations or liquidity.
| 5 |
Securities Markets – The fair value of the Corporation’s available-for-sale securities, as well as the revenues the Corporation earns from its Trust and Financial Management and brokerage services, are sensitive to price fluctuations and market events.
Declines in the values of the Corporation’s securities holdings, combined with adverse changes in the expected cash flows from these investments, could result in other-than-temporary impairment charges.
For additional information regarding debt securities, see the “Securities” section of Management’s Discussion and Analysis and Note 7 to the consolidated financial statements.
The Corporation’s Trust and Financial Management revenue is determined, in part, from the value of the underlying investment portfolios. Accordingly, if the values of those investment portfolios decrease, whether due to factors influencing U.S. or international securities markets, in general, or otherwise, the Corporation’s revenue could be negatively impacted. In addition, the Corporation’s ability to sell its brokerage services is dependent, in part, upon consumers’ level of confidence in securities markets.
The Federal Home Loan Bank of Pittsburgh – Through its subsidiary (C&N Bank), the Corporation is a member of the Federal Home Loan Bank of Pittsburgh (FHLB-Pittsburgh), which is one of 11 regional Federal Home Loan Banks. The Corporation has a line of credit with the FHLB-Pittsburgh that is secured by a blanket lien on its loan portfolio. Access to this line of credit is critical if a funding need arises. However, there can be no assurance that the FHLB-Pittsburgh will be able to provide funding when needed, nor can there be assurance that the FHLB-Pittsburgh will provide funds specifically to the Corporation should its financial condition deteriorate and/or regulators prevent that access. The inability to access this source of funds could have a materially adverse effect on the Corporation’s financial flexibility if alternate financing is not available at acceptable interest rates. The failure of the FHLB-Pittsburgh or the FHLB system in general, may materially impair the Corporation’s ability to meet short- and long-term liquidity needs or to meet growth plans.
The Corporation owns common stock of the FHLB-Pittsburgh in order to qualify for membership in the FHLB system and access services from the FHLB-Pittsburgh. The FHLB-Pittsburgh faces a variety of risks in its operations including interest rate risk, counterparty credit risk, and adverse changes in its regulatory framework. In addition, the 11 Federal Home Loan Banks are jointly liable for the consolidated obligations of the FHLB system. To the extent that one FHLB cannot meet its obligations, other FHLBs can be called upon to make required payments. Such risks affecting the FHLB-Pittsburgh could adversely impact the value of the Corporation’s investment in the common stock of the FHLB-Pittsburgh and/or affect its access to credit.
Soundness of Other Financial Institutions – In addition to the FHLB-Pittsburgh, the Corporation maintains other credit facilities that provide it with additional liquidity. These facilities include secured and unsecured borrowings from the Federal Reserve Bank and third-party commercial banks. The Corporation believes that it maintains a strong liquidity position and that it is well positioned to withstand foreseeable market conditions. However, legal agreements with counterparties typically include provisions allowing them to restrict or terminate the Corporation’s access to these credit facilities with or without advance notice and at their sole discretion.
Financial institutions are interconnected as a result of trading, clearing, counterparty, and other relationships. Financial market conditions have been negatively impacted in the past and such disruptions or adverse changes in the Corporation’s results of operations or financial condition could, in the future, have a negative impact on available sources of liquidity. Such a situation may arise due to circumstances that are outside the Corporation’s control, such as general market disruptions or operational problems affecting the Corporation or third parties. The Corporation’s efforts to monitor and manage liquidity risk may not be successful or sufficient to deal with dramatic or unanticipated reductions in available liquidity. In such events, the Corporation’s cost of funds may increase, thereby reducing net interest income, or the Corporation may need to sell a portion of its securities and/or loan portfolio, which, depending upon market conditions, could necessitate realizing a loss.
FDIC Insurance Assessments – In 2008 and 2009, higher levels of bank failures dramatically increased the resolution costs of the Federal Deposit Insurance Corporation, or the FDIC, and depleted the deposit insurance fund. In addition, the FDIC and the U.S. Congress increased federal deposit insurance coverage, placing additional stress on the deposit insurance fund. In order to maintain a strong funding position and restore reserve ratios of the deposit insurance fund, in 2009 the FDIC increased assessment rates. As a result of lowering assessment levels for the Corporation and other US banks, the Corporation’s 2017 FDIC assessment expense decreased to $376,000 from $488,000 in 2016 and from $603,000 in 2015. Although the Corporation’s total expenses from FDIC assessments have steadily decreased from $2,092,000 in 2009, the Corporation is generally unable to control the cost of the premiums. If a significant number of bank or financial institution failures occur, the Corporation may be required to pay higher FDIC premiums. Future increases in FDIC insurance premiums or additional special assessments may materially adversely affect the Corporation’s results of operations.
| 6 |
Bank Secrecy Act and Related Laws and Regulations – These laws and regulations have significant implications for all financial institutions. In recent years, they have increased due diligence requirements and reporting obligations for financial institutions, created new crimes and penalties, and required the federal banking agencies, in reviewing merger and other acquisition transactions, to consider the effectiveness of the parties to such transactions in combating money laundering activities. Even innocent noncompliance and inconsequential failure to follow the regulations could result in significant fines or other penalties, which could have a material adverse impact on the Corporation’s financial condition, results of operations or liquidity.
Not applicable.
The Bank owns each of its properties, except for the branch facilities located at 130 Court Street, Williamsport, PA, and at 2 East Mountain Avenue, South Williamsport, PA, which are leased. All of the properties are in good condition. None of the owned properties are subject to encumbrance.
A listing of properties is as follows:
Main administrative offices:
| 90-92 Main Street | or | 10 Nichols Street | ||
| Wellsboro, PA 16901 | Wellsboro, PA 16901 |
Branch offices – Citizens & Northern Bank:
| 428 S. Main Street | 514 Main Street | 2 East Mountain Avenue ** | ||
| Athens, PA 18810 | Laporte, PA 18626 | South Williamsport, PA 17702 | ||
| 10 North Main Street | 4534 Williamson Trail | 41 Main Street | ||
| Coudersport, PA 16915 | Liberty, PA 16930 | Tioga, PA 16946 | ||
| 111 W. Main Street | 1085 S. Main Street | 428 Main Street | ||
| Dushore, PA 18614 | Mansfield, PA 16933 | Towanda, PA 18848 | ||
| 563 Main Street | 612 James Monroe Avenue | 64 Elmira Street | ||
| East Smithfield, PA 18817 | Monroeton, PA 18832 | Troy, PA 16947 | ||
| 104 W. Main Street | 3461 Route 405 Highway | 90-92 Main Street | ||
| Elkland, PA 16920 | Muncy, PA 17756 | Wellsboro, PA 16901 | ||
| 135 East Fourth Street | 100 Maple Street | 1510 Dewey Avenue | ||
| Emporium, PA 15834 | Port Allegany, PA 16743 | Williamsport, PA 17701 | ||
| 230 Railroad Street | 24 Thompson Street | 130 Court Street ** | ||
| Jersey Shore, PA 17740 | Ralston, PA 17763 | Williamsport, PA 17701 | ||
| 102 E. Main Street | 1827 Elmira Street | 1467 Golden Mile Road | ||
| Knoxville, PA 16928 | Sayre, PA 18840 | Wysox, PA 18854 | ||
| 3 Main Street | 6250 County Rte 64 | |||
| Canisteo, NY 14823 | Hornell, NY 14843 |
Loan production office of Citizens & Northern Bank:
250 East Water Street
Elmira, NY 14901
Facilities management office:
13 Water Street
Wellsboro, PA 16901
** designates leased branch facility
| 7 |
The Corporation and the Bank are involved in various legal proceedings incidental to their business. Management believes the aggregate liability, if any, resulting from such pending and threatened legal proceedings will not have a material adverse effect on the Corporation’s financial condition or results of operations.
Not applicable.
QUARTERLY SHARE DATA
Trades of the Corporation’s stock are executed through various brokers who maintain a market in the Corporation’s stock. The Corporation’s stock is listed on the NASDAQ Capital Market with the trading symbol CZNC. As of December 31, 2017, there were 2,206 shareholders of record of the Corporation’s common stock.
The following table sets forth the high and low sales prices of the common stock during 2017 and 2016.
| 2017 | 2016 | |||||||||||||||||||||||
| Dividend | Dividend | |||||||||||||||||||||||
| Declared | Declared | |||||||||||||||||||||||
| per | per | |||||||||||||||||||||||
| High | Low | Quarter | High | Low | Quarter | |||||||||||||||||||
| First quarter | $ | 26.50 | $ | 22.31 | $ | 0.26 | $ | 20.99 | $ | 19.26 | $ | 0.26 | ||||||||||||
| Second quarter | 24.40 | 22.00 | 0.26 | 21.00 | 19.40 | 0.26 | ||||||||||||||||||
| Third quarter | 25.42 | 22.01 | 0.26 | 22.67 | 20.00 | 0.26 | ||||||||||||||||||
| Fourth quarter | 26.75 | 23.02 | 0.26 | 26.57 | 20.54 | 0.26 | ||||||||||||||||||
Future dividend payments will depend upon maintenance of a strong financial condition, future earnings and capital and regulatory requirements. Also, the Corporation and C&N Bank are subject to restrictions on the amount of dividends that may be paid without approval of banking regulatory authorities. These restrictions are described in Note 18 to the consolidated financial statements.
Effective April 21, 2016, the Corporation’s Board of Directors approved a treasury stock repurchase program. Under this program, the Corporation is authorized to repurchase up to 600,000 shares of the Corporation’s common stock or slightly less than 5% of the Corporation’s issued and outstanding shares at April 19, 2016. The Board of Directors’ April 21, 2016 authorization provides that: (1) the new treasury stock repurchase program shall be effective when publicly announced and shall continue thereafter until suspended or terminated by the Board of Directors, in its sole discretion; and (2) all shares of common stock repurchased pursuant to the new program shall be held as treasury shares and be available for use and reissuance for purposes as and when determined by the Board of Directors including, without limitation, pursuant to the Corporation’s Dividend Reinvestment and Stock Purchase Plan and its equity compensation program. To date, no purchases have been made under this repurchase program.
| 8 |
The following table sets forth a summary of purchases by the Corporation, in the open market, of its equity securities during the fourth quarter 2017:
| Period |
Total Number
of Shares Purchased |
Average
Price Paid per Share |
Total Number of
Shares Purchased as Part of Publicly Announced Plans or Programs |
Maximum Number of
Shares that May Yet be Purchased Under the Plans or Programs |
||||||||||||
| October 1 - 31, 2017 | 0 | $ | - | 0 | 600,000 | |||||||||||
| November 1 - 30, 2017 | 0 | $ | - | 0 | 600,000 | |||||||||||
| December 1 - 31, 2017 | 0 | $ | - | 0 | 600,000 | |||||||||||
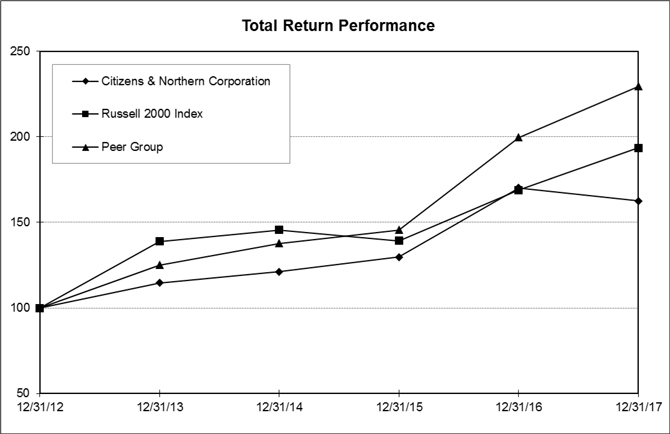
PERFORMANCE GRAPH
Set forth below is a chart comparing the Corporation’s cumulative return to stockholders against the cumulative return of the Russell 2000 and a Peer Group Index of similar banking organizations selected by the Corporation for the five-year period commencing December 31, 2012 and ended December 31, 2017. The index values are market-weighted dividend-reinvestment numbers, which measure the total return for investing $100.00 five years ago. This meets Securities & Exchange Commission requirements for showing dividend reinvestment share performance over a five-year period and measures the return to an investor for placing $100.00 into a group of bank stocks and reinvesting any and all dividends into the purchase of more of the same stock for which dividends were paid.
| 9 |
| Period Ending | ||||||||||||||||||||||||
| Index | 12/31/12 | 12/31/13 | 12/31/14 | 12/31/15 | 12/31/16 | 12/31/17 | ||||||||||||||||||
| Citizens & Northern Corporation | 100.00 | 114.68 | 121.20 | 129.69 | 170.12 | 162.63 | ||||||||||||||||||
| Russell 2000 Index | 100.00 | 138.82 | 145.62 | 139.19 | 168.85 | 193.58 | ||||||||||||||||||
| Peer Group | 100.00 | 125.12 | 137.72 | 145.57 | 199.56 | 229.49 | ||||||||||||||||||
Peer Group includes all publicly traded SEC filing Commercial Banks & Thrifts within NJ, NY, OH and PA with assets between $750M and $3.5B as of 9/30/2017
Source: S&P Global Market Intelligence © 2017
EQUITY COMPENSATION PLAN INFORMATION
The following table sets forth information concerning the Stock Incentive Plan and Independent Directors Stock Incentive Plan, both of which have been approved by the Corporation’s shareholders. The figures shown in the table below are as of December 31, 2017.
| Number of | ||||||||||
| Number of | Weighted- | Securities | ||||||||
| Securities to be | average | Remaining | ||||||||
| Issued Upon | Exercise | for Future | ||||||||
| Exercise of | Price of | Issuance Under | ||||||||
| Outstanding | Outstanding | Equity Compen- | ||||||||
| Options | Options | sation Plans | ||||||||
| Equity compensation plans approved by shareholders | 165,660 | $ | 18.49 | 287,575 | ||||||
| Equity compensation plans not approved by shareholders | 0 | N/A | 0 | |||||||
More details related to the Corporation’s equity compensation plans are provided in Notes 1 and 13 to the consolidated financial statements.
| 10 |
| As of or for the Year Ended December 31, | ||||||||||||||||||||
| INCOME STATEMENT (In Thousands) | 2017 | 2016 | 2015 | 2014 | 2013 | |||||||||||||||
| Interest and fee income | $ | 45,863 | $ | 44,098 | $ | 44,519 | $ | 46,009 | $ | 48,914 | ||||||||||
| Interest expense | 3,915 | 3,693 | 4,602 | 5,122 | 5,765 | |||||||||||||||
| Net interest income | 41,948 | 40,405 | 39,917 | 40,887 | 43,149 | |||||||||||||||
| Provision for loan losses | 801 | 1,221 | 845 | 476 | 2,047 | |||||||||||||||
| Net interest income after provision for loan losses | 41,147 | 39,184 | 39,072 | 40,411 | 41,102 | |||||||||||||||
| Noninterest income excluding securities gains | 16,153 | 15,511 | 15,478 | 15,420 | 16,451 | |||||||||||||||
| Realized gains on available-for-sale securities, net | 257 | 1,158 | 2,861 | 1,104 | 1,718 | |||||||||||||||
| Loss on prepayment of debt | 0 | 0 | 2,573 | 0 | 1,023 | |||||||||||||||
| Noninterest expense excluding loss on prepayment of debt | 36,967 | 34,744 | 33,030 | 34,157 | 33,471 | |||||||||||||||
| Income before income tax provision | 20,590 | 21,109 | 21,808 | 22,778 | 24,777 | |||||||||||||||
| Income tax provision | 7,156 | 5,347 | 5,337 | 5,692 | 6,183 | |||||||||||||||
| Net income | $ | 13,434 | $ | 15,762 | $ | 16,471 | $ | 17,086 | $ | 18,594 | ||||||||||
| Net income attributable to common shares | $ | 13,365 | $ | 15,677 | $ | 16,387 | $ | 17,009 | $ | 18,490 | ||||||||||
| PER COMMON SHARE: | ||||||||||||||||||||
| Basic earnings per share | $ | 1.10 | $ | 1.30 | $ | 1.35 | $ | 1.38 | $ | 1.51 | ||||||||||
| Diluted earnings per share | $ | 1.10 | $ | 1.30 | $ | 1.35 | $ | 1.38 | $ | 1.50 | ||||||||||
| Cash dividends declared per share | $ | 1.04 | $ | 1.04 | $ | 1.04 | $ | 1.04 | $ | 1.00 | ||||||||||
| Book value per common share at period-end | $ | 15.43 | $ | 15.36 | $ | 15.39 | $ | 15.34 | $ | 14.49 | ||||||||||
| Tangible book value per common share at period-end | $ | 14.45 | $ | 14.37 | $ | 14.41 | $ | 14.36 | $ | 13.51 | ||||||||||
| Weighted average common shares outstanding - basic | 12,115,840 | 12,032,820 | 12,149,252 | 12,333,933 | 12,283,426 | |||||||||||||||
| Weighted average common shares outstanding - diluted | 12,155,136 | 12,063,055 | 12,171,084 | 12,355,916 | 12,313,833 | |||||||||||||||
| END OF PERIOD BALANCES (Dollars In Thousands) | ||||||||||||||||||||
| Available-for-sale securities | $ | 356,908 | $ | 395,077 | $ | 420,290 | $ | 516,807 | $ | 482,658 | ||||||||||
| Gross loans | 815,713 | 751,835 | 704,880 | 630,545 | 644,303 | |||||||||||||||
| Allowance for loan losses | 8,856 | 8,473 | 7,889 | 7,336 | 8,663 | |||||||||||||||
| Total assets | 1,276,959 | 1,242,292 | 1,223,417 | 1,241,963 | 1,237,695 | |||||||||||||||
| Deposits | 1,008,449 | 983,843 | 935,615 | 967,989 | 954,516 | |||||||||||||||
| Borrowings | 70,955 | 64,629 | 92,263 | 78,597 | 96,723 | |||||||||||||||
| Stockholders’ equity | 188,443 | 186,008 | 187,487 | 188,362 | 179,472 | |||||||||||||||
| Common shares outstanding | 12,214,525 | 12,113,228 | 12,180,623 | 12,279,980 | 12,390,063 | |||||||||||||||
| AVERAGE BALANCES (In Thousands) | ||||||||||||||||||||
| Total assets | 1,247,759 | 1,229,866 | 1,243,209 | 1,239,897 | 1,237,096 | |||||||||||||||
| Earning assets | 1,169,569 | 1,147,549 | 1,159,298 | 1,155,401 | 1,145,340 | |||||||||||||||
| Gross loans | 780,640 | 723,076 | 657,727 | 627,753 | 656,495 | |||||||||||||||
| Deposits | 990,917 | 970,447 | 968,201 | 965,418 | 964,031 | |||||||||||||||
| Stockholders’ equity | 188,958 | 188,373 | 188,905 | 185,469 | 181,412 | |||||||||||||||
| 11 |
| As of or for the Year Ended December 31, | ||||||||||||||||||||
| 2017 | 2016 | 2015 | 2014 | 2013 | ||||||||||||||||
| KEY RATIOS | ||||||||||||||||||||
| Return on average assets | 1.08 | % | 1.28 | % | 1.32 | % | 1.38 | % | 1.50 | % | ||||||||||
| Return on average equity | 7.11 | % | 8.37 | % | 8.72 | % | 9.21 | % | 10.25 | % | ||||||||||
| Average equity to average assets | 15.14 | % | 15.32 | % | 15.19 | % | 14.96 | % | 14.66 | % | ||||||||||
| Net interest margin (1) | 3.82 | % | 3.76 | % | 3.69 | % | 3.80 | % | 4.05 | % | ||||||||||
| Efficiency (2) | 60.74 | % | 59.22 | % | 56.66 | % | 57.59 | % | 53.27 | % | ||||||||||
| Cash dividends as a % of diluted earnings per share | 94.55 | % | 80.00 | % | 77.04 | % | 75.36 | % | 66.67 | % | ||||||||||
| Tier 1 leverage | 14.23 | % | 14.27 | % | 14.31 | % | 13.89 | % | 13.78 | % | ||||||||||
| Tier 1 risk-based capital | 21.95 | % | 22.48 | % | 23.29 | % | 26.26 | % | 25.15 | % | ||||||||||
| Total risk-based capital | 23.07 | % | 23.60 | % | 24.40 | % | 27.60 | % | 26.60 | % | ||||||||||
| Tangible common equity/tangible assets | 13.95 | % | 14.15 | % | 14.49 | % | 14.34 | % | 13.66 | % | ||||||||||
| Nonperforming assets/total assets | 1.47 | % | 1.43 | % | 1.31 | % | 1.34 | % | 1.53 | % | ||||||||||
| Nonperforming loans/total loans | 2.10 | % | 2.07 | % | 2.09 | % | 2.45 | % | 2.80 | % | ||||||||||
| Allowance for loan losses/total loans | 1.09 | % | 1.13 | % | 1.12 | % | 1.16 | % | 1.34 | % | ||||||||||
| Net charge-offs/average loans | 0.05 | % | 0.09 | % | 0.04 | % | 0.29 | % | 0.04 | % | ||||||||||
(1) Rates of return on tax-exempt securities and loans are calculated on a fully-taxable equivalent basis.
(2) The efficiency ratio is calculated by dividing: (a) total noninterest expense excluding losses from prepayment of debt, by (b) the sum of net interest income (including income from tax-exempt securities and loans on a fully-taxable equivalent basis) and noninterest income excluding securities gains or losses.
| 12 |
Certain statements in this section and elsewhere in this Annual Report on Form 10-K are forward-looking statements. Citizens & Northern Corporation and its wholly-owned subsidiaries (collectively, the Corporation) intend such forward-looking statements to be covered by the safe harbor provisions for forward-looking statements contained in the Private Securities Reform Act of 1995. Forward-looking statements, which are not historical facts, are based on certain assumptions and describe future plans, business objectives and expectations, and are generally identifiable by the use of words such as, “should”, “likely”, “expect”, “plan”, “anticipate”, “target”, “forecast”, and “goal”. These forward-looking statements are subject to risks and uncertainties that are difficult to predict, may be beyond management’s control and could cause results to differ materially from those expressed or implied by such forward-looking statements. Factors which could have a material, adverse impact on the operations and future prospects of the Corporation include, but are not limited to, the following:
| · | changes in monetary and fiscal policies of the Federal Reserve Board and the U.S. Government, particularly related to changes in interest rates |
| · | changes in general economic conditions |
| · | legislative or regulatory changes |
| · | downturn in demand for loan, deposit and other financial services in the Corporation’s market area |
| · | increased competition from other banks and non-bank providers of financial services |
| · | technological changes and increased technology-related costs |
| · | changes in accounting principles, or the application of generally accepted accounting principles. |
These risks and uncertainties should be considered in evaluating forward-looking statements and undue reliance should not be placed on such statements.
EARNINGS OVERVIEW
In 2017, net income totaled $13,434,000, or $1.10 per common share - basic and diluted, as compared to $1.30 per share – basic and diluted in 2016 and $1.35 per share – basic and diluted in 2015. The results for 2017 represented a return on average assets of 1.08% and a return on average equity of 7.11%. As described below, 2017 earnings were reduced for a tax charge in 2017 attributable to the recent reduction in the marginal corporate income tax rate.
2017 vs. 2016
In December 2017, the federal corporate income tax rate was lowered to 21% effective January 1, 2018, from the 35% marginal rate in effect throughout 2017 and 2016. As a result of the reduction in the income tax rate, the 2017 results include an additional income tax provision (expense) of $2,159,000 ($0.18 per share) related to a reduction in the carrying value of the net deferred tax asset. Management expects the Corporation’s income tax provision will be significantly lower in 2018 and on an ongoing basis as a result of the lower tax rate.
Deferred tax assets and liabilities are recognized based on temporary differences between the financial statement carrying amounts and the tax basis of assets and liabilities, and are valued using currently enacted tax rates. The reduction in the deferred tax asset in 2017 reflects the reduced expected future net benefit from these differences, and was recognized upon the new tax bill being signed into law in December 2017.
The table below provides a reconciliation of the Corporation’s annual earnings results under U.S. generally accepted accounting principles (U.S. GAAP) to the comparative results excluding the additional tax charge referred to above. Management believes disclosure of 2017 earnings results, adjusted to exclude the additional income tax provision resulting from the change in the tax rate, provides useful information to investors for purposes of comparison with 2016 results.
| 13 |
RECONCILIATION OF NON-U.S. GAAP MEASURE
(Dollars in Thousands, Except Per Share Data)
| Year Ended Dec. 31, 2017 | Year Ended Dec. 31, 2016 | |||||||||||||||
| Diluted | Diluted | |||||||||||||||
| Earnings per | Earnings per | |||||||||||||||
| Earnings | Share | Earnings | Share | |||||||||||||
| Net Income | $ | 13,434 | $ | 1.10 | $ | 15,762 | $ | 1.30 | ||||||||
| Additional Income Tax Provision Resulting from Change in Tax Rate | 2,159 | 0 | ||||||||||||||
| Net Income, Excluding Effect of Change in Tax Rate | $ | 15,593 | $ | 1.28 | $ | 15,762 | $ | 1.30 | ||||||||
The effective tax rate (income tax provision as a percentage of income before tax) for the year ended December 31, 2017 was 34.75% as compared to 25.33% for 2016. The higher effective tax rate for 2017 resulted mainly from the additional tax provision related to the change in the tax rate. Management estimates the effective tax rate for 2018 to be approximately 15%, reflecting the benefit of a lower corporate rate.
In addition to the income tax provision fluctuation discussed above, significant highlights related to earnings in 2017 as compared to 2016 are as follows:
| · | Net interest income was $1,543,000 (3.8%) higher in 2017 as compared to 2016. The net interest margin was 3.82% for 2017, up from 3.76% for 2016. Average total loans outstanding were up $57.6 million (8.0%) in 2017 as compared to 2016, while average total available-for-sale securities were lower by $33.2 million. Average total deposits were $20.5 million (2.1%) higher in 2017 as compared to 2016. |
| · | The provision for loan losses was $801,000 in 2017, which was $420,000 lower than the amount in 2016. In 2017, the provision included $1,023,000 related to the change in total specific allowances on impaired loans, as adjusted for net charge-offs during the period and a $101,000 increase in the unallocated portion of the allowance, with a reduction in the provision of $323,000 related to the reduction in the collectively determined allowance for loan losses. The reduction in the collectively determined allowance included the effects of an improvement in the Corporation’s aggregate net charge-off experience and a reduction in the qualitative factors used to estimate the allowance as of December 31, 2017, partially offset by the effects of loan growth. The net increase in specific allowances in 2017 included an increase in the allowance related to one real estate secured commercial loan of $391,000 to $919,000 at December 31, 2017 as compared to $528,000 at December 31, 2016. The increase in the specific allowance for this loan was based on an updated appraisal. In comparison, the provision of $1,221,000 for 2016 included $491,000 related to the change in total specific allowances on impaired loans, as adjusted for net charge-offs during the period, a $29,000 decrease in the unallocated portion of the allowance and an increase in the provision of $759,000 related to an increase in the collectively determined allowance for loan losses. The increase in the collectively determined portion of the allowance at December 31, 2016 as compared to the end of the preceding year resulted from loan growth and slight increases in the net charge-off and qualitative factors used to estimate the allowance. |
| · | Noninterest revenue increased $642,000 (4.1%) in 2017 as compared to 2016. Trust and financial management revenue increased $639,000 (13.4%), reflecting growth in assets under management resulting from market appreciation and new business, as well as a recent increase in fee levels and an estimated $215,000 of additional revenue from changing the frequency of billings to monthly for certain services. Interchange revenue from debit card transactions increased $278,000 (14.3%), reflecting improvements in card-related volumes and processing. Loan servicing fees, net, increased $141,000, as the fair value of mortgage servicing rights decreased by $168,000 in 2017 as compared to a reduction of $282,000 in 2016. Net gains from sales of loans decreased $211,000 (20.5%) due to a lower volume of sales. Service charges on deposit accounts decreased $207,000 (4.4%), as revenue from consumer overdrafts declined due to lower volume. |
| 14 |
| · | Net gains on available-for-sale securities totaled $257,000 in 2017, a reduction of $901,000 from $1,158,000 in 2016. In 2016, gains from sales of bank stocks totaled $1,125,000, as the Corporation completed its program of bank stock sales that had begun in 2015. The Corporation had no remaining investments in bank stocks throughout 2017. |
| · | Total noninterest expenses increased $2,223,000 (6.4%) in 2017 as compared to 2016. Other operating expense increased $808,000. Within other operating expense, the largest variances included increases of $208,000 in loan collection expenses, $149,000 in accounting and auditing expense stemming from increased internal audit outsourcing and $130,000 in attorney fees (mainly related to a commercial loan workout situation). Employee benefits expense increased $657,000, including an increase of $594,000 from higher health care expenses on the Corporation’s partially self-insured plan. Salaries and wages expense increased $395,000 (2.6%), reflecting the net effects of annual merit-based salary increases, an increase to an average of 292 FTEs in 2017 from 287 in 2016 and a net decrease in officers’ incentive compensation from corporate plans of $166,000. |
2016 vs. 2015
Net income per share – diluted for 2016 was 3.7% lower than in 2015. Some of the more significant highlights related to annual earnings in 2016 as compared to 2015 are as follows:
| · | Net interest income was $488,000 (1.2%) higher than the comparable total for 2015. The net interest margin was 3.76%, which was 0.07% higher than the margin for 2015, reflecting the benefits of a lower cost of borrowed funds and a more favorable mix of earning assets. The average balance of total borrowed funds was $62,516,000 at an average interest rate of 2.57% in 2016, down from average borrowings of $77,642,000 at an average interest rate of 3.45% in 2015. Average total loans outstanding were higher by $65.3 million (9.9%) in 2016 as compared to 2015, while average total available-for-sale securities were lower by $74.2 million. Average total deposits increased $2.2 million (0.2%). |
| · | The provision for loan losses was $1,221,000 in 2016, an increase of $376,000 over 2015. In 2016, the provision included the impact of increasing the allowance for loan losses for the effects of loan growth and slight increases in net charge-off experience and qualitative factors used in determining the collectively evaluated portion of the allowance. In comparison, in 2015 the provision also reflected the effects of loan growth, but the qualitative factors used in determining a portion of the collectively determined allowance decreased slightly during the period. Also in 2016, the provision included an increase of $148,000 as compared to 2015 from changes in specific allowances on loans individually identified as impaired, adjusted for the impact of net charge-offs. |
| · | Total noninterest revenue for 2016 increased $33,000 (0.2%) over 2015. Net gains from sales of loans increased $294,000 (40.0%), reflecting higher volume of sales, and Trust and Financial Management revenue increased $134,000 (2.9%). Other operating income increased $28,000 (2.2%), including an increase of $148,000 from redemptions of tax credits and increases in lending-related fees of $80,000, while this category included a gain of $212,000 from a split-dollar life insurance policy in 2015. Service charges on deposit accounts decreased $169,000 (3.5%) in 2016, reflecting a reduction in consumer overdraft volume. Loan servicing fees, net, decreased $113,000 in 2016 as compared to 2015, including a decrease in the fair value of mortgage servicing rights of $282,000 in 2016, which was a larger decrease by $120,000 as compared to 2015. Brokerage revenue decreased $83,000 (9.9%), as the volume of sales of annuities declined. |
| · | In 2016, realized gains from securities totaled $1,158,000, including gains from sales of bank stocks of $1,125,000. In 2015, the Corporation generated gains from sales of securities totaling $2,861,000, including gains from sales of bank stocks of $2,220,000, and also incurred losses of $2,573,000 from prepayments of a borrowing in the second and fourth quarters totaling $34 million. In the fourth quarter 2016, the Corporation completed its program of bank stock sales that had begun in 2015, and had no remaining investments in bank stocks at December 31, 2016. |
| · | Noninterest expenses, excluding losses on prepayment of borrowings, in 2016 exceeded the amount for 2015 by $1,714,000 (5.2%). Salaries and wages expense increased $729,000 (5.0%). Several new positions were established in the latter portion of 2015 and early 2016, including new positions established for lending, lending support, information technology, training, human resources and marketing functions. Professional fees expense increased $488,000, including increases related to employee sales and service training, information technology and marketing. Other operating expense increased $399,000 (7.8%), including increases in other real estate expenses of $123,000, donations and public relations-related expenses of $94,000 and education and training-related expenses of $60,000. Also, other operating expense was reduced in 2015 by $69,000 as a result of a recovery of sales tax previously paid. |
| 15 |
| · | The provision for income tax totaled $5,347,000 in 2016, or an effective tax rate of 25.3% of pre-tax income. In comparison, the provision for income tax of $5,337,000 in 2015 represented a 24.5% effective rate. The higher effective tax rate in 2016 included the impact of a $300,000 reduction in tax-exempt interest income and an increase in the provision for state income tax of $64,000 that resulted mainly from a catch-up adjustment to increase New York State taxes for the effect of changes in the tax methodology that first became effective in 2015. |
More detailed information concerning fluctuations in the Corporation’s earnings results are provided in other sections of Management’s Discussion and Analysis.
CRITICAL ACCOUNTING POLICIES
The presentation of financial statements in conformity with U.S. generally accepted accounting principles requires management to make estimates and assumptions that affect many of the reported amounts and disclosures. Actual results could differ from these estimates.
A material estimate that is particularly susceptible to significant change is the determination of the allowance for loan losses. The Corporation maintains an allowance for loan losses that represents management’s estimate of the losses inherent in the loan portfolio as of the balance sheet date and recorded as a reduction of the investment in loans. Management believes the allowance for loan losses is adequate and reasonable. Notes 1 and 8 to the consolidated financial statements provide an overview of the process management uses for evaluating and determining the allowance for loan losses, and additional discussion of the allowance for loan losses is provided in a separate section later in Management’s Discussion and Analysis. Given the very subjective nature of identifying and valuing loan losses, it is likely that well-informed individuals could make materially different assumptions, and could, therefore calculate a materially different allowance value. While management uses available information to recognize losses on loans, changes in economic conditions may necessitate revisions in future years. In addition, various regulatory agencies, as an integral part of their examination process, periodically review the Corporation’s allowance for loan losses. Such agencies may require the Corporation to recognize adjustments to the allowance based on their judgments of information available to them at the time of their examination.
Another material estimate is the calculation of fair values of the Corporation’s debt securities. For most of the Corporation’s debt securities, the Corporation receives estimated fair values of debt securities from an independent valuation service, or from brokers. In developing fair values, the valuation service and the brokers use estimates of cash flows, based on historical performance of similar instruments in similar interest rate environments. Based on experience, management is aware that estimated fair values of debt securities tend to vary among brokers and other valuation services.
As described in Note 7 to the consolidated financial statements, management evaluates securities for other-than-temporary impairment (“OTTI”). In making that evaluation, consideration is given to (1) the length of time and the extent to which the fair value has been less than cost, (2) the financial condition and near-term prospects of the issuer, and (3) whether the Corporation intends to sell the security or more likely than not will be required to sell the security before its anticipated recovery. Management’s assessments of the likelihood and potential for recovery in value of securities are subjective and based on sensitive assumptions.
NET INTEREST INCOME
The Corporation’s primary source of operating income is net interest income, which is equal to the difference between the amounts of interest income and interest expense. Tables I, II and III include information regarding the Corporation’s net interest income in 2017, 2016, and 2015. In each of these tables, the amounts of interest income earned on tax-exempt securities and loans have been adjusted to a fully taxable-equivalent basis. Accordingly, the net interest income amounts reflected in these tables exceed the amounts presented in the consolidated financial statements. The discussion that follows is based on amounts in the tables.
The calculations of fully taxable-equivalent yields on tax-exempt loans and securities in Tables I, II and III reflect inherent tax benefit based on the Corporation’s marginal federal income tax rate of 35% for all periods presented. In 2018, the tax benefit from tax-exempt loans and securities will be reduced as a result of the change to a 21% federal income tax rate. The overall yield on tax-exempt assets, however, in 2018 and future periods will depend on market conditions for new assets originated or purchased and the pace of principal repayments on assets held as of December 31, 2017.
| 16 |
2017 vs. 2016
Fully taxable equivalent net interest income was $44,708,000 in 2017, $1,551,000 (3.6%) higher than in 2016. Interest income was $1,773,000 higher in 2017 as compared to 2016; interest expense was also higher by $222,000 in comparing the same periods. As presented in Table II, the Net Interest Margin was 3.82% in 2017 as compared to 3.76% in 2016, and the “Interest Rate Spread” (excess of average rate of return on earning assets over average cost of funds on interest-bearing liabilities) increased to 3.68% in 2017 from 3.63% in 2016.
INTEREST INCOME AND EARNING ASSETS
Interest income totaled $48,623,000 in 2017, an increase of 3.8% from 2016. Although the average yield on loans fell, the overall yield on earning assets increased to 4.16% in 2017 from 4.08% in 2016 due to a change in mix of earning assets, as loans increased while available-for-sale securities decreased. Interest and fees on loans receivable increased $2,466,000, or 6.9%, while interest on available-for-sale securities decreased $765,000, or 6.9%. The average balance of gross loans receivable increased 8.0% to $780,640,000 in 2017 from $723,076,000 in 2016. The Corporation experienced significant growth in both residential mortgages and commercial loans. The Corporation’s average rate of return on loans receivable declined to 4.87% in 2017 from 4.92% in 2016 as average interest rates on new loans have been lower than the average rates on loans that have been fully or partially paid off.
As indicated in Table II, average available-for-sale securities (at amortized cost) totaled $371,825,000 in 2017, a decrease of $33,154,000 (8.2%) from 2016. Funds generated from the net decrease in the Corporation’s available-for-sale securities portfolio were used, in part, to fund the loan growth described above. The average rate of return on available-for-sale securities was 2.79% in 2017, up from 2.75% in 2016.
The average balance of interest-bearing due from banks decreased to $16,634,000 in 2017 from $19,022,000 in 2016, while the average yield increased to 1.14% in 2017 from 0.61% in 2016. This category has consisted primarily of balances held by the Federal Reserve and also includes other overnight deposits and FDIC-insured certificates of deposit issued by other financial institutions.
INTEREST EXPENSE AND INTEREST-BEARING LIABILITIES
Interest expense rose $222,000, or 6.0%, to $3,915,000 in 2017 from $3,693,000 in 2016. Table II shows that the overall cost of funds on interest-bearing liabilities increased to 0.48% in 2017 from 0.45% in 2016.
Total average deposits (interest-bearing and noninterest-bearing) increased 2.1% to $990,917,000 in 2017 from $970,447,000 in 2016. Increases in the average balances of noninterest-bearing demand deposits, savings and interest checking were partially offset by decreases in average balances of money market and Individual Retirement Accounts. The average rate paid on interest-bearing deposits increased to 0.32% in 2017 from 0.28% in 2016. The increase in average rate is mainly due to increases in rates paid on certificates of deposits and interest checking accounts.
Total average borrowed funds decreased $3,097,000 to $59,419,000 in 2017 from $62,516,000 in 2016. The average rate on borrowed funds was 2.54% in 2017, down slightly from 2.57% in 2016. Interest expense on short-term borrowings increased $58,000 in 2017 as compared to 2016, reflecting an increase in average rate to 0.90% in 2017 from 0.65% in 2016. Interest expense on long-term borrowings decreased $154,000, as the overall reduction in average balance of $2,952,000 included the impact of repayments of two higher-cost borrowings that had been originated in 2007. These borrowings included a $10 million FHLB advance with an interest rate of 3.81% that matured in September 2017 and repurchase agreements with a broker dealer totaling $27 million with an interest rate of 3.595% that matured in December 2017.
2016 vs. 2015
Fully taxable equivalent net interest income was $43,157,000 in 2016, $338,000 (0.8%) higher than in 2015. Interest income was $571,000 lower in 2016 as compared to 2015; interest expense was also lower by $909,000 in comparing the same periods. As presented in Table II, the Net Interest Margin was 3.76% in 2016 as compared to 3.69% in 2015, and the “Interest Rate Spread” (excess of average rate of return on earning assets over average cost of funds on interest-bearing liabilities) increased to 3.63% in 2016 from 3.54% in 2015.
| 17 |
INTEREST INCOME AND EARNING ASSETS
Interest income totaled $46,850,000 in 2016, a decrease of 1.2% from 2015. Although yields on securities and loans fell, overall yield on earning assets dropped only 0.01% due to a change in mix of earning assets to increase loans and decrease securities. Interest and fees on loans receivable increased $1,695,000, or 5.0%, while interest on available-for-sale securities decreased $2,300,000, or 17.1%. The average balance of gross loans receivable increased 9.9% to $723,076,000 in 2016 from $657,727,000 in 2015. The Corporation experienced significant growth in both residential and commercial loans. The Corporation’s average rate of return on loans receivable declined to 4.92% in 2016 from 5.15% in 2015.
As indicated in Table II, average available-for-sale securities (at amortized cost) totaled $404,979,000 in 2016, a decrease of $74,169,000 (15.5%) from 2015. Funds generated from the net decrease in the Corporation’s available-for-sale securities portfolio were used, in part, to fund the loan growth described above. The Corporation’s yield on securities was lower in 2016 than in 2015, primarily due to higher-yielding securities maturing as the portfolio size was reduced. The average rate of return on available-for-sale securities was 2.75% in 2016 and 2.81% in 2015.
INTEREST EXPENSE AND INTEREST-BEARING LIABILITIES
Interest expense fell $909,000, or 19.8%, to $3,693,000 in 2016 from $4,602,000 in 2015. Table II shows that the overall cost of funds on interest-bearing liabilities fell to 0.45% in 2016 from 0.55% in 2015.
Total average deposits (interest-bearing and noninterest-bearing) increased slightly (0.2%) to $970,447,000 in 2016 from $968,201,000 in 2015. Decreases in the average balances of certificates of deposit and Individual Retirement Accounts were offset by increases in average balances of interest checking, money market accounts, savings accounts and noninterest-bearing demand deposits. The average rate paid on interest-bearing deposits increased slightly to 0.28% in 2016 from 0.26% in 2015.
Total average borrowed funds decreased $15,126,000 to $62,516,000 in 2016 from $77,642,000 in 2015. The average rate on borrowed funds was 2.57% in 2016 compared to 3.45% in 2015, reflecting a $27,604,000 reduction in the average balance of higher-rate, long-term borrowings resulting from prepayment in the second and fourth quarters of 2015 of a long-term repurchase agreement borrowing with an interest rate of 4.265%. The average balance of short-term borrowings increased $12,478,000 in 2016 over 2015, as average overnight borrowings were higher in 2016 and the Corporation funded the pay-off of the long-term repurchase agreement with a series of short-term advances from the FHLB-Pittsburgh that matured over the course of 2016.
| 18 |
TABLE I - ANALYSIS OF INTEREST INCOME AND EXPENSE
| Years Ended December 31, | Increase/(Decrease) | |||||||||||||||||||
| (In Thousands) | 2017 | 2016 | 2015 | 2017/2016 | 2016/2015 | |||||||||||||||
| INTEREST INCOME | ||||||||||||||||||||
| Available-for-sale securities: | ||||||||||||||||||||
| Taxable | $ | 5,499 | $ | 5,916 | $ | 7,587 | $ | (417 | ) | $ | (1,671 | ) | ||||||||
| Tax-exempt | 4,892 | 5,240 | 5,869 | (348 | ) | (629 | ) | |||||||||||||
| Total available-for-sale securities | 10,391 | 11,156 | 13,456 | (765 | ) | (2,300 | ) | |||||||||||||
| Interest-bearing due from banks | 190 | 116 | 93 | 74 | 23 | |||||||||||||||
| Loans held for sale | 25 | 27 | 16 | (2 | ) | 11 | ||||||||||||||
| Loans receivable: | ||||||||||||||||||||
| Taxable | 34,907 | 32,827 | 31,311 | 2,080 | 1,516 | |||||||||||||||
| Tax-exempt | 3,110 | 2,724 | 2,545 | 386 | 179 | |||||||||||||||
| Total loans receivable | 38,017 | 35,551 | 33,856 | 2,466 | 1,695 | |||||||||||||||
| Total Interest Income | 48,623 | 46,850 | 47,421 | 1,773 | (571 | ) | ||||||||||||||
| INTEREST EXPENSE | ||||||||||||||||||||
| Interest-bearing deposits: | ||||||||||||||||||||
| Interest checking | 474 | 293 | 214 | 181 | 79 | |||||||||||||||
| Money market | 355 | 342 | 299 | 13 | 43 | |||||||||||||||
| Savings | 143 | 133 | 128 | 10 | 5 | |||||||||||||||
| Certificates of deposit | 996 | 882 | 831 | 114 | 51 | |||||||||||||||
| Individual Retirement Accounts | 434 | 434 | 451 | 0 | (17 | ) | ||||||||||||||
| Other time deposits | 1 | 1 | 1 | 0 | 0 | |||||||||||||||
| Total interest-bearing deposits | 2,403 | 2,085 | 1,924 | 318 | 161 | |||||||||||||||
| Borrowed funds: | ||||||||||||||||||||
| Short-term | 213 | 155 | 32 | 58 | 123 | |||||||||||||||
| Long-term | 1,299 | 1,453 | 2,646 | (154 | ) | (1,193 | ) | |||||||||||||
| Total borrowed funds | 1,512 | 1,608 | 2,678 | (96 | ) | (1,070 | ) | |||||||||||||
| Total Interest Expense | 3,915 | 3,693 | 4,602 | 222 | (909 | ) | ||||||||||||||
| Net Interest Income | $ | 44,708 | $ | 43,157 | $ | 42,819 | $ | 1,551 | $ | 338 | ||||||||||
| (1) | Interest income from tax-exempt securities and loans has been adjusted to a fully taxable-equivalent basis, using the Corporation’s marginal federal income tax rate of 35%. |
| (2) | Fees on loans are included with interest on loans and amounted to $883,000 in 2017, $1,000,000 in 2016, and $1,004,000 in 2015. |
| 19 |
TABLE II - ANALYSIS OF AVERAGE DAILY BALANCES AND RATES
| (Dollars in Thousands) | ||||||||||||||||||||||||
| Year | Year | Year | ||||||||||||||||||||||
| Ended | Rate of | Ended | Rate of | Ended | Rate of | |||||||||||||||||||
| 12/31/2017 | Return/ | 12/31/2016 | Return/ | 12/31/2015 | Return/ | |||||||||||||||||||
| Average | Cost of | Average | Cost of | Average | Cost of | |||||||||||||||||||
| Balance | Funds % | Balance | Funds % | Balance | Funds % | |||||||||||||||||||
| EARNING ASSETS | ||||||||||||||||||||||||
| Available-for-sale securities, at amortized cost: | ||||||||||||||||||||||||
| Taxable | $ | 259,079 | 2.12 | % | $ | 293,636 | 2.01 | % | $ | 366,448 | 2.07 | % | ||||||||||||
| Tax-exempt | 112,746 | 4.34 | % | 111,343 | 4.71 | % | 112,700 | 5.21 | % | |||||||||||||||
| Total available-for-sale securities | 371,825 | 2.79 | % | 404,979 | 2.75 | % | 479,148 | 2.81 | % | |||||||||||||||
| Interest-bearing due from banks | 16,634 | 1.14 | % | 19,022 | 0.61 | % | 22,201 | 0.42 | % | |||||||||||||||
| Loans held for sale | 470 | 5.32 | % | 472 | 5.72 | % | 222 | 7.21 | % | |||||||||||||||
| Loans receivable: | ||||||||||||||||||||||||
| Taxable | 711,901 | 4.90 | % | 662,769 | 4.95 | % | 603,771 | 5.19 | % | |||||||||||||||
| Tax-exempt | 68,739 | 4.52 | % | 60,307 | 4.52 | % | 53,956 | 4.72 | % | |||||||||||||||
| Total loans receivable | 780,640 | 4.87 | % | 723,076 | 4.92 | % | 657,727 | 5.15 | % | |||||||||||||||
| Total Earning Assets | 1,169,569 | 4.16 | % | 1,147,549 | 4.08 | % | 1,159,298 | 4.09 | % | |||||||||||||||
| Cash | 17,322 | 16,570 | 16,639 | |||||||||||||||||||||
| Unrealized gain/loss on securities | 88 | 7,166 | 8,871 | |||||||||||||||||||||
| Allowance for loan losses | (8,820 | ) | (8,082 | ) | (7,380 | ) | ||||||||||||||||||
| Bank premises and equipment | 15,541 | 15,413 | 15,911 | |||||||||||||||||||||
| Intangible Assets | 11,957 | 11,966 | 11,983 | |||||||||||||||||||||
| Other assets | 42,102 | 39,284 | 37,887 | |||||||||||||||||||||
| Total Assets | $ | 1,247,759 | $ | 1,229,866 | $ | 1,243,209 | ||||||||||||||||||
| INTEREST-BEARING LIABILITIES | ||||||||||||||||||||||||
| Interest-bearing deposits: | ||||||||||||||||||||||||
| Interest checking | $ | 209,893 | 0.23 | % | $ | 201,357 | 0.15 | % | $ | 195,940 | 0.11 | % | ||||||||||||
| Money market | 191,356 | 0.19 | % | 199,405 | 0.17 | % | 196,585 | 0.15 | % | |||||||||||||||
| Savings | 143,575 | 0.10 | % | 132,679 | 0.10 | % | 128,355 | 0.10 | % | |||||||||||||||
| Certificates of deposit | 117,366 | 0.85 | % | 117,130 | 0.75 | % | 121,803 | 0.68 | % | |||||||||||||||
| Individual Retirement Accounts | 97,519 | 0.45 | % | 103,467 | 0.42 | % | 110,659 | 0.41 | % | |||||||||||||||
| Other time deposits | 1,014 | 0.10 | % | 1,036 | 0.10 | % | 1,031 | 0.10 | % | |||||||||||||||
| Total interest-bearing deposits | 760,723 | 0.32 | % | 755,074 | 0.28 | % | 754,373 | 0.26 | % | |||||||||||||||
| Borrowed funds: | ||||||||||||||||||||||||
| Short-term | 23,761 | 0.90 | % | 23,906 | 0.65 | % | 11,428 | 0.28 | % | |||||||||||||||
| Long-term | 35,658 | 3.64 | % | 38,610 | 3.76 | % | 66,214 | 4.00 | % | |||||||||||||||
| Total borrowed funds | 59,419 | 2.54 | % | 62,516 | 2.57 | % | 77,642 | 3.45 | % | |||||||||||||||
| Total Interest-bearing Liabilities | 820,142 | 0.48 | % | 817,590 | 0.45 | % | 832,015 | 0.55 | % | |||||||||||||||
| Demand deposits | 230,194 | 215,373 | 213,828 | |||||||||||||||||||||
| Other liabilities | 8,465 | 8,530 | 8,461 | |||||||||||||||||||||
| Total Liabilities | 1,058,801 | 1,041,493 | 1,054,304 | |||||||||||||||||||||
| Stockholders’ equity, excluding other comprehensive income/loss | 188,756 | 183,671 | 183,125 | |||||||||||||||||||||
| Other comprehensive income/loss | 202 | 4,702 | 5,780 | |||||||||||||||||||||
| Total Stockholders’ Equity | 188,958 | 188,373 | 188,905 | |||||||||||||||||||||
| Total Liabilities and Stockholders’ Equity | $ | 1,247,759 | $ | 1,229,866 | $ | 1,243,209 | ||||||||||||||||||
| Interest Rate Spread | 3.68 | % | 3.63 | % | 3.54 | % | ||||||||||||||||||
| Net Interest Income/Earning Assets | 3.82 | % | 3.76 | % | 3.69 | % | ||||||||||||||||||
| Total Deposits (Interest-bearing and Demand) | $ | 990,917 | $ | 970,447 | $ | 968,201 | ||||||||||||||||||
| (1) | Rates of return on tax-exempt securities and loans are presented on a fully taxable-equivalent basis, using the Corporation’s marginal federal income tax rate of 35%. |
| (2) | Nonaccrual loans have been included with loans for the purpose of analyzing net interest earnings. |
| 20 |
TABLE III - ANALYSIS OF VOLUME AND RATE CHANGES
| (In Thousands) | Year Ended 12/31/17 vs. 12/31/16 | Year Ended 12/31/16 vs. 12/31/15 | ||||||||||||||||||||||
| Change in | Change in | Total | Change in | Change in | Total | |||||||||||||||||||
| Volume | Rate | Change | Volume | Rate | Change | |||||||||||||||||||
| EARNING ASSETS | ||||||||||||||||||||||||
| Available-for-sale securities: | ||||||||||||||||||||||||
| Taxable | $ | (721 | ) | $ | 304 | $ | (417 | ) | $ | (1,472 | ) | $ | (199 | ) | $ | (1,671 | ) | |||||||
| Tax-exempt | 65 | (413 | ) | (348 | ) | (70 | ) | (559 | ) | (629 | ) | |||||||||||||
| Total available-for-sale securities | (656 | ) | (109 | ) | (765 | ) | (1,542 | ) | (758 | ) | (2,300 | ) | ||||||||||||
| Interest-bearing due from banks | (17 | ) | 91 | 74 | (14 | ) | 37 | 23 | ||||||||||||||||
| Loans held for sale | 0 | (2 | ) | (2 | ) | 15 | (4 | ) | 11 | |||||||||||||||
| Loans receivable: | ||||||||||||||||||||||||
| Taxable | 2,412 | (332 | ) | 2,080 | 2,965 | (1,449 | ) | 1,516 | ||||||||||||||||
| Tax-exempt | 381 | 5 | 386 | 290 | (111 | ) | 179 | |||||||||||||||||
| Total loans receivable | 2,793 | (327 | ) | 2,466 | 3,255 | (1,560 | ) | 1,695 | ||||||||||||||||
| Total Interest Income | 2,120 | (347 | ) | 1,773 | 1,714 | (2,285 | ) | (571 | ) | |||||||||||||||
| INTEREST-BEARING LIABILITIES | ||||||||||||||||||||||||
| Interest-bearing deposits: | ||||||||||||||||||||||||
| Interest checking | 12 | 169 | 181 | 6 | 73 | 79 | ||||||||||||||||||
| Money market | (14 | ) | 27 | 13 | 4 | 39 | 43 | |||||||||||||||||
| Savings | 11 | (1 | ) | 10 | 4 | 1 | 5 | |||||||||||||||||
| Certificates of deposit | 2 | 112 | 114 | (33 | ) | 84 | 51 | |||||||||||||||||
| Individual Retirement Accounts | (25 | ) | 25 | 0 | (30 | ) | 13 | (17 | ) | |||||||||||||||
| Other time deposits | 0 | 0 | 0 | 0 | 0 | 0 | ||||||||||||||||||
| Total interest-bearing deposits | (14 | ) | 332 | 318 | (49 | ) | 210 | 161 | ||||||||||||||||
| Borrowed funds: | ||||||||||||||||||||||||
| Short-term | (1 | ) | 59 | 58 | 56 | 67 | 123 | |||||||||||||||||
| Long-term | (109 | ) | (45 | ) | (154 | ) | (1,047 | ) | (146 | ) | (1,193 | ) | ||||||||||||
| Total borrowed funds | (110 | ) | 14 | (96 | ) | (991 | ) | (79 | ) | (1,070 | ) | |||||||||||||
| Total Interest Expense | (124 | ) | 346 | 222 | (1,040 | ) | 131 | (909 | ) | |||||||||||||||
| Net Interest Income | $ | 2,244 | $ | (693 | ) | $ | 1,551 | $ | 2,754 | $ | (2,416 | ) | $ | 338 | ||||||||||
| (1) | Changes in income on tax-exempt securities and loans are presented on a fully taxable-equivalent basis, using the Corporation’s marginal federal income tax rate of 35%. |
| (2) | The change in interest due to both volume and rates has been allocated to volume and rate changes in proportion to the relationship of the absolute dollar amounts of the change in each. |
| 21 |
NONINTEREST INCOME
Years Ended December 31, 2017, 2016 and 2015
The table below presents a comparison of noninterest income and excludes realized gains on available-for-sale securities, which are discussed in the “Earnings Overview” section of Management’s Discussion and Analysis.
TABLE IV - COMPARISON OF NONINTEREST INCOME
(Dollars In Thousands)
| Years Ended | ||||||||||||||||
| December 31, | $ | % | ||||||||||||||
| 2017 | 2016 | Change | Change | |||||||||||||
| Service charges on deposit accounts | $ | 4,488 | $ | 4,695 | $ | (207 | ) | (4.4 | ) | |||||||
| Service charges and fees | 417 | 439 | (22 | ) | (5.0 | ) | ||||||||||
| Trust and financial management revenue | 5,399 | 4,760 | 639 | 13.4 | ||||||||||||
| Brokerage revenue | 797 | 756 | 41 | 5.4 | ||||||||||||
| Insurance commissions, fees and premiums | 115 | 102 | 13 | 12.7 | ||||||||||||
| Interchange revenue from debit card transactions | 2,221 | 1,943 | 278 | 14.3 | ||||||||||||
| Net gains from sales of loans | 818 | 1,029 | (211 | ) | (20.5 | ) | ||||||||||
| Loan servicing fees, net | 244 | 103 | 141 | 136.9 | ||||||||||||
| Increase in cash surrender value of life insurance | 379 | 382 | (3 | ) | (0.8 | ) | ||||||||||
| Other operating income | 1,275 | 1,302 | (27 | ) | (2.1 | ) | ||||||||||
| Total noninterest income before realized gains on available-for-sale securities, net | $ | 16,153 | $ | 15,511 | $ | 642 | 4.1 | |||||||||
| Years Ended | ||||||||||||||||
| December 31, | $ | % | ||||||||||||||
| 2016 | 2015 | Change | Change | |||||||||||||
| Service charges on deposit accounts | $ | 4,695 | $ | 4,864 | $ | (169 | ) | (3.5 | ) | |||||||
| Service charges and fees | 439 | 494 | (55 | ) | (11.1 | ) | ||||||||||
| Trust and financial management revenue | 4,760 | 4,626 | 134 | 2.9 | ||||||||||||
| Brokerage revenue | 756 | 839 | (83 | ) | (9.9 | ) | ||||||||||
| Insurance commissions, fees and premiums | 102 | 109 | (7 | ) | (6.4 | ) | ||||||||||
| Interchange revenue from debit card transactions | 1,943 | 1,935 | 8 | 0.4 | ||||||||||||
| Net gains from sales of loans | 1,029 | 735 | 294 | 40.0 | ||||||||||||
| Loan servicing fees, net | 103 | 216 | (113 | ) | (52.3 | ) | ||||||||||
| Increase in cash surrender value of life insurance | 382 | 386 | (4 | ) | (1.0 | ) | ||||||||||
| Other operating income | 1,302 | 1,274 | 28 | 2.2 | ||||||||||||
| Total noninterest income before realized gains on available-for-sale securities, net | $ | 15,511 | $ | 15,478 | $ | 33 | 0.2 | |||||||||
Total noninterest income, excluding realized gains on available-for-sale securities, increased $642,000 in 2017 compared to 2016. In 2016, total noninterest income increased $33,000 from 2015. Changes of significance are discussed in the narrative that follows.
2017 vs. 2016
Trust and financial management revenue increased $639,000 (13.4%), reflecting growth in assets under management resulting from market appreciation and new business, as well as an increase in fee levels and an estimated $215,000 of additional revenue from changing the frequency of billings to monthly for certain services.
Interchange revenue from debit card transactions increased $278,000 (14.3%), reflecting improvements in card-related volumes and processing.
Loan servicing fees, net, increased $141,000. This category includes fees received from servicing residential mortgage loans that have been originated and sold, adjusted for the change in the fair value of servicing rights. The fair value of mortgage servicing rights decreased by $168,000 in 2017 as compared to a reduction of $282,000 in 2016.
| 22 |
Net gains from sales of loans decreased $211,000 (20.5%) due to a lower volume of residential mortgage sales.
Service charges on deposit accounts decreased $207,000 (4.4%). Revenue from consumer overdrafts declined $133,000 due to lower volume. Also, fees on noninterest-bearing, business-related checking accounts decreased $53,000 as the earnings crediting rate used to offset the cost of services increased over the year, consistent with increases in the Fed Funds rate.
2016 vs. 2015
Net gains from sales of loans increased $294,000 (40.0%), reflecting higher volume of sales. The increase in volume in 2016 included the impact of employing one additional mortgage lender in a dedicated, full-time capacity throughout most of 2016 as compared to 2015.
Trust and Financial Management revenue increased $134,000 (2.9%). The increase in Trust revenue in 2016 reflected, in part, the effect of higher value of U.S. equity markets in the latter portion of the year.
Service charges on deposit accounts decreased $169,000 (3.5%) in 2016, including a $131,000 reduction in consumer overdraft fees due to a lower volume of overdrafts.
Loan servicing fees, net, decreased $113,000 in 2016. The fair value of mortgage servicing rights decreased $282,000 in 2016, as their valuation was negatively impacted by a reduction in demand by banks for purchasing servicing rights resulting from regulatory changes that have generally increased their risk-based capital weighting. In comparison, the fair value of mortgage servicing rights decreased $162,000 in 2015.
Brokerage revenue decreased $83,000 (9.9%), as the volume of sales of annuities declined.
NONINTEREST EXPENSE
Years Ended December 31, 2017, 2016 and 2015
Total noninterest expenses increased $2,223,000 (6.4%) in 2017 as compared to 2016. Total noninterest expense decreased $859,000, or 2.4%, in 2016 as compared to 2015; however, excluding losses from prepayment of borrowings in 2015, noninterest expense was $1,714,000 (5.2%) higher in 2016 as compared to 2015. In 2015, the Corporation incurred losses totaling $2,573,000 from prepayment of borrowings (repurchase agreements). There were no losses from prepayment of borrowings incurred in 2017 or 2016. Changes of significance (other than the previously discussed losses on prepayment of debt) are discussed in the narrative that follows.
TABLE V - COMPARISON OF NONINTEREST EXPENSE
(Dollars In Thousands)
| Years Ended | ||||||||||||||||
| December 31, | $ | % | ||||||||||||||
| 2017 | 2016 | Change | Change | |||||||||||||
| Salaries and wages | $ | 15,806 | $ | 15,411 | $ | 395 | 2.6 | |||||||||
| Pensions and other employee benefits | 5,374 | 4,717 | 657 | 13.9 | ||||||||||||
| Occupancy expense, net | 2,340 | 2,340 | 0 | 0.0 | ||||||||||||
| Furniture and equipment expense | 1,834 | 1,730 | 104 | 6.0 | ||||||||||||
| FDIC Assessments | 376 | 488 | (112 | ) | (23.0 | ) | ||||||||||
| Pennsylvania shares tax | 1,329 | 1,274 | 55 | 4.3 | ||||||||||||
| Professional fees | 1,086 | 1,126 | (40 | ) | (3.6 | ) | ||||||||||
| Automated teller machine and interchange expense | 1,284 | 1,137 | 147 | 12.9 | ||||||||||||
| Software subscriptions | 1,190 | 981 | 209 | 21.3 | ||||||||||||
| Other operating expense | 6,348 | 5,540 | 808 | 14.6 | ||||||||||||
| Total Other Expense | $ | 36,967 | $ | 34,744 | $ | 2,223 | 6.4 | |||||||||
| 23 |
| Years Ended | ||||||||||||||||
| December 31, | $ | % | ||||||||||||||
| 2016 | 2015 | Change | Change | |||||||||||||
| Salaries and wages | $ | 15,411 | $ | 14,682 | $ | 729 | 5.0 | |||||||||
| Pensions and other employee benefits | 4,717 | 4,420 | 297 | 6.7 | ||||||||||||
| Occupancy expense, net | 2,340 | 2,574 | (234 | ) | (9.1 | ) | ||||||||||
| Furniture and equipment expense | 1,730 | 1,860 | (130 | ) | (7.0 | ) | ||||||||||
| FDIC Assessments | 488 | 603 | (115 | ) | (19.1 | ) | ||||||||||
| Pennsylvania shares tax | 1,274 | 1,248 | 26 | 2.1 | ||||||||||||
| Professional fees | 1,126 | 638 | 488 | 76.5 | ||||||||||||
| Automated teller machine and interchange expense | 1,137 | 988 | 149 | 15.1 | ||||||||||||
| Software subscriptions | 981 | 876 | 105 | 12.0 | ||||||||||||
| Loss on prepayment of borrowings | 0 | 2,573 | (2,573 | ) | (100.0 | ) | ||||||||||
| Other operating expense | 5,540 | 5,141 | 399 | 7.8 | ||||||||||||
| Total Other Expense | $ | 34,744 | $ | 35,603 | $ | (859 | ) | (2.4 | ) | |||||||
2017 vs 2016
Other operating expense increased $808,000. Within other operating expense, the largest variances included increases of $208,000 in loan collection expenses, $149,000 in accounting and auditing expense stemming from increased internal audit outsourcing and $130,000 in attorney fees (mainly related to a commercial loan workout situation). The increased loan collection expenses in 2017 included payments of delinquent property taxes associated with mortgage loans on properties located in New York State and $32,000 for the Corporation’s share of collection expenses on a Multi-family residential participation loan that has been classified as impaired at December 31, 2017 and 2016.
Employee benefits expense increased $657,000, including an increase of $594,000 from higher health care expenses from the Corporation’s partially self-insured plan. The Corporation is self-insured for health insurance, up to a cap for catastrophic levels of losses, which are insured by a third party.
Salaries and wages expense increased $395,000 (2.6%), reflecting the net effects of annual merit-based salary increases, an increase to an average of 292 FTEs in 2017 from 287 in 2016 and a net decrease in officers’ incentive compensation from corporate plans of $166,000.
Software subscriptions increased $209,000, including costs associated with new applications as well as annual licensing increases.
Automated teller machine and interchange expense increased $147,000, including increases in volume-related costs and fraud monitoring costs.
Furniture and equipment expenses in 2017 increased $104,000 primarily as a result of higher depreciation and repair costs.
FDIC insurance decreased $112,000 in 2017 reflecting lower assessment levels beginning in the third quarter of 2016.
2016 vs 2015
Salaries and wages expense increased $729,000 (5.0%), reflecting an increase in number of employees. The average number of full-time equivalent employees was 287 in 2016, up from 281 in 2015, including new positions established for lending, lending support, information technology, training and marketing functions.
Pension and other employee benefits expense increased $297,000 (6.7%). The increase resulted mainly from an increase of $214,000 in healthcare expense as a result of increased healthcare claims. Payroll taxes and other expenses within this category increased in 2016, as well, due to the increase in number of employees described above.
Professional fees expense increased $488,000, including increases related to employee sales and service training, information technology and marketing.
| 24 |
Automated teller machine and interchange expense increased $149,000, including the costs of purchasing new debit cards with EMV functionality.
Software subscriptions increased $105,000 as a result of enhancements and new applications initiated in 2015 and continuing into 2016 including costs associated with the network operating system, automated document signatures and marketing-related functionality.
Other operating expense increased $399,000 (7.8%), including increases in other real estate expenses of $123,000, donations and public relations-related expenses of $94,000 and education and training-related expenses of $60,000. Also, other operating expense was reduced in 2015 by $69,000 as a result of a recovery of sales tax previously paid.
Occupancy expenses in 2016 were $234,000 under 2015 primarily as a result of lower depreciation costs as well as lower winter-related expenses such as snow removal and fuel costs.
Furniture and equipment expenses in 2016 were $130,000 under 2015 primarily as a result lower depreciation costs.
FDIC insurance decreased $115,000 in 2016 reflecting lower assessment levels beginning in the third quarter of 2016.
INCOME TAXES
The effective income tax rate was 34.8% of pre-tax income in 2017, up from 25.3% in 2016 and 24.5% in 2015. The Corporation’s effective tax rates differed from the statutory rate of 35% in 2016 and 2015 principally because of the effects of tax-exempt interest income. In 2017, the Corporation realized an increase in the income tax provision (expense) due to the write-down of the net deferred tax asset as a result of the recently enacted Tax Cuts and Jobs Act of 2017 that, among other things, lowered the federal corporate income tax rate to 21% effective January 1, 2018, from the 35% marginal tax rate in effect for prior periods. Excluding the effect of the write-down of the deferred tax asset resulting from the change in the federal corporate income tax rate, the effective income tax rate for the year ended December 31, 2017 would have been 24.3%. Further, management estimates that had the recently enacted 21% federal tax rate been in effect throughout 2017 and 2016, the effective federal tax rate would have been 14.5% in 2017 and 15% in 2016. Management estimates the effective tax rate for 2018 will be approximately 15%. In developing these estimates, no adjustments have been made to 2017 and 2016 historical data for reinvestment of additional funds or for any changes to the composition of the Corporation’s assets and liabilities.
The Corporation recognizes deferred tax assets and liabilities based on differences between the financial statement carrying amounts and the tax basis of assets and liabilities. At December 31, 2017, the net deferred tax asset was $3,289,000, a decrease from the balance at December 31, 2016 of $5,117,000. The primary reason for the decrease was the write-down of the deferred tax asset based on the decrease in the federal tax rate as described above. The total amount of the write-down of the net deferred tax asset was $2,159,000, including $325,000 associated with items included in Accumulated Other Comprehensive Loss in the consolidated balance sheet.
The Corporation regularly reviews deferred tax assets for recoverability based on history of earnings, expectations for future earnings and expected timing of reversals of temporary differences. Realization of deferred tax assets ultimately depends on the existence of sufficient taxable income, including taxable income in prior carryback years, as well as future taxable income. Further, the value of the benefit from realization of deferred tax assets would be impacted if income tax rates were changed from currently enacted levels.
Management believes the recorded net deferred tax asset at December 31, 2017 is fully realizable; however, if management determines the Corporation will be unable to realize all or part of the net deferred tax asset, the Corporation would adjust the deferred tax asset, which would negatively impact earnings.
Additional information related to income taxes is presented in Note 14 to the consolidated financial statements.
SECURITIES
Table VI shows the composition of the investment portfolio at December 31, 2017, 2016 and 2015. Comparison of the amortized cost totals of available-for-sale securities at each year-end presented reflects a decrease of $19,917,000 to $396,538,000 at December 31, 2016 from December 31, 2015. This change was followed by a decrease of $37,221,000 to $359,317,000 at December 31, 2017. The continued decrease in securities in 2017 reflects the use of cash generated from the investment portfolio to help fund the increase in loans outstanding. The Corporation’s holdings of mortgage-backed securities issued or guaranteed by U.S. Government agencies or sponsored agencies have decreased to $221,187,000 at December 31, 2017 from $237,654,000 at December 31, 2016 and $266,372,000 at December 31, 2015. Within that overall category, in 2017, the Corporation had some commercial mortgage-backed securities for which the underlying collateral consists of multi-family properties. The total amortized cost of commercial mortgage-backed securities held at December 31, 2017 was $33,881,000.
| 25 |
As reflected in Table VI, the fair value of available-for-sale securities as of December 31, 2017 was $2,409,000, or 0.67%, less than the total amortized cost basis. In comparison, the aggregate unrealized loss position at December 31, 2016 was $1,461,000, or 0.37% of the total amortized cost basis. . Modest increases in intermediate-term and long-term interest rates over the course of 2016 and 2017, as well as market expectations of further rate increases, have contributed to the decrease in fair values of debt securities. Also, the fair values of tax-exempt municipal bonds have been negatively impacted by the reduced benefit of their tax-exempt nature as a result of the reduction in the federal corporate income tax rate. At December 31, 2015, the aggregate unrealized gain position was $3,835,000, or 0.92% of total amortized cost, including an unrealized gain of $706,000 on marketable equity securities (bank stocks). The Corporation liquidated its investments in bank stocks in 2015 and 2016, and held no investments in bank stocks in 2017. The Corporation reported net realized gains from sales of available-for-sale securities of $257,000 in 2017. In comparison, net realized gains from sales of available-for-sale securities totaled $1,158,000 in 2016 and $2,861,000 in 2015, including realized gains from sales of bank stocks of $1,125,000 in 2016 and $2,220,000 in 2015.
Management has reviewed the Corporation’s holdings as of December 31, 2017 and concluded that unrealized losses on all of the securities in an unrealized loss position are considered temporary. Notes 6 and 7 to the consolidated financial statements provide more detail concerning the Corporation’s processes for evaluating securities for other-than-temporary impairment. Management will continue to closely monitor the status of impaired securities in 2018.
TABLE VI - INVESTMENT SECURITIES
| As of December 31, | ||||||||||||||||||||||||
| 2017 | 2016 | 2015 | ||||||||||||||||||||||
| Amortized | Fair | Amortized | Fair | Amortized | Fair | |||||||||||||||||||
| (In Thousands) | Cost | Value | Cost | Value | Cost | Value | ||||||||||||||||||
| AVAILABLE-FOR-SALE SECURITIES: | ||||||||||||||||||||||||
| Obligations of U.S. Government agencies | $ | 8,026 | $ | 7,873 | $ | 9,671 | $ | 9,541 | $ | 10,663 | $ | 10,483 | ||||||||||||
| Obligations of states and political subdivisions: | ||||||||||||||||||||||||
| Tax-exempt | 103,673 | 105,111 | 118,140 | 119,037 | 103,414 | 107,757 | ||||||||||||||||||
| Taxable | 25,431 | 25,573 | 30,073 | 30,297 | 34,317 | 34,597 | ||||||||||||||||||
| Mortgage-backed securities issued or guaranteed by U.S. Government agencies or sponsored agencies: | ||||||||||||||||||||||||
| Residential pass-through securities | 52,992 | 52,347 | 58,922 | 58,404 | 73,227 | 73,343 | ||||||||||||||||||
| Residential collateralized mortgage obligations | 134,314 | 131,814 | 147,915 | 146,608 | 193,145 | 191,715 | ||||||||||||||||||
| Commercial mortgage-backed securities | 33,881 | 33,219 | 30,817 | 30,219 | 0 | 0 | ||||||||||||||||||
| Other collateralized debt obligations | 0 | 0 | 0 | 0 | 9 | 9 | ||||||||||||||||||
| Total debt securities | 358,317 | 355,937 | 395,538 | 394,106 | 414,775 | 417,904 | ||||||||||||||||||
| Marketable equity securities | 1,000 | 971 | 1,000 | 971 | 1,680 | 2,386 | ||||||||||||||||||
| Total | $ | 359,317 | $ | 356,908 | $ | 396,538 | $ | 395,077 | $ | 416,455 | $ | 420,290 | ||||||||||||
| 26 |
The following table presents the contractual maturities and the weighted-average yields (calculated based on amortized cost) of investment securities as of December 31, 2017. Yields on tax-exempt securities are presented on a nominal basis, that is, the yields are not presented on a fully taxable-equivalent basis. Actual maturities may differ from contractual maturities because counterparties may have the right to call or prepay obligations with or without call or prepayment penalties.
| (In Thousands, Except for Percentages) | Within | One- | Five- | After | ||||||||||||||||||||||||||||||||||||
| One | Five | Ten | Ten | |||||||||||||||||||||||||||||||||||||
| Year | Yield | Years | Yield | Years | Yield | Years | Yield | Total | Yield | |||||||||||||||||||||||||||||||
| AVAILABLE-FOR-SALE SECURITIES: | ||||||||||||||||||||||||||||||||||||||||
| Obligations of U.S. Government agencies | $ | 0 | 0.00 | % | $ | 8,026 | 1.42 | % | $ | 0 | 0.00 | % | $ | 0 | 0.00 | % | $ | 8,026 | 1.42 | % | ||||||||||||||||||||
| Obligations of states and political subdivisions: | ||||||||||||||||||||||||||||||||||||||||
| Tax-exempt | 6,247 | 1.55 | % | 45,184 | 3.00 | % | 32,822 | 2.21 | % | 19,420 | 3.60 | % | 103,673 | 2.78 | % | |||||||||||||||||||||||||
| Taxable | 5,103 | 1.97 | % | 16,064 | 2.51 | % | 4,264 | 3.12 | % | 0 | 0.00 | % | 25,431 | 2.51 | % | |||||||||||||||||||||||||
| Sub-total | $ | 11,350 | 1.74 | % | $ | 69,274 | 2.71 | % | $ | 37,086 | 2.32 | % | $ | 19,420 | 3.60 | % | 137,130 | 2.65 | % | |||||||||||||||||||||
| Mortgage-backed securities issued or guaranteed by U.S. Government agencies or sponsored agencies: | ||||||||||||||||||||||||||||||||||||||||
| Residential pass-through securities | 52,992 | 2.24 | % | |||||||||||||||||||||||||||||||||||||
| Residential collateralized mortgage obligations | 134,314 | 2.12 | % | |||||||||||||||||||||||||||||||||||||
| Commercial mortgage-backed securities | 33,881 | 2.39 | % | |||||||||||||||||||||||||||||||||||||
| Total | $ | 358,317 | 2.36 | % | ||||||||||||||||||||||||||||||||||||
The Corporation’s mortgage-backed securities and collateralized mortgage obligations have stated maturities that may differ from actual maturities due to borrowers’ ability to prepay obligations. Cash flows from such investments are dependent upon the performance of the underlying mortgage loans and are generally influenced by the level of interest rates. As rates increase, cash flows generally decrease as prepayments on the underlying mortgage loans decrease. As rates decrease, cash flows generally increase as prepayments increase due to increased refinance activity and other factors. In the table above, the entire balances and weighted-average rates for mortgage-backed securities and collateralized mortgage obligations are shown in one period.
FINANCIAL CONDITION
Gross loans outstanding (excluding mortgage loans held for sale) were $815,713,000 at December 31, 2017, up 8.5% from $751,835,000 at December 31, 2016. The total outstanding balances of residential mortgage segment loans at December 31, 2017 increased $26,513,000 (6.3%) as compared to December 31, 2016, and the total outstanding balances of commercial segment loans at December 31, 2017 increased $36,148,000 (11.4%) as compared to December 31, 2016. The 2017 loan growth followed growth in loans outstanding in 2016 of 6.7% from December 31, 2015. Total outstanding commercial loans were higher by $9,206,000 (3.0%), and residential mortgage segment loans were up $34,683,000 (9.0%), at December 31, 2016 as compared to December 31, 2015.
The increases in loans outstanding in 2016 and 2017 included increases in commercial participation loans. Participation loans represent portions of larger commercial transactions for which other institutions are the “lead banks”. Although not the lead bank, the Corporation conducts detailed underwriting and monitoring of participation loan opportunities. Participation loans are included in the “Commercial and industrial,” “Commercial loans secured by real estate” and “Political subdivisions” classes in the loan tables presented in this Form 10-K. Total participation loans outstanding amounted to $61,245,000 at December 31, 2017, up from $47,508,000 at December 31, 2016. At December 31, 2017, the balance of participation loans outstanding includes a total of $53,756,000 to businesses located outside of the Corporation’s market area, including $10,063,000 from participations in loans originated through the Corporation’s membership in a network that originates loans throughout the U.S. The Corporation’s participation loans originated through the network consist of loans to businesses that are larger than the Corporation’s typical commercial customer base. The loans originated through the network are considered “leveraged loans,” meaning the businesses typically have minimal tangible book equity and the extent of collateral available is limited, though at the time of origination the businesses have demonstrated strong cash flow performance in their recent histories. At December 31, 2017, total leveraged participation loans, including loans originated through the network and four loans to two borrowers originated through another lead institution, totaled $15,328,000, up slightly from $15,207,000 at December 31, 2016. At December 31, 2017, there was a leveraged loan with an outstanding balance of $324,000 classified as impaired with a specific allowance for loan losses of $96,000. With the exception of the loan identified in the preceding sentence, there were no loans classified as impaired at December 31, 2017 and 2016, and all of the leveraged loans (including the loan classified as impaired) were current as to payments of principal and interest as of December 31, 2017 and 2016.
| 27 |
Table VIII presents loan maturity data as of December 31, 2017. The interest rate simulation model used to prepare Table VIII classifies certain loans under different categories from the categories that appear in Table VII. Fixed-rate loans are shown in Table VIII based on their contractually scheduled principal repayments, and variable-rate loans are shown based on the date of the next change in rate. Table VIII shows that fixed-rate loans are approximately 38% of the loan portfolio. Of the 62% of the portfolio made up of variable-rate loans, a significant portion (42%) will re-price after more than one year. Variable-rate loans re-pricing after more than one year include residential and commercial real estate secured loans. The Corporation’s substantial investment in long-term, fixed-rate loans and variable-rate loans with extended periods until re-pricing is one of the concerns management attempts to address through interest rate risk management practices. See Part II, Item 7A for a more detailed discussion of the Corporation’s interest rate risk.
Short-term borrowings totaled $61,766,000 at December 31, 2017, up from $26,175,000 at December 31, 2016. Within this category, overnight borrowing from FHLB-Pittsburgh of $29,000,000 was up from $21,000,000 at December 31, 2016. Also at December 31, 2017, the balance of short-term borrowings included a series of advances from FHLB-Pittsburgh totaling $29,000,000, including advances maturing monthly from January through October 2018 with a weighted average interest rate of 1.69% and rates ranging from 1.23% to 1.89%.
Long-term borrowings of $9,189,000 at December 31, 2017 were down from the balance at December 31, 2016 of $38,454,000. In 2017, the Corporation paid off two higher-cost borrowings totaling $37,000,000, including an advance from FHLB-Pittsburgh of $10,000,000 with a rate of 3.81% in October and repurchase agreements totaling $27,000,000 with a rate of 3.595% in December. Repayment of these borrowings was funded by advances from FHLB-Pittsburgh, including the short-term advances described above and an additional $8,000,000 of advances included in long-term borrowings at December 31, 2017. The advances included in long-term borrowings at December 31, 2017 had initial maturities of greater than one year, with varying maturities through February 2019 and interest rates ranging from 1.35% to 1.83%.
Other significant changes in the average balances of the Corporation’s earning assets and interest-bearing liabilities are described in the “Net Interest Income” section of Management’s Discussion and Analysis. Other significant balance sheet items, including securities, the allowance for loan losses and stockholders’ equity, are discussed in separate sections of Management’s Discussion and Analysis.
Total purchases of bank premises and equipment in 2018 are estimated at approximately $3.0 million. Management does not expect the amount of purchases of bank premises and equipment to have a material, detrimental effect on the Corporation’s financial condition in 2018.
Since 2009, the Corporation has originated and sold residential mortgage loans to the secondary market through the MPF Xtra program administered by the Federal Home Loan Banks of Pittsburgh and Chicago. Residential mortgages originated and sold through the MPF Xtra program consist primarily of conforming, prime loans sold to the Federal National Mortgage Association (Fannie Mae), a quasi-government entity. In 2014, the Corporation began to originate and sell residential mortgage loans to the secondary market through the MPF Original program, which is also administered by the Federal Home Loan Banks of Pittsburgh and Chicago. Residential mortgages originated and sold through the MPF Original program consist primarily of conforming, prime loans sold to the Federal Home Loan Bank of Pittsburgh.
For loan sales originated under the MPF Xtra and Original programs, the Corporation provides customary representations and warranties to investors that specify, among other things, that the loans have been underwritten to the standards established by the investor. The Corporation may be required to repurchase a loan and reimburse a portion of fees received, or reimburse the investor for a credit loss incurred on a loan, if it is determined that the representations and warranties have not been met. Such repurchases or reimbursements generally result from an underwriting or documentation deficiency. At December 31, 2017, the total outstanding balance of loans the Corporation has repurchased as a result of identified instances of noncompliance amounted to $1,805,000, and the corresponding total outstanding balance repurchased at December 31, 2016 was $1,852,000.
At December 31, 2017, outstanding balances of loans sold and serviced through the two programs totaled $169,725,000, including loans sold through the MPF Xtra program of $107,117,000 and loans sold through the Original program of $62,608,000. At December 31, 2016, outstanding balances of loans sold and serviced through the two programs totaled $163,296,000, including loans sold through the MPF Xtra program of $116,978,000 and loans sold through the Original Program of $46,318,000. Based on the fairly limited volume of required repurchases to date, no allowance has been established for representation and warranty exposures as of December 31, 2017 and December 31, 2016.
| 28 |
For loans sold under the Original program, the Corporation provides a credit enhancement whereby the Corporation would assume credit losses in excess of a defined First Loss Account (“FLA”) balance, up to specified amounts. The FLA is funded by the Federal Home Loan Bank of Pittsburgh based on a percentage of the outstanding balance of loans sold. At December 31, 2017, the Corporation’s maximum credit enhancement obligation under the MPF Original Program was $5,742,000, and the Corporation has recorded a related allowance for credit losses in the amount of $260,000 which is included in “Accrued interest and other liabilities” in the accompanying consolidated balance sheets. At December 31, 2016, the Corporation’s maximum credit enhancement obligation under the MPF Original Program was $4,664,000, and the related allowance for credit losses was $196,000. The Corporation does not provide a credit enhancement for loans sold through the Xtra program.
TABLE VII - Five-year Summary of Loans by Type
(Dollars In Thousands)
| 2017 | % | 2016 | % | 2015 | % | 2014 | % | 2013 | % | |||||||||||||||||||||||||||||||
| Residential mortgage: | ||||||||||||||||||||||||||||||||||||||||
| Residential mortgage loans - first liens | $ | 359,987 | 44.1 | $ | 334,102 | 44.4 | $ | 304,783 | 43.2 | $ | 291,882 | 46.3 | $ | 299,831 | 46.5 | |||||||||||||||||||||||||
| Residential mortgage loans - junior liens | 25,325 | 3.1 | 23,706 | 3.2 | 21,146 | 3.0 | 21,166 | 3.4 | 23,040 | 3.6 | ||||||||||||||||||||||||||||||
| Home equity lines of credit | 35,758 | 4.4 | 38,057 | 5.1 | 39,040 | 5.5 | 36,629 | 5.8 | 34,530 | 5.4 | ||||||||||||||||||||||||||||||
| 1-4 Family residential construction | 26,216 | 3.2 | 24,908 | 3.3 | 21,121 | 3.0 | 16,739 | 2.7 | 13,909 | 2.2 | ||||||||||||||||||||||||||||||
| Total residential mortgage | 447,286 | 54.8 | 420,773 | 56.0 | 386,090 | 54.8 | 366,416 | 58.1 | 371,310 | 57.6 | ||||||||||||||||||||||||||||||
| Commercial: | ||||||||||||||||||||||||||||||||||||||||
| Commercial loans secured by real estate | 159,266 | 19.5 | 150,468 | 20.0 | 154,779 | 22.0 | 145,878 | 23.1 | 147,215 | 22.8 | ||||||||||||||||||||||||||||||
| Commercial and industrial | 88,276 | 10.8 | 83,854 | 11.2 | 75,196 | 10.7 | 50,157 | 8.0 | 42,387 | 6.6 | ||||||||||||||||||||||||||||||
| Political subdivisions | 59,287 | 7.3 | 38,068 | 5.1 | 40,007 | 5.7 | 17,534 | 2.8 | 16,291 | 2.5 | ||||||||||||||||||||||||||||||
| Commercial construction | 14,527 | 1.8 | 14,287 | 1.9 | 5,122 | 0.7 | 6,938 | 1.1 | 17,003 | 2.6 | ||||||||||||||||||||||||||||||
| Loans secured by farmland | 7,255 | 0.9 | 7,294 | 1.0 | 7,019 | 1.0 | 7,916 | 1.3 | 10,468 | 1.6 | ||||||||||||||||||||||||||||||
| Multi-family (5 or more) residential | 7,713 | 0.9 | 7,896 | 1.1 | 9,188 | 1.3 | 8,917 | 1.4 | 10,985 | 1.7 | ||||||||||||||||||||||||||||||
| Agricultural loans | 6,178 | 0.8 | 3,998 | 0.5 | 4,671 | 0.7 | 3,221 | 0.5 | 3,251 | 0.5 | ||||||||||||||||||||||||||||||
| Other commercial loans | 10,986 | 1.3 | 11,475 | 1.5 | 12,152 | 1.7 | 13,334 | 2.1 | 14,631 | 2.3 | ||||||||||||||||||||||||||||||
| Total commercial | 353,488 | 43.3 | 317,340 | 42.2 | 308,134 | 43.7 | 253,895 | 40.3 | 262,231 | 40.7 | ||||||||||||||||||||||||||||||
| Consumer | 14,939 | 1.8 | 13,722 | 1.8 | 10,656 | 1.5 | 10,234 | 1.6 | 10,762 | 1.7 | ||||||||||||||||||||||||||||||
| Total | 815,713 | 100.0 | 751,835 | 100.0 | 704,880 | 100.0 | 630,545 | 100.0 | 644,303 | 100.0 | ||||||||||||||||||||||||||||||
| Less: allowance for loan losses | (8,856 | ) | (8,473 | ) | (7,889 | ) | (7,336 | ) | (8,663 | ) | ||||||||||||||||||||||||||||||
| Loans, net | $ | 806,857 | $ | 743,362 | $ | 696,991 | $ | 623,209 | $ | 635,640 | ||||||||||||||||||||||||||||||
TABLE VIII – LOAN MATURITY DISTRIBUTION
| (In Thousands) | As of December 31, 2017 | |||||||||||||||||||||||||||||||
| Fixed-Rate Loans | Variable- or Adjustable-Rate Loans | |||||||||||||||||||||||||||||||
| 1 Year | 1-5 | >5 | 1 Year | 1-5 | >5 | |||||||||||||||||||||||||||
| or Less | Years | Years | Total | or Less | Years | Years | Total | |||||||||||||||||||||||||
| Real Estate | $ | 6,076 | $ | 25,336 | $ | 174,902 | $ | 206,314 | $ | 122,028 | $ | 172,436 | $ | 123,684 | $ | 418,148 | ||||||||||||||||
| Commercial | 12,724 | 34,971 | 40,389 | 88,084 | 55,832 | 29,152 | 3,511 | 88,495 | ||||||||||||||||||||||||
| Consumer | 1,842 | 9,589 | 3,188 | 14,619 | 45 | 0 | 8 | 53 | ||||||||||||||||||||||||
| Total | $ | 20,642 | $ | 69,896 | $ | 218,479 | $ | 309,017 | $ | 177,905 | $ | 201,588 | $ | 127,203 | $ | 506,696 | ||||||||||||||||
PROVISION AND ALLOWANCE FOR LOAN LOSSES
The Corporation maintains an allowance for loan losses that represents management’s estimate of the losses inherent in the loan portfolio as of the balance sheet date and recorded as a reduction of the investment in loans. Notes 1 and 8 to the consolidated financial statements provide an overview of the process management uses for evaluating and determining the allowance for loan losses.
| 29 |
While management uses available information to recognize losses on loans, changes in economic conditions may necessitate revisions in future years. In addition, various regulatory agencies, as an integral part of their examination process, periodically review the Corporation’s allowance for loan losses. Such agencies may require the Corporation to recognize adjustments to the allowance based on their judgments of information available to them at the time of their examination.
The allowance for loan losses was $8,856,000 at December 31, 2017, up from $8,473,000 at December 31, 2016. Table X shows total specific allowances on impaired loans increased $605,000 to $1,279,000 at December 31, 2017 from $674,000 at December 31, 2016. The net increase in specific allowances in 2017 included an increase of $391,000 in the allowance related to one real estate secured commercial loan. The increase in the specific allowance for this loan was based on an updated appraisal received in 2017 as well as principal reductions from scheduled payments. At December 31, 2017, the outstanding balance of this loan was $2,641,000, and the related allowance was $919,000.
Table X also shows that the collectively determined portion of the allowance related to commercial loans decreased $295,000, to $3,078,000 at December 31, 2017 from $3,373,000 at December 31, 2016. The decrease in the collectively determined allowance on commercial loans resulted from an aggregate improvement (reduction) in the net charge-off experience and qualitative factors used to value the allowance on commercial loans, partially offset by the impact of an increase in outstanding loans. The aggregate net charge-off experience factor used in the allowance calculation on commercial loans was 0.09% lower at December 31, 2017 as compared to December 31, 2016. The Corporation’s aggregate net charge-off rate on commercial loans has been improving over the past several quarters, as the effects on the overall rate of a large ($1,486,000) charge-off in 2014 on a commercial loan secured by real estate has gradually diminished. The qualitative factors used in the allowance calculation for commercial loans were 0.07% lower at December 31, 2017 as compared to December 31, 2016, reflecting a pattern of overall improvement in loan delinquency levels and a reduction in the unemployment rate throughout most of the Corporation’s market area over the previous 12-18 months.
Throughout 2016 and at March 31, 2017, a rolling three-year average net charge-off rate was used for all loan classes. Beginning with the quarter ending June 30, 2017, a five-year average net charge-off rate was used for commercial loans secured by real estate and for multi-family residential loans, while a three-year average net charge-off rate was used for all other loan classes. The change in time period for these two loan classes was based on management’s evaluation of an appropriate time period that captures an historical loss experience relevant to the current portfolio.
The provision for loan losses by segment for 2017, 2016 and 2015 is as follows:
| (In Thousands) | ||||||||||||
| 2017 | 2016 | 2015 | ||||||||||
| Residential mortgage | $ | 251 | $ | 542 | $ | (19 | ) | |||||
| Commercial | 316 | 687 | 816 | |||||||||
| Consumer | 133 | 21 | 16 | |||||||||
| Unallocated | 101 | (29 | ) | 32 | ||||||||
| Total | $ | 801 | $ | 1,221 | $ | 845 | ||||||
| 30 |
The provision for loan losses for the two largest lending segments, Residential mortgage and Commercial, is further detailed as follows:
| Residential mortgage segment | ||||||||||||
| (In thousands) | ||||||||||||
| 2017 | 2016 | 2015 | ||||||||||
| Increase (decrease) in total specific allowance on impaired loans, adjusted for the effect of net charge-offs | $ | 300 | $ | 69 | $ | (141 | ) | |||||
| Increase (decrease) in collectively determined portion of the allowance attributable to: | ||||||||||||
| Loan growth | 233 | 325 | 196 | |||||||||
| Changes in historical loss experience factors | (53 | ) | (6 | ) | (111 | ) | ||||||
| Changes in qualitative factors | (229 | ) | 154 | 37 | ||||||||
| Total provision (credit) for loan losses - Residential mortgage segment | $ | 251 | $ | 542 | $ | (19 | ) | |||||
| Commercial segment | ||||||||||||
| (In thousands) | ||||||||||||
| 2017 | 2016 | 2015 | ||||||||||
| Increase in total specific allowance on impaired loans, adjusted for the effect of net charge-offs | $ | 611 | $ | 417 | $ | 445 | ||||||
| Increase (decrease) in collectively determined portion of the allowance attributable to: | ||||||||||||
| Loan growth | 183 | 114 | 437 | |||||||||
| Changes in historical loss experience factors | (268 | ) | 75 | (42 | ) | |||||||
| Changes in qualitative factors | (210 | ) | 81 | (24 | ) | |||||||
| Total provision for loan losses - Commercial segment | $ | 316 | $ | 687 | $ | 816 | ||||||
For each year shown in the table immediately above, the provision related to increases or decreases in specific allowances on impaired loans was affected by changes in the results of management’s assessment of the amount of probable or actual (charged-off) losses associated with a small number of larger, individual loans. This line item also includes net charge-offs or recoveries from smaller loans that had not been individually evaluated for impairment prior to charge-off.
In the table immediately above, the portion of the net change in the collectively determined allowance attributable to loan growth was determined by applying the historical loss experience and qualitative factors used in the allowance calculation at the end of the preceding year to the net increase in loans outstanding (excluding loans specifically evaluated for impairment) for the year. The table shows that the provision for both the Residential mortgage and Commercial segments included the effects of loan growth in 2017, 2016 and 2015.
The effect on the provision of changes in historical loss experience and qualitative factors, as shown in the table above, was determined by: (1) calculating the net change in each factor used in determining the allowance at the end of the year as compared to the preceding year, and (2) applying the net change in each factor to the outstanding balance of loans at the end of the preceding year (excluding loans specifically evaluated for impairment).
As discussed above, the Corporation’s overall net charge-off experience has improved in 2017, consistent with the reductions in the provision for both the Residential mortgage and Commercial segments. Table XII shows the average rate of net charge-offs as a percentage of loans was 0.05% in 2017, with an average over the five-year period ended December 31, 2017 of 0.10%, and annual average rates ranging from lows of 0.04% in 2013 and 2015 to a high of 0.29% in 2014.
| 31 |
The table above also shows the provision for both the Residential mortgage and Commercial segments in 2017 was reduced by the effect of a reduction in qualitative factors. As discussed above, the reduced qualitative factors is consistent with the overall pattern of improving loan delinquency and charge-off levels and an improved local economy as evidenced by a reduction in the unemployment rate throughout most of the Corporation’s market area. In 2016, the provision for both the Residential mortgage and Commercial segments included the effect of slight increases in qualitative factors.
Table XI presents information related to past due and impaired loans, and loans that have been modified under terms that are considered troubled debt restructurings (TDRs). Total nonperforming loans as a percentage of outstanding loans was 2.10% at December 31, 2017, up slightly from 2.07% at December 31, 2016. Nonperforming assets as a percentage of total assets was 1.47% at December 31, 2017, also up slightly from 1.43% at December 31, 2016. Table XI presents data at the end of each of the years ended December 31, 2013 through 2017. For the range of dates presented in Table XI, total nonperforming loans as a percentage of loans has ranged from a low of 2.07% at December 31, 2016 to a high of 2.80% at December 31, 2013, and total nonperforming assets as a percentage of assets has ranged from a low of 1.31% at December 31, 2015 to a high of 1.53% at December 31, 2013.
Total impaired loans of $9,511,000 at December 31, 2017, are down $1,349,000 from the corresponding amount at December 31, 2016 of $10,860,000. Table XI shows that over the period 2013-2017, the year-end total outstanding balance of impaired loans has ranged from a low of $9,511,000 in 2017 to a high of $16,321,000 in 2013.
Total nonperforming assets of $18,726,000 at December 31, 2017 are up $972,000 from the corresponding amount at December 31, 2016. The total amount of nonperforming assets exceeds the amount of total impaired loans because the nonperforming category includes, in addition to impaired loans, foreclosed assets held for sale and loans 90 days or more past due or in nonaccrual status with outstanding balances lower than the minimum amounts that are individually evaluated for impairment. A summary of changes in the components of nonperforming assets at December 31, 2017 as compared to December 31, 2016 is as follows:
| · | Nonaccrual loans totaled $13,404,000 at December 31, 2017, up from $8,736,000 at December 31, 2016. The net increase in nonaccrual loans included the effect of classifying a commercial loan with a recorded investment of $2,811,000 at December 31, 2017 as nonaccrual in 2017. The increase also included the effect of an increase in total residential mortgage loans in nonaccrual status to $5,417,000 at December 31, 2017 from $3,781,000 at December 31, 2016. |
| · | Total loans past due 90 days or more and still accruing interest amounted to $3,724,000 at December 31, 2017, a decrease of $3,114,000 from $6,838,000 at December 31, 2016. The decrease in 2017 in the balance of loans past due 90 days or more and still accruing interest included the commercial loan described above moving to nonaccrual status. At December 31, 2017, total residential mortgage loans that were more than 90 days past due but deemed to be well secured and in the process of collection amounted to $2,648,000, down from $3,456,000 at December 31, 2016. The Corporation reviews the status of loans past due 90 days or more each quarter to determine if it is appropriate to continue to accrue interest, and has determined the loans included in this category are well secured and that ultimate collection of all principal and interest is probable. |
| · | Foreclosed assets held for sale consisted of real estate, and totaled $1,598,000 at December 31, 2017, a decrease of $582,000 from $2,180,000 at December 31, 2016. At December 31, 2017, the Corporation held 16 such properties for sale, with total carrying values of $721,000 related to residential real estate, $632,000 of land and $245,000 related to commercial real estate. At December 31, 2016, the Corporation held 19 such properties for sale, with total carrying values of $1,102,000 related to residential real estate, $650,000 of land and $428,000 related to commercial real estate. The Corporation evaluates the carrying values of foreclosed assets each quarter based on the most recent market activity or appraisals for each property. |
| 32 |
As shown in Table XI, loans classified as TDRs decreased to $3,663,000 at December 31, 2017 from $8,677,000 at December 31, 2016. The decrease resulted primarily from removing one commercial relationship from TDR status in 2017. At December 31, 2017, the outstanding contractual balances of loans to this borrower totaled $6,425,000, and the recorded investments totaled $4,593,000. In 2014, the Corporation entered into a forbearance agreement with this commercial borrower which was extended for two additional twelve-month periods, most recently in July 2016. The Corporation recorded a charge-off of $1,486,000 in 2014 as a result of these modifications, as the payment amounts based on the forbearance agreement were not sufficient to fully amortize the contractual amount of principal outstanding on the loans. In December 2016, the Corporation and the borrower entered into a modification agreement, terminating the forbearance agreement and establishing loan terms with essentially the same interest rate and monthly payment amounts as had been in effect under the forbearance agreement. The interest rates provided for in the modification agreement were equal to or greater than rates the Corporation would be willing to accept for loans with comparable terms to borrowers with a comparable risk profile at the time of modification. The borrower has made all required payments on the loans in accordance with the terms of the forbearance agreement, as extended, and the modification agreement. Accordingly, the loans were restored to full accrual status at December 31, 2016 and are no longer included in the amounts reported as TDRs at December 31, 2017. Table XI shows that over the period 2013-2017, the year-end total outstanding balance of TDRs has ranged from a low of $3,663,000 in 2017 to a high of $8,677,000 in 2016.
Over the period 2013-2017, each period includes a few large commercial relationships that have required significant monitoring and workout efforts. As a result, a limited number of relationships may significantly impact the total amount of allowance required on impaired loans, and may significantly impact the amount of total charge-offs reported in any one period.
Management believes it has been conservative in its decisions concerning identification of impaired loans, estimates of loss, and nonaccrual status; however, the actual losses realized from these relationships could vary materially from the allowances calculated as of December 31, 2017. Management continues to closely monitor its commercial loan relationships for possible credit losses, and will adjust its estimates of loss and decisions concerning nonaccrual status, if appropriate.
Tables IX through XII present historical data related to the allowance for loan losses.
| TABLE IX - ANALYSIS OF THE ALLOWANCE FOR LOAN LOSSES |
| (Dollars In Thousands) | Years Ended December 31, | |||||||||||||||||||
| 2017 | 2016 | 2015 | 2014 | 2013 | ||||||||||||||||
| Balance, beginning of year | $ | 8,473 | $ | 7,889 | $ | 7,336 | $ | 8,663 | $ | 6,857 | ||||||||||
| Charge-offs: | ||||||||||||||||||||
| Residential mortgage | (197 | ) | (73 | ) | (217 | ) | (327 | ) | (95 | ) | ||||||||||
| Commercial | (132 | ) | (597 | ) | (251 | ) | (1,715 | ) | (459 | ) | ||||||||||
| Consumer | (150 | ) | (87 | ) | (94 | ) | (97 | ) | (117 | ) | ||||||||||
| Total charge-offs | (479 | ) | (757 | ) | (562 | ) | (2,139 | ) | (671 | ) | ||||||||||
| Recoveries: | ||||||||||||||||||||
| Residential mortgage | 19 | 3 | 1 | 25 | 24 | |||||||||||||||
| Commercial | 4 | 35 | 214 | 264 | 348 | |||||||||||||||
| Consumer | 38 | 82 | 55 | 47 | 58 | |||||||||||||||
| Total recoveries | 61 | 120 | 270 | 336 | 430 | |||||||||||||||
| Net charge-offs | (418 | ) | (637 | ) | (292 | ) | (1,803 | ) | (241 | ) | ||||||||||
| Provision for loan losses | 801 | 1,221 | 845 | 476 | 2,047 | |||||||||||||||
| Balance, end of period | $ | 8,856 | $ | 8,473 | $ | 7,889 | $ | 7,336 | $ | 8,663 | ||||||||||
| Net charge-offs as a % of average loans | 0.05 | % | 0.09 | % | 0.04 | % | 0.29 | % | 0.04 | % | ||||||||||
| 33 |
| TABLE X - COMPONENTS OF THE ALLOWANCE FOR LOAN LOSSES |
| (In Thousands) | ||||||||||||||||||||
| As of December 31, | ||||||||||||||||||||
| 2017 | 2016 | 2015 | 2014 | 2013 | ||||||||||||||||
| ASC 310 - Impaired loans | $ | 1,279 | $ | 674 | $ | 820 | $ | 769 | $ | 2,333 | ||||||||||
| ASC 450 - Collective segments: | ||||||||||||||||||||
| Commercial | 3,078 | 3,373 | 3,103 | 2,732 | 2,583 | |||||||||||||||
| Residential mortgage | 3,841 | 3,890 | 3,417 | 3,295 | 3,156 | |||||||||||||||
| Consumer | 159 | 138 | 122 | 145 | 193 | |||||||||||||||
| Unallocated | 499 | 398 | 427 | 395 | 398 | |||||||||||||||
| Total Allowance | $ | 8,856 | $ | 8,473 | $ | 7,889 | $ | 7,336 | $ | 8,663 | ||||||||||
| TABLE XI - PAST DUE AND IMPAIRED LOANS, NONPERFORMING ASSETS | ||||||||||||||||||||
| AND TROUBLED DEBT RESTRUCTURINGS (TDRs) | ||||||||||||||||||||
| (Dollars In Thousands) | ||||||||||||||||||||
| As of December 31, | ||||||||||||||||||||
| 2017 | 2016 | 2015 | 2014 | 2013 | ||||||||||||||||
| Impaired loans with a valuation allowance | $ | 4,100 | $ | 3,372 | $ | 1,933 | $ | 3,241 | $ | 9,889 | ||||||||||
| Impaired loans without a valuation allowance | 5,411 | 7,488 | 8,041 | 9,075 | 6,432 | |||||||||||||||
| Total impaired loans | $ | 9,511 | $ | 10,860 | $ | 9,974 | $ | 12,316 | $ | 16,321 | ||||||||||
| Total loans past due 30-89 days and still accruing | $ | 9,449 | $ | 7,735 | $ | 7,057 | $ | 7,121 | $ | 8,305 | ||||||||||
| Nonperforming assets: | ||||||||||||||||||||
| Total nonaccrual loans | $ | 13,404 | $ | 8,736 | $ | 11,517 | $ | 12,610 | $ | 14,934 | ||||||||||
| Total loans past due 90 days or more and still accruing | 3,724 | 6,838 | 3,229 | 2,843 | 3,131 | |||||||||||||||
| Total nonperforming loans | 17,128 | 15,574 | 14,746 | 15,453 | 18,065 | |||||||||||||||
| Foreclosed assets held for sale (real estate) | 1,598 | 2,180 | 1,260 | 1,189 | 892 | |||||||||||||||
| Total nonperforming assets | $ | 18,726 | $ | 17,754 | $ | 16,006 | $ | 16,642 | $ | 18,957 | ||||||||||
| Loans subject to troubled debt restructurings (TDRs): | ||||||||||||||||||||
| Performing | $ | 636 | $ | 5,803 | $ | 1,186 | $ | 1,807 | $ | 3,267 | ||||||||||
| Nonperforming | 3,027 | 2,874 | 5,178 | 5,388 | 908 | |||||||||||||||
| Total TDRs | $ | 3,663 | $ | 8,677 | $ | 6,364 | $ | 7,195 | $ | 4,175 | ||||||||||
| Total nonperforming loans as a % of loans | 2.10 | % | 2.07 | % | 2.09 | % | 2.45 | % | 2.80 | % | ||||||||||
| Total nonperforming assets as a % of assets | 1.47 | % | 1.43 | % | 1.31 | % | 1.34 | % | 1.53 | % | ||||||||||
| Allowance for loan losses as a % of total loans | 1.09 | % | 1.13 | % | 1.12 | % | 1.16 | % | 1.34 | % | ||||||||||
| Allowance for loan losses as a % of nonperforming loans | 51.70 | % | 54.40 | % | 53.50 | % | 47.47 | % | 47.95 | % | ||||||||||
| 34 |
| TABLE XII - FIVE-YEAR HISTORY OF LOAN LOSSES | ||||||||||||||||||||||||
| (Dollars In Thousands) | ||||||||||||||||||||||||
| 2017 | 2016 | 2015 | 2014 | 2013 | Average | |||||||||||||||||||
| Average gross loans | $ | 780,640 | $ | 723,076 | $ | 657,727 | $ | 627,753 | $ | 656,495 | $ | 689,138 | ||||||||||||
| Year-end gross loans | 815,713 | 751,835 | 704,880 | 630,545 | 644,303 | $ | 709,455 | |||||||||||||||||
| Year-end allowance for loan losses | 8,856 | 8,473 | 7,889 | 7,336 | 8,663 | $ | 8,243 | |||||||||||||||||
| Year-end nonaccrual loans | 13,404 | 8,736 | 11,517 | 12,610 | 14,934 | $ | 12,240 | |||||||||||||||||
| Year-end loans 90 days or more past due and still accruing | 3,724 | 6,838 | 3,229 | 2,843 | 3,131 | 3,953 | ||||||||||||||||||
| Net charge-offs | 418 | 637 | 292 | 1,803 | 241 | 678 | ||||||||||||||||||
| Provision for loan losses | 801 | 1,221 | 845 | 476 | 2,047 | 1,078 | ||||||||||||||||||
| Earnings coverage of charge-offs | 56 | x | 37 | x | 85 | x | 14 | x | 116 | x | 37 | x | ||||||||||||
| Allowance coverage of charge-offs | 21 | x | 13 | x | 27 | x | 4 | x | 36 | x | 12 | x | ||||||||||||
| Net charge-offs as a % of provision for loan losses | 52.18 | % | 52.17 | % | 34.56 | % | 378.78 | % | 11.77 | % | 62.89 | % | ||||||||||||
| Net charge-offs as a % of average gross loans | 0.05 | % | 0.09 | % | 0.04 | % | 0.29 | % | 0.04 | % | 0.10 | % | ||||||||||||
| Income before income taxes on a fully taxable equivalent basis | 23,350 | 23,861 | 24,710 | 25,784 | 28,012 | 25,143 | ||||||||||||||||||
CONTRACTUAL OBLIGATIONS AND OFF-BALANCE SHEET ARRANGEMENTS
Table XIII presents the Corporation’s significant fixed and determinable contractual obligations as of December 31, 2017 by payment date. The payment amounts represent the principal amounts of time deposits and borrowings and do not include interest.
TABLE XIII – CONTRACTUAL OBLIGATIONS
(In Thousands)
| 1 Year | 1-3 | 3-5 | Over 5 | |||||||||||||||||
| or Less | Years | Years | Years | Total | ||||||||||||||||
| Time deposits | $ | 112,563 | $ | 79,933 | $ | 18,459 | $ | 2,716 | $ | 213,671 | ||||||||||
| Short-term borrowings: | ||||||||||||||||||||
| Federal Home Loan Bank of Pittsburgh | 58,000 | 0 | 0 | 0 | 58,000 | |||||||||||||||
| Customer repurchase agreements | 3,766 | 0 | 0 | 0 | 3,766 | |||||||||||||||
| Long-term borrowings: | ||||||||||||||||||||
| Federal Home Loan Bank of Pittsburgh | 6,000 | 2,463 | 0 | 726 | 9,189 | |||||||||||||||
| Total | $ | 180,329 | $ | 82,396 | $ | 18,459 | $ | 3,442 | $ | 284,626 | ||||||||||
In addition to the amounts described in Table XIII, the Corporation has obligations related to deposits without a stated maturity with outstanding principal balances totaling $794,778,000 at December 31, 2017.
The Corporation’s operating lease and other commitments at December 31, 2017 are immaterial. The Corporation’s significant off-balance sheet arrangements include commitments to extend credit and standby letters of credit. Off-balance sheet arrangements are described in Note 16 to the consolidated financial statements.
As described in more detail in the “Financial Condition” section of Management’s Discussion and Analysis, the Corporation sells residential mortgage loans for which the Corporation provides customary representations and warranties to investors that specify, among other things, that the loans have been underwritten to the standards established by the investor. The Corporation may be required to repurchase a loan and reimburse a portion of fees received, or reimburse the investor for a credit loss incurred on a loan, if it is determined that the representations and warranties have not been met. At December 31, 2017, outstanding balances of such loans sold totaled $169,725,000.
Also, for loans sold under the MPF Original program, the Corporation provides a credit enhancement. At December 31, 2017, the Corporation’s maximum credit enhancement obligation under the MPF Original Program was $5,742,000, and the Corporation has recorded a related allowance for credit losses in the amount of $260,000 which is included in “Accrued interest and other liabilities” in the accompanying consolidated balance sheets.
| 35 |
LIQUIDITY
Liquidity is the ability to quickly raise cash at a reasonable cost. An adequate liquidity position permits the Corporation to pay creditors, compensate for unforeseen deposit fluctuations and fund unexpected loan demand. At December 31, 2017, the Corporation maintained overnight interest-bearing deposits with the Federal Reserve Bank of Philadelphia and other correspondent banks totaling $11,340,000.
The Corporation maintains overnight borrowing facilities with several correspondent banks that provide a source of day-to-day liquidity. Also, the Corporation maintains borrowing facilities with the Federal Home Loan Bank of Pittsburgh, secured by various mortgage loans.
The Corporation has a line of credit with the Federal Reserve Bank of Philadelphia’s Discount Window. Management intends to use this line of credit as a contingency funding source. As collateral for the line, the Corporation has pledged available-for-sale securities with a carrying value of $16,301,000 at December 31, 2017.
The Corporation’s outstanding, available, and total credit facilities at December 31, 2017 and 2016 are as follows:
| Outstanding | Available | Total Credit | ||||||||||||||||||||||
| (In Thousands) | Dec. 31, | Dec. 31, | Dec. 31, | Dec. 31, | Dec. 31, | Dec. 31, | ||||||||||||||||||
| 2017 | 2016 | 2017 | 2016 | 2017 | 2016 | |||||||||||||||||||
| Federal Home Loan Bank of Pittsburgh | $ | 67,189 | $ | 32,454 | $ | 295,441 | $ | 306,767 | $ | 362,630 | $ | 339,221 | ||||||||||||
| Federal Reserve Bank Discount Window | 0 | 0 | 15,877 | 15,636 | 15,877 | 15,636 | ||||||||||||||||||
| Other correspondent banks | 0 | 0 | 45,000 | 45,000 | 45,000 | 45,000 | ||||||||||||||||||
| Total credit facilities | $ | 67,189 | $ | 32,454 | $ | 356,318 | $ | 367,403 | $ | 423,507 | $ | 399,857 | ||||||||||||
At December 31, 2017, the Corporation’s outstanding credit facilities with the Federal Home Loan Bank of Pittsburgh consisted of overnight borrowings of $29,000,000, short-term borrowings of $29,000,000 and long-term borrowings with a total amount of $9,189,000. At December 31, 2016, the Corporation’s outstanding credit facilities with the Federal Home Loan Bank of Pittsburgh consisted of overnight borrowings of $21,000,000 and long-term borrowings with a total amount of $11,454,000. Additional information regarding borrowed funds is included in Note 12 to the consolidated financial statements.
Additionally, the Corporation uses repurchase agreements placed with brokers to borrow funds secured by investment assets and “RepoSweep” arrangements to borrow funds from commercial banking customers on an overnight basis. If required to raise cash in an emergency situation, the Corporation could sell available-for-sale securities to meet its obligations. At December 31, 2017, the carrying value of available-for-sale securities in excess of amounts required to meet pledging or repurchase agreement obligations was $196,810,000.
Management believes the Corporation is well-positioned to meet its short-term and long-term obligations.
STOCKHOLDERS’ EQUITY AND CAPITAL ADEQUACY
The Corporation and C&N Bank are subject to various regulatory capital requirements administered by the federal banking agencies. Details concerning regulatory capital amounts and ratios are presented in Note 18 to the consolidated financial statements. As reflected in Note 18, at December 31, 2017 and 2016, the Corporation and C&N Bank meet all capital adequacy requirements to which they are subject and maintain capital conservation buffers that allow the Corporation and C&N Bank to avoid limitations on capital distributions, including dividend payments and certain discretionary bonus payments to certain executive officers.
In July 2013, the federal regulatory authorities issued a new capital rule based, in part, on revisions developed by the Basel Committee on Banking Supervision to the Basel capital framework (Basel III). The Corporation and C&N Bank were subject to the new rule on January 1, 2015. Generally, the new rule implements higher minimum capital requirements, revises the definition of regulatory capital components and related calculations, adds a new common equity tier 1 capital ratio, implements a new capital conservation buffer, increases the risk weighting for past due loans and provides a transition period for several aspects of the new rule.
| 36 |
The current (new) capital rule provides that, in order to avoid limitations on capital distributions, including dividend payments and certain discretionary bonus payments to executive officers, a banking organization must hold a capital conservation buffer composed of common equity tier 1 capital above its minimum risk-based capital requirements. The buffer is measured relative to risk-weighted assets and is added to the minimum required risk-based capital ratios (as defined) for common equity tier 1 capital, tier 1 capital and total capital. The minimum capital conservation buffer needed in 2017 in order to fully avoid limitations on capital distributions, along with the remaining transition schedule, is as follows:
| As of January 1: | ||||||||||||
| 2017 | 2018 | 2019 | ||||||||||
| Common equity tier 1 capital conservation buffer | 1.25 | % | 1.875 | % | 2.5 | % | ||||||
As fully phased in, a banking organization with a buffer greater than 2.5% would not be subject to additional limits on dividend payments or discretionary bonus payments; however, a banking organization with a buffer less than 2.5% would be subject to increasingly stringent limitations as the buffer approaches zero. The new rule also prohibits a banking organization from making dividend payments or discretionary bonus payments if its eligible retained income is negative in that quarter and its capital conservation buffer ratio was less than 2.5% as of the beginning of that quarter. Eligible net income is defined as net income for the four calendar quarters preceding the current calendar quarter, net of any distributions and associated tax effects not already reflected in net income. A summary of payout restrictions based on the capital conservation buffer is as follows:
| Capital Conservation Buffer | Maximum Payout | |
| (as a % of risk-weighted assets) | (as a % of eligible retained income) | |
| Greater than 2.5% | No payout limitation applies | |
| ≤2.5% and >1.875% | 60% | |
| ≤1.875% and >1.25% | 40% | |
| ≤1.25% and >0.625% | 20% | |
| ≤0.625% | 0% |
At December 31, 2017, the Corporation’s Capital Conservation Buffer, determined based on the minimum total capital ratio, was 15.07%. C&N Bank’s Capital Conservation Buffer (also determined based on the minimum total capital ratio) was 12.47%.
Future dividend payments will depend upon maintenance of a strong financial condition, future earnings and capital and regulatory requirements. In addition, the Corporation and C&N Bank are subject to restrictions on the amount of dividends that may be paid without approval of banking regulatory authorities. These restrictions are described in Note 18 to the consolidated financial statements.
Management expects the Corporation and C&N Bank to maintain capital levels that exceed the regulatory standards for well-capitalized institutions for the next 12 months and for the foreseeable future. Planned capital expenditures are not expected to have a significantly detrimental effect on capital ratios.
The Corporation’s total stockholders’ equity is affected by fluctuations in the fair values of available-for-sale securities. The difference between amortized cost and fair value of available-for-sale securities, net of deferred income tax, is included in Accumulated Other Comprehensive Income (Loss) within stockholders’ equity. The balance in Accumulated Other Comprehensive Income (Loss) related to unrealized gains (losses) on available-for-sale securities, net of deferred income tax, amounted to ($1,566,000) at December 31, 2017, ($949,000) at December 31, 2016 and $2,493,000 at December 31, 2015. Changes in accumulated other comprehensive income (loss) are excluded from earnings and directly increase or decrease stockholders’ equity. If available-for-sale securities are deemed to be other-than-temporarily impaired, unrealized losses are recorded as a charge against earnings, and amortized cost for the affected securities is reduced. Note 7 to the consolidated financial statements provides additional information concerning management’s evaluation of available-for-sale securities for other-than-temporary impairment at December 31, 2017.
Stockholders’ equity is also affected by the underfunded or overfunded status of defined benefit pension and postretirement plans. The balance in Accumulated Other Comprehensive Income (Loss) related to defined benefit plans, net of deferred income tax, was $59,000 at December 31, 2017, $51,000 at December 31, 2016 and $35,000 at December 31, 2015.
| 37 |
COMPREHENSIVE INCOME
Comprehensive Income is the total of (1) net income, and (2) all other changes in equity from non-stockholder sources, which are referred to as Other Comprehensive Income. Changes in the components of Accumulated Other Comprehensive Income (Loss) are included in Other Comprehensive Income, and for the Corporation, consist of changes in unrealized gains or losses on available-for-sale securities and changes in underfunded or overfunded defined benefit plans.
Comprehensive Income totaled $12,825,000 in 2017 as compared to $12,336,000 in 2016 and $13,639,000 in 2015. In 2017, Comprehensive Income included: (1) Net Income of $13,434,000, which was $2,328,000 lower than in 2016 and $3,037,000 lower than in 2015; (2) Other Comprehensive Loss from unrealized losses on available-for-sale securities, net of deferred income tax, of ($617,000) as compared to Other Comprehensive Loss of ($3,442,000) in 2016 and Other Comprehensive Loss of ($2,788,000) in 2015; and (3) Other Comprehensive Income from defined benefit plans of $8,000 in 2017 as compared to Other Comprehensive Income of $16,000 in 2016 and Other Comprehensive Loss of ($44,000) in 2015. Fluctuations in interest rates significantly affected fair values of available-for-sale securities in 2015 through 2017, and accordingly had an effect on Other Comprehensive Income (Loss) in each year.
INFLATION
The Corporation is significantly affected by the Federal Reserve Board’s efforts to control inflation through changes in short-term interest rates. Since September 2007, the Federal Reserve has maintained the fed funds target rate at extremely low levels by historical standards. Further, throughout the period of low interest rates, the Federal Reserve has injected massive amounts of liquidity into the nation’s monetary system through a variety of programs. Since late 2015, the Federal Reserve has begun to move its fed funds target rate higher, in an effort to re-establish a more normalized level by historical standards, with 0.25% increases in December 2015 and 2016, March 2017, June 2017 and December 2017, resulting in the current range of 1.25% to 1.50%. Inflation has remained subdued, measured for most of 2016 and through 2017 at levels below the Federal Open Market Committee’s 2% longer run objective, though there have been some reports of wage pressure as the U.S. employment picture has gradually improved over the past several years.
Although management cannot predict future changes in the rates of inflation, management monitors the impact of economic trends, including any indicators of inflationary pressures, in managing interest rate and other financial risks.
RECENT ACCOUNTING PRONOUNCEMENTS
See Note 2 to the consolidated financial statements for a description of recent accounting pronouncements and their recent or potential future effects on the Corporation’s financial statements.
MARKET RISK
Market risk is the risk of loss arising from adverse changes in market rates and prices of the Corporation’s financial instruments. In addition to the effects of interest rates, the market prices of the Corporation’s debt securities within the available-for-sale securities portfolio are affected by fluctuations in the risk premiums (amounts of spread over risk-free rates) demanded by investors. Management attempts to limit the risk that economic conditions would force the Corporation to sell securities for realized losses by maintaining a strong capital position (discussed in the “Stockholders’ Equity and Capital Adequacy” section of Management’s Discussion and Analysis) and ample sources of liquidity (discussed in the “Liquidity” section of Management’s Discussion and Analysis).
The Corporation’s major category of market risk, interest rate risk, is discussed in the following section.
INTEREST RATE RISK
Business risk arising from changes in interest rates is an inherent factor in operating a bank. A significant portion of the Corporation’s assets are long-term, fixed-rate loans and debt securities. Funding for these assets comes principally from shorter-term deposits and borrowed funds. Accordingly, there is an inherent risk of lower future earnings or decline in fair value of the Corporation’s financial instruments when interest rates change.
| 38 |
The Corporation uses a simulation model to calculate the potential effects of interest rate fluctuations on net interest income and the market value of portfolio equity. For purposes of these calculations, the market value of portfolio equity includes the fair values of financial instruments, such as securities, loans, deposits and borrowed funds, and the book values of nonfinancial assets and liabilities, such as premises and equipment and accrued expenses. The model measures and projects potential changes in net interest income, and calculates the discounted present value of anticipated cash flows of financial instruments, assuming an immediate increase or decrease in interest rates. Management ordinarily runs a variety of scenarios within a range of plus or minus 100-400 basis points of current rates.
The model makes estimates, at each level of interest rate change, regarding cash flows from principal repayments on loans and mortgage-backed securities and call activity on other investment securities. Actual results could vary significantly from these estimates, which could result in significant differences in the calculations of projected changes in net interest income and market value of portfolio equity. Also, the model does not make estimates related to changes in the composition of the deposit portfolio that could occur due to rate competition, and the table does not necessarily reflect changes that management would make to realign the portfolio as a result of changes in interest rates.
The Corporation’s Board of Directors has established policy guidelines for acceptable levels of interest rate risk, based on an immediate increase or decrease in interest rates. The policy limits acceptable fluctuations in net interest income from the baseline (flat rates) one-year scenario and variances in the market value of portfolio equity from the baseline values based on current rates.
Table XIV, which follows this discussion, is based on the results of calculations performed using the simulation model as of December 31, 2017 and 2016. Table XIV reflects two significant changes to the analysis using December 31, 2017 data as compared to the analysis based on December 31, 2016 data, as follows:
| · | Management lowered assumptions of sensitivity of market interest rate changes on some types of the Corporation’s deposits. This change resulted in a reduction in the amount of increase in interest expense in the rising rate scenarios presented in Table XIV. The reduction in estimated sensitivity was based on data showing the Corporation’s prior sensitivity assumptions were higher than may be expected based on industry norms. |
| · | The policy limits for present value of equity volatility were lowered based on a determination that the prior levels were so high they would be unlikely to be approached, thereby limiting their effectiveness as a tool for timely identification of long-term interest rate risk. |
Table XIV shows that as of the respective dates, the changes in net interest income and changes in market value were within the policy limits in all scenarios.
| 39 |
TABLE XIV - THE EFFECT OF HYPOTHETICAL CHANGES IN INTEREST RATES
| December 31, 2017 Data | ||||
| (Dollars In Thousands) | Period Ending December 31, 2018 | |||
| Basis Point | Interest | Interest | Net Interest | NII | NII | |||||||||||||||
| Change in Rates | Income | Expense | Income (NII) | % Change | Risk Limit | |||||||||||||||
| +400 | $ | 57,619 | $ | 19,730 | $ | 37,889 | -10.8 | % | 25.0 | % | ||||||||||
| +300 | 54,978 | 15,852 | 39,126 | -7.9 | % | 20.0 | % | |||||||||||||
| +200 | 52,334 | 11,974 | 40,360 | -5.0 | % | 15.0 | % | |||||||||||||
| +100 | 49,620 | 8,095 | 41,525 | -2.2 | % | 10.0 | % | |||||||||||||
| 0 | 46,717 | 4,243 | 42,474 | 0.0 | % | 0.0 | % | |||||||||||||
| -100 | 43,581 | 2,781 | 40,800 | -3.9 | % | 10.0 | % | |||||||||||||
| -200 | 41,290 | 2,216 | 39,074 | -8.0 | % | 15.0 | % | |||||||||||||
| -300 | 40,463 | 2,191 | 38,272 | -9.9 | % | 20.0 | % | |||||||||||||
| -400 | 40,194 | 2,191 | 38,003 | -10.5 | % | 25.0 | % | |||||||||||||
| Market Value of Portfolio Equity at December 31, 2017 |
| Present | Present | Present | ||||||||||
| Basis Point | Value | Value | Value | |||||||||
| Change in Rates | Equity | % Change | Risk Limit | |||||||||
| +400 | $ | 195,385 | -16.8 | % | 40.0 | % | ||||||
| +300 | 203,648 | -13.3 | % | 30.0 | % | |||||||
| +200 | 213,689 | -9.0 | % | 25.0 | % | |||||||
| +100 | 224,389 | -4.4 | % | 15.0 | % | |||||||
| 0 | 234,759 | 0.0 | % | 0.0 | % | |||||||
| -100 | 236,030 | 0.5 | % | 15.0 | % | |||||||
| -200 | 234,863 | 0.0 | % | 25.0 | % | |||||||
| -300 | 252,464 | 7.5 | % | 30.0 | % | |||||||
| -400 | 292,124 | 24.4 | % | 40.0 | % | |||||||
| December 31, 2016 Data | |||||
| (Dollars In Thousands) | Period Ending December 31, 2017 | ||||
| Basis Point | Interest | Interest | Net Interest | NII | NII | |||||||||||||||
| Change in Rates | Income | Expense | Income (NII) | % Change | Risk Limit | |||||||||||||||
| +400 | $ | 53,712 | $ | 22,315 | $ | 31,397 | -20.5 | % | 25.0 | % | ||||||||||
| +300 | 51,128 | 17,545 | 33,583 | -15.0 | % | 20.0 | % | |||||||||||||
| +200 | 48,500 | 12,809 | 35,691 | -9.6 | % | 15.0 | % | |||||||||||||
| +100 | 45,845 | 8,102 | 37,743 | -4.4 | % | 10.0 | % | |||||||||||||
| 0 | 43,132 | 3,643 | 39,489 | 0.0 | % | 0.0 | % | |||||||||||||
| -100 | 40,581 | 2,978 | 37,603 | -4.8 | % | 10.0 | % | |||||||||||||
| -200 | 38,881 | 2,949 | 35,932 | -9.0 | % | 15.0 | % | |||||||||||||
| -300 | 38,269 | 2,936 | 35,333 | -10.5 | % | 20.0 | % | |||||||||||||
| -400 | 38,104 | 2,936 | 35,168 | -10.9 | % | 25.0 | % | |||||||||||||
| Market Value of Portfolio Equity at December 31, 2016 |
| Present | Present | Present | ||||||||||
| Basis Point | Value | Value | Value | |||||||||
| Change in Rates | Equity | % Change | Risk Limit | |||||||||
| +400 | $ | 168,600 | -24.6 | % | 50.0 | % | ||||||
| +300 | 180,500 | -19.3 | % | 45.0 | % | |||||||
| +200 | 194,471 | -13.1 | % | 35.0 | % | |||||||
| +100 | 208,830 | -6.7 | % | 25.0 | % | |||||||
| 0 | 223,744 | 0.0 | % | 0.0 | % | |||||||
| -100 | 227,806 | 1.8 | % | 25.0 | % | |||||||
| -200 | 229,602 | 2.6 | % | 35.0 | % | |||||||
| -300 | 252,118 | 12.7 | % | 45.0 | % | |||||||
| -400 | 290,792 | 30.0 | % | 50.0 | % | |||||||
| 40 |
The accompanying notes are an integral part of the consolidated financial statements.
| 41 |
| The accompanying notes are an integral part of the consolidated financial statements. |
| 42 |
The accompanying notes are an integral part of the consolidated financial statements.
| 43 |
Consolidated Statements of Changes in Stockholders’ Equity
| (In Thousands Except Share and Per Share Data) | Accumulated | |||||||||||||||||||||||||||||||
| Other | ||||||||||||||||||||||||||||||||
| Comprehensive | ||||||||||||||||||||||||||||||||
| Common | Treasury | Common | Paid-in | Retained | Income | Treasury | ||||||||||||||||||||||||||
| Shares | Shares | Stock | Capital | Earnings | (Loss) | Stock | Total | |||||||||||||||||||||||||
| Balance, January 1, 2015 | 12,655,171 | 375,191 | $ | 12,655 | $ | 71,541 | $ | 105,550 | $ | 5,360 | ($ | 6,744 | ) | $ | 188,362 | |||||||||||||||||
| Net income | 16,471 | 16,471 | ||||||||||||||||||||||||||||||
| Other comprehensive loss, net | (2,832 | ) | (2,832 | ) | ||||||||||||||||||||||||||||
| Cash dividends declared on common stock, $1.04 per share | (12,710 | ) | (12,710 | ) | ||||||||||||||||||||||||||||
| Shares issued for dividend reinvestment plan | (73,810 | ) | 86 | 1,379 | 1,465 | |||||||||||||||||||||||||||
| Treasury stock purchased | 226,900 | (4,415 | ) | (4,415 | ) | |||||||||||||||||||||||||||
| Shares issued from treasury related to exercise of stock options | (22,435 | ) | (27 | ) | 408 | 381 | ||||||||||||||||||||||||||
| Restricted stock granted | (34,800 | ) | (627 | ) | 627 | 0 | ||||||||||||||||||||||||||
| Forfeiture of restricted stock | 3,502 | 59 | (59 | ) | 0 | |||||||||||||||||||||||||||
| Stock-based compensation expense | 606 | 606 | ||||||||||||||||||||||||||||||
| Tax benefit from compensation plans | 16 | 143 | 159 | |||||||||||||||||||||||||||||
| Balance, December 31, 2015 | 12,655,171 | 474,548 | 12,655 | 71,654 | 109,454 | 2,528 | (8,804 | ) | 187,487 | |||||||||||||||||||||||
| Net income | 15,762 | 15,762 | ||||||||||||||||||||||||||||||
| Other comprehensive loss, net | (3,426 | ) | (3,426 | ) | ||||||||||||||||||||||||||||
| Cash dividends declared on common stock, $1.04 per share | (12,578 | ) | (12,578 | ) | ||||||||||||||||||||||||||||
| Shares issued for dividend reinvestment plan | (68,571 | ) | 170 | 1,296 | 1,466 | |||||||||||||||||||||||||||
| Treasury stock purchased | 187,300 | (3,723 | ) | (3,723 | ) | |||||||||||||||||||||||||||
| Shares issued from treasury related to exercise of stock options | (19,113 | ) | (98 | ) | 361 | 263 | ||||||||||||||||||||||||||
| Restricted stock granted | (35,427 | ) | (658 | ) | 658 | 0 | ||||||||||||||||||||||||||
| Forfeiture of restricted stock | 3,431 | 61 | (61 | ) | 0 | |||||||||||||||||||||||||||
| Stock-based compensation expense | 578 | 578 | ||||||||||||||||||||||||||||||
| Other stock-based expense | (225 | ) | 4 | 4 | ||||||||||||||||||||||||||||
| Tax benefit from compensation plans | 23 | 152 | 175 | |||||||||||||||||||||||||||||
| Balance, December 31, 2016 | 12,655,171 | 541,943 | 12,655 | 71,730 | 112,790 | (898 | ) | (10,269 | ) | 186,008 | ||||||||||||||||||||||
| Net income | 13,434 | 13,434 | ||||||||||||||||||||||||||||||
| Other comprehensive loss, net | (609 | ) | (609 | ) | ||||||||||||||||||||||||||||
| Cash dividends declared on common stock, $1.04 per share | (12,616 | ) | (12,616 | ) | ||||||||||||||||||||||||||||
| Shares issued for dividend reinvestment plan | (63,066 | ) | 276 | 1,195 | 1,471 | |||||||||||||||||||||||||||
| Shares issued from treasury related to exercise of stock options | (11,780 | ) | (100 | ) | 227 | 127 | ||||||||||||||||||||||||||
| Restricted stock granted | (30,782 | ) | (583 | ) | 583 | 0 | ||||||||||||||||||||||||||
| Forfeiture of restricted stock | 4,406 | 85 | (85 | ) | 0 | |||||||||||||||||||||||||||
| Stock-based compensation expense | 627 | 627 | ||||||||||||||||||||||||||||||
| Other stock-based expense | (75 | ) | 1 | 1 | ||||||||||||||||||||||||||||
| Balance, December 31, 2017 | 12,655,171 | 440,646 | $ | 12,655 | $ | 72,035 | $ | 113,608 | $ | (1,507 | ) | $ | (8,348 | ) | $ | 188,443 | ||||||||||||||||
The accompanying notes are an integral part of the consolidated financial statements.
| 44 |
| SUPPLEMENTAL DISCLOSURES OF CASH FLOW INFORMATION: | ||||||||||||
| Assets acquired through foreclosure of real estate loans | $ | 940 | $ | 1,508 | $ | 2,523 | ||||||
| Interest paid | $ | 3,934 | $ | 3,698 | $ | 4,636 | ||||||
| Income taxes paid | $ | 4,913 | $ | 5,129 | $ | 4,827 | ||||||
The accompanying notes are an integral part of the consolidated financial statements.
| 45 |
NOTES TO CONSOLIDATED FINANCIAL STATEMENTS
1 . NATURE OF OPERATIONS AND SUMMARY OF SIGNIFICANT ACCOUNTING POLICIES
BASIS OF CONSOLIDATION – The consolidated financial statements include the accounts of Citizens & Northern Corporation and its subsidiaries, Citizens & Northern Bank (“C&N Bank”), Bucktail Life Insurance Company and Citizens & Northern Investment Corporation (collectively, “Corporation”), as well as C&N Bank’s wholly-owned subsidiary, C&N Financial Services Corporation. In December 2017, C&N Bank established a new entity, Northern Tier Holding LLC, for the purpose of acquiring, holding and disposing of real property acquired by the Bank. C&N Bank is the sole member of Northern Tier Holding LLC, which had no transactions in 2017. All material intercompany balances and transactions have been eliminated in consolidation.
NATURE OF OPERATIONS – The Corporation is primarily engaged in providing a full range of banking and mortgage services to individual and corporate customers in North Central Pennsylvania and Southern New York State. Lending products include mortgage loans, commercial loans and consumer loans, as well as specialized instruments such as commercial letters-of-credit. Deposit products include various types of checking accounts, passbook and statement savings, money market accounts, interest checking accounts, Individual Retirement Accounts and certificates of deposit. The Corporation also offers non-insured “RepoSweep” accounts.
The Corporation provides Trust and Financial Management services, including administration of trusts and estates, retirement plans, and other employee benefit plans, and investment management services. The Corporation offers a variety of personal and commercial insurance products through C&N Financial Services Corporation. C&N Financial Services Corporation also offers mutual funds, annuities, educational savings accounts and other investment products through registered agents.
Management has determined that the Corporation has one reportable segment, “Community Banking.” All of the Corporation’s activities are interrelated, and each activity is dependent and assessed based on how each of the activities of the Corporation supports the others.
The Corporation is subject to competition from other financial institutions. It is also subject to regulation by certain federal and state agencies and undergoes periodic examination by those regulatory authorities. As a consequence, the Corporation’s business is particularly susceptible to being affected by future federal and state legislation and regulations.
USE OF ESTIMATES – The financial information is presented in accordance with generally accepted accounting principles and general practice for financial institutions in the United States of America (“U.S. GAAP”). In preparing financial statements, management is required to make estimates and assumptions that affect the reported amount of assets and liabilities and disclosure of contingent assets and liabilities as of the date of the financial statements. In addition, these estimates and assumptions affect revenues and expenses in the financial statements and as such, actual results could differ from those estimates.
Material estimates that are particularly susceptible to change include: (1) the allowance for loan losses, (2) fair values of debt securities based on estimates from independent valuation services or from brokers, (3) assessment of impaired securities to determine whether or not the securities are other-than-temporarily impaired, (4) valuation of deferred tax assets and (5) valuation of obligations from defined benefit plans.
INVESTMENT SECURITIES – Investment securities are accounted for as follows:
Available-for-sale securities – includes debt securities not classified as held-to-maturity or trading, and unrestricted equity securities. Such securities are reported at fair value, with unrealized gains and losses excluded from earnings and reported separately through accumulated other comprehensive income (loss), net of tax. Amortization of premiums and accretion of discounts on available-for-sale securities are recorded using the level yield method over the remaining contractual life of the securities, adjusted for actual prepayments. Realized gains and losses on sales of available-for-sale securities are computed on the basis of specific identification of the adjusted cost of each security. Securities within the available-for-sale portfolio may be used as part of the Corporation’s asset and liability management strategy and may be sold in response to changes in interest rate risk, prepayment risk or other factors.
Other-than-temporary impairment – Credit-related declines in the fair value of available-for-sale securities that are deemed to be other-than-temporary are reflected in earnings as realized losses. In estimating other-than-temporary impairment (OTTI) losses, management considers (1) the length of time and the extent to which the fair value has been less than cost, (2) the financial condition and near-term prospects of the issuer, (3) the intent and ability of the Corporation to retain its investment in the issuer for a period of time sufficient to allow for any anticipated recovery in fair value, and (4) whether the Corporation intends to sell the security or if it is more likely than not that the Corporation will be required to sell the security before the recovery of its amortized cost basis. The credit-related impairment is recognized in earnings and is the difference between a security’s amortized cost basis and the present value of expected future cash flows discounted at the security’s effective interest rate. For debt securities classified as held-to-maturity, if any, the amount of noncredit-related impairment is recognized in other comprehensive income and accreted over the remaining life of the debt security as an increase in the carrying value of the security.
| 46 |
Restricted equity securities – Restricted equity securities consist primarily of Federal Home Loan Bank of Pittsburgh stock, and are carried at cost and evaluated for impairment. Holdings of restricted equity securities are included in Other Assets in the consolidated balance sheets, and dividends received on restricted securities are included in Other Income in the consolidated statements of income.
LOANS HELD FOR SALE – Mortgage loans held for sale are reported at the lower of cost or market, determined in the aggregate.
LOANS RECEIVABLE – Loans receivable which management has the intent and ability to hold for the foreseeable future or until maturity or payoff are stated at unpaid principal balances, less the allowance for loan losses and net deferred loan fees. Interest income is accrued on the unpaid principal balance. Loan origination and commitment fees, as well as certain direct origination costs, are deferred and amortized as a yield adjustment over the lives of the related loans using the interest method.
The loans receivable portfolio is segmented into residential mortgage, commercial and consumer loans. The residential mortgage segment includes the following classes: first and junior lien residential mortgages, home equity lines of credit and residential construction loans. The most significant classes of commercial loans are commercial loans secured by real estate, non-real estate secured commercial and industrial loans, loans to political subdivisions, commercial construction, and loans secured by farmland.
Loans are placed on nonaccrual status for all classes of loans when, in the opinion of management, collection of interest is doubtful. Any unpaid interest previously accrued on those loans is reversed from income. Interest income is not recognized on specific impaired loans unless the likelihood of further loss is remote. Interest payments received on loans for which the risk of further loss is greater than remote are applied as a reduction of the loan principal balance. Interest income on other nonaccrual loans is recognized only to the extent of interest payments received. Generally, loans are restored to accrual status when the obligation is brought current, has performed in accordance with the contractual terms for a reasonable period of time (generally six months) and the ultimate collectability of the total contractual principal and interest is no longer in doubt. The past due status of all classes of loans receivable is determined based on contractual due dates for loan payments. Also, the amortization of deferred loan fees is discontinued when a loan is placed on nonaccrual status.
ALLOWANCE FOR LOAN LOSSES – The allowance for loan losses represents management’s estimate of losses inherent in the loan portfolio as of the balance sheet date and is recorded as a reduction to loans. The allowance for loan losses is increased by the provision for loan losses, and decreased by charge-offs, net of recoveries. Loans deemed to be uncollectible are charged against the allowance for loan losses, and subsequent recoveries, if any, are credited to the allowance. All, or part, of the principal balance of loans receivable are charged off to the allowance as soon as it is determined that the collection of all, or part, of the principal balance is highly unlikely. Non-residential consumer loans are generally charged off no later than when they are 120 days past due on a contractual basis, or earlier in the event of bankruptcy or if there is an amount deemed uncollectible.
The allowance for loan losses is maintained at a level considered adequate to provide for losses that can be reasonably anticipated. Management performs a quarterly evaluation of the adequacy of the allowance. The allowance is based on the Corporation’s past loan loss experience, known and inherent risks in the portfolio, adverse situations that may affect the borrower’s ability to repay, the estimated value of any underlying collateral, composition of the loan portfolio, current economic conditions and other relevant factors. This evaluation is inherently subjective as it requires material estimates that may be susceptible to significant revision as more information becomes available. In addition, various regulatory agencies, as an integral part of their examination process, periodically review the Corporation’s allowance for loan losses. Such agencies may require the Corporation to recognize adjustments to the allowance based on their judgments of information available to them at the time of their examination. In the process of evaluating the loan portfolio, management also considers the Corporation’s exposure to losses from unfunded loan commitments. As of December 31, 2017 and 2016, management determined that no allowance for credit losses related to unfunded loan commitments was required.
The allowance consists primarily of two major components – (1) a specific component based on a detailed assessment of certain larger loan relationships, mainly commercial purpose, determined on a loan-by-loan basis; and (2) a general component for the remainder of the portfolio based on a collective evaluation of pools of loans with similar risk characteristics. The general component is assigned to each pool of loans based on both historical net charge-off experience, and an evaluation of certain qualitative factors. An unallocated component is maintained to cover uncertainties that could affect management’s estimate of probable losses. The unallocated component of the allowance reflects the margin of imprecision inherent in the underlying assumptions used in the above methodologies for estimating specific and general losses in the portfolio.
The specific component relates to loans that are classified as impaired based on a detailed assessment of certain larger loan relationships evaluated by a management committee referred to as the Watch List Committee. Specific loan relationships are identified for evaluation based on the related credit risk rating. For individual loans classified as impaired, an allowance is established when the collateral value less estimated selling costs, present value of discounted cash flows or observable market price of the impaired loan is lower than the carrying value of that loan.
| 47 |
The general component covers pools of loans by loan class including commercial loans not considered individually impaired, as well as smaller balance homogeneous classes of loans, such as residential real estate, home equity lines of credit and other consumer loans. Accordingly, the Corporation generally does not separately identify individual consumer and residential loans for impairment disclosures, unless such loans are subject to a restructuring agreement. The pools of loans for each loan segment are evaluated for loss exposure based upon average historical net charge-off rates, adjusted for qualitative factors. The time period used in determining the average historical net charge-off rate for each loan class is based on management’s evaluation of an appropriate time period that captures an historical loss experience relevant to the current portfolio. Qualitative risk factors (described in the following paragraph) are evaluated for the impact on each of the three distinct segments (residential mortgage, commercial and consumer) within the loan portfolio. Each qualitative factor is assigned a value to reflect improving, stable or declining conditions based on management’s judgment using relevant information available at the time of the evaluation. Any adjustments to the factors are supported by a narrative documentation of changes in conditions accompanying the allowance for loan losses calculation.
The qualitative factors used in the general component calculations are designed to address credit risk characteristics associated with each segment. The Corporation’s credit risk associated with all of the segments is significantly impacted by these factors, which include economic conditions within its market area, the Corporation’s lending policies, changes or trends in the portfolio, risk profile, competition, regulatory requirements and other factors. Further, the residential mortgage segment is significantly affected by the values of residential real estate that provide collateral for the loans. The majority of the Corporation’s commercial segment loans (approximately 53% at December 31, 2017) are secured by real estate, and accordingly, the Corporation’s risk for the commercial segment is significantly affected by commercial real estate values. The consumer segment includes a wide mix of loans for different purposes, primarily secured loans, including loans secured by motor vehicles, manufactured housing and other types of collateral.
Loans are classified as impaired when, based on current information and events, it is probable that the Corporation will be unable to collect the scheduled payments of principal or interest when due according to the contractual terms of the loan agreement. Factors considered by management in determining impairment include payment status, collateral value and the probability of collecting scheduled principal and interest payments when due. Loans that experience insignificant payment delays and payment shortfalls generally are not classified as impaired. Management determines the significance of payment delays and payment shortfalls on a case-by-case basis, taking into consideration all of the circumstances surrounding the loan and the borrower, including the length of the delay, the reasons for the delay, the borrower’s prior payment record and the amount of shortfall in relation to the principal and interest owed. Impairment is measured on a loan-by-loan basis for commercial loans by the fair value of the collateral (if the loan is collateral dependent), by future cash flows discounted at the loan’s effective rate or by the loan’s observable market price.
For commercial loans secured by real estate, estimated fair values are determined primarily through third-party appraisals. When a real estate secured loan becomes impaired, a decision is made regarding whether an updated certified appraisal of the real estate is necessary. This decision is based on various considerations, including the age of the most recent appraisal, the loan-to-value ratio based on the original appraisal and the condition of the property. Appraised values are discounted to arrive at the estimated selling price of the collateral, which is considered to be the estimated fair value. The discounts also include estimated costs to sell the property.
For commercial and industrial loans secured by non-real estate collateral, such as accounts receivable, inventory and equipment, estimated fair values are determined based on the borrower’s financial statements, inventory reports, accounts receivable aging data or equipment appraisals or invoices. Indications of value from these sources are generally discounted based on the age of the financial information or the quality of the assets.
Loans whose terms are modified are classified as troubled debt restructurings if the Corporation grants such borrowers concessions and it is deemed that those borrowers are experiencing financial difficulty. Concessions granted under a troubled debt restructuring generally involve reductions in required payments, an extension of a loan’s stated maturity date or a temporary reduction in interest rate. Loans classified as troubled debt restructurings are designated as impaired. Non-accrual troubled debt restructurings may be restored to accrual status if the ultimately collectability of principal and interest payments under the modified terms is not in doubt, and there has been a period (generally, for at least six consecutive months) of satisfactory payment performance by the borrower either immediately before or after the restructuring.
BANK PREMISES AND EQUIPMENT – Bank premises and equipment are stated at cost less accumulated depreciation. Repair and maintenance expenditures which extend the useful lives of assets are capitalized, and other repair and maintenance expenditures are expensed as incurred. Depreciation expense is computed using the straight-line method.
| 48 |
IMPAIRMENT OF LONG-LIVED ASSETS – The Corporation reviews long-lived assets, such as premises and equipment and intangibles, for impairment whenever events or changes in circumstances indicate the carrying amount of an asset may not be recoverable. These changes in circumstances may include a significant decrease in the market value of an asset or the manner in which an asset is used. If there is an indication the carrying value of an asset may not be recoverable, future undiscounted cash flows expected to result from use of the asset are estimated. If the sum of the expected cash flows is less than the carrying value of the asset, a loss is recognized for the difference between the carrying value and fair market value of the asset.
FORECLOSED ASSETS HELD FOR SALE – Foreclosed assets held for sale consist of real estate acquired by foreclosure and are initially recorded at fair value, less estimated selling costs.
GOODWILL AND CORE DEPOSIT INTANGIBLE ASSETS – Goodwill represents the excess of the cost of acquisitions over the fair value of the net assets acquired. Goodwill is tested at least annually for impairment, or more often if events or circumstances indicate there may be impairment. Core deposit intangibles are being amortized over periods of time that represent the expected lives using a method of amortization that reflects the pattern of economic benefit. Core deposit intangibles are subject to impairment testing whenever events or changes in circumstances indicate their carrying amounts may not be recoverable .
SERVICING RIGHTS – The estimated fair value of servicing rights related to mortgage loans sold and serviced by the Corporation is recorded as an asset upon the sale of such loans. The valuation of servicing rights is adjusted quarterly, with changes in fair value included in Loan Servicing Fees, Net, in the consolidated statements of income. Significant inputs to the valuation include expected net servicing income to be received, the expected life of the underlying loans and the discount rate. The servicing rights asset is included in Other Assets in the consolidated balance sheets.
INCOME TAXES – Deferred tax assets and liabilities are recognized for the future tax consequences attributable to differences between the financial statement carrying amount of existing assets and liabilities and their respective tax bases given the provisions of the enacted tax laws. Deferred tax assets are reduced, if necessary, by the amount of such benefits that are not expected to be realized based upon available evidence. Tax benefits from investments in limited partnerships that have qualified for federal low-income tax credits are recognized as a reduction in the provision for income tax over the term of the investment using the effective yield method. The Corporation includes income tax penalties in the provision for income tax. The Corporation has no accrued interest related to unrecognized tax benefits.
STOCK COMPENSATION PLANS – The Corporation’s stock-based compensation policy applies to all forms of stock-based compensation including stock options and restricted stock units. All stock-based compensation is accounted for under the fair value method as required by U.S. GAAP. The expense associated with stock-based compensation is recognized over the vesting period of each individual arrangement.
The fair value of each stock option is estimated on the date of grant using the Black-Scholes-Merton option valuation model. The fair value of restricted stock is based on the current market price on the date of grant.
OFF-BALANCE SHEET FINANCIAL INSTRUMENTS – In the ordinary course of business, the Corporation has entered into off-balance sheet financial instruments consisting of commitments to extend credit and standby letters of credit. Such financial instruments are recorded in the financial statements when they become payable.
CASH FLOWS – The Corporation utilizes the net reporting of cash receipts and cash payments for certain deposit and lending activities. Cash equivalents include federal funds sold and all cash and amounts due from depository institutions and interest-bearing deposits in other banks with original maturities of three months or less.
TRUST ASSETS AND INCOME – Assets held by the Corporation in a fiduciary or agency capacity for its customers are not included in the financial statements since such items are not assets of the Corporation. Trust income is recorded on a cash basis, which is not materially different from the accrual basis.
2. RECENT ACCOUNTING PRONOUNCEMENTS
The Financial Accounting Standards Board (“FASB”) issues Accounting Standards Updates (ASUs) to the FASB Accounting Standards Codification (ASC). This section provides a summary description of recent ASUs that have significant implications (elected or required) within the consolidated financial statements, or that management expects may have a significant impact on financial statements issued in the near future.
| 49 |
In May 2014, the FASB issued ASU 2014-09, Revenue from Contracts with Customers, which provides a principles-based framework for revenue recognition under U.S. GAAP. The core principle of the five-step revenue recognition framework is that an entity should recognize revenue to depict the transfer of promised goods or services to customers in an amount that reflects the consideration to which the entity expects to be entitled in exchange for those goods or services. Several additional ASUs have been issued subsequent to ASU 2014-09 to provide clarifying guidance related to various revenue recognition areas and to defer the effective date of the standard by a year, making it applicable for the Corporation in the first quarter 2018 and for the annual period ending December 31, 2018. More than 70% of the Corporation’s revenue comes from net interest income and is explicitly out of the scope of ASU 2014-09. The Corporation’s largest sources of noninterest revenue which are subject to the guidance include Trust and financial management revenue, service charges on deposit accounts and interchange revenue from debit card transactions. Management has evaluated the Corporation’s noninterest revenue streams and adoption of ASU 2014-09 using the modified retrospective method had no effect on the Corporation’s revenue recognition practices. Additionally, the ASU requires expanded disclosures to help users of financial statements better understand the nature, amount, timing, and uncertainty of revenue that is recognized. Management is in the process of reviewing the Corporation’s business processes, systems and controls to support the expanded disclosure requirements that will be effective in the first quarter 2018.
In January 2016, the FASB issued ASU 2016-01, Recognition and Measurement of Financial Assets and Liabilities. This makes significant changes in U.S. GAAP related to certain aspects of recognition, measurement, presentation and disclosure of financial instruments. The changes provided for in this Update that are applicable to the Corporation are as follows: (1) require equity investments (except those accounted for under the equity method of accounting or those that result in consolidation of the investee) to be measured at fair value with changes in fair value recognized in net income; however, an entity may choose to measure equity investments that do not have readily determinable fair values at cost minus impairment, if any, plus or minus changes resulting from observable price changes in orderly transactions for the identical or a similar investment of the same issuer; (2) for equity investments without readily determinable fair values, require a qualitative assessment to identify impairment, and if a qualitative assessment indicates that impairment exists, requiring an entity to measure the investment at fair value; (3) eliminate the requirement for public business entities to disclose the method(s) and significant assumptions used to estimate the fair value that is required to be disclosed for financial instruments measured at amortized cost on the balance sheet; (4) require public business entities to use the exit price notion when measuring the fair value of financial instruments for disclosure purposes; (5) require an entity to present separately in other comprehensive income the portion of the total change in the fair value of a liability resulting from a change in the instrument-specific credit risk when the entity has elected to measure the liability at fair value in accordance with the fair value option for financial instruments (at December 31, 2017 and 2016, the Corporation has no liabilities for which the fair value measurement option has been elected); (6) require separate presentation of financial assets and financial liabilities by measurement category and form of financial asset (that is, securities or loans and receivables) on the balance sheet or the accompanying notes to the financial statements; and (7) clarify that an entity should evaluate the need for a valuation allowance on a deferred tax asset related to available-for-sale securities in combination with the entity’s other deferred tax assets. The amendments in this Update will become effective for the Corporation for annual and interim periods beginning in the first quarter 2018. With limited exceptions, early adoption of the amendments in this Update is not permitted. Amendments are to be applied by means of a cumulative-effect adjustment to the balance sheet as of the beginning of the fiscal year of adoption. The amendments related to equity securities without readily determinable fair values should be applied prospectively. The Corporation’s current exposure related to investments in marketable equity securities and other issues considered in ASU 2016-01 is limited, and accordingly, initial adoption of this ASU had no effect on the Corporation’s financial position. Management is in the process of reviewing the changes in disclosure requirements that will become effective in the first quarter 2018.
In February 2016, the FASB issued ASU 2016-02, Leases (Topic 842). The core principle of Topic 842 is that a lessee should recognize the assets and liabilities that arise from leases. Specifically, a lessee should recognize on the balance sheet a liability to make lease payments (the lease liability) and a right-of-use asset representing its right to use the underlying asset for the lease term. For leases with a term of 12 months or less, a lessee would be permitted to make an accounting policy election by class of underlying asset not to recognize lease assets and liabilities. Topic 842 would not significantly change the recognition, measurement and presentation of expenses and cash flows arising from a lease by a lessee from current U.S. GAAP; however, the principal change from current GAAP is that lease assets and liabilities arising from operating leases would be recognized on the balance sheet. Topic 842 provides several other changes or clarifications to existing GAAP, and will require qualitative disclosures, along with quantitative disclosures, so that financial statement users can understand more about the nature of an entity’s leasing activities. In transition, Topic 842 provides that lessees and lessors are required to recognize and measure leases at the beginning of the earliest period presented using a modified retrospective approach, including optional practical expedients. An entity that elects to apply the practical expedients will, in effect, continue to account for leases that commence before the effective date in accordance with previous GAAP unless the lease is modified, except that lessees will be required to recognize a right-of-use asset and a lease liability for all operating leases at each reporting date based on the present value of the remaining minimum rental payments that were tracked and disclosed under previous GAAP. Topic 842 will become effective for the Corporation for annual and interim periods beginning in the first quarter 2019. The Corporation is in the early stages of evaluating the potential impact of adopting this amendment.
In March 2016, the FASB issued ASU No. 2016-07, Investments – Equity Method and Joint Ventures. This ASU eliminates the requirement that when an investment qualifies for the equity method as a result of an increase in the level of ownership interest or influence, an investor must adjust the investment, results of operations and retained earnings retroactively as if the equity method had been in effect during all previous periods the investment had been held. The ASU requires the equity method investor to add the cost of acquiring an additional interest in the investee to the basis of the investor’s previously held interest and adopt the equity method of accounting as of the date the investment becomes qualified for the equity method. The ASU further requires that an entity that has an available-for-sale equity security that becomes qualified for the equity method recognize through earnings the unrealized gain or loss in accumulated other comprehensive income at the date the investment becomes qualified for use of the equity method. The amendments in this Update were effective for the Corporation for annual and interim periods beginning in the first quarter 2017. Initial adoption of this ASU in 2017 did not have a significant impact on the Corporation.
| 50 |
In March 2016, the FASB issued ASU No. 2016-09, Compensation – Stock Compensation. This ASU changes several aspects of accounting for share-based payment transactions, and includes some changes that apply only to nonpublic companies. This Update includes amendments that currently apply, or may apply in the future, to the Corporation related to the following: (1) accounting for the difference between the deduction for tax purposes and the amount of compensation cost recognized for financial reporting purposes; (2) classification of excess tax benefits on the statement of cash flows; (3) accounting for forfeitures; (4) accounting for awards partially settled in cash in excess of the employer’s minimum statutory tax withholding requirements; and (5) classification of employee taxes paid on the statement of cash flows when an employer withholds shares for tax-withholding purposes. The amendments in this Update were effective for the Corporation for annual and interim periods beginning in the first quarter 2017. The ASU provides separate transition provisions for each of the amendments. Initial adoption of this ASU in 2017 did not have a significant impact on the Corporation.
In June 2016, the FASB issued ASU 2016-13, Financial Instruments-Credit Losses (Topic 326). This ASU will result in significant changes in the Corporation’s accounting for credit losses related to loans receivable and investment securities. A summary of significant provisions of this ASU is as follows:
| · | The ASU requires that a financial asset (or a group of financial assets) measured at amortized cost basis be presented, net of a valuation allowance for credit losses, at an amount expected to be collected on the financial asset(s), and that the income statement include the measurement of credit losses for newly recognized financial assets as well as changes in expected losses on previously recognized financial assets. The provisions of this ASU require measurement of expected credit losses based on relevant information including past events, historical experience, current conditions, and reasonable and supportive forecasts that affect the collectability of the asset. The provisions of this ASU differ from current U.S. GAAP in that current U.S. GAAP generally delays recognition of the full amount of credit losses until the loss is probable of occurring. |
| · | The amendments in the Update retain many of the disclosure requirements related to credit quality in current U.S. GAAP, updated to reflect the change from an incurred loss methodology to an expected credit loss methodology. |
| · | In addition, the Update requires that disclosure of credit quality indicators in relation to the amortized cost of financing receivables, a current requirement, be further disaggregated by year of origination. |
| · | This ASU requires that credit losses on available-for-sale debt securities be presented as an allowance rather than as a write-down, and limits the amount of the allowance for credit losses to the amount by which the fair value is below amortized cost. For purchased available-for-sale securities with a more-than-insignificant amount of credit deterioration since origination, the ASU requires an allowance be determined in a manner similar to other available-for-sale debt securities; however, the initial allowance would be added to the purchase price, with only subsequent changes in the allowance recorded in credit loss expense, and interest income recognized at the effective rate excluding the discount embedded in the purchase price related to estimated credit losses at acquisition. |
| · | This ASU will be effective for the Corporation for interim and annual periods beginning in the first quarter of 2020. Earlier adoption is permitted beginning in the first quarter of 2019. The Corporation will record the effect of implementing this ASU through a cumulative-effect adjustment through retained earnings as of the beginning of the reporting period in which Topic 326 is effective. |
The Corporation is in the early stages of evaluating the potential impact of adopting this amendment.
In June 2016, the FASB issued ASU 2016-15, Statement of Cash Flows (Topic 230) – Classification of Certain Cash Receipts and Cash Payments. This Update provides clarification regarding eight specific cash flow issues with the objective of reducing diversity in practice in how certain cash receipts and cash payments are presented and classified in the statement of cash flows. For the Corporation, the amendments in this Update are effective beginning in the first quarter 2018. The amendments in this Update should be applied using a retroactive transition method to each period presented. The Corporation anticipates there will be no adjustments to the Consolidated Statements of Cash Flows, as previously reported, as a result of the clarifications provided in the Update.
In January 2017, the FASB issued ASU 2017-04, Intangibles – Goodwill and Other (Topic 350) to simplify the accounting for goodwill impairment. This guidance, among other things, removes step 2 of the goodwill impairment test thus eliminating the need to determine the fair value of individual assets and liabilities of the reporting unit. Upon adoption of this ASU, goodwill impairment will be the amount by which a reporting unit’s carrying value exceeds its fair value, not to exceed the carrying amount of goodwill. This may result in more or less impairment being recognized than under current guidance. This Update will become effective for the Corporation’s annual and interim goodwill impairment tests beginning in the first quarter of 2020.
| 51 |
In March 2017, the FASB issued ASU 2017-08, Receivables – Nonrefundable Fees and Other Costs (Subtopic 310-20). This Update will shorten the amortization period for certain callable debt securities held at a premium. Under current U.S. GAAP, entities generally amortize the premium over the contractual life of the instrument. This Update requires the premium be amortized to the earliest call date. Discounts will continue to be amortized to maturity. The Corporation expects to adopt the amendments in this Update through a cumulative-effect adjustment directly to retained earnings in 2018, and does not expect the amount of the adjustment to be significant.
3. COMPREHENSIVE INCOME
Comprehensive income is the total of (1) net income, and (2) all other changes in equity from non-stockholder sources, which are referred to as other comprehensive (loss) income. The components of other comprehensive (loss) income, and the related tax effects, are as follows:
| (In Thousands) | Before-Tax | Income Tax | Net-of-Tax | |||||||||
| Amount | Effect | Amount | ||||||||||
| 2017 | ||||||||||||
| Unrealized losses on available-for-sale securities: | ||||||||||||
| Unrealized holding losses on available-for-sale securities | $ | (691 | ) | $ | 242 | $ | 449 | ) | ||||
| Reclassification adjustment for (gains) realized in income | (257 | ) | 89 | (168 | ) | |||||||
| Other comprehensive loss on available-for-sale securities | (948 | ) | 331 | (617 | ) | |||||||
| Unfunded pension and postretirement obligations: | ||||||||||||
| Changes from plan amendments and actuarial gains and losses included in other comprehensive income | 36 | (12 | ) | 24 | ||||||||
| Amortization of net transition obligation, prior service cost and net actuarial gain included in net periodic benefit cost | (24 | ) | 8 | (16 | ) | |||||||
| Other comprehensive income on unfunded retirement obligations | 12 | (4 | ) | 8 | ||||||||
| Total other comprehensive loss | $ | (936 | ) | $ | 327 | $ | 609 | ) | ||||
| (In Thousands) | Before-Tax | Income Tax | Net-of-Tax | |||||||||
| Amount | Effect | Amount | ||||||||||
| 2016 | ||||||||||||
| Unrealized losses on available-for-sale securities: | ||||||||||||
| Unrealized holding losses on available-for-sale securities | $ | (4,138 | ) | $ | 1,448 | $ | 2,690 | ) | ||||
| Reclassification adjustment for (gains) realized in income | (1,158 | ) | 406 | (752 | ) | |||||||
| Other comprehensive loss on available-for-sale securities | (5,296 | ) | 1,854 | (3,442 | ) | |||||||
| Unfunded pension and postretirement obligations: | ||||||||||||
| Changes from plan amendments and actuarial gains and losses included in other comprehensive income | 46 | (16 | ) | 30 | ||||||||
| Amortization of net transition obligation, prior service cost and net actuarial gain included in net periodic benefit cost | (22 | ) | 8 | (14 | ) | |||||||
| Other comprehensive income on unfunded retirement obligations | 24 | (8 | ) | 16 | ||||||||
| Total other comprehensive loss | $ | (5,272 | ) | $ | 1,846 | $ | (3,426 | ) | ||||
| 52 |
| (In Thousands) | Before-Tax | Income Tax | Net-of-Tax | |||||||||
| Amount | Effect | Amount | ||||||||||
| 2015 | ||||||||||||
| Unrealized losses on available-for-sale securities: | ||||||||||||
| Unrealized holding losses on available-for-sale securities | $ | (1,429 | ) | $ | 500 | $ | (929 | ) | ||||
| Reclassification adjustment for (gains) realized in income | (2,861 | ) | 1,002 | (1,859 | ) | |||||||
| Other comprehensive loss on available-for-sale securities | (4,290 | ) | 1,502 | (2,788 | ) | |||||||
| Unfunded pension and postretirement obligations: | ||||||||||||
| Changes from plan amendments and actuarial gains and losses included in other comprehensive loss | (135 | ) | 47 | (88 | ) | |||||||
| Amortization of net transition obligation, prior service cost, net actuarial loss and loss on settlement included in net period benefit cost | 67 | (23 | ) | 44 | ||||||||
| Other comprehensive loss on unfunded retirement obligations | (68 | ) | 24 | (44 | ) | |||||||
| Total other comprehensive loss | $ | (4,358 | ) | $ | 1,526 | $ | (2,832 | ) | ||||
Changes in the components of accumulated other comprehensive (loss) income, included in stockholders’ equity, are as follows:
| (In Thousands) | Unrealized | Accumulated | ||||||||||
| Holding (Losses) | Unfunded | Other | ||||||||||
| Gains on | Retirement | Comprehensive | ||||||||||
| Securities | Obligations | (Loss) Income | ||||||||||
| 2017 | ||||||||||||
| Balance, beginning of period | $ | (949 | ) | $ | 51 | $ | (898 | ) | ||||
| Change during year ended December 31, 2017 | (617 | ) | 8 | (609 | ) | |||||||
| Balance, end of period | $ | (1,566 | ) | $ | 59 | $ | (1,507 | ) | ||||
| 2016 | ||||||||||||
| Balance, beginning of period | $ | 2,493 | $ | 35 | $ | 2,528 | ||||||
| Change during year ended December 31, 2016 | (3,442 | ) | 16 | (3,426 | ) | |||||||
| Balance, end of period | $ | (949 | ) | $ | 51 | $ | (898 | ) | ||||
| 2015 | ||||||||||||
| Balance, beginning of period | $ | 5,281 | $ | 79 | $ | 5,360 | ||||||
| Change during year ended December 31, 2015 | (2,788 | ) | (44 | ) | (2,832 | ) | ||||||
| Balance, end of period | $ | 2,493 | $ | 35 | $ | 2,528 | ||||||
Items reclassified out of each component of accumulated other comprehensive (loss) income are as follows:
| For the Year Ended December 31, 2017 | ||||||
| (In Thousands) | ||||||
| Reclassified from | ||||||
| Details about Accumulated Other | Accumulated Other | Affected Line Item in the Consolidated | ||||
| Comprehensive Loss Components | Comprehensive Loss | Statements of Income | ||||
| Unrealized gains and losses on available-for-sale securities | $ | (257 | ) | Realized gains on available-for-sale securities, net | ||
| 89 | Income tax provision | |||||
| (168 | ) | Net of tax | ||||
| Amortization of defined benefit pension and postretirement items: | ||||||
| Prior service cost | (31 | ) | Pensions and other employee benefits | |||
| Actuarial loss | 7 | Pensions and other employee benefits | ||||
| (24 | ) | Total before tax | ||||
| 8 | Income tax provision | |||||
| (16 | ) | Net of tax | ||||
| Total reclassifications for the period | $ | (184 | ) | |||
| 53 |
| For the Year Ended December 31, 2016 | ||||||
| (In Thousands) | ||||||
| Reclassified from | ||||||
| Details about Accumulated Other | Accumulated Other | Affected Line Item in the Consolidated | ||||
| Comprehensive Income Components | Comprehensive Income | Statements of Income | ||||
| Unrealized gains and losses on available-for-sale securities | $ | (1,158 | ) | Realized gains on available-for-sale securities, net | ||
| 406 | Income tax provision | |||||
| (752 | ) | Net of tax | ||||
| Amortization of defined benefit pension and postretirement items: | ||||||
| Prior service cost | (31 | ) | Pensions and other employee benefits | |||
| Actuarial loss | 9 | Pensions and other employee benefits | ||||
| (22 | ) | Total before tax | ||||
| 8 | Income tax provision | |||||
| (14 | ) | Net of tax | ||||
| Total reclassifications for the period | $ | (766 | ) | |||
| For the Year Ended December 31, 2015 | ||||||
| (In Thousands) | ||||||
| Reclassified from | ||||||
| Details about Accumulated Other | Accumulated Other | Affected Line Item in the Consolidated | ||||
| Comprehensive Income Components | Comprehensive Income | Statements of Income | ||||
| Unrealized gains and losses on available-for-sale securities | $ | (2,861 | ) | Realized gains on available-for-sale securities, net | ||
| 1,002 | Income tax provision | |||||
| (1,859 | ) | Net of tax | ||||
| Amortization of defined benefit pension and postretirement items: | ||||||
| Prior service cost | (31 | ) | Pensions and other employee benefits | |||
| Actuarial loss | 11 | Pensions and other employee benefits | ||||
| Loss on settlement | 87 | Pensions and other employee benefits | ||||
| 67 | Total before tax | |||||
| (23 | ) | Income tax provision | ||||
| 44 | Net of tax | |||||
| Total reclassifications for the period | $ | (1,815 | ) | |||
Basic earnings per common share are calculated using the two-class method to determine income attributable to common shareholders. Unvested restricted stock awards that contain nonforfeitable rights to dividends are considered participating securities under the two-class method. Distributed dividends and an allocation of undistributed net income to participating securities reduce the amount of income attributable to common shareholders. Income attributable to common shareholders is then divided by weighted-average common shares outstanding for the period to determine basic earnings per common share.
Diluted earnings per common share are calculated under the more dilutive of either the treasury method or the two-class method. Diluted earnings per common share is computed using weighted-average common shares outstanding, plus weighted-average common shares available from the exercise of all dilutive stock options, less the number of shares that could be repurchased with the proceeds of stock option exercises based on the average share price of the Corporation’s common stock during the period.
| 54 |
| Years Ended | ||||||||||||
| Dec. 31, | Dec. 31, | Dec. 31, | ||||||||||
| 2017 | 2016 | 2015 | ||||||||||
| Basic | ||||||||||||
| Net income | $ | 13,434,000 | $ | 15,762,000 | $ | 16,471,000 | ||||||
| Less: Dividends and undistributed earnings allocated to participating securities | (69,000 | ) | (85,000 | ) | (84,000 | ) | ||||||
| Net income attributable to common shares | $ | 13,365,000 | $ | 15,677,000 | $ | 16,387,000 | ||||||
| Basic weighted-average common shares outstanding | 12,115,840 | 12,032,820 | 12,149,252 | |||||||||
| Basic earnings per common share (a) | $ | 1.10 | $ | 1.30 | $ | 1.35 | ||||||
| Diluted | ||||||||||||
| Net income attributable to common shares | $ | 13,365,000 | $ | 15,677,000 | $ | 16,387,000 | ||||||
| Basic weighted-average common shares outstanding | 12,115,840 | 12,032,820 | 12,149,252 | |||||||||
| Dilutive effect of potential common stock arising from stock options | 39,296 | 30,235 | 21,832 | |||||||||
| Diluted weighted-average common shares outstanding | 12,155,136 | 12,063,055 | 12,171,084 | |||||||||
| Diluted earnings per common share (a) | $ | 1.10 | $ | 1.30 | $ | 1.35 | ||||||
| (a) | Basic and diluted earnings per share under the two-class method are determined on net income reported on the income statement less earnings allocated to nonvested restricted shares with nonforfeitable dividends (participating securities). |
The weighted-average number of nonvested restricted shares outstanding was 62,329 shares in 2017, 65,309 shares in 2016 and 62,689 shares in 2015.
Stock options that were anti-dilutive were excluded from net income per share calculations. There were no anti-dilutive instruments in 2017. Weighted-average common shares available from anti-dilutive instruments totaled 31,153 shares in 2016 and 61,590 shares in 2015.
5. CASH AND DUE FROM BANKS
Cash and due from banks at December 31, 2017 and 2016 include the following:
| (In thousands) | Dec. 31, | Dec. 31, | ||||||
| 2017 | 2016 | |||||||
| Cash and cash equivalents | $ | 37,004 | $ | 28,621 | ||||
| Certificates of deposit | 3,240 | 3,488 | ||||||
| Total cash and due from banks | $ | 40,244 | $ | 32,109 | ||||
Certificates of deposit are issues by U.S. banks with original maturities greater than three months. Each certificate of deposit is fully FDIC-insured. The Corporation maintains cash and cash equivalents with certain financial institutions in excess of the FDIC insurance limit.
The Corporation is required to maintain reserves against deposit liabilities in the form of cash and balances with the Federal Reserve Bank. The reserves are based on deposit levels, account activity, and other services provided by the Federal Reserve Bank. Required reserves were $17,178,000 at December 31, 2017 and $16,654,000 at December 31, 2016.
6. FAIR VALUE MEASUREMENTS AND FAIR VALUES OF FINANCIAL INSTRUMENTS
The Corporation measures certain assets at fair value. Fair value is defined as the price that would be received to sell an asset in an orderly transaction between market participants at the measurement date. FASB ASC topic 820, “Fair Value Measurements and Disclosures” establishes a framework for measuring fair value that includes a hierarchy used to classify the inputs used in measuring fair value. The hierarchy prioritizes the inputs used in determining valuations into three levels. The level in the fair value hierarchy within which the fair value measurement falls is determined based on the lowest level input that is significant to the fair value measurement. The levels of the fair value hierarchy are as follows:
Level 1 – Fair value is based on unadjusted quoted prices in active markets that are accessible to the Corporation for identical assets. These generally provide the most reliable evidence and are used to measure fair value whenever available.
| 55 |
Level 2 – Fair value is based on significant inputs, other than Level 1 inputs, that are observable either directly or indirectly for substantially the full term of the asset through corroboration with observable market data. Level 2 inputs include quoted market prices in active markets for similar assets, quoted market prices in markets that are not active for identical or similar assets and other observable inputs.
Level 3 – Fair value is based on significant unobservable inputs. Examples of valuation methodologies that would result in Level 3 classification include option pricing models, discounted cash flows and other similar techniques.
The Corporation monitors and evaluates available data relating to fair value measurements on an ongoing basis and recognizes transfers among the levels of the fair value hierarchy as of the date of an event or change in circumstances that affects the valuation method chosen. Examples of such changes may include the market for a particular asset becoming active or inactive, changes in the availability of quoted prices, or changes in the availability of other market data.
At December 31, 2017 and 2016, assets measured at fair value and the valuation methods used are as follows:
| December 31, 2017 | ||||||||||||||||
|
Quoted Prices |
Other | |||||||||||||||
| in Active | Observable | Unobservable | Total | |||||||||||||
| Markets | Inputs | Inputs | Fair | |||||||||||||
| (In Thousands) | (Level 1) | (Level 2) | (Level 3) | Value | ||||||||||||
| Recurring fair value measurements | ||||||||||||||||
| AVAILABLE-FOR-SALE SECURITIES: | ||||||||||||||||
| Obligations of U.S. Government agencies | $ | 0 | $ | 7,873 | $ | 0 | $ | 7,873 | ||||||||
| Obligations of states and political subdivisions: | ||||||||||||||||
| Tax-exempt | 0 | 105,111 | 0 | 105,111 | ||||||||||||
| Taxable | 0 | 25,573 | 0 | 25,573 | ||||||||||||
| Mortgage-backed securities issued or guaranteed by U.S. Government agencies or sponsored agencies: | ||||||||||||||||
| Residential pass-through securities | 0 | 52,347 | 0 | 52,347 | ||||||||||||
| Residential collateralized mortgage obligations | 0 | 131,814 | 0 | 131,814 | ||||||||||||
| Commercial mortgage-backed securities | 0 | 33,219 | 0 | 33,219 | ||||||||||||
| Total debt securities | 0 | 355,937 | 0 | 355,937 | ||||||||||||
| Marketable equity securities | 971 | 0 | 0 | 971 | ||||||||||||
| Total available-for-sale securities | 971 | 355,937 | 0 | 356,908 | ||||||||||||
| Servicing rights | 0 | 0 | 1,299 | 1,299 | ||||||||||||
| Total recurring fair value measurements | $ | 971 | $ | 355,937 | $ | 1,299 | $ | 358,207 | ||||||||
| Nonrecurring fair value measurements | ||||||||||||||||
| Impaired loans with a valuation allowance | $ | 0 | $ | 0 | $ | 3,776 | $ | 3,776 | ||||||||
| Valuation allowance | 0 | 0 | (1,183 | ) | (1,183 | ) | ||||||||||
| Impaired loans, net | 0 | 0 | 2,593 | 2,593 | ||||||||||||
| Foreclosed assets held for sale | 0 | 0 | 1,598 | 1,598 | ||||||||||||
| Total nonrecurring fair value measurements | $ | 0 | $ | 0 | $ | 4,191 | $ | 4,191 | ||||||||
| 56 |
| December 31, 2016 | ||||||||||||||||
| Quoted Prices | Other | |||||||||||||||
| in Active | Observable | Unobservable | Total | |||||||||||||
| Markets | Inputs | Inputs | Fair | |||||||||||||
| (In Thousands) | (Level 1) | (Level 2) | (Level 3) | Value | ||||||||||||
| Recurring fair value measurements | ||||||||||||||||
| AVAILABLE-FOR-SALE SECURITIES: | ||||||||||||||||
| Obligations of U.S. Government agencies | $ | 0 | $ | 9,541 | $ | 0 | $ | 9,541 | ||||||||
| Obligations of states and political subdivisions: | ||||||||||||||||
| Tax-exempt | 0 | 119,037 | 0 | 119,037 | ||||||||||||
| Taxable | 0 | 30,297 | 0 | 30,297 | ||||||||||||
| Mortgage-backed securities issued or guaranteed by U.S. Government agencies or sponsored agencies: | ||||||||||||||||
| Residential pass-through securities | 0 | 58,404 | 0 | 58,404 | ||||||||||||
| Residential collateralized mortgage obligations | 0 | 146,608 | 0 | 146,608 | ||||||||||||
| Commercial mortgage-backed securities | 0 | 30,219 | 0 | 30,219 | ||||||||||||
| Total debt securities | 0 | 394,106 | 0 | 394,106 | ||||||||||||
| Marketable equity securities | 971 | 0 | 0 | 971 | ||||||||||||
| Total available-for-sale securities | 971 | 394,106 | 0 | 395,077 | ||||||||||||
| Servicing rights | 0 | 0 | 1,262 | 1,262 | ||||||||||||
| Total recurring fair value measurements | $ | 971 | $ | 394,106 | $ | 1,262 | $ | 396,339 | ||||||||
| Nonrecurring fair value measurements | ||||||||||||||||
| Impaired loans with a valuation allowance | $ | 0 | $ | 0 | $ | 3,372 | $ | 3,372 | ||||||||
| Valuation allowance | 0 | 0 | (674 | ) | (674 | ) | ||||||||||
| Impaired loans, net | 0 | 0 | 2,698 | 2,698 | ||||||||||||
| Foreclosed assets held for sale | 0 | 0 | 2,180 | 2,180 | ||||||||||||
| Total nonrecurring fair value measurements | $ | 0 | $ | 0 | $ | 4,878 | $ | 4,878 | ||||||||
Management’s evaluation and selection of valuation techniques and the unobservable inputs used in determining the fair values of assets valued using Level 3 methodologies include sensitive assumptions. Other market participants might use substantially different assumptions, which could result in calculations of fair values that would be substantially different than the amount calculated by management. The following table shows quantitative information regarding significant techniques and inputs used at December 31, 2017 and 2016 for servicing rights assets measured using unobservable inputs (Level 3 methodologies) on a recurring basis:
| Fair Value at | ||||||||||||||
| 12/31/17 | Valuation | Unobservable | Method or Value As of | |||||||||||
| Asset | (In Thousands) | Technique | Input(s) | 12/31/17 | ||||||||||
| Servicing rights | $ | 1,299 | Discounted cash flow | Discount rate | 13.00 | % | Rate used through modeling period | |||||||
| Loan prepayment speeds | 140.00 | % | Weighted-average PSA | |||||||||||
| Servicing fees | 0.25 | % | of loan balances | |||||||||||
| 4.00 | % | of payments are late | ||||||||||||
| 5.00 | % | late fees assessed | ||||||||||||
| $ | 1.94 | Miscellaneous fees per account per month | ||||||||||||
| Servicing costs | $ | 6.00 | Monthly servicing cost per account | |||||||||||
| $ | 24.00 | Additional monthly servicing cost per loan on loans more than 30 days delinquent | ||||||||||||
| 1.50 | % | of loans more than 30 days delinquent | ||||||||||||
| 3.00 | % | annual increase in servicing costs | ||||||||||||
| 57 |
| Fair Value at | ||||||||||||||
| 12/31/16 | Valuation | Unobservable | Method or Value As of | |||||||||||
| Asset | (In Thousands) | Technique | Input(s) | 12/31/16 | ||||||||||
| Servicing rights | $ | 1,262 | Discounted cash flow | Discount rate | 13.00 | % | Rate used through modeling period | |||||||
| Loan prepayment speeds | 138.00 | % | Weighted-average PSA | |||||||||||
| Servicing fees | 0.25 | % | of loan balances | |||||||||||
| 4.00 | % | of payments are late | ||||||||||||
| 5.00 | % | late fees assessed | ||||||||||||
| $ | 1.94 | Miscellaneous fees per account per month | ||||||||||||
| Servicing costs | $ | 6.00 | Monthly servicing cost per account | |||||||||||
| $ | 24.00 | Additional monthly servicing cost per loan on loans more than 30 days delinquent | ||||||||||||
| 1.50 | % | of loans more than 30 days delinquent | ||||||||||||
| 3.00 | % | annual increase in servicing costs | ||||||||||||
The fair value of servicing rights is affected by expected future interest rates. Increases (decreases) in future expected interest rates tend to increase (decrease) the fair value of the Corporation’s servicing rights because of changes in expected prepayment behavior by the borrowers on the underlying loans.
Following is a reconciliation of activity for Level 3 assets (servicing rights) measured at fair value on a recurring basis:
| (In Thousands) | Years Ended December 31, | |||||||||||
| 2017 | 2016 | 2015 | ||||||||||
| Balance, beginning of period | $ | 1,262 | $ | 1,296 | $ | 1,281 | ||||||
| Issuances of servicing rights | 205 | 248 | 177 | |||||||||
| Unrealized losses included in earnings | (168 | ) | (282 | ) | (162 | ) | ||||||
| Balance, end of period | $ | 1,299 | $ | 1,262 | $ | 1,296 | ||||||
Loans are classified as impaired when, based on current information and events, it is probable that the Corporation will be unable to collect the scheduled payments of principal or interest when due according to the contractual terms of the loan agreement. Foreclosed assets held for sale consist of real estate acquired by foreclosure. For impaired commercial loans secured by real estate and foreclosed assets held for sale, estimated fair values are determined primarily using values from third-party appraisals. Appraised values are discounted to arrive at the estimated selling price of the collateral, which is considered to be the estimated fair value. The discounts also include estimated costs to sell the property.
At December 31, 2017 and 2016, quantitative information regarding significant techniques and inputs used for nonrecurring fair value measurements using unobservable inputs (Level 3 methodologies) are as follows:
| (In Thousands, Except | Weighted- | |||||||||||||||||||
| Percentages) | Valuation | Average | ||||||||||||||||||
| Balance at | Allowance at | Fair Value at | Valuation | Unobservable | Discount at | |||||||||||||||
| Asset | 12/31/17 | 12/31/17 | 12/31/17 | Technique | Inputs | 12/31/17 | ||||||||||||||
| Impaired loans: | ||||||||||||||||||||
| Residential mortgage loans - first liens | $ | 515 | $ | 122 | $ | 393 | Sales comparison | Discount to appraised value | 26 | % | ||||||||||
| Commercial: | ||||||||||||||||||||
| Commercial loans secured by real estate | 2,641 | 919 | 1,722 | Sales comparison | Discount to appraised value | 16 | % | |||||||||||||
| Commercial and industrial | 126 | 92 | 34 | Sales comparison | Discount to appraised value | 72 | % | |||||||||||||
| Loans secured by farmland | 494 | 50 | 444 | Sales comparison | Discount to appraised value | 53 | % | |||||||||||||
| Total impaired loans | $ | 3,776 | $ | 1,183 | $ | 2,593 | ||||||||||||||
| Foreclosed assets held for sale - real estate: | ||||||||||||||||||||
| Residential (1-4 family) | $ | 721 | $ | 0 | $ | 721 | Sales comparison | Discount to appraised value | 37 | % | ||||||||||
| Land | 632 | 0 | 632 | Sales comparison | Discount to appraised value | 35 | % | |||||||||||||
| Commercial real estate | 245 | 0 | 245 | Sales comparison | Discount to appraised value | 71 | % | |||||||||||||
| Total foreclosed assets held for sale | $ | 1,598 | $ | 0 | $ | 1,598 | ||||||||||||||
| 58 |
| (In Thousands, Except | Weighted- | |||||||||||||||||||
| Percentages) | Valuation | Average | ||||||||||||||||||
| Balance at | Allowance at | Fair Value at | Valuation | Unobservable | Discount at | |||||||||||||||
| Asset | 12/31/16 | 12/31/16 | 12/31/16 | Technique | Inputs | 12/31/16 | ||||||||||||||
| Impaired loans: | ||||||||||||||||||||
| Commercial: | ||||||||||||||||||||
| Commercial loans secured by real estate | $ | 2,773 | $ | 528 | $ | 2,245 | Sales comparison | Discount to appraised value | 7 | % | ||||||||||
| Commercial and industrial | 95 | 95 | 0 | Sales comparison | Discount to appraised value | 100 | % | |||||||||||||
| Loans secured by farmland | 504 | 51 | 453 | Sales comparison | Discount to appraised value | 55 | % | |||||||||||||
| Total impaired loans | $ | 3,372 | $ | 674 | $ | 2,698 | ||||||||||||||
| Foreclosed assets held for sale - real estate: | ||||||||||||||||||||
| Residential (1-4 family) | $ | 1,102 | $ | 0 | $ | 1,102 | Sales comparison | Discount to appraised value | 35 | % | ||||||||||
| Land | 650 | 0 | 650 | Sales comparison | Discount to appraised value | 33 | % | |||||||||||||
| Commercial real estate | 428 | 0 | 428 | Sales comparison | Discount to appraised value | 50 | % | |||||||||||||
| Total foreclosed assets held for sale | $ | 2,180 | $ | 0 | $ | 2,180 | ||||||||||||||
Certain of the Corporation’s financial instruments are not measured at fair value in the consolidated financial statements. In cases where quoted market prices are not available, fair values are based on estimates using present value or other valuation techniques. Those techniques are significantly affected by the assumptions used, including the discount rate and estimates of future cash flows. Accordingly, the fair value estimates may not be realized in an immediate settlement of the instrument. Certain financial instruments and all nonfinancial instruments are excluded from disclosure requirements. Therefore, the aggregate fair value amounts presented may not represent the underlying fair value of the Corporation.
The Corporation used the following methods and assumptions in estimating fair value disclosures for financial instruments:
CASH AND CASH EQUIVALENTS – The carrying amounts of cash and short-term instruments approximate fair values.
CERTIFICATES OF DEPOSIT – Fair values for certificates of deposit, included in cash and due from banks in the consolidated balance sheets, are based on quoted market prices for certificates of similar remaining maturities.
SECURITIES – Fair values for securities, excluding restricted equity securities, are based on quoted market prices or other methods as described above. The carrying value of restricted equity securities approximates fair value based on applicable redemption provisions.
LOANS HELD FOR SALE – Fair values of loans held for sale are determined based on applicable sale prices available under the Federal Home Loan Banks’ MPF Original or Xtra program.
LOANS – Fair values are estimated for portfolios of loans with similar financial characteristics. Loans are segregated by type such as commercial, commercial real estate, residential mortgage and other consumer. Each loan category is further segmented into fixed-rate and adjustable-rate interest terms and by performing and nonperforming categories. The fair value of performing loans is calculated by discounting contractual cash flows, adjusted for estimated prepayments based on historical experience, using estimated market discount rates that reflect the credit and interest rate risk inherent in the loans. Fair value of nonperforming loans is based on recent appraisals or estimates prepared by the Corporation’s lending officers.
SERVICING RIGHTS – The fair value of servicing rights, included in other assets in the consolidated balance sheet, is determined through a discounted cash flow valuation. Significant inputs include expected net servicing income, the discount rate and the expected prepayment speeds of the underlying loans.
DEPOSITS – The fair value of deposits with no stated maturity, such as noninterest-bearing demand deposits, savings, money market and interest checking accounts, is (by definition) equal to the amount payable at December 31, 2017 and 2016. The fair value of time deposits, such as certificates of deposit and Individual Retirement Accounts, is based on the discounted value of contractual cash flows. The discount rate is estimated using the rates currently offered for deposits of similar remaining maturities. The fair value estimates of deposits do not include the benefit that results from the low-cost funding provided by the deposit liabilities compared to the cost of borrowing funds in the market, commonly referred to as the core deposit intangible.
BORROWED FUNDS – The fair value of borrowings is estimated using discounted cash flow analyses based on rates currently available to the Corporation for similar types of borrowing arrangements.
ACCRUED INTEREST – The carrying amounts of accrued interest receivable and payable approximate fair values.
| 59 |
OFF-BALANCE SHEET COMMITMENTS – The Corporation has commitments to extend credit and has issued standby letters of credit. Standby letters of credit are conditional guarantees of performance by a customer to a third party. Estimates of the fair value of these off-balance sheet items were not made because of the short-term nature of these arrangements and the credit standing of the counterparties.
The estimated fair values, and related carrying amounts, of the Corporation’s financial instruments are as follows:
| (In Thousands) | Valuation | December 31, 2017 | December 31, 2016 | |||||||||||||||
| Method(s) | Carrying | Fair | Carrying | Fair | ||||||||||||||
| Used | Amount | Value | Amount | Value | ||||||||||||||
| Financial assets: | ||||||||||||||||||
| Cash and cash equivalents | Level 1 | $ | 37,004 | $ | 37,004 | $ | 28,621 | $ | 28,621 | |||||||||
| Certificates of deposit | Level 2 | 3,240 | 3,234 | 3,488 | 3,481 | |||||||||||||
| Available-for-sale securities | See Above | 356,908 | 356,908 | 395,077 | 395,077 | |||||||||||||
| Restricted equity securities (included in Other Assets) | Level 2 | 6,556 | 6,556 | 4,426 | 4,426 | |||||||||||||
| Loans held for sale | Level 2 | 765 | 765 | 142 | 142 | |||||||||||||
| Loans, net | Level 3 | 806,857 | 789,891 | 743,362 | 725,787 | |||||||||||||
| Accrued interest receivable | Level 2 | 4,048 | 4,048 | 3,963 | 3,963 | |||||||||||||
| Servicing rights | Level 3 | 1,299 | 1,299 | 1,262 | 1,262 | |||||||||||||
| Financial liabilities: | ||||||||||||||||||
| Deposits with no stated maturity | Level 2 | 794,778 | 794,778 | 771,625 | 771,625 | |||||||||||||
| Time deposits | Level 2 | 213,671 | 213,734 | 212,218 | 212,274 | |||||||||||||
| Short-term borrowings | Level 2 | 61,766 | 61,643 | 26,175 | 26,024 | |||||||||||||
| Long-term borrowings | Level 2 | 9,189 | 9,256 | 38,454 | 39,062 | |||||||||||||
| Accrued interest payable | Level 2 | 46 | 46 | 65 | 65 | |||||||||||||
7. SECURITIES
Amortized cost and fair value of available-for-sale securities at December 31, 2017 and 2016 are summarized as follows:
| December 31, 2017 | ||||||||||||||||
| Gross | Gross | |||||||||||||||
| Unrealized | Unrealized | |||||||||||||||
| Amortized | Holding | Holding | Fair | |||||||||||||
| (In Thousands) | Cost | Gains | Losses | Value | ||||||||||||
| Obligations of U.S. Government agencies | $ | 8,026 | $ | 0 | $ | (153 | ) | $ | 7,873 | |||||||
| Obligations of states and political subdivisions: | ||||||||||||||||
| Tax-exempt | 103,673 | 2,291 | (853 | ) | 105,111 | |||||||||||
| Taxable | 25,431 | 226 | (84 | ) | 25,573 | |||||||||||
| Mortgage-backed securities issued or guaranteed by U.S. Government agencies or sponsored agencies: | ||||||||||||||||
| Residential pass-through securities | 52,992 | 79 | (724 | ) | 52,347 | |||||||||||
| Residential collateralized mortgage obligations | 134,314 | 110 | (2,610 | ) | 131,814 | |||||||||||
| Commercial mortgage-backed securities | 33,881 | 4 | (666 | ) | 33,219 | |||||||||||
| Total debt securities | 358,317 | 2,710 | (5,090 | ) | 355,937 | |||||||||||
| Marketable equity securities | 1,000 | 0 | (29 | ) | 971 | |||||||||||
| Total | $ | 359,317 | $ | 2,710 | $ | (5,119 | ) | $ | 356,908 | |||||||
| 60 |
| December 31, 2016 | ||||||||||||||||
| Gross | Gross | |||||||||||||||
| Unrealized | Unrealized | |||||||||||||||
| Amortized | Holding | Holding | Fair | |||||||||||||
| (In Thousands) | Cost | Gains | Losses | Value | ||||||||||||
| Obligations of U.S. Government agencies | $ | 9,671 | $ | 5 | $ | (135 | ) | $ | 9,541 | |||||||
| Obligations of states and political subdivisions: | ||||||||||||||||
| Tax-exempt | 118,140 | 2,592 | (1,695 | ) | 119,037 | |||||||||||
| Taxable | 30,073 | 303 | (79 | ) | 30,297 | |||||||||||
| Mortgage-backed securities issued or guaranteed by U.S. Government agencies or sponsored agencies: | ||||||||||||||||
| Residential pass-through securities | 58,922 | 306 | (824 | ) | 58,404 | |||||||||||
| Residential collateralized mortgage obligations | 147,915 | 408 | (1,715 | ) | 146,608 | |||||||||||
| Commercial mortgage-backed securities | 30,817 | 0 | (598 | ) | 30,219 | |||||||||||
| Total debt securities | 395,538 | 3,614 | (5,046 | ) | 394,106 | |||||||||||
| Marketable equity securities | 1,000 | 0 | (29 | ) | 971 | |||||||||||
| Total | $ | 396,538 | $ | 3,614 | $ | (5,075 | ) | $ | 395,077 | |||||||
The following table presents gross unrealized losses and fair value of available-for-sale securities with unrealized loss positions that are not deemed to be other-than-temporarily impaired, aggregated by length of time that individual securities have been in a continuous unrealized loss position at December 31, 2017 and 2016:
| December 31, 2017 | Less Than 12 Months | 12 Months or More | Total | |||||||||||||||||||||
| (In Thousands) | Fair | Unrealized | Fair | Unrealized | Fair | Unrealized | ||||||||||||||||||
| Value | Losses | Value | Losses | Value | Losses | |||||||||||||||||||
| Obligations of U.S. Government agencies | $ | 0 | $ | 0 | $ | 7,873 | $ | (153 | ) | $ | 7,873 | $ | (153 | ) | ||||||||||
| Obligations of states and political subdivisions: | ||||||||||||||||||||||||
| Tax-exempt | 19,050 | (135 | ) | 24,391 | (718 | ) | 43,441 | (853 | ) | |||||||||||||||
| Taxable | 9,279 | (45 | ) | 2,116 | (39 | ) | 11,395 | (84 | ) | |||||||||||||||
| Mortgage-backed securities issued or guaranteed by U.S. Government agencies or sponsored agencies: | ||||||||||||||||||||||||
| Residential pass-through securities | 25,255 | (242 | ) | 22,549 | (482 | ) | 47,804 | (724 | ) | |||||||||||||||
| Residential collateralized mortgage obligations | 50,812 | (589 | ) | 68,558 | (2,021 | ) | 119,370 | (2,610 | ) | |||||||||||||||
| Commercial mortgage-backed securities | 14,713 | (173 | ) | 14,569 | (493 | ) | 29,282 | (666 | ) | |||||||||||||||
| Total debt securities | 119,109 | (1,184 | ) | 140,056 | (3,906 | ) | 259,165 | (5,090 | ) | |||||||||||||||
| Marketable equity securities | 0 | 0 | 971 | (29 | ) | 971 | (29 | ) | ||||||||||||||||
| Total temporarily impaired available-for-sale securities | $ | 119,109 | $ | (1,184 | ) | $ | 141,027 | $ | (3,935 | ) | $ | 260,136 | $ | (5,119 | ) | |||||||||
| December 31, 2016 | Less Than 12 Months | 12 Months or More | Total | |||||||||||||||||||||
| (In Thousands) | Fair | Unrealized | Fair | Unrealized | Fair | Unrealized | ||||||||||||||||||
| Value | Losses | Value | Losses | Value | Losses | |||||||||||||||||||
| Obligations of U.S. Government agencies | $ | 7,899 | $ | (135 | ) | $ | 0 | $ | 0 | $ | 7,899 | $ | (135 | ) | ||||||||||
| Obligations of states and political subdivisions: | ||||||||||||||||||||||||
| Tax-exempt | 54,479 | (1,676 | ) | 1,278 | (19 | ) | 55,757 | (1,695 | ) | |||||||||||||||
| Taxable | 9,594 | (79 | ) | 0 | 0 | 9,594 | (79 | ) | ||||||||||||||||
| Mortgage-backed securities issued or guaranteed by U.S. Government agencies or sponsored agencies: | ||||||||||||||||||||||||
| Residential pass-through securities | 48,674 | (824 | ) | 0 | 0 | 48,674 | (824 | ) | ||||||||||||||||
| Residential collateralized mortgage obligations | 85,198 | (1,124 | ) | 16,073 | (591 | ) | 101,271 | (1,715 | ) | |||||||||||||||
| Commercial mortgage-backed securities | 30,219 | (598 | ) | 0 | 0 | 30,219 | (598 | ) | ||||||||||||||||
| Total debt securities | 236,063 | (4,436 | ) | 17,351 | (610 | ) | 253,414 | (5,046 | ) | |||||||||||||||
| Marketable equity securities | 1,000 | (29 | ) | 0 | 0 | 1,000 | (29 | ) | ||||||||||||||||
| Total temporarily impaired available-for-sale securities | $ | 237,063 | $ | (4,465 | ) | $ | 17,351 | $ | (610 | ) | $ | 254,414 | $ | (5,075 | ) | |||||||||
| 61 |
Gross realized gains and losses from available-for-sale securities and the related income tax provision were as follows:
| (In Thousands) | ||||||||||||
| 2017 | 2016 | 2015 | ||||||||||
| Gross realized gains from sales | $ | 315 | $ | 1,392 | $ | 2,972 | ||||||
| Gross realized losses from sales | (58 | ) | (234 | ) | (111 | ) | ||||||
| Net realized gains | $ | 257 | $ | 1,158 | $ | 2,861 | ||||||
| Income tax provision related to net realized gains | $ | 89 | $ | 406 | $ | 1,002 | ||||||
The amortized cost and fair value of available-for-sale debt securities by contractual maturity are shown in the following table as of December 31, 2017. Actual maturities may differ from contractual maturities because counterparties may have the right to call or prepay obligations with or without call or prepayment penalties.
| December 31, 2017 | ||||||||
| Amortized | Fair | |||||||
| (In Thousands) | Cost | Value | ||||||
| Due in one year or less | $ | 11,350 | $ | 11,347 | ||||
| Due from one year through five years | 69,274 | 70,016 | ||||||
| Due from five years through ten years | 37,086 | 37,089 | ||||||
| Due after ten years | 19,420 | 20,105 | ||||||
| Sub-total | 137,130 | 138,557 | ||||||
| Mortgage-backed securities issued or guaranteed by U.S. Government agencies or sponsored agencies: | ||||||||
| Residential pass-through securities | 52,992 | 52,347 | ||||||
| Residential collateralized mortgage obligations | 134,314 | 131,814 | ||||||
| Commercial mortgage-backed securities | 33,881 | 33,219 | ||||||
| Total | $ | 358,317 | $ | 355,937 | ||||
The Corporation’s mortgage-backed securities and collateralized mortgage obligations have stated maturities that may differ from actual maturities due to borrowers’ ability to prepay obligations. Cash flows from such investments are dependent upon the performance of the underlying mortgage loans and are generally influenced by the level of interest rates. In the table above, mortgage-backed securities and collateralized mortgage obligations are shown in one period.
Investment securities carried at $217,925,000 at December 31, 2017 and $230,803,000 at December 31, 2016 were pledged as collateral for public deposits, trusts and certain other deposits as provided by law. See Note 12 for information concerning securities pledged to secure borrowing arrangements.
Management evaluates securities for OTTI at least on a quarterly basis, and more frequently when economic or market conditions warrant such evaluation. Consideration is given to (1) the length of time and the extent to which the fair value has been less than cost, (2) the financial condition and near-term prospects of the issuer, and (3) whether the Corporation intends to sell the security or more likely than not will be required to sell the security before its anticipated recovery.
The Corporation recognized no net impairment losses in earnings for the years ended December 31, 2017, 2016 and 2015.
A summary of information management considered in evaluating debt and equity securities for OTTI at December 31, 2017 and 2016 is provided below.
At December 31, 2017 and 2016, management performed an assessment for possible OTTI of the Corporation’s debt securities on an issue-by-issue basis, relying on information obtained from various sources, including publicly available financial data, ratings by external agencies, brokers and other sources. The extent of individual analysis applied to each security depended on the size of the Corporation’s investment, as well as management’s perception of the credit risk associated with each security. Based on the results of the assessment, management believes impairment of these debt securities at December 31, 2017 and 2016 to be temporary.
| 62 |
Equity Securities
The Corporation’s marketable equity securities at December 31, 2017 and 2016 consisted exclusively of one mutual fund. The Corporation recognized no other-than-temporary impairment losses related to equities in 2017, 2016 or 2015. At December 31, 2017, the mutual fund held by the Corporation had an unrealized loss of $29,000 for which management determined an OTTI charge was not required.
There were no realized gains or losses on equity securities in 2017. Realized gains from sales of equity securities (bank stocks) totaled $1,125,000 in 2016 and $2,220,000 in 2015.
C&N Bank is a member of the Federal Home Loan Bank of Pittsburgh (FHLB-Pittsburgh), which is one of 11 regional Federal Home Loan Banks. As a member, C&N Bank is required to purchase and maintain stock in FHLB-Pittsburgh. There is no active market for FHLB-Pittsburgh stock, and it must ordinarily be redeemed by FHLB-Pittsburgh in order to be liquidated. C&N Bank’s investment in FHLB-Pittsburgh stock, included in Other Assets in the consolidated balance sheets, was $6,426,000 at December 31, 2017 and $4,296,000 at December 31, 2016. The Corporation evaluated its holding of FHLB-Pittsburgh stock for impairment and deemed the stock to not be impaired at December 31, 2017 and December 31, 2016. In making this determination, management concluded that recovery of total outstanding par value, which equals the carrying value, is expected. The decision was based on review of financial information that FHLB-Pittsburgh has made publicly available.
8. LOANS
Loans outstanding at December 31, 2017 and 2016 are summarized as follows:
| Summary of Loans by Type | ||||||||
| (In Thousands) | Dec. 31, | Dec. 31, | ||||||
| 2017 | 2016 | |||||||
| Residential mortgage: | ||||||||
| Residential mortgage loans - first liens | $ | 359,987 | $ | 334,102 | ||||
| Residential mortgage loans - junior liens | 25,325 | 23,706 | ||||||
| Home equity lines of credit | 35,758 | 38,057 | ||||||
| 1-4 Family residential construction | 26,216 | 24,908 | ||||||
| Total residential mortgage | 447,286 | 420,773 | ||||||
| Commercial: | ||||||||
| Commercial loans secured by real estate | 159,266 | 150,468 | ||||||
| Commercial and industrial | 88,276 | 83,854 | ||||||
| Political subdivisions | 59,287 | 38,068 | ||||||
| Commercial construction and land | 14,527 | 14,287 | ||||||
| Loans secured by farmland | 7,255 | 7,294 | ||||||
| Multi-family (5 or more) residential | 7,713 | 7,896 | ||||||
| Agricultural loans | 6,178 | 3,998 | ||||||
| Other commercial loans | 10,986 | 11,475 | ||||||
| Total commercial | 353,488 | 317,340 | ||||||
| Consumer | 14,939 | 13,722 | ||||||
| Total | 815,713 | 751,835 | ||||||
| Less: allowance for loan losses | (8,856 | ) | (8,473 | ) | ||||
| Loans, net | $ | 806,857 | $ | 743,362 | ||||
The Corporation grants loans to individuals as well as commercial and tax-exempt entities. Commercial, residential and personal loans are made to customers geographically concentrated in the Pennsylvania and New York counties that make up the market serviced by Citizens & Northern Bank. Although the Corporation has a diversified loan portfolio, a significant portion of its debtors’ ability to honor their contracts is dependent on the local economic conditions within the region. There is no concentration of loans to borrowers engaged in similar businesses or activities that exceed 10% of total loans at December 31, 2017.
| 63 |
Transactions within the allowance for loan losses, summarized by segment and class, were as follows:
| Year Ended December 31, 2017 | Dec. 31, | Dec. 31, | ||||||||||||||||||
| 2016 | Provision | 2017 | ||||||||||||||||||
| (In Thousands) | Balance | Charge-offs | Recoveries | (Credit) | Balance | |||||||||||||||
| Allowance for Loan Losses: | ||||||||||||||||||||
| Residential mortgage: | ||||||||||||||||||||
| Residential mortgage loans - first liens | $ | 3,033 | $ | (167 | ) | $ | 15 | $ | 319 | $ | 3,200 | |||||||||
| Residential mortgage loans - junior liens | 258 | (16 | ) | 4 | (22 | ) | 224 | |||||||||||||
| Home equity lines of credit | 350 | (14 | ) | 0 | (40 | ) | 296 | |||||||||||||
| 1-4 Family residential construction | 249 | 0 | 0 | (6 | ) | 243 | ||||||||||||||
| Total residential mortgage | 3,890 | (197 | ) | 19 | 251 | 3,963 | ||||||||||||||
| Commercial: | ||||||||||||||||||||
| Commercial loans secured by real estate | 2,380 | (96 | ) | 0 | 300 | 2,584 | ||||||||||||||
| Commercial and industrial | 999 | (36 | ) | 4 | 98 | 1,065 | ||||||||||||||
| Commercial construction and land | 162 | 0 | 0 | (12 | ) | 150 | ||||||||||||||
| Loans secured by farmland | 110 | 0 | 0 | (5 | ) | 105 | ||||||||||||||
| Multi-family (5 or more) residential | 241 | 0 | 0 | (69 | ) | 172 | ||||||||||||||
| Agricultural loans | 40 | 0 | 0 | 17 | 57 | |||||||||||||||
| Other commercial loans | 115 | 0 | 0 | (13 | ) | 102 | ||||||||||||||
| Total commercial | 4,047 | (132 | ) | 4 | 316 | 4,235 | ||||||||||||||
| Consumer | 138 | (150 | ) | 38 | 133 | 159 | ||||||||||||||
| Unallocated | 398 | 0 | 0 | 101 | 499 | |||||||||||||||
| Total Allowance for Loan Losses | $ | 8,473 | $ | (479 | ) | $ | 61 | $ | 801 | $ | 8,856 | |||||||||
| Year Ended December 31, 2016 | Dec. 31 | Dec. 31 | ||||||||||||||||||
| 2015 | Provision | 2016 | ||||||||||||||||||
| (In Thousands) | Balance | Charge-offs | Recoveries | (Credit) | Balance | |||||||||||||||
| Allowance for Loan Losses: | ||||||||||||||||||||
| Residential mortgage: | ||||||||||||||||||||
| Residential mortgage loans - first liens | $ | 2,645 | $ | (73 | ) | $ | 3 | $ | 458 | $ | 3,033 | |||||||||
| Residential mortgage loans - junior liens | 219 | 0 | 0 | 39 | 258 | |||||||||||||||
| Home equity lines of credit | 347 | 0 | 0 | 3 | 350 | |||||||||||||||
| 1-4 Family residential construction | 207 | 0 | 0 | 42 | 249 | |||||||||||||||
| Total residential mortgage | 3,418 | (73 | ) | 3 | 542 | 3,890 | ||||||||||||||
| Commercial: | ||||||||||||||||||||
| Commercial loans secured by real estate | 1,939 | 0 | 2 | 439 | 2,380 | |||||||||||||||
| Commercial and industrial | 981 | (2 | ) | 3 | 17 | 999 | ||||||||||||||
| Political subdivisions | 0 | 0 | 0 | 0 | 0 | |||||||||||||||
| Commercial construction and land | 58 | 0 | 30 | 74 | 162 | |||||||||||||||
| Loans secured by farmland | 106 | 0 | 0 | 4 | 110 | |||||||||||||||
| Multi-family (5 or more) residential | 675 | (595 | ) | 0 | 161 | 241 | ||||||||||||||
| Agricultural loans | 45 | 0 | 0 | (5 | ) | 40 | ||||||||||||||
| Other commercial loans | 118 | 0 | 0 | (3 | ) | 115 | ||||||||||||||
| Total commercial | 3,922 | (597 | ) | 35 | 687 | 4,047 | ||||||||||||||
| Consumer | 122 | (87 | ) | 82 | 21 | 138 | ||||||||||||||
| Unallocated | 427 | 0 | 0 | (29 | ) | 398 | ||||||||||||||
| Total Allowance for Loan Losses | $ | 7,889 | $ | (757 | ) | $ | 120 | $ | 1,221 | $ | 8,473 | |||||||||
| 64 |
| Year Ended December 31, 2015 | Dec. 31, | Dec. 31, | ||||||||||||||||||
| 2014 | Provision | 2015 | ||||||||||||||||||
| (In Thousands) | Balance | Charge-offs | Recoveries | (Credit) | Balance | |||||||||||||||
| Allowance for Loan Losses: | ||||||||||||||||||||
| Residential mortgage: | ||||||||||||||||||||
| Residential mortgage loans - first liens | $ | 2,941 | $ | (175 | ) | $ | 1 | $ | (122 | ) | $ | 2,645 | ||||||||
| Residential mortgage loans - junior liens | 176 | (42 | ) | 0 | 85 | 219 | ||||||||||||||
| Home equity lines of credit | 322 | 0 | 0 | 25 | 347 | |||||||||||||||
| 1-4 Family residential construction | 214 | 0 | 0 | (7 | ) | 207 | ||||||||||||||
| Total residential mortgage | 3,653 | (217 | ) | 1 | (19 | ) | 3,418 | |||||||||||||
| Commercial: | ||||||||||||||||||||
| Commercial loans secured by real estate | 1,758 | (115 | ) | 208 | 88 | 1,939 | ||||||||||||||
| Commercial and industrial | 688 | (21 | ) | 6 | 308 | 981 | ||||||||||||||
| Political subdivisions | 0 | 0 | 0 | 0 | 0 | |||||||||||||||
| Commercial construction and land | 283 | (115 | ) | 0 | (110 | ) | 58 | |||||||||||||
| Loans secured by farmland | 165 | 0 | 0 | (59 | ) | 106 | ||||||||||||||
| Multi-family (5 or more) residential | 87 | 0 | 0 | 588 | 675 | |||||||||||||||
| Agricultural loans | 31 | 0 | 0 | 14 | 45 | |||||||||||||||
| Other commercial loans | 131 | 0 | 0 | (13 | ) | 118 | ||||||||||||||
| Total commercial | 3,143 | (251 | ) | 214 | 816 | 3,922 | ||||||||||||||
| Consumer | 145 | (94 | ) | 55 | 16 | 122 | ||||||||||||||
| Unallocated | 395 | 0 | 0 | 32 | 427 | |||||||||||||||
| Total Allowance for Loan Losses | $ | 7,336 | $ | (562 | ) | $ | 270 | $ | 845 | $ | 7,889 | |||||||||
In the evaluation of the loan portfolio, management determines two major components for the allowance for loan losses – (1) a specific component based on an assessment of certain larger relationships, mainly commercial purpose loans, on a loan-by-loan basis; and (2) a general component for the remainder of the portfolio based on a collective evaluation of pools of loans with similar risk characteristics.
In determining the larger loan relationships for detailed assessment under the specific allowance component, the Corporation uses an internal risk rating system. Under the risk rating system, the Corporation classifies problem or potential problem loans as “Special Mention,” “Substandard,” or “Doubtful” on the basis of currently existing facts, conditions and values. Substandard loans include those characterized by the distinct possibility that the Corporation will sustain some loss if the deficiencies are not corrected. Loans classified as Doubtful have all the weaknesses inherent in those classified as Substandard with the added characteristic that the weaknesses present make collection or liquidation in full, on the basis of currently existing facts, conditions and values, highly questionable and improbable. Loans that do not currently expose the Corporation to sufficient risk to warrant classification as Substandard or Doubtful, but possess weaknesses that deserve management’s close attention, are deemed to be Special Mention. Risk ratings are updated any time that conditions or the situation warrants. Loans not classified are included in the “Pass” column in the table below.
The following tables summarize the aggregate credit quality classification of outstanding loans by risk rating as of December 31, 2017 and 2016:
| 65 |
| December 31, 2017 | ||||||||||||||||||||
| (In Thousands) | Special | |||||||||||||||||||
| Pass | Mention | Substandard | Doubtful | Total | ||||||||||||||||
| Residential Mortgage: | ||||||||||||||||||||
| Residential mortgage loans - first liens | $ | 350,609 | $ | 307 | $ | 9,019 | $ | 52 | $ | 359,987 | ||||||||||
| Residential mortgage loans - junior liens | 24,795 | 104 | 426 | 0 | 25,325 | |||||||||||||||
| Home equity lines of credit | 35,233 | 61 | 464 | 0 | 35,758 | |||||||||||||||
| 1-4 Family residential construction | 26,216 | 0 | 0 | 0 | 26,216 | |||||||||||||||
| Total residential mortgage | 436,853 | 472 | 9,909 | 52 | 447,286 | |||||||||||||||
| Commercial: | ||||||||||||||||||||
| Commercial loans secured by real estate | 150,806 | 936 | 7,524 | 0 | 159,266 | |||||||||||||||
| Commercial and Industrial | 82,724 | 3,896 | 1,645 | 11 | 88,276 | |||||||||||||||
| Political subdivisions | 59,287 | 0 | 0 | 0 | 59,287 | |||||||||||||||
| Commercial construction and land | 14,449 | 0 | 78 | 0 | 14,527 | |||||||||||||||
| Loans secured by farmland | 5,283 | 581 | 1,379 | 12 | 7,255 | |||||||||||||||
| Multi-family (5 or more) residential | 7,130 | 0 | 583 | 0 | 7,713 | |||||||||||||||
| Agricultural loans | 5,203 | 270 | 705 | 0 | 6,178 | |||||||||||||||
| Other commercial loans | 10,913 | 0 | 73 | 0 | 10,986 | |||||||||||||||
| Total commercial | 335,795 | 5,683 | 11,987 | 23 | 353,488 | |||||||||||||||
| Consumer | 14,853 | 0 | 86 | 0 | 14,939 | |||||||||||||||
| Totals | $ | 787,501 | $ | 6,155 | $ | 21,982 | $ | 75 | $ | 815,713 | ||||||||||
| December 31, 2016 | ||||||||||||||||||||
| (In Thousands) | Special | |||||||||||||||||||
| Pass | Mention | Substandard | Doubtful | Total | ||||||||||||||||
| Residential Mortgage: | ||||||||||||||||||||
| Residential mortgage loans - first liens | $ | 324,377 | $ | 408 | $ | 9,258 | $ | 59 | $ | 334,102 | ||||||||||
| Residential mortgage loans - junior liens | 23,274 | 132 | 300 | 0 | 23,706 | |||||||||||||||
| Home equity lines of credit | 37,360 | 123 | 574 | 0 | 38,057 | |||||||||||||||
| 1-4 Family residential construction | 24,820 | 0 | 88 | 0 | 24,908 | |||||||||||||||
| Total residential mortgage | 409,831 | 663 | 10,220 | 59 | 420,773 | |||||||||||||||
| Commercial: | ||||||||||||||||||||
| Commercial loans secured by real estate | 139,358 | 3,092 | 8,018 | 0 | 150,468 | |||||||||||||||
| Commercial and Industrial | 79,202 | 4,180 | 461 | 11 | 83,854 | |||||||||||||||
| Political subdivisions | 38,068 | 0 | 0 | 0 | 38,068 | |||||||||||||||
| Commercial construction and land | 14,136 | 70 | 81 | 0 | 14,287 | |||||||||||||||
| Loans secured by farmland | 5,745 | 129 | 1,404 | 16 | 7,294 | |||||||||||||||
| Multi-family (5 or more) residential | 7,277 | 0 | 619 | 0 | 7,896 | |||||||||||||||
| Agricultural loans | 3,208 | 0 | 790 | 0 | 3,998 | |||||||||||||||
| Other commercial loans | 11,401 | 0 | 74 | 0 | 11,475 | |||||||||||||||
| Total commercial | 298,395 | 7,471 | 11,447 | 27 | 317,340 | |||||||||||||||
| Consumer | 13,546 | 0 | 176 | 0 | 13,722 | |||||||||||||||
| Totals | $ | 721,772 | $ | 8,134 | $ | 21,843 | $ | 86 | $ | 751,835 | ||||||||||
The scope of loans reviewed individually each quarter to determine if they are impaired include all commercial loan relationships greater than $200,000 for which there is at least one extension of credit graded Special Mention, Substandard or Doubtful. In the fourth quarter 2017, the scope was expanded to include any residential mortgage or consumer loans of $400,000 or more with a credit grade of Special Mention, Substandard or Doubtful. Loans that are individually reviewed, but which are determined to not be impaired, are combined with all remaining loans that are not reviewed on a specific basis, and such loans are included within larger pools of loans based on similar risk and loss characteristics for purposes of determining the general component of the allowance. The loans that have been individually reviewed, but which have been determined to not be impaired, are included in the “Collectively Evaluated” column in the table summarizing the allowance and associated loan balances as of December 31, 2017 and 2016. All loans classified as troubled debt restructurings (discussed in more detail below) and all commercial loan relationships less than $200,000 or other loan relationships less than $400,000 in the aggregate, but with an estimated loss of $100,000 or more, are individually evaluated for impairment.
| 66 |
The following tables present a summary of loan balances and the related allowance for loan losses summarized by portfolio segment and class for each impairment method used as of December 31, 2017 and 2016:
| December 31, 2017 | Loans: | Allowance for Loan Losses: | ||||||||||||||||||||||
| (In Thousands) | ||||||||||||||||||||||||
| Individually | Collectively | Individually | Collectively | |||||||||||||||||||||
| Evaluated | Evaluated | Totals | Evaluated | Evaluated | Totals | |||||||||||||||||||
| Residential mortgage: | ||||||||||||||||||||||||
| Residential mortgage loans - first liens | $ | 984 | $ | 359,003 | $ | 359,987 | $ | 0 | $ | 3,200 | $ | 3,200 | ||||||||||||
| Residential mortgage loans - junior liens | 302 | 25,023 | 25,325 | 122 | 102 | 224 | ||||||||||||||||||
| Home equity lines of credit | 0 | 35,758 | 35,758 | 0 | 296 | 296 | ||||||||||||||||||
| 1-4 Family residential construction | 0 | 26,216 | 26,216 | 0 | 243 | 243 | ||||||||||||||||||
| Total residential mortgage | 1,286 | 446,000 | 447,286 | 122 | 3,841 | 3,963 | ||||||||||||||||||
| Commercial: | ||||||||||||||||||||||||
| Commercial loans secured by real estate | 5,873 | 153,393 | 159,266 | 919 | 1,665 | 2,584 | ||||||||||||||||||
| Commercial and industrial | 568 | 87,708 | 88,276 | 188 | 877 | 1,065 | ||||||||||||||||||
| Political subdivisions | 0 | 59,287 | 59,287 | 0 | 0 | 0 | ||||||||||||||||||
| Commercial construction and land | 0 | 14,527 | 14,527 | 0 | 150 | 150 | ||||||||||||||||||
| Loans secured by farmland | 1,365 | 5,890 | 7,255 | 50 | 55 | 105 | ||||||||||||||||||
| Multi-family (5 or more) residential | 392 | 7,321 | 7,713 | 0 | 172 | 172 | ||||||||||||||||||
| Agricultural loans | 7 | 6,171 | 6,178 | 0 | 57 | 57 | ||||||||||||||||||
| Other commercial loans | 0 | 10,986 | 10,986 | 0 | 102 | 102 | ||||||||||||||||||
| Total commercial | 8,205 | 345,283 | 353,488 | 1,157 | 3,078 | 4,235 | ||||||||||||||||||
| Consumer | 20 | 14,919 | 14,939 | 0 | 159 | 159 | ||||||||||||||||||
| Unallocated | 499 | |||||||||||||||||||||||
| Total | $ | 9,511 | $ | 806,202 | $ | 815,713 | $ | 1,279 | $ | 7,078 | $ | 8,856 | ||||||||||||
| 67 |
| December 31, 2016 | Loans: | Allowance for Loan Losses: | ||||||||||||||||||||||
| (In Thousands) | ||||||||||||||||||||||||
| Individually | Collectively | Individually | Collectively | |||||||||||||||||||||
| Evaluated | Evaluated | Totals | Evaluated | Evaluated | Totals | |||||||||||||||||||
| Residential mortgage: | ||||||||||||||||||||||||
| Residential mortgage loans - first liens | $ | 753 | $ | 333,349 | $ | 334,102 | $ | 0 | $ | 3,033 | $ | 3,033 | ||||||||||||
| Residential mortgage loans - junior liens | 68 | 23,638 | 23,706 | 0 | 258 | 258 | ||||||||||||||||||
| Home equity lines of credit | 0 | 38,057 | 38,057 | 0 | 350 | 350 | ||||||||||||||||||
| 1-4 Family residential construction | 0 | 24,908 | 24,908 | 0 | 249 | 249 | ||||||||||||||||||
| Total residential mortgage | 821 | 419,952 | 420,773 | 0 | 3,890 | 3,890 | ||||||||||||||||||
| Commercial: | ||||||||||||||||||||||||
| Commercial loans secured by real estate | 8,005 | 142,463 | 150,468 | 528 | 1,852 | 2,380 | ||||||||||||||||||
| Commercial and industrial | 212 | 83,642 | 83,854 | 95 | 904 | 999 | ||||||||||||||||||
| Political subdivisions | 0 | 38,068 | 38,068 | 0 | 0 | 0 | ||||||||||||||||||
| Commercial construction and land | 0 | 14,287 | 14,287 | 0 | 162 | 162 | ||||||||||||||||||
| Loans secured by farmland | 1,394 | 5,900 | 7,294 | 51 | 59 | 110 | ||||||||||||||||||
| Multi-family (5 or more) residential | 392 | 7,504 | 7,896 | 0 | 241 | 241 | ||||||||||||||||||
| Agricultural loans | 13 | 3,985 | 3,998 | 0 | 40 | 40 | ||||||||||||||||||
| Other commercial loans | 0 | 11,475 | 11,475 | 0 | 115 | 115 | ||||||||||||||||||
| Total commercial | 10,016 | 307,324 | 317,340 | 674 | 3,373 | 4,047 | ||||||||||||||||||
| Consumer | 23 | 13,699 | 13,722 | 0 | 138 | 138 | ||||||||||||||||||
| Unallocated | 398 | |||||||||||||||||||||||
| Total | $ | 10,860 | $ | 740,975 | $ | 751,835 | $ | 674 | $ | 7,401 | $ | 8,473 | ||||||||||||
Summary information related to impaired loans as of December 31, 2017 and 2016 is as follows:
| (In Thousands) | December 31, 2017 | December 31, 2016 | ||||||||||||||||||||||
| Unpaid | Unpaid | |||||||||||||||||||||||
| Principal | Recorded | Related | Principal | Recorded | Related | |||||||||||||||||||
| Balance | Investment | Allowance | Balance | Investment | Allowance | |||||||||||||||||||
| With no related allowance recorded: | ||||||||||||||||||||||||
| Residential mortgage loans - first liens | $ | 740 | $ | 711 | $ | 0 | $ | 783 | $ | 753 | $ | 0 | ||||||||||||
| Residential mortgage loans - junior liens | 60 | 60 | 0 | 68 | 68 | 0 | ||||||||||||||||||
| Commercial loans secured by real estate | 3,230 | 3,230 | 0 | 6,975 | 5,232 | 0 | ||||||||||||||||||
| Commercial and industrial | 119 | 119 | 0 | 117 | 117 | 0 | ||||||||||||||||||
| Loans secured by farmland | 871 | 871 | 0 | 890 | 890 | 0 | ||||||||||||||||||
| Multi-family (5 or more) residential | 987 | 392 | 0 | 987 | 392 | 0 | ||||||||||||||||||
| Agricultural loans | 8 | 8 | 0 | 13 | 13 | 0 | ||||||||||||||||||
| Consumer | 20 | 20 | 0 | 23 | 23 | 0 | ||||||||||||||||||
| Total with no related allowance recorded | 6,035 | 5,411 | 0 | 9,856 | 7,488 | 0 | ||||||||||||||||||
| With a related allowance recorded: | ||||||||||||||||||||||||
| Residential mortgage loans - first liens | 273 | 273 | 0 | 0 | 0 | 0 | ||||||||||||||||||
| Residential mortgage loans - junior liens | 242 | 242 | 122 | 0 | 0 | 0 | ||||||||||||||||||
| Commercial loans secured by real estate | 2,641 | 2,641 | 919 | 2,773 | 2,773 | 528 | ||||||||||||||||||
| Commercial and industrial | 449 | 449 | 188 | 95 | 95 | 95 | ||||||||||||||||||
| Loans secured by farmland | 495 | 495 | 50 | 504 | 504 | 51 | ||||||||||||||||||
| Total with a related allowance recorded | 4,100 | 4,100 | 1,279 | 3,372 | 3,372 | 674 | ||||||||||||||||||
| Total | $ | 10,135 | $ | 9,511 | $ | 1,279 | $ | 13,228 | $ | 10,860 | $ | 674 | ||||||||||||
In the table immediately above, two loans to one borrower are presented under the Residential mortgage loans – first liens and Residential mortgage loans – junior liens classes. These loans are collateralized by one property, and the allowance associated with these loans was determined based on an analysis of the total amounts of the Corporation’s exposure in comparison to the estimated net proceeds if the Corporation were to sell the property.
| 68 |
The average balance of impaired loans and interest income recognized on impaired loans is as follows:
| Interest Income Recognized on | ||||||||||||||||||||||||
| Average Investment in Impaired Loans | Impaired Loans on a Cash Basis | |||||||||||||||||||||||
| (In Thousands) | Year Ended December 31, | Year Ended December 31, | ||||||||||||||||||||||
| 2017 | 2016 | 2015 | 2017 | 2016 | 2015 | |||||||||||||||||||
| Residential mortgage: | ||||||||||||||||||||||||
| Residential mortgage loans - first lien | $ | 857 | $ | 806 | $ | 2,206 | $ | 52 | $ | 43 | $ | 86 | ||||||||||||
| Residential mortgage loans - junior lien | 112 | 71 | 64 | 15 | 3 | 4 | ||||||||||||||||||
| Total residential mortgage | 969 | 877 | 2,270 | 67 | 46 | 90 | ||||||||||||||||||
| Commercial: | ||||||||||||||||||||||||
| Commercial loans secured by real estate | 6,272 | 6,806 | 6,357 | 173 | 495 | 380 | ||||||||||||||||||
| Commercial and industrial | 301 | 547 | 438 | 24 | 20 | 20 | ||||||||||||||||||
| Commercial construction and land | 0 | 0 | 40 | 0 | 0 | 0 | ||||||||||||||||||
| Loans secured by farmland | 1,379 | 1,409 | 1,459 | 45 | 94 | 103 | ||||||||||||||||||
| Multi-family (5 or more) residential | 392 | 511 | 790 | 0 | 0 | 0 | ||||||||||||||||||
| Agricultural loans | 10 | 14 | 21 | 1 | 1 | 3 | ||||||||||||||||||
| Total commercial | 8,354 | 9,287 | 9,105 | 243 | 610 | 506 | ||||||||||||||||||
| Consumer | 26 | 21 | 0 | 1 | 1 | 0 | ||||||||||||||||||
| Total | $ | 9,349 | $ | 10,185 | $ | 11,375 | $ | 311 | $ | 657 | $ | 596 | ||||||||||||
The breakdown by portfolio segment and class of nonaccrual loans and loans past due ninety days or more and still accruing is as follows:
| (In Thousands) | December 31, 2017 | December 31, 2016 | ||||||||||||||
| Past Due | Past Due | |||||||||||||||
| 90+ Days and | 90+ Days and | |||||||||||||||
| Accruing | Nonaccrual | Accruing | Nonaccrual | |||||||||||||
| Residential mortgage: | ||||||||||||||||
| Residential mortgage loans - first liens | $ | 2,340 | $ | 5,131 | $ | 3,022 | $ | 3,770 | ||||||||
| Residential mortgage loans - junior liens | 105 | 242 | 114 | 0 | ||||||||||||
| Home equity lines of credit | 203 | 44 | 320 | 11 | ||||||||||||
| Total residential mortgage | 2,648 | 5,417 | 3,456 | 3,781 | ||||||||||||
| Commercial: | ||||||||||||||||
| Commercial loans secured by real estate | 175 | 5,645 | 2,774 | 3,080 | ||||||||||||
| Commercial and industrial | 603 | 517 | 286 | 119 | ||||||||||||
| Commercial construction and land | 26 | 52 | 0 | 0 | ||||||||||||
| Loans secured by farmland | 271 | 1,308 | 219 | 1,331 | ||||||||||||
| Multi-family (5 or more) residential | 0 | 392 | 0 | 392 | ||||||||||||
| Agricultural loans | 0 | 7 | 0 | 13 | ||||||||||||
| Total commercial | 1,075 | 7,921 | 3,279 | 4,935 | ||||||||||||
| Consumer | 1 | 66 | 103 | 20 | ||||||||||||
| Totals | $ | 3,724 | $ | 13,404 | $ | 6,838 | $ | 8,736 | ||||||||
The amounts shown in the table immediately above include loans classified as troubled debt restructurings (described in more detail below), if such loans are considered past due ninety days or more, or nonaccrual.
| 69 |
The tables below present a summary of the contractual aging of loans as of December 31, 2017 and 2016:
| As of December 31, 2017 | As of December 31, 2016 | |||||||||||||||||||||||||||||||
| Current & | Current & | |||||||||||||||||||||||||||||||
| (In Thousands) | Past Due | Past Due | Past Due | Past Due | Past Due | Past Due | ||||||||||||||||||||||||||
| Less than | 30-89 | 90+ | Less than | 30-89 | 90+ | |||||||||||||||||||||||||||
| 30 Days | Days | Days | Total | 30 Days | Days | Days | Total | |||||||||||||||||||||||||
| Residential mortgage: | ||||||||||||||||||||||||||||||||
| Residential mortgage loans - first liens | $ | 347,032 | $ | 7,967 | $ | 4,988 | $ | 359,987 | $ | 321,670 | $ | 6,695 | $ | 5,737 | $ | 334,102 | ||||||||||||||||
| Residential mortgage loans - junior liens | 25,133 | 87 | 105 | 25,325 | 23,268 | 324 | 114 | 23,706 | ||||||||||||||||||||||||
| Home equity lines of credit | 34,789 | 732 | 237 | 35,758 | 37,603 | 134 | 320 | 38,057 | ||||||||||||||||||||||||
| 1-4 Family residential construction | 25,667 | 549 | 0 | 26,216 | 24,567 | 341 | 0 | 24,908 | ||||||||||||||||||||||||
| Total residential mortgage | 432,621 | 9,335 | 5,330 | 447,286 | 407,108 | 7,494 | 6,171 | 420,773 | ||||||||||||||||||||||||
| Commercial: | ||||||||||||||||||||||||||||||||
| Commercial loans secured by real estate | 155,917 | 311 | 3,038 | 159,266 | 147,464 | 82 | 2,922 | 150,468 | ||||||||||||||||||||||||
| Commercial and industrial | 87,306 | 303 | 667 | 88,276 | 83,364 | 185 | 305 | 83,854 | ||||||||||||||||||||||||
| Political subdivisions | 59,287 | 0 | 0 | 59,287 | 38,068 | 0 | 0 | 38,068 | ||||||||||||||||||||||||
| Commercial construction and land | 14,400 | 49 | 78 | 14,527 | 14,199 | 88 | 0 | 14,287 | ||||||||||||||||||||||||
| Loans secured by farmland | 6,226 | 12 | 1,017 | 7,255 | 6,181 | 83 | 1,030 | 7,294 | ||||||||||||||||||||||||
| Multi-family (5 or more) residential | 7,321 | 0 | 392 | 7,713 | 7,439 | 65 | 392 | 7,896 | ||||||||||||||||||||||||
| Agricultural loans | 6,114 | 57 | 7 | 6,178 | 3,981 | 4 | 13 | 3,998 | ||||||||||||||||||||||||
| Other commercial loans | 10,986 | 0 | 0 | 10,986 | 11,475 | 0 | 0 | 11,475 | ||||||||||||||||||||||||
| Total commercial | 347,557 | 732 | 5,199 | 353,488 | 312,171 | 507 | 4,662 | 317,340 | ||||||||||||||||||||||||
| Consumer | 14,760 | 123 | 56 | 14,939 | 13,446 | 153 | 123 | 13,722 | ||||||||||||||||||||||||
| Totals | $ | 794,938 | $ | 10,190 | $ | 10,585 | $ | 815,713 | $ | 732,725 | $ | 8,154 | $ | 10,956 | $ | 751,835 | ||||||||||||||||
Nonaccrual loans are included in the contractual aging immediately above. A summary of the contractual aging of nonaccrual loans at December 31, 2017 and 2016 is as follows:
| Current & | ||||||||||||||||
| (In Thousands) | Past Due | Past Due | Past Due | |||||||||||||
| Less than | 30-89 | 90+ | ||||||||||||||
| 30 Days | Days | Days | Total | |||||||||||||
| December 31, 2017 Nonaccrual Totals | $ | 5,802 | $ | 741 | $ | 6,861 | $ | 13,404 | ||||||||
| December 31, 2016 Nonaccrual Totals | $ | 4,199 | $ | 419 | $ | 4,118 | $ | 8,736 | ||||||||
Loans whose terms are modified are classified as Troubled Debt Restructurings (TDRs) if the Corporation grants such borrowers concessions and it is deemed that those borrowers are experiencing financial difficulty. Loans classified as TDRs are designated as impaired and reviewed each quarter to determine if a specific allowance for loan losses is required. The outstanding balance of loans subject to TDRs, as well as the contractual aging information at December 31, 2017 and 2016 is as follows:
| Troubled Debt Restructurings (TDRs): | ||||||||||||||||||||
| Current & | ||||||||||||||||||||
| (In Thousands) | Past Due | Past Due | Past Due | |||||||||||||||||
| Less than | 30-89 | 90+ | ||||||||||||||||||
| 30 Days | Days | Days | Nonaccrual | Total | ||||||||||||||||
| December 31, 2017 Totals | $ | 636 | $ | 0 | $ | 0 | $ | 3,027 | $ | 3,663 | ||||||||||
| December 31, 2016 Totals | $ | 5,453 | $ | 350 | $ | 0 | $ | 2,874 | $ | 8,677 | ||||||||||
At December 31, 2017 and 2016, there were no commitments to loan additional funds to borrowers whose loans have been classified as TDRs.
| 70 |
There were no TDRs that occurred during 2017. A summary of TDRs that occurred during 2016 and 2015 is as follows:
| (Balances in Thousands) | ||||||||||||||||
| 2016 | 2015 | |||||||||||||||
| Post- | Post- | |||||||||||||||
| Number | Modification | Number | Modification | |||||||||||||
| of | Recorded | of | Recorded | |||||||||||||
| Loans | Investment | Loans | Investment | |||||||||||||
| Residential mortgage - first liens: | ||||||||||||||||
| Extended maturity with interest rate reduction | 1 | $ | 71 | 1 | $ | 56 | ||||||||||
| Extended maturity with reduced monthly payments | 1 | 26 | 0 | 0 | ||||||||||||
| Reduced monthly payments for a six-month period | 0 | 0 | 1 | 242 | ||||||||||||
| Residential mortgage - junior liens, | ||||||||||||||||
| Interest rate and monthly payment reduction | 0 | 0 | 1 | 32 | ||||||||||||
| Commercial loans secured by real estate, | ||||||||||||||||
| Interest only payments for a period of one year | 1 | 2,773 | 0 | 0 | ||||||||||||
| Commercial and industrial, | ||||||||||||||||
| Extended maturity | 1 | 5 | 0 | 0 | ||||||||||||
| Consumer: | ||||||||||||||||
| Interest rate and monthly payment reduction | 0 | 0 | 1 | 30 | ||||||||||||
| New unsecured loan after short-fall from sale | ||||||||||||||||
| of property | 1 | 24 | 0 | 0 | ||||||||||||
| Total | 5 | $ | 2,899 | 4 | $ | 360 | ||||||||||
There were no differences between the outstanding contractual amounts and the recorded investments in receivables resulting from TDRs that occurred in 2016 and 2015.
For 2017, there were no defaults on loans for which modifications considered to be TDRs were entered into within the previous 12 months. For 2016 and 2015, defaults on loans for which modifications considered to be TDRs were entered into within the previous 12 months are summarized as follows:
| (Balances in Thousands) | ||||||||||||||||
| 2016 | 2015 | |||||||||||||||
| Number | Number | |||||||||||||||
| of | Recorded | of | Recorded | |||||||||||||
| Loans | Investment | Loans | Investment | |||||||||||||
| Residential mortgage - first liens | 2 | $ | 294 | 1 | $ | 32 | ||||||||||
| Residential mortgage - junior liens | 1 | 29 | 0 | 0 | ||||||||||||
| Commercial and industrial | 1 | 5 | 0 | 0 | ||||||||||||
| Consumer | 1 | 27 | 0 | 0 | ||||||||||||
| Total | 5 | $ | 355 | 1 | $ | 32 | ||||||||||
The carrying amount of foreclosed residential real estate properties held as a result of obtaining physical possession (included in Foreclosed assets held for sale in the consolidated balance sheets) is as follows:
| (In Thousands) | Dec. 31, | Dec. 31, | ||||||
| 2017 | 2016 | |||||||
| Foreclosed residential real estate | $ | 721 | $ | 1,102 | ||||
The recorded investment of consumer mortgage loans secured by residential real properties for which formal foreclosure proceedings were in process is as follows:
| (In Thousands) | Dec. 31, | Dec. 31, | ||||||
| 2017 | 2016 | |||||||
| Residential real estate in process of foreclosure | $ | 1,789 | $ | 2,738 | ||||
| 71 |
9. BANK PREMISES AND EQUIPMENT
| (In Thousands) | December 31, | |||||||||||
| 2017 | 2016 | |||||||||||
| Land | $ | 2,818 | $ | 2,818 | ||||||||
| Buildings and improvements | 28,285 | 27,619 | ||||||||||
| Furniture and equipment | 15,578 | 18,741 | ||||||||||
| Construction in progress | 268 | 392 | ||||||||||
| Total | 46,949 | 49,570 | ||||||||||
| Less: accumulated depreciation | (31,517 | ) | (34,173 | ) | ||||||||
| Net | $ | 15,432 | $ | 15,397 | ||||||||
Depreciation expense included in occupancy expense and furniture and equipment expense was as follows:
| (In Thousands) | 2017 | 2016 | 2015 | |||||||||
| Occupancy expense | $ | 801 | $ | 804 | $ | 954 | ||||||
| Furniture and equipment expense | 838 | 785 | 934 | |||||||||
| Total | $ | 1,639 | $ | 1,589 | $ | 1,888 | ||||||
10. INTANGIBLE ASSETS
There were no changes in the carrying amount of goodwill in 2017 and 2016. The balance in goodwill was $11,942,000 at December 31, 2017 and 2016. The Corporation did not complete any acquisitions in 2017 or 2016.
In testing goodwill for impairment as of December 31, 2017, the Corporation assessed qualitative factors to determine whether it is more likely than not that the fair value of its only reporting unit, its community banking operation, is less than its carrying amount. The qualitative factors assessed included the Corporation’s recent financial performance, economic conditions in the Corporation’s market area, macroeconomic conditions and other factors. Based on the assessment of qualitative factors, the Corporation determined that it is not more likely than not that the fair value of the community banking operation has fallen below its carrying value, and therefore, the Corporation did not perform the more detailed, two-step goodwill impairment test described in Topic 350. Accordingly, there was no goodwill impairment as of December 31, 2017.
Information related to the core deposit intangibles is as follows:
| December 31, | ||||||||
| (In Thousands) | 2017 | 2016 | ||||||
| Gross amount | $ | 2,034 | $ | 2,034 | ||||
| Less: accumulated amortization | (2,022 | ) | (2,017 | ) | ||||
| Net | $ | 12 | $ | 17 | ||||
Amortization expense was $5,000 in 2017, $13,000 in 2016 and $22,000 in 2015. The amount of amortization expense to be recognized each of the ensuing five years is not significant.
11. DEPOSITS
At December 31, 2017, the scheduled maturities of time deposits are as follows:
| (In Thousands) | ||||
| 2018 | $ | 112,563 | ||
| 2019 | 57,097 | |||
| 2020 | 22,836 | |||
| 2021 | 7,975 | |||
| 2022 | 10,484 | |||
| Thereafter | 2,716 | |||
| Total | $ | 213,671 | ||
| 72 |
Time deposits of more than $250,000 totaled $12,653,000 at December 31, 2017 and $7,929,000 at December 31, 2016. As of December 31, 2017, the remaining maturities or time to next re-pricing of time deposits more than $250,000 was as follows:
| (In Thousands) | ||||
| Three months or less | $ | 4,833 | ||
| Over 3 months through 12 months | 5,375 | |||
| Over 1 year through 3 years | 1,148 | |||
| Over 3 years | 1,297 | |||
| Total | $ | 12,653 | ||
12. BORROWED FUNDS
Short-term borrowings (initial maturity within one year) include the following:
| (In Thousands) | Dec. 31, | Dec. 31, | ||||||
| 2017 | 2016 | |||||||
| FHLB-Pittsburgh borrowings | $ | 58,000 | $ | 21,000 | ||||
| Customer repurchase agreements | 3,766 | 5,175 | ||||||
| Total short-term borrowings | $ | 61,766 | $ | 26,175 | ||||
Short-term borrowings from FHLB-Pittsburgh are as follows:
| (In Thousands) | Dec. 31, | Dec. 31 | ||||||
| 2017 | 2016 | |||||||
| Overnight borrowing | $ | 29,000 | $ | 21,000 | ||||
| Other short-term advances | 29,000 | 0 | ||||||
| Total short-term FHLB-Pittsburgh borrowings | $ | 58,000 | $ | 21,000 | ||||
The weighted average interest rate on total short-term borrowings outstanding was 1.52% at December 31, 2017 and 0.61% at December 31, 2016. The maximum amount of total short-term borrowings outstanding at any month-end was $61,766,000 in 2017, $47,005,000 in 2016 and $53,496,000 in 2015.
The Corporation had available credit with other correspondent banks totaling $45,000,000 at December 31, 2017 and 2016. These lines of credit are primarily unsecured. No amounts were outstanding at December 31, 2017 or 2016.
The Corporation has a line of credit with the Federal Reserve Bank of Philadelphia’s Discount Window. At December 31, 2017, the Corporation had available credit in the amount of $15,877,000 on this line with no outstanding advances. At December 31, 2016, the Corporation had available credit in the amount of $15,636,000 on this line with no outstanding advances. As collateral for this line, the Corporation has pledged available-for-sale securities with a carrying value of $16,301,000 at December 31, 2017 and $17,690,000 at December 31, 2016.
The FHLB-Pittsburgh loan facility is collateralized by qualifying loans secured by real estate with a book value totaling $488,889,000 at December 31, 2017 and $471,454,000 at December 31, 2016. Also, the FHLB-Pittsburgh loan facility requires the Corporation to invest in established amounts of FHLB-Pittsburgh stock. The carrying values of the Corporation’s holdings of FHLB-Pittsburgh stock (included in Other Assets) were $6,426,000 at December 31, 2017 and $4,296,000 at December 31, 2016. The Corporation’s total credit facility with FHLB-Pittsburgh was $362,630,000 at December 31, 2017, including an unused (available) amount of $295,441,000. At December 31, 2016, the Corporation’s total credit facility with FHLB-Pittsburgh was $339,221,000, including an unused (available) amount of $306,767,000.
Overnight borrowings from FHLB-Pittsburgh had an interest rate of 1.54% at December 31, 2017 and 0.74% at December 31, 2016. At December 31, 2017, the other short-term advances included 9 advances of $3,000,000 and 1 advance of $2,000,000, each maturing monthly from January through October 2018, with a weighted average interest rate of 1.69% and rates ranging from 1.23% to 1.89%.
The Corporation engages in repurchase agreements with certain commercial customers. These agreements provide that the Corporation sells specified investment securities to the customers on an overnight basis and repurchases them on the following business day. The weighted average rate paid by the Corporation on customer repurchase agreements was 0.10% at December 31, 2017 and December 31, 2016. The carrying value of the underlying securities was $12,158,000 at December 31, 2017 and $15,019,000 at December 31, 2016.
| 73 |
LONG-TERM BORROWINGS
Long-term borrowings (initial maturity of greater than one year) are as follows:
| (In Thousands) | Dec. 31, | Dec. 31, | ||||||
| 2017 | 2016 | |||||||
| FHLB-Pittsburgh borrowings | $ | 9,189 | $ | 11,454 | ||||
| Repurchase agreements | 0 | 27,000 | ||||||
| Total long-term borrowings | $ | 9,189 | $ | 38,454 | ||||
Long-term borrowings from FHLB - Pittsburgh are as follows:
| (In Thousands) | Dec. 31, | Dec. 31, | ||||||
| 2017 | 2016 | |||||||
| Loan matured in 2017 with a rate of 6.83% | $ | 0 | $ | 4 | ||||
| Loan matured in 2017 with a rate of 3.81% | 0 | 10,000 | ||||||
| Loan maturing in 2018 with a rate of 1.63% | 3,000 | 0 | ||||||
| Loan maturing in 2018 with a rate of 1.35% | 3,000 | 0 | ||||||
| Loan maturing in 2019 with a rate of 1.83% | 2,000 | 0 | ||||||
| Loan maturing in 2020 with a rate of 4.79% | 463 | 646 | ||||||
| Loan maturing in 2025 with a rate of 4.91% | 726 | 804 | ||||||
| Total long-term FHLB-Pittsburgh borrowings | $ | 9,189 | $ | 11,454 | ||||
The repurchase agreement included in long-term borrowings had an interest rate of 3.595% and matured in December 2017.
Securities sold under repurchase agreements were delivered to the broker-dealer who was the counter-party to the transactions. The broker-dealer may have sold, loaned or otherwise disposed of such securities to other parties in the normal course of their operations, and resold to the Corporation substantially identical securities at the maturities of the agreements. The carrying value of the underlying securities sold under the repurchase agreements with the broker dealer was $0 at December 31, 2017 and $31,494,000 at December 31, 2016, as detailed in the following table:
| (In Thousands) | Dec. 31, | Dec. 31, | ||||||
| 2017 | 2016 | |||||||
| Mortgage-backed securities issued or guaranteed by U.S. Government agencies or sponsored agencies: | ||||||||
| Residential pass-through securities | $ | 0 | $ | 18,181 | ||||
| Residential collateralized mortgage obligations | 0 | 13,313 | ||||||
| Total | $ | 0 | $ | 31,494 | ||||
Average daily repurchase agreement borrowings amounted to $26,112,000 in 2017, $27,000,000 in 2016 and $54,304,000 in 2015. The maximum amounts of outstanding borrowings under repurchase agreements with broker-dealers were $27,000,000 in 2017 and 2016, and $61,000,000 in 2015. The weighted average interest rate on repurchase agreements was 3.60% in 2017 and 2016, and 3.99% in 2015.
13. EMPLOYEE AND POSTRETIREMENT BENEFIT PLANS
DEFINED BENEFIT PLANS
The Corporation sponsors a defined benefit health care plan that provides postretirement medical benefits and life insurance to employees who meet certain age and length of service requirements. Full-time employees no longer accrue service time toward the Corporation-subsidized portion of the medical benefits. The plan contains a cost-sharing feature which causes participants to pay for all future increases in costs related to benefit coverage. Accordingly, actuarial assumptions related to health care cost trend rates do not significantly affect the liability balance at December 31, 2017 and December 31, 2016, and are not expected to significantly affect the Corporation’s future expenses. The Corporation uses a December 31 measurement date for the postretirement plan.
| 74 |
In an acquisition in 2007, the Corporation assumed the Citizens Trust Company Retirement Plan, a defined benefit pension plan. This plan covers certain employees who were employed by Citizens Trust Company on December 31, 2002, when the plan was amended to discontinue admittance of any future participant and to freeze benefit accruals. Information related to the Citizens Trust Company Retirement Plan has been included in the tables that follow. The Corporation uses a December 31 measurement date for this plan.
The following table shows the funded status of the defined benefit plans:
| (In Thousands) | ||||||||||||||||
| Pension | Postretirement | |||||||||||||||
| 2017 | 2016 | 2017 | 2016 | |||||||||||||
| CHANGE IN BENEFIT OBLIGATION: | ||||||||||||||||
| Benefit obligation at beginning of year | $ | 713 | $ | 722 | $ | 1,555 | $ | 1,539 | ||||||||
| Service cost | 0 | 0 | 36 | 37 | ||||||||||||
| Interest cost | 24 | 26 | 57 | 62 | ||||||||||||
| Plan participants’ contributions | 0 | 0 | 211 | 215 | ||||||||||||
| Actuarial loss (gain) | 127 | 3 | (103 | ) | (30 | ) | ||||||||||
| Benefits paid | (14 | ) | (38 | ) | (259 | ) | (268 | ) | ||||||||
| Benefit obligation at end of year | $ | 850 | $ | 713 | $ | 1,497 | $ | 1,555 | ||||||||
| CHANGE IN PLAN ASSETS: | ||||||||||||||||
| Fair value of plan assets at beginning of year | $ | 846 | $ | 839 | $ | 0 | $ | 0 | ||||||||
| Actual return on plan assets | 91 | 45 | 0 | 0 | ||||||||||||
| Employer contribution | 0 | 0 | 48 | 53 | ||||||||||||
| Plan participants’ contributions | 0 | 0 | 211 | 215 | ||||||||||||
| Benefits paid | (14 | ) | (38 | ) | (259 | ) | (268 | ) | ||||||||
| Fair value of plan assets at end of year | $ | 923 | $ | 846 | $ | 0 | $ | 0 | ||||||||
| Funded status at end of year | $ | 73 | $ | 133 | $ | (1,497 | ) | $ | (1,555 | ) | ||||||
At December 31, 2017 and 2016, the following pension plan and postretirement plan asset and liability amounts were recognized in the consolidated balance sheets:
| Assets and liabilities: | ||||||||||||||||
| (In Thousands) | Pension | Postretirement | ||||||||||||||
| 2017 | 2016 | 2017 | 2016 | |||||||||||||
| Other assets | $ | 73 | $ | 133 | ||||||||||||
| Accrued interest and other liabilities | $ | 1,497 | $ | 1,555 | ||||||||||||
At December 31, 2017 and 2016, the following items included in accumulated other comprehensive income had not been recognized as components of expense:
| Items not yet recognized as a component | ||||||||||||||||
| of net periodic benefit cost: | ||||||||||||||||
| (In Thousands) | Pension | Postretirement | ||||||||||||||
| 2017 | 2016 | 2017 | 2016 | |||||||||||||
| Prior service cost | $ | 0 | $ | 0 | $ | (309 | ) | $ | (340 | ) | ||||||
| Net actuarial loss (gain) | 221 | 161 | (2 | ) | 101 | |||||||||||
| Total | $ | 221 | $ | 161 | $ | (311 | ) | $ | (239 | ) | ||||||
For the defined benefit pension plan, amortization of the net actuarial loss is expected to be $13,000 in 2018. For the postretirement plan, the estimated amount of prior service cost that will be amortized from accumulated other comprehensive loss into net periodic benefit cost in 2018 is a reduction in expense of $31,000, and no net actuarial gain is expected to be amortized in 2018.
The accumulated benefit obligation for the defined benefit pension plan was $850,000 at December 31, 2017 and $713,000 at December 31, 2016.
| 75 |
The components of net periodic benefit costs from defined benefit plans are as follows:
| (In Thousands) | Pension | Postretirement | ||||||||||||||||||||||
| 2017 | 2016 | 2015 | 2017 | 2016 | 2015 | |||||||||||||||||||
| Service cost | $ | 0 | $ | 0 | $ | 0 | $ | 36 | $ | 37 | $ | 38 | ||||||||||||
| Interest cost | 24 | 26 | 36 | 57 | 62 | 57 | ||||||||||||||||||
| Expected return on plan assets | (31 | ) | (26 | ) | (45 | ) | 0 | 0 | 0 | |||||||||||||||
| Amortization of prior service cost | 0 | 0 | 0 | (31 | ) | (31 | ) | (31 | ) | |||||||||||||||
| Recognized net actuarial loss | 7 | 9 | 11 | 0 | 0 | 0 | ||||||||||||||||||
| Loss on settlement | 0 | 0 | 87 | 0 | 0 | 0 | ||||||||||||||||||
| Total net periodic benefit cost | $ | 0 | $ | 9 | $ | 89 | $ | 62 | $ | 68 | $ | 64 | ||||||||||||
In 2015, there was a distribution from the pension plan of $337,000, or 32% of the plan’s total accumulated benefit obligation prior to the distribution. The Corporation recognized a loss of $87,000 (included in net periodic benefit cost) in 2015 as a result of this settlement.
The weighted-average assumptions used to determine net periodic benefit cost are as follows:
| Pension | Postretirement | |||||||||||||||||||||||
| 2017 | 2016 | 2015 | 2017 | 2016 | 2015 | |||||||||||||||||||
| Discount rate | 4.05 | % | 4.30 | % | 3.75 | % | 3.75 | % | 4.25 | % | 4.00 | % | ||||||||||||
| Expected return on plan assets | 6.00 | % | 5.00 | % | 5.31 | % | N/A | N/A | N/A | |||||||||||||||
| Rate of compensation increase | N/A | N/A | N/A | N/A | N/A | N/A | ||||||||||||||||||
The weighted-average assumptions used to determine benefit obligations as of December 31, 2017 and 2016 are as follows:
| Pension | Postretirement | |||||||||||||||
| 2017 | 2016 | 2017 | 2016 | |||||||||||||
| Discount rate | 3.55 | % | 4.05 | % | 3.75 | % | 4.25 | % | ||||||||
| Rate of compensation increase | N/A | N/A | N/A | N/A | ||||||||||||
Estimated future benefit payments, including only estimated employer contributions for the postretirement plan, which reflect expected future service, are as follows:
| (In Thousands) | Pension | Postretirement | ||||||
| 2018 | $ | 312 | $ | 96 | ||||
| 2019 | 41 | 96 | ||||||
| 2020 | 13 | 104 | ||||||
| 2021 | 12 | 101 | ||||||
| 2022 | 14 | 105 | ||||||
| 2023-2027 | 226 | 516 | ||||||
No estimated minimum contribution to the defined benefit pension plan is required in 2018, though the Corporation may make discretionary contributions.
The expected return on pension plan assets is a significant assumption used in the calculation of net periodic benefit cost. This assumption reflects the average long-term rate of earnings expected on the funds invested or to be invested to provide for the benefits included in the projected benefit obligation.
The fair values of pension plan assets at December 31, 2017 and 2016 are as follows:
| 2017 | 2016 | |||||||
| Mutual funds invested principally in: | ||||||||
| Cash and cash equivalents | 2 | % | 2 | % | ||||
| Debt securities | 37 | % | 38 | % | ||||
| Equity securities | 45 | % | 44 | % | ||||
| Alternative funds | 16 | % | 16 | % | ||||
| Total | 100 | % | 100 | % | ||||
| 76 |
C&N Bank’s Trust and Financial Management Department manages the investment of the pension plan assets. The Plan’s securities include mutual funds invested principally in debt securities, a diversified mix of large, mid- and small-capitalization U.S. stocks, foreign stocks and alternative asset classes such as real estate, commodities, and inflation-protected securities. The fair values of plan assets are determined based on Level 1 inputs (as described in Note 6). At December 31, 2017, the targeted asset allocation of mutual funds for the pension plan was 45% equity securities, 37% debt securities, 16% alternative assets, and 2% cash. At December 31, 2016, the targeted asset allocation of mutual funds for the pension plan was 44% equity securities, 38% debt securities, 16% alternative assets and 2% cash. The pension plan’s assets do not include any shares of the Corporation’s common stock.
PROFIT SHARING AND DEFERRED COMPENSATION PLANS
The Corporation has a profit sharing plan that incorporates the deferred salary savings provisions of Section 401(k) of the Internal Revenue Code. The Corporation’s matching contributions to the Plan depend upon the tax deferred contributions of employees. The Corporation’s total basic and matching contributions were $681,000 in 2017, $646,000 in 2016 and $609,000 in 2015.
The Corporation has an Employee Stock Ownership Plan (ESOP). Contributions to the ESOP are discretionary, and the ESOP uses funds contributed to purchase Corporation stock for the accounts of ESOP participants. These purchases are made on the market (not directly from the Corporation), and employees are not permitted to purchase Corporation stock under the ESOP. The ESOP includes a diversification feature, which allows participants, upon reaching age 55 and 10 years of service (as defined), to sell up to 50% of their Corporation shares over a period of 6 years. As of December 31, 2017 and 2016, there were no shares allocated for repurchase by the ESOP.
Dividends paid on shares held by the ESOP are charged to retained earnings. All Corporation shares owned through the ESOP are included in the calculation of weighted-average shares outstanding for purposes of calculating earnings per share - basic and diluted. The ESOP held 419,067 shares of Corporation stock at December 31, 2017 and 417,753 shares at December 31, 2016, all of which had been allocated to Plan participants. The Corporation’s contributions to the ESOP totaled $588,000 in 2017, $549,000 in 2016 and $522,000 in 2015.
The Corporation has a nonqualified supplemental deferred compensation arrangement with its key officers. Charges to operating expense for officers’ supplemental deferred compensation were $200,000 in 2017, $184,000 in 2016 and $167,000 in 2015.
In December 2015, the Corporation established a nonqualified deferred compensation plan that allows selected officers, beginning in 2016, the option to defer receipt of cash compensation, including base salary and any cash bonuses or other cash incentives. This nonqualified deferred compensation plan does not provide for Corporation contributions.
STOCK-BASED COMPENSATION PLANS
The Corporation has a Stock Incentive Plan for a selected group of senior officers. A total of 850,000 shares of common stock may be issued under the Stock Incentive Plan. Awards may be made under the Stock Incentive Plan in the form of qualified options (“Incentive Stock Options,” as defined in the Internal Revenue Code), nonqualified options, stock appreciation rights or restricted stock. Historically through December 31, 2017, all awards made under this Plan have consisted of Incentive Stock Options or restricted stock. Incentive Stock Options have an exercise price equal to the market value of the stock at the date of grant, vest after 6 months and expire after 10 years. There are 270,179 shares available for issuance under the Stock Incentive Plan as of December 31, 2017.
Also, the Corporation has an Independent Directors Stock Incentive Plan. This plan permits awards of nonqualified stock options and/or restricted stock to non-employee directors. A total of 135,000 shares of common stock may be issued under the Independent Directors Stock Incentive Plan. The recipients’ rights to exercise stock options under this plan expire 10 years from the date of grant. The exercise prices of all stock options awarded under the Independent Directors Stock Incentive Plan are equal to market value as of the dates of grant. There are 17,396 shares available for issuance under the Independent Directors Stock Incentive Plan as of December 31, 2017.
Total stock-based compensation expense is as follows:
| (In Thousands) | 2017 | 2016 | 2015 | |||||||||
| Restricted stock | $ | 627 | $ | 578 | $ | 606 | ||||||
| Stock options | 0 | 0 | 0 | |||||||||
| Total | $ | 627 | $ | 578 | $ | 606 | ||||||
| 77 |
The following summarizes non-vested restricted stock activity for the year ended December 31, 2017:
| Weighted | ||||||||
| Average | ||||||||
| Number |
Grant
Date |
|||||||
|
of
Shares |
Fair
Value |
|||||||
| Outstanding, December 31, 2016 | 63,362 | $ | 20.35 | |||||
| Granted | 30,782 | $ | 25.97 | |||||
| Vested | (28,981 | ) | $ | 20.21 | ||||
| Forfeited | (4,406 | ) | $ | 21.74 | ||||
| Outstanding, December 31, 2017 | 60,757 | $ | 23.17 | |||||
Compensation cost related to restricted stock is recognized based on the market price of the stock at the grant date over the vesting period, adjusted for estimated and actual forfeitures. As of December 31, 2017, there was $671,000 total unrecognized compensation cost related to restricted stock, which is expected to be recognized over a weighted average period of 1.3 years.
In 2017 and 2016, the Corporation awarded shares of restricted stock under the Stock Incentive Plan, as follows:
| 2017 | 2016 | |||||||
| Executive Officers | 14,897 | 17,289 | ||||||
| Other employees | 7,415 | 10,304 | ||||||
| Total | 22,312 | 27,593 | ||||||
Restricted stock awards in 2017 and 2016 to employees other than executive officers vest over a three-year term, subject to continued employment and satisfactory job performance, with no additional performance conditions (time vesting). Restricted stock awards in 2017 and 2016 to Executive Officers vest over a three-year term, with vesting for half of the shares based on time vesting and vesting for half of the shares based on time vesting and upon the Corporation meeting an annual return on average equity (“ROAE”) performance ratio, as defined. The minimum level for satisfying the performance condition defined in the 2017 and 2016 awards was an ROAE at the 50 th percentile of the defined Peer Group’s results. The Corporation did not meet the performance condition defined in the 2017 and 2016 awards, as the Corporation’s return on average equity ROAE was in the 37 th percentile of the Peer Group’s results for the 12-month period ended September 30, 2017 and in the 47 th percentile of the Peer Group’s results for the 12-month period ended September 30, 2016. For purposes of the 2017 and 2016 awards, the Peer Group included all publicly traded commercial banks and bank holding companies with headquarters in Pennsylvania, New York, New Jersey and Ohio, and total assets ranging between $750 million and $3.5 billion as of the beginning of the applicable period.
Most of the restricted stock awards issued under this Plan prior to 2016, for which a portion of the awards vested in 2017 and 2016, include a condition that the Corporation must meet an annual targeted ROAE performance ratio, as defined, in order for participants to vest. In 2017, 2016 and 2015, the Corporation met the ROAE target applicable to these awards, which is based on the Corporation’s ROAE for 12-month periods ended September 30 of each year as compared to the applicable peer group of bank holding companies based in Pennsylvania and one local competitor based in New York with total assets of $750 million to $2 billion as of the beginning of each applicable period.
In 2017, a total of 8,470 restricted shares were granted under the Independent Directors Stock Incentive Plan, subject to time vesting over a term of one year. In 2016, a total of 7,834 restricted shares were granted under the Independent Directors Stock Incentive Plan, also with time vesting over a term of one year.
| 78 |
There were no stock options granted in 2017, 2016 or 2015. A summary of stock option activity is presented below:
| 2017 | 2016 | 2015 | ||||||||||||||||||||||
| Weighted | Weighted | Weighted | ||||||||||||||||||||||
| Average | Average | Average | ||||||||||||||||||||||
| Exercise | Exercise | Exercise | ||||||||||||||||||||||
| Shares | Price | Shares | Price | Shares | Price | |||||||||||||||||||
| Outstanding, beginning of year | 202,037 | $ | 18.58 | 248,486 | $ | 18.59 | 316,157 | $ | 19.05 | |||||||||||||||
| Granted | 0 | 0 | 0 | |||||||||||||||||||||
| Exercised | (24,976 | ) | $ | 17.50 | (35,880 | ) | $ | 18.86 | (29,557 | ) | $ | 17.56 | ||||||||||||
| Forfeited | (635 | ) | $ | 19.88 | (10,569 | ) | $ | 18.03 | (20,211 | ) | $ | 19.76 | ||||||||||||
| Expired | (10,766 | ) | $ | 22.33 | 0 | (17,903 | ) | $ | 27.00 | |||||||||||||||
| Outstanding, end of year | 165,660 | $ | 18.49 | 202,037 | $ | 18.58 | 248,486 | $ | 18.59 | |||||||||||||||
| Options exercisable at year-end | 165,660 | $ | 18.49 | 202,037 | $ | 18.58 | 248,486 | $ | 18.59 | |||||||||||||||
| Weighted-average fair value of options forfeited | $ | 4.21 | $ | 4.04 | $ | 4.86 | ||||||||||||||||||
The weighted-average remaining contractual term of outstanding stock options at December 31, 2017 was 3.5 years. The aggregate intrinsic value of stock options outstanding was $913,000 at December 31, 2017. The total intrinsic value of options exercised was $164,000 in 2017, $183,000 in 2016 and $77,000 in 2015.
The Corporation has issued shares from treasury stock for almost all stock option exercises through December 31, 2017. Management does not anticipate that stock repurchases will be necessary to accommodate stock option exercises in 2018.
In January 2018, the Corporation awarded 25,416 shares of restricted stock under the Stock Incentive Plan and 9,086 shares of restricted stock under the Independent Directors Stock Incentive Plans. The 2018 restricted stock awards under the Stock Incentive Plan vest ratably over three years, and vesting for one-half of the 16,578 restricted shares awarded to Executive Officers depends on the Corporation meeting a ROAE target each year. The 2018 restricted stock issued under the Independent Directors Stock Incentive Plan vests over one year. Total estimated stock-based compensation for 2018 is $716,000. The restricted stock awards made in January 2018 are not included in the tables above.
14. INCOME TAXES
The net deferred tax asset at December 31, 2017 and 2016 represents the following temporary difference components:
| December 31, | December 31, | |||||||
| (In Thousands) | 2017 | 2016 | ||||||
| Deferred tax assets: | ||||||||
| Unrealized holding losses on securities: | ||||||||
| Included in accumulated other comprehensive loss | $ | 843 | $ | 512 | ||||
| Included in retained earnings | (337 | ) | 0 | |||||
| Allowance for loan losses | 1,894 | 2,998 | ||||||
| Other deferred tax assets | 1,726 | 2,658 | ||||||
| Total deferred tax assets | 4,126 | 6,168 | ||||||
| Deferred tax liabilities: | ||||||||
| Defined benefit plans - ASC 835: | ||||||||
| Included in accumulated other comprehensive loss | 31 | 27 | ||||||
| Included in retained earnings | (12 | ) | 0 | |||||
| Bank premises and equipment | 751 | 913 | ||||||
| Core deposit intangibles | 3 | 6 | ||||||
| Other deferred tax liabilities | 64 | 105 | ||||||
| Total deferred tax liabilities | 837 | 1,051 | ||||||
| Deferred tax asset, net | $ | 3,289 | $ | 5,117 | ||||
| 79 |
The provision for income taxes includes the following:
| (In thousands) | 2017 | 2016 | 2015 | |||||||||
| Currently payable | $ | 4,938 | $ | 5,328 | $ | 5,097 | ||||||
| Tax expense resulting from allocations of certain tax benefits to equity or as a reduction in other assets | 63 | 175 | 161 | |||||||||
| Deferred | 2,155 | (156 | ) | 79 | ||||||||
| Total provision | $ | 7,156 | $ | 5,347 | $ | 5,337 | ||||||
A reconciliation of income tax at the statutory rate to the Corporation’s effective rate is as follows (amounts in thousands):
| (Amounts in thousands) | 2017 | 2016 | 2015 | |||||||||||||||||||||
| Amount | % | Amount | % | Amount | % | |||||||||||||||||||
| Expected provision | $ | 7,207 | 35.00 | $ | 7,388 | 35.00 | $ | 7,633 | 35.00 | |||||||||||||||
| Tax-exempt interest income | (1,817 | ) | (8.82 | ) | (1,801 | ) | (8.53 | ) | (1,914 | ) | (8.78 | ) | ||||||||||||
| Nondeductible interest expense | 42 | 0.20 | 40 | 0.19 | 51 | 0.23 | ||||||||||||||||||
| Dividends received deduction | (7 | ) | (0.03 | ) | (22 | ) | (0.10 | ) | (75 | ) | (0.34 | ) | ||||||||||||
| Increase in cash surrender value of life insurance | (133 | ) | (0.65 | ) | (134 | ) | (0.63 | ) | (135 | ) | (0.62 | ) | ||||||||||||
| Employee stock option compensation | 8 | 0.04 | 0 | 0.00 | 0 | 0.00 | ||||||||||||||||||
| ESOP Dividends | (154 | ) | (0.75 | ) | 0 | 0.00 | 0 | 0.00 | ||||||||||||||||
| Tax benefit from limited partnership investment | (73 | ) | (0.35 | ) | (76 | ) | (0.36 | ) | (80 | ) | (0.37 | ) | ||||||||||||
| Effect of tax rate change | 2,159 | 10.49 | 0 | 0.00 | 0 | 0.00 | ||||||||||||||||||
| Other, net | (76 | ) | (0.37 | ) | (48 | ) | (0.23 | ) | (143 | ) | (0.66 | ) | ||||||||||||
| Effective income tax provision | $ | 7,156 | 34.75 | $ | 5,347 | 25.33 | $ | 5,337 | 24.47 | |||||||||||||||
In 2017, the Corporation recognized a reduction in the carrying value of the net deferred tax asset of $2,159,000 as a result of the December 2017 enactment of a reduction in the federal corporate income tax rate to 21% effective January 1, 2018, from the 35% marginal tax rate in effect throughout 2017, 2016 and 2015. Included in the total related provision was $325,000 associated with items included in Accumulated Other Comprehensive Loss in the consolidated balance sheets. Management believes the Corporation’s accounting for the effects of the reduction in the federal income tax rate is materially complete at December 31, 2017.
The Corporation has investments in three limited partnerships that manage affordable housing projects that have qualified for the federal low-income housing tax credit. The Corporation’s expected return from these investments is based on the receipt of tax credits and tax benefits from deductions of operating losses. The Corporation uses the effective yield method to account for these investments, with the benefits recognized as a reduction of the provision for income taxes. For two of the three limited partnership investments, the tax credits have been received in full in prior years, and the Corporation has fully realized the benefits of the credits and amortized its initial investments in the partnerships. The most recent affordable housing project was completed in 2013, and the Corporation received tax credits in 2013 through 2017 and expects to continue to receive tax credits annually through 2022. The carrying amount of the Corporation’s investment is $608,000 at December 31, 2017 and $713,000 at December 31, 2016 (included in Other Assets in the consolidated balance sheets). For 2017, the estimated amount of tax credits and other tax benefits to be received is $157,000 and the amount recognized as a reduction of the provision for income taxes is $73,000. In 2016, the Corporation received tax credits and other tax benefits totaling $158,000, and recognized a reduction of the provision for income tax of $76,000. In 2015, the Corporation received tax credits and other tax benefits totaling $160,000, and recognized a reduction of the provision for income tax of $80,000.
The Corporation has no unrecognized tax benefits, nor pending examination issues related to tax positions taken in preparation of its income tax returns. With limited exceptions, the Corporation is no longer subject to examination by the Internal Revenue Service for years prior to 2014.
15. RELATED PARTY TRANSACTIONS
Loans to executive officers, directors of the Corporation and its subsidiaries and any associates of the foregoing persons are as follows:
| (In Thousands) | Beginning | New | Other | Ending | ||||||||||||||||
| Balance | Loans | Repayments | Changes | Balance | ||||||||||||||||
| 12 directors, 7 executive officers 2017 | $ | 11,414 | $ | 2,128 | $ | (2,061 | ) | $ | 2,931 | $ | 14,412 | |||||||||
| 12 directors, 7 executive officers 2016 | 10,246 | 307 | (1,160 | ) | 2,021 | 11,414 | ||||||||||||||
| 11 directors, 7 executive officers 2015 | 12,023 | 52 | (808 | ) | (1,021 | ) | 10,246 | |||||||||||||
| 80 |
In the table above, other changes represent net changes in the balance of existing lines of credit and transfers in and out of the related party category.
Deposits from related parties held by the Corporation amounted to $7,171,000 at December 31, 2017 and $6,261,000 at December 31, 2016.
16. OFF-BALANCE SHEET RISK
The Corporation is a party to financial instruments with off-balance sheet risk in the normal course of business to meet the financial needs of its customers. These financial instruments include commitments to extend credit and standby letters of credit. These instruments involve, to varying degrees, elements of credit, interest rate or liquidity risk in excess of the amount recognized in the consolidated balance sheets. The contract amounts of these instruments express the extent of involvement the Corporation has in particular classes of financial instruments.
The Corporation’s exposure to credit loss from nonperformance by the other party to the financial instruments for commitments to extend credit and standby letters of credit is represented by the contractual amount of these instruments. The Corporation uses the same credit policies in making commitments and conditional obligations as it does for on-balance sheet instruments.
Financial instruments whose contract amounts represent credit risk at December 31, 2017 and 2016 are as follows:
| (In Thousands) | 2017 | 2016 | ||||||
| Commitments to extend credit | $ | 187,919 | $ | 180,768 | ||||
| Standby letters of credit | 7,445 | 9,025 | ||||||
Commitments to extend credit are legally binding agreements to lend to customers. Commitments generally have fixed expiration dates or other termination clauses and may require payment of fees. Since many of the commitments are expected to expire without being drawn upon, the total commitment amounts do not necessarily represent future liquidity requirements. The Corporation evaluates each customer’s creditworthiness on a case-by-case basis. The amount of collateral obtained, if deemed necessary by the Corporation, for extensions of credit is based on management’s credit assessment of the counterparty.
Standby letters of credit are conditional commitments issued by the Corporation guaranteeing performance by a customer to a third party. Those guarantees are issued primarily to support public and private borrowing arrangements, including commercial paper, bond financing and similar transactions. The credit risk involved in issuing letters of credit is essentially the same as that involved in extending loan facilities to customers. Some of the standby letters of credit are collateralized by real estate or other assets, and others are unsecured. The extent to which proceeds from liquidation of collateral would be expected to cover the maximum potential amount of future payments related to standby letters of credit is not estimable. The Corporation has recorded no liability associated with standby letters of credit as of December 31, 2017 and 2016.
Standby letters of credit as of December 31, 2017 expire as follows:
| Year of Expiration | (In Thousands) | |||
| 2018 | $ | 7,042 | ||
| 2019 | 355 | |||
| 2020 | 48 | |||
| Total | $ | 7,445 | ||
17. CONTINGENCIES
In the normal course of business, the Corporation is subject to pending and threatened litigation in which claims for monetary damages are asserted. In management’s opinion, the Corporation’s financial position and results of operations would not be materially affected by the outcome of these legal proceedings.
18. REGULATORY MATTERS
The Corporation (on a consolidated basis) and C&N Bank are subject to various regulatory capital requirements administered by the federal banking agencies. Failure to meet minimum capital requirements can initiate certain mandatory - and possibly additional discretionary - actions by regulators that, if undertaken, could have a direct material effect on the Corporation’s financial statements. Under capital adequacy guidelines and the regulatory framework for prompt corrective action, the Corporation and C&N Bank must meet specific capital guidelines that involve quantitative measures of their assets, liabilities and certain off-balance sheet items as calculated under regulatory accounting practices. The capital amounts and classification are also subject to qualitative judgments by the regulators about components, risk weightings and other factors.
| 81 |
Quantitative measures established by regulation to ensure capital adequacy require the Corporation and C&N Bank to maintain minimum amounts and ratios (set forth in the following table) of total capital, Tier I capital (as defined in the regulations) and Common equity Tier 1 capital (as defined) to risk-weighted assets (as defined) and of Tier I capital (as defined) to average assets (as defined). Management believes, as of December 31, 2017 and 2016, that the Corporation and C&N Bank meet all capital adequacy requirements (described in more detail below) to which they are subject and maintain capital conservation buffers that allow the Corporation and C&N Bank to avoid limitations on capital distributions, including dividend payments and certain discretionary bonus payments to certain executive officers.
To be categorized as well capitalized, an institution must maintain minimum total risk based, Tier I risk based, Common equity risk based and Tier I leverage ratios as set forth in the following table. The Corporation’s and C&N Bank’s actual capital amounts and ratios are also presented in the following table:
| (Dollars in Thousands) | Minimum To Be Well | |||||||||||||||||||||||||||||||||||||||
| Actual | Minimum To Maintain | Capitalized Under | Minimum To Meet | |||||||||||||||||||||||||||||||||||||
| Minimum | Capital Conservation | Prompt Corrective | the Corporation’s | |||||||||||||||||||||||||||||||||||||
| Actual |
Capital
Requirement |
Buffer at
Reporting Date |
Action
Provisions |
Policy
Thresholds |
||||||||||||||||||||||||||||||||||||
| Amount | Ratio | Amount | Ratio | Amount | Ratio | Amount | Ratio | Amount | Ratio | |||||||||||||||||||||||||||||||
| December 31, 2017: | ||||||||||||||||||||||||||||||||||||||||
| Total capital to risk-weighted assets: | ||||||||||||||||||||||||||||||||||||||||
| Consolidated | $ | 187,097 | 23.07 | % | $ | 64,872 | ³8% | $ | 75,008 | ³9.25% | $ | 81,090 | ³10% | $ | 85,144 | ³10.5% | ||||||||||||||||||||||||
| C&N Bank | 165,142 | 20.47 | % | 64,528 | ³8% | 74,611 | ³9.25% | 80,661 | ³10% | 84,694 | ³10.5% | |||||||||||||||||||||||||||||
| Tier 1 capital to risk-weighted assets: | ||||||||||||||||||||||||||||||||||||||||
| Consolidated | 177,981 | 21.95 | % | 48,654 | ³6% | 58,790 | ³7.25% | 64,872 | ³8% | 68,926 | ³8.5% | |||||||||||||||||||||||||||||
| C&N Bank | 156,026 | 19.34 | % | 48,396 | ³6% | 58,479 | ³7.25% | 64,528 | ³8% | 68,561 | ³8.5% | |||||||||||||||||||||||||||||
| Common equity tier 1 capital to risk-weighted assets: | ||||||||||||||||||||||||||||||||||||||||
| Consolidated | 177,981 | 21.95 | % | 36,490 | ³4.5% | 46,626 | ³5.75% | 52,708 | ³6.5% | 56,763 | ³7% | |||||||||||||||||||||||||||||
| C&N Bank | 156,026 | 19.34 | % | 36,297 | ³4.5% | 46,380 | ³5.75% | 52,429 | ³6.5% | 56,462 | ³7% | |||||||||||||||||||||||||||||
| Tier 1 capital to average assets: | ||||||||||||||||||||||||||||||||||||||||
| Consolidated | 177,981 | 14.23 | % | 50,023 | ³4% | N/A | N/A | 62,529 | ³5% | 62,529 | ³5% | |||||||||||||||||||||||||||||
| C&N Bank | 156,026 | 12.63 | % | 49,418 | ³4% | N/A | N/A | 61,772 | ³5% | 61,772 | ³5% | |||||||||||||||||||||||||||||
| December 31, 2016: | ||||||||||||||||||||||||||||||||||||||||
| Total capital to risk-weighted assets: | ||||||||||||||||||||||||||||||||||||||||
| Consolidated | $ | 183,597 | 23.60 | % | $ | 62,245 | ³8% | $ | 67,108 | ³8.625% | $ | 77,806 | ³10% | $ | 81,697 | ³10.5% | ||||||||||||||||||||||||
| C&N Bank | 162,705 | 21.03 | % | 61,894 | ³8% | 66,730 | ³8.625% | 77,368 | ³10% | 81,236 | ³10.5% | |||||||||||||||||||||||||||||
| Tier 1 capital to risk-weighted assets: | ||||||||||||||||||||||||||||||||||||||||
| Consolidated | 174,928 | 22.48 | % | 46,684 | ³6% | 51,547 | ³6.625% | 62,245 | ³8% | 66,135 | ³8.5% | |||||||||||||||||||||||||||||
| C&N Bank | 154,036 | 19.91 | % | 46,421 | ³6% | 51,256 | ³6.625% | 61,894 | ³8% | 65,762 | ³8.5% | |||||||||||||||||||||||||||||
| Common equity tier 1 capital to risk-weighted assets: | ||||||||||||||||||||||||||||||||||||||||
| Consolidated | 174,928 | 22.48 | % | 35,013 | ³4.5% | 39,876 | ³5.125% | 50,574 | ³6.5% | 54,464 | ³7% | |||||||||||||||||||||||||||||
| C&N Bank | 154,036 | 19.91 | % | 34,815 | ³4.5% | 39,651 | ³5.125% | 50,289 | ³6.5% | 54,157 | ³7% | |||||||||||||||||||||||||||||
| Tier 1 capital to average assets: | ||||||||||||||||||||||||||||||||||||||||
| Consolidated | 174,928 | 14.27 | % | 49,026 | ³4% | N/A | N/A | 61,282 | ³5% | 61,282 | ³5% | |||||||||||||||||||||||||||||
| C&N Bank | 154,036 | 12.73 | % | 48,404 | ³4% | N/A | N/A | 60,506 | ³5% | 60,506 | ³5% | |||||||||||||||||||||||||||||
In July 2013, the federal regulatory authorities issued a new capital rule based, in part, on revisions developed by the Basel Committee on Banking Supervision to the Basel capital framework (Basel III). The Corporation and C&N Bank became subject to the new rule effective January 1, 2015. Generally, the new rule implemented higher minimum capital requirements, revised the definition of regulatory capital components and related calculations, added a new common equity tier 1 capital ratio, implemented a new capital conservation buffer, increased the risk weighting for past due loans and provided a transition period for several aspects of the new rule.
| 82 |
The current (new) capital rule provides that, in order to avoid limitations on capital distributions, including dividend payments and certain discretionary bonus payments to executive officers, a banking organization must hold a capital conservation buffer composed of common equity tier 1 capital above its minimum risk-based capital requirements. The buffer is measured relative to risk-weighted assets. The 2017 minimum required capital ratios and capital conservation buffer needed in order to fully avoid limitations on capital distributions, along with the remaining transition schedule for new ratios and the capital conservation buffer, is as follows:
| As of January 1: | ||||||||||||
| 2017 | 2018 | 2019 | ||||||||||
| Minimum common equity tier 1 capital ratio | 4.5 | % | 4.5 | % | 4.5 | % | ||||||
| Common equity tier 1 capital conservation buffer | 1.25 | % | 1.875 | % | 2.5 | % | ||||||
| Minimum common equity tier 1 capital ratio plus capital conservation buffer | 5.75 | % | 6.375 | % | 7.0 | % | ||||||
| Phase-in of most deductions from common equity tier 1 capital | 80 | % | 100 | % | 100 | % | ||||||
| Minimum tier 1 capital ratio | 6.0 | % | 6.0 | % | 6.0 | % | ||||||
| Minimum tier 1 capital ratio plus capital conservation buffer | 7.25 | % | 7.875 | % | 8.5 | % | ||||||
| Minimum total capital ratio | 8.0 | % | 8.0 | % | 8.0 | % | ||||||
| Minimum total capital ratio plus capital | ||||||||||||
| conservation buffer | 9.25 | % | 9.875 | % | 10.5 | % | ||||||
As fully phased in, a banking organization with a buffer greater than 2.5% would not be subject to additional limits on dividend payments or discretionary bonus payments; however, a banking organization with a buffer less than 2.5% would be subject to increasingly stringent limitations as the buffer approaches zero. The new rule also prohibits a banking organization from making dividend payments or discretionary bonus payments if its eligible retained income is negative in that quarter and its capital conservation buffer ratio was less than 2.5% as of the beginning of that quarter. Eligible net income is defined as net income for the four calendar quarters preceding the current calendar quarter, net of any distributions and associated tax effects not already reflected in net income. A summary of payout restrictions based on the capital conservation buffer is as follows:
| Capital Conservation Buffer | Maximum Payout | |
| (as a % of risk-weighted assets) | (as a % of eligible retained income) | |
| Greater than 2.5% | No payout limitation applies | |
| ≤2.5% and >1.875% | 60% | |
| ≤1.875% and >1.25% | 40% | |
| ≤1.25% and >0.625% | 20% | |
| ≤0.625% | 0% |
At December 31, 2017, the Corporation’s Capital Conservation Buffer, determined based on the minimum total capital ratio, was 15.07%. C&N Bank’s Capital Conservation Buffer (also determined based on the minimum total capital ratio) was 12.47%.
Banking regulators limit the amount of dividends that may be paid by C&N Bank to the Corporation. Retained earnings against which dividends may be paid without prior approval of the banking regulators amounted to approximately $88,980,000 at December 31, 2017, subject to the minimum capital ratio requirements noted above.
Restrictions imposed by federal law prohibit the Corporation from borrowing from C&N Bank unless the loans are secured in specific amounts. Such secured loans to the Corporation are generally limited to 10% of C&N Bank’s tangible stockholder’s equity (excluding accumulated other comprehensive loss) or $15,604,000 at December 31, 2017.
| 83 |
19. PARENT COMPANY ONLY
The following is condensed financial information for Citizens & Northern Corporation:
| CONDENSED BALANCE SHEET | December 31, | |||||||
| (In Thousands) | 2017 | 2016 | ||||||
| ASSETS | ||||||||
| Cash | $ | 6,790 | $ | 6,033 | ||||
| Investment in subsidiaries: | ||||||||
| Citizens & Northern Bank | 166,576 | 165,397 | ||||||
| Citizens & Northern Investment Corporation | 11,588 | 11,168 | ||||||
| Bucktail Life Insurance Company | 3,488 | 3,419 | ||||||
| Other assets | 15 | 4 | ||||||
| TOTAL ASSETS | $ | 188,457 | $ | 186,021 | ||||
| LIABILITIES AND STOCKHOLDERS’ EQUITY | ||||||||
| Other liabilities | $ | 14 | $ | 13 | ||||
| Stockholders’ equity | 188,443 | 186,008 | ||||||
| TOTAL LIABILITIES AND STOCKHOLDERS’ EQUITY | $ | 188,457 | $ | 186,021 | ||||
| CONDENSED INCOME STATEMENT | ||||||||||||
| (In Thousands) | 2017 | 2016 | 2015 | |||||||||
| Dividends from Citizens & Northern Bank | $ | 12,022 | $ | 14,960 | $ | 11,569 | ||||||
| Expenses | (233 | ) | (367 | ) | (234 | ) | ||||||
| Income before equity in undistributed income of subsidiaries | 11,789 | 14,593 | 11,335 | |||||||||
| Equity in undistributed income of subsidiaries | 1,645 | 1,169 | 5,136 | |||||||||
| NET INCOME | $ | 13,434 | $ | 15,762 | $ | 16,471 | ||||||
| CONDENSED STATEMENT OF CASH FLOWS | ||||||||||||
| (In Thousands) | ||||||||||||
| 2017 | 2016 | 2015 | ||||||||||
| CASH FLOWS FROM OPERATING ACTIVITIES: | ||||||||||||
| Net income | $ | 13,434 | $ | 15,762 | $ | 16,471 | ||||||
| Adjustments to reconcile net income to net | ||||||||||||
| cash provided by operating activities: | ||||||||||||
| Equity in undistributed net income of subsidiaries | (1,645 | ) | (1,169 | ) | (5,136 | ) | ||||||
| (Increase) decrease in other assets | (11 | ) | 20 | 12 | ||||||||
| Increase (decrease) in other liabilities | 1 | (6 | ) | 12 | ||||||||
| Net Cash Provided by Operating Activities | 11,779 | 14,607 | 11,359 | |||||||||
| CASH FLOWS FROM FINANCING ACTIVITIES: | ||||||||||||
| Proceeds from sale of treasury stock | 128 | 263 | 381 | |||||||||
| Tax (cost) benefit from compensation plans, net | (5 | ) | 151 | 143 | ||||||||
| Purchase of treasury stock | 0 | (3,723 | ) | (4,415 | ) | |||||||
| Dividends paid | (11,145 | ) | (11,112 | ) | (11,245 | ) | ||||||
| Net Cash Used in Financing Activities | (11,022 | ) | (14,421 | ) | (15,136 | ) | ||||||
| INCREASE (DECREASE) IN CASH AND CASH EQUIVALENTS | 757 | 186 | (3,777 | ) | ||||||||
| CASH AND CASH EQUIVALENTS, BEGINNING OF YEAR | 6,033 | 5,847 | 9,624 | |||||||||
| CASH AND CASH EQUIVALENTS, END OF YEAR | $ | 6,790 | $ | 6,033 | $ | 5,847 | ||||||
| 84 |
20. SUMMARY OF QUARTERLY CONSOLIDATED FINANCIAL DATA (Unaudited)
The following table presents summarized quarterly financial data for 2017 and 2016:
| SUMMARY OF QUARTERLY CONSOLIDATED FINANCIAL DATA | ||||||||||||||||
| (In Thousands Except Per Share Data) (Unaudited) | ||||||||||||||||
| 2017 Quarter Ended | ||||||||||||||||
| Mar. 31, | June 30, | Sept. 30, | Dec. 31, | |||||||||||||
| 2017 | 2017 | 2017 | 2017 | |||||||||||||
| Interest income | $ | 11,112 | $ | 11,340 | $ | 11,626 | $ | 11,785 | ||||||||
| Interest expense | 953 | 978 | 985 | 999 | ||||||||||||
| Net interest income | 10,159 | 10,362 | 10,641 | 10,786 | ||||||||||||
| Provision for loan losses | 452 | 4 | 322 | 23 | ||||||||||||
| Net interest income after provision for loan losses | 9,707 | 10,358 | 10,319 | 10,763 | ||||||||||||
| Other income | 3,864 | 4,106 | 4,066 | 4,117 | ||||||||||||
| Net gains on available-for-sale securities | 145 | 107 | 5 | 0 | ||||||||||||
| Other expenses | 9,298 | 9,076 | 9,192 | 9,401 | ||||||||||||
| Income before income tax provision | 4,418 | 5,495 | 5,198 | 5,479 | ||||||||||||
| Income tax provision | 984 | 1,374 | 1,262 | 3,536 | ||||||||||||
| Net income | $ | 3,434 | $ | 4,121 | $ | 3,936 | $ | 1,943 | ||||||||
| Net income attributable to common shares | $ | 3,416 | $ | 4,100 | $ | 3,916 | $ | 1,933 | ||||||||
| Net income per share – basic | $ | 0.28 | $ | 0.34 | $ | 0.32 | $ | 0.16 | ||||||||
| Net income per share – diluted | $ | 0.28 | $ | 0.34 | $ | 0.32 | $ | 0.16 | ||||||||
| 2016 Quarter Ended | ||||||||||||||||
| Mar. 31, | June 30, | Sept. 30, | Dec. 31, | |||||||||||||
| 2016 | 2016 | 2016 | 2016 | |||||||||||||
| Interest income | $ | 10,937 | $ | 10,924 | $ | 11,131 | $ | 11,106 | ||||||||
| Interest expense | 904 | 925 | 944 | 920 | ||||||||||||
| Net interest income | 10,033 | 9,999 | 10,187 | 10,186 | ||||||||||||
| Provision (credit) for loan losses | 368 | 318 | 538 | (3 | ) | |||||||||||
| Net interest income after provision (credit) for loan losses | 9,665 | 9,681 | 9,649 | 10,189 | ||||||||||||
| Other income | 3,690 | 3,906 | 3,884 | 4,031 | ||||||||||||
| Net gains on available-for-sale securities | 383 | 122 | 584 | 69 | ||||||||||||
| Other expenses | 9,072 | 8,535 | 8,579 | 8,558 | ||||||||||||
| Income before income tax provision | 4,666 | 5,174 | 5,538 | 5,731 | ||||||||||||
| Income tax provision | 1,093 | 1,303 | 1,451 | 1,500 | ||||||||||||
| Net income | $ | 3,573 | $ | 3,871 | $ | 4,087 | $ | 4,231 | ||||||||
| Net income attributable to common shares | $ | 3,553 | $ | 3,850 | $ | 4,065 | $ | 4,209 | ||||||||
| Net income per share – basic | $ | 0.29 | $ | 0.32 | $ | 0.34 | $ | 0.35 | ||||||||
| Net income per share – diluted | $ | 0.29 | $ | 0.32 | $ | 0.34 | $ | 0.35 | ||||||||
| 85 |
Report of Independent Registered Public Accounting Firm
Stockholders and Board of Directors of
Citizens & Northern Corporation
Opinions on the Financial Statements and Internal Control over Financial Reporting
We have audited the accompanying consolidated balance sheets of Citizens & Northern Corporation and subsidiaries (collectively, the “Corporation”) as of December 31, 2017 and 2016 and the related consolidated statements of income, comprehensive income, changes in stockholders’ equity, and cash flows, for each of the three years in the period ended December 31, 2017, and the related notes (collectively referred to as the “consolidated financial statements”). We have also audited the Corporation’s internal control over financial reporting as of December 31, 2017, based on criteria established in Internal Control-Integrated Framework (2013) issued by the Committee of Sponsoring Organizations of the Treadway Commission (“COSO”).
In our opinion, the consolidated financial statements present fairly, in all material respects, the financial position of the Corporation as of December 31, 2017 and 2016, and the results of its operations and its cash flows for each of the three years in the period ended December 31, 2017 in conformity with accounting principles generally accepted in the United States of America. Also in our opinion, the Corporation maintained, in all material respects, effective internal control over financial reporting as of December 31, 2017, based on criteria established in Internal Control-Integrated Framework (2013) issued by COSO.
Basis for Opinion
The Corporation’s management is responsible for these consolidated financial statements, for maintaining effective control over financial reporting, and for its assessment of the effectiveness of internal control over financial reporting, included in the accompanying Management’s Report on Internal Control over Financial Reporting. Our responsibility is to express an opinion on the Corporation’s consolidated financial statements and an opinion on the Corporation’s internal control over financial reporting based on our audits. We are a public accounting firm registered with the Public Company Accounting Oversight Board (United States) (“PCAOB”) and are required to be independent with respect to the Company in accordance with the U.S. federal securities laws and the applicable rules and regulations of the Securities and Exchange Commission and the PCAOB.
We conducted our audits in accordance with the standards of the PCAOB. Those standards require that we plan and perform the audit to obtain reasonable assurance about whether the consolidated financial statements are free of material misstatement, whether due to error or fraud and whether effective internal control over financial reporting was maintained. An audit includes examining, on a test basis, evidence supporting the amounts and disclosures in the financial statements.
| 86 |
Our audits of the financial statements included performing procedures to assess the risks of material misstatement of the consolidated financial statements, whether due to error or fraud, and performing procedures that respond to those risks. Such procedures included examining, on a test basis, evidence regarding the amounts and disclosures in the consolidated financial statements. Our audits also included evaluating the accounting principles used and significant estimates made by management, as well as evaluating the overall presentation of the consolidated financial statements. Our audit of internal control over financial reporting included obtaining an understanding of internal control over financial reporting, assessing the risk that a material weakness exists, and testing and evaluating the design and operating effectiveness of internal control based on the assessed risk. We believe that our audits provide a reasonable basis for our opinion.
A company’s internal control over financial reporting is a process designed to provide reasonable assurance regarding the reliability of financial reporting and the preparation of financial statements for external purposes in accordance with generally accounting principles. A company’s internal control over financial reporting includes those policies and procedures that (1) pertain to the maintenance of records that, in reasonable detail, accurately and fairly reflect the transactions and dispositions of the assets of the company; (2) provide reasonable assurance that transactions are recorded as necessary to permit preparation of financial statements in accordance with generally accepted accounting principles, and that receipts and expenditures of the company are being made only in accordance with authorizations of management and directors of the company; and (3) provide reasonable assurance regarding prevention or timely detection of unauthorized acquisition, use, or disposition of the company’s assets that could have a material effect on the financial statements.
Because of its inherent limitations, internal control over financial reporting may not prevent or detect misstatements. Also, projections of any evaluation of effectiveness to future periods are subject to the risk that controls may become inadequate because of changes in conditions, or that the degree of compliance with the policies or procedures may deteriorate.
| /s/ Baker Tilly Virchow Krause, LLP | |
| Williamsport, Pennsylvania | |
| We have served as the Corporation’s auditor since 1979. | |
| February 15, 2018 |
| 87 |
None
EVALUATION OF DISCLOSURE CONTROLS AND PROCEDURES
The Corporation’s management, under the supervision of and with the participation of the Corporation’s Chief Executive Officer and Chief Financial Officer, has carried out an evaluation of the design and effectiveness of the Corporation’s disclosure controls and procedures as defined in Rule 13a-15(e) and Rule 15d-15(e) of the Securities Exchange Act of 1934 as of the end of the period covered by this report. Based upon that evaluation, the Chief Executive Officer and Chief Financial Officer have concluded that, as of the end of such period, the Corporation’s disclosure controls and procedures are effective to ensure that all material information required to be disclosed in reports the Corporation files or submits under the Securities Exchange Act of 1934 is recorded, processed, summarized and reported, within the time periods specified in the Securities and Exchange Commission’s rules and forms.
There were no significant changes in the Corporation’s internal control over financial reporting that occurred during the period covered by this report that has materially affected, or that is reasonably likely to affect, our internal control over financial reporting.
MANAGEMENT’S REPORT ON INTERNAL CONTROL OVER FINANCIAL REPORTING
The Corporation’s management is responsible for establishing and maintaining effective internal control over financial reporting, as that term is defined in Exchange Act Rules 13a-15(f) and 15d-15(f). The Corporation’s system of internal control over financial reporting has been designed to provide reasonable assurance regarding the reliability of financial reporting and the preparation and fair presentation of financial statements for external purposes in accordance with accounting principles generally accepted in the United States of America. The Corporation’s internal control over financial reporting includes those policies and procedures that: (1) pertain to the maintenance of records that, in reasonable detail, accurately and fairly reflect the transactions and dispositions of the Corporation’s assets; (2) provide reasonable assurance that transactions are recorded as necessary to permit preparation of financial statements in accordance with accounting principles generally accepted in the United States of America, and that receipts and expenditures of the Corporation are being made only in accordance with authorizations of the Corporation’s management and directors; and (3) provide reasonable assurance regarding prevention, or timely detection and correction of unauthorized acquisition, use or disposition of the Corporation’s assets that could have a material effect on the financial statements.
Because of its inherent limitations, internal control over financial reporting may not prevent or detect and correct misstatements. Also, projections of any evaluation of effectiveness to future periods are subject to the risk that controls may become inadequate because of changes in conditions, or that the degree of compliance with the policies and procedures may deteriorate.
The Corporation’s management assessed the effectiveness of the Corporation’s internal control over financial reporting as of December 31, 2017, based on the framework set forth by the Committee of Sponsoring Organizations of the Treadway Commission in Internal Control – Integrated Framework (2013). Based on that assessment, we concluded that, as of December 31, 2017, the Corporation’s internal control over financial reporting is effective based on the criteria established in Internal Control – Integrated Framework (2013).
Baker Tilly Virchow Krause, LLP, the independent registered public accounting firm that audited the Corporation’s consolidated financial statements, has issued an audit report on the Corporation’s internal control over financial reporting as of December 31, 2017. That report appears immediately prior to this report.
| February 15, 2018 | By: | /s/ J. Bradley Scovill |
| Date | President and Chief Executive Officer | |
| February 15, 2018 | By: | /s/ Mark A. Hughes |
| Date | Treasurer and Chief Financial Officer |
| 88 |
There was no information the Corporation was required to disclose in a report on Form 8-K during the fourth quarter 2017 that was not disclosed.
Information concerning Directors and Executive Officers is incorporated herein by reference to disclosure under the captions “Proposal 1 - Election of Directors,” “Executive Officers,” “Information Concerning Security Ownership” and “Meetings and Committees of the Board of Directors” of the Corporation’s proxy statement dated March 9, 2018 for the annual meeting of stockholders to be held on April 19, 2018.
The Corporation’s Board of Directors has adopted a Code of Ethics, available on the Corporation’s web site at www.cnbankpa.com for the Corporation’s employees, officers and directors. (The provisions of the Code of Ethics are also included in the Corporation’s employee handbook.)
Information concerning executive compensation is incorporated herein by reference to disclosure under the captions “Compensation Discussion and Analysis” and “Executive Compensation Tables” of the Corporation’s proxy statement dated March 9, 2018 for the annual meeting of stockholders to be held on April 19, 2018.
Information concerning security ownership of certain beneficial owners and management is incorporated herein by reference to disclosure under the caption “Beneficial Ownership of Executive Officers and Directors” of the Corporation’s proxy statement dated March 9, 2018 for the annual meeting of stockholders to be held on April 19, 2018.
“Equity Compensation Plan Information” as required by Item 201(d) of Regulation S-K is incorporated by reference herein from Item 5 (Market for Registrant’s Common Equity and Related Stockholder Matters) of this Form 10-K.
Information concerning loans and deposit balances with Directors and Executive Officers is provided in Note 15 to the Consolidated Financial Statements, which is included in Part II, Item 8 of this Annual Report on Form 10-K. Additional information, including information concerning director independence, is incorporated herein by reference to disclosure appearing under the captions “Director Independence” and “Related Person Transaction and Policies” of the Corporation’s proxy statement dated March 9, 2018 for the annual meeting of stockholders to be held on April 19, 2018.
Information concerning services provided by the Corporation’s independent auditor Baker Tilly Virchow Krause, LLP, the audit committee’s pre-approval policies and procedures for such services, and fees paid by the Corporation to that firm, is incorporated herein by reference to disclosure under the caption “Fees of Independent Public Accountants” of the Corporation’s proxy statement dated March 9, 2018 for the annual meeting of stockholders to be held on April 19, 2018.
| 89 |
(a) (1). The following consolidated financial statements are set forth in Part II, Item 8:
(a)(2) Financial statement schedules are not applicable or included in the financial statements or related notes.
| 90 |
| 91 |
| 92 |
| 33. Report on assessment of compliance with servicing criteria for asset-backed securities | Not applicable | |
| 34. Attestation report on assessment of compliance with servicing criteria for asset-backed securities | Not applicable | |
| 35. Service compliance statement | Not applicable | |
| 99. Additional exhibits: | ||
| 99.1 Additional information mailed or made available online to shareholders with proxy statement and Form 10-K on March 9, 2018 | Filed herewith | |
| 100. XBRL-related documents | Not applicable | |
| 101. Interactive data file | Filed herewith |
| 93 |
Pursuant to the requirements of Section 13 or 15(d) of the Securities Exchange Act of 1934, this report has been signed below by the following persons on behalf of the registrant and in the capacities indicated.
| By: /s/ J. Bradley Scovill | |
| President and Chief Executive Officer | |
| Date: February 15, 2018 | |
| By: /s/ Mark A. Hughes | |
| Treasurer and Principal Accounting Officer |
Date: February 15, 2018
Pursuant to the requirements of the Securities Exchange Act of 1934, this report has been signed below by the following persons on behalf of the registrant and in the capacities and on the dates indicated.
BOARD OF DIRECTORS
| /s/ | Dennis F. Beardslee | /s/ | Edward H. Owlett, III | |
| Dennis F. Beardslee | Edward H. Owlett, III | |||
| Date: February 15, 2018 | Date: February 15, 2018 | |||
| /s/ | Jan E. Fisher | /s/ | J. Bradley Scovill | |
| Jan E. Fisher | J. Bradley Scovill | |||
| Date: February 15, 2018 | Date: February 15, 2018 | |||
| /s/ | R. Bruce Haner | /s/ | Leonard Simpson | |
| R. Bruce Haner | Leonard Simpson | |||
| Date: February 15, 2018 | Date: February 15, 2018 | |||
| /s/ | Susan E. Hartley | /s/ | James E. Towner | |
| Susan E. Hartley | James E. Towner | |||
| Date: February 15, 2018 | Date: February 15, 2018 | |||
| /s/ | Leo F. Lambert | /s/ | Aaron K. Singer | |
| Leo F. Lambert | Aaron K. Singer | |||
| Date: February 15, 2018 | Date: February 15, 2018 | |||
| /s/ | Terry L. Lehman | /s/ | Frank G. Pellegrino | |
| Terry L. Lehman | Frank G. Pellegrino | |||
| Date: February 15, 2018 | Date: February 15, 2018 |
| 94 |