DAKTRONICS INC /SD/
10-Ks and 10-Qs
|
|
|
|
|
|
|
|
|
|
|
|
|
|
|
|
|
|
|
|
|
|
|
|
|
|
|
|
|
|
|
|
|
|
|
|
|
|
|
|
|
|
|
|
|
|
|
|
|
|
|
|
|
|
|
|
|
|
|
|
|
|
|
|
|
|
|
|
UNITED STATES
SECURITIES AND EXCHANGE COMMISSION
Washington, D.C. 20549
FORM 10-K
(Mark One)
x
ANNUAL REPORT PURSUANT TO SECTION 13 OR 15(d) OF THE SECURITIES EXCHANGE ACT OF 1934
For the Fiscal Year Ended
April 27, 2013
OR
o
TRANSITION REPORT PURSUANT TO SECTION 13 OR 15(d) OF THE SECURITIES EXCHANGE ACT OF 1934
For the Transition Period From ___ to ___.
Commission File Number: 0-23246

Daktronics, Inc.
(Exact name of Registrant as specified in its charter)
|
South Dakota
(State or other jurisdiction of
incorporation or organization)
|
|
46-0306862
(I.R.S. Employer Identification No.)
|
|
|
|
|
|
201 Daktronics Drive
Brookings SD
|
|
57006 |
|
(Address of principal executive offices)
|
|
(Zip Code)
|
(605) 692-0200
(Registrant’s telephone number, including area code)
Securities registered pursuant to Section 12(b) of the Act:
|
Title of Each Class
|
|
Name of Each Exchange on Which Registered
|
|
Common Stock, No Par Value
|
|
NASDAQ Global Select Market
|
|
Common Stock Purchase Rights
|
|
NASDAQ Global Select Market
|
Securities registered pursuant to Section 12(g) of the Act: None
Indicate by check mark if the registrant is a well-known seasoned issuer, as defined in Rule 405 of the Securities Act. Yes
o
No
x
Indicate by check mark if the registrant is not required to file reports pursuant to Section 13 or Section 15(d) of the Act. Yes
o
No
x
Indicate by check mark whether the registrant (1) has filed all reports required to be filed by Section 13 or 15(d) of the Securities Exchange Act of 1934 during the preceding 12 months (or for such shorter period that the registrant was required to file such reports), and (2) has been subject to such filing requirements for the past 90 days. Yes
x
No
o
Indicate by check mark whether the registrant has submitted electronically and posted on its corporate Web site, if any, every Interactive Data File required to be submitted and posted pursuant to Rule 405 of Regulation S-T during the preceding 12 months (or for such shorter period that the registrant was required to submit and post such files) . Yes
x
No
o
Indicate by check mark if disclosure of delinquent filers pursuant to Item 405 of Regulation S-K is not contained herein, and will not be contained, to the best of the registrant’s knowledge, in definitive proxy or information statements incorporated by reference in Part III of this Form 10-K or any amendment to this Form 10-K.
x
Indicate by check mark whether the registrant is a large accelerated filer, an accelerated filer, a non-accelerated filer or a smaller reporting company. See the definitions of “large accelerated filer,” “accelerated filer” and “smaller reporting company” in Rule 12b-2 of the Exchange Act. (Check one):
|
Large accelerated filer
|
o
|
Accelerated filer
|
x
|
|
Non-accelerated filer
|
o
(Do not check if a smaller reporting company.)
|
Smaller reporting company
|
o
|
Indicate by check mark whether the registrant is a shell company (as defined in Rule 12b-2 of the Exchange Act). Yes
o
No
x
The aggregate market value of the common stock held by non-affiliates of the Registrant as of
October 27, 2012
(which is the last business day at the Registrant’s most recently completed second quarter), computed by reference to the closing sales price of the Registrant’s common stock on the NASDAQ Stock Market on such date, was approximately
$375,576,307
. For purposes of determining this number, individual stockholders holding more than 10 percent of the Registrant’s outstanding Common Stock are considered affiliates. This number is provided only for the purpose of this Annual Report on Form 10-K and does not represent an admission by either the Registrant or any such person as to the status of such person.
The number of shares of the Registrant’s Common Stock outstanding as of
June 4, 2013
was
42,477,879
.
Documents Incorporated By Reference
Portions of the Registrant’s Proxy Statement for its Annual Meeting of Shareholders to be held August 21, 2013 are incorporated by reference in Part III of the Form 10-K, as indicated in Items 10 through 14 of Part III.
DAKTRONICS, INC. AND SUBSIDIARIES
FORM 10-K
FOR THE FISCAL YEAR ENDED
APRIL 27, 2013
Table of Contents
|
|
Page
|
||
|
|
|||
|
|
|||
|
|
|||
|
|
|||
|
|
|||
|
|
|||
SPECIAL NOTE REGARDING FORWARD–LOOKING STATEMENTS
This Annual Report on Form 10-K (including exhibits and any information incorporated by reference herein) contains both historical and forward-looking statements that involve risks, uncertainties and assumptions. The statements contained in this report that are not purely historical are forward-looking statements within the meaning of Section 27A of the Securities Act of 1933, as amended, and Section 21B of the Securities Exchange Act of 1934, as amended, including statements regarding our expectations, beliefs, intentions and strategies for the future. These statements appear in a number of places in this Report and include all statements that are not historical statements of fact regarding the intent, belief or current expectations with respect to, among other things: our financing plans; trends affecting our financial condition or results of operations; our growth strategy and operating strategy; our competition; our business outside of the United States; our large contracts with significant customers; our ability to protect our intellectual property rights; excess production capacity or capacity needs; our involvement in litigation; difficult conditions in the economy; and the declaration and payment of dividends. The words “may,” “would,” “could,” “will,” “expect,” “estimate,” “anticipate,” “believe,” “intend,” “plans” and similar expressions and variations thereof are intended to identify forward-looking statements. Investors are cautioned that any such forward-looking statements are not guarantees of future performance and involve risk and uncertainties, many of which are beyond our ability to control, and that actual results may differ materially from those projected in the forward-looking statements as a result of various factors discussed herein, including those discussed in the section of this Annual Report on Form 10-K entitled “Item 1A. Risk Factors” and “Item 7. Management’s Discussion and Analysis of Financial Condition and Results of Operations,” and those factors discussed in detail in our other filings with the Securities and Exchange Commission.
General Development of Business
Company Background and Overview.
Daktronics, Inc. was founded by Dr. Aelred Kurtenbach and Dr. Duane Sander in 1968 while they were professors of electrical engineering at South Dakota State University (“SDSU”) in Brookings, South Dakota. Our relationship with SDSU and other colleges and universities is a key factor contributing to our leadership in the industry. We have been able to experience sustained long-term growth due in part to the capability of the local universities and colleges to provide an important source of highly educated full-time and student employees.
Over the years, our products have evolved significantly from scoreboards and matrix displays and related software applications to complex, integrated visual display systems which include full color video, text and graphics displays located on a local or remote network and are tied together through sophisticated control systems. In the mid-nineties, as light emitting diodes (“LEDs”) became available in red, blue and green colors with outdoor brightness, we pioneered the development of full color LED video displays capable of replicating trillions of colors, thereby producing large format video systems with excellent color, brightness, energy efficiency and lifetime. Due to our foundation of developing scoring and graphics display systems, in which we were already a leader, we were able to add video capabilities so all of our customer’s large format display needs could be met in a complete, integrated system. This has proven to be a key factor in Daktronics becoming a leader in large electronic displays. Over the years, we have invested in product development to add complementary products and services, such as production services, control systems, liquid crystal display (“LCD”) networks, architectural lighting solutions, sound systems, marketing services, maintenance and support and other products and services for our customers.
Business Developments.
As a result of our line of LED display systems and software applications, we gained significant market share through designing and manufacturing quality products and providing technical expertise and services. Our products are in use throughout the world, as we are the world’s leader in all large format LED display product categories, according to independent research.
In the sports and live events markets, our integrated video, scoring, and control systems, have been installed at many professional, collegiate and high school facilities, in North America, and at international multi-purpose sports venues around the world.
With commercial applications, our video displays can be seen in major destination sites, such as Las Vegas and Times Square, while our digital billboards and message displays can be seen along roadsides, at retail establishments, and at many other locations.
In the transportation market, our Vanguard
®
displays are in use in numerous jurisdictions across North America. Our customers include many state departments of transportation, mass transit systems and airports.
One of our core growth strategies has been to enter geographic markets by developing regional sales and service presence providing after-sale support to our entire product line and sales of our products. We currently have regional offices in the United States as well as internationally that support our field sales and service people, many of whom today work out of their homes.
1
We occasionally acquire businesses providing access to new markets or complement our existing products. Although these acquisitions have increased the scope of services and technology we are able to provide, our primary growth objective is to increase sales and profitability through organic growth.
We manufacture most of our products in South Dakota and Minnesota. We also invested in facilities in Shanghai, China, where we manufacture our architectural lighting products and perform final assembly for video displays for the Chinese market. We also have a plant in Victor, New York which produces our rigging products. In May of 2013 we completed the acquisition of a small manufacturing operation in Belgium, primarily serving the third party advertising market.
Description of Business
We are the world’s leading supplier of electronic scoreboards, large electronic display systems, digital messaging solutions, software and services for sporting, commercial and transportation applications. We serve our customers by providing superior products, integration and services providing dynamic, reliable and unique visual communication solutions. We offer a complete line of products, from small indoor and outdoor scoreboards and electronic displays to large multi-million dollar video display systems as well as related control, timing, sound and hoist systems and related professional services. We are recognized worldwide as a technical leader with the capabilities to design, market, manufacture, install and service complete integrated systems displaying real-time data, graphics, animation and video.
We are engaged in a full range of activities: marketing and sales, engineering and product development, manufacturing, technical contracting, professional services and customer service and support. Each of those activities is described below.
Marketing and Sales.
Our products have been sold throughout the United States and other countries through a combination of direct sales personnel and resellers. In the United States and Canada, we use primarily a direct sales force for professional sports, colleges and universities, convention centers and smaller sports facilities, including high schools and transportation applications. In smaller commercial applications, we rely primarily on resellers. We also utilize resellers outside North America on large video system projects where we do not have a direct sales presence. Sales to resellers generally have terms consistent with sales directly to end users.
The majority of the products sold by resellers in North America are standard catalog products. These are typically moderately priced and relatively easy to install. A limited number of models are built to inventory and available for quick delivery. We support our resellers through direct mail advertising, trade journal advertising, trade show exhibitions and our sales force support in the field. We believe we can expand sales and, in some niches, market share, by expanding both our direct sales force and resellers. Resellers outside North America focus on large integrated system sales.
Our sales force is comprised of sales staff located throughout the world supporting all customer types in both sales and service. In addition to supporting resellers as described above, the direct sales staff sells the entire range of our standard products and substantially all of the large video display systems. Our sales staff is structured in a way to maximize cross-selling opportunities across segments.
We have organized our business into five business units which have a primary focus on particular markets or customer segments. There are four domestic business units (United States and Canada) – Commercial, Live Events, Schools and Theatres and Transportation. The fifth business unit identified as International is for all operations outside the United States and Canada. This structure allows us to focus on serving the unique needs of each of these customer groups. Live Events customers usually have a large variety of products tied into a system in a single location involving creative production services, design and event support. The Commercial business unit serves the needs created by large and remote networks of displays connected through various modes of communication. The Transportation business unit focuses on the unique needs of governmental contractors and ties into integrated systems managing the flow of travelers and vehicles. Finally, the Schools and Theatre business unit focuses on providing information displays to high schools for both sports and marquee applications and automated rigging for theatres. The International business unit comprises all of these areas outside of North America.
When we target a potential customer for sales opportunities, the prospect is contacted either directly or through a reseller. Frequently, on larger sales opportunities, engineers, technicians and sales personnel jointly participate in site visits to assess site conditions, evaluate the customer’s requirements and present proposals. Proposals to prospective customers include business and technical presentations as well as product demonstrations and visits to existing installations. We also regularly host customers at our various manufacturing facilities to demonstrate product quality, manufacturing and design capabilities.
International sales can fluctuate from year to year based on the timing of large system projects. A typical term of sale for international projects includes a letter of credit, bank guarantee or partial payment in advance. We believe in addition to the growth we expect domestically, we will also achieve growth in the international markets. During fiscal years
2013
,
2012
and
2011
, approximately
17 percent
,
17 percent
and
16 percent
of our net sales, respectively, were derived from international sales. Since 2000, we have acquired or opened international offices in Canada, China, France, the United Arab Emirates, Germany, Australia, Japan, Brazil, Spain, Singapore, Macau, Hong Kong, Belgium and the United Kingdom.
2
Much of our marketing and sales success in the past was based on our ability to create new products and product enhancements for customers by understanding their needs and opportunities. We have developed and continue to develop this understanding through active participation in the sales cycle by engineers and other personnel. We attend trade shows, conventions, seminars and foster a culture of teamwork throughout the organization.
Engineering and Product Development.
The large format electronic display industry is characterized by ongoing product innovations and developments in technology and complementary services. To remain competitive, we must continue to anticipate and respond to changes and developments in the industry. We will continue our tradition of applying engineering resources throughout our business to help achieve more effective product development by investing approximately four percent of our net sales over the long-term into product design and development.
We employ engineers and technicians in the areas of mechanical and electrical design, applications engineering, software design and customer and product support. We use primarily in-house engineering to anticipate and respond rapidly to the product development needs of customers and the marketplace. We assign product managers to each product or product family to assist our sales staff in training and implementing product improvements and to ensure each product is designed for maximum reliability and serviceability. We also invest in new creative technologies and in companies developing new technologies.
Our product development staff consists of four groups – Sports, Video, Commercial and Transportation. The Sports product development group is aligned with the Schools and Theatres business unit; the Video group is aligned with the Live Events, International and Commercial business units; and the Commercial and Transportation groups are aligned with the Commercial and Transportation business units, respectively. These groups leverage common technology, concepts and platforms through various knowledge centers spanning across all groups. This alignment has driven improved product reliability, lower costs and better functionality for our customers. The development of these knowledge centers and various other practices within product development are modeled after best practices for lean product development.
Manufacturing.
As a vertically integrated manufacturer of display systems, we perform most sub-assembly and substantially all final assembly of our products.
Our manufacturing operations include component manufacturing and system manufacturing (metal fabrication, electronic assembly, sub-assembly and final assembly). We flex our production capacity through varying work hours and strategic outsourcing.
We use a modular approach for manufacturing displays. Standard product modules are designed to be used in a variety of different products. This modular approach reduces parts inventory and improves manufacturing efficiency. We inventory a limited supply of finished standard products. Custom projects are built according to the customer’s specifications through the use of common components. Product modules are designed so a custom product may include a significant percentage of standard components to maximize reliability and ease of service. A key strategy of ours is to increase standardization and commonality of parts and manufacturing processes across product lines through product platform strategies.
Our order entry, production, customer service and many other functions are also consolidated through an enterprise resource planning system and a service operations system to facilitate the sales, design, production and delivery process.
Our plants are loosely aligned with the five business units described above. This alignment has been critical to allow us to respond to the different types of customers in the different business units in areas such as lead times and product consolidation. Furthermore, we have decentralized to these plants certain functions such as materials planning and scheduling. Our goal was to generally align sales, marketing, engineering and manufacturing into a cohesive business unit with a focus on customers while not giving up the synergies of shared resources. On the other hand, given the cyclical nature of some parts of our business, we also needed to balance and maintain our ability to manufacture the same products across our plants so we can smooth out the peaks and valleys of customer demand of the various business units.
Our manufacturing facilities have embraced lean manufacturing techniques throughout all areas. We have also placed significant emphasis on lean techniques in the non-manufacturing areas. Although there are direct costs associated with implementing lean techniques, the goal of doing so is to eliminate waste and deliver products to a customer timely, while maintaining minimal inventory and eliminating non-value added tasks.
Technical Contracting.
We serve as a technical contractor for larger display system installations requiring custom designs and innovative product solutions. The purchase of display systems typically involves competitive proposals. As part of our response to a proposal request, we may suggest additional products or features to assist the prospective customer in analyzing the optimal type of display system. We usually include in our proposal site preparation and installation services related to the display system. In these cases, we serve as a contractor and may retain subcontractors. We are licensed in a number of domestic jurisdictions as a general contractor. Typically, we outsource all related electrical, steel and installation labor to qualified subcontractors. We have developed
3
relationships with many subcontractors throughout the United States overtime, which is advantageous for us in bidding and delivering on these projects.
Professional Services.
Our professional services are essential to continued market penetration and growth. Professional services we provide in addition to technical contracting include event support, content creation, product maintenance, marketing assistance, training on hardware and software, control room design, and continuing technical support for operators of complicated display systems.
Our sports marketing division assists customers with marketing and ad sales for sports facilities to fund display system purchases. Typically, we render these services to facilities which do not have in-house marketing programs and staff.
Customer Service and Support.
We offer limited warranties on our products against failure due to defective parts or workmanship for periods generally ranging from one to five years after the first sale or installation, depending on the product or type of customer. In addition, we offer service agreements of various scopes. To serve our customers we provide help-desk access, parts repair and replacement and programming support for video, animation and other displays. We staff our technical help desk with experienced technicians who are on-call 24 hours a day to support events and sites.
Our repair centers, located in the United States, Germany and Shanghai, are staffed with trained technicians who repair and return components requiring service. We also offer a component exchange program for same-day shipment of replacement parts.
We also have a staff of field service personnel trained across product lines and business units allowing us to better focus on the commonality of the products rather than the unique needs of each customer. We also use third party service partners to improve the overall utilization of our field service staff as the needs of the customer fluctuate greatly during the fiscal year. This allows us to respond to changes in volume of service, which peaks in the late summer and early fall.
General Description of Our Products and Technologies
Our range of products spans from message displays, to scoreboards, to audio systems, to large complex systems. The two principal components of our systems are the display and the controller. We produce displays varying in complexity, size and resolution. The physical dimensions of a display depend on the size of the viewing area, the distance from the viewer to the display, and the amount and type of information to be displayed. Generally, for longer distance viewing, the light sources, or pixels, are larger and spaced farther apart. The type of the display may also depend on the location of the viewing audience. For example, arena scoreboards may have a viewing angle nearly as wide as 180 degrees, compared with roadside displays, which typically are viewed from a passing vehicle only within a narrow angle from the display. We customize our products according to the design specifications of the customer and the conditions of the environment in which our products function.
The controller uses computer hardware and our software products to process information provided by the operator and other integrated sources and then compiles the information, graphics or animation to be presented on the displays.
Product Families and Technologies
Our products are comprised of the following primary product families, all of which include control systems and software:
|
•
|
Video display systems
|
|
•
|
Scoring and timing systems
|
|
•
|
Message displays
|
|
•
|
ITS dynamic message signs
|
|
•
|
Audio systems
|
|
•
|
Digital billboards
|
|
•
|
Digit and price displays
|
|
•
|
Automated rigging and hoists
|
Each of these product families is described below.
Video Display Systems.
This group consists primarily of displays comprised of a large number of full-color pixels capable of showing various levels of video, graphics and animation plus controllers which manage the operation of the display. Video displays are comprised of red, green and blue LEDs arranged in various combinations to form pixels (picture elements). The electronic circuitry which controls the pixels allows for variances in the relative brightness of each LED to provide a full color spectrum, thereby displaying video images in striking, vibrant colors.
4
We offer a wide range of video display systems for different applications and budgets. Variables in video displays include the spacing of the pixels (pixel pitch), the resolution of the displays (number of pixels), the brightness of the displays (nits), the number of discrete colors the display is able to produce (color depth), and the viewing angles. In addition, modular design allows the product to be readily configured in custom sizes to meet each customer’s specific requirements, with virtually no limit to the size a display can be built.
We offer a wide range of pixel spacing, ranging from four millimeter to 26 millimeter. The four millimeter application provides the user with the greatest pixel density and shortest viewing distance, while the 26 millimeter is the most cost effective for physically large displays with longer viewing distances. In addition, the uniformity of colors across the display is important to the quality of the video image. Our unique display control circuitry, along with our proprietary manufacturing and calibration procedures, provide uniform colors across the display.
In addition to traditional rectangular video displays, we have adapted LED video technology into ribbon board displays and modular display systems. Our ribbon board display systems are configured in different height-to-width ratios to give arenas and stadiums the ability to install long, narrower bands of displays in the facility. For new construction projects, our ProRail
®
attachment system is combined with ribbon board technology to provide improved sight lines for fans and reduce construction costs for the facility’s owner. Digital ribbon boards generally serve as a revenue generation source for teams and facilities through advertising as well as another location to display information such as scoring and statistics.
Our transportable display systems are comprised of lightweight individual LED video panels less than a square meter in size are assembled together to form a display in a customizable height and width. These panels are used in what we refer to as mobile and modular applications, such as touring shows and the events market.
Our video systems may use a network of displays to deliver a pre-programmed schedule of advertisements, relevant entertainment information and sports scores, including video, audio, graphics and live data to viewers in the concourses and club areas. The network can be integrated with the main video displays through the control system, providing complete control. Daktronics digital display networks can incorporate flat-panel screens, LED message displays, LED video screens and even numeric scoreboards to provide an even better game day experience.
Our GKD MediaMesh
®
product can turn any building facade into a dynamic communications medium while not concealing the architecture behind it. This display can be mounted over a solid facade or in front of windows knowing the finished solution is free from visible cabling, and it delivers a clean, semi-transparent viewing experience for those within the building. The stainless steel, textile-like mesh provides a modern, urban feel while the thin-profile design – less than one inch in depth – provides an elegant, refined structural appearance.
Our line of ProPixel
®
LED architectural lighting and display products include our freeform video elements, which are available as individual pixels or strips of pixels, assembled and interconnected to transform structures into stunning visual landmarks. Flexible mounting platforms allow designers to transform structures into full-motion video displays and to create various effects. These elements can be structured in various resolutions depending on the application. The freeform video elements are managed by our various controllers, depending on the specific application.
The primary control components for video displays in live event applications are Show Control, proprietary digital media players and proprietary video processors. These control components provide advanced capability for the display of live video and real time content on our displays.
Our Show Control Software Suite is an integrated display control system enabling flexible, intuitive display control and event management for large video applications. The Show Control Software Suite can operate entire networks of displays from a single, intuitive control interface. Features such as smart buttons allow users to instantly deliver media clips, camera feeds, and streaming information to any display in a network.
Daktronics digital media players store recorded video clips and can function as a still store and character generator. Managed through our Show Control Software Suite, the digital media player provides instant access to any video, animation, graphic or real-time data files on a player. It also controls the overall picture settings of any Daktronics LED display, making it the most feature-rich product of its kind in the live events industry.
We also provide a proprietary video processing system developed specifically for LED display technology. For larger venues hosting live events, the Show Control Software Suite, digital media player and video processor are typically part of a larger system with cameras, switchers and other components. These systems provide the ability to show instant replays, live action video, prerecorded video clips, and overlays of scoring, timing and statistical information. We occasionally package our components with control components from other suppliers to provide a complete video production solution.
5
Scoring and Timing Systems.
Our line of scoring and timing products include indoor and outdoor scoreboards for many different sports, digit displays, scoring and timing controllers, statistics software and other related products. Indoor systems range in complexity from two-digit shot clocks and small scoreboards to large, center-hung scoreboards incorporating video displays, message centers, advertising panels, hoist systems and control software. Outdoor scoreboards range in complexity from two-digit game timers and small scoreboards to larger systems incorporating scoring, timing, video, message centers, advertising panels and control software.
We expect LED technology will remain the technology of choice for scoreboards and displays due to its lower power consumption, longer life and resulting lower maintenance costs as compared to other technologies. Because most of the scoreboards and display products within this group have significant standardization, we have been able to make progress on our goal of efficiently delivering high quality products.
We offer a variety of internally developed controllers complementing our scoreboards and displays. These controllers vary in price and complexity from the All Sport
®
100, a handheld controller for portable scoreboards, to the All Sport
®
5000 series, designed for more sophisticated scoring systems and allowing for more user-defined options. These controllers communicate with scoreboards through radio frequencies, fiber optic connections or other means.
We also offer timing systems for sports events, primarily aquatics and track competitions. A primary component of these systems is our OmniSport
®
2000 timing console. The system has the capability to not only time and rank the competitors but also to interface with event management software created by third parties to facilitate the administration of the sporting event. Other timing system components include swimming touchpads, race start systems, and relay take-off platforms.
As a key component of an integrated system, we market sports statistics and results software under the DakStats
®
trademark. The software allows entry and display of sports statistics and other information. It is one of the leading applications of its type in collegiate and high school sports.
Message Displays.
The key product lines in this group are marketed under the names Galaxy
®
and GalaxyPro
®
and are generally controlled with our Venus
®
1500 display controller.
Galaxy
®
full-matrix displays, available in both indoor and outdoor models, are our leading product line for commercial applications and are expected to be a key product line for growth in the future. Galaxy
®
displays are full color, monochrome, or tri-color, with pixel spacing ranging from six millimeter to 46 millimeter depending on color, size and viewing distance. They are used primarily as message centers to convey information and advertising to consumers. The modular design of the product allows us to configure a display to readily meet the size requirements of each customer. We offer various price points for displays within the Galaxy
®
line.
GalaxyPro
®
displays are full-matrix outdoor displays capable of displaying text, graphics and animation, as well as prerecorded video clips. The product was developed to meet the video needs of the commercial market, primarily large retail market applications such as auto dealerships and shopping centers. GalaxyPro
®
displays are offered in full color with pixel spacing ranging from 16 to 26 millimeter. GalaxyPro
®
displays are capable of producing 68 billion colors, have excellent color uniformity across the display and are fully compatible with our Venus
®
1500 display control software. The modular design of the product allows us to configure a display to readily meet the size requirements of each customer.
Galaxy
®
and GalaxyPro
®
series displays utilize our proprietary Venus
®
1500 display control software to control the creation of messages and graphic sequences for downloading to the display. This software is designed to be usable without any special training, and it is applicable to all general advertising or message presentation applications. We also provide software allowing system integrators to write their own software using the Venus
®
1500 software developer’s kit to communicate to displays supplied by us. Several system integrators have implemented the Venus
®
1500 protocol into their specific applications, resulting in additional display sales.
ITS Dynamic Message Signs (DMS).
DMS products include a wide range of LED-based displays for road management, parking, mass transit and aviation applications. The Vanguard
®
family of dynamic message displays are typically used to direct traffic and inform
motorists. These displays are used over freeways, on arterial roads, near bridges, at toll booths and in other locations. We have also developed a control system for these displays to help transportation agencies manage large networks of displays.
Our digit and directional displays are primarily marketed and sold for use in parking facilities. They include multi-line displays delivered in vertical cabinets or drop-in digit panels designed to be mounted in existing structures or signs.
Most of the transportation products are designed and tested to rigorous transportation industry standards. Our personnel routinely work with standard development organizations to assist in writing standards to benefit the public and take advantage of the latest display technologies.
6
Audio Systems.
The audio system offerings include both standard and custom options. Standard audio systems are designed to meet the needs of a wide variety of outdoor sports venues based on the size and configuration of the facility. Each of the standard outdoor systems include control systems featuring digital signal processing for improved sound quality reproduction. Custom indoor and outdoor systems are also offered for larger venues and venues with unique seating configurations. Our sound systems are often integrated into an overall venue solution for scoring, timing, message display and/or video capability.
Digital Billboards.
Our line of digital billboards offers a unique digital display solution for the outdoor advertising industry. The products, developed based on our experience with other full-color LED display technologies, are used primarily to display static images which change at regular intervals. Digital billboard systems include many features unique to the outdoor advertising market, such as our patented mounting system, self-adjusting brightness, improved energy consumption and enhanced network security.
The Visiconn
®
system is the primary software application for controlling content and playback loops for digital billboard applications. The Visiconn
®
display management solution can transform any Internet-ready computer into a secure, global control center for multiple LED displays, flat panel monitors (such as LCDs) and other display technologies. A rights-based control environment allows users to grant advertisers access to powerful content management tools while also providing detailed ad tracking and proof-of-play reports. These features, combined with instant content deployment and the ability to sync with trusted real-time data providers, allow for incorporation of live information into any presentation.
Digit and Price Displays.
Other product lines marketed primarily to Commercial customers include our DataTime
®
and Fuelight
™
display systems. The DataTime
®
product line consists of outdoor time and temperature displays which use a remote sensor for temperature data and are available in red or amber in various character sizes. Fuelight
™
digit displays are specifically designed for the petroleum industry, offering high visibility and quick fuel price updates using the Fuelink
™
control software. The product easily retrofits into existing structures and is also available in single-face or double-face (on certain models) configurations.
Automated Rigging and Hoist Products.
The automated rigging and hoist product family includes our Vortek
®
automated hoists which complement our arena center-hung scoreboard/display systems for both small and large sporting facilities. The hoist is an important part of an integrated solution for indoor venues having center-hung, suspended displays. Many of these hoist systems are customized based on the weight and design of the equipment being suspended, along with the load capacity of the building structure and attachment points within the facility.
Additionally, we provide automated rigging for theatre applications, primarily in high schools and similar venues. The strengths of our automated rigging systems include safety and ease of operation. The theatre rigging control system includes intuitive touch screens and menus to control the integrated hoist systems for added safety and enhanced operation of a theatre production, allowing changes in scenery, lighting and sound preprogrammed, timed and easy to control.
Financial Information About Segments and Geographic Areas
Our operations in countries outside the U.S. are accompanied by various risks, including financial risks. Relationships with customers and terms of sale vary by country, often with longer-term receivables than are typical in the U.S. Currency exchange rate fluctuations can affect net sales from, and the profitability of, operations outside the U.S. We attempt to hedge these exposures to reduce the effects of foreign currency fluctuations on net earnings. In addition, although we do not have the intention to do so, the repatriation of certain earnings of our foreign subsidiaries may result in substantial U.S. tax cost.
See Note 2 of the Consolidated Financial Statements for financial information pertaining to our business segments and geographic operations.
Sources of Raw Materials
We source some of our materials, such as LEDs, power supplies, from a limited number of suppliers, primarily due to the proprietary nature of the material. The loss of one of these key suppliers could have an adverse impact on our business and operations. However, our sourcing group works to implement strategies to mitigate the associated risks. For additional information, refer to “Item 1A – Risk Factors.” From time to time, we enter into pricing agreements or purchasing contracts under which we agree to purchase a minimum amount of product in exchange for guaranteed price terms over the length of the contract, which generally does not exceed one year.
Intellectual Property
We continually assess the cost or benefit of filing patents related to new products. We apply for patents to document our rights to the technology so other parties cannot later claim ownership (a defensive strategy) and to also allow us to pursue infringement claims against competitors for protection due to patent violations (an offensive strategy).
7
We rely on trademarks, in addition to patents, to help establish and preserve proprietary protection for our products. Our trademarks are registered in the United States and other countries. These trademarks are used to establish brand recognition and distinction in our various markets.
Product drawings, software, training and product manuals and other works of authorship are also subject to applicable copyright law protections. We provide software to our customers in object code to help preserve our intellectual property rights. We also rely on nondisclosure and license agreements with our employees to protect our intellectual property. Despite these intellectual property protections, there can be no assurance a competitor will not copy the functions or features of our products.
Seasonal Nature of the Business
Our sales and profitability historically have fluctuated due to the seasonality of our business and variability due to the impact of large product orders, such as display systems for facilities where professional, major college, or international sports events take place and large commercial display systems. As a result of the seasonality of the business, primarily due to the sports market, net sales and net income tend to be lower in the third quarter of a fiscal year.
The seasonality of the sports business is caused by sales related to facilities for football, basketball and hockey in the summer and fall and for baseball in the early to late spring, leaving a slower time in the winter. This seasonal effect can be compounded by large product orders in the sports markets and by the effects of holidays during our third fiscal quarter. The effects of seasonality are generally not as great in our Commercial, International and Transportation business units, although the impact of large orders in those markets and the implications of weather during the winter months of the northern hemisphere can cause fluctuations in net sales and profits.
Gross margins on large orders tend to fluctuate more than the gross margins on smaller orders. Large product orders with competitive bidding and substantial subcontract work for product installation generally have lower gross margins with greater variability in margins. Although we follow the percentage-of-completion method of recognizing revenues on the majority of these larger orders, we nevertheless have experienced fluctuations in operating results and expect our future results of operations will be subject to similar fluctuations.
Working Capital Items
On large product orders, the time between order acceptance and project completion may extend up to and exceed 18 months depending on the amount of custom work and the customer’s delivery needs. We often receive down payments or progress payments on these orders. To the extent these payments are not sufficient to fund the costs and expenses associated with these orders, we use working capital and bank borrowings to finance these cash requirements.
Customers
The primary markets we serve, along with primary types of customers, are as follows:
|
Markets
|
Types of Customers
|
|
Live Events
|
Large colleges and universities, professional sports teams and facilities, national and international sports games and federations, civic arenas and convention centers, live entertainment venues, staging and rental, and motor racing.
|
|
Schools and Theatres
|
Elementary and secondary schools, small colleges and universities, local recreation centers and theatres.
|
|
Commercial
|
Retailers and outdoor advertisers, auto dealers, gaming facilities, petroleum retailers, restaurants and quick-serve restaurants, shopping centers, worship venues, and spectaculars.
|
|
Transportation
|
State and local departments of transportation, airlines, airports and related industries, parking facilities and transit authorities.
|
We have a large and diverse worldwide customer base and are not economically dependent on any single customer, however, there are important customers within each of our business units and the loss of one or more customers could have an adverse effect on us. Within our Commercial business unit, two major customers account for more than 50 percent of our digital billboard sales niche.
Backlog
Our backlog consists of customer sales agreements or purchase orders we expect to fill within the next 24 months and was approximately
$141.3 million
as of
April 27, 2013
and
$122.8 million
as of
April 28, 2012
. Because sales agreements and purchase orders may be subject to extended delivery schedules our backlog is not necessarily indicative of future net sales or net income. Although orders for
8
many of our products may be shipped within 90 days, other orders may take longer depending on the customer’s project schedule or other factors. Contracts related to new construction projects generally tend to have the longest lead times.
Government and Other Regulation
In the United States and other countries, various laws and regulations, including zoning ordinances, restrict the installation of outdoor signs and displays, particularly in the commercial market. These laws and regulations impose greater restrictions on electronic displays versus non-electronic displays such as traditional billboards due to alleged concerns over aesthetics or driver safety if a display is located near a road or highway. These factors may prevent or inhibit us from selling products to some prospective customers.
Some of our products are tested to safety standards developed by Underwriters Laboratories in the United States, as well as similar standards in other countries. We design and produce our products in accordance with these standards.
Our manufacturing operations use certain chemical products and chemical processes subject to various environmental rules and regulations. Our manufacturing operations must also meet numerous safety related rules and regulations. We believe we are in material compliance with applicable governmental laws and regulations.
In some countries in which we operate, such as China, there are various laws and regulations which may affect our operations. These include restrictions or limitations on our ability to withdraw our capital investment, undeveloped legal frameworks to enforce our rights including payment collections, and different levels of enforcement and consistency of laws.
Competition
The large electronic display industry is highly fragmented and characterized by intense competition from a variety of sources. There are a number of established suppliers of competing products which may have greater market penetration in certain of our market niches or greater financial, marketing and other resources. Competitors also attempt to copy our products or product features. Because a customer’s budget for the purchase of a large screen electronic display is often part of their advertising budget, we may also compete with other forms of advertising, such as television, print media or fixed display signs.
There are generally more competitors in product categories and applications requiring less complicated display systems, such as the high school scoreboard market, the text and graphics display market and the market for less customized video displays. As the needs of customers increase and the display systems become more complex, there are generally fewer competitors. However, due to the high profile nature of larger complex display systems, the competition is intense on those projects.
Within our standard product business, which includes our Galaxy
®
display lines, our digital billboard product, and scoreboard products, there are a large number of competitors, none of which we consider to be dominant. In addition, there are a significant number of Asian competitors attempting to sell in the marketplace, which generally compete on the basis of price. We generally compete based on our local presence, our depth of service, and the wide range of our product offerings.
Within our large video system business, across all segments, there are various competitors with different levels of strength in individual niches, but none have a dominant position overall. For example, a single competitor may have strength in the mobile video business but very little in the fixed installation business. Another competitor may have strength in the billboard display business but very little strength in any other large display applications. In addition, our large display business has competitors in a narrow niche which were significant at one time and then substantially decreased their presence in the niche. These changes seem to happen as a result of the complexities of the marketplace and the failures experienced on installations which receive a great deal of visibility. Our video systems, especially those systems comprised of many displays networked together, are highly complex and visible and thus require a high standard of performance difficult for other industry participants to maintain over the long-term. There are a growing number of Asian-based competitors expanding their presence beyond Asia to compete more directly with us. These competitors generally offer products and solutions at a lower price.
Each of our business units tends to have a different set of competitors. Some competitors only compete in our transportation business and some primarily compete in the high school market, for example. Video display competitors compete for our live events, international, and commercial video business.
Overall, we compete based on our broad range of products and features, complementary services, advanced technology, prompt delivery, and reliable and readily available customer service and support. We also strive to provide cost-effective products and solutions for our customers. Contrary to our focus on technologically advanced products and customer support, some of our competitors compete in some markets by providing lower-cost display systems, which are of a lesser quality with lower product performance or less customer support. If a customer focuses principally on price, we are less likely to obtain the sale. To remain competitive, we must continue to enhance our existing products, introduce new products and product features, and provide customers with cost-effective solutions to their display needs.
9
Research and Development
We believe our engineering and product development capability and experience will continue to be a very important factor to continue to develop the most up-to-date digital displays and control system solutions desired by the market. Product development expenses for fiscal years
2013
,
2012
and
2011
were
$23.1 million
,
$23.5 million
and
$18.9 million
, respectively.
Environmental Concerns
Our products and production processes require the storage, use and disposal of a variety of chemicals considered hazardous under applicable federal and state laws. Accordingly, we are subject to a variety of regulatory requirements for the handling and disposal of such materials. We do not anticipate any material effect on our capital expenditures, earnings or competitive position due to compliance with government regulations involving environmental matters.
Employees
As of
April 27, 2013
, we employed approxi
mately 2,210 full-time employees and approximately 410 part-time and temporary employees. Of these employees, approximately 960 were in manufacturing, 550 were in sales and marketing, 500 were in customer service, 370 were in engineering and 240 were in g
eneral and administrative. None of our employees are represented by a collective bargaining agreement. We believe employee relations are good.
Available Information
We make available, free of charge, on or through our website (http://investor.daktronics.com), our annual, quarterly and current reports and any amendments to those reports as soon as reasonably practicable after we electronically file such reports with the Securities and Exchange Commission (“SEC”). The reports are also available through a link to the SEC website at http://www.sec.gov. Information contained on our website or linked through it is not part of this report.
A number of risks and uncertainties exist which could impact our future operating results. These uncertainties include, but are not limited to, general economic conditions, competition, our success in developing new products and technologies, market acceptance of new products and other factors, including those set forth below.
We engage in a highly competitive business. If we are unable to compete effectively, we could lose market share and our results of operations could be negatively impacted.
We operate in highly competitive markets, some of which are highly fragmented. We also compete against products produced in Asia and other parts of the world, including the U.S., which in some cases are of lower quality or performance and lower cost. In addition, because a customer’s budget for the purchase of an electronic display is often part of their advertising budget, our products often compete with other forms of advertising, such as television, print media or fixed display signs. Competition could result in not only a reduction in net sales but also in the prices charged by us for our products. To remain competitive, we must be able to not only anticipate and respond quickly to our customers’ needs and enhance our existing products and services to meet those needs, but also continue to price our products competitively. Our competitors may develop cheaper, more efficient products, or they may be willing to charge lower prices for strategic marketing or to increase market share. Some competitors have more capital and other resources and may be better able to take advantage of acquisition opportunities or adapt more quickly to changes in customer requirements, which could negatively affect our ability to compete effectively.
Our results of operations can be substantially affected by whether we are awarded large contracts and the size and timing of large contracts.
The amounts of our orders and net sales and our financial results will be substantially affected by whether we are awarded large contracts, primarily in the professional and major college sports facilities market, the outdoor advertising niche and for large spectaculars around the world and the amounts and timing of these contracts. When awarded large contracts, the timing and amount could cause material fluctuations in our net sales and earnings. Awards of large contracts and their timing and amount are difficult to predict and are outside of our control.
Our products are covered by warranties, and fulfilling these warranties could adversely affect our financial results.
Unanticipated warranty and other costs for defective products could adversely affect our financial condition and results of operations and reputation
.
We provide warranties on our products generally for terms of five years or less. In addition, in response to customer needs, we regularly offer extended warranties. These warranties require us to repair or replace faulty products and meet certain performance standards, among other customary warranty provisions. Although we continually monitor our warranty claims and provide a reserve for estimated warranty issues on an on-going basis, an unanticipated claim could have a material adverse impact on our financial results. In some cases, we may be able to subrogate a claim back to a subcontractor or supplier if the subcontractor or supplier supplied the defective product or performed
10
the service, but this may not always be possible. The need to repair or replace products with design or manufacturing defects could temporarily delay the sale of new products, reduce profits and adversely affect our reputation.
Our quarterly operating results may vary significantly, which could have a material effect on the price of our common stock.
Our quarterly revenues and earnings have varied in the past and are likely to vary in the future. Contracts we enter into generally stipulate customer-specific delivery terms and may have contract cycles of a year or more, which subjects the timing of revenue recognition to many factors beyond our control. In addition, the timing and size of large contract orders and delivery may not be predictable or repeatable. Furthermore, because significant portions of our operating costs are fixed, an unanticipated delay or cancellation of orders in backlog may have a significant negative impact on our quarterly operating results. Factors causing our operating results to vary may include new product introductions, variations in product and project mix and delivery due date changes. Therefore, quarterly operating results may be subject to significant variations, and operating results in one quarter may not be indicative of future operating results.
We enter into fixed-priced contracts on a regular basis, which could reduce our profits.
The majority of our contracts we enter into to sell our products are on a fixed-price basis. If our actual costs exceed original estimates on fixed-price contracts, our profits will be reduced.
Although we benefit from cost savings, we have a limited ability to recover cost overruns. Because of the large scale and long duration of some contracts, unanticipated cost increases may occur as a result of several factors including, but not limited to, increases in the cost or shortages of components, materials or labor; unanticipated technical problems; required project modifications not initiated by the customer; and suppliers’ or subcontractors’ failure to perform or a delay in performing their obligations. These factors could delay delivery of products, and contracts may provide for liquidated damages for late delivery. Unanticipated costs unable to be passed on to customers or the payment of liquidated damages under fixed contracts would negatively impact our profits.
Backlog may not be indicative of future revenue or profitability.
Customers may cancel or delay projects for reasons beyond our control. Orders normally contain cancellation provisions to permit our recovery of costs expended and a portion of the anticipated profit if a customer cancels an order. If a customer elects to cancel, we may not realize the full amount of revenues included in our backlog. If projects are delayed, the timing of revenues could be affected, and projects may remain in the backlog for extended periods of time. Revenue recognition occurs over longer periods of time and is subject to unanticipated delays and cost changes. If we receive relatively large orders in any given quarter, fluctuations in the levels of the quarterly backlog can result because the backlog may reach levels which may not be sustained in subsequent quarters. For these reasons, backlog may not be indicative of future revenues.
Large contracts with significant customers represent a significant portion of our accounts receivable and costs and estimated earnings in excess of billings.
We closely monitor the credit worthiness of our customers and have not, to date, experienced significant credit losses. Significant portions of our sales are to customers who place large orders for custom products. We mitigate our exposure to credit risk, to some extent, by requiring deposits, payments prior to shipment, progress payments and letters of credit. However, because some of the exposure is outside of our control, unanticipated events could have a material adverse impact on our operating results.
General price increases or significant shortages of raw materials and components could adversely affect our operating margin.
We purchase large quantities of raw materials and components, including, but not limited to, aluminum, LEDs, power supplies, circuit boards and various other electronic components. Materials comprise the largest component in our cost of goods sold. Unless, to the extent described above, we have multiple sources of supply for many of our raw materials, significant shortages could disrupt the supply of raw materials. Further increases in the price of these raw materials and components could further increase our product costs and materially adversely affect margins. Although we attempt to pass along increased costs in the form of price increases to customers, we may decide not to do so for competitive reasons. Even when our price increases are successful, the timing of such price increases may lag significantly behind the incurrence of higher costs. As of the date of this report, there were no material parts shortages in the market place impacting our business.
We depend on single-source suppliers for some of the raw materials used in the manufacture of our products.
We obtain some of our raw materials, including, but not limited to, LEDs, power supplies, circuit boards and plastics, from a limited number of suppliers. If we cannot obtain key raw materials from our suppliers, the raw materials may not be readily available from other suppliers, other suppliers may not agree to supply the materials to us on terms as favorable as the terms we currently receive, or the raw materials from any other suppliers may not be of adequate and consistent quality. Although we believe our supply of raw materials currently is adequate for the needs of our business, we cannot assure that new sources of supply will be available when needed. Any interruption in our supply of raw materials could have a material adverse effect on our ability to manufacture our products until a new source of supply is located and, therefore, could have a material adverse effect on our business, financial condition or results of operations.
Our business may suffer if we are not successful in our efforts to keep up with a rapidly changing product market.
The electronic display industry is characterized by ongoing product improvement, innovations and developments in display and controller technology. Competitors could develop new or superior products to increase their share of the markets. Our future success in addressing the needs of our customers will depend in part on our ability to continue to understand their needs and to make timely and cost-effective product improvements, innovations and developments.
11
Our international operations are exposed to additional risk and uncertainties, including unfavorable political developments, weak foreign economies, and compliance with foreign governmental requirements, which may impact our results of operations.
For fiscal years
2013
,
2012
and
2011
, revenue outside the United States represented approximately
17 percent
,
17 percent
and
16 percent
of our consolidated net sales, respectively. Our operations and earnings throughout the world have been and may in the future be adversely affected from time to time in varying degrees by war, political developments, foreign laws and regulations, regional economic uncertainty, recessions, or other economic crises, difficulties in staffing and managing foreign operations, including logistical and communication challenges, political instability, restrictions, customs and tariffs, changing regulatory environments, fluctuations in foreign currency exchange rates, longer accounts receivable cycles in certain foreign countries (whether due to cultural, exchange rate or other factors), lack of developed legal systems to enforce contractual rights, renegotiation or nullification of our existing contracts, compliance with import/export laws, U.S. government policy and foreign tax laws with potential increased costs associated with overlapping tax structures. The likelihood of such occurrences and their overall effect on us vary greatly from country to country and are not predictable. These factors may result in a decline in net sales or profitability and could adversely affect our ability to expand our business outside of the United States.
We may fail to continue to attract, develop and retain key management and other key employees, which could negatively impact our operating results.
We depend on the performance of our senior management team and other key employees. The loss of certain members of our senior management, including our Chief Executive Officer or successor Chief Executive Officer, could negatively impact our operating results and ability to execute our business strategy. Our future success will also depend in part upon our ability to attract, train, motivate and retain qualified personnel. We do not have employment agreements with the executive officers or other employees, but we do maintain key person life insurance on the lives of our Chairman of the Board and our Chief Executive Officer.
We may not be able to utilize our capacity efficiently or accurately plan our capacity requirements, which may negatively affect our business and operating results.
We increase our production capacity and the overhead supporting production based on anticipated market demand. Market demand, however, has not always developed as expected or remained at a consistent level. The potential underutilization risk can decrease our profitability.
The following factors complicate accurate capacity planning for market demand:
|
•
|
Changes in the demand for and mix of products our customers buy
|
|
•
|
Our ability to add and train our manufacturing staff in advance of demand
|
|
•
|
The market’s pace of technological change
|
|
•
|
Variability in our manufacturing productivity
|
|
•
|
Long lead times for our plant and equipment expenditures, requiring major financial commitments well in advance of actual production requirements.
|
A future deterioration of our business could result in further underutilization of our manufacturing capacity, resulting in an impairment of certain assets at some point. Our inability to plan our capacity requirements accurately and efficiently utilize our production capacity, or our failure to put in place the technologies and capacity necessary to meet market demand, could adversely affect our business, financial condition or results of operations.
Regulations related to the use of conflict-free minerals may increase our costs and cause us to incur additional expenses.
The Dodd-Frank Wall Street Reform and Consumer Protection Act contains provisions to improve the transparency and accountability of the use by public companies in their products of minerals originating from the conflict zones of the Democratic Republic of Congo (DRC) and adjoining countries and to prevent the sourcing of such “conflict” minerals. As a result, the Securities and Exchange Commission enacted new annual disclosure and reporting requirements for public companies who use these minerals in their products, which apply to us. Under the final rules, we are required to conduct due diligence to determine the source of any conflict minerals used in our products. Because our supply chain is broad-based and complex, we may not be able to easily verify the origins for all minerals used in our products. We may face reputational challenges with our customers and other stakeholders if we are unable to sufficiently verify the origins of all minerals used in our products through the due diligence procedures we are implementing. In addition, the new rules could reduce the number of suppliers who provide components and products containing conflict-free minerals and thus could increase the cost of the components used in manufacturing our products and the costs of our products to us. Any increased costs and expenses could have a material adverse impact on our financial condition and results of operations.
Our actual results could differ from the estimates and assumptions used to prepare our financial statements.
In preparing our financial statements, our management is required under U.S. generally accepted accounting principles ("GAAP") to make estimates and assumptions as of the dates of the financial statements. These estimates and assumptions affect the reported values of assets, liabilities, revenue, and expenses and disclosure of contingent assets and liabilities. Areas requiring significant estimates by our management include the recognition of contract revenue, costs, profit or losses in applying the principles of percentage of completion, estimated amounts for warranty costs, collectability of billed and unbilled accounts receivable and the amount of any allowance for doubtful accounts, the amount of estimated liabilities, valuation of assets acquired plus liabilities, goodwill, and intangible assets assumed in acquisitions, and
12
valuation of stock-based compensation. Our actual results could differ from our estimates of such results, which could have a material negative impact on our financial condition and results of operation.
If our internal control over financial reporting is found to be inadequate, our financial results may not be accurate, raising concerns for investors and potentially adversely affecting our stock price.
Under Section 404 of the Sarbanes-Oxley Act of 2002, we are required to evaluate and determine the effectiveness of our internal controls over financial reporting. We have dedicated a significant amount of time and resources to ensure compliance with this legislation for the fiscal years ended
April 27, 2013
,
April 28, 2012
and
April 30, 2011
and will continue to do so for future periods. We may encounter problems or delays in completing the review and evaluation, implementing improvements, or receiving a positive attestation from our independent registered public accounting firm. In addition, our assessment of internal controls may identify deficiencies in our internal controls over financial reporting or other matters which may raise concerns for investors and therefore adversely affect our stock price.
Our future results may be affected by legal compliance risks related to the U.S. Foreign Corrupt Practices Act and other anti-bribery laws for the countries in which we operate.
We are required to comply with the United States Foreign Corrupt Practices Act, which prohibits United States companies from engaging in bribery or making other prohibited payments to foreign officials for the purpose of obtaining or retaining business. It also requires us to maintain specific record-keeping standards and adequate internal accounting controls. Foreign companies, including some of our competitors, are not subject to these prohibitions and requirements. Corruption, extortion, bribery, pay-offs, theft and other fraudulent practices occur from time to time in many jurisdictions, including the Middle East and the People's Republic of China ("China"). If our competitors engage in these practices, they may receive preferential treatment from companies or governmental agencies, resulting in a competitive advantage for securing business from these companies or government officials who might give them priority in obtaining new licenses or permits, which would put us at a disadvantage. In addition, although we inform our personnel through training sessions, policies and other means such practices are illegal, we cannot assure our employees or agents will not engage in such conduct for which we may be held responsible even if we are not aware of such conduct. If our employees or agents are found to have engaged in such practices, we could suffer severe fines and penalties.
Product liability claims not covered by insurance could adversely affect our financial condition and results of operations.
We may be subject to product liability claims involving claims of personal injury or property damage. Although we maintain product liability insurance coverage to protect us in the event of such a claim, our coverage may be inadequate to cover litigation and/or the potential award. Also, a well-publicized actual or perceived problem could adversely affect our reputation and reduce the demand for our products.
Our operations in China subject us to risks and uncertainties relating to China's laws and regulations.
We have offices and manufacturing facilities and make sales to customers in China which encompass many different activities. Under its current leadership, the government of China has been pursuing economic reform policies, including encouraging of foreign trade and investment and greater economic decentralization. However, the government of China may not continue to pursue such policies. Despite progress in developing its legal system, China does not have a comprehensive and highly developed system of laws, particularly with respect to foreign investment activities and foreign trade. Enforcement of existing and future laws and contracts is uncertain, and the implementation and interpretation of them may be inconsistent. As the Chinese legal system develops, the promulgation of new laws, changes to existing laws and the preemption of local regulations by national laws may adversely affect foreign investors and foreign companies with operations in China, such as ours. In addition, some government policies and rules are not published or communicated in local districts in a timely manner, if at all. If they are published, they may not be followed consistently by local districts. As a result, we may inadvertently operate our business in violation of new rules and policies without having any knowledge of their existence. These uncertainties could limit the legal protections available to us. Any litigation or other proceeding in China may be protracted and result in substantial costs and diversion of resources and management attention. Furthermore, a significant portion of our business in China involves contracts with government bodies, which can significantly inhibit our ability to enforce a contract through litigation or similar means.
Circumstances could arise in which our goodwill and intangible assets could become impaired, causing us to recognize substantial non-cash impairment charges, which would adversely affect our financial results.
We have pursued and will continue to seek potential acquisitions to complement and expand our existing businesses, increase our revenues and profitability, and expand our markets. As a result of prior acquisitions, we have goodwill and intangible assets recorded on our balance sheet as described in the notes to the consolidated financial statements contained elsewhere in this Report. We will continue to evaluate the recoverability of the carrying amount of our goodwill and intangible assets on an ongoing basis, and we may incur substantial non-cash impairment charges, which would adversely affect our financial results. There can be no assurance the outcome of such reviews in the future will not result in substantial impairment charges. Impairment assessment inherently involves judgment as to assumptions about expected future cash flows and the impact of market conditions on those assumptions. Future events and changing market conditions may impact our assumptions as to prices, costs, holding periods or other factors resulting in changes in our estimates of future cash flows. Although we believe the assumptions we used in testing for impairment are reasonable, significant changes in any one of our assumptions could produce a significantly different result. A decline in our market capitalization or in our estimated forecasted discounted cash flows could also result in an impairment of our goodwill and intangible assets. A non-cash impairment charge could materially and adversely affect the net income for the reporting period in which it is recorded.
13
The terms and conditions of our credit facility impose restrictions on our operations, and if we default on our credit facility, it could have a material adverse effect on our results of operations and financial condition.
The terms and conditions of our credit facilities impose restrictions limiting, among other things, our ability to incur debt, merge, sell assets, make distributions (including cash dividends) and create or incur liens. The availability of credit facilities is also subject to certain covenants as explained in “Item 7 – Management’s Discussion and Analysis of Financial Condition and Results of Operations.” Our ability to comply with the covenants may be affected by events beyond our control, and we cannot assure we will achieve operating results and maintain a financial position meeting the requirements of the credit facility. A breach of any of these covenants could result in a default under the facilities. In the event of a default, the bank could elect to declare any outstanding principal amount of the credit facilities and term debt, any and all accrued interest thereon and any or all other amounts payable under the credit facilities to be immediately due and payable, which would have an adverse effect on our results of operations and financial condition. As of
April 27, 2013
, we were in compliance with all financial and other covenants of our credit facilities.
Maintaining adequate bonding and letter of credit capacity is necessary for us to successfully bid on and win some contracts.
In line with industry practice, we are often required to provide performance or payment bonds to our customers. These bonds indemnify the customer should we fail to perform our obligations under the contract. If a bond is required for a particular project, and we are unable to obtain an appropriate bond, we cannot pursue that project. Historically, we have had adequate bonding and letter of credit capacity; however, as is typically the case, the issuance of a bond is at the surety's sole discretion and the issuance of the letter of credit is based on the company's credit worthiness.
Prevailing economic, financial and business conditions and other factors could impair our ability to operate our business, satisfy our debt obligations, and impact our customers' and vendors' business.
It is anticipated borrowings from our existing credit facilities and cash provided by operating activities should provide sufficient funds to finance our capital expenditures, working capital and otherwise meet operating expenses and debt service requirements as they become due. However, if additional capital is required, there can be no assurance we will be able to obtain such capital when needed or on satisfactory terms, if at all. In addition, market conditions can negatively impact our clients' ability to fund their projects and can impact our vendors, suppliers, and subcontractors and may not allow them to perform their obligations to us, potentially impacting our business, financial condition, and results of operations.
We may make future acquisitions, which may be difficult to integrate, divert management resources, result in unanticipated costs or dilute our shareholders.
Part of our business strategy is to acquire or invest in companies, businesses, products or technologies complementing our current products, enhancing our market coverage or technical capabilities, or offer growth opportunities. We currently do not have any definitive agreements to acquire any company or business, and we may not be able to identify or complete any acquisition in the future. Additional risks potentially associated with acquisitions include the following:
|
•
|
Difficulty integrating the purchased company, products, businesses or technologies into our own business
|
|
•
|
Incurring substantial unanticipated integration costs
|
|
•
|
Difficult, time-consuming and costly to integrate management information and accounting systems of an acquired business into our current systems
|
|
•
|
Assimilating the acquired businesses may divert management attention and financial resources from our other operations, disrupting our ongoing business
|
|
•
|
Entering markets in which we have limited prior experience
|
|
•
|
Loss of key employees, particularly those of the acquired entity
|
|
•
|
Retaining or developing the acquired businesses’ customers
|
|
•
|
Adversely affect our existing business relationships with suppliers
|
|
•
|
Failure to effectively analyze our return on investment
|
|
•
|
Inability to indemnify assumed liabilities for infringement of intellectual property rights or other claims
|
In connection with these acquisitions or investments, we could incur debt, recognize amortization expenses related to intangible assets, recognize large and immediate write-offs, assume liabilities or issue stock diluting our current shareholders’ percentage of ownership. We may not be able to complete acquisitions or integrate the operations, products or personnel gained through any such acquisition without a material adverse effect on our business, financial condition or results of operations.
We maintain inventory subject to obsolescence and write downs to the extent it is replaced through product enhancements or advances in technology.
As a result of our products being subject to continuous enhancements and design changes, inventory held by us is subject to the risk of obsolescence, and excess levels may not be salable. Losses incurred as a result could have an adverse impact on our future profits.
We may be unable to protect our intellectual property rights.
We rely on a variety of intellectual property rights we use in our products and services. We may not be able to successfully preserve our intellectual property rights in the future, and these rights could be invalidated, circumvented or challenged. In addition, the laws of some foreign countries in which our products and services have been or may be sold do not protect intellectual property rights to the same extent as the laws of the United States. A failure to protect proprietary
14
information and any successful intellectual property challenges or infringement proceedings against us could materially and adversely affect our competitive position. In addition, even if we are successful in protecting our intellectual property rights or defending ourselves against a claim of infringement, any related dispute or litigation could be costly and time-consuming thereby diverting management’s attention from business.
We may be sued by third parties for alleged infringement of their proprietary rights, which could be costly, time-consuming and limit our ability to use certain technologies in the future.
As the sizes of our markets increase and our product offerings continue to evolve and become more sophisticated, we are more likely to be subject to claims our technologies infringe upon the intellectual property or other proprietary rights of third parties. Given the current legal framework associated with infringement claims, any such claims, with or without merit, could be time consuming and expensive and could divert our management’s attention away from the execution of our business plan. Moreover, any settlement or adverse judgment resulting from a claim could require us to pay substantial amounts, obtain a license to continue to use the technology subject to the claim, or otherwise restrict or prohibit our use of the technology. There can be no assurance we would be able to obtain a license from the third party asserting the claim on commercially reasonable terms (if at all), we would be able to develop alternative technology on a timely basis (if at all) or we would be able to obtain a license to use a suitable alternative technology to permit us to continue offering, and our customers to continue using, our affected product. In addition, we may be required to indemnify our customers’ partners for third-party intellectual property infringement claims, which would increase the cost to us of an adverse ruling in such a claim. An adverse determination could also prevent us from offering our products to others. Infringement claims asserted against us or our vendors may have a material adverse effect on our business, results of operations or financial condition.
The outcome of pending and future claims and litigation can have a material adverse impact on our business, financial condition, and results of operations.
We can be a party to litigation in the normal course of business. Litigation and regulatory proceedings are subject to inherent uncertainties, and unfavorable rulings can and do occur. Pending or future claims against us could result in professional liability, product liability, criminal liability, warranty obligations or other liabilities to the extent we are not insured against a loss or our insurance fails to provide adequate coverage and could have a material adverse impact on our business, financial condition, and results of operations.
Our manufacturing would be interrupted if we were unable to use one of our manufacturing facilities.
We manufacture most of our products in two locations in South Dakota and one in Minnesota. In addition, we manufacture certain products in our China facility. If any of these facilities, or a part thereof, were to be destroyed, shut down or unable to be used for its intended purposes, we would be limited in our capacity to meet customer demands until a replacement facility and equipment, if necessary, was found. The replacement of the manufacturing facility could take an extended amount of time before manufacturing operations could restart. The delay engendered by, and the potential cost incurred in, these steps could have a material adverse effect on our business, financial condition or results of operations.
Our data systems could fail or their security could be compromised.
Our business operations depend on the reliability of sophisticated data systems. Any failure of these systems, or any breach of our systems’ security measures, could adversely affect our operations, at least until our data can be restored and/or the breaches remediated.
Our common stock has at times been thinly traded, which may result in low liquidity and price volatility.
The daily trading volume of our common stock has at times been relatively low. If this were to occur in the future, the liquidity and appreciation of our common stock may not meet shareholders’ expectations, and the prices at which our stock trades may be volatile. The market price of our common stock could be adversely impacted as a result of sales by existing shareholders of a large number of shares of common stock in the market or by the perception such sales could occur.
The protections we have adopted and to which we are subject may discourage takeover offers favored by our shareholders.
We have adopted and are subject to several provisions of the South Dakota Business Corporation Act (SD Act) which could have the effect of discouraging takeover offers. Of the 120,000,000 shares of capital stock authorized in our articles of incorporation, 5,000,000 shares are undesignated. Our Board of Directors may issue the undesignated shares on terms and with the rights, preferences and designations determined by the Board without shareholder action, which could be used to discourage takeover attempts. Our articles of incorporation provide for a classified board consisting of three classes of directors. Our classified board generally makes it more difficult to replace directors and to acquire our company. We have adopted a shareholder rights plan providing for the exercise of preferred share purchase rights when a person becomes the beneficial owner of 15 percent or more of our outstanding common stock (subject to certain exceptions). In addition, we are governed by the anti-takeover provisions of the current SD Act, which may deny shareholders the receipt of a premium on their common stock, which in turn have a depressive effect on the market price of our common stock. In general, shares of a corporation acquired in a “control share acquisition,” as defined in the SD Act, have no voting rights unless voting rights are approved in a prescribed manner. There are also provisions prohibiting a public South Dakota corporation from engaging in a “business combination” with an “interested shareholder,” as defined in the SD Act, for a period of four years after the date of the transaction in which the person became an interested shareholder unless the business combination is approved in a prescribed manner. The SD Act also limits the voting rights of shares acquired in specified types of acquisitions and restricts specified types of business combinations. The existence or issuance of "blank check" stock, the classified Board, the existence of our shareholder rights plan and the effect of the anti-takeover provisions of
15
the SD Act, individually or in the aggregate, may discourage potential takeover attempts and delay, deter or prevent a change in control. They also may make the removal of management more difficult, which could deprive our shareholders of opportunities to sell their shares at prices higher than prevailing market prices.
Significant changes in the market price of our common stock could result in securities litigation claims against us.
Significant price and value fluctuations have occurred with respect to the publicly-traded securities of technology companies generally. The price of our common stock has changed significantly in the past and is likely to continue to experience significant changes in the future. In the past, securities litigation claims have been filed against certain companies following a period of decline in the market price of their publicly-traded securities. We may be the target of similar securities litigation claims in the future. Risks associated with litigation often are difficult to assess or quantify, and their existence and magnitude can remain unknown for significant periods of time. Although we maintain directors’ and officers’ insurance, the amount of insurance coverage may not be sufficient to cover a claim, and the continued availability of this insurance cannot be assured. Future litigation, if any, may result in substantial costs and divert management’s attention and resources, which could materially adversely affect our results of operations, financial condition and the liquidity of our common stock.
Our directors and executive officers have substantial influence over us and could limit the ability of our other shareholders to affect the outcome of key transactions, including changes of control.
Dr. Aelred Kurtenbach serves as our Chairman of the Board. His brother, Mr. Frank Kurtenbach, served on our Board and in a part-time role within our sales organization until May 23, 2013. Mr. Reece Kurtenbach, Dr. Aelred Kurtenbach's son, serves as our Executive Vice President and is our successor Chief Executive Officer. In addition, Dr. Aelred Kurtenbach has two other children who serve as our Vice President of Human Resources and as our Vice President of Manufacturing. Together, these individuals, in the aggregate, beneficially owned 8.9 percent of our outstanding common stock as of June 3, 2013, assuming the exercise by them of all of their options that were currently exercisable or that vest within 60 days of June 3, 2013. In addition, our other executive officers and directors, in the aggregate, beneficially owned an additional 4.9 percent of our outstanding common stock as of June 3, 2013, assuming the exercise by them of all of their options currently exercisable or that vest within 60 days of June 3, 2013. These Kurtenbach family members and our other executive officers and directors and their affiliated entities, if acting together, thus are able to influence significantly all matters requiring approval by our shareholders, including the election of directors and the approval of mergers or other significant corporate transactions. These shareholders may have interests differing from other shareholders and they may vote in a way with which other shareholders disagree, unfavorably affecting other shareholders’ interests. The concentration of ownership of our common stock may have the effect of delaying, preventing or deterring a change of control of our company, could deprive our shareholders of an opportunity to receive a premium for their common stock as part of a sale of our company, and may adversely affect the market price of our common stock. This concentration of ownership of our common stock may also have the effect of influencing the completion of a change in control not necessarily in the best interests of all of our shareholders.
Our business is partially subject to risks of terrorist acts and, to a lesser degree, acts of war.
Terrorist acts and, to a lesser degree, acts of war, may disrupt our operations as well as the operations of our customers. Such acts have created an interruption of orders and delays in orders already booked, primarily in sports facilities and destination sites. Any future terrorist activities and, to a lesser degree, acts of
war, could create additional uncertainties, forcing customers to further reduce or delay their spending or cancel or delay already planned projects, which could have a material adverse impact on our business, operating results or financial condition.
None.
Our principal real estate properties are located in areas we deem necessary to meet sales, service and operating requirements. We consider all of the properties to be both suitable and adequate to meet current and near-term operating requirements.
We own various buildings used for manufacturing, sales and service space in Brookings, South Dakota, totaling approximately 1,000,000 square feet and a building in Redwood Falls, Minnesota, totaling approximately 100,000 square feet. We lease a facility in Sioux Falls, South Dakota, comprising approximately 140,000 square feet. The lease contains an option to purchase the building from January 1, 2015 through December 31, 2016. Our China subsidiary leases approximately 90,500 square feet in a building in Shanghai for sales, service and manufacturing.
The remaining sales and service offices located throughout the United States, Canada, Europe, South America, and the Asia-Pacific regions are small offices, generally consisting of less than 10,000 square feet leased under operating leases. These lease obligations expire on various dates, with the longest commitment extending to fiscal 2019. We believe all of our leases will be renewable at market terms, at our discretion as they become due or suitable alternative space will be available to lease under similar terms and conditions.
16
We are involved in a variety of legal actions relating to various matters during the normal course of business. Although we are unable to predict the ultimate outcome of these legal actions, it is the opinion of management the disposition of these matters, taken as a whole, will not have a material adverse effect on our financial condition or results of operations.
Not applicable.
17
Our common stock is quoted on The NASDAQ Global Select Market under the symbol “DAKT.” As of June 3, 2013, we had 1,300 shareholders of record. Following are the high and low sales prices for our common stock for each quarter within the last two fiscal years.
|
|
Fiscal Year 2013
|
Fiscal Year 2012
|
|||||||||||||||||||||
|
Sales Price
|
Cash Dividends Declared
|
Sales Price
|
Cash Dividends Declared
|
||||||||||||||||||||
|
|
High
|
Low
|
High
|
Low
|
|||||||||||||||||||
|
1
st
Quarter
|
$
|
8.39
|
|
$
|
6.39
|
|
$
|
0.115
|
|
$
|
11.81
|
|
$
|
8.07
|
|
$
|
0.11
|
|
|||||
|
2
nd
Quarter
|
9.91
|
|
7.36
|
|
—
|
|
10.58
|
|
8.34
|
|
—
|
|
|||||||||||
|
3
rd
Quarter
|
11.73
|
|
8.03
|
|
0.615
|
|
10.16
|
|
7.68
|
|
0.51
|
|
|||||||||||
|
4
th
Quarter
|
12.40
|
|
9.57
|
|
—
|
|
11.02
|
|
7.99
|
|
—
|
|
|||||||||||
On May 23, 2013, our Board of Directors declared a semi-annual dividend payment of $0.12 per share payable on June 14, 2013 to holders of record of our common stock on June 3, 2013.
Although we expect to continue to pay dividends for the foreseeable future, any and all subsequent dividends will be reviewed regularly and declared by the Board at its discretion. In addition, our credit facility imposes limitations on our ability to pay dividends as further described in “Item 7 – Management’s Discussion and Analysis of Financial Condition and Results of Operations – Liquidity and Capital Resources.”
Performance Graph
The following graph shows changes during the period from April 26, 2008 to April 27, 2013 in the value of $100 invested in: (1) our common stock; (2) The NASDAQ Composite; and (3) the Standard and Poor's 600 Index for Electronic Equipment Manufacturers. The values of each investment as of the dates indicated are based on share prices plus any cash dividends, with the dividends reinvested on the date they were paid. The calculations exclude trading commissions and taxes.
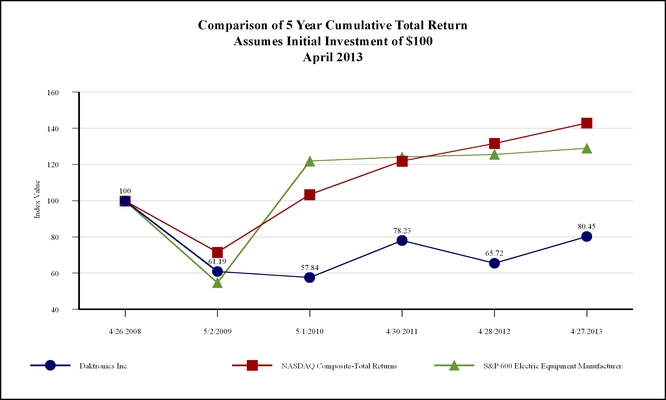
18
The table below provides selected historical financial data, which should be read in conjunction with "Management's Discussion and Analysis of Financial Condition and Results of Operations" and the Consolidated Financial Statements and the Notes to the Consolidated Financial Statements, which are included in Items 7 and 8 of this Annual Report on Form 10-K. The statement of operations data for the fiscal years ended
April 27, 2013
,
April 28, 2012
and
April 30, 2011
and the balance sheet data at
April 27, 2013
and
April 28, 2012
are derived from, and are qualified by reference to, the audited Consolidated Financial Statements included elsewhere in this report. The statement of operations data for the fiscal years ended
May 1, 2010
and
May 2, 2009
and the balance sheet data at
April 30, 2011
,
May 1, 2010
and
May 2, 2009
are derived from audited financial statements that are not included in this report.
|
|
2013
|
2012
|
2011
|
2010
|
2009
|
||||||||||||||
|
Statement of Operations Data:
|
|
|
|
|
|
||||||||||||||
|
Net sales
|
$
|
518,322
|
|
$
|
489,526
|
|
$
|
441,676
|
|
$
|
393,185
|
|
$
|
580,681
|
|
||||
|
Gross profit
|
133,894
|
|
113,437
|
|
111,484
|
|
94,556
|
|
155,358
|
|
|||||||||
|
Gross profit margin
|
25.8
|
%
|
23.2
|
%
|
25.2
|
%
|
24.0
|
%
|
26.8
|
%
|
|||||||||
|
Operating income (loss)
|
30,600
|
|
10,275
|
|
19,527
|
|
(6,730
|
)
|
42,617
|
|
|||||||||
|
Operating margin
|
5.9
|
%
|
2.1
|
%
|
4.4
|
%
|
(1.7
|
)%
|
7.3
|
%
|
|||||||||
|
Net income (loss)
|
22,779
|
|
8,489
|
|
14,244
|
|
(6,989
|
)
|
26,428
|
|
|||||||||
|
Diluted earnings (loss) per share
|
0.53
|
|
0.20
|
|
0.34
|
|
(0.17
|
)
|
0.64
|
|
|||||||||
|
Weighted average diluted shares outstanding
|
42,621
|
|
42,304
|
|
42,277
|
|
40,908
|
|
41,152
|
|
|||||||||
|
Balance Sheet Data:
|
|
|
|
|
|
|
|
|
|
|
|||||||||
|
Working capital
|
$
|
125,456
|
|
$
|
119,833
|
|
$
|
128,160
|
|
$
|
118,625
|
|
$
|
104,542
|
|
||||
|
Total assets
|
319,418
|
|
315,967
|
|
327,847
|
|
305,851
|
|
324,876
|
|
|||||||||
|
Total long-term liabilities
|
16,480
|
|
15,989
|
|
15,083
|
|
14,358
|
|
10,536
|
|
|||||||||
|
Total shareholders' equity
|
188,246
|
|
190,805
|
|
203,102
|
|
207,053
|
|
211,911
|
|
|||||||||
|
Cash dividends per share
|
0.73
|
|
0.62
|
|
0.60
|
|
0.10
|
|
0.09
|
|
|||||||||
The following discussion highlights the principal factors affecting changes in our financial condition and results of operations. This discussion should be read in conjunction with the accompanying Consolidated Financial Statements and notes to Consolidated Financial Statements.
OVERVIEW
We design, manufacture and sell a wide range of display systems to customers throughout the world. We focus our sales and marketing efforts on markets, geographical regions and products. Our five business segments consist of four domestic business units and an International business unit. The four domestic business units consist of Live Events, Commercial, Schools and Theatres, and Transportation, which include the geographic territories of the United States and Canada.
Our net sales and profitability historically have fluctuated due to the impact of large project orders, such as display systems for professional sports facilities and colleges and universities or spectacular projects in the commercial area, as well as the seasonality of the sports market. Large project orders can include a number of displays, controllers, and subcontracted structure builds all of which can occur on variable schedule according to the customer's needs. Net sales and gross profit percentages also have fluctuated due to other seasonal factors, including the impact of holidays, which primarily affects our third quarter. Our gross margins on large custom and standard orders tend to fluctuate more than small standard orders. Large product orders involving competitive bidding and substantial subcontract work for product installation generally have lower gross margins. Although we follow the percentage of completion method of recognizing revenues for large custom orders, we nevertheless have experienced fluctuations in operating results and expect our future results of operations will be subject to similar fluctuations.
Orders are booked and included in backlog only upon receipt of a firm contract and after receipt of any required deposits. As a result, certain orders for which we have received binding letters of intent or contracts will not be booked until all required contractual documents and deposits are received. In addition, order bookings can vary significantly on a quarterly basis as a result of the timing of large orders.
19
GENERAL
Our business, especially the large video display business in all of our business units, is very competitive, and generally our margins on these large contracts are similar across the business units over the long-term. There are, however, differences in the short term among the business units, which are discussed more fully in the following analysis.
Overall, our business growth is driven by the market demand for large format electronic displays with the depth and quality of our products, including related control systems, and the depth of our service offerings and our technology serving these market demands. This growth, however, is partially offset by declines in product prices caused by increasing competition. Each business unit also has unique key growth drivers.
Commercial Business Unit:
Over the long-term, we believe growth in the Commercial business unit will result from a number of factors, including:
|
•
|
The growing interest in our standard display products used in many different retail-type establishments, among other types of applications. The demand in this area is driven by retailers' and other types of commercial establishments' desire to attract the attention of motorists and others into their storefronts. It is also driven by the need to communicate messages to the public. National accounts may replace their displays reaching end of life, which could lead to increased sales. Furthermore, we believe in the future there will be increased demand from national accounts, including retailers, quick serve restaurants and other types of nationwide organizations, which could lead to increasing sales.
|
|
•
|
Increasing interest in spectaculars, which include very large and sometimes highly customized displays as part of entertainment venues such as casinos, amusement parks and Times Square type locations.
|
|
•
|
The introduction of architectural lighting products for commercial buildings, which real estate owners use to add accents or effects to an entire side or circumference of a building to communicate messages or to decorate the building.
|
|
•
|
The continued deployment of digital billboards as billboard companies continue developing new sites for these and start to replace digital billboards which are reaching end of life. This is dependent on there being no adverse changes in the digital billboard regulatory environment, which could restrict future deployments of billboards, as well as maintaining our current market share of the business concentrated in a few large billboard companies.
|
Live Events Business Unit:
Over the long-term, we believe growth in the Live Events business unit will result from a number of factors, including:
|
•
|
Facilities spending more on larger display systems
|
|
•
|
Lower product costs, which are driving an expansion of the marketplace
|
|
•
|
Our product and service offerings, which remain the most integrated and comprehensive offerings in the industry
|
|
•
|
The competitive nature of sports teams, which strive to out-perform their competitors with display systems
|
|
•
|
The desire for high-definition video displays, which typically drives larger displays or higher resolution displays, both of which increase the average transaction size
|
Schools and Theatres Business Unit:
Over the long-term, we believe growth in the Schools and Theatres business unit will result from a number of factors, including:
|
•
|
Increased demand for video systems in high schools as school districts realize the revenue generating potential of these displays versus traditional scoreboards
|
|
•
|
Increased demand for different types of displays, such as message centers at schools to communicate to students, parents and the broader community
|
|
•
|
The use of more sophisticated displays in more athletic venues, such as aquatics in schools
|
Transportation Business Unit:
Over the long-term, we believe growth in the Transportation business unit will result from increasing applications of electronic displays to manage transportation systems, including roadway, airport, parking, transit and other applications. This growth is highly dependent on government spending, primarily by the federal government.
International Business Unit:
Over the long-term, we believe growth in the International business unit will result from achieving greater penetration in various geographies, building products more suited to individual markets, third party advertising market opportunities, and the reasons listed in each of the other business units to the extent they apply outside the United States and Canada.
Each of our business units is impacted by adverse economic conditions in different ways and to different degrees. The effects of an adverse economy are generally less severe on our sports related business as compared to our other businesses, although in severe economic downturns, the sports business also can be severely impacted. Our Commercial and International business units are highly dependent on economic conditions in general.
20
The cost and selling prices of our products have decreased over time and are expected to continue to decrease in the future. As a result, each year we must sell more products to generate the same or greater level of net sales as in previous fiscal years. This price decline has been significant as a result of increased competition across all business units.
CRITICAL ACCOUNTING POLICIES AND ESTIMATES
The following discussion and analysis of financial condition and results of operations are based upon our consolidated financial statements, which have been prepared in accordance with accounting principles generally accepted in the United States of America. The preparation of these financial statements requires us to make estimates and judgments which affect the reported amounts of assets, liabilities, revenues and expenses and related disclosure of contingent assets and liabilities. On a regular basis, we evaluate our estimates, including those related to total costs on long-term construction-type contracts, costs to be incurred for product warranties and extended maintenance contracts, bad debts, excess and obsolete inventory, income taxes, share-based compensation and contingencies. Our estimates are based on historical experience and on various other assumptions believed to be reasonable under the circumstances, the results of which form the basis for making judgments about the carrying values of assets and liabilities not readily apparent from other sources. Actual results may differ from these estimates.
We believe the following critical accounting policies require significant judgments and estimates in the preparation of our consolidated financial statements:
Revenue recognition on long-term construction-type contracts.
Earnings on construction-type contracts are recognized on the percentage-of-completion method, measured by the percentage of costs incurred to date to estimated total costs for each contract. Contract costs include all direct material and labor costs and those indirect costs related to contract performance. Indirect costs include charges for such items as facilities, engineering and project management. Provisions for estimated losses on uncompleted contracts are made in the period such losses are capable of being estimated. Generally, construction-type contracts we enter into have fixed prices established, and to the extent the actual costs to complete construction-type contracts are higher than the amounts estimated as of the date of the financial statements, the resulting gross margin would be negatively affected in future quarters when we revise our estimates. Our practice is to revise estimates as soon as such changes in estimates are known. We do not believe there is a reasonable likelihood there will be a material change in future estimates or assumptions we use to determine these estimates. We combine contracts for accounting purposes when they are negotiated as a package with an overall profit margin objective, essentially represent an agreement to do a single project for a customer, involve interrelated construction activities, and are performed concurrently or sequentially. When a group of contracts is combined, revenue and profit are recognized uniformly over the performance of the combined projects. We segment revenues in accordance with the contract segmenting criteria in Accounting Standards Codification (“ASC”) 650-35,
Construction-Type and Production-Type Contracts.
Allowance for doubtful accounts.
We maintain an allowance for doubtful accounts for estimated losses resulting from the inability of our customers to make required payments. If the financial condition of our customers were to deteriorate, resulting in an impairment of their ability to make payments, additional allowances may be required. To identify impairment in customers’ ability to pay, we review aging reports, contact customers in connection with collection efforts and review other available information. Although we consider our allowance for doubtful accounts adequate, if the financial condition of our customers were to deteriorate and impair their ability to make payments to us, additional allowances may be required in future periods. We do not believe there is a reasonable likelihood there will be a material change in the future estimates or assumptions we use to determine the allowance for doubtful accounts. As of
April 27, 2013
and
April 28, 2012
, we had an allowance for doubtful accounts balance of approximately
$2.7 million
and
$2.4 million
, respectively.
Warranties.
We have recognized a reserve for warranties on our products equal to our estimate of the actual costs to be incurred in connection with our performance under the warranties. Generally, estimates are based on historical experience taking into account known or expected changes. If we would become aware of an increase in our estimated warranty costs, additional reserves may become necessary, resulting in an increase in costs of goods sold. We do not believe there is a reasonable likelihood there will be a material change in the future estimates or assumptions we use to determine our reserve for warranties. As of
April 27, 2013
and
April 28, 2012
, we had approximately
$25.1 million
and
$22.2 million
reserved for these costs, respectively.
Extended warranty and product maintenance.
We recognize deferred revenue related to separately priced extended warranty and product maintenance agreements. The deferred revenue is recognized ratably over the contractual term. If we would become aware of an increase in our estimated costs under these agreements in excess of our deferred revenue, additional reserves may be necessary, resulting in an increase in costs of goods sold. In determining if additional reserves are necessary, we examine cost trends on the contracts and other information and compare them to the deferred revenue. We do not believe there is a reasonable likelihood there will be a material change in the future estimates or assumptions we use to determine estimated costs under these agreements. As of
April 27, 2013
and
April 28, 2012
, we had
$13.0 million
and
$14.0 million
of deferred revenue related to separately priced extended warranty and product maintenance agreements, respectively.
21
Inventory.
Inventories are stated at the lower of cost or market. Market refers to the current replacement cost, except market may not exceed the net realizable value (that is, the estimated selling price in the ordinary course of business less reasonably predictable costs of completion and disposal), and market is not less than the net realizable value reduced by an allowance for normal profit margins. In valuing inventory, we estimate market value where it is believed to be the lower of cost or market, and any necessary changes are charged to costs of goods sold in the period in which they occur. In determining market value, we review various factors such as current inventory levels, forecasted demand and technological obsolescence. We do not believe there is a reasonable likelihood there will be a material change in the future estimates or assumptions we use to calculate the estimated market value of inventory. However, if market conditions change, including changes in technology, product components used in our products or in expected sales, we may be exposed to unforeseen losses which could be material.
Income taxes.
As part of the process of preparing our consolidated financial statements, we are required to estimate our income taxes in each of the jurisdictions in which we operate. This process involves estimating the actual current tax expense, as well as assessing temporary differences in the treatment of items for tax and financial reporting purposes. These timing differences result in deferred tax assets and liabilities, which are included in our consolidated balance sheets. We must then assess the likelihood our deferred tax assets will be recovered from future taxable income in each jurisdiction, and to the extent we believe recovery is not likely, a valuation allowance must be established. We review deferred tax assets, including net operating losses, and to the extent we believe the asset may not be realized, we recognize a valuation allowance. If our estimates of future taxable income are not met in future periods, a valuation allowance for some of these deferred tax assets may be required. We believe we will generate taxable income in future years which will allow for realization of deferred tax assets. Realization of the deferred tax assets would require approximately $20 million of taxable income, which we believe is achievable through the carry back of losses or future earnings.
We operate within multiple taxing jurisdictions, both domestic and international, and are subject to audits in these jurisdictions. These audits can involve complex issues, including challenges regarding the timing and amount of deductions and the allocation of income amounts to various tax jurisdictions. At any one time, multiple tax years are subject to audit by various tax authorities.
We record our income tax provision based on our knowledge of all relevant facts and circumstances, including the existing tax laws, the status of any current examinations and our understanding of how the tax authorities view certain relevant industry and commercial matters. In evaluating the exposure associated with our various tax filing positions, we record reserves for probable exposures consistent with ASC 740,
Income Taxes.
A number of years may elapse before a particular matter for which we have established a reserve is audited and fully resolved or clarified. We adjust our income tax provision in the period in which actual results of a settlement with tax authorities differs from our established reserve; when the statute of limitations expires for the relevant taxing authority to examine the tax position, or when more information becomes available. Our tax contingencies reserve contains uncertainties because management is required to make assumptions and apply judgment to estimate the exposure associated with our various filing positions. We believe any potential tax assessments from various tax authorities not covered by our income tax provision will not have a material adverse impact on our consolidated financial position, results of operations or cash flow.
Some of the countries in which we are located allow tax holidays or provide other tax incentives to attract and retain business. We have obtained holidays or other incentives where available and practicable. Our taxes could increase if certain tax holidays or incentives were retracted for past periods (which in some cases could occur if we do not satisfy the conditions on which such holidays or incentives are based), they are not renewed upon expiration, or tax rates applicable to us in such jurisdictions are otherwise increased. Our tax holiday with respect to our Chinese operations expired as of December 31, 2011, and after fiscal 2012, we were not benefiting from any tax incentives in foreign jurisdictions which would have a material impact on our effective tax rate. In addition, any acquisitions may cause our effective tax rate to increase, depending on the jurisdictions in which the acquired operations are located.
Asset Impairment.
Carrying values of goodwill and other intangible assets with indefinite lives are reviewed at least annually for possible impairment in accordance with ASC 350,
Intangibles -
Goodwill and Other
. Our impairment review involves estimating the fair value of goodwill and indefinite-lived intangible assets using a combination of a market approach and an income (discounted cash flow) approach at the reporting unit level, requiring significant management judgment with respect to revenue and expense growth rates, changes in working capital, and the selection and use of an appropriate discount rate. The estimates of fair value of reporting units are based on the best information available as of the date of the assessment. The use of different assumptions would increase or decrease estimated discounted future operating cash flows and could increase or decrease an impairment charge. We use our judgment in assessing whether assets may have become impaired between annual impairment tests. Indicators such as adverse business conditions, economic factors and technological change or competitive activities may signal an asset has become impaired.
Carrying values for long-lived tangible assets and definite-lived intangible assets, excluding goodwill and indefinite-lived intangible assets, are reviewed for possible impairment as circumstances warrant in connection with ASC 360-10-05-4,
Impairment or Disposal of Long-Lived Assets.
Impairment reviews are conducted when we believe a change in circumstances in the business or external factors warrants a review. Circumstances such as the discontinuation of a product or product line, a sudden or consistent decline in the forecast for a product, changes in technology or in the way an asset is being used, a history of negative operating cash flow, or an adverse change in legal factors or in the business climate, among others, may be indicators to trigger an impairment review. The Company’s initial
22
impairment review to determine if a potential impairment charge is required is based on an undiscounted cash flow analysis at the lowest level for which identifiable cash flows exist. The analysis requires judgment with respect to changes in technology, the continued success of product lines, future volume, revenue and expense growth rates, and discount rates.
Share-based compensation.
We use the Black-Scholes standard option pricing model (“Black-Scholes model”) to determine the fair value of stock options and stock purchase rights. The determination of the fair value of the awards on the date of grant using the Black-Scholes model is affected by our stock price as well as by assumptions regarding other variables, including projected employee stock option exercise behaviors, risk-free interest rate, expected volatility of our stock price in future periods, and expected dividend yield.
We analyze historical employee exercise and termination data to estimate the expected life assumption of a new employee option. We believe historical data currently represents the best estimate of the expected life of a new employee option. The risk-free interest rate we use is based on the U.S. Treasury zero-coupon yield curve on the grant date for a maturity similar to the expected life of the options. We estimate the expected volatility of our stock price in future periods by using the implied volatility in market traded options. Our decision to use expected volatility was based on the availability of actively traded options for our common stock, and our assessment of expected volatility is more representative of future stock price trends than the historical volatility of our common stock. We use an expected dividend yield consistent with our dividend yield over the period of time we have paid dividends in the Black-Scholes option valuation model. The amount of share-based compensation expense we recognize during a period is based on the portion of the awards ultimately expected to vest. We estimate pre-vesting option forfeitures at the time of grant by analyzing historical data, and we revise those estimates in subsequent periods if actual forfeitures differ from those estimates.
If factors change and we employ different assumptions for estimating share-based compensation expense in future periods or if we decide to use a different valuation model, the expense in future periods may differ significantly from what we have recorded in the current period and could materially affect our net earnings and net earnings per share in a future period.
RECENT ACCOUNTING PRONOUNCEMENTS
For a summary of recently issued accounting pronouncements and the effects those pronouncements would have on our financial results, see Note 1 of the Notes to our Consolidated Financial Statements included in this report.
RESULTS OF OPERATIONS
Net Sales
|
|
Year Ended
|
||||||||||||||||
|
April 27, 2013
|
April 28, 2012
|
April 30, 2011
|
|||||||||||||||
|
(in thousands)
|
Amount
|
Percent Change
|
Amount
|
Percent Change
|
Amount
|
||||||||||||
|
Net Sales:
|
|
|
|
||||||||||||||
|
Commercial
|
$
|
144,596
|
|
(2.7
|
)%
|
$
|
148,585
|
|
32.1
|
%
|
$
|
112,515
|
|
||||
|
Live Events
|
158,562
|
|
(1.5
|
)
|
160,933
|
|
(0.4
|
)
|
161,572
|
|
|||||||
|
Schools & Theatres
|
66,128
|
|
10.8
|
|
59,662
|
|
(4.2
|
)
|
62,310
|
|
|||||||
|
Transportation
|
73,270
|
|
51.7
|
|
48,284
|
|
6.8
|
|
45,215
|
|
|||||||
|
International
|
75,766
|
|
5.1
|
|
72,062
|
|
20.0
|
|
60,064
|
|
|||||||
|
|
$
|
518,322
|
|
5.9
|
%
|
$
|
489,526
|
|
10.8
|
%
|
$
|
441,676
|
|
||||
|
Orders:
|
|
|
|
|
|||||||||||||
|
Commercial
|
$
|
152,028
|
|
(0.8
|
)%
|
$
|
153,268
|
|
32.3
|
%
|
$
|
115,820
|
|
||||
|
Live Events
|
161,602
|
|
2.5
|
|
157,695
|
|
3.2
|
|
152,851
|
|
|||||||
|
Schools & Theatres
|
64,796
|
|
10.7
|
|
58,534
|
|
(5.6
|
)
|
61,995
|
|
|||||||
|
Transportation
|
73,426
|
|
33.4
|
|
55,060
|
|
25.5
|
|
43,878
|
|
|||||||
|
International
|
80,158
|
|
44.7
|
|
55,396
|
|
(15.2
|
)
|
65,318
|
|
|||||||
|
|
$
|
532,010
|
|
10.8
|
%
|
$
|
479,953
|
|
9.1
|
%
|
$
|
439,862
|
|
||||
23
Fiscal Year 2013 as compared to Fiscal Year 2012
Commercial:
The decrease in net sales for fiscal 2013 compared to the same period one year ago was the net result of:
|
•
|
A decrease of $3.5 million in sales for large video display projects due to delayed orders for custom video projects.
|
|
•
|
A decrease of $3.7 million in sales to outdoor advertising companies due to lower demand from our billboard customers.
|
|
•
|
An increase of $2.2 million in sales of on-premise advertising displays, which was primarily due to an increase in orders for a national account customer replacement program, as previously disclosed, and an improved economy.
|
|
•
|
An increase of $1.0 million of service related sales.
|
Over the near-term in fiscal 2014, we believe the commercial market sales will be generally flat due indications given to us by our billboard customers and expected lower national account replacements compared to fiscal 2013. A number of custom video projects opportunities are available in the marketplace, however, due to a number of factors, such as the discretionary nature of customers committing to the system, it is difficult to predict orders and sales for fiscal 2014.
Live Events:
The decrease in net sales for fiscal 2013 compared to the same period one year ago was the net result of:
|
•
|
A $2.4 million decrease in sales to mobile and modular customers due to reduced demand from these customers.
|
|
•
|
General volatility of this business unit because of the nature of the business in large custom display systems. During fiscal 2013, sales increased for multi-purpose live event arena venues and National Football League stadiums which were offset by a decrease in sales to National Baseball League stadiums and National Hockey League and National Basketball Association arenas.
|
We continue to see ongoing interest from venues at all levels to increase the size and capability of their display system which should offer continued growth opportunity for this market in fiscal 2014. A number of factors, such as the discretionary nature of customers committing to upgrade systems, versus the non-discretionary purchases associated with new construction, the current aggressive competitive environment and various other factors, make forecasting fiscal 2014 orders and net sales difficult. However, for the reasons cited previously, we expect growth in this business unit over the long-term, assuming the economy continues to improve and we are successful at counteracting competitive pressures.
Schools and Theatres:
The increase in net sales for fiscal 2013 compared to the same period one year ago was the result of:
|
•
|
Schools demonstrating more willingness this year than in fiscal 2012 to move forward with projects including smaller video systems, scoring and timing equipment and message centers.
|
|
•
|
An increased demand in video projects for high schools.
|
We continue to see opportunities to sell larger video systems, primarily in high school facilities which benefit from our sports marketing services that generate advertising revenue to fund the display systems for fiscal 2014. For the long term, we believe this business unit presents growth opportunities as the economy continues to improve.
Transportation:
The increase in net sales for fiscal 2013 compared to the same period one year ago was the result of:
|
•
|
Sales recorded from a large procurement contract compared to the previous year.
|
|
•
|
Sales recorded in relation to a $21 million order for video displays at the LAX Bradley International Terminal in Los Angeles. This type of order in the transportation market is unusual and infrequent in nature.
|
During fiscal 2013, we recorded significant revenues from large projects in excess of $40 million related to the LAX and New Jersey Turnpike Authority projects. Currently we do not have another large project like these on the horizon for fiscal 2014 to replace these sales, but with the introduction of our 20mm high resolution full-color products introduced in fiscal 2013, we are anticipating sales to adjust back to a more normal growth curve with an increase over fiscal 2012 sales levels.
International:
The increase in net sales for the fiscal 2013 compared to the same period one year ago was the net result of general volatility of this business unit because of the nature of the business in large custom display systems and timing differences in the production and installation schedule of orders booked.
For fiscal 2014, we believe the International business unit to have potential for sales growth as we penetrate markets with our established sales networks. In addition, the third-party advertising business continues to be strong worldwide and we see a definite shift to digital as price for displays has come down. Both of these factors could increase sales.
24
Fiscal Year 2012 as compared to Fiscal Year 2011
Commercial:
The increase in net sales in our Commercial business unit for fiscal 2012 compared to fiscal 2011 is the net result of:
|
•
|
An increase in orders of approximately 49 percent in our billboard business. This growth was the result of the large outdoor advertising companies increasing their rollout of digital billboards beginning in calendar 2011 and our ability to gain back a portion of the business with one large outdoor advertising company.
|
|
•
|
An increase of approximately 60 percent in orders for large video display systems, primarily spectaculars, which we attribute to improvements in the economy and a growing market.
|
|
•
|
A 15 percent increase in orders for our standard product displays, which appears to be a reflection of improvement in the economy as well as our expanded product offerings, including our GalaxyPro line of displays.
|
Live Events:
Net sales were generally flat in fiscal 2012 as compared to fiscal 2011. During fiscal 2012, orders and net sales were impacted by:
|
•
|
A decrease in orders and net sales for professional baseball facilities. During fiscal 2011, we booked approximately $22.9 million in orders for professional baseball projects compared to approximately $10.7 million in fiscal 2012. Net sales in professional baseball facilities were $28.8 million and $9.6 million for fiscal 2011 and 2012, respectively. These changes were the result of higher than expected orders in fiscal 2011 that were delayed from fiscal 2010 as a result of economic conditions, which drove 2011 to unusually high levels.
|
|
•
|
A decrease in orders and net sales for professional football and basketball facilities. During fiscal 2011, we booked approximately $15.4 million in orders for professional football and basketball projects, compared to approximately $7.5 million in fiscal 2012.
|
Net sales were $20.2 million and $7.3 million for fiscal 2011 and 2012. This change was the result of labor issues in both sports in the spring and summer of calendar year 2011.
|
•
|
An increase in orders for colleges and universities which more than offset the declines mentioned above. This increase was the result of the factors driving growth in the Live Events business unit as described previously.
|
Schools and Theatres:
The decrease in net sales in our Schools and Theatres business unit for fiscal 2012 compared to fiscal 2011 is the result of economic pressures on schools, which we believe inhibits spending in spite of the revenue generation abilities of these display systems for schools.
Transportation:
The increase in net sales in our Transportation business unit for fiscal 2012 compared to fiscal 2011 is the result of the increase in orders booked during this period, which was driven by orders from the New Jersey Turnpike Authority under a $25 million, three year procurement contract. Net sales from this customer exceeded $5.0 million for fiscal 2012.
International:
The increase in net sales in our International business unit for fiscal 2012 compared to fiscal 2011 is the result of the higher backlog of business we had at the beginning of fiscal 2012, primarily as a result of a large contract for a new arena built in Mexico during fiscal 2012. At the end of fiscal 2011, the backlog of this contract was approximately $8.9 million compared to zero at the end of fiscal 2012.
Advertising Revenues
We occasionally sell products in exchange for the advertising revenues generated from the use of our display products. These sales represented less than one percent of net sales for fiscal 2013, 2012 and 2011. The gross profit percent on these transactions has typically been higher than the gross profit percent on other transactions of similar size, although the selling expenses associated with these transactions are typically higher.
Backlog
The product order backlog as of
April 27, 2013
was approximately
$141 million
as compared to
$123 million
as of
April 28, 2012
. Historically, our backlog varies due to the timing of large projects and customer delivery schedules for these projects. The backlog decreased from one year ago in our Live Events and Schools and Theatres business units and increased in our other business units.
Backlog is not a measure defined by U.S. generally accepted accounting principles, and our methodology for determining backlog may vary from the methodology used by other companies in determining their backlog amounts. Our backlog is equal to the amount of net sales expected to be recognized in future periods on standard product and contract sales that are evidenced by an arrangement, with prices that are fixed and determinable and with collectability reasonably assured. Backlog may not be indicative of future operating results, and arrangements in our backlog may be canceled, modified or otherwise altered; therefore, it is not necessarily indicative of future sales or net income.
25
Gross Profit
|
|
Year Ended
|
|||||||||||||||||||
|
|
April 27, 2013
|
April 28, 2012
|
April 30, 2011
|
|||||||||||||||||
|
(in thousands)
|
Amount
|
As a Percent of Net Sales
|
Amount
|
As a Percent of Net Sales
|
Amount
|
As a Percent of Net Sales
|
||||||||||||||
|
Commercial
|
$
|
38,123
|
|
26.4
|
%
|
$
|
38,123
|
|
25.7
|
%
|
$
|
25,544
|
|
22.7
|
%
|
|||||
|
Live Events
|
31,718
|
|
20.0
|
|
26,477
|
|
16.5
|
|
32,276
|
|
20.0
|
|
||||||||
|
Schools & Theatres
|
18,601
|
|
28.1
|
|
15,532
|
|
26.0
|
|
17,272
|
|
27.7
|
|
||||||||
|
Transportation
|
24,552
|
|
33.5
|
|
14,445
|
|
29.9
|
|
15,647
|
|
34.6
|
|
||||||||
|
International
|
20,900
|
|
27.6
|
|
18,860
|
|
26.2
|
|
20,745
|
|
34.5
|
|
||||||||
|
|
$
|
133,894
|
|
25.8
|
%
|
$
|
113,437
|
|
23.2
|
%
|
$
|
111,484
|
|
25.2
|
%
|
|||||
Fiscal Year 2013 as compared to Fiscal Year 2012
The increase in our gross profit
percentage for fiscal 2013 compared to fiscal 2012 is the net result of the following:
|
•
|
An increase of approximately 3.4 percentage points because of improved cost and resource management in the manufacturing and services infrastructure and improved sales mix.
|
|
•
|
A decrease of approximately 0.8 percentage points because of unexpected warranty costs and costs incurred for services not covered under warranty to cover primarily supplier component issues. For fiscal 2013, warranty costs were approximately 3.4 percent of net sales compared to 2.7 percent in fiscal 2012.
|
It is difficult to project gross profit levels for fiscal 2014 because of the uncertainty regarding the level of sales and the competitive factors in our business. We expect gross profit levels will increase as we continue to execute on our strategies for improved profitability. We plan on focusing efforts on the quality of suppliers, adding additional quality testing in our manufacturing areas, continuing our sourcing strategies, continuing focus on product reliability in designs to improve warranty costs as a percent of sales and improved process flow in our manufacturing and services organization to improve gross profit margin. An increase in gross profit assumes competitive pressures remain consistent with the levels of fiscal 2013.
Commercial:
The gross profit percent increase for fiscal 2013 compared to the same period one year ago was primarily the result of sales mix and improved manufacturing utilization, which were offset by unexpected warranty costs due to a supplier component failure.
Live Events:
The gross profit percent increase for fiscal 2013 compared to the same period one year ago was the result of lowered manufacturing infrastructure costs primarily due to the overall higher sales volumes. Large live events video projects are competitively bid and generally result in lower overall margins from a sales mix perspective.
Schools and Theatres:
The gross profit percent increase for fiscal 2013 compared to the same period one year ago primarily was the result of sales mix and improved manufacturing utilization from the overall higher sales volumes and cost reduction initiatives.
Transportation:
The gross profit percent increase for fiscal 2013 compared to the same period one year ago was the primarily the result of improved manufacturing utilization from the overall higher sales volumes and cost reduction initiatives and improved sales mix offset by unexpected warranty costs due to a supplier component failure.
International:
The gross profit percent increase for fiscal 2013 compared to the same period one year ago was the net result of an increase in the gross margin on product sales, which increased the overall gross profit by approximately six percentage points offset by an increase in warranty costs and an increase in services infrastructure costs.
Fiscal Year 2012 as compared to Fiscal Year 2011
Commercial:
The gross profit percent increase in the Commercial business unit for fiscal 2012 compared to fiscal 2011 is the net result of:
|
•
|
A decrease in warranty expenses, which added approximately 2.5 percentage points to gross profit percentage and resulted from the actions previously discussed and some unusually higher costs in fiscal 2011, as explained in prior filings.
|
|
•
|
A decrease in gross profit percentage on services and maintenance agreements, which caused a decrease of approximately 0.9 percentage points.
|
|
•
|
A decrease in the gross profit on product sales that decreased gross profit percentage by approximately 0.3 percentage points, primarily due to an increased percentage of net sales in the billboard niche, which typically has lower gross profit percentages.
|
|
•
|
An increase in our services overhead, which decreased gross profit percentage by approximately 0.8 percentage points.
|
26
|
•
|
Increased cost absorption in manufacturing due to the increased level of net sales, which improved gross profit percentages by approximately 1.5 percentage points.
|
Live Events:
The gross profit percent decrease in the Live Events business unit for fiscal 2012 compared to fiscal 2011 is the net result of:
|
•
|
A decrease in gross profit percentage on product sales, which reduced gross profit percentage by approximately 1.1 percentage points.
|
|
•
|
Increases in our services overhead, which decreased gross profit percentage by approximately 2.2 percentage points.
|
|
•
|
Lower plant utilization due to the overall lower sales volumes, which decreased gross profit percentage by approximately 1.2 percentage points.
|
|
•
|
A decrease in warranty expenses, which added approximately 0.7 percentage points to the gross profit percentage and resulted from the actions previously discussed and some unusually higher costs in fiscal 2011, as explained in prior filings.
|
Schools and Theatres:
The gross profit percentage decrease in the Schools and Theatres business unit for fiscal 2012 compared to fiscal 2011 is the net result of:
|
•
|
A decrease in gross profit percentage in product sales, which decreased the overall gross profit percentage by approximately 1.3 percentage points.
|
|
•
|
A decrease in warranty expenses, which added approximately 2.1 percentage points to the gross profit percentage.
|
|
•
|
An increase in our services overhead, which reduced the gross profit percentage by approximately 1.8 percentage points.
|
|
•
|
Lower plant utilization due to the overall lower sales volumes, which decreased gross profit percentage by approximately 0.8 percentage points.
|
Transportation:
The gross profit percent decrease in the Transportation business unit for fiscal 2012 compared to fiscal 2011 is the net result of:
|
•
|
A decrease in the gross profit percentage on product sales, which decreased the overall gross profit percentage by approximately 0.6 percentage points.
|
|
•
|
Increase in conversion costs as a percent of sales and increased inventory losses, which decreased the gross profit percentage by approximately 2.6 percentage points.
|
|
•
|
An increase in our services overhead, which reduced the gross profit percentage by approximately 1.3 percentage points.
|
International:
The gross profit percent decrease in the International business unit for fiscal 2012 compared to fiscal 2011 is the net result of:
|
•
|
A decrease in the gross margin on product sales, which decreased the overall gross profit by approximately 6.0 percentage points. This decrease is the result of a number of factors, including added costs to conform products to local regulatory requirements and a lower margin on contracts booked due to the factors described below.
|
|
•
|
An increase in warranty costs, which added approximately 0.3 percentage points.
|
|
•
|
An increase in manufacturing costs, primarily in China as we increased the capabilities there.
|
Selling Expense
|
|
Year Ended
|
|||||||||||||||||||||||||
|
April 27, 2013
|
April 28, 2012
|
April 30, 2011
|
||||||||||||||||||||||||
|
(in thousands)
|
Amount
|
As a Percent of Net Sales
|
Percent Change
|
Amount
|
As a Percent of Net Sales
|
Percent Change
|
Amount
|
As a Percent of Net Sales
|
||||||||||||||||||
|
Commercial
|
$
|
13,882
|
|
9.6
|
%
|
(1.6
|
)%
|
$
|
14,112
|
|
9.5
|
%
|
11.8
|
%
|
$
|
12,619
|
|
11.2
|
%
|
|||||||
|
Live Events
|
12,647
|
|
8.0
|
|
(1.9
|
)
|
12,898
|
|
8.0
|
|
(3.7
|
)
|
13,387
|
|
8.3
|
|
||||||||||
|
Schools & Theatres
|
10,451
|
|
15.8
|
|
(3.4
|
)
|
10,816
|
|
18.1
|
|
7.9
|
|
10,025
|
|
16.1
|
|
||||||||||
|
Transportation
|
3,222
|
|
4.4
|
|
(6.2
|
)
|
3,436
|
|
7.1
|
|
(1.8
|
)
|
3,498
|
|
7.7
|
|
||||||||||
|
International
|
12,557
|
|
16.6
|
|
14.5
|
|
10,971
|
|
15.2
|
|
9.4
|
|
10,026
|
|
16.7
|
|
||||||||||
|
|
$
|
52,759
|
|
10.2
|
%
|
1.0
|
%
|
$
|
52,233
|
|
10.7
|
%
|
5.4
|
%
|
$
|
49,555
|
|
11.2
|
%
|
|||||||
Fiscal Year 2013 as compared to Fiscal Year 2012
Selling expenses consist primarily of salaries, other employee-related costs, travel and entertainment expenses, facilities-related costs for sales and service offices, bad debt expenses, third party commissions and expenditures for marketing efforts, including the costs of
27
collateral materials, conventions and trade shows, product demos, and supplies. The increase in selling expenses
in fiscal 2013 compared to fiscal 2012 is the net result of the following:
|
•
|
A $1.0 million increase in personnel costs, including taxes and benefits.
|
|
•
|
A $0.8 million increase in bad debt expense for potentially uncollectable accounts receivable primarily from sales derived from our International business unit.
|
|
•
|
An increase of $0.6 million in third-party commissions used in various locations around the world to expand market opportunities.
|
|
•
|
A reduction of $1.8 million in travel and entertainment, convention expenses and various decreases in vehicle expense, depreciation, and other expenses due to our on-going cost containment initiatives.
|
We expect selling expenses will increase slightly in fiscal 2014 as compared to fiscal 2013.
Commercial:
The decrease in selling expense for
fiscal 2013
compared to the same period in
fiscal 2012
is due to a $0.3 million decrease in travel and entertainment expenses and various changes in other selling expenses as a result of our initiatives to contain costs.
Live Events:
The decrease of $0.2 million in selling expenses for
fiscal 2013
compared to
fiscal 2012
was the result of our initiative to contain costs in travel and entertainment and convention expenses.
Schools & Theatres:
The decrease in selling expenses for
fiscal 2013
compared to
fiscal 2012
was the result of reductions in bad debts and various changes in other selling expenses from normal business changes and cost containment initiatives.
Transportation:
Selling expenses for
fiscal 2013
compared to the same period one year ago decreased as a result of cost containment efforts offsetting increases in other variable expenses.
International:
The increase in selling expenses for
fiscal 2013
compared to the same period one year ago was the net result of:
|
•
|
An increase of $1.2 million in bad debt expense for potentially uncollectable accounts receivable due to the continued softness of the worldwide economy.
|
|
•
|
A $0.7 million increase in third-party commissions on significant contracts. Third-party sales agents are contracted from time-to-time to penetrate geographic locations where we have limited presence.
|
|
•
|
A net decrease of $0.2 million in various other selling expenses.
|
Fiscal Year 2012 as compared to Fiscal Year 2011
Commercial:
The increase in selling expenses for fiscal 2012 compared to fiscal 2011 was the result of a $1.0 million increase in personnel costs, including taxes and benefits, and a $0.5 million increase in travel and entertainment costs. These increases are a result of the increase in orders, as explained previously.
Live Events:
The decline in selling expenses for fiscal 2012 compared to fiscal 2011 was the net result of:
|
•
|
A reduction of $0.4 million in depreciation, which reflects the lower level of capital expenditures associated primarily with display equipment used for sales promotion.
|
|
•
|
A decrease of approximately $0.5 million in the allocation of shared sales administration costs which are allocated between our Live Events business unit and our Schools and Theatres business unit.
|
|
•
|
An increase in payroll, including taxes and benefits, of approximately $0.4 million, as we increased our staffing to address contract opportunities.
|
Schools & Theatres:
The increase in selling expenses for fiscal 2012 compared to fiscal 2011 was the net result of:
|
•
|
An increase in bad debt expense of approximately $0.3 million.
|
|
•
|
An increase of approximately $0.6 million in the allocation of shared sales administration costs allocated between our Live Events business unit and our Schools and Theatres business unit.
|
Transportation:
Selling expenses were flat for fiscal 2012 compared to fiscal 2011, although there were increases in payroll costs, net of taxes and benefits, which were offset by decreases in various other expenses.
International:
The increase in selling expenses for fiscal 2012 compared to fiscal 2011 was the result of a $1.1 million increase in payroll costs, net of taxes and benefits, which was partially offset by cost savings in various other expenses.
28
Other Operating Expenses
|
|
Year Ended
|
|||||||||||||||||||||||||
|
April 27, 2013
|
April 28, 2012
|
April 30, 2011
|
||||||||||||||||||||||||
|
(in thousands)
|
Amount
|
As a Percent of Net Sales
|
Percent Change
|
Amount
|
As a Percent of Net Sales
|
Percent Change
|
Amount
|
As a Percent of Net Sales
|
||||||||||||||||||
|
General and administrative
|
$
|
27,404
|
|
5.3
|
%
|
(0.1
|
)%
|
$
|
27,422
|
|
5.6
|
%
|
16.9
|
%
|
$
|
23,453
|
|
5.3
|
%
|
|||||||
|
Product design and development
|
$
|
23,131
|
|
4.5
|
%
|
(1.6
|
)%
|
$
|
23,507
|
|
4.8
|
%
|
24.1
|
%
|
$
|
18,949
|
|
4.3
|
%
|
|||||||
Fiscal Year 2013 as compared to Fiscal Year 2012
General and administrative expenses
consist primarily of salaries, other employee-related costs, professional fees, shareholder relations costs, facilities and equipment related costs for administrative departments, training costs, amortization of intangibles and the costs of supplies. General and administrative expense in fiscal 2013 as compared to fiscal 2012 remained relatively flat due to our continued focus on controlling spending as a part of our strategic goals to improve operating income. During fiscal 2013, increases in salaries and other employee-related costs of $0.5 million were offset by decreases of $0.3 million in professional fees and $0.2 million of other costs.
We expect general and administrative expenses to increase slightly in fiscal 2014 as compared to fiscal 2013.
Product design and development expenses
consist primarily of salaries, other employee-related costs, facilities and equipment-related costs and supplies. Product development investments during fiscal 2013 included video technology with a range of pixel pitches for outdoor applications using LED surface mount technology. In addition, we completed development of a new full-color family of Vanguard displays for the Transportation business unit.
Our costs for product development represent an allocated amount of costs based on time charges, materials costs and overhead of our engineering departments. Generally, a significant portion of our engineering time is spent on product development, while the rest is allocated to large contract work and included in cost of goods sold. The decline in product development expense
in fiscal 2013 as compared to fiscal 2012 was the net result of the following:
|
•
|
An increase in personnel costs, including taxes and benefits, of $0.5 million.
|
|
•
|
A decrease in material costs related to product development of $1.0 million as a result of the timing of projects for prototyping new products and the stage of product development.
|
|
•
|
An increase of $0.1 million in various other expenses.
|
We expect product design and development expenses will increase slightly in fiscal 2014 as compared to fiscal 2013.
Fiscal Year 2012 as compared to Fiscal Year 2011
General and administrative expenses
increased in fiscal 2012 as compared to fiscal 2011 as the net result of the following:
|
•
|
An increase in professional fees of $1.7 million as a result of higher litigation costs and international expansion initiatives, some of which were one-time costs, and higher costs of information systems consulting fees, as we outsourced more projects to speed up development where we believed we could achieve a faster payback in efficiencies.
|
|
•
|
Increases in personnel costs, including taxes and benefits, of approximately $1.4 million due to an increase in employee count primarily related to personnel to support hiring in other areas and in accounting to support international development, primarily in China.
|
|
•
|
Increases in various other expenses of approximately $0.9 million.
|
Product design and development expenses
increased in fiscal 2012 as compared to fiscal 2011 as the net result of the allocation of the following changes in our engineering department total spending and other charges made directly to product development initiatives:
|
•
|
An increase in personnel costs, including taxes and benefits, of approximately $2.2 million, as we increased our staff to support the continued roll out of our display and control system platforms.
|
|
•
|
An increase in material costs related to product development of $1.5 million as a result of increasing importance placed on prototyping new products and the increase in new product introductions.
|
|
•
|
An increase of approximately $0.9 million in various other expenses.
|
29
Other Income and Expenses
|
|
Year Ended
|
|||||||||||||||||||||||||
|
April 27, 2013
|
April 28, 2012
|
April 30, 2011
|
||||||||||||||||||||||||
|
(in thousands)
|
Amount
|
As a Percent of Net Sales
|
Percent Change
|
Amount
|
As a Percent of Net Sales
|
Percent Change
|
Amount
|
As a Percent of Net Sales
|
||||||||||||||||||
|
Interest income, net
|
$
|
1,168
|
|
0.2
|
%
|
(17.3
|
)%
|
$
|
1,412
|
|
0.3
|
%
|
(18.7
|
)%
|
$
|
1,737
|
|
0.4
|
%
|
|||||||
|
Other (expense) income, net
|
$
|
(839
|
)
|
(0.2
|
)%
|
662.7
|
%
|
$
|
(110
|
)
|
—
|
%
|
(112.5
|
)%
|
$
|
877
|
|
0.2
|
%
|
|||||||
Fiscal Year 2013 as compared to Fiscal Year 2012
Interest income, net:
We generate interest income through short-term cash investments, marketable securities, product sales on an installment basis, under lease arrangements, or in exchange for the rights to sell and retain advertising revenues from displays, which result in long-term receivables. Interest expense is comprised primarily of interest costs on long-term marketing obligations. Interest income declined slightly for fiscal 2013 as compared to fiscal 2012 due to a reduction in long-term receivable balances. As a result of the volatility of working capital needs and changes in investing and financing activities, along with changes in the interest rate environment, it is difficult to project changes in interest income. We expect our cash balances will be increasing during fiscal 2014; however, we are unable to project how that will compare to fiscal 2013.
Other (expense) income, net:
The decrease of $0.7 million in other expenses for fiscal 2013 as compared to fiscal 2012 is due to a settlement of a dispute relating to a past acquisition of $0.5 million and approximately $0.1 million of higher currency losses on U.S. dollar advances to foreign subsidiaries in fiscal 2013 compared to fiscal 2012.
Fiscal Year 2012 as compared to Fiscal Year 2011
Interest income, net:
Interest income declined slightly for fiscal 2012 as compared to fiscal 2011 due to a reduction in our cash and short term investment balances that was mainly the result of dividends paid during fiscal 2012. Interest expense increased to $0.3 million for fiscal 2012 as a result of borrowings in China to support our expanding business there and the impact of currency controls, which limit our transfers of investment capital from the U.S. to fund operations in China.
Other (expense) income, net:
The decrease of $1.0 million for fiscal 2012 as compared to fiscal 2011 is due to the net result of a $0.6 million gain on the settlement of amounts owed to us by Outcast Media International, Inc. in fiscal 2011, as described in previous filings, an increase of $0.7 million in foreign currency losses, and various other non-operating gains.
In addition, as a result of the decrease in the value of the U.S. dollar, we experienced higher levels of currency losses on U.S. dollar advances to foreign subsidiaries in fiscal 2012 compared to fiscal 2011.
Income Taxes
Fiscal Year 2013 as compared to Fiscal Year 2012
The effective tax rate was approximately
26.4 percent
for fiscal 2013 as compared to
26.7 percent
for fiscal 2012. To understand the overall effective rate for each year, it is important to recognize the effect of specific items as they compare to the level of income before taxes in each year. Income tax expense increased to
$8.2 million
in fiscal 2013 as compared to
$3.1 million
in fiscal 2012. The increase was attributable primarily to the increase in income before income taxes. In comparing fiscal 2013 to fiscal 2012, the changes in the effective tax rate were primarily due to the net impact of the following items:
|
•
|
The reinstatement of the federal research and development tax credit which decreased the effective rate by approximately 5.8 percent as compared to 8.7 percent in fiscal year 2012. However, fiscal 2012 was limited as the credit only pertained to a portion of the year, but that amount made a greater impact on the effective rate since income before taxes were lower than in fiscal 2013.
|
|
•
|
An increase in the annual estimated effective tax rate of approximately 2.5 percentage points compared to 10.5 percentage points in fiscal 2012 as a result of the impact of non- deductible meals and entertainment costs and stock compensation expense on a higher projected income compared to similar level expenses on a lower projected income in fiscal 2012.
|
|
•
|
A decrease in the effective tax rate of approximately 1.1 percentage points due to an international tax change which did not occur in fiscal 2012.
|
|
•
|
An increase in the effective tax rate related to a reversal of valuation allowances in fiscal 2012, as it related to some foreign jurisdictions which did not occur in fiscal 2013.
|
|
•
|
Various other items which have a greater impact on the effective rate due to lower income before taxes but are not material to the results.
|
We operate within multiple taxing jurisdictions, both domestic and international, and we are subject to audits in these jurisdictions. These audits can involve complex issues, including challenges regarding the timing and amount of deductions and the allocation of income
30
amounts to various tax jurisdictions. At any one time, multiple tax years are subject to audit by various tax authorities because different taxing jurisdictions have different statutes of limitations. During the third quarter of fiscal 2013, the United States Internal Revenue Service (IRS) completed and approved the examination of our U.S. federal tax returns for fiscal years 2009 and 2010. The Chinese tax authorities recently completed an audit of our tax returns for calendar years prior to 2012 in connection with a transfer of location of our business address in China.
Fiscal Year 2012 as compared to Fiscal Year 2011
The effective tax rate was approximately 26.7 percent for fiscal 2012 as compared to 35.7 percent for fiscal 2011. Income tax expense decreased to $3.1 million in fiscal 2012 as compared to $7.9 million in fiscal 2011. The decrease was attributable primarily to the decrease in income before income taxes and a decrease in the effective income tax rate. In comparing fiscal 2012 to fiscal 2011, changes in the effective tax rate were due to the net impact of the following items:
|
•
|
A decrease in the effective tax rate of approximately five percentage points as a result of the deductibility of dividends paid into our 401(k) plan in fiscal 2012 which were not deductible in fiscal 2011 due to a change in plan design.
|
|
•
|
An increase in the effective tax rate of approximately three percentage points as a result of the lower level of deduction for domestic production activities which result from the lower level of income before taxes.
|
|
•
|
A decrease in the effective rate of approximately three percentage points as a result of the impact of the research and development tax credit compared to income before taxes.
|
|
•
|
An increase in the liability for foreign income taxable in the United States under subpart F of the Internal Revenue Code of 1986, which increased the effective tax rate by 2.6 percentage points.
|
|
•
|
A decrease in the effective tax rate of approximately two percentage points as a result of the impact on the deferred tax expense in a foreign jurisdiction as a result of the expiration of the termination of a tax holiday.
|
|
•
|
Various other items which have a greater impact on the effective rate due to lower income before taxes but are not material to the results.
|
Fiscal Year 2013 Fourth Quarter Summary
During the fourth quarter of
fiscal 2013
, net sales increased approximately
11 percent
to
$124.5 million
as compared to
$112.0 million
in the fourth quarter of
fiscal 2012
. Net sales increased in all business units except for Live Events. The increase in net sales for the International business unit was due to net sales realized on large projects including an architectural lighting project and a video display project for a horse race track, and on deliveries of other orders booked prior to the quarter. Commercial business unit net sales increased due to the net sales realization on large video projects offset by decreases in net sales for our billboard niche which was caused by variability in timing of orders being booked and softening of demand. Transportation business unit net sales increased due to the continued net sales realization of a project for a major airport. Schools and Theatres business unit net sales increased due the increased delivery on video projects for high schools, for which our customers have shown strong demand for.
Gross margin percentage increased to approximately
23 percent
in the fourth quarter of
fiscal 2013
from approximately
22 percent
in the fourth quarter of
fiscal 2012
. The increase in gross profit percentage was the net result of:
|
•
|
Unexpected warranty charges during the fourth quarter of fiscal 2013, accounting for an approximately three percentage points decline.
|
|
•
|
Several large projects generating revenue having lower than typical margins due to the competitive pricing on projects, primarily in the Live Events business unit.
|
|
•
|
Improved gross margins in our Schools & Theatres business unit because of sales mix and a decline in warranty charges.
|
|
•
|
Improvements in the overall cost and resource management in manufacturing infrastructure.
|
Selling expenses decreased from
$13.8 million
to
$13.2 million
in the fourth quarter of
fiscal 2013
compared to the fourth quarter of
fiscal 2012
. The decrease was the net result of:
|
•
|
A decrease of approximately $0.4 million in third-party commissions primarily in the International business unit. We use third parties in various locations around the world to expand market opportunities, and these types of expense occur only if the third party is successful in procuring sales.
|
|
•
|
A reduction of approximately $0.4 million in payroll costs, including taxes and benefits, and travel and entertainment expenses as explained previously.
|
|
•
|
An increase in bad debt expense of $0.5 million in the International business unit as explained previously.
|
|
•
|
Net decreases in various other expenses.
|
General and administrative costs rose by approximately
three percent
in the fourth quarter of
fiscal 2013
to
$7.3 million
as compared to
$7.0 million
in the fourth quarter of
fiscal 2012
. The increase was the net result of:
31
|
•
|
An increase of approximately $0.2 million in payroll costs, including taxes and benefits as explained previously.
|
|
•
|
An increase of approximately $0.1 million in professional fees to support international acquisition and international information technology projects.
|
Product development costs decreased by approximately
12 percent
in the fourth quarter of
fiscal 2013
to
$5.7 million
as compared to
$6.5 million
in the fourth quarter of
fiscal 2012
. The decrease was the result of:
|
•
|
Reduced overall engineering costs of approximately $0.2 million, which are partially applied to product development.
|
|
•
|
Reduced usage of material to produce prototypes or test materials of $0.2 million.
|
|
•
|
The non-recurrence of capital asset impairments relating to design. During the fourth quarter of fiscal 2012, various impairments of capital assets of approximately $0.3 million were recorded related to the redesign of our outdoor surface mount product platform video display modules.
|
The effective tax benefit was
22.9 percent
in the fourth quarter of
fiscal 2013
compared to a benefit of
77.0 percent
in the fourth quarter of
fiscal 2012
. The decrease was primarily related to one-time adjustments booked in fiscal 2012 that were not repeated during the fourth quarter of fiscal 2013, including the recognition of various tax benefits in foreign jurisdictions, the reversal of a valuation allowance relating to net operating losses in a foreign jurisdiction, and an adjustment of state income tax estimates related to fiscal 2011. The effective tax benefit for the fourth quarter of fiscal 2013 was the result of an increase in the domestic production activities deduction estimate and other one-time adjustments in fiscal 2013.
LIQUIDITY AND CAPITAL RESOURCES
|
|
Year Ended
|
|||||||||
|
|
April 27,
2013 |
April 28,
2012 |
Percent Change
|
|||||||
|
(in thousands)
|
||||||||||
|
Net cash provided by (used in):
|
|
|
|
|||||||
|
Operating activities
|
$
|
50,749
|
|
$
|
20,038
|
|
153.3
|
%
|
||
|
Investing activities
|
(8,531
|
)
|
(18,753
|
)
|
(54.5
|
)
|
||||
|
Financing activities
|
(31,002
|
)
|
(26,284
|
)
|
18.0
|
|
||||
|
Effect of exchange rate changes on cash
|
(11
|
)
|
114
|
|
(109.6
|
)
|
||||
|
Net increase (decrease) in cash and cash equivalents
|
$
|
11,205
|
|
$
|
(24,885
|
)
|
145.0
|
%
|
||
Cash flows from operating activities:
The increase in cash from operating activities for fiscal
2013
as compared to fiscal
2012
was the net result of an increase in net income of $14.3 million plus $22.2 million from a reduction of changes in net operating assets and liabilities, adjusted by depreciation and amortization of $1.9 million and by deferred income taxes of $4.3 million.
The most significant drivers of the change in net operating assets and liabilities were the net result of the following:
|
•
|
A decrease in cash resulting from an increase in costs and earnings in excess of billings of $16.3 million. Variability in costs and earnings in excess of billings relates to the timing of billings on construction-type contracts and revenue recognition, which can vary significantly depending on contractual payment terms and build and installation schedules. As of April 27, 2013, $11.7 million of the increase related to four different transportation projects; timing difference mainly relates to timing of shipment and billings per progress payment schedule. The majority of these unbilled amounts is expected to be billed during the first quarter of fiscal 2014.
|
|
•
|
An increase of accounts payable and accrued liabilities of $7.7 million was the result of a $1.2 million increase in payables related to a change in extended payments terms with one large supplier, a $3.0 million increase in payables and accruals related to four large projects in process at year end, and a $1.7 million increase in accrued items related to various marketing agreements on large projects and increases in various payroll related accruals.
|
|
•
|
A net increase in cash of $7.0 million from an increase in income tax payables and a reduction of income tax receivables due to a significant improvement in net income in fiscal 2013 compared to fiscal 2012.
|
|
•
|
A decline in inventories, which increased cash from operations by $6.7 million. Days inventory outstanding decreased from 53 days as of April 28, 2012 to 46 days as of April 27, 2013. Changes in inventory are primarily the result of using inventory in production specified for a significant transportation project and inventory management initiatives.
|
|
•
|
A reduction of $5.7 million in accounts receivable and long-term receivables primarily due to the collection of two significant progress payments totaling $4.2 million that were outstanding at the end of fiscal 2012 and the annual collection of long-term receivables.
|
|
•
|
A net change in various other operating assets and liabilities, which increased cash from operations by $2.4 million.
|
32
Overall, changes in operating assets and liabilities can be impacted by the timing of cash flows on large projects, which can cause significant fluctuations in the short term in inventory, accounts receivables, accounts payable, customer deposits, costs and earnings in excess of billings and various other operating assets and liabilities.
Cash flows from investing activities:
The decrease in cash used in investing activities for fiscal
2013
as compared to fiscal
2012
was the net result of the following:
|
•
|
An increase in the net cash invested in marketable securities, net of maturities. Our investment approach has remained consistent year over year as we try to maintain a consistent level of marketable securities and, therefore, the change was the result of the timing of investment decisions and investments of excess cash in marketable securities.
|
|
•
|
A decrease in purchases of property and equipment of
$6.9 million
. The decrease relates primarily to the timing of projects anticipated, but not completed during fiscal 2013 for the expansion of our surface mount production line. We anticipate capital expenditures to be approximately $16 million in fiscal 2014.
|
During fiscal 2013, we invested $4.5 million in manufacturing equipment, $2.3 million in product demonstration equipment, $2.0 million in information systems infrastructure, including software, and $1.6 million in other assets. These investments were generally for maintenance in the case of information systems and in manufacturing investments related to a new product line for our outdoor surface mount displays and various other equipment. As of the end of fiscal 2013, capital expenditures were approximately two percent of net sales.
Cash flows from financing activities:
The increase in cash used in financing activities for fiscal
2013
as compared to fiscal
2012
was the result of a $4.9 million increase in dividends paid to shareholders as explained elsewhere in this Report, which was partially offset by the net change in repayments of our short-term debt obligations and proceeds from the exercise of stock options.
Other Liquidity and Capital Resource Discussion:
Included in receivables and costs in excess of billings as of
April 27, 2013
was approximately
$5.7 million
of retainage on long-term contracts, all of which is expected to be collected within one year.
Working capital was
$125.5 million
at
April 27, 2013
and
$119.8 million
at
April 28, 2012
. The increase in working capital was primarily the result of higher sales and the net changes between accounts receivable, inventories and cost and estimated earnings in excess of billings. We have historically financed working capital needs through a combination of cash flow from operations and borrowings under bank credit agreements.
We have used and expect to continue to use cash reserves and, to a lesser extent, bank borrowings to meet our short-term working capital requirements. On large product orders, the time between order acceptance and project completion may extend up to and exceed 24 months depending on the amount of custom work and a customer’s delivery needs. We often receive down payments or progress payments on these product orders. To the extent these payments are not sufficient to fund the costs and other expenses associated with these orders, we use working capital and bank borrowings to finance these cash requirements.
We have a credit agreement with a U.S. bank providing for a $35.0 million line of credit and includes up to $15.0 million for standby letters of credit. The line of credit is due on November 15, 2013. The interest rate ranges from LIBOR plus 125 basis points to LIBOR plus 175 basis points depending on the ratio of our interest-bearing debt to EBITDA. EBITDA is defined as net income before income taxes, interest expense, depreciation and amortization. The effective interest rate was 1.5 percent at
April 27, 2013
. We are assessed a loan fee equal to 0.125 percent per annum of any non-used portion of the loan. As of
April 27, 2013
, there were no advances under the line of credit.
The credit agreement is unsecured and requires us to be in compliance with the following financial ratios:
|
•
|
A minimum fixed charge coverage ratio of at least 2 to 1 at the end of any fiscal year. The ratio is equal to (a) EBITDA less dividends, a capital expenditure reserve of $6 million, and income tax expense, over (b) all principal and interest payments with respect to debt, excluding debt outstanding on the line of credit; and
|
|
•
|
A ratio of interest-bearing debt, excluding any marketing obligations, to EBITDA of less than 1 to 1 at the end of any fiscal quarter.
|
We have an additional credit agreement with another U.S. bank which expires on November 15, 2013 and is intended to support our credit needs outside of the United States. The facility provides for a $35.0 million line of credit and includes facilities for letters of credit and bank guarantees and to secure foreign loans for our international subsidiaries. The U.S. credit agreement is unsecured and is cross collateralized with the $35.0 million line of credit described above. It contains the same covenants as the credit agreement above. As of
April 27, 2013
, there were no advances under the line of credit.
33
We were in compliance with all applicable covenants as of
April 27, 2013
and
April 28, 2012
. The minimum fixed charge coverage ratio as of
April 27, 2013
was 64-to-1, and the ratio of interest-bearing debt to EBITDA as of
April 27, 2013
was 0.01-to-1.
On May 23, 2013, our Board of Directors declared a semi-annual dividend of $0.12 per share on our common stock for the fiscal year ended
April 27, 2013
, payable on June 14, 2013. Although we expect to continue to pay dividends for the foreseeable future, any and all subsequent dividends will be reviewed regularly and declared by the Board at its discretion.
We are sometimes required to obtain performance bonds for display installations, and we have a bonding line available through a surety company that provides for an aggregate of $100.0 million in bonded work outstanding. At
April 27, 2013
, we had
$13.3 million
of bonded work outstanding against this line.
We believe if our growth extends beyond current expectations, or if we make any strategic investments, we may need to increase our credit facilities or seek other means of financing. We anticipate we will be able to obtain any needed funds under commercially reasonable terms from our current lenders or other sources. We believe our working capital available from all sources will be adequate to meet the cash requirements of our operations in the foreseeable future.
OFF-BALANCE-SHEET ARRANGEMENTS AND CONTRACTUAL OBLIGATIONS
We enter into various lease, purchase and marketing obligations that require payments in future periods. Operating lease obligations relate primarily to leased manufacturing space, office space, furniture, and vehicles. Long-term marketing obligations relate to amounts due in future periods for payments on net sales where we sold and installed our equipment in exchange for future advertising revenue. When certain advertising revenue thresholds are met, all or a portion of excess cash is owed back to the customer. Conditional and unconditional purchase obligations represent future payments for inventory, advertising rights and various other products and services purchase commitments.
We have entered into standby letters of credit and surety bonds with financial institutions relating to the guarantee of future performance on contracts, primarily construction type contracts. Performance guarantees are issued to certain customers to guarantee the operation and installation of the equipment and our ability to complete a contract. These performance guarantees have various terms, which are generally less than one year.
Guarantees include transactions in connection with the sale of equipment to various customers. Under these transactions, we entered into a contractual arrangement whereby we agreed to repurchase equipment at the end of the lease term at a fixed price of approximately
$1.3 million
. We have recognized a guarantee in the amount of
$0.2 million
under the provisions of ASC 460,
Guarantees.
As of
April 27, 2013
, our contractual obligations were as follows (in thousands):
|
Contractual Obligations
|
Total
|
Less than 1 year
|
1-3 Years
|
4-5 Years
|
After 5 Years
|
|||||||||||||||
|
Cash commitments:
|
|
|
|
|
|
|||||||||||||||
|
Long-term marketing obligations and accrued interest
|
$
|
738
|
|
$
|
393
|
|
$
|
338
|
|
$
|
7
|
|
$
|
—
|
|
|||||
|
Operating leases
|
7,914
|
|
2,797
|
|
3,929
|
|
1,159
|
|
29
|
|
||||||||||
|
Unconditional purchase obligations
|
1,242
|
|
981
|
|
261
|
|
—
|
|
—
|
|
||||||||||
|
Conditional purchase obligations
|
1,000
|
|
200
|
|
400
|
|
400
|
|
—
|
|
||||||||||
|
Unrecognized tax benefits
(1)
|
379
|
|
—
|
|
—
|
|
—
|
|
—
|
|
||||||||||
|
Total
|
$
|
11,273
|
|
$
|
4,371
|
|
$
|
4,928
|
|
$
|
1,566
|
|
$
|
29
|
|
|||||
|
Other commercial commitments:
|
|
|
|
|
|
|
|
|
|
|
||||||||||
|
Standby letters of credit
|
$
|
6,169
|
|
$
|
5,579
|
|
$
|
149
|
|
$
|
441
|
|
$
|
—
|
|
|||||
|
Surety Bonds
|
$
|
13,287
|
|
$
|
5,996
|
|
$
|
7,291
|
|
$
|
—
|
|
$
|
—
|
|
|||||
|
Guarantees
|
$
|
1,285
|
|
$
|
—
|
|
$
|
1,285
|
|
$
|
—
|
|
$
|
—
|
|
|||||
|
(1)
|
Unrecognized tax benefits relate to uncertain tax positions. As we are not able to reasonably estimate the timing of the payments or the amount by which the liability will increase or decrease over time, the related balances have not been reflected in any of the columns other than the total column.
|
INFLATION
We believe inflation has not had a material effect on our operations or our financial condition, although it could in the future.
34
Foreign Currency Exchange Rates
Through
April 27, 2013
, most of our net sales were denominated in United States dollars, and our exposure to foreign currency exchange rate changes on net sales has not been significant. Net sales originating from manufacturing plants and sales offices outside the United States were approximately
17 percent
of total net sales, of which a portion was denominated in Canadian dollars, Euros, Chinese renminbi, British pounds, Australian dollars, Brazilian reais or other currencies. We manufacture our products in the United States and China. Our results of operations could be affected by factors such as changes in foreign currency rates or weak economic conditions in foreign markets. If we believed currency risk in any foreign location was significant, we would utilize foreign exchange hedging contracts to manage our exposure to the currency fluctuations.
Over the long-term, net sales to international markets are expected to increase as a percentage of net sales and, consequently, a greater portion of this business could be denominated in foreign currencies. In addition, we may fund our foreign subsidiaries’ operating cash needs in the form of loans denominated in U.S. dollars. As a result, operating results may become subject to fluctuations based upon changes in the exchange rates of certain currencies in relation to the United States dollar. To the extent we engage in international sales denominated in U.S. dollars, an increase in the value of the U.S. dollar relative to foreign currencies could make our products less competitive in international markets. This effect is also impacted by the sources of raw materials from international sources. Our foreign currency risk is mitigated since the majority of our foreign operations’ net sales and the related expense transactions are denominated in the same currency so therefore a significant change in foreign exchange rates would likely have a very minor impact on net income. For example, if there were to be a ten percent change in value of the U.S. dollar in relation to our foreign currency exposures, we would have had an impact of $1.6 million on income before taxes. We will continue to monitor and minimize our exposure to currency fluctuations and, when appropriate, use financial hedging techniques, including foreign currency forward contracts and options, to minimize the effect of these fluctuations. However, exchange rate fluctuations as well as differing economic conditions, changes in political climates, differing tax structures and other rules and regulations could adversely affect our ability to effectively hedge exchange rate fluctuations in the future.
We have foreign currency forward agreements in place to offset changes in the value of intercompany receivables from certain foreign subsidiaries due to changes in foreign exchange rates. The notional amount of these derivatives is $6.1 million and all contracts mature within twelve months. These contracts are marked to market each balance sheet date and are not designated as hedges. See Note 14 of the Notes to our Consolidated Financial Statements included in this report for further details on our derivatives.
Interest Rate Risks
Our exposure to market rate risk for changes in interest rates relates primarily to our marketing obligations and long-term accounts receivable. As of
April 27, 2013
, our outstanding marketing obligations were
$0.7 million
, substantially all of which were in fixed rate obligations.
In connection with the sale of certain display systems, we have entered into various types of financing with customers. The aggregate amounts due from customers include an imputed interest element. The majority of these financings carry fixed rates of interest. As of
April 27, 2013
, our outstanding long-term receivables were
$16.1 million
. Each 25 basis point increase in interest rates would have an associated annual opportunity cost of
$0.1 million
.
The following table provides maturities and weighted average interest rates on our financial instruments sensitive to changes in interest rates.
|
|
Fiscal Years
(in thousands)
|
||||||||||||||||||||||
|
|
2014
|
2015
|
2016
|
2017
|
2018
|
Thereafter
|
|||||||||||||||||
|
Assets:
|
|
|
|
|
|
|
|||||||||||||||||
|
Long-term receivables, including current maturities:
|
|
|
|
|
|
|
|||||||||||||||||
|
Fixed-rate
|
$
|
4,806
|
|
$
|
3,932
|
|
$
|
2,952
|
|
$
|
1,865
|
|
$
|
1,214
|
|
$
|
1,363
|
|
|||||
|
Average interest rate
|
8.1
|
%
|
8.1
|
%
|
7.8
|
%
|
8.2
|
%
|
8.3
|
%
|
8.5
|
%
|
|||||||||||
|
Liabilities:
|
|
|
|
|
|
|
|
|
|
|
|
|
|||||||||||
|
Long-term marketing obligations, including current portion:
|
|
|
|
|
|
|
|
|
|
|
|
|
|||||||||||
|
Fixed-rate
|
$
|
393
|
|
$
|
226
|
|
$
|
112
|
|
$
|
4
|
|
$
|
3
|
|
$
|
—
|
|
|||||
|
Average interest rate
|
8.7
|
%
|
8.9
|
%
|
8.8
|
%
|
6.2
|
%
|
6.3
|
%
|
—
|
%
|
|||||||||||
35
Of our cash balances at
April 27, 2013
,
$28.3 million
were denominated in United States dollars. Cash balances in foreign currencies are operating balances maintained in accounts of our foreign subsidiaries. A portion of the cash held in foreign accounts is used to collateralize outstanding bank guarantees issued by the foreign subsidiaries.
36
REPORT OF INDEPENDENT REGISTERED PUBLIC ACCOUNTING FIRM
The Board of Directors and Shareholders
Daktronics, Inc.
We have audited the accompanying consolidated balance sheets of Daktronics, Inc. and subsidiaries (the Company) as of April 27, 2013 and April 28, 2012, and the related consolidated statements of operations, comprehensive income, shareholders' equity, and cash flows for each of the three years in the period ended April 27, 2013. Our audits also included the financial statement schedule listed in the index at Item 15(a)(2). These financial statements and schedule are the responsibility of the Company's management. Our responsibility is to express an opinion on these financial statements and schedule based on our audits.
We conducted our audits in accordance with the standards of the Public Company Accounting Oversight Board (United States). Those standards require that we plan and perform the audit to obtain reasonable assurance about whether the financial statements are free of material misstatement. An audit includes examining, on a test basis, evidence supporting the amounts and disclosures in the financial statements. An audit also includes assessing the accounting principles used and significant estimates made by management, as well as evaluating the overall financial statement presentation. We believe that our audits provide a reasonable basis for our opinion.
In our opinion, the financial statements referred to above present fairly, in all material respects, the consolidated financial position of the Company at April 27, 2013 and April 28, 2012, and the consolidated results of its operations and its cash flows for each of the three years in the period ended April 27, 2013, in conformity with U.S. generally accepted accounting principles. Also, in our opinion, the related financial statement schedule referred to above, when considered in relation to the consolidated financial statements taken as a whole, presents fairly in all material respects, the information set forth therein.
We also have audited, in accordance with the standards of the Public Company Accounting Oversight Board (United States), the Company's internal control over financial reporting as of April 27, 2013, based on criteria established in
Internal Control-Integrated Framework
issued by the Committee of Sponsoring Organizations of the Treadway Commission and our report dated June 12, 2013 expressed an unqualified opinion thereon.
/s/ Ernst & Young LLP
Minneapolis, Minnesota
June 12, 2013
37
|
DAKTRONICS, INC. AND SUBSIDIARIES
CONSOLIDATED BALANCE SHEETS
(in thousands, except per share data)
|
||||||||
|
April 27,
2013 |
April 28,
2012 |
|||||||
|
ASSETS
|
|
|||||||
|
CURRENT ASSETS:
|
|
|
||||||
|
Cash and cash equivalents
|
$
|
40,628
|
|
$
|
29,423
|
|
||
|
Restricted cash
|
48
|
|
1,169
|
|
||||
|
Marketable securities
|
24,052
|
|
25,258
|
|
||||
|
Accounts receivable, net
|
63,227
|
|
66,923
|
|
||||
|
Inventories, net
|
49,045
|
|
54,924
|
|
||||
|
Costs and estimated earnings in excess of billings
|
39,355
|
|
23,020
|
|
||||
|
Current maturities of long-term receivables
|
4,807
|
|
5,830
|
|
||||
|
Prepaid expenses and other assets
|
6,185
|
|
5,528
|
|
||||
|
Deferred income taxes
|
12,755
|
|
10,941
|
|
||||
|
Income tax receivables
|
46
|
|
5,990
|
|
||||
|
Total current assets
|
240,148
|
|
229,006
|
|
||||
|
Property and equipment, net
|
61,625
|
|
68,396
|
|
||||
|
Long-term receivables, less current maturities
|
11,325
|
|
12,622
|
|
||||
|
Goodwill
|
3,306
|
|
3,347
|
|
||||
|
Intangibles, net
|
1,181
|
|
1,409
|
|
||||
|
Advertising rights, net and other assets
|
772
|
|
1,157
|
|
||||
|
Deferred income taxes
|
1,061
|
|
30
|
|
||||
|
TOTAL ASSETS
|
$
|
319,418
|
|
$
|
315,967
|
|
||
|
LIABILITIES AND SHAREHOLDERS' EQUITY
|
|
|
|
|
||||
|
CURRENT LIABILITIES:
|
|
|
||||||
|
Notes payable, bank
|
$
|
—
|
|
$
|
1,459
|
|
||
|
Accounts payable
|
38,651
|
|
33,906
|
|
||||
|
Accrued expenses
|
24,331
|
|
22,731
|
|
||||
|
Warranty obligations
|
13,933
|
|
13,049
|
|
||||
|
Billings in excess of costs and estimated earnings
|
14,245
|
|
14,385
|
|
||||
|
Customer deposits (billed or collected)
|
12,375
|
|
12,826
|
|
||||
|
Deferred revenue (billed or collected)
|
9,112
|
|
9,751
|
|
||||
|
Current portion of other long-term obligations
|
356
|
|
359
|
|
||||
|
Income taxes payable
|
1,689
|
|
665
|
|
||||
|
Deferred income taxes
|
—
|
|
42
|
|
||||
|
Total current liabilities
|
114,692
|
|
109,173
|
|
||||
|
Long-term warranty obligations
|
11,213
|
|
9,166
|
|
||||
|
Long-term deferred revenue (billed or collected)
|
4,424
|
|
4,361
|
|
||||
|
Other long-term obligations, less current maturities
|
843
|
|
1,009
|
|
||||
|
Deferred income taxes
|
—
|
|
1,453
|
|
||||
|
Total long-term liabilities
|
16,480
|
|
15,989
|
|
||||
|
SHAREHOLDERS' EQUITY:
|
|
|
|
|
||||
|
Common stock, no par value, authorized 120,000,000 shares; 42,393,456 and 41,930,116 shares issued at April 27, 2013 and April 28, 2012, respectively
|
37,429
|
|
34,631
|
|
||||
|
Additional paid-in capital
|
27,194
|
|
24,320
|
|
||||
|
Retained earnings
|
123,750
|
|
131,830
|
|
||||
|
Treasury stock, at cost, 19,680 shares
|
(9
|
)
|
(9
|
)
|
||||
|
Accumulated other comprehensive (loss) income
|
(118
|
)
|
33
|
|
||||
|
TOTAL SHAREHOLDERS' EQUITY
|
188,246
|
|
190,805
|
|
||||
|
TOTAL LIABILITIES AND SHAREHOLDERS' EQUITY
|
$
|
319,418
|
|
$
|
315,967
|
|
||
|
See notes to consolidated financial statements.
|
|
|
|
|
||||
38
|
DAKTRONICS, INC. AND SUBSIDIARIES
(in thousands, except per share data)
|
|||||||||||
|
Year Ended
|
|||||||||||
|
April 27,
2013 |
April 28,
2012 |
April 30,
2011 |
|||||||||
|
Net sales
|
$
|
518,322
|
|
$
|
489,526
|
|
$
|
441,676
|
|
||
|
Cost of goods sold
|
384,428
|
|
376,089
|
|
330,192
|
|
|||||
|
Gross profit
|
133,894
|
|
113,437
|
|
111,484
|
|
|||||
|
Operating expenses:
|
|
|
|
|
|
|
|||||
|
Selling expense
|
52,759
|
|
52,233
|
|
49,555
|
|
|||||
|
General and administrative
|
27,404
|
|
27,422
|
|
23,453
|
|
|||||
|
Product design and development
|
23,131
|
|
23,507
|
|
18,949
|
|
|||||
|
|
103,294
|
|
103,162
|
|
91,957
|
|
|||||
|
Operating income
|
30,600
|
|
10,275
|
|
19,527
|
|
|||||
|
Nonoperating income (expense):
|
|
|
|
|
|
|
|||||
|
Interest income
|
1,523
|
|
1,747
|
|
1,921
|
|
|||||
|
Interest expense
|
(355
|
)
|
(335
|
)
|
(184
|
)
|
|||||
|
Other (expense) income, net
|
(839
|
)
|
(110
|
)
|
877
|
|
|||||
|
Income before income taxes
|
30,929
|
|
11,577
|
|
22,141
|
|
|||||
|
Income tax expense
|
8,150
|
|
3,088
|
|
7,897
|
|
|||||
|
Net income
|
$
|
22,779
|
|
$
|
8,489
|
|
$
|
14,244
|
|
||
|
Weighted average shares outstanding:
|
|
|
|
|
|
|
|||||
|
Basic
|
42,280
|
|
41,869
|
|
41,422
|
|
|||||
|
Diluted
|
42,621
|
|
42,304
|
|
42,277
|
|
|||||
|
Earnings per share:
|
|
|
|
|
|
|
|||||
|
Basic
|
$
|
0.54
|
|
$
|
0.20
|
|
$
|
0.34
|
|
||
|
Diluted
|
$
|
0.53
|
|
$
|
0.20
|
|
$
|
0.34
|
|
||
|
Cash dividend declared per share
|
$
|
0.73
|
|
$
|
0.62
|
|
$
|
0.60
|
|
||
|
See notes to consolidated financial statements.
|
|
|
|
|
|||||||
39
|
DAKTRONICS, INC. AND SUBSIDIARIES
CONSOLIDATED STATEMENTS OF COMPREHENSIVE INCOME
(in thousands)
|
||||||||||||
|
Year Ended
|
||||||||||||
|
April 27,
2013 |
April 28,
2012 |
April 30,
2011 |
||||||||||
|
Net income
|
$
|
22,779
|
|
$
|
8,489
|
|
$
|
14,244
|
|
|||
|
Other comprehensive (loss) income:
|
||||||||||||
|
Cumulative translation adjustments
|
(102
|
)
|
(20
|
)
|
426
|
|
||||||
|
Unrealized (loss) gain on available-for-sale securities, net of tax
|
(49
|
)
|
52
|
|
22
|
|
||||||
|
Total other comprehensive (loss) income, net of tax
|
(151
|
)
|
32
|
|
448
|
|
||||||
|
Comprehensive income
|
$
|
22,628
|
|
$
|
8,521
|
|
$
|
14,692
|
|
|||
|
See notes to consolidated financial statements.
|
||||||||||||
40
|
DAKTRONICS, INC. AND SUBSIDIARIES
CONSOLIDATED STATEMENTS OF SHAREHOLDERS’ EQUITY
(in thousands)
|
|||||||||||||||||||||||
|
|
Common Stock
|
Additional Paid-In Capital
|
Retained Earnings
|
Treasury Stock
|
Accumulated Other Comprehensive Income (Loss)
|
Total
|
|||||||||||||||||
|
Balance as of May 1, 2010:
|
$
|
29,936
|
|
$
|
17,731
|
|
$
|
159,842
|
|
$
|
(9
|
)
|
$
|
(447
|
)
|
$
|
207,053
|
|
|||||
|
Net income
|
—
|
|
—
|
|
14,244
|
|
—
|
|
—
|
|
14,244
|
|
|||||||||||
|
Other comprehensive income
|
—
|
|
—
|
|
—
|
|
—
|
|
448
|
|
448
|
|
|||||||||||
|
Net tax benefit (deduction) related to share-based compensation
|
—
|
|
121
|
|
—
|
|
—
|
|
—
|
|
121
|
|
|||||||||||
|
Share-based compensation
|
—
|
|
3,370
|
|
—
|
|
—
|
|
—
|
|
3,370
|
|
|||||||||||
|
Exercise of stock options
|
1,352
|
|
(73
|
)
|
—
|
|
—
|
|
—
|
|
1,279
|
|
|||||||||||
|
Employee savings plan activity
|
1,382
|
|
—
|
|
—
|
|
—
|
|
—
|
|
1,382
|
|
|||||||||||
|
Dividends paid
|
—
|
|
—
|
|
(24,795
|
)
|
—
|
|
—
|
|
(24,795
|
)
|
|||||||||||
|
Balance as of April 30, 2011:
|
32,670
|
|
21,149
|
|
149,291
|
|
(9
|
)
|
1
|
|
203,102
|
|
|||||||||||
|
Net income
|
—
|
|
—
|
|
8,489
|
|
—
|
|
—
|
|
8,489
|
|
|||||||||||
|
Other comprehensive income
|
—
|
|
—
|
|
—
|
|
—
|
|
32
|
|
32
|
|
|||||||||||
|
Net tax benefit (deduction) related to share-based compensation
|
—
|
|
(2
|
)
|
—
|
|
—
|
|
—
|
|
(2
|
)
|
|||||||||||
|
Share-based compensation
|
—
|
|
3,262
|
|
—
|
|
—
|
|
—
|
|
3,262
|
|
|||||||||||
|
Exercise of stock options
|
547
|
|
(89
|
)
|
—
|
|
—
|
|
—
|
|
458
|
|
|||||||||||
|
Employee savings plan activity
|
1,414
|
|
—
|
|
—
|
|
—
|
|
—
|
|
1,414
|
|
|||||||||||
|
Dividends paid
|
—
|
|
—
|
|
(25,950
|
)
|
—
|
|
—
|
|
(25,950
|
)
|
|||||||||||
|
Balance as of April 28, 2012:
|
34,631
|
|
24,320
|
|
131,830
|
|
(9
|
)
|
33
|
|
190,805
|
|
|||||||||||
|
Net income
|
—
|
|
—
|
|
22,779
|
|
—
|
|
—
|
|
22,779
|
|
|||||||||||
|
Other comprehensive loss
|
—
|
|
—
|
|
—
|
|
—
|
|
(151
|
)
|
(151
|
)
|
|||||||||||
|
Net tax benefit (deduction) related to share-based compensation
|
—
|
|
—
|
|
—
|
|
—
|
|
—
|
|
—
|
|
|||||||||||
|
Share-based compensation
|
—
|
|
3,037
|
|
—
|
|
—
|
|
—
|
|
3,037
|
|
|||||||||||
|
Exercise of stock options
|
1,316
|
|
(163
|
)
|
—
|
|
—
|
|
—
|
|
1,153
|
|
|||||||||||
|
Employee savings plan activity
|
1,482
|
|
—
|
|
—
|
|
—
|
|
—
|
|
1,482
|
|
|||||||||||
|
Dividends paid
|
—
|
|
—
|
|
(30,859
|
)
|
—
|
|
—
|
|
(30,859
|
)
|
|||||||||||
|
Balance as of April 27, 2013:
|
$
|
37,429
|
|
$
|
27,194
|
|
$
|
123,750
|
|
$
|
(9
|
)
|
$
|
(118
|
)
|
$
|
188,246
|
|
|||||
|
See notes to consolidated financial statements
|
|
|
|
|
|
|
|
|
|
|
|||||||||||||
41
|
DAKTRONICS, INC. AND SUBSIDIARIES
(in thousands)
|
|||||||||||
|
|
Year Ended
|
||||||||||
|
April 27,
2013 |
April 28,
2012 |
April 30,
2011 |
|||||||||
|
CASH FLOWS FROM OPERATING ACTIVITIES:
|
|
|
|||||||||
|
Net income
|
$
|
22,779
|
|
$
|
8,489
|
|
$
|
14,244
|
|
||
|
Adjustments to reconcile net income to net cash provided by operating activities:
|
|
|
|
|
|||||||
|
Depreciation
|
15,379
|
|
17,273
|
|
19,354
|
|
|||||
|
Amortization
|
228
|
|
245
|
|
287
|
|
|||||
|
Amortization of premium/discount on marketable securities
|
190
|
|
183
|
|
48
|
|
|||||
|
Loss (gain) on sale of property and equipment
|
42
|
|
(16
|
)
|
(62
|
)
|
|||||
|
Share-based compensation
|
3,037
|
|
3,262
|
|
3,370
|
|
|||||
|
Excess tax benefits from share-based compensation
|
—
|
|
(48
|
)
|
(121
|
)
|
|||||
|
Equity in losses of affiliates
|
—
|
|
—
|
|
36
|
|
|||||
|
Provision for doubtful accounts
|
331
|
|
(150
|
)
|
(37
|
)
|
|||||
|
Deferred income taxes, net
|
(4,340
|
)
|
(68
|
)
|
852
|
|
|||||
|
Change in operating assets and liabilities
|
13,103
|
|
(9,132
|
)
|
3,375
|
|
|||||
|
Net cash provided by operating activities
|
50,749
|
|
20,038
|
|
41,346
|
|
|||||
|
CASH FLOWS FROM INVESTING ACTIVITIES:
|
|
|
|
|
|||||||
|
Purchases of property and equipment
|
(9,674
|
)
|
(16,524
|
)
|
(9,386
|
)
|
|||||
|
Proceeds from sales of property and equipment
|
198
|
|
231
|
|
238
|
|
|||||
|
Purchases of marketable securities
|
(16,506
|
)
|
(18,870
|
)
|
(23,035
|
)
|
|||||
|
Proceeds from sales or maturities of marketable securities
|
17,451
|
|
16,410
|
|
—
|
|
|||||
|
Insurance recoveries on property and equipment
|
—
|
|
—
|
|
187
|
|
|||||
|
Other investing activities, net
|
—
|
|
—
|
|
2,110
|
|
|||||
|
Net cash used in investing activities
|
(8,531
|
)
|
(18,753
|
)
|
(29,886
|
)
|
|||||
|
CASH FLOWS FROM FINANCING ACTIVITIES:
|
|
|
|
|
|||||||
|
Borrowings on notes payable
|
—
|
|
782
|
|
2,316
|
|
|||||
|
Payments on notes payable
|
(1,459
|
)
|
(1,711
|
)
|
—
|
|
|||||
|
Proceeds from exercise of stock options
|
1,316
|
|
547
|
|
1,352
|
|
|||||
|
Excess tax benefits from share-based compensation
|
—
|
|
48
|
|
121
|
|
|||||
|
Principal payments on long-term obligations
|
—
|
|
—
|
|
(26
|
)
|
|||||
|
Dividends paid
|
(30,859
|
)
|
(25,950
|
)
|
(24,795
|
)
|
|||||
|
Net cash used in financing activities
|
(31,002
|
)
|
(26,284
|
)
|
(21,032
|
)
|
|||||
|
EFFECT OF EXCHANGE RATE CHANGES ON CASH
|
(11
|
)
|
114
|
|
277
|
|
|||||
|
NET INCREASE (DECREASE) IN CASH AND CASH EQUIVALENTS
|
11,205
|
|
(24,885
|
)
|
(9,295
|
)
|
|||||
|
CASH AND CASH EQUIVALENTS:
|
|
|
|
|
|||||||
|
Beginning of period
|
29,423
|
|
54,308
|
|
63,603
|
|
|||||
|
End of period
|
$
|
40,628
|
|
$
|
29,423
|
|
$
|
54,308
|
|
||
|
See notes to consolidated financial statements.
|
|
|
|
|
|||||||
42
NOTES TO THE CONSOLIDATED FINANCIAL STATEMENTS
(in thousands, except per share data)
Nature of business
: Daktronics, Inc. and its subsidiaries are engaged principally in the design, manufacture and sale of a wide range of electronic display systems and related products which are sold in a variety of markets throughout the world and the rendering of related maintenance and professional services. Our products are designed primarily to inform and entertain people through the communication of content.
Fiscal year
: We operate on a 52 to 53 week fiscal year, with our fiscal year ending on the Saturday closest to April 30 of each year. When April 30 falls on a Wednesday, the fiscal year ends on the preceding Saturday. The fiscal years ended
April 27, 2013
,
April 28, 2012
and
April 30, 2011
each consisted of 52 weeks. Within each fiscal year, each quarter is comprised of 13 week periods following the beginning of each fiscal year. In each 53 week year, each of the last three quarters is comprised of a 13 week period, and an additional week is added to the first quarter of that fiscal year.
Principles of consolidation
: The consolidated financial statements include our accounts and the accounts of our wholly-owned subsidiaries – Daktronics France SARL; Daktronics Shanghai, Ltd.; Daktronics GmbH; Daktronics UK, Ltd.; Daktronics HK Limited; Daktronics International Limited; Daktronics Canada, Inc.; Daktronics Beijing, Ltd.; Daktronics Australia Pty Ltd.; Daktronics Installation; Daktronics Japan, Inc.; Daktronics Brazil, Ltda.; Daktronics Singapore Pte. Ltd., and Daktronics Spain S.L. Intercompany balances and transactions have been eliminated in consolidation.
Investments in affiliates over which we have significant influence are accounted for by the equity method. As of
April 27, 2013
and
April 28, 2012
, we did not have any investments accounted for by the equity method. Prior to April 30, 2011, as explained in Note 16, we had various investments accounted for under the equity method. Investments in affiliates as to which we do not have the ability to exert significant influence over their operating and financing activities are accounted for under the cost method of accounting. We have evaluated our relationships with affiliates and have determined that these entities are either not variable interest entities or, in the case of variable interest entities, we are not the primary beneficiary and therefore they are not required to be consolidated in our consolidated financial statements. The equity method requires us to report our share of losses up to our equity investment amount, including any financial support made or committed to. At such time the equity investment is reduced to zero, we recognize losses to the extent of and as an adjustment to the other investments in the affiliate in order of seniority or priority in liquidation. Our proportional share of the respective affiliates' earnings or losses is included in other (expense) income in our consolidated statements of operations.
As of May 1, 2010, we had a variable interest in Outcast Media International, Inc. (“Outcast”). During fiscal 2011, it became a cost method investee and ceased being treated as a variable interest entity. This occurred as a result of a reorganization of Outcast in connection with a sale of most of its assets. The results of the variable interest analysis we completed prior to fiscal 2011 indicated that we were not the primary beneficiary of this variable interest entity and, as a result, we were not required to consolidate it. Our analysis included reviewing the amount of financial support, equity risk, and board influence. As of
April 27, 2013
, our interest in Outcast consisted of a
seven
percent equity interest. During fiscal 2010, we had written down our equity investment to
zero
. During fiscal 2011, as described in Note 16, we exchanged certain debt and other obligations related to Outcast for a note from a third party related to Outcast.
The aggregate amount of investments accounted for under the cost method was
$106
at
April 27, 2013
and
April 28, 2012
. The fair value of these investments has not been estimated, as there have not been any identified events or changes in circumstances that may have a significant adverse effect on their fair value, and it is not practical to estimate their fair value.
Use of estimates
: The preparation of financial statements in conformity with accounting principles generally accepted in the United States requires us to make estimates and assumptions that affect the reported amounts of assets and liabilities and the disclosure of contingent assets and liabilities at the date of the financial statements and the reported amounts of revenues and expenses during the reporting period. Actual results could differ significantly from those estimates. Material estimates that are particularly susceptible to significant change in the near-term relate to the determination of the estimated total costs on construction-type contracts, estimated costs to be incurred for product warranties, excess and obsolete inventory, the reserve for doubtful accounts, share-based compensation, goodwill impairment and income taxes. Changes in estimates are reflected in the periods in which they become known.
Cash and cash equivalents
: All highly liquid investments with maturities of three months or less at the date of purchase are considered to be cash equivalents and consist primarily of government repurchase agreements, savings accounts and money market accounts that are carried at cost, which approximates fair value. We maintain our cash in bank deposit accounts, the balances of which at times may exceed federally insured limits. We have not experienced any losses in such accounts.
Restricted cash
: Restricted cash consists of deposits to secure bank guarantees issued by our foreign subsidiaries.
43
Inventories:
Inventories are stated at the lower of cost (first-in, first-out method) or market. Market is determined on the basis of estimated net realizable values.
Revenue recognition
: Net sales are reported net of estimated sales returns and exclude sales taxes. We estimate our sales returns reserve based on historical return rates and analysis of specific accounts. Our sales returns reserve was
$73
and
$63
at
April 27, 2013
and
April 28, 2012
, respectively.
Long-term construction-type contracts:
Earnings on construction-type contracts are recognized on the percentage-of-completion method, measured by the percentage of costs incurred to date to estimated total costs for each contract. Contract costs include all direct material and labor costs and those indirect costs related to contract performance. Indirect costs include charges for such items as facilities, engineering, and project management. Provisions for estimated losses on uncompleted contracts are made in the period in which such losses are probable and capable of being estimated. We combine contracts for accounting purposes when they are negotiated as a package with an overall profit margin objective, essentially represent an agreement to do a single project for a customer, involve interrelated construction activities, and are performed concurrently or sequentially. When a group of contracts is combined, revenue and profit are recognized uniformly over the performance of the combined projects. We segment revenues in accordance with contract segmenting criteria in Accounting Standards Codification (“ASC”) 650-35,
Construction-Type and Production-Type Contracts.
Equipment other than construction-type contracts:
We recognize revenue on equipment sales, other than construction-type contracts, when title passes, which is usually upon shipment and then only if the terms of the arrangement are fixed and determinable and collectability is reasonably assured. We record estimated sales returns and discounts as a reduction of net sales in the same period revenue is recognized.
Product maintenance:
In connection with the sale of our products, we also occasionally sell separately priced extended warranties and product maintenance contracts. The revenue related to such contracts is deferred and recognized ratably as net sales over the terms of the contracts, which vary up to
10
years. We record unrealized revenue in deferred revenue (billed or collected) in the liability section of the balance sheet. Deferred revenue (billed or collected) excludes unrealized revenue from contractual obligations to be billed by us in future periods.
Services:
Revenues generated by us for services, such as event support, control room design, on-site training, equipment service and technical support of our equipment, are recognized as net sales when the services are performed. Net sales from services and product maintenance approximated
9.0 percent
,
9.0 percent
and
9.4 percent
of net sales for the fiscal years ended
April 27, 2013
,
April 28, 2012
and
April 30, 2011
, respectively.
Multiple-element arrangements:
We generate revenue from the sale of equipment and related services, including customization, installation and maintenance services. In these limited cases, we provide some or all of such equipment and services to our customers under the terms of a single multiple-element sales arrangement. These arrangements typically involve the sale of equipment bundled with some or all of these services, but they may also involve instances in which we have contracted to deliver multiple pieces of equipment over time rather than at a single point in time.
When a sales arrangement involves multiple elements, the items included in the arrangement (deliverables) are evaluated pursuant to ASC 605-25,
Revenue Arrangements with Multiple Deliverables
and ASC 605-35
,
to determine whether they represent separate units of accounting. We perform this evaluation at the inception of an arrangement and as we deliver each item in the arrangement. We first consider the separation criteria of ASC 605-35. Deliverables not within the scope of ASC 605-35 are evaluated for separation under ASC 605-25. For those elements falling under the guidance of ASC 605-25, we generally account for a deliverable (or a group of deliverables) separately if the delivered item(s) has standalone value to the customer and if we have given the customer a general right of return relative to the delivered item(s) and delivery or performance of the undelivered item(s) or service(s) is probable and substantially in our control.
When items included in a multiple-element arrangement represent separate units of accounting, we allocate the arrangement consideration to the individual items based on their relative fair values. The amount of arrangement consideration allocated to the delivered item(s) is limited to the amount not contingent on us delivering additional products or services. Once we have determined the amount, if any, of arrangement consideration allocable to the delivered item(s), we apply the applicable revenue recognition policy to determine when and by which method such amount may be recognized as revenue.
We generally determine if objective and reliable evidence of fair value for the items included in a multiple-element arrangement exists based on whether we have vendor-specific objective evidence ("VSOE") of the price for which we sell an item on a standalone basis. If we do not have VSOE for the item, we will use the price charged by a competitor selling a comparable product or service on a standalone
basis to similarly situated customers, if available. If neither VSOE nor third party evidence is available, we use our best estimate of the selling price for that deliverable.
Software:
We typically sell our proprietary software bundled with our video displays and certain other products, but we also sell our software separately. Pursuant to ASC 985-605,
Software Revenue Recognition,
revenues from software license fees on sales, other than
44
construction-type contracts, are recognized when persuasive evidence of an agreement exists, delivery of the product has occurred, the fee is fixed and determinable, and collection is probable. For sales of software included in construction-type contracts, the revenue is recognized under the percentage-of-completion method starting when all of these criteria have been met.
Long-term receivables and advertising rights:
We occasionally sell and install our products at facilities in exchange for the rights to sell or to retain future advertising revenues. For these transactions, we recognize revenue for the amount of the present value of the future advertising payments if enough advertising is sold to obtain normal margins on the contract and we record the related receivable in long-term receivables. We recognize imputed interest as earned.
On those transactions where we have not sold the advertising for the full value of the equipment at normal margins, we record the related cost of equipment as advertising rights. Revenue to the extent of the present value of the advertising payments is recognized in long-term receivables when it becomes fixed and determinable under the provisions of the applicable advertising contracts. At the time the revenue is recognized, costs of the equipment are recognized based on an estimate of overall margin expected. Any remaining costs are recorded in the costs of advertising rights.
The cost of advertising rights, net of amortization, was
$53
and
$446
as of
April 27, 2013
and
April 28, 2012
, respectively.
Property and equipment
: Property and equipment is stated at cost and depreciated principally on the straight-line method over the following estimated useful lives:
|
|
Years
|
|
Buildings
|
7 - 40
|
|
Machinery and equipment
|
5 - 7
|
|
Office furniture and equipment
|
3 - 5
|
|
Computer software and hardware
|
3 - 5
|
|
Equipment held for rental
|
2 - 7
|
|
Demonstration equipment
|
3 - 5
|
|
Transportation equipment
|
5 - 7
|
Leasehold improvements are depreciated over the lesser of the useful life of the asset or the term of the lease. Our depreciation expense was
$15,379
,
$17,273
and
$19,354
for the fiscal years ended
April 27, 2013
,
April 28, 2012
and
April 30, 2011
, respectively.
Long-Lived Assets
: Long-lived assets other than goodwill and indefinite-lived intangible assets, as described in Note 4, which are separately tested for impairment, are evaluated for impairment whenever events or changes in circumstances indicate the carrying value may not be recoverable.
When evaluating long-lived assets for potential impairment, we first compare the carrying value of the asset to the asset's estimated future cash flows (undiscounted and without interest charges). If the estimated future cash flows are less than the carrying value of the asset, we calculate an impairment loss. The impairment loss calculation compares the carrying value of the asset to the asset's estimated fair value. We recognize an impairment loss if the amount of the asset's carrying value exceeds the asset's estimated fair value. If we recognize an impairment loss, the adjusted carrying amount of the asset becomes its new cost basis. For a depreciable long-lived asset, the new cost basis will be depreciated (amortized) over the remaining useful life of that asset.
Our impairment loss calculations contain uncertainties because they require management to make assumptions and to apply judgment to estimate future cash flows and asset fair values, including forecasting useful lives of the assets and selecting the discount rate that reflects the risk inherent in future cash flows.
Software costs
: We capitalize certain costs incurred in connection with developing or obtaining internal-use software. Capitalized software costs are included in property and equipment on our consolidated balance sheets. Software costs that do not meet capitalization criteria are expensed immediately.
Insurance
: We are self-insured for certain losses related to health and liability claims and workers’ compensation, although we obtain third-party insurance to limit our exposure to these claims. We estimate our self-insured liabilities using a number of factors, including historical claims experience. Our self-insurance liability was
$1,843
and
$2,075
at
April 27, 2013
and
April 28, 2012
, respectively, and is included in accrued expenses in our consolidated balance sheets.
45
Foreign currency translation
: Our foreign subsidiaries use the local currency of their respective countries as their functional currency. The assets and liabilities of foreign operations are generally translated at the exchange rates in effect at the balance sheet date. The operating results of foreign operations are translated at weighted average exchange rates. The related translation gains or losses are reported as a separate component of shareholders’ equity in accumulated other comprehensive (loss) income.
Income taxes
: We account for income taxes under ASC 740,
Income Taxes
, which requires recognition of deferred tax liabilities and assets for the expected future tax consequences of events included in our financial statements or tax returns. Under this method, deferred tax liabilities and assets are determined based on the difference between the financial statement and tax basis of assets and liabilities using enacted tax rates in effect for the year in which the differences are expected to reverse. ASC 740 requires the consideration of a valuation allowance for deferred tax assets if it is “more likely than not” some component or all of the benefits of deferred tax assets will not be realized. Tax rate changes are reflected in income during the period such changes are enacted. We have benefited from a tax holiday in China that expired in fiscal 2012. In fiscal
2012
and
2011
, we realized a benefit of approximately
$249
or
$0.006
per share and
$77
or
$0.002
per share, respectively.
Our income tax returns, like those of most companies, are periodically audited by U.S. federal, state and local and foreign tax authorities. These audits include questions regarding our tax filing positions, including the timing and amount of deductions and the allocation of income among various tax jurisdictions. At any one time, multiple tax years are subject to audit by the various tax authorities. In evaluating the tax benefits associated with our various tax filing positions, we record a tax benefit for uncertain tax positions using the highest cumulative tax benefit that is more likely than not to be realized. A number of years may elapse before a particular matter for which we have established a liability is audited and effectively settled. We adjust our liability for unrecognized tax benefits in the period in which we determine the issue is effectively settled with the tax authorities, the statute of limitations expires for the relevant taxing authority to examine the tax position, or when more information becomes available. We include our liability for unrecognized tax benefits, including accrued penalties and interest, in income taxes payable on our consolidated balance sheets and in income tax expense in our consolidated statements of operations.
Comprehensive (loss) income
: We follow the provisions of ASC 220,
Reporting Comprehensive Income
, which establishes standards for reporting and displaying comprehensive income and its components. Comprehensive (loss) income reflects the change in equity of a business enterprise during a period from transactions and other events and circumstances from non-owner sources. For us, comprehensive (loss) income represents net income (loss) adjusted for foreign currency translation adjustments and unrealized gains and losses on available-for-sale securities. The foreign currency translation adjustment included in comprehensive (loss) income has not been tax affected, as the investments in foreign affiliates are deemed to be permanent. In accordance with ASC 220 and ASU 2011-05, we disclose comprehensive (loss) income on a separate consolidated statement of comprehensive income.
Product design and development
: All expenses related to product design and development are charged to operations as incurred. Our product development activities include the enhancement of existing products and the development of new products.
Advertising costs
: We expense advertising costs as incurred. Advertising expenses were
$1,584
,
$1,843
and
$1,895
for fiscal years
2013
,
2012
and
2011
, respectively.
Shipping and handling costs
: Shipping and handling costs collected from our customers in connection with our sales are recorded as revenue. We record shipping and handling costs as a component of cost of sales at the time the product is shipped.
Earnings per share (“EPS”)
: Basic EPS is computed by dividing income attributable to common shareholders by the weighted average number of common shares outstanding for the period. Diluted EPS reflects the potential dilution which may occur if securities or other obligations to issue common stock were exercised or converted into common stock or resulted in the issuance of common stock which share in our earnings.
46
The following is a reconciliation of the income and common stock share amounts used in the calculation of basic and diluted EPS for the fiscal years ended
April 27, 2013
,
April 28, 2012
and
April 30, 2011
:
|
|
Net income
|
Shares
|
Per share income (loss)
|
|||||||
|
For the year ended April 27, 2013:
|
|
|
|
|||||||
|
Basic earnings per share
|
$
|
22,779
|
|
42,280
|
|
$
|
0.54
|
|
||
|
Dilution associated with stock compensation plans
|
—
|
|
341
|
|
(0.01
|
)
|
||||
|
Diluted earnings per share
|
$
|
22,779
|
|
42,621
|
|
$
|
0.53
|
|
||
|
For the year ended April 28, 2012:
|
|
|
|
|
|
|||||
|
Basic earnings per share
|
$
|
8,489
|
|
41,869
|
|
$
|
0.20
|
|
||
|
Dilution associated with stock compensation plans
|
—
|
|
435
|
|
—
|
|
||||
|
Diluted earnings per share
|
$
|
8,489
|
|
42,304
|
|
$
|
0.20
|
|
||
|
For the year ended April 30, 2011:
|
|
|
|
|
|
|||||
|
Basic earnings per share
|
$
|
14,244
|
|
41,422
|
|
$
|
0.34
|
|
||
|
Dilution associated with stock compensation plans
|
—
|
|
855
|
|
—
|
|
||||
|
Diluted earnings per share
|
$
|
14,244
|
|
42,277
|
|
$
|
0.34
|
|
||
Options outstanding to purchase
2,672
,
1,611
and
1,655
shares of common stock with a weighted average exercise price of
$15.09
,
$19.17
and
$19.23
per share during the fiscal years ended
April 27, 2013
,
April 28, 2012
and
April 30, 2011
, respectively, were not included in the computation of diluted earnings per share because the weighted average exercise price of those instruments exceeded the average market price of the common shares during the year.
Share-based compensation
: We account for share-based compensation in accordance with ASC 718,
Compensation-Stock Compensation.
Under the fair value recognition provisions of ASC 718, we measure share-based compensation cost at the grant date based on the fair value of the award and recognize the compensation expense over the requisite service period, which is the vesting period. See Note 9 for additional information and the assumptions we use to calculate the fair value of share-based employee compensation.
Recent Accounting Pronouncements
In June 2011, the Financial Accounting Standards Board ("FASB") issued Accounting Standards Update ("ASU") 2011-05,
Comprehensive Income (Topic 220): Presentation of Comprehensive Income
. The ASU amends guidance for the presentation of comprehensive income. The amended guidance requires an entity to present components of net income and other comprehensive income in one continuous statement, referred to as the statement of comprehensive income, or in two separate but consecutive statements. The previous option to report other comprehensive income and its components in the statement of shareholders’ equity has been eliminated. Although the new guidance changes the presentation of comprehensive income, there are no changes to the components recognized in net income or other comprehensive income under existing guidance. In the first quarter of fiscal 2013, we revised our presentation of comprehensive income to conform to the guidance in this ASU.
In September 2011, the FASB issued ASU 2011-08,
Intangibles – Goodwill and Other (Topic 350): Testing Goodwill for Impairment
. Under this new standard, entities testing goodwill for impairment now have an option of performing a qualitative assessment before having to calculate the fair value of a reporting unit. If an entity determines, on the basis of qualitative factors, it is more-likely-than-not the fair value of the reporting unit is less than the carrying amount, the existing quantitative impairment test is required. Otherwise, no further impairment testing is required. This ASU is effective for impairment tests after April 29, 2012. The adoption of this standard did not have an impact on our consolidated results of operations or financial condition, as this ASU impacts only the analysis performed.
In July 2012, the FASB issued ASU 2012-02,
Intangibles - Goodwill and Other (Topic 350): Testing Indefinite-Lived Intangible Assets for Impairment.
The amended guidance gives entities the option to perform a qualitative impairment assessment to determine whether it is more-likely-than-not an indefinite-lived intangible asset is impaired. An entity must identify and evaluate changes in economic, industry and entity-specific events and circumstances affecting the significant inputs used to determine the fair value of an indefinite-lived intangible asset and whether it is more-likely-than-not the fair value exceeds its carrying amount. ASU 2012-02 is effective for annual and interim impairment tests performed for fiscal years beginning after September 15, 2012, with early adoption permitted. The adoption of this amended guidance is not expected to have an impact on our consolidated results of operations or financial condition, as the ASU impacts only the analysis to be performed.
47
We have organized our business into
five
segments which meet the definition of reportable segments under ASC 280-10,
Segment Reporting
: Commercial, Live Events, Schools and Theatres, Transportation, and the International business unit. These segments are based on the type of customer and geography.
Our Commercial business unit primarily consists of sales of our video, Galaxy
®
and Fuelight
™
product lines to resellers (primarily sign companies), outdoor advertisers, national retailers, quick-serve restaurants, casinos and petroleum retailers. Our Live Events business unit primarily consists of sales of integrated scoring and video display systems to college and professional sports facilities and convention centers and sales of our mobile display technology to video rental organizations and other live events type venues. Our Schools and Theatres business unit primarily consists of sales of scoring systems, Galaxy
®
displays and video display systems to primary and secondary education facilities and sales of our Vortek
®
automated rigging systems for theatre applications. Our Transportation business unit primarily consists of sales of our Vanguard
®
and Galaxy
®
product lines to governmental transportation departments, airlines and other transportation related customers. Our International business unit consists of sales of all product lines outside the United States and Canada.
Segment reports present results through contribution margin, which is comprised of gross profit less selling costs. Segment profit excludes general and administration expense, product development expense, interest income and expense, non-operating income and income tax expense. Assets are not allocated to the segments. Depreciation and amortization, excluding the portion related to non-allocated costs, are allocated to each segment based on various financial measures. In general, segments follow the same accounting policies as those described in Note 1. Unabsorbed costs of domestic field sales and services infrastructure, including most field administrative staff, are allocated to the Commercial, Live Events, Transportation, and Schools and Theatres business units based on cost of sales. Shared manufacturing, building and utilities, and procurement costs are allocated based on payroll dollars, square footage and various other financial measures.
We do not maintain information on sales by products; therefore, disclosure of such information is not practical.
48
The following table sets forth certain financial information for each of our five operating segments for the periods indicated:
|
|
Year Ended
|
||||||||||
|
April 27,
2013 |
April 28,
2012 |
April 30,
2011 |
|||||||||
|
Net sales:
|
|
|
|
||||||||
|
Commercial
|
$
|
144,596
|
|
$
|
148,585
|
|
$
|
112,515
|
|
||
|
Live Events
|
158,562
|
|
160,933
|
|
161,572
|
|
|||||
|
Schools & Theatres
|
66,128
|
|
59,662
|
|
62,310
|
|
|||||
|
Transportation
|
73,270
|
|
48,284
|
|
45,215
|
|
|||||
|
International
|
75,766
|
|
72,062
|
|
60,064
|
|
|||||
|
|
518,322
|
|
489,526
|
|
441,676
|
|
|||||
|
Contribution margin:
|
|||||||||||
|
Commercial
|
24,241
|
|
24,011
|
|
12,925
|
|
|||||
|
Live Events
|
19,071
|
|
13,579
|
|
18,889
|
|
|||||
|
Schools & Theatres
|
8,150
|
|
4,716
|
|
7,247
|
|
|||||
|
Transportation
|
21,330
|
|
11,009
|
|
12,149
|
|
|||||
|
International
|
8,343
|
|
7,889
|
|
10,719
|
|
|||||
|
|
81,135
|
|
61,204
|
|
61,929
|
|
|||||
|
Non-allocated operating expenses:
|
|||||||||||
|
General and administrative
|
27,404
|
|
27,422
|
|
23,453
|
|
|||||
|
Product design and development
|
23,131
|
|
23,507
|
|
18,949
|
|
|||||
|
Operating income
|
30,600
|
|
10,275
|
|
19,527
|
|
|||||
|
Nonoperating income (expense):
|
|||||||||||
|
Interest income
|
1,523
|
|
1,747
|
|
1,921
|
|
|||||
|
Interest expense
|
(355
|
)
|
(335
|
)
|
(184
|
)
|
|||||
|
Other (expense) income, net
|
(839
|
)
|
(110
|
)
|
877
|
|
|||||
|
Income before income taxes
|
30,929
|
|
11,577
|
|
22,141
|
|
|||||
|
Income tax expense
|
8,150
|
|
3,088
|
|
7,897
|
|
|||||
|
Net income
|
$
|
22,779
|
|
$
|
8,489
|
|
$
|
14,244
|
|
||
|
Depreciation and amortization:
|
|||||||||||
|
Commercial
|
$
|
4,940
|
|
$
|
6,103
|
|
$
|
6,790
|
|
||
|
Live Events
|
4,473
|
|
5,055
|
|
6,224
|
|
|||||
|
Schools & Theatres
|
2,233
|
|
2,361
|
|
2,621
|
|
|||||
|
Transportation
|
1,375
|
|
1,386
|
|
1,524
|
|
|||||
|
International
|
717
|
|
650
|
|
692
|
|
|||||
|
Unallocated corporate depreciation
|
1,869
|
|
1,963
|
|
1,790
|
|
|||||
|
|
$
|
15,607
|
|
$
|
17,518
|
|
$
|
19,641
|
|
||
No single geographic area comprises a material amount of net sales or long-lived assets net of accumulated depreciation other than the United States. The following table presents information about net sales and long-lived assets in the United States and elsewhere:
|
Year Ended
|
|||||||||||
|
April 27,
2013 |
April 28,
2012 |
April 30,
2011 |
|||||||||
|
Net sales:
|
|||||||||||
|
United States
|
$
|
430,242
|
|
$
|
405,479
|
|
$
|
368,979
|
|
||
|
Outside U.S.
|
88,080
|
|
84,047
|
|
72,697
|
|
|||||
|
$
|
518,322
|
|
$
|
489,526
|
|
$
|
441,676
|
|
|||
|
Long-lived assets:
|
|||||||||||
|
United States
|
$
|
60,060
|
|
$
|
66,350
|
|
$
|
68,034
|
|
||
|
Outside U.S.
|
1,565
|
|
2,046
|
|
1,832
|
|
|||||
|
$
|
61,625
|
|
$
|
68,396
|
|
$
|
69,866
|
|
|||
49
We have numerous customers worldwide for sales of our products and services; therefore, we are not economically dependent on a limited number of customers for the sale of our products and services.
We have a cash management program which provides for the investment of cash balances not used in current operations. We classify our investments in marketable securities as available-for-sale in accordance with the provisions of ASU 320,
Investments – Debt and Equity Securities.
Marketable securities classified as available-for-sale are reported at fair value with unrealized gains or losses, net of tax, reported in accumulated other comprehensive (loss) income. As it relates to fixed income marketable securities, we do not intend to sell any of these investments, and it is not more-likely-than-not we will be required to sell any of these investments before recovery of the entire amortized cost basis. The cost of securities sold is based on the specific identification method. Where quoted market prices are not available, we use the market price of similar types of securities traded in the market to estimate fair value.
As of
April 27, 2013
and
April 28, 2012
, our available-for-sale securities consisted of the following:
|
|
Amortized Cost
|
Unrealized Gains
|
Unrealized Losses
|
Fair Value
|
|||||||||||
|
Balance as of April 27, 2013:
|
|
|
|
|
|||||||||||
|
Certificates of deposit
|
$
|
4,677
|
|
$
|
—
|
|
$
|
—
|
|
$
|
4,677
|
|
|||
|
U.S. Government securities
|
4,999
|
|
19
|
|
—
|
|
5,018
|
|
|||||||
|
U.S. Government sponsored entities
|
4,752
|
|
—
|
|
—
|
|
4,752
|
|
|||||||
|
Municipal obligations
|
9,596
|
|
9
|
|
—
|
|
9,605
|
|
|||||||
|
$
|
24,024
|
|
$
|
28
|
|
$
|
—
|
|
$
|
24,052
|
|
||||
|
Balance as of April 28, 2012:
|
|
|
|
|
|
|
|
|
|||||||
|
Certificates of deposit
|
$
|
7,657
|
|
$
|
—
|
|
$
|
—
|
|
$
|
7,657
|
|
|||
|
U.S. Government securities
|
7,507
|
|
49
|
|
—
|
|
7,556
|
|
|||||||
|
U.S. Government sponsored entities
|
4,503
|
|
2
|
|
—
|
|
4,505
|
|
|||||||
|
Municipal obligations
|
5,517
|
|
23
|
|
—
|
|
5,540
|
|
|||||||
|
$
|
25,184
|
|
$
|
74
|
|
$
|
—
|
|
$
|
25,258
|
|
||||
Realized gains or losses on investments are recorded in our consolidated statements of operations within other (expense) income, net. Upon the sale of a security classified as available-for-sale, the security’s specific unrealized gain (loss) is reclassified out of "accumulated other comprehensive (loss) income” into earnings based on the specific identification method. In the fiscal years ended
April 27, 2013
and
April 28, 2012
, the reclassifications from accumulated other comprehensive (loss) income to net assets were immaterial. Realized gains and losses on sales and maturities of investments were immaterial in the fiscal years ended
April 27, 2013
and
April 28, 2012
.
All available-for-sale securities are classified as current assets, as they are readily available to support our current operating needs. The contractual maturities of available-for-sale debt securities as of
April 27, 2013
were as follows:
|
|
Less than 12 months
|
Greater than 12 months
|
Total
|
||||||||
|
Certificates of deposit
|
$
|
1,473
|
|
$
|
3,204
|
|
$
|
4,677
|
|
||
|
U.S. Government securities
|
3,017
|
|
2,001
|
|
5,018
|
|
|||||
|
U.S. Government sponsored entities
|
—
|
|
4,752
|
|
4,752
|
|
|||||
|
Municipal obligations
|
3,863
|
|
5,742
|
|
9,605
|
|
|||||
|
$
|
8,353
|
|
$
|
15,699
|
|
$
|
24,052
|
|
|||
Goodwill and other intangible assets
: We account for goodwill and intangible assets in accordance with ASC 350,
Goodwill and Other Intangible Assets.
Under these provisions, goodwill is not amortized but is tested for impairment on at least an annual basis. Impairment testing is required more often than annually if an event or circumstance indicates an impairment or a decline in value may have occurred. Such circumstances could include, but are not limited to, a worsening trend of orders and sales without a corresponding way to preserve future cash flows or a significant decline in our stock price. In conducting our impairment testing, we compare the fair value of each of our business units (reporting unit) to the related carrying value. If the fair value of a reporting unit exceeds its carrying value, goodwill is not impaired. If the carrying value of a reporting unit exceeds its fair value, an impairment loss is measured and recognized.
We utilize an income approach to estimate the fair value of each reporting unit. We selected this method because we believe it most appropriately measures our income producing assets. We considered using the market approach and cost approach, but concluded they
50
were not appropriate in valuing our reporting units given the lack of relevant and available market comparisons. The income approach is based on the projected cash flows, which are discounted to their present value using discount rates which consider the timing and risk of the forecasted cash flows. We believe that this approach is appropriate because it provides a fair value estimate based upon the reporting units’ expected long-term operating cash performance. This approach also mitigates the impact of the cyclical trends occurring in the industry. Fair value is estimated using internally-developed forecasts and assumptions. The discount rate used is the average estimated value of a market participant’s cost of capital and debt, derived using customary market metrics. Other significant assumptions include terminal value margin rates, future capital expenditures, and changes in future working capital requirements. We also compare and reconcile our overall fair value to our market capitalization. Although there are inherent uncertainties related to the assumptions used and to our application of these assumptions to this analysis, we believe the income approach provides a reasonable estimate of the fair value of our reporting units. The foregoing assumptions to a large degree were consistent with our long-term performance, with limited exceptions. We believe our future investments for capital expenditures as a percent of revenue will remain similar to the historical rates as a percentage of sales in future years with investments related to equipment replacements, new product line manufacturing equipment needs, and to keep our information technology infrastructure robust, and we believe long-term receivables will decrease as we grow. We also have assumed through the recent economic downturn, our markets have not contracted for the long term; however, it may be a number of years before they fully recover. These assumptions could deviate materially from actual results.
We perform an analysis of goodwill on an annual basis. We completed this annual analysis during our third quarter of each fiscal year, based on the goodwill amount as of the first business day of our third quarter in fiscal
2013
,
2012
, and
2011
. The result of our analysis indicated that no goodwill impairment existed for each fiscal year.
The changes in the carrying amount of goodwill related to each reportable segment for the fiscal year ended
April 27, 2013
were as follows:
|
|
Live Events
|
Commercial
|
Transportation
|
Total
|
|||||||||||
|
Balance as of April 28, 2012:
|
$
|
2,435
|
|
$
|
741
|
|
$
|
171
|
|
$
|
3,347
|
|
|||
|
Foreign currency translation
|
(18
|
)
|
(16
|
)
|
(7
|
)
|
(41
|
)
|
|||||||
|
Balance as of April 27, 2013:
|
$
|
2,417
|
|
$
|
725
|
|
$
|
164
|
|
$
|
3,306
|
|
|||
As required by ASC 350, intangibles with finite lives are amortized. We evaluate indefinite lived assets for impairment annually and whenever events or changes in circumstances indicate their carrying value may not be recoverable. The net value of intangible assets is shown on our consolidated balance sheets. Estimated amortization expense based on intangibles as of
April 27, 2013
is
$228
for each of the fiscal years 2014 through 2016 and
$95
for fiscal 2017.
The following table sets forth the gross carrying amount and accumulated amortization of intangible assets by major intangible class as of
April 27, 2013
and
April 28, 2012
:
|
|
April 27, 2013
|
April 28, 2012
|
||||||||||||||||||||||
|
|
Gross Carrying Amount
|
Accumulated Amortization
|
Net Value
|
Gross Carrying Amount
|
Accumulated Amortization
|
Net Value
|
||||||||||||||||||
|
Definite-lived:
|
||||||||||||||||||||||||
|
Patents
|
$
|
2,282
|
|
$
|
1,502
|
|
$
|
780
|
|
$
|
2,282
|
|
$
|
1,274
|
|
$
|
1,008
|
|
||||||
|
Indefinite-lived:
|
||||||||||||||||||||||||
|
Registered trademarks
|
401
|
|
—
|
|
401
|
|
401
|
|
—
|
|
401
|
|
||||||||||||
|
$
|
2,683
|
|
$
|
1,502
|
|
$
|
1,181
|
|
$
|
2,683
|
|
$
|
1,274
|
|
$
|
1,409
|
|
|||||||
Impairment of long-lived assets
: We recorded a pretax asset impairment charge of
$64
,
$538
and
$355
for the fiscal years ended
April 27, 2013
,
April 28, 2012
and
April 30, 2011
, respectively for other long-lived assets including property and equipment. The impairment charges related to technology or equipment obsoleted due to technology improvements or to custom demo equipment with no re-sale value. Impairment charges during fiscal 2013 were included primarily in selling expense.
51
Inventories consisted of the following:
|
April 27,
2013 |
April 28,
2012 |
||||||
|
Raw materials
|
$
|
20,979
|
|
$
|
24,880
|
|
|
|
Work-in-process
|
8,523
|
|
10,581
|
|
|||
|
Finished goods
|
19,543
|
|
19,463
|
|
|||
|
|
$
|
49,045
|
|
$
|
54,924
|
|
|
Inventories are reported net of the allowance for excess and obsolete inventory of
$3,286
and
$2,851
as of
April 27, 2013
and
April 28, 2012
, respectively.
Property and equipment consisted of the following:
|
April 27,
2013 |
April 28,
2012 |
||||||
|
Land
|
$
|
1,497
|
|
$
|
1,497
|
|
|
|
Buildings
|
57,012
|
|
56,431
|
|
|||
|
Machinery and equipment
|
65,600
|
|
61,654
|
|
|||
|
Office furniture and equipment
|
16,118
|
|
15,648
|
|
|||
|
Computer software and hardware
|
41,745
|
|
42,172
|
|
|||
|
Equipment held for rental
|
868
|
|
1,003
|
|
|||
|
Demonstration equipment
|
8,400
|
|
9,806
|
|
|||
|
Transportation equipment
|
4,026
|
|
4,116
|
|
|||
|
|
195,266
|
|
192,327
|
|
|||
|
Less accumulated depreciation
|
133,641
|
|
123,931
|
|
|||
|
|
$
|
61,625
|
|
$
|
68,396
|
|
|
Accrued expenses consisted of the following:
|
April 27,
2013 |
April 28,
2012 |
||||||
|
Compensation
|
$
|
12,940
|
|
$
|
11,475
|
|
|
|
Taxes, other than income taxes
|
2,534
|
|
3,987
|
|
|||
|
Other
|
8,857
|
|
7,269
|
|
|||
|
|
$
|
24,331
|
|
$
|
22,731
|
|
|
Other (expense) income, net consisted of the following:
|
Year Ended
|
|||||||||||
|
April 27,
2013 |
April 28,
2012 |
April 30,
2011 |
|||||||||
|
Foreign currency transaction (losses) gains
|
$
|
(319
|
)
|
$
|
(206
|
)
|
$
|
463
|
|
||
|
Equity in losses of affiliates
|
—
|
|
—
|
|
(36
|
)
|
|||||
|
Other
|
(520
|
)
|
96
|
|
450
|
|
|||||
|
|
$
|
(839
|
)
|
$
|
(110
|
)
|
$
|
877
|
|
||
52
Uncompleted contracts consisted of the following:
|
April 27,
2013 |
April 28,
2012 |
||||||
|
Costs incurred
|
$
|
393,287
|
|
$
|
304,058
|
|
|
|
Estimated earnings
|
146,378
|
|
114,687
|
|
|||
|
|
539,665
|
|
418,745
|
|
|||
|
Less billings to date
|
514,555
|
|
410,110
|
|
|||
|
|
$
|
25,110
|
|
$
|
8,635
|
|
|
Uncompleted contracts are included in the accompanying consolidated balance sheets as follows:
|
April 27,
2013 |
April 28,
2012 |
||||||
|
Costs and estimated earnings in excess of billings
|
$
|
39,355
|
|
$
|
23,020
|
|
|
|
Billings in excess of costs and estimated earnings
|
(14,245
|
)
|
(14,385
|
)
|
|||
|
|
$
|
25,110
|
|
$
|
8,635
|
|
|
We sell our products throughout the United States and in certain foreign countries on credit terms we establish for each customer. On the sale of certain products, we have the ability to file a contractor’s lien against the product installed as collateral and to file claims against surety bonds to protect our interest in receivables. Foreign sales are at times secured by irrevocable letters of credit or bank guarantees.
Accounts receivable are reported net of an allowance for doubtful accounts of
$2,729
and
$2,398
at
April 27, 2013
and
April 28, 2012
, respectively.
We make estimates regarding the collectability of our accounts receivable, long-term receivables, costs and estimated earnings in excess of billings and other receivables. In evaluating the adequacy of our allowance for doubtful accounts, we analyze specific balances, customer creditworthiness, changes in customer payment cycles, and current economic trends. If the financial condition of any customer were to deteriorate, resulting in an impairment of its ability to make payments, additional allowances may be required. We charge off receivables at such time as it is determined collection will not occur. Charge offs of receivables and our allowance for doubtful accounts related to financing receivables are not material to our financial results.
In connection with certain sales transactions, we have entered into sales contracts with installment payments exceeding six months and sales-type leases. The present value of these contracts and leases is recorded as a receivable as the revenue is recognized in accordance with generally accepted accounting principles, and profit is recognized to the extent the present value is in excess of cost. We generally retain a security interest in the equipment or in the cash flow generated by the equipment until the contract is paid. The present value of long-term contracts and lease receivables, including accrued interest and current maturities, was
$16,132
and
$18,452
as of
April 27, 2013
and
April 28, 2012
, respectively. Contract and lease receivables bearing annual interest rates of
5.8
to
10.0
percent are due in varying monthly, quarterly or annual installments through July 2022. The face amount of long-term receivables was
$18,731
as of
April 27, 2013
and
$21,494
as of
April 28, 2012
. Included in accounts receivable as of
April 27, 2013
and
April 28, 2012
was
$803
and
$783
, respectively, of retainage on construction-type contracts, all of which is expected to be collected in one year.
We have a credit agreement with a U.S. bank providing for a
$35.0
million line of credit and includes up to
$15.0
million for standby letters of credit. The line of credit is due on November 15, 2013. The interest rate ranges from LIBOR plus
125
basis points to LIBOR plus
175
basis points depending on the ratio of our interest-bearing debt to EBITDA. EBITDA is defined as net income before income taxes, interest expense, depreciation and amortization. The effective interest rate was
1.5
percent at
April 27, 2013
. We are assessed a loan fee equal to
0.125
percent per annum of any non-used portion of the loan. As of
April 27, 2013
, there were
no
advances under the line of credit.
53
The credit agreement is unsecured and requires us to be in compliance with the following financial ratios:
|
•
|
A minimum fixed charge coverage ratio of at least
2
to 1 at the end of any fiscal year. The ratio is equal to (a) EBITDA less dividends, a capital expenditure reserve of
$6
million, and income tax expense, over (b) all principal and interest payments with respect to debt, excluding debt outstanding on the line of credit; and
|
|
•
|
A ratio of interest-bearing debt, excluding any marketing obligations, to EBITDA of less than
1
to 1 at the end of any fiscal quarter.
|
We have an additional credit agreement with another U.S. bank which expires on November 15, 2013 and is intended to support our credit needs outside of the United States. The facility provides for a
$35.0
million line of credit and includes facilities for letters of credit and bank guarantees and to secure foreign loans for our international subsidiaries. The U.S. credit agreement is unsecured and is cross collateralized with the
$35.0
million line of credit described above. It contains the same covenants as the credit agreement above. As of
April 27, 2013
, there were
no
advances under the line of credit.
We were in compliance with all applicable covenants as of
April 27, 2013
and
April 28, 2012
. The minimum fixed charge coverage ratio as of
April 27, 2013
was
64
-to-1, and the ratio of interest-bearing debt to EBITDA as of
April 27, 2013
was
0.01
-to-1.
Common stock
: Our authorized shares of
120,000
consist of
115,000
shares of common stock and
5,000
shares of “undesignated stock.” Our Board of Directors has the power to issue any or all of the shares of undesignated stock without shareholder approval, including the authority to establish the rights and preferences of the undesignated stock.
Each outstanding share of our common stock includes
one
common share purchase right. Each right entitles the registered holder to purchase from us one one-tenth of one share of common stock at a price of
$100
per common share, subject to adjustment and the terms of the shareholder rights agreement under which the dividend was declared and paid. The rights become exercisable immediately after the earlier of (i)
10
business days following a public announcement where a person or group has acquired beneficial ownership of
15
percent or more of our outstanding common shares (subject to certain exclusions) or (ii)
10
business days following the commencement or announcement of an intention to make a tender offer or exchange offer for our common shares, the consummation of which would result in the beneficial ownership by a person or group of
15
percent or more of our outstanding common shares. The rights expire on November 19, 2018, which date may be extended by our Board subject to certain additional conditions.
Stock incentive plans
: During fiscal 2008, we established the 2007 Stock Incentive Plan (“2007 Plan”) and ceased granting options under the 2001 Incentive Stock Option Plan, and the 2001 Outside Directors Option Plan (“2001 Plans”). The 2007 Plan provides for the issuance of stock-based awards, including stock options, restricted stock, restricted stock units and deferred stock, to employees, directors and consultants. Stock options issued to employees under the plans generally have a
10
-year life, an exercise price equal to the fair market value on the grant date and a
five
-year vesting period. Stock options granted to independent directors under these plans have a
seven
-year life and an exercise price equal to the fair market value on the date of grant. Stock options granted to independent directors prior to fiscal 2010 vest over
three
years, and options granted in or after fiscal 2010 vest in
one
year. The restricted stock granted to independent directors vests in
one
year, provided that they remain on the Board. Restricted stock units are granted to employees and have a
five
-year vesting period. As with stock options, restricted stock and restricted stock unit ownership cannot be transferred during the vesting period.
At
April 27, 2013
, the aggregate number of shares available for future grant under the 2007 plan for stock options and restricted stock awards was
798 shares
. Full value awards such as restricted stock and restricted stock unit awards reduce the number of shares available for issuance by a factor of two, or if such an award were forfeited or terminated without delivery of the shares, the number of shares again become eligible for issuance would be multiplied by a factor of two. Although the 2001 Plans remain in effect for options outstanding, no new options can be granted under these plans.
Restricted stock and restricted stock units
: We issue restricted stock to our non-employee directors and restricted stock units to employees. The fair value of restricted stock and our restricted stock unit awards are measured on the grant date based on the market value of our common stock. The related compensation expense as calculated under ASC 718, net of estimated forfeitures, is recognized over the applicable vesting period. Unrecognized compensation expense related to the restricted stock and restrict stock unit awards was approximately
$2,080
at
April 27, 2013
, which is expected to be recognized over a weighted-average period of
3.3
years. The total fair value of restricted stock vested was
$666
,
$511
, and
$288
for fiscal years
2013
,
2012
, and
2011
, respectively.
54
A summary of nonvested restricted stock and restricted stock units for the years ended
April 27, 2013
,
April 28, 2012
and
April 30, 2011
is as follows:
|
|
Year Ended
|
|||||||||||||||||||
|
|
April 27, 2013
|
April 28, 2012
|
April 30, 2011
|
|||||||||||||||||
|
Number of
Nonvested
Shares
|
Weighted Average Grant Date Fair Value Per Share
|
Number of
Nonvested
Shares
|
Weighted Average Grant Date Fair Value Per Share
|
Number of
Nonvested
Shares
|
Weighted Average Grant Date Fair Value Per Share
|
|||||||||||||||
|
Outstanding at beginning of year
|
242
|
|
$
|
9.81
|
|
181
|
|
$
|
11.07
|
|
121
|
|
$
|
8.21
|
|
|||||
|
Granted
|
119
|
|
8.50
|
|
118
|
|
8.24
|
|
103
|
|
13.29
|
|
||||||||
|
Vested
|
(69
|
)
|
12.05
|
|
(49
|
)
|
10.51
|
|
(35
|
)
|
8.24
|
|
||||||||
|
Forfeited
|
(13
|
)
|
9.63
|
|
(8
|
)
|
10.85
|
|
(8
|
)
|
9.17
|
|
||||||||
|
Outstanding at end of year
|
279
|
|
9.74
|
|
242
|
|
9.81
|
|
181
|
|
11.07
|
|
||||||||
Stock Options
: We issue incentive stock options to our employees and non-qualified stock options to our independent directors. A summary of stock option activity under all stock option plans during the fiscal year ended
April 27, 2013
is as follows:
|
Stock Options
|
Weighted Average Exercise Price Per Share
|
Weighted Average Remaining Contractual Life (Years)
|
Aggregate Intrinsic Value
|
||||||||||
|
Outstanding at April 28, 2012
|
3,290
|
|
$
|
13.73
|
|
5.34
|
|
$
|
463
|
|
|||
|
Granted
|
485
|
|
9.51
|
|
—
|
|
—
|
|
|||||
|
Canceled or forfeited
|
(157
|
)
|
12.55
|
|
—
|
|
—
|
|
|||||
|
Exercised
|
(197
|
)
|
6.69
|
|
—
|
|
562
|
|
|||||
|
Outstanding at April 27, 2013
|
3,421
|
|
$
|
13.59
|
|
5.09
|
|
$
|
1,176
|
|
|||
|
Shares vested and expected to vest
|
3,377
|
|
$
|
13.63
|
|
5.05
|
|
$
|
1,166
|
|
|||
|
Exercisable at April 27, 2013
|
2,301
|
|
$
|
15.42
|
|
3.71
|
|
$
|
828
|
|
|||
The aggregate intrinsic value of stock options represents the difference between the exercise price of stock options and the fair market value of the underlying common stock at day's end for all in-the-money options. We define in-the-money options at
April 27, 2013
as options having exercise prices lower than the
$9.57
per share market price of our common stock. There were in-the-money options to purchase
917
shares exercisable at
April 27, 2013
. The total intrinsic value of options exercised during fiscal years
2013
,
2012
, and
2011
was
$562
,
$624
, and
$1,945
, respectively. The total fair value of stock options vested was
$1,898
,
$2,497
, and
$2,628
for fiscal years
2013
,
2012
, and
2011
, respectively.
We estimate the fair value of stock options granted using the Black-Scholes option valuation model. We recognize the fair value of the stock options on a straight-line basis as compensation expense. All options are recognized over the requisite service periods of the awards, which are generally the vesting periods.
The Black-Scholes option-pricing model was developed for use in estimating the fair value of traded options having no vesting restrictions and are fully transferable. In addition, option valuation models require the input of highly subjective assumptions, including the expected stock price volatility. ASC 718 requires us to estimate forfeitures at the time of grant and revise those estimates in subsequent periods if actual forfeitures differ from those estimates. We use historical data to estimate pre-vesting option forfeitures and record share-based compensation expense only for those awards expected to vest. The following factors are the significant assumptions used in the computation of fair value of options:
Expected life
. The expected life of options granted represents the period of time they are expected to be outstanding. We estimate the expected life of options granted based on historical exercise patterns, which we believe are representative of future behavior. We have examined our historical pattern of option exercises in an effort to determine if there were any discernible patterns of activity based on certain demographic characteristics. Demographic characteristics tested included age, salary level, job level and geographic location. We have determined there were no meaningful differences in option exercise activity based on the demographic characteristics tested.
Expected volatility
. We estimate the volatility of our common stock at the date of grant based on historical volatility consistent with ASC 718 and SEC Staff Accounting Bulletin No. 107,
Share Based Payments
. Our decision to use historical volatility instead
55
of implied volatility was based upon analyzing historical data along with the lack of availability of history of actively traded options on our common stock.
Risk-free interest rate.
The rate is based on the U.S. Treasury zero-coupon yield curve on the grant date for a term similar to the expected life of the options.
Dividend yield.
We use an expected dividend yield consistent with our dividend yield over the period of time we have paid dividends.
The following table provides the weighted-average fair value of options granted and the related assumptions used in the Black-Scholes model:
|
Year Ended
|
|||||||||||
|
April 27,
2013 |
April 28,
2012 |
April 30,
2011 |
|||||||||
|
Fair Value of options granted
|
$
|
3.43
|
|
$
|
3.46
|
|
$
|
5.74
|
|
||
|
Risk-free interest rate
|
0.71 - 1.13%
|
|
1.10 - 1.50%
|
|
1.40 - 2.30%
|
|
|||||
|
Expected dividend rate
|
2.43
|
%
|
0.71 - 2.15%
|
|
0.67 - 0.68%
|
|
|||||
|
Expected volatility
|
45.60 - 46.15%
|
|
44.59 - 46.85%
|
|
42.00 - 46.00%
|
|
|||||
|
Expected life of option
|
5.9 - 6.8 years
|
|
5.9 - 6.8 years
|
|
5.9 - 6.7 years
|
|
|||||
Employee stock purchase plan
: We have an employee stock purchase plan (“ESPP”), which enables employees after
six
months of continuous employment to elect, in advance and semi-annually, to contribute up to
15
percent of their compensation, subject to certain limitations, toward the purchase of our common stock at a purchase price equal to
85
percent of the lower of the fair market value of the common stock on the first or last day of the participation period. The ESPP plan requires participants to hold any share purchased under the plan for a minimum period of
one
year after the date of purchase. Compensation expense recognized on shares issued under our ESPP is based on the value of a traded option to purchase shares of our stock at a
15
percent discount to the stock price. The total number of shares reserved under the ESPP is
2,500
. The number of shares of common stock issued under the ESPP totaled
214
,
160
, and
205
shares in fiscal
2013
,
2012
, and
2011
, respectively. The number of shares of common stock reserved for future employee purchases under the ESPP totaled
1,185
shares at
April 27, 2013
. The ESPP is intended to qualify under Section 423 of the Internal Revenue Code of 1986.
Total share-based compensation expense
: As of
April 27, 2013
, there was
$5,379
of total unrecognized compensation cost related to nonvested share-based compensation arrangements granted under all equity compensation plans. Total unrecognized compensation cost will be adjusted for future changes in estimated forfeitures. We expect to recognize the cost over a weighted-average period of
3.1
years.
The following table presents a summary of the share-based compensation expense by equity type as follows:
|
|
Year Ended
|
||||||||||
|
April 27,
2013 |
April 28,
2012 |
April 30,
2011 |
|||||||||
|
Stock options
|
$
|
1,812
|
|
$
|
2,565
|
|
$
|
2,671
|
|
||
|
Restricted stock and stock units
|
765
|
|
256
|
|
256
|
|
|||||
|
Employee stock purchase plans
|
460
|
|
441
|
|
443
|
|
|||||
|
|
$
|
3,037
|
|
$
|
3,262
|
|
$
|
3,370
|
|
||
A summary of the share-based compensation expenses for stock options, restricted stock, restricted stock units and shares issued under the ESPP for the fiscal years ended
April 27, 2013
,
April 28, 2012
and
April 30, 2011
is as follows:
|
|
Year Ended
|
||||||||||
|
April 27,
2013 |
April 28,
2012 |
April 30,
2011 |
|||||||||
|
Cost of goods sold
|
$
|
633
|
|
$
|
610
|
|
$
|
565
|
|
||
|
Selling
|
856
|
|
982
|
|
1,065
|
|
|||||
|
General and administrative
|
980
|
|
1,059
|
|
1,103
|
|
|||||
|
Product design and development
|
568
|
|
611
|
|
637
|
|
|||||
|
|
$
|
3,037
|
|
$
|
3,262
|
|
$
|
3,370
|
|
||
We received
$1,316
in cash from option exercises under all share-based payment arrangements for the fiscal year ended
April 27, 2013
. The tax benefit related to non-qualified options and restricted stock units under all share-based payment arrangements totaled
$346
,
$325
, and
$239
for fiscal years
2013
,
2012
, and
2011
, respectively.
56
We sponsor a 401(k) savings plan under which eligible U.S. employees may choose to make voluntary contributions of such employee's compensation on a pretax basis, subject to certain Internal Revenue Service (IRS) limits. We make matching contributions equal to
25
percent (
50
percent prior to August 1, 2010 and after January 29, 2011) of the employee's qualifying contribution up to
six
percent of such employee's compensation plus other discretionary contributions as authorized by our Board of Directors. Employees are eligible to participate upon completion of
one
year of service if they have attained the age of
21
and have worked more than
1000
hours during such plan year. We contributed
$1,713
,
$1,618
and
$905
to the plan for fiscal years
2013
,
2012
, and
2011
, respectively.
We have unfunded deferred compensation agreements with certain officers and a former director under which interest is credited each year to each participant’s account in an amount equal to the
five
-year Treasury note rate as of January 1 of each plan year. Total amounts accrued for these plans as of
April 27, 2013
and
April 28, 2012
were
$629
and
$625
, respectively. Contributions for each of the fiscal years
2013
,
2012
, and
2011
were
$23
,
$23
and
$22
, respectively. The amounts accrued under the plans are not funded and are subject to the claims of the participants’ creditors. Participants may elect various forms of withdrawals upon retirement, including a lump sum distribution or annual payments over
five
or
10
years.
We are subject to U.S. Federal income tax as well as the income taxes of multiple state jurisdictions. As a result of the completion of examinations by the Internal Revenue Service on prior years and the expiration of statutes of limitations, fiscal years 2010, 2011 and 2012 are the only years remaining open under statutes of limitations. Certain subsidiaries are also subject to income tax in several foreign jurisdictions which have open tax years varying by jurisdiction beginning in fiscal 2005.
On January 2, 2013, the President signed into law The American Taxpayer Relief Act of 2012. Under prior law, a taxpayer was entitled to a research tax credit for qualifying amounts paid or incurred on or before December 31, 2011. The 2012 Taxpayer Relief Act extends the research credit for two years to December 31, 2013. The extension of the research credit is retroactive and includes amounts paid or incurred after December 31, 2011.
As a result of the retroactive extension, we recognized approximately
$1,804
in tax benefits for the credit during fiscal year 2013.
Income tax expense (benefit) consisted of the following:
|
Year Ended
|
|||||||||||
|
April 27,
2013 |
April 28,
2012 |
April 30,
2011 |
|||||||||
|
Current:
|
|
|
|
||||||||
|
Federal
|
$
|
9,517
|
|
$
|
2,266
|
|
$
|
4,879
|
|
||
|
State
|
2,219
|
|
577
|
|
1,227
|
|
|||||
|
Foreign
|
754
|
|
313
|
|
939
|
|
|||||
|
Deferred taxes
|
(4,340
|
)
|
(68
|
)
|
852
|
|
|||||
|
|
$
|
8,150
|
|
$
|
3,088
|
|
$
|
7,897
|
|
||
A reconciliation of the provision for income taxes and the amount computed by applying the federal statutory rate to income before income taxes is as follows:
|
Year Ended
|
||||||||||||
|
April 27,
2013 |
April 28,
2012 |
April 30,
2011 |
||||||||||
|
Computed income tax expense at federal statutory rate
|
$
|
10,825
|
|
$
|
4,052
|
|
$
|
7,732
|
|
|||
|
State taxes, net of federal benefit
|
684
|
|
497
|
|
1,107
|
|
||||||
|
Research and development tax credit
|
(1,804
|
)
|
(1,004
|
)
|
(981
|
)
|
||||||
|
Meals and entertainment
|
308
|
|
375
|
|
299
|
|
||||||
|
Stock compensation
|
466
|
|
842
|
|
959
|
|
||||||
|
Dividends paid to retirement plan
|
(616
|
)
|
(522
|
)
|
—
|
|
||||||
|
Domestic production activities deduction
|
(976
|
)
|
(270
|
)
|
(607
|
)
|
||||||
|
Change in foreign deferred rates
|
—
|
|
(249
|
)
|
—
|
|
||||||
|
Reversal of valuation allowance
|
—
|
|
(364
|
)
|
—
|
|
||||||
|
Other, net
|
(737
|
)
|
(269
|
)
|
(612
|
)
|
||||||
|
|
$
|
8,150
|
|
$
|
3,088
|
|
$
|
7,897
|
|
|||
57
We operated under a tax holiday in China which expired in fiscal 2012. As noted above, the expiration of this tax holiday caused a
$249
decrease in our income tax expense in fiscal 2012.
The pretax income attributable to domestic and foreign operations was as follows:
|
Year Ended
|
|||||||||||
|
April 27,
2013 |
April 28,
2012 |
April 30,
2011 |
|||||||||
|
Domestic
|
$
|
27,667
|
|
$
|
10,052
|
|
$
|
17,892
|
|
||
|
Foreign
|
3,262
|
|
1,525
|
|
4,249
|
|
|||||
|
Income before income taxes
|
$
|
30,929
|
|
$
|
11,577
|
|
$
|
22,141
|
|
||
The components of the net deferred tax asset were as follows:
|
April 27,
2013 |
April 28,
2012 |
||||||
|
Deferred taxes assets:
|
|
|
|||||
|
Warranty reserves
|
$
|
9,847
|
|
$
|
8,425
|
|
|
|
Vacation accrual
|
1,788
|
|
1,821
|
|
|||
|
Net losses on equity investments
|
3,066
|
|
2,971
|
|
|||
|
Deferred maintenance revenue
|
2,439
|
|
1,738
|
|
|||
|
Reserves for excess and obsolete inventory
|
1,246
|
|
1,021
|
|
|||
|
Equity compensation
|
1,049
|
|
653
|
|
|||
|
Allowance for doubtful accounts
|
599
|
|
473
|
|
|||
|
Inventory capitalization
|
600
|
|
907
|
|
|||
|
Accrued compensation and benefits
|
1,077
|
|
742
|
|
|||
|
Intangible assets
|
37
|
|
81
|
|
|||
|
Net operating loss carry forwards
|
—
|
|
15
|
|
|||
|
Other
|
440
|
|
334
|
|
|||
|
|
22,188
|
|
19,181
|
|
|||
|
Deferred tax liabilities:
|
|
|
|
|
|||
|
Property and equipment
|
(7,542
|
)
|
(8,817
|
)
|
|||
|
Prepaid expenses
|
(662
|
)
|
(669
|
)
|
|||
|
Other
|
(168
|
)
|
(219
|
)
|
|||
|
|
(8,372
|
)
|
(9,705
|
)
|
|||
|
|
$
|
13,816
|
|
$
|
9,476
|
|
|
We review deferred tax assets, including net operating losses, and to the extent we believe the asset may not be realized, we recognize a valuation allowance. At
April 27, 2013
and
April 28, 2012
, we had recorded no valuation allowances as we believe our deferred tax assets will be fully realized based upon our estimates of the future taxable income. If our estimates of future taxable income are not met in future periods, a valuation allowance for some of these deferred tax assets may be required.
We have not recorded U.S. deferred income taxes on certain of our non-U.S. subsidiaries’ undistributed earnings, as such amounts are intended to be reinvested outside the United States indefinitely. However, should we change our business and tax strategies in the future and decide to repatriate a portion of these earnings to one of our U.S. subsidiaries, including cash maintained by these non-U.S. subsidiaries, additional U.S. tax liabilities would be incurred. It is not practical at this time to estimate the amount of additional U.S. tax liabilities we would incur.
The following presents the classification of the net deferred tax asset on the accompanying consolidated balance sheets:
|
April 27,
2013 |
April 28,
2012 |
||||||
|
Current assets
|
$
|
12,755
|
|
$
|
10,941
|
|
|
|
Current liabilities
|
—
|
|
(42
|
)
|
|||
|
Non-current assets
|
1,061
|
|
30
|
|
|||
|
Non-current liabilities
|
—
|
|
(1,453
|
)
|
|||
|
|
$
|
13,816
|
|
$
|
9,476
|
|
|
58
We account for uncertainties in tax positions under the provisions of ASC 740-10,
Accounting for Uncertainty in Income Taxes, an Interpretation of SFAS No. 109
. ASC 740-10 creates a single model to address uncertainty in tax positions and clarifies the accounting for income taxes by prescribing the minimum recognition threshold a tax position is required to meet before being recognized in the financial statements. ASC 740-10 also provides guidance on derecognition, measurement, classification, interest and penalties, accounting in interim periods, disclosure and transition. The following table provides a reconciliation of changes in unrecognized tax benefits for fiscal
2013
,
2012
and 2011:
|
|
Amount
|
||
|
Balance as of May 1, 2010:
|
$
|
538
|
|
|
Gross increases related to prior period tax positions
|
132
|
|
|
|
Gross decreases related to prior period tax positions
|
(104
|
)
|
|
|
Gross increases related to current period tax positions
|
81
|
|
|
|
Lapse of statute of limitations
|
(120
|
)
|
|
|
Balance as of April 30, 2011:
|
$
|
527
|
|
|
Gross increases related to prior period tax positions
|
14
|
|
|
|
Gross decreases related to prior period tax positions
|
(178
|
)
|
|
|
Gross increases related to current period tax positions
|
86
|
|
|
|
Lapse of statute of limitations
|
—
|
|
|
|
Balance as of April 28, 2012:
|
$
|
449
|
|
|
Gross increases related to prior period tax positions
|
—
|
|
|
|
Gross decreases related to prior period tax positions
|
(11
|
)
|
|
|
Gross increases related to current period tax positions
|
129
|
|
|
|
Lapse of statute of limitations
|
(188
|
)
|
|
|
Balance as of April 27, 2013:
|
$
|
379
|
|
We recognized an expense (benefit) of
$10
,
$(1)
and
$(16)
in net interest and penalties during the years ended
April 27, 2013
,
April 28, 2012
and
April 30, 2011
, respectively. Interest and penalties recognized are recorded in income taxes in our consolidated statements of operations. We had accrued
$11
and
$24
in net interest or penalties as of
April 27, 2013
and
April 28, 2012
, respectively.
The changes in operating assets and liabilities consisted of the following:
|
|
Year Ended
|
||||||||||
|
April 27,
2013 |
April 28,
2012 |
April 30,
2011 |
|||||||||
|
(Increase) decrease:
|
|
|
|
||||||||
|
Restricted cash
|
$
|
1,120
|
|
$
|
377
|
|
$
|
(282
|
)
|
||
|
Accounts receivable
|
3,364
|
|
(4,995
|
)
|
(16,837
|
)
|
|||||
|
Long-term receivables
|
2,348
|
|
462
|
|
(756
|
)
|
|||||
|
Inventories
|
6,656
|
|
(7,539
|
)
|
(10,341
|
)
|
|||||
|
Costs and estimated earnings in excess of billings
|
(16,335
|
)
|
1,173
|
|
1,040
|
|
|||||
|
Prepaid expenses and other current assets
|
(658
|
)
|
784
|
|
82
|
|
|||||
|
Income taxes receivable
|
5,944
|
|
(1,120
|
)
|
2,574
|
|
|||||
|
Advertising rights and other assets
|
386
|
|
226
|
|
823
|
|
|||||
|
Increase (decrease):
|
|
|
|
|
|
|
|||||
|
Accounts payable and accrued expenses
|
7,658
|
|
6,975
|
|
11,242
|
|
|||||
|
Customer deposits
|
(450
|
)
|
1,538
|
|
1,940
|
|
|||||
|
Billings in excess of costs and estimated earnings
|
(140
|
)
|
(5,899
|
)
|
7,179
|
|
|||||
|
Long-term warranty obligations
|
2,932
|
|
(767
|
)
|
4,561
|
|
|||||
|
Income taxes payable
|
1,023
|
|
(215
|
)
|
853
|
|
|||||
|
Long-term deferred revenue
|
(576
|
)
|
783
|
|
1,256
|
|
|||||
|
Other long-term obligations
|
(169
|
)
|
(915
|
)
|
41
|
|
|||||
|
|
$
|
13,103
|
|
$
|
(9,132
|
)
|
$
|
3,375
|
|
||
59
Supplemental disclosures of cash flow information consisted of the following:
|
|
Year Ended
|
||||||||||
|
April 27,
2013 |
April 28,
2012 |
April 30,
2011 |
|||||||||
|
Cash payments for:
|
|
|
|
||||||||
|
Interest
|
$
|
420
|
|
$
|
306
|
|
$
|
113
|
|
||
|
Income taxes, net of refunds
|
5,422
|
|
4,292
|
|
(3,683
|
)
|
|||||
Supplemental schedule of non-cash investing and financing activities consisted of the following:
|
|
Year Ended
|
|||||||||||
|
April 27,
2013 |
April 28,
2012 |
April 30,
2011 |
||||||||||
|
Demonstration equipment transferred to inventory
|
$
|
612
|
|
$
|
409
|
|
$
|
896
|
|
|||
|
Purchases of property and equipment included in accounts payable
|
1,207
|
|
1,475
|
|
673
|
|
||||||
|
Contributions of common stock under the employee stock purchase plan
|
1,482
|
|
1,413
|
|
1,382
|
|
||||||
ASC 820,
Fair Value Measurements and Disclosures,
defines fair value as the price that would be received to sell an asset or paid to transfer a liability (an exit price) in an orderly transaction between market participants at the measurement date. It also establishes a fair value hierarchy which requires an entity to maximize the use of observable inputs and minimize the use of unobservable inputs when measuring fair value. The fair value hierarchy within ASC 820 distinguishes between the following three levels of inputs which may be utilized when measuring fair value.
Level 1
- Quoted prices in active markets for identical assets or liabilities.
Level 2
- Observable inputs other than quoted prices included within Level 1 for the assets or liabilities, either directly or indirectly (for example, quoted market prices for similar assets and liabilities in active markets or quoted market prices for identical assets or liabilities in markets not considered to be active, inputs other than quoted prices that are observable for the asset or liability, or market-corroborated input.)
Level 3
- Unobservable inputs supported by little or no market activity based on our own assumptions used to measure assets and liabilities.
The fair values for fixed-rate contracts receivable are estimated using a discounted cash flow analysis based on interest rates currently being offered for contracts with similar terms to customers with similar credit quality. The carrying amounts reported on our consolidated balance sheets for contracts receivable approximate fair value and have been categorized as a Level 2 fair value measurement. The carrying amounts reported for variable rate long-term marketing obligations approximate fair value. Fair values for fixed-rate long-term marketing obligations are estimated using a discounted cash flow calculation which applies interest rates currently being offered for debt with similar terms and underlying collateral. The total carrying value of long-term marketing obligations reported on our consolidated balance sheets approximates fair value and has been categorized as a Level 2 fair value measurement.
60
The following table sets forth by Level within the fair value hierarchy our financial assets and liabilities accounted for at fair value on a recurring basis at
April 27, 2013
and
April 28, 2012
according to the valuation techniques we used to determine their fair values. There have been no transfers of assets or liabilities among the fair value hierarchies presented.
|
|
Fair Value Measurements
|
||||||||||
|
|
Level 1
|
Level 2
|
Total
|
||||||||
|
Balance as of April 27, 2013:
|
|
|
|
||||||||
|
Cash and cash equivalents
|
$
|
40,628
|
|
$
|
—
|
|
$
|
40,628
|
|
||
|
Restricted cash
|
48
|
|
—
|
|
48
|
|
|||||
|
Available-for-sale securities:
|
|
|
|
|
|||||||
|
Certificates of deposit
|
—
|
|
4,677
|
|
4,677
|
|
|||||
|
U.S. Government securities
|
5,018
|
|
—
|
|
5,018
|
|
|||||
|
U.S. Government sponsored entities
|
—
|
|
4,752
|
|
4,752
|
|
|||||
|
Municipal obligations
|
—
|
|
9,605
|
|
9,605
|
|
|||||
|
Derivatives - currency forward contracts
|
—
|
|
7
|
|
7
|
|
|||||
|
$
|
45,694
|
|
$
|
19,041
|
|
$
|
64,735
|
|
|||
|
Balance as of April 28, 2012:
|
|
|
|
|
|
|
|||||
|
Cash and cash equivalents
|
$
|
29,423
|
|
$
|
—
|
|
$
|
29,423
|
|
||
|
Restricted cash
|
1,169
|
|
—
|
|
1,169
|
|
|||||
|
Available-for-sale securities:
|
|
|
|
|
|||||||
|
Certificates of deposit
|
—
|
|
7,657
|
|
7,657
|
|
|||||
|
U.S. Government securities
|
7,556
|
|
—
|
|
7,556
|
|
|||||
|
U.S. Government sponsored entities
|
—
|
|
4,505
|
|
4,505
|
|
|||||
|
Municipal obligations
|
—
|
|
5,540
|
|
5,540
|
|
|||||
|
Derivatives - currency forward contracts
|
—
|
|
(95
|
)
|
(95
|
)
|
|||||
|
$
|
38,148
|
|
$
|
17,607
|
|
$
|
55,755
|
|
|||
The following methods and assumptions were used to estimate the fair value of each class of financial instrument. There have been no changes in the valuation techniques used by us to value our financial instruments.
Cash and cash equivalents
: Consists of cash on hand in bank deposits and highly liquid investments, primarily money market accounts. The fair value was measured using quoted market prices in active markets. The carrying amount approximates fair value.
Restricted cash
: Consists of cash and cash equivalents held in bank deposit accounts to secure issuances of foreign bank guarantees. The fair value of restricted cash was measured using quoted market prices in active markets. The carrying amount approximates fair value.
Certificates of deposit
: Consists of time deposit accounts with original maturities of less than three years and various yields. The fair value of these securities was measured based on valuations observed in less active markets than Level 1 investments from a third-party financial institution. The carrying amount approximates fair value.
U.S. Government securities
:
Consists of U.S. Government treasury bills, notes, and bonds with original maturities of less than three years and various yields. The fair value of these securities was measured using quoted market prices in active markets.
U.S. Government sponsored entities
: Consist of Fannie Mae and Federal Home Loan Bank investment grade debt securities trading with sufficient frequency and volume to enable us to obtain pricing information on an ongoing basis. The fair value of these securities was measured based on valuations observed in less active markets than Level 1 investments. The contractual maturities of these investments vary from one month to three years.
Municipal obligations
: Consist of investment grade municipal bonds trading with sufficient frequency and volume to enable us to obtain pricing information on an ongoing basis. The contractual maturities of these investments vary from two to three years. The fair value of these bonds was measured based on valuations observed in less active markets than Level 1 investments.
Derivatives – currency forward contracts
: Consists of currency forward contracts trading with sufficient frequency and volume to enable us to obtain pricing information on an ongoing basis. The fair value of these securities was measured based on a valuation from a third-party bank. See Note 14 for more information regarding our derivatives.
The fair value measurement standard also applies to certain non-financial assets and liabilities measured at fair value on a nonrecurring basis. For example, certain long-lived assets such as goodwill, intangible assets and property, plant and equipment are measured at fair
61
value in connection with business combinations or when an impairment is recognized and the related assets are written down to fair value. We did not make any material business combinations or recognize significant impairment losses during fiscal 2013 or fiscal 2012.
We utilize derivative financial instruments to manage the economic impact of fluctuations in currency exchange rates on those transactions denominated in currencies other than our functional currency, which is the U.S. dollar. We enter into currency forward contracts to manage these economic risks. We account for all derivatives on the balance sheet within other assets or accounts payable measured at fair value, and changes in fair values are recognized in earnings unless specific hedge accounting criteria are met for cash flow or net investment hedges. As of
April 27, 2013
and
April 28, 2012
, we had not designated any of our derivative instruments as accounting hedges, and thus we recorded the changes in fair value in other (expense) income, net.
The foreign currency exchange contracts in aggregated notional amounts in place to exchange United States Dollars at
April 27, 2013
and
April 28, 2012
were as follows:
|
|
April 27, 2013
|
April 28, 2012
|
|||||||||
|
|
U.S.
Dollars
|
Foreign
Currency
|
U.S.
Dollars
|
Foreign
Currency
|
|||||||
|
Foreign Currency Exchange Forward Contracts:
|
|
|
|
|
|||||||
|
U.S. Dollars/Australian Dollars
|
2,944
|
|
2,873
|
|
3,315
|
|
3,269
|
|
|||
|
U.S. Dollars/Canadian Dollars
|
492
|
|
492
|
|
870
|
|
868
|
|
|||
|
U.S. Dollars/British Pounds
|
1,554
|
|
1,005
|
|
—
|
|
—
|
|
|||
|
U.S. Dollars/Euros
|
1,155
|
|
866
|
|
130
|
|
99
|
|
|||
|
U.S. Dollars/Singapore Dollars
|
—
|
|
—
|
|
96
|
|
121
|
|
|||
|
U.S. Dollars/Brazilian Reais
|
—
|
|
—
|
|
242
|
|
436
|
|
|||
As of
April 27, 2013
and
April 28, 2012
, there was a net asset (liability) of
$7
and
$(95)
, respectively, representing the fair value of foreign currency exchange forward contracts, which was determined using Level 2 inputs from a third-party bank.
Litigation:
We are a party to legal proceedings and claims that arise during the ordinary course of business. We review our legal proceedings and claims, regulatory reviews and inspections and other legal matters on an ongoing basis and follow appropriate accounting guidance when making accrual and disclosure decisions. We establish accruals for those contingencies when the incurrence of a loss is probable and can be reasonably estimated, and we disclose the amount accrued and the amount of a reasonably possible loss in excess of the amount accrued, if such disclosure is necessary for our financial statements to not be misleading. We do not record an accrual when the likelihood of loss has been incurred is probable, but the amount cannot be reasonably estimated, or when the loss is believed to be only reasonably possible or remote, although disclosures will be made for material matters as required by ASC 450-20,
Loss Contingencies
. Our assessment of whether a loss is reasonably possible or probable is based on our assessment and consultation with legal counsel regarding the ultimate outcome of the matter following all appeals.
As of
April 27, 2013
, we did not believe there was a reasonable possibility any material loss for these various claims or legal actions, including reviews, inspections or other legal proceedings, if any, had been incurred. Accordingly, no accrual or disclosure of a potential range of loss has been made related to these matters. In the opinion of management, the ultimate liability of all unresolved legal proceedings is not expected to have a material effect on our financial position, liquidity or capital resources.
Guarantees:
In connection with the sale of equipment to various customers, we have entered into contractual arrangements whereby we agreed to repurchase equipment at the end of the lease term at a fixed price. Our total obligations under these fixed price arrangements were
$1,285
as of
April 27, 2013
and
April 28, 2012
. We have recognized a guarantee liability in accrued expenses for the amount of
$185
in accordance with the provisions of ASC 460,
Guarantees
, in connection with these arrangements.
Warranties:
We offer a standard parts coverage warranty for periods varying from
one
to
five
years for most of our products. We also offer additional types of warranties including on-site labor, routine maintenance and event support. In addition, the terms of warranties on some installations can vary from
one
to
10
years. The specific terms and conditions of these warranties vary primarily depending on the type of the product sold. We estimate the costs incurred under the warranty obligations and record a liability in the amount of such estimated costs at the time the revenue is recognized. Factors affecting our estimate of the cost of our warranty obligations include historical experience and expectations of future conditions. We periodically assess the adequacy of our recorded warranty reserves and,
62
to the extent we experience any changes in warranty claim activity or costs associated with servicing those claims, our warranty obligation is adjusted accordingly.
Changes in our warranty liability for the fiscal years ended
April 27, 2013
and
April 28, 2012
consisted of the following:
|
|
April 27, 2013
|
April 28, 2012
|
|||||
|
Beginning accrued warranty costs
|
$
|
22,215
|
|
$
|
22,982
|
|
|
|
Warranties issued during the period
|
11,140
|
|
8,199
|
|
|||
|
Settlements made during the period
|
(13,875
|
)
|
(13,531
|
)
|
|||
|
Changes in accrued warranty costs for pre-existing warranties during the period, including expirations
|
5,666
|
|
4,565
|
|
|||
|
Ending accrued warranty costs
|
$
|
25,146
|
|
$
|
22,215
|
|
|
Performance guarantees:
We have entered into standby letters of credit and surety bonds with financial institutions relating to the guarantee of future performance on contracts, primarily construction type contracts. As of
April 27, 2013
, we had outstanding letters of credit and surety bonds in the amount of
$6,169
and
$13,287
, respectively. Performance guarantees are issued to certain customers to guarantee the operation and installation of the equipment and our ability to complete a contract. These performance guarantees have various terms, which are generally less than one year.
Leases:
We lease vehicles, office space and various equipment for various sales and service locations throughout the world, including manufacturing space in the United States and China. Some of these leases, including the lease for manufacturing facilities in Sioux Falls, South Dakota, include provisions for extensions or purchase. The lease for the facilities in Sioux Falls, South Dakota can be extended for an additional three years past its current term, which ends December 31, 2016, and it contains an option to purchase the property subject to the lease from January 1, 2015 to December 31, 2016 for
$8,400
, which approximates fair value. If the lease is extended, the purchase option increases to
$8,600
for the year ending December 31, 2017 and
$8,800
for the year ending December 31, 2018. Rental expense for operating leases was
$2,749
,
$3,159
and
$3,738
for the fiscal years ended
April 27, 2013
,
April 28, 2012
and
April 30, 2011
, respectively.
Future minimum payments under noncancelable operating leases, excluding executory costs such as management and maintenance fees, with initial or remaining terms of one year or more consisted of the following at
April 27, 2013
:
|
Fiscal years ending
|
Amount
|
|||
|
2014
|
$
|
2,840
|
|
|
|
2015
|
2,096
|
|
||
|
2016
|
1,832
|
|
||
|
2017
|
968
|
|
||
|
2018
|
191
|
|
||
|
Thereafter
|
30
|
|
||
|
$
|
7,957
|
|
||
Purchase commitments:
From time to time, we commit to purchase inventory, advertising, and various other products and services over periods that extend beyond one year. As of
April 27, 2013
, we were obligated under the following conditional and unconditional purchase commitments, which included
$1,000
in conditional purchase commitments.
|
Fiscal years ending
|
Amount
|
|||
|
2014
|
$
|
1,181
|
|
|
|
2015
|
399
|
|
||
|
2016
|
262
|
|
||
|
2017
|
200
|
|
||
|
2018
|
200
|
|
||
|
Thereafter
|
—
|
|
||
|
$
|
2,242
|
|
||
63
We owned a
seven
percent interest in Outcast as of
April 27, 2013
and
April 28, 2012
. Prior to February 2011, our interest in Outcast was
37.5
percent. As a result of certain transactions during fiscal 2011, Outcast ceased being an equity method investee and, as of April 30, 2011, was a cost method investee with a carrying balance of
zero
. These transactions during fiscal 2011 resulted in our release under our guarantees of certain debt of Outcast and resulted in the repayment of various loans and advances we had made to Outcast and related parties of Outcast. These transactions resulted in a gain of approximately
$605
during fiscal 2011, which is included in other income.
On May 23, 2013, our Board of Directors declared a semi-annual dividend of
$0.12
per share on our common stock for the fiscal year ended
April 27, 2013
, payable on June 14, 2013 to holders of record of our common stock on June 3, 2013.
The following table presents summarized quarterly financial data:
|
Fiscal 2013 Quarter Ended
|
|||||||||||||||
|
July 28,
2012 |
October 27,
2012 |
January 26,
2013 |
April 27,
2013 |
||||||||||||
|
Net sales
|
$
|
132,919
|
|
$
|
149,871
|
|
$
|
111,050
|
|
$
|
124,482
|
|
|||
|
Gross profit
|
36,390
|
|
42,352
|
|
27,049
|
|
28,103
|
|
|||||||
|
Net income
|
6,678
|
|
11,547
|
|
2,710
|
|
1,844
|
|
|||||||
|
Basic earnings per share
|
0.16
|
|
0.27
|
|
0.06
|
|
0.04
|
|
|||||||
|
Diluted earnings per share
|
0.16
|
|
0.27
|
|
0.06
|
|
0.04
|
|
|||||||
|
Fiscal 2012 Quarter Ended
|
|||||||||||||||
|
July 30,
2011 |
October 29,
2011 |
January 28,
2012 |
April 28,
2012 |
||||||||||||
|
Net sales
|
$
|
118,698
|
|
$
|
135,910
|
|
$
|
122,925
|
|
$
|
111,994
|
|
|||
|
Gross profit
|
29,507
|
|
31,470
|
|
27,855
|
|
24,606
|
|
|||||||
|
Net income (loss)
|
3,368
|
|
3,959
|
|
1,666
|
|
(505
|
)
|
|||||||
|
Basic earnings (loss) per share
|
0.08
|
|
0.09
|
|
0.04
|
|
(0.01
|
)
|
|||||||
|
Diluted earnings (loss) per share
|
0.08
|
|
0.09
|
|
0.04
|
|
(0.01
|
)
|
|||||||
64
None.
Evaluation of Disclosure Controls and Procedures
Management of our company is responsible for establishing and maintaining effective disclosure controls and procedures as defined in Rules 13a-15(e) and 15d-15(e) under the Securities Exchange Act of 1934. As of
April 27, 2013
, an evaluation was performed, under the supervision and with the participation of management, including our Chief Executive Officer and Chief Financial Officer, of the effectiveness of the design and operation of our disclosure controls and procedures. Based upon that evaluation, the Chief Executive Officer and Chief Financial Officer concluded as of
April 27, 2013
, our disclosure controls and procedures were effective at the reasonable assurance level to ensure information required to be disclosed in this Annual Report on Form 10-K was recorded, processed, summarized and reported within the time period required by the SEC’s rules and forms and accumulated and communicated to management, including our Chief Executive Officer and Chief Financial Officer, to allow timely decisions regarding required disclosure.
Changes in Internal Control Over Financial Reporting
During the quarter ended
April 27, 2013
and thereafter, there have been no changes in our internal control over financial reporting to materially affect, or are reasonably likely to materially affect, our internal control over financial reporting.
Management’s Report on Internal Control Over Financial Reporting
Our management is responsible for establishing and maintaining adequate internal control over financial reporting, as such term is defined in Rule 13a-15(f) under the Securities Exchange Act of 1934. Our internal control system was designed to provide reasonable assurance to our management and board of directors regarding the preparation and fair presentation of published financial statements. All internal control systems, no matter how well designed, have inherent limitations. Therefore, even those systems determined to be effective can provide only reasonable assurance with respect to financial statement preparation and presentation.
Under the supervision and with the participation of our management, including our Chief Executive Officer and Chief Financial Officer, we conducted an evaluation of the effectiveness of our internal control over financial reporting based on the framework in Internal Control—Integrated Framework issued by the Committee of Sponsoring Organizations of the Treadway Commission. Based on our evaluation under the framework in Internal Control—Integrated Framework, our management concluded our internal control over financial reporting was effective as of
April 27, 2013
.
Our internal control over financial reporting as of
April 27, 2013
has been audited by Ernst & Young LLP, our independent registered public accounting firm, as stated in their report that follows.
|
By /s/ James B. Morgan
|
By /s/ Sheila M. Anderson
|
|
James B. Morgan
|
Sheila M. Anderson
|
|
Chief Executive Officer
|
Chief Financial Officer
|
|
June 12, 2013
|
June 12, 2013
|
65
REPORT OF INDEPENDENT REGISTERED PUBLIC ACCOUNTING FIRM
The Board of Directors and Shareholders
Daktronics, Inc.
We have audited Daktronics, Inc. and subsidiaries' internal control over financial reporting as of April 27, 2013, based on criteria established in
Internal Control-Integrated Framework
issued by the Committee of Sponsoring Organizations of the Treadway Commission (the COSO criteria). Daktronics, Inc.'s management is responsible for maintaining effective internal control over financial reporting, and for its assessment of the effectiveness of internal control over financial reporting included in the accompanying Management's Report on Internal Control Over Financial Reporting. Our responsibility is to express an opinion on the company's internal control over financial reporting based on our audit.
We conducted our audit in accordance with the standards of the Public Company Accounting Oversight Board (United States). Those standards require that we plan and perform the audit to obtain reasonable assurance about whether effective internal control over financial reporting was maintained in all material respects. Our audit included obtaining an understanding of internal control over financial reporting, assessing the risk that a material weakness exists, testing and evaluating the design and operating effectiveness of internal control based on the assessed risk, and performing such other procedures as we considered necessary in the circumstances. We believe that our audit provides a reasonable basis for our opinion.
A company's internal control over financial reporting is a process designed to provide reasonable assurance regarding the reliability of financial reporting and the preparation of financial statements for external purposes in accordance with generally accepted accounting principles. A company's internal control over financial reporting includes those policies and procedures that (1) pertain to the maintenance of records that, in reasonable detail, accurately and fairly reflect the transactions and dispositions of the assets of the company; (2) provide reasonable assurance that transactions are recorded as necessary to permit preparation of financial statements in accordance with generally accepted accounting principles, and that receipts and expenditures of the company are being made only in accordance with authorizations of management and directors of the company; and (3) provide reasonable assurance regarding prevention or timely detection of unauthorized acquisition, use, or disposition of the company's assets that could have a material effect on the financial statements.
Because of its inherent limitations, internal control over financial reporting may not prevent or detect misstatements. Also, projections of any evaluation of effectiveness to future periods are subject to the risk that controls may become inadequate because of changes in conditions, or that the degree of compliance with the policies or procedures may deteriorate.
In our opinion, Daktronics, Inc. and subsidiaries maintained, in all material respects, effective internal control over financial reporting as of April 27, 2013, based on the COSO criteria
.
We also have audited, in accordance with the standards of the Public Company Accounting Oversight Board (United States), the consolidated balance sheets of Daktronics, Inc. and subsidiaries as of April 27, 2013 and April 28, 2012, and the related consolidated statements of operations, comprehensive income, shareholders' equity, and cash flows for each of the three years in the period ended April 27, 2013, and our report dated June 12, 2013 expressed an unqualified opinion thereon.
/s/ Ernst & Young LLP
Minneapolis, Minnesota
June 12, 2013
66
None
The information required by this Item 10 will be included under the captions “Proposal One - Election of Directors” and “Corporate Governance” in our Proxy Statement for our 2013 annual meeting of shareholders (“Proxy Statement”) to be filed within 120 days after our most recent fiscal year-end. Information concerning the compliance of our officers, directors and 10 percent shareholders with Section 16(a) of the Securities Exchange Act of 1934 is incorporated by reference to the information to be contained in the Proxy Statement under the caption “Section 16(a) Beneficial Ownership Reporting Compliance.” The information regarding Audit Committee members and “Audit Committee Financial Experts” is incorporated by reference to the information to be contained in the Proxy Statement under the caption “Corporate Governance–Committees of the Board of Directors.” The information regarding our Code of Conduct is incorporated by reference to the information to be contained in the Proxy Statement under the heading “Corporate Governance – Code of Conduct.”
Information regarding the compensation of our directors and officers for the fiscal year ended April 27, 2013 will be in the Proxy Statement under the heading “Proposal One -Election of Directors” and “Executive Compensation” and is incorporated herein by reference.
We maintain a Code of Conduct which applies to all of our employees, officers and Directors. Included in the Code of Conduct are ethics provisions that apply to our Chief Executive Officer, Chief Financial Officer and all other financial and accounting management employees. A copy of our Code of Conduct can be obtained from our Internet website at
www.daktronics.com
on the Investor Relations page and will be made available free of charge to any shareholder upon request. Information on or available through our website is not part of this report. We intend to disclose any waivers from, or amendments to, the Code of Conduct by posting a description of such waiver or amendment on our Internet website. However, to date, we have not granted a waiver from the Code of Conduct.
The security ownership of certain beneficial owners and management will be contained in the Proxy Statement under the heading “Security Ownership of Certain Beneficial Owners and Management” and “Executive Compensation - Securities Authorized for Issuance Under Equity Compensation Plans” and is incorporated herein by reference.
Information required by this item is incorporated by reference from the sections entitled “Proposal One – Election of Directors – Independent Directors” and “Corporate Governance - Compensation Committee Interlocks and Insider Participation” contained in our Proxy Statement. There were no related party transactions in fiscal 2013.
Information regarding our principal accountant is under the heading “Proposal Four - Ratification of Appointment of Independent Registered Public Accounting Firm” in our Proxy Statement.
67
|
(a)(1)
|
Financial Statements
|
Our financial statements, a description of which follows, are contained in Part II, Item 8:
|
(2)
|
Schedules
|
The following financial statement schedule is submitted herewith:
Other schedules are omitted because they are not required or are not applicable or because the required information is included in the financial statements listed above.
|
(3)
|
Exhibits
|
Certain of the following exhibits are incorporated by reference from prior filings. The form with which each exhibit was filed and the date of filing are as indicated below.
|
3.1
|
Amended and Restated Articles of Incorporation of the Company (Incorporated by reference to Exhibit 3.1 filed with our Registration Statement on Form S-1 on December 3, 1993 as Commission File No. 33-72466).
|
|
|
3.2
|
Amendment to the Articles of Incorporation (Incorporated by reference to Exhibit 3.2 filed with our Annual Report on Form 10-K on July 28, 1999 as Commission File No. 0-23246).
|
|
|
3.3
|
Amendment to the Articles of Incorporation (Incorporated by reference to the Definitive Proxy Statement on Form DEF-14A filed on July 6, 2006 as Commission File 0-23246).
|
|
|
3.4
|
Amended and Restated Bylaws of the Company. (1)
|
|
|
4.1
|
Form of Stock Certificate evidencing Common Stock, without par value, of the Company (Incorporated by reference to Exhibit 4.1 filed with our Amendment No. 1 to the Registration Statement on Form S-1 on January 12, 1994 as Commission File No. 33-72466).
|
|
|
4.2
|
Shareholders Rights Agreement (Incorporated by reference to Exhibit 4.1 filed with our Form 8-A on August 29, 2008).
|
|
|
4.3
|
2001 Incentive Stock Option Plan (Incorporated by reference to Exhibit 4.1 to our Registration Statement on Form S-8 filed on November 8, 2001 as Commission File No. 333-72990).*
|
|
|
4.4
|
2001 Outside Directors Stock Option Plan (Incorporated by reference to Exhibit 4.2 to our Registration Statement on Form S-8 filed on November 8, 2001 as Commission File No. 333-72990).*
|
|
|
4.5
|
Daktronics, Inc. 2007 Incentive Stock Plan (Incorporated by reference to Exhibit 10.1 filed with our Quarterly Report on Form 10-Q on August 20, 2007 as Commission File No. 0-23246).*
|
|
|
10.1
|
Amended and Restated Deferred Compensation Agreement Between Daktronics, Inc. and Aelred Kurtenbach (Incorporated by reference to Exhibit 10.1 filed with our Annual Report on Form 10-K on June 28, 2004 as Commission File No. 0-23246).*
|
|
|
10.2
|
Amended and Restated Deferred Compensation Agreement Between Daktronics, Inc. and Frank Kurtenbach (Incorporated by reference to Exhibit 10.2 filed with our Annual Report on Form 10-K on June 28, 2004 as Commission File No. 0-23246.)*
|
|
|
10.3
|
Amended and Restated Deferred Compensation Agreement Between Daktronics, Inc. and James Morgan (Incorporated by reference to Exhibit 10.3 filed with our Annual Report on Form 10-K on June 28, 2004 as Commission File No. 0-23246).*
|
|
68
|
10.4
|
Loan Agreement dated October 14, 1998 between U.S. Bank National Association and Daktronics, Inc. (Incorporated by reference to Exhibit 10.6 filed with our Quarterly Report on Form 10-Q filed on December 11, 1998 as Commission File No. 0-23246).
|
|
|
10.5
|
Eighth Amendment to Loan Agreement dated November 12, 2009 by and between Daktronics, Inc. and U.S. Bank National Association (Incorporate by reference to Exhibit 10.1 filed with our Current Report on Form 8-K filed on November 12, 2009).
|
|
|
10.6
|
Tenth Amendment to Loan Agreement dated November 15, 2011 by and between Daktronics, Inc. and U.S. Bank National Association (Incorporated by reference to Exhibit 10.1 filed with our Current Report on Form 8-K filed on November 17, 2011).
|
|
|
10.7
|
Eleventh Amendment to Loan Agreement dated November 9, 2012 by and between the Company and U.S. Bank National Association (Incorporated by reference to Exhibit 10.1 filed with our Current Report on Form 8-K filed on November 9, 2012).
|
|
|
10.8
|
Renewal Revolving Note Dated November 9, 2012 between the Company and U.S. Bank National Association
(Incorporated by reference to Exhibit 10.2 filed with our Current Report on Form 8-K filed on November 9, 2012).
|
|
|
10.9
|
Loan Agreement Dated December 23, 2010 between Daktronics, Inc. and Bank of America, N.A. (Incorporated by reference to Exhibit 10.3 filed with our Current Report on Form 8-K filed on November 17, 2011).
|
|
|
10.10
|
Second Amendment to Loan Agreement Dated November 15, 2011 by and between Daktronics, Inc. and Bank of America, N.A. (Incorporated by reference to Exhibit 10.5 filed with our Current Report on Form 8-K filed on November 17, 2011).
|
|
|
10.11
|
Third Amendment to Loan Agreement dated July 2, 2012 by and between the Company and Bank of America, N.A. (Incorporated by reference to Exhibit 10.1 filed with our Current Report on Form 8-K filed on July 3, 2012).
|
|
|
10.12
|
Fourth Amendment to Loan Agreement dated November 9, 2012 by and between the Company and Bank of America, N.A. (Incorporated by reference to Exhibit 10.3 filed with our Current Report on Form 8-K filed on November 9, 2012).
|
|
|
10.13
|
Reaffirmation and Second Amendment to Unlimited Guaranty Agreement dated November 9, 2012 by and between the Company and Bank of America, N.A. (Incorporated by reference to Exhibit 10.4 filed with our Current Report on Form 8-K filed on November 9, 2012).
|
|
|
10.14
|
Amended and Restated Revolving Note Dated November 9, 2012 between the Company and Bank of America, N.A. (Incorporated by reference to Exhibit 10.5 filed with our Current Report on Form 8-K filed on November 9, 2012).
|
|
|
10.15
|
Separation Agreement dated October 7, 2012 by and between the Company and William R. Retterath (Incorporated by reference to Exhibit 10.1 filed with our Current Report on Form 8-K filed on October 12, 2012).*
|
|
|
21.1
|
Subsidiaries of the Company. (1)
|
|
|
23.1
|
Consent of Ernst & Young LLP. (1)
|
|
|
24
|
Power of Attorney. (1)
|
|
|
31.1
|
Certification of the Chief Executive Officer required by Rule 13a-14(a) or Rule 15d-14(a) under the Securities Exchange Act of 1934, as adopted pursuant to Section 302 of the Sarbanes-Oxley Act of 2002. (1)
|
|
|
31.2
|
Certification of the Chief Financial Officer required by Rule 13a-14(a) or Rule 15d-14(a) under the Securities Exchange Act of 1934, as adopted pursuant to Section 302 of the Sarbanes-Oxley Act of 2002. (1)
|
|
|
32.1
|
Certification of the Chief Executive Officer pursuant to Section 906 of the Sarbanes-Oxley Act of 2002 (18 U.S.C. Section 1350). (1)
|
|
|
32.2
|
Certification of the Chief Financial Officer pursuant to Section 906 of the Sarbanes-Oxley Act of 2002 (18 U.S.C. Section 1350). (1)
|
|
|
101
|
The following financial information from our Annual Report on Form 10-K for the fiscal year ended April 27, 2013, formatted in Extensible Business Reporting Language (XBRL): (i) Consolidated Balance Sheets, (ii) Consolidated Statements of Operations, (iii) Consolidated Statements of Comprehensive Income, (iv) Consolidated Statements of Shareholders' Equity, (v) Consolidated Statements of Cash Flows, and (vi) Notes to Consolidated Financial Statements. (1) (2)
|
|
|
|
(1)
|
Filed herewith electronically.
|
|
(2)
|
Pursuant to Rule 406T of Regulation S-T, the XBRL related information in Exhibit 101 to this Annual Report on Form 10-K shall not be deemed to be “filed” for purposes of Section 18 of the Securities Exchange Act of 1934 (the “Exchange Act”), or otherwise subject to the liability of that section, and shall not be deemed part of a registration statement, prospectus or other document filed under the Securities Act of 1933 or the Exchange Act, except as shall be expressly set forth by specific reference in such filings.
|
|
|
*
|
Indicates a management contract or compensatory plan or arrangement.
|
|
All Sport
®
, Daktronics
®
, DakStats
®
, DataTime
®
, Fuelight
™
, Fuelink
™
, Galaxy
®
, GalaxyPro
™
, OmniSport
®
, ProAd
®
, ProPixel
®
, ProRail
®
, ProStar
®
, ProTour
®
, Sportsound
®
, Valo
®
, Vanguard
®
, Venus
®
, V-Net
®
, Visiconn
®
, V-Tour
®
, V-Link
®
, and Vortek
®
are trademarks of Daktronics, Inc. All other trademarks referenced are the intellectual property of their respective companies.
69
SIGNATURES
Pursuant to the requirements of Section 13 or 15(d) of the Securities Exchange Act of 1934, the Registrant has duly caused this Annual Report to be signed on its behalf by the undersigned, thereunto duly authorized, on June 12, 2013.
|
|
DAKTRONICS, INC.
|
|
|
|
By:
/s/ James B. Morgan
|
|
|
|
|
Chief Executive Officer and President
|
|
|
|
(Principal Executive Officer)
|
|
|
|
|
|
|
By: /s/ Sheila M. Anderson
|
|
|
|
|
Chief Financial Officer
|
|
|
|
(Principal Financial Officer and Principal Accounting Officer)
|
Pursuant to the requirements of the Securities Exchange Act of 1934, this report has been signed below by the following persons on behalf of the Registrant and in the capacities and on the dates indicated.
|
Signature
|
Title
|
Date
|
|
|
|
|
|
|
|
By /s/ Byron J. Anderson
|
Director
|
June 12, 2013
|
|
|
|
Byron J. Anderson
|
|
|
|
|
|
|
|
|
By /s/ Robert G. Dutcher
|
Director
|
June 12, 2013
|
|
|
|
Robert G. Dutcher
|
|
|
|
|
|
|
|
|
By /s/ Nancy D. Frame
|
Director
|
June 12, 2013
|
|
|
|
Nancy D. Frame
|
|
|
|
|
|
|
|
|
By /s/ Aelred J. Kurtenbach
|
Director
|
June 12, 2013
|
|
|
|
Aelred J. Kurtenbach
|
|
|
|
|
|
|
|
|
By /s/ Reece A. Kurtenbach
|
Director
|
June 12, 2013
|
|
|
|
Reece A. Kurtenbach
|
|
|
|
|
|
|
|
|
By /s/ James B. Morgan
|
Director
|
June 12, 2013
|
|
|
|
James B. Morgan
|
|
|
|
|
|
|
|
|
By /s/ John L. Mulligan
|
Director
|
June 12, 2013
|
|
|
|
John L. Mulligan
|
|
|
|
|
|
|
|
|
By /s/ Bruce W. Tobin
|
Director
|
June 12, 2013
|
|
|
|
Bruce W. Tobin
|
|
|
|
|
|
|
|
|
By /s/ James A. Vellenga
|
Director
|
June 12, 2013
|
|
|
|
James A. Vellenga
|
|
|
70
|
DAKTRONICS, INC. AND SUBSIDIARIES
SCHEDULE II - VALUATION AND QUALIFYING ACCOUNTS
Years Ended April 27, 2013, April 28, 2012 and April 30, 2011
(in thousands)
|
|||||||||||||||||||
|
Additions
|
|||||||||||||||||||
|
Description
|
Balance at
Beginning of Year |
Charged to
Costs and
Expenses
|
Charged to
Other Accounts |
Deductions
|
Balance
at End of Year |
||||||||||||||
|
For the year ended April 27, 2013:
|
|||||||||||||||||||
|
Deducted from asset accounts:
|
|||||||||||||||||||
|
Allowance for doubtful accounts
|
$
|
2,398
|
|
$
|
782
|
|
$
|
—
|
|
$
|
(462
|
)
|
(2)
|
$
|
2,718
|
|
|||
|
Allowance for excess and obsolete inventories
|
2,851
|
|
3,094
|
|
1
|
|
(1)
|
(2,660
|
)
|
(3)
|
3,286
|
|
|||||||
|
For the year ended April 28, 2012:
|
|||||||||||||||||||
|
Deducted from asset accounts:
|
|||||||||||||||||||
|
Allowance for doubtful accounts
|
2,548
|
|
110
|
|
—
|
|
(260
|
)
|
(2)
|
2,398
|
|
||||||||
|
Allowance for excess and obsolete inventories
|
2,139
|
|
2,537
|
|
11
|
|
(1)
|
(1,836
|
)
|
(3)
|
2,851
|
|
|||||||
|
For the year ended April 30, 2011:
|
|||||||||||||||||||
|
Deducted from asset accounts:
|
|||||||||||||||||||
|
Allowance for doubtful accounts
|
2,585
|
|
101
|
|
—
|
|
(138
|
)
|
(2)
|
2,548
|
|
||||||||
|
Allowance for excess and obsolete inventories
|
3,414
|
|
2,131
|
|
10
|
|
(1)
|
(3,416
|
)
|
(3)
|
2,139
|
|
|||||||
(1)
Translation adjustment on foreign subsidiary balances.
(2)
Write-off of uncollected accounts, net of collections.
(3)
Obsolete and excess inventory disposals
71
Index of Exhibits
Certain of the following exhibits are incorporated by reference from prior filings. The form with which each exhibit was filed and the date of filing are as indicated below.
|
3.1
|
Amended and Restated Articles of Incorporation of the Company (Incorporated by reference to Exhibit 3.2 filed with our Registration Statement on Form S-1 on December 3, 1993 as Commission File No. 33-72466).
|
|
|
3.2
|
Amendment to the Articles of Incorporation (Incorporated by reference to Exhibit 3.3 filed with our Annual Report on Form 10-K on July 28, 1999 as Commission File No. 0-23246).
|
|
|
3.3
|
Amendment to the Articles of Incorporation (Incorporated by reference to the Definitive Proxy Statement on Form DEF-14A filed on July 6, 2006 as Commission File 0-23246).
|
|
|
3.4
|
Amended and Restated Bylaws of the Company. (1)
|
|
|
4.1
|
Form of Stock Certificate evidencing Common Stock, without par value, of the Company (Incorporated by reference to Exhibit 4.1 filed with our Amendment No. 1 to the Registration Statement on Form S-1 on January 12, 1994 as Commission File No. 33-72466).
|
|
|
4.2
|
Shareholders Rights Agreement (Incorporated by reference to Exhibit 4.1 filed with our Form 8-A on August 29, 2008).
|
|
|
4.3
|
2001 Incentive Stock Option Plan (Incorporated by reference to Exhibit 4.1 to our Registration Statement on Form S-8 filed on November 8, 2001 as Commission File No. 333-72990).*
|
|
|
4.4
|
2001 Outside Directors Stock Option Plan (Incorporated by reference to Exhibit 4.2 to our Registration Statement on Form S-8 filed on November 8, 2001 as Commission File No. 333-72990).*
|
|
|
4.5
|
Daktronics, Inc. 2007 Incentive Stock Plan (Incorporated by reference to Exhibit 10.1 filed with our Quarterly Report on Form 10-Q on August 20, 2007 as Commission File No. 0-23246).*
|
|
|
10.1
|
Amended and Restated Deferred Compensation Agreement Between Daktronics, Inc. and Aelred Kurtenbach (Incorporated by reference to Exhibit 10.1 filed with our Annual Report on Form 10-K on June 28, 2004 as Commission File No. 0-23246).*
|
|
|
10.2
|
Amended and Restated Deferred Compensation Agreement Between Daktronics, Inc. and Frank Kurtenbach (Incorporated by reference to Exhibit 10.2 filed with our Annual Report on Form 10-K on June 28, 2004 as Commission File No. 0-23246.)*
|
|
|
10.3
|
Amended and Restated Deferred Compensation Agreement Between Daktronics, Inc. and James Morgan (Incorporated by reference to Exhibit 10.3 filed with our Annual Report on Form 10-K on June 28, 2004 as Commission File No. 0-23246).*
|
|
|
10.4
|
Loan Agreement dated October 14, 1998 between U.S. Bank National Association and Daktronics, Inc. (Incorporated by reference to Exhibit 10.6 filed with our Quarterly Report on Form 10-Q filed on December 11, 1998 as Commission File No. 0-23246).
|
|
|
10.5
|
Eighth Amendment to Loan Agreement dated November 12, 2009 by and between Daktronics, Inc. and U.S. Bank National Association (Incorporate by reference to Exhibit 10.1 filed with our Current Report on Form 8-K filed on November 12, 2009).
|
|
|
10.6
|
Tenth Amendment to Loan Agreement dated November 15, 2011 by and between Daktronics, Inc. and U.S. Bank National Association (Incorporated by reference to Exhibit 10.1 filed with our Current Report on Form 8-K filed on November 17, 2011).
|
|
|
10.7
|
Eleventh Amendment to Loan Agreement dated November 9, 2012 by and between the Company and U.S. Bank National Association (Incorporated by reference to Exhibit 10.1 filed with our Current Report on Form 8-K filed on November 9, 2012).
|
|
|
10.8
|
Renewal Revolving Note Dated November 9, 2012 between the Company and U.S. Bank National Association (Incorporated by reference to Exhibit 10.2 filed with our Current Report on Form 8-K filed on November 9, 2012).
|
|
|
10.9
|
Loan Agreement Dated December 23, 2010 between Daktronics, Inc. and Bank of America, N.A. (Incorporated by reference to Exhibit 10.3 filed with our Current Report on Form 8-K filed on November 17, 2011).
|
|
|
10.10
|
Second Amendment to Loan Agreement Dated November 15, 2011 by and between Daktronics, Inc. and Bank of America, N.A. (Incorporated by reference to Exhibit 10.5 filed with our Current Report on Form 8-K filed on November 17, 2011).
|
|
|
10.11
|
Third Amendment to Loan Agreement dated July 2, 2012 by and between the Company and Bank of America, N.A. (Incorporated by reference to Exhibit 10.1 filed with our Current Report on Form 8-K filed on July 3, 2012).
|
|
|
10.12
|
Fourth Amendment to Loan Agreement dated November 9, 2012 by and between the Company and Bank of America, N.A. (Incorporated by reference to Exhibit 10.3 filed with our Current Report on Form 8-K filed on November 9, 2012).
|
|
|
10.13
|
Reaffirmation and Second Amendment to Unlimited Guaranty Agreement dated November 9, 2012 by and between the Company and Bank of America, N.A. (Incorporated by reference to Exhibit 10.4 filed with our Current Report on Form 8-K filed on November 9, 2012).
|
|
|
10.14
|
Amended and Restated Revolving Note Dated November 9, 2012 between the Company and Bank of America, N.A. (Incorporated by reference to Exhibit 10.5 filed with our Current Report on Form 8-K filed on November 9, 2012).
|
|
72
|
10.15
|
Separation Agreement dated October 7, 2012 by and between the Company and William R. Retterath (Incorporated by reference to Exhibit 10.1 filed with our Current Report on Form 8-K filed on October 12, 2012).*
|
|
|
21.1
|
Subsidiaries of the Company. (1)
|
|
|
23.1
|
Consent of Ernst & Young LLP. (1)
|
|
|
24
|
Power of Attorney. (1)
|
|
|
31.1
|
Certification of the Chief Executive Officer required by Rule 13a-14(a) or Rule 15d-14(a) under the Securities Exchange Act of 1934, as adopted pursuant to Section 302 of the Sarbanes-Oxley Act of 2002. (1)
|
|
|
31.2
|
Certification of the Chief Financial Officer required by Rule 13a-14(a) or Rule 15d-14(a) under the Securities Exchange Act of 1934, as adopted pursuant to Section 302 of the Sarbanes-Oxley Act of 2002. (1)
|
|
|
32.1
|
Certification of the Chief Executive Officer pursuant to Section 906 of the Sarbanes-Oxley Act of 2002 (18 U.S.C. Section 1350). (1)
|
|
|
32.2
|
Certification of the Chief Financial Officer pursuant to Section 906 of the Sarbanes-Oxley Act of 2002 (18 U.S.C. Section 1350). (1)
|
|
|
101
|
The following financial information from our Annual Report on Form 10-K for the fiscal year ended April 27, 2013, formatted in Extensible Business Reporting Language (XBRL): (i) Consolidated Balance Sheets, (ii) Consolidated Statements of Operations, (iii) Consolidated Statements of Comprehensive Income, (iv) Consolidated Statements of Shareholders' Equity, (v) Consolidated Statements of Cash Flows, and (vi) Notes to Consolidated Financial Statements. (1) (2)
|
|
|
|
(1)
|
Filed herewith electronically.
|
|
(2)
|
Pursuant to Rule 406T of Regulation S-T, the XBRL related information in Exhibit 101 to this Annual Report on Form 10-K shall not be deemed to be “filed” for purposes of Section 18 of the Securities Exchange Act of 1934 (the “Exchange Act”), or otherwise subject to the liability of that section, and shall not be deemed part of a registration statement, prospectus or other document filed under the Securities Act of 1933 or the Exchange Act, except as shall be expressly set forth by specific reference in such filings.
|
|
|
*
|
Indicates a management contract or compensatory plan or arrangement.
|
|
73
TABLE OF CONTENTS
Part IItem 1. BusinessItem 1A. Risk FactorsItem 1B. Unresolved Staff CommentsItem 2. PropertiesItem 3. Legal ProceedingsItem 4. Mine Safety DisclosuresPart IIItem 5. Market For Registrant S Common Equity, Related Stockholder Matters and Issuer Purchases Of Equity SecuritiesItem 6. Selected Financial Data (in Thousands, Except Per Share Data)Item 6. Selected Financial DataItem 7. Management S Discussion and Analysis Of Financial Condition and Results Of OperationsItem 7A. Quantitative and Qualitative Disclosures About Market RiskItem 8. Financial Statements and Supplementary DataNote 1. Nature Of Business and Summary Of Significant Accounting PoliciesNote 2. Segment ReportingNote 3. Marketable SecuritiesNote 4. Long-lived AssetsNote 5. Selected Financial Statement DataNote 6. Uncompleted ContractsNote 7. ReceivablesNote 8. Financing AgreementsNote 9. Shareholders Equity and Share-based CompensationNote 10. Employee Benefit PlansNote 11. Income TaxesNote 12. Cash Flow InformationNote 13. Fair Value MeasurementNote 14. Derivative Financial InstrumentsNote 15. Commitments and ContingenciesNote 16. Investments in Affiliates and Related Party TransactionsNote 17. Subsequent EventsNote 18. Quarterly Financial Data (unaudited)Item 9. Changes in and Disagreements with Accountants on Accounting and Financial DisclosureItem 9A. Controls and ProceduresItem 9B. Other InformationPart IIIItem 10. Directors, Executive Officers and Corporate GovernanceItem 11. Executive CompensationItem 12. Security Ownership Of Certain Beneficial Owners and Management and Related Stockholder MattersItem 13. Certain Relationships and Related Transactions and Director IndependenceItem 14. Principal Accountant Fees and ServicesPart IVItem 15. Exhibits and Financial Statement Schedules