DAKTRONICS INC /SD/
10-Ks and 10-Qs
|
|
|
|
|
|
|
|
|
|
|
|
|
|
|
|
|
|
|
|
|
|
|
|
|
|
|
|
|
|
|
|
|
|
|
|
|
|
|
|
|
|
|
|
|
|
|
|
|
|
|
|
|
|
|
|
|
|
|
|
|
|
|
|
|
|
|
|
UNITED STATES
SECURITIES AND EXCHANGE COMMISSION
Washington, D.C. 20549
FORM 10-K
(Mark One)
x
ANNUAL REPORT PURSUANT TO SECTION 13 OR 15(d) OF THE SECURITIES EXCHANGE ACT OF 1934
For the Fiscal Year Ended
April 30, 2016
OR
o
TRANSITION REPORT PURSUANT TO SECTION 13 OR 15(d) OF THE SECURITIES EXCHANGE ACT OF 1934
For the Transition Period From ___ to ___.
Commission File Number: 0-23246

Daktronics, Inc.
(Exact name of Registrant as specified in its charter)
|
South Dakota
(State or other jurisdiction of
incorporation or organization)
|
|
46-0306862
(I.R.S. Employer Identification No.)
|
|
|
|
|
|
201 Daktronics Drive
Brookings SD
|
|
57006 |
|
(Address of principal executive offices)
|
|
(Zip Code)
|
(605) 692-0200
(Registrant’s telephone number, including area code)
Securities registered pursuant to Section 12(b) of the Act:
|
Title of Each Class
|
|
Name of Each Exchange on Which Registered
|
|
Common Stock, No Par Value
|
|
NASDAQ Global Select Market
|
|
Common Stock Purchase Rights
|
|
NASDAQ Global Select Market
|
Securities registered pursuant to Section 12(g) of the Act: None
Indicate by check mark if the registrant is a well-known seasoned issuer, as defined in Rule 405 of the Securities Act. Yes
o
No
x
Indicate by check mark if the registrant is not required to file reports pursuant to Section 13 or Section 15(d) of the Act. Yes
o
No
x
Indicate by check mark whether the registrant (1) has filed all reports required to be filed by Section 13 or 15(d) of the Securities Exchange Act of 1934 during the preceding 12 months (or for such shorter period that the registrant was required to file such reports), and (2) has been subject to such filing requirements for the past 90 days. Yes
x
No
o
Indicate by check mark whether the registrant has submitted electronically and posted on its corporate website, if any, every Interactive Data File required to be submitted and posted pursuant to Rule 405 of Regulation S-T during the preceding 12 months (or for such shorter period that the registrant was required to submit and post such files) . Yes
x
No
o
Indicate by check mark if disclosure of delinquent filers pursuant to Item 405 of Regulation S-K is not contained herein, and will not be contained, to the best of the registrant’s knowledge, in definitive proxy or information statements incorporated by reference in Part III of this Form 10-K or any amendment to this Form 10-K.
x
Indicate by check mark whether the registrant is a large accelerated filer, an accelerated filer, a non-accelerated filer or a smaller reporting company. See the definitions of “large accelerated filer,” “accelerated filer” and “smaller reporting company” in Rule 12b-2 of the Exchange Act. (Check one):
|
Large accelerated filer
|
o
|
Accelerated filer
|
x
|
|
Non-accelerated filer
|
o
|
Smaller reporting company
|
o
|
|
(Do not check if a smaller reporting company.)
|
|||
Indicate by check mark whether the registrant is a shell company (as defined in Rule 12b-2 of the Exchange Act). Yes
o
No
x
The aggregate market value of the registrant's common stock held by non-affiliates at
October 31, 2015
(which is the last business day at the Registrant’s most recently completed second quarter), computed by reference to the closing sales price of the Registrant’s common stock on the NASDAQ Stock Market on such date, was approximately
$425,476,920
. For purposes of determining this number, individual shareholders holding more than 10 percent of the Registrant’s outstanding Common Stock are considered affiliates. This number is provided only for the purpose of this Annual Report on Form 10-K and does not represent an admission by either the Registrant or any such person as to the status of such person.
The number of shares of the Registrant’s Common Stock outstanding as of
June 13, 2016
was
44,093,054
.
Documents Incorporated By Reference
Portions of the Registrant’s Proxy Statement for its Annual Meeting of Shareholders to be held
August 31, 2016
are incorporated by reference in Part III of the Form 10-K, as indicated in Items 10 through 14 of Part III.
DAKTRONICS, INC. AND SUBSIDIARIES
FORM 10-K
FOR THE FISCAL YEAR ENDED
APRIL 30, 2016
Table of Contents
|
|
Page
|
||
|
|
|||
|
|
|||
|
|
|||
|
|
|||
|
|
|||
|
|
|||
SPECIAL NOTE REGARDING FORWARD–LOOKING STATEMENTS
This Annual Report on Form 10-K (including exhibits and any information incorporated by reference herein) (the "Form 10-K" or the "Report") contains both historical and forward-looking statements that involve risks, uncertainties and assumptions. The statements contained in this Report that are not purely historical are forward-looking statements within the meaning of Section 27A of the Securities Act of 1933, as amended, and Section 21B of the Securities Exchange Act of 1934, as amended, including statements regarding our expectations, beliefs, intentions and strategies for the future. These statements appear in a number of places in this Report and include all statements that are not historical statements of fact regarding the intent, belief or current expectations with respect to, among other things: (i.) our competition; (ii.) our financing plans; (iii.) trends affecting our financial condition or results of operations; (iv.) our growth strategy and operating strategy; (v.) the declaration and payment of dividends; (vi.) the timing and magnitude of future contracts; (vii.) parts shortages and lead times; (viii.) fluctuations in margins; (ix.) the seasonality of our business; (x.) the introduction of new products and technology; and (xi.) the timing and magnitude of any acquisitions or dispositions. The words “may,” “would,” “could,” “should,” “will,” “expect,” “estimate,” “anticipate,” “believe,” “intend,” “plans” and similar expressions and variations thereof are intended to identify forward-looking statements. Investors are cautioned that any such forward-looking statements are not guarantees of future performance and involve risk and uncertainties, many of which are beyond our ability to control, and that actual results may differ materially from those projected in the forward-looking statements as a result of various factors discussed herein, including those discussed in the section of this Form 10-K entitled “Item 1A. Risk Factors” and “Item 7. Management’s Discussion and Analysis of Financial Condition and Results of Operations,” and those factors discussed in detail in our other filings with the Securities and Exchange Commission.
PART I.
Item 1. BUSINESS
Business Overview
Daktronics, Inc. (the “Company”, “Daktronics”, “we”, “our”, or “us”) is a world-leading supplier of electronic scoreboards, large electronic display systems, digital messaging solutions, software and services for sporting, commercial and transportation applications. We serve our customers by providing the highest quality standard display products as well as custom-designed and integrated systems. We offer a complete line of products, from small scoreboards and electronic displays to large multi-million dollar video display systems as well as related control, timing, and sound systems. We are recognized as a technical leader with the capabilities to design, market, manufacture, install and service complete integrated systems displaying real-time data, graphics, animation and video.
We were founded in 1968 by Drs. Aelred Kurtenbach and Duane Sander, professors of electrical engineering at South Dakota State University in Brookings, South Dakota. The Company began with the design and manufacture of electronic voting systems for state legislatures. In 1971, Daktronics developed the patented Matside® wrestling scoreboard, the first product in the Company's growing and evolving line. In 1994, Daktronics became a publicly traded company, offering shares under the symbol DAKT on the NASDAQ National Market system. Today, Daktronics has grown from a small company operating out of a garage to a world leader, offering the most complete product lineup in the display industry.
We have organized our business into five segments: Commercial, Live Events, High School Park and Recreation, Transportation, and International. These segments are based on the type of customer or geography and are the same as our business units. Financial information concerning these segments is set forth in this Form 10-K in "Part II, Item 7. Management’s Discussion and Analysis of Financial Condition and Results of Operations" and "
Note 2. Segment Reporting
" of the Notes to our Consolidated Financial Statements included in this Form 10-K.
We make significant investments to complement and develop our existing innovative, high quality products. We employ engineering expertise with electrical, mechanical, and software design capabilities. In addition, we invest in quality and reliability capabilities, process development and testing capabilities, and sourcing processes.
We strive to grow into new geographic markets by strategically adding resources and emerging markets. Three of our targeted acquisitions were in fiscal 2014, 2015, and 2016; these acquisitions support our long-term growth objectives which are to increase sales and profitability. For more information regarding these acquisitions, see "
Note 4. Business Combinations
" of the Notes to our Consolidated Financial Statements included in this Form 10-K.
Our annual, quarterly and current reports and any amendments to those reports are filed with the Securities and Exchange Commission (“SEC”) and are available at http://investor.daktronics.com. We post each of these documents on our website as soon as reasonably practicable after it is electronically filed with the SEC. These reports also may be found on the SEC’s website at www.sec.gov. Information contained on our website is not deemed to be incorporated by reference into this Report or filed with the SEC.
1
Industry Background
Over the years, our products have evolved significantly from scoreboards and matrix displays with related software applications to complex, integrated visual display systems which include full color video with text and graphics displays located on a local or remote network that are tied together through sophisticated control systems. In the mid-1990's, as light emitting diodes (“LEDs”) became available in red, blue and green colors with outdoor brightness, we pioneered the development of full color LED video displays capable of replicating trillions of colors, thereby producing large format video systems with excellent color, brightness, energy efficiency and lifetime. Due to our foundation of developing scoring and graphics display systems, we were able to add video capabilities so all of our customers' large format display needs could be met in a complete, integrated system. This has proven to be a key factor in Daktronics becoming a leader in large electronic displays.
Description of Business
We are engaged in a full range of activities: marketing and sales, engineering and product development, manufacturing, technical contracting, professional services and customer service and support. Each of those activities is described below:
Marketing and Sales.
Our sales force is comprised of direct sales staff and resellers located throughout the world supporting all customer types in both sales and service. We primarily use a direct sales force for large integrated display systems sales in professional sports, colleges and universities, and commercial spectacular projects. We use our direct sales force to sell third-party advertising and transportation applications. We utilize resellers outside North America for large integrated system sales where we do not have a direct sales presence. The majority of the products sold by resellers in North America are standard catalog products. We support our resellers through direct mail advertising, trade journal advertising, product and installation training, trade show exhibitions and accessibility to our regional sales or service teams.
Engineering and Product Development.
The large format electronic display industry is characterized by ongoing product innovations and developments in technology and complementary services. To remain competitive, we have a tradition of applying engineering resources throughout our business to anticipate and respond rapidly to the system needs in the marketplace. We employ engineers and technicians in the areas of mechanical and electrical design; applications engineering; software design; quality design; and customer and product support. We assign product managers to each product family to assist our sales staff in training and implementing product improvements which ensures each product is designed for maximum reliability and serviceability. We employ process engineers to assist in quality and reliability processing in our product design testing and manufacturing areas.
Manufacturing.
A majority of our products are manufactured in the United States, specifically in South Dakota and Minnesota. We also have manufacturing facilities in China, Belgium, and Ireland. For more details on our facilities, see "Item 2. Properties."
Our manufacturing is somewhat aligned with our business segments and is co-located with product development to accelerate technology improvements and improve our cost structure. We perform component manufacturing, system manufacturing (metal fabrication, electronic assembly, sub-assembly and final assembly) and testing in-house for most of our products to control quality, improve response time and maximize cost-effectiveness. We make our products in focused factories and product cells. We generally align sales, marketing, engineering and manufacturing into a cohesive business unit with a focus on customers. Given the cyclical nature of some parts of our business, we also need to balance and maintain our ability to manufacture the same products across our plants so we can smooth out the customer demand of the various business units. A key strategy of ours is to increase standardization and commonality of parts and manufacturing processes across product lines through product platform strategies.
Our manufacturing facilities have embraced lean manufacturing techniques throughout all areas. We have also placed significant emphasis on lean techniques in the non-manufacturing areas. Our goal is to eliminate waste and timely deliver products to a customer while maintaining minimal inventory and eliminating non-value added tasks.
Technical Contracting.
We serve as a technical contractor for larger display system installations requiring custom designs and innovative product solutions. The purchase of display systems typically involves competitive proposals. As part of our response to a proposal request, we may suggest additional products or features to assist the prospective customer in analyzing the optimal type of display system. We usually include site preparation and installation services related to the display system in our proposal. In these cases, we serve as a contractor and may retain subcontractors for electrical, steel and installation labor. We have developed relationships with many subcontractors throughout the United States and the world, which is an advantage for us in bidding and delivering on these projects. We are licensed in a number of jurisdictions as a general contractor.
Professional Services.
Our professional services are essential to continued market penetration and growth. Professional services include event support, content creation, product maintenance, marketing assistance, training on hardware and software, control room design, and continuing technical support for operators.
2
Customer Service and Support.
We offer limited warranties on our products, ranging from one to 10 years, against failure due to defective parts or workmanship. In addition, we offer service agreements of various scopes. To serve our customers we provide help-desk access, parts repair and replacement, display monitoring and on-site support. Our technical help desk has experienced technicians who are on-call 24 hours a day to support events and sites. Our field service personnel and third-party service partners are trained to provide on-site support. We use third-party service partners to allow us to respond to changes in volume of service during our seasonal peaks.
Products and Technologies
The two principal components of our systems are the display and the controller, which manages the operation of the display. We produce displays varying in complexity, size and resolution. The physical dimensions of a display depend on the size of the viewing area, the distance from the viewer to the display, and the amount and type of information to be displayed. The controller is comprised of computer hardware and software products designed to compile information provided by the operator and other integrated sources to display information, graphics or animation on the displays. We customize our products according to the design specifications of the customer and the conditions of the environment in which our products function.
Our products are comprised of the following product families, all of which include control systems and software:
•
Video displays
•
Scoreboards and timing systems
•
Message displays
•
ITS (intelligent transportation systems) dynamic message signs
•
Space availability displays
•
Audio systems
•
Advertising displays
•
Digit and price displays
•
Digital messaging systems
Each of these product families is described below:
Video Displays.
These displays are comprised of a large number of full-color pixels capable of showing various levels of video, graphics and animation plus controllers. These displays include red, green and blue LEDs arranged in various combinations to form pixels. The electronic circuitry which controls the pixels allows for variances in the relative brightness of each LED to provide a full color spectrum, thereby displaying video images in striking, vibrant colors. Variables in video displays include the spacing of the pixels (pixel pitch), the resolution of the displays (number of pixels), the brightness of the displays (nits), the number of discrete colors the display is able to produce (color depth), the viewing angles, and the LED mount technology (surface mount vs. through hole).
Our LED ribbon board displays are ultra-slim, customizable displays that accommodate curved and 360° installations. These displays are used for end zones, sidelines, encircling a stadium, outfields, concourses, stadium exterior or other linear applications. For new construction projects, our ProRail® attachment system is combined with ribbon board technology to provide improved sight lines for fans. Digital ribbon boards generally serve as a revenue generation source for teams and facilities through advertising, as well as another location to display information such as scoring and statistics.
Our mobile and modular display systems are transportable and are comprised of lightweight individual LED video panels less than a square meter in size and are assembled together to form a display in a customizable size. These displays are used for touring shows and the events market.
Our display technology may be integrated with architectural mesh to deliver a dynamic communication medium that provides a semi-transparent viewing experience within a building. These displays can be mounted over a solid facade or in front of windows resulting in a finished solution that is free from visible cabling, and delivers a clean, semi-transparent view. These are less than one inch in depth and provide an elegant, refined structural appearance.
Our line of Freeform LED displays are architectural lighting and display products. The ProPixel® freeform products use mountable LED elements to transform ordinary structures into stunning visual landmarks. A flexible mounting platform allows designers to transform any structure into a full-motion video display.
The control components for video displays in live event applications are our Show Control Software Suite, proprietary digital media players and video processors. These control components provide advanced capabilities for the display of live video and real time content on our displays. The Show Control Software Suite can operate entire networks of displays from a single, intuitive control interface. Features allow users to instantly deliver media clips, camera feeds, and streaming information to any display in a network.
3
Scoreboards and Timing Systems.
Our line of scoreboards and timing products include indoor and outdoor scoreboards for many different sports, digit displays, scoring and timing controllers, statistics software and other related products. Indoor and outdoor systems range in complexity from small scoreboards to larger systems incorporating scoring, timing, video, message centers, advertising panels and control software.
We offer a variety of controllers complementing our scoreboards and displays. These controllers vary in complexity from the All Sport® 100, a handheld controller for portable scoreboards, to the All Sport® 5000, designed for more sophisticated scoring systems and allowing for more user-defined options.
We also offer timing systems for sports events, primarily aquatics and track competitions. A component of these systems is our OmniSport® 2000 timing console. The system has the capability to time and rank the competitors and to interface with event management software to facilitate the sporting event. Other timing system components include swimming touchpads, race start systems, and relay take-off platforms.
As a key component of an integrated system, we market sports statistics and results software under the DakStats® trademark. The software allows the entry and display of sports statistics and other information. It is one of the leading applications of its type in collegiate and high school sports.
Message Displays.
The key product lines in this group are the Galaxy® and GalaxyPro® and are generally controlled with our Venus® 1500 display controller.
Galaxy® full-matrix displays, available in both indoor and outdoor models, are our leading product line for commercial applications. Galaxy® displays are full color, monochrome, or tri-color, with varying pixel spacing depending on color, size and viewing distance. They are used primarily as message centers to convey information and advertising to consumers.
GalaxyPro® displays are full-matrix outdoor displays capable of displaying text, graphics and animation, as well as prerecorded video clips. The product was developed to meet the video needs of the commercial market, primarily large retail market applications such as auto dealerships and shopping centers. GalaxyPro® displays have varying pixel spacing and are capable of producing 68 billion colors.
The Venus® 1500 display control software is used to control the creation of messages and graphic sequences for uploading to the Galaxy® and GalaxyPro® displays. This software is designed to be user friendly and applicable to all general advertising or message applications. We also provide software kits, allowing system integrators to write their own software using the Venus® 1500 to communicate to the displays.
ITS Dynamic Message Signs (DMS).
DMS products include a wide range of LED displays for road management, mass transit and aviation applications. The Vanguard® family of dynamic message displays is typically used to direct traffic and inform motorists. These displays are used over freeways, on arterial roads, near bridges, at toll booths and in other locations. We have also developed a control system for these displays to help transportation agencies manage large networks of displays.
Space Availability Displays.
This product line is our digit and directional displays, which are primarily marketed and sold for use in parking facilities. They include multi-line displays delivered in vertical cabinets or drop-in digit panels designed to be mounted in existing structures or signs.
Audio Systems.
Our audio systems include both standard and custom options. Standard audio systems are designed to meet the needs of a variety of outdoor sports venues based on the size and configuration of the facility. Custom indoor and outdoor systems are for larger venues and venues with unique seating configurations. Our sound systems are often integrated into an overall venue solution for scoring, timing, message display and/or video capability.
Out-of-Home Advertising Displays.
Our line of out-of-home advertising displays includes billboards and street furniture displays.
Our line of static and digital billboards offers a unique display solution for the Out-of-Home (“OOH”) advertising industry. The products are used to display static images which change at regular intervals. These systems include many features unique to the outdoor advertising market, such as our patented mounting system, self-adjusting brightness, improved energy consumption, and enhanced network security.
The Visiconn® system is the software application for controlling content and playback loops for digital billboard applications. This system can transform any Internet-ready computer into a secure, global control center for multiple LED displays, flat panel monitors and other display technologies.
4
Our line of street furniture engages people with advertising content at eye level as they walk through campuses, cityscapes, and outlet malls. This design enhances the message and complements surrounding architecture. These advertising light boxes are our most flexible solution for static, scrolling and digital OOH campaigns.
Digit and Price Displays.
This product line includes our DataTime® and Fuelight™ displays. The DataTime® product line consists of outdoor time and temperature displays which use a remote sensor for temperature data. Fuelight™ digit displays are specifically designed for the petroleum industry, offering high visibility and quick fuel price updates using the Fuelink™ control software.
Dynamic Messaging Systems
™
:
Our dynamic messaging systems include indoor networked solutions for retailers, convenience stores and other businesses. These solutions allows customers to broadcast advertising campaigns and other information through the software, media players and visual hardware.
Raw Materials
Materials used in the production of our video display systems are sourced from around the world. We source some of our materials from a limited number of suppliers due to the proprietary nature of the materials. The loss of a key supplier or a defect in the supplied material could have an adverse impact on our business and operations. Our sourcing group works to implement strategies to mitigate these risks. Periodically, we enter into pricing agreements or purchasing contracts under which we agree to purchase a minimum amount of product in exchange for guaranteed price terms over the length of the contract, which generally does not exceed one year.
Intellectual Property
We own or hold licenses to use numerous patents, copyrights, and trademarks on a global basis. Our policy is to protect our competitive position by filing U.S. and international patent applications to protect technology and improvements that we consider important to the development of our business. This will allow us to pursue infringement claims against competitors for protection due to patent violations. We also rely on nondisclosure agreements with our employees and agents to protect our intellectual property. Despite these intellectual property protections, there can be no assurance a competitor will not copy the functions or features of our products.
Seasonality
Our net sales and profitability historically have fluctuated due to the impact of large project orders, such as display systems for professional sports facilities, colleges and universities, and spectacular projects in the commercial area, as well as the seasonality of the sports market. Large project orders can include a number of displays, controllers, and subcontracted structure builds, each of which can occur on varied schedules according to the customer's needs. Net sales and gross profit percentages also have fluctuated due to other seasonal factors, including the impact of holidays, which primarily affects our third quarter.
Our gross margins on large custom and large standard orders tend to fluctuate more than on small standard orders. Large product orders involving competitive bidding and substantial subcontract work for product installation generally have lower gross margins. Although we follow the percentage of completion method of recognizing revenues for large custom orders, we nevertheless have experienced fluctuations in operating results and expect our future results of operations will be subject to similar fluctuations.
Working Capital
For information regarding working capital items, see “Management’s Discussion and Analysis of Financial Condition and Results of Operations-Liquidity and Capital Resources” in Part II, Item 7 of this Form 10-K.
Customers
We have a large and diverse worldwide customer base, ranging from local main street business owners to the owners and operators of premier professional sports arenas. Our customers are important to us, and we strive to serve them over the long-term to earn their future business. The loss of one or more customers could have an adverse effect on us. While we are not economically dependent on any single customer, within our Commercial business unit digital billboard niche, two major customers account for more than 50 percent of sales. See "
Note 2. Segment Reporting
" of the Notes to our Consolidated Financial Statements included in this Form 10-K for our primary markets and customers of each business unit.
Backlog
Our backlog consists of contractually binding sales agreements or purchase orders we expect to fill within the next 24 months. Orders are booked and included in backlog only upon receipt of an executed contract and any required deposits. As a result, certain orders for which we have received binding letters of intent or contracts will not be booked until all required contractual documents and deposits
5
are received. In addition, order bookings can vary significantly on a quarterly basis as a result of the timing of large orders. Because order backlog may be subject to extended delivery schedules, orders may be canceled, and orders have varied estimated profitability, our backlog is not necessarily indicative of future net sales or net income. Backlog can fluctuate due to large order booking timing and seasonality. Backlog is not a measure defined by U.S. generally accepted accounting principles ("GAAP"), and our methodology for determining backlog may vary from the methodology used by other companies in determining their backlog amounts.
Government and Other Regulation
In the United States and other countries, various laws, regulations and ordinances restrict the installation of outdoor signs and displays, particularly in the commercial market. These laws and regulations impose greater restrictions on electronic displays versus non-electronic displays due to alleged concerns over aesthetics or driver safety. These factors may prevent or inhibit us from selling products to some prospective customers.
Our manufacturing facilities and products comply with industry specific requirements, including environmental rules and regulations and safety standards. These requirements include quality, manufacturing process controls, manufacturing documentation, supplier certification of raw materials, and various safety tests. Our products and production processes require the storage, use and disposal of a variety of hazardous chemicals under applicable laws.
Our global supply chain and sales distribution channels subject us to various trade compliance regulations. These requirements include certification of country of origin, classification within the various tariff codes, and compliance with other specific product or country import/export regulations.
We believe we are in material compliance with these requirements.
Competition
We encounter a wide variety of competitors that vary by product, geographic area, and business unit. Our competitors are both United States and foreign companies and range in size and product offerings. Some of our competitors compete in certain markets by providing lower-cost display systems, which are of a lesser quality with lower product performance or include less customer support. Other competitors use sponsorships as a means to win the business at a location.
We believe that our ability to compete depends upon product quality and features, technical expertise, service breadth, and cost-effective solutions.
Research and Development
We believe our engineering and product development capability and experience are very important factors to continue to develop the most up-to-date digital displays and control system solutions desired by the market.
Employees
As of
April 30, 2016
, we employed approximately
2,470
full-time employees and approximately
315
part-time and temporary employees. Of these employees, approximately
1,000
were in manufacturing,
560
were in sales and marketing,
575
were in customer service,
395
were in engineering and
255
were in general and administrative. None of our employees are represented by a collective bargaining agreement. We believe employee relations are good.
Item 1A. RISK FACTORS
The factors that are discussed below, as well as the matters that are generally set forth in this Form 10-K and the documents incorporated by reference herein, could materially and adversely affect the Company’s business, results of operations and financial condition.
We operate in highly competitive markets and face significant competition and pricing pressure. If we are unable to keep up with the rapidly changing product market or compete effectively, we could lose market share, and our results of operations could be negatively impacted.
The electronic display industry is characterized by ongoing product improvement, innovations and development. We compete against products produced in foreign countries and the United States. In addition, our products compete with other forms of advertising, such as television, print media and fixed display signs. Our competitors may develop cheaper, more efficient products, or they may be willing to charge lower prices to increase their market share. Some competitors have more capital and other resources, which may allow them to take advantage of acquisition opportunities or adapt more quickly to changes in customer requirements. To remain competitive, we
6
must anticipate and respond quickly to our customers’ needs, enhance our existing products, introduce new products and features, and continue to price our products competitively.
Our results of operations can be substantially affected by whether we are awarded large contracts and the size and timing of large contracts.
Our revenues and earnings have varied in the past and are likely to vary in the future. When awarded large contracts, primarily in the college and professional sports facilities market, the OOH niche, and the large spectacular niche, the timing and amount could cause material fluctuations in our net sales and earnings. Awards of large contracts and their timing and amount are difficult to predict, may not be repeatable, and are outside of our control. Operating results in one quarter or fiscal year may not be indicative of future operating results. Some factors that may cause our operating results to vary include:
|
•
|
new product introductions;
|
|
•
|
variations in product and product mix; and
|
|
•
|
delays or cancellations of orders.
|
Unanticipated warranty and other costs for defective products could adversely affect our financial condition and results of operations and reputation.
We provide warranties on our products with terms varying from one to 10 years. In addition, we offer extended warranties. These warranties require us to repair or replace faulty products and meet certain performance standards, among other customary warranty provisions. Although we continually monitor our warranty claims and accrue a liability for estimated warranty costs, unanticipated claims could have a material adverse impact on our financial results. During fiscal 2016, we discovered a warranty issue caused by a mechanical device failure within a module for displays primarily in our OOH application built prior to fiscal 2013. We increase our accrued warranty obligations by $9.2 million during fiscal 2016 and $1.2 million during fiscal 2015 for probable and reasonably estimable costs to remediate this issue. See "
Note 17. Commitments and Contingencies
" of the Notes to our Consolidated Financial Statements included in the Form 10-K for more information regarding our warranty accrual. In some cases, we may be able to subrogate a claim back to a subcontractor or supplier if the subcontractor or supplier supplied the defective product or performed the service, but this may not always be possible. In addition, the need to repair or replace products with design and manufacturing defects could adversely affect our reputation. The time required to remediate the claim may take time and could result in lost or deferred revenue, lead to costly warranty expenses, and could have a material adverse impact on our financial condition and operating results.
We enter into fixed-priced contracts on a regular basis, which could reduce our profits.
As part of our strategy, we enter into capped or fixed-price contracts. Because of the complexity of many of our client contracts, accurately estimating the cost, scope and duration of a particular contract can be a difficult task. If our actual costs exceed original estimates on fixed-price contracts, our profits will be reduced. Because of the large scale, customer timelines, seasonality of our business or long duration of some contracts, unanticipated cost increases may occur as a result of several factors including, but not limited to: increases in the cost or shortages of materials or labor; unanticipated technical problems; required project modifications not initiated by the customer; suppliers’ or subcontractors’ failure to perform or delay in performing their obligations; and capacity constraints. In addition to increased costs, these factors could delay delivery of products which may result in the assessment of liquidated damages or other contractual damages. Unanticipated costs that we are unable to pass on to our customers or our payment of delay damages under fixed contracts would negatively impact our profits.
Backlog may not be indicative of future revenue or profitability.
Many of our products have long sales, delivery and acceptance cycles. In addition, our backlog is subject to order cancellations and delays. Orders normally contain cancellation provisions to permit our recovery of costs expended and a pro-rata portion of the profit. If projects are delayed, revenue recognition can occur over longer periods of time, and projects may remain in the backlog for extended periods of time. If we receive relatively large orders in any given quarter, fluctuations in the levels of the quarterly backlog can result because the backlog may reach levels which may not be sustained in subsequent quarters.
Unanticipated events resulting in credit losses could have a material adverse impact on our financial results.
Significant portions of our sales are to customers who place large orders for custom products. We closely monitor the credit worthiness of our customers and have not, to date, experienced significant credit losses. We mitigate our exposure to credit risk, to some extent, by requiring deposits, payments prior to shipment, progress payments and letters of credit. However, because some of our exposure to credit losses is outside of our control, unanticipated events resulting in credit losses could have a material adverse impact on our operating results.
7
We depend on a single-source or a limited number of suppliers for our raw materials and components, and the loss of any of these suppliers or an increase in cost of raw materials could harm our business.
We obtain some of our raw materials from one or limited number of suppliers. If we cannot obtain key raw materials from our suppliers, the raw materials may not be readily available from other suppliers, other suppliers may not agree to supply the materials to us on terms as favorable as the terms we currently receive, or the raw materials from any other suppliers may not be of adequate and consistent quality. Although we believe our supply of raw materials is adequate for the needs of our business, we cannot assure that new sources of supply will be available when needed. Any interruption in our supply of raw materials could affect our ability to manufacture our products until a new source of supply is located and, therefore, could have a material adverse effect on our business, financial condition or results of operations.
In addition, we purchase various raw materials and components in order to manufacture our products. Historically, fluctuations in the prices of these raw materials and components have not had a material impact on our business. In the future, however, if we experience increases in the price of raw materials and components and are unable to pass on those increases to our customers, it could negatively affect our business, financial condition or results of operations.
Our international operations are exposed to additional risks and uncertainties, including unfavorable political developments, weak foreign economies, and compliance with foreign governmental requirements, which may impact our results of operations.
For the
2016
,
2015
, and
2014
fiscal years, revenue outside the United States represented approximately
18%
,
20%
, and
18%
of our consolidated net sales, respectively. Our operations and earnings throughout the world have been and may in the future be adversely affected by changes in trade, monetary and fiscal policies, laws and regulations, or other activities of United States and foreign governments, agencies, and similar organizations. These conditions include, but are not limited to, changes in a country's or region's economic or political conditions; trade regulations affecting production, pricing and marketing of products; local labor conditions and regulations; reduced protection of intellectual property rights in some countries; changes in the regulatory or legal environment; restrictions and foreign exchange rate fluctuations; and burdensome taxes and tariffs and other trade barriers. International risks and uncertainties also include changing social and economic conditions, terrorism, political hostilities and war, difficultly in enforcing agreements or collecting receivables and increased transportation and other shipping costs. The likelihood of such occurrences and their overall effect on us vary greatly from country to country and are not predictable. These factors may result in a decline in net sales or profitability and could adversely affect our ability to expand our business outside of the United States.
Our future results may be affected by legal compliance risks related to the United States Foreign Corrupt Practices Act and other anti-bribery and anti-corruption laws for the countries in which we operate.
We are required to comply with the United States Foreign Corrupt Practices Act, which prohibits United States companies from engaging in bribery or making other prohibited payments to foreign officials for the purpose of obtaining or retaining business, and other similar regulations in other areas of the world. It also requires us to maintain specific record-keeping standards and adequate internal accounting controls. In addition, we are subject to similar requirements in other countries. Bribery, corruption, and trade laws and regulations, and the enforcement thereof, are increasing in frequency, complexity and severity on a global basis. Although we have internal policies and procedures with the intention of assuring compliance with these laws and regulations, our employees, contractors, agents and licensees involved in our international sales may take actions in violations of such policies. If our internal controls and compliance program do not adequately prevent or deter our employees, agents, distributors, suppliers and other third parties with whom we do business from violating anti-bribery, anti-corruption or similar laws and regulations, we may incur severe fines, penalties and reputational damage.
We may fail to continue to attract, develop and retain key management personnel, which could negatively impact our operating results.
We depend on the performance of our senior executives and key employees, including experienced and skilled technical personnel. The loss of any of our senior executives could negatively impact our operating results and ability to execute our business strategy. Our future success will also depend upon our ability to attract, train, motivate and retain qualified personnel.
We may not be able to utilize our capacity efficiently or accurately plan our capacity requirements, which may negatively affect our business and operating results.
We increase our production capacity and the overhead supporting production based on anticipated market demand. Market demand, however, has not always developed as expected or remained at a consistent level. This underutilization risk can potentially decrease our profitability and result in the impairment of certain assets.
The following factors are among those that could complicate capacity planning for market demand:
8
|
•
|
changes in the demand for and mix of products that our customers buy;
|
|
•
|
our ability to add and train our manufacturing staff in advance of demand;
|
|
•
|
the market’s pace of technological change;
|
|
•
|
variability in our manufacturing productivity; and
|
|
•
|
long lead times for our plant and equipment expenditures.
|
We have been required to conduct a good faith reasonable country of origin analysis on our use of “conflict minerals,” which has imposed and may impose additional costs on us and could raise reputational challenges and other risks.
The SEC has promulgated final rules in connection with the Dodd-Frank Wall Street Reform and Consumer Protection Act regarding disclosure of the use of certain minerals, known as conflict minerals, mined from the Democratic Republic of the Congo and adjoining countries. As required annually, we filed Forms SD in May
2015
and May
2016
reporting our work performed to gain information on the source of conflict minerals we use. We incurred costs associated with complying with these disclosure requirements. As we continue our due diligence, we may face reputational challenges if we continue to be unable to verify the origins for all conflict minerals used in our products. We may also encounter challenges in our efforts to satisfy customers that may require all of the components of products purchased to be certified as conflict free. If we are not able to meet customer requirements, customers may choose to disqualify us as a supplier.
Our actual results could differ from the estimates and assumptions used to prepare our financial statements, which could have a material impact on our financial condition and results of operations.
Our management is required under U.S. GAAP to make estimates and assumptions as of the dates of our financial statements. These estimates and assumptions affect the recognition of contract revenue, costs, profits or losses in applying the principles of percentage of completion; estimated amounts for warranty costs; the collectability of billed and unbilled accounts receivable and the amount of any allowance for doubtful accounts; the continuing utility of our property and equipment; the amount of estimated liabilities; the valuation of assets acquired plus liabilities, goodwill, and intangible assets assumed in acquisitions; and the valuation of stock-based compensation. If management's estimates and assumptions are not accurate, our financial results or results of operation could be adversely affected.
If our internal control over financial reporting is found to be ineffective, our financial statements may not be fairly stated, raising concerns for investors and potentially adversely affecting our stock price.
Under Section 404 of the Sarbanes-Oxley Act of 2002, we are required to evaluate and determine the effectiveness of our internal controls over financial reporting. We have made, and will continue to make, changes to our internal controls and procedures for financial reporting and accounting systems to meet our reporting obligations as a public company. We may encounter problems or delays in completing the review and evaluation, implementing improvements, or receiving a positive attestation from our independent registered public accounting firm. In addition, our assessment of internal controls may identify deficiencies in our internal controls over financial reporting or other matters which may raise concerns for investors and therefore adversely affect our stock price.
If goodwill or other intangible assets in connection with our acquisitions become impaired, we could take significant non-cash charges against earnings.
We have pursued and will continue to seek potential acquisitions to complement and expand our existing businesses, increase our revenues and profitability, and expand our markets. As a result of prior acquisitions, we have goodwill and intangible assets recorded on our consolidated balance sheet as described in "
Note 6. Long-Lived Assets
" of the Notes to our Consolidated Financial Statements included in this Form 10-K. Under current accounting guidelines, we must assess, at least annually, whether the value of goodwill and other intangible assets has been impaired. Any reduction or impairment of the value of goodwill or other intangible assets will result in charges against earnings, which would adversely affect our results of operations in future periods.
9
Acquisitions and divestitures pose financial, management and other risks and challenges.
We routinely explore acquiring other businesses and assets. Periodically, we may also consider disposing of certain assets, subsidiaries, or lines of business. Acquisitions or divestitures present financial, managerial and operational challenges. These include, but are not limited to, the following:
|
•
|
diversion of management attention;
|
|
•
|
difficulty with integrating acquired businesses;
|
|
•
|
difficulty with the integration of different corporate cultures;
|
|
•
|
personnel issues;
|
|
•
|
increased expenses;
|
|
•
|
assumption of unknown liabilities and indemnification obligations;
|
|
•
|
potential disputes with the buyers or sellers;
|
|
•
|
the time involved in evaluating or modifying the financial systems of an acquired business; and
|
|
•
|
establishment of appropriate internal controls.
|
There can be no assurance that we will engage in any acquisitions or divestitures or that we will be able to do so on terms that will result in any expected benefits.
The terms and conditions of our credit facility impose restrictions on our operations, and if we default on our credit facility, it could have a material adverse effect on our results of operations and financial condition and make us vulnerable to adverse economic or industry conditions.
The terms and conditions of our credit facilities impose restrictions limiting our ability to incur debt, merge, sell assets, make distributions (including cash dividends) and create or incur liens. The availability of credit facilities is also subject to certain covenants as explained in “Item 7 - Management’s Discussion and Analysis of Financial Condition and Results of Operations.” A breach of any of these covenants could result in an event of default under our credit facility. Upon the occurrence of an event of default, the lender could elect to declare any and all amounts outstanding under such facility to be immediately due and payable and terminate all commitments to extend further credit. For additional information on financing agreements, see, "
Note 10. Financing Agreements
" of the Notes to our Consolidated Financial Statements included in this Form 10-K.
In addition, it is anticipated that borrowings from our existing credit facilities and cash provided by operating activities should provide sufficient funds to finance our capital expenditures, working capital and otherwise meet operating expenses and debt service requirements. However, if additional capital is required, there can be no assurance we will be able to obtain such capital when needed or on satisfactory terms. Also, market conditions can negatively impact our customers' ability to fund their projects and can impact our vendors, suppliers, and subcontractors and may not allow them to perform their obligations to us.
If we became unable to obtain adequate surety bonding or letters of credit, it could adversely affect our ability to bid on new work, which could have a material adverse effect on our future revenue and business prospects.
In line with industry practice, we are often required to provide performance and surety bonds to customers and may be required to provide letters of credit. These bonds and letters of credit provide credit support for the client if we fail to perform our obligations under the contract. If security is required for a particular project and we are unable to obtain a bond or letter of credit on terms acceptable to us, we may not be able to pursue that project. In addition, bonding may be more difficult to obtain in the future or may be available only at significant additional cost as a result of general conditions that affect the insurance and bonding markets.
We may be unable to protect our intellectual property rights effectively, or we may infringe upon the intellectual property of others, either of which may have a material adverse effect on our operating results and financial condition.
We rely on a variety of intellectual property rights we use in our products and services. We may not be able to successfully preserve our intellectual property rights in the future, and these rights could be invalidated, circumvented or challenged. In particular, the laws of certain countries in which our products are sold do not protect our products and intellectual property rights to the same extent as the laws of the United States. If litigation is necessary in the future to enforce our intellectual property rights, to protect our trade secrets or to determine the validity and scope of the proprietary rights of others, such litigation could result in substantial costs and diversion of resources.
In addition, intellectual property of others also has an impact on our ability to offer some of our products and services for specific uses or at competitive prices. Competitor's patents or other intellectual property may limit our ability to offer products or services to our customers. Any infringement or claimed infringement of the intellectual property rights of others could result in litigation and adversely affect our ability to continue to provide, or could increase the cost of providing, products and services.
10
The outcome of pending and future claims or litigation can have a material adverse impact on our business, financial condition, and results of operations.
We can be a party to litigation in the normal course of business. Litigation and regulatory proceedings are subject to inherent uncertainties, and unfavorable rulings can and do occur. Pending or future claims against us could result in professional liability, product liability, criminal liability, warranty obligations or other liabilities to the extent we are not insured against a loss or our insurance fails to provide adequate coverage. Also, a well-publicized actual or perceived threat of litigation could adversely affect our reputation and reduce the demand for our products.
Our data systems could fail or their security could be compromised, causing a material adverse effect on our business.
We rely heavily on digital technologies for the successful operation of our business and for the collection and retention of business data. Any failure of our digital systems, or any breach of our systems’ security measures, could adversely affect our operations, at least until our data can be restored and/or the breaches remediated. Despite the security measures we have in place, our facilities and systems and those of our third-party service providers may be vulnerable to cybersecurity breaches, acts of vandalism, computer viruses, misplaced or lost data, programming, and/or human errors or other similar events. Any misappropriation, loss or other unauthorized disclosure of confidential or personally identifiable information, whether by us or by our third-party service providers, could adversely affect our business and operations. Any disruption in our digital technologies could affect our business and operations, including our manufacturing processes, severely damaging our reputation with customers, suppliers, employees and investors and expose us to risk of litigation and liability.
The protections we have adopted and to which we are subject may discourage takeover offers favored by our shareholders.
Our articles of incorporation, by-laws and other corporate governance documents and the South Dakota Business Corporation Act (SD Act) contain provisions that could have an anti-takeover effect and discourage, delay or prevent a change in control or an acquisition that many shareholders may find attractive. These provisions make it more difficult for our shareholders to take some corporate actions. These provisions relate to:
|
•
|
the ability of our Board of Directors to issue undesignated shares on terms and with the rights, preferences and designations determined by the Board without shareholder action;
|
|
•
|
the classification of our Board of Directors, which effectively prevents shareholders from electing a majority of the directors at any one meeting of shareholders;
|
|
•
|
the adoption of a shareholder rights plan providing for the exercise of common stock purchase rights when a person becomes the beneficial owner of 15 percent or more of our outstanding common stock (subject to certain exceptions);
|
|
•
|
under the SD Act, limitations on the voting rights of shares acquired in specified types of acquisitions and restrictions on specified types of business combinations; and
|
|
•
|
under the SD Act, prohibitions against engaging in a “business combination” with an “interested shareholder” for a period of four years after the date of the transaction in which the person became an interested shareholder unless the business combination is approved.
|
These provisions may deny shareholders the receipt of a premium on their common stock, which in turn may have a depressive effect on the market price of our common stock.
Our common stock has at times been thinly traded, which may result in low liquidity and price volatility.
The daily trading volume of our common stock has at times been relatively low. If this were to occur in the future, the liquidity and appreciation of our common stock may not meet our shareholders’ expectations, and the prices at which our stock trades may be volatile. The market price of our common stock could be adversely impacted as a result of sales by existing shareholders of a large number of shares of common stock in the market or by the perception such sales could cause.
Significant changes in the market price of our common stock could result in securities litigation claims against us.
The market price of our common stock has fluctuated and will likely continue to fluctuate, and in the past, companies that have experienced significant changes in the market price of their stock have been subject to securities litigation claims. We may be the target of this type of litigation in the future. Securities litigation against us could result in substantial costs and divert our management’s attention from other business concerns, which could harm our business.
Our executive officers, directors and principal shareholders have the ability to significantly influence all matters submitted to our shareholders for approval.
11
Dr. Aelred Kurtenbach served as our Chairman of the Board until September 3, 2014, when he retired. Mr. Reece Kurtenbach, Dr. Aelred Kurtenbach's son, serves as our Chairman and Chief Executive Officer. In addition, Dr. Aelred Kurtenbach has two other children who serve as our Vice President of Human Resources and as our Vice President of Manufacturing. Together, these individuals, in the aggregate, beneficially owned 9.5% of our outstanding common stock as of
June 13, 2016
, assuming the exercise by them of all of their options that were currently exercisable or that vest within 60 days of
June 13, 2016
. In addition, our other executive officers and directors, in the aggregate, beneficially owned an additional 4.8% of our outstanding common stock as of
June 13, 2016
, assuming the exercise by them of all of their options currently exercisable or that vest within 60 days of
June 13, 2016
. While this does not represent a majority of our outstanding common stock, if these shareholders were to choose to act together, they would be able to significantly influence all matters submitted to our shareholders for approval, as well as our management and affairs. For example, these persons, if they choose to act together, could significantly influence the election of directors and approval of any merger, consolidation, sale of all or substantially all of our assets or other business combination or reorganization. This concentration of voting power could delay or prevent an acquisition of us on terms that other shareholders may desire. The interests of this group of shareholders may not always coincide with the interests of other shareholders, and they may act in a manner that advances their best interests and not necessarily those of other shareholders, including seeking a premium value for their common stock, and might affect the prevailing market price for our common stock.
Unexpected events, including natural disasters, may increase our cost of doing business or disrupt our operations.
The occurrence of one or more unexpected events, including war, terrorist acts, fires, tornadoes, floods and severe weather in the United States or in other countries in which we operate may disrupt our operations as well as the operations of our customers. Such acts could create additional uncertainties, forcing customers to reduce, delay, or cancel already planned projects. These events could result in damage to, and a complete or partial closure of, one or more of our manufacturing facilities, which could make it difficult to supply our customers with product and provide our employees with work, thereby adversely affecting our business, operating results or financial condition.
Item 1B. UNRESOLVED STAFF COMMENTS
None.
Item 2. PROPERTIES
Our principal real estate properties are located in areas we deem necessary to meet sales, service and operating requirements. We consider all of our properties to be both suitable and adequate to meet our requirements for the foreseeable future. A description of our principal facilities is set forth below:
|
Facilities
|
Owned or Leased
|
Square Footage
|
Facility Activities
|
|
Brookings, SD, USA
|
Owned
|
773,000
|
Corporate Office, Manufacturing, Sales, Service
|
|
Redwood Falls, MN, USA
|
Owned
|
120,000
|
Manufacturing, Sales, Service, Office
|
|
Rupelmonde, Belgium
|
Owned
|
40,000
|
Manufacturing, Sales, Service, Office
|
|
Ennistymon, Ireland
|
Owned
|
44,000
|
Manufacturing, Sales, Service, Office
|
|
Sioux Falls, SD, USA
|
Leased
|
177,000
|
Manufacturing, Sales, Service, Office
|
|
Shanghai, China
|
Leased
|
90,500
|
Manufacturing, Sales, Service, Office
|
|
Burlington, Canada
|
Leased
|
15,500
|
Sales, Service, Office
|
The remaining sales and service offices located throughout the United States, Canada, Europe, South America, and the Asia-Pacific regions are small offices, generally consisting of less than 10,000 square feet leased under operating leases. These lease obligations expire on various dates, with the longest commitment extending to fiscal
2022
. We believe all of our leases will be renewable at market terms, at our discretion, or that suitable alternative space would be available to lease under similar terms and conditions. See "
Note 17. Commitments and Contingencies
" of the Notes to our Consolidated Financial Statements included in the Form 10-K for further information on lease obligations.
12
Item 3. LEGAL PROCEEDINGS
We are involved in a variety of legal actions relating to various matters during the normal course of business. Although we are unable to predict the ultimate outcome of these legal actions, it is the opinion of management that the disposition of these matters, taken as a whole, will not have a material adverse effect on our financial condition or results of operations. See "
Note 17. Commitments and Contingencies
" of the Notes to our Consolidated Financial Statements included in the Form 10-K for further information on any legal proceedings and claims.
Item 4. MINE SAFETY DISCLOSURES
Not applicable.
13
PART II
Item 5. MARKET FOR REGISTRANT’S COMMON EQUITY, RELATED STOCKHOLDER MATTERS AND ISSUER PURCHASES OF EQUITY SECURITIES
Our common stock is quoted on The NASDAQ Global Select Market under the symbol “DAKT.” As of
June 13, 2016
, we had
1,135
shareholders of record. Following are the high and low sales prices for our common stock for each quarter within the last two fiscal years.
|
|
Fiscal Year 2016
|
Fiscal Year 2015
|
|||||||||||||||||||||
|
Sales Price
|
Cash Dividends Declared
|
Sales Price
|
Cash Dividends Declared
|
||||||||||||||||||||
|
|
High
|
Low
|
High
|
Low
|
|||||||||||||||||||
|
1
st
Quarter
|
$
|
12.23
|
|
$
|
10.13
|
|
$
|
0.10
|
|
$
|
14.47
|
|
$
|
11.05
|
|
$
|
0.10
|
|
|||||
|
2
nd
Quarter
|
12.24
|
|
8.20
|
|
0.10
|
|
13.68
|
|
11.02
|
|
0.10
|
|
|||||||||||
|
3
rd
Quarter
|
10.25
|
|
7.37
|
|
0.10
|
|
13.87
|
|
11.48
|
|
0.10
|
|
|||||||||||
|
4
th
Quarter
|
8.72
|
|
6.90
|
|
0.10
|
|
13.05
|
|
10.03
|
|
0.10
|
|
|||||||||||
On
June 16, 2016
, our Board of Directors declared a regular quarterly dividend payment of $0.06 per share and a special dividend of $0.04 per share payable on
July 8, 2016
to holders of record of our common stock on
June 27, 2016
.
Although we expect to continue to pay dividends for the foreseeable future, any and all subsequent dividends will be reviewed regularly and declared by the Board at its discretion. In addition, our credit facility imposes limitations on our ability to pay dividends as further described in “Item 7 – Management’s Discussion and Analysis of Financial Condition and Results of Operations – Liquidity and Capital Resources.”
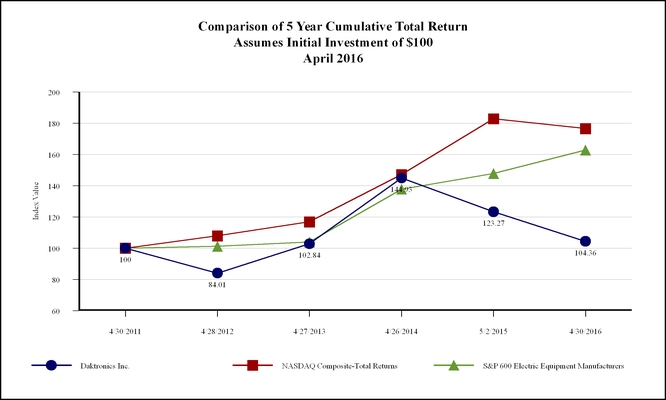
Performance Graph
The following graph shows changes during the period from
April 30, 2011
to
April 30, 2016
in the value of $100 invested in: (1) our common stock; (2) The NASDAQ Composite; and (3) the Standard and Poor's 600 Index for Electronic Equipment Manufacturers. The values of each investment as of the dates indicated are based on share prices plus any cash dividends, with the dividends reinvested on the date they were paid. The calculations exclude trading commissions and taxes.
14
Item 6. SELECTED FINANCIAL DATA
(in thousands, except per share data)
The table below provides selected historical financial data, which should be read in conjunction with "Management's Discussion and Analysis of Financial Condition and Results of Operations" and the Consolidated Financial Statements and the Notes to the Consolidated Financial Statements, which are included in Items 7 and 8 of this Annual Report on Form 10-K. The statement of operations data for the fiscal years ended
April 30, 2016
,
May 2, 2015
and
April 26, 2014
and the balance sheet data at
April 30, 2016
and
May 2, 2015
are derived from, and are qualified by reference to, the audited Consolidated Financial Statements included elsewhere in this Form 10-K. The statement of operations data for the fiscal years ended
April 27, 2013
and
April 28, 2012
and the balance sheet data at
April 26, 2014
,
April 27, 2013
and
April 28, 2012
are derived from audited financial statements that are not included in this Form 10-K.
|
|
2016
|
2015
|
2014
|
2013
|
2012
|
||||||||||||||
|
Statement of Operations Data:
|
|
|
|
|
|
||||||||||||||
|
Net sales
|
$
|
570,168
|
|
$
|
615,942
|
|
$
|
551,970
|
|
$
|
518,322
|
|
$
|
489,526
|
|
||||
|
Gross profit
|
121,019
|
|
144,579
|
|
141,710
|
|
133,894
|
|
113,437
|
|
|||||||||
|
Gross profit margin
|
21.2
|
%
|
23.5
|
%
|
25.7
|
%
|
25.8
|
%
|
23.2
|
%
|
|||||||||
|
Operating income
|
2,495
|
|
31,285
|
|
36,557
|
|
30,600
|
|
10,275
|
|
|||||||||
|
Operating margin
|
0.4
|
%
|
5.1
|
%
|
6.6
|
%
|
5.9
|
%
|
2.1
|
%
|
|||||||||
|
Net income
|
2,061
|
|
20,882
|
|
22,206
|
|
22,779
|
|
8,489
|
|
|||||||||
|
Diluted earnings per share
|
0.05
|
|
0.47
|
|
0.51
|
|
0.53
|
|
0.20
|
|
|||||||||
|
Weighted average diluted shares outstanding
|
44,456
|
|
44,443
|
|
43,762
|
|
42,621
|
|
42,304
|
|
|||||||||
|
Balance Sheet Data:
|
|
|
|
|
|
|
|
|
|
|
|||||||||
|
Working capital
|
$
|
123,714
|
|
$
|
149,075
|
|
$
|
140,532
|
|
$
|
125,456
|
|
$
|
119,833
|
|
||||
|
Total assets
|
349,948
|
|
379,479
|
|
357,451
|
|
319,418
|
|
315,967
|
|
|||||||||
|
Total long-term liabilities
|
27,364
|
|
25,420
|
|
20,624
|
|
16,480
|
|
15,989
|
|
|||||||||
|
Total shareholders' equity
|
201,067
|
|
212,039
|
|
203,119
|
|
188,246
|
|
190,805
|
|
|||||||||
|
Cash dividends per share
|
0.40
|
|
0.40
|
|
0.39
|
|
0.73
|
|
0.62
|
|
|||||||||
Daktronics, Inc. operates on a 52 or 53 week fiscal year, with our fiscal year ending on the Saturday closest to April 30 of each year. When April 30 falls on a Wednesday, the fiscal year ends on the preceding Saturday. Within each fiscal year, each quarter is comprised of 13 week periods following the beginning of each fiscal year. In each 53 week year, an additional week is added to the first quarter and each of the last three quarters is comprised of a 13 week period. The fiscal years ended
April 30, 2016
,
April 26, 2014
,
April 27, 2013
, and
April 28, 2012
contained operating results for
52
weeks while the fiscal year ended
May 2, 2015
contained operating results for
53
weeks.
Item 7. MANAGEMENT’S DISCUSSION AND ANALYSIS OF FINANCIAL CONDITION AND RESULTS OF OPERATIONS
The following discussion provides our highlights and commentary related to factors impacting our financial conditions and further describes the results of operations. The most significant risks and uncertainties are discussed in "Item 1A. Risk Factors."
This discussion should be read in conjunction with the accompanying Consolidated Financial Statements and Notes to the Consolidated Financial Statements included in this Form 10-K.
EXECUTIVE OVERVIEW
Our mission is to be the world leader at informing and entertaining audiences through dynamic audio-visual communication systems. We measure our success through estimated market share based on estimated market demand for digital displays and generating profits over the long-term. Our success is contingent on the depth and quality of our products, including related control systems, the depth of our service offerings and our technology serving these market demands. These qualities are important for our long-term success because our products have finite lifetimes and we strive to win replacement business from existing customers.
Increases in user adoption; the acceptance of a variety of digital solutions; and the decline of digital solution pricing over the years has increased the size of the global market. With this positive demand, strong competition exists across all of our business units, which causes margin constraints. Projects with multi-million revenue potential also attract competition, which generally reduces profitability.
We organize around customer segments and geographic regions as further described in "
Note 2. Segment Reporting
" of the Notes to our Consolidated Financial Statements included in this Form 10-K. Each business segment also has unique key growth drivers and challenges.
15
Commercial Business Unit:
Over the long-term, we believe growth in the Commercial business unit will result from a number of factors, including:
|
•
|
Standard display product market growth due to market adoption and lower product costs, which drive marketplace expansion. Standard display products are used to attract or communicate with customers and potential customers of retail, commercial, and other establishments. Pricing and economic conditions impact our success in this business unit. We utilize a reseller network to distribute our standard products.
|
|
•
|
National accounts standard display market opportunities due to their desire to communicate their message, advertising and content consistently across the country. Increased demand is possible from retailers, quick serve restaurants, petroleum businesses, and other nationwide organizations.
|
|
•
|
Increasing interest in spectaculars, which include very large and sometimes highly customized displays as part of entertainment venues such as casinos, amusement parks and Times Square type locations.
|
|
•
|
Dynamic messaging systems demand growth due to market adoption and marketplace expansion.
|
|
•
|
The introduction of architectural lighting products for commercial buildings, which real estate owners use to add accents or effects to an entire side or circumference of a building to communicate messages or to decorate the building.
|
|
•
|
The continued deployment of digital billboards as OOH companies continue developing new sites and start to replace digital billboards which are reaching end of life. This is dependent on there being no adverse changes in the digital billboard regulatory environment, which could restrict future deployments of billboards, as well as maintaining our current market share of the business concentrated in a few large OOH companies.
|
|
•
|
Replacement cycles within each of these areas.
|
Live Events Business Unit:
Over the long-term, we believe growth in the Live Events business unit will result from a number of factors, including:
|
•
|
Facilities spending more on larger display systems to enhance the game-day and event experience for attendees.
|
|
•
|
Lower product costs, driving an expansion of the marketplace.
|
|
•
|
Our product and service offerings, which remain the most integrated and comprehensive offerings in the industry.
|
|
•
|
The competitive nature of sports teams, which strive to out-perform their competitors with display systems.
|
|
•
|
The desire for high-definition video displays, which typically drives larger displays or higher resolution displays, both of which increase the average transaction size.
|
|
•
|
Replacement cycles within each of these areas.
|
High School Park and Recreation Business Unit:
Over the long-term, we believe growth in the High School Park and Recreation business unit will result from a number of factors, including:
|
•
|
Increased demand for video systems in high schools as school districts realize the revenue generating potential of these displays versus traditional scoreboards.
|
|
•
|
Increased demand for different types of displays, such as message centers at schools to communicate to students, parents and the broader community.
|
|
•
|
The use of more sophisticated displays in athletic facilities, such as aquatic venues in schools.
|
Transportation Business Unit:
Over the long-term, we believe growth in the Transportation business unit will result from increasing applications and acceptance of electronic displays to manage transportation systems, including roadway, airport, parking, transit and other applications. Effective use of the United States transportation infrastructure requires intelligent transportation systems. This growth is highly dependent on government spending, primarily by the federal government, along with the continuing acceptance of private/public partnerships as an alternative funding source.
International Business Unit:
Over the long-term, we believe growth in the International business unit will result from achieving greater penetration in various geographies and building products more suited to individual markets. We are broadening our product offerings into the transportation segment in Europe and the Middle East. We currently focus on third-party advertising market opportunities and the factors listed in each of the other business units to the extent they apply outside the United States and Canada.
Each of our business units is impacted by adverse economic conditions in different ways and to different degrees. The effects of an adverse economy are generally less severe on our sports related business as compared to our other businesses, although in severe economic downturns, the sports business also can be severely impacted. Our Commercial and International business units are highly dependent on economic conditions in general.
16
The cost and selling prices of our products have decreased over time and are expected to continue to decrease in the future. As a result, each year we must sell more product to generate the same or greater level of net sales as in previous fiscal years. This price decline has been significant as a result of increased competition across all business units.
17
CRITICAL ACCOUNTING POLICIES AND ESTIMATES
The following discussion and analysis of financial condition and results of operations are based upon our consolidated financial statements, which have been prepared in accordance with U.S. generally accepted accounting principles ("GAAP"). The preparation of these financial statements requires us to make estimates and judgments affecting the reported amounts of assets, liabilities, revenues and expenses and related disclosure of contingent assets and liabilities. On a regular basis, we evaluate our estimates, including those related to total costs on long-term construction-type contracts, costs to be incurred for product warranties and extended maintenance contracts, bad debts, excess and obsolete inventory, income taxes, share-based compensation, goodwill impairment and contingencies. Our estimates are based on historical experience and on various other assumptions believed to be reasonable under the circumstances, the results of which form the basis for making judgments about the carrying values of assets and liabilities not readily apparent from other sources. Actual results may differ from these estimates.
We believe the following critical accounting policies require significant judgments and estimates in the preparation of our consolidated financial statements:
Revenue recognition on long-term construction-type contracts.
Earnings on construction-type contracts are recognized on the percentage-of-completion method, measured by the percentage of costs incurred to date to estimated total costs for each contract. Contract costs include all direct material and labor costs and those indirect costs related to contract performance. Indirect costs include charges for such items as facilities, engineering and project management. Provisions for estimated losses on uncompleted contracts are made in the period such losses are capable of being estimated. Generally, construction-type contracts we enter into have fixed prices established, and to the extent the actual costs to complete construction-type contracts are higher than the amounts estimated as of the date of the financial statements, the resulting gross margin would be negatively affected in future quarters when we revise our estimates. Our practice is to revise estimates as soon as such changes in estimates are known. We do not believe there is a reasonable likelihood there will be a material change in future estimates or assumptions we use to determine these estimates. We combine contracts for accounting purposes when they are negotiated as a package with an overall profit margin objective, essentially represent an agreement to do a single project for a customer, involve interrelated construction activities, and are performed concurrently or sequentially. When a group of contracts is combined, revenue and profit are recognized uniformly over the performance of the combined projects. We segment revenues in accordance with the contract segmenting criteria in Accounting Standards Codification (“ASC”) 650-35,
Construction-Type and Production-Type Contracts.
Allowance for doubtful accounts.
We maintain an allowance for doubtful accounts for estimated losses resulting from the inability of our customers to make required payments. If the financial condition of our customers were to deteriorate, resulting in an impairment of their ability to make payments, additional allowances may be required. To identify impairment in customers’ ability to pay, we review aging reports, contact customers in connection with collection efforts and review other available information. Although we consider our allowance for doubtful accounts adequate, if the financial condition of our customers were to deteriorate and impair their ability to make payments to us, additional allowances may be required in future periods. We do not believe there is a reasonable likelihood there will be a material change in the future estimates or assumptions we use to determine the allowance for doubtful accounts. As of
April 30, 2016
and
May 2, 2015
, we had an allowance for doubtful accounts balance of approximately
$2.8 million
and
$2.3 million
, respectively.
Warranties.
We have recognized an accrued liability for warranty obligations equal to our estimate of the actual costs to be incurred in connection with our performance under the warranties. Generally, estimates are based on historical experience taking into account known or expected changes. If we would become aware of an increase in our estimated warranty costs, additional accruals may become necessary, resulting in an increase in costs of goods sold. As of
April 30, 2016
and
May 2, 2015
, we had approximately
$30.5 million
and
$26.5 million
accrued for these costs, respectively. Due to the difficulty in estimating probable costs related to certain warranty obligations, there is a reasonable likelihood that the ultimate remaining costs to remediate the warranty claims could differ materially from the recorded accrued liabilities. See "
Note 17. Commitments and Contingencies
" of the Notes to our Consolidated Financial Statements included in the Form 10-K for further information on warranties.
Extended warranty and product maintenance.
We recognize deferred revenue related to separately priced extended warranty and product maintenance agreements. The deferred revenue is recognized ratably over the contractual term. If we would become aware of an increase in our estimated costs under these agreements in excess of our deferred revenue, additional charges may be necessary, resulting in an increase in costs of goods sold. In determining if additional charges are necessary, we examine cost trends on the contracts and other information and compare them to the deferred revenue. We do not believe there is a reasonable likelihood there will be a material change in the future estimates or assumptions we use to determine estimated costs under these agreements. As of
April 30, 2016
and
May 2, 2015
, we had
$15.1 million
and
$13.1 million
of deferred revenue related to separately priced extended warranty and product maintenance agreements, respectively.
Inventory.
Inventories are stated at the lower of cost or market. Market refers to the current replacement cost, except market may not exceed the net realizable value (that is, the estimated selling price in the ordinary course of business less reasonably predictable costs of completion and disposal), and market is not less than the net realizable value reduced by an allowance for normal profit margins. In
18
valuing inventory, we estimate market value where it is believed to be the lower of cost or market, and any necessary changes are charged to costs of goods sold in the period in which they occur. In determining market value, we review various factors such as current inventory levels, forecasted demand and technological obsolescence. We do not believe there is a reasonable likelihood there will be a material change in the future estimates or assumptions we use to calculate the estimated market value of inventory. However, if market conditions change, including changes in technology, product components used in our products or expected sales, we may be exposed to unforeseen losses which could be material.
Income taxes.
We operate in multiple income tax jurisdictions both within the United States and internationally. Our annual tax rate is determined based on our income, statutory tax rates and the tax impacts of items treated differently for tax purposes than for financial reporting purposes in each tax jurisdiction. Tax laws require that certain items be included in the tax returns at different times than the items are reflected in the financial statements. Some of these differences are permanent, such as expenses that are not deductible in our tax return, and some differences are temporary and reverse over time, such as depreciation expense. These temporary differences create deferred tax assets and liabilities and reflect the enacted income tax rates in effect for the years in which the differences are expected to reverse. We consider a valuation allowance for deferred tax assets if it is "more likely than not" that some or all of the benefits will not be realized.
Because we operate in multiple income tax jurisdictions both within the United States and internationally, management must determine the appropriate allocation of income and expenses to each of these jurisdictions based on current interpretations of complex income tax regulations.
Income tax authorities in all jurisdictions regularly perform audits of our income tax filings. Income tax audits associated with the allocation of income, expenses and other complex issues, including transfer pricing methodologies, may require an extended period of time to resolve and may result in significant income tax adjustments if changes to the income allocation are required between jurisdictions with different income tax rates.
We have no deferred tax liability recognized relating to our investment in foreign subsidiaries where the earnings have been indefinitely reinvested. If circumstances change and it becomes apparent that some or all of the undistributed untaxed earnings of a subsidiary will be remitted to the United States, we will accrue a tax expense at that time. We have approximately
$9.1 million
of untaxed earnings which have been indefinitely reinvested.
Asset Impairment.
Carrying values of goodwill and other intangible assets with indefinite lives are reviewed at least annually for possible impairment in accordance with ASC 350,
Intangibles -
Goodwill and Other
. Our impairment review involves estimating the fair value of goodwill and indefinite-lived intangible assets using a combination of a market approach and an income (discounted cash flow) approach at the reporting unit level, requiring significant management judgment with respect to revenue and expense growth rates, changes in working capital, and the selection and use of an appropriate discount rate. The estimates of fair value of reporting units are based on the best information available as of the date of the assessment. The use of different assumptions would increase or decrease estimated discounted future operating cash flows and could increase or decrease any impairment charge. We use our judgment in assessing whether assets may have become impaired between annual impairment tests. Indicators such as adverse business conditions, economic factors and technological change or competitive activities may signal an asset has become impaired.
Carrying values for long-lived tangible assets and definite-lived intangible assets, excluding goodwill and indefinite-lived intangible assets, are reviewed for possible impairment as circumstances warrant in connection with ASC 360-10-05-4,
Impairment or Disposal of Long-Lived Assets.
Impairment reviews are conducted when we believe a change in circumstances in the business or external factors warrants a review. Circumstances such as the discontinuation of a product or product line, a sudden or consistent decline in the forecast for a product, changes in technology or in the way an asset is being used, a history of negative operating cash flow, or an adverse change in legal factors or in the business climate, among others, may be indicators that trigger an impairment review. Our initial impairment review to determine if a potential impairment charge is required is based on an undiscounted cash flow analysis at the lowest level for which identifiable cash flows exist. The analysis requires judgment with respect to changes in technology, the continued success of product lines, future volume, revenue and expense growth rates, and discount rates.
Share-based compensation.
We use the Black-Scholes standard option pricing model (“Black-Scholes model”) to determine the fair value of stock options and stock purchase rights. The determination of the fair value of the awards on the date of grant using the Black-Scholes model is affected by our stock price as well as by assumptions regarding other variables, including projected employee stock option exercise behaviors, risk-free interest rate, expected volatility of our stock price in future periods, and expected dividend yield.
We analyze historical employee exercise and termination data to estimate the expected life assumption of a new employee stock option. We believe historical data currently represents the best estimate of the expected life of a new employee stock option. The risk-free interest rate we use is based on the U.S. Treasury zero-coupon yield curve on the grant date for a maturity similar to the expected life of the options. We estimate the expected volatility of our stock price in future periods by using the historical volatility. We use an expected dividend yield consistent with our dividend yield over the period of time we have paid dividends in the Black-Scholes option valuation
19
model. The amount of share-based compensation expense we recognize during a period is based on the portion of the awards ultimately expected to vest. We estimate pre-vesting option forfeitures at the time of grant by analyzing historical data, and we revise those estimates in subsequent periods if actual forfeitures differ from those estimates.
If factors change and we employ different assumptions for estimating share-based compensation expense in future periods or if we decide to use a different valuation model, the expense in future periods may differ significantly from what we have recorded in the current period and could materially affect our net earnings and net earnings per share in a future period.
RECENT ACCOUNTING PRONOUNCEMENTS
For a summary of recently issued accounting pronouncements and the effects those pronouncements on our financial results, refer to "
Note 1. Nature of Business and Summary of Critical Accounting Policies
" of the Notes to our Consolidated Financial Statements included elsewhere in this Report.
RESULTS OF OPERATIONS
Daktronics, Inc. operates on a 52 or 53 week fiscal year, with our fiscal year ending on the Saturday closest to April 30 of each year. When April 30 falls on a Wednesday, the fiscal year ends on the preceding Saturday. Within each fiscal year, each quarter is comprised of 13 week periods following the beginning of each fiscal year. In each 53 week year, an additional week is added to the first quarter and each of the last three quarters is comprised of a 13 week period. The years ended
April 30, 2016
,
May 2, 2015
, and
April 26, 2014
contained operating results for
52
,
53
, and
52
weeks, respectively.
Net Sales
|
|
|||||||||||||||||||||||
|
April 30, 2016
|
May 2, 2015
|
2016 vs 2015
|
April 26, 2014
|
2015 vs 2014
|
|||||||||||||||||||
|
(dollars in thousands)
|
Amount
|
Amount
|
Dollar Change
|
Percent Change
|
Amount
|
Dollar Change
|
Percent Change
|
||||||||||||||||
|
Net Sales:
|
|
|
|
||||||||||||||||||||
|
Commercial
|
$
|
148,261
|
|
$
|
165,793
|
|
$
|
(17,532
|
)
|
(10.6
|
)%
|
$
|
154,754
|
|
$
|
11,039
|
|
7.1
|
%
|
||||
|
Live Events
|
205,151
|
|
231,877
|
|
(26,726
|
)
|
(11.5
|
)%
|
197,246
|
|
34,631
|
|
17.6
|
%
|
|||||||||
|
High School Park and Recreation
|
70,035
|
|
67,657
|
|
2,378
|
|
3.5
|
%
|
59,531
|
|
8,126
|
|
13.7
|
%
|
|||||||||
|
Transportation
|
52,249
|
|
48,333
|
|
3,916
|
|
8.1
|
%
|
54,861
|
|
(6,528
|
)
|
(11.9
|
)%
|
|||||||||
|
International
|
94,472
|
|
102,282
|
|
(7,810
|
)
|
(7.6
|
)%
|
85,578
|
|
16,704
|
|
19.5
|
%
|
|||||||||
|
|
$
|
570,168
|
|
$
|
615,942
|
|
$
|
(45,774
|
)
|
(7.4
|
)%
|
$
|
551,970
|
|
$
|
63,972
|
|
11.6
|
%
|
||||
|
Orders:
|
|
|
|
|
|
|
|
|
|
|
|||||||||||||
|
Commercial
|
$
|
135,824
|
|
$
|
170,209
|
|
$
|
(34,385
|
)
|
(20.2
|
)%
|
$
|
155,840
|
|
$
|
14,369
|
|
9.2
|
%
|
||||
|
Live Events
|
220,377
|
|
226,354
|
|
(5,977
|
)
|
(2.6
|
)%
|
225,331
|
|
1,023
|
|
0.5
|
%
|
|||||||||
|
High School Park and Recreation
|
76,485
|
|
69,188
|
|
7,297
|
|
10.5
|
%
|
59,812
|
|
9,376
|
|
15.7
|
%
|
|||||||||
|
Transportation
|
56,834
|
|
50,845
|
|
5,989
|
|
11.8
|
%
|
49,057
|
|
1,788
|
|
3.6
|
%
|
|||||||||
|
International
|
71,266
|
|
114,977
|
|
(43,711
|
)
|
(38.0
|
)%
|
87,094
|
|
27,883
|
|
32.0
|
%
|
|||||||||
|
|
$
|
560,786
|
|
$
|
631,573
|
|
$
|
(70,787
|
)
|
(11.2
|
)%
|
$
|
577,134
|
|
$
|
54,439
|
|
9.4
|
%
|
||||
20
Sales and orders were impacted as a result of the 53-week fiscal year ended
May 2, 2015
compared to the more common 52 week 2016 fiscal year. The fiscal years ended
April 30, 2016
and
April 26, 2014
contained 52 weeks. The additional week of sales constituted approximately 2% of the decrease in the sales for 2016 fiscal year compared to fiscal 2015 and 2% of the increase in sales for the 2015 fiscal year compared to the 2014 fiscal year.
Fiscal Year 2016
as compared to
Fiscal Year 2015
Commercial:
The
decrease
in net sales for
fiscal 2016
compared to
fiscal 2015
was the net result of a decrease of sales in our billboard niche due to volatility of order timing and general market delay in placing orders as compared to prior periods due to customer capital allocation decisions and overall satisfaction with our product lifetime, leading to longer product replacement cycles. There were higher than usual fiscal 2015 first quarter billboard sales caused by construction site delays in late fiscal 2014 that moved more work into fiscal 2015. Sales in our spectacular niche were also down compared to last year due to the timing of projects, which was offset by an increase in the sales of our on-premise niche.
The
decrease
in orders for
fiscal 2016
compared to
fiscal 2015
was primarily due to the softening in customer demand in the digital billboard niche and delayed customer commitments on large custom video project orders in our spectacular niche. Orders increased in our national account niche because of increased demand from a national company using petroleum displays. Orders were up slightly in our on-premise business.
We continue to see adoption of video solutions in our Commercial business unit marketplace. We see opportunity for orders and sales in our billboard, on-premise, and national account niches due to replacement cycles. A number of large custom video contract opportunities are available in the marketplace. Due to a number of factors, such as the discretionary nature of customers committing to a system, economic dependencies, and competitive factors, it is difficult to predict orders and net sales for fiscal
2017
. We expect growth in this business unit over the long-term, assuming favorable economic conditions.
Live Events:
The
decrease
in net sales for
fiscal 2016
compared to
fiscal 2015
was primarily due to the timing of orders converting to sales based on customer delivery expectations and due to the slight decline of orders for the year.
The
decrease
in orders for
fiscal 2016
compared to
fiscal 2015
was primarily the result of the order timing variability on large projects. In addition, we had a large National Football League ("NFL") order in fiscal 2015, and no order of similar size occurred during fiscal 2016.
We continue to see ongoing interest from venues at all levels to increase the size and capability of their display system in our Live Events business unit marketplace. A number of factors, such as the discretionary nature of customers committing to upgrade systems, long replacement cycles, and competitive factors make forecasting fiscal
2017
orders and net sales difficult. We expect growth in this business unit over the long-term, assuming favorable economic conditions and success of counteracting competitive pressures.
High School Park and Recreation:
The
increase
in net sales for
fiscal 2016
compared to
fiscal 2015
was primarily
due to increased demand for large display systems.
The
increase
in orders for
fiscal 2016
compared to
fiscal 2015
was primarily due to larger average order sizes due to increased video projects during fiscal 2016 and increased win rates across the market.
We continue to see opportunities to sell larger video systems and our classic scoring and message centers in fiscal
2017
, primarily in high school facilities which benefit from our sports marketing services that generate advertising revenue to fund the display systems and because of schools' desires to communicate with students and parents. For the long term, we believe this market presents growth opportunities as the economy continues to improve and larger video systems are adopted.
Transportation:
The
increase
in net sales for
fiscal 2016
compared to
fiscal 2015
was primarily the result of increased availability of federal funding for intelligent transportation and mass transit projects.
The
increase
in orders for
fiscal 2016
compared to
fiscal 2015
was primarily due to market demand for intelligent transportation systems due to the availability of federal funding from a number of departments of transportation across the United States and success in winning mass transit projects.
A number of factors, such as transportation funding, the competitive environment, customer delivery changes and various other factors, make forecasting orders and net sales difficult for fiscal
2017
. However, the stability of long-term federal transportation funding and the number of capital projects for highways and public transit that include dynamic message signs show signs of growth over the long-term. Without transportation funding, payments to states could be reduced and could have a negative impact on our sales and financial results in the Transportation business unit.
21
International:
The
decrease
in net sales for
fiscal 2016
compared to
fiscal 2015
was the net result of a lower volume of orders.
The
decrease
in orders for
fiscal 2016
compared to
fiscal 2015
was primarily due to global macroeconomic conditions, a strong U.S. dollar, competition, and the timing and volatility of large orders
For fiscal
2017
, while our pipeline for large commercial and sports and transportation remains strong, macroeconomic headwinds which may impact order bookings and timing making it difficult to predict order and sales levels for fiscal 2017. For the long-term, we believe the International business unit has the potential for sales growth as we penetrate markets with our established sales networks to increase our International market share and due to the increased use and adoption of our technology globally.
Backlog:
The product order backlog as of
April 30, 2016
was
$181.2 million
as compared to
$190.5 million
as of
May 2, 2015
. Historically, our backlog varies due to the seasonality of our business, the timing of large projects, and customer delivery schedules for these orders. The backlog decreased from one year ago in our Commercial and International business units and increased in our other business units.
Fiscal Year 2015
as compared to
Fiscal Year 2014
Commercial:
The increase in net sales for fiscal 2015 compared to fiscal 2014 was the net result of an increase in sales in the billboard niche due to the timing of orders and shipments. Weather related issues at our customers' billboard construction sites caused delayed shipments and moved sales from fiscal 2014 into early fiscal 2015. Sales in our spectacular niche increased due to increased market activity, which was offset by decreases in our on-premise and national account niches caused by the soft economic market.
The increase in orders for fiscal 2015 compared to fiscal 2014 was primarily the net result of an increase in orders in our large custom video contract niche due to increased market activity in this area. There was a slight increase in orders in our billboard niche, which was offset by decreases in our on-premise and national account niches due to the soft economic market.
Live Events:
The increase in net sales for fiscal 2015 compared to fiscal 2014 was primarily due to an increase in the number of multi-million dollar projects in professional sports stadiums and arenas used by Major League Baseball, the National Basketball Association, the NFL, and the National Hockey League, which was offset by decreases in multi-sport arenas and sales related to college and university venues.
Orders for fiscal 2015 compared to fiscal 2014 were relatively flat.
High School Park and Recreation:
The increase in net sales for fiscal 2015 compared to fiscal 2014 was primarily the result of a difference in order timing. We experienced many orders that were pushed out from our fourth quarter of fiscal 2014 into the first six months of fiscal 2015. The increase in sales also is due to production and delivery on a higher volume of orders and an increase in service agreements. Order transaction size also increased due to larger display sizes, which increased sales prices.
The increase in orders for fiscal 2015 compared to fiscal 2014 was primarily due to higher orders of video and sound systems as some orders pushed into the first six months of fiscal 2015 from the fourth quarter of fiscal 2014 due to customer timing, increased opportunities in the market place, and an increase in the size of the display systems.
Transportation:
The decrease in net sales for fiscal 2015 compared to fiscal 2014 was primarily the result of sales recognized during fiscal 2014 for three significant state transportation authorities and a significant transit project with no sales from recurring projects of a similar size recognized during fiscal 2015. We believe some of the sales decline is due to the uncertainty in this market because of the lack of clarity on the approval, timing and funding levels of the federal Highway and Transportation Funding Act of 2014.
The increase in orders for fiscal 2015 compared to fiscal 2014 was primarily due to the timing of orders received from state transportation authorities.
International:
The increase in net sales for fiscal 2015 compared to fiscal 2014 was the net result of sales recognized for sports projects in Europe and Australia, retail spectaculars, and OOH billboard and street furniture products. We believe the increased sales is a result of our ongoing strategy to grow our international presence. In addition, Data Display's sales in the International business unit were approximately $5.0 million for fiscal 2015; Data Display was not part of the International business unit in fiscal 2014.
The increase in orders for fiscal 2015 compared to fiscal 2014 was primarily due to the increased amount of orders booked during the fourth quarter of fiscal 2015. These orders are related to all of our international markets; however, a major portion was due to an order in the transportation market for over $12.0 million.
22
Gross Profit
|
|
Year Ended
|
||||||||||||||||||||
|
|
April 30, 2016
|
May 2, 2015
|
April 26, 2014
|
||||||||||||||||||
|
(dollars in thousands)
|
Amount
|
As a Percent of Net Sales
|
Amount
|
As a Percent of Net Sales
|
Amount
|
As a Percent of Net Sales
|
|||||||||||||||
|
Commercial
|
$
|
29,147
|
|
19.7
|
%
|
$
|
44,344
|
|
26.7
|
%
|
$
|
44,974
|
|
29.1
|
%
|
||||||
|
Live Events
|
36,568
|
|
17.8
|
|
40,945
|
|
17.7
|
|
43,019
|
|
21.8
|
|
|||||||||
|
High School Park and Recreation
|
20,624
|
|
29.4
|
|
21,561
|
|
31.9
|
|
16,202
|
|
27.2
|
|
|||||||||
|
Transportation
|
16,572
|
|
31.7
|
|
14,647
|
|
30.3
|
|
16,126
|
|
29.4
|
|
|||||||||
|
International
|
18,108
|
|
19.2
|
|
23,082
|
|
22.6
|
|
21,389
|
|
25.0
|
|
|||||||||
|
|
$
|
121,019
|
|
21.2
|
%
|
$
|
144,579
|
|
23.5
|
%
|
$
|
141,710
|
|
25.7
|
%
|
||||||
Fiscal Year 2016
as compared to
Fiscal Year 2015
The gross profit percentage
decrease
d for
fiscal 2016
compared to
fiscal 2015
. This decline was primarily due to additional warranty charges in fiscal 2016, decreased volume levels through manufacturing areas, increased personnel costs, a change in the mix of business, and the increased competitive environment. The following describes the overall impact by business unit:
Commercial:
The gross profit percent
decrease
in the Commercial business unit for
fiscal 2016
compared to
fiscal 2015
was primarily the result of a $9.2 million warranty charge in our OOH product application, which decreased the Commercial gross profit percentage by 6.1% for the 2016 fiscal year. This warranty charge relates to the costs of upgrading firmware to improve display performance and refurbishing displays. Gross profit also declined due to low manufacturing utilization as a result of decreases in billboard demand, the product mix of sales, and overall competitiveness of large custom contracts. See "
Note 17. Commitments and Contingencies
" of the Notes to our Consolidated Financial Statements included in the Form 10-K for more information regarding our warranty accrual.
Live Events:
The slight gross profit percent
increase
in the Live Events business unit for
fiscal 2016
compared to
fiscal 2015
was the result of decreased expenditures incurred for overtime, expediting, and shipping costs to meet critical event dates incurred for our customers in fiscal 2015 that were not incurred in fiscal 2016 and improved manufacturing utilization, offset by an increase in warranty costs as a percent of sales and increases in personnel related expenses.
High School Park and Recreation:
The gross profit percent
decrease
in the High School Park and Recreation business unit for
fiscal 2016
compared to
fiscal 2015
primarily was due to recognizing a $1.3 million gain on the sale of our theatre rigging manufacturing division during the fiscal 2015, but no comparable transaction occurred during fiscal 2016. Gross profit also declined due to increases in personnel related expenses.
Transportation:
The gross profit percent
increase
in the Transportation business unit for
fiscal 2016
compared to
fiscal 2015
was primarily due to the product mix of sales and improved manufacturing utilization.
International:
The gross profit percent
decrease
in the International business unit for
fiscal 2016
compared to
fiscal 2015
was primarily the result of low utilization of our international manufacturing facilities due to lower sales volume and increases in warranty costs as a percent of sales.
It is difficult to project gross profit levels for fiscal
2017
because of the uncertainty regarding the level of sales, the sales mix and timing, and the competitive factors in our business. We are focused on improving our gross profit margins as we execute our strategies for improved profitability which include enhanced capacity planning, releasing new product designs to lower overall costs of the product, improving reliability to reduce warranty expenses, meeting customer solution expectations, and improving operational effectiveness in the installation and services delivery areas. We continue to experience wage and benefit pressures through our manufacturing and services areas.
Fiscal Year 2015
as compared to
Fiscal Year 2014
The gross profit percentage decreased for fiscal 2015 compared to fiscal 2014. This decline was due to the mix of business; a number of multi-million dollar projects that generally are more competitive and have lower profit margins and include a higher level of subcontracted installations; additional spending due to capacity constraints in our second quarter; an increase in expenses for our acquisition of Data Display in fiscal 2015; and competitive pressures in the marketplace.
23
Commercial:
The gross profit percent decrease in the Commercial business unit for fiscal 2015 compared to fiscal 2014 was the result of the product mix of sales and manufacturing utilization, partially offset by lower warranty costs as a percent of sales.
Live Events:
The gross profit percent decrease in the Live Events business unit for fiscal 2015 compared to fiscal 2014 was due to the effects of an increased mix of large custom contracts, the related increased mix of subcontracted installation activity, and the higher volume of business during the second quarter which stretched our capacity. In order to meet critical event dates for our sports customers, we had additional costs related to overtime, expediting, and shipping. The installation activity generally lowers margins as we outsource subcontracted on-site work at general contracting rates which have lower margins than in-house video equipment production.
High School Park and Recreation:
The gross profit percent increase in the High School Park and Recreation business unit for fiscal 2015 compared to fiscal 2014 primarily was the result of overall gross margin improvement on contracts due to higher percentages of Daktronics Sports Marketing ("DSM") projects and improved manufacturing utilization. In addition, in the first quarter of fiscal 2015, we recognized a $1.3 million gain on the sale of our theatre rigging division.
Transportation:
The gross profit percent increase in the Transportation business unit for fiscal 2015 compared to fiscal 2014 was primarily the result of improved gross margins on contracts and standard orders and lower warranty costs as a percent of sales, partially offset by a decline in our manufacturing utilization.
International:
The gross profit percent decrease in the International business unit for fiscal 2015 compared to fiscal 2014 was the net result of an overall gross margin decline on our large custom contracts, which generally have lower margins due to their competitive nature and low utilization of our international manufacturing facilities, including the factory and related costs acquired with the Data Display acquisition.
Selling Expenses
|
|
Year Ended
|
|||||||||||||||||||||||||
|
April 30, 2016
|
May 2, 2015
|
April 26, 2014
|
||||||||||||||||||||||||
|
(dollars in thousands)
|
Amount
|
As a Percent of Net Sales
|
Percent Change
|
Amount
|
As a Percent of Net Sales
|
Percent Change
|
Amount
|
As a Percent of Net Sales
|
||||||||||||||||||
|
Commercial
|
$
|
15,938
|
|
10.7
|
%
|
0.9
|
%
|
$
|
15,802
|
|
9.5
|
%
|
7.8
|
%
|
$
|
14,662
|
|
9.5
|
%
|
|||||||
|
Live Events
|
13,390
|
|
6.5
|
|
(1.6
|
)
|
13,611
|
|
5.9
|
|
8.8
|
|
12,515
|
|
6.3
|
|
||||||||||
|
High School Park and Recreation
|
10,310
|
|
14.7
|
|
(1.2
|
)
|
10,436
|
|
15.4
|
|
(2.7
|
)
|
10,727
|
|
18.0
|
|
||||||||||
|
Transportation
|
4,106
|
|
7.9
|
|
(3.3
|
)
|
4,244
|
|
8.8
|
|
28.0
|
|
3,316
|
|
6.0
|
|
||||||||||
|
International
|
15,068
|
|
15.9
|
|
8.6
|
|
13,870
|
|
13.6
|
|
10.3
|
|
12,574
|
|
14.7
|
|
||||||||||
|
|
$
|
58,812
|
|
10.3
|
%
|
1.5
|
%
|
$
|
57,963
|
|
9.4
|
%
|
7.7
|
%
|
$
|
53,794
|
|
9.7
|
%
|
|||||||
All areas of selling expenses were impacted as a result of the 53-week fiscal year ended
May 2, 2015
compared to the more common 52 week fiscal year. The fiscal years ended
April 30, 2016
and
April 26, 2014
contained 52 weeks.
Fiscal Year 2016
as compared to
Fiscal Year 2015
Selling expenses
consist primarily of salaries, other employee-related costs, travel and entertainment expenses, facilities-related costs for sales and service offices, bad debt expenses, third-party commissions and expenditures for marketing efforts, including the costs of collateral materials, conventions and trade shows, product demos, and supplies.
Selling expense in our Transportation, Live Events, and High School Park and Recreation business units decreased for
fiscal 2016
compared to
fiscal 2015
primarily due to the additional week of selling expenses in the first quarter of fiscal year 2015 and decreases in our travel and entertainment expenses, marketing expenses, and third party commissions.
Selling expense in our International business unit increased in
fiscal 2016
compared to
fiscal 2015
primarily due to increases in personnel expenses, bad debt expense, and third-party commissions.
Selling expense in our Commercial business unit remained relatively flat.
For fiscal
2017
, we are focused on constraining cost growth throughout the company because of the short-term order uncertainty and to allocate additional resources to product design and development. In addition, we expect a reduction in bad debt expense, which will contribute to flat to decreased selling expenses.
24
Fiscal Year 2015
as compared to
Fiscal Year 2014
Selling expense in our Commercial, Live Events, Transportation, and International business units increased for fiscal 2015 compared to fiscal 2014 primarily due to increases in personnel expenses, travel and entertainment expense, marketing expense, the implementation of a sales opportunity management tool, the additional costs associated with the Data Display sales teams, and various other expenses, with a reduction of bad debt and commission expenses.
Selling expense in our High School Park and Recreation business unit remained relatively flat for fiscal 2015 compared to fiscal 2014.
Other Operating Expenses
|
|
Year Ended
|
|||||||||||||||||||||||||
|
April 30, 2016
|
May 2, 2015
|
April 26, 2014
|
||||||||||||||||||||||||
|
(dollars in thousands)
|
Amount
|
As a Percent of Net Sales
|
Percent Change
|
Amount
|
As a Percent of Net Sales
|
Percent Change
|
Amount
|
As a Percent of Net Sales
|
||||||||||||||||||
|
General and administrative
|
$
|
32,801
|
|
5.8
|
%
|
6.9
|
%
|
$
|
30,679
|
|
5.0
|
%
|
9.6
|
%
|
$
|
27,984
|
|
5.1
|
%
|
|||||||
|
Product design and development
|
$
|
26,911
|
|
4.7
|
%
|
9.2
|
%
|
$
|
24,652
|
|
4.0
|
%
|
5.5
|
%
|
$
|
23,375
|
|
4.2
|
%
|
|||||||
All areas of operating expenses were impacted as a result of the 53-week fiscal year ended
May 2, 2015
compared to the more common 52 week fiscal year. The fiscal years ended
April 30, 2016
and
April 26, 2014
contained 52 weeks.
Fiscal Year 2016
as compared to
Fiscal Year 2015
General and administrative expenses
consist primarily of salaries, other employee-related costs, professional fees, shareholder relations costs, facilities and equipment-related costs for administrative departments, training costs, amortization of intangibles, and the cost of supplies.
General and administrative expenses in
fiscal 2016
increase
d as compared to
fiscal 2015
primarily due to increases in information technology and personnel expenses, partially offset by decreases in professional fees.
We expect general and administrative expenses to remain flat or only increase slightly for fiscal
2017
as compared to
fiscal 2016
because we want to constrain cost growth throughout the Company because of the short-term order uncertainty and to additional allocate resources to product design and development. We continue to project increases in information technology related costs.
Product design and development expenses
consist primarily of salaries, other employee-related costs, facilities cost and equipment-related costs and supplies. Product development investments in the near term are focused on video technology with a range of pixel pitches for outdoor applications using LED surface mount technology, which offers improved performance at a lower cost point as compared to our current offerings. In addition, we continue to focus on various other products to standardize display components and control systems for both single site and network displays.
Our costs for product development represent an allocated amount of costs based on time charges, materials costs and the overhead of our engineering departments. Generally, a significant portion of our engineering time is spent on product development while the rest is allocated to large contract work and is included in cost of goods sold. Product development expenses in
fiscal 2016
increase
d compared to
fiscal 2015
primarily due to an increase in time spent on the development of new or enhanced solutions development in order to meet market demand for these solutions. The increase is primarily a function of the increased activity and includes personnel, materials, and professional services expenditures.
We plan to accelerate activities in our design groups to complete development for a number of solution areas during fiscal 2017. This acceleration is expected to cause product design and development expenses to increase in fiscal 2017.
Fiscal Year 2015
as compared to
Fiscal Year 2014
General and administrative expenses in fiscal 2015 increased as compared to fiscal 2014 primarily due to an increase in professional services costs, personnel expenses, IT maintenance, and various other expenses. These expenses included one-time costs incurred in the second quarter of fiscal 2015 for professional services to support the expansion of our International business and other on-going costs to support our anticipated business growth. We incurred $0.4 million in general and administration expense for professional fees related to the Data Display acquisition.
25
Product development expenses in fiscal 2015
increased compared to fiscal 2014
primarily due to an increase in materials used in the development of new products and labor costs assigned to product development projects.
Other Income and Expenses
|
|
Year Ended
|
|||||||||||||||||||||||||
|
April 30, 2016
|
May 2, 2015
|
April 26, 2014
|
||||||||||||||||||||||||
|
(dollars in thousands)
|
Amount
|
As a Percent of Net Sales
|
Percent Change
|
Amount
|
As a Percent of Net Sales
|
Percent Change
|
Amount
|
As a Percent of Net Sales
|
||||||||||||||||||
|
Interest income, net
|
$
|
759
|
|
0.1
|
%
|
(15.3
|
)%
|
$
|
896
|
|
0.1
|
%
|
(13.8
|
)%
|
$
|
1,039
|
|
0.2
|
%
|
|||||||
|
Other (expense) income, net
|
$
|
(128
|
)
|
—
|
%
|
(74.3
|
)%
|
$
|
(498
|
)
|
(0.1
|
)%
|
40.3
|
%
|
$
|
(355
|
)
|
(0.1
|
)%
|
|||||||
Fiscal Year 2016
as compared to
Fiscal Year 2015
Interest income, net
:
We generate interest income through short-term cash investments, marketable securities, product sales on an installment basis, or in exchange for the rights to sell and retain advertising revenues from displays, which result in long-term receivables. Interest expense is comprised primarily of interest costs on long-term marketing obligations.
Interest income, net
decrease
d in
fiscal 2016
as compared to
fiscal 2015
as a result of interest expenses related to a tax audit assessment. As a result of the volatility of working capital needs and changes in investing and financing activities, along with changes in the interest rate environment, it is difficult to project changes in interest income.
Other (expense) income, net
:
The change in other income and expense, net for
fiscal 2016
as compared to
fiscal 2015
was primarily due to adjustment of contingent consideration for a past acquisition offset by foreign currency gains.
Fiscal Year 2015
as compared to
Fiscal Year 2014
Interest income, net:
Interest income decreased slightly for fiscal 2015 as compared to fiscal 2014 due to lower installment receivables.
Other (expense) income, net:
The change in other income and expense, net for fiscal 2015 as compared to fiscal 2014 is primarily due to unrealized foreign currency gains from the volatility of the Euro, Australian dollar, and Canadian dollar.
Income Taxes
The effective tax rate was approximately
34.1 percent
,
34.1 percent
and
40.4 percent
for
fiscal 2016
,
fiscal 2015
, and
fiscal 2014
, respectively.
The effective income tax rate for fiscal 2016 includes the impact of The Protecting Americans from Tax Hikes Act of 2015 (“PATH Act”) signed by the President in December 2015. Under prior law, a taxpayer was not entitled to a research tax credit for qualifying amounts paid or incurred after December 31, 2014. However, under the PATH Act, a taxpayer is now entitled to a research tax credit for qualifying amounts paid or incurred after December 31, 2014 with no expiration. As a result of the retroactive reinstatement and permanent extension, we recognized approximately $2.0 million in tax benefits during fiscal 2016. The benefit is largely offset by pre-tax losses with no tax benefit due to valuation allowances and the current year establishment of valuation allowances in certain jurisdictions of $1.2 million that were recognized during fiscal 2016.
The effective income tax rate for fiscal 2015 includes the impact of The Tax Increase Prevention Act of 2014 signed by the President in December 2014, which extended the research tax credits for one year to December 31, 2014. Under prior law, a taxpayer was entitled to a research tax credit for qualifying amounts paid or incurred on or before December 31, 2013. The extension of the research credit is retroactive and includes amounts paid or incurred after December 31, 2013. As a result of the retroactive extension, we recognized approximately $1.3 million in tax benefits during fiscal 2015.
The effective income tax rate for fiscal 2014 includes the impact of a $2.3 million valuation allowance against a deferred tax asset related to losses on an equity investment when it became more likely than not we would not realize the benefit. The rate was also impacted by the research credit being effective for only a portion of the year. For a more detailed description of the valuation allowance, please see "
Note 13. Income Taxes
" of the Notes to our Consolidated Financial Statements included in this Form 10-K.
26
Fiscal Year 2016
Fourth Quarter Summary
During the fourth quarter of
fiscal 2016
, net sales
decrease
d approximately
12.4 percent
to
$138.5 million
as compared to
$158.1 million
in the fourth quarter of
fiscal 2015
. Net sales decreased in the International, Commercial billboard and spectacular niches, and Live Events business units. Net sales increased in the High School Park and Recreation business unit. Transportation business unit net sales remained relatively flat. Commercial business unit net sales decreased due to decreased customer demand in billboard and spectacular niches due to lower demand in the billboard segment from our national billboard customers and due to the volatility of order timing of large projects cause by various macroeconomic and customer decision delays. Live Events business unit net sales decreased due to the timing of customer deliveries extending beyond the fiscal year. High School Park and Recreation business unit net sales increased due to an increase in sales and service orders for increased project sizes. International business unit net sales decreased due to lower orders during the last half of the year.
Gross margin percentage
decrease
d to approximately
20.2 percent
in the fourth quarter of
fiscal 2016
from approximately
22.3 percent
in the fourth quarter of
fiscal 2015
. The
decrease
in gross profit percentage was the net result of the additional warranty charge in fiscal 2016 and the product mix of sales.
Selling expenses
increase
d to
$15.9 million
in the fourth quarter of
fiscal 2016
compared to
$14.6 million
in the fourth quarter of
fiscal 2015
. The
increase
was primarily due to increased personnel expenses, including taxes and benefits, third party commissions, and bad debt expense, which were partially offset by decreases in travel and entertainment expenses and other expenses.
General and administrative costs
increase
d by approximately
10.5 percent
in the fourth quarter of
fiscal 2016
to
$8.6 million
as compared to
$7.8 million
in the fourth quarter of
fiscal 2015
. The
increase
was primarily due to increased personnel expenses, including taxes and benefits, information technology, including software and hardware expenses, and professional fees.
Product development costs
increase
d by approximately
20.5 percent
in the fourth quarter of
fiscal 2016
to
$7.1 million
as compared to
$5.9 million
in the fourth quarter of
fiscal 2015
. The
increase
was the result of increased development activities including personnel costs and cost of materials to produce and test prototypes.
The effective tax rate was
0.6 percent
in the fourth quarter of
fiscal 2016
compared to
45.0 percent
in the fourth quarter of
fiscal 2015
. The effective income tax rate for fiscal 2016 includes the impact of a tax benefit of a book loss for the fourth quarter offset by the impact of $1.0 million in valuation allowances against deferred tax assets related to foreign net operating losses recognized in the fourth quarter when it became more likely than not we would not realize the benefit of the losses.
27
LIQUIDITY AND CAPITAL RESOURCES
|
|
Year Ended
|
|||||||||
|
|
April 30,
2016 |
May 2,
2015 |
Percent Change
|
|||||||
|
(dollars in thousands)
|
||||||||||
|
Net cash provided by (used in):
|
|
|
|
|||||||
|
Operating activities
|
$
|
13,275
|
|
$
|
53,168
|
|
(75.0
|
)%
|
||
|
Investing activities
|
(23,818
|
)
|
(24,227
|
)
|
(1.7
|
)
|
||||
|
Financing activities
|
(17,448
|
)
|
(16,070
|
)
|
8.6
|
|
||||
|
Effect of exchange rate changes on cash
|
(965
|
)
|
(641
|
)
|
50.5
|
|
||||
|
Net increase in cash and cash equivalents
|
$
|
(28,956
|
)
|
$
|
12,230
|
|
336.8
|
%
|
||
Cash flows from operating activities:
Operating cash flows result primarily from cash received from customers, which is offset by cash payments for inventories, income taxes, market and warranty obligations, and employee compensation.
Cash provided by operating activities was
$13.3 million
for
fiscal 2016
compared to
$53.2 million
in
fiscal 2015
. The
decrease
in cash from operating activities of
$39.9 million
was the net result of a
decrease
for changes in net operating assets and liabilities of
$23.3 million
, a
decrease
of
$18.8 million
in net income, a
decrease
of
$1.2 million
in our deferred income taxes, net, adjusted by a
$1.8 million
increase
in depreciation and amortization, a
$1.1 million
gain on the sale of property and equipment in fiscal 2015, and a
$0.5 million
increase
in other non-cash items.
Overall, changes in operating assets and liabilities can be impacted by the timing of cash flow on large orders, which can cause significant fluctuations in the short term in inventory, accounts receivables, accounts payable, customer deposits, costs and earnings in excess of billings and various other operating assets and liabilities. Variability in costs and earnings in excess of billings and billings in excess of costs relates to the timing of billings on construction-type contracts and revenue recognition, which can vary significantly depending on contractual payment terms and build and installation schedules. Balances are also impacted by the seasonality of the sports markets. For information regarding changes in operating assets and liabilities, see "
Note 14. Cash Flow Information
" of the Notes to our Consolidated Financial Statements included in the Form 10-K.
Cash flows from investing activities:
Cash used in investing activities totaled
$23.8 million
for
fiscal 2016
compared to
$24.2 million
in
fiscal 2015
. Purchases of property and equipment totaled
$17.1 million
in
fiscal 2016
compared to
$21.8 million
in
fiscal 2015
.
A net cash inflow of
$4.0 million
was recognized during fiscal 2015 from the disposition of our automated rigging systems division for theatre applications. No comparable transaction occurred in fiscal 2016.
A net cash outlay of
$7.9 million
was recognized during
fiscal 2016
compared to
$6.3 million
recognized in
fiscal 2015
for acquisitions, investments in affiliates and equity investments.
Cash flows from financing activities:
Cash used in financing activities was
$17.4 million
for
fiscal 2016
compared to
$16.1 million
in
fiscal 2015
. Dividends of
$17.6 million
, or
$0.40
per share, were paid to Daktronics shareholders during
fiscal 2016
compared to
$17.4 million
, or
$0.40
per share, paid to Daktronics shareholders during
fiscal 2015
.
Other Liquidity and Capital Resources Discussion:
Although we have
$4.2 million
of retainage on long-term contracts included in receivables and costs in excess of billings as of
April 30, 2016
, we expect all of it to be collected within one year.
Working capital was
$123.7 million
at
April 30, 2016
and
$149.1 million
at
May 2, 2015
. The changes in working capital, particularly changes in accounts receivable, accounts payable, inventory, costs in excess of billings and billings in excess of cost, and the seasonality of the sports market can have a significant impact on net cash provided by operating activities, largely due to the timing of payments and receipts. Working capital changes were also attributable to the change in accounting for deferred tax assets. All deferred tax assets are classified in long-term assets starting in the fourth quarter of fiscal 2016. Historically, deferred tax assets were included in current assets. We have historically financed working capital needs through a combination of cash flow from operations and borrowings under bank credit agreements.
We have used and expect to continue to use cash reserves to meet our short-term working capital requirements. On large product orders, the time between order acceptance and project completion may extend up to and exceed 24 months depending on the amount of custom work and a customer’s delivery needs. We often receive down payments or progress payments on these product orders. To the extent these payments are not sufficient to fund the costs and other expenses associated with these orders, we use working capital and bank borrowings to finance these cash requirements. During the fourth quarter of fiscal 2016, we violated one of our bank covenants, but received a waiver from our banking institution for the year ended April 30, 2016. Although we are not currently using our credit line,
28
which expires on November 15, 2016, any future covenant violations could impact our ability to obtain future financing. For additional information on financing agreements, see, "
Note 10. Financing Agreements
" of the Notes to our Consolidated Financial Statements included in this Form 10-K.
We utilize cash to pay dividends to our investors. The following table summarizes the regular quarterly dividend declared and paid since the fiscal year end of
May 2, 2015
:
|
Date Declared
|
Record Date
|
Payment Date
|
Amount per Share
|
|
May 29, 2015
|
June 12, 2015
|
June 23, 2015
|
$0.10
|
|
September 3, 2015
|
September 14, 2015
|
September 25, 2015
|
$0.10
|
|
December 9, 2015
|
December 21, 2015
|
December 30, 2015
|
$0.10
|
|
February 29, 2016
|
March 11, 2016
|
March 22, 2016
|
$0.10
|
|
June 16, 2016
|
June 27, 2016
|
July 8, 2016
|
$0.06
|
The following table summarizes the special dividends declared and paid since the fiscal year end of
May 2, 2015
:
|
Date Declared
|
Record Date
|
Payment Date
|
Amount per Share
|
|
June 16, 2016
|
June 27, 2016
|
July 8, 2016
|
$0.04
|
Although we expect to continue to pay dividends for the foreseeable future, any and all subsequent dividends will be reviewed regularly and declared by the Board of Directors at its discretion.
We are sometimes required to obtain performance bonds for display installations, and we have a bonding line available through a surety company for an aggregate of $150.0 million in bonded work outstanding. If we were unable to complete the work and our customer would call upon the bond for payment, the surety company would subrogate its loss to Daktronics. At
April 30, 2016
, we had
$50.6 million
of bonded work outstanding against this line.
Our business growth and profitability improvement strategies depend on investments in capital expenditures. We are projecting capital expenditures to be approximately $20 million for fiscal
2017
for manufacturing equipment for new or enhanced product production, expanded capacity, investments in quality and reliability equipment, and continued information infrastructure investments.
We believe our working capital available from all sources will be adequate to meet the cash requirements of our operations in the foreseeable future. If our growth extends beyond current expectations, profitability does not improve, or if we make any strategic investments, we may need to increase our credit facilities or seek other means of financing. We anticipate we will be able to obtain any needed funds under commercially reasonable terms from our current lenders or other sources, although there can be no guarantee of such.
29
OFF-BALANCE-SHEET ARRANGEMENTS AND CONTRACTUAL OBLIGATIONS
We enter into various lease, purchase and marketing obligations that require payments in future periods. Operating lease obligations relate primarily to leased manufacturing space, office space, furniture, and vehicles. Long-term marketing obligations relate to amounts due in future periods for payments on net sales where we sold and installed our equipment in exchange for future advertising revenue. When certain advertising revenue thresholds are met, all or a portion of excess cash is owed back to the customer. Conditional and unconditional purchase obligations represent future payments for inventory, advertising rights and various other products and services purchase commitments.
We have entered into standby letters of credit and surety bonds with financial institutions relating to the guarantee of future performance on contracts, primarily construction type contracts. Performance guarantees are issued to certain customers to guarantee the operation and installation of the equipment and our ability to complete a contract. These performance guarantees have various terms, which are generally one year.
As of
April 30, 2016
, our contractual obligations were as follows (in thousands):
|
Contractual Obligations
|
Total
|
Less than 1 year
|
1-3 Years
|
4-5 Years
|
After 5 Years
|
|||||||||||||||
|
Cash commitments:
|
|
|
|
|
|
|||||||||||||||
|
Long-term obligations and accrued interest
|
$
|
3,944
|
|
$
|
594
|
|
$
|
3,275
|
|
$
|
75
|
|
$
|
—
|
|
|||||
|
Operating leases
|
7,785
|
|
2,166
|
|
2,948
|
|
1,892
|
|
779
|
|
||||||||||
|
Unconditional purchase obligations
|
1,107
|
|
1,012
|
|
95
|
|
—
|
|
—
|
|
||||||||||
|
Conditional purchase obligations
|
500
|
|
200
|
|
300
|
|
—
|
|
—
|
|
||||||||||
|
Unrecognized tax benefits
|
3,016
|
|
3,016
|
|
—
|
|
—
|
|
—
|
|
||||||||||
|
Total
|
$
|
16,352
|
|
$
|
6,988
|
|
$
|
6,618
|
|
$
|
1,967
|
|
$
|
779
|
|
|||||
|
Other commercial commitments:
|
|
|
|
|
|
|
|
|
|
|
||||||||||
|
Standby letters of credit
|
$
|
7,354
|
|
$
|
5,765
|
|
$
|
1,031
|
|
$
|
558
|
|
$
|
—
|
|
|||||
|
Surety bonds
|
$
|
50,593
|
|
$
|
50,453
|
|
$
|
140
|
|
$
|
—
|
|
$
|
—
|
|
|||||
INFLATION
We believe inflation has not had a material effect on our operations or our financial condition, although it could in the future.
Item 7A. QUANTITATIVE AND QUALITATIVE DISCLOSURES ABOUT MARKET RISK
Foreign Currency Exchange Rates
Through
April 30, 2016
, most of our net sales were denominated in U.S. dollars, and our exposure to foreign currency exchange rate changes on net sales had not been significant. For the fiscal year
2016
, net sales originating outside the United States were
18%
of total net sales, of which a portion was denominated in Canadian dollars, Euros, Chinese renminbi, British pounds, Australian dollars, Brazilian reais or other currencies. We manufacture our products in the United States, China, Belgium, and Ireland. Our results of operations could be affected by factors such as changes in foreign currency rates or weak economic conditions in foreign markets. If we believed currency risk in any foreign location is significant, we would utilize foreign exchange hedging contracts to manage our exposure to the currency fluctuations.
Over the long term, net sales to international markets are expected to increase as a percentage of net sales and, consequently, a greater portion of our business could be denominated in foreign currencies. In addition, we may fund our foreign subsidiaries’ operating cash needs in the form of loans denominated in U.S. dollars. As a result, operating results may become subject to fluctuations based upon changes in the exchange rates of certain currencies in relation to the U.S. dollar. To the extent we engage in international sales denominated in U.S. dollars, an increase in the value of the U.S. dollar relative to foreign currencies could make our products less competitive in international markets. This effect is also impacted by the sources of raw materials from international sources. We estimate that a 10 percent change in all foreign exchange rates would impact our reported income before taxes by approximately
$1.0 million
. This sensitivity analysis disregards the possibilities that rates can move in opposite directions and that losses from one geographic area may be offset by gains from another geographic area. We will continue to monitor and minimize our exposure to currency fluctuations and, when appropriate, use financial hedging techniques, including foreign currency forward contracts and options, to minimize the effect of these fluctuations. However, exchange rate fluctuations as well as differing economic conditions, changes in political climates, differing tax structures and other rules and regulations could adversely affect our ability to effectively hedge exchange rate fluctuations in the future.
30
We have foreign currency forward agreements in place to offset changes in the value of intercompany receivables from certain foreign subsidiaries due to changes in foreign exchange rates. The notional amount of these derivatives is
$10.0 million
, and all contracts mature within
15
months. These contracts are marked to market each balance sheet date and are not designated as hedges. See "
Note 16. Derivative Financial Instruments
" of the Notes to our Consolidated Financial Statements included in this Form 10-K for further details.
Interest Rate Risks
Our exposure to market rate risk for changes in interest rates relates primarily to our marketing obligations and long-term accounts receivable. As of
April 30, 2016
, our outstanding marketing obligations were
$0.6 million
, all of which were in fixed rate obligations.
In connection with the sale of certain display systems, we have entered into various types of financing with customers. The aggregate amounts due from customers include an imputed interest element. The majority of these financings carry fixed rates of interest. As of
April 30, 2016
, our outstanding long-term receivables were
$7.0 million
. Each 25 basis point increase in interest rates would have an associated annual opportunity benefit of
$23 thousand
.
The following table provides maturities and weighted average interest rates on our financial instruments sensitive to changes in interest rates.
|
|
Fiscal Years
(dollars in thousands)
|
||||||||||||||||||||||
|
|
2017
|
2018
|
2019
|
2020
|
2021
|
Thereafter
|
|||||||||||||||||
|
Assets:
|
|
|
|
|
|
|
|||||||||||||||||
|
Long-term receivables, including current maturities:
|
|
|
|
|
|
|
|||||||||||||||||
|
Fixed-rate
|
$
|
3,172
|
|
$
|
1,637
|
|
$
|
1,026
|
|
$
|
542
|
|
$
|
322
|
|
$
|
339
|
|
|||||
|
Average interest rate
|
8.8
|
%
|
9.0
|
%
|
9.0
|
%
|
9.0
|
%
|
9.0
|
%
|
9.0
|
%
|
|||||||||||
|
Liabilities:
|
|
|
|
|
|
|
|
|
|
|
|
|
|||||||||||
|
Long- and short-term debt:
|
|
|
|
|
|
|
|
|
|
|
|
|
|||||||||||
|
Variable-rate
|
$
|
470
|
|
$
|
583
|
|
$
|
1,362
|
|
$
|
1,027
|
|
$
|
—
|
|
$
|
—
|
|
|||||
|
Average interest rate
|
3.9
|
%
|
3.9
|
%
|
3.9
|
%
|
3.9
|
%
|
—
|
%
|
—
|
%
|
|||||||||||
|
Long-term marketing obligations, including current portion:
|
|
|
|
|
|
|
|
|
|
|
|
|
|||||||||||
|
Fixed-rate
|
$
|
210
|
|
$
|
161
|
|
$
|
142
|
|
$
|
65
|
|
$
|
10
|
|
$
|
—
|
|
|||||
|
Average interest rate
|
8.5
|
%
|
8.8
|
%
|
9.0
|
%
|
9.0
|
%
|
9.0
|
%
|
—
|
%
|
|||||||||||
Of our
$28.3 million
in cash balances at
April 30, 2016
,
$21.0 million
were denominated in U.S. dollars. Cash balances in foreign currencies are operating balances maintained in accounts of our foreign subsidiaries. A portion of the cash held in foreign accounts is used to collateralize outstanding bank guarantees issued by the foreign subsidiaries.
Commodity Risk
We are dependent on basic raw materials, sub-assemblies, components, and other supplies used in our operations. Our financial results could be affected by the availability and changes in prices of these materials. Some of these materials are sourced from a limited number of suppliers or only a single supplier. These materials are also key source materials for our competitors. Therefore, if demand for these materials rises, we may experience increased costs and/or limited or unavailable supplies. As a result, we may not be able to acquire key production materials on a timely basis, which could impact our ability to produce products and satisfy incoming sales orders on a timely basis. In addition, the costs of these materials can rise suddenly and result in significantly higher costs of production. Our sourcing group works to implement strategies to mitigate these risks. Periodically, we enter into pricing agreements or purchasing contracts under which we agree to purchase a minimum amount of product in exchange for guaranteed price terms over the length of the contract, which generally does not exceed one year. We believe that we have adequate sources of supply for many of our key materials.
31
Item 8. FINANCIAL STATEMENTS AND SUPPLEMENTARY DATA
REPORT OF INDEPENDENT REGISTERED PUBLIC ACCOUNTING FIRM
The Board of Directors and Shareholders of Daktronics, Inc.
We have audited the accompanying consolidated balance sheets of Daktronics, Inc. and subsidiaries (the Company) as of
April 30, 2016
and
May 2, 2015
, and the related consolidated statements of operations, comprehensive income, shareholders' equity and cash flows for each of the three years in the period ended
April 30, 2016
. Our audits also included the financial statement schedule listed in the Index at Item 15(a)(2). These financial statements and schedule are the responsibility of the Company's management. Our responsibility is to express an opinion on these financial statements and schedule based on our audits.
We conducted our audits in accordance with the standards of the Public Company Accounting Oversight Board (United States). Those standards require that we plan and perform the audit to obtain reasonable assurance about whether the financial statements are free of material misstatement. An audit includes examining, on a test basis, evidence supporting the amounts and disclosures in the financial statements. An audit also includes assessing the accounting principles used and significant estimates made by management, as well as evaluating the overall financial statement presentation. We believe that our audits provide a reasonable basis for our opinion.
In our opinion, the financial statements referred to above present fairly, in all material respects, the consolidated financial position of Daktronics, Inc. and subsidiaries at
April 30, 2016
and
May 2, 2015
, and the consolidated results of their operations and their cash flows for each of the three years in the period ended
April 30, 2016
, in conformity with U.S. generally accepted accounting principles. Also, in our opinion, the related financial statement schedule, when considered in relation to the basic financial statements taken as a whole, presents fairly in all material respects, the information set forth therein.
We also have audited, in accordance with the standards of the Public Company Accounting Oversight Board (United States), Daktronics, Inc.’s internal control over financial reporting as of
April 30, 2016
, based on criteria established in Internal Control-Integrated Framework issued by the Committee of Sponsoring Organizations of the Treadway Commission (2013 framework) and our report dated
June 21, 2016
, expressed an unqualified opinion thereon.
/s/ Ernst & Young LLP
Minneapolis, Minnesota
June 21, 2016
32
|
DAKTRONICS, INC. AND SUBSIDIARIES
CONSOLIDATED BALANCE SHEETS
(in thousands, except per share data)
|
||||||||
|
April 30,
2016 |
May 2,
2015 |
|||||||
|
ASSETS
|
|
|||||||
|
CURRENT ASSETS:
|
|
|
||||||
|
Cash and cash equivalents
|
$
|
28,328
|
|
$
|
57,284
|
|
||
|
Restricted cash
|
198
|
|
496
|
|
||||
|
Marketable securities
|
24,672
|
|
25,346
|
|
||||
|
Accounts receivable, net
|
77,554
|
|
80,857
|
|
||||
|
Inventories, net
|
69,827
|
|
64,389
|
|
||||
|
Costs and estimated earnings in excess of billings
|
30,200
|
|
35,068
|
|
||||
|
Current maturities of long-term receivables
|
3,172
|
|
3,784
|
|
||||
|
Prepaid expenses and other assets
|
6,468
|
|
6,663
|
|
||||
|
Deferred income taxes
|
—
|
|
10,640
|
|
||||
|
Income tax receivables
|
4,812
|
|
5,543
|
|
||||
|
Total current assets
|
245,231
|
|
290,070
|
|
||||
|
Property and equipment, net
|
73,163
|
|
72,844
|
|
||||
|
Long-term receivables, less current maturities
|
3,866
|
|
6,090
|
|
||||
|
Goodwill
|
8,116
|
|
5,269
|
|
||||
|
Intangibles, net
|
7,721
|
|
1,824
|
|
||||
|
Investment in affiliates and other assets
|
2,414
|
|
2,680
|
|
||||
|
Deferred income taxes
|
9,437
|
|
702
|
|
||||
|
TOTAL ASSETS
|
$
|
349,948
|
|
$
|
379,479
|
|
||
|
LIABILITIES AND SHAREHOLDERS' EQUITY
|
|
|
|
|
||||
|
CURRENT LIABILITIES:
|
|
|
||||||
|
Accounts payable
|
$
|
43,441
|
|
$
|
52,747
|
|
||
|
Accrued expenses
|
23,532
|
|
26,063
|
|
||||
|
Warranty obligations
|
16,564
|
|
11,838
|
|
||||
|
Billings in excess of costs and estimated earnings
|
10,361
|
|
23,797
|
|
||||
|
Customer deposits (billed or collected)
|
16,012
|
|
16,828
|
|
||||
|
Deferred revenue (billed or collected)
|
10,712
|
|
9,524
|
|
||||
|
Current portion of other long-term obligations
|
585
|
|
587
|
|
||||
|
Income taxes payable
|
310
|
|
636
|
|
||||
|
Total current liabilities
|
121,517
|
|
142,020
|
|
||||
|
Long-term warranty obligations
|
13,932
|
|
14,643
|
|
||||
|
Long-term deferred revenue (billed or collected)
|
5,603
|
|
3,914
|
|
||||
|
Other long-term obligations, less current maturities
|
4,059
|
|
3,190
|
|
||||
|
Long-term income tax payable
|
3,016
|
|
2,734
|
|
||||
|
Deferred income taxes
|
754
|
|
939
|
|
||||
|
Total long-term liabilities
|
27,364
|
|
25,420
|
|
||||
|
SHAREHOLDERS' EQUITY:
|
|
|
|
|
||||
|
Common Stock, no par value, authorized 120,000,000 shares; 43,998,635 and 43,643,801 shares issued at April 30, 2016 and May 2, 2015, respectively
|
51,347
|
|
48,960
|
|
||||
|
Additional paid-in capital
|
35,351
|
|
32,693
|
|
||||
|
Retained earnings
|
117,276
|
|
132,771
|
|
||||
|
Treasury Stock, at cost, 19,680 shares
|
(9
|
)
|
(9
|
)
|
||||
|
Accumulated other comprehensive loss
|
(2,898
|
)
|
(2,376
|
)
|
||||
|
TOTAL SHAREHOLDERS' EQUITY
|
201,067
|
|
212,039
|
|
||||
|
TOTAL LIABILITIES AND SHAREHOLDERS' EQUITY
|
$
|
349,948
|
|
$
|
379,479
|
|
||
|
See notes to consolidated financial statements.
|
|
|
|
|
||||
33
|
DAKTRONICS, INC. AND SUBSIDIARIES
CONSOLIDATED STATEMENTS OF OPERATIONS
(in thousands, except per share data)
|
|||||||||||
|
Year Ended
|
|||||||||||
|
April 30,
2016 |
May 2,
2015 |
April 26,
2014 |
|||||||||
|
Net sales
|
$
|
570,168
|
|
$
|
615,942
|
|
$
|
551,970
|
|
||
|
Cost of goods sold
|
449,149
|
|
471,363
|
|
410,260
|
|
|||||
|
Gross profit
|
121,019
|
|
144,579
|
|
141,710
|
|
|||||
|
Operating expenses:
|
|
|
|
|
|
|
|||||
|
Selling expense
|
58,812
|
|
57,963
|
|
53,794
|
|
|||||
|
General and administrative
|
32,801
|
|
30,679
|
|
27,984
|
|
|||||
|
Product design and development
|
26,911
|
|
24,652
|
|
23,375
|
|
|||||
|
|
118,524
|
|
113,294
|
|
105,153
|
|
|||||
|
Operating income
|
2,495
|
|
31,285
|
|
36,557
|
|
|||||
|
Nonoperating income (expense):
|
|
|
|
|
|
|
|||||
|
Interest income
|
987
|
|
1,119
|
|
1,294
|
|
|||||
|
Interest expense
|
(228
|
)
|
(223
|
)
|
(255
|
)
|
|||||
|
Other (expense) income, net
|
(128
|
)
|
(498
|
)
|
(355
|
)
|
|||||
|
Income before income taxes
|
3,126
|
|
31,683
|
|
37,241
|
|
|||||
|
Income tax expense
|
1,065
|
|
10,801
|
|
15,035
|
|
|||||
|
Net income
|
$
|
2,061
|
|
$
|
20,882
|
|
$
|
22,206
|
|
||
|
Weighted average shares outstanding:
|
|
|
|
|
|
|
|||||
|
Basic
|
43,990
|
|
43,514
|
|
42,886
|
|
|||||
|
Diluted
|
44,456
|
|
44,443
|
|
43,762
|
|
|||||
|
Earnings per share:
|
|
|
|
|
|
|
|||||
|
Basic
|
$
|
0.05
|
|
$
|
0.48
|
|
$
|
0.52
|
|
||
|
Diluted
|
$
|
0.05
|
|
$
|
0.47
|
|
$
|
0.51
|
|
||
|
Cash dividends declared per share
|
$
|
0.40
|
|
$
|
0.40
|
|
$
|
0.39
|
|
||
|
See notes to consolidated financial statements.
|
|
|
|
|
|||||||
34
|
DAKTRONICS, INC. AND SUBSIDIARIES
CONSOLIDATED STATEMENTS OF COMPREHENSIVE INCOME
(in thousands)
|
||||||||||||
|
Year Ended
|
||||||||||||
|
April 30,
2016 |
May 2,
2015 |
April 26,
2014 |
||||||||||
|
Net income
|
$
|
2,061
|
|
$
|
20,882
|
|
$
|
22,206
|
|
|||
|
Other comprehensive (loss) income:
|
||||||||||||
|
Cumulative translation adjustments
|
(529
|
)
|
(2,358
|
)
|
147
|
|
||||||
|
Unrealized gain (loss) on available-for-sale securities, net of tax
|
7
|
|
(22
|
)
|
(25
|
)
|
||||||
|
Total other comprehensive (loss) income, net of tax
|
(522
|
)
|
(2,380
|
)
|
122
|
|
||||||
|
Comprehensive income
|
$
|
1,539
|
|
$
|
18,502
|
|
$
|
22,328
|
|
|||
|
See notes to consolidated financial statements.
|
||||||||||||
35
|
DAKTRONICS, INC. AND SUBSIDIARIES
CONSOLIDATED STATEMENTS OF SHAREHOLDERS’ EQUITY
(in thousands)
|
|||||||||||||||||||||||
|
|
Common Stock
|
Additional Paid-In Capital
|
Retained Earnings
|
Treasury Stock
|
Accumulated Other Comprehensive Income (Loss)
|
Total
|
|||||||||||||||||
|
Balance as of April 27, 2013:
|
$
|
37,429
|
|
$
|
27,194
|
|
$
|
123,750
|
|
$
|
(9
|
)
|
$
|
(118
|
)
|
$
|
188,246
|
|
|||||
|
Net income
|
—
|
|
—
|
|
22,206
|
|
—
|
|
—
|
|
22,206
|
|
|||||||||||
|
Cumulative translation adjustments
|
—
|
|
—
|
|
—
|
|
—
|
|
147
|
|
147
|
|
|||||||||||
|
Unrealized gain (loss) on available-for-sale securities, net of tax
|
—
|
|
—
|
|
—
|
|
—
|
|
(25
|
)
|
(25
|
)
|
|||||||||||
|
Net tax benefit related to share-based compensation
|
—
|
|
119
|
|
—
|
|
—
|
|
—
|
|
119
|
|
|||||||||||
|
Share-based compensation
|
—
|
|
2,897
|
|
—
|
|
—
|
|
—
|
|
2,897
|
|
|||||||||||
|
Exercise of stock options
|
4,954
|
|
(287
|
)
|
—
|
|
—
|
|
—
|
|
4,667
|
|
|||||||||||
|
Employee savings plan activity
|
1,552
|
|
—
|
|
—
|
|
—
|
|
—
|
|
1,552
|
|
|||||||||||
|
Dividends paid
|
—
|
|
—
|
|
(16,690
|
)
|
—
|
|
—
|
|
(16,690
|
)
|
|||||||||||
|
Balance as of April 26, 2014:
|
43,935
|
|
29,923
|
|
129,266
|
|
(9
|
)
|
4
|
|
203,119
|
|
|||||||||||
|
Net income
|
—
|
|
—
|
|
20,882
|
|
—
|
|
—
|
|
20,882
|
|
|||||||||||
|
Cumulative translation adjustments
|
—
|
|
—
|
|
—
|
|
—
|
|
(2,358
|
)
|
(2,358
|
)
|
|||||||||||
|
Unrealized gain (loss) on available-for-sale securities, net of tax
|
—
|
|
—
|
|
—
|
|
—
|
|
(22
|
)
|
(22
|
)
|
|||||||||||
|
Net tax benefit related to share-based compensation
|
—
|
|
38
|
|
—
|
|
—
|
|
—
|
|
38
|
|
|||||||||||
|
Share-based compensation
|
—
|
|
3,038
|
|
—
|
|
—
|
|
—
|
|
3,038
|
|
|||||||||||
|
Exercise of stock options
|
2,513
|
|
(306
|
)
|
—
|
|
—
|
|
—
|
|
2,207
|
|
|||||||||||
|
Employee savings plan activity
|
2,512
|
|
—
|
|
—
|
|
—
|
|
—
|
|
2,512
|
|
|||||||||||
|
Dividends paid
|
—
|
|
—
|
|
(17,377
|
)
|
—
|
|
—
|
|
(17,377
|
)
|
|||||||||||
|
Balance as of May 2, 2015:
|
48,960
|
|
32,693
|
|
132,771
|
|
(9
|
)
|
(2,376
|
)
|
212,039
|
|
|||||||||||
|
Net income
|
—
|
|
—
|
|
2,061
|
|
—
|
|
—
|
|
2,061
|
|
|||||||||||
|
Cumulative translation adjustments
|
—
|
|
—
|
|
—
|
|
—
|
|
(529
|
)
|
(529
|
)
|
|||||||||||
|
Unrealized gain (loss) on available-for-sale securities, net of tax
|
—
|
|
—
|
|
—
|
|
—
|
|
7
|
|
7
|
|
|||||||||||
|
Net tax benefit related to share-based compensation
|
—
|
|
3
|
|
—
|
|
—
|
|
—
|
|
3
|
|
|||||||||||
|
Share-based compensation
|
—
|
|
2,958
|
|
—
|
|
—
|
|
—
|
|
2,958
|
|
|||||||||||
|
Exercise of stock options
|
610
|
|
(303
|
)
|
—
|
|
—
|
|
—
|
|
307
|
|
|||||||||||
|
Employee savings plan activity
|
1,777
|
|
—
|
|
—
|
|
—
|
|
—
|
|
1,777
|
|
|||||||||||
|
Dividends paid
|
—
|
|
—
|
|
(17,556
|
)
|
—
|
|
—
|
|
(17,556
|
)
|
|||||||||||
|
Balance as of April 30, 2016:
|
$
|
51,347
|
|
$
|
35,351
|
|
$
|
117,276
|
|
$
|
(9
|
)
|
$
|
(2,898
|
)
|
$
|
201,067
|
|
|||||
|
See notes to consolidated financial statements
|
|
|
|
|
|
|
|
|
|
|
|||||||||||||
36
|
DAKTRONICS, INC. AND SUBSIDIARIES
CONSOLIDATED STATEMENTS OF CASH FLOWS
(in thousands)
|
|||||||||||
|
|
Year Ended
|
||||||||||
|
April 30,
2016 |
May 2,
2015 |
April 26,
2014 |
|||||||||
|
CASH FLOWS FROM OPERATING ACTIVITIES:
|
|
|
|||||||||
|
Net income
|
$
|
2,061
|
|
$
|
20,882
|
|
$
|
22,206
|
|
||
|
Adjustments to reconcile net income to net cash provided by operating activities:
|
|
|
|
|
|||||||
|
Depreciation
|
16,561
|
|
14,764
|
|
14,137
|
|
|||||
|
Amortization
|
295
|
|
204
|
|
364
|
|
|||||
|
Amortization of premium/discount on marketable securities
|
87
|
|
168
|
|
221
|
|
|||||
|
Gain on sale of property and equipment
|
(71
|
)
|
(1,207
|
)
|
(72
|
)
|
|||||
|
Share-based compensation
|
2,958
|
|
3,038
|
|
2,897
|
|
|||||
|
Excess tax benefits from share-based compensation
|
(3
|
)
|
(38
|
)
|
(119
|
)
|
|||||
|
Gain on sale of equity investee
|
(119
|
)
|
—
|
|
—
|
|
|||||
|
Provision for doubtful accounts
|
481
|
|
(222
|
)
|
(190
|
)
|
|||||
|
Deferred income taxes, net
|
911
|
|
2,146
|
|
1,543
|
|
|||||
|
Change in operating assets and liabilities
|
(9,886
|
)
|
13,433
|
|
(4,788
|
)
|
|||||
|
Net cash provided by operating activities
|
13,275
|
|
53,168
|
|
36,199
|
|
|||||
|
CASH FLOWS FROM INVESTING ACTIVITIES:
|
|
|
|
|
|||||||
|
Purchases of property and equipment
|
(17,056
|
)
|
(21,837
|
)
|
(13,519
|
)
|
|||||
|
Proceeds from sales of property, equipment and other assets
|
152
|
|
4,037
|
|
238
|
|
|||||
|
Purchases of marketable securities
|
(21,286
|
)
|
(15,653
|
)
|
(15,550
|
)
|
|||||
|
Proceeds from sales or maturities of marketable securities
|
21,862
|
|
15,532
|
|
13,953
|
|
|||||
|
Proceeds from sale of equity method investment
|
377
|
|
—
|
|
—
|
|
|||||
|
Acquisitions, net of cash acquired
|
(7,867
|
)
|
(6,306
|
)
|
(1,480
|
)
|
|||||
|
Net cash used in investing activities
|
(23,818
|
)
|
(24,227
|
)
|
(16,358
|
)
|
|||||
|
CASH FLOWS FROM FINANCING ACTIVITIES:
|
|
|
|
|
|||||||
|
Payments on notes payable
|
(38
|
)
|
(81
|
)
|
—
|
|
|||||
|
Proceeds from exercise of stock options
|
610
|
|
2,513
|
|
4,954
|
|
|||||
|
Excess tax benefits from share-based compensation
|
3
|
|
38
|
|
119
|
|
|||||
|
Principal payments on long-term obligations
|
(467
|
)
|
(1,163
|
)
|
(3,704
|
)
|
|||||
|
Dividends paid
|
(17,556
|
)
|
(17,377
|
)
|
(16,690
|
)
|
|||||
|
Net cash used in financing activities
|
(17,448
|
)
|
(16,070
|
)
|
(15,321
|
)
|
|||||
|
EFFECT OF EXCHANGE RATE CHANGES ON CASH
|
(965
|
)
|
(641
|
)
|
(94
|
)
|
|||||
|
NET (DECREASE) INCREASE IN CASH AND CASH EQUIVALENTS
|
(28,956
|
)
|
12,230
|
|
4,426
|
|
|||||
|
CASH AND CASH EQUIVALENTS:
|
|
|
|
|
|||||||
|
Beginning of period
|
57,284
|
|
45,054
|
|
40,628
|
|
|||||
|
End of period
|
$
|
28,328
|
|
$
|
57,284
|
|
$
|
45,054
|
|
||
|
See notes to consolidated financial statements.
|
|
|
|
|
|||||||
37
NOTES TO THE CONSOLIDATED FINANCIAL STATEMENTS
(in thousands, except per share data)
Note 1. Nature of Business and Summary of Critical Accounting Policies
Nature of business
: Daktronics, Inc. and its subsidiaries are engaged principally in the design, manufacture and sale of a wide range of electronic display systems and related products which are sold in a variety of markets throughout the world and the rendering of related maintenance and professional services. Our products are designed primarily to inform and entertain people through the communication of content.
Fiscal year
: We operate on a 52 or 53 week fiscal year, with our fiscal year ending on the Saturday closest to April 30 of each year. When April 30 falls on a Wednesday, the fiscal year ends on the preceding Saturday. Within each fiscal year, each quarter is comprised of 13 week periods following the beginning of each fiscal year. In each 53 week year, an additional week is added to the first quarter and each of the last three quarters is comprised of a 13 week period. The years ended
April 30, 2016
,
May 2, 2015
, and
April 26, 2014
contained operating results for
52
,
53
, and
52
weeks, respectively.
A reclassification to correct the immaterial presentation of long term prepaid expenses in the Consolidated Balance Sheets' categories of prepaid expenses and other assets and investment in affiliates and other assets have been made to conform fiscal 2015 to the fiscal 2016 classifications for comparative purposes.
Principles of consolidation
: The consolidated financial statements include Daktronics, Inc. and its subsidiaries. All significant intercompany accounts and transactions are eliminated in consolidation.
Investments in affiliates over which we do not have the ability to exert significant influence over the investee's operating and financing activities are accounted for under the cost method of accounting. We have evaluated our relationships with affiliates and have determined that these entities are not variable interest entities. Our proportional share of the respective affiliate’s earnings or losses is included in other (expense) income in our consolidated statements of operations.
The aggregate amount of investments accounted for under the cost method was $
1,211
and $
1,071
at
April 30, 2016
and
May 2, 2015
, respectively. There have not been any identified events or changes in circumstances that may have a significant adverse effect on their fair value and it is not practical to estimate their fair value.
Use of estimates
: The preparation of financial statements in conformity with accounting principles generally accepted in the United States requires us to make estimates and assumptions that affect the reported amounts of assets and liabilities and the disclosure of contingent assets and liabilities at the date of the financial statements and the reported amounts of revenues and expenses during the reporting period. Actual results could differ significantly from those estimates. Material estimates that are particularly susceptible to significant change in the near-term relate to the determination of the estimated total costs on long-term construction-type contracts, estimated costs to be incurred for product warranties and extended maintenance contracts, excess and obsolete inventory, the allowance for doubtful accounts, share-based compensation, goodwill impairment and income taxes. Changes in estimates are reflected in the periods in which they become known.
Cash and cash equivalents
: All highly liquid investments with maturities of three months or less at the date of purchase are considered to be cash equivalents and consist primarily of government repurchase agreements, savings accounts and money market accounts that are carried at cost, which approximates fair value. We maintain our cash in bank deposit accounts, the balances of which at times may exceed federally insured limits. We have not experienced any losses in such accounts.
Restricted cash
: Restricted cash consists of cash and cash equivalents held in bank deposit accounts to secure issuances of foreign bank guarantees.
Inventories:
Inventories are stated at the lower of cost (first-in, first-out method) or market. Market is determined on the basis of estimated net realizable values.
Revenue recognition
: Net sales are reported net of estimated sales returns and exclude sales taxes. We estimate our sales returns reserve based on historical return rates and analysis of specific accounts. Our sales returns reserve was
$93
and
$15
at
April 30, 2016
and
May 2, 2015
, respectively.
Long-term construction-type contracts:
Earnings on construction-type contracts are recognized on the percentage-of-completion method, measured by the percentage of costs incurred to date to estimated total costs for each contract. Contract costs include all direct material and labor costs and those indirect costs related to contract performance. Indirect costs include charges for such items as labor overhead, equipment, facilities, engineering, and project management. Provisions for estimated losses on uncompleted contracts are made in the
38
period in which such losses are probable and capable of being estimated. We combine contracts for accounting purposes when they are negotiated as a package with an overall profit margin objective, essentially represent an agreement to do a single project for a customer, involve interrelated construction activities, and are performed concurrently or sequentially. When a group of contracts is combined, revenue and profit are recognized uniformly over the performance of the combined projects. We segment revenues in accordance with contract segmenting criteria in Accounting Standards Codification (“ASC”) 650-35,
Construction-Type and Production-Type Contracts.
Equipment other than construction-type contracts:
We recognize revenue on equipment sales, other than construction-type contracts, when title passes, which is usually upon shipment and then only if the terms of the arrangement are fixed and determinable and collectability is reasonably assured. We record estimated sales returns and discounts as a reduction of net sales in the same period revenue is recognized.
Product maintenance:
In connection with the sale of our products, we also occasionally sell separately priced extended warranties and product maintenance contracts. The revenue related to such contracts is deferred and recognized ratably as net sales over the terms of the contracts, which vary up to
10
years. We record unrealized revenue in deferred revenue (billed or collected) in the liability section of the balance sheet.
Services:
Revenues generated by us for services, such as event support, control room design, on-site training, equipment service and technical support of our equipment, are recognized as net sales when the services are performed. Net sales from services and product maintenance approximated
9.7 percent
,
8.2 percent
and
8.4 percent
of net sales for the fiscal years ended
April 30, 2016
,
May 2, 2015
and
April 26, 2014
, respectively.
Software:
We follow ASC 985-605,
Software-Revenue Recognition
. Revenues from software license fees on sales, other than construction-type contracts, are recognized when persuasive evidence of an arrangement exists, delivery of the product has occurred, the fee is fixed or determinable, and collectability is probable. Subscription-based licenses include the right for a customer to use our licenses and receive related support for a specified term and revenue is recognized ratably over the term of the arrangement.
Multiple-element arrangements:
We generate revenue from the sale of equipment and related services, including customization, installation and maintenance services. In these limited cases, we provide some or all of such equipment and services to our customers under the terms of a single multiple-element sales arrangement. These arrangements typically involve the sale of equipment bundled with some or all of these services, but they may also involve instances in which we have contracted to deliver multiple pieces of equipment over time rather than at a single point in time.
When a sales arrangement involves multiple elements, the items included in the arrangement (deliverables) are evaluated pursuant to ASC 605-25,
Revenue Arrangements with Multiple Deliverables,
and ASC 605-35
,
Accounting for Performance of Construction-Type and Certain Production-Type Contracts,
to determine whether they represent separate units of accounting. We perform this evaluation at the inception of an arrangement and as we deliver each item in the arrangement. We first consider the separation criteria of ASC 605-35. Deliverables not within the scope of ASC 605-35 are evaluated for separation under ASC 605-25. For those elements falling under the guidance of ASC 605-25, we generally account for a deliverable (or a group of deliverables) separately if the delivered item(s) has standalone value to the customer and if we have given the customer a general right of return relative to the delivered item(s) and delivery or performance of the undelivered item(s) or service(s) is probable and substantially in our control.
When items included in a multiple-element arrangement represent separate units of accounting, we allocate the arrangement consideration to the individual items based on their relative fair values. The amount of arrangement consideration allocated to the delivered item(s) is limited to the amount not contingent on us delivering additional products or services. Once we have determined the amount, if any, of arrangement consideration allocable to the delivered item(s), we apply the applicable revenue recognition policy to determine when and by which method such amount may be recognized as revenue.
We generally determine if objective and reliable evidence of fair value for the items included in a multiple-element arrangement exists based on whether we have vendor-specific objective evidence ("VSOE") of the price for which we sell an item on a standalone basis. If we do not have VSOE for the item, we will use the price charged by a competitor selling a comparable product or service on a standalone basis to similarly situated customers, if available. If neither VSOE nor third party evidence is available, we use our best estimate of the selling price for that deliverable.
Long-term receivables and advertising rights:
We occasionally sell and install our products at facilities in exchange for the rights to sell or to retain future advertising revenues. For these transactions, we recognize revenue for the amount of the present value of the future advertising payments if enough advertising is sold to obtain normal margins on the contract and we record the related receivable in long-term receivables. We recognize imputed interest as earned.
Property and equipment
: Property and equipment is stated at cost and depreciated principally on the straight-line method over the following estimated useful lives:
39
|
|
Years
|
|
Buildings
|
7 - 40
|
|
Machinery and equipment
|
5 - 7
|
|
Office furniture and equipment
|
3 - 5
|
|
Computer software and hardware
|
3 - 5
|
|
Equipment held for rental
|
2 - 7
|
|
Demonstration equipment
|
3 - 5
|
|
Transportation equipment
|
5 - 7
|
Leasehold improvements are depreciated over the lesser of the useful life of the asset or the term of the lease. Our depreciation expense was
$16,561
,
$14,764
and
$14,137
for the fiscal years ended
April 30, 2016
,
May 2, 2015
and
April 26, 2014
, respectively.
Long-Lived Assets
: Long-lived assets other than goodwill and indefinite-lived intangible assets, described in "
Note 6. Long-Lived Assets
" which are separately tested for impairment, are evaluated for impairment whenever events or changes in circumstances indicate the carrying value may not be recoverable.
When evaluating long-lived assets for potential impairment, we first compare the carrying value of the asset to the asset's estimated future cash flows (undiscounted and without interest charges). If the estimated future cash flows are less than the carrying value of the asset, we calculate an impairment loss. The impairment loss calculation compares the carrying value of the asset to the asset's estimated fair value. We recognize an impairment loss if the amount of the asset's carrying value exceeds the asset's estimated fair value. If we recognize an impairment loss, the adjusted carrying amount of the asset becomes its new cost basis. For a depreciable long-lived asset, the new cost basis will be depreciated (amortized) over the remaining useful life of that asset.
Our impairment loss calculations contain uncertainties because they require management to make assumptions and to apply judgment to estimate future cash flows and asset fair values, including forecasting useful lives of the assets and selecting the discount rate that reflects the risk inherent in future cash flows.
Software costs for internal use
: We capitalize certain costs incurred in connection with developing or obtaining internal-use software. Capitalized software costs are included in property and equipment on our consolidated balance sheets. Software costs that do not meet capitalization criteria are expensed when incurred.
Software costs to be sold, leased, or marketed:
We follow the provisions of ASC 985,
Software
, which states software development costs are expensed as incurred until technological feasibility has been established. At such time, such costs are capitalized until the product is made available for release to customers. Additionally, costs incurred after release to customers are expensed as research and development. We had
$3,000
of capitalized software to be sold, leased, or otherwise marketed, which was valued in connection with the acquisition of ADFLOW Networks, Inc. as of April 30, 2016 and is included in intangible assets in our consolidated balance sheet.
Insurance
: We are self-insured for certain losses related to health and liability claims and workers’ compensation. We obtain third-party insurance to limit our exposure to these claims. We estimate our self-insured liabilities using a number of factors, including historical claims experience. Our self-insurance liability was
$2,314
and
$1,783
at
April 30, 2016
and
May 2, 2015
, respectively, and is included in accrued expenses in our consolidated balance sheets.
Foreign currency translation
: Our foreign subsidiaries use the local currency of their respective countries as their functional currency. The assets and liabilities of foreign operations are generally translated at the exchange rates in effect at the balance sheet date. The operating results of foreign operations are translated at weighted average exchange rates. The related translation gains or losses are reported as a separate component of shareholders’ equity in
accumulated other comprehensive loss
.
Income taxes
: We operate in multiple income tax jurisdictions both within the United States and internationally. Our annual tax rate is determined based on our income, statutory tax rates and the tax impacts of items treated differently for tax purposes than for financial reporting purposes in each tax jurisdiction. Tax laws require certain items be included in the tax return at different times than are reflected in the financial statements. Some of these differences are permanent, such as expenses that are not deductible in our tax return, and some differences are temporary and reverse over time, such as depreciation expense. These temporary differences create deferred tax assets and liabilities and reflect the enacted income tax rates in effect for the years in which the differences are expected to reverse. We consider a valuation allowance for deferred tax assets if it is "more likely than not" some or all of the benefits will not be realized.
40
Because we operate in multiple income tax jurisdictions both within the United States and internationally, management must determine the appropriate allocation of income and expenses to each of these jurisdictions based on current interpretations of complex income tax regulations.
Income tax authorities in these jurisdictions regularly perform audits of our income tax filings. Income tax audits associated with the allocation of income, expenses and other complex issues, including transfer pricing methodologies, may require an extended period of time to resolve and may result in significant income tax adjustments if changes to the income allocation are required between jurisdictions with different income tax rates.
Comprehensive income
: We follow the provisions of ASC 220,
Reporting Comprehensive Income
, which establishes standards for reporting and displaying comprehensive income and its components.
Comprehensive income
reflects the change in equity of a business enterprise during a period from transactions and other events and circumstances from non-owner sources. For us,
comprehensive loss
represents net income adjusted for foreign currency translation adjustments and unrealized gains and losses on available-for-sale securities. The foreign currency translation adjustment included in
comprehensive loss
has not been tax affected, as the investments in foreign affiliates are deemed to be permanent. In accordance with ASC 220 and Accounting Standards Update ("ASU") 2011-05, we disclose
comprehensive loss
on a separate consolidated statement of comprehensive income.
Product design and development
: All expenses related to product design and development are charged to operations as incurred. Our product development activities include the enhancement of existing products and the development of new products.
Advertising costs
: We expense advertising costs as incurred. Advertising expenses were
$2,209
,
$2,318
and
$1,694
for fiscal years
2016
,
2015
and
2014
, respectively.
Shipping and handling costs
: Shipping and handling costs collected from our customers in connection with our sales are recorded as revenue. We record shipping and handling costs as a component of cost of sales at the time the product is shipped.
Earnings per share (“EPS”)
: Basic EPS is computed by dividing income attributable to common shareholders by the weighted average number of common shares outstanding for the period. Diluted EPS reflects the potential dilution which may occur if securities or other obligations to issue common stock were exercised or converted into common stock or resulted in the issuance of common stock which share in our earnings.
The following is a reconciliation of the income and common stock share amounts used in the calculation of basic and diluted EPS for the fiscal years ended
April 30, 2016
,
May 2, 2015
and
April 26, 2014
:
|
|
Net income
|
Shares
|
Per share income (loss)
|
|||||||
|
For the year ended April 30, 2016:
|
|
|
|
|||||||
|
Basic earnings per share
|
$
|
2,061
|
|
43,990
|
|
$
|
0.05
|
|
||
|
Dilution associated with stock compensation plans
|
—
|
|
466
|
|
—
|
|
||||
|
Diluted earnings per share
|
$
|
2,061
|
|
44,456
|
|
$
|
0.05
|
|
||
|
For the year ended May 2, 2015:
|
|
|
|
|
|
|||||
|
Basic earnings per share
|
$
|
20,882
|
|
43,514
|
|
$
|
0.48
|
|
||
|
Dilution associated with stock compensation plans
|
—
|
|
929
|
|
(0.01
|
)
|
||||
|
Diluted earnings per share
|
$
|
20,882
|
|
44,443
|
|
$
|
0.47
|
|
||
|
For the year ended April 26, 2014:
|
|
|
|
|
|
|||||
|
Basic earnings per share
|
$
|
22,206
|
|
42,886
|
|
$
|
0.52
|
|
||
|
Dilution associated with stock compensation plans
|
—
|
|
876
|
|
(0.01
|
)
|
||||
|
Diluted earnings per share
|
$
|
22,206
|
|
43,762
|
|
$
|
0.51
|
|
||
Options outstanding to purchase
2,122
,
1,462
and
1,564
shares of common stock with a weighted average exercise price of
$15.04
,
$18.42
and
$18.64
per share during the fiscal years ended
April 30, 2016
,
May 2, 2015
and
April 26, 2014
, respectively, were not included in the computation of diluted earnings per share because the weighted average exercise price of those instruments exceeded the average market price of the common shares during the year.
Share-based compensation
: We account for share-based compensation in accordance with ASC 718,
Compensation-Stock Compensation.
Under the fair value recognition provisions of ASC 718, we measure share-based compensation cost at the grant date based on the fair value of the award and recognize the compensation expense over the requisite service period, which is the vesting period. See "
Note 11. Shareholders’ Equity and Share-Based Compensation
" for additional information and the assumptions we use to calculate the fair value of share-based employee compensation.
41
Recent Accounting Pronouncements
In March 2016, the Financial Accounting Standards Board ("FASB") issued ASU 2016-09,
Compensation-Stock Compensation (Topic 718), Improvements to Employee Share-Based Payment Accounting,
which is intended to simplify certain aspects of the accounting for share-based payment award transactions, including income tax effects when awards vest or settle, repurchase of employees’ shares to satisfy statutory tax withholding obligations, an option to account for forfeitures as they occur, and classification of certain amounts on the statement of cash flows. This standard is effective for us in the first quarter of fiscal 2018, with early adoption permitted. We are currently evaluating the effect that adopting this new accounting guidance will have on our consolidated results of operations, cash flows, and financial position.
In February 2016, the FASB issued ASU 2016-02,
Leases (Topic 842)
, which sets out the principles for the recognition, measurement, presentation and disclosure of leases for both parties to a contract (that is, lessees and lessors). This update requires lessees to apply a dual approach, classifying leases as either finance or operating leases based on the principle of whether or not the lease is effectively a financed purchase of the leased asset by the lessee. This classification will determine whether the lease expense is recognized based on an effective interest method or on a straight-line basis over the term of the lease. A lessee is also required to record a right-of-use asset and a lease liability for all leases with a term of greater than 12 months regardless of their classification. The new standard requires lessors to account for leases using an approach that is substantially equivalent to existing guidance for sales-type leases, direct financing leases and operating leases. The new guidance is effective for interim and annual periods beginning after December 15, 2018, with early adoption permitted. We are currently evaluating the effect that adopting this new accounting guidance will have on our consolidated results of operations, cash flows, and financial position.
In January 2016, the FASB issued ASU 2016-01,
Financial Instruments - Overall: Recognition and Measurement of Financial Assets and Financial Liabilities
, which affects accounting for equity investments and financial liabilities where the fair value option has been elected. The new guidance is effective for interim and annual periods beginning after December 15, 2017, with early adoption permitted. We are currently evaluating the effect that adopting this new accounting guidance will have on our consolidated results of operations, cash flows, and financial position.
In November 2015, the FASB issued ASU 2015-17,
Income Taxes (Topic 740) Balance Sheet Classification of Deferred Taxes
, which simplifies the presentation of deferred income taxes. Under the new accounting standard, deferred tax assets and liabilities are required to be classified as noncurrent, eliminating the prior requirement to separate deferred tax assets and liabilities into current and noncurrent. The new guidance is effective for interim and annual periods beginning after December 15, 2016, with early adoption permitted. We adopted the ASU prospectively and have presented both deferred tax assets and deferred tax liabilities as noncurrent in our Consolidated Balance Sheet as of April 30, 2016. Prior balance sheets have not been retrospectively adjusted. For significant components of our deferred tax accounts, see "Note 13. Income Taxes."
In July 2015, the FASB issued ASU 2015-11,
Simplifying the Measurement of Inventory
, which changes the measurement principle of inventory from the lower of cost or market to the lower of cost and net realizable value. The guidance will require prospective application at the beginning of our first quarter of fiscal 2018, but it permits adoption in an earlier period. We have evaluated the effect of adopting ASU 2015-11 and will adopt the standard at the beginning of fiscal 2017. We do not expect this adoption will have a material impact on our consolidated results of operations, cash flows, and financial position.
In May 2014, the FASB issued ASU 2014-09,
Revenue from Contracts with Customers.
This ASU is a comprehensive revenue recognition model that requires a company to recognize revenue from the transfer of goods or services to customers in an amount that reflects the consideration that the entity expects to receive in exchange for those goods or services. The FASB has also issued ASUs 2016-08, 2016-10, and 2016-12 to clarify guidance with respect to principal versus agent considerations, the identification of performance obligations and licensing, and guidance on certain narrow areas and adds practical expedients. ASU 2014-09 is effective for fiscal years and interim periods beginning after December 15, 2017 (as stated in ASU 2015-14, which was issued in August 2015 and defers the effective date) and is now effective for the Company's fiscal 2019. We are evaluating the effect that adopting this new accounting guidance will have on our consolidated results of operations, cash flows, financial position, and related disclosures.
Note 2. Segment Reporting
We have organized our business into
five
segments which meet the definition of reportable segments under ASC 280-10,
Segment Reporting
: Commercial, Live Events, High School Park and Recreation, Transportation, and International. These segments are based on the type of customer or geography and are the same as our business units.
Our Commercial business unit primarily consists of sales of our video display systems, digital billboards, Galaxy
®
and Fuelight
™
product lines to resellers (primarily sign companies), Out-of-Home ("OOH") companies, national retailers, quick-serve restaurants, casinos and petroleum retailers. Our Live Events business unit primarily consists of sales of integrated scoring and video display systems to college
42
and professional sports facilities and convention centers and sales of our mobile display technology to video rental organizations and other live events type venues. Our High School Park and Recreation business unit primarily consists of sales of scoring systems, Galaxy
®
displays and video display systems to primary and secondary education facilities. Our Transportation business unit primarily consists of sales of our Vanguard
®
and Galaxy
®
product lines to governmental transportation departments, airlines and other transportation related customers. Our International business unit consists of sales of all product lines outside the United States and Canada. We focus on product lines related to integrated scoring and video display systems for sports and commercial applications, OOH advertising products, and European transportation related products.
Segment reports present results through contribution margin, which is comprised of gross profit less selling costs. Segment profit excludes general and administration expense, product development expense, interest income and expense, non-operating income and income tax expense. Assets are not allocated to the segments. Depreciation and amortization are allocated to each segment based on various financial measures; however, some depreciation and amortization are corporate in nature and remain unallocated. In general, our segments follow the same accounting policies as those described in "
Note 1. Nature of Business and Summary of Critical Accounting Policies
". Unabsorbed costs of domestic field sales and services infrastructure, including most field administrative staff, are allocated to the Commercial, Live Events, High School Park and Recreation, and Transportation business units based on cost of sales. Shared manufacturing, buildings and utilities, and procurement costs are allocated based on payroll dollars, square footage and various other financial measures.
We do not maintain information on sales by products; therefore, disclosure of such information is not practical.
43
The following table sets forth certain financial information for each of our five operating segments for the periods indicated:
|
|
Year Ended
|
||||||||||
|
April 30,
2016 |
May 2,
2015 |
April 26,
2014 |
|||||||||
|
Net sales:
|
|
|
|
||||||||
|
Commercial
|
$
|
148,261
|
|
$
|
165,793
|
|
$
|
154,754
|
|
||
|
Live Events
|
205,151
|
|
231,877
|
|
197,246
|
|
|||||
|
High School Park and Recreation
|
70,035
|
|
67,657
|
|
59,531
|
|
|||||
|
Transportation
|
52,249
|
|
48,333
|
|
54,861
|
|
|||||
|
International
|
94,472
|
|
102,282
|
|
85,578
|
|
|||||
|
|
570,168
|
|
615,942
|
|
551,970
|
|
|||||
|
Contribution margin:
|
|||||||||||
|
Commercial
|
13,210
|
|
28,541
|
|
30,313
|
|
|||||
|
Live Events
|
23,178
|
|
27,334
|
|
30,503
|
|
|||||
|
High School Park and Recreation
|
10,314
|
|
11,125
|
|
5,474
|
|
|||||
|
Transportation
|
12,466
|
|
10,404
|
|
12,810
|
|
|||||
|
International
|
3,039
|
|
9,212
|
|
8,816
|
|
|||||
|
|
62,207
|
|
86,616
|
|
87,916
|
|
|||||
|
Non-allocated operating expenses:
|
|||||||||||
|
General and administrative
|
32,801
|
|
30,679
|
|
27,984
|
|
|||||
|
Product design and development
|
26,911
|
|
24,652
|
|
23,375
|
|
|||||
|
Operating income
|
2,495
|
|
31,285
|
|
36,557
|
|
|||||
|
Nonoperating income (expense):
|
|||||||||||
|
Interest income
|
987
|
|
1,119
|
|
1,294
|
|
|||||
|
Interest expense
|
(228
|
)
|
(223
|
)
|
(255
|
)
|
|||||
|
Other (expense) income, net
|
(128
|
)
|
(498
|
)
|
(355
|
)
|
|||||
|
Income before income taxes
|
3,126
|
|
31,683
|
|
37,241
|
|
|||||
|
Income tax expense
|
1,065
|
|
10,801
|
|
15,035
|
|
|||||
|
Net income
|
$
|
2,061
|
|
$
|
20,882
|
|
$
|
22,206
|
|
||
|
Depreciation and amortization:
|
|||||||||||
|
Commercial
|
$
|
4,925
|
|
$
|
4,846
|
|
$
|
4,243
|
|
||
|
Live Events
|
4,970
|
|
4,610
|
|
4,461
|
|
|||||
|
High School Park and Recreation
|
1,722
|
|
1,836
|
|
2,053
|
|
|||||
|
Transportation
|
1,364
|
|
1,148
|
|
1,132
|
|
|||||
|
International
|
1,227
|
|
1,053
|
|
873
|
|
|||||
|
Unallocated corporate depreciation
|
2,648
|
|
1,475
|
|
1,739
|
|
|||||
|
|
$
|
16,856
|
|
$
|
14,968
|
|
$
|
14,501
|
|
||
No single geographic area comprises a material amount of net sales or property and equipment, net of accumulated depreciation, other than the United States. The following table presents information about net sales and property and equipment, net of accumulated depreciation, in the United States and elsewhere:
|
Year Ended
|
|||||||||||
|
April 30,
2016 |
May 2,
2015 |
April 26,
2014 |
|||||||||
|
Net sales:
|
|||||||||||
|
United States
|
$
|
465,598
|
|
$
|
494,860
|
|
$
|
453,468
|
|
||
|
Outside U.S.
|
104,570
|
|
121,082
|
|
98,502
|
|
|||||
|
$
|
570,168
|
|
$
|
615,942
|
|
$
|
551,970
|
|
|||
|
Property and equipment, net of accumulated depreciation:
|
|||||||||||
|
United States
|
$
|
68,233
|
|
$
|
67,882
|
|
$
|
60,846
|
|
||
|
Outside U.S.
|
4,930
|
|
4,962
|
|
4,424
|
|
|||||
|
$
|
73,163
|
|
$
|
72,844
|
|
$
|
65,270
|
|
|||
44
We have numerous customers worldwide for sales of our products and services; therefore, we are not economically dependent on a limited number of customers for the sale of our products and services except with respect to our dependence on two major digital billboard customers in our Commercial business unit.
Note 3. Marketable Securities
We have a cash management program which provides for the investment of cash balances not used in current operations. We classify our investments in marketable securities as available-for-sale in accordance with the provisions of ASC 320,
Investments – Debt and Equity Securities.
Marketable securities classified as available-for-sale are reported at fair value with unrealized gains or losses, net of tax, reported in
accumulated other comprehensive loss
. As it relates to fixed income marketable securities, it is not likely we will be required to sell any of these investments before recovery of the entire amortized cost basis. In addition, as of
April 30, 2016
, we anticipate we will recover the entire amortized cost basis of such fixed income securities, and we have determined no other-than-temporary impairments associated with credit losses were required to be recognized. The cost of securities sold is based on the specific identification method. Where quoted market prices are not available, we use the market price of similar types of securities traded in the market to estimate fair value.
As of
April 30, 2016
and
May 2, 2015
, our available-for-sale securities consisted of the following:
|
|
Amortized Cost
|
Unrealized Gains
|
Unrealized Losses
|
Fair Value
|
|||||||||||
|
Balance as of April 30, 2016:
|
|
|
|
|
|||||||||||
|
Certificates of deposit
|
$
|
14,927
|
|
$
|
—
|
|
$
|
—
|
|
$
|
14,927
|
|
|||
|
U.S. Government sponsored entities
|
8,523
|
|
—
|
|
(1
|
)
|
8,522
|
|
|||||||
|
Municipal bonds
|
1,221
|
|
2
|
|
—
|
|
1,223
|
|
|||||||
|
$
|
24,671
|
|
$
|
2
|
|
$
|
(1
|
)
|
$
|
24,672
|
|
||||
|
Balance as of May 2, 2015:
|
|
|
|
|
|
|
|
|
|||||||
|
Certificates of deposit
|
$
|
11,409
|
|
$
|
—
|
|
$
|
—
|
|
$
|
11,409
|
|
|||
|
U.S. Government securities
|
1,000
|
|
1
|
|
—
|
|
1,001
|
|
|||||||
|
U.S. Government sponsored entities
|
7,951
|
|
—
|
|
(9
|
)
|
7,942
|
|
|||||||
|
Municipal bonds
|
4,989
|
|
5
|
|
—
|
|
4,994
|
|
|||||||
|
$
|
25,349
|
|
$
|
6
|
|
$
|
(9
|
)
|
$
|
25,346
|
|
||||
Realized gains or losses on investments are recorded in our consolidated statements of operations as other (expense) income, net. Upon the sale of a security classified as available-for-sale, the security’s specific unrealized gain (loss) is reclassified out of
accumulated other comprehensive loss
into earnings based on the specific identification method. In the fiscal years ended
April 30, 2016
and
May 2, 2015
, the reclassifications from
accumulated other comprehensive loss
to net assets were immaterial.
All available-for-sale securities are classified as current assets, as they are readily available to support our current operating needs. The contractual maturities of available-for-sale debt securities as of
April 30, 2016
were as follows:
|
|
Less than 12 months
|
1-5 Years
|
Total
|
||||||||
|
Certificates of deposit
|
$
|
7,650
|
|
$
|
7,277
|
|
$
|
14,927
|
|
||
|
U.S. Government sponsored entities
|
—
|
|
8,522
|
|
8,522
|
|
|||||
|
Municipal obligations
|
—
|
|
1,223
|
|
1,223
|
|
|||||
|
$
|
7,650
|
|
$
|
17,022
|
|
$
|
24,672
|
|
|||
Note 4. Business Combinations
OPEN Acquisition
We acquired
100
percent ownership in OPEN Out-of-Home Solutions ("OPEN"), a Belgian company, on May 8, 2013 for an undisclosed amount. The results of its operations have been included in our consolidated financial statements since the date of acquisition.
OPEN is a European manufacturer of cabinets and street furniture for the third-party advertising market. This acquisition expanded our product offerings to third-party advertisers as they increasingly adopt digital technology and included a manufacturing plant in Belgium to manufacture digital advertising displays. This acquisition was funded with cash on hand and a five-year promissory note that matures in May 2018.
45
During the third quarter of fiscal 2014, the purchase price allocation for the OPEN acquisition was completed. The excess of the purchase price over the net tangible and intangible assets was recorded as goodwill of
$1,249
which primarily related to the value of an assembled workforce and is not deductible for tax purposes. Included in the purchase price allocation were acquired identifiable intangibles valued at
$1,160
representing trade names with a useful life of
20
years and a customer list valued at
$582
with a useful life of
nine
years. Also included in the purchase was
$2,658
of property and equipment,
$2,038
of inventory,
$833
of other current assets offset by current operating liabilities of
$1,230
and long and short term debt of
$4,155
. There have been no material adjustments to the original purchase price allocation.
The purchase price includes deferred payments of
$2,375
to be made over
five
years unless certain conditions in the business are not met. We have included the payment obligation in other long-term obligations in our consolidated balance sheet.
OPEN's sales were included in the International business unit results and contributed
$4,218
of net sales during fiscal 2014. General and administrative expenses included
$44
for the year ended April 26, 2014 for professional fees relating to the acquisition.
Data Display Acquisition
We acquired
100
percent ownership in Data Display, a European transportation display company, on August 11, 2014 for an undisclosed amount. The results of its operations have been included in our consolidated financial statements since the date of acquisition. We have not made pro forma disclosures because the results of its operations are not material to our consolidated financial statements.
Data Display is a European based company focused on the design and manufacture of transportation displays. This acquisition allows our organization to better service transportation customers world-wide and broadens our leadership position on a global scale. This acquisition included a manufacturing plant in Ireland to manufacture transportation displays. This acquisition was funded with cash on hand.
During the second quarter of fiscal 2015, we prepared the preliminary fair value measurements of assets acquired and liabilities assumed as of the acquisition date using independent appraisals and other analysis. A final measurement was completed during the first quarter of fiscal 2016, and the fair values of the consideration paid and contingent consideration were finalized.
The following table summarizes the adjustments that were made to the original purchase price allocation:
|
Purchase price allocation as originally reported
|
Adjustments
|
Reconciliation of assets and liabilities transferred
|
|||||||
|
Goodwill
|
$
|
1,099
|
|
$
|
364
|
|
$
|
1,463
|
|
|
Trademarks and technology
|
480
|
|
—
|
|
480
|
|
|||
|
Customer relationships
|
84
|
|
—
|
|
84
|
|
|||
|
Property and equipment
|
1,433
|
|
—
|
|
1,433
|
|
|||
|
Investment for affiliates
|
437
|
|
—
|
|
437
|
|
|||
|
Inventory
|
2,773
|
|
(149
|
)
|
2,624
|
|
|||
|
Accounts receivable
|
3,380
|
|
(317
|
)
|
3,063
|
|
|||
|
Other current assets
|
1,869
|
|
23
|
|
1,892
|
|
|||
|
Current liabilities
|
3,616
|
|
79
|
|
3,695
|
|
|||
|
Long-term obligations
|
950
|
|
—
|
|
950
|
|
|||
ADFLOW Acquisition
We acquired
100 percent
ownership in ADFLOW Networks, Inc. ("ADFLOW"), a Canadian company, on March 15, 2016 for an undisclosed amount. The results of its operations have been included in our consolidated financial statements since the date of acquisition. We have not made pro forma disclosures because the results of its operations are not material to our consolidated financial statements.
ADFLOW is a Canadian based company focused on digital media solutions. This acquisition will allow our organization to grow and strengthen our solution offering in Digital Media Networks (DMN). We believe this will broaden our value proposition for our customers and deliver new offerings to the market. This acquisition was funded with cash on hand.
46
During the fourth quarter of fiscal 2016, we prepared the preliminary fair value measurements of assets acquired and liabilities assumed as of the acquisition date using independent appraisals and other analysis. We are in the process of determining final working capital adjustments. The excess of purchase price over the estimated net tangible and intangible assets was recorded as goodwill of
$2,502
which primarily related to the value of an assembled workforce and is not deductible for tax purposes. Included in the preliminary purchase price allocation were acquired identifiable intangibles valued at
$3,176
representing software and trademarks and customer relationships valued at
$2,692
. Based on the preliminary fair value measurements, also included in the purchase price was
$58
of property and equipment,
$230
of inventory,
$1,283
of accounts receivable, and
$513
of other current assets, which was offset by current operating liabilities of
$935
and long term obligations of
$1,545
. The purchase price allocation is expected to be completed in the first quarter of fiscal 2017.
The purchase price includes deferred payments of
$1,833
to be made over
three
years unless certain conditions in the business are not met. We have included the payment obligation in other long-term obligations in our consolidated balance sheet.
ADFLOW contributed net sales of
$542
during fiscal 2016. General and administrative expenses included
$295
during fiscal 2016 for professional fees relating to the acquisition.
Note 5. Sale of Theatre Rigging Division
In July 2014, we sold our automated rigging systems business for theatre applications. Related to the sale, we recorded a
$1,261
gain, which is included in cost of goods sold in the High School Park and Recreation business unit.
As part of the transaction, we sold assets of
$2,817
that primarily consisted of accounts receivable, patents, inventory, and manufacturing equipment, net of
$355
of accounts payable.
Note 6. Long-Lived Assets
Goodwill and other intangible assets
: We account for goodwill and intangible assets in accordance with ASC 350,
Goodwill and Other Intangible Assets.
Under these provisions, goodwill is not amortized but is tested for impairment on at least an annual basis. Impairment testing is required more often than annually if an event or circumstance indicates an impairment or a decline in value may have occurred. Such circumstances could include, but are not limited to, a worsening trend of orders and sales without a corresponding way to preserve future cash flows or a significant decline in our stock price. In conducting our impairment testing, we compare the fair value of each of our business units (reporting unit) to the related carrying value. If the fair value of a reporting unit exceeds its carrying value, goodwill is not impaired. If the carrying value of a reporting unit exceeds its fair value, an impairment loss is measured and recognized.
We utilize an income approach to estimate the fair value of each reporting unit. We selected this method because we believe it most appropriately measures our income producing assets. We considered using the market approach and cost approach, but concluded they were not appropriate in valuing our reporting units given the lack of relevant and available market comparisons. The income approach is based on the projected cash flows, which are discounted to their present value using discount rates which consider the timing and risk of the forecasted cash flows. We believe that this approach is appropriate because it provides a fair value estimate based upon the reporting units’ expected long-term operating cash performance. This approach also mitigates the impact of the cyclical trends occurring in the industry. Fair value is estimated using internally-developed forecasts and assumptions. The discount rate used is the average estimated value of a market participant’s cost of capital and debt, derived using customary market metrics. Other significant assumptions include terminal value margin rates, future capital expenditures, and changes in future working capital requirements. We also compare and reconcile our overall fair value to our market capitalization. Although there are inherent uncertainties related to the assumptions used and to our application of these assumptions to this analysis, we believe the income approach provides a reasonable estimate of the fair value of our reporting units. The foregoing assumptions to a large degree were consistent with our long-term performance, with limited exceptions. We believe our future investments for capital expenditures as a percent of revenue will remain similar to the historical rates as a percentage of sales in future years. Our investments are expected to relate to equipment replacements and new product line manufacturing equipment needs, and to keep our information technology infrastructure robust. These assumptions could deviate materially from actual results.
We perform an analysis of goodwill on an annual basis, and is tested for impairment more frequently if events or changes in circumstances indicate that an asset might be impaired. We complete this annual analysis during our third quarter of each fiscal year, based on the goodwill amount as of the first business day of our third quarter in fiscal
2016
,
2015
, and
2014
. The result of our analysis indicated no goodwill impairment existed for fiscal years
2016
,
2015
, and
2014
.
During the fourth quarter of fiscal 2016, we performed an interim goodwill impairment analysis due to economic conditions causing slowing orders. The results of our analysis indicated no goodwill impairment was necessary.
47
The changes in the carrying amount of goodwill related to each reportable segment for the fiscal year ended
April 30, 2016
were as follows:
|
|
Live Events
|
Commercial
|
Transportation
|
International
|
Total
|
||||||||||||||
|
Balance as of May 2, 2015:
|
$
|
2,321
|
|
$
|
721
|
|
$
|
91
|
|
$
|
2,136
|
|
$
|
5,269
|
|
||||
|
Acquisition, net of cash acquired
|
—
|
|
2,502
|
|
—
|
|
213
|
|
2,715
|
|
|||||||||
|
Foreign currency translation
|
(17
|
)
|
127
|
|
(16
|
)
|
38
|
|
132
|
|
|||||||||
|
Balance as of April 30, 2016:
|
$
|
2,304
|
|
$
|
3,350
|
|
$
|
75
|
|
$
|
2,387
|
|
$
|
8,116
|
|
||||
As required by ASC 350, intangibles with finite lives are amortized. We evaluate indefinite lived assets for impairment annually and whenever events or changes in circumstances indicate their carrying value may not be recoverable. The net value of intangible assets is shown on our consolidated balance sheets. Estimated amortization expense based on intangibles as of
April 30, 2016
is
$1,591
for fiscal
2017
,
$1,492
for fiscal
2018
,
$1,393
for fiscal
2019
,
$473
for fiscal
2020
,
$440
for fiscal
2021
, and
$2,332
thereafter.
The following table sets forth the gross carrying amount and accumulated amortization of intangible assets by major intangible class as of
April 30, 2016
and
May 2, 2015
:
|
|
April 30, 2016
|
May 2, 2015
|
|||||||||||||||||||||||
|
|
Weighted Average Life (in years)
|
Gross Carrying Amount
|
Accumulated Amortization
|
Net Value
|
Gross Carrying Amount
|
Accumulated Amortization
|
Net Value
|
||||||||||||||||||
|
Definite-lived:
|
|||||||||||||||||||||||||
|
Registered trademarks
|
18.3
|
$
|
1,676
|
|
$
|
194
|
|
$
|
1,482
|
|
$
|
1,461
|
|
$
|
116
|
|
$
|
1,345
|
|
||||||
|
Software
|
3.0
|
3,046
|
|
46
|
|
3,000
|
|
—
|
|
—
|
|
—
|
|
||||||||||||
|
Customer relationships
|
9.7
|
3,449
|
|
300
|
|
3,149
|
|
—
|
|
—
|
|
—
|
|
||||||||||||
|
Other
|
1.0
|
103
|
|
13
|
|
90
|
|
608
|
|
129
|
|
479
|
|
||||||||||||
|
Total
|
8.8
|
$
|
8,274
|
|
$
|
553
|
|
$
|
7,721
|
|
$
|
2,069
|
|
$
|
245
|
|
$
|
1,824
|
|
||||||
Impairment of long-lived assets
: In the fiscal years ended
April 30, 2016
,
May 2, 2015
, and
April 26, 2014
, the pretax impairment charges for other long-lived assets, including property and equipment, were immaterial. The impairment charges related to technology or equipment obsoleted due to technology improvements or to custom demo equipment with no resale value. Impairment charges during fiscal
2016
,
2015
, and
2014
were included primarily in product development and selling expense.
Note 7. Selected Financial Statement Data
Inventories consisted of the following:
|
April 30,
2016 |
May 2,
2015 |
||||||
|
Raw materials
|
$
|
28,184
|
|
$
|
28,325
|
|
|
|
Work-in-process
|
6,158
|
|
7,512
|
|
|||
|
Finished goods
|
35,485
|
|
28,552
|
|
|||
|
|
$
|
69,827
|
|
$
|
64,389
|
|
|
Inventories are reported net of the allowance for excess and obsolete inventory of
$4,975
and
$3,998
as of
April 30, 2016
and
May 2, 2015
, respectively.
Property and equipment consisted of the following:
48
|
April 30,
2016 |
May 2,
2015 |
||||||
|
Land
|
$
|
2,155
|
|
$
|
2,147
|
|
|
|
Buildings
|
65,247
|
|
64,186
|
|
|||
|
Machinery and equipment
|
82,973
|
|
80,664
|
|
|||
|
Office furniture and equipment
|
14,746
|
|
15,823
|
|
|||
|
Computer software and hardware
|
48,917
|
|
51,083
|
|
|||
|
Equipment held for rental
|
374
|
|
803
|
|
|||
|
Demonstration equipment
|
8,026
|
|
7,299
|
|
|||
|
Transportation equipment
|
6,596
|
|
6,012
|
|
|||
|
|
229,034
|
|
228,017
|
|
|||
|
Less accumulated depreciation
|
155,871
|
|
155,173
|
|
|||
|
|
$
|
73,163
|
|
$
|
72,844
|
|
|
Accrued expenses consisted of the following:
|
April 30,
2016 |
May 2,
2015 |
||||||
|
Compensation
|
$
|
12,065
|
|
$
|
12,137
|
|
|
|
Taxes, other than income taxes
|
3,969
|
|
4,223
|
|
|||
|
Other
|
7,498
|
|
9,703
|
|
|||
|
|
$
|
23,532
|
|
$
|
26,063
|
|
|
Other (expense) income, net
consisted of the following:
|
Year Ended
|
|||||||||||
|
April 30,
2016 |
May 2,
2015 |
April 26,
2014 |
|||||||||
|
Foreign currency transaction losses
|
$
|
(326
|
)
|
$
|
(514
|
)
|
$
|
(292
|
)
|
||
|
Other
|
198
|
|
16
|
|
(63
|
)
|
|||||
|
|
$
|
(128
|
)
|
$
|
(498
|
)
|
$
|
(355
|
)
|
||
Note 8. Uncompleted Contracts
Uncompleted contracts consisted of the following:
|
April 30,
2016 |
May 2,
2015 |
||||||
|
Costs incurred
|
$
|
530,594
|
|
$
|
708,029
|
|
|
|
Estimated earnings
|
173,356
|
|
237,239
|
|
|||
|
|
703,950
|
|
945,268
|
|
|||
|
Less billings to date
|
684,111
|
|
933,997
|
|
|||
|
|
$
|
19,839
|
|
$
|
11,271
|
|
|
Uncompleted contracts are included in the accompanying consolidated balance sheets as follows:
|
April 30,
2016 |
May 2,
2015 |
||||||
|
Costs and estimated earnings in excess of billings
|
$
|
30,200
|
|
$
|
35,068
|
|
|
|
Billings in excess of costs and estimated earnings
|
(10,361
|
)
|
(23,797
|
)
|
|||
|
|
$
|
19,839
|
|
$
|
11,271
|
|
|
Note 9. Receivables
We sell our products throughout the United States and in certain foreign countries on credit terms we establish for each customer. On the sale of certain products, we have the ability to file a contractor’s lien against the product installed as collateral and to file claims against surety bonds to protect our interest in receivables. Foreign sales are at times secured by irrevocable letters of credit or bank guarantees.
49
Accounts receivable are reported net of an allowance for doubtful accounts of
$2,797
and
$2,316
at
April 30, 2016
and
May 2, 2015
, respectively. Included in accounts receivable as of
April 30, 2016
and
May 2, 2015
was
$437
and
$385
, respectively, of retainage on construction-type contracts, all of which are expected to be collected within one year.
We make estimates regarding the collectability of our accounts receivable, long-term receivables, costs and estimated earnings in excess of billings and other receivables. In evaluating the adequacy of our allowance for doubtful accounts, we analyze specific balances, customer creditworthiness, changes in customer payment cycles, and current economic trends. If the financial condition of any customer were to deteriorate, resulting in an impairment of its ability to make payments, additional allowances may be required. We charge off receivables at such time as it is determined collection will not occur. Charge-offs of receivables and our allowance for doubtful accounts related to financing receivables are not material to our financial results.
In connection with certain sales transactions, we have entered into sales contracts with installment payments exceeding six months and sales-type leases. The present value of these contracts and leases is recorded as a receivable as the revenue is recognized in accordance with U.S. GAAP, and profit is recognized to the extent the present value is in excess of cost. We generally retain a security interest in the equipment or in the cash flow generated by the equipment until the contract is paid. The present value of long-term contracts and lease receivables, including accrued interest and current maturities, was
$7,038
and
$9,874
as of
April 30, 2016
and
May 2, 2015
, respectively. Contract and lease receivables bearing annual interest rates of
4.8
to
10.0
percent are due in varying annual installments through
August 2024
. The face amount of long-term receivables was
$7,236
as of
April 30, 2016
and
$10,976
as of
May 2, 2015
.
Note 10. Financing Agreements
We have a credit agreement with a U.S. bank for a
$35,000
line of credit, which includes up to
$15,000
for standby letters of credit. The line of credit, which was amended on November 15, 2013, is due on November 15, 2016. The interest rate ranges from LIBOR plus
145
basis points to LIBOR plus
195
basis points depending on the ratio of our interest-bearing debt to EBITDA. EBITDA is defined as net income before deductions for income taxes, interest expense, depreciation and amortization, all as determined in accordance with U.S. GAAP. The effective interest rate was
2.4 percent
at
April 30, 2016
. We are assessed a loan fee equal to
0.125
percent per annum of any unused portion of the loan. As of
April 30, 2016
, there were no advances to us under the loan portion of the line of credit, and the balance of letters of credit outstanding was approximately
$3,872
.
The credit agreement is unsecured and requires us to be in compliance with the following financial ratios:
|
•
|
A minimum fixed charge coverage ratio of at least 2 to 1 at the end of any fiscal year. The ratio is equal to (a) EBITDA less dividends or other distributions, a capital expenditure reserve of
$6,000
, and income tax expenses, over (b) all principal and interest payments with respect to debt, excluding principal payments on the line of credit; and
|
|
•
|
A ratio of interest-bearing debt, excluding any marketing obligations, to EBITDA of less than 1 to 1 at the end of any fiscal quarter.
|
We have an additional credit agreement with another U.S. bank which supports our credit needs outside of the United States. It was also amended on November 15, 2013 and becomes due on November 15, 2016. The facility provides for a
$40,000
line of credit and includes facilities for letters of credit and bank guarantees and to secure foreign loans for our international subsidiaries. This credit agreement is unsecured. It contains the same covenants as the credit agreement noted above and contains an inter creditor agreement whereby the debt has a cross default provision with the primary credit agreement. Total credit allowed between the two credit agreements is limited to
$40,000
. The interest rate is equal to LIBOR plus
1.5 percent
. We are assessed a loan fee equal to
0.15
percent per annum of any unused portion of the loan. As of
April 30, 2016
, there were no advances outstanding and approximately
$3,482
in bank guarantees under this line of credit.
During the fourth quarter of fiscal 2016, we violated one of our bank covenants, but received a waiver from our banking institutions for the year ended April 30, 2016. While we are not using our credit line, other than letters of credit, any future covenant violations could impact our ability to obtain financing. We were in compliance with all applicable covenants as of
May 2, 2015
. The minimum fixed charge coverage ratio as of
April 30, 2016
was
(15)
-to-1, and the ratio of interest-bearing debt to EBITDA as of
April 30, 2016
was
0.07
-to-1.
Note 11. Shareholders’ Equity and Share-Based Compensation
Common stock
: Our authorized shares of
120,000,000
consist of
115,000,000
shares of common stock and
5,000,000
shares of “undesignated stock.” Our Board of Directors has the power to issue any or all of the shares of undesignated stock without shareholder approval, including the authority to establish the rights and preferences of the undesignated stock.
50
Each outstanding share of our common stock includes
one
common share purchase right. Each right entitles the registered holder to purchase from us one-tenth of one share of common stock at a price of
$100
per common share, subject to adjustment and the terms of the shareholder rights agreement under which the dividend was declared and paid. The rights become exercisable immediately after the earlier of (i)
10
business days following a public announcement that a person or group has acquired beneficial ownership of
15
percent or more of our outstanding common shares (subject to certain exclusions) or (ii)
10
business days following the commencement or announcement of an intention to make a tender offer or exchange offer for our common shares, the consummation of which would result in the beneficial ownership by a person or group of
15
percent or more of our outstanding common shares. The rights expire on November 19, 2018, which date may be extended by our Board subject to certain additional conditions.
Stock incentive plans
: During fiscal 2016, we established the 2015 Stock Incentive Plan (“2015 Plan”) and ceased granting options under the 2007 Stock Incentive Plan ("2007 Plan") and the 2001 Incentive Stock Option Plan and the 2001 Outside Directors Option Plan (“2001 Plans”). The 2015 Plan provides for the issuance of stock-based awards, including stock options, restricted stock, restricted stock units and deferred stock, to employees, directors and consultants. Stock options issued to employees under the plans generally have a
10
-year life, an exercise price equal to the fair market value on the grant date and a
five
-year annual vesting period. Stock options granted to independent directors under these plans have a
seven
-year life and an exercise price equal to the fair market value on the date of grant. Stock options granted to independent directors prior to fiscal 2010 vested annually over
three
years, and options granted in or after fiscal 2010 vest in
one
year. The restricted stock granted to independent directors vests in
one
year, provided that they remain on the Board. Restricted stock units are granted to employees and have a
five
-year annual vesting period. As with stock options, restricted stock and restricted stock unit ownership cannot be transferred during the vesting period.
At
April 30, 2016
, the aggregate number of shares available for future grant under the 2015 Plan for stock options and restricted stock awards was
2,602 shares
. Shares of common stock subject to all stock awards granted under the 2015 Plan are counted as one share of stock for each share of stock subject to the award. Although the 2001 Plans and 2007 Plan remain in effect for options outstanding, no new options can be granted under these plans.
Restricted stock and restricted stock units
: We issue restricted stock to our non-employee directors and restricted stock units to employees. The fair value of restricted stock and our restricted stock unit awards are measured on the grant date based on the market value of our common stock. The related compensation expense as calculated under ASC 718, net of estimated forfeitures, is recognized over the applicable vesting period. Unrecognized compensation expense related to the restricted stock and restricted stock unit awards was approximately
$2,555
at
April 30, 2016
, which is expected to be recognized over a weighted-average period of
3.0
years. The total fair value of restricted stock vested was
$1,191
,
$1,089
, and
$804
for fiscal years
2016
,
2015
, and
2014
, respectively.
A summary of nonvested restricted stock and restricted stock units for the years ended
April 30, 2016
,
May 2, 2015
and
April 26, 2014
is as follows:
|
|
Year Ended
|
|||||||||||||||||||
|
|
April 30, 2016
|
May 2, 2015
|
April 26, 2014
|
|||||||||||||||||
|
Number of
Nonvested
Shares
|
Weighted Average Grant Date Fair Value Per Share
|
Number of
Nonvested
Shares
|
Weighted Average Grant Date Fair Value Per Share
|
Number of
Nonvested
Shares
|
Weighted Average Grant Date Fair Value Per Share
|
|||||||||||||||
|
Outstanding at beginning of year
|
344
|
|
$
|
10.63
|
|
318
|
|
$
|
9.59
|
|
279
|
|
$
|
9.74
|
|
|||||
|
Granted
|
159
|
|
7.04
|
|
150
|
|
12.25
|
|
147
|
|
10.03
|
|
||||||||
|
Vested
|
(110
|
)
|
10.76
|
|
(111
|
)
|
9.83
|
|
(85
|
)
|
9.47
|
|
||||||||
|
Forfeited
|
(9
|
)
|
10.69
|
|
(13
|
)
|
10.70
|
|
(23
|
)
|
9.37
|
|
||||||||
|
Outstanding at end of year
|
384
|
|
9.10
|
|
344
|
|
10.63
|
|
318
|
|
9.59
|
|
||||||||
Stock Options
: We issue incentive stock options to our employees and non-qualified stock options to our independent directors. A summary of stock option activity under all stock option plans during the fiscal year ended
April 30, 2016
is as follows:
51
|
Stock Options
|
Weighted Average Exercise Price Per Share
|
Weighted Average Remaining Contractual Life (Years)
|
Aggregate Intrinsic Value
|
||||||||||
|
Outstanding at May 2, 2015
|
2,741
|
|
$
|
13.94
|
|
4.63
|
|
$
|
2,258
|
|
|||
|
Granted
|
240
|
|
8.51
|
|
—
|
|
—
|
|
|||||
|
Canceled or forfeited
|
(309
|
)
|
14.42
|
|
—
|
|
—
|
|
|||||
|
Exercised
|
(66
|
)
|
9.26
|
|
—
|
|
132
|
|
|||||
|
Outstanding at April 30, 2016
|
2,606
|
|
$
|
13.50
|
|
4.57
|
|
$
|
158
|
|
|||
|
Shares vested and expected to vest
|
2,581
|
|
$
|
13.53
|
|
4.54
|
|
$
|
156
|
|
|||
|
Exercisable at April 30, 2016
|
1,920
|
|
$
|
14.70
|
|
3.50
|
|
$
|
113
|
|
|||
The aggregate intrinsic value of stock options represents the difference between the exercise price of stock options and the fair market value of the underlying common stock for all in-the-money options. We define in-the-money options at
April 30, 2016
as options having exercise prices lower than the
$8.70
per share market price of our common stock on that date. There were in-the-money options to purchase
0
shares exercisable at
April 30, 2016
. The total intrinsic value of options exercised during fiscal years
2016
,
2015
, and
2014
was
$132
,
$533
, and
$1,534
, respectively. The total fair value of stock options vested was
$1,190
,
$1,294
, and
$1,541
for fiscal years
2016
,
2015
, and
2014
, respectively.
We estimate the fair value of stock options granted using the Black-Scholes option valuation model. We recognize the fair value of the stock options on a straight-line basis as compensation expense. All options are recognized over the requisite service periods of the awards, which are generally the vesting periods.
The Black-Scholes option-pricing model was developed for use in estimating the fair value of traded options which have no vesting restrictions and are fully transferable. In addition, option valuation models require the input of highly subjective assumptions, including the expected stock price volatility. ASC 718 requires us to estimate forfeitures at the time of grant and revise those estimates in subsequent periods if actual forfeitures differ from those estimates. We use historical data to estimate pre-vesting option forfeitures and record share-based compensation expense only for those awards expected to vest. The following factors are the significant assumptions used in the computation of the fair value of options:
Expected life
. The expected life of options granted represents the period of time they are expected to be outstanding. We estimate the expected life of options granted based on historical exercise patterns, which we believe are representative of future behavior. We have examined our historical pattern of option exercises in an effort to determine if there were any discernible patterns of activity based on certain demographic characteristics. Demographic characteristics tested included age, salary level, job level and geographic location. We have determined there were no meaningful differences in option exercise activity based on the demographic characteristics tested.
Expected volatility
. We estimate the volatility of our common stock at the date of grant based on historical volatility consistent with ASC 718 and SEC Staff Accounting Bulletin No. 107,
Share Based Payments
.
Risk-free interest rate.
The rate is based on the U.S. Treasury zero-coupon yield curve on the grant date for a term similar to the expected life of the options.
Dividend yield.
We use an expected dividend yield consistent with our dividend yield over the period of time we have paid dividends.
The following table provides the weighted-average fair value of options granted and the related assumptions used in the Black-Scholes model:
|
Year Ended
|
|||||||||||
|
April 30,
2016 |
May 2,
2015 |
April 26,
2014 |
|||||||||
|
Fair value of options granted
|
$
|
2.92
|
|
$
|
5.44
|
|
$
|
4.91
|
|
||
|
Risk-free interest rate
|
1.70 - 1.90%
|
|
1.93 - 2.14%
|
|
2.03 - 2.34%
|
|
|||||
|
Expected dividend rate
|
2.78
|
%
|
2.60%
|
|
2.32%
|
|
|||||
|
Expected volatility
|
42.71 - 48.32%
|
|
48.01 - 51.89%
|
|
54.09 - 54.37%
|
|
|||||
|
Expected life of option
|
5.78 - 6.98 years
|
|
5.84 - 6.95 years
|
|
5.9 - 6.9 years
|
|
|||||
52
Employee stock purchase plan
: We have an employee stock purchase plan (“ESPP”), which enables employees after
six
months of continuous employment to elect, in advance and semi-annually, to contribute up to
15
percent of their compensation, subject to certain limitations, toward the purchase of our common stock at a purchase price equal to
85
percent of the lower of the fair market value of the common stock on the first or last day of the participation period. The ESPP requires participants to hold any shares purchased under the ESPP for a minimum period of
one
year after the date of purchase. Compensation expense recognized on shares issued under our ESPP is based on the value of a traded option to purchase shares of our stock at a
15
percent discount to the stock price. The total number of shares reserved under the ESPP is
2,500
. The number of shares of common stock issued under the ESPP totaled
227
,
248
, and
195
shares in fiscal
2016
,
2015
, and
2014
, respectively. The number of shares of common stock reserved for future employee purchases under the ESPP totaled
514
shares at
April 30, 2016
. The ESPP is intended to qualify under Section 423 of the Internal Revenue Code of 1986 (the "Code").
Total share-based compensation expense
: As of
April 30, 2016
, there was
$4,450
of total unrecognized compensation cost related to nonvested share-based compensation arrangements granted under all equity compensation plans. Total unrecognized compensation cost will be adjusted for future changes in estimated forfeitures. We expect to recognize the cost over a weighted-average period of
2.7
years.
The following table presents a summary of the share-based compensation expense by equity type as follows:
|
|
Year Ended
|
||||||||||
|
April 30,
2016 |
May 2,
2015 |
April 26,
2014 |
|||||||||
|
Stock options
|
$
|
1,179
|
|
$
|
1,311
|
|
$
|
1,451
|
|
||
|
Restricted stock and stock units
|
1,237
|
|
1,234
|
|
1,000
|
|
|||||
|
Employee stock purchase plans
|
542
|
|
493
|
|
446
|
|
|||||
|
|
$
|
2,958
|
|
$
|
3,038
|
|
$
|
2,897
|
|
||
A summary of the share-based compensation expenses for stock options, restricted stock, restricted stock units and shares issued under the ESPP for the fiscal years ended
April 30, 2016
,
May 2, 2015
and
April 26, 2014
is as follows:
|
|
Year Ended
|
||||||||||
|
April 30,
2016 |
May 2,
2015 |
April 26,
2014 |
|||||||||
|
Cost of goods sold
|
$
|
751
|
|
$
|
737
|
|
$
|
657
|
|
||
|
Selling
|
780
|
|
825
|
|
810
|
|
|||||
|
General and administrative
|
839
|
|
908
|
|
859
|
|
|||||
|
Product design and development
|
588
|
|
568
|
|
571
|
|
|||||
|
|
$
|
2,958
|
|
$
|
3,038
|
|
$
|
2,897
|
|
||
We received
$610
in cash from option exercises under all share-based payment arrangements for the fiscal year ended
April 30, 2016
. The tax (expense) benefit related to non-qualified options and restricted stock units under all share-based payment arrangements totaled
$(69)
,
$3
, and
$(126)
for fiscal years
2016
,
2015
, and
2014
, respectively.
Note 12. Employee Benefit Plans
We sponsor a 401(k) savings plan under which eligible U.S. employees may choose to make voluntary contributions of such employees' compensation on a pretax basis, subject to certain Internal Revenue Service ("IRS") limits. We make matching contributions equal to
50
percent of the employee's qualifying contribution up to
six
percent of such employee's compensation plus other discretionary contributions as authorized by our Board of Directors. Employees are eligible to participate upon completion of
one
year of service if they have attained the age of
21
and have worked more than
1000
hours during such plan year. We contributed
$2,323
,
$2,115
and
$1,859
to the plan for fiscal years
2016
,
2015
, and
2014
, respectively.
Note 13. Income Taxes
53
The pretax income attributable to domestic and foreign operations was as follows:
|
Year Ended
|
|||||||||||
|
April 30,
2016 |
May 2,
2015 |
April 26,
2014 |
|||||||||
|
Domestic
|
$
|
3,264
|
|
$
|
29,194
|
|
$
|
35,699
|
|
||
|
Foreign
|
(138
|
)
|
2,489
|
|
1,542
|
|
|||||
|
Income before income taxes
|
$
|
3,126
|
|
$
|
31,683
|
|
$
|
37,241
|
|
||
Income tax expense consisted of the following:
|
Year Ended
|
|||||||||||
|
April 30,
2016 |
May 2,
2015 |
April 26,
2014 |
|||||||||
|
Current:
|
|
|
|
||||||||
|
Federal
|
$
|
(467
|
)
|
$
|
6,657
|
|
$
|
11,342
|
|
||
|
State
|
123
|
|
1,150
|
|
1,454
|
|
|||||
|
Foreign
|
557
|
|
848
|
|
696
|
|
|||||
|
Deferred:
|
|||||||||||
|
Federal
|
463
|
|
1,906
|
|
1,241
|
|
|||||
|
State
|
(89
|
)
|
307
|
|
667
|
|
|||||
|
Foreign
|
478
|
|
(67
|
)
|
(365
|
)
|
|||||
|
|
$
|
1,065
|
|
$
|
10,801
|
|
$
|
15,035
|
|
||
A reconciliation of the provision for income taxes and the amount computed by applying the federal statutory rate to income before income taxes is as follows:
|
Year Ended
|
||||||||||||
|
April 30,
2016 |
May 2,
2015 |
April 26,
2014 |
||||||||||
|
Computed income tax expense at federal, state and local jurisdiction statutory rates
|
$
|
1,063
|
|
$
|
11,089
|
|
$
|
13,035
|
|
|||
|
State taxes, net of federal benefit
|
40
|
|
1,016
|
|
1,433
|
|
||||||
|
Research and development tax credit
|
(2,015
|
)
|
(1,292
|
)
|
(750
|
)
|
||||||
|
Meals and entertainment
|
334
|
|
369
|
|
344
|
|
||||||
|
Stock compensation
|
525
|
|
566
|
|
586
|
|
||||||
|
Dividends paid to retirement plan
|
(323
|
)
|
(352
|
)
|
(328
|
)
|
||||||
|
Domestic production activities deduction
|
(91
|
)
|
(529
|
)
|
(1,012
|
)
|
||||||
|
Change in valuation allowances
|
1,265
|
|
(2,295
|
)
|
2,301
|
|
||||||
|
Change in uncertain tax positions
|
125
|
|
2,357
|
|
111
|
|
||||||
|
Other, net
|
142
|
|
(128
|
)
|
(685
|
)
|
||||||
|
|
$
|
1,065
|
|
$
|
10,801
|
|
$
|
15,035
|
|
|||
54
The components of the net deferred tax asset were as follows:
|
April 30,
2016 |
May 2,
2015 |
||||||
|
Deferred tax assets:
|
|
|
|||||
|
Accrued warranty obligations
|
$
|
11,407
|
|
$
|
10,038
|
|
|
|
Vacation accrual
|
1,963
|
|
1,808
|
|
|||
|
Net losses on investments
|
336
|
|
—
|
|
|||
|
Deferred maintenance revenue
|
341
|
|
745
|
|
|||
|
Allowance for excess and obsolete inventory
|
1,314
|
|
939
|
|
|||
|
Equity compensation
|
745
|
|
828
|
|
|||
|
Allowance for doubtful accounts
|
703
|
|
613
|
|
|||
|
Inventory capitalization
|
595
|
|
531
|
|
|||
|
Accrued compensation and benefits
|
1,015
|
|
1,124
|
|
|||
|
Unrealized loss on foreign currency exchange
|
—
|
|
554
|
|
|||
|
Net operating loss carry forwards
|
1,404
|
|
791
|
|
|||
|
Research and development tax credit carry forwards
|
1,005
|
|
—
|
|
|||
|
Other
|
617
|
|
344
|
|
|||
|
|
21,445
|
|
18,315
|
|
|||
|
Valuation allowance
|
(1,673
|
)
|
(52
|
)
|
|||
|
19,772
|
|
18,263
|
|
||||
|
Deferred tax liabilities:
|
|
|
|
|
|||
|
Property and equipment
|
(7,988
|
)
|
(7,249
|
)
|
|||
|
Prepaid expenses
|
(631
|
)
|
(577
|
)
|
|||
|
Intangible assets
|
(1,479
|
)
|
—
|
|
|||
|
Unrealized gain on foreign currency exchange
|
(931
|
)
|
—
|
|
|||
|
Other
|
(60
|
)
|
(34
|
)
|
|||
|
|
(11,089
|
)
|
(7,860
|
)
|
|||
|
|
$
|
8,683
|
|
$
|
10,403
|
|
|
The classification of net deferred tax assets in the accompanying consolidated balance sheets is:
|
April 30,
2016 |
May 2,
2015 |
||||||
|
Current assets
|
$
|
—
|
|
$
|
10,640
|
|
|
|
Current liabilities
|
—
|
|
—
|
|
|||
|
Non-current assets
|
9,437
|
|
702
|
|
|||
|
Non-current liabilities
|
(754
|
)
|
(939
|
)
|
|||
|
|
$
|
8,683
|
|
$
|
10,403
|
|
|
The changes in the amounts recorded for uncertain tax positions are:
|
|
April 30, 2016
|
May 2, 2015
|
April 26, 2014
|
||||||
|
Balance at beginning of year
|
$
|
2,891
|
|
$
|
494
|
|
$
|
379
|
|
|
Gross increases related to prior period tax positions
|
137
|
|
6
|
|
16
|
|
|||
|
Gross decreases related to prior period tax positions
|
—
|
|
—
|
|
—
|
|
|||
|
Gross increases related to current period tax positions
|
8
|
|
2,496
|
|
99
|
|
|||
|
Lapse of statute of limitations
|
(20
|
)
|
(105
|
)
|
—
|
|
|||
|
Balance at end of year
|
$
|
3,016
|
|
$
|
2,891
|
|
$
|
494
|
|
All of our unrecognized tax benefits would have an impact on the effective tax rate if recognized. It is reasonably possible that the amount of unrecognized tax benefits could change due to one or more of the following events in the next 12 months: expiring statutes, audit activity, tax payments, or competent authority proceedings. We are not able to reasonably estimate the amount or the future periods in which changes in unrecognized tax benefits may be resolved; however, we do not anticipate any significant changes within the next 12 months. Interest and penalties incurred associated with uncertain tax positions are included in income tax expense.
55
Our fiscal 2014 financial results included a deferred asset tax valuation allowance of
$2,297
. The corresponding deferred tax asset was related to potential capital losses from an investment in an affiliate ("affiliate") that is a United States entity. During the fourth quarter of fiscal 2014, we were notified that the affiliate had sold off a significant portion of its operations for a substantial loss. This loss puts us in doubt of any financial recovery of our investment in affiliate. Although the full capital loss of the affiliate has not yet been triggered under the Code, we have concluded that it would be more likely than not a capital loss if the affiliate goes out of business or we abandon the partnership. A tax court case solidified capital loss treatment versus ordinary gain treatment in abandonments. The Tax Court's decision in
Pilgrim's Pride Corporation v. Commissioner
and Code Sections 165 and 1234A state that loss deductions related to worthless security abandonments would be treated as a capital loss versus an ordinary loss.
In fiscal 2015, the Tax Court's decision in
Pilgrim's Pride Corporation v. Commissioner
was overturned by the federal Fifth Circuit Court of Appeals. Hence, we abandoned our partnership interest and recorded an ordinary loss on our 2015 federal tax return, thereby moving the asset and valuation allowance into our current tax provision and recording a current deduction. Because our position has a chance of being disallowed, we believe we cannot reach the more-likely-than not conclusion that this ordinary loss will be realized. Therefore, we have maintained an uncertain tax accrual. We will continue to evaluate the facts and circumstances of this case and adjust our accrual accordingly.
As of
April 30, 2016
, we have foreign net operating loss (“NOL”) carryforwards of approximately
$6,428
primarily related to our operations in Belgium and Ireland which have indefinite lives. A portion of the total NOL amounting to
$219
is related to operations in Canada and expires in 2036. A deferred tax asset has been recorded for all NOL carryforwards totaling approximately
$1,404
. However, due to uncertainty in future taxable income in Ireland and Belgium, a full valuation allowance totaling approximately
$1,337
has been recorded. If sufficient evidence of our ability to generate future taxable income in the jurisdictions in which we currently maintain a valuation allowance causes us to determine that our deferred tax assets are more likely than not realizable, we would release our valuation allowance, which would result in an income tax benefit being recorded in our consolidated statement of operations.
Additional tax information:
In the normal course of business, income tax authorities in various income tax jurisdictions both within the United States and internationally conduct routine audits of our income tax returns filed in prior years. Income tax years are open for the United States jurisdiction for fiscal years 2013 through 2015. International jurisdictions have open tax years varying by location beginning in fiscal 2006.
We have no deferred tax liability recognized relating to our investment in foreign subsidiaries where the earnings have been indefinitely reinvested. If circumstances change and it becomes apparent that some or all of the undistributed untaxed earnings of a subsidiary will be remitted to the United States, we will accrue a tax expense at that time. We have approximately
$9,067
of untaxed earnings which have indefinitely been reinvested. Determination of the amount of any unrecognized deferred income tax liability on these earnings is not practicable.
We recognized an expense of
$232
,
$14
and
$20
in net interest and penalties during the years ended
April 30, 2016
,
May 2, 2015
and
April 26, 2014
, respectively. Interest and penalties recognized are recorded in income taxes in our consolidated statements of operations. We had accrued
$94
and
$16
in net interest or penalties as of
April 30, 2016
and
May 2, 2015
, respectively.
56
Note 14. Cash Flow Information
The changes in operating assets and liabilities consisted of the following:
|
|
Year Ended
|
||||||||||
|
April 30,
2016 |
May 2,
2015 |
April 26,
2014 |
|||||||||
|
(Increase) decrease:
|
|
|
|
||||||||
|
Restricted cash
|
$
|
298
|
|
$
|
18
|
|
$
|
(466
|
)
|
||
|
Account receivable
|
3,789
|
|
6,412
|
|
(18,293
|
)
|
|||||
|
Long-term receivables
|
2,851
|
|
3,234
|
|
3,027
|
|
|||||
|
Inventories
|
(5,100
|
)
|
(1,907
|
)
|
(12,771
|
)
|
|||||
|
Costs and estimated earnings in excess of billings
|
4,867
|
|
(1,667
|
)
|
5,955
|
|
|||||
|
Prepaid expenses and other current assets
|
1,290
|
|
(575
|
)
|
(536
|
)
|
|||||
|
Income taxes receivables
|
1,061
|
|
(3,084
|
)
|
(2,414
|
)
|
|||||
|
Advertising rights and other assets
|
(776
|
)
|
912
|
|
64
|
|
|||||
|
Increase (decrease):
|
|
|
|
|
|
|
|||||
|
Current marketing obligations and other payables
|
21
|
|
(146
|
)
|
372
|
|
|||||
|
Accounts payable
|
(9,926
|
)
|
5,594
|
|
6,701
|
|
|||||
|
Customer deposits (billed or collected)
|
(941
|
)
|
(1,315
|
)
|
4,931
|
|
|||||
|
Accrued expenses
|
476
|
|
2,860
|
|
165
|
|
|||||
|
Warranty obligations
|
4,726
|
|
(2,638
|
)
|
543
|
|
|||||
|
Billings in excess of costs and estimated earnings
|
(13,436
|
)
|
1,314
|
|
8,238
|
|
|||||
|
Long-term warranty obligations
|
(710
|
)
|
1,869
|
|
1,560
|
|
|||||
|
Income taxes payable
|
(40
|
)
|
(666
|
)
|
(527
|
)
|
|||||
|
Deferred revenue (billed or collected)
|
2,120
|
|
(250
|
)
|
(836
|
)
|
|||||
|
Long-term marketing obligations and other payables
|
(456
|
)
|
3,468
|
|
(501
|
)
|
|||||
|
|
$
|
(9,886
|
)
|
$
|
13,433
|
|
$
|
(4,788
|
)
|
||
Supplemental disclosures of cash flow information consisted of the following:
|
|
Year Ended
|
||||||||||
|
April 30,
2016 |
May 2,
2015 |
April 26,
2014 |
|||||||||
|
Cash payments for:
|
|
|
|
||||||||
|
Interest
|
$
|
303
|
|
$
|
289
|
|
$
|
198
|
|
||
|
Income taxes, net of refunds
|
(824
|
)
|
8,690
|
|
16,521
|
|
|||||
Supplemental schedule of non-cash investing and financing activities consisted of the following:
|
|
Year Ended
|
|||||||||||
|
April 30,
2016 |
May 2,
2015 |
April 26,
2014 |
||||||||||
|
Demonstration equipment transferred to inventory
|
$
|
227
|
|
$
|
34
|
|
$
|
255
|
|
|||
|
Purchases of property and equipment included in accounts payable
|
142
|
|
1,510
|
|
2,099
|
|
||||||
|
Contributions of common stock under the ESPP
|
1,777
|
|
2,512
|
|
1,552
|
|
||||||
|
Contingent consideration related to acquisition of ADFLOW
|
1,955
|
|
—
|
|
—
|
|
||||||
Note 15. Fair Value Measurement
ASC 820,
Fair Value Measurement,
defines fair value as the price that would be received to sell an asset or paid to transfer a liability (an exit price) in an orderly transaction between market participants at the measurement date. It also establishes a fair value hierarchy which requires an entity to maximize the use of observable inputs and minimize the use of unobservable inputs when measuring fair value. The fair value hierarchy within ASC 820 distinguishes between the following three levels of inputs which may be utilized when measuring fair value.
57
Level 1
- Quoted prices in active markets for identical assets or liabilities.
Level 2
- Observable inputs other than quoted prices included within Level 1 for the assets or liabilities, either directly or indirectly (for example, quoted market prices for similar assets and liabilities in active markets or quoted market prices for identical assets or liabilities in markets not considered to be active, inputs other than quoted prices that are observable for the asset or liability, or market-corroborated input).
Level 3
- Unobservable inputs supported by little or no market activity based on our own assumptions used to measure assets and liabilities.
The fair values for fixed-rate contracts receivable are estimated using a discounted cash flow analysis based on interest rates currently being offered for contracts with similar terms to customers with similar credit quality. The carrying amounts reported on our consolidated balance sheets for contracts receivable approximate fair value and have been categorized as a Level 2 fair value measurement. Fair values for fixed-rate long-term marketing obligations are estimated using a discounted cash flow calculation applying interest rates currently being offered for debt with similar terms and underlying collateral. The total carrying value of long-term marketing obligations as reported on our consolidated balance sheets within other long-term obligations approximates fair value and has been categorized as a Level 2 fair value measurement.
The following table sets forth by Level within the fair value hierarchy our financial assets and liabilities that were accounted for at fair value on a recurring basis at
April 30, 2016
and
May 2, 2015
according to the valuation techniques we used to determine their fair values. There have been no transfers of assets or liabilities among the fair value hierarchies presented.
|
|
Fair Value Measurements
|
||||||||||
|
|
Level 1
|
Level 2
|
Total
|
||||||||
|
Balance as of April 30, 2016:
|
|
|
|
||||||||
|
Cash and cash equivalents
|
$
|
28,328
|
|
$
|
—
|
|
$
|
28,328
|
|
||
|
Restricted cash
|
198
|
|
—
|
|
198
|
|
|||||
|
Available-for-sale securities:
|
|
|
|
|
|||||||
|
Certificates of deposit
|
—
|
|
14,927
|
|
14,927
|
|
|||||
|
U.S. Government sponsored entities
|
—
|
|
8,522
|
|
8,522
|
|
|||||
|
Municipal obligations
|
—
|
|
1,223
|
|
1,223
|
|
|||||
|
Derivatives - currency forward contracts
|
—
|
|
(453
|
)
|
(453
|
)
|
|||||
|
$
|
28,526
|
|
$
|
24,219
|
|
$
|
52,745
|
|
|||
|
Balance as of May 2, 2015:
|
|
|
|
|
|
|
|||||
|
Cash and cash equivalents
|
$
|
57,284
|
|
$
|
—
|
|
$
|
57,284
|
|
||
|
Restricted cash
|
496
|
|
—
|
|
496
|
|
|||||
|
Available-for-sale securities:
|
|
|
|
|
|||||||
|
Certificates of deposit
|
—
|
|
11,409
|
|
11,409
|
|
|||||
|
U.S. Government securities
|
1,001
|
|
—
|
|
1,001
|
|
|||||
|
U.S. Government sponsored entities
|
—
|
|
7,942
|
|
7,942
|
|
|||||
|
Municipal obligations
|
—
|
|
4,994
|
|
4,994
|
|
|||||
|
Derivatives - currency forward contracts
|
—
|
|
(283
|
)
|
(283
|
)
|
|||||
|
$
|
58,781
|
|
$
|
24,062
|
|
$
|
82,843
|
|
|||
The following methods and assumptions were used to estimate the fair value of each class of financial instrument. There have been no changes in the valuation techniques used by us to value our financial instruments.
Cash and cash equivalents
: Consists of cash on hand in bank deposits and highly liquid investments, primarily money market accounts. The fair value was measured using quoted market prices in active markets. The carrying amount approximates fair value.
Restricted cash
: Consists of cash and cash equivalents held in bank deposit accounts to secure issuances of foreign bank guarantees. The fair value of restricted cash was measured using quoted market prices in active markets. The carrying amount approximates fair value.
Certificates of deposit
: Consists of time deposit accounts with original maturities of less than three years and various yields. The fair value of these securities was measured based on valuations observed in less active markets than Level 1 investments from a third-party financial institution. The carrying amount approximates fair value.
58
U.S. Government securities
:
Consists of U.S. Government treasury bills, notes, and bonds with original maturities of less than three years and various yields. The fair value of these securities was measured using quoted market prices in active markets.
U.S. Government sponsored entities
: Consist of Fannie Mae and Federal Home Loan Bank investment grade debt securities trading with sufficient frequency and volume to enable us to obtain pricing information on an ongoing basis. The fair value of these securities was measured based on valuations observed in less active markets than Level 1 investments. The contractual maturities of these investments vary from one month to three years.
Municipal obligations
: Consist of investment grade municipal bonds trading with sufficient frequency and volume to enable us to obtain pricing information on an ongoing basis. The contractual maturities of these investments vary from two to three years. The fair value of these bonds was measured based on valuations observed in less active markets than Level 1 investments.
Derivatives – currency forward contracts
: Consists of currency forward contracts trading with sufficient frequency and volume to enable us to obtain pricing information on an ongoing basis. The fair value of these securities was measured based on a valuation from a third-party bank. See "
Note 16. Derivative Financial Instruments
" for more information regarding our derivatives.
The fair value measurement standard also applies to certain non-financial assets and liabilities measured at fair value on a nonrecurring basis. For example, certain long-lived assets such as goodwill, intangible assets and property, plant and equipment are measured at fair value in connection with business combinations or when an impairment is recognized and the related assets are written down to fair value. We utilized the fair value measurement standard, using primarily Level 3 inputs, to value the assets and liabilities for the business combinations and the determination of goodwill associated with the sale of our automated rigging systems business for theatre applications. See "
Note 4. Business Combinations
" and "
Note 5. Sale of Theatre Rigging Division
" for more information. We did not make any material business combinations or recognize significant impairment losses during
fiscal 2016
or
fiscal 2015
.
Note 16. Derivative Financial Instruments
We utilize derivative financial instruments to manage the economic impact of fluctuations in currency exchange rates on those transactions denominated in currencies other than our functional currency, which is the U.S. dollar. We enter into currency forward contracts to manage these economic risks. We account for all derivatives on the balance sheet within accounts receivable or accounts payable measured at fair value, and changes in fair values are recognized in earnings unless specific hedge accounting criteria are met for cash flow or net investment hedges. As of
April 30, 2016
and
May 2, 2015
, we had not designated any of our derivative instruments as accounting hedges, and thus we recorded the changes in fair value in other (expense) income, net.
The foreign currency exchange contracts in aggregated notional amounts in place to exchange U.S. dollars at
April 30, 2016
and
May 2, 2015
were as follows:
|
|
April 30, 2016
|
May 2, 2015
|
|||||||||
|
|
U.S.
Dollars
|
Foreign
Currency
|
U.S.
Dollars
|
Foreign
Currency
|
|||||||
|
Foreign Currency Exchange Forward Contracts:
|
|
|
|
|
|||||||
|
U.S. Dollars/Australian Dollars
|
7,216
|
|
10,027
|
|
1,487
|
|
1,918
|
|
|||
|
U.S. Dollars/Canadian Dollars
|
563
|
|
771
|
|
4,129
|
|
4,923
|
|
|||
|
U.S. Dollars/British Pounds
|
1,795
|
|
1,263
|
|
1,679
|
|
1,123
|
|
|||
|
U.S. Dollars/Singapore Dollars
|
261
|
|
356
|
|
1,176
|
|
1,601
|
|
|||
|
U.S. Dollars/Euros
|
147
|
|
132
|
|
(229
|
)
|
174
|
|
|||
|
U.S. Dollars/Swiss Franc
|
—
|
|
—
|
|
5,662
|
|
5,500
|
|
|||
|
U.S. Dollars/Japanese Yen
|
—
|
|
—
|
|
764
|
|
91,282
|
|
|||
As of
April 30, 2016
and
May 2, 2015
, there was a net
liability
of
$453
and
$283
, respectively, representing the fair value of foreign currency exchange forward contracts, which was determined using Level 2 inputs from a third-party bank.
Note 17. Commitments and Contingencies
Litigation:
We are a party to legal proceedings and claims which arise during the ordinary course of business. We review our legal proceedings and claims, regulatory reviews and inspections, and other legal matters on an ongoing basis and follow appropriate accounting guidance when making accrual and disclosure decisions. We establish accruals for those contingencies when the incurrence of a loss is probable and can be reasonably estimated, and we disclose the amount accrued and the amount of a reasonably possible loss in excess of the amount accrued, if such disclosure is necessary for our financial statements to not be misleading. We do not record an accrual
59
when the likelihood of loss being incurred is probable, but the amount cannot be reasonably estimated, or when the loss is believed to be only reasonably possible or remote, although disclosures will be made for material matters as required by ASC 450-20,
Contingencies - Loss Contingencies
. Our assessment of whether a loss is reasonably possible or probable is based on our assessment and consultation with legal counsel regarding the ultimate outcome of the matter following all appeals.
As of
April 30, 2016
and
May 2, 2015
, we did not believe there was a reasonable probability that any material loss for these various claims or legal actions, including reviews, inspections or other legal proceedings, if any, would be incurred. Accordingly, no accrual or disclosure of a potential range of loss has been made related to these matters. In the opinion of management, the ultimate liability of all unresolved legal proceedings is not expected to have a material effect on our financial position, liquidity or capital resources.
Warranties:
We offer a standard parts coverage warranty for periods varying from
one
to
five
years for most of our products. We also offer additional types of warranties to include on-site labor, routine maintenance and event support. In addition, the terms of warranties on some installations can vary from
one
to
10
years. The specific terms and conditions of these warranties vary primarily depending on the type of the product sold. We estimate the costs which may be incurred under the warranty obligations and record a liability in the amount of such estimated costs at the time the revenue is recognized. Factors affecting our estimate of the cost of our warranty obligations include historical experience and expectations of future conditions. We continually assess the adequacy of our recorded warranty accruals and, to the extent we experience any changes in warranty claim activity or costs associated with servicing those claims, our accrued warranty obligation is adjusted accordingly.
We discovered a warranty issue caused by a mechanical device failure within a module for displays primarily in our OOH applications built prior to fiscal 2013. The device failure causes a visual defect in the display. We are deploying preventative maintenance to sites impacted and can repair the device in our repair center. When certain site locations have exceeded an acceptable failure rate, we have refurbished the display to meet customers’ expectations under contractual obligations. We have increased our accrued warranty obligations by
$9.2 million
during fiscal 2016 and
$1.2 million
during fiscal 2015 for probable and reasonably estimable costs to remediate this issue. As of April 30, 2016, we had
$5.5 million
remaining in accrued warranty obligations for the estimate of probable future claims related to this issue. Because failure rates are unpredictable, the final outcome of this matter is dependent on many factors that are difficult to predict. Accordingly, it is possible that the ultimate cost to resolve this matter may increase and may be materially different from the amount of the current estimate and accrual.
Changes in our warranty obligation for the fiscal years ended
April 30, 2016
and
May 2, 2015
consisted of the following:
|
|
April 30, 2016
|
May 2, 2015
|
|||||
|
Beginning accrued warranty obligations
|
$
|
26,481
|
|
$
|
27,250
|
|
|
|
Warranties issued during the period
|
10,528
|
|
14,113
|
|
|||
|
Settlements made during the period
|
(18,377
|
)
|
(13,829
|
)
|
|||
|
Changes in accrued warranty obligations for pre-existing warranties during the period, including expirations
|
11,864
|
|
(1,053
|
)
|
|||
|
Ending accrued warranty obligations
|
$
|
30,496
|
|
$
|
26,481
|
|
|
Performance guarantees:
We have entered into standby letters of credit and surety bonds with financial institutions relating to the guarantee of our future performance on contracts, primarily construction type contracts. As of
April 30, 2016
, we had outstanding letters of credit and surety bonds in the amount of
$7,354
and
$50,593
, respectively. Performance guarantees are issued to certain customers to guarantee the operation and installation of the equipment and our ability to complete a contract. These performance guarantees have various terms, which are generally one year.
Leases:
We lease vehicles, office space and various equipment for various global sales and service locations, including manufacturing space in the United States and China. Some of these leases, including the lease for manufacturing facilities in Sioux Falls, South Dakota, include provisions for extensions or purchase. During fiscal 2016, we signed a letter of intent to lease the entire building upon the departure of the other tenant. The lease for the facilities in Sioux Falls, South Dakota can be extended for an additional five years past its current term, which ends approximately March 31, 2022, and it contains an option to purchase the property subject to the lease from March 31, 2017 to March 31, 2022 for
$9,000
, which approximates fair value. If the lease is extended, the purchase option increases to
$9,090
for the year ending March 31, 2023 and
$9,180
for the year ending March 31, 2024. Rental expense for operating leases was
$2,725
,
$2,714
and
$2,742
for the fiscal years ended
April 30, 2016
,
May 2, 2015
and
April 26, 2014
, respectively.
60
Future minimum payments under noncancelable operating leases, excluding executory costs such as management and maintenance fees, with initial or remaining terms of one year or more consisted of the following at
April 30, 2016
:
|
Fiscal years ending
|
Amount
|
|||
|
2017
|
$
|
2,166
|
|
|
|
2018
|
1,715
|
|
||
|
2019
|
1,233
|
|
||
|
2020
|
1,040
|
|
||
|
2021
|
852
|
|
||
|
Thereafter
|
779
|
|
||
|
$
|
7,785
|
|
||
Purchase commitments:
From time to time, we commit to purchase inventory, advertising, information technology maintenance and support services, and various other products and services over periods that extend beyond one year. As of
April 30, 2016
, we were obligated under the following conditional and unconditional purchase commitments, which included
$500
in conditional purchase commitments:
|
Fiscal years ending
|
Amount
|
|||
|
2017
|
$
|
1,212
|
|
|
|
2018
|
295
|
|
||
|
2019
|
100
|
|
||
|
2020
|
—
|
|
||
|
2021
|
—
|
|
||
|
Thereafter
|
—
|
|
||
|
$
|
1,607
|
|
||
Other long-term obligations:
We are obligated to pay the following payments for acquisitions and for other various obligations.
|
April 30, 2016
|
May 2, 2015
|
|||||||
|
Advertising
|
$
|
589
|
|
$
|
700
|
|
||
|
Deferred purchase price
|
3,228
|
|
1,476
|
|
||||
|
Total Outstanding
|
3,817
|
|
2,176
|
|
||||
|
Less: current liability
|
552
|
|
555
|
|
||||
|
Other long-term obligations
|
$
|
3,265
|
|
$
|
1,621
|
|
||
Note 18. Subsequent Events
On
June 16, 2016
, our Board of Directors declared a regular quarterly dividend of
$0.06
per share and a special dividend of
$0.04
per share on our common stock for the fiscal year ended
April 30, 2016
, payable on
July 8, 2016
to holders of record of our common stock on
June 27, 2016
.
On
June 16, 2016
, our Board of Directors authorized at stock buyback program under which it may repurchase up to
$40,000
of its outstanding common stock.
Note 19. Quarterly Financial Data (Unaudited)
The following table presents summarized quarterly financial data:
61
|
Fiscal 2016 Quarter Ended
|
|||||||||||||||
|
August 1,
2015 |
October 31,
2015 |
January 30,
2016 |
April 30,
2016 |
||||||||||||
|
Net sales
|
$
|
150,221
|
|
$
|
157,668
|
|
$
|
123,816
|
|
$
|
138,463
|
|
|||
|
Gross profit
|
35,501
|
|
35,513
|
|
22,029
|
|
27,976
|
|
|||||||
|
Net income (loss)
|
3,776
|
|
3,168
|
|
(1,953
|
)
|
(2,930
|
)
|
|||||||
|
Basic earnings (loss) per share
|
0.09
|
|
0.07
|
|
(0.04
|
)
|
(0.07
|
)
|
|||||||
|
Diluted earnings (loss) per share
|
0.09
|
|
0.07
|
|
(0.04
|
)
|
(0.07
|
)
|
|||||||
|
Fiscal 2015 Quarter Ended
|
|||||||||||||||
|
August 2,
2014 |
November 1,
2014 |
January 31,
2015 |
May 2,
2015 |
||||||||||||
|
Net sales
|
$
|
166,618
|
|
$
|
173,115
|
|
$
|
118,123
|
|
$
|
158,086
|
|
|||
|
Gross profit
|
43,403
|
|
40,877
|
|
25,062
|
|
35,237
|
|
|||||||
|
Net income
|
8,745
|
|
7,737
|
|
561
|
|
3,839
|
|
|||||||
|
Basic earnings per share
|
0.20
|
|
0.18
|
|
0.01
|
|
0.09
|
|
|||||||
|
Diluted earnings per share
|
0.20
|
|
0.18
|
|
0.01
|
|
0.09
|
|
|||||||
62
Item 9. CHANGES IN AND DISAGREEMENTS WITH ACCOUNTANTS ON ACCOUNTING AND FINANCIAL DISCLOSURE
None.
Item 9A. CONTROLS AND PROCEDURES
Evaluation of Disclosure Controls and Procedures
Management of our Company is responsible for establishing and maintaining effective disclosure controls and procedures as defined in Rules 13a-15(e) and 15d-15(e) under the Securities Exchange Act of 1934. As of
April 30, 2016
, an evaluation was performed, under the supervision and with the participation of management, including our Chief Executive Officer and Chief Financial Officer, of the effectiveness of the design and operation of our disclosure controls and procedures. Based upon that evaluation, the Chief Executive Officer and Chief Financial Officer concluded that as of
April 30, 2016
, our disclosure controls and procedures were effective at the reasonable assurance level to ensure information required to be disclosed in this Annual Report on Form 10-K was recorded, processed, summarized and reported within the time period required by the SEC’s rules and forms and accumulated and communicated to management, including our Chief Executive Officer and Chief Financial Officer, to allow timely decisions regarding required disclosure.
Changes in Internal Control Over Financial Reporting
During the quarter ended
April 30, 2016
and thereafter, there have been no changes in our internal control over financial reporting that have materially affected, or are reasonably likely to materially affect, our internal control over financial reporting.
Management’s Report on Internal Control Over Financial Reporting
Our management is responsible for establishing and maintaining adequate internal control over financial reporting, as such term is defined in Rule 13a-15(f) under the Securities Exchange Act of 1934. Our internal control system was designed to provide reasonable assurance to our management and board of directors regarding the preparation and fair presentation of published financial statements. All internal control systems, no matter how well designed, have inherent limitations. Therefore, even those systems determined to be effective can provide only reasonable assurance with respect to financial statement preparation and presentation.
Under the supervision and with the participation of our management, including our Chief Executive Officer and Chief Financial Officer, we conducted an evaluation of the effectiveness of our internal control over financial reporting based on the framework in Internal Control—Integrated Framework issued by the Committee of Sponsoring Organizations of the Treadway Commission (2013 framework). Based on our evaluation under the framework in Internal Control—Integrated Framework, our management concluded our internal control over financial reporting was effective as of
April 30, 2016
.
Our internal control over financial reporting as of
April 30, 2016
has been audited by Ernst & Young LLP, our independent registered public accounting firm, as stated in their report that follows.
|
By /s/ Reece A. Kurtenbach
|
By /s/ Sheila M. Anderson
|
|
Reece A. Kurtenbach
|
Sheila M. Anderson
|
|
Chief Executive Officer
|
Chief Financial Officer
|
|
June 21, 2016
|
June 21, 2016
|
63
REPORT OF INDEPENDENT REGISTERED PUBLIC ACCOUNTING FIRM
The Board of Directors and Shareholders of Daktronics, Inc.
We have audited Daktronics, Inc. and subsidiaries’ (the Company) internal control over financial reporting as of
April 30, 2016
, based on criteria established in Internal Control-Integrated Framework issued by the Committee of Sponsoring Organizations of the Treadway Commission (2013 framework) (the COSO criteria). The Company's management is responsible for maintaining effective internal control over financial reporting, and for its assessment of the effectiveness of internal control over financial reporting included in the accompanying Management’s Report on Internal Control Over Financial Reporting. Our responsibility is to express an opinion on the Company’s internal control over financial reporting based on our audit.
We conducted our audit in accordance with the standards of the Public Company Accounting Oversight Board (United States). Those standards require that we plan and perform the audit to obtain reasonable assurance about whether effective internal control over financial reporting was maintained in all material respects. Our audit included obtaining an understanding of internal control over financial reporting, assessing the risk that a material weakness exists, testing and evaluating the design and operating effectiveness of internal control based on the assessed risk, and performing such other procedures as we considered necessary in the circumstances. We believe that our audit provides a reasonable basis for our opinion.
A company’s internal control over financial reporting is a process designed to provide reasonable assurance regarding the reliability of financial reporting and the preparation of financial statements for external purposes in accordance with generally accepted accounting principles. A company’s internal control over financial reporting includes those policies and procedures that (1) pertain to the maintenance of records that, in reasonable detail, accurately and fairly reflect the transactions and dispositions of the assets of the company; (2) provide reasonable assurance that transactions are recorded as necessary to permit preparation of financial statements in accordance with generally accepted accounting principles, and that receipts and expenditures of the company are being made only in accordance with authorizations of management and directors of the company; and (3) provide reasonable assurance regarding prevention or timely detection of unauthorized acquisition, use, or disposition of the company’s assets that could have a material effect on the financial statements.
Because of its inherent limitations, internal control over financial reporting may not prevent or detect misstatements. Also, projections of any evaluation of effectiveness to future periods are subject to the risk that controls may become inadequate because of changes in conditions, or that the degree of compliance with the policies or procedures may deteriorate.
In our opinion, Daktronics, Inc. and subsidiaries maintained, in all material respects, effective internal control over financial reporting as of
April 30, 2016
, based on the COSO criteria.
We also have audited, in accordance with the standards of the Public Company Accounting Oversight Board (United States), the consolidated balance sheets of Daktronics, Inc. and subsidiaries as of
April 30, 2016
and
May 2, 2015
, and the related consolidated statements of operations, comprehensive income, shareholders’ equity and cash flows for each of the three years in the period ended
April 30, 2016
of Daktronics, Inc. and subsidiaries and our report dated
June 21, 2016
expressed an unqualified opinion thereon.
/s/ Ernst & Young LLP
Minneapolis, Minnesota
June 21, 2016
64
Item 9B. OTHER INFORMATION
None
PART III.
Item 10. DIRECTORS, EXECUTIVE OFFICERS AND CORPORATE GOVERNANCE
The information required by this Item 10 will be included under the captions “Proposal One - Election of Directors” and “Corporate Governance” in our Proxy Statement for our
2016
annual meeting of shareholders (“Proxy Statement”) to be filed within 120 days after our most recent fiscal year-end. Information concerning the compliance of our officers, directors and 10 percent shareholders with Section 16(a) of the Securities Exchange Act of 1934 is incorporated by reference to the information to be contained in the Proxy Statement under the caption “Section 16(a) Beneficial Ownership Reporting Compliance.” The information regarding Audit Committee members and “Audit Committee Financial Experts” is incorporated by reference to the information to be contained in the Proxy Statement under the caption “Corporate Governance–Committees of the Board of Directors.” The information regarding our Code of Conduct is incorporated by reference to the information to be contained in the Proxy Statement under the heading “Corporate Governance – Code of Conduct.”
Item 11. EXECUTIVE COMPENSATION
Information regarding the compensation of our directors and officers for the fiscal year ended
April 30, 2016
will be in the Proxy Statement under the heading “Proposal One - Election of Directors” and “Executive Compensation” and is incorporated herein by reference.
We maintain a Code of Conduct which applies to all of our employees, officers and directors. Included in the Code of Conduct are ethics provisions that apply to our Chief Executive Officer, Chief Financial Officer and all other financial and accounting management employees. A copy of our Code of Conduct can be obtained from our website at
www.daktronics.com
on the Investor Relations page and will be made available free of charge to any shareholder upon request. Information on or available through our website is not part of this Form 10-K. We intend to disclose any waivers from, or amendments to, the Code of Conduct by posting a description of such waiver or amendment on our Internet website. However, to date, we have not granted a waiver from the Code of Conduct.
Item 12. SECURITY OWNERSHIP OF CERTAIN BENEFICIAL OWNERS AND MANAGEMENT AND RELATED STOCKHOLDER MATTERS
The security ownership of certain beneficial owners and management will be contained in the Proxy Statement under the heading “Security Ownership of Certain Beneficial Owners and Management” and “Executive Compensation - Securities Authorized for Issuance Under Equity Compensation Plans” and is incorporated herein by reference.
Item 13. CERTAIN RELATIONSHIPS AND RELATED TRANSACTIONS AND DIRECTOR INDEPENDENCE
Information required by this item is incorporated by reference from the sections entitled “Proposal One – Election of Directors – Independent Directors” and “Corporate Governance - Compensation Committee Interlocks and Insider Participation” that will be contained in our Proxy Statement. There were no related party transactions in fiscal
2016
.
Item 14. PRINCIPAL ACCOUNTANT FEES AND SERVICES
Information regarding our principal accountant will be contained in the Proxy Statement under the heading “Proposal Three - Ratification of Appointment of Independent Registered Public Accounting Firm” and is incorporated herein by reference.
65
PART IV
.
Item 15. EXHIBITS AND FINANCIAL STATEMENT SCHEDULES
|
(a)(1)
|
Financial Statements
|
Our financial statements, a description of which follows, are contained in Part II, Item 8:
|
(2)
|
Schedules
|
The following financial statement schedule is submitted herewith:
Other schedules are omitted because they are not required or are not applicable or because the required information is included in the financial statements listed above.
|
(3)
|
Exhibits
|
A list of exhibits required to be filed as part of this report is set forth in the Index of Exhibits, which immediately precedes such exhibits, and is incorporated herein by reference.
All Sport
®
, Daktronics
®
, DakStats
®
, DataTime
®
, Fuelight
™
, Fuelink
™
, Galaxy
®
, GalaxyPro
™
, OmniSport
®
, ProAd
®
, ProPixel
®
, ProRail
®
, ProStar
®
, ProTour
®
, Sportsound
®
, Valo
®
, Vanguard
®
, Venus
®
, V-Net
®
, Visiconn
®
, V-Tour
®
, and V-Link
®
are trademarks of Daktronics, Inc. All other trademarks referenced are the intellectual property of their respective companies.
66
SIGNATURES
Pursuant to the requirements of Section 13 or 15(d) of the Securities Exchange Act of 1934, the Registrant has duly caused this Annual Report to be signed on its behalf by the undersigned, thereunto duly authorized, on
June 21, 2016
.
|
|
DAKTRONICS, INC.
|
|
|
|
By: /s/ Reece A. Kurtenbach
|
|
|
|
|
Chief Executive Officer and President
|
|
|
|
(Principal Executive Officer)
|
|
|
|
|
|
|
By: /s/ Sheila M. Anderson
|
|
|
|
|
Chief Financial Officer
|
|
|
|
(Principal Financial Officer and Principal Accounting Officer)
|
Pursuant to the requirements of the Securities Exchange Act of 1934, this report has been signed below by the following persons on behalf of the Registrant and in the capacities and on the dates indicated.
|
Signature
|
Title
|
Date
|
|
|
|
|
|
|
|
By /s/ Byron J. Anderson
|
Director
|
June 21, 2016
|
|
|
|
Byron J. Anderson
|
|
|
|
|
|
|
|
|
By /s/ Robert G. Dutcher
|
Director
|
June 21, 2016
|
|
|
|
Robert G. Dutcher
|
|
|
|
|
|
|
|
|
By /s/ Nancy D. Frame
|
Director
|
June 21, 2016
|
|
|
|
Nancy D. Frame
|
|
|
|
|
|
|
|
|
By /s/ Reece A. Kurtenbach
|
Director
|
June 21, 2016
|
|
|
|
Reece A. Kurtenbach
|
|
|
|
|
|
|
|
|
By /s/ James B. Morgan
|
Director
|
June 21, 2016
|
|
|
|
James B. Morgan
|
|
|
|
|
|
|
|
|
By /s/ John L. Mulligan
|
Director
|
June 21, 2016
|
|
|
|
John L. Mulligan
|
|
|
|
|
|
|
|
|
By /s/ John P. Friel
|
Director
|
June 21, 2016
|
|
|
|
John P. Friel
|
|
|
|
By /s/ Kevin P. McDermott
|
Director
|
June 21, 2016
|
|
|
Kevin P. McDermott
|
|||
67
|
DAKTRONICS, INC. AND SUBSIDIARIES
SCHEDULE II - VALUATION AND QUALIFYING ACCOUNTS
(in thousands)
|
|||||||||||||||||||
|
Additions
|
|||||||||||||||||||
|
Description
|
Balance at
Beginning of Year |
Charged to
Costs and
Expenses
|
Charged to
Other Accounts |
Deductions
|
Balance
at End of Year |
||||||||||||||
|
For the year ended April 30, 2016:
|
|||||||||||||||||||
|
Deducted from asset accounts:
|
|||||||||||||||||||
|
Allowance for doubtful accounts
|
$
|
2,316
|
|
$
|
934
|
|
$
|
—
|
|
$
|
(453
|
)
|
(b)
|
$
|
2,797
|
|
|||
|
Allowance for excess and obsolete inventories
|
3,998
|
|
3,475
|
|
12
|
|
(a)
|
(2,510
|
)
|
(c)
|
4,975
|
|
|||||||
|
For the year ended May 2, 2015:
|
|||||||||||||||||||
|
Deducted from asset accounts:
|
|||||||||||||||||||
|
Allowance for doubtful accounts
|
2,539
|
|
(150
|
)
|
—
|
|
(73
|
)
|
(b)
|
2,316
|
|
||||||||
|
Allowance for excess and obsolete inventories
|
2,692
|
|
2,701
|
|
2
|
|
(a)
|
(1,397
|
)
|
(c)
|
3,998
|
|
|||||||
|
For the year ended April 26, 2014:
|
|||||||||||||||||||
|
Deducted from asset accounts:
|
|||||||||||||||||||
|
Allowance for doubtful accounts
|
2,718
|
|
860
|
|
—
|
|
(1,039
|
)
|
(b)
|
2,539
|
|
||||||||
|
Allowance for excess and obsolete inventories
|
3,286
|
|
1,219
|
|
(1
|
)
|
(a)
|
(1,812
|
)
|
(c)
|
2,692
|
|
|||||||
(b) Write-off of uncollected accounts, net of collections
(c) Obsolete and excess inventory disposals
68
Index of Exhibits
Certain of the following exhibits are incorporated by reference from prior filings. The form with which each exhibit was filed and the date of filing are as indicated below; the reports described below are filed as Commission File No. 0-23246 unless otherwise indicated.
|
3.1
|
Amended and Restated Articles of Incorporation of the Company (Incorporated by reference to Exhibit 3.1 filed with our Quarterly Report on Form 10-Q on August 30, 2013).
|
|
|
3.2
|
Amended and Restated Bylaws of the Company (Incorporated by reference to Exhibit 3.4 filed with our Annual Report on Form 10-K on June 12, 2013).
|
|
|
4.1
|
Form of Stock Certificate evidencing Common Stock, without par value, of the Company (Incorporated by reference to Exhibit 4.1 filed with our Amendment No. 1 to the Registration Statement on Form S-1 on January 12, 1994 as Commission File No. 33-72466).
|
|
|
4.2
|
Rights Agreement (Incorporated by reference to Exhibit 4.1 filed with our Form 8-A on August 29, 2008).
|
|
|
4.3
|
2001 Incentive Stock Option Plan (Incorporated by reference to Exhibit 4.1 to our Registration Statement on Form S-8 filed on November 8, 2001 as Commission File No. 333-72990).*
|
|
|
4.4
|
2001 Outside Directors Stock Option Plan (Incorporated by reference to Exhibit 4.2 to our Registration Statement on Form S-8 filed on November 8, 2001 as Commission File No. 333-72990).*
|
|
|
4.5
|
Daktronics, Inc. 2007 Incentive Stock Plan (Incorporated by reference to Exhibit 10.1 filed with our Quarterly Report on Form 10-Q on August 20, 2007).*
|
|
|
4.6
|
Daktronics, Inc. 2015 Incentive Stock Plan ("2015 Plan") (Incorporated by reference to Exhibit A to the Company's Definitive Proxy Statement on Schedule 14A filed on July 14, 2015).*
|
|
|
4.7
|
Form of Restricted Stock Award Agreement under the 2015 Plan (Incorporated by reference to Exhibit 10.2 filed with our Current Report on Form 8-K on September 3, 2015).*
|
|
|
4.8
|
Form of Non-Qualified Stock Option Agreement Terms and Conditions under the 2015 Plan (Incorporated by reference to Exhibit 10.3 filed with our Current Report on Form 8-K on September 3, 2015).*
|
|
|
4.9
|
Form of Incentive Stock Option Terms and Conditions under the 2015 Plan (Incorporated by reference to Exhibit 10.4 filed with our Current Report on Form 8-K on September 3, 2015).*
|
|
|
4.10
|
Form of Restricted Stock Unit Terms and Conditions under the 2015 Plan (Incorporated by reference to Exhibit 10.5 filed with our Current Report on Form 8-K on September 3, 2015).*
|
|
|
10.1
|
Amended and Restated Deferred Compensation Agreement Between the Company and Aelred Kurtenbach (Incorporated by reference to Exhibit 10.1 filed with our Annual Report on Form 10-K on June 28, 2004).*
|
|
|
10.2
|
Loan Agreement dated October 14, 1998 between U.S. Bank National Association and the Company (Incorporated by reference to Exhibit 10.6 filed with our Quarterly Report on Form 10-Q filed on December 11, 1998).
|
|
|
10.3
|
Eighth Amendment to Loan Agreement dated November 12, 2009 by and between the Company and U.S. Bank National Association (Incorporated by reference to Exhibit 10.1 filed with our Current Report on Form 8-K filed on November 12, 2009).
|
|
|
10.4
|
Tenth Amendment to Loan Agreement dated November 15, 2011 by and between the Company and U.S. Bank National Association (Incorporated by reference to Exhibit 10.1 filed with our Current Report on Form 8-K filed on November 17, 2011).
|
|
|
10.5
|
Eleventh Amendment to Loan Agreement dated November 9, 2012 by and between the Company and U.S. Bank National Association (Incorporated by reference to Exhibit 10.1 filed with our Current Report on Form 8-K filed on November 9, 2012).
|
|
|
10.6
|
Renewal Revolving Note dated November 15, 2013 issued by the Company to the U.S. Bank National Association (Incorporated by reference to Exhibit 10.2 filed with our Current Report on Form 8-K filed on November 18, 2013).
|
|
|
10.7
|
Loan Agreement dated December 23, 2010 between the Company and Bank of America, N.A. (Incorporated by reference to Exhibit 10.3 filed with our Current Report on Form 8-K filed on November 17, 2011).
|
|
|
10.8
|
Second Amendment to Loan Agreement Dated November 15, 2011 by and between the Company and Bank of America, N.A. (Incorporated by reference to Exhibit 10.5 filed with our Current Report on Form 8-K filed on November 17, 2011).
|
|
|
10.9
|
Third Amendment to Loan Agreement dated July 2, 2012 by and between the Company and Bank of America, N.A. (Incorporated by reference to Exhibit 10.1 filed with our Current Report on Form 8-K filed on July 3, 2012).
|
|
|
10.10
|
Fourth Amendment to Loan Agreement dated November 9, 2012 by and between the Company and Bank of America, N.A. (Incorporated by reference to Exhibit 10.3 filed with our Current Report on Form 8-K filed on November 9, 2012).
|
|
|
10.11
|
Reaffirmation and Second Amendment to Unlimited Guaranty Agreement dated November 9, 2012 by and between the Company and Bank of America, N.A. (Incorporated by reference to Exhibit 10.4 filed with our Current Report on Form 8-K filed on November 9, 2012).
|
|
69
|
10.12
|
Amended and Restated Revolving Note dated November 15, 2013 issued by the Company to Bank of America, N.A. (Incorporated by reference to Exhibit 10.5 filed with our Current Report on Form 8-K filed on November 18, 2013).
|
|
|
10.13
|
Twelfth Amendment to Loan Agreement dated November 15, 2013 by and between the Company and U.S. Bank National Association (Incorporated by reference to Exhibit 10.1 filed with our Current Report on Form 8-K filed on November 18, 2013).
|
|
|
10.14
|
Fifth Amendment to Loan Agreement dated November 15, 2013 by and between the Company and Bank of America, N.A. (Incorporated by reference to Exhibit 10.3 filed with our Current Report on Form 8-K filed on November 18, 2013).
|
|
|
10.15
|
Reaffirmation of and Third Amendment to Unlimited Guaranty Agreement dated November 15, 2013 by and between the Company and Bank of America, N.A. (Incorporated by reference to Exhibit 10.4 filed with our Current Report on Form 8-K filed on November 18, 2013).
|
|
|
21.1
|
Subsidiaries of the Company. (1)
|
|
|
23.1
|
Consent of Ernst & Young LLP. (1)
|
|
|
24
|
Power of Attorney. (1)
|
|
|
31.1
|
Certification of the Chief Executive Officer required by Rule 13a-14(a) or Rule 15d-14(a) under the Securities Exchange Act of 1934, as adopted pursuant to Section 302 of the Sarbanes-Oxley Act of 2002. (1)
|
|
|
31.2
|
Certification of the Chief Financial Officer required by Rule 13a-14(a) or Rule 15d-14(a) under the Securities Exchange Act of 1934, as adopted pursuant to Section 302 of the Sarbanes-Oxley Act of 2002. (1)
|
|
|
32.1
|
Certification of the Chief Executive Officer pursuant to Section 906 of the Sarbanes-Oxley Act of 2002 (18 U.S.C. Section 1350). (1)
|
|
|
32.2
|
Certification of the Chief Financial Officer pursuant to Section 906 of the Sarbanes-Oxley Act of 2002 (18 U.S.C. Section 1350). (1)
|
|
|
101
|
The following financial information from our Annual Report on Form 10-K for the fiscal year ended April 30, 2016, formatted in Extensible Business Reporting Language (XBRL): (i) the Consolidated Balance Sheets, (ii) the Consolidated Statements of Operations, (iii) the Consolidated Statements of Comprehensive Income, (iv) the Consolidated Statements of Shareholders' Equity, (v) the Consolidated Statements of Cash Flows, (vi) Notes to Consolidated Financial Statements, and (vii) document and entity information. (1)
|
|
|
|
(1)
|
Filed herewith electronically.
|
|
*
|
Indicates a management contract or compensatory plan or arrangement.
|
|
70
TABLE OF CONTENTS
Part IItem 1. BusinessNote 2. Segment ReportingNote 4. Business CombinationsItem 1A. Risk FactorsNote 17. Commitments and ContingenciesNote 6. Long-lived AssetsNote 10. Financing AgreementsItem 1B. Unresolved Staff CommentsItem 2. PropertiesItem 3. Legal ProceedingsItem 4. Mine Safety DisclosuresPart IIItem 5. Market For Registrant S Common Equity, Related Stockholder Matters and Issuer Purchases Of Equity SecuritiesItem 6. Selected Financial Data (in Thousands, Except Per Share Data)Item 6. Selected Financial DataItem 7. Management S Discussion and Analysis Of Financial Condition and Results Of OperationsNote 1. Nature Of Business and Summary Of Critical Accounting PoliciesNote 13. Income TaxesNote 14. Cash Flow InformationItem 7A. Quantitative and Qualitative Disclosures About Market RiskNote 16. Derivative Financial InstrumentsItem 8. Financial Statements and Supplementary DataNote 11. Shareholders Equity and Share-based CompensationNote 3. Marketable SecuritiesNote 5. Sale Of Theatre Rigging DivisionNote 7. Selected Financial Statement DataNote 8. Uncompleted ContractsNote 9. ReceivablesNote 12. Employee Benefit PlansNote 15. Fair Value MeasurementNote 18. Subsequent EventsNote 19. Quarterly Financial Data (unaudited)Item 9. Changes in and Disagreements with Accountants on Accounting and Financial DisclosureItem 9A. Controls and ProceduresItem 9B. Other InformationPart IIIItem 10. Directors, Executive Officers and Corporate GovernanceItem 11. Executive CompensationItem 12. Security Ownership Of Certain Beneficial Owners and Management and Related Stockholder MattersItem 13. Certain Relationships and Related Transactions and Director IndependenceItem 14. Principal Accountant Fees and ServicesPart IVItem 15. Exhibits and Financial Statement Schedules