DAKTRONICS INC /SD/
10-Ks and 10-Qs
|
|
|
|
|
|
|
|
|
|
|
|
|
|
|
|
|
|
|
|
|
|
|
|
|
|
|
|
|
|
|
|
|
|
|
|
|
|
|
|
|
|
|
|
|
|
|
|
|
|
|
|
|
|
|
|
|
|
|
|
|
|
|
|
|
|
|
|
UNITED STATES
SECURITIES AND EXCHANGE COMMISSION
Washington, D.C. 20549
FORM 10-K
x
ANNUAL REPORT PURSUANT TO SECTION 13 OR 15(d) OF THE SECURITIES EXCHANGE ACT OF 1934
For the Fiscal Year Ended
May 2, 2020
OR
o
TRANSITION REPORT PURSUANT TO SECTION 13 OR 15(d) OF THE SECURITIES EXCHANGE ACT OF 1934
For the Transition Period From ___ to ___.
Commission File Number: 0-23246

Daktronics, Inc.
(Exact Name of Registrant as Specified in Its Charter)
|
South Dakota
|
|
46-0306862
|
|
(State or Other Jurisdiction of
Incorporation or Organization)
|
(I.R.S. Employer Identification No.)
|
|
|
|
|
|
|
201 Daktronics Drive
Brookings, SD
|
|
57006 |
|
(Address of Principal Executive Offices)
|
|
(Zip Code)
|
(605) 692-0200
(Registrant’s telephone number, including area code)
Securities registered pursuant to Section 12(b) of the Act:
|
Title of each class
|
Trading Symbol(s)
|
Name of each exchange on which registered
|
|
Common Stock, No Par Value
|
DAKT
|
Nasdaq Global Select Market
|
|
Preferred Stock Purchase Rights
|
DAKT
|
Nasdaq Global Select Market
|
Securities registered pursuant to Section 12(g) of the Act: None
Indicate by check mark if the registrant is a well-known seasoned issuer, as defined in Rule 405 of the Securities Act. Yes
o
No
x
Indicate by check mark if the registrant is not required to file reports pursuant to Section 13 or Section 15(d) of the Act. Yes
o
No
x
Indicate by check mark whether the registrant (1) has filed all reports required to be filed by Section 13 or 15(d) of the Securities Exchange Act of 1934 during the preceding 12 months (or for such shorter period that the registrant was required to file such reports), and (2) has been subject to such filing requirements for the past 90 days. Yes
x
No
o
Indicate by check mark whether the registrant has submitted electronically every Interactive Data File required to be submitted pursuant to Rule 405 of Regulation S-T (§ 232.405 of this chapter) during the preceding 12 months (or for such shorter period that the registrant was required to submit such files). Yes
x
No
o
Indicate by check mark whether the registrant is a large accelerated filer, an accelerated filer, a non-accelerated filer, a smaller reporting company, or an emerging growth company. See the definitions of “large accelerated filer,” “accelerated filer,” “smaller reporting company,” and "emerging growth company" in Rule 12b-2 of the Exchange Act.
|
Large accelerated filer
o
|
Accelerated filer
x
|
|
Non-accelerated filer
o
|
Smaller reporting company
o
|
|
Emerging growth company
o
|
|
If an emerging growth company, indicate by check mark if the registrant has elected not to use the extended transition period for complying with any new or revised financial accounting standards provided pursuant to Section 13(a) of the Exchange Act.
o
Indicate by check mark whether the registrant is a shell company (as defined in Rule 12b-2 of the Exchange Act). Yes
o
No
x
The aggregate market value of the registrant's common stock held by non-affiliates at
November 2, 2019
(which is the last business day of the Registrant’s most recently completed second quarter), computed by reference to the closing sales price of the Registrant’s common stock on The Nasdaq Global Select Market on such date, was approximately
$309,995,906
. For purposes of determining this number, individual shareholders holding more than 10 percent of the Registrant’s outstanding Common Stock are considered affiliates. This number is provided only for the purpose of this Annual Report on Form 10-K and does not represent an admission by either the Registrant or any such person as to the status of such person.
The number of shares of the Registrant’s Common Stock outstanding as of
June 8, 2020
was
44,569,143
.
DOCUMENTS INCORPORATED BY REFERENCE
Portions of the Registrant’s Proxy Statement for its Annual Meeting of Shareholders to be held
September 2, 2020
are incorporated by reference in Part III of the Form 10-K, as indicated in Items 10 through 14 of Part III.
DAKTRONICS, INC. AND SUBSIDIARIES
FORM 10-K
FOR THE FISCAL YEAR ENDED
MAY 2, 2020
Table of Contents
|
|
Page
|
||
|
|
|||
|
|
|||
|
|
|||
|
|
|||
|
|
|||
|
|
|||
SPECIAL NOTE REGARDING FORWARD–LOOKING STATEMENTS
This Annual Report on Form 10-K (including exhibits and any information incorporated by reference herein) (the "Form 10-K" or the "Report") contains both historical and forward-looking statements that involve risks, uncertainties and assumptions. The statements contained in this Report that are not purely historical are forward-looking statements within the meaning of Section 27A of the Securities Act of 1933, as amended, and Section 21B of the Securities Exchange Act of 1934, as amended, including statements regarding our expectations, beliefs, intentions and strategies for the future. These statements appear in a number of places in this Report and include all statements that are not historical statements of fact regarding the intent, belief or current expectations with respect to, among other things: (i.) our competition; (ii.) our financing plans and ability to maintain adequate liquidity; (iii.) trends affecting our financial condition or results of operations; (iv.) our growth and operating strategies; (v.) the declaration and payment of dividends; (vi.) the timing and magnitude of future contracts; (vii.) raw material shortages and lead times; (viii.) fluctuations in margins; (ix.) the seasonality of our business; (x.) the introduction of new products and technology; (xi.) the amount and frequency of warranty claims; (xii.) our ability to manage the impact that new or adjusted tariffs may have on the cost of raw materials and components and our ability to sell product internationally; (xiii.) the resolution of litigation contingencies; (xiv.) the timing and magnitude of any acquisitions or dispositions; (xv.) the impact of governmental laws, regulations, and orders, including as a result of the COVID-19 pandemic caused by the coronavirus; and (xvi) disruptions to our business caused by geopolitical events, military actions, work stoppages, natural disasters, or international health emergencies, such as the COVID-19 pandemic. The words “may,” “would,” “could,” “should,” “will,” “expect,” “estimate,” “anticipate,” “believe,” “intend,” “plan” and similar expressions and variations thereof are intended to identify forward-looking statements. Investors are cautioned that any such forward-looking statements are not guarantees of future performance and involve risks and uncertainties, many of which are beyond our ability to control, and that actual results may differ materially from those projected in the forward-looking statements as a result of various factors discussed herein, including those discussed in the section of this Form 10-K entitled “Part I, Item 1A. Risk Factors” and “Part II, Item 7. Management’s Discussion and Analysis of Financial Condition and Results of Operations,” and those factors discussed in detail in our other filings with the Securities and Exchange Commission.
PART I.
Item 1. BUSINESS
Business Overview
Daktronics, Inc. and its subsidiaries (the “Company”, “Daktronics”, “we”, “our”, or “us”) are the world's industry leader in designing and manufacturing electronic scoreboards, programmable display systems and large screen video displays for sporting, commercial and transportation applications. We serve our customers by providing the highest quality standard display products as well as custom-designed and integrated systems. We offer a complete line of products, from small scoreboards and electronic displays to large multimillion-dollar video display systems as well as related control, timing, and sound systems. We are recognized as a technical leader with the capabilities to design, market, manufacture, install and service complete integrated systems displaying real-time data, graphics, animation and video. We engage in a full range of activities: marketing and sales, engineering and product design and development, manufacturing, technical contracting, professional services and customer service and support.
We were founded in 1968 by Drs. Aelred Kurtenbach and Duane Sander, professors of electrical engineering at South Dakota State University in Brookings, South Dakota. The Company began with the design and manufacture of electronic voting systems for state legislatures. In 1971, Daktronics developed the patented Matside® wrestling scoreboard, the first product in the Company's growing and evolving line. In 1994, Daktronics became a publicly traded company and invested in display technologies and new markets. We have continued these investments and have supported our long-term customer relationships to grow from a small company operating out of a garage to the world leader in the display industry. We currently employ
2,671
people globally. We are headquartered at 201 Daktronics Dr., Brookings, SD 57006 telephone 605-692-4200. Our Internet address is https://
www.daktronics.com.
Our annual, quarterly and current reports and any amendments to those reports are freely available in the "Investor Relations" section of our website. We post each of these documents on our website as soon as reasonably practicable after it is electronically filed with the Securities and Exchange Commission (the "SEC"). These reports and other reports, proxy, and electronic filings are also found on the SEC’s website at www.sec.gov. Information contained on our website is not deemed to be incorporated by reference into this Report or filed with the SEC.
We have organized our business into five segments: Commercial, Live Events, High School Park and Recreation, Transportation, and International. These segments are based on the customer type or geography and are the same as our business units. Financial information concerning these segments is set forth in this Form 10-K in "Part II, Item 7. Management’s Discussion and Analysis of Financial Condition and Results of Operations" and "
Note 3. Segment Reporting
" of the Notes to our Consolidated Financial Statements included in this Form 10-K.
Industry Background
1
Over the years, our products have evolved significantly from scoreboards and matrix displays with related software applications to complex, integrated visual display systems which include full color video with text and graphics displays located on a local or remote network that are tied together through sophisticated control systems. In the mid-1990's, as light emitting diodes (“LEDs”) became available in red, blue and green colors with outdoor brightness, we pioneered the development of full color LED video displays capable of replicating trillions of colors, thereby producing large format video systems with excellent color, brightness, energy efficiency and lifetime. Due to our foundation of developing scoring and graphics display systems, we were able to add video capabilities so we could meet all our customers' large format display needs in a complete, integrated system. This has proven to be a key factor in Daktronics becoming a leader in large electronic displays. LED technologies continue to evolve and advance, creating new high-resolution and micro-LED display options of all shapes and sizes. Today, the industry continues development in both the construct of the micro-LED and production methods of micro-LED display panels using mass-transfer technology.
Integrated visual display systems are increasingly used across a variety of vertical markets including: media/advertising, stadiums/venues, hospitality/leisure, transportation, broadcast, control room, corporate and education, and retail. Generally, these vertical markets use systems to collaboratively communicate, inform, entertain, and advertise to various sized audiences. Advances in technologies and the decrease in costs of systems have opened up and increased the market's size.
Description of Business
We are engaged in a full range of activities: marketing and sales, engineering and product design and development, manufacturing, technical contracting, professional services and customer service and support. Each of those activities is described below:
Marketing and Sales.
Our sales force is comprised of direct sales staff and resellers located throughout the world supporting all customer types in both sales and service. We primarily use a direct sales force for large integrated display system sales in professional sports, colleges and universities, and commercial spectacular projects. We also use our direct sales force to sell third-party advertising and transportation applications. We utilize resellers outside North America for large integrated system sales where we do not have a direct sales presence. The majority of our products sold by resellers in North America are standard catalog products. We support our resellers through direct mail/email advertising, social media campaigns, trade journal advertising, product and installation training, trade show exhibitions and accessibility to our regional sales or service teams and demonstration equipment.
Engineering and Product Design and Development.
The large format electronic display industry is characterized by ongoing product innovations and developments in technology and complementary services. To remain competitive, we have a tradition of applying engineering resources throughout our business to anticipate and respond rapidly to the system needs in the marketplace. We employ engineers and technicians in the areas of mechanical and electrical design; applications engineering; software design; quality design; and customer and product support. Product managers assigned to each product family assist our sales staff in training and implementing product improvements which ensures each product is designed for maximum reliability and serviceability. We employ process engineers to assist in quality and reliability processing in our product design testing and manufacturing areas.
Manufacturing.
The majority of our products are manufactured in the United States, specifically in South Dakota and Minnesota. We also have manufacturing facilities in China and Ireland. We perform component manufacturing, system manufacturing (metal fabrication, electronic assembly, sub-assembly and final assembly) and testing in-house for most of our products to control quality, improve response time and maximize cost-effectiveness. Our manufacturing facilities are somewhat aligned with our business segments' sales, marketing, and product design and development areas to accelerate technology improvements and improve our cost structure. Given the cyclical nature of some parts of our business and dispersed sales geography, we balance and maintain our ability to manufacture the same products across our plants so we can efficiently utilize our capacity and reduce costs. A key strategy of ours is to increase standardization and commonality of parts and manufacturing processes across product lines through use of product platforms to increase efficiencies. Other strategies include supplier management programs and lean manufacturing techniques. For more details on our facilities, see "Part II, Item 2. Properties".
Technical Contracting.
We serve as a technical contractor for larger display system installations requiring custom designs and innovative product solutions. The purchase of display systems typically involves competitive proposals. As part of our response to a proposal request, we may suggest additional products or features to assist the prospective customer in analyzing the optimal type of display system. We usually include site preparation and installation services related to the display system in our proposal. In these cases, we serve as a contractor and may retain subcontractors for electrical, steel and installation labor. We have developed relationships with many subcontractors throughout the United States and the world, which is an advantage for us in bidding and delivering on these projects. We are licensed as a general contractor in many jurisdictions.
Professional Services.
To assist our clients' ability to engage, inform and entertain their audiences, we provide professional services including event support, content creation, product maintenance, marketing assistance, training on hardware and software, control room design, and continuing technical support training for operators.
2
Customer Service and Support.
We offer limited warranties on our products, ranging from one to 10 years, against failure due to defective parts or workmanship. In addition, we offer service agreements of various scopes. To serve our customers, we provide help-desk access, parts repair and replacement, display monitoring and on-site support. Our technical help desk has experienced technicians who are on-call 24 hours a day to support events and sites. Our field service personnel and third-party service partners are trained to provide on-site support. We use third-party service partners to allow us to respond to changes in volume of service during our seasonal peaks.
Products and Technologies
The two principal components of our systems are the display and the controller, which manages the operation of the display. We produce displays varying in complexity, size and resolution. The physical dimensions of a display depend on the size of the viewing area, the distance from the viewer to the display, and the amount and type of information to be displayed. The controller is comprised of computer hardware and software products designed to compile information provided by the operator and other integrated sources to display information, graphics or animation on the displays. We customize our products according to the design specifications of the customer and the conditions of the environment in which our products function.
Our products are comprised of the following product families, all of which include software and controller options:
•
Video displays
•
Scoreboards and timing systems
•
Message displays
•
ITS (intelligent transportation systems) dynamic message signs
•
Space availability displays
•
Sound systems
•
Out-of-Home advertising displays
•
Digit and price displays
•
Indoor dynamic messaging systems
Each of these product families is described below:
Video Displays.
These displays are comprised of a large number of full-color pixels capable of showing various levels of video, graphics and animation. These displays include red, green and blue LEDs arranged in various combinations to form pixels. The electronic circuitry, which controls the pixels, allows for variances in the relative brightness of each LED to provide a full color spectrum, thereby displaying video images in striking, vibrant colors. Variables in video displays include the spacing of the pixels (pixel pitch), the resolution of the displays (number of pixels), the brightness of the displays (nits), the number of discrete colors the display is able to produce (color depth), the viewing angles, and the LED mount technology .
We offer a broad range of indoor and outdoor LED video displays with these varying features. Examples of indoor offerings include centerhung displays, landmark displays, video walls, ribbon board displays, hanging banners, corporate office entrance displays, and video displays designed for retail stores, restaurants, malls, transportation hubs and other similar indoor facilities.
Video displays provide content to serve as a revenue generation source through advertising or as an information and communication medium (e.g. scoring, statistics, wayfinding, advertising, control center information), or to provide interior design elements to create luxurious space to feature digital art.
Our mobile and modular display systems are transportable and are comprised of lightweight individual LED video panels less than a square meter in size and are assembled together to form a display in a customizable size. These displays are used for both indoor and outdoor touring shows and for other live events.
Our display technology may be integrated with architectural mesh to deliver a dynamic communication medium that provides a semi-transparent viewing experience within a building. These displays can be mounted over a solid facade or in front of windows, resulting in a finished solution that is free from visible cabling and delivers a clean, semi-transparent view. These displays are less than one inch in depth and provide an elegant, refined structural appearance.
Our line of freeform LED displays is architectural lighting and display products. The ProPixel® freeform products use mountable LED elements to transform ordinary structures into stunning visual landmarks. A flexible mounting platform allows designers to transform any structure into a full-motion video display.
The control components for video displays in live event applications include our Show Control Software Suite, proprietary digital media players and video processors. These control components provide advanced capabilities for the display of live video and real-time content
3
on our displays. The Show Control Software Suite can operate entire networks of displays from a single, intuitive control interface. Its features allow users to instantly deliver media clips, camera feeds, and streaming information to any display in a network.
Scoreboards and Timing Systems.
Our line of scoreboards and timing products include indoor and outdoor scoreboards for many different sports, digit displays, scoring and timing controllers, statistics software and other related products. Indoor and outdoor systems range in complexity from small scoreboards to larger systems incorporating scoring, timing, video, message centers, advertising panels and control software.
We offer a variety of controllers complementing our scoreboards and displays. These controllers vary in complexity from the All Sport® 100, a handheld controller for portable scoreboards, to the All Sport® Pro, designed for more sophisticated scoring systems and allowing for more user-defined options.
We also offer timing systems for sports events, primarily aquatics and track competitions. A component of these systems is our OmniSport® 2000 timing console. The system has the capability to time and rank the competitors and to interface with event management software to facilitate the sporting event. Other timing system components include swimming touchpads, race start systems, and relay take-off platforms.
As a key component of an integrated system, we market sports statistics and results software under the DakStats® trademark. The software allows the entry and display of sports statistics and other information. It is one of the leading applications of its type in collegiate and high school sports.
Message Displays.
The Galaxy® product line is a family of full-matrix displays, available in both indoor and outdoor models and controlled with the Venus® Control Suite. Galaxy® displays are full color or monochrome with varying pixel spacing depending on color, size and viewing distance. Galaxy® displays can display text, graphics and animation, as well as prerecorded video clips. They are used primarily as message centers to convey information and advertising to consumers.
The Venus® Control Suite software is used to control the creation of messages and graphic sequences for uploading to the Galaxy® displays. This software is designed to be user friendly and applicable to all general advertising or message applications. It can be used to control a single message display or can scale up to provide a secure, cloud-based control center for large networks of message displays.
ITS Dynamic Message Signs ("DMS").
DMS products include a wide range of LED displays for road management, mass transit and aviation applications. The Vanguard® family of dynamic message displays is typically used to direct traffic and inform motorists. These displays are used over freeways, on arterial roads, near bridges, at toll booths and in other locations. We have also developed a control system for these displays to help transportation agencies manage large networks of displays.
Space Availability Displays.
This product line is our digit and directional displays, which are primarily marketed and sold for use in parking facilities. They include multi-line displays delivered in vertical cabinets or drop-in digit panels designed to be mounted in existing structures or signs.
Sound Systems.
Our sound systems include both standard and custom options. Standard systems are designed to meet the needs of a variety of indoor and outdoor sports venues based on the size and configuration of the facility. Custom indoor and outdoor systems are tailored for larger venues and venues with unique seating configurations and are often integrated into an overall venue solution for scoring, timing, message display and/or video capability. Our audio systems also complement our video display systems used in mall applications.
Out-of-Home Advertising Displays.
Our line of out-of-home advertising displays includes billboards and street furniture displays. Our line of digital billboards offers a unique display solution for the Out-of-Home (“OOH”) advertising industry. The products are used to display images which change at regular intervals. These systems include many features unique to the outdoor advertising market, such as our patented mounting system, self-adjusting brightness, improved energy consumption, and enhanced network security.
Our line of digital street furniture engages people with advertising content at eye level as they walk through campuses, cityscapes, and outlet malls. This design enhances the message and complements surrounding architecture. These street furniture displays are our most flexible solution for digital OOH campaigns.
Digit and Price Displays.
This product line includes our DataTime® and Fuelight™ displays. The DataTime® product line consists of outdoor time and temperature displays which use a remote sensor for temperature data. Fuelight™ digit displays are specifically designed for the petroleum industry, offering high visibility and quick fuel price updates using the Fuelink™ control software.
Indoor Dynamic Messaging Systems.
Our ADFLOW DMS
TM
systems include indoor networked solutions for retailers, convenience stores and other businesses. These solutions allow customers to broadcast advertising campaigns and other information through the software, media players and visual hardware.
4
Software and Controller Options.
The Venus® Control Suite, Show Control, Vanguard®, and other options offer easy control solutions to help customers manage content on their displays. Content includes media, scoring, timing, statistics, advertising, way-finding information, playback loops and entertainment type visualizations. Software and controller options are available in on-premise and hosted cloud-based configurations and are accessible by multiple devices.
Raw Materials
Materials used in the production of our video display systems are sourced from around the world. Examples of the materials we use in production include LEDs, integrated circuits, printed circuit boards, power supplies, plastics, aluminum, and steel. We source some of our materials from a single-source or a limited number of suppliers due to the proprietary nature of the materials. The loss of a key supplier, part unavailability, price changes or defects in the supplied material or component could have an adverse impact on our business and operations. Our sourcing group works to implement strategies to mitigate these risks. Periodically, we enter into pricing agreements or purchasing contracts under which we agree to purchase a minimum amount of product in exchange for guaranteed price terms over the length of the contract, which generally does not exceed one year.
During our fiscal year ended April 27, 2019, many electrical components were in high demand or market factors impacted their availability, both of which caused extended lead-times and price volatility and resulted in an additional cost of $3.8 million during fiscal 2019. Pricing returned to a more stable environment during fiscal 2020 for these materials. We also incurred $2.5 million and $4.9 million during fiscal 2019 and 2020, respectively, of tariff related expenses on imports of materials to the U.S. due to the U.S. administration's implementation of tariffs on aluminum, steel, and items made in China.
During fiscal 2020, the global COVID-19 reaction had a minimal impact in our ability to receive raw materials from suppliers. However, the time to obtain and shipping costs have been unpredictable.
Intellectual Property
We own or hold licenses to use numerous patents, copyrights, and trademarks on a global basis. Our policy is to protect our competitive position by filing U.S. and international patent applications to protect technology and improvements that we consider important to the development of our business. This will allow us to pursue infringement claims against competitors for protection due to patent violations. Although we own a number of patents and possess rights under others to which we attach importance, we do not believe that our business as a whole is materially dependent upon any such patents or rights. We also own a number of trademarks that we believe are important in connection with the identification of our products and associated goodwill with customers, but no part of our business materially depends on such trademarks. We also rely on nondisclosure agreements with our employees and agents to protect our intellectual property. Despite these intellectual property protections, there can be no assurance a competitor will not copy the functions or features of our products.
Seasonality
Our net sales and profitability historically have fluctuated due to the impact of uniquely configured orders, such as display systems for professional sports facilities, colleges and universities, and spectacular projects in the commercial area, as well as the seasonality of the sports market. Uniquely configured orders can include several displays, controllers, and subcontracted structure builds, each of which can occur on varied schedules per the customer's needs. Our third fiscal quarter sales and profit levels are lighter than other quarters due to the seasonality of our sports business, construction cycles, and the reduced number of production days due to holidays in the quarter.
Our gross margins tend to fluctuate more on uniquely configured orders than on limited configured orders. Uniquely configured orders involving competitive bidding and substantial subcontracting work for product installation generally have lower gross margins. Although we follow the over time method of recognizing revenues for uniquely configured orders, we nevertheless have experienced fluctuations in operating results and expect our future results of operations will be subject to similar fluctuations.
Because of the seasonality and volatility in business demand and variety of product types, we may not be able to utilize our capacity efficiently or accurately plan our capacity requirements, which may negatively affect our business and operating results.
Working Capital
For information regarding working capital items, see “Part II, Item 7. Management’s Discussion and Analysis of Financial Condition and Results of Operations-Liquidity and Capital Resources” in this Form 10-K.
Customers
5
We have a large and diverse worldwide customer base, ranging from local main street business owners and out-of-home companies to the owners and operators of premier professional sports arenas. Our customers are important to us, and we strive to serve them over the long-term to earn their future business. The loss of one or more customers could have an adverse effect on us. See "
Note 3. Segment Reporting
" of the Notes to our Consolidated Financial Statements included in this Form 10-K for our primary markets and customers of each business unit.
Backlog
Our remaining performance obligations ("backlog") consist of contractually binding sales agreements or purchase orders for integrated electronic display systems and related products and service. Orders are included in backlog when we are in receipt of an executed contract and any required deposits or security. As a result, certain orders for which we have received binding letters of intent or contracts will not be included in backlog until all required contractual documents and deposits are received. Backlog can fluctuate due to large order bookings and the timing and seasonality of net sales. Because order backlog fluctuates and may be subject to extended delivery schedules, orders may be canceled and have varied estimated profitability. Our backlog is not necessarily indicative of future net sales or net income. Backlog is not a measure defined by generally accepted accounting principles in the United States ("GAAP"), and our methodology for determining backlog may vary from the methodology used by other companies in determining their backlog amounts.
Our backlog as of
May 2, 2020
was
$268 million
as compared to
$257 million
as of
April 27, 2019
. We expect to fulfill the backlog as of
May 2, 2020
within the next 24 months. The timing of backlog may be impacted by project delays resulting from the coronavirus ("COVID-19") pandemic.
Government and Other Regulation
In the United States and other countries, various laws, regulations and ordinances related to our products and controllers restrict the installation of outdoor signs and displays, particularly in the commercial and transportation markets. These laws and regulations impose greater restrictions on electronic displays versus non-electronic displays due to alleged concerns over aesthetics or driver safety. Globally, our products are also subject to various regulations and standards including electromagnetic interference, electromagnetic compatibility, electrical safety, and flammability standards. We design and have our products tested for these regulations; however, these factors may prevent or inhibit us from selling products to some prospective customers in certain geographies.
Our manufacturing facilities and products comply with industry specific requirements, including environmental rules and regulations and safety standards. These requirements include quality, manufacturing process controls, manufacturing documentation, supplier certification of raw materials, and various safety tests. Our products and production processes require the storage, use and disposal of a variety of hazardous chemicals under applicable laws.
Our global supply chain and sales distribution channels subject us to various trade compliance regulations. These requirements can include certification of country of origin, classification within the various tariff codes and trade agreements, compliance with other specific product or country import/export regulations, and payment of certain import or export tariffs, duties, or taxes.
Our global operations subject us to various laws and regulations, including laws and regulations relating to tax compliance, anti-corruption, and data privacy. These requirements vary and can include things like records management, policy creation and maintenance, data protection programs, compliance filings, and continued training of employees.
We are subject to regulations restricting the movement and interaction of people and business operations. During unprecedented times, countries and the U.S. states and/or its localities can issue lock down orders impacting availability of employees, third parties, suppliers, customers, and other services we need to operate our business.
During the fourth quarter of fiscal 2020, to comply with various governmental stay-at-home regulations, we experienced impacts in our ability to complete installations on-site in various jurisdictions, had some closures in our facilities to keep people safe, and had some slowdown in material receipts from our suppliers due to the impact of work restrictions resulting from COVID-19.
We believe we are in material compliance with these requirements.
Competition
We encounter a wide variety of competitors that vary by product, geographic area, and business unit. Our competitors include both United States and foreign companies and range in size and product offerings. Our competitors may develop lower-cost or lower-featured products, may be willing to charge lower prices to increase their market share, or include different service and controller offerings. Some competitors have more capital, governmental funding, supply change access, and other resources, which may allow them to take advantage of acquisition opportunities or adapt more quickly to changes in customer requirements. Other competitors use sponsorships as a way to
6
win business at a particular location or market. In addition, our products compete with other forms of advertising, such as television, print media and fixed display signs.
We believe that our ability to compete depends upon customer centric product and service quality and features, technical expertise, service breadth, and cost-effective solutions.
Research and Development
Our engineering, process design, and product and service design and development capabilities and experience are very important factors in continuing to develop, produce, and offer the most up-to-date digital displays and control system solutions desired by the market.
Over the past years, we have invested in our development to increase our differentiated product platforms, advance our software architecture and offerings, support customer requirements, and advance new competitive narrow pixel and micro-electronic technologies.
Product design and development investments in the near term are focused on developing or improving our video technology over a wide range of pixel pitches for both indoor and outdoor applications. These new or improved technologies are focused on varied pixel density for image quality and use, expanded product line offerings for our various markets and geographies, improved quality and reliability, and improved cost points.
Employees
As of
May 2, 2020
, we employed approximately
2,395
full-time employees and
276
part-time and temporary employees. Of these employees, approximately
887
were in manufacturing,
556
were in sales and marketing,
535
were in customer service,
442
were in engineering and
251
were in general and administrative. None of our employees are represented by a collective bargaining agreement. We believe employee relations are good.
Item 1A. RISK FACTORS
The factors that are discussed below, as well as the matters that are generally set forth in this Form 10-K and the documents incorporated by reference herein, could materially and adversely affect the Company’s business, results of operations and financial condition.
Pandemics, including the coronavirus ("COVID-19") pandemic, could have a material adverse effect on our operations, liquidity, financial condition, and financial results.
The ramifications of the COVID-19 outbreak reported to have started in December 2019 and spread globally are filled with uncertainty and changing quickly. In March 2020, the World Health Organization declared COVID-19 a pandemic. A serious global pandemic, like COVID-19, can adversely impact, shock and weaken the global economy. These impacts can amplify other risk factors and could have a material impact on our operations, liquidity, financial conditions, and financial results.
COVID-19 pandemic-related risks impacting our business may include increased exposure to: global regulatory, geopolitical, and societal changes; rapid degradation of global economic conditions, creating an increase in the volatility and the timing and level of orders; supply chain disruptions, material shortages, and increases in the costs of components; changes in labor force availability, which could reduce our ability to operate across our business in development, sales and marketing, production, installation, and ongoing service and support; an increased risk of being subject to contract performance claims if we are unable to deliver according to the terms of our contracts or commitments and cannot claim force majeure to mitigate or eliminate our exposure to such claims; increased geographic work restrictions that could impact our ability to market, sell, manufacture and/or install our products; an increase in our exposure to claims or litigation relating to the pandemic; limitations on our ability to meet the terms of our bank credit agreements that causes restrictions on our ability to access the liquidity under such agreements; reduced access to and an increase in the cost of capital; reduced access to surety bonds or bank guarantees to secure customer orders; volatility and changes in foreign currency rates; delayed timing of collections and/or decreased collectability of receivables and contract assets; and a material reduction to the values of our assets including, but not limited to, inventory, investments in affiliates, deferred tax assets, goodwill, intangibles, and property and equipment.
We expect the COVID-19 global pandemic to have an impact on our results of operations, liquidity, and financial position, the size and duration of which we are currently unable to predict. The global outbreak of COVID-19 and its effects continue to rapidly evolve. The extent to which COVID-19 will impact our business will depend on future developments, which are highly uncertain and cannot be predicted with confidence, such as the ultimate severity and spread of the disease, the duration of the outbreak, travel restrictions and social distancing requirements in the United States and other countries, economic recovery, and any change in trends on how people gather. To the extent that our customers and suppliers are adversely impacted by the COVID-19 outbreak, this could reduce the availability, or result in delays, of materials or supplies, or delays in customer payments and orders, which in turn could materially interrupt our business operations and/or impact our liquidity. Site closures or project delays have occurred and increased social distancing and health-
7
related precautions are required in our factories and many work sites, which may cause additional project delays and additional costs to be incurred. COVID-19 could disrupt our operations due to absenteeism by infected or ill employees or other employees who elect not to come to work due to the illness or due to quarantines.
We operate in highly competitive markets and face significant competition and pricing pressure. If we are unable to keep up with the rapidly changing product developments or to compete effectively, we could lose market share as well as limited and uniquely configured orders, which could negatively impact our results of operations.
The electronic display industry is characterized by ongoing product improvement, innovations and development. We compete against products produced in foreign countries and the United States. Our competitors may develop lower-cost or lower-featured products, may be willing to charge lower prices to increase their market share, or include different service and controller offerings. Some competitors have more capital and other resources, which may allow them to take advantage of acquisition opportunities or adapt more quickly to changes in customer requirements. Other competitors use sponsorships as a way to win business at a particular location or market. In addition, our products compete with other forms of advertising, such as television, print media and fixed display signs. To remain competitive, we must anticipate and respond quickly to our customers’ needs, enhance our existing products, introduce new products and features, and continue to price our products competitively.
Our results of operations on a quarterly and annual basis have and are likely to fluctuate and be substantially affected by the size and timing of large contract order awards.
Customer demand and the timing and size of large contracts create volatility in supply chain planning and capacity requirements to fulfill orders. Awards of large contracts and their timing and amounts are difficult to predict, may not be repeatable, and are outside of our control. Market demand has not always developed as expected or remained at a consistent level. Adjusting supply chain material planning and production and services capacity to meet this varied demand can increase costs. Large contracts or customer awards include projects for college and professional sports facilities markets, the OOH niche, the transportation market, and the large spectacular niche. These projects can have short delivery time frames. Some factors that may cause our operating results to vary due to timing and size of the awards include:
|
•
|
the timing of orders and related deliveries, including delays or cancellations of orders;
|
|
•
|
our ability to obtain raw materials and components timely and at reasonable prices;
|
|
•
|
our ability to adjust and utilize production and services capacity;
|
|
•
|
our ability to engage third parties to support production and fulfillment;
|
|
•
|
new product introductions;
|
|
•
|
variations in product mix; and
|
|
•
|
customer financial wherewithal and the related economic conditions impacting their business.
|
Operating results in one or more quarters or a fiscal year may not be indicative of future operating results.
Our actual results could differ from the estimates and assumptions we make to prepare our financial statements, which could have a material impact on our financial condition and results of operations.
In connection with the preparation of our financial statements, including the Consolidated Financial Statements included in this Form 10-K, our management is required under GAAP to make estimates and assumptions based on historical experience and other factors. Our most critical accounting estimates are described in "Part II, Item 7. Management's Discussion and Analysis of Financial Condition and Results of Operations" in this Form 10-K.
These estimates and assumptions affect the timing of net sales, costs, and profits or losses in applying the principles to contracts with customers under the cost incurred input method; credit losses for accounts receivables and contract assets, the valuation of inventory, estimated amounts for warranty costs; the calculation and valuation of our investments and deferred tax assets; fair value estimates used in goodwill and long-term assets testing; and estimating the impact of uncertainties in the application of complex tax laws. Although we believe these estimates and assumptions are reasonable under the circumstances, they are subject to significant uncertainties, some of which are beyond our control. If management's estimates and assumptions change or are not correct, our financial condition or results of operation could be adversely affected.
In March 2020, we began to see impacts from the COVID-19 pandemic that could have a negative impact on our forecasted revenue and profitability. This, along with the decline in our stock price and other market conditions, led us to perform an interim qualitative goodwill impairment analysis. After evaluating our results, events and circumstances, we determined that a quantitative or step 1 analysis was necessary for our International business unit. The results of that analysis indicated no goodwill impairment was necessary.
8
The potential impact of COVID-19 on our customers' business could adversely impact our customers' ability to pay us for work performed and increase our future estimate of credit losses.
Unanticipated warranty and other costs for defective products could adversely affect our financial condition, results of operations and reputation.
We provide warranties on our products with terms varying from one to 10 years. In addition, we offer extended warranties. These warranties require us to repair or replace faulty products and meet certain performance standards, among other customary warranty provisions. Although we continually monitor our warranty claims and accrue a liability for estimated warranty costs, unanticipated claims could have a material adverse impact on our financial results. In some cases, we may be able to subrogate a claim back to a subcontractor or supplier if the subcontractor or supplier supplied the defective product or performed the service, but this may not always be possible. In addition, the need to repair or replace products with design and manufacturing defects could adversely affect our reputation. Remediation of a claim may take time and could result in lost or deferred revenue, lead to costly warranty expenses, and have a material adverse impact on our financial condition and operating results.
During fiscal 2016, we discovered a warranty issue caused by a mechanical device failure within a module for displays primarily in our OOH application built prior to fiscal 2013. During our fiscal years
2020
,
2019
, and
2018
, we recognized warranty expense and estimated equipment service agreement losses for probable and reasonably estimated costs to remediate this issue of $0.0 million, $2.4 million, and $4.5 million, respectively. Our contractual warranty arrangements have expired for products with this issue, and we do not expect material changes to the equipment service agreement accrual. The additional warranty expense in fiscal 2018 is primarily based on our decision to preserve our market leadership and for customer relationship purposes in certain cases beyond our contractual obligations. See "
Note 19. Commitments and Contingencies
" of the Notes to our Consolidated Financial Statements included in this Form 10-K for more information regarding our warranty accrual.
We enter into fixed-price contracts, which could reduce our profits if actual costs exceed estimated costs.
Because of the complexity of many of our client contracts, accurately estimating the cost, scope and duration of a particular contract can be a difficult task. Unanticipated costs that exceed our original estimates may not be recoverable under fixed price contracts. Unanticipated cost increases may occur as a result of several factors including, but not limited to: increases in the cost, shortages or non-availability of materials or labor; unanticipated technical problems; required project modifications not initiated by the customer; suppliers’ or subcontractors’ failure to perform or delay in performing their obligations; logistics disruptions or delays; and capacity constraints. In addition to increased costs, these factors could delay delivery of products, which may result in the assessment of liquidated damages or other contractual damages which would negatively impact our profits.
COVID-19 or similar pandemics can create site closures or project delays. Restrictions including social distancing and health-related precautions are required in our factories and many work sites, which may cause additional project delays and additional costs to be incurred. COVID-19 could disrupt our operations due to absenteeism by infected or ill employees or other employees who elect not to come to work due to the illness or due to quarantines.
Backlog may not be indicative of future revenue or profitability.
Many of our products have long sales, delivery and acceptance cycles. In addition, our backlog is subject to order cancellations and delays. Orders normally contain cancellation provisions to permit our recovery of costs expended as well as a pro-rata portion of the profit. If projects are delayed, revenue recognition can occur over longer periods of time, and projects may remain in backlog for extended periods of time. If we receive relatively large orders in any given quarter, fluctuations in the levels of the quarterly backlog can result because the backlog may reach levels which may not be sustained in subsequent quarters.
The timing of backlog may be impacted by project delays resulting from the COVID-19 pandemic.
We depend on a single-source or a limited number of suppliers for our raw materials and components from countries around the world. The loss, interruption, or material change in our business relationships with our suppliers could cause a disruption in supply and a substantial increase in the costs of such materials. Such changes could cause harm to our sales, financial condition, and results of operations.
Our suppliers are subject to the fluctuations in global economic cycles and conditions and other business risk factors which may impact their ability to operate their businesses. The performance and financial condition of a supplier may cause us to alter our business terms, cease doing business with a particular supplier, or change our sourcing practices. Further, the potential impact of COVID-19 could adversely impact our suppliers and supply chains and result in our inability to obtain needed materials in a timely manner.
9
An interruption from our suppliers of raw materials or components could affect our ability to manufacture our products until a new source of supply is located and, therefore, could have a material adverse effect on our business, financial condition or results of operations. Although we believe our supply of raw materials and components is adequate for the needs of our business, we cannot assure that new sources of supply will be available if needed.
If we fail to timely and effectively obtain shipments of raw materials and components from our suppliers or to send shipments of our manufactured product to our customers, our business and operating results could be adversely affected.
We cannot control all the various factors that might affect our suppliers' timely and effective delivery of raw materials and components to our manufacturing facilities or the availability of freight capacity for us to deliver products to our customers.
Our utilization of a complex supply chain for raw material and component imports and the global distribution of our products makes us vulnerable to many risks, including, among other things, risks of damage, destruction or confiscation of products while in transit to and from our manufacturing facilities; organized labor strikes and work stoppages, such as labor disputes or COVID-19 health regulations or related employee worker unavailability, that could disrupt operations at ports-of-entry; transportation and other delays in shipments, as a result of heightened security screening and inspection processes or other port-of-entry limitations or restrictions; unexpected or significant port congestion; lack of freight availability; and freight cost increases. In addition, we may be required to arrange for products to be delivered through airfreight, which is significantly more expensive than standard shipping by sea. We may not be able to obtain sufficient freight capacity on a timely basis or at favorable shipping rates and, therefore, may not be able to timely receive shipments of raw materials and components or deliver products to customers.
Price fluctuations in, and shortages of, raw materials, components, and related transportation costs and tariffs can have a significant impact on our price competitiveness and/or ability to produce our products which could cause harm to our sales, financial condition and results of operations.
Price fluctuations and shortages of any raw materials and components used to manufacture our products can occur due to various factors (such as worldwide demand, natural disasters, logistic disruptions, and trade regulations). Electronic components used in our products are sometimes in short supply, which may impact our ability to meet customer demand. Transportation costs and availability can fluctuate due to fluctuations in oil prices and other social and economic factors. If we experience shortages or increases in the price of raw materials and components and are unable to pass on those increases to our customers or are unable to manufacture our products, it could negatively affect our business, financial condition or results of operations. In addition to increased costs, these factors could delay delivery of products, which may result in the assessment of liquidated damages or other contractual damages that could negatively impact our profits.
As a result of U.S. Administrative trade actions in 2019 and 2020, we experienced volatility in supply and increases in the prices of aluminum, electrical, and other components we use in our production. Further trade disputes could make us subject to additional regulatory costs and challenges, affect global economic and market conditions, and contribute to volatility in foreign exchange markets, which we may be unable to effectively manage through our foreign exchange risk management program. We continue to monitor the situation and evaluate ways to minimize these impacts through vendor negotiations, alternative sources, and potential price adjustments. We estimate our financial results were adversely impacted by approximately $6.3 million of additional costs for price changes and tariffs in fiscal 2019 and $4.9 million of additional costs for tariffs in fiscal 2020.
During fiscal 2019, many electrical components were in high demand or market factors impacted availability, both of which caused extended lead-times and price volatility, resulting in an estimated additional cost of $3.8 million during fiscal 2019. Pricing returned to a more stable environment during fiscal 2020 for these materials.
We may depend on third parties to complete our contracts.
Depending on a contract's scope of work, we may hire third-party subcontractors to perform on-site installation and service-related activities, hire manufacturers of structures or elements of structures related to on-site installation, hire contract manufacturers for certain product lines, or purchase specialty non-display related system elements from other companies. If we are unable to hire qualified subcontractors, find qualified manufacturers for on-site elements, find qualified contract manufacturers, or purchase specialty non-display system elements, our ability to successfully complete a project could be impaired. If we are not able to locate qualified third-party subcontractors or manufacturers, the amount we are required to pay may exceed what we have estimated, and we may suffer losses on these contracts. If the subcontractor or manufacturer fails to perform, we may be required to source these services to other third parties on a delayed basis or on less favorable terms, which could impact contract profitability. There is a risk that we may have disputes with our subcontractors relating to, among other things, the quality and timeliness of work performed, customer concerns about the subcontractor, or faulty workmanship resulting in claims against us for failure to meet required project specifications and negatively impacting our financial condition and results of operations.
10
These third parties are subject to fluctuations in global economic cycles and conditions and other business risk factors which may adversely impact their ability to operate their businesses. The performance and financial condition of the third parties may cause us to alter our business terms or to cease doing business with a particular third party or change our sourcing practices. Further, the potential impact of COVID-19 could adversely impact our third parties and result in our inability to obtain needed subcontracted services.
Unanticipated events resulting in credit losses could have a material adverse impact on our financial results.
Significant portions of our sales are to customers who place large orders for custom products. We closely monitor the creditworthiness of our customers and have not, to date, experienced significant credit losses. We mitigate our exposure to credit risk, to some extent, by requiring deposits, payments prior to shipment, progress payments and letters of credit. However, because some of our exposure to credit losses is outside of our control, unanticipated events resulting in credit losses could have a material adverse impact on our operating results. For example, the potential negative impact of COVID-19 on businesses of the third parties with which we do business could adversely impact our customers' ability to pay us for work performed and increase our future estimate of credit losses.
We may not be able to utilize our capacity efficiently or accurately plan our capacity requirements, which may negatively affect our business and operating results.
We increase our production and services capacity and the overhead supporting order fulfillment based on anticipated market demand. Market demand, however, has not always developed as expected or remained at a consistent level. This underutilization risk can potentially decrease our profitability and result in the impairment of certain assets.
The following factors are among those that could complicate capacity planning for market demand:
|
•
|
changes in the demand for and mix of products that our customers buy;
|
|
•
|
our ability to add and train our manufacturing staff in advance of demand;
|
|
•
|
the market’s pace of technological change;
|
|
•
|
variability in our manufacturing or services productivity;
|
|
•
|
long lead times for components used in production;
|
|
•
|
our ability to engage third parties;
|
|
•
|
geography of the order and related shipping methods; and
|
|
•
|
long lead times for our plant and equipment expenditures.
|
The terms and conditions of our credit facilities impose restrictions on our operations, and if we default on our credit facilities, it could have a material adverse effect on our results of operations and financial condition and make us vulnerable to adverse economic or industry conditions and cause liquidity issues.
The terms and conditions of our credit facilities impose restrictions limiting our ability to incur debt, contingent liabilities, lease obligations or liens; make a substantial change of ownership; or acquire or purchase a business or its assets. Our credit facilities also impose certain financial covenants on us which restrict the level of cash dividends and capital expenditures. A breach of any of these covenants could result in an event of default under our credit facilities. Upon the occurrence of an event of default, the lender could elect to declare any and all amounts outstanding under such facility to be immediately due and payable and terminate all commitments to extend further credit. For additional information on financing agreements, see "
Note 10. Financing Agreements
" of the Notes to our Consolidated Financial Statements included in this Form 10-K.
For the foreseeable future, it is anticipated that our cash on hand, marketable securities, cash provided by operating activities, and borrowings under our existing credit facilities should provide sufficient funds to finance our capital expenditures and working capital needs and otherwise meet operating expenses and debt service requirements. However, if additional capital is required or we are unable to renew our existing credit facilities, there can be no assurance we will be able to obtain such capital when needed or on satisfactory terms. Also, market conditions can negatively impact our customers' ability to fund their projects and can impact our vendors, suppliers, and subcontractors and may not allow them to meet their obligations to us.
The transition away from LIBOR may adversely affect our cost to obtain financing.
Central banks around the world, including the Board of Governors of the Federal Reserve, have commissioned working groups of market participants and official sector representatives with the goal of finding suitable replacements for the London Interbank Offered Rate (“LIBOR”) based on observable market transactions. It is expected that a transition away from the widespread use of LIBOR to alternative rates will occur over the course of the next few years. The U.K. Financial Conduct Authority, which regulates LIBOR, has announced that it has commitments from panel banks to continue to contribute to LIBOR through the end of 2021, but that it will not use its powers to compel contributions beyond such date. Accordingly, there is considerable uncertainty regarding the publication of such rates beyond 2021. The Federal Reserve Bank of New York and various other authorities have commenced the publication of reforms and actions
11
relating to alternatives to U.S. dollar LIBOR. The U.S. Federal Reserve, in conjunction with the Alternative Reference Rates Committee, a steering committee comprised of large U.S. financial institutions, is considering replacing LIBOR with the Secured Overnight Financing Rate ("SOFR"), a new index calculated by reference to short-term repurchase agreements, backed by Treasury securities. It not possible to predict whether SOFR will attain market traction as a LIBOR replacement or to predict any other reforms to LIBOR that may be enacted in the U.K. or elsewhere. Although the full impact of such reforms and actions, together with any transition away from LIBOR, including the potential or actual discontinuance of LIBOR publication, remains unclear, these changes may have a material adverse impact on the availability of financing, including LIBOR-based loans, and on our financing costs.
If we became unable to obtain adequate surety bonding or letters of credit, it could adversely affect our ability to bid on new work, which could have a material adverse effect on our future revenue and business prospects.
In line with industry practice, we are often required to provide performance and surety bonds to customers and may be required to provide letters of credit. These bonds and letters of credit provide credit support for the client if we fail to perform our obligations under the contract. If security is required for a project and we are unable to obtain a bond or letter of credit on terms acceptable to us and our client, we may not be able to pursue that project. In addition, bonding may be more difficult to obtain in the future or may be available only at significant additional cost as a result of general conditions that affect the insurance and bonding markets.
We may be unable to protect our intellectual property rights effectively, or we may infringe upon the intellectual property of others, either of which may have a material adverse effect on our operating results and financial condition.
We rely on a variety of intellectual property rights we use in our products and services. We may not be able to successfully preserve our intellectual property rights in the future, and these rights could be invalidated, circumvented or challenged. In particular, the laws of certain countries in which our products are sold do not protect our products and intellectual property rights to the same extent as the laws of the United States. If litigation is necessary in the future to enforce our intellectual property rights, to protect our trade secrets or to determine the validity and scope of the proprietary rights of others, such litigation could result in substantial costs and diversion of resources even if we ultimately prevail.
In addition, intellectual property of others also has an impact on our ability to offer some of our products and services for specific uses or at competitive prices. Competitors' patents or other intellectual property may limit our ability to offer products or services to our customers. Any infringement or claimed infringement by us of the intellectual property rights of others could result in litigation and adversely affect our ability to continue to provide, or could increase the cost of providing, products and services.
Weakened global economic conditions may adversely affect our industry, business and results of operations.
Our overall performance depends in part on worldwide economic conditions. The United States and other key international economies have experienced downturns, including the COVID-19 related downturn, from time to time during which economic activity was impacted by falling demand for a variety of goods and services; restricted credit; poor liquidity; reduced corporate profitability; volatility in credit, equity and foreign exchange markets; increased unemployment; bankruptcies; and overall uncertainty with respect to the economy. These conditions affect consumer spending and could adversely affect our customers’ ability or willingness to purchase our products, delay prospective customers’ purchasing decisions, reduce the value of their contracts, or affect attrition rates, all of which could adversely affect our operating results.
Unexpected events, including natural disasters and the COVID-19 pandemic, may increase our cost of doing business or disrupt our operations.
The occurrence of one or more unexpected events, including war, terrorist acts, fires, tornadoes, floods and severe weather in the United States or in other countries in which we operate and the COVID-19 pandemic, may disrupt our operations as well as the operations of our customers. Such events could create additional uncertainties, forcing customers to reduce, delay, or cancel already planned projects. These events could result in damage to, and a complete or partial closure of, one or more of our manufacturing facilities, which could make it difficult to supply our customers with product and provide our employees with work, thereby adversely affecting our business, operating results or financial condition.
Our global operations expose us to global regulatory, geopolitical, economic and social changes and add additional risks and uncertainties which can harm our business, operating results, and financial condition.
Our United States and foreign operations, sales, earnings, and strategies for profitable growth can be adversely affected by global conditions and compliance with global regulations and governmental orders. Global conditions include political developments; economic changes; unfavorable trading policies; difficulties in staffing and managing global operations; changes in foreign and domestic governmental regulations or requirements, treaty and trade relationships; the imposition of government orders that differ among jurisdictions, including mandatory closures, work-from-home and lock-down orders and social distancing protocols, or other restrictions related to the COVID-19
12
pandemic; changes in monetary and fiscal policies; changes in laws and regulations; or other activities of the United States and other foreign governments, agencies, and similar organizations. These conditions include, but are not limited to, changes in a country's or region's economic or political conditions; pricing and marketing of products; local labor conditions and regulations; reduced protection of intellectual property rights; changes in the regulatory or legal environment; lack of well-developed legal systems; restrictions and foreign exchange rate fluctuations; and burdensome taxes and tariffs and other trade regulations or barriers. Other exposures and uncertainties exist include changing social conditions and attitudes, terrorism, or political hostilities and war. Other difficulties of global operations include staffing and managing our various locations, including logistical and communication challenges. The likelihood of such occurrences and their overall effect on us vary greatly from country to country and are not predictable.
Our business could be impacted by the withdrawal of the United Kingdom ("U.K.") withdrawal from the European Union (known as "Brexit"). The U.K. formally withdrew from the European Union on January 31, 2020; and it is now in a period of transition until December 31, 2020. Uncertainty remains as to what kind of post-Brexit agreement between the U.K. and the European Union, if any, may be approved by the U.K. Parliament and the European Union. Brexit may adversely affect global economic and market conditions and could contribute to volatility in foreign exchange markets, which we may be unable to effectively manage through our foreign exchange risk management program. Brexit may also adversely affect our revenues and could subject us to new regulatory costs and challenges in addition to other adverse effects that we are unable to effectively anticipate.
In March 2020, the World Health Organization declared the outbreak of COVID-19 a global pandemic, and in the following weeks, many countries and U.S. states and localities issued work-from-home and lock-down orders impacting businesses globally. The COVID-19 situation has created an unprecedented and challenging time. Our focus is on positioning the Company for a strong recovery when the crisis is over. However, the ensuing impact to the economy and related economic recovery creates considerable uncertainties in our business. We are unable to predict the impact to our customers and any sustained changes in their buying habits or to predict any regulatory or societal changes which could impact how people gather and the need for our solutions. As we react to estimating changes to our business, we may not be able to adjust our cost structure to quickly align to new demand, which will negatively impact our operating results and liquidity.
Our future results may be affected by compliance risks related to United States and other countries' anti-bribery and anti-corruption laws, trade controls, economic sanctions, and similar laws and regulations. Our failure to comply with these laws and regulations could subject us to civil, criminal and administrative proceedings or penalties and harm our reputation.
Doing business on a worldwide basis requires us to comply with the laws and regulations of the United States government and various foreign jurisdictions. These laws and regulations place restrictions on our operations, trade practices, partners, and investments.
In particular, we and our operations are subject to U.S. and foreign anti-corruption and trade control laws and regulations, such as the United States Foreign Corrupt Practices Act (the “FCPA”); the United Kingdom Bribery Act (the “Bribery Act”); and export controls and economic sanctions programs, including those administered by the U.S. Treasury Department’s Office of Foreign Assets Control (“OFAC”), the State Department’s Directorate of Defense Trade Controls (the “DDTC”), and the Bureau of Industry and Security of the U.S. Department of Commerce.
As part of our business, we deal with state-owned business enterprises, the employees of which are considered to be foreign officials for purposes of the FCPA's prohibition on United States companies from engaging in bribery, providing anything of value, or making other prohibited payments to foreign officials for the purpose of obtaining or retaining business, and other similar regulations in other areas of the world. In addition, the provisions of the Bribery Act apply to bribery of foreign officials and to transactions with individuals that a government does not employ. The FCPA also requires us to maintain specific record-keeping standards and adequate internal accounting controls. In addition, we are subject to similar requirements in other countries. Some of the international locations in which we do business lack a developed legal system and have higher than normal levels of corruption. Our expansion outside of the United States, and our development of new partnerships and joint venture relations worldwide, could increase the risk of violation of the FCPA, OFAC, the Bribery Act or similar laws and regulations.
As an exporter, we must comply with various laws and regulations relating to the export of products and technology from the U.S. and other countries having jurisdiction over our operations and trade sanctions against embargoed countries and destinations administered by OFAC. Before shipping certain items, we must obtain an export license or verify that license exemptions are available. Any failures to comply with these laws and regulations could result in fines, adverse publicity, and restrictions on our ability to export our products. Repeat failures could carry more significant penalties.
Bribery, corruption, and trade laws and regulations, and the enforcement thereof, are increasing in frequency, complexity and severity on a global basis. Violations of anti-corruption, anti-bribery and trade control laws and sanctions regulations are punishable by civil penalties, including fines, denial of export privileges, injunctions, asset seizures, debarment from government contracts and revocations or restrictions of licenses, as well as criminal fines and imprisonment, and could harm our reputation, create negative shareholder sentiment and affect our share value. We have established policies and procedures with the intention of providing reasonable assurance of compliance
13
with these laws and regulations and trained our employees to comply with these laws and regulations. However, our employees, contractors, agents and licensees involved in our international operations may take actions in violations of such policies. If our employees, agents, distributors, suppliers and other third parties with whom we do business violate anti-bribery, anti-corruption or similar laws and regulations, we may incur severe fines, penalties and reputational damage. Additionally, there can be no assurance that our policies and procedures will effectively prevent us from violating these regulations in every transaction in which we may engage or provide a defense to any alleged violation. In particular, we may be held liable for the actions that our joint venture partners take inside or outside of the United States even though our partners may not be subject to these laws. Such a violation, even if our policies prohibit it, could have an adverse effect on our reputation, business, financial condition and results of operations. In addition, various state and municipal governments, universities and other investors maintain prohibitions or restrictions on investments in companies that do business with sanctioned countries, persons and entities, which could adversely affect our reputation, business, financial condition and results of operations.
Global tax law changes may adversely affect our business, financial condition and results of operations.
We are subject to the income tax laws of the United States and its various state and local governments as well as several foreign tax jurisdictions. Our future income taxes could be materially adversely affected by changes in the amount or mix of earnings amongst countries with differing statutory tax rates, changes in the valuation of deferred tax assets and liabilities, changes in tax rates or the interpretation of tax rules and regulations in jurisdictions in which we do business, changes in tax laws, or the outcome of income tax audits and any related litigation. The U.S. Tax Cuts and Jobs Act of 2017 is one such example of legislation that impacts our effective tax rate.
Further changes in the tax laws of the United States and foreign jurisdictions could arise, including additional tax reform in the United States and the base erosion and profit shifting project undertaken by the Organization for Economic Co-operation and Development (“OECD”). Both the United States tax reform and the OECD proposed recommendations, that, in some cases, would make substantial changes to numerous long-standing tax positions and principles. These contemplated changes could increase tax uncertainty and may adversely affect our business, financial condition and results of operations.
Acquisitions, partial investments, and divestitures pose financial, management and other risks and challenges.
We routinely explore investing in or acquiring other businesses and related assets to complement or enhance our business strategies. These investments are often made to increase customer relations and market base, expand geographically, or obtain technological advances to support our solution portfolio. Periodically, we may also consider disposing of these businesses, partial investments, assets, or other lines of business.
The financial, management and other risks and challenges include, but are not limited to, the following:
|
•
|
diversion of management attention;
|
|
•
|
difficulty with integrating acquired businesses;
|
|
•
|
adverse impact on overall profitability if the expanded operations do not achieve the strategic benefits forecasted;
|
|
•
|
potential loss or adverse relationship change of key employees, customers, or suppliers of the acquired business;
|
|
•
|
inability to effectively manage our expanded operations;
|
|
•
|
difficulty with the integration of different corporate cultures;
|
|
•
|
personnel issues;
|
|
•
|
increased expenses;
|
|
•
|
assumption of unknown liabilities and indemnification obligations;
|
|
•
|
potential disputes with the buyers or sellers;
|
|
•
|
the time involved in evaluating or modifying the financial systems of an acquired business and the establishment of appropriate internal controls; and
|
|
•
|
incorrect estimates made in the accounting for the transaction that cause misstatement of acquisition assets and liabilities.
|
There can be no assurance that we will engage in any acquisitions or divestitures or that we will be able to do so on terms that will result in any expected benefits.
Any reduction or impairment of the value of an investment and related acquired assets or goodwill would result in charges against earnings, which would adversely affect our results of operations in future periods.
If goodwill or other intangible assets in connection with our acquisitions become impaired, we could take significant non-cash charges against earnings.
We have pursued and will continue to seek potential acquisitions to complement and expand our existing businesses, increase our revenues and profitability, and expand our markets. As a result of prior acquisitions, we have goodwill and intangible assets recorded in our
14
consolidated balance sheets as described in "
Note 7. Goodwill and Intangible Assets
" of the Notes to our Consolidated Financial Statements included in this Form 10-K.
Goodwill represents the purchase price paid in excess of the fair value of net tangible and intangible assets acquired in a business combination. Goodwill is not amortized and remains in our consolidated balance sheets indefinitely unless there is an impairment or a sale of a portion of the business. Under current accounting guidelines, we must assess, at least annually, whether the value of goodwill and other intangible assets has been impaired. Any reduction or impairment of the value of goodwill or other intangible assets will result in charges against earnings, which would adversely affect our results of operations in future periods.
In March 2020, we began to see impacts from the COVID-19 pandemic that could have a negative impact on our forecasted revenue and profitability. This, along with the decline in our stock price and other market conditions, led us to perform an interim qualitative goodwill impairment analysis. After evaluating our results, events and circumstances, we determined that a quantitative or step 1 analysis was necessary for our International business unit. The results of that analysis indicated no goodwill impairment was necessary.
We had no impairments in fiscal 2018, 2019, or 2020.
Our data systems could fail, or their security could be compromised, causing a material adverse effect on our business.
We rely heavily on digital technologies for the successful operation of our business, for the support of our controller offerings, and for the collection and retention of business data. Any failure of our digital systems, or any breach of our systems’ security measures, could adversely affect our operations, at least until our data can be restored and/or the breaches remediated. Despite the security measures we have in place, our facilities and systems and those of our third-party service providers may be vulnerable to cybersecurity breaches, acts of vandalism, computer viruses, misplaced or lost data, programming issues, and/or human errors or other similar events. Any misappropriation, loss or other unauthorized disclosure of confidential or personally identifiable information, whether by us or by our third-party service providers, could adversely affect our business and operations. We could face significant fines and penalties under various global laws revolving around data loss, lack of adequate date protection or lack of required reporting. Any disruption in our digital technologies could affect our business and operations, causing potentially significant expenses to recover and modify the data systems, to reimburse customers' losses, and to investigate and remediate any vulnerabilities, which could severely damage our reputation with customers, suppliers, employees and investors and expose us to risk of litigation and liability.
Regulation in the areas of privacy, data protection and information security could increase our costs and affect or limit our business opportunities and how we collect or use personal information.
As privacy, data protection and information security laws, including data localization laws, are interpreted and applied, compliance costs may increase, particularly in the context of ensuring that adequate data protection and data transfer mechanisms are in place. In recent years, there have been increasing regulatory enforcement and litigation activities in the areas of privacy, data protection and information security in the U.S. and in various countries in which we operate. For example, effective in May 2018, the General Data Protection Regulation (“GDPR”) became effective, and the GDPR applies to any organization, including Daktronics, that holds or uses data on people inside the European Union (“EU”). Under the GDPR, businesses must generally obtain consent from individuals in the EU before they store or process personal information, and data cannot be held longer than necessary. The GDPR creates new compliance obligations, which have caused us to change some of our business practices relative to the EU. The GDPR greatly increases the jurisdictional reach of EU law and significantly increases financial penalties for noncompliance, including possible fines of up to 4% of global annual turnover (that is, revenue) for the preceding financial year or €20 million (whichever is higher) for the most serious infringements. We are also subject to the People's Republic of China Cybersecurity Law put into place on June 1, 2017. Under this regulation, network operators, including online lending information service providers, shall comply with laws and regulations and fulfill their obligations to safeguard security of the network when conducting business and providing services, and take all necessary measures pursuant to laws, regulations and compulsory national requirements to safeguard the safe and stable operation of the networks, respond to network security incidents effectively, prevent illegal and criminal activities, and maintain the integrity, confidentiality and usability of network data.
In addition, state and federal legislators and/or regulators in the U.S. and other countries in which we operate are increasingly adopting or revising privacy, data protection and information security laws that potentially could have significant impact on our current and planned privacy, data protection and information security-related practices; our collection, use, sharing, retention and safeguarding of consumer and/or employee information; and some of our current or planned business activities. New legislation or regulation could increase our costs of compliance and business operations and could reduce revenues from certain business initiatives. Moreover, the application of existing or new laws to existing technology and practices can be uncertain and may lead to additional compliance risk and cost.
Similar to the GDPR, the California Consumer Privacy Act of 2018 ("CCPA"), which became effective January 1, 2020, grants to California residents several new rights relating to their personal information. The CCPA applies to businesses that conduct business in California and satisfies one of three financial conditions, including a business that has a gross revenue greater than $25 million; therefore, it applies
15
to Daktronics. The CCPA is the most prescriptive general privacy law in the United States and may lead to similar laws being enacted in other U.S. states or at the federal level.
Compliance with current or future privacy, data protection and information security laws relating to consumer and/or employee data could result in higher compliance and technology costs and could restrict our ability to provide certain products and services, which could materially and adversely affect our results of operations. Our failure to comply with privacy, data protection and information security laws could result in potentially significant regulatory and/or governmental investigations and/or actions, litigation, fines, sanctions, ongoing regulatory monitoring, customer attrition, customer indemnity claims, decreases in the use or acceptance of our products and services, and damage to our reputation and our brand.
We may fail to continue to attract, develop and retain key management personnel, which could negatively impact our operating results.
We depend on the performance of our senior executives and key employees, including experienced and skilled technical personnel. The loss of any of our senior executives could negatively impact our operating results and ability to execute our business strategy. Our future success will also depend upon our ability to attract, train, motivate and retain qualified personnel.
Although we intend to continue to provide competitive compensation packages to attract and retain key personnel, some of our competitors for these employees have greater resources and more experience, making it difficult for us to compete successfully for key personnel. If we cannot attract and retain sufficiently qualified technical employees for our research and development and manufacturing operations, we may be unable to achieve the synergies expected from mergers and acquisitions or to develop and commercialize new products or new applications for existing products. Furthermore, possible shortages of key personnel, including engineers, in the regions surrounding our facilities could require us to pay more to hire and retain key personnel, thereby increasing our costs.
The outcome of pending and future claims, investigations or litigation can have a material adverse impact on our business, financial condition, and results of operations.
We are involved from time to time in a variety of litigation, investigations, inquires or similar matters arising in our business. Litigation, investigations and regulatory proceedings are subject to inherent uncertainties, and unfavorable rulings and outcomes can and do occur. Pending or future claims against us could result in professional liability, product liability, criminal liability, warranty obligations, indemnity claims, or other liabilities to the extent we are not insured against a loss or our insurance fails to provide adequate coverage. Also, a well-publicized actual or perceived threat of litigation could adversely affect our reputation and reduce the demand for our products. See "
Note 19. Commitments and Contingencies
" of the Notes to our Consolidated Financial Statements included in this Form 10-K for further information on litigation obligations.
Our business involves the use of hazardous materials, and we must comply with environmental, health and safety laws and regulations, which can be expensive and restrict how we do business.
Our business involves the blending, controlled storage, use and disposal of hazardous materials. We and our suppliers are subject to federal, state, local and foreign laws and regulations governing the use, manufacture, storage, handling and disposal of these hazardous materials. Although we believe the safety procedures we utilize for handling and disposing of these materials comply with the standards prescribed by these laws and regulations, we cannot eliminate the risk of accidental contamination or injury from these materials. In the event of an accident, local, state, federal or foreign authorities may curtail the use of these materials and interrupt our business operations. If we are subject to any liability as a result of activities involving hazardous materials, our business, financial condition and results of operations may be adversely affected, and our reputation may be harmed.
If our internal controls over financial reporting is found to be ineffective, our financial statements may not be fairly stated, raising concerns for investors and potentially adversely affecting our stock price.
Under Section 404 of the Sarbanes-Oxley Act of 2002, we are required to evaluate and determine the effectiveness of our internal controls over financial reporting. We have made, and will continue to make, changes to our internal controls and procedures for financial reporting and accounting systems to meet our reporting obligations as a public company. We may encounter problems or delays in completing the review and evaluation, implementing improvements, or receiving a positive attestation from our independent registered public accounting firm. In addition, our assessment of internal controls may identify deficiencies in our internal controls over financial reporting or other matters which may raise concerns for investors, which may adversely affect our stock price.
The protections we have adopted and to which we are subject may discourage takeover offers favored by our shareholders.
Our articles of incorporation, by-laws and other corporate governance documents and the South Dakota Business Corporation Act ("SD Act") contain provisions that could have an anti-takeover effect and discourage, delay or prevent a change in control or an acquisition
16
that many shareholders may find attractive. These provisions make it more difficult for our shareholders to take some corporate actions and include provisions relating to:
|
•
|
the ability of our Board of Directors, without shareholder approval, to authorize and issue shares of stock with voting, liquidation, dividend and other rights and preferences that are superior to our common stock;
|
|
•
|
the classification of our Board of Directors, which effectively prevents shareholders from electing a majority of the directors at any one meeting of shareholders;
|
|
•
|
the adoption of a shareholder rights agreement providing for the exercise of junior participating preferred stock purchase rights when a person becomes the beneficial owner of 20 percent or more of our outstanding common stock and upon the occurrence of certain similar events (subject to certain exceptions);
|
|
•
|
under the SD Act, limitations on the voting rights of shares acquired in specified types of acquisitions and restrictions on specified types of business combinations; and
|
|
•
|
under the SD Act, prohibitions against engaging in a “business combination” with an “interested shareholder” for a period of four years after the date of the transaction in which the person became an interested shareholder unless the business combination is approved.
|
These provisions may deny shareholders the receipt of a premium on their common stock, which in turn may have a depressive effect on the market price of our common stock.
Our common stock has at times been thinly traded, which may result in low liquidity and price volatility.
The daily trading volume of our common stock has at times been relatively low. If this were to occur in the future, the liquidity and appreciation of our common stock may not meet our shareholders’ expectations, and the price at which our stock trades may be volatile. The market price of our common stock could be adversely impacted as a result of sales by existing shareholders of a large number of shares of common stock in the market or by the perception such sales could cause.
Significant changes in the market price of our common stock could result in securities litigation claims against us.
The market price of our common stock has fluctuated and will likely continue to fluctuate and, in the past, companies that have experienced significant changes in the market price of their stock have been subject to securities litigation claims. We may be the target of this type of litigation in the future. Securities litigation against us could result in substantial costs and divert our management’s attention from other business concerns, which could harm our business.
Additionally, if we fail to meet or exceed the expectations of securities analysts and investors, or if one or more of the securities analysts who cover us adversely change their recommendation regarding our stock, the market price of our common stock could decline. Moreover, our stock price may be based on expectations, estimates and forecasts of our future performance that may be unrealistic or that may not be met. Further, our stock price may fluctuate based on reporting by the financial media, including television, radio, press reports and blogs.
There can be no assurance that we will pay dividends on our common stock.
Our Board of Directors has approved regular dividends since fiscal 2006 until March 2020. The declaration, amount and timing of such dividends are determined by our Board of Directors at their discretion. Such determinations are subject to capital availability, compliance with all respective laws and our agreements applicable to the declaration and payment of cash dividends, strategic investment cash needs, business outlook and other factors balancing our long-term needs of our business and the interests of our shareholders.
Our ability to pay dividends will depend upon, among other factors, our cash balances and potential future capital requirements for strategic transactions, including acquisitions, results of operations, financial condition and other factors that our Board of Directors may deem relevant. A reduction in or elimination of our dividend payments and/or our dividend program could have a material negative effect on our stock price.
On April 1, 2020, our Board of Directors announced the suspension of dividends for the foreseeable future. We believe these measures are necessary to help preserve our ability to borrow for liquidity needs and help us to be well positioned when the COVID-19 pandemic passes and economies begin to recover.
Our executive officers, directors and principal shareholders have the ability to significantly influence all matters submitted to our shareholders for approval.
Dr. Aelred Kurtenbach served as our Chairman of the Board until September 3, 2014, when he retired. Mr. Reece Kurtenbach, who is Dr. Aelred Kurtenbach's son, serves as our Chairman of the Board and Chief Executive Officer. In addition, Dr. Aelred Kurtenbach has
17
two other children who serve as our Vice President of Human Resources and as our Vice President of Manufacturing. Together, these individuals, in the aggregate, beneficially owned 9.5 percent of our outstanding common stock as of
June 8, 2020
, assuming the exercise by them of all of their options that were currently exercisable or that vest within 60 days of
June 8, 2020
. Our other executive officers and directors, in the aggregate, beneficially owned an additional 4.4 percent of our outstanding common stock as of
June 8, 2020
, assuming the exercise by them of all of their options currently exercisable or that vest within 60 days of
June 8, 2020
. Although this does not represent a majority of our outstanding common stock, if these shareholders were to choose to act together, they would be able to significantly influence all matters submitted to our shareholders for approval, as well as our management and affairs. For example, these persons, if they choose to act together, could significantly influence the election of directors and the approval of any merger, consolidation, sale of all or substantially all of our assets or other business combination or reorganization requiring shareholder approval. This concentration of voting power could delay or prevent an acquisition of us on terms that other shareholders may desire. The interests of this group of shareholders may not always coincide with the interests of other shareholders, and they may act in a manner that advances their best interests and not necessarily those of other shareholders, including seeking a premium value for their common stock, that might affect the prevailing market price for our common stock.
Insurance coverage can be difficult or expensive to obtain, and our failure to obtain adequate insurance coverage could adversely affect our financial condition or results of operations.
We maintain insurance both as a corporate risk management strategy and to satisfy the requirements of many of our contracts with customers. As the costs and availability of insurance change, we may decide not to be covered against certain losses where, in the judgment of management, the insurance is not warranted due to the cost or availability of coverage or the remoteness of the perceived risk. We cannot provide assurance that all necessary or appropriate insurances will be available, cover every type of loss incurred, or be able to be economically secured. For example, some insurers limit coverages, increase premium costs or increase deductibles when global catastrophic events occur. As part of our corporate risk management strategy, we monitor and place our coverages with financially strong insurers, layer our risk with multiple insurers, and seek advice on the amount, breadth and type of insurance coverages to protect our interests. We also contractually require subcontractors and others working on our behalf to carry common insurance coverages for the types of work they perform to mitigate any risk of our loss. Our failure to obtain adequate insurance coverage could adversely affect our financial condition or results of operations.
We have been required to conduct a good faith reasonable country of origin analysis on our use of “conflict minerals”, which has imposed and may impose additional costs on us and could raise reputational challenges and other risks.
The SEC has promulgated rules in connection with the Dodd-Frank Wall Street Reform and Consumer Protection Act regarding disclosure of the use of certain minerals, known as conflict minerals, mined from the Democratic Republic of the Congo and adjoining countries. As required, we have filed annual Forms SD since 2014 reporting our work performed to gain information on the source of conflict minerals we use. We incur costs associated with complying with these disclosure requirements. As we continue our due diligence, we may face reputational challenges if we continue to be unable to verify the origins of all conflict minerals used in our products. We may also encounter challenges in our efforts to satisfy customers that may require all of the components of products purchased to be certified as conflict free. If we are not able to meet customer requirements, customers may choose to disqualify us as a supplier.
Item 1B. UNRESOLVED STAFF COMMENTS
None.
Item 2. PROPERTIES
Our principal properties include space for manufacturing products, designing and testing new developments or processes, and employee collaboration space. Our properties are somewhat aligned with our business segments; however, we manufacture the same products across our manufacturing facilities to efficiently utilize capacity and reduce costs. We consider all our properties to be both suitable and adequate to meet our requirements for the foreseeable future.
Our principal properties consist of the following:
|
Facilities
|
Owned or Leased
|
Square Footage
|
Facility Activities
|
|
Brookings, SD, USA
|
Owned
|
764,000
|
Corporate Office, Manufacturing, Sales, Service
|
|
Redwood Falls, MN, USA
|
Owned
|
151,000
|
Manufacturing, Sales, Service, Office
|
|
Ennistymon, Ireland
|
Owned
|
60,000
|
Manufacturing, Sales, Service, Office
|
|
Sioux Falls, SD, USA
|
Leased
|
277,000
|
Manufacturing, Sales, Service, Office
|
|
Shanghai, China
|
Leased
|
137,000
|
Manufacturing, Sales, Service, Office
|
18
We also utilize sales and service offices located throughout the United States, Canada, Europe, South America, and the Asia-Pacific regions. These spaces are generally small leased offices used for sales related activities. See "
Note 12. Leases
" of the Notes to our Consolidated Financial Statements included in this Form 10-K for further information on lease obligations. Our Belgium property is used infrequently and is available for sale.
Item 3. LEGAL PROCEEDINGS
We are involved in a variety of legal actions relating to various matters during the normal course of business. Although we are unable to predict the ultimate outcome of these legal actions, it is the opinion of management that the disposition of these matters, taken as a whole, will not have a material adverse effect on our financial condition or results of operations. See "
Note 19. Commitments and Contingencies
" of the Notes to our Consolidated Financial Statements included in this Form 10-K for further information on any legal proceedings and claims.
Item 4. MINE SAFETY DISCLOSURES
Not applicable.
19
PART II
Item 5. MARKET FOR REGISTRANT’S COMMON EQUITY, RELATED STOCKHOLDER MATTERS AND ISSUER PURCHASES OF EQUITY SECURITIES
Stock Performance
Our common stock is quoted on The Nasdaq Global Select Market under the ticker symbol DAKT. Daily market activity, along with quoted prices and other trading information, are readily available for our common stock on numerous websites including www.nasdaq.com. As of
June 8, 2020
, we had
989
shareholders of record.
The following graph shows changes during the period from
May 2, 2015
to
May 2, 2020
in the value of $100 invested in: (1) our common stock; (2) The Nasdaq Composite; and (3) the Standard and Poor's 600 Index for Electronic Equipment Manufacturers. The values of each investment as of the dates indicated are based on share prices plus any cash dividends, with the dividends reinvested on the date they were paid. The calculations exclude trading commissions and taxes.
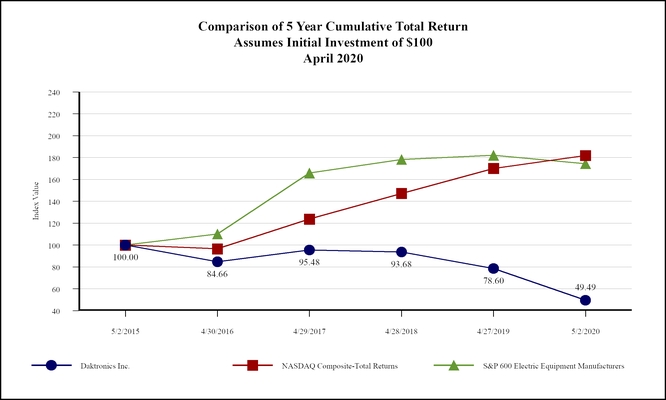
Share Repurchases
On
June 17, 2016
, our Board of Directors approved a stock repurchase program under which Daktronics may purchase up to
$40 million
of its outstanding shares of common stock. Under this program, we may repurchase shares from time to time in open market transactions and in privately negotiated transactions based on business, market, applicable legal requirements and other considerations. The repurchase program does not require the repurchase of a specific number of shares and may be terminated at any time. During fiscal 2020, we repurchased
1.0 million
shares of common stock at a total cost of
$5.6 million
. As of
May 2, 2020
, we had
$32.5 million
of remaining capacity under our current share repurchase program. During fiscal 2019 and 2018, we had no repurchases of shares of our outstanding common stock. As part of our COVID-19 response, on April 1, 2020, our Board of Directors voted to suspend stock repurchases under our share repurchase program for the foreseeable future.
The following table provides information about share repurchases of common stock during the fourth quarter of fiscal 2020:
20
|
Period
|
Total number of shares purchased
|
Average price paid per share (including fees)
|
Total number of shares purchased as part of publicly announced plans or programs
|
Approximate dollar value of shares that may yet be purchased under the share repurchase program
|
||||||
|
February 2, 2020 - February 29, 2020
|
127,515
|
|
$
|
5.64
|
|
127,515
|
|
$
|
35,126,597
|
|
|
March 1, 2020 - March 28, 2020
|
533,990
|
|
4.85
|
|
533,990
|
|
32,539,076
|
|
||
|
Total
|
661,505
|
|
661,505
|
|
||||||
Item 6. SELECTED FINANCIAL DATA
(in thousands, except per share data)
The table below provides selected historical financial data, which should be read in conjunction with "Management's Discussion and Analysis of Financial Condition and Results of Operations" and the Consolidated Financial Statements and the Notes to the Consolidated Financial Statements, which are included in Part II, Items 7 and 8 in this Form 10-K. The statement of operations data for the fiscal years ended
May 2, 2020
,
April 27, 2019
and
April 28, 2018
and the balance sheet data at
May 2, 2020
and
April 27, 2019
are derived from, and are qualified by reference to, the audited Consolidated Financial Statements included elsewhere in this Form 10-K. The statement of operations data for the fiscal years ended
April 29, 2017
and
April 30, 2016
and the balance sheet data at
April 28, 2018
,
April 29, 2017
and
April 30, 2016
are derived from audited financial statements that are not included in this Form 10-K.
|
|
2020
(1)(2)
|
2019
(2)(3)(4)(6)(8)
|
2018
(5)(6)(8)
|
2017
(7)(8)
|
2016
(8)(9)
|
||||||||||||||
|
Statement of Operations Data:
|
|
|
|
|
|
||||||||||||||
|
Net sales
|
$
|
608,932
|
|
$
|
569,704
|
|
$
|
610,530
|
|
$
|
586,539
|
|
$
|
570,168
|
|
||||
|
Gross profit
|
138,700
|
|
130,294
|
|
145,669
|
|
140,415
|
|
121,019
|
|
|||||||||
|
Gross profit margin
|
22.8
|
%
|
22.9
|
%
|
23.9
|
%
|
23.9
|
%
|
21.2
|
%
|
|||||||||
|
Operating (loss) income
|
(167
|
)
|
(4,728
|
)
|
12,460
|
|
15,421
|
|
2,495
|
|
|||||||||
|
Operating margin
|
—
|
%
|
(0.8
|
)%
|
2.0
|
%
|
2.6
|
%
|
0.4
|
%
|
|||||||||
|
Net income (loss)
|
491
|
|
(958
|
)
|
5,562
|
|
10,342
|
|
2,061
|
|
|||||||||
|
Diluted earnings (loss) per share
|
0.01
|
|
(0.02
|
)
|
0.12
|
|
0.23
|
|
0.05
|
|
|||||||||
|
Weighted average diluted shares outstanding
|
45,316
|
|
44,926
|
|
44,873
|
|
44,303
|
|
44,456
|
|
|||||||||
|
Balance Sheet Data:
|
|
|
|
|
|
|
|
|
|
|
|||||||||
|
Working capital
|
$
|
106,037
|
|
$
|
119,601
|
|
$
|
132,825
|
|
$
|
127,130
|
|
$
|
123,714
|
|
||||
|
Total assets
|
372,651
|
|
349,216
|
|
358,800
|
|
355,433
|
|
349,948
|
|
|||||||||
|
Total long-term liabilities
|
49,706
|
|
27,481
|
|
29,876
|
|
26,552
|
|
27,364
|
|
|||||||||
|
Total shareholders' equity
|
176,980
|
|
187,663
|
|
197,616
|
|
198,286
|
|
201,067
|
|
|||||||||
|
Cash dividends per share
|
0.20
|
|
0.28
|
|
0.28
|
|
0.31
|
|
0.40
|
|
|||||||||
(1) Fiscal year 2020 consisted of 53 weeks. Each of the other fiscal years presented consisted of 52 weeks.
(2) Includes approximately $4.9 million of additional costs for tariffs during fiscal 2020 and $6.3 million of additional costs for price changes and tariffs during fiscal 2019.
(3) Includes the net assets acquired of AJT Systems, Inc. See "
Note 5. Business Combination
" of the Notes to our Consolidated Financial Statements included in this Form 10-K for further information.
(4) Includes the release of $2.7 million in unrecognized tax benefits related to the lapse of a statute of limitations and the release of $0.5 million for a valuation allowance reversal related to foreign net operating loss carryforwards. See "
Note 15. Income Taxes
" of the Notes to our Consolidated Financial Statements included in this Form 10-K for further information.
(5) Includes the sale of our non-digital division assets. See "
Note 6. Sale of Non-Digital Division Assets
" of the Notes to our Consolidated Financial Statements included in this Form 10-K for further information.
(6) Includes the effects of the U.S. Tax Cuts and Jobs Act, which impacted our deferred tax asset valuation and increased tax expense. See "
Note 15. Income Taxes
" of the Notes to our Consolidated Financial Statements included in this Form 10-K for further information.
(7) Includes a $0.8 million impairment loss on intangible assets. See "Note 5. Goodwill and Intangible Assets" of the Notes to our Consolidated Financial Statements included in our Annual Report on Form 10-K for the fiscal year ended April 29, 2017 for further information.
(8) Includes an additional warranty charge in our OOH product application in fiscal years 2019, 2018, 2017, and 2016 of $2.4 million, $4.5 million, $1.8 million, and $9.2 million, respectively. See "
Note 19. Commitments and Contingencies
" of the Notes to our Consolidated Financial Statements included in this Form 10-K for further information.
21
(9) Includes the acquisition of ADFLOW Networks, Inc. in March 2016. See "Note 4. Business Combinations" of the Notes to our Consolidated Financial Statements included in our Annual Report on Form 10-K for the fiscal year ended April 30, 2016 for further information.
Item 7. MANAGEMENT’S DISCUSSION AND ANALYSIS OF FINANCIAL CONDITION AND RESULTS OF OPERATIONS
The following discussion provides our highlights and commentary related to factors impacting our financial conditions and further describes the results of operations. The most significant risks and uncertainties are discussed in "Item 1A. Risk Factors."
This discussion should be read in conjunction with the accompanying Consolidated Financial Statements and Notes to the Consolidated Financial Statements included in this Form 10-K.
EXECUTIVE OVERVIEW
Our mission is to be the world leader at informing and entertaining audiences through dynamic audio-visual communication systems. We organize into business units to focus on customer loyalty over time to earn new and replacement business because our products have a finite lifetime. See "
Note 3. Segment Reporting
" of the Notes to our Consolidated Financial Statements included in this Form 10-K for further information. Our strategies include the creation of a comprehensive line of innovative solutions and systems and our ability to create and leverage platform designs and technologies. These strategies align us to effectively deliver value to our varied customers and their market needs, while serving our stakeholders over the long-term. We focus on creating local capabilities for sales, service, and manufacturing in geographies with expected digital market opportunities. We believe consistently generating profitable growth will provide value to our stakeholders (customers, employees, shareholders, suppliers, and communities).
We measure our success using a variety of measures including:
|
•
|
our percentage of market share by comparing our estimated revenue to the total estimated global digital display revenue;
|
|
•
|
our order growth compared to the overall digital market order change;
|
|
•
|
financial metrics such as annual order volume and profit change as compared to our previous financial results;
|
|
•
|
customer retention and expansion rates; and
|
|
•
|
our ability to generate profits over the long-term to provide a shareholder return.
|
Certain factors impact our ability to succeed in these strategies and impact our business units to varying degrees. For example, the overall cost to manufacture and the selling prices of our products have decreased over the years and are expected to continue to decrease in the future. Our competitors outside the U.S. are impacted differently by the global trade environment allowing them to avoid tariff costs or reduce prices. As a result, additional competitors have entered the market, and each year we must sell more product to generate the same or greater level of net sales as in previous fiscal years. However, the decline of digital solution pricing over the years and increased user adoption and applications have increased the size of the global market.
Competitor offerings, actions and reactions also can vary and change over time or in certain customer situations. Projects with multimillion-dollar revenue potential attracts competition, and competitors can use marketing or other tactics to win business.
Each business unit's long-term performance can be impacted by economic conditions in different ways and to different degrees. The effects of an adverse economy are generally less severe on our sports related business as compared to our other businesses, although in severe economic downturns with social changes causing decreases in sporting event revenues, the sports business can also be seriously impacted.
Outlook: The COVID-19 pandemic has created disruptions since its initial outbreak, first impacting our China operations. Beginning in February, we created COVID-19 response teams to manage our local and global response activities. Using the guidance from the U.S. Centers for Disease Control and Prevention, the World Health Organization, and other applicable regulatory agencies, we enhanced or implemented robust health, safety, and cleaning protocols across our organization. Employees are working from home where possible, and we have limited travel for the time being. When unable to work safely or within the various regulations in certain geographies and locations, our manufacturing and field service teams have reduced capacity and furloughed employees. Our Minnesota, Ireland, and China production facilities were briefly closed and production has since resumed operations. Our sales teams have continued to engage our customers, mostly virtually, across our diverse markets and geographies, with some customers continuing to place orders while others are choosing to delay purchases. Our supply chain team has remained alert to potential short supply situations and shipping disruptions, and, if necessary, we are utilizing alternative sources and shipping methods.
We expect the COVID-19 pandemic to have an adverse impact on our revenue and our results of operations, the size and duration of which we are currently unable to predict. The global impact of COVID-19 continues to rapidly evolve. The extent to which COVID-19 will impact our business will depend on future developments, which are highly uncertain and cannot be predicted with confidence, such
22
as the ultimate severity and spread of the disease, the duration of the pandemic, travel restrictions and social distancing requirements in the United States and other countries, the pace and extent of the economic recovery, and any change in trends and practices in how people gather. Given the speed and frequency of continuously evolving developments with respect to this pandemic, we cannot reasonably estimate the magnitude of the impact to our business. In addition, we can be impacted by events like the U.S. Administrative trade actions in 2018 or a number of other factors that are disclosed in "Item 1A. Risk Factors" included in this Form 10-K.
The outlook and unique key growth drivers and challenges by our business units include:
Commercial Business Unit:
In the near-term, our customers who rely on advertising revenues for Out-of-Home ("OOH") advertising or who are reliant on customer foot-traffic to drive sales have been adversely impacted by stay-at-home or quarantine orders which started in March 2020 with varied or no published expiration. These customers are expected to delay their discretionary capital spending through the COVID-19 economic recovery. Business using our displays for self-promotion or on-premise advertising may have reduced budgets for the foreseeable future or choose to utilize displays as part of their recovery, both actions creating an impact to the Commercial near-term outlook. We cannot reasonably estimate the magnitude or length of time our Commercial business will be adversely impacted.
Over the long-term, we believe growth in the Commercial business unit will result from a number of factors, including:
|
•
|
Standard display product market growth due to market adoption and lower product costs, which drive marketplace expansion. Standard display products are used to attract or communicate with customers and potential customers of retail, commercial, and other establishments. Pricing and economic conditions are the principal factors that impact our success in this business unit. We utilize a reseller network to distribute our standard products.
|
|
•
|
National accounts standard display market opportunities due to customers' desire to communicate their message, advertising and content consistently across the country. Increased demand is possible from national retailers, quick-serve restaurants, petroleum retailers, and other nationwide organizations.
|
|
•
|
Additional standard display offerings using micro-light emitting diode ("LED") designs.
|
|
•
|
Increasing use of LED technologies replacing signage previously using liquid crystal display ("LCD") technology by existing and new customers.
|
|
•
|
Increasing interest in spectaculars, which include very large and sometimes highly customized displays as part of entertainment venues such as casinos, shopping centers, cruise ships and Times Square type locations.
|
|
•
|
Dynamic messaging systems demand growth due to market adoption and expanded use of this technology.
|
|
•
|
The use of architectural lighting products for commercial buildings, which real estate owners use to add accents or effects to an entire side or circumference of a building to communicate messages or to decorate the building.
|
|
•
|
The continued deployment of digital billboards as OOH advertising companies continue developing new sites and replacing digital billboards reaching end of life. This is dependent on no adverse changes occurring in the digital billboard regulatory environment restricting future billboard deployments, as well as maintaining our current market share in a business that is concentrated in a few large OOH companies.
|
|
•
|
Replacement cycles within each of these areas.
|
Live Events Business Unit:
In the near-term, our customers who rely on advertising and event revenues are expected to delay spending on projects because of the COVID-19 pandemic. Changes to the way people gather may change the long-term usage of our systems.
Over the long-term, we believe growth in the Live Events business unit will result from a number of factors, including:
|
•
|
Facilities spending more on larger display systems to enhance the game-day and event experience for attendees.
|
|
•
|
Lower product costs, driving an expansion of the marketplace.
|
|
•
|
Our product and service offerings, including additional micro-LED offerings which remain the most integrated and comprehensive offerings in the industry.
|
|
•
|
The competitive nature of sports teams, which strive to out-perform their competitors with display systems.
|
|
•
|
The desire for high-definition video displays, which typically drives larger displays or higher resolution displays, both of which increase the average transaction size.
|
|
•
|
Dynamic messaging system needs throughout a sports facility.
|
|
•
|
Increasing use of LED technologies replacing signage previously using LCD technology in and surrounding live events facilities.
|
|
•
|
Replacement cycles within each of these areas.
|
High School Park and Recreation Business Unit:
In the near-term, our customers who rely on advertising revenue for sports installations or who may be impacted by governmental tax revenue availability may choose to delay spending on projects because of the COVID-19 pandemic.
Over the long-term, we believe growth in the High School Park and Recreation business unit will result from a number of factors, including:
23
|
•
|
Increased demand for video systems in high schools as school districts realize the revenue generating potential of these displays compared to traditional scoreboards and these systems' ability to provide or enhance academic curriculum offerings for students.
|
|
•
|
Increased demand for different types of displays and dynamic messaging systems, such as message centers at schools to communicate to students, parents and the broader community.
|
|
•
|
Lower system costs driving the use of more sophisticated displays in school athletic facilities, such as large integrated video systems.
|
|
•
|
Expanding control system options tailored for the markets' needs.
|
Transportation Business Unit:
In the near term, customers in the mass-transit and airport part of the market are expected to delay spending as a result of the limited use of this infrastructure during the COVID-19 pandemic. In the long-term, roadway projects may be impacted due to reduced tax revenues. That impact will increase as the duration of the reduction in infrastructure usage continues.
Over the long-term, we believe growth in the Transportation business unit will result from increasing applications and acceptance of electronic displays to manage transportation systems, including roadway, airport, parking, transit and other applications. Effective use of the United States transportation infrastructure requires intelligent transportation systems. This growth is highly dependent on government spending, primarily by state and federal governments, along with the continuing acceptance of private/public partnerships as an alternative funding source. Growth is also expected in dynamic messaging systems for advertising and wayfinding use in public transport and airport terminals due to expanded market usage and displays, with LED technology replacing prior LCD installations and additional display offerings using micro-LEDs.
International Business Unit:
In the near-term, our customers who rely on advertising, retail, event revenues and governmental tax revenue availability are expected to delay spending on projects due to the COVID-19 pandemic. Changes to the ways people gather may change the long-term usage of our systems.
Over the long-term, we believe growth in the International business unit will result from achieving greater penetration in various geographies and building products more suited to individual markets. We continue to broaden our product offerings into the transportation segment in Europe and the Middle East. We also focus on sports facility, spectacular-type, OOH advertising products, and architectural lighting market opportunities and the factors listed in each of the other business units to the extent they apply outside of the United States and Canada. Additional opportunities exist with expanded market usage of LED technology due to price considerations, usage of LED technology replacing prior LCD installations and additional display offerings using micro-LEDs.
CRITICAL ACCOUNTING POLICIES AND ESTIMATES
The following Management's Discussion and Analysis of Financial Condition and Results of Operations ("MD&A") are based upon our consolidated financial statements, which have been prepared in accordance with generally accepted accounting principles in the United States ("GAAP"). This discussion should be read in conjunction with the accompanying Consolidated Financial Statements and Notes to the Consolidated Financial Statements included in this Report. The preparation of these financial statements requires us to make estimates and judgments affecting the reported amounts of assets, liabilities, revenues and expenses and related disclosure of contingent assets and liabilities. Although our significant accounting policies are described in "
Note 1. Nature of Business and Summary of Significant Accounting Policies
", the following discussion is intended to highlight and describe those accounting policies that are especially critical to the preparation of our consolidated financial statements.
A critical accounting policy is defined as a policy that is both very important to the portrayal of a company's financial condition and results and requires management's most difficult, subjective or complex judgments. We regularly review our critical accounting policies and evaluate them based on these factors. We believe the estimation process for uniquely configured contracts and warranties are most material and critical. These areas contain estimates with a reasonable likelihood to change, and those changes could have a material impact on our financial condition and reported results of operations. The estimation processes for these areas are also difficult, subjective and use complex judgments. Our critical accounting estimates are based on historical experience; on our interpretation of GAAP, current laws and regulations; and on various other assumptions believed to be reasonable under the circumstances, the results of which form the basis for making judgments about the carrying values of assets and liabilities not readily apparent from other sources. Actual results may differ from these estimates.
Revenue recognition on uniquely configured contracts.
Revenue for uniquely configured (custom) or integrated systems is recognized over time using the cost incurred input method. Over time revenue recognition is appropriate because we have no alternative use for the uniquely configured system and have an enforceable right to payment for work performed. The cost incurred input method measures cost incurred to date compared to estimated total costs for each contract. This method is the most faithful depiction of our performance because it measures the value of the contract transferred to the customer. Costs to perform the contract include direct and indirect costs for contract design, production, integration, installation, and assurance-type warranty reserve. Direct costs include material and components; manufacturing, project management and engineering labor; and subcontracting expenses. Indirect costs include allocated
24
charges for such items as facilities and equipment depreciation and general overhead. Provisions of estimated losses on uncompleted contracts are made in the period when such losses are capable of being estimated.
We may have multiple performance obligations in these types of contracts; however, a majority are treated as a combined single performance obligation. In our judgment, this accounting treatment is most appropriate because the substantial part of our promise to our customer is to provide significant integration services and incorporate individual goods and services into a combined output or system. Often times the system is customized or significantly modified to the customer's desired configurations and location, and the interrelated goods and services provide utility to the customer as a package. See "
Note 1. Nature of Business and Summary of Significant Accounting Policies
" of the Notes to our Consolidated Financial Statements included in this Form 10-K for further information on our revenue recognition policies.
Warranties.
We have recognized an accrued liability for warranty obligations equal to our estimate of the actual costs to be incurred in connection with our performance under contractual warranties. Warranty estimates include the cost of direct material and labor estimates to repair products over their warranty coverage period. Generally, estimates are based on historical experience considering known or expected changes. If we would become aware of an increase in our estimated warranty costs, additional accruals may become necessary, resulting in an increase in cost of sales. Although prior estimates have been materially correct, estimates for warranty liabilities can change based on actual versus estimated defect rates over the lifetime of the warranty coverage, a difference in actual to estimated costs to conduct repairs for the components and related labor needed, and other site related actual to estimated cost changes.
As of
May 2, 2020
and
April 27, 2019
, we had approximately
$25.6 million
and
$24.5 million
accrued for these warranty obligations, respectively. Due to the difficulty in estimating probable costs related to certain warranty obligations, there is a reasonable likelihood that the ultimate remaining costs to remediate the warranty claims could differ materially from the recorded accrued liabilities. See "
Note 19. Commitments and Contingencies
" of the Notes to our Consolidated Financial Statements included in this Form 10-K for further information on warranties.
RECENT ACCOUNTING PRONOUNCEMENTS
For a summary of recently issued accounting pronouncements and the effects those pronouncements have on our financial results, refer to "
Note 1. Nature of Business and Summary of Significant Accounting Policies
" of the Notes to our Consolidated Financial Statements included elsewhere in this Form 10-K.
RESULTS OF OPERATIONS
Daktronics, Inc. operates on a 52- or 53-week fiscal year, with our fiscal year ending on the Saturday closest to April 30 of each year. When April 30 falls on a Wednesday, the fiscal year ends on the preceding Saturday. Within each fiscal year, each quarter is comprised of 13-week periods following the beginning of each fiscal year. In each 53-week year, an additional week is added to the first quarter, and each of the last three quarters is comprised of a 13-week period. The fiscal years ended
April 27, 2019
and
April 28, 2018
contained operating results for 52 weeks, while the fiscal year ended
May 2, 2020
contained operating results for 53 weeks.
Net Sales
The following table shows information regarding net sales for the fiscal years ended
May 2, 2020
,
April 27, 2019
, and
April 28, 2018
:
25
|
|
|||||||||||||||||||||||
|
May 2, 2020
|
April 27, 2019
|
2020 vs 2019
|
April 28, 2018
|
2019 vs 2018
|
|||||||||||||||||||
|
(dollars in thousands)
|
Amount
|
Amount
|
Dollar Change
|
Percent Change
|
Amount
|
Dollar Change
|
Percent Change
|
||||||||||||||||
|
Net Sales:
|
|
|
|
||||||||||||||||||||
|
Commercial
|
$
|
152,627
|
|
$
|
148,833
|
|
$
|
3,794
|
|
2.5
|
%
|
$
|
134,535
|
|
$
|
14,298
|
|
10.6
|
%
|
||||
|
Live Events
|
196,591
|
|
170,952
|
|
25,639
|
|
15.0
|
|
236,333
|
|
(65,381
|
)
|
(27.7
|
)
|
|||||||||
|
High School Park and Recreation
|
96,414
|
|
91,187
|
|
5,227
|
|
5.7
|
|
87,627
|
|
3,560
|
|
4.1
|
|
|||||||||
|
Transportation
|
70,139
|
|
64,391
|
|
5,748
|
|
8.9
|
|
59,578
|
|
4,813
|
|
8.1
|
|
|||||||||
|
International
|
93,161
|
|
94,341
|
|
(1,180
|
)
|
(1.3
|
)
|
92,457
|
|
1,884
|
|
2.0
|
|
|||||||||
|
|
$
|
608,932
|
|
$
|
569,704
|
|
$
|
39,228
|
|
6.9
|
%
|
$
|
610,530
|
|
$
|
(40,826
|
)
|
(6.7
|
)%
|
||||
|
Orders:
|
|
|
|
|
|
|
|
|
|
|
|||||||||||||
|
Commercial
|
$
|
146,182
|
|
$
|
162,592
|
|
$
|
(16,410
|
)
|
(10.1
|
)%
|
$
|
135,363
|
|
$
|
27,229
|
|
20.1
|
%
|
||||
|
Live Events
|
203,834
|
|
179,217
|
|
24,617
|
|
13.7
|
|
203,036
|
|
(23,819
|
)
|
(11.7
|
)
|
|||||||||
|
High School Park and Recreation
|
100,088
|
|
98,139
|
|
1,949
|
|
2.0
|
|
87,243
|
|
10,896
|
|
12.5
|
|
|||||||||
|
Transportation
|
83,473
|
|
73,059
|
|
10,414
|
|
14.3
|
|
50,581
|
|
22,478
|
|
44.4
|
|
|||||||||
|
International
|
87,201
|
|
95,873
|
|
(8,672
|
)
|
(9.0
|
)
|
107,244
|
|
(11,371
|
)
|
(10.6
|
)
|
|||||||||
|
|
$
|
620,778
|
|
$
|
608,880
|
|
$
|
11,898
|
|
2.0
|
%
|
$
|
583,467
|
|
$
|
25,413
|
|
4.4
|
%
|
||||
Fiscal Year 2020
as compared to
Fiscal Year 2019
Sales and orders in all business units were impacted as a result of
fiscal 2020
including 53 weeks compared to the more common 52 weeks. Fiscal 2019 contained 52 weeks.
For net sales, during
fiscal 2020
, we achieved a $11.5 million per week average run rate as compared to $11.0 million per week during
fiscal 2019
, or an approximate 4.5% increase. This change was driven by the order volume reasons described below and the timing of order conversion based on our customer's delivery schedules.
For orders, during
fiscal 2020
and
fiscal 2019
, we achieved a $11.7 million per week average run rate. This was due to increases in orders placed during
fiscal 2020
related to new releases of our product offerings, which were offset by a slow market in our account-based order placements due to COVID-19.
As we look into fiscal year 2021, the COVID-19 impact to the economy and changes in the near-term buying habits of our customers add uncertainty and potential business contraction in all business areas making it difficult to predict orders and sales.
Commercial:
The
increase
in net sales for
fiscal 2020
compared to
fiscal 2019
was primarily due to the timing of projects in the spectacular and OOH niches, which was partly offset by a decrease in net sales in the on-premise niche primarily due to lighter demand.
The
decrease
in orders for
fiscal 2020
compared to
fiscal 2019
was primarily due to a decrease in large orders in the spectacular niche and a slow market in the OOH niche.
We continue to see increased adoption of video solutions in our Commercial business unit marketplace. Depending on the duration of the current economic conditions, we see opportunities for orders and sales over the coming years in our OOH, on-premise, and spectacular focused niches due to replacement cycles, expansion of dynamic messaging systems usage, our releases of new solutions, additional distribution methods, and increased market size due to the decline of digital pricing over the years as well as the desire for higher resolution technology. Due to a number of factors, such as the discretionary nature of customers committing to a system, economic dependencies, regulatory environments, competitive factors, and the uncertainty of the impacts of the COVID-19 pandemic, it is difficult to predict orders and net sales for fiscal
2021
. We expect growth in the Commercial business unit over the long-term, assuming favorable economic conditions and our success in counteracting competitive pressures.
Live Events:
The
increase
in net sales for
fiscal 2020
compared to
fiscal 2019
was primarily due to the timing of the demand for upgraded or new solutions for arenas and professional sports stadiums.
The
increase
in orders for
fiscal 2020
compared to
fiscal 2019
was primarily the result of an increase in the number of projects for college and university venues, minor league and professional sports stadiums, and arena venues.
26
We continue to see ongoing interest from venues at all levels to increase the size and capability of their display systems and in the usage of dynamic messaging systems throughout their facilities in our Live Events business unit marketplace. A number of factors, such as the discretionary nature of customers committing to upgrade systems, long replacement cycles, the limited number of large custom projects, competitive factors, and the uncertainty of the impacts of the COVID-19 pandemic, make forecasting fiscal
2021
orders and net sales difficult. We expect continued growth in this business unit over the long-term, assuming favorable economic conditions and success in counteracting competitive pressures.
High School Park and Recreation:
The
increase
in net sales for
fiscal 2020
compared to
fiscal 2019
was primarily due to the timing of converting orders and backlog into sales.
The
increase
in orders for
fiscal 2020
compared to
fiscal 2019
was primarily due to the variability in order timing.
We expect larger video systems and our classic scoring and message centers to remain in demand in fiscal
2021
, primarily in high school facilities, which benefit from our sports marketing services that generate advertising revenue to fund the display systems and because of schools' desires to communicate with students and parents using these systems. Several factors, such as the potential reduction in the availability of advertising revenues, the discretionary nature of customers committing to upgrade systems, replacement cycles, competitive factors, and the uncertainty of the impacts of the COVID-19 pandemic, make forecasting fiscal
2021
orders and net sales difficult. We expect growth in this business unit over the long-term, assuming favorable economic conditions.
Transportation:
The
increase
in net sales for
fiscal 2020
compared to
fiscal 2019
was primarily due to the variability caused by large order timing.
The
increase
in orders for
fiscal 2020
compared to
fiscal 2019
was primarily due to the variability of timing caused by large projects and an increase in demand for intelligent transportation systems.
Several factors, such as transportation funding, the competitive environment, customer delivery changes, and the uncertainty of the impacts of the COVID-19 pandemic, make forecasting orders and net sales difficult for fiscal
2021
. However, the stability of long-term federal transportation funding and the number of capital projects for highways and public transit that include dynamic message signs and for advertising and wayfinding use in public transport and airport terminals continues to rise. We expect continued growth in this business unit over the long-term, assuming favorable economic conditions and continued transportation funding.
International:
The
decrease
in net sales for
fiscal 2020
compared to
fiscal 2019
was primarily the result of the variability of timing caused by large spectacular, OOH, and sport stadium projects.
The
decrease
in orders for
fiscal 2020
compared to
fiscal 2019
was primarily due to general variations in the timing of account-based order placements.
We expect demand for larger video systems for commercial and sports applications, indoor and outdoor OOH applications, and transportation applications to remain strong over the long-term. Macroeconomic factors, the discretionary nature of customers committing to new systems or replacements, the pace of market growth, and the uncertainty of the impacts of the COVID-19 pandemic, may impact order bookings and timing, making it difficult to predict order and sales levels for fiscal
2021
. For the long-term, we believe the International business unit has the potential for sales growth as we penetrate markets with our established sales networks to increase our International market share, continue to enhance our tailored portfolio of product and control solution offerings, and increase the use and adoption of our technology globally.
Product Order Backlog:
The product order backlog as of
May 2, 2020
was
$212 million
as compared to
$202 million
as of
April 27, 2019
. Historically, our product order backlog varies due to the seasonality of our business, the timing of large projects, and customer delivery schedules for these orders. The product order backlog increased from one year ago in our Live Events, High School Park and Recreation and Transportation business units and decreased in our Commercial and International business units.
Fiscal Year 2019
as compared to
Fiscal Year 2018
Commercial
: The increase in net sales for fiscal 2019 compared to fiscal 2018 was primarily due to the timing of large custom projects in the spectacular niche and increased order volumes in the on-premise and OOH niches.
The increase in orders for fiscal 2019 compared to fiscal 2018 was primarily due to an active spectacular market in Times Square, Las Vegas, and other similar locations. In addition, orders grew in the OOH niche because of higher demand for digital billboard replacements and new installations and due to winning a multimillion-dollar OOH airport installation.
27
Live Events
: The decrease in net sales for fiscal 2019 compared to fiscal 2018 was primarily due to decreased orders for the reasons described below.
We had continued order success throughout most of our Live Event sports and entertainment markets; however, we had a decrease in orders for fiscal 2019 compared to fiscal 2018, which was primarily the result of fewer project wins in professional sports due to fewer project opportunities in the market and strong competition. During fiscal 2018, we were awarded three projects each valued at over $5 million as compared to one project valued at over $5 million in fiscal 2019.
High School Park and Recreation
: The increase in net sales for fiscal 2019 compared to fiscal 2018 was primarily due to increased order volumes described below and the related timing of converting orders into sales dependent on customers' schedules.
The increase in orders for fiscal 2019 compared to fiscal 2018 was primarily due to the market’s increased demand for video products and control systems and our on-going success selling catalog marques and scoring systems. Video projects have a larger average selling price than historical sales, which consisted of a higher concentration of classic scoring systems in this business unit.
Transportation
: The increase in net sales for fiscal 2019 compared to fiscal 2018 was primarily due to the increased production of large orders, the timing of customer schedules, and an increase in demand for intelligent transportation systems.
The increase in orders for fiscal 2019 compared to fiscal 2018 was primarily due to increased orders for intelligent transportation systems and tolling applications as state transportation departments and private public partnerships continue to invest in ways to better inform travelers, manage transport systems, and collect revenues.
International
: The increase in net sales for fiscal 2019 compared to fiscal 2018 was primarily the result of timing on large project orders being completed.
The decrease in orders for fiscal 2019 compared to fiscal 2018 was primarily due to the general variations in timing of large contracts and account-based order placements.
Gross Profit
|
|
Year Ended
|
||||||||||||||||||||
|
|
May 2, 2020
|
April 27, 2019
|
April 28, 2018
|
||||||||||||||||||
|
(dollars in thousands)
|
Amount
|
As a Percent of Net Sales
|
Amount
|
As a Percent of Net Sales
|
Amount
|
As a Percent of Net Sales
|
|||||||||||||||
|
Commercial
|
$
|
29,246
|
|
19.2
|
%
|
$
|
31,785
|
|
21.4
|
%
|
$
|
26,665
|
|
19.8
|
%
|
||||||
|
Live Events
|
39,518
|
|
20.1
|
|
32,164
|
|
18.8
|
|
49,755
|
|
21.1
|
|
|||||||||
|
High School Park and Recreation
|
28,874
|
|
29.9
|
|
26,858
|
|
29.5
|
|
29,317
|
|
33.5
|
|
|||||||||
|
Transportation
|
23,910
|
|
34.1
|
|
22,525
|
|
35.0
|
|
21,247
|
|
35.7
|
|
|||||||||
|
International
|
17,152
|
|
18.4
|
|
16,962
|
|
18.0
|
|
18,685
|
|
20.2
|
|
|||||||||
|
|
$
|
138,700
|
|
22.8
|
%
|
$
|
130,294
|
|
22.9
|
%
|
$
|
145,669
|
|
23.9
|
%
|
||||||
Fiscal Year 2020
as compared to
Fiscal Year 2019
Gross profit
is net sales less cost of sales. Cost of sales consists primarily of inventory, logistics related costs including tariffs and duties
consumables, salaries, other employee-related costs, facilities-related costs for manufacturing locations, machinery and equipment maintenance and depreciation, site sub-contractors, warranty costs, and other service delivery expenses.
The gross profit percentage for
fiscal 2020
compared to
fiscal 2019
remained relatively flat. This was primarily due to an increase in tariff related expenses of approximately $3.0 million, or a 0.5% impact to gross profit, as last year at this time tariffs were just being introduced on US imports of aluminum, steel, and components from China. We also experienced additional expenses of approximately $4.3 million for project delivery costs and for an existing litigation claim estimate. These increases were offset by higher sales volumes over relatively fixed infrastructure costs and a decrease in warranty expense. Total warranty as a percent of sales decreased to 1.9% for
fiscal 2020
as compared to 2.3% for
fiscal 2019
. The following describes the overall impact by business unit for
fiscal 2020
as compared to
fiscal 2019
:
The gross profit percent change in our Commercial, Live Events, High School Park and Recreation, and International business units are due to the reasons described above. The gross profit percent decreased in the Transportation business unit primarily due to increased warranty expense, which was partially offset by the reasons described above.
28
It is difficult to project gross profit levels for fiscal
2021
because of the uncertainty regarding the level of sales, the sales mix and timing, COVID-19 impact, and the competitive factors in our business. We are focused on improving our gross profit margins as we execute our strategies for improved profitability, which include releasing new product designs to lower overall costs of the product; improving reliability to reduce warranty expenses; expanding our global capacity and planning; meeting customer solution expectations; and continued improvements in operational effectiveness in manufacturing, installation, and service delivery areas.
Fiscal Year 2019
as compared to
Fiscal Year 2018
The gross profit percentage decrease for fiscal 2019 compared to fiscal 2018 was primarily due to lower sales volumes over relatively fixed infrastructure costs, $3.4 million in expenses for an unprofitable project and a litigation claim, a $1.3 million gain from the sale of our non-digital assets that was recorded in fiscal 2018, and an increase in commodity costs due to the global trade environment, which was partly offset by lower warranty expenses and a change in sales mix. The overall impact on each business unit are for the reasons described above.
Contribution Margin
|
|
Year Ended
|
|||||||||||||||||||||||||
|
May 2, 2020
|
April 27, 2019
|
April 28, 2018
|
||||||||||||||||||||||||
|
(dollars in thousands)
|
Amount
|
As a Percent of Net Sales
|
Percent Change
|
Amount
|
As a Percent of Net Sales
|
Percent Change
|
Amount
|
As a Percent of Net Sales
|
||||||||||||||||||
|
Commercial
|
$
|
9,897
|
|
6.5
|
%
|
(25.1
|
)%
|
$
|
13,218
|
|
8.9
|
%
|
65.5
|
%
|
$
|
7,986
|
|
5.9
|
%
|
|||||||
|
Live Events
|
26,074
|
|
13.3
|
|
41.1
|
|
18,484
|
|
10.8
|
|
(47.8
|
)
|
35,439
|
|
15.0
|
|
||||||||||
|
High School Park and Recreation
|
15,341
|
|
15.9
|
|
5.7
|
|
14,518
|
|
15.9
|
|
(20.7
|
)
|
18,317
|
|
20.9
|
|
||||||||||
|
Transportation
|
19,566
|
|
27.9
|
|
7.2
|
|
18,260
|
|
28.4
|
|
7.1
|
|
17,048
|
|
28.6
|
|
||||||||||
|
International
|
1,920
|
|
2.1
|
|
64.7
|
|
1,166
|
|
1.2
|
|
(71.7
|
)
|
4,119
|
|
4.5
|
|
||||||||||
|
|
$
|
72,798
|
|
12.0
|
%
|
10.9
|
%
|
$
|
65,646
|
|
11.5
|
%
|
(20.8
|
)%
|
$
|
82,909
|
|
13.6
|
%
|
|||||||
Fiscal Year 2020
as compared to
Fiscal Year 2019
Contribution margin
consists of gross profit less selling expenses. Selling expenses consist primarily of salaries, other employee-related costs, travel and entertainment expenses, facility-related costs for sales and service offices, bad debt expenses, third-party commissions and expenditures for marketing efforts, including the costs of collateral materials, conventions and trade shows, product demonstrations, customer relationship management systems, and supplies.
Contribution margin is impacted by the previously described sales and gross margin for each business unit. The impact of changes in selling expenses on each business unit's contribution margin is as follows:
All areas of selling expenses were impacted as a result of
fiscal 2020
including 53 weeks compared to the more common 52 weeks. Fiscal 2019 contained 52 weeks. Selling expense for
fiscal 2020
compared to
fiscal 2019
increased in our Commercial, Live Events, High School Park and Recreation, and Transportation business units primarily due to personnel related expenses and increased marketing efforts. Selling expense for
fiscal 2020
compared to
fiscal 2019
decreased in our International business unit primarily due to bad debt recovery and a decrease in third-party commissions.
We expect selling expenses will decrease in dollars for fiscal
2021
as compared to
fiscal 2020
due to initiatives to reduce costs in anticipation of the potential impact of the COVID-19 pandemic.
Fiscal Year 2019
as compared to
Fiscal Year 2018
Selling expense for fiscal 2019 compared to fiscal 2018 increased in our High School Park and Recreation and International business units, decreased in our Live Events business unit, and remained relatively flat in our Commercial and Transportation business units. High School Park and Recreation selling expenses increased year-over-year primarily due to the allocation of additional resources to this unit's selling efforts. International selling expenses increased year-over-year primarily due to third-party commissions and increased personnel related expenses. Live Events selling expenses decreased year-over-year primarily due to decreases in bad debt expenses and travel and entertainment expenses.
29
Other Operating Expenses
|
|
Year Ended
|
|||||||||||||||||||||||||
|
May 2, 2020
|
April 27, 2019
|
April 28, 2018
|
||||||||||||||||||||||||
|
(dollars in thousands)
|
Amount
|
As a Percent of Net Sales
|
Percent Change
|
Amount
|
As a Percent of Net Sales
|
Percent Change
|
Amount
|
As a Percent of Net Sales
|
||||||||||||||||||
|
General and administrative
|
$
|
35,193
|
|
5.8
|
%
|
1.1
|
%
|
$
|
34,817
|
|
6.1
|
%
|
(0.3
|
)%
|
$
|
34,919
|
|
5.7
|
%
|
|||||||
|
Product design and development
|
$
|
37,772
|
|
6.2
|
%
|
6.2
|
%
|
$
|
35,557
|
|
6.2
|
%
|
0.1
|
%
|
$
|
35,530
|
|
5.8
|
%
|
|||||||
Fiscal Year 2020
as compared to
Fiscal Year 2019
All areas of operating expenses were impacted as a result of
fiscal 2020
including 53 weeks compared to the more common 52 weeks. Fiscal 2019 contained 52 weeks.
General and administrative expenses
consist primarily of salaries, other employee-related costs, professional fees, shareholder relations costs, facilities and equipment-related costs for administrative departments, training costs, and the cost of supplies.
General and administrative expenses in
fiscal 2020
as compared to
fiscal 2019
remained relatively flat.
We expect general and administrative expenses to decrease in dollars for fiscal
2021
as compared to
fiscal 2020
due to initiatives to reduce costs in anticipation of the potential impact of the COVID-19 pandemic.
Product design and development expenses
consist primarily of salaries, other employee-related costs, professional services, facilities costs and equipment-related costs and supplies. Product design and development investments in the near term are focused on developing or improving our video technology over a wide range of pixel pitches for both indoor and outdoor applications. These new or improved technologies are focused on varied pixel density for image quality and use, expanded product line offerings for our various markets and geographies, improved quality and reliability, and improved cost points. During fiscal
2021
, we plan to make continued investments in our software and controller capabilities throughout our various product offerings. Through our design efforts, we focus on standardizing display components and control systems for both single site and network displays.
Our costs for product design and development represent an allocated amount of costs based on time charges, professional services, material costs and the overhead of our engineering departments. Generally, a significant portion of our engineering time is spent on product design and development, while the rest is allocated to large contract work and included in cost of sales.
Product design and development expenses in
fiscal 2020
compared to
fiscal 2019
increased primarily due to increased labor costs and professional services assigned to product design and development projects. We expect a decrease in expenditures for product design and development for fiscal
2021
as compared to
fiscal 2020
due to initiatives to reduce costs in anticipation of the potential impact of the COVID-19 pandemic.
Fiscal Year 2019
as compared to
Fiscal Year 2018
General and administrative expenses and product design and development expenses in fiscal 2019 compared to fiscal 2018 remained relatively flat.
Other Income and Expenses
|
|
Year Ended
|
|||||||||||||||||||||||||
|
May 2, 2020
|
April 27, 2019
|
April 28, 2018
|
||||||||||||||||||||||||
|
(dollars in thousands)
|
Amount
|
As a Percent of Net Sales
|
Percent Change
|
Amount
|
As a Percent of Net Sales
|
Percent Change
|
Amount
|
As a Percent of Net Sales
|
||||||||||||||||||
|
Interest income, net
|
$
|
699
|
|
0.1
|
%
|
(19.7
|
)%
|
$
|
871
|
|
0.2
|
%
|
72.1
|
%
|
$
|
506
|
|
0.1
|
%
|
|||||||
|
Other (expense) income, net
|
$
|
(541
|
)
|
(0.1
|
)%
|
(50.2
|
)%
|
$
|
(1,087
|
)
|
(0.2
|
)%
|
102.4
|
%
|
$
|
(537
|
)
|
(0.1
|
)%
|
|||||||
Fiscal Year 2020
as compared to
Fiscal Year 2019
Interest income, net
:
We generate interest income through short-term cash investments, marketable securities, and product sales on an installment basis or in exchange for the rights to sell and retain advertising revenues from displays, which result in long-term receivables. Interest expense is comprised primarily of interest costs on long-term obligations.
30
The change in interest income, net for
fiscal 2020
as compared to
fiscal 2019
was primarily due to the change in investment levels caused by the volatility of working capital needs.
Other (expense) income, net
:
The change in other income and expense, net for
fiscal 2020
as compared to
fiscal 2019
was primarily due to foreign currency volatility and losses recorded from equity method affiliates.
Fiscal Year 2019
as compared to
Fiscal Year 2018
The change in
interest income, net
for fiscal 2019 as compared to fiscal 2018 was primarily due to the change in investment levels caused by the volatility of working capital needs.
Other (expense) income, net:
The change in other income and expense, net for fiscal 2019 as compared to fiscal 2018 was primarily due to foreign currency volatility and the losses recorded from an equity method affiliate.
Income Taxes
Our effective tax rate was approximately
80.6 percent
and
55.2 percent
for fiscal years
2019
and
2018
, respectively. For fiscal 2020, our income tax benefit was the result of permanent tax credits reduced by valuation allowances and minor pre-tax book loss creating a meaningless effective tax rate.
Fiscal 2019 effective tax rate was impacted due to the tax benefits of a book loss plus permanent credits and deductions, the release of $2.7 million in unrecognized tax benefits, and the reversal of a valuation allowance of $0.5 million related to foreign net operating loss carryforwards.
Fiscal 2018 effective tax rate was significantly impacted by the Tax Act, which was signed into law on December 22, 2017. Most notably, the Tax Act reduced the statutory U.S. federal corporate income tax rate from 35% to 21%. Because we file our tax return based on our fiscal year rather than the calendar year, the statutory tax rate for our fiscal 2018 tax return was a blended rate of 30.4%. In addition to the effect of the lower overall federal tax rate, the Tax Act resulted in a provisional $3.5 million one-time expense for the estimated re-measurement of our net deferred tax asset and a $0.3 million estimated one-time transition tax on certain undistributed earnings of our foreign subsidiaries in fiscal 2018.
Our consolidated effective tax rate is impacted by the statutory income tax rates applicable to each of the jurisdictions in which we operate. Due to various factors, and because we operate in multiple state and foreign jurisdictions, our effective tax rate is subject to fluctuation. See "
Note 15. Income Taxes
" of the Notes to our Consolidated Financial Statements included in this Form 10-K for further information.
LIQUIDITY AND CAPITAL RESOURCES
|
|
Year Ended
|
|||||||||
|
|
May 2,
2020 |
April 27,
2019 |
Percent Change
|
|||||||
|
(dollars in thousands)
|
||||||||||
|
Net cash provided by (used in):
|
|
|
|
|||||||
|
Operating activities
|
$
|
10,808
|
|
$
|
29,546
|
|
(63.4
|
)%
|
||
|
Investing activities
|
(4,271
|
)
|
(11,842
|
)
|
(63.9
|
)
|
||||
|
Financing activities
|
(1,978
|
)
|
(11,932
|
)
|
(83.4
|
)
|
||||
|
Effect of exchange rate changes on cash
|
111
|
|
215
|
|
(48.4
|
)
|
||||
|
Net increase in cash, cash equivalents and restricted cash
|
$
|
4,670
|
|
$
|
5,987
|
|
(22.0
|
)%
|
||
31
Cash decreased by
$4.7 million
in
fiscal 2020
as compared to
$6.0 million
in
fiscal 2019
, which is primarily due to the conversion of marketable securities to cash and borrowings on notes payable, which is to pay for our investments in property and equipment, equity investments, dividends, and share repurchases.
Net cash provided by operating activities
:
Operating cash flows consist primarily of net income adjusted for non-cash items, including depreciation and amortization, stock-based compensation, deferred income taxes, and the effect of changes in operating assets and liabilities. Overall, changes in net operating assets and liabilities can be impacted by the timing of cash flows on large orders, which can cause significant short-term and seasonal fluctuations in inventory, accounts receivables, accounts payable, contract assets and liabilities, and various other operating assets and liabilities. Variability in contract assets and liabilities relates to the timing of billings on construction-type contracts and revenue recognition, which can vary significantly depending on contractual payment terms and build and installation schedules. Balances are also impacted by the seasonality of the sports market. For specific quantitative changes in operating assets and liabilities, see "
Note 16. Cash Flow Information
" of the Notes to our Consolidated Financial Statements included in this Form 10-K.
Year-to-date cash provided from operations in
fiscal 2020
differed as compared to
fiscal 2019
primarily due to order volatility in our Commercial, Live Events, and Transportation business units, which accounted for most of the changes in accounts receivable, inventory, contract assets, long-term receivables, and contract liabilities as compared to last year.
Net cash provided by operating activities
was
$10.8 million
for
fiscal 2020
compared to
$29.5 million
in
fiscal 2019
. The
$18.7 million
decrease
in cash provided by operating activities from
fiscal 2019
to
fiscal 2020
was the result of changes in net operating assets and liabilities of
$20.0 million
; a
$0.9 million
decrease
in depreciation and amortization; a
$0.4 million
decrease
in other non-cash items, net; adjusted by an
increase
of
$1.4 million
in net income and an
increase
of
$1.2 million
in our deferred income taxes, net.
Net cash used in investing activities
:
Net cash used in investing activities
totaled
$4.3 million
for
fiscal 2020
compared to
$11.8 million
in
fiscal 2019
. During
fiscal 2020
, we had no purchases of marketable securities compared to
$25.3 million
used to purchase marketable securities in
fiscal 2019
. Proceeds from sales or maturities of marketable securities totaled
$25.2 million
in
fiscal 2020
as compared to
$33.7 million
in
fiscal 2019
. Net proceeds of marketable securities in
fiscal 2020
were utilized to cover working capital needs for changes in operating assets and liabilities. Purchases of property and equipment totaled
$18.1 million
in
fiscal 2020
compared to
$17.3 million
in
fiscal 2019
. Purchases of and loans to equity investments totaled
$11.7 million
in
fiscal 2020
as compared to
$1.3 million
in
fiscal 2019
. During
fiscal 2019
, we had a net cash outflow of
$2.3 million
for the acquisition of assets of AJT Systems, Inc.
Net cash used in financing activities
:
Net cash used in financing activities
was
$2.0 million
for
fiscal 2020
compared to
$11.9 million
in
fiscal 2019
. Borrowings on notes payable for
fiscal 2020
was
$15.0 million
compared to no borrowings in
fiscal 2019
. Dividends of
$9.0 million
, or
$0.20
per share, were paid to Daktronics shareholders during
fiscal 2020
compared to dividends of
$12.6 million
, or
$0.28
per share, paid to Daktronics shareholders during
fiscal 2019
. Principal payments on long-term obligations for
fiscal 2020
was
$2.1 million
compared to
$0.5 million
in
fiscal 2019
, which was mostly related to contingent liability payments. During
fiscal 2020
, we repurchased
$5.6 million
of shares as part of the $40.0 million share repurchase plan authorized by our Board of Directors. There were no share repurchases in
fiscal 2019
. Proceeds from the exercise of stock options for
fiscal 2020
were
$0.0 million
compared to
$1.3 million
in
fiscal 2019
.
Other Liquidity and Capital Resources Discussion:
The timing and amounts of working capital changes, dividend payments, stock repurchase program, and capital spending impact our liquidity.
Working capital was
$106.0 million
at
May 2, 2020
and
$119.6 million
at
April 27, 2019
, respectively. The changes in working capital, particularly changes in accounts receivable, accounts payable, inventory, and contract assets and liabilities, and the sports market seasonality can have a significant impact on the amount of net cash provided by operating activities largely due to the timing of payments and receipts. On multimillion-dollar orders, the time between order acceptance and project completion may extend up to or exceed 12 months or more depending on the amount of custom work and a customer’s delivery needs. We often receive down payments or progress payments on these orders.
We had
$3.4 million
of retainage on long-term contracts included in receivables and contract assets as of
May 2, 2020
, which has an impact on our liquidity. We expect to collect these amounts within one year. When working capital is needed, we have historically financed our cash needs through a combination of cash flow from operations and borrowings under bank credit agreements. As of
May 2, 2020
, we were in compliance with all applicable bank loan covenants. For additional information on financing agreements, see, "
Note 10. Financing Agreements
" of the Notes to our Consolidated Financial Statements included in this Form 10-K.
We utilized cash on hand to pay dividends to our shareholders. The following table summarizes the quarterly dividends declared and/or paid since the prior fiscal year end of
April 27, 2019
:
32
|
Date Declared
|
Record Date
|
Payment Date
|
Amount per Share
|
|
May 30, 2019
|
June 10, 2019
|
June 20, 2019
|
$0.05
|
|
September 5, 2019
|
September 16, 2019
|
September 26, 2019
|
$0.05
|
|
December 4, 2019
|
December 16, 2019
|
December 26, 2019
|
$0.05
|
|
February 25, 2020
|
March 9, 2020
|
March 19, 2020
|
$0.05
|
As part of our COVID-19 response, our Board of Directors has suspended dividends for the foreseeable future. Future reinstatement cannot be predicted and is at the discretion of the Board of Directors. Future dividends are also impacted by the limitations imposed in our credit facility as further described in "
Note 10. Financing Agreements
" of the Notes to our Consolidated Financial Statements included in this Form 10-K.
On June 17, 2016, our Board of Directors authorized a share repurchase program allowing for the purchase of shares from the open market and in privately negotiated transactions. Although we have authorization for additional share repurchases and could use repurchased shares in treasury after purchase, all subsequent purchases or sales are reviewed regularly for price, market conditions, and compliance with various regulations for company share repurchase programs. For additional information on the share repurchase program, see, "
Note 11. Share Repurchase Program
" of the Notes to our Consolidated Financial Statements included in this Form 10-K. As disclosed in our Current Report on Form 8-K filed on April 1, 2020, as part of our COVID-19 response, the Board of Directors voted to suspend stock repurchases under our share repurchase program for the foreseeable future.
We are sometimes required to obtain performance bonds for display installations, and we have a bonding line available through a surety company for an aggregate of $150.0 million in bonded work outstanding. If we were unable to complete the work, and our customer would call upon the bond for payment, the surety company would subrogate its loss to Daktronics. At
May 2, 2020
, we had
$18.2 million
of bonded work outstanding against this line.
During fiscal year 2020, we offered special voluntary retirement and voluntary exit offering ("Offering") and on May 13, 2020, we conducted a reduction in force to adjust our capacity and reduce on-going expenses due to the uncertainties created by the COVID-19 pandemic.
Under the Offering, employees had until June 2020 to choose to participate. During the first quarter of fiscal 2021,
57
employees agreed to participate and will complete employment by the end of June 2020. The approximate cost of this program was
$0.9 million
. Under the reduction in force, employment was terminated with
98
employees with severance totaling
$1.4 million
. These costs are fiscal 2021 expenses.
While it is difficult to estimate the longevity and severity of the COVID-19 pandemic impact to the economy and to our financial
position, operating results, and cash flows, we are taking proactive steps to solidify our financial position and mitigate any adverse
consequences. These steps include:
|
•
|
preserving liquidity by drawing down $15 million from our existing line of credit and pursuing other sources of financing;
|
|
•
|
reducing investments in capital assets; we estimate less than $15 million in capital expenses in fiscal year 2020;
|
|
•
|
reducing executive pay and Board member compensation;
|
|
•
|
utilizing tax and other government opportunities to improve liquidity;
|
|
•
|
temporarily furloughing and permanently reducing our staffing and reducing salary, where necessary, to maintain a right-sized skilled workforce;
|
|
•
|
instituting other costs reductions across the business;
|
|
•
|
suspending stock repurchases under our share repurchase program; and
|
|
•
|
suspending dividend declarations for the foreseeable future.
|
We believe these measures are necessary to help preserve our ability to borrow for liquidity needs and provide adequate working capital to weather the economic downturn caused by the COVID-19 pandemic. However, no assurance can be made that we will be able to secure such financing, if needed, on favorable terms or at all, or that these strategies will be successful. We continue to carefully monitor this crisis and will take additional actions as needed.
OFF-BALANCE SHEET ARRANGEMENTS AND CONTRACTUAL OBLIGATIONS
We are obligated to make cash payments in connection with non-cancelable operating leases for facilities and for unconditional purchase obligations primarily for inventory, information technology maintenance or software as a service commitment, advertising rights, and various other commitments.
33
We are contingently obligated to invest an additional $5 million in X Display Company ("XDC"), an equity method investment, if certain conditions are met. For additional information, see, "
Note 1. Nature of Business and Summary of Significant Accounting Policies
" of the Notes to our Consolidated Financial Statements included in this Form 10-K.
Our acquisition-related contingent payments are liabilities contingent on certain employment conditions. The present value of these payment obligations is recorded in the "Accrued expense" line item in our Consolidated Balance Sheets.
We provide bank or insurance company issued standby letters of credit, bank guarantees, or surety bonds to certain customers to guarantee our ability to complete a contract. If we do not meet the contractual specifications, the customer may obtain cash payment through these guarantees. We have provided an indemnity to the bank and insurance companies for these instruments.
We enter into written agreements with our customers, and those agreements often contain indemnification provisions that require us to make the customer whole if certain acts or omissions by us cause the customer financial loss. We make efforts to negotiate reasonable caps and limitations on the recovery of such damages. As of
May 2, 2020
, we were not aware of any indemnification claim from a customer.
As of
May 2, 2020
, our contractual obligations were as follows (in thousands):
|
Contractual Obligations
|
Total
|
Less than 1 year
|
1-3 Years
|
4-5 Years
|
After 5 Years
|
|||||||||||||||
|
Cash commitments:
|
|
|
|
|
|
|||||||||||||||
|
Unconditional purchase obligations
|
$
|
9,580
|
|
$
|
4,775
|
|
$
|
4,504
|
|
$
|
261
|
|
$
|
40
|
|
|||||
|
Operating leases
|
9,351
|
|
2,675
|
|
3,193
|
|
2,016
|
|
1,467
|
|
||||||||||
|
Investment in affiliate contingency
|
6,962
|
|
6,962
|
|
—
|
|
—
|
|
—
|
|
||||||||||
|
Acquisition-related contingency payments
|
571
|
|
376
|
|
195
|
|
—
|
|
—
|
|
||||||||||
|
Notes payable, bank
|
15,000
|
|
—
|
|
15,000
|
|
—
|
|
—
|
|
||||||||||
|
Unrecognized tax benefits
(1)
|
582
|
|
—
|
|
—
|
|
—
|
|
—
|
|
||||||||||
|
Total
|
$
|
42,046
|
|
$
|
14,788
|
|
$
|
22,892
|
|
$
|
2,277
|
|
$
|
1,507
|
|
|||||
|
Other off-balance sheet arrangements:
|
|
|
|
|
|
|
|
|
|
|
||||||||||
|
Standby letters of credit and bank guarantees
|
$
|
13,090
|
|
$
|
9,424
|
|
$
|
328
|
|
$
|
3,338
|
|
$
|
—
|
|
|||||
|
Surety bonds
|
$
|
18,212
|
|
$
|
18,212
|
|
$
|
—
|
|
$
|
—
|
|
$
|
—
|
|
|||||
(1) We are not able to reasonably estimate the timing of future payments relating to these non-current tax benefits. This
obligation is retired when the uncertain tax position is settled or when the applicable tax year is no longer subject to examination by the tax authorities.
Item 7A. QUANTITATIVE AND QUALITATIVE DISCLOSURES ABOUT MARKET RISK
Foreign Currency Exchange Rates
Our results of operations could be affected by factors such as changes in foreign currency rates or weak economic conditions in foreign markets. We derive net sales in U.S. dollars and other currencies including Canadian dollars, Euros, Chinese renminbi, British pounds, Australian dollars, or other currencies. For
fiscal 2020
,
17 percent
of net sales were derived in currencies other than U.S. dollars. We incur expenses in currencies other than U.S. dollars relating to specific contracts with customers and for our operations outside the U.S.
If we believe currency risk in any foreign location or specific sales or purchase transaction is significant, we utilize foreign exchange hedging contracts to manage our exposure to the currency fluctuations. The notional amount of the foreign currency agreements as of
May 2, 2020
was
$7.7 million
, and all contracts mature within
11
months. These contracts are marked to market each balance sheet date and are not designated as hedges. See "
Note 18. Derivative Financial Instruments
" of the Notes to our Consolidated Financial Statements included in this Form 10-K for further details. We estimate that a 10 percent change in all foreign exchange rates would impact our reported income before taxes by approximately
$0.9 million
. This sensitivity analysis disregards the possibilities that rates can move in opposite directions and that losses from one geographic area may be offset by gains from another geographic area.
Over the long term, net sales to international markets are expected to increase as a percentage of total net sales and, consequently, a greater portion of our business could be denominated in foreign currencies. As a result, operating results may become more subject to fluctuations based upon changes in the exchange rates of certain currencies in relation to the U.S. dollar. To the extent we engage in international sales denominated in U.S. dollars, an increase in the value of the U.S. dollar relative to foreign currencies could make our products less competitive in international markets. This effect is also impacted by sources of raw materials from international sources and costs of our sales, service, and manufacturing locations outside the U.S.
34
We will continue to monitor and minimize our exposure to currency fluctuations and, when appropriate, use financial hedging techniques to minimize the effect of these fluctuations. However, exchange rate fluctuations as well as differing economic conditions, changes in political climates, the effects of the COVID-19 pandemic, and other rules and regulations could adversely affect our ability to effectively hedge exchange rate fluctuations in the future.
We have foreign currency cash accounts to operate our global business. These accounts are impacted by changes in foreign currency rates. Of our
$40.4 million
in cash balances at
May 2, 2020
,
$36.0 million
were denominated in U.S. dollars, of which
$3.0 million
were held by our foreign subsidiaries. As of
May 2, 2020
, we had an additional
$4.4 million
in cash balances denominated in foreign currencies, of which
$3.9 million
were maintained in accounts of our foreign subsidiaries.
Interest Rate Risks
Our exposure to market risks relate primarily to changes in interest rates on cash and marketable securities. We do not expect our income or cash flows to be significantly impacted by interest rates.
Commodity Risk
We are dependent on basic raw materials, sub-assemblies, components, and other supplies used in our production operations. Our financial results could be affected by changes in the availability, prices, and global tariff regulations of these materials. Some of these materials are sourced from one or a limited number of suppliers in countries around the world. Some of these materials are also key source materials for our competitors and for other technology companies. Some of these materials are sourced outside of the countries in which we manufacture our products and are subject to transportation delays. Any of these factors may cause a sudden increase in costs and/or limited or unavailable supplies. As a result, we may not be able to acquire key production materials on a timely basis, which could adversely impact our ability to produce products and satisfy incoming sales orders on a timely basis. Our sourcing and material groups work to implement strategies to monitor and mitigate these risks. Periodically, we enter into pricing agreements or purchasing contracts under which we agree to purchase a minimum amount of product in exchange for guaranteed price terms over the length of the contract, which generally does not exceed one year. Over the years, we have been impacted by the factors noted; however, we believe that we have adequate sources of supply for our key materials in the near-term.
35
Item 8. FINANCIAL STATEMENTS AND SUPPLEMENTARY DATA
REPORT OF INDEPENDENT REGISTERED PUBLIC ACCOUNTING FIRM
To the shareholders and the Board of Directors of Daktronics, Inc.
Opinions on the Financial Statements and Internal Control over Financial Reporting
We have audited the accompanying consolidated balance sheets of Daktronics, Inc. and subsidiaries (the "Company") as of May 2, 2020 and April 27, 2019, the related consolidated statements of income, comprehensive income, shareholders' equity, and cash flows, for each of the three years in the period ended May 2, 2020, and the related notes and the schedule listed in the Index at Item 15 (collectively referred to as the "financial statements"). We also have audited the Company’s internal control over financial reporting as of May 2, 2020, based on criteria established in Internal Control - Integrated Framework (2013) issued by the Committee of Sponsoring Organizations of the Treadway Commission (COSO).
In our opinion, the financial statements referred to above present fairly, in all material respects, the financial position of the Company as of May 2, 2020 and April 27, 2019, and the results of its operations and its cash flows for each of the three years in the period ended May 2, 2020, in conformity with accounting principles generally accepted in the United States of America. Also, in our opinion, the Company maintained, in all material respects, effective internal control over financial reporting as of May 2, 2020, based on criteria established in Internal Control - Integrated Framework (2013) issued by COSO.
Basis for Opinions
The Company’s management is responsible for these financial statements, for maintaining effective internal control over financial reporting, and for its assessment of the effectiveness of internal control over financial reporting, included in the accompanying Management’s Report on Internal Control Over Financial Reporting. Our responsibility is to express an opinion on these financial statements and an opinion on the Company’s internal control over financial reporting based on our audits. We are a public accounting firm registered with the Public Company Accounting Oversight Board (United States) (PCAOB) and are required to be independent with respect to the Company in accordance with the U.S. federal securities laws and the applicable rules and regulations of the Securities and Exchange Commission and the PCAOB.
We conducted our audits in accordance with the standards of the PCAOB. Those standards require that we plan and perform the audits to obtain reasonable assurance about whether the financial statements are free of material misstatement, whether due to error or fraud, and whether effective internal control over financial reporting was maintained in all material respects.
Our audits of the financial statements included performing procedures to assess the risks of material misstatement of the financial statements, whether due to error or fraud, and performing procedures to respond to those risks. Such procedures included examining, on a test basis, evidence regarding the amounts and disclosures in the financial statements. Our audits also included evaluating the accounting principles used and significant estimates made by management, as well as evaluating the overall presentation of the financial statements. Our audit of internal control over financial reporting included obtaining an understanding of internal control over financial reporting, assessing the risk that a material weakness exists, and testing and evaluating the design and operating effectiveness of internal control based on the assessed risk. Our audits also included performing such other procedures as we considered necessary in the circumstances. We believe that our audits provide a reasonable basis for our opinions.
Definition and Limitations of Internal Control over Financial Reporting
A company’s internal control over financial reporting is a process designed to provide reasonable assurance regarding the reliability of financial reporting and the preparation of financial statements for external purposes in accordance with generally accepted accounting principles. A company’s internal control over financial reporting includes those policies and procedures that (1) pertain to the maintenance of records that, in reasonable detail, accurately and fairly reflect the transactions and dispositions of the assets of the company; (2) provide reasonable assurance that transactions are recorded as necessary to permit preparation of financial statements in accordance with generally accepted accounting principles, and that receipts and expenditures of the company are being made only in accordance with authorizations of management and directors of the company; and (3) provide reasonable assurance regarding prevention or timely detection of unauthorized acquisition, use, or disposition of the company’s assets that could have a material effect on the financial statements.
Because of its inherent limitations, internal control over financial reporting may not prevent or detect misstatements. Also, projections of any evaluation of effectiveness to future periods are subject to the risk that controls may become inadequate because of changes in conditions, or that the degree of compliance with the policies or procedures may deteriorate.
36
/s/ Deloitte & Touche LLP
Minneapolis, Minnesota
June 12, 2020
We have served as the Company's auditor since 2017.
37
|
DAKTRONICS, INC. AND SUBSIDIARIES
CONSOLIDATED BALANCE SHEETS
(in thousands, except per share data)
|
||||||||
|
May 2,
2020 |
April 27,
2019 |
|||||||
|
ASSETS
|
|
|||||||
|
CURRENT ASSETS:
|
|
|
||||||
|
Cash and cash equivalents
|
$
|
40,398
|
|
$
|
35,383
|
|
||
|
Restricted cash
|
14
|
|
359
|
|
||||
|
Marketable securities
|
1,230
|
|
26,344
|
|
||||
|
Accounts receivable, net
|
72,577
|
|
65,487
|
|
||||
|
Inventories
|
86,803
|
|
78,832
|
|
||||
|
Contract assets
|
35,467
|
|
33,704
|
|
||||
|
Current maturities of long-term receivables
|
3,519
|
|
2,300
|
|
||||
|
Prepaid expenses and other current assets
|
9,629
|
|
8,319
|
|
||||
|
Income tax receivables
|
548
|
|
1,087
|
|
||||
|
Property and equipment and other assets available for sale
|
1,817
|
|
1,858
|
|
||||
|
Total current assets
|
252,002
|
|
253,673
|
|
||||
|
Property and equipment, net
|
67,484
|
|
65,314
|
|
||||
|
Long-term receivables, less current maturities
|
1,114
|
|
1,214
|
|
||||
|
Goodwill
|
7,743
|
|
7,889
|
|
||||
|
Intangibles, net
|
3,354
|
|
4,906
|
|
||||
|
Investment in affiliates and other assets
|
27,683
|
|
5,052
|
|
||||
|
Deferred income taxes
|
13,271
|
|
11,168
|
|
||||
|
TOTAL ASSETS
|
$
|
372,651
|
|
$
|
349,216
|
|
||
|
LIABILITIES AND SHAREHOLDERS' EQUITY
|
|
|
|
|
||||
|
CURRENT LIABILITIES:
|
|
|
||||||
|
Accounts payable
|
47,834
|
|
44,873
|
|
||||
|
Contract liabilities
|
50,897
|
|
47,178
|
|
||||
|
Accrued expenses
|
36,626
|
|
32,061
|
|
||||
|
Warranty obligations
|
9,764
|
|
9,492
|
|
||||
|
Income taxes payable
|
844
|
|
468
|
|
||||
|
Total current liabilities
|
145,965
|
|
134,072
|
|
||||
|
Long-term warranty obligations
|
15,860
|
|
14,978
|
|
||||
|
Long-term contract liabilities
|
10,707
|
|
10,053
|
|
||||
|
Other long-term obligations
|
22,105
|
|
1,339
|
|
||||
|
Long-term income tax payable
|
582
|
|
578
|
|
||||
|
Deferred income taxes
|
452
|
|
533
|
|
||||
|
Total long-term liabilities
|
49,706
|
|
27,481
|
|
||||
|
SHAREHOLDERS' EQUITY:
|
|
|
|
|
||||
|
Common stock, no par value, authorized 115,000,000 shares; 45,913,209 and 45,317,267 shares issued at May 2, 2020 and April 27, 2019, respectively
|
60,010
|
|
57,699
|
|
||||
|
Additional paid-in capital
|
44,627
|
|
42,561
|
|
||||
|
Retained earnings
|
85,090
|
|
93,593
|
|
||||
|
Treasury stock, at cost, 1,343,281 and 303,957 shares at May 2, 2020 and April 27, 2019, respectively
|
(7,470
|
)
|
(1,834
|
)
|
||||
|
Accumulated other comprehensive loss
|
(5,277
|
)
|
(4,356
|
)
|
||||
|
TOTAL SHAREHOLDERS' EQUITY
|
176,980
|
|
187,663
|
|
||||
|
TOTAL LIABILITIES AND SHAREHOLDERS' EQUITY
|
$
|
372,651
|
|
$
|
349,216
|
|
||
|
See notes to consolidated financial statements.
|
|
|
|
|
||||
38
|
DAKTRONICS, INC. AND SUBSIDIARIES
CONSOLIDATED STATEMENTS OF OPERATIONS
(in thousands, except per share data)
|
|||||||||||
|
Year Ended
|
|||||||||||
|
May 2,
2020 |
April 27,
2019 |
April 28,
2018 |
|||||||||
|
Net sales
|
$
|
608,932
|
|
$
|
569,704
|
|
$
|
610,530
|
|
||
|
Cost of sales
|
470,232
|
|
439,410
|
|
464,861
|
|
|||||
|
Gross profit
|
138,700
|
|
130,294
|
|
145,669
|
|
|||||
|
Operating expenses:
|
|
|
|
|
|
|
|||||
|
Selling
|
65,902
|
|
64,648
|
|
62,760
|
|
|||||
|
General and administrative
|
35,193
|
|
34,817
|
|
34,919
|
|
|||||
|
Product design and development
|
37,772
|
|
35,557
|
|
35,530
|
|
|||||
|
|
138,867
|
|
135,022
|
|
133,209
|
|
|||||
|
Operating (loss) income
|
(167
|
)
|
(4,728
|
)
|
12,460
|
|
|||||
|
Nonoperating income (expense):
|
|
|
|
|
|
|
|||||
|
Interest income
|
805
|
|
1,031
|
|
723
|
|
|||||
|
Interest expense
|
(106
|
)
|
(160
|
)
|
(217
|
)
|
|||||
|
Other (expense) income, net
|
(541
|
)
|
(1,087
|
)
|
(537
|
)
|
|||||
|
(Loss) income before income taxes
|
(9
|
)
|
(4,944
|
)
|
12,429
|
|
|||||
|
Income tax (benefit) expense
|
(500
|
)
|
(3,986
|
)
|
6,867
|
|
|||||
|
Net income (loss)
|
$
|
491
|
|
$
|
(958
|
)
|
$
|
5,562
|
|
||
|
Weighted average shares outstanding:
|
|
|
|
|
|
|
|||||
|
Basic
|
45,031
|
|
44,926
|
|
44,457
|
|
|||||
|
Diluted
|
45,316
|
|
44,926
|
|
44,873
|
|
|||||
|
Earnings (loss) per share:
|
|
|
|
|
|
|
|||||
|
Basic
|
$
|
0.01
|
|
$
|
(0.02
|
)
|
$
|
0.13
|
|
||
|
Diluted
|
$
|
0.01
|
|
$
|
(0.02
|
)
|
$
|
0.12
|
|
||
|
See notes to consolidated financial statements.
|
|
|
|
|
|||||||
39
|
DAKTRONICS, INC. AND SUBSIDIARIES
CONSOLIDATED STATEMENTS OF COMPREHENSIVE INCOME
(in thousands)
|
||||||||||||
|
Year Ended
|
||||||||||||
|
May 2,
2020 |
April 27,
2019 |
April 28,
2018 |
||||||||||
|
Net income (loss)
|
$
|
491
|
|
$
|
(958
|
)
|
$
|
5,562
|
|
|||
|
Other comprehensive (loss) income:
|
||||||||||||
|
Cumulative translation adjustments
|
(965
|
)
|
(1,749
|
)
|
1,808
|
|
||||||
|
Unrealized gain (loss) on available-for-sale securities, net of tax
|
44
|
|
107
|
|
(141
|
)
|
||||||
|
Total other comprehensive (loss) income, net of tax
|
(921
|
)
|
(1,642
|
)
|
1,667
|
|
||||||
|
Comprehensive (loss) income
|
$
|
(430
|
)
|
$
|
(2,600
|
)
|
$
|
7,229
|
|
|||
|
See notes to consolidated financial statements.
|
||||||||||||
40
|
DAKTRONICS, INC. AND SUBSIDIARIES
CONSOLIDATED STATEMENTS OF SHAREHOLDERS’ EQUITY
(in thousands)
|
|||||||||||||||||||||||
|
|
Common Stock
|
Additional Paid-In Capital
|
Retained Earnings
|
Treasury Stock
|
Accumulated Other Comprehensive Loss
|
Total
|
|||||||||||||||||
|
Balance as of April 29, 2017:
|
$
|
52,530
|
|
$
|
38,004
|
|
$
|
113,967
|
|
$
|
(1,834
|
)
|
$
|
(4,381
|
)
|
$
|
198,286
|
|
|||||
|
Net income
|
—
|
|
—
|
|
5,562
|
|
—
|
|
—
|
|
5,562
|
|
|||||||||||
|
Cumulative translation adjustments
|
—
|
|
—
|
|
—
|
|
—
|
|
1,808
|
|
1,808
|
|
|||||||||||
|
Unrealized gain (loss) on available-for-sale securities, net of tax
|
—
|
|
—
|
|
—
|
|
—
|
|
(141
|
)
|
(141
|
)
|
|||||||||||
|
Share-based compensation
|
—
|
|
2,635
|
|
—
|
|
—
|
|
—
|
|
2,635
|
|
|||||||||||
|
Exercise of stock options
|
519
|
|
—
|
|
—
|
|
—
|
|
—
|
|
519
|
|
|||||||||||
|
Tax payments related to RSU issuances
|
—
|
|
(311
|
)
|
—
|
|
—
|
|
—
|
|
(311
|
)
|
|||||||||||
|
Employee savings plan activity
|
1,682
|
|
—
|
|
—
|
|
—
|
|
—
|
|
1,682
|
|
|||||||||||
|
Dividends paid ($0.28 per share)
|
—
|
|
—
|
|
(12,424
|
)
|
—
|
|
—
|
|
(12,424
|
)
|
|||||||||||
|
Balance as of April 28, 2018:
|
54,731
|
|
40,328
|
|
107,105
|
|
(1,834
|
)
|
(2,714
|
)
|
197,616
|
|
|||||||||||
|
Net loss
|
—
|
|
—
|
|
(958
|
)
|
—
|
|
—
|
|
(958
|
)
|
|||||||||||
|
Cumulative translation adjustments
|
—
|
|
—
|
|
—
|
|
—
|
|
(1,749
|
)
|
(1,749
|
)
|
|||||||||||
|
Unrealized gain (loss) on available-for-sale securities, net of tax
|
—
|
|
—
|
|
—
|
|
—
|
|
107
|
|
107
|
|
|||||||||||
|
Share-based compensation
|
—
|
|
2,479
|
|
—
|
|
—
|
|
—
|
|
2,479
|
|
|||||||||||
|
Exercise of stock options
|
1,318
|
|
—
|
|
—
|
|
—
|
|
—
|
|
1,318
|
|
|||||||||||
|
Tax payments related to RSU issuances
|
—
|
|
(246
|
)
|
—
|
|
—
|
|
—
|
|
(246
|
)
|
|||||||||||
|
Employee savings plan activity
|
1,650
|
|
—
|
|
—
|
|
—
|
|
—
|
|
1,650
|
|
|||||||||||
|
Dividends paid ($0.28 per share)
|
—
|
|
—
|
|
(12,554
|
)
|
—
|
|
—
|
|
(12,554
|
)
|
|||||||||||
|
Balance as of April 27, 2019:
|
57,699
|
|
42,561
|
|
93,593
|
|
(1,834
|
)
|
(4,356
|
)
|
187,663
|
|
|||||||||||
|
Net income
|
—
|
|
—
|
|
491
|
|
—
|
|
—
|
|
491
|
|
|||||||||||
|
Cumulative translation adjustments
|
—
|
|
—
|
|
—
|
|
—
|
|
(965
|
)
|
(965
|
)
|
|||||||||||
|
Unrealized gain (loss) on available-for-sale securities, net of tax
|
—
|
|
—
|
|
—
|
|
—
|
|
44
|
|
44
|
|
|||||||||||
|
Share-based compensation
|
—
|
|
2,265
|
|
—
|
|
—
|
|
—
|
|
2,265
|
|
|||||||||||
|
Exercise of stock options
|
—
|
|
—
|
|
—
|
|
—
|
|
—
|
|
—
|
|
|||||||||||
|
Tax payments related to RSU issuances
|
—
|
|
(199
|
)
|
—
|
|
—
|
|
—
|
|
(199
|
)
|
|||||||||||
|
Employee savings plan activity
|
2,311
|
|
—
|
|
—
|
|
—
|
|
—
|
|
2,311
|
|
|||||||||||
|
Dividends paid ($0.20 per share)
|
—
|
|
—
|
|
(8,994
|
)
|
—
|
|
—
|
|
(8,994
|
)
|
|||||||||||
|
Treasury stock purchase
|
—
|
|
—
|
|
—
|
|
(5,636
|
)
|
—
|
|
(5,636
|
)
|
|||||||||||
|
Balance as of May 2, 2020:
|
$
|
60,010
|
|
$
|
44,627
|
|
$
|
85,090
|
|
$
|
(7,470
|
)
|
$
|
(5,277
|
)
|
$
|
176,980
|
|
|||||
|
See notes to consolidated financial statements.
|
|
|
|
|
|
|
|
|
|
|
|||||||||||||
41
|
DAKTRONICS, INC. AND SUBSIDIARIES
CONSOLIDATED STATEMENTS OF CASH FLOWS
(in thousands)
|
|||||||||||
|
|
Year Ended
|
||||||||||
|
May 2,
2020 |
April 27,
2019 |
April 28,
2018 |
|||||||||
|
CASH FLOWS FROM OPERATING ACTIVITIES:
|
|
|
|||||||||
|
Net income (loss)
|
$
|
491
|
|
$
|
(958
|
)
|
$
|
5,562
|
|
||
|
Adjustments to reconcile net income (loss) to net cash provided by operating activities:
|
|
|
|
|
|||||||
|
Depreciation and amortization
|
17,718
|
|
18,635
|
|
17,784
|
|
|||||
|
(Gain) loss on sale of property, equipment and other assets
|
(35
|
)
|
(441
|
)
|
(1,252
|
)
|
|||||
|
Share-based compensation
|
2,265
|
|
2,479
|
|
2,635
|
|
|||||
|
Contingent consideration adjustment
|
—
|
|
286
|
|
—
|
|
|||||
|
Equity in loss of affiliate
|
741
|
|
844
|
|
481
|
|
|||||
|
Provision for doubtful accounts
|
(99
|
)
|
194
|
|
140
|
|
|||||
|
Deferred income taxes, net
|
(2,183
|
)
|
(3,379
|
)
|
3,148
|
|
|||||
|
Change in operating assets and liabilities
|
(8,090
|
)
|
11,886
|
|
1,863
|
|
|||||
|
Net cash provided by operating activities
|
10,808
|
|
29,546
|
|
30,361
|
|
|||||
|
CASH FLOWS FROM INVESTING ACTIVITIES:
|
|
|
|
|
|||||||
|
Purchases of property and equipment
|
(18,091
|
)
|
(17,268
|
)
|
(18,127
|
)
|
|||||
|
Proceeds from sales of property, equipment and other assets
|
322
|
|
607
|
|
2,179
|
|
|||||
|
Purchases of marketable securities
|
—
|
|
(25,337
|
)
|
(17,438
|
)
|
|||||
|
Proceeds from sales or maturities of marketable securities
|
25,162
|
|
33,706
|
|
15,273
|
|
|||||
|
Purchases of and loans to equity investment
|
(11,664
|
)
|
(1,300
|
)
|
(1,450
|
)
|
|||||
|
Acquisitions, net of cash acquired
|
—
|
|
(2,250
|
)
|
—
|
|
|||||
|
Net cash used in investing activities
|
(4,271
|
)
|
(11,842
|
)
|
(19,563
|
)
|
|||||
|
CASH FLOWS FROM FINANCING ACTIVITIES:
|
|
|
|
|
|||||||
|
Borrowings on notes payable
|
15,000
|
|
—
|
|
—
|
|
|||||
|
Principal payments on long-term obligations
|
(2,149
|
)
|
(450
|
)
|
(1,046
|
)
|
|||||
|
Dividends paid
|
(8,994
|
)
|
(12,554
|
)
|
(12,424
|
)
|
|||||
|
Proceeds from exercise of stock options
|
—
|
|
1,318
|
|
519
|
|
|||||
|
Payments for common shares repurchased
|
(5,636
|
)
|
—
|
|
—
|
|
|||||
|
Tax payments related to RSU issuances
|
(199
|
)
|
(246
|
)
|
(311
|
)
|
|||||
|
Net cash used in financing activities
|
(1,978
|
)
|
(11,932
|
)
|
(13,262
|
)
|
|||||
|
EFFECT OF EXCHANGE RATE CHANGES ON CASH
|
111
|
|
215
|
|
(620
|
)
|
|||||
|
NET INCREASE (DECREASE) IN CASH, CASH EQUIVALENTS AND RESTRICTED CASH
|
4,670
|
|
5,987
|
|
(3,084
|
)
|
|||||
|
CASH, CASH EQUIVALENTS AND RESTRICTED CASH:
|
|
|
|
|
|||||||
|
Beginning of period
|
35,742
|
|
29,755
|
|
32,839
|
|
|||||
|
End of period
|
$
|
40,412
|
|
$
|
35,742
|
|
$
|
29,755
|
|
||
|
See notes to consolidated financial statements.
|
|
|
|
|
|||||||
42
NOTES TO THE CONSOLIDATED FINANCIAL STATEMENTS
(in thousands, except per share data)
Note 1. Nature of Business and Summary of Significant Accounting Policies
Nature of business
: Daktronics, Inc. and its subsidiaries are engaged principally in the design, market, and manufacture of a wide range of integrated electronic display systems and related products which are sold in a variety of markets throughout the world and the rendering of related maintenance and professional services. Our products are designed primarily to inform and entertain people through the communication of content.
Fiscal year
: We operate on a 52- or 53-week fiscal year, with our fiscal year ending on the Saturday closest to April 30 of each year. When April 30 falls on a Wednesday, the fiscal year ends on the preceding Saturday. Within each fiscal year, each quarter is comprised of 13-week periods following the beginning of each fiscal year. In each 53-week year, an additional week is added to the first quarter, and each of the last three quarters is comprised of a 13-week period. The fiscal years ended
April 27, 2019
and
April 28, 2018
contained operating results for 52 weeks, while the fiscal year ended
May 2, 2020
contained operating results for 53 weeks.
Principles of consolidation
: The consolidated financial statements include Daktronics, Inc. and its subsidiaries. All intercompany accounts and transactions are eliminated in consolidation.
Investments in affiliates
: Investments in affiliates over which we have significant influence are accounted for under the equity method of accounting, recording the investment at cost and then subsequently adjusting to account for our share of the affiliates profit or losses, in accordance with the provisions of Accounting Standards Codification ("ASC") 323,
Investments - Equity Method and Joint Ventures
. Investments in affiliates over which we do not have the ability to exert significant influence over the affiliate's operating and financing activities are accounted for under the cost method of accounting, recording the investment at cost and then subsequently adjusting for any changes in ownership or dividends in accordance with the provisions of ASC 321,
Investments - Equity Securities
. We have evaluated our relationships with our affiliates and have determined that these entities are not variable interest entities. Cash paid for investments in affiliates and loans to affiliates are included in the "Purchases of and loans to equity investment" line item in our consolidated statements of cash flows. Equity method investments as a whole are assessed for other-than-temporary impairments whenever events or changes in circumstances indicate that the carrying amount of the investment may not be recoverable.
During the fourth quarter of fiscal 2020, we participated in a Series A investment in X Display Company ("XDC"). XDC creates and owns leading intellectual property (IP) and capabilities in microLED mass transfer technology. This investment will support XDC’s further development in microLED capabilities and applications. MicroLED technologies support Daktronics’ line of narrow pixel pitch LED displays and will enable solutions to move into the realm of less than 1-millimeter pixel spacing. We own approximately
12 percent
of the shares of XDC outstanding. We have the right to invest
$5,000
in XDC within one year if certain conditions exist. This additional investment would result in approximately an additional six percent ownership in the company. XDC is accounted for under the equity method of accounting.
During the fourth quarter of fiscal 2020, the COVID-19 crisis impacted the global economy. While this uncertain economic outlook has caused near-term changes, we do not believe this change will have a permanent impact to our investments in affiliates.
The aggregate amount of investments accounted for under the equity method was
$17,257
and
$3,657
at
May 2, 2020
and
April 27, 2019
, respectively. Our proportional share of the respective affiliates' earnings or losses is included in the "
Other (expense) income, net
" line item in our consolidated statements of operations. For fiscal years
2020
,
2019
, and
2018
, our share of the losses of our affiliates was
$741
,
$844
, and $
481
respectively.
Summarized financial information for equity method investments consist of the following:
|
Year Ended
|
||||||||||
|
May 2,
2020 |
April 27,
2019 |
April 28,
2018 |
||||||||
|
Balance sheet data:
|
||||||||||
|
Current assets
|
$
|
10,593
|
|
$
|
192
|
|
||||
|
Non-current assets
|
4,266
|
|
2,626
|
|
||||||
|
Current liabilities
|
2,755
|
|
839
|
|
||||||
|
Non-current liabilities
|
4,086
|
|
2,599
|
|
||||||
|
Income statement data:
|
||||||||||
|
Net loss
|
(1,383
|
)
|
(2,168
|
)
|
(1,493
|
)
|
||||
43
Use of estimates
: The preparation of financial statements in conformity with generally accepted accounting principles in the United States ("GAAP") requires management to make estimates and assumptions affecting the reported amounts of assets and liabilities; the disclosure of contingent assets and liabilities at the date of the financial statements; the reported amounts of revenues and expenses during the reporting period; and our ability to continue as a going concern. Due to the inherent uncertainty involved in making estimates, actual results in future periods may differ from those estimates. Material estimates that are particularly susceptible to significant change in the near-term relate to the determination of the estimated total costs on uniquely configured contracts and estimated costs to be incurred for product warranties and income taxes. Estimation processes are also used in inventory valuation, the allowance for doubtful accounts, share-based compensation, goodwill impairment, and extended warranty and product maintenance agreements. Changes in estimates are reflected in the periods in which they become known.
Cash and cash equivalents
: All highly liquid investments with maturities of three months or less at the date of purchase are considered to be cash equivalents and consist primarily of government repurchase agreements, savings accounts and money market accounts that are carried at cost, which approximates fair value. We maintain our cash in bank deposit accounts, the balances of which at times may exceed federally insured limits. We have not experienced any losses in such accounts.
Restricted cash
: Restricted cash consists of cash and cash equivalents held in bank deposit accounts to secure issuances of foreign bank guarantees.
The following table provides a reconciliation of cash, cash equivalents, and restricted cash reported within the consolidated balance sheets that sum to the totals of the same amounts shown in the consolidated statement of cash flows:
|
May 2,
2020 |
April 27,
2019 |
April 28,
2018 |
|||||||||
|
Cash and cash equivalents
|
$
|
40,398
|
|
$
|
35,383
|
|
$
|
29,727
|
|
||
|
Restricted cash
|
14
|
|
359
|
|
28
|
|
|||||
|
Total cash, cash equivalents, and restricted cash shown in the consolidated statement of cash flows
|
$
|
40,412
|
|
$
|
35,742
|
|
$
|
29,755
|
|
||
Inventories:
In accordance with ASC 330,
Inventory,
our inventories are stated at the lower of cost (first-in, first-out method) and net realizable value. Net realizable value is the estimated selling price in the ordinary course of business, less reasonably predictable costs of completion, disposal, and transportation. Cost is measured as the price of the components and allocated expenses for production or betterment of the inventory item. When we estimate net realizable value to be lower than cost, any necessary adjustments are charged to cost of sales in that period. In determining net realizable value, we review various factors such as current inventory levels, forecasted demand, costs of completion, and technological obsolescence.
Allowance for doubtful accounts:
We make estimates regarding the collectability of our accounts receivable, long-term receivables, contract assets and other receivables. In evaluating the adequacy of our allowance for doubtful accounts, we analyze specific balances, customer creditworthiness, changes in customer payment cycles, and current economic trends. If the financial condition of any customer were to deteriorate, resulting in an impairment of its ability to make payments, additional allowances may be required. We charge off receivables at such time as it is determined collection will not occur in accordance with ASC 310,
Receivables
.
Revenue recognition
: We adopted ASU 2014-09 and its related guidance under the modified retrospective method during the first quarter of fiscal 2019 by applying the guidance to all open contracts at the adoption date. The adoption of this standard did not materially change the timing or amount of revenue recognized, primarily based upon our assessment of "point in time" and "over time" revenue recognition.
Our accounting policies and estimates as a result of adopting ASU 2014-09,
Revenue from Contracts with Customers (Topic 606)
, are as follows:
Contracts are identified and follow the revenue recognition policies when all of the following occur: we have evidence that all parties to the contract have approved the contract and are committed to perform their respective obligations, we can identify each party’s rights regarding the goods or services to be transferred, we can identify the payment terms for the goods or services to be transferred, the contract has commercial substance, and it is probable we will collect substantially all of the consideration to which we would be entitled in exchange for the goods or services.
Pre-contract costs are generally expensed as incurred, unless they are directly associated with an anticipated contract and recoverability from that contract is probable. Pre-contract costs directly associated with anticipated contracts expected to be recoverable include
$1,582
44
and
$857
as of
May 2, 2020
and
April 27, 2019
, respectively. These are included in the "Inventories" line item in our consolidated balance sheets.
At contract inception, we identify performance obligations by reviewing the agreement for material distinct goods and services. Goods and services are distinct when the customer can benefit from them on their own and our promises to transfer these items are identifiable from other promises within the contract. When we are contracted to provide a single promise (an integrated system), we often treat it as a single performance obligation if we are providing goods and services with the same pattern of transfer that are highly integrated or interdependent, that are modified or customized by other goods or services promised, or that provide a combined outcome for which the customer has contracted. When less interdependency or integration is necessary, or when the customer can benefit from distinct items, we separate the contract into multiple performance obligations. We account for extended warranties and other services ("service-type warranties") that represent a distinct service as a separate performance obligation.
Our contracts can contain multiple components of transaction price. We evaluate each contract for these components and include fixed consideration, variable consideration, financing components, and non-cash consideration and exclude consideration payable to a customer and sales taxes in the transaction price. When we are responsible for site installations which include subcontracted work, we maintain the contractual responsibilities and risks and include the consideration for these services in the transaction price. When our contract contains variable consideration, including return rights, discounts, claims, unpriced change orders, and liquidated damages, we estimate the transaction price using the expected value (i.e., the sum of the probability-weighted amount) or the most likely amount method, whichever is expected to better predict revenue for that contract situation. We also constrain the revenue to the extent that it is probable that a significant reversal of the amount of cumulative revenue recognized will not occur when the uncertainty associated with the variable consideration is subsequently resolved. We consider the following factors in determining revenue associated with variable consideration: (a) the contract or other evidence providing the legal basis, (b) additional costs caused by unforeseen circumstances, (c) evidence supporting the claim, and (d) historical evidence and patterns of customers. We adjust the contract price for the effects of a significant financing component if we expect, at contract inception, that the period between when we transfer goods and services to a customer will exceed one year from the time the customer pays and represents financing. If the payment structures exceed a year but are structured to account for risks with a contract or correspond to payments on milestones or are scheduled for performance, we do not adjust the contract price for a financing component. See "
Note 9. Receivables
" for amounts recorded in long-term receivables.
When separate performance obligations are identified, we allocate the transaction price to the individual performance obligation based on the best method we judge as faithfully depicting the value of the performance obligation. Many of our contracts are bundled, and we do not have separate selling prices for each performance obligation; therefore, for these contracts, we primarily use the cost plus a margin approach to allocate the relative transaction price to identified performance obligations, as it is the best representative of our pricing methods.
Revenue is recognized when we satisfy a performance obligation. We receive payments from customers based on a billing schedule as established in our contracts. Billing schedules include down payments and progress billings over time; set milestone payments that are specific to the project are scheduled for performance-based payments or are set time-based payment(s). Variability in contract assets and contract liabilities relates to the timing of billings and revenue recognition, which can vary significantly depending on contractual payment terms and build and installation schedules and the related timing differences in transfer of control. Balances are also impacted by the seasonality in our business.
Significant judgments and estimates are used in our revenue policies. Throughout the revenue cycle, we evaluate contractual evidence, monitor our performance, evaluate variable consideration changes, update estimated costs to complete cost-to-cost projects, and obtain evidence of deliveries or other control change evidence for appropriate and consistent revenue recognition. We maintain internal policies and procedures to provide guidance for those involved in recording revenue. We monitor for changes in our business sales practices and customer interactions to capture the appropriate types of performance obligations and adjust for any change in control terms and conditions.
Our material performance obligation types include:
Unique configuration contracts
: audio-visual communication systems uniquely configured (custom) or integrated for a customer's particular location and system configuration may include all or a combination of the following: engineering services, project management services, video display(s), control solution(s), installation and integration services, scoring and messaging equipment, training, other on-site services, spare parts, software licenses, and assurance-type warranties.
We may have multiple performance obligations in these types of contracts; however a majority are treated as a combined single performance obligation. In our judgment, this accounting treatment is most appropriate because the substantial part of our promise to customers is to provide significant integration services and incorporate individual goods and services into a combined output or system. Often times, the system is customized or significantly modified to the customer's desired configurations and location, and the interrelated goods and services provide utility to the customer as a package.
45
Revenue for uniquely configured (custom) or integrated systems is recognized over time using the cost incurred input method. Over time revenue recognition is appropriate because we have no alternative use for the uniquely configured system and have an enforceable right to payment for work performed. The cost incurred input method measures costs incurred to date compared to estimated total costs for each contract. This method is the most faithful depiction of our performance because it measures the value of the contract transferred to the customer. Costs to perform include direct and indirect costs for contract design, production, integration, installation, and assurance-type warranty reserve. Direct costs include material and components; manufacturing, project management and engineering labor; and subcontracting expenses. Indirect costs include allocated charges for such items as facilities and equipment depreciation and general overhead. Provisions of estimated losses on uncompleted contracts are made in the period when such losses are capable of being estimated.
Contract modifications to existing contracts with customers are evaluated in accordance with the five-step revenue model. We treat contract modifications as a separate contract and new performance obligations when the additional goods or services are distinct and do not add to the unique configuration or are outside the integrated system and when the consideration reflects standalone selling prices. If the additional goods or services offered under the modification enhance the uniquely configured or integrated systems, revenue is allocated to the existing contracts' performance obligation. Modifications may cause changes in the timing of revenue recognition depending on the allocation to various performance obligations.
The time between contract order and project completion is typically less than 12 months but may extend longer depending on the amount of custom work and customers’ delivery needs.
Limited configuration (standard systems) and after-sale parts contracts
: Limited configured (standard systems) or after-sale parts contracts with limited or no configuration or limited integration are recognized as distinct individual performance obligations when material. When not distinct, we combine into one performance obligation the goods and/or services with each other until the bundle of goods or services is distinct. For standard display purchases made in large quantities, we account for each piece of equipment separately as a distinct performance obligation from which a customer derives benefit. Immaterial goods or services in the context of the contract are included with the display system performance obligation. Standard systems and equipment with limited configurations or integrations may include all or a combination (when immaterial) of the following performance obligations: engineering services, project management services, video display(s), control solution(s), installation and integration services, scoring, messaging and audio equipment, training, spare parts, software licenses, assurance-type warranties, and after-sale parts.
Revenue is recognized at a point in time when control passes, or over time as services are performed. When fulfilling limited configuration performance obligations, we are typically able to redirect the video displays or scoring, messaging, or audio equipment to another customer without incurring significant economic losses. Therefore, we have an alternative use for the performance obligation and recognize revenue upon our substantial completion and at the point in time we estimate control has transferred to the customer. When limited configured single performance obligations are more service-type (i.e., installation and integration services), we recognize revenue over time using the cost-to-cost input method, which is the most faithful depiction of the customer obtaining control and benefits from the work performed.
Services and other
: Services sold on a stand-alone basis or after the initial system sale include performance obligations such as event support, control room design, on-site training, equipment service, service-type warranties, technical support, software sold as a service, and other immaterial revenue streams. These are contracted with a customer generally per service event or service type on a stand-alone basis. Services, service type warranties, and other are recognized as net sales when the services are performed, and control is transferred to the customer at a point in time when title or control passes or over time as services are performed and for time-based "stand ready to perform" type obligations. We use professional judgment to determine control transfer. If we have the right to consideration from a customer that directly corresponds with the value of our performance (where we bill a fixed amount for each hour of service provided), we recognize revenue related to the work completed.
Software:
Revenues from software license fees on sales, other than uniquely configured type contracts, are recognized when delivery of the product has occurred. Subscription-based licenses include the right for a customer to use our licenses and receive related support for a specified term, and revenue is recognized pro-rata over the term of the engagement.
Shipping and handling costs:
Shipping and handling costs collected from our customers in connection with our sales are recorded as revenue. We record shipping and handling costs as a component of cost of sales at the time the product is shipped.
Warranty:
We offer a standard parts coverage warranty for periods varying from
one
to
five
years for most of our products. We also offer additional types of warranties to include on-site labor, routine maintenance and event support. In addition, the terms of warranties on some installations can vary from
one
to
10
years. The specific terms and conditions of these warranties vary primarily depending on the type of product sold. We estimate the costs which may be incurred under the contractual warranty obligations (assurance type warranty) and record a liability in the amount of such estimated costs at the time the revenue is recognized. Factors affecting our estimate of the
46
cost of our warranty obligations include historical experience and expectations of future conditions. We continually assess the adequacy of our recorded warranty accruals and, to the extent we experience any changes in warranty claim activity or costs associated with servicing those claims, our accrued warranty obligation is adjusted accordingly. For service-type warranty contracts, we allocate revenue to this performance obligation, recognize the revenue over time, and recognize costs as incurred.
Long-term receivables and advertising rights:
We occasionally sell and install our products at facilities in exchange for the rights to sell or to retain future advertising revenues. For these transactions, we recognize revenue equal to the amount of the present value of the future advertising payments if enough advertising is sold to obtain normal margins on the contract, and we record the related receivable in long-term receivables. We recognize imputed interest as earned.
Property and equipment
: In accordance with ASC 360,
Property, Plant, and Equipment,
property and equipment are stated at cost and depreciated principally on the straight-line method over the following estimated useful lives:
|
|
Years
|
|
Buildings and improvements
|
5 - 40
|
|
Machinery and equipment
|
5 - 7
|
|
Office furniture and equipment
|
3 - 5
|
|
Computer software and hardware
|
3 - 5
|
|
Equipment held for rental
|
2 - 7
|
|
Demonstration equipment
|
3 - 5
|
|
Transportation equipment
|
5 - 7
|
Leasehold improvements are depreciated over the lesser of the useful life of the asset or the term of the lease.
Property and equipment held for sale:
In accordance with ASC 360,
Property, Plant, and Equipment,
property and equipment held for sale are reported separately when we have a plan to dispose of the asset by sale, it is probable we will find a buyer in the near future, and a change in plan is unlikely. The value is stated at the lower of carrying value or fair value, and no depreciation is charged.
Impairment of Long-Lived Assets
: In accordance with ASC 360,
Property, Plant, and Equipment
, we assess long-lived tangible assets and definite-lived intangible assets for impairment whenever events or changes in circumstances indicate the carrying value may not be recoverable.
When evaluating long-lived assets for potential impairment, we first compare the carrying value of the asset to the asset's estimated future cash flows (undiscounted and without interest charges). If the estimated future cash flows are less than the carrying value of the asset, we calculate an impairment loss. The impairment loss calculation compares the carrying value of the asset to the asset's estimated fair value. We recognize an impairment loss if the amount of the asset's carrying value exceeds the asset's estimated fair value. If we recognize an impairment loss, the adjusted carrying amount of the asset becomes its new cost basis. For a depreciable long-lived asset, the new cost basis will be depreciated (amortized) over the remaining useful life of that asset.
Our impairment loss calculations contain uncertainties because they require management to make assumptions and to apply judgment to estimate future cash flows and asset fair values, including forecasting useful lives of the assets and selecting the discount rate that reflects the risk inherent in future cash flows.
Goodwill and Other Intangible Assets
: We account for goodwill and other intangible assets with indefinite lives in accordance with ASC 350,
Goodwill and Other.
Under these provisions, goodwill is not amortized but is tested for impairment on at least an annual basis. Impairment testing is required more often than annually if an event or circumstance indicates an impairment or a decline in value may have occurred. Such circumstances could include, but are not limited to, a worsening trend of orders and sales without a corresponding way to preserve future cash flows or a significant decline in our stock price. In conducting our impairment testing, we utilize step 0 which allows us to first assess qualitative factors to determine whether it is more likely than not that the fair value of a reporting unit is less than its carrying value. If, based on a review of qualitative factors, it is more likely than not that the fair value of a reporting unit is less than its carrying value we perform a quantitative impairment test by comparing the fair value of a reporting unit with its carrying amount. If the carrying value exceeds the fair value, we measure the amount of impairment loss, if any.
If a quantitative analysis is performed, we utilize an income approach to estimate the fair value of each reporting unit. We selected this method because we believe it most appropriately measures our income producing assets. We considered using the market approach and cost approach, but concluded they were not appropriate in valuing our reporting units given the lack of relevant and available market comparisons. The income approach is based on the projected cash flows, which are discounted to their present value using discount rates which consider the timing and risk of the forecasted cash flows. We believe that this approach is appropriate because it provides a fair
47
value estimate based upon the reporting unit's expected long-term operating cash performance. This approach also mitigates the impact of the cyclical trends occurring in the industry. Fair value is estimated using internally developed forecasts and assumptions. The discount rate used is the average estimated value of a market participant’s cost of capital and debt, derived using customary market metrics. Other significant assumptions include terminal value margin rates, future capital expenditures, and changes in future working capital requirements. We also compare and reconcile our overall fair value to our market capitalization. Although there are inherent uncertainties related to the assumptions used and to our application of these assumptions to this analysis, we believe the income approach provides a reasonable estimate of the fair value of our reporting units. The foregoing assumptions to a large degree were consistent with our long-term performance, with limited exceptions. We believe our future investments for capital expenditures as a percent of revenue will remain similar to the historical rates as a percentage of sales in future years. Our investments are expected to relate to equipment replacements and new product line manufacturing equipment needs, and to keep our information technology infrastructure robust. These assumptions could deviate materially from actual results.
Software costs to be sold, leased, or marketed:
We follow the provisions of ASC 985,
Software
, which states software development costs are expensed as incurred until technological feasibility has been established. At such time, such costs are capitalized until the product is made available for release to customers. Additionally, costs incurred after release to customers are expensed as research and development expenses. As of
May 2, 2020
and
April 27, 2019
, capitalized software to be sold, leased, or otherwise marketed had a net book value of
$1,357
and
$2,523
, respectively.
Foreign currency translation
: We follow the provisions of ASC 830,
Foreign Currency Matters.
Our foreign subsidiaries use the local currency of their respective countries as their functional currency. The assets and liabilities of foreign operations are generally translated at the exchange rates in effect at the balance sheet date. The operating results of foreign operations are translated at weighted average exchange rates. The related translation gains or losses are reported as a separate component of shareholders’ equity in
accumulated other comprehensive loss
.
Income taxes
: We account for income taxes in accordance with ASC 740,
Income Taxes
. We record a tax provision for anticipated tax consequences of the reported results of operations. Deferred tax assets and liabilities are measured using currently enacted tax rates and statutory tax rates applicable to the years in which we expect these temporary differences will affect taxable income. These assets and liabilities are analyzed regularly, and we assess the likelihood that deferred tax assets will be recoverable from future taxable income. When necessary, a valuation allowance is established if it is more likely than not the deferred tax asset will not be realized. We report the net deferred tax asset and liability as a long-term asset or liability. Net deferred assets or liabilities are calculated by combining them based on their jurisdiction.
In addition, because we operate in multiple income tax jurisdictions both within the United States and internationally, the calculation of tax liabilities involves significant judgment in estimating the impact of uncertainties in the application of complex tax laws. Resolution of these uncertainties in a manner inconsistent with our expectations could have a material impact on our financial condition and operating results. See "
Note 15. Income Taxes
" for further information.
Comprehensive (loss) income
: We follow the provisions of ASC 220,
Reporting Comprehensive Income
, which establishes standards for reporting and displaying comprehensive income and its components, and disclose these components in the consolidated statements of comprehensive income.
Comprehensive (loss) income
reflects the change in equity of a business enterprise during a period from transactions and other events and circumstances from non-owner sources. For us, comprehensive income represents net income adjusted for cumulative foreign currency translation adjustments and unrealized gains and losses on available-for-sale securities. The foreign currency translation adjustment included in the comprehensive income calculation has not been tax affected, as the investments in foreign affiliates are deemed to be permanent.
Product design and development
: We follow the provisions of ASC 730,
Research and Development
, which states all expenses related to product design and development are charged to operations as incurred. Our product design and development activities include the enhancement of existing products and technologies and the development of new products and technologies.
Advertising costs
: In accordance with ASC 720-35,
Advertising Costs
, we expense advertising costs as incurred. Advertising expenses were
$2,184
,
$2,969
and
$2,855
for the fiscal years
2020
,
2019
and
2018
, respectively.
Earnings per share (“EPS”)
: We follow the provisions of ASC 260,
Earnings Per Share,
where basic EPS is computed by dividing income attributable to common shareholders by the weighted average number of common shares outstanding for the period. Diluted EPS reflects the potential dilution which may occur if securities or other obligations to issue common stock were exercised or converted into common stock or resulted in the issuance of common stock which share in our earnings.
48
The following is a reconciliation of the net income (loss) and common share amounts used in the calculation of basic and diluted EPS for the fiscal years ended
May 2, 2020
,
April 27, 2019
and
April 28, 2018
:
|
|
Net income (loss)
|
Shares
|
Per share income (loss)
|
|||||||
|
For the year ended May 2, 2020:
|
|
|
|
|||||||
|
Basic earnings per share
|
$
|
491
|
|
45,031
|
|
$
|
0.01
|
|
||
|
Dilution associated with stock compensation plans
|
—
|
|
285
|
|
—
|
|
||||
|
Diluted earnings per share
|
$
|
491
|
|
45,316
|
|
$
|
0.01
|
|
||
|
For the year ended April 27, 2019:
|
|
|
|
|
|
|||||
|
Basic loss per share
|
$
|
(958
|
)
|
44,926
|
|
$
|
(0.02
|
)
|
||
|
Dilution associated with stock compensation plans
|
—
|
|
—
|
|
—
|
|
||||
|
Diluted loss per share
|
$
|
(958
|
)
|
44,926
|
|
$
|
(0.02
|
)
|
||
|
For the year ended April 28, 2018:
|
|
|
|
|
|
|||||
|
Basic earnings per share
|
$
|
5,562
|
|
44,457
|
|
$
|
0.13
|
|
||
|
Dilution associated with stock compensation plans
|
—
|
|
416
|
|
(0.01
|
)
|
||||
|
Diluted earnings per share
|
$
|
5,562
|
|
44,873
|
|
$
|
0.12
|
|
||
Options outstanding to purchase
2,198
,
2,304
and
1,548
shares of common stock with a weighted average exercise price of
$9.95
,
$9.99
and
$11.69
for the fiscal years ended
May 2, 2020
,
April 27, 2019
and
April 28, 2018
, respectively, were not included in the computation of diluted earnings (loss) per share because the effects would be anti-dilutive.
Share-based compensation
: We account for share-based compensation in accordance with ASC 718,
Compensation-Stock Compensation.
Under the fair value recognition provisions of ASC 718, we measure share-based compensation cost at the grant date based on the fair value of the award and recognize the compensation expense over the requisite service period, which is the vesting period. See "
Note 13. Shareholders’ Equity and Share-Based Compensation
" for additional information and the assumptions we use to calculate the fair value of share-based employee compensation.
Recent Accounting Pronouncements
Accounting Standards Adopted
In February 2016, the Financial Accounting Standards Board ("FASB") issued ASU 2016-02,
Leases (Topic 842)
, which sets out the principles for the recognition, measurement, presentation and disclosure of leases for both parties to a contract (that is, lessees and lessors). ASU 2016-02 requires lessees to apply a dual approach, classifying leases as either finance or operating leases based on the principle of whether or not the lease is effectively a financed purchase of the leased asset by the lessee. This classification will determine whether the lease expense is recognized based on an effective interest method or on a straight-line basis over the term of the lease. A lessee is also required to record a right-of-use asset and a lease liability for all leases with a term greater than 12 months regardless of their classification. ASU 2016-02 requires lessors to account for leases using an approach that is substantially equivalent to existing guidance for sales-type leases, direct financing leases and operating leases. In July 2018, the FASB issued ASU 2018-10,
Codification Improvements to Topic 842 (Leases)
and ASU 2018-11,
Leases (Topic 842), Targeted Improvements
, which provide (i) narrow amendments to clarify how to apply certain aspects of the new lease standard, (ii) entities with an additional transition method to adopt the new standard, and (iii) lessors with a practical expedient for separating components of a contract.
We adopted ASU 2016-02 and its related guidance during the first quarter of fiscal 2020 for all agreements existing as of April 28, 2019. We elected the "comparatives under Accounting Standards Codification ("ASC") 840 option" as a transitional method, which allows us to initially apply the new lease requirements at the effective date. Comparative periods were not adjusted and will continue to be reported in accordance with prior lease guidance under ASC 840. We elected the package of practical expedients, which permits us not to reassess our prior conclusions about lease identification, lease classification and initial direct costs. In addition, we have elected the short-term lease recognition whereby we will not recognize operating leases related assets or liabilities for leases with a lease term of less than one year. We have also elected the practical expedient to not separate lease and non-lease components in the lease payments for all asset classes. This adoption did not have an impact on our consolidated statements of operations, shareholders' equity and cash flows, and there was no adjustment to retained earnings. As of April 28, 2019, we recognized a right of use asset for operating leases of
$11,101
and a current and non-current lease liability for operating leases of
$2,745
and
$8,356
, respectively. The right of use operating assets are included in the "Investment in affiliates and other assets" line item, the current lease liabilities are included in the "Accrued expenses" line item, and the non-current lease liabilities are included in the "Other long-term obligations" line item in our consolidated balance sheets. See "
Note 12. Leases
" for more information.
Accounting Standards Not Yet Adopted
49
In January 2017, the FASB issued ASU 2017-04,
Intangibles-Goodwill and Other (Topic 350)
, which simplifies the subsequent measurement of goodwill by removing the second step of the two-step impairment test. The amendment requires an entity to perform its annual or interim goodwill impairment test by comparing the fair value of a reporting unit with its carrying amount. A goodwill impairment will be the amount by which a reporting unit’s carrying value exceeds its fair value, not to exceed the carrying amount of goodwill. ASU 2017-04 is effective for interim and annual periods beginning after December 15, 2019 and will require adoption on a prospective basis. We are currently evaluating the effect that adopting ASU 2017-04 will have on our consolidated financial statements and related disclosures.
In June 2016, the FASB issued ASU 2016-13,
Measurement of Credit Losses on Financial Instruments
, which provides guidance regarding the measurement and recognition of credit impairment for certain financial assets. ASU 2016-13 is effective for interim and annual periods beginning after December 15, 2019, with early adoption permitted, and will require adoption on a modified retrospective basis. We are currently evaluating the effect that adopting ASU 2016-13, including all subsequent amendments and improvements to ASC Topic 326 issued by FASB, will have on our consolidated financial statements and related disclosures.
Note 2. Revenue Recognition
Disaggregation of revenue
In accordance with ASC 606-10-50, we disaggregate revenue from contracts with customers by the type of performance obligation and the timing of revenue recognition. We determine that disaggregating revenue in these categories achieves the disclosure objective to depict how the nature, amount, timing and uncertainty of revenue and cash flows are affected by economic factors and to enable users of financial statements to understand the relationship to each reportable segment.
The following table presents our disaggregation of revenue by segments:
50
|
Fiscal Year 2020
|
|||||||||||||||||||||||
|
Commercial
|
Live Events
|
High School Park and Recreation
|
Transportation
|
International
|
Total
|
||||||||||||||||||
|
Type of performance obligation
|
|||||||||||||||||||||||
|
Unique configuration
|
$
|
35,212
|
|
$
|
140,044
|
|
$
|
19,176
|
|
$
|
43,519
|
|
$
|
40,454
|
|
$
|
278,405
|
|
|||||
|
Limited configuration
|
102,847
|
|
31,897
|
|
74,266
|
|
24,588
|
|
45,626
|
|
279,224
|
|
|||||||||||
|
Service and other
|
14,568
|
|
24,650
|
|
2,972
|
|
2,032
|
|
7,081
|
|
51,303
|
|
|||||||||||
|
$
|
152,627
|
|
$
|
196,591
|
|
$
|
96,414
|
|
$
|
70,139
|
|
$
|
93,161
|
|
$
|
608,932
|
|
||||||
|
Timing of revenue recognition
|
|||||||||||||||||||||||
|
Goods/services transferred at a point in time
|
$
|
105,096
|
|
$
|
39,521
|
|
$
|
68,582
|
|
$
|
25,157
|
|
$
|
47,345
|
|
$
|
285,701
|
|
|||||
|
Goods/services transferred over time
|
47,531
|
|
157,070
|
|
27,832
|
|
44,982
|
|
45,816
|
|
323,231
|
|
|||||||||||
|
$
|
152,627
|
|
$
|
196,591
|
|
$
|
96,414
|
|
$
|
70,139
|
|
$
|
93,161
|
|
$
|
608,932
|
|
||||||
|
Fiscal Year 2019
|
|||||||||||||||||||||||
|
Commercial
|
Live Events
|
High School Park and Recreation
|
Transportation
|
International
|
Total
|
||||||||||||||||||
|
Type of performance obligation
|
|||||||||||||||||||||||
|
Unique configuration
|
$
|
25,171
|
|
$
|
119,569
|
|
$
|
21,792
|
|
$
|
38,490
|
|
$
|
44,989
|
|
$
|
250,011
|
|
|||||
|
Limited configuration
|
108,921
|
|
30,107
|
|
66,825
|
|
23,799
|
|
42,134
|
|
271,786
|
|
|||||||||||
|
Service and other
|
14,741
|
|
21,276
|
|
2,570
|
|
2,102
|
|
7,218
|
|
47,907
|
|
|||||||||||
|
$
|
148,833
|
|
$
|
170,952
|
|
$
|
91,187
|
|
$
|
64,391
|
|
$
|
94,341
|
|
$
|
569,704
|
|
||||||
|
Timing of revenue recognition
|
|||||||||||||||||||||||
|
Goods/services transferred at a point in time
|
$
|
111,617
|
|
$
|
35,313
|
|
$
|
60,763
|
|
$
|
24,500
|
|
$
|
44,758
|
|
$
|
276,951
|
|
|||||
|
Goods/services transferred over time
|
37,216
|
|
135,639
|
|
30,424
|
|
39,891
|
|
49,583
|
|
292,753
|
|
|||||||||||
|
$
|
148,833
|
|
$
|
170,952
|
|
$
|
91,187
|
|
$
|
64,391
|
|
$
|
94,341
|
|
$
|
569,704
|
|
||||||
See "
Note 3. Segment Reporting
" for a disaggregation of revenue by geography.
Contract balances
Contract assets represent revenue recognized in excess of amounts billed and include unbilled receivables. Unbilled receivables, which represent an unconditional right to payment subject only to the passage of time, are reclassified to accounts receivable when they are billed according to the contract terms. Contract liabilities represent amounts billed to the clients in excess of revenue recognized to date.
The following table reflects the changes in our contract assets and liabilities:
|
May 2, 2020
|
April 27, 2019
|
Dollar Change
|
Percent Change
|
|||||||||||
|
Contract assets
|
$
|
35,467
|
|
$
|
33,704
|
|
$
|
1,763
|
|
5.2
|
%
|
|||
|
Contract liabilities - current
|
50,897
|
|
47,178
|
|
3,719
|
|
7.9
|
|
||||||
|
Contract liabilities - non-current
|
10,707
|
|
10,053
|
|
654
|
|
6.5
|
|
||||||
The changes in our contract assets and contract liabilities from
April 27, 2019
to
May 2, 2020
were due to the timing of billing schedules and revenue recognition, which can vary significantly depending on the contractual payment terms and the seasonality of the sports markets. We had no material impairments of contract assets for
fiscal 2020
.
51
For service-type warranty contracts, we allocate revenue to this performance obligation, recognize the revenue over time, and recognize costs as incurred. Earned and unearned revenues for these contracts are included in the "Contract assets" and "Contract liabilities". Changes in unearned service-type warranty contracts, net were as follows:
|
|
May 2, 2020
|
April 27, 2019
|
|||||
|
Balance at beginning of year
|
$
|
24,939
|
|
$
|
20,127
|
|
|
|
New contracts sold
|
41,169
|
|
41,907
|
|
|||
|
Less: reductions for revenue recognized
|
(41,167
|
)
|
(37,241
|
)
|
|||
|
Foreign currency translation and other
|
(451
|
)
|
146
|
|
|||
|
Balance at end of year
|
$
|
24,490
|
|
$
|
24,939
|
|
|
As of
April 27, 2019
, we had
six
contracts in progress that were identified as loss contracts, for which we recorded a provision for losses of
$2,353
and
one
remaining contract with loss estimates of
$42
as of
May 2, 2020
. These were included in the "Accrued expenses" line item in our consolidated balance sheets.
During
fiscal 2020
, we recognized revenue of
$45,195
related to our contract liabilities as of
April 27, 2019
.
Remaining performance obligations
As of
May 2, 2020
, the aggregate amount of the transaction price allocated to the remaining performance obligations was
$267,671
. We expect approximately
$222,963
of our remaining performance obligations to be recognized over the next
12
months, with the remainder recognized thereafter. Remaining performance obligations related to product and service agreements at
May 2, 2020
are
$211,863
and
$55,808
, respectively. Although remaining performance obligations reflect business that is considered to be legally binding, cancellations, deferrals or scope adjustments may occur. Any known project cancellations, revisions to project scope and cost, foreign currency exchange fluctuations and project deferrals are reflected or excluded in the remaining performance obligation balance, as appropriate.
Note 3. Segment Reporting
We organize and manage our business by the following
five
segments which meet the definition of reportable segments under ASC 280-10,
Segment Reporting
: Commercial, Live Events, High School Park and Recreation, Transportation, and International. These segments are based on the customer type or geography and are the same as our business units.
Our Commercial business unit primarily consists of sales of our integrated video display systems, digital billboards, Galaxy
®
and Fuelight
™
product lines, and dynamic messaging systems to resellers (primarily sign companies), out-of-home ("OOH") companies, national retailers, quick-serve restaurants, casinos, shopping centers, cruise ships, commercial building owners, and petroleum retailers. Our Live Events business unit primarily consists of sales of integrated scoring and video display systems to college and professional sports facilities and convention centers and sales of our mobile display technology to video rental organizations and other live events type venues. Our High School Park and Recreation business unit primarily consists of sales of scoring systems, Galaxy
®
displays and video display systems to primary and secondary education facilities and resellers (primarily sign companies). Our Transportation business unit primarily consists of sales of intelligent transportation system dynamic messaging signs for road management, mass transit, and aviation applications and other electronic signage for advertising and way-finding needs, which includes our Vanguard
®
and Galaxy
®
product lines and other intelligent transportation systems dynamic message signs, to governmental transportation departments, transportation industry contractors, airlines and other transportation related customers. Our International business unit consists of sales of all product lines outside the United States and Canada. In our International business unit, we focus on product lines related to integrated scoring and video display systems for sports and commercial applications, OOH advertising products, architectural lighting, and transportation related products for sale outside of the United States and Canada to the related type of company, including sports and commercial business facilities, OOH companies, and governmental transportation agencies.
We evaluate segment performance based on operating results through contribution margin, which is comprised of gross profit less selling expense. Gross profit is net sales less cost of sales. Cost of sales consists primarily of inventory and components, logistics related costs including tariffs and duties, consumables, salaries, other employee-related costs, facilities-related costs for manufacturing locations, machinery and equipment maintenance and depreciation, site sub-contractors, warranty costs, enterprise resource and service management systems, inventory obsolescence and write-downs, inventory procurement and handling costs, and other manufacturing, installation, and service delivery expenses. Selling expenses consist primarily of salaries, other employee-related costs, travel and entertainment expenses, facilities-related costs for sales and service offices, bad debt expenses, third-party commissions and expenditures for marketing efforts, including the costs of collateral materials, conventions and trade shows, product demonstrations, customer relationship management systems, and supplies. Contribution margin excludes general and administration expense, product design and development expense, non-operating income and expense and income tax expense. Assets are not allocated to the segments. Depreciation and amortization are
52
allocated to each segment based on various financial measures; however, some depreciation and amortization are corporate in nature and remain unallocated. Our segments follow the same accounting policies as those described in "
Note 1. Nature of Business and Summary of Significant Accounting Policies
." Some expenses or services are not directly allocable to a sale or segment or the resources and related expenses are shared across business segment areas. These expenses are allocated using estimates and allocation methodologies based on some financial measures and professional judgment. Shared or unabsorbed manufacturing costs are allocated to the business unit benefiting most from that manufacturing location's production capabilities. Shared or unabsorbed costs of domestic field sales and services infrastructure, including most field administrative staff, are allocated to the Commercial, Live Events, High School Park and Recreation, and Transportation business units based on cost of sales. Shared manufacturing, buildings and utilities, and procurement costs are allocated based on payroll dollars, square footage and various other financial measures in the segment analysis. Separate financial information is available and regularly evaluated by our chief operating decision-maker ("CODM"), who is our president and chief executive officer, in making resource allocation decisions for our segments.
We do not maintain information on sales by products; therefore, disclosure of such information is not practical.
53
The following table sets forth certain financial information for each of our five reporting segments for the periods indicated:
|
|
Year Ended
|
||||||||||
|
May 2,
2020 |
April 27,
2019 |
April 28,
2018 |
|||||||||
|
Net sales:
|
|
|
|
||||||||
|
Commercial
|
$
|
152,627
|
|
$
|
148,833
|
|
$
|
134,535
|
|
||
|
Live Events
|
196,591
|
|
170,952
|
|
236,333
|
|
|||||
|
High School Park and Recreation
|
96,414
|
|
91,187
|
|
87,627
|
|
|||||
|
Transportation
|
70,139
|
|
64,391
|
|
59,578
|
|
|||||
|
International
|
93,161
|
|
94,341
|
|
92,457
|
|
|||||
|
|
608,932
|
|
569,704
|
|
610,530
|
|
|||||
|
Gross profit:
|
|||||||||||
|
Commercial
|
29,246
|
|
31,785
|
|
26,665
|
|
|||||
|
Live Events
|
39,518
|
|
32,164
|
|
49,755
|
|
|||||
|
High School Park and Recreation
|
28,874
|
|
26,858
|
|
29,317
|
|
|||||
|
Transportation
|
23,910
|
|
22,525
|
|
21,247
|
|
|||||
|
International
|
17,152
|
|
16,962
|
|
18,685
|
|
|||||
|
138,700
|
|
130,294
|
|
145,669
|
|
||||||
|
Contribution margin: (1)
|
|||||||||||
|
Commercial
|
9,897
|
|
13,218
|
|
7,986
|
|
|||||
|
Live Events
|
26,074
|
|
18,484
|
|
35,439
|
|
|||||
|
High School Park and Recreation
|
15,341
|
|
14,518
|
|
18,317
|
|
|||||
|
Transportation
|
19,566
|
|
18,260
|
|
17,048
|
|
|||||
|
International
|
1,920
|
|
1,166
|
|
4,119
|
|
|||||
|
72,798
|
|
65,646
|
|
82,909
|
|
||||||
|
Non-allocated operating expenses:
|
|||||||||||
|
General and administrative
|
35,193
|
|
34,817
|
|
34,919
|
|
|||||
|
Product design and development
|
37,772
|
|
35,557
|
|
35,530
|
|
|||||
|
Operating (loss) income
|
(167
|
)
|
(4,728
|
)
|
12,460
|
|
|||||
|
Nonoperating income (expense):
|
|||||||||||
|
Interest income
|
805
|
|
1,031
|
|
723
|
|
|||||
|
Interest expense
|
(106
|
)
|
(160
|
)
|
(217
|
)
|
|||||
|
Other (expense) income, net
|
(541
|
)
|
(1,087
|
)
|
(537
|
)
|
|||||
|
(Loss) income before income taxes
|
(9
|
)
|
(4,944
|
)
|
12,429
|
|
|||||
|
Income tax (benefit) expense
|
(500
|
)
|
(3,986
|
)
|
6,867
|
|
|||||
|
Net income (loss)
|
$
|
491
|
|
$
|
(958
|
)
|
$
|
5,562
|
|
||
|
Depreciation and amortization:
|
|||||||||||
|
Commercial
|
$
|
3,682
|
|
$
|
4,795
|
|
$
|
6,199
|
|
||
|
Live Events
|
5,605
|
|
5,194
|
|
4,783
|
|
|||||
|
High School Park and Recreation
|
2,025
|
|
1,965
|
|
1,646
|
|
|||||
|
Transportation
|
1,029
|
|
1,102
|
|
1,138
|
|
|||||
|
International
|
2,460
|
|
2,829
|
|
1,163
|
|
|||||
|
Unallocated corporate depreciation
|
2,917
|
|
2,750
|
|
2,855
|
|
|||||
|
|
$
|
17,718
|
|
$
|
18,635
|
|
$
|
17,784
|
|
||
(1) Contribution margin consists of gross profit less selling expense.
54
No single geographic area comprises a material amount of our net sales or property and equipment, net of accumulated depreciation, other than the United States. The following table presents information about net sales and property and equipment, net of accumulated depreciation, in the United States and elsewhere:
|
Year Ended
|
|||||||||||
|
May 2,
2020 |
April 27,
2019 |
April 28,
2018 |
|||||||||
|
Net sales:
|
|||||||||||
|
United States
|
$
|
504,931
|
|
$
|
460,099
|
|
$
|
501,646
|
|
||
|
Outside United States
|
104,001
|
|
109,605
|
|
108,884
|
|
|||||
|
$
|
608,932
|
|
$
|
569,704
|
|
$
|
610,530
|
|
|||
|
Property and equipment, net of accumulated depreciation:
|
|||||||||||
|
United States
|
$
|
58,422
|
|
$
|
59,192
|
|
$
|
61,206
|
|
||
|
Outside United States
|
9,062
|
|
6,122
|
|
6,853
|
|
|||||
|
$
|
67,484
|
|
$
|
65,314
|
|
$
|
68,059
|
|
|||
We have numerous customers worldwide for sales of our products and services, and no customer accounted for 10% or more of net sales; therefore, we are not economically dependent on a limited number of customers for the sale of our products and services.
We have numerous raw material and component suppliers, and no supplier accounts for 10% or more of our cost of sales; however, we have a number of single-source suppliers that could limit our supply or cause delays in obtaining raw material and components needed in manufacturing.
Note 4. Marketable Securities
We have a cash management program which provides for the investment of cash balances not used in current operations. We classify our investments in marketable securities as available-for-sale in accordance with the provisions of ASC 320,
Investments – Debt and Equity Securities.
Marketable securities classified as available-for-sale are reported at fair value with unrealized gains or losses, net of tax, reported in
accumulated other comprehensive loss
in the consolidated balance sheets. As it relates to fixed income marketable securities, it is not likely we will be required to sell any of these investments before recovery of the entire amortized cost basis. In addition, as of
May 2, 2020
, we anticipate we will recover the entire amortized cost basis of such fixed income securities, and we have determined no other-than-temporary impairments associated with credit losses were required to be recognized. The cost of securities sold is based on the specific identification method. Where quoted market prices are not available, we use the market price of similar types of securities traded in the market to estimate fair value.
As of
May 2, 2020
and
April 27, 2019
, our available-for-sale securities consisted of the following:
|
|
Amortized Cost
|
Unrealized Losses
|
Fair Value
|
||||||||
|
Balance as of May 2, 2020:
|
|
|
|
||||||||
|
Certificates of deposit
|
$
|
1,230
|
|
$
|
—
|
|
$
|
1,230
|
|
||
|
$
|
1,230
|
|
$
|
—
|
|
$
|
1,230
|
|
|||
|
Balance as of April 27, 2019:
|
|
|
|
|
|
|
|||||
|
Certificates of deposit
|
$
|
3,464
|
|
$
|
—
|
|
$
|
3,464
|
|
||
|
U.S. Government securities
|
10,779
|
|
(5
|
)
|
10,774
|
|
|||||
|
U.S. Government sponsored entities
|
10,510
|
|
(28
|
)
|
10,482
|
|
|||||
|
Municipal bonds
|
1,626
|
|
(2
|
)
|
1,624
|
|
|||||
|
$
|
26,379
|
|
$
|
(35
|
)
|
$
|
26,344
|
|
|||
Realized gains or losses on investments are recorded in our consolidated statements of operations as "
Other (expense) income, net
." Upon the sale of a security classified as available-for-sale, the security’s specific unrealized gain (loss) is reclassified out of
accumulated other comprehensive loss
into earnings based on the specific identification method. In the fiscal years ended
May 2, 2020
and
April 27, 2019
, the reclassifications from
accumulated other comprehensive loss
to net earnings were immaterial.
55
All available-for-sale securities are classified as current assets, as they are readily available to support our current operating needs. The contractual maturities of available-for-sale debt securities as of
May 2, 2020
were as follows:
|
|
Less than 12 months
|
Total
|
|||||
|
Certificates of deposit
|
$
|
1,230
|
|
$
|
1,230
|
|
|
|
$
|
1,230
|
|
$
|
1,230
|
|
||
Note 5. Business Combination
AJT Systems, Inc. Acquisition
We acquired the net assets of AJT Systems, Inc. ("AJT"), a Florida-based company, on June 21, 2018. The results of its operations have been included in our consolidated financial statements since the date of acquisition. We have not made pro forma disclosures about our acquisition of AJT's net assets because the results of its operations are not material to our consolidated financial statements.
AJT is a developer of real-time live to air graphics rendering and video server systems for the broadcast TV industry. This acquisition will allow our organization to grow and strengthen our solution offerings to the market. This acquisition was primarily funded with cash on hand and with payments made over a three-year period.
Note 6. Sale of Non-Digital Division Assets
During fiscal 2018, we sold our non-digital division assets, primarily consisting of inventory, non-digital manufacturing equipment, patented and unpatented technology and know-how, customer lists, and backlog, net of warranty obligations and accounts payable with a net book value of
$517
. We recorded a gain of
$1,267
on the disposal, which was included in cost of sales in the International business unit during fiscal 2018.
Note 7. Goodwill and Intangible Assets
We account for goodwill and intangible assets in accordance with ASC 350,
Goodwill and Other Intangible Assets.
Goodwill
The changes in the carrying amount of goodwill related to each reportable segment for the fiscal year ended
May 2, 2020
were as follows:
|
|
Live Events
|
Commercial
|
Transportation
|
International
|
Total
|
||||||||||||||
|
Balance as of April 27, 2019:
|
$
|
2,276
|
|
$
|
3,218
|
|
$
|
49
|
|
$
|
2,346
|
|
$
|
7,889
|
|
||||
|
Foreign currency translation
|
(10
|
)
|
(74
|
)
|
(11
|
)
|
(51
|
)
|
(146
|
)
|
|||||||||
|
Balance as of May 2, 2020:
|
$
|
2,266
|
|
$
|
3,144
|
|
$
|
38
|
|
$
|
2,295
|
|
$
|
7,743
|
|
||||
We perform an analysis of goodwill on an annual basis, and test for impairment more frequently if events or changes in circumstances indicate that an asset might be impaired. Our annual analysis is performed during our third quarter of each fiscal year, based on the goodwill amount as of the first business day of our third fiscal quarter. We performed our annual impairment test and concluded no goodwill impairment existed for fiscal years
2020
,
2019
, and
2018
.
In conducting our impairment testing, we utilize step 0 which allows us to first assess qualitative factors to determine whether it is more likely than not that the fair value of a reporting unit is less than its carrying value. If, based on a review of qualitative factors, it is more likely than not that the fair value of a reporting unit is less than its carrying value we perform a quantitative impairment test by comparing the fair value of a reporting unit with its carrying amount. If the carrying value exceeds the fair value, we measure the amount of impairment loss, if any.
In March 2020, we began to see impacts from the COVID-19 pandemic that could have a negative impact on our forecasted revenue and profitability. This, along with the decline in our stock price and other market conditions, led us to perform an interim qualitative goodwill impairment analysis. After evaluating our results, events and circumstances, we determined that a quantitative or step 1 analysis was necessary for our International business unit. The results of that analysis indicated no goodwill impairment was necessary.
Intangible Assets
The following table summarizes intangible assets, net, as of
May 2, 2020
and
April 27, 2019
:
56
|
|
May 2, 2020
|
||||||||||||
|
|
Weighted Average Life (in years)
|
Gross Carrying Amount
|
Accumulated Amortization
|
Net Carrying Amount
|
|||||||||
|
Registered trademarks
|
19.4
|
$
|
663
|
|
$
|
183
|
|
$
|
480
|
|
|||
|
Software
|
3.0
|
6,247
|
|
4,890
|
|
1,357
|
|
||||||
|
Customer relationships
|
10.0
|
2,641
|
|
1,135
|
|
1,506
|
|
||||||
|
Other
|
1.5
|
120
|
|
109
|
|
11
|
|
||||||
|
Total amortized intangible assets
|
6.0
|
$
|
9,671
|
|
$
|
6,317
|
|
$
|
3,354
|
|
|||
|
April 27, 2019
|
|||||||||||||
|
Weighted Average Life (in years)
|
Gross Carrying Amount
|
Accumulated Amortization
|
Net Carrying Amount
|
||||||||||
|
Registered trademarks
|
19.5
|
$
|
679
|
|
$
|
148
|
|
$
|
531
|
|
|||
|
Software
|
3.0
|
6,330
|
|
3,807
|
|
2,523
|
|
||||||
|
Customer relationships
|
10.0
|
2,720
|
|
888
|
|
1,832
|
|
||||||
|
Other
|
1.4
|
123
|
|
103
|
|
20
|
|
||||||
|
Total amortized intangible assets
|
6.0
|
$
|
9,852
|
|
$
|
4,946
|
|
$
|
4,906
|
|
|||
In the fiscal years
2020
,
2019
, and
2018
, amortization expense was
$1,498
,
$2,157
, and
$1,330
, respectively. Amortization expenses are included primarily in product design and development and selling expense in the consolidated statements of operations.
As of
May 2, 2020
, amortization expenses for future periods were estimated to be as follows:
|
Fiscal years ending
|
Amount
|
|||
|
2021
|
$
|
1,483
|
|
|
|
2022
|
476
|
|
||
|
2023
|
280
|
|
||
|
2024
|
280
|
|
||
|
2025
|
280
|
|
||
|
Thereafter
|
555
|
|
||
|
Total expected amortization expense
|
$
|
3,354
|
|
|
Note 8. Selected Financial Statement Data
Inventories consisted of the following:
|
May 2,
2020 |
April 27,
2019 |
||||||
|
Raw materials
|
$
|
35,306
|
|
$
|
30,789
|
|
|
|
Work-in-process
|
12,102
|
|
8,239
|
|
|||
|
Finished goods
|
39,395
|
|
39,804
|
|
|||
|
|
$
|
86,803
|
|
$
|
78,832
|
|
|
Property and equipment, net
consisted of the following:
57
|
May 2,
2020 |
April 27,
2019 |
||||||
|
Land
|
$
|
2,183
|
|
$
|
1,738
|
|
|
|
Buildings
|
68,804
|
|
66,403
|
|
|||
|
Machinery and equipment
|
104,157
|
|
96,486
|
|
|||
|
Office furniture and equipment
|
6,151
|
|
6,195
|
|
|||
|
Computer software and hardware
|
53,441
|
|
55,460
|
|
|||
|
Equipment held for rental
|
287
|
|
287
|
|
|||
|
Demonstration equipment
|
8,473
|
|
7,422
|
|
|||
|
Transportation equipment
|
7,944
|
|
7,715
|
|
|||
|
|
251,440
|
|
241,706
|
|
|||
|
Less accumulated depreciation
|
183,956
|
|
176,392
|
|
|||
|
|
$
|
67,484
|
|
$
|
65,314
|
|
|
Our depreciation expense was
$16,230
,
$16,564
, and
$16,273
for the fiscal years
2020
,
2019
, and
2018
, respectively.
In the fiscal years
2020
,
2019
, and
2018
, the pretax impairment charges for property and equipment were immaterial.
Accrued expenses
consisted of the following:
|
May 2,
2020 |
April 27,
2019 |
||||||
|
Compensation
|
$
|
15,967
|
|
$
|
12,766
|
|
|
|
Taxes, other than income taxes
|
3,597
|
|
2,685
|
|
|||
|
Accrued employee benefits
|
2,243
|
|
3,046
|
|
|||
|
Operating lease liabilities
|
2,416
|
|
—
|
|
|||
|
Short-term accrued expenses
|
9,270
|
|
8,520
|
|
|||
|
Claims liabilities
|
2,562
|
|
2,685
|
|
|||
|
Acquisition-related contingency consideration
|
571
|
|
2,359
|
|
|||
|
|
$
|
36,626
|
|
$
|
32,061
|
|
|
Other (expense) income, net
consisted of the following:
|
Year Ended
|
|||||||||||
|
May 2,
2020 |
April 27,
2019 |
April 28,
2018 |
|||||||||
|
Foreign currency transaction gains (losses)
|
$
|
207
|
|
$
|
(262
|
)
|
$
|
29
|
|
||
|
Equity in losses of affiliates
|
(741
|
)
|
(844
|
)
|
(481
|
)
|
|||||
|
Other
|
(7
|
)
|
19
|
|
(85
|
)
|
|||||
|
|
$
|
(541
|
)
|
$
|
(1,087
|
)
|
$
|
(537
|
)
|
||
Note 9. Receivables
We invoice customers based on a billing schedule as established in our contracts. We sometimes have the ability to file a contractor’s lien against the product installed as collateral and to file claims against surety bonds to protect our interest in receivables. Foreign sales are at times secured by irrevocable letters of credit or bank guarantees. Accounts receivable are reported net of an allowance for doubtful accounts of
$2,828
and
$2,208
at
May 2, 2020
and
April 27, 2019
, respectively. Included in accounts receivable as of
May 2, 2020
and
April 27, 2019
was
$687
and
$440
, respectively, of retainage on construction-type contracts, all of which is expected to be collected within one year.
In some contracts with customers, we agree to installment payments exceeding 12 months. The present value of these contracts is recorded as a receivable as the revenue is recognized in accordance with GAAP, and profit is recognized to the extent the present value is in excess of cost. We generally retain a security interest in the equipment or in the cash flow generated by the equipment until the contract is paid. The present value of long-term contracts, including accrued interest and current maturities, was
$4,633
and
$3,514
as of
May 2, 2020
and
April 27, 2019
, respectively. Contract receivables bearing annual interest rates of
5.0
to
9.0
percent are due in varying annual installments through
August 2024
. The face value of long-term receivables was
$5,166
as of
May 2, 2020
and
$3,271
as of
April 27, 2019
.
58
Our customers' businesses are subject to the fluctuations in global economic cycles and conditions and other business risk factors which may impact their ability to operate their businesses. The performance and financial condition of our customers may cause us to alter our business terms or to cease doing business with a particular customer. Further, the potential impact of the COVID-19 pandemic on their businesses could adversely impact our customers' ability to pay us for work performed and increase our future estimate of credit losses. We evaluated our receivable and contract assets as of
May 2, 2020
and reserved for anticipated losses. Due to the uncertainty created by the COVID-19 pandemic, this loss may materially change from this estimate.
Note 10. Financing Agreements
On November 15, 2019, we entered into an amendment to extend the maturity date of our credit agreement and a related revolving bank note from November 15, 2019 to November 15, 2022 and to modify certain other terms and financial covenants. The revolving amount of the agreement and note remains at
$35,000
, including up to
$15,000
for commercial and standby letters of credit. The interest rate ranges from the London Interbank Offered Rate ("LIBOR") plus
145
basis points to LIBOR plus
195
basis points depending on the ratio of our interest-bearing debt to EBITDA. EBITDA is defined as net income before deductions for interest expense, income taxes, depreciation and amortization, all as determined in accordance with GAAP. The effective interest rate was
2.0 percent
at
May 2, 2020
. We are assessed a loan fee equal to
0.125
percent per annum on any unused portion of the loan. As of
May 2, 2020
,
$15,000
had been advanced to us under the loan portion of the line of credit, and the balance of letters of credit outstanding was approximately
$4,196
.
The credit agreement is unsecured and requires us to be in compliance with the following financial ratios:
|
•
|
A minimum fixed charge coverage ratio of at least
2
to 1 at the end of any fiscal quarter. The ratio is equal to (a) EBITDA minus the sum of dividends or other distributions (unless the bank approves), share repurchases, a maintenance capital expenditure reserve in the amount of
$6,000
, and income tax to (b) all principal and interest payments with respect to indebtedness, excluding principal payments on the line of credit; and
|
|
•
|
A ratio of funded debt, excluding any marketing obligations, to EBITDA of greater than
2
to 1 at the end of any fiscal quarter.
|
We are sometimes required to obtain bank guarantees or other financial instruments for display installations. If we are unable to meet the terms of the arrangement, our customer would draw on the banking arrangement, and the bank would subrogate its loss to Daktronics. As of
May 2, 2020
, we had
$8,894
of such instruments outstanding.
As of
May 2, 2020
, we were in compliance with all applicable bank loan covenants.
Note 11. Share Repurchase Program
On
June 17, 2016
, our Board of Directors approved a stock repurchase program under which we may purchase up to
$40,000
of the Company's outstanding shares of common stock. Under this program, we may repurchase shares from time to time in open market transactions and in privately negotiated transactions based on business, market, applicable legal requirements and other considerations. The repurchase program does not require the repurchase of a specific number of shares and may be terminated at any time.
During fiscal 2018 and 2019, we had no repurchases of shares of our outstanding common stock. During fiscal 2020, we repurchased
1,039
shares of common stock at a total cost of
$5,636
. As of
May 2, 2020
, we had
$32,539
of remaining capacity under our current share repurchase program.
As part of our COVID-19 response, on April 1, 2020, our Board of Directors voted to suspend stock repurchases under our share repurchase program for the foreseeable future.
Note 12. Leases
We lease facilities and various equipment to manufacture products and provide employee collaboration space and tools. These are all classified as operating leases and have initial lease terms ranging from
one
to
five
years. These operating leases do not contain material residual value guarantees or material restrictive covenants. Our lease in Sioux Falls, South Dakota has a purchase option. We do not have any financing leases.
We determine if an arrangement is a lease at inception. Leases with an initial term of 12 months or less are not recorded on the balance sheet. Right-of-use assets represent our right to use an underlying asset for the lease term, and lease liabilities represent our obligation to make lease payments arising from the lease. Operating lease right-of-use assets and liabilities are recognized at commencement date based on the present value of lease payments over the lease term. As we are generally not able to determine the rate implicit in our leases, we use the incremental borrowing rate based on the information available at the commencement date in determining the present value of future lease payments. The operating lease right-of-use asset includes any prepaid lease payments and initial direct costs and excludes any lease incentives and impairments. Some of our leases include options to extend the term, which is only included in the right-of-use assets and lease liability calculation when it is reasonably certain that we will exercise that option. We have lease agreements with lease
59
and non-lease components, and we have elected to account for all asset classes as a single lease component. Our operating leases also typically require payment of real estate taxes, insurance, and common area maintenance. These components comprise the majority of our variable lease cost and are excluded from the present value of our lease obligations. In instances where they are fixed, they are included due to our election to combine lease and non-lease components. Our total variable lease costs are immaterial.
Operating lease cost is recognized on a straight-line basis over the lease term, and short-term lease cost is recognized when paid. During
fiscal 2020
, the operating lease cost included in cost of sales and operating expenses in the consolidated statements of operations was
$2,325
and
$1,116
, respectively. Operating lease cost includes short-term leases, which are immaterial.
As of
May 2, 2020
, the weighted average remaining lease term and discount rate related to operating leases was
5.0 years
and
3.4%
.
Supplemental unaudited cash flow information related to operating leases include:
|
Fiscal Year 2020
|
||||
|
Cash paid for amounts included in the measurement of lease liabilities:
|
||||
|
Operating cash flows from operating leases
|
$
|
3,340
|
|
|
Future minimum operating lease payments as of, and subsequent to,
May 2, 2020
under ASC 842 are as follows:
|
Operating Leases
(1)
|
||||
|
Fiscal years ending
|
||||
|
2021
|
$
|
2,675
|
|
|
|
2022
|
1,984
|
|
||
|
2023
|
1,209
|
|
||
|
2024
|
1,085
|
|
||
|
2025
|
931
|
|
||
|
Thereafter
|
1,467
|
|
||
|
Total lease payments
|
9,351
|
|
||
|
Less imputed interest
|
(780
|
)
|
||
|
Total lease liabilities
|
$
|
8,571
|
|
|
(1) Includes
$3,879
to extend the term of the lease for our Sioux Falls, South Dakota manufacturing facility.
Note 13. Shareholders’ Equity and Share-Based Compensation
Common stock
: Our
120,000
authorized shares consist of
115,000
shares of common stock and
5,000
shares of “undesignated stock.” Our Board of Directors has the power to authorize and issue any or all of the shares of undesignated stock without shareholder approval, including the authority to establish the rights and preferences of the undesignated stock.
Each outstanding share of our common stock includes
one
preferred share purchase right. Each right entitles the registered holder to purchase from us one one-thousandth of one share of our Series A Junior Participating Preferred Stock at an initial exercise price of
$25
per right, subject to adjustment and the terms of the shareholder rights agreement under which the dividend was declared and paid. The rights become exercisable immediately after the earlier of (i)
10
business days following a public announcement that a person or group has acquired beneficial ownership of
20 percent
or more of our outstanding common shares (subject to certain exceptions) or (ii)
10
business days following the commencement or announcement of an intention to make a tender offer or exchange offer for our common shares, the consummation of which would result in the beneficial ownership by a person or group of
20 percent
or more of our outstanding common shares. The rights expire on November 19, 2021, which date may be extended by our Board of Directors subject to certain additional conditions.
Stock incentive plans
: During fiscal 2016, we established the Daktronics, Inc. 2015 Stock Incentive Plan (“2015 Plan”) and ceased granting options under the 2007 Stock Incentive Plan ("2007 Plan"). The 2015 Plan provides for the issuance of stock-based awards, including stock options, restricted stock, restricted stock units and deferred stock, to employees, directors and consultants. Stock options issued to employees under the 2007 Plan and 2015 Plan generally have a
10
-year life, an exercise price equal to the market value on the grant date and a
five
-year annual vesting period. Stock options granted to independent directors under these plans have a
seven
-year life and an exercise price equal to the fair market value on the date of grant. Stock options granted to independent directors vest in
one
year, provided that the directors remain on the Board. The restricted stock granted to independent directors vests in
one
year, provided that the directors remain on the Board. Restricted stock units are granted to employees and have a
five
-year annual vesting period. As with stock options, restricted stock and restricted stock unit ownership cannot be transferred during the vesting period.
60
At
May 2, 2020
, the aggregate number of shares available for future grants under the 2015 Plan for stock options and restricted stock awards was
1,176 shares
. Shares of common stock subject to all stock awards granted under the 2015 Plan are counted as one share of stock for each share of stock subject to the award. Although the 2007 Plan remains in effect for options outstanding that were granted under the 2007 Plan until the earlier of the exercise of the options or their expiration or termination without being exercised, no new options can be granted under the 2007 Plan.
Restricted stock and restricted stock units
: We issue restricted stock to our non-employee directors and restricted stock units to employees. Restricted stock issued to non-employee directors are participating securities and receive dividends prior to vesting. Unvested restricted stock will terminate and be forfeited upon termination of employment or service. The fair value of restricted stock and our restricted stock unit awards are measured on the grant date based on the market value of our common stock. The related compensation expense as calculated under ASC 718, net of estimated forfeitures, is recognized over the applicable vesting period. Unrecognized compensation expense related to the restricted stock and restricted stock unit awards was approximately
$2,197
at
May 2, 2020
, which is expected to be recognized over a weighted-average period of
2.7
years. The total fair value of restricted stock vested was
$1,415
,
$1,530
, and
$1,274
in fiscal years
2020
,
2019
, and
2018
, respectively.
A summary of nonvested restricted stock and restricted stock units for fiscal years
2020
,
2019
, and
2018
is as follows:
|
|
Year Ended
|
|||||||||||||||||||
|
|
May 2, 2020
|
April 27, 2019
|
April 28, 2018
|
|||||||||||||||||
|
Number of
Nonvested
Shares
|
Weighted Average Grant Date Fair Value Per Share
|
Number of
Nonvested
Shares
|
Weighted Average Grant Date Fair Value Per Share
|
Number of
Nonvested
Shares
|
Weighted Average Grant Date Fair Value Per Share
|
|||||||||||||||
|
Outstanding at beginning of year
|
444
|
|
$
|
7.58
|
|
437
|
|
$
|
8.48
|
|
402
|
|
$
|
8.69
|
|
|||||
|
Granted
|
186
|
|
7.03
|
|
181
|
|
6.79
|
|
178
|
|
8.46
|
|
||||||||
|
Vested
|
(173
|
)
|
8.10
|
|
(169
|
)
|
9.05
|
|
(141
|
)
|
9.06
|
|
||||||||
|
Forfeited
|
(8
|
)
|
7.37
|
|
(5
|
)
|
7.74
|
|
(2
|
)
|
8.93
|
|
||||||||
|
Outstanding at end of year
|
449
|
|
$
|
7.16
|
|
444
|
|
$
|
7.58
|
|
437
|
|
$
|
8.48
|
|
|||||
Stock Options
: We issue incentive stock options to our employees and non-qualified stock options to our independent directors. A summary of stock option activity under our 2007 Plan and 2015 Plan during the fiscal year ended
May 2, 2020
is as follows:
|
Stock Options
|
Weighted Average Exercise Price Per Share
|
Weighted Average Remaining Contractual Life (Years)
|
Aggregate Intrinsic Value
|
||||||||||
|
Outstanding at April 27, 2019
|
2,202
|
|
$
|
10.03
|
|
4.41
|
|
$
|
—
|
|
|||
|
Granted
|
182
|
|
7.47
|
|
—
|
|
—
|
|
|||||
|
Canceled or forfeited
|
(263
|
)
|
8.85
|
|
—
|
|
—
|
|
|||||
|
Exercised
|
—
|
|
—
|
|
—
|
|
—
|
|
|||||
|
Outstanding at May 2, 2020
|
2,121
|
|
$
|
9.96
|
|
4.38
|
|
$
|
—
|
|
|||
|
Shares vested and expected to vest
|
2,098
|
|
$
|
9.98
|
|
4.34
|
|
$
|
—
|
|
|||
|
Exercisable at May 2, 2020
|
1,593
|
|
$
|
10.50
|
|
3.17
|
|
$
|
—
|
|
|||
The aggregate intrinsic value of stock options represents the difference between the exercise price of stock options and the fair market value of the underlying common stock for all in-the-money options. We define in-the-money options at
May 2, 2020
as options having exercise prices lower than the
$4.45
per share market price of our common stock on that date. There were in-the-money options to purchase
0
shares exercisable at
May 2, 2020
. The total intrinsic value of options exercised during fiscal years
2020
,
2019
, and
2018
was
$0
,
$98
, and
$65
, respectively. The total fair value of stock options vested was
$566
,
$667
, and
$977
for fiscal years
2020
,
2019
, and
2018
, respectively.
We estimate the fair value of stock options granted using the Black-Scholes option valuation model. We recognize the fair value of the stock options on a straight-line basis as compensation expense. All options are recognized over the requisite service periods of the awards, which are generally the vesting periods.
The Black-Scholes option-pricing model was developed for use in estimating the fair value of traded options which have no vesting restrictions and are fully transferable. In addition, option valuation models require the input of highly subjective assumptions, including
61
the expected stock price volatility. ASC 718 requires us to estimate forfeitures at the time of grant and revise those estimates in subsequent periods if actual forfeitures differ from those estimates. We use historical data to estimate pre-vesting option forfeitures and record share-based compensation expense only for those awards expected to vest. The following factors are the significant assumptions used in the computation of the fair value of options:
Expected life
. The expected life of options granted represents the period of time they are expected to be outstanding. We estimate the expected life of options granted based on historical exercise patterns, which we believe are representative of future behavior. We have examined our historical pattern of option exercises in an effort to determine if there were any discernible patterns of activity based on certain demographic characteristics. Demographic characteristics tested included age, salary level, job level and geographic location. We have determined there were no meaningful differences in option exercise activity based on the demographic characteristics tested.
Expected volatility
. We estimate the volatility of our common stock at the date of grant based on historical volatility consistent with ASC 718 and Securities and Exchange Commission ("SEC") Staff Accounting Bulletin No. 107,
Share Based Payments
.
Risk-free interest rate.
The rate is based on the U.S. Treasury zero-coupon yield curve on the grant date for a term similar to the expected life of the options.
Dividend yield.
We use an expected dividend yield consistent with our historical dividend yield pattern.
The following table provides the weighted-average fair value of options granted and the related assumptions used in the Black-Scholes model:
|
Year Ended
|
|||||||||||
|
May 2,
2020 |
April 27,
2019 |
April 28,
2018 |
|||||||||
|
Fair value of options granted
|
$
|
1.99
|
|
$
|
2.16
|
|
$
|
2.82
|
|
||
|
Risk-free interest rate
|
1.51
|
%
|
2.83
|
%
|
1.95
|
%
|
|||||
|
Expected dividend rate
|
3.50
|
%
|
3.37
|
%
|
3.27
|
%
|
|||||
|
Expected volatility
|
37.55
|
%
|
38.58
|
%
|
42.51
|
%
|
|||||
|
Expected life of option
|
6.94 years
|
|
6.83 years
|
|
6.83 years
|
|
|||||
Employee stock purchase plan
: We have an employee stock purchase plan (“ESPP”), which enables employees after
six
months of continuous employment to elect, in advance and semi-annually, to contribute up to
15
percent of their compensation, subject to certain limitations, toward the purchase of our common stock at a purchase price equal to
85
percent of the lower of the fair market value of the common stock on the first or last day of the participation period. The ESPP requires participants to hold any shares purchased under the ESPP for a minimum period of
one
year after the date of purchase. Compensation expense recognized on shares issued under our ESPP is based on the value of a traded option to purchase shares of our stock at a
15
percent discount to the stock price. The total number of shares reserved under the ESPP is
4,000
. The number of shares of common stock issued under the ESPP totaled
453
,
241
, and
223
shares in fiscal
2020
,
2019
, and
2018
, respectively. The number of shares of common stock reserved for future employee purchases under the ESPP totaled
979
shares at
May 2, 2020
. The ESPP is intended to qualify under Section 423 of the Internal Revenue Code of 1986 (the "Code").
Total share-based compensation expense
: As of
May 2, 2020
, there was
$3,096
of total unrecognized compensation cost related to nonvested share-based compensation arrangements granted under all equity compensation plans. Total unrecognized compensation cost will be adjusted for future changes in estimated forfeitures. We expect to recognize the cost over a weighted-average period of
2.9
years.
The following table presents a summary of the share-based compensation expense by equity type as follows:
|
|
Year Ended
|
||||||||||
|
May 2,
2020 |
April 27,
2019 |
April 28,
2018 |
|||||||||
|
Stock options
|
$
|
492
|
|
$
|
593
|
|
$
|
763
|
|
||
|
Restricted stock and stock units
|
1,341
|
|
1,446
|
|
1,442
|
|
|||||
|
Employee stock purchase plans
|
432
|
|
440
|
|
430
|
|
|||||
|
|
$
|
2,265
|
|
$
|
2,479
|
|
$
|
2,635
|
|
||
62
A summary of the share-based compensation expense for stock options, restricted stock, restricted stock units and shares issued under the ESPP for fiscal years
2020
,
2019
, and
2018
is as follows:
|
|
Year Ended
|
||||||||||
|
May 2,
2020 |
April 27,
2019 |
April 28,
2018 |
|||||||||
|
Cost of sales
|
$
|
514
|
|
$
|
578
|
|
$
|
619
|
|
||
|
Selling
|
572
|
|
625
|
|
644
|
|
|||||
|
General and administrative
|
717
|
|
772
|
|
851
|
|
|||||
|
Product design and development
|
462
|
|
504
|
|
521
|
|
|||||
|
|
$
|
2,265
|
|
$
|
2,479
|
|
$
|
2,635
|
|
||
We received
$0
in cash from option exercises under all share-based payment arrangements for the fiscal year ended
May 2, 2020
. The tax (expense) benefit related to non-qualified options and restricted stock units under all share-based payment arrangements totaled
$(92)
,
$(52)
, and
$9
for fiscal years
2020
,
2019
, and
2018
, respectively.
Note 14. Retirement Benefits
We sponsor a 401(k) savings plan providing benefits for substantially all United States-based employees of Daktronics, Inc. and its subsidiaries, subject to certain Internal Revenue Service ("IRS") limits. We made matching cash contributions equal to
50
percent of the employee's qualifying contribution up to
six
percent of such employee's compensation; however, effective April 1, 2020, we eliminated our matching contribution as one of our cost savings initiatives. Employees are eligible to participate in the 401(k) savings plan upon completion of
three
months of continuous service if they have attained the age of
21
. We contributed
$2,917
,
$2,754
and
$2,612
for matches to the plan for fiscal years
2020
,
2019
, and
2018
, respectively.
Note 15. Income Taxes
The following tables reflect the significant components of our income tax provision. The pretax income attributable to domestic and foreign operations was as follows:
|
Year Ended
|
|||||||||||
|
May 2,
2020 |
April 27,
2019 |
April 28,
2018 |
|||||||||
|
Domestic
|
$
|
(4,187
|
)
|
$
|
(8,402
|
)
|
$
|
9,235
|
|
||
|
Foreign
|
4,178
|
|
3,458
|
|
3,194
|
|
|||||
|
(Loss) income before income taxes
|
$
|
(9
|
)
|
$
|
(4,944
|
)
|
$
|
12,429
|
|
||
Income tax (benefit) expense
consisted of the following:
|
Year Ended
|
|||||||||||
|
May 2,
2020 |
April 27,
2019 |
April 28,
2018 |
|||||||||
|
Current:
|
|
|
|
||||||||
|
Federal
|
$
|
625
|
|
$
|
(2,142
|
)
|
$
|
1,646
|
|
||
|
State
|
297
|
|
384
|
|
868
|
|
|||||
|
Foreign
|
761
|
|
1,151
|
|
1,205
|
|
|||||
|
Deferred:
|
|||||||||||
|
Federal
|
(2,028
|
)
|
(2,725
|
)
|
3,693
|
|
|||||
|
State
|
(321
|
)
|
(390
|
)
|
27
|
|
|||||
|
Foreign
|
166
|
|
(264
|
)
|
(572
|
)
|
|||||
|
|
$
|
(500
|
)
|
$
|
(3,986
|
)
|
$
|
6,867
|
|
||
63
The reconciliation of the provision for income taxes and the amount computed by applying the federal statutory rate to income before income taxes is as follows:
|
Year Ended
|
|||||||||||
|
May 2,
2020 |
April 27,
2019 |
April 28,
2018 |
|||||||||
|
Computed income tax (benefit) expense at federal statutory rates
|
$
|
(2
|
)
|
$
|
(1,038
|
)
|
$
|
3,779
|
|
||
|
Change in uncertain tax positions
|
4
|
|
(2,600
|
)
|
65
|
|
|||||
|
Research and development tax credit
|
(1,621
|
)
|
(1,278
|
)
|
(1,598
|
)
|
|||||
|
Other, net
|
(241
|
)
|
587
|
|
559
|
|
|||||
|
Change in valuation allowances
|
482
|
|
(471
|
)
|
(486
|
)
|
|||||
|
GILTI
|
149
|
|
391
|
|
—
|
|
|||||
|
Base Erosion Anti-Abuse Tax (BEAT)
|
301
|
|
—
|
|
—
|
|
|||||
|
Stock compensation
|
318
|
|
308
|
|
336
|
|
|||||
|
Meals and entertainment
|
305
|
|
248
|
|
333
|
|
|||||
|
Dividends paid to retirement plan
|
(111
|
)
|
(158
|
)
|
(238
|
)
|
|||||
|
State taxes, net of federal benefit
|
(84
|
)
|
25
|
|
592
|
|
|||||
|
Impact of Tax Act
|
—
|
|
—
|
|
3,819
|
|
|||||
|
Domestic production activities deduction
|
—
|
|
—
|
|
(294
|
)
|
|||||
|
|
$
|
(500
|
)
|
$
|
(3,986
|
)
|
$
|
6,867
|
|
||
The effective income tax rate for fiscal 2020 was impacted due to the tax benefit of permanent tax credits reduced by a valuation allowance placed on equity investments in proportion to a small pre-tax book loss which results in an abnormal looking tax rate.
During fiscal 2019, our effective income tax rate was impacted due to a tax benefit of a book loss plus permanent credits and deductions, the release of unrecognized tax benefits, and the reversal of a valuation allowance related to foreign net operating loss carryforwards.
The effective income tax rate for fiscal 2018 was higher than the federal statutory rate primarily due to the impacts of the Tax Act signed into law on December 22, 2017, which included a re-measurement of deferred taxes resulting in an impact to tax expense and an estimated one-time transition tax on certain undistributed earnings for our foreign subsidiaries. The Tax Act reduced the federal normal statutory rate from
35 percent
to
21 percent
; however, since we are a fiscal year tax filer, a blended rate of
30.4 percent
was used for fiscal year 2018.
64
The components of the net deferred tax assets were as follows:
|
May 2,
2020 |
April 27,
2019 |
||||||
|
Deferred tax assets:
|
|
|
|||||
|
Accrued warranty obligations
|
$
|
6,202
|
|
$
|
5,912
|
|
|
|
Vacation accrual
|
1,753
|
|
1,571
|
|
|||
|
Deferred maintenance revenue
|
987
|
|
716
|
|
|||
|
Allowance for excess and obsolete inventory
|
1,318
|
|
1,340
|
|
|||
|
Legal reserve
|
503
|
|
260
|
|
|||
|
Equity compensation
|
396
|
|
486
|
|
|||
|
Allowance for doubtful accounts
|
546
|
|
402
|
|
|||
|
Inventory capitalization
|
822
|
|
567
|
|
|||
|
Accrued compensation and benefits
|
539
|
|
549
|
|
|||
|
Net operating loss carry forwards
|
919
|
|
1,059
|
|
|||
|
Research and development tax credit carry forwards
|
1,975
|
|
1,299
|
|
|||
|
Lease accounting - lease liability
|
2,099
|
|
—
|
|
|||
|
Other
|
1,035
|
|
1,647
|
|
|||
|
Total deferred tax assets
|
19,094
|
|
15,808
|
|
|||
|
Valuation allowance
|
(1,189
|
)
|
(893
|
)
|
|||
|
Net deferred tax assets
|
17,905
|
|
14,915
|
|
|||
|
Deferred tax liabilities:
|
|
|
|
|
|||
|
Property and equipment
|
(2,141
|
)
|
(3,100
|
)
|
|||
|
Lease accounting - right of use asset
|
(2,103
|
)
|
—
|
|
|||
|
Prepaid expenses
|
(440
|
)
|
(476
|
)
|
|||
|
Intangible assets
|
(317
|
)
|
(623
|
)
|
|||
|
Unrealized gain on foreign currency exchange
|
(17
|
)
|
(6
|
)
|
|||
|
Other
|
(68
|
)
|
(75
|
)
|
|||
|
Total deferred tax liabilities
|
(5,086
|
)
|
(4,280
|
)
|
|||
|
Net deferred tax asset
|
$
|
12,819
|
|
$
|
10,635
|
|
|
The classification of the net deferred tax assets in the accompanying consolidated balance sheets is:
|
May 2,
2020 |
April 27,
2019 |
||||||
|
Non-current assets
|
$
|
13,271
|
|
$
|
11,168
|
|
|
|
Non-current liabilities
|
(452
|
)
|
(533
|
)
|
|||
|
|
$
|
12,819
|
|
$
|
10,635
|
|
|
The summary of changes in the amounts related to unrecognized uncertain tax benefits are:
|
|
May 2, 2020
|
April 27, 2019
|
|||||
|
Balance at beginning of year
|
$
|
578
|
|
$
|
3,178
|
|
|
|
Gross increases related to prior period tax positions
|
17
|
|
13
|
|
|||
|
Gross decreases related to prior period tax positions
|
(2
|
)
|
(18
|
)
|
|||
|
Gross increases related to current period tax positions
|
148
|
|
146
|
|
|||
|
Lapse of statute of limitations
|
(159
|
)
|
(2,741
|
)
|
|||
|
Balance at end of year
|
$
|
582
|
|
$
|
578
|
|
|
All of our unrecognized tax benefits would have an impact on the effective tax rate if recognized. It is reasonably possible that the amount of unrecognized tax benefits could change due to one or more of the following events occurring in the next 12 months: expiring statutes, audit activity, tax payments, or competent authority proceedings. A statute of limitations relating to
$138
of the unrecognized tax benefits (including interest) expires in the next 12 months. The benefit will be recognized if the statute lapses with no further action taken by
65
regulators. Additionally, we recognized the release of
$159
in unrecognized tax benefits related to the lapse of a statute of limitations in fiscal 2020.
Interest and penalties incurred associated with uncertain tax positions are included in the "Income tax expense" line item in our consolidated statements of operations. Accrued interest and penalties are included in the related tax liability line item in our consolidated balance sheets of
$30
and
$26
as of
May 2, 2020
and
April 27, 2019
, respectively.
As of
May 2, 2020
, we had foreign net operating loss (“NOL”) carryforwards of approximately
$4,832
primarily related to our operations in Belgium and Ireland, which have indefinite lives. A deferred tax asset has been recorded for all NOL carryforwards totaling approximately
$919
. However, due to uncertainty in future taxable income, a valuation allowance totaling approximately
$627
has been recorded in Belgium. If sufficient evidence of our ability to generate future taxable income in the jurisdictions in which we currently maintain a valuation allowance causes us to determine that our deferred tax assets are more likely than not realizable, we would release our valuation allowance, which would result in an income tax benefit being recorded in our consolidated statements of operations.
Additional tax information:
We are subject to U.S. federal income tax as well as income taxes of multiple state and foreign jurisdictions. Fiscal years 2017, 2018 and 2019 remain open to federal tax examinations, and fiscal years 2016, 2017, 2018 and 2019 remain open for state income tax examinations. Certain subsidiaries are also subject to income tax in several foreign jurisdictions which have open tax years varying by jurisdiction beginning in fiscal 2008. In the event of any future tax assessments, we have elected to record the income taxes and any related interest and penalties as income tax expense in our consolidated statement of operations.
As of
May 2, 2020
, we had no deferred tax liability recognized relating to our investment in foreign subsidiaries where the earnings have been indefinitely reinvested. The Tax Act generally eliminates U.S. federal income taxes on dividends from foreign subsidiaries, and, as a result, the accumulated undistributed earnings would be subject only to other taxes, such as withholding taxes and state income taxes, on the distribution of such earnings. No additional withholding or income taxes have been provided for any remaining undistributed foreign earnings not subject to the one-time deemed repatriation tax, as it is our intention for these amounts to continue to be indefinitely reinvested in foreign operations in all of our non-U.S. jurisdictions.
On March 27, 2020, the Coronavirus Aid, Relief, and Economic Security Act ("CARES Act") was enacted in response to the COVID-19 global pandemic. The CARES Act includes provisions such as: a deferral of the employer portion of certain payroll taxes, refundable payroll tax credits, alternative minimum tax credit refunds, modifications to the net interest deduction limitations and technical corrections to tax depreciation methods for qualified improvement property, and permitting NOL incurred in tax years 2018, 2019, and 2020 (our fiscal years 2019, 2020, and 2021) to be carried back to each of the five preceding taxable years to generate a refund of previously paid income taxes. We are evaluating the specific rules, guidance, and procedures allowed by the provisions of the CARES Act. Some of these provisions do not apply to our income tax results; however, we are currently participating in the payment deferral of the employer portion of certain payroll taxes.
66
Note 16. Cash Flow Information
The changes in operating assets and liabilities consisted of the following:
|
|
Year Ended
|
||||||||||
|
May 2,
2020 |
April 27,
2019 |
April 28,
2018 |
|||||||||
|
(Increase) decrease:
|
|
|
|
||||||||
|
Account receivable
|
$
|
(7,461
|
)
|
$
|
10,856
|
|
$
|
2,266
|
|
||
|
Long-term receivables
|
(1,173
|
)
|
329
|
|
1,548
|
|
|||||
|
Inventories
|
(8,347
|
)
|
(4,076
|
)
|
(8,517
|
)
|
|||||
|
Contract assets
|
(1,931
|
)
|
(3,040
|
)
|
5,911
|
|
|||||
|
Prepaid expenses and other current assets
|
(1,403
|
)
|
472
|
|
(1,252
|
)
|
|||||
|
Income taxes receivables
|
533
|
|
4,250
|
|
(4,747
|
)
|
|||||
|
Investment in affiliates and other assets
|
(3,137
|
)
|
48
|
|
413
|
|
|||||
|
Increase (decrease):
|
|
|
|
|
|
|
|||||
|
Accounts payable
|
2,377
|
|
(2,747
|
)
|
(2,573
|
)
|
|||||
|
Contract liabilities
|
4,548
|
|
10,774
|
|
3,480
|
|
|||||
|
Accrued expenses
|
6,745
|
|
4,631
|
|
3,472
|
|
|||||
|
Warranty obligations
|
273
|
|
(4,393
|
)
|
346
|
|
|||||
|
Long-term warranty obligations
|
883
|
|
(1,079
|
)
|
1,729
|
|
|||||
|
Income taxes payable
|
390
|
|
(3,023
|
)
|
(592
|
)
|
|||||
|
Long-term marketing obligations and other payables
|
(387
|
)
|
(1,116
|
)
|
379
|
|
|||||
|
|
$
|
(8,090
|
)
|
$
|
11,886
|
|
$
|
1,863
|
|
||
Supplemental disclosures of cash flow information consisted of the following:
|
|
Year Ended
|
||||||||||
|
May 2,
2020 |
April 27,
2019 |
April 28,
2018 |
|||||||||
|
Cash payments for:
|
|
|
|
||||||||
|
Interest
|
$
|
46
|
|
$
|
177
|
|
$
|
193
|
|
||
|
Income taxes, net of refunds
|
977
|
|
(1,934
|
)
|
8,937
|
|
|||||
Supplemental schedule of non-cash investing and financing activities consisted of the following:
|
|
Year Ended
|
|||||||||||
|
May 2,
2020 |
April 27,
2019 |
April 28,
2018 |
||||||||||
|
Demonstration equipment transferred to inventory
|
$
|
10
|
|
$
|
97
|
|
$
|
72
|
|
|||
|
Purchases of property and equipment included in accounts payable
|
1,951
|
|
1,106
|
|
1,983
|
|
||||||
|
Contributions of common stock under the ESPP
|
2,311
|
|
1,650
|
|
1,682
|
|
||||||
Note 17. Fair Value Measurement
ASC 820,
Fair Value Measurement,
defines fair value as the price that would be received to sell an asset or paid to transfer a liability (an exit price) in an orderly transaction between market participants at the measurement date. It also establishes a fair value hierarchy which requires an entity to maximize the use of observable inputs and minimize the use of unobservable inputs when measuring fair value. The fair value hierarchy within ASC 820 distinguishes between the following three Levels of inputs which may be utilized when measuring fair value:
Level 1
- Quoted prices in active markets for identical assets or liabilities.
Level 2
- Observable inputs other than quoted prices included within Level 1 for the assets or liabilities, either directly or indirectly (for example, quoted market prices for similar assets and liabilities in active markets or quoted market prices for identical assets or liabilities in markets not considered to be active, inputs other than quoted prices that are observable for the asset or liability, or market-corroborated input).
67
Level 3
- Unobservable inputs supported by little or no market activity based on our own assumptions used to measure assets and liabilities.
The fair values for fixed-rate long-term receivables are estimated using a discounted cash flow analysis based on interest rates currently being offered for contracts with similar terms to customers with similar credit quality. The carrying amounts reported in our consolidated balance sheets for long-term receivables approximate fair value and have been categorized as a Level 2 fair value measurement. Fair values for fixed-rate long-term marketing obligations are estimated using a discounted cash flow calculation applying interest rates currently being offered for debt with similar terms and underlying collateral. The total carrying value of long-term marketing obligations as reported in our consolidated balance sheets within other long-term obligations approximates fair value and has been categorized as a Level 2 fair value measurement.
The following table sets forth by Level within the fair value hierarchy our financial assets and liabilities that were accounted for at fair value on a recurring basis at
May 2, 2020
and
April 27, 2019
according to the valuation techniques we used to determine their fair values. There have been no transfers of assets or liabilities among the fair value hierarchies presented.
|
|
Fair Value Measurements
|
||||||||||||||
|
|
Level 1
|
Level 2
|
Level 3
|
Total
|
|||||||||||
|
Balance as of May 2, 2020:
|
|
|
|
||||||||||||
|
Cash and cash equivalents
|
$
|
40,398
|
|
$
|
—
|
|
$
|
—
|
|
$
|
40,398
|
|
|||
|
Restricted cash
|
14
|
|
—
|
|
—
|
|
14
|
|
|||||||
|
Available-for-sale securities:
|
|
|
|
|
|||||||||||
|
Certificates of deposit
|
—
|
|
1,230
|
|
—
|
|
1,230
|
|
|||||||
|
Derivatives - asset position
|
—
|
|
261
|
|
—
|
|
261
|
|
|||||||
|
Derivatives - liability position
|
—
|
|
(17
|
)
|
—
|
|
(17
|
)
|
|||||||
|
Acquisition-related contingent consideration
|
—
|
|
—
|
|
(761
|
)
|
(761
|
)
|
|||||||
|
$
|
40,412
|
|
$
|
1,474
|
|
$
|
(761
|
)
|
$
|
41,125
|
|
||||
|
Balance as of April 27, 2019:
|
|
|
|
|
|
|
|||||||||
|
Cash and cash equivalents
|
$
|
35,383
|
|
$
|
—
|
|
$
|
—
|
|
$
|
35,383
|
|
|||
|
Restricted cash
|
359
|
|
—
|
|
—
|
|
359
|
|
|||||||
|
Available-for-sale securities:
|
|
|
|
|
|||||||||||
|
Certificates of deposit
|
—
|
|
3,464
|
|
—
|
|
3,464
|
|
|||||||
|
U.S. Government securities
|
10,774
|
|
—
|
|
—
|
|
10,774
|
|
|||||||
|
U.S. Government sponsored entities
|
—
|
|
10,482
|
|
—
|
|
10,482
|
|
|||||||
|
Municipal bonds
|
—
|
|
1,624
|
|
—
|
|
1,624
|
|
|||||||
|
Derivatives - asset position
|
—
|
|
91
|
|
—
|
|
91
|
|
|||||||
|
Derivatives - liability position
|
—
|
|
(4
|
)
|
—
|
|
(4
|
)
|
|||||||
|
Acquisition-related contingent consideration
|
—
|
|
—
|
|
(3,065
|
)
|
(3,065
|
)
|
|||||||
|
$
|
46,516
|
|
$
|
15,657
|
|
$
|
(3,065
|
)
|
$
|
59,108
|
|
||||
A roll forward of the Level 3 contingent liabilities, both short- and long-term, for the fiscal year ended
May 2, 2020
is as follows:
|
Acquisition-related contingent consideration as of April 27, 2019
|
$
|
3,065
|
|
|
|
Additions
|
100
|
|
||
|
Settlements
|
(2,491
|
)
|
||
|
Interest
|
50
|
|
||
|
Foreign currency translation
|
37
|
|
||
|
Acquisition-related contingent consideration as of May 2, 2020
|
$
|
761
|
|
|
The following methods and assumptions were used to estimate the fair value of each class of financial instrument. There have been no changes in the valuation techniques used by us to value our financial instruments.
Cash and cash equivalents
: Consists of cash on hand in bank deposits and highly liquid investments, primarily money market accounts. The fair value was measured using quoted market prices in active markets. The carrying amount approximates fair value.
Restricted cash
: Consists of cash and cash equivalents held in bank deposit accounts to secure issuances of foreign bank guarantees. The fair value of restricted cash was measured using quoted market prices in active markets. The carrying amount approximates fair value.
68
Certificates of deposit
: Consists of time deposit accounts with original maturities of less than three years and various yields. The fair value of these securities was measured based on valuations observed in less active markets than Level 1 investments from a third-party financial institution. The carrying amount approximates fair value.
U.S. Government securities
:
Consists of U.S. Government treasury bills, notes, and bonds with original maturities of less than three years and various yields. The fair value of these securities was measured using quoted market prices in active markets.
U.S. Government sponsored entities
: Consists of Fannie Mae and Federal Home Loan Bank investment grade debt securities trading with sufficient frequency and volume to enable us to obtain pricing information on an ongoing basis. The fair value of these securities was measured based on valuations observed in less active markets than Level 1 investments. The contractual maturities of these investments vary from one month to three years.
Municipal bonds
: Consists of investment grade municipal bonds trading with sufficient frequency and volume to enable us to obtain pricing information on an ongoing basis. The contractual maturities of these investments vary from two to three years. The fair value of these bonds was measured based on valuations observed in less active markets than Level 1 investments.
Derivatives – currency forward contracts
: Consists of currency forward contracts trading with sufficient frequency and volume to enable us to obtain pricing information on an ongoing basis. The fair value of these securities was measured based on a valuation from a third-party bank. See "
Note 18. Derivative Financial Instruments
" for more information regarding our derivatives.
Contingent liabilities
: Consists of the fair value of liabilities measured on expected future payments relating to business acquisitions if conditions are met. The contingent liabilities were calculated by estimating the discounted present value of expected future payments as of the acquisition date and subsequently at the end of each reporting period. The fair value measurement is based on significant unobservable inputs as of
May 2, 2020
and
April 27, 2019
. The contingent liabilities are presented in the "Accrued expenses" and "Other long-term obligations" line items in our consolidated balance sheets.
Non-recurring measurements:
The fair value measurement standard also applies to certain non-financial assets and liabilities measured at fair value on a nonrecurring basis. Certain long-lived assets such as goodwill, intangible assets and property and equipment are measured at fair value on a nonrecurring basis and are subject to fair value adjustments in certain circumstances, such as when there is evidence of impairment.
Other measurements using fair value
: Some of our financial instruments, such as accounts receivable, long-term receivables, prepaid expense and other assets, contract assets and liabilities, accounts payable, warranty obligations, and other long-term obligations, are reflected in the consolidated balance sheets at carrying value, which approximates fair value due to their short-term nature.
Note 18. Derivative Financial Instruments
We utilize derivative financial instruments to manage the economic impact of fluctuations in currency exchange rates on those transactions denominated in currencies other than our functional currency, which is the U.S. dollar. We enter into currency forward contracts to manage these economic risks. We account for all derivatives in the consolidated balance sheets within accounts receivable or accounts payable measured at fair value, and changes in fair values are recognized in earnings unless specific hedge accounting criteria are met for cash flow or net investment hedges. As of
May 2, 2020
and
April 27, 2019
, we had not designated any of our derivative instruments as accounting hedges, and thus we recorded the changes in fair value in the "
Other (expense) income, net
" line item in the consolidated statements of operations.
The foreign currency exchange contracts in aggregated notional amounts in place to exchange U.S. dollars at
May 2, 2020
and
April 27, 2019
were as follows:
|
|
May 2, 2020
|
April 27, 2019
|
|||||||||
|
|
U.S.
Dollars
|
Foreign
Currency
|
U.S.
Dollars
|
Foreign
Currency
|
|||||||
|
Foreign Currency Exchange Forward Contracts:
|
|
|
|
|
|||||||
|
U.S. Dollars/Australian Dollars
|
2,235
|
|
3,323
|
|
2,688
|
|
3,772
|
|
|||
|
U.S. Dollars/Canadian Dollars
|
452
|
|
648
|
|
625
|
|
821
|
|
|||
|
U.S. Dollars/British Pounds
|
3,160
|
|
2,424
|
|
3,547
|
|
2,680
|
|
|||
|
U.S. Dollars/Euros
|
1,881
|
|
1,689
|
|
—
|
|
—
|
|
|||
|
U.S. Dollars/Swiss Franc
|
—
|
|
—
|
|
927
|
|
925
|
|
|||
|
U.S. Dollars/Malaysian Ringgit
|
—
|
|
—
|
|
60
|
|
246
|
|
|||
69
As of
May 2, 2020
, there was an asset and liability of
$261
and
$17
, respectively, and as of
April 27, 2019
, there was an asset and liability of
$91
and
$4
, respectively, representing the fair value of foreign currency exchange forward contracts, which were determined using Level 2 inputs from a third-party bank. As of
May 2, 2020
, all contracts mature within
11
months.
Note 19. Commitments and Contingencies
Litigation:
We are a party to legal proceedings and claims which arise during the ordinary course of business. We review our legal proceedings and claims, regulatory reviews and inspections, and other legal matters on an ongoing basis and follow appropriate accounting guidance when making accrual and disclosure decisions. We establish accruals for those contingencies when the incurrence of a loss is probable and can be reasonably estimated, and we disclose the amount accrued and the amount of a reasonably possible loss in excess of the amount accrued, if such disclosure is necessary for our financial statements to not be misleading. We do not record an accrual when the likelihood of loss being incurred is probable, but the amount cannot be reasonably estimated, or when the loss is believed to be only reasonably possible or remote, although disclosures will be made for material matters as required by ASC 450-20,
Contingencies - Loss Contingencies
. Our assessment of whether a loss is reasonably possible or probable is based on our assessment and consultation with legal counsel regarding the ultimate outcome of the matter following all appeals.
As of May 2, 2020 and April 27, 2019,
$2,072
and
$1,072
, respectively, were included in the "Accrued expenses" line item in our consolidated balance sheets for a probable and reasonably estimated cost to settle a patent litigation claim. The costs are included in cost of sales in the High School Park and Recreation business unit for each fiscal year.
For other unresolved legal proceedings or claims, we do not believe there is a reasonable probability that any material loss would be incurred. Accordingly, no material accrual or disclosure of a potential range of loss has been made related to these matters. We do not expect the ultimate liability of these unresolved legal proceedings or claims to have a material effect on our financial position, liquidity or capital resources.
Warranties:
See "
Note 1. Nature of Business and Summary of Significant Accounting Policies
" for more information regarding warranties. During fiscal 2016, we discovered a warranty issue caused by a mechanical device failure within a module for displays primarily in our OOH application built prior to fiscal 2013. During
fiscal 2020
,
2019
, and
2018
, we recognized warranty expense and estimated equipment service agreement losses for probable and reasonably estimated costs to remediate this issue of
$0
,
$2,427
, and
$4,539
, respectively. Our contractual warranty arrangements have expired for products with this issue, and we do not expect material changes to the equipment service agreement accrual. The additional warranty expense in fiscal 2018 is primarily based on our decision to preserve our market leadership and for customer relationship purposes in certain cases beyond our contractual obligations.
Changes in our warranty obligation for the fiscal years ended
May 2, 2020
and
April 27, 2019
consisted of the following:
|
|
May 2, 2020
|
April 27, 2019
|
|||||
|
Beginning accrued warranty obligations
|
$
|
24,470
|
|
$
|
29,953
|
|
|
|
Warranties issued during the period
|
10,629
|
|
9,239
|
|
|||
|
Settlements made during the period
|
(9,209
|
)
|
(16,715
|
)
|
|||
|
Changes in accrued warranty obligations for pre-existing warranties during the period, including expirations
|
(266
|
)
|
1,993
|
|
|||
|
Ending accrued warranty obligations
|
$
|
25,624
|
|
$
|
24,470
|
|
|
Performance guarantees:
We have entered into standby letters of credit and surety bonds with financial institutions relating to the guarantee of our future performance on contracts, primarily construction-type contracts. As of
May 2, 2020
, we had outstanding letters of credit and surety bonds in the amount of
$13,090
and
$18,212
, respectively. Performance guarantees are issued to certain customers to guarantee the operation and installation of the equipment and our ability to complete a contract. These performance guarantees have various terms but are generally one year. We enter into written agreements with our customers, and those agreements often contain indemnification provisions that require us to make the customer whole if certain acts or omissions by us cause the customer financial loss. We make efforts to negotiate reasonable caps and limitations on the recovery of such damages. As of
May 2, 2020
, we were not aware of any indemnification claim from a customer.
Purchase commitments:
From time to time, we commit to purchase inventory, advertising, cloud-based information systems, information technology maintenance and support services, and various other products and services over periods that extend beyond one year. As of
May 2, 2020
, we were obligated under the following unconditional purchase commitments:
70
|
Fiscal years ending
|
Amount
|
|||
|
2021
|
$
|
4,775
|
|
|
|
2022
|
2,750
|
|
||
|
2023
|
1,754
|
|
||
|
2024
|
148
|
|
||
|
2025
|
113
|
|
||
|
Thereafter
|
40
|
|
||
|
$
|
9,580
|
|
||
Investment in affiliates commitments
: We agreed to invest an additional
$5,000
in XDC by February 2021 if certain conditions are met.
Note 20. Subsequent Events
During fiscal year 2020, we offered special voluntary retirement and voluntary exit offering ("Offering") and on May 13, 2020, we conducted a reduction in force to adjust our capacity and reduce on-going expenses due to the uncertainties created by the COVID-19 pandemic.
Under the Offering, employees had until June 2020 to choose to participate. During the first quarter of fiscal 2021,
57
employees agreed to participate and will complete employment by the end of June 2020. The approximate cost of this program was
$892
. Under the reduction in force, employment was terminated with
98
employees with severance totaling
$1,365
. These costs are fiscal 2021 expenses.
Note 21. Quarterly Financial Data (Unaudited)
The following table presents summarized quarterly financial data:
|
Fiscal Year 2020
(1)(2)
|
|||||||||||||||
|
August 3,
2019 |
November 2,
2019 |
February 1,
2020 |
May 2,
2020 |
||||||||||||
|
Net sales
|
$
|
180,256
|
|
$
|
174,911
|
|
$
|
127,657
|
|
$
|
126,108
|
|
|||
|
Gross profit
|
45,505
|
|
40,087
|
|
24,482
|
|
28,626
|
|
|||||||
|
Net income (loss)
|
7,030
|
|
7,274
|
|
(12,734
|
)
|
(1,079
|
)
|
|||||||
|
Basic earnings (loss) per share
|
0.16
|
|
0.16
|
|
(0.28
|
)
|
(0.02
|
)
|
|||||||
|
Diluted earnings (loss) per share
|
0.16
|
|
0.16
|
|
(0.28
|
)
|
(0.02
|
)
|
|||||||
|
Fiscal Year 2019
(2)(3)(4)
|
|||||||||||||||
|
July 28,
2018 |
October 27,
2018 |
January 26,
2019 |
April 27,
2019 |
||||||||||||
|
Net sales
|
$
|
154,188
|
|
$
|
172,692
|
|
$
|
115,069
|
|
$
|
127,755
|
|
|||
|
Gross profit
|
38,247
|
|
42,757
|
|
24,869
|
|
24,421
|
|
|||||||
|
Net income (loss)
|
4,574
|
|
8,606
|
|
(3,319
|
)
|
(10,819
|
)
|
|||||||
|
Basic earnings (loss) per share
|
0.10
|
|
0.19
|
|
(0.07
|
)
|
(0.24
|
)
|
|||||||
|
Diluted earnings (loss) per share
|
0.10
|
|
0.19
|
|
(0.07
|
)
|
(0.24
|
)
|
|||||||
|
(1)
|
Fiscal year 2020 consisted of 53 weeks.
|
|
(2)
|
Includes approximately
$4,927
of additional costs for tariffs during fiscal 2020 and
$6,300
of additional costs for price changes and tariffs during fiscal 2019.
|
|
(3)
|
The financial data for the quarter ended October 27, 2018 includes the net assets acquired of AJT Systems, Inc. See "
Note 5. Business Combination
" for further information.
|
(4) The financial data for the quarter ended January 26, 2019 includes the release of
$2,775
in unrecognized tax benefits related to the lapse of a statute of limitations and the release of
$480
for a valuation allowance reversal related to foreign net operating loss carryforwards. See "
Note 15. Income Taxes
" for further information.
Item 9. CHANGES IN AND DISAGREEMENTS WITH ACCOUNTANTS ON ACCOUNTING AND FINANCIAL DISCLOSURE
None.
71
Item 9A. CONTROLS AND PROCEDURES
Evaluation of Disclosure Controls and Procedures
Management of our Company is responsible for establishing and maintaining effective disclosure controls and procedures as defined in Rule 13a-15(e) under the Securities Exchange Act of 1934. As of
May 2, 2020
, an evaluation was performed, under the supervision and with the participation of management, including our Chief Executive Officer and Chief Financial Officer, of the effectiveness of the design and operation of our disclosure controls and procedures. Based upon that evaluation, the Chief Executive Officer and Chief Financial Officer concluded that as of
May 2, 2020
, our disclosure controls and procedures were effective at the reasonable assurance level to ensure information required to be disclosed in this Annual Report on Form 10-K was recorded, processed, summarized and reported within the time period required by the SEC’s rules and forms and accumulated and communicated to management, including our Chief Executive Officer and Chief Financial Officer, to allow timely decisions regarding required disclosure.
Changes in Internal Control Over Financial Reporting
During the quarter ended
May 2, 2020
, there have been no changes in our internal control over financial reporting that have materially affected, or are reasonably likely to materially affect, our internal control over financial reporting.
Management’s Report on Internal Control Over Financial Reporting
Our management is responsible for establishing and maintaining adequate internal control over financial reporting, as such term is defined in Rule 13a-15(f) under the Securities Exchange Act of 1934. Our internal control system was designed to provide reasonable assurance to our management and Board of Directors regarding the preparation and fair presentation of published financial statements. All internal control systems, no matter how well designed, have inherent limitations. Therefore, even those systems determined to be effective can provide only reasonable assurance with respect to financial statement preparation and presentation.
Under the supervision and with the participation of our management, including our Chief Executive Officer and Chief Financial Officer, we conducted an evaluation of the effectiveness of our internal control over financial reporting based on the framework in Internal Control—Integrated Framework issued by the Committee of Sponsoring Organizations of the Treadway Commission (2013 framework). Based on our evaluation under the framework in Internal Control—Integrated Framework, our management concluded our internal control over financial reporting was effective as of
May 2, 2020
.
Our internal control over financial reporting as of
May 2, 2020
has been audited by Deloitte & Touche, LLP, our independent registered public accounting firm, which is included in this Annual Report on Form 10-K.
|
By /s/ Reece A. Kurtenbach
|
By /s/ Sheila M. Anderson
|
|
Reece A. Kurtenbach
|
Sheila M. Anderson
|
|
Chief Executive Officer
|
Chief Financial Officer
|
|
June 12, 2020
|
June 12, 2020
|
Item 9B. OTHER INFORMATION
None.
72
PART III.
Item 10. DIRECTORS, EXECUTIVE OFFICERS AND CORPORATE GOVERNANCE
The information required by this Item 10 will be included under the captions “Proposal One - Election of Directors” and “Corporate Governance” in our Proxy Statement for our
2020
annual meeting of shareholders (“Proxy Statement”) to be filed within 120 days after our most recent fiscal year-end. Any information concerning the compliance of our officers, directors and 10 percent shareholders with Section 16(a) of the Securities Exchange Act of 1934 is incorporated by reference to the information to be contained in the Proxy Statement under the caption “Delinquent Section 16(a) Reports.” The information regarding Audit Committee members and “Audit Committee Financial Experts” is incorporated by reference to the information to be contained in the Proxy Statement under the caption “Corporate Governance–Committees of the Board of Directors.” The information regarding our Code of Conduct is incorporated by reference to the information to be contained in the Proxy Statement under the heading “Corporate Governance – Code of Conduct.”
Item 11. EXECUTIVE COMPENSATION
Information regarding the compensation of our directors and officers for the fiscal year ended
May 2, 2020
will be in the Proxy Statement under the heading “Proposal One - Election of Directors” and “Executive Compensation” and is incorporated herein by reference.
We maintain a Code of Conduct which applies to all employees, officers and directors. Included in the Code of Conduct are ethics provisions that apply to our Chief Executive Officer, Chief Financial Officer and all other financial and accounting management employees. A copy of our Code of Conduct can be obtained from our website at
www.daktronics.com
on the Investor Relations page and will be made available free of charge to any shareholder upon request. Information on or available through our website is not part of this Form 10-K. We intend to disclose any waivers from, or amendments to, the Code of Conduct by posting a description of such waiver or amendment on our Internet website. However, to date, we have not granted a waiver from the Code of Conduct.
Item 12. SECURITY OWNERSHIP OF CERTAIN BENEFICIAL OWNERS AND MANAGEMENT AND RELATED STOCKHOLDER MATTERS
The security ownership of certain beneficial owners and management will be contained in the Proxy Statement under the heading “Security Ownership of Certain Beneficial Owners and Management” and “Executive Compensation - Securities Authorized for Issuance Under Equity Compensation Plans” and is incorporated herein by reference.
Item 13. CERTAIN RELATIONSHIPS AND RELATED TRANSACTIONS AND DIRECTOR INDEPENDENCE
Information required by this item is incorporated by reference from the sections entitled “Proposal One – Election of Directors – Independent Directors” and “Corporate Governance - Compensation Committee Interlocks and Insider Participation” that will be contained in our Proxy Statement. There were no related party transactions in fiscal
2020
.
Item 14. PRINCIPAL ACCOUNTANT FEES AND SERVICES
Information regarding our principal accountant will be contained in the Proxy Statement under the heading “Proposal Three - Ratification of Appointment of Independent Registered Public Accounting Firm” and is incorporated herein by reference.
73
PART IV
.
Item 15. EXHIBITS AND FINANCIAL STATEMENT SCHEDULES
|
(a)(1)
|
Financial Statements
|
Our financial statements, a description of which follows, are contained in Part II, Item 8:
|
(2)
|
Schedules
|
The following financial statement schedule is submitted herewith:
Other schedules are omitted because they are not required or are not applicable or because the required information is included in the financial statements listed above.
|
(3)
|
Exhibits
|
A list of exhibits required to be filed as part of this report is set forth in the Index of Exhibits, which immediately precedes such exhibits, and is incorporated herein by reference.
ADFLOW
®
, AJT Systems
®
, All Sport
®
, Daktronics
®
, D
®
, DakStats
®
, Data Display
®
, DataTime
®
, Fuelight
™
, Fuelink
™
, Galaxy
®
, GalaxyPro
™
, Go Digital
®
, Keyframe
®
, Liveticker
®
, Matside
®
, OmniSport
®
, ProAd
®
, ProPixel
®
, ProRail
®
, ProStar
®
, Sportsound
®
, Statvision
®
, Tuff Sport
®
, Uniview
®
, Vanguard
®
, Venus
®
, Visiconn
®
, V-Tour
®
, V-Link
®
, and Web-Sync
®
are trademarks of Daktronics, Inc. All other trademarks referenced are the intellectual property of their respective companies.
74
SIGNATURES
Pursuant to the requirements of Section 13 or 15(d) of the Securities Exchange Act of 1934, the Registrant has duly caused this Annual Report to be signed on its behalf by the undersigned, thereunto duly authorized, on
June 12, 2020
.
|
|
DAKTRONICS, INC.
|
|
|
|
By: /s/ Reece A. Kurtenbach
|
|
|
|
|
Chief Executive Officer and President
|
|
|
|
(Principal Executive Officer)
|
|
|
|
|
|
|
By: /s/ Sheila M. Anderson
|
|
|
|
|
Chief Financial Officer
|
|
|
|
(Principal Financial Officer and Principal Accounting Officer)
|
Pursuant to the requirements of the Securities Exchange Act of 1934, this report has been signed below by the following persons on behalf of the Registrant and in the capacities and on the dates indicated.
|
Signature
|
Title
|
Date
|
|
|
|
|
|
|
|
By /s/ Byron J. Anderson
|
Director
|
June 12, 2020
|
|
|
|
Byron J. Anderson
|
|
|
|
|
|
|
|
|
By /s/ Robert G. Dutcher
|
Director
|
June 12, 2020
|
|
|
|
Robert G. Dutcher
|
|
|
|
|
|
|
|
|
By /s/ Nancy D. Frame
|
Director
|
June 12, 2020
|
|
|
|
Nancy D. Frame
|
|
|
|
|
|
|
|
|
By /s/ Reece A. Kurtenbach
|
Director
|
June 12, 2020
|
|
|
|
Reece A. Kurtenbach
|
|
|
|
|
|
|
|
|
By /s/ James B. Morgan
|
Director
|
June 12, 2020
|
|
|
|
James B. Morgan
|
|
|
|
|
|
|
|
|
By /s/ John P. Friel
|
Director
|
June 12, 2020
|
|
|
|
John P. Friel
|
|
|
|
By /s/ Kevin P. McDermott
|
Director
|
June 12, 2020
|
|
|
Kevin P. McDermott
|
|||
75
|
DAKTRONICS, INC. AND SUBSIDIARIES
SCHEDULE II - VALUATION AND QUALIFYING ACCOUNTS
(in thousands)
|
|||||||||||||||||||
|
Additions
|
|||||||||||||||||||
|
Description
|
Balance at
Beginning of Year |
Charged to
Costs and
Expenses
|
Charged to
Other Accounts |
Deductions
|
Balance
at End of Year |
||||||||||||||
|
For the year ended May 2, 2020:
|
|||||||||||||||||||
|
Deducted from asset accounts:
|
|||||||||||||||||||
|
Allowance for doubtful accounts for trade receivables
|
$
|
2,208
|
|
$
|
1,461
|
|
$
|
—
|
|
$
|
(841
|
)
|
(a)
|
$
|
2,828
|
|
|||
|
For the year ended April 27, 2019:
|
|||||||||||||||||||
|
Deducted from asset accounts:
|
|||||||||||||||||||
|
Allowance for doubtful accounts for trade receivables
|
2,151
|
|
1,620
|
|
—
|
|
(1,563
|
)
|
(a)
|
2,208
|
|
||||||||
|
For the year ended April 28, 2018:
|
|||||||||||||||||||
|
Deducted from asset accounts:
|
|||||||||||||||||||
|
Allowance for doubtful accounts for trade receivables
|
2,610
|
|
1,451
|
|
—
|
|
(1,910
|
)
|
(a)
|
2,151
|
|
||||||||
76
Index of Exhibits
Certain of the following exhibits are incorporated by reference from prior filings. The form with which each exhibit was filed and the date of filing are as indicated below; the reports described below are filed as Commission File No. 0-23246 unless otherwise indicated.
|
|
||
|
4.1
|
Form of Stock Certificate Evidencing Common Stock, without par value, of the Company (Incorporated by reference to Exhibit 4.1 filed with our Amendment No. 1 to the Registration Statement on Form S-1 on January 12, 1994 as Commission File No. 33-72466).**
|
|
|
|
||
|
101
|
The following financial information from our Annual Report on Form 10-K for the fiscal year ended May 2, 2020, formatted in Extensible Business Reporting Language (XBRL): (i) the Consolidated Balance Sheets, (ii) the Consolidated Statements of Operations, (iii) the Consolidated Statements of Comprehensive Income, (iv) the Consolidated Statements of Shareholders' Equity, (v) the Consolidated Statements of Cash Flows, (vi) Notes to Consolidated Financial Statements, and (vii) document and entity information. (1)
|
|
|
|
(1)
|
Filed herewith electronically.
|
|
**
|
Paper filing.
|
|
|
*
|
Indicates a management contract or compensatory plan or arrangement.
|
|
77
TABLE OF CONTENTS
Part IItem 1. BusinessNote 3. Segment ReportingItem 1A. Risk FactorsNote 19. Commitments and ContingenciesNote 10. Financing AgreementsNote 7. Goodwill and Intangible AssetsItem 1B. Unresolved Staff CommentsItem 2. PropertiesNote 12. LeasesItem 3. Legal ProceedingsItem 4. Mine Safety DisclosuresPart IIItem 5. Market For Registrant S Common Equity, Related Stockholder Matters and Issuer Purchases Of Equity SecuritiesItem 6. Selected Financial Data (in Thousands, Except Per Share Data)Item 6. Selected Financial DataNote 5. Business CombinationNote 15. Income TaxesNote 6. Sale Of Non-digital Division AssetsItem 7. Management S Discussion and Analysis Of Financial Condition and Results Of OperationsNote 1. Nature Of Business and Summary Of Significant Accounting PoliciesNote 16. Cash Flow InformationNote 11. Share Repurchase ProgramItem 7A. Quantitative and Qualitative Disclosures About Market RiskNote 18. Derivative Financial InstrumentsItem 8. Financial Statements and Supplementary DataNote 9. ReceivablesNote 13. Shareholders Equity and Share-based CompensationNote 2. Revenue RecognitionNote 4. Marketable SecuritiesNote 8. Selected Financial Statement DataNote 14. Retirement BenefitsNote 17. Fair Value MeasurementNote 20. Subsequent EventsNote 21. Quarterly Financial Data (unaudited)Item 9. Changes in and Disagreements with Accountants on Accounting and Financial DisclosureItem 9A. Controls and ProceduresItem 9B. Other InformationPart IIIItem 10. Directors, Executive Officers and Corporate GovernanceItem 11. Executive CompensationItem 12. Security Ownership Of Certain Beneficial Owners and Management and Related Stockholder MattersItem 13. Certain Relationships and Related Transactions and Director IndependenceItem 14. Principal Accountant Fees and ServicesPart IVItem 15. Exhibits and Financial Statement Schedules