DELTA AIR LINES, INC.
10-Ks and 10-Qs
|
|
|
|
|
|
|
|
|
|
|
|
|
|
|
|
|
|
|
|
|
|
|
|
|
|
|
|
|
|
|
|
|
|
|
|
|
|
|
|
|
|
|
|
|
|
|
|
|
|
|
|
|
|
|
|
|
|
|
UNITED STATES
SECURITIES AND EXCHANGE COMMISSION
Washington, D.C. 20549
FORM 10-K
|
R
|
ANNUAL REPORT PURSUANT TO SECTION 13 OR 15(d) OF THE SECURITIES
EXCHANGE ACT OF 1934
|
For the fiscal year ended
December 31, 2011
|
Or
|
|
|
o
|
TRANSITION REPORT PURSUANT TO SECTION 13 OR 15(d) OF THE SECURITIES
EXCHANGE ACT OF 1934
|
Commission File Number 001-5424

DELTA AIR LINES, INC.
(Exact name of registrant as specified in its charter)
|
Delaware
|
58-0218548
|
|
(State or other jurisdiction of incorporation or organization)
|
(I.R.S. Employer Identification No.)
|
|
Post Office Box 20706
|
|
|
Atlanta, Georgia
|
30320-6001
|
|
(Address of principal executive offices)
|
(Zip Code)
|
|
Registrant's telephone number, including area code: (404) 715-2600
|
|
Securities registered pursuant to Section 12(b) of the Act:
|
Title of each class
|
Name of each exchange on which registered
|
|
|
Common Stock, par value $0.0001 per share
|
New York Stock Exchange
|
|
Securities registered pursuant to Section 12(g) of the Act: None
Indicate by check mark if the registrant is a well-known seasoned issuer, as defined in Rule 405 of the Securities Act. Yes
R
No
o
Indicate by check mark if the registrant is not required to file reports pursuant to Section 13 or Section 15(d) of the Exchange Act. Yes
o
No
R
Indicate by check mark whether the registrant (1) has filed all reports required to be filed by Section 13 or 15(d) of the Securities Exchange Act of 1934 during the preceding 12 months (or for such shorter period that the registrant was required to file such reports), and (2) has been subject to such filing requirements for the past 90 days. Yes
R
No
o
Indicate by check mark whether the registrant has submitted electronically and posted on its corporate Web site, if any, every Interactive Data File required to be submitted and posted pursuant to Rule 405 of Regulation S-T (§ 232.405 of this chapter) during the preceding 12 months (or for such shorter period that the registrant was required to submit and post such files). Yes
R
No
o
Indicate by check mark if disclosure of delinquent filers pursuant to Item 405 of Regulation S-K is not contained herein, and will not be contained, to the best of registrant's knowledge, in definitive proxy or information statements incorporated by reference in Part III of this Form 10-K or any amendment to this Form 10-K.
R
Indicate by check mark whether the registrant is a large accelerated filer, an accelerated filer, a non-accelerated filer, or a smaller reporting company. See the definitions of “large accelerated filer,” “accelerated filer” and “smaller reporting company” in Rule 12b-2 of the Exchange Act. (Check one):
|
Large accelerated filer
|
R
|
Accelerated filer
|
o
|
Non-accelerated filer
|
o
|
Smaller reporting company
|
o
|
|
|
(Do not check if a smaller reporting company)
|
||||||||
Indicate by check mark whether the registrant is a shell company (as defined in Rule 12b-2 of the Exchange Act). Yes
o
No
R
The aggregate market value of the voting and non-voting common equity held by non-affiliates of the registrant as of June 30, 2011 was approximately
$7.8 billion
.
Indicate by check mark whether the registrant has filed all documents and reports required to be filed by Section 12, 13 or 15(d) of the Securities Exchange Act of 1934 subsequent to the distribution of securities under a plan confirmed by a court. Yes
R
No
o
On January 31, 2012, there were outstanding
845,519,629
shares of the registrant's common stock.
This document is also available on our website at http://www.delta.com/about_delta/investor_relations.
Documents Incorporated By Reference
Part III of this Form 10-K incorporates by reference certain information from the registrant's definitive Proxy Statement for its Annual Meeting of Stockholders to be filed with the Securities and Exchange Commission.
|
Table of Contents
|
|
|
Page
|
|
|
Forward-Looking
Statements
|
|
|
PART I
|
|
|
PART II
|
|
|
Income Taxes
|
|
|
Page
|
|
|
PART III
|
|
|
PART IV
|
|
Unless otherwise indicated, the terms “Delta,” “we,” “us,” and “our” refer to Delta Air Lines, Inc. and its subsidiaries.
FORWARD-LOOKING STATEMENTS
Statements in this Form 10-K (or otherwise made by us or
on
our behalf) that are not historical facts, including statements about our estimates, expectations, beliefs, intentions, projections or strategies for the future, may be “forward-looking statements” as defined in the Private Securities Litigation Reform Act of 1995. Forward-looking statements involve risks and uncertainties that could cause actual results to differ materially from historical experience or our present expectations. Known material risk factors applicable to Delta are described in “Risk Factors Relating to Delta” and “Risk Factors Relating to the Airline Industry” in “Item 1A. Risk Factors” of this Form 10-K, other than risks that could apply to any issuer or offering. All forward-looking statements speak only as of the date made, and we undertake no obligation to publicly update or revise any forward-looking statements to reflect events or circumstances that may arise after the date of this report.
1
Part I
ITEM 1. BUSINESS
General
We provide scheduled air transportation for passengers and cargo throughout the United States and around the world. Our global route network gives us a presence in every major domestic and international market. Our route network is centered around the hub system we operate at airports in Amsterdam, Atlanta, Cincinnati, Detroit, Memphis, Minneapolis-St. Paul, New York-JFK, Paris-Charles de Gaulle, Salt Lake City and Tokyo-Narita. Each of these hub operations includes flights that gather and distribute traffic from markets in the geographic region surrounding the hub to domestic and international cities and to other hubs. Our network is supported by a fleet of aircraft that is varied in terms of size and capabilities, giving us flexibility to adjust aircraft to the network.
Other key characteristics of our route network include:
|
•
|
our alliances with foreign airlines, including our membership in SkyTeam, a global airline alliance;
|
|
•
|
our transatlantic joint venture with Air France-KLM and Alitalia;
|
|
•
|
our domestic marketing alliance with Alaska Airlines, which expands our west coast service; and
|
|
•
|
agreements with multiple domestic regional carriers, which operate as Delta Connection, including our wholly-owned subsidiary, Comair, Inc.
|
We are incorporated under the laws of the State of Delaware. Our principal executive offices are located at Hartsfield-Jackson Atlanta International Airport in Atlanta, Georgia. Our telephone number is (404) 715-2600 and our Internet address is www.delta.com. Information contained on this website is not part of, and is not incorporated by reference in, this Form 10-K.
International Alliances
We have bilateral and multilateral marketing alliances with foreign airlines to improve our access to international markets. These arrangements can include codesharing, reciprocal frequent flyer program benefits, shared or reciprocal access to passenger lounges, joint promotions, common use of airport gates and ticket counters, ticket office co-location and other marketing agreements. These alliances often present opportunities in other areas, such as airport ground handling arrangements and aircraft maintenance insourcing.
Our international codesharing agreements enable us to market and sell seats to an expanded number of international destinations. Under international codesharing arrangements, we and a foreign carrier each publish our respective airline designator codes on a single flight operation, thereby allowing us and the foreign carrier to offer joint service with one aircraft, rather than operating separate services with two aircraft. These arrangements typically allow us to sell seats on a foreign carrier's aircraft that are marketed under our designator code and permit the foreign airline to sell seats on our aircraft that are marketed under the foreign carrier's designator code.
We have international codeshare arrangements with Aeroméxico, Air France, Air Nigeria, Alitalia, Aeroflot, China Airlines, China Eastern, China Southern, CSA Czech Airlines, KLM Royal Dutch Airlines, Korean Air, Olympic Air, Royal Air Maroc, VRG Linhas Aéreas (operating as GOL), Vietnam Airlines, Virgin Australia and WestJet Airlines (and some affiliated carriers operating in conjunction with some of these airlines).
SkyTeam
. In addition to our marketing alliance agreements with individual foreign airlines, we are a member of the SkyTeam global airline alliance. The other members or prospective members of SkyTeam are Aeroflot, Aeroméxico, Air Europa, Air France, Alitalia, China Airlines, China Eastern, China Southern, CSA Czech Airlines, Kenya Airways, KLM, Korean Air, Tarom and Vietnam Airlines. Aerolineas Argentinas, Garuda Indonesia, Middle East Airlines, Saudi Arabian Airlines and Xiamen Airlines each have announced their formal intent to join SkyTeam within the next two years
.
One goal of SkyTeam is to link the route networks of the member airlines, providing opportunities for increased connecting traffic while offering enhanced customer service through mutual codesharing arrangements, reciprocal frequent flyer and lounge programs and coordinated cargo operations.
2
Transatlantic joint venture
. In addition to being members in SkyTeam with Air France and KLM, both of which are subsidiaries of the same holding company, and Alitalia, we have a transatlantic joint venture agreement with these carriers. This agreement provides for the sharing of revenues and costs on transatlantic routes, as well as coordinated pricing, scheduling and product development on included routes. Pursuant to this joint venture, we, Air France-KLM and Alitalia operate an extensive transatlantic network, primarily on routes between North America and Europe, and secondarily on routes between North America and Africa, the Middle East and India, and routes between Europe and Central America and several countries in northern South America.
Transpacific joint venture with Virgin Australia Airlines
. In June 2011, we and Virgin Australia Airlines received approval of antitrust immunity for our transpacific alliance. Antitrust immunity will allow us to implement a proposed joint venture that will expand the reach of Delta and Virgin Australia between the United States and Australia and the South Pacific. The alliance will create a network able to serve thousands of city-pairs in North America and the South Pacific. Alone, we serve only Sydney in Australia and Virgin Australia flies only to Los Angeles in the United States. The antitrust immunized alliance will allow the airlines to fully cooperate on network planning and distribution to deliver a more attractive and competitive service for customers.
Enhanced commercial agreements with Latin American Carriers.
In 2011, we entered into separate agreements with Grupo Aeroméxico, S.A.B. de C.V., the parent company of Aeroméxico, and GOL Linhas Aéreas Inteligentes, S.A, the parent company of GOL, for a strategic equity investment in each company and an exclusive commercial relationship with their carriers. We believe this will secure our long-term position in the important and expanding Latin markets of Mexico and Brazil, respectively. The agreements provide for expansion of codesharing, additional alignment of service attributes offered to frequent flyer members of our Sky Miles program and the other carriers' programs, and additional cooperation for selling activities. The expanded relationship with Aeroméxico also contemplates the establishment of a joint-venture maintenance, repair and overhaul facility in Guadalajara, Mexico.
Domestic Alliances
We have entered into a marketing alliance with Alaska Airlines, which includes mutual codesharing and reciprocal frequent flyer and airport lounge access arrangements. Our alliance agreement with Alaska Airlines provides for extensive cooperation with respect to our west coast presence.
We also have frequent flyer and reciprocal lounge agreements with Hawaiian Airlines, and codesharing agreements with American Eagle Airlines (“American Eagle”) and Hawaiian Airlines. These marketing relationships are designed to permit the carriers to retain their separate identities and route networks while increasing the number of domestic and international connecting passengers using the carriers' route networks.
Regional Carriers
We have air service agreements with multiple domestic regional air carriers that feed traffic to our route system by serving passengers primarily in small-and medium-sized cities. These arrangements enable us to increase the number of flights we have available in certain locations and to better match capacity with demand. Approximately
21%
of our passenger revenue in 2011 was related to flying by regional air carriers.
Through our regional carrier program, we have contractual arrangements with ten regional carriers to operate regional jet and, in certain cases, turbo-prop aircraft using our “DL” designator code. In addition to our wholly-owned subsidiary, Comair, we have contractual arrangements with: ExpressJet Airlines, Inc. (formerly, Atlantic Southeast Airlines, Inc.) and SkyWest Airlines, Inc., both subsidiaries of SkyWest, Inc.; Chautauqua Airlines, Inc. and Shuttle America Corporation, both subsidiaries of Republic Airways Holdings, Inc.; Pinnacle Airlines, Inc. and Mesaba Aviation, Inc. ("Mesaba"), both subsidiaries of Pinnacle Airlines Corp. ("Pinnacle"); Compass Airlines, Inc. ("Compass") and GoJet Airlines, LLC, both subsidiaries of Trans States Holdings, Inc. ("Trans States"); and American Eagle.
3
With the exception of American Eagle and a portion of the flights operated for us by SkyWest Airlines as described below, these agreements are capacity purchase arrangements, under which we control the scheduling, pricing, reservations, ticketing and seat inventories for the regional carriers' flights operating under our “DL” designator code, and we are entitled to all ticket, cargo, mail and in-flight and ancillary revenues associated with these flights. We pay those airlines an amount, as defined in the applicable agreement, which is based on a determination of their cost of operating those flights and other factors intended to approximate market rates for those services. These capacity purchase agreements are long-term agreements, usually with initial terms of at least 10 years, which grant us the option to extend the initial term. Certain of these agreements provide us the right to terminate the entire agreement, or in some cases remove some of the aircraft from the scope of the agreement, for convenience at certain future dates.
Our arrangement with American Eagle, limited to certain flights operated to and from the Los Angeles International Airport, as well as a portion of the flights operated for us by SkyWest Airlines, are structured as revenue proration agreements. These proration agreements establish a fixed dollar or percentage division of revenues for tickets sold to passengers traveling on connecting flight itineraries.
Frequent Flyer Program
Our SkyMiles
®
frequent flyer program is designed to retain and increase traveler loyalty by offering incentives to travel on Delta. The SkyMiles program allows program members to earn mileage for travel awards by flying on Delta, Delta's regional carriers and other participating airlines. Mileage credit may also be earned by using certain services offered by program participants, such as credit card companies, hotels and car rental agencies. In addition, individuals and companies may purchase mileage credits. Miles will not expire, but are subject to all program rules. We reserve the right to terminate the program with six months advance notice, and to change the program's terms and conditions at any time without notice.
SkyMiles program mileage credits can be redeemed for air travel on Delta and participating airlines, for membership in our Delta Sky Clubs
®
and for other program participant awards. Mileage credits are subject to certain transfer restrictions and travel awards are subject to capacity-controlled seating. In
2011
, program members redeemed more than 275 billion miles in the SkyMiles program for 12 million award redemptions. During this period, 8.2% of revenue miles flown on Delta were from award travel.
Other Businesses
Cargo
Through the strength of our global network, our cargo operations are able to connect all of the world's major freight gateways. We generate cargo revenues in domestic and international markets primarily through the use of cargo space on regularly scheduled passenger aircraft. We are a member of SkyTeam Cargo, a global airline cargo alliance, whose other members are Aeromexico Cargo, Air France Cargo, Alitalia Cargo, CSA Czech Airlines Cargo, KLM Cargo and Korean Air Cargo. SkyTeam Cargo offers a global network spanning six continents, provides customers a consistent international product line and permits its members to improve their efficiency and effectiveness in the marketplace.
Delta TechOps, Delta Global Services, MLT Vacations and Delta Private Jets
We have several other businesses arising from our airline operations, including aircraft maintenance, repair and overhaul (“MRO”), staffing services for third parties, vacation wholesale operations and our private jet operations. Our MRO operation, known as Delta TechOps, is the largest airline MRO in North America. In addition to providing maintenance and engineering support for our fleet of approximately
775
aircraft, Delta TechOps serves more than 150 aviation and airline customers from around the world. Delta TechOps employs approximately 9,600 maintenance professionals and is one of the most experienced MRO providers in the world. Our staffing services business, Delta Global Services, provides staffing services, professional security, training services and aviation solutions to approximately 150 customers. Our vacation wholesale business, MLT Vacations, is one of the largest providers of vacation packages in the United States. Our private jet operations, Delta Private Jets, provides aircraft charters, aircraft management and programs allowing members to purchase flight time by the hour. In 2011, the total revenue from these businesses was approximately $900 million.
4
Distribution and Expanded Product Offerings
Our tickets are sold through various distribution channels including telephone reservations, delta.com, global distribution systems and online travel agencies. An increasing number of our tickets are sold through delta.com, which reduces our distribution costs and gives us closer contact with our customers. We expect to launch a new delta.com platform in 2012, which we expect will result in additional purchases of tickets through that channel.
We are transforming distribution from a commodity approach to a differentiated and merchandised approach. We expect that the merchandising initiatives we are implementing, primarily through delta.com, will generate additional revenue opportunities for us and will improve the experience of our customers. Our plan is to provide our customers with opportunities to purchase what they value, such as first class upgrades, economy comfort seating, WiFi access and SkyClub passes. We also expect to benefit from increased traffic on delta.com through a combination of advertising revenue and sales of third party merchandise and services such as car rentals, hotels, and trip insurance.
Fuel
Our results of operations are significantly impacted by changes in the price and availability of aircraft fuel. The following table shows our aircraft fuel consumption and costs.
|
Year
|
Gallons Consumed
(1)
(Millions)
|
Cost
(1)(2)
(Millions)
|
Average Price Per Gallon
(1)(2)
|
Percentage of Total Operating Expense
(1)
|
||||||
|
2011
|
3,856
|
|
$
|
11,783
|
|
$
|
3.06
|
|
36
|
%
|
|
2010
|
3,823
|
|
$
|
8,901
|
|
$
|
2.33
|
|
30
|
%
|
|
2009
|
3,853
|
|
$
|
8,291
|
|
$
|
2.15
|
|
29
|
%
|
|
(1)
|
Includes the operations of our contract carriers under capacity purchase agreements.
|
|
(2)
|
Includes fuel hedge gains (losses) under our fuel hedging program of
$420 million
,
$(89) million
and
$(1.4) billion
for 2011, 2010 and 2009, respectively.
|
Our aircraft fuel purchase contracts do not provide material protection against price increases or assure the availability of our fuel supplies. We purchase most of our aircraft fuel under contracts that establish the price based on various market indices. We also purchase aircraft fuel on the spot market, from off-shore sources and under contracts that permit the refiners to set the price.
In an effort to manage our exposure to changes in aircraft fuel prices, we actively manage our fuel price risk through a hedging program intended to provide an offset against increases in jet fuel prices. This fuel hedging program utilizes several different contract and fuel commodity types, which are used together to create a risk mitigating hedge portfolio.
We are currently able to obtain adequate supplies of aircraft fuel, but it is impossible to predict the future availability or price of aircraft fuel. Weather-related events, natural disasters, political disruptions or wars involving oil-producing countries, changes in government policy concerning aircraft fuel production, transportation or marketing, changes in aircraft fuel production capacity, environmental concerns and other unpredictable events may result in fuel supply shortages and fuel price increases in the future.
Competition
The airline industry is highly competitive, marked by significant competition with respect to routes, fares, schedules (both timing and frequency), services, products, customer service and frequent flyer programs. The industry is going through a period of transformation through consolidation, both domestically and internationally, and changes in international alliances. Consolidation in the airline industry and changes in international alliances have altered and will continue to alter the competitive landscape in the industry by resulting in the formation of airlines and alliances with increased financial resources, more extensive global networks and altered cost structures. In addition, other network carriers have also significantly reduced their costs over the last several years including through restructuring and bankruptcy reorganization. American Airlines has recently filed for bankruptcy protection, which may enable it to substantially reduce its costs. Our ability to compete effectively depends, in part, on our ability to maintain a competitive cost structure.
5
Domestic
Our domestic operations are subject to competition from both traditional network and discount carriers, some of which may have lower costs than we do and provide service at low fares to destinations served by us. In particular, we face significant competition at our domestic hub airports in Atlanta, Cincinnati, Detroit, Memphis, Minneapolis-St. Paul, New York-JFK and Salt Lake City either directly at those airports or at the hubs of other airlines that are located in close proximity to our hubs. We also face competition in smaller to medium-sized markets from regional jet operators.
International
Our international operations are subject to competition from both domestic and foreign carriers. Through alliance and other marketing and codesharing agreements with foreign carriers, U.S. carriers have increased their ability to sell international transportation, such as services to and beyond traditional European and Asian gateway cities. Similarly, foreign carriers have obtained increased access to interior U.S. passenger traffic beyond traditional U.S. gateway cities through these relationships. In particular, alliances formed by domestic and foreign carriers, including SkyTeam, the Star Alliance (among United Air Lines, Continental Airlines, Lufthansa German Airlines, Air Canada and others) and the oneworld alliance (among American Airlines, British Airways, Qantas and others) have significantly increased competition in international markets. The adoption of liberalized Open Skies Aviation Agreements with an increasing number of countries around the world, including in particular the Open Skies Treaties that the U.S. has with the Member States of the European Union and Japan, could significantly increase competition among carriers serving those markets.
Several joint ventures among U.S. and foreign carriers, including our transatlantic joint venture with Air France-KLM and Alitalia, have received grants of antitrust immunity allowing the participating carriers to coordinate schedules, pricing, sales and inventory. Other joint ventures that have received anti-trust immunity include a transatlantic alliance among United, Continental, Air Canada and Lufthansa, a transpacific joint venture among United, Continental and All Nippon Airways, a transatlantic joint venture among American, British Airways and Iberia, and a transpacific joint venture between American and Japan Air Lines.
Regulatory Matters
The Department of Transportation (“DOT”) and the Federal Aviation Administration (the “FAA”) exercise regulatory authority over air transportation in the U.S. The DOT has authority to issue certificates of public convenience and necessity required for airlines to provide domestic air transportation. An air carrier that the DOT finds fit to operate is given authority to operate domestic and international air transportation (including the carriage of passengers and cargo). Except for constraints imposed by regulations regarding “Essential Air Services,” which are applicable to certain small communities, airlines may terminate service to a city without restriction.
The DOT has jurisdiction over certain economic and consumer protection matters, such as unfair or deceptive practices and methods of competition, advertising, denied boarding compensation, baggage liability and disabled passenger transportation. The DOT also has authority to review certain joint venture agreements between major carriers and engages in regulation of economic matters such as slot transactions. The FAA has primary responsibility for matters relating to the safety of air carrier flight operations, including airline operating certificates, control of navigable air space, flight personnel, aircraft certification and maintenance and other matters affecting air safety.
Authority to operate international routes and international codesharing arrangements is regulated by the DOT and by the governments of the foreign countries involved. International certificate authorities are also subject to the approval of the U.S. President for conformance with national defense and foreign policy objectives.
The Transportation Security Administration and the U.S. Customs and Border Protection, each a division of the Department of Homeland Security, are responsible for certain civil aviation security matters, including passenger and baggage screening at U.S. airports and international passenger prescreening prior to entry into or departure from the U.S.
Airlines are also subject to various other federal, state, local and foreign laws and regulations. For example, the U.S. Department of Justice has jurisdiction over airline competition matters. The U.S. Postal Service has authority over certain aspects of the transportation of mail. Labor relations in the airline industry, as discussed below, are generally governed by the Railway Labor Act. Environmental matters are regulated by various federal, state, local and foreign governmental entities. Privacy of passenger and employee data is regulated by domestic and foreign laws and regulations.
6
Fares and Rates
Airlines set ticket prices in all domestic and most international city pairs with minimal governmental regulation, and the industry is characterized by significant price competition. Certain international fares and rates are subject to the jurisdiction of the DOT and the governments of the foreign countries involved. Many of our tickets are sold by travel agents, and fares are subject to commissions, overrides and discounts paid to travel agents, brokers and wholesalers.
Route Authority
Our flight operations are authorized by certificates of public convenience and necessity and also by exemptions and limited-entry frequency awards issued by the DOT. The requisite approvals of other governments for international operations are controlled by bilateral agreements (and a multilateral agreement in the case of the U.S. and the European Union) with, or permits or approvals issued by, foreign countries. Because international air transportation is governed by bilateral or other agreements between the U.S. and the foreign country or countries involved, changes in U.S. or foreign government aviation policies could result in the alteration or termination of such agreements, diminish the value of our international route authorities or otherwise affect our international operations. Bilateral agreements between the U.S. and various foreign countries served by us are subject to renegotiation from time to time. The U.S. government has negotiated “open skies” agreements with many countries, which allow unrestricted access between the U.S. and the foreign markets. These agreements include separate agreements with the European Union and Japan.
Certain of our international route authorities are subject to periodic renewal requirements. We request extension of these authorities when and as appropriate. While the DOT usually renews temporary authorities on routes where the authorized carrier is providing a reasonable level of service, there is no assurance this practice will continue in general or with respect to a specific renewal. Dormant route authorities may not be renewed in some cases, especially where another U.S. carrier indicates a willingness to provide service.
Airport Access
Operations at four major domestic airports and certain foreign airports served by us are regulated by governmental entities through allocations of “slots” or similar regulatory mechanisms which limit the rights of carriers to conduct operations at those airports. Each slot represents the authorization to land at or take off from the particular airport during a specified time period.
In the U.S., the FAA currently regulates the allocation of slots, slot exemptions, operating authorizations, or similar capacity allocation mechanisms at Reagan National in Washington, D.C. and LaGuardia, John F. Kennedy International Airport (“JFK”) and Newark in the New York City area. Our operations at these airports generally require the allocation of slots or analogous regulatory authorizations. Similarly, our operations at Tokyo's Narita and Haneda Airports, London's Gatwick and Heathrow airports and other international airports are regulated by local slot coordinators pursuant to the International Air Transport Association's Worldwide Scheduling Guidelines and applicable local law. We currently have sufficient slots or analogous authorizations to operate our existing flights, and we have generally been able to obtain the rights to expand our operations and to change our schedules. There is no assurance, however, that we will be able to do so in the future because, among other reasons, such allocations are subject to changes in governmental policies.
Environmental Matters
Emissions
. The U.S. Environmental Protection Agency (the “EPA”) is authorized to regulate aircraft emissions and has historically implemented emissions control standards previously adopted by the International Civil Aviation Organization (“ICAO”). Our aircraft comply with existing EPA standards as applicable by engine design date. The ICAO has adopted two additional aircraft engine emissions standards, the first of which is applicable to engines certified after December 31, 2007, and the second of which is applicable to engines certified after December 31, 2013. On July 6, 2011, the EPA issued a Notice of Proposed Rulemaking that proposes to adopt these two ICAO aircraft engine emissions standards, but the EPA has not yet issued the final regulation.
7
Concern about aviation environmental issues, including climate change and greenhouse gases, has led to taxes on our operations in the United Kingdom and in Germany, both of which have levied taxes directly on our customers. We may face additional regulation of aircraft emissions in the United States and abroad and become subject to further taxes, charges or additional requirements to obtain permits or purchase allowances or emission credits for greenhouse gas emissions in various jurisdictions. This could result in taxation or permitting requirements from multiple jurisdictions for the same operations. Ongoing bilateral discussions between the United States and other nations as well as discussions at the ICAO Assembly and Conference of the Parties, most recently in Durbin in December 2011, may lead to international treaties or other actions focusing on reducing greenhouse gas emissions from aviation.
The European Union has required its member states to implement regulations including aviation in its Emissions Trading Scheme (“ETS”). Under these regulations, any airline with flights originating or landing in the European Union are subject to the ETS and, beginning in 2012, are required to purchase emissions allowances if the airline exceeds the number of free allowances allocated to it under the ETS. We expect that this system will impose significant costs on our operations in the European Union. Numerous countries, including the U.S., and airline groups continue to oppose the European Union ETS.
Cap and trade restrictions have also been proposed in the United States. In addition, other legislative or regulatory action, including by the EPA, to regulate greenhouse gas emissions is possible. In particular, the EPA has found that greenhouse gases threaten the public health and welfare, which could result in regulation of greenhouse gas emissions from aircraft. In the event that legislation or regulation is enacted in the U.S. or in the event similar legislation or regulation is enacted in jurisdictions other than the European Union where we operate or where we may operate in the future, it could result in significant costs for us and the airline industry. In addition to direct costs, such regulation may have a greater effect on the airline industry through increases in fuel costs that could result from fuel suppliers passing on increased costs that they incur under such a system. We are monitoring and evaluating the potential impact of such legislative and regulatory developments.
We seek to minimize the impact of carbon emissions from our operations through reductions in our fuel consumption and other efforts. We have reduced the fuel needs of our aircraft fleet through the retirement and replacement of certain elements of our fleet and with newer, more fuel efficient aircraft. In addition, we have implemented fuel saving procedures in our flight and ground support operations that further reduce carbon emissions. We are also supporting efforts to develop alternative fuels and efforts to modernize the air traffic control system in the U.S., as part of our efforts to reduce our emissions and minimize our impact on the environment.
Noise
. The Airport Noise and Capacity Act of 1990 recognizes the rights of operators of airports with noise problems to implement local noise abatement programs so long as such programs do not interfere unreasonably with interstate or foreign commerce or the national air transportation system. This statute generally provides that local noise restrictions on Stage 3 aircraft first effective after October 1, 1990, require FAA approval. While we have had sufficient scheduling flexibility to accommodate local noise restrictions in the past, our operations could be adversely impacted if locally-imposed regulations become more restrictive or widespread.
Other Environmental Matters
. We have been identified by the EPA as a potentially responsible party (a “PRP”) with respect to certain Superfund Sites, and entered into consent decrees or settlements regarding some of these sites. Our alleged disposal volume at each of these sites was small or was considered
de minimis
when compared to the total contributions of all PRPs at each site. We are aware of soil and/or ground water contamination present on our current or former leaseholds at several domestic airports. To address this contamination, we have a program in place to investigate and, if appropriate, remediate these sites. Although the ultimate outcome of these matters cannot be predicted with certainty, we believe that the resolution of these matters will not have a material adverse effect on our consolidated financial statements.
We are also subject to various other federal, state and local laws governing environmental matters, including the management and disposal of chemicals, waste and hazardous materials, protection of surface and subsurface waters, and regulation of air emissions and aircraft drinking water.
Civil Reserve Air Fleet Program
We participate in the Civil Reserve Air Fleet program (the “CRAF Program”), which permits the U.S. military to use the aircraft and crew resources of participating U.S. airlines during airlift emergencies, national emergencies or times of war. We have agreed to make available under the CRAF Program a portion of our international long-range aircraft during the contract period ending September 30, 2012.
We have also committed aircraft to international short-range requirements. The CRAF Program has only been activated twice since it was created in 1951.
8
Employee Matters
Railway Labor Act
Our relations with labor unions in the U.S. are governed by the Railway Labor Act. Under the Railway Labor Act, a labor union seeking to represent an unrepresented craft or class of employees is required to file with the National Mediation Board (the “NMB”) an application alleging a representation dispute, along with authorization cards signed by at least 35% of the employees in that craft or class. The NMB then investigates the dispute and, if it finds the labor union has obtained a sufficient number of authorization cards, conducts an election to determine whether to certify the labor union as the collective bargaining representative of that craft or class. A labor union will be certified as the representative of the employees in a craft or class if more than 50% of votes cast are for that union. A certified labor union would commence negotiations toward a collective bargaining agreement with the employer.
Under the Railway Labor Act, a collective bargaining agreement between an airline and a labor union does not expire, but instead becomes amendable as of a stated date. Either party may request that the NMB appoint a federal mediator to participate in the negotiations for a new or amended agreement. If no agreement is reached in mediation, the NMB may determine, at any time, that an impasse exists and offer binding arbitration. If either party rejects binding arbitration, a 30-day “cooling off” period begins. At the end of this 30-day period, the parties may engage in “self help,” unless the U.S. President appoints a Presidential Emergency Board (“PEB”) to investigate and report on the dispute. The appointment of a PEB maintains the “status quo” for an additional 60 days. If the parties do not reach agreement during this period, the parties may then engage in “self help.” “Self help” includes, among other things, a strike by the union or the imposition of proposed changes to the collective bargaining agreement by the airline. Congress and the President have the authority to prevent “self help” by enacting legislation that, among other things, imposes a settlement on the parties.
Collective Bargaining
As of
December 31, 2011
, we had approximately
78,400
full-time equivalent employees. Approximately
16%
of these employees were represented by unions, including the following domestic employee groups.
|
Employee Group
|
Approximate Number of Active Employees Represented
|
Union
|
Date on which Collective Bargaining Agreement Becomes Amendable
|
|
|
Delta Pilots
|
10,850
|
|
ALPA
|
December 31, 2012
|
|
Delta Flight Superintendents (Dispatchers)
|
340
|
|
PAFCA
|
December 31, 2013
|
|
Comair Pilots
|
790
|
|
ALPA
|
March 2, 2011
|
|
Comair Maintenance Employees
|
280
|
|
IAM
|
December 31, 2010
|
|
Comair Flight Attendants
|
550
|
|
IBT
|
December 31, 2010
|
All of our agreements with workgroups at our airline subsidiary, Comair, are currently amendable. Comair is in discussions with representatives of the respective unions and we cannot predict the outcome of those discussions.
Labor unions periodically engage in organizing efforts to represent various groups of our employees, including at our airline subsidiary, that are not represented for collective bargaining purposes.
Completion of Merger Integration
Integration of a number of the workgroups following our merger with Northwest Airlines (including pilots, aircraft maintenance technicians, dispatchers, meteorologists, simulator technicians, and office and clerical staff) has been completed. Completion of the integration of other workgroups (including flight attendants, airport employees and reservations employees) will be completed during 2012 following the final resolution of representation issues during the latter part of 2011. The flight attendants, airport employees and reservations employees each rejected representation by unions.
9
Executive Officers of the Registrant
Richard H. Anderson, Age 56
: Chief Executive Officer of Delta since September 1, 2007; Executive Vice President of UnitedHealth Group and President of its Commercial Services Group (December 2006-August 2007); Executive Vice President of UnitedHealth Group (November 2004-December 2006); Chief Executive Officer of Northwest Airlines Corporation (“Northwest”) (2001-November 2004).
Edward H. Bastian, Age 54
: President of Delta since September 1, 2007; President of Delta and Chief Executive Officer Northwest Airlines, Inc. (October 2008-December 2009); President and Chief Financial Officer of Delta (September 2007-October 2008); Executive Vice President and Chief Financial Officer of Delta (July 2005-September 2007); Chief Financial Officer, Acuity Brands (June 2005-July 2005); Senior Vice President-Finance and Controller of Delta (2000-April 2005); Vice President and Controller of Delta (1998-2000).
Michael H. Campbell, Age 63
: Executive Vice President-HR & Labor Relations of Delta since October 2008; Executive Vice President-HR, Labor & Communications of Delta (December 2007-October 2008); Executive Vice President-Human Resources and Labor Relations of Delta (July 2006-December 2007); Of Counsel, Ford & Harrison (January 2005-July 2006); Senior Vice President-Human Resources and Labor Relations, Continental Airlines, Inc. (1997-2004); Partner, Ford & Harrison (1978-1996).
Stephen E. Gorman, Age 56
: Executive Vice President and Chief Operating Officer of Delta since October 2008; Executive Vice President-Operations of Delta (December 2007-October 2008); President and Chief Executive Officer of Greyhound Lines, Inc. (June 2003-October 2007); President, North America and Executive Vice President Operations Support at Krispy Kreme Doughnuts, Inc. (August 2001-June 2003); Executive Vice President, Technical Operations and Flight Operations of Northwest (February 2001-August 2001), Senior Vice President, Technical Operations of Northwest (January 1999-February 2001), and Vice President, Engine Maintenance Operations of Northwest (April 1996-January 1999).
Glen W. Hauenstein, Age 51
: Executive Vice President-Network Planning and Revenue Management of Delta since April 2006; Executive Vice President and Chief of Network and Revenue Management of Delta (August 2005-April 2006); Vice General Director-Chief Commercial Officer and Chief Operating Officer of Alitalia (2003-2005); Senior Vice President-Network of Continental Airlines (2003); Senior Vice President-Scheduling of Continental Airlines (2001- 2003); Vice President Scheduling of Continental Airlines (1998-2001).
Hank Halter, Age 46
: Senior Vice President and Chief Financial Officer of Delta since October 2008; Senior Vice President-Finance and Controller of Delta (May 2005-October 2008); Vice President-Controller of Delta (March 2005-May 2005); Vice President-Assistant Controller of Delta (January 2002-March 2005); and Vice President-Finance-Operations of Delta (February 2000-December 2001); various finance leadership positions at Delta and American Airlines, Inc. (June 1993-February 2000).
Richard B. Hirst, Age 67
: Senior Vice President and General Counsel of Delta since October 2008; Senior Vice President-Corporate Affairs and General Counsel of Northwest (March 2008- October 2008); Executive Vice President and Chief Legal Officer of KB Home (March 2004-November 2006); Executive Vice President and General Counsel of Burger King Corporation (March 2001-June 2003); General Counsel of the Minnesota Twins (1999-2000); Senior Vice President-Corporate Affairs of Northwest (1994-1999); Senior Vice President-General Counsel of Northwest (1990-1994); Vice President-General Counsel and Secretary of Continental Airlines (1986-1990).
Additional Information
We make available free of charge on our website our Annual Report on Form 10-K, our Quarterly Reports on Form 10-Q, our Current Reports on Form 8-K and amendments to those reports as soon as reasonably practicable after these reports are filed with or furnished to the Securities and Exchange Commission. Information on our website is not incorporated into this Form 10-K or our other securities filings and is not a part of those filings.
10
ITEM 1A. RISK FACTORS
Risk Factors Relating to Delta
Our business and results of operations are dependent on the price and availability of aircraft fuel. High fuel costs or cost increases could have a materially adverse effect on our operating results. Likewise, significant disruptions in the supply of aircraft fuel would materially adversely affect our operations and operating results.
Our operating results are significantly impacted by changes in the price and availability of aircraft fuel. Fuel prices have increased substantially since the middle part of the last decade and have been extremely volatile during the last several years. In 2011, our average fuel price per gallon was
$3.06
, a
31%
increase from an average fuel price of
$2.33
in 2010. In 2010, our average fuel price per gallon was
$2.33
, an
8%
increase from an average fuel price of
$2.15
in 2009. In 2008, our average fuel price per gallon was
$3.16
, a 41% increase from an average price of $2.24 in 2007, which in turn was significantly higher than fuel prices just a few years earlier. Fuel costs represented
36%
,
30%
and
29%
of our operating expense in 2011, 2010 and 2009, respectively. Volatility in fuel costs has had a significant negative effect on our results of operations and financial condition.
Our ability to pass along the increased costs of fuel to our customers may be affected by the competitive nature of the airline industry. We often have not been able to increase our fares to offset fully the effect of increased fuel costs in the past and we may not be able to do so in the future. In addition, our aircraft fuel purchase contracts do not provide material protection against price increases or assure the availability of our fuel supplies. We purchase most of our aircraft fuel under contracts that establish the price based on various market indices. We also purchase aircraft fuel on the spot market, from offshore sources and under contracts that permit the refiners to set the price.
We are currently able to obtain adequate supplies of aircraft fuel, but it is impossible to predict the future availability or price of aircraft fuel. Weather-related events, natural disasters, political disruptions or wars involving oil-producing countries, changes in governmental policy concerning aircraft fuel production, transportation or marketing, changes in aircraft fuel production capacity, environmental concerns and other unpredictable events may result in additional fuel supply shortages and fuel price increases in the future. Additional increases in fuel costs or disruptions in fuel supplies could have additional negative effects on us.
Our fuel hedging activities are intended to provide an offset against increases in jet fuel prices. Our obligation to post collateral in connection with our hedge contracts may have a substantial impact on our short-term liquidity.
We actively manage our fuel price risk through a hedging program intended to provide an offset against increases in jet fuel prices.
This fuel hedging program utilizes several different contract and commodity types, which are used together to create a risk mitigating hedge portfolio.
The economic effectiveness of this hedge portfolio is frequently tested against our financial targets.
The hedge portfolio is rebalanced from time to time according to market conditions, which may result in locking in gains or losses on hedge contracts prior to their settlement dates
and may have a negative impact on our financial results.
Our fuel hedge contracts contain margin funding requirements, which are driven by changes in price of the underlying commodity and the contracts used.
The margin funding requirements may cause us to post margin to counterparties or may cause counterparties to post margin to us as market prices in the underlying hedged items change.
If fuel prices decrease significantly from the levels existing at the time we enter into fuel hedge contracts, we may be required to post a significant amount of margin
, which could have a material adverse impact on the level of our unrestricted cash and cash equivalents and short-term investments.
Our funding obligations with respect to defined benefit pension plans we
sponsor is significant and can vary materially because of changes in
investment asset returns and values.
As of
December 31, 2011
, our defined benefit pension plans had an estimated benefit obligation of approximately
$19.3 billion
and were funded through assets with a value of approximately
$7.8 billion
. The benefit obligation is significantly affected by investment asset returns and changes in interest rates, neither of which is in the control of Delta. We estimate that our funding requirement for our defined benefit pension plans, which are governed by ERISA and have been frozen for future accruals, is approximately
$700 million
in 2012. Estimates of pension plan funding requirements can vary materially from actual funding requirements because the estimates are based on various assumptions concerning factors outside our control, including, among other things, the market performance of assets; statutory requirements; and demographic data for participants, including the number of participants and the rate of participant attrition. Results that vary significantly from our assumptions could have a material impact on our future funding obligations.
11
Our substantial indebtedness may limit our financial and operating activities
and may adversely affect our ability to incur additional debt to fund future
needs.
We have substantial indebtedness, which could:
|
•
|
make us more vulnerable to economic downturns, adverse industry conditions or catastrophic external events;
|
|
•
|
limit our ability to borrow additional money for working capital, restructurings, capital expenditures, research and development, investments, acquisitions or other purposes, if needed, and increasing the cost of any of these borrowings;
|
|
•
|
limit our ability to withstand competitive pressures; and/or
|
|
•
|
limit our flexibility in responding to changing business and economic conditions, including increased competition and demand for new services, placing us at a disadvantage when compared to our competitors that have less debt, and making us more vulnerable than our competitors who have less debt to a downturn in our business, industry or the economy in general.
|
In addition, a substantial level of indebtedness, particularly because a significant portion of our assets are currently subject to liens, could limit our ability to obtain additional financing on acceptable terms or at all for working capital, capital expenditures and general corporate purposes. We have historically had substantial liquidity needs in the operation of our business. These liquidity needs could vary significantly and may be affected by general economic conditions, industry trends, performance and many other factors not within our control.
Agreements governing our debt, including credit agreements and indentures,
include financial and other covenants that impose restrictions on our
financial and business operations.
Our credit facilities and indentures for secured notes have various financial and other covenants that require us to maintain, depending on the particular agreement, minimum fixed charge coverage ratios, minimum liquidity and/or minimum collateral coverage ratios. The value of the collateral that has been pledged in each facility may change over time, which may be reflected in appraisals of collateral required by our credit agreements and indentures. These changes could result from factors that are not under our control. A decline in the value of collateral could result in a situation where we may not be able to maintain the collateral coverage ratio. In addition, the credit facilities and indentures contain other negative covenants customary for such financings. If we fail to comply with these covenants and are unable to obtain a waiver or amendment, an event of default would result. These covenants are subject to important exceptions and qualifications.
The credit facilities and indentures also contain other events of default customary for such financings. If an event of default were to occur, the lenders or the trustee could, among other things, declare outstanding amounts due and payable, and our cash may become restricted. We cannot provide assurance that we would have sufficient liquidity to repay or refinance the borrowings or notes under any of the credit facilities if such amounts were accelerated upon an event of default. In addition, an event of default or declaration of acceleration under any of the credit facilities or the indentures could also result in an event of default under other of our financing agreements.
Employee strikes and other labor-related disruptions may adversely affect our
operations.
Our business is labor intensive, utilizing large numbers of pilots, flight attendants, aircraft maintenance technicians, ground support personnel and other personnel. As of
December 31, 2011
, approximately
16%
of our workforce was unionized. Relations between air carriers and labor unions in the United States are governed by the Railway Labor Act, which provides that a collective bargaining agreement between an airline and a labor union does not expire, but instead becomes amendable as of a stated date. The Railway Labor Act generally prohibits strikes or other types of self-help actions both before and after a collective bargaining agreement becomes amendable, unless and until the collective bargaining processes required by the Railway Labor Act have been exhausted. Our agreement with our pilots becomes amendable in December 2012. All of our agreements with workgroups at our airline subsidiary, Comair, are currently amendable. Comair is in discussions with representatives of the respective unions and we cannot predict the outcome of those discussions.
12
If we or our affiliates are unable to reach agreement with any of our unionized work groups on future negotiations regarding the terms of their collective bargaining agreements or if additional segments of our workforce become unionized, we may be subject to work interruptions or stoppages, subject to the requirements of the Railway Labor Act. Strikes or labor disputes with our unionized employees may adversely affect our ability to conduct business. Likewise, if third party regional carriers with whom we have contract carrier agreements are unable to reach agreement with their unionized work groups on current or future negotiations regarding the terms of their collective bargaining agreements, those carriers may be subject to work interruptions or stoppages, subject to the requirements of the Railway Labor Act, which could have a negative impact on our operations.
Extended interruptions or disruptions in service at one of our hub airports could have a material adverse impact on our operations.
Our business is heavily dependent on our operations at the Atlanta airport and at our other hub airports in Amsterdam, Cincinnati, Detroit, Memphis, Minneapolis-St. Paul, New York-JFK, Paris-Charles de Gaulle, Salt Lake City and Tokyo-Narita. Each of these hub operations includes flights that gather and distribute traffic from markets in the geographic region surrounding the hub to other major cities and to other Delta hubs. A significant interruption or disruption in service at one of our hubs could have a serious impact on our business, financial condition and results of operations.
We are increasingly dependent on technology in our operations, and if our technology fails or we are unable to continue to invest in new technology, our business may be adversely affected.
We have become increasingly dependent on technology initiatives to reduce costs and to enhance customer service in order to compete in the current business environment. For example, we have made and continue to make significant investments in delta.com, check-in kiosks and related initiatives. The performance and reliability of the technology are critical to our ability to attract and retain customers and our ability to compete effectively. Because of the rapid pace of new developments, these initiatives will continue to require significant capital investments in our technology infrastructure. If we are unable to make these investments, our business and operations could be negatively affected. If we are unable to manage these challenges effectively, our business and results of operations could be negatively affected.
In addition, any internal technology error or failure impacting systems hosted internally at our data centers or externally at third party locations or large scale external interruption in technology infrastructure we depend on, such as power, telecommunications or the internet, may disrupt our technology network. Any individual, sustained or repeated failure of technology could impact our customer service and result in increased costs. Our technology systems and related data may also be vulnerable to a variety of sources of interruption due to events beyond our control, including natural disasters, terrorist attacks, telecommunications failures, computer viruses, hackers and other security issues. While we have in place, and continue to invest in, technology security initiatives and disaster recovery plans, these measures may not be adequate or implemented properly to prevent a business disruption and its adverse financial and reputational consequences to our business.
Our primary credit card processors have the ability to take significant holdbacks in certain circumstances. The initiation of such holdbacks likely would have a material adverse effect on our liquidity.
Most of the tickets we sell are paid for by customers who use credit cards. Our primary credit card processing agreements provide that no holdback of receivables or reserve is required except in certain circumstances, including if we do not maintain a required level of unrestricted cash. If circumstances were to occur that would allow American Express or our VISA/MasterCard processor to initiate a holdback, the negative impact on our liquidity likely would be material.
We are at risk of losses and adverse publicity stemming from any accident involving our aircraft.
An aircraft crash or other accident could expose us to significant tort liability. In the event that the insurance that we carry to cover damages arising from future accidents is not adequate, we may be forced to bear substantial losses from an accident. In addition, any accident involving an aircraft that we operate or an aircraft that is operated by an airline that is one of our regional carriers or codeshare partners could create a public perception that our aircraft are not safe or reliable, which could harm our reputation, result in air travelers being reluctant to fly on our aircraft and harm our business.
13
Our business is subject to the effects of weather and natural disasters and seasonality, which can cause our results to fluctuate.
Our results of operations will reflect fluctuations from weather, natural disasters and seasonality. Severe weather conditions and natural disasters can significantly disrupt service and create air traffic control problems. These events decrease revenue and can also increase costs. In addition, increases in frequency, severity or duration of thunderstorms, hurricanes, typhoons or other severe weather events, including from changes in the global climate, could result in increases in fuel consumption to avoid such weather, turbulence-related injuries, delays and cancellations, any of which would increase the potential for greater loss of revenue and higher costs. In addition, demand for air travel is typically higher in the June and September quarters, particularly in international markets, because there is more vacation travel during these periods than during the remainder of the year. Because of fluctuations in our results from weather, natural disasters and seasonality, operating results for a historical period are not necessarily indicative of operating results for a future period and operating results for an interim period are not necessarily indicative of operating results for an entire year.
An extended disruption in services provided by our third party regional
carriers could have a material adverse effect on our results of operations.
We utilize the services of third party providers in a number of areas in support of our operations that are integral to our business, including third party carriers in the Delta Connection program. While we have agreements with these providers that define expected service performance, we do not have direct control over the operations of these carriers. To the extent that a significant disruption in our regional operations occurs because any of these providers are unable to perform their obligations over an extended period of time, our revenue may be reduced or our expenses may be increased resulting in a material adverse effect on our results of operations.
If we experience losses of senior management personnel and other key employees, our operating results could be adversely affected.
We are dependent on the experience and industry knowledge of our officers and other key employees to execute our business plans. If we experience a substantial turnover in our leadership and other key employees, our performance could be materially adversely impacted. Furthermore, we may be unable to attract and retain additional qualified executives as needed in the future.
Our ability to use net operating loss carryforwards to offset future taxable income for U.S. federal income tax purposes is subject to limitation.
In general, under Section 382 of the Internal Revenue Code of 1986, as amended, a corporation that undergoes an “ownership change” is subject to limitations on its ability to utilize its pre-change net operating losses (“NOLs”), to offset future taxable income. In general, an ownership change occurs if the aggregate stock ownership of certain stockholders (generally 5% shareholders, applying certain look-through rules) increases by more than 50 percentage points over such stockholders' lowest percentage ownership during the testing period (generally three years).
As of
December 31, 2011
, Delta reported a consolidated federal pretax NOL carryforward of approximately
$16.8 billion
. Both Delta and Northwest experienced an ownership change in 2007 as a result of their respective plans of reorganization under Chapter 11 of the U.S. Bankruptcy Code. As a result of the merger, Northwest experienced a subsequent ownership change. Delta also experienced a subsequent ownership change on December 17, 2008 as a result of the merger, the issuance of equity to employees in connection with the merger and other transactions involving the sale of our common stock within the testing period.
The Delta and Northwest ownership changes resulting from the merger could limit the ability to utilize pre-change NOLs that were not subject to limitation, and could further limit the ability to utilize NOLs that were already subject to limitation. Limitations imposed on the ability to use NOLs to offset future taxable income could cause U.S. federal income taxes to be paid earlier than otherwise would be paid if such limitations were not in effect and could cause such NOLs to expire unused, in each case reducing or eliminating the benefit of such NOLs. Similar rules and limitations may apply for state income tax purposes. NOLs generated subsequent to December 17, 2008 are not limited.
14
Risk Factors Relating to the Airline Industry
The airline industry is highly competitive and, if we cannot successfully compete in the marketplace, our business, financial condition and operating results will be materially adversely affected.
The airline industry is highly competitive, marked by significant competition with respect to routes, fares, schedules (both timing and frequency), services, products, customer service and frequent flyer programs. Our domestic operations are subject to competition from both traditional network and discount carriers, some of which may have lower costs than we do and provide service at low fares to destinations served by us. In particular, we face significant competition at our domestic hub airports in Atlanta, Cincinnati, Detroit, Memphis, Minneapolis-St. Paul, New York-JFK and Salt Lake City either directly at those airports or at the hubs of other airlines that are located in close proximity to our hubs. We also face competition in smaller to medium-sized markets from regional jet operators.
Discount carriers, including Southwest, AirTran (now owned by Southwest) and JetBlue, have placed significant competitive pressure on us in the United States and on other network carriers in the domestic market. In addition, other network carriers have also significantly reduced their costs over the last several years through restructuring and bankruptcy reorganization. American has recently filed for bankruptcy protection, which may enable it to substantially reduce its costs. Our ability to compete effectively depends, in part, on our ability to maintain a competitive cost structure. If we cannot maintain our costs at a competitive level, then our business, financial condition and operating results could be materially adversely affected.
Our international operations are subject to competition from both domestic and foreign carriers. Through alliance and other marketing and codesharing agreements with foreign carriers, U.S. carriers have increased their ability to sell international transportation, such as services to and beyond traditional European and Asian gateway cities. Similarly, foreign carriers have obtained increased access to interior U.S. passenger traffic beyond traditional U.S. gateway cities through these relationships. In particular, alliances formed by domestic and foreign carriers, including SkyTeam, the Star Alliance (among United Air Lines, Continental Airlines, Lufthansa German Airlines, Air Canada and others) and the oneworld alliance (among American Airlines, British Airways, Qantas and others) have significantly increased competition in international markets. The adoption of liberalized Open Skies Aviation Agreements with an increasing number of countries around the world, including in particular the Open Skies Treaties that the U.S. has with the Member States of the European Union and Japan, could significantly increase competition among carriers serving those markets.
Several joint ventures among U.S. and foreign carriers, including our transatlantic joint venture with Air France-KLM and Alitalia, have received grants of antitrust immunity allowing the participating carriers to coordinate schedules, pricing, sales and inventory. Other joint ventures that have received anti-trust immunity include a transatlantic alliance among United, Continental, Air Canada and Lufthansa, a transpacific joint venture among United, Continental and All Nippon Airways, a transatlantic joint venture among American, British Airways and Iberia, and a transpacific joint venture between American and Japan Air Lines.
Consolidation in the domestic airline industry and changes in international alliances have altered and will continue to alter the competitive landscape in the industry by resulting in the formation of airlines and alliances with increased financial resources, more extensive global networks and altered cost structures.
The rapid spread of contagious illnesses can have a material adverse effect on our business and results of operations.
The rapid spread of a contagious illness can have a material adverse effect on the demand for worldwide air travel and therefore have a material adverse effect on our business and results of operations. Moreover, our operations could be negatively affected if employees are quarantined as the result of exposure to a contagious illness. Similarly, travel restrictions or operational problems resulting from the rapid spread of contagious illnesses in any part of the world in which we operate may have a materially adverse impact on our business and results of operations.
15
Terrorist attacks or international hostilities may adversely affect our business, financial condition and operating results.
The terrorist attacks of September 11, 2001 caused fundamental and permanent changes in the airline industry, including substantial revenue declines and cost increases, which resulted in industry-wide liquidity issues. Potential terrorist attacks or security breaches or fear of such events, even if not made directly on the airline industry, could negatively affect us and the airline industry. The potential negative effects include increased security (including as a result of our global operations), insurance and other costs and lost revenue from increased ticket refunds and decreased ticket sales. Our financial resources might not be sufficient to absorb the adverse effects of any further terrorist attacks or other international hostilities involving the United States.
The airline industry is subject to extensive government regulation, and new regulations may increase our operating costs.
Airlines are subject to extensive regulatory and legal compliance requirements that result in significant costs. For instance, the FAA from time to time issues directives and other regulations relating to the maintenance and operation of aircraft that necessitate significant expenditures. We expect to continue incurring expenses to comply with the FAA's regulations.
Other laws, regulations, taxes and airport rates and charges have also been imposed from time to time that significantly increase the cost of airline operations or reduce revenues. The industry is heavily taxed. For example, the Aviation and Transportation Security Act mandates the federalization of certain airport security procedures and imposes security requirements on airports and airlines, most of which are funded by a per ticket tax on passengers and a tax on airlines. The federal government has on several occasions proposed a significant increase in the per ticket tax and has recently proposed additional departure fees. A ticket tax increase or additional fees, if implemented, could negatively impact our results of operations.
Proposals to address congestion issues at certain airports or in certain airspace, particularly in the Northeast United States, have included concepts such as “congestion-based” landing fees, “slot auctions” or other alternatives that could impose a significant cost on the airlines operating in those airports or airspace and impact the ability of those airlines to respond to competitive actions by other airlines. In contrast, the failure of the federal government to upgrade the U.S. air traffic control system has resulted in delays and disruptions of air traffic during peak travel periods in certain congested markets. The failure to improve the air traffic control system could lead to increased delays and inefficiencies in flight operations as demand for U.S. air travel increases, having a material adverse effect on our operations. Failure to update the air traffic control system in a timely manner, and the substantial funding requirements of an updated system that may be imposed on air carriers, may have an adverse impact on our financial condition and results of operations.
Events related to extreme weather delays caused the DOT to promulgate regulations imposing potentially severe financial penalties upon airlines that have flights experiencing extended tarmac delays. These regulations could have a negative impact on our operations in certain circumstances.
Future regulatory action concerning climate change and aircraft emissions could have a significant effect on the airline industry. For example, the European Commission has adopted an emissions trading scheme applicable to all flights operating in the European Union, including flights to and from the United States. We expect that this system will impose additional costs on our operations in the European Union. Other laws or regulations such as this emissions trading scheme or other U.S. or foreign governmental actions may adversely affect our operations and financial results, either through direct costs in our operations or through increases in costs for jet fuel that could result from jet fuel suppliers passing on increased costs that they incur under such a system.
We and other U.S. carriers are subject to domestic and foreign laws regarding privacy of passenger and employee data that are not consistent in all countries in which we operate. In addition to the heightened level of concern regarding privacy of passenger data in the United States, certain European government agencies are initiating inquiries into airline privacy practices. Compliance with these regulatory regimes is expected to result in additional operating costs and could impact our operations and any future expansion. In addition, a security breach in which passenger or employee data is exposed could result in disruption to our operations, damage to our reputation and significant costs.
16
Our insurance costs have increased substantially as a result of the September 11, 2001 terrorist attacks, and further increases in insurance costs or reductions in coverage could have a material adverse impact on our business and operating results.
As a result of the terrorist attacks on September 11, 2001, aviation insurers significantly (1) reduced the maximum amount of insurance coverage available to commercial air carriers for liability to persons (other than employees or passengers) for claims resulting from acts of terrorism, war or similar events and (2) increased the premiums for such coverage and for aviation insurance in general.
Since September 24, 2001, the U.S. government has been providing U.S. airlines with war-risk insurance to cover losses, including those resulting from terrorism, to passengers, third parties (ground damage) and the aircraft hull.
The coverage currently extends through
September 30, 2012
,
and we expect the coverage to be further extended.
The withdrawal of government support of airline war-risk insurance would require us to obtain war-risk insurance coverage commercially, if available. Such commercial insurance could have substantially less desirable coverage than that currently provided by the U.S. government, may not be adequate to protect our risk of loss from future acts of terrorism, may result in a material increase to our operating expenses or may not be obtainable at all, resulting in an interruption to our operations.
ITEM 1B. UNRESOLVED STAFF COMMENTS
None.
17
ITEM 2. PROPERTIES
Flight Equipment
During
2011
, we (1) entered into an agreement with Boeing to purchase 100 B-737-900ER aircraft; (2) purchased 12 previously owned MD-90 aircraft and one previously leased B-767-300 aircraft; and (3) leased six MD-90 aircraft and one B-757-200 aircraft.
Our active aircraft fleet, commitments, and options at
December 31, 2011
are summarized in the following table:
|
Current Fleet
(1)
|
|||||||||||||
|
Aircraft Type
|
Owned
|
Capital Lease
|
Operating Lease
|
Total
|
Average Age
|
Commitments
(2)
|
Options
|
||||||
|
B-737-700
|
10
|
—
|
—
|
10
|
2.9
|
—
|
|
—
|
|
||||
|
B-737-800
|
71
|
—
|
—
|
71
|
10.9
|
—
|
|
—
|
|
||||
|
B-737-900ER
|
—
|
—
|
—
|
—
|
—
|
100
|
|
30
|
|
||||
|
B-747-400
|
4
|
8
|
3
|
15
|
18.5
|
—
|
|
—
|
|
||||
|
B-757-200
|
84
|
37
|
33
|
154
|
18.7
|
—
|
|
—
|
|
||||
|
B-757-300
|
16
|
—
|
—
|
16
|
8.8
|
—
|
|
—
|
|
||||
|
B-767-300
|
10
|
2
|
4
|
16
|
20.9
|
—
|
|
—
|
|
||||
|
B-767-300ER
|
50
|
4
|
4
|
58
|
15.8
|
—
|
|
4
|
|
||||
|
B-767-400ER
|
21
|
—
|
—
|
21
|
10.8
|
—
|
|
8
|
|
||||
|
B-777-200ER
|
8
|
—
|
—
|
8
|
11.9
|
—
|
|
—
|
|
||||
|
B-777-200LR
|
10
|
—
|
—
|
10
|
2.7
|
—
|
|
14
|
|
||||
|
B-787-8
|
—
|
—
|
—
|
—
|
—
|
18
|
|
—
|
|
||||
|
A319-100
|
55
|
—
|
2
|
57
|
9.9
|
—
|
|
—
|
|
||||
|
A320-200
|
41
|
—
|
28
|
69
|
16.8
|
—
|
|
—
|
|
||||
|
A330-200
|
11
|
—
|
—
|
11
|
6.8
|
—
|
|
—
|
|
||||
|
A330-300
|
21
|
—
|
—
|
21
|
6.4
|
—
|
|
—
|
|
||||
|
MD-88
|
67
|
50
|
—
|
117
|
21.5
|
—
|
|
—
|
|
||||
|
MD-90
|
28
|
1
|
—
|
29
|
15.1
|
9
|
|
7
|
|
||||
|
DC9-50
|
24
|
—
|
—
|
24
|
33.8
|
—
|
|
—
|
|
||||
|
CRJ-100
|
15
|
9
|
16
|
40
|
13.9
|
—
|
|
—
|
|
||||
|
CRJ-700
|
15
|
—
|
—
|
15
|
8.1
|
—
|
|
—
|
|
||||
|
CRJ-900
|
13
|
—
|
—
|
13
|
4.1
|
—
|
|
—
|
|
||||
|
Embraer 175
|
—
|
—
|
—
|
—
|
—
|
—
|
|
36
|
|
||||
|
Total
|
574
|
|
111
|
|
90
|
|
775
|
|
15.6
|
127
|
|
99
|
|
|
(1)
|
Excludes certain aircraft we own or lease which are operated by third party contract carriers on our behalf shown in the table below.
|
|
(2)
|
Excludes our orders for
five
A319-100 aircraft and
two
A320-200 aircraft because we have the right to cancel these orders.
|
The following table summarizes the active aircraft fleet operated by third party contract carriers on our behalf at
December 31, 2011
:
|
Fleet Type
|
||||||||||||||
|
Carrier
|
CRJ-200
|
CRJ-700
|
CRJ-900
|
ERJ-145
|
Embraer 170
|
Embraer 175
|
Total
|
|||||||
|
ExpressJet Airlines, Inc.
(1)
|
99
|
|
46
|
|
10
|
|
—
|
|
—
|
|
—
|
|
155
|
|
|
Pinnacle
|
122
|
|
—
|
|
16
|
|
—
|
|
—
|
|
—
|
|
138
|
|
|
SkyWest Airlines, Inc.
|
60
|
|
21
|
|
21
|
|
—
|
|
—
|
|
—
|
|
102
|
|
|
Chautauqua Airlines, Inc.
|
—
|
|
—
|
|
—
|
|
24
|
|
—
|
|
—
|
|
24
|
|
|
Compass
|
—
|
|
—
|
|
—
|
|
—
|
|
5
|
|
36
|
|
41
|
|
|
Mesaba
|
19
|
|
—
|
|
41
|
|
—
|
|
—
|
|
—
|
|
60
|
|
|
Shuttle America Corporation
|
—
|
|
—
|
|
—
|
|
—
|
|
14
|
|
16
|
|
30
|
|
|
Total
|
300
|
|
67
|
|
88
|
|
24
|
|
19
|
|
52
|
|
550
|
|
|
(1)
|
Formerly, Atlantic Southeast Airlines, Inc.
|
18
Aircraft on Option
Our options to purchase additional aircraft at
December 31, 2011
are detailed in the following table:
|
Aircraft on Option
|
2012
|
2013
|
2014
|
After
2014
|
Total
|
|
B-737-900ER
|
—
|
—
|
6
|
24
|
30
|
|
B-767-300ER
|
—
|
—
|
1
|
3
|
4
|
|
B-767-400ER
|
—
|
1
|
2
|
5
|
8
|
|
B-777-200LR
|
—
|
2
|
4
|
8
|
14
|
|
MD-90
|
5
|
2
|
—
|
—
|
7
|
|
Embraer 175
|
—
|
4
|
18
|
14
|
36
|
|
Total
|
5
|
9
|
31
|
54
|
99
|
Ground Facilities
We lease most of the land and buildings that we occupy. Our largest aircraft maintenance base, various computer, cargo, flight kitchen and training facilities and most of our principal offices are located at or near the Atlanta airport, on land leased from the City of Atlanta generally under long-term leases. We own our Atlanta reservations center, other real property in Atlanta and the former Northwest headquarters building and flight training buildings, which are located near the Minneapolis-St. Paul International Airport. Other owned facilities include reservations centers in Minot, North Dakota and Chisholm, Minnesota, and a data processing center in Eagan, Minnesota. We also own property in Tokyo, including a 1.3-acre site in downtown Tokyo and a 33-acre land parcel, 512-room hotel and flight kitchen located near Tokyo's Narita International Airport.
We lease ticket counter and other terminal space, operating areas and air cargo facilities in most of the airports that we serve. At most airports, we have entered into use agreements which provide for the non-exclusive use of runways, taxiways, and other improvements and facilities; landing fees under these agreements normally are based on the number of landings and weight of aircraft. These leases and use agreements generally run for periods of less than one year to 30 years or more, and often contain provisions for periodic adjustments of lease rates, landing fees and other charges applicable under that type of agreement. We also lease aircraft maintenance facilities and air cargo facilities at certain airports, including, among others: (1) our main Atlanta maintenance base; (2) our Atlanta air cargo facilities; and (3) our hangar and air cargo facilities at the Cincinnati/Northern Kentucky International Airport, Salt Lake City International Airport, Detroit Metropolitan International Airport, Minneapolis-St. Paul International Airport and Seattle-Tacoma International Airport. Our aircraft maintenance facility leases generally require us to pay the cost of providing, operating and maintaining such facilities, including, in some cases, amounts necessary to pay debt service on special facility bonds issued to finance their construction. We also lease marketing, ticketing and reservations offices in certain locations for varying terms.
In recent years, some airports have increased or sought to increase the rates charged to airlines to levels that we believe are unreasonable. The extent to which such charges are limited by statute or regulation and the ability of airlines to contest such charges has been subject to litigation and to administrative proceedings before the DOT. If the limitations on such charges are relaxed, or the ability of airlines to challenge such proposed rate increases is restricted, the rates charged by airports to airlines may increase substantially.
The City of Atlanta is currently implementing portions of a 10 year capital improvement program (the “CIP”) at the Atlanta airport. The CIP includes, among other things, a 9,000 foot full-service runway that opened in May 2006, related airfield improvements, a new international terminal and gate capacity that is scheduled to open in May 2012, new cargo and other support facilities and roadway and other infrastructure improvements. The CIP will not be complete until at least 2014, with individual projects scheduled to be constructed at different times. A combination of federal grants, passenger facility charge revenues, increased user rentals and fees, and other airport funds are expected to be used to pay CIP costs directly and through the payment of debt service on bonds.
19
During the December 2010 quarter, we began a redevelopment project at JFK, where we currently operate primarily at Terminal 2 for domestic flights and Terminal 3 for international flights under leases with the Port Authority of New York and New Jersey (“Port Authority”). We estimate this project will cost approximately $1.2 billion and will be completed in stages over five years. We also conduct some flights from Terminal 4, which is operated by JFK International Air Terminal, LLC, a private party, under a lease with the Port Authority. Our JFK redevelopment project currently includes the (1) enhancement and expansion of Terminal 4, including the construction of nine new gates; (2) construction of a passenger connector between Terminal 2 and Terminal 4; (3) demolition of the outdated Terminal 3 facilities; and (4) development of the Terminal 3 site for aircraft parking positions. Upon completion of the Terminal 4 expansion, expected to occur in 2013, we will relocate our operations from Terminal 3 to Terminal 4, proceed with demolition activities in Terminal 3 and thereafter conduct coordinated flight operations from Terminals 2 and 4. For information about special project bonds issued to fund a substantial majority of the project and our 30 year sublease of space in Terminal 4 from the operator of Terminal 4, see Note 4 of the Notes to the Consolidated Financial Statements.
In December 2011, we executed agreements with US Airways and the Port Authority, allowing us to expand our flight operations into Terminal C at New York's LaGuardia Airport. This project allows us to accommodate additional flights into LaGuardia. As part of the expansion, we are also investing $100 million to create an expanded main terminal at LaGuardia in Terminals C and D and will build a bridge to link the two terminals.
20
ITEM 3. LEGAL PROCEEDINGS
First Bag Fee Antitrust Litigation
In May, June and July, 2009, a number of purported class action antitrust lawsuits were filed in the U.S. District Courts for the Northern District of Georgia, the Middle District of Florida, and the District of Nevada, against Delta and AirTran Airways (“AirTran”). In these cases, the plaintiffs originally alleged that Delta and AirTran engaged in collusive behavior in violation of Section 1 of the Sherman Act in November 2008 based upon certain public statements made in October 2008 by AirTran's CEO at an analyst conference concerning fees for the first checked bag, Delta's imposition of a fee for the first checked bag on November 4, 2008 and AirTran's imposition of a similar fee on November 12, 2008. The plaintiffs sought to assert claims on behalf of an alleged class consisting of passengers who paid the first bag fee after December 5, 2008 and seek injunctive relief and unspecified treble damages. All of these cases have been consolidated for pre-trial proceedings in the Northern District of Georgia by the Multi-District Litigation (“MDL”) Panel.
In February 2010, the plaintiffs in the MDL proceeding filed a consolidated amended class action complaint which substantially expanded the scope of the original complaint. In the consolidated amended complaint, plaintiffs add new allegations concerning alleged signaling by both Delta and AirTran based upon statements made to the investment community by both carriers relating to industry capacity levels during 2008-2009. Plaintiffs also add a new cause of action against Delta alleging attempted monopolization in violation of Section 2 of the Sherman Act, paralleling a claim previously asserted against AirTran but not Delta.
In August 2010, the District Court issued an order granting Delta's motion to dismiss the Section 2 claim, but denying its motion to dismiss the Section 1 claim. Plaintiffs have filed a motion to certify the Section 1 class, which remains pending. Delta believes the claims in these cases are without merit and is vigorously defending these lawsuits.
EU Regulation 261 Class Action Litigation
In February 2011, a putative class action was filed in the U.S. District Court for the Northern District of Illinois seeking to represent all US residents who were passengers on flights during the period from Feb 2009 to the present who are allegedly entitled to compensation under EU Regulation 261 because their flight was cancelled or delayed by more than 3 hours. Plaintiffs allege that Delta has incorporated a duty to pay this compensation into its contract of carriage, and assert a claim for breach of contract as the basis for their cause of action. The complaint seeks recovery of the EU Regulation 261 compensation of €600 for each US resident on a flight qualifying for such compensation. Delta disputes the allegations in the Complaint, has filed a motion to dismiss all claims, and intends to vigorously defend the matter.
Canadian Passenger Surcharge Antitrust Litigation
On July 31, 2009, two parallel putative class actions were filed against a number of Canadian, Asian, European, and U.S. carriers (including Delta) in the Ontario Superior Court of Justice. Both allege that the defendants colluded to fix the price of passenger surcharges, in Canada-Asia and Canada-Europe markets respectively. There are no allegations in the complaints of any specific act by Delta in furtherance of either conspiracy. The complaints seek damages in excess of $100 million. We believe the allegations against Delta are without merit and intend to vigorously defend these cases.
***
For a discussion of certain environmental matters, see “Business-Environmental Matters” in Item 1.
ITEM 4. MINE SAFETY DISCLOSURES
Not applicable.
21
Part II
ITEM 5. MARKET FOR REGISTRANT'S COMMON EQUITY, RELATED STOCKHOLDER MATTERS AND
ISSUER PURCHASES OF EQUITY SECURITIES
Market Information
Our common stock is listed on the New York Stock Exchange. The following table sets forth for the periods indicated the highest and lowest sales price for our common stock as reported on the NYSE.
|
Common Stock
|
||||||
|
High
|
Low
|
|||||
|
Fiscal 2011
|
||||||
|
First Quarter
|
$
|
13.21
|
|
$
|
9.71
|
|
|
Second Quarter
|
$
|
11.60
|
|
$
|
8.91
|
|
|
Third Quarter
|
$
|
9.41
|
|
$
|
6.41
|
|
|
Fourth Quarter
|
$
|
9.13
|
|
$
|
6.64
|
|
|
Fiscal 2010
|
||||||
|
First Quarter
|
$
|
14.90
|
|
$
|
10.93
|
|
|
Second Quarter
|
$
|
14.94
|
|
$
|
10.90
|
|
|
Third Quarter
|
$
|
12.80
|
|
$
|
9.60
|
|
|
Fourth Quarter
|
$
|
14.54
|
|
$
|
10.96
|
|
Holders
As of January 31, 2012, there were approximately 3,750 holders of record of our common stock.
Dividends
We expect to retain any future earnings to fund our operations and meet our cash and liquidity needs. In addition, our ability to pay dividends or repurchase common stock is restricted under several of our credit facilities. Therefore, we do not anticipate paying any dividends on our common stock or repurchasing common stock for the foreseeable future.
22
Stock Performance Graph
The following graph compares the cumulative total returns during the period from April 30, 2007 to December 31, 2011 of our common stock to the Standard & Poor's 500 Stock Index and the Amex Airline Index. The comparison assumes $100 was invested on April 30, 2007 in each of our common stock and the indices and assumes that all dividends were reinvested. Data for periods prior to April 30, 2007 is not shown because of the period we were in bankruptcy and the lack of comparability of financial results before and after April 30, 2007.
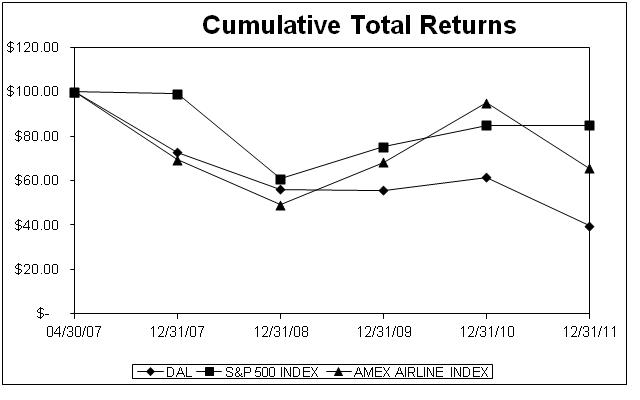
The Amex Airline Index (ticker symbol XAL) consists of Alaska Air Group, Inc., AMR Corporation, Copa Holdings SA, Delta, GOL Linhas Areas Inteligentes S.A., Hawaiian Holdings, Inc., JetBlue Airways Corporation, LAN Airlines SA, Ryanair Holdings plc, SkyWest, Inc., Southwest Airlines Company, TAM S.A., United Continental Holdings, Inc. and US Airways Group, Inc.
Issuer Purchases of Equity Securities
We withheld the following shares of common stock to satisfy tax withholding obligations during the December
2011
quarter from the distributions described below. These shares may be deemed to be “issuer purchases” of shares that are required to be disclosed pursuant to this Item.
|
Period
|
Total Number of Shares Purchased
(1)
|
Average Price Paid Per Share
|
Total Number of Shares Purchased as Part of Publicly Announced Plans or Programs
(1)
|
Maximum Number of Shares (or Approximate Dollar Value) of Shares That May Yet Be Purchased Under the Plan or Programs
|
||
|
October 1-31, 2011
|
24,048
|
|
$7.74
|
24,048
|
|
(1)
|
|
November 1-30, 2011
|
1,922,778
|
|
$8.33
|
1,922,778
|
|
(1)
|
|
December 1-31, 2011
|
15,442
|
|
$8.31
|
15,442
|
|
(1)
|
|
Total
|
1,962,268
|
|
1,962,268
|
|
||
|
(1)
|
Shares were withheld from employees to satisfy certain tax obligations due in connection with grants of stock under the Delta Air Lines, Inc. 2007 Performance Compensation Plan (the "2007 Plan"). The 2007 Plan provides for the withholding of shares to satisfy tax obligations. It does not specify a maximum number of shares that can be withheld for this purpose. See Note 12 of the Notes to the Consolidated Financial Statements elsewhere in this Form 10-K for more information about the 2007 Plan.
|
23
ITEM 6. SELECTED FINANCIAL DATA
On October 29, 2008, a wholly-owned subsidiary of ours merged with and into Northwest. Our Consolidated Financial Statements include the results of operations of Northwest and its wholly-owned subsidiaries for periods after October 29, 2008.
On September 15, 2005, we and substantially all of our subsidiaries (the “Delta Debtors”) filed voluntary petitions for reorganization under Chapter 11 of the U.S. Bankruptcy Code. On April 30, 2007 (the “Effective Date”), the Delta Debtors emerged from bankruptcy. Upon emergence from Chapter 11, we adopted fresh start reporting which resulted in our becoming a new entity for financial reporting purposes. Accordingly, consolidated financial data on or after May 1, 2007 is not comparable to the consolidated financial data prior to that date.
References in the tables below to “Successor” refer to Delta on or after May 1, 2007, after giving effect to (1) the cancellation of Delta common stock issued prior to the Effective Date, (2) the issuance of new Delta common stock and certain debt securities in accordance with the Delta Debtors' Joint Plan of Reorganization and (3) the application of fresh start reporting. References to “Predecessor” refer to Delta prior to May 1, 2007.
The following tables are derived from our audited consolidated financial statements, and present selected financial and operating data for the (1) years ended
December 31, 2011
,
2010
,
2009
and
2008
of the Successor, (2) eight months ended
December 31, 2007
of the Successor and (3) four months ended April 30, 2007 of the Predecessor.
Consolidated Summary of Operations
|
Successor
|
Predecessor
|
||||||||||||||||||
|
Year Ended December 31,
|
Eight Months Ended December 31, 2007
|
Four Months Ended
April 30, 2007
|
|||||||||||||||||
|
(in millions, except share data)
|
2011
|
2010
|
2009
|
2008
|
|||||||||||||||
|
Operating revenue
|
$
|
35,115
|
|
$
|
31,755
|
|
$
|
28,063
|
|
$
|
22,697
|
|
$
|
13,358
|
|
$
|
5,796
|
|
|
|
Operating expense
|
33,140
|
|
29,538
|
|
28,387
|
|
31,011
|
|
12,562
|
|
5,496
|
|
|||||||
|
Operating income (loss)
|
1,975
|
|
2,217
|
|
(324
|
)
|
(8,314
|
)
|
796
|
|
300
|
|
|||||||
|
Other expense, net
|
(1,206
|
)
|
(1,609
|
)
|
(1,257
|
)
|
(727
|
)
|
(271
|
)
|
(221
|
)
|
|||||||
|
Income (loss) before reorganization items, net
|
769
|
|
608
|
|
(1,581
|
)
|
(9,041
|
)
|
525
|
|
79
|
|
|||||||
|
Reorganization items, net
|
—
|
|
—
|
|
—
|
|
—
|
|
—
|
|
1,215
|
|
|||||||
|
Income (loss) before income taxes
|
769
|
|
608
|
|
(1,581
|
)
|
(9,041
|
)
|
525
|
|
1,294
|
|
|||||||
|
Income tax benefit (provision)
|
85
|
|
(15
|
)
|
344
|
|
119
|
|
(211
|
)
|
4
|
|
|||||||
|
Net income (loss)
|
$
|
854
|
|
$
|
593
|
|
$
|
(1,237
|
)
|
$
|
(8,922
|
)
|
$
|
314
|
|
$
|
1,298
|
|
|
|
Basic earnings (loss) per share
|
$
|
1.02
|
|
$
|
0.71
|
|
$
|
(1.50
|
)
|
$
|
(19.08
|
)
|
$
|
0.80
|
|
$
|
6.58
|
|
|
|
Diluted earnings (loss) per share
|
$
|
1.01
|
|
$
|
0.70
|
|
$
|
(1.50
|
)
|
$
|
(19.08
|
)
|
$
|
0.79
|
|
$
|
4.63
|
|
|
The following are included in the results above:
|
Successor
|
Predecessor
|
||||||||||||||||||
|
Year Ended December 31,
|
Eight Months Ended December 31, 2007
|
Four Months Ended
April 30, 2007
|
|||||||||||||||||
|
(in millions)
|
2011
|
2010
|
2009
|
2008
|
|||||||||||||||
|
Severance, impairment charges and other
|
$
|
242
|
|
$
|
217
|
|
$
|
132
|
|
$
|
153
|
|
$
|
—
|
|
$
|
—
|
|
|
|
Merger-related items
|
—
|
|
233
|
|
275
|
|
978
|
|
—
|
|
—
|
|
|||||||
|
Loss on extinguishment of debt
|
68
|
|
391
|
|
83
|
|
—
|
|
—
|
|
—
|
|
|||||||
|
Impairment of goodwill and other intangible assets
|
—
|
|
—
|
|
—
|
|
7,296
|
|
—
|
|
—
|
|
|||||||
|
Intraperiod income tax allocation
|
—
|
|
—
|
|
(321
|
)
|
—
|
|
—
|
|
—
|
|
|||||||
|
Income tax benefit associated with intangible assets
|
—
|
|
—
|
|
—
|
|
(119
|
)
|
—
|
|
—
|
|
|||||||
|
Reorganization items, net
|
—
|
|
—
|
|
—
|
|
—
|
|
—
|
|
1,215
|
|
|||||||
|
Total
|
$
|
310
|
|
$
|
841
|
|
$
|
169
|
|
$
|
8,308
|
|
$
|
—
|
|
$
|
1,215
|
|
|
24
Other Financial and Statistical Data
(Unaudited)
|
Successor
|
Predecessor
|
||||||||||||||||||
|
Year Ended December 31,
|
Eight Months Ended December 31, 2007
|
Four Months Ended April 30, 2007
|
|||||||||||||||||
|
Consolidated
(1)
|
2011
|
2010
|
2009
|
2008
|
|||||||||||||||
|
Revenue passenger miles (millions)
|
192,767
|
|
193,169
|
|
188,943
|
|
134,879
|
|
85,029
|
|
37,036
|
|
|||||||
|
Available seat miles (millions)
|
234,656
|
|
232,684
|
|
230,331
|
|
165,639
|
|
104,427
|
|
47,337
|
|
|||||||
|
Passenger mile yield
|
|
15.70
|
¢
|
|
14.11
|
¢
|
|
12.60
|
¢
|
|
14.52
|
¢
|
|
13.88
|
¢
|
|
13.84
|
¢
|
|
|
Passenger revenue per available seat mile
|
|
12.89
|
¢
|
|
11.71
|
¢
|
|
10.34
|
¢
|
|
11.82
|
¢
|
|
11.30
|
¢
|
|
10.83
|
¢
|
|
|
Operating cost per available seat mile
|
|
14.12
|
¢
|
|
12.69
|
¢
|
|
12.32
|
¢
|
|
18.72
|
¢
|
|
12.03
|
¢
|
|
11.61
|
¢
|
|
|
Passenger load factor
|
82.1
|
%
|
83.0
|
%
|
82.0
|
%
|
81.4
|
%
|
81.4
|
%
|
78.2
|
%
|
|||||||
|
Fuel gallons consumed (millions)
|
3,856
|
|
3,823
|
|
3,853
|
|
2,740
|
|
1,742
|
|
792
|
|
|||||||
|
Average price per fuel gallon
(2)
|
$
|
3.06
|
|
$
|
2.33
|
|
$
|
2.15
|
|
$
|
3.16
|
|
$
|
2.38
|
|
$
|
1.93
|
|
|
|
Average price per fuel gallon, adjusted
(3)
|
$
|
3.05
|
|
$
|
2.33
|
|
$
|
2.15
|
|
$
|
3.13
|
|
$
|
2.38
|
|
$
|
1.93
|
|
|
|
Full-time equivalent employees, end of period
|
78,392
|
|
79,684
|
|
81,106
|
|
84,306
|
|
55,044
|
|
52,704
|
|
|||||||
|
(1)
|
Includes the operations of our contract carriers under capacity purchase agreements, except full-time equivalent employees which excludes employees of contract carriers we do not own.
|
|
(2)
|
Includes the impact of fuel hedge activity.
|
|
(3)
|
Adjusted for mark-to-market adjustments for fuel hedges recorded in periods other than the settlement period (a non-GAAP financial measure as defined in "Supplemental Information").
|
|
December 31,
|
|||||||||||||||
|
(in millions)
|
2011
|
2010
|
2009
|
2008
|
2007
|
||||||||||
|
Total assets
|
$
|
43,499
|
|
$
|
43,188
|
|
$
|
43,789
|
|
$
|
45,084
|
|
$
|
32,423
|
|
|
Long-term debt and capital leases (including current maturities)
|
$
|
13,791
|
|
$
|
15,252
|
|
$
|
17,198
|
|
$
|
16,571
|
|
$
|
9,000
|
|
|
Stockholders' (deficit) equity
|
$
|
(1,396
|
)
|
$
|
897
|
|
$
|
245
|
|
$
|
874
|
|
$
|
10,113
|
|
|
Common stock outstanding
|
845
|
|
835
|
|
784
|
|
695
|
|
292
|
|
|||||
25
ITEM 7. MANAGEMENT'S DISCUSSION AND ANALYSIS OF FINANCIAL CONDITION AND RESULTS
OF OPERATIONS
Financial Highlights - 2011 Compared to 2010
Our net income for
2011
was
$854 million
, or
$1.01
per diluted share. This is $261 million higher than
2010
despite significantly higher fuel costs. Total operating revenue increased
$3.4 billion
, on an
11%
increase in passenger mile yield, primarily due to higher passenger revenues as we were able to adjust ticket prices in response to higher fuel prices. Total operating expense was up
$3.6 billion
, or
12%
, driven primarily by a
$2.9 billion
increase in fuel expense (including our contract carriers under capacity purchase agreements).
Fuel price volatility continues to represent a significant risk to our business and the airline industry as a whole. Our fuel cost per gallon increased
31%
from
2010
to
2011
. During
2011
, fuel expense, including amounts under contract carrier agreements, increased by
$2.9 billion
and now represents
36%
of total operating expense. During
2011
, gains from our hedging program reduced fuel expense by
$420 million
. Including fuel hedge activity, our average price per fuel gallon in
2011
was
$3.06
as compared to
$2.33
in
2010
.
Our consolidated operating cost per available seat mile ("CASM") for
2011
increased to
14.12
cents compared to
12.69
cents in
2010
, primarily reflecting higher fuel prices. For
2011
, CASM-Ex (a non-GAAP financial measure as defined in "Supplemental Information" below) was
8.53
cents, or 3% higher than
2010
, primarily reflecting higher revenue-related expenses and salaries and related costs.
During
2011
, we reduced our total debt and capital leases by
$1.5 billion
and ended the year with
$5.4 billion
in unrestricted liquidity, consisting of cash and cash equivalents, short-term investments and availability under credit facilities.
Fleet Strategy
During 2011, we entered into an agreement with The Boeing Company ("Boeing") to purchase 100 B-737-900ER aircraft with deliveries beginning in 2013 and continuing through 2018. We have obtained committed long-term financing for a substantial portion of the purchase price of these aircraft. The Boeing agreement and our plans to bring into service 30 to 40 previously owned MD-90 aircraft over the next two to three years will enable us to replace on a capacity-neutral basis older, less efficient aircraft scheduled to be retired. The majority of the MD-90 aircraft scheduled to come into service over the next two to three years were purchased or leased in 2010 and 2011. These B-737-900ER and MD-90 aircraft will have lower unit costs than the aircraft they are replacing as a result of lower maintenance costs and fuel efficiencies.
In addition to lowering unit costs, we are also investing in our fleet to enhance the customer experience. The state-of-the-art B-737-900ER will offer an industry leading customer experience, including expanded carry-on baggage space and a roomier cabin. By the end of 2013, our entire widebody international fleet will be updated with full flat-bed seats in BusinessElite. We completed the installation of full flat-bed seats in the BusinessElite cabin of our B-777 and B-767-400ER aircraft during 2011. Due to the success of our Economy Comfort product, which we began offering during the 2011 summer on long-haul international flights, we are expanding Economy Comfort throughout our mainline and regional fleet by the summer of 2012. We have also been investing in our domestic and regional fleet, with in-flight WiFi on all two-class domestic aircraft, interior upgrades and the installation of additional First Class seating.
New York Strategy
Strengthening our position in New York City is an important part of our network strategy. As discussed below, key components of this strategy are operating a domestic hub at New York's LaGuardia Airport ("LaGuardia") and creating a state-of-the-art facility at New York's John F. Kennedy International Airport ("JFK").
LaGuardia.
During December 2011, we closed the transactions contemplated under an agreement with US Airways including the exchange of takeoff and landing rights (each a "slot pair") at LaGuardia and Reagan National airports, which will allow us to operate a new domestic hub at LaGuardia. Under the agreement, (1) Delta acquired 132 slot pairs at LaGuardia from US Airways and (2) US Airways acquired from Delta 42 slot pairs at Reagan National; the rights to operate additional daily service to São Paulo, Brazil in 2015; and $66.5 million in cash. Additionally, Delta divested 16 slot pairs at LaGuardia and eight slot pairs at Reagan National to airlines with limited or no service at those airports.
26
Following the closing of the transaction, we announced the expansion of our service at LaGuardia in 2012 to include more than 100 new flights and 29 new destinations. Our expanded schedule will add nonstop service to top U.S. business markets and additional frequencies to business markets currently served. As part of the expansion, we are also investing $100 million to create an expanded main terminal at LaGuardia in Terminals C and D and will build a bridge to link the two terminals.
JFK.
While our expanded LaGuardia schedule is focused on providing industry-leading domestic service, our schedule at JFK is being optimized in 2012 for international and trans-continental flights, as well as improved coordination with our SkyTeam alliance partners. At JFK, we currently operate domestic flights primarily at Terminal 2 and international flights at Terminal 3 and, to a lesser extent, Terminal 4. Our redevelopment project at JFK, which began in 2010, currently includes the (1) enhancement and expansion of Terminal 4, including the construction of nine new international gates; (2) construction of a passenger connector between Terminal 2 and Terminal 4; (3) demolition of the outdated Terminal 3, which was constructed in 1960; and (4) development of the Terminal 3 site for aircraft parking positions. We estimate this project will cost approximately $1.2 billion and will be completed in stages over five years. Construction at Terminal 4 has commenced and is scheduled to be completed in 2013. Upon completion of the Terminal 4 expansion, we will relocate our operations from Terminal 3 to Terminal 4, proceed with the demolition of Terminal 3, and thereafter conduct coordinated flight operations from Terminals 2 and 4. Once our project is complete, we expect that passengers will benefit from an enhanced customer experience and improved operational performance, including reduced taxi times and better on-time performance.
27
Results of Operations -
2011
Compared to
2010
Operating Revenue
|
Year Ended December 31,
|
Increase
(Decrease)
|
% Increase
(Decrease)
|
|||||||||
|
(in millions)
|
2011
|
2010
|
|||||||||
|
Passenger:
|
|||||||||||
|
Mainline
|
$
|
23,864
|
|
$
|
21,408
|
|
$
|
2,456
|
|
11
|
%
|
|
Regional carriers
|
6,393
|
|
5,850
|
|
543
|
|
9
|
%
|
|||
|
Total passenger revenue
|
30,257
|
|
27,258
|
|
2,999
|
|
11
|
%
|
|||
|
Cargo
|
1,027
|
|
850
|
|
177
|
|
21
|
%
|
|||
|
Other
|
3,831
|
|
3,647
|
|
184
|
|
5
|
%
|
|||
|
Total operating revenue
|
$
|
35,115
|
|
$
|
31,755
|
|
$
|
3,360
|
|
11
|
%
|
|
Increase (Decrease)
vs. Year Ended December 31, 2010
|
||||||||||||||||
|
(in millions)
|
Year Ended December 31, 2011
|
Passenger Revenue
|
RPMs
(Traffic)
|
ASMs (Capacity)
|
Passenger Mile Yield
|
PRASM
|
Load Factor
|
|||||||||
|
Domestic
|
$
|
13,129
|
|
11
|
%
|
—
|
%
|
(1
|
)%
|
11
|
%
|
11
|
%
|
0.4
|
|
pts
|
|
Atlantic
|
5,590
|
|
9
|
%
|
(1
|
)%
|
2
|
%
|
10
|
%
|
7
|
%
|
(2.1
|
)
|
pts
|
|
|
Pacific
|
3,368
|
|
20
|
%
|
4
|
%
|
10
|
%
|
15
|
%
|
9
|
%
|
(4.7
|
)
|
pts
|
|
|
Latin America
|
1,777
|
|
13
|
%
|
—
|
%
|
—
|
%
|
13
|
%
|
13
|
%
|
(0.6
|
)
|
pts
|
|
|
Total mainline
|
23,864
|
|
11
|
%
|
—
|
%
|
1
|
%
|
11
|
%
|
10
|
%
|
(1.0
|
)
|
pts
|
|
|
Regional carriers
|
6,393
|
|
9
|
%
|
(2
|
)%
|
(2
|
)%
|
12
|
%
|
12
|
%
|
0.1
|
|
pts
|
|
|
Total passenger revenue
|
$
|
30,257
|
|
11
|
%
|
—
|
%
|
1
|
%
|
11
|
%
|
10
|
%
|
(0.9
|
)
|
pts
|
Mainline Passenger Revenue.
Mainline passenger revenue increased primarily due to an improvement in the passenger mile yield from fare increases implemented in response to higher fuel prices and from higher revenue under corporate travel contracts.
|
•
|
Domestic
. Domestic mainline passenger revenue increased
11%
due to an
11%
improvement in PRASM on a
1%
decline in capacity. The improvement in PRASM reflects higher passenger mile yield driven by fare increases.
|
|
•
|
International
. International mainline passenger revenue increased
13%
due to a
9%
improvement in PRASM on a
4%
capacity increase. Passenger mile yield increased
12%
, reflecting increased business and leisure travel and increased fares, including fuel surcharges. Atlantic passenger revenue increased
9%
due to a
7%
increase in PRASM. We and the industry faced overcapacity in the Atlantic, particularly in early 2011, which prevented us from increasing ticket prices sufficiently to cover higher fuel prices. Pacific passenger revenue increased
20%
on a
10%
capacity increase. Pacific passenger mile yield increased
15%
due to a stronger revenue environment, partially offset by the negative impact from the March 2011 earthquake and tsunami in Japan. Latin America passenger revenue increased
13%
, benefiting from a
13%
higher passenger mile yield driven by fare increases.
|
Regional carriers
. Passenger revenue from regional carriers increased
9%
due to an
12%
improvement in PRASM on a
2%
decline in capacity. Passenger mile yield increased
12%
, reflecting fare increases we implemented in response to increased fuel prices.
Cargo
. Cargo revenue increased
21%
due to a 12% improvement in yield and an 8% increase in volume.
Other.
Other revenue increased $210 million due to higher maintenance sales to third parties by our MRO services business and $65 million due to an increase in the volume of ticket change fees. These increases were partially offset by $90 million in lower baggage fee revenue, resulting from an increase in bag fees waived for premium customers and customers under our co-brand credit card agreement with American Express.
28
Operating Expense
|
Year Ended December 31,
|
Increase
(Decrease)
|
% Increase
(Decrease)
|
|||||||||
|
(in millions)
|
2011
|
2010
|
|||||||||
|
Aircraft fuel and related taxes
|
$
|
9,730
|
|
$
|
7,594
|
|
$
|
2,136
|
|
28
|
%
|
|
Salaries and related costs
|
6,894
|
|
6,751
|
|
143
|
|
2
|
%
|
|||
|
Contract carrier arrangements
|
5,470
|
|
4,305
|
|
1,165
|
|
27
|
%
|
|||
|
Aircraft maintenance materials and outside repairs
|
1,765
|
|
1,569
|
|
196
|
|
12
|
%
|
|||
|
Passenger commissions and other selling expenses
|
1,682
|
|
1,509
|
|
173
|
|
11
|
%
|
|||
|
Contracted services
|
1,642
|
|
1,549
|
|
93
|
|
6
|
%
|
|||
|
Depreciation and amortization
|
1,523
|
|
1,511
|
|
12
|
|
1
|
%
|
|||
|
Landing fees and other rents
|
1,281
|
|
1,281
|
|
—
|
|
—
|
%
|
|||
|
Passenger service
|
721
|
|
673
|
|
48
|
|
7
|
%
|
|||
|
Aircraft rent
|
298
|
|
387
|
|
(89
|
)
|
(23
|
)%
|
|||
|
Profit sharing
|
264
|
|
313
|
|
(49
|
)
|
(16
|
)%
|
|||
|
Restructuring and other items
|
242
|
|
450
|
|
(208
|
)
|
(46
|
)%
|
|||
|
Other
|
1,628
|
|
1,646
|
|
(18
|
)
|
(1
|
)%
|
|||
|
Total operating expense
|
$
|
33,140
|
|
$
|
29,538
|
|
$
|
3,602
|
|
12
|
%
|
On July 1, 2010, we sold Compass and Mesaba, our wholly-owned subsidiaries, to Trans States and Pinnacle, respectively.
Upon the closing of these transactions, we entered into new or amended long-term capacity purchase agreements with Compass, Mesaba and Pinnacle. Prior to these sales, expenses related to Compass and Mesaba as our wholly-owned subsidiaries were reported in the applicable expense line items. Subsequent to these sales, expenses related to Compass and Mesaba are reported as contract carrier arrangements expense.
Fuel Expense.
Including contract carriers under capacity purchase agreements, fuel expense increased
$2.9 billion
on flat consumption. The table below presents fuel expense, gallons consumed, and our average price per fuel gallon, including the impact of fuel hedge activity:
|
Year Ended December 31,
|
Increase
(Decrease)
|
% Increase
(Decrease)
|
|||||||||
|
(in millions, except per gallon data)
|
2011
|
2010
|
|||||||||
|
Aircraft fuel and related taxes
|
$
|
9,730
|
|
$
|
7,594
|
|
$
|
2,136
|
|
||
|
Aircraft fuel and related taxes included within contract carrier arrangements
|
2,053
|
|
1,307
|
|
746
|
|
|||||
|
Total fuel expense
|
$
|
11,783
|
|
$
|
8,901
|
|
$
|
2,882
|
|
32
|
%
|
|
Total fuel consumption (gallons)
|
3,856
|
|
3,823
|
|
33
|
|
1
|
%
|
|||
|
Average price per fuel gallon
|
$
|
3.06
|
|
$
|
2.33
|
|
$
|
0.73
|
|
31
|
%
|
Fuel expense increased primarily due to higher unhedged fuel prices, partially offset by an improvement in net fuel hedge results. The table below shows the impact of hedging on fuel expense and average price per fuel gallon:
|
Average Price Per Gallon
|
|||||||||||||||||||
|
Year Ended December 31,
|
Increase
(Decrease)
|
Year Ended December 31,
|
Increase
(Decrease)
|
||||||||||||||||
|
(in millions, except per gallon data)
|
2011
|
2010
|
2011
|
2010
|
|||||||||||||||
|
Fuel purchase cost
|
$
|
12,203
|
|
$
|
8,812
|
|
$
|
3,391
|
|
$
|
3.17
|
|
$
|
2.31
|
|
$
|
0.86
|
|
|
|
Fuel hedge (gains) losses
|
(420
|
)
|
89
|
|
(509
|
)
|
(0.11
|
)
|
0.02
|
|
(0.13
|
)
|
|||||||
|
Total fuel expense
|
$
|
11,783
|
|
$
|
8,901
|
|
$
|
2,882
|
|
$
|
3.06
|
|
$
|
2.33
|
|
$
|
0.73
|
|
|
|
Mark-to-market adjustments for fuel hedges recorded in periods other than the settlement period
|
(26
|
)
|
—
|
|
(26
|
)
|
(0.01
|
)
|
—
|
|
(0.01
|
)
|
|||||||
|
Total fuel expense, adjusted
|
$
|
11,757
|
|
$
|
8,901
|
|
$
|
2,856
|
|
$
|
3.05
|
|
$
|
2.33
|
|
$
|
0.72
|
|
|
29
Our average price per fuel gallon, adjusted for mark-to-market adjustments for fuel hedges recorded in periods other than the settlement period (a non-GAAP financial measure as defined in "Supplemental Information" below) was
$3.05
for the year ended December 31, 2011. During 2011, our net fuel hedge gains of
$420 million
included
$26 million
in gains for mark-to-market adjustments recorded in periods other than the settlement period.
These mark-to-market adjustments are based on market prices as of the end of the reporting period. Such market prices are not necessarily indicative of the actual future cash value of the underlying hedge in the contract settlement period. Therefore, Delta adjusts fuel expense for these items to arrive at a more meaningful measure of fuel cost.
Salaries and related costs.
Salaries and related costs increased due to a 3% average increase in headcount and employee pay increases, partially offset by the change in reporting described above due to the transactions involving Compass and Mesaba.
Contract carrier arrangements
. Contract carrier arrangements expense, excluding the impact of fuel expense (discussed above), increased primarily due to the change in reporting for the transactions involving Compass and Mesaba.
Aircraft maintenance materials and outside repairs.
Aircraft maintenance materials and outside repairs expense increased primarily due to costs associated with increased maintenance sales to third parties by our MRO services business, reflected in other revenue above.
Passenger commissions and other selling expenses.
Credit card and sales commissions increased in conjunction with the
11%
increase in passenger revenue.
Aircraft rent.
Aircraft rent decreased primarily due to the restructuring of certain existing leases and the change in reporting described above due to the transactions involving Compass and Mesaba.
Restructuring and other items.
Due to the nature of amounts recorded within restructuring and other items, a year over year comparison is not meaningful. For a discussion of charges recorded in restructuring and other items, see Note 15 to the Notes of the Consolidated Financial Statements.
30
Results of Operations -
2010
Compared to
2009
Operating Revenue
|
Year Ended December 31,
|
Increase
(Decrease)
|
% Increase
(Decrease)
|
|||||||||
|
(in millions)
|
2010
|
2009
|
|||||||||
|
Passenger:
|
|||||||||||
|
Mainline
|
$
|
21,408
|
|
$
|
18,522
|
|
$
|
2,886
|
|
16
|
%
|
|
Regional carriers
|
5,850
|
|
5,285
|
|
565
|
|
11
|
%
|
|||
|
Total passenger revenue
|
27,258
|
|
23,807
|
|
3,451
|
|
14
|
%
|
|||
|
Cargo
|
850
|
|
788
|
|
62
|
|
8
|
%
|
|||
|
Other
|
3,647
|
|
3,468
|
|
179
|
|
5
|
%
|
|||
|
Total operating revenue
|
$
|
31,755
|
|
$
|
28,063
|
|
$
|
3,692
|
|
13
|
%
|
|
Increase (Decrease)
vs. Year Ended December 31, 2009
|
||||||||||||||||
|
(in millions)
|
Year Ended December 31, 2010
|
Passenger Revenue
|
RPMs
(Traffic)
|
ASMs (Capacity)
|
Passenger Mile Yield
|
PRASM
|
Load Factor
|
|||||||||
|
Domestic
|
$
|
11,878
|
|
11
|
%
|
1
|
%
|
2
|
%
|
9
|
%
|
9
|
%
|
(0.3
|
)
|
pts
|
|
Atlantic
|
5,152
|
|
18
|
%
|
—
|
%
|
(3
|
)%
|
18
|
%
|
21
|
%
|
2.3
|
|
pts
|
|
|
Pacific
|
2,806
|
|
38
|
%
|
14
|
%
|
9
|
%
|
21
|
%
|
26
|
%
|
7.3
|
|
pts
|
|
|
Latin America
|
1,572
|
|
13
|
%
|
4
|
%
|
3
|
%
|
8
|
%
|
10
|
%
|
1.0
|
|
pts
|
|
|
Total mainline
|
21,408
|
|
16
|
%
|
3
|
%
|
2
|
%
|
12
|
%
|
14
|
%
|
1.0
|
|
pts
|
|
|
Regional carriers
|
5,850
|
|
11
|
%
|
(1
|
)%
|
(2
|
)%
|
12
|
%
|
13
|
%
|
1.0
|
|
pts
|
|
|
Total passenger revenue
|
$
|
27,258
|
|
14
|
%
|
2
|
%
|
1
|
%
|
12
|
%
|
13
|
%
|
1.0
|
|
pts
|
Mainline Passenger Revenue.
Mainline passenger revenue increased primarily due to increased business demand for air travel and an increase in fares, largely due to the strengthening of the airline industry revenue environment. During 2009, weakened demand for air travel from the global recession and the effects of the H1N1 virus and related capacity reductions had a significant negative impact on our mainline passenger revenue.
|
•
|
Domestic Passenger Revenue
. Domestic passenger revenue increased 11% from a 9% increase in PRASM on a 0.3 point decrease in load factor and a 2% increase in capacity. The passenger mile yield increased 9%, reflecting an increase in business travel and an increase in fares.
|
|
•
|
International Passenger Revenue
. International passenger revenue increased 22% from a 21% increase in PRASM and a 2.4 point increase in load factor on a 1% increase in capacity. The passenger mile yield increased 17%, reflecting an increase in demand for air travel and an increase in fares.
|
Regional carriers
. Passenger revenue of regional carriers increased 11% from a 13% increase in PRASM and a 1.0 point increase in load factor on a 2% decline in capacity. The passenger mile yield increased 12%, reflecting an increase in demand for air travel and an increase in fares.
Cargo
. Cargo revenue increased due to a 13% increase in yield and a 25% increase in volume, primarily in international markets, partially offset by capacity reductions due to the retirement of our dedicated freighter aircraft in 2009.
Other
. Other revenue increased due to higher baggage fee revenue from an increased volume of checked bags.
31
Operating Expense
|
Year Ended December 31,
|
Increase
(Decrease)
|
% Increase
(Decrease)
|
|||||||||
|
(in millions)
|
2010
|
2009
|
|||||||||
|
Aircraft fuel and related taxes
|
$
|
7,594
|
|
$
|
7,384
|
|
$
|
210
|
|
3
|
%
|
|
Salaries and related costs
|
6,751
|
|
6,838
|
|
(87
|
)
|
(1
|
)%
|
|||
|
Contract carrier arrangements
|
4,305
|
|
3,823
|
|
482
|
|
13
|
%
|
|||
|
Aircraft maintenance materials and outside repairs
|
1,569
|
|
1,434
|
|
135
|
|
9
|
%
|
|||
|
Passenger commissions and other selling expenses
|
1,509
|
|
1,405
|
|
104
|
|
7
|
%
|
|||
|
Contracted services
|
1,549
|
|
1,595
|
|
(46
|
)
|
(3
|
)%
|
|||
|
Depreciation and amortization
|
1,511
|
|
1,536
|
|
(25
|
)
|
(2
|
)%
|
|||
|
Landing fees and other rents
|
1,281
|
|
1,289
|
|
(8
|
)
|
(1
|
)%
|
|||
|
Passenger service
|
673
|
|
638
|
|
35
|
|
5
|
%
|
|||
|
Aircraft rent
|
387
|
|
480
|
|
(93
|
)
|
(19
|
)%
|
|||
|
Profit sharing
|
313
|
|
—
|
|
313
|
|
NM
(1)
|
|
|||
|
Restructuring and other items
|
450
|
|
407
|
|
43
|
|
11
|
%
|
|||
|
Other
|
1,646
|
|
1,558
|
|
88
|
|
6
|
%
|
|||
|
Total operating expense
|
$
|
29,538
|
|
$
|
28,387
|
|
$
|
1,151
|
|
4
|
%
|
|
(1)
|
NM - not meaningful
|
On July 1, 2010, we sold Compass and Mesaba, our wholly-owned subsidiaries, to Trans States and Pinnacle, respectively.
Upon the closing of these transactions, we entered into new or amended long-term capacity purchase agreements with Compass, Mesaba and Pinnacle. Prior to these sales, expenses related to Compass and Mesaba as our wholly-owned subsidiaries were reported in the applicable expense line items. Subsequent to these sales, expenses related to Compass and Mesaba are reported as contract carrier arrangements expense.
Fuel Expense
. Including contract carriers under capacity purchase agreements, fuel expense increased
$610 million
on flat consumption. The table below presents fuel expense, gallons consumed, and our average price per fuel gallon, including the impact of fuel hedge activity:
|
Year Ended December 31,
|
Increase
(Decrease)
|
% Increase
(Decrease)
|
|||||||||
|
(in millions, except per gallon data)
|
2010
|
2009
|
|||||||||
|
Aircraft fuel and related taxes
|
$
|
7,594
|
|
$
|
7,384
|
|
$
|
210
|
|
||
|
Aircraft fuel and related taxes included within contract carrier arrangements
|
1,307
|
|
907
|
|
400
|
|
|||||
|
Total fuel expense
|
$
|
8,901
|
|
$
|
8,291
|
|
$
|
610
|
|
7
|
%
|
|
Total fuel consumption (gallons)
|
3,823
|
|
3,853
|
|
(30
|
)
|
(1
|
)%
|
|||
|
Average price per fuel gallon
|
$
|
2.33
|
|
$
|
2.15
|
|
$
|
0.18
|
|
8
|
%
|
Fuel expense increased primarily due to higher unhedged fuel prices, partially offset by an improvement in net fuel hedge results. Fuel hedge losses in 2009 were primarily due to hedge contracts purchased in 2008 when fuel prices reached record highs and were expected to continue to rise, but instead declined. The table below shows the impact of hedging on fuel expense and average price per fuel gallon:
|
Average Price Per Gallon
|
|||||||||||||||||||
|
Year Ended December 31,
|
Increase
(Decrease)
|
Year Ended December 31,
|
Increase
(Decrease)
|
||||||||||||||||
|
(in millions, except per gallon data)
|
2010
|
2009
|
2010
|
2009
|
|||||||||||||||
|
Fuel purchase cost
|
$
|
8,812
|
|
$
|
6,932
|
|
$
|
1,880
|
|
$
|
2.31
|
|
$
|
1.80
|
|
$
|
0.51
|
|
|
|
Fuel hedge (gains) losses
|
89
|
|
1,359
|
|
(1,270
|
)
|
0.02
|
|
0.35
|
|
(0.33
|
)
|
|||||||
|
Total fuel expense
|
$
|
8,901
|
|
$
|
8,291
|
|
$
|
610
|
|
$
|
2.33
|
|
$
|
2.15
|
|
$
|
0.18
|
|
|
32
Contract carrier arrangements
. Contract carrier arrangements expense, excluding the impact of fuel expense (discussed above), increased primarily due to the change in reporting described above due to the transactions involving Compass and Mesaba.
Aircraft maintenance materials and outside repairs.
Aircraft maintenance materials and outside repairs expense increased primarily due to returning aircraft to service after temporary storage, as well as the timing of engine and airframe maintenance volumes.
Passenger commissions and other selling expenses.
Passenger commissions and other selling expenses increased primarily due to higher revenue-related expenses, such as booking fees and sales commissions, from the increase in revenue.
Profit sharing.
We recorded $313 million related to our broad-based employee profit sharing plans for 2010. We did not record any profit sharing expense in 2009. Our broad-based profit sharing plans provide that, for each year in which we have an annual pre-tax profit (as defined in the plan document), we will pay a specified portion of that profit to eligible employees.
Restructuring and other items.
Due to the nature of amounts recorded within restructuring and other items, a year over year comparison is not meaningful. For a discussion of charges recorded in restructuring and other items, see Note 15 to the Notes of the Consolidated Financial Statements.
Non-Operating Results
|
Year Ended December 31,
|
Favorable (Unfavorable)
|
|||||||||||||||
|
(in millions)
|
2011
|
2010
|
2009
|
2011 vs. 2010
|
2010 vs. 2009
|
|||||||||||
|
Interest expense, net
|
$
|
(901
|
)
|
$
|
(969
|
)
|
$
|
(881
|
)
|
$
|
68
|
|
$
|
(88
|
)
|
|
|
Amortization of debt discount, net
|
(193
|
)
|
(216
|
)
|
(370
|
)
|
23
|
|
154
|
|
||||||
|
Loss on extinguishment of debt
|
(68
|
)
|
(391
|
)
|
(83
|
)
|
323
|
|
(308
|
)
|
||||||
|
Miscellaneous, net
|
(44
|
)
|
(33
|
)
|
77
|
|
(11
|
)
|
(110
|
)
|
||||||
|
Total other expense, net
|
$
|
(1,206
|
)
|
$
|
(1,609
|
)
|
$
|
(1,257
|
)
|
$
|
403
|
|
$
|
(352
|
)
|
|
During the years ended December 31, 2011, 2010 and 2009, we recorded
$68 million
,
$391 million
and
$83 million
in losses from the early extinguishment of debt, which primarily related to the write-off of debt discounts. These debt discounts are a result of fair value adjustments recorded in 2008 to reduce the carrying value of our long-term debt due to purchase accounting and a $1.0 billion advance purchase of SkyMiles by American Express. As a result of these write-offs and scheduled amortization, our unamortized debt discount has decreased from $1.9 billion at the beginning of 2009 to
$737 million
at
December 31, 2011
and our amortization of debt discount, net has decreased significantly from 2009 to 2011.
The table below shows the changes in miscellaneous, net:
|
Favorable (Unfavorable)
|
||||||
|
(in millions)
|
2011 vs. 2010
|
2010 vs. 2009
|
||||
|
Mark-to-market adjustments on the ineffective portion of fuel hedge contracts
|
$
|
(6
|
)
|
$
|
(61
|
)
|
|
Foreign currency exchange rates
|
3
|
|
(52
|
)
|
||
|
Other
|
(8
|
)
|
3
|
|
||
|
Miscellaneous, net
|
$
|
(11
|
)
|
$
|
(110
|
)
|
Income Taxes
We consider all income sources, including other comprehensive income, in determining the amount of tax benefit allocated to continuing operations. During the years ended
December 31, 2011
, 2010 and
2009
, we did not record an income tax provision for U.S. federal income tax purposes since our deferred tax assets are fully reserved by a valuation allowance. The following table shows the components of our income tax benefit (provision):
33
|
Year Ended December 31,
|
|||||||||
|
(in millions)
|
2011
|
2010
|
2009
|
||||||
|
International and state income tax (provision) benefit
|
$
|
(7
|
)
|
$
|
(15
|
)
|
$
|
23
|
|
|
Deferred tax benefit
|
2
|
|
—
|
|
—
|
|
|||
|
Alternative minimum tax refunds and other
|
90
|
|
—
|
|
—
|
|
|||
|
Intraperiod income tax allocation
|
—
|
|
—
|
|
321
|
|
|||
|
Income tax benefit (provision)
|
$
|
85
|
|
$
|
(15
|
)
|
$
|
344
|
|
During 2011, we recorded an income tax benefit of
$85 million
, primarily related to the recognition of alternative minimum tax refunds.
During 2009, we recorded an income tax benefit of
$344 million
, including a non-cash income tax benefit of
$321 million
on the loss from continuing operations, with an offsetting non-cash income tax expense of $321 million on other comprehensive income. This deferred income tax expense of $321 million will remain in accumulated other comprehensive loss until all amounts in accumulated other comprehensive loss that relate to fuel derivatives which are designated as accounting hedges are recognized in the Consolidated Statement of Operations. All amounts relating to our fuel derivative contracts that were previously designated as accounting hedges will be recognized by June 2012 (original settlement date of those contracts). As a result, a non-cash income tax expense of $321 million will be recognized in the June 2012 quarter unless we enter into and designate additional fuel derivative contracts as accounting hedges prior to June 2012.
At
December 31, 2011
, we had
$16.8 billion
of U.S. federal pre-tax net operating loss carryforwards. Accordingly, we believe we will not pay any cash federal income taxes during the next several years. Our U.S. federal pre-tax net operating loss carryforwards do not begin to expire until
2022
.
Financial Condition and Liquidity
We expect to meet our cash needs for the next 12 months from cash flows from operations, cash and cash equivalents, short-term investments and financing arrangements. As of
December 31, 2011
, we had
$5.4 billion
in unrestricted liquidity, consisting of $3.6 billion in cash and cash equivalents and short-term investments and $1.8 billion in undrawn revolving credit facilities.
Debt and Capital Leases.
At
December 31, 2011
, total debt and capital leases, including current maturities, was
$13.8 billion
, a
$1.5 billion
reduction from
December 31, 2010
and a $3.4 billion reduction from December 31, 2009. Our ability to obtain additional financing, if needed, on acceptable terms could be adversely affected by the fact that a significant portion of our assets are subject to liens.
Pension Obligations.
We sponsor defined benefit pension plans for eligible employees and retirees. These plans are closed to new entrants and are frozen for future benefit accruals. Our funding obligations for these plans are generally governed by the Employee Retirement Income Security Act. We contributed
$598 million
and
$728 million
to our defined benefit pension plans during 2011 and 2010, respectively. We estimate the funding requirements under these plans will total approximately
$700 million
in 2012.
Advance Purchase of SkyMiles.
In 2008, we entered into a multi-year extension of our American Express agreements and received $1.0 billion from American Express for an advance purchase of SkyMiles (the "prepayment"). The 2008 agreement provided that our obligations with respect to the advance purchase would be satisfied as American Express uses the purchased miles over a specified future period (“SkyMiles Usage Period”), rather than by cash payments from us to American Express. Due to the SkyMiles Usage Period and other restrictions placed upon American Express regarding the timing and use of the SkyMiles, we classified the $1.0 billion we received, the pre-payment, as long-term debt.
During the SkyMiles Usage Period, which commenced during the December 2011 quarter, American Express will draw down on their prepayment instead of paying cash to Delta for SkyMiles used. As of December 31, 2011,
$952 million
of the original $1.0 billion debt (or prepayment) remained, including $333 million which is classified in current maturities of long-term debt and capital leases.
34
Annual Sale of SkyMiles.
In December 2011, we amended our American Express agreements and sold American Express
$675 million
of SkyMiles. Under the December 2011 amendment, we anticipate American Express will make additional purchases of
$675 million
of SkyMiles in each of 2012, 2013, and 2014.
Fuel Card Obligation
. In December 2011, we also obtained a purchasing card with American Express for the purpose of buying jet fuel. The card currently carries a maximum credit limit of
$612 million
and must be paid monthly. As of December 31, 2011, we had
$318 million
outstanding on this purchasing card, which was classified as other accrued liabilities.
Liquidity Events
Liquidity and financing events during 2011 included the following:
|
•
|
Senior Secured Credit Facilities.
We entered into senior secured first-lien credit facilities (the "Senior Secured Credit Facilities") to borrow up to $2.6 billion. We borrowed $1.4 billion under the Senior Secured Credit Facilities to retire $1.4 billion of outstanding loans under our $2.5 billion senior secured exit financing facilities and terminated those facilities and an existing $100 million revolving credit facility. The Senior Secured Credit Facilities bear interest at a variable rate equal to LIBOR (subject to a 1.25% floor) or another index rate, in each case plus a specified margin and have final maturities in April 2016 and 2017. At
December 31, 2011
, the outstanding balances under the Senior Secured Credit Facilities had an interest rate of
5.50%
per annum.
|
|
•
|
Pacific Routes Term Loan Facility.
We amended our $250 million first-lien term loan facility (the "Pacific Routes Term Loan Facility") to, among other things, reduce the interest rate and extend the maturity date from September 2013 to March 2016. At
December 31, 2011
, the Pacific Routes Term Loan Facility had an interest rate of
4.25%
per annum.
|
|
•
|
Certificates.
We received
$834 million
in proceeds from offerings of Pass-Through Trust Certificates ("EETC") and used the proceeds to refinance aircraft securing other debt instruments at their maturities, primarily the 2001-1 EETC, and for general corporate purposes. During 2011, we paid $789 million to retire the outstanding principal amount under the 2001-1 EETC.
|
Sources and Uses of Cash
Cash Flows From Operating Activities
Cash provided by operating activities totaled
$2.8 billion
for 2011, primarily reflecting (1)
$2.7 billion
in net income after adjusting for items such as depreciation and amortization and (2) $675 million received for the sale of SkyMiles. Cash provided by operating activities was reduced by $313 million in profit sharing payments related to 2010 and other working capital changes.
Cash provided by operating activities totaled $2.8 billion for 2010, primarily reflecting (1) $2.6 billion in net income after adjusting for items such as depreciation and amortization, (2) a $516 million increase in accounts payable and accrued liabilities primarily related to our broad-based employee profit sharing plans and increased operations due to the improving economy and (3) a $232 million increase in advance ticket sales primarily due to an increase in air fares. Cash provided by operating activities for the year ended December 31, 2010 was partially offset by a $345 million decrease in frequent flyer liability.
Cash provided by operating activities totaled $1.4 billion for 2009, primarily reflecting the return from counterparties of $1.1 billion of hedge margin primarily used to settle hedge losses recognized during the period and $690 million in net income after adjusting for items such as depreciation and amortization.
Cash Flows From Investing Activities
Cash used in investing activities totaled
$1.5 billion
for 2011, primarily reflecting investments of (1)
$907 million
for flight equipment, including aircraft modifications to invest in full flat bed seats in BusinessElite and in-seat audio and video entertainment systems, parts and advance deposits related to our order to purchase 100 B-737-900ER aircraft, (2)
$347 million
for ground property and equipment (3) $240 million in net purchases of short-term investments and (4) a $100 million investment in GOL. Included in flight equipment acquisitions are 12 previously owned MD-90 aircraft and one previously leased B-767-300 aircraft.
35
Cash used in investing activities totaled $2.0 billion for 2010, primarily reflecting investments of (1) $1.1 billion for flight equipment, including aircraft modifications and parts, (2) $287 million for ground property and equipment and (3) $815 million for purchases of investments. Flight equipment acquisitions include the purchase of 34 aircraft, four of which were purchased new from the manufacturer, 18 of which were previously leased and 12 of which were previously owned.
Cash used in investing activities totaled $1.0 billion for 2009, primarily reflecting net investments of $951 million for flight equipment and $251 million for ground property and equipment. Cash used in investing activities was partially offset by a distribution of our investment in a money market fund that was liquidated in an orderly manner in 2010 and proceeds from the sale of flight equipment.
Cash Flows From Financing Activities
Cash used in financing activities totaled
$1.6 billion
for 2011, reflecting the repayment of $2.8 billion in long-term debt and capital lease obligations, partially offset by $1.0 billion in proceeds from aircraft and other aircraft-related financing and
$318 million
from the use of our fuel card. We also refinanced our $2.5 billion senior secured exit financing facilities as discussed above.
Cash used in financing activities totaled $2.5 billion for 2010, reflecting the repayment of $3.7 billion in long-term debt and capital lease obligations, including the repayment of $914 million of our Exit Revolving Facility. Cash used in financing activities was partially offset by $1.1 billion in proceeds from EETC aircraft financing.
Cash used in financing activities totaled $19 million for 2009, primarily reflecting $3.0 billion in proceeds from long-term debt and aircraft financing, largely associated with the issuance of (1) $2.1 billion under three new financings, which included (a) $750 million of senior secured credit facilities, (b) $750 million of senior secured notes, and (c) $600 million of senior second lien notes, (2) $342 million from the 2009-1 EETC offering and (3) $150 million of tax exempt bonds, mostly offset by the repayment of $2.9 billion in long-term debt and capital lease obligations, including the Northwest senior secured exit financing facility and a $500 million revolving facility.
Contractual Obligations
The following table summarizes our contractual obligations at
December 31, 2011
that we expect will be paid in cash. The table does not include amounts that are contingent on events or other factors that are uncertain or unknown at this time, including legal contingencies, uncertain tax positions, and amounts payable under collective bargaining arrangements, among others. In addition, the table does not include expected significant cash payments which are generally ordinary course of business obligations that do not include contractual commitments.
The amounts presented are based on various estimates, including estimates regarding the timing of payments, prevailing interest rates, volumes purchased, the occurrence of certain events and other factors. Accordingly, the actual results may vary materially from the amounts presented in the table.
During 2011, our contractual obligations were impacted by our agreement with Boeing to purchase
100
B-737-900ER aircraft with deliveries beginning in 2013 and continuing through 2018. Our estimated payments to purchase these aircraft are included in aircraft purchase obligations below.
|
Contractual Obligations by Year
(1)
|
|||||||||||||||||||||
|
(in millions)
|
2012
|
2013
|
2014
|
2015
|
2016
|
Thereafter
|
Total
|
||||||||||||||
|
Long-term debt (see Note 7)
|
|||||||||||||||||||||
|
Principal amount
|
$
|
1,592
|
|
$
|
1,225
|
|
$
|
2,000
|
|
$
|
1,347
|
|
$
|
1,240
|
|
$
|
5,441
|
|
$
|
12,845
|
|
|
Interest payments
|
710
|
|
630
|
|
560
|
|
410
|
|
320
|
|
800
|
|
3,430
|
|
|||||||
|
Contract carrier obligations (see Note 9)
|
2,340
|
|
2,420
|
|
2,430
|
|
2,400
|
|
2,100
|
|
5,700
|
|
17,390
|
|
|||||||
|
Operating lease payments (see Note 8)
|
1,462
|
|
1,441
|
|
1,380
|
|
1,271
|
|
1,126
|
|
7,588
|
|
14,268
|
|
|||||||
|
Employee benefit obligations (see Note 10)
|
830
|
|
790
|
|
800
|
|
810
|
|
780
|
|
10,920
|
|
14,930
|
|
|||||||
|
Aircraft purchase commitments (see Note 9)
|
215
|
|
530
|
|
745
|
|
760
|
|
760
|
|
3,810
|
|
6,820
|
|
|||||||
|
Capital lease obligations (see Note 8)
|
221
|
|
196
|
|
168
|
|
155
|
|
163
|
|
323
|
|
1,226
|
|
|||||||
|
Other obligations
|
510
|
|
230
|
|
210
|
|
120
|
|
70
|
|
170
|
|
1,310
|
|
|||||||
|
Total
|
$
|
7,880
|
|
$
|
7,462
|
|
$
|
8,293
|
|
$
|
7,273
|
|
$
|
6,559
|
|
$
|
34,752
|
|
$
|
72,219
|
|
|
(1)
|
For additional information, see the Notes to the Consolidated Financial Statements referenced in the table above.
|
36
Long-Term Debt, Principal Amount.
Represents scheduled principal payments on long-term debt. The table excludes amounts received from American Express for its advance purchase of SkyMiles because this obligation will be satisfied by American Express' use of SkyMiles over a specified period rather than by cash payments from us. For additional information about our agreements with American Express, see Note 6 of the Notes to the Consolidated Financial Statements.
Long-Term Debt, Interest Payments.
Represents estimated interest payments under our long-term debt based on the interest rates specified in the applicable debt agreements. Interest payments on variable interest rate debt were calculated using LIBOR at
December 31, 2011
.
Contract Carrier Obligations.
Represents our estimated minimum fixed obligations under capacity purchase agreements with regional carriers (excluding Comair). The reported amounts are based on (1) the required minimum levels of flying by our contract carriers under the applicable agreements and (2) assumptions regarding the costs associated with such minimum levels of flying.
Employee Benefit Obligations.
Represents primarily (1) our estimated minimum required funding for our qualified defined benefit pension plans based on actuarially determined estimates and (2) projected future benefit payments from our unfunded postretirement and postemployment plans. For additional information about our employee benefit obligations, see “Critical Accounting Policies and Estimates”.
Aircraft Purchase Commitments.
Represents primarily our commitments to purchase
100
B-737-900ER aircraft,
18
B-787-8 aircraft and
nine
previously owned MD-90 aircraft.
Other Obligations.
Represents primarily estimated purchase obligations under which we are required to make minimum payments for goods and services, including but not limited to insurance, marketing, maintenance, technology, sponsorships and other third party services and products.
Critical Accounting Policies and Estimates
Our critical accounting policies and estimates are those that require significant judgments and estimates. Accordingly, the actual results may differ materially from these estimates. For a discussion of these and other accounting policies, see Note 1 of the Notes to the Consolidated Financial Statements.
Frequent Flyer Program
Our frequent flyer program (the “SkyMiles Program”) offers incentives to travel on Delta. This program allows customers to earn mileage credits by flying on Delta, regional air carriers with which we have contract carrier agreements
and airlines that participate in the SkyMiles Program, as well as through participating companies such as credit card companies, hotels and car rental agencies. We also sell mileage credits to non-airline businesses, customers and other airlines.
The SkyMiles Program includes two types of transactions that are considered revenue arrangements with multiple deliverables. As discussed below, these are (1) passenger ticket sales earning mileage credits and (2) the sale of mileage credits to participating companies with which we have marketing agreements. Mileage credits are a separate unit of accounting as they can be redeemed by customers in future periods for air travel on Delta and participating airlines, membership in our Sky Club and other program awards.
Passenger Ticket Sales Earning Mileage Credits.
Passenger ticket sales earning mileage credits under our SkyMiles Program provide customers with two deliverables: (1) mileage credits earned and (2) air transportation.
Effective January 1, 2011, we began applying the provisions of Revenue Arrangements with Multiple Deliverables ("ASU 2009-13") to passenger tickets earning mileage credits.
Under ASU 2009-13, we value each deliverable on a standalone basis. Our estimate of the standalone selling price of a mileage credit is based on an analysis of our sales of mileage credits to other airlines and customers and is re-evaluated at least annually. We use established ticket prices to determine the standalone selling price of air transportation. We allocate the total amount collected from passenger ticket sales between the deliverables based on their relative selling prices.
37
We defer revenue from the mileage credit component of passenger ticket sales and recognize it as passenger revenue when miles are redeemed and services are provided. We record the portion of the passenger ticket sales for air transportation in air traffic liability and recognize these amounts in passenger revenue when we provide transportation or when the ticket expires unused.
The adoption of ASU 2009-13 did not have a material impact on the timing of revenue recognition or its classification with regard to passenger tickets earning mileage credits.
A hypothetical 10% increase in our estimate of the standalone selling price of a mileage credit would decrease passenger revenue by approximately $50 million, as a result of an increase in the amount of revenue deferred from the mileage component of passenger ticket sales.
Prior to the adoption of ASU 2009-13, we used the residual method for revenue recognition. Under the residual method, we determined the fair value of the mileage credit component based on prices at which we sold mileage credits to other airlines and then considered the remainder of the amount collected to be the air transportation deliverable.
Sale of Mileage Credits.
Customers may earn mileage credits through participating companies such as credit card companies, hotels and car rental agencies with which we have marketing agreements to sell mileage credits. Our contracts to sell mileage credits under these marketing agreements have two deliverables: (1) the mileage credits redeemable for future travel and (2) the marketing component.
ASU 2009-13 does not apply to contracts to sell mileage credits entered into prior to January 1, 2011 unless those contracts are materially modified. As of December 31, 2011, we had not materially modified any of our significant agreements. Our most significant contract to sell mileage credits relates to our co-brand credit card relationship with American Express. For additional information about this relationship, see Note 6. For contracts entered into prior to January 1, 2011 that have not been materially modified since January 1, 2011, we continue to use the residual method for revenue recognition and value only the mileage credits. Under the residual method, the portion of the revenue from the mileage component is deferred and recognized as passenger revenue when miles are redeemed and services are provided. The portion of the revenue received in excess of the fair value of mileage credits sold, the marketing component, is recognized in income as other revenue when the related marketing services are provided. The fair value of a mileage credit is determined based on prices at which we sell mileage credits to other airlines and is re-evaluated at least annually.
If we enter into new contracts or materially modify existing contracts to sell mileage credits related to our SkyMiles Program, we will value the standalone selling price of the marketing component and allocate the revenue from the contract based on the relative selling price of the mileage credits and the marketing component. A material modification of an existing contract could impact our deferral rate or cause an adjustment to our deferred revenue balance, which could materially impact our future financial results.
Breakage.
For mileage credits which we estimate are not likely to be redeemed (“Breakage”), we recognize the associated value proportionally during the period in which the remaining mileage credits are expected to be redeemed. The estimate of Breakage is based on historical redemption patterns. A change in assumptions as to the period over which mileage credits are expected to be redeemed, the actual redemption activity for mileage credits or the estimated fair value of mileage credits expected to be redeemed could have a material impact on our revenue in the year in which the change occurs and in future years.
At
December 31, 2011
, the aggregate deferred revenue balance associated with the SkyMiles Program was
$4.5 billion
. A hypothetical 1% change in the number of outstanding miles estimated to be redeemed would result in a $31 million impact on our deferred revenue liability at
December 31, 2011
.
Goodwill and Other Intangible Assets
We apply a fair value-based impairment test to the net book value of goodwill and indefinite-lived intangible assets on an annual basis (as of October 1) and, if certain events or circumstances indicate that an impairment loss may have been incurred, on an interim basis.
In September 2011, the FASB issued "Testing Goodwill for Impairment." The standard revises the way in which entities test goodwill for impairment. We adopted this standard and applied its provisions to our annual goodwill impairment test in the December 2011 quarter.
Key Assumptions.
The key assumptions in our impairment tests include
(1) our projected revenues, expenses and cash flows, (2) an estimated weighted average cost of capital, (3) assumed discount rates depending on the asset and (4) a tax rate. These assumptions are consistent with those hypothetical market participants would use. Since we are required to make estimates and assumptions when evaluating goodwill and indefinite-lived intangible assets for impairment, the actual amounts may differ materially from these estimates.
38
Changes in assumptions or circumstances could result in impairment. Factors which could cause impairment include, but are not limited to, (1) negative trends in our market capitalization, (2) an increase in fuel prices, (3) declining passenger mile yields, (4) lower passenger demand as a result of the weakened U.S. and global economy, (5) interruption to our operations due to an employee strike, terrorist attack, or other reasons, (6) changes to the regulatory environment and (7) consolidation of competitors in the airline industry.
Goodwill.
As of
December 31, 2011
and
2010
, our goodwill balance was
$9.8 billion
.
In evaluating goodwill for impairment, we estimate the fair value of our reporting unit by considering market capitalization and other factors if it is more likely than not that the fair value of our reporting unit is less than its carrying value. If the reporting unit's fair value exceeds its carrying value, no further testing is required. If, however, the reporting unit's carrying value exceeds its fair value, we then determine the amount of the impairment charge, if any. We recognize an impairment charge if the carrying value of the reporting unit's goodwill exceeds its estimated fair value.
Identifiable Intangible Assets.
Our identifiable intangible assets had a net carrying amount of
$4.8 billion
at
December 31, 2011
.
Indefinite-lived assets are not amortized and consist primarily of routes, slots, the Delta tradename and assets related to SkyTeam. Definite-lived intangible assets consist primarily of marketing agreements and contracts and are amortized on a straight-line basis or under the undiscounted cash flows method over the estimated economic life of the respective agreements and contracts.
We perform the impairment test for indefinite-lived intangible assets by comparing the asset's fair value to its carrying value. Fair value is estimated based on (1) recent market transactions, where available, (2) the lease savings method for certain airport slots (which reflects potential lease savings from owning the slots rather than leasing them from another airline at market rates), (3) the royalty method for the Delta tradename (which assumes hypothetical royalties generated from using our tradename) or (4) projected discounted future cash flows. We recognize an impairment charge if the asset's carrying value exceeds its estimated fair value.
Long-Lived Assets
Our flight equipment and other long-lived assets have a recorded value of
$20.2 billion
at
December 31, 2011
. This value is based on various factors, including the assets' estimated useful lives and salvage values.
We record impairment losses on flight equipment and other long-lived assets used in operations when events and circumstances indicate the assets may be impaired and the estimated future cash flows generated by those assets are less than their carrying amounts. Factors which could cause impairment include, but are not limited to, (1) a decision to permanently remove flight equipment or other long-lived assets from operations, (2) significant changes in the estimated useful life, (3) significant changes in projected cash flows, (4) permanent and significant declines in fleet fair values and (5) changes to the regulatory environment. For long-lived assets held for sale, we discontinue depreciation and record impairment losses when the carrying amount of these assets is greater than the fair value less the cost to sell.
To determine whether impairments exist for aircraft used in operations, we group assets at the fleet-type level (the lowest level for which there are identifiable cash flows) and then estimate future cash flows based on projections of capacity, passenger mile yield, fuel costs, labor costs and other relevant factors. If an impairment occurs, the impairment loss recognized is the amount by which the aircraft's carrying amount exceeds its estimated fair value. We estimate aircraft fair values using published sources, appraisals and bids received from third parties, as available.
Income Tax Valuation Allowance
We periodically assess whether it is more likely than not that we will generate sufficient taxable income to realize our deferred income tax assets and establish valuation allowances if it is not likely we will realize our deferred income tax assets. In making this determination, we consider all available positive and negative evidence and make certain assumptions. We consider, among other things, our deferred tax liabilities, the overall business environment, our historical financial results, our industry's historically cyclical financial results and potential current and future tax planning strategies. We cannot presently determine when we will be able to generate sufficient taxable income to realize our deferred tax assets.
Accordingly, we have recorded a full valuation allowance totaling
$10.7 billion
against our net deferred tax assets.
If we determine that it is more likely than not that we will generate sufficient taxable income to realize our deferred income tax assets, we will reverse our valuation allowance (in full or in part), resulting in a significant income tax benefit in the period such a determination is made.
39
Defined Benefit Pension Plans
We sponsor defined benefit pension plans for eligible employees and retirees. These plans are closed to new entrants and frozen for future benefit accruals.
As of
December 31, 2011
, the unfunded benefit obligation for these plans recorded on our Consolidated Balance Sheet was
$11.5 billion
. During
2011
, we contributed
$598 million
to these plans and recorded
$300 million
of expense in salaries and related costs on our Consolidated Statement of Operations. In
2012
, we estimate we will contribute approximately
$700 million
to these plans and that our expense will be approximately $370 million. The most critical assumptions impacting our defined benefit pension plan obligations and expenses are the weighted average discount rate and the expected long-term rate of return on the plan assets.
Weighted Average Discount Rate.
We determine our weighted average discount rate on our measurement date primarily by reference to annualized rates earned on high quality fixed income investments and yield-to-maturity analysis specific to our estimated future benefit payments. We used a weighted average discount rate to value the obligations of
4.94%
and
5.69%
at
December 31, 2011
and
2010
, respectively. Our weighted average discount rate for net periodic pension benefit cost in each of the past three years has varied from the rate selected on our measurement date, ranging from
5.70%
to
6.49%
between
2009
and
2011
, due to remeasurements throughout the year.
Expected Long-Term Rate of Return.
The expected long-term rate of return on plan assets is based primarily on plan-specific investment studies using historical market return and volatility data.
Modest excess return expectations versus some public market indices are incorporated into the return projections based on the actively managed structure of the investment programs and their records of achieving such returns historically. We also expect to receive a premium for investing in less liquid private markets.
We review our rate of return on plan asset assumptions annually.
Our annual investment performance for one particular year does not, by itself, significantly influence our evaluation.
Our actual historical annualized three and five year rate of return on plan assets for our defined benefit pension plans was approximately 11% and 2%, respectively, as of
December 31, 2011
. Our annualized five year return includes a -26% return during 2008.
The investment strategy for our defined benefit pension plan assets is to utilize a diversified mix of global public and private equity portfolios, public and private fixed income portfolios, and private real estate and natural resource investments to earn a long-term investment return that meets or exceeds our annualized return target.
Our expected long-term rate of return on assets for net periodic pension benefit cost for the year ended
December 31, 2011
was 9%.
The impact of a 0.50% change in these assumptions is shown in the table below:
|
Change in Assumption
|
Effect on 2012
Pension Expense
|
Effect on Accrued
Pension Liability at
December 31, 2011
|
|
0.50% decrease in weighted average discount rate
|
-$1 million
|
+$1.2 billion
|
|
0.50% increase in weighted average discount rate
|
- $4 million
|
- $1.1 billion
|
|
0.50% decrease in expected long-term rate of return on assets
|
+$39 million
|
—
|
|
0.50% increase in expected long-term rate of return on assets
|
- $39 million
|
—
|
Funding.
Our funding obligations for qualified defined benefit plans are governed by the Employee Retirement Income Security Act.
The Pension Protection Act of 2006 allows commercial airlines to elect alternative funding rules (“Alternative Funding Rules”) for defined benefit plans that are frozen. Delta elected the Alternative Funding Rules under which the unfunded liability for a frozen defined benefit plan may be amortized over a fixed 17-year period and is calculated using an
8.85%
interest rate.
While the Pension Protection Act makes our funding obligations for these plans more predictable, factors outside our control continue to have an impact on the funding requirements. Estimates of future funding requirements are based on various assumptions and can vary materially from actual funding requirements. Assumptions include, among other things, the actual and projected market performance of assets; statutory requirements; and demographic data for participants. For additional information, see Note 10 of the Notes to the Consolidated Financial Statements.
40
Recent Accounting Standards
Revenue Arrangements with Multiple Deliverables.
In October 2009, the Financial Accounting Standards Board ("FASB") issued ASU 2009-13.
The standard (1) revises guidance on when individual deliverables may be treated as separate units of accounting, (2) establishes a selling price hierarchy for determining the selling price of a deliverable, (3) eliminates the residual method for revenue recognition and (4) provides guidance on allocating consideration among separate deliverables. It applies only to contracts entered into or materially modified after December 31, 2010. We adopted this standard on a prospective basis beginning January 1, 2011.
We determined that the only revenue arrangements impacted by the adoption of this standard are those associated with our SkyMiles Program.
Fair Value Measurement and Disclosure Requirements.
In May 2011, the FASB issued "Amendments to Achieve Common Fair Value Measurement and Disclosure Requirements in U.S. GAAP and IFRSs." The standard revises guidance for fair value measurement and expands the disclosure requirements. It is effective prospectively for fiscal years beginning after December 15, 2011. We are currently evaluating the impact the adoption of this standard will have on our Consolidated Financial Statements.
Supplemental Information
We sometimes use information that is derived from the Consolidated Financial Statements, but that is not presented in accordance with accounting principles generally accepted in the U.S. (“GAAP”). Certain of this information are considered to be “non-GAAP financial measures” under the U.S. Securities and Exchange Commission rules. The non-GAAP financial measures should be considered in addition to results prepared in accordance with GAAP, but should not be considered a substitute for or superior to GAAP results.
The following tables show reconciliations of non-GAAP financial measures to the most directly comparable GAAP financial measures.
We exclude the following items from CASM to determine CASM-Ex:
|
•
|
Aircraft fuel and related taxes.
Management believes the volatility in fuel prices impacts the comparability of year-over-year financial performance.
|
|
•
|
Ancillary businesses
. Ancillary businesses are not related to the generation of a seat mile. These businesses include aircraft maintenance and staffing services we provide to third parties and our vacation wholesale operations.
|
|
•
|
Profit sharing.
Management believes the exclusion of this item provides a more meaningful comparison of our results to the airline industry.
|
|
•
|
Restructuring and other items.
Management believes the exclusion of this item is helpful to investors to evaluate our recurring core operational performance.
|
|
•
|
Mark-to-market ("MTM") adjustments for fuel hedges recorded in periods other than the settlement period.
Management believes these adjustments are helpful to evaluate our financial results in the period shown.
|
|
Year Ended December 31,
|
||||||
|
2011
|
2010
|
|||||
|
CASM
|
|
14.12
|
¢
|
|
12.69
|
¢
|
|
Items excluded:
|
||||||
|
Aircraft fuel and related taxes
|
(5.00
|
)
|
(3.82
|
)
|
||
|
Ancillary businesses
|
(0.37
|
)
|
(0.28
|
)
|
||
|
Profit sharing
|
(0.11
|
)
|
(0.13
|
)
|
||
|
Restructuring and other items
|
(0.10
|
)
|
(0.19
|
)
|
||
|
MTM adjustments for fuel hedges recorded in periods other than the settlement period
|
(0.01
|
)
|
—
|
|
||
|
CASM-Ex
|
|
8.53
|
¢
|
|
8.27
|
¢
|
41
The following table reconciles average price per fuel gallon to average price per fuel gallon, adjusted for MTM adjustments for fuel hedges recorded in periods other than the settlement period.
These mark-to-market adjustments are based on market prices as of the end of the reporting period. Such market prices are not necessarily indicative of the actual future cash value of the underlying hedge in the contract settlement period. Therefore, Delta adjusts fuel expense for these items to arrive at a more meaningful measure of fuel cost.
|
Year Ended December 31,
|
||||||
|
2011
|
2008
|
|||||
|
Average price per fuel gallon
(1)
|
$
|
3.06
|
|
$
|
3.16
|
|
|
MTM adjustments for fuel hedges recorded in periods other than the settlement period
|
(0.01
|
)
|
(0.03
|
)
|
||
|
Average price per fuel gallon, adjusted
|
$
|
3.05
|
|
$
|
3.13
|
|
|
(1)
|
Includes fuel expense incurred under contract carriers arrangements and the impact of fuel hedge activity
|
Glossary of Defined Terms
ASM
- Available Seat Mile. A measure of capacity. ASMs equal the total number of seats available for transporting passengers during a reporting period multiplied by the total number of miles flown during that period.
CASM
- (Operating) Cost per Available Seat Mile. The amount of operating cost incurred per ASM during a reporting period.
CASM-Ex
- The amount of operating cost incurred per ASM during a reporting period, excluding aircraft fuel and related taxes, ancillary businesses, profit sharing, restructuring and other items and MTM adjustments for fuel hedges recorded in periods other than the settlement period.
Passenger Load Factor
- A measure of utilized available seating capacity calculated by dividing RPMs by ASMs for a reporting period.
Passenger Mile Yield or Yield
- The amount of passenger revenue earned per RPM during a reporting period.
PRASM
- Passenger Revenue per ASM. The amount of passenger revenue earned per ASM during a reporting period. PRASM is also referred to as “unit revenue.”
RPM
- Revenue Passenger Mile. One revenue-paying passenger transported one mile. RPMs equal the number of revenue passengers during a reporting period multiplied by the number of miles flown by those passengers during that period. RPMs are also referred to as “traffic.”
42
ITEM 7A. QUANTITATIVE AND QUALITATIVE DISCLOSURES ABOUT MARKET RISK
We have market risk exposure related to aircraft fuel prices, interest rates, and foreign currency exchange rates. Market risk is the potential negative impact of adverse changes in these prices or rates on our Consolidated Financial Statements. In an effort to manage our exposure to these risks, we enter into derivative contracts and may adjust our derivative portfolio as market conditions change. We expect adjustments to the fair value of financial instruments to result in ongoing volatility in earnings and stockholders' equity.
The following sensitivity analysis does not consider the effects of a change in demand for air travel, the economy as a whole or actions we may take to seek to mitigate our exposure to a particular risk. For these and other reasons, the actual results of changes in these prices or rates may differ materially from the following hypothetical results.
Aircraft Fuel Price Risk
Our results of operations are materially impacted by changes in aircraft fuel prices.
We actively manage our fuel price risk through a hedging program intended to provide an offset against increases in jet fuel prices.
This fuel hedging program utilizes several different contract and commodity types, which are used together to create a risk mitigating hedge portfolio.
The economic effectiveness of this hedge portfolio is frequently tested against our financial targets.
The hedge portfolio is rebalanced from time to time according to market conditions, which may result in locking in gains or losses on hedge contracts prior to their settlement dates
.
Our fuel hedge portfolio generally consists of call options; put options, combinations of two or more call options and put options; swap contracts; and futures contracts. The products underlying the hedge contracts are derivatives of jet fuel, such as heating oil, crude oil and low sulfur diesel.
Our fuel hedge contracts contain margin funding requirements, which are driven by changes in price of the underlying commodity and the contracts used.
The margin funding requirements may cause us to post margin to counterparties or may cause counterparties to post margin to us as market prices in the underlying hedged items change.
If fuel prices decrease significantly from the levels existing at the time we enter into fuel hedge contracts, we may be required to post a significant amount of margin
. We may adjust our hedge portfolio from time to time in response to margin posting requirements.
For the year ended
December 31, 2011
, aircraft fuel and related taxes, including our contract carriers under capacity purchase agreements, accounted for
$11.8 billion
, or
36%
, of our total operating expense, including
$420 million
of net fuel hedge gains.
The following table shows the projected cash impact to fuel cost, on both an unhedged and hedged basis, assuming 10% and 20% increases or decreases in fuel prices. The hedge gain (loss) reflects the change in the projected cash settlement value of our open fuel hedge contracts at December 31, 2011 based on their contract settlement dates, assuming the same 10% and 20% changes.
|
Year Ending December 31, 2012
|
Fuel Hedge Margin (Posted to) Received from Counterparties
|
|||||||||||
|
(in millions)
|
Decrease (Increase) to Unhedged Fuel Cost
(1)
|
Hedge Gain (Loss)
(2)
|
Net Impact
|
|||||||||
|
+ 20%
|
$
|
(2,200
|
)
|
$
|
120
|
|
$
|
(2,080
|
)
|
$
|
40
|
|
|
+ 10%
|
(1,100
|
)
|
90
|
|
(1,010
|
)
|
$
|
10
|
|
|||
|
- 10%
|
1,100
|
|
(100
|
)
|
1,000
|
|
$
|
—
|
|
|||
|
- 20%
|
2,200
|
|
(230
|
)
|
1,970
|
|
$
|
(60
|
)
|
|||
|
(1)
|
Projections based upon the (increase) decrease to unhedged fuel cost as compared to the jet fuel price per gallon of $2.94, excluding transportation costs and taxes, at December 31, 2011 and estimated fuel consumption of 3.8 billion gallons for the year ending December 31, 2012.
|
|
(2)
|
Projections based on average futures prices by contract settlement month compared to futures prices at December 31, 2011.
|
43
Interest Rate Risk
Our exposure to market risk from adverse changes in interest rates is primarily associated with our long-term debt obligations. Market risk associated with our fixed and variable rate long-term debt relates to the potential reduction in fair value and negative impact to future earnings, respectively, from an increase in interest rates.
At
December 31, 2011
, we had $7.7 billion of fixed-rate long-term debt and $6.1 billion of variable-rate long-term debt. An increase of 100 basis points in average annual interest rates would have decreased the estimated fair value of our fixed-rate long-term debt by $300 million at
December 31, 2011
and would have increased the annual interest expense on our variable-rate long-term debt by $40 million, inclusive of the impact of our interest rate hedge contracts.
Foreign Currency Exchange Risk
We are subject to foreign currency exchange rate risk because we have revenue and expense denominated in foreign currencies with our primary exposures being the Japanese yen and Canadian dollar. To manage exchange rate risk, we execute both our international revenue and expense transactions in the same foreign currency to the extent practicable.
From time to time, we may also enter into foreign currency option and forward contracts.
At
December 31, 2011
, we had open foreign currency forward contracts totaling an $89 million liability position. We estimate that a 10% increase or decrease in the price of the Japanese yen and Canadian dollar in relation to the U.S. dollar would change the projected cash settlement value of our open hedge contracts by a $90 million gain or $110 million loss, respectively, for the year ending
December 31, 2012
.
44
ITEM 8. FINANCIAL STATEMENTS AND SUPPLEMENTARY DATA
INDEX TO CONSOLIDATED FINANCIAL STATEMENTS
|
Page
|
|
45
REPORT OF INDEPENDENT REGISTERED PUBLIC ACCOUNTING FIRM
To the Board of Directors and Stockholders of Delta Air Lines, Inc.
We have audited the accompanying consolidated balance sheets of Delta Air Lines, Inc. (the Company) as of
December 31, 2011
and
2010
, and the related consolidated statements of operations, stockholders' (deficit) equity, and cash flows for each of the three years in the period ended
December 31, 2011
. These financial statements are the responsibility of the Company's management. Our responsibility is to express an opinion on these financial statements based on our audits.
We conducted our audits in accordance with the standards of the Public Company Accounting Oversight Board (United States). Those standards require that we plan and perform the audit to obtain reasonable assurance about whether the financial statements are free of material misstatement. An audit includes examining, on a test basis, evidence supporting the amounts and disclosures in the financial statements. An audit also includes assessing the accounting principles used and significant estimates made by management, as well as evaluating the overall financial statement presentation. We believe that our audits provide a reasonable basis for our opinion.
In our opinion, the financial statements referred to above present fairly, in all material respects, the consolidated financial position of Delta Air Lines, Inc. at
December 31, 2011
and
2010
, and the consolidated results of its operations and its cash flows for each of the three years in the period ended
December 31, 2011
, in conformity with U.S. generally accepted accounting principles.
We also have audited, in accordance with the standards of the Public Company Accounting Oversight Board (United States), Delta Air Lines, Inc.'s internal control over financial reporting as of
December 31, 2011
, based on criteria established in Internal Control-Integrated Framework issued by the Committee of Sponsoring Organizations of the Treadway Commission and our report dated
February 10, 2012
expressed an unqualified opinion thereon.
|
/s/ Ernst & Young LLP
|
|
|
Atlanta, Georgia
|
|
|
February 10, 2012
|
|
46
DELTA AIR LINES, INC.
Consolidated Balance Sheets
|
December 31,
|
|||||||
|
(in millions, except share data)
|
2011
|
2010
|
|||||
|
ASSETS
|
|||||||
|
Current Assets:
|
|||||||
|
Cash and cash equivalents
|
$
|
2,657
|
|
$
|
2,892
|
|
|
|
Short-term investments
|
958
|
|
718
|
|
|||
|
Restricted cash, cash equivalents and short-term investments
|
305
|
|
409
|
|
|||
|
Accounts receivable, net of an allowance for uncollectible accounts of $33 and $40
at December 31, 2011 and 2010, respectively |
1,563
|
|
1,456
|
|
|||
|
Expendable parts and supplies inventories, net of an allowance for obsolescence of $101 and $104
at December 31, 2011 and 2010, respectively
|
367
|
|
318
|
|
|||
|
Deferred income taxes, net
|
461
|
|
355
|
|
|||
|
Prepaid expenses and other
|
1,418
|
|
1,159
|
|
|||
|
Total current assets
|
7,729
|
|
7,307
|
|
|||
|
Property and Equipment, Net:
|
|||||||
|
Property and equipment, net of accumulated depreciation and amortization of $5,472 and $4,164
at December 31, 2011 and 2010, respectively |
20,223
|
|
20,307
|
|
|||
|
Other Assets:
|
|||||||
|
Goodwill
|
9,794
|
|
9,794
|
|
|||
|
Identifiable intangibles, net of accumulated amortization of $600 and $530
at December 31, 2011 and 2010, respectively |
4,751
|
|
4,749
|
|
|||
|
Other noncurrent assets
|
1,002
|
|
1,031
|
|
|||
|
Total other assets
|
15,547
|
|
15,574
|
|
|||
|
Total assets
|
$
|
43,499
|
|
$
|
43,188
|
|
|
|
LIABILITIES AND STOCKHOLDERS' (DEFICIT) EQUITY
|
|||||||
|
Current Liabilities:
|
|||||||
|
Current maturities of long-term debt and capital leases
|
$
|
1,944
|
|
$
|
2,073
|
|
|
|
Air traffic liability
|
3,480
|
|
3,306
|
|
|||
|
Accounts payable
|
1,600
|
|
1,713
|
|
|||
|
Frequent flyer deferred revenue
|
1,849
|
|
1,690
|
|
|||
|
Accrued salaries and related benefits
|
1,367
|
|
1,370
|
|
|||
|
Taxes payable
|
594
|
|
579
|
|
|||
|
Other accrued liabilities
|
1,867
|
|
654
|
|
|||
|
Total current liabilities
|
12,701
|
|
11,385
|
|
|||
|
Noncurrent Liabilities:
|
|||||||
|
Long-term debt and capital leases
|
11,847
|
|
13,179
|
|
|||
|
Pension, postretirement and related benefits
|
14,200
|
|
11,493
|
|
|||
|
Frequent flyer deferred revenue
|
2,700
|
|
2,777
|
|
|||
|
Deferred income taxes, net
|
2,028
|
|
1,924
|
|
|||
|
Other noncurrent liabilities
|
1,419
|
|
1,533
|
|
|||
|
Total noncurrent liabilities
|
32,194
|
|
30,906
|
|
|||
|
Commitments and Contingencies
|
|||||||
|
Stockholders' (Deficit) Equity:
|
|||||||
|
Common stock at $0.0001 par value; 1,500,000,000 shares authorized, 861,499,734 and 847,716,723
shares issued at December 31, 2011 and 2010, respectively
|
—
|
|
—
|
|
|||
|
Additional paid-in capital
|
13,999
|
|
13,926
|
|
|||
|
Accumulated deficit
|
(8,398
|
)
|
(9,252
|
)
|
|||
|
Accumulated other comprehensive loss
|
(6,766
|
)
|
(3,578
|
)
|
|||
|
Treasury stock, at cost, 16,253,791 and 12,993,100 shares at December 31, 2011 and 2010, respectively
|
(231
|
)
|
(199
|
)
|
|||
|
Total stockholders' (deficit) equity
|
(1,396
|
)
|
897
|
|
|||
|
Total liabilities and stockholders' (deficit) equity
|
$
|
43,499
|
|
$
|
43,188
|
|
|
|
The accompanying notes are an integral part of these Consolidated Financial Statements.
|
|||||||
47
DELTA AIR LINES, INC.
Consolidated Statements of Operations
|
Year Ended December 31,
|
|||||||||||
|
(in millions, except per share data)
|
2011
|
2010
|
2009
|
||||||||
|
Operating Revenue:
|
|||||||||||
|
Passenger:
|
|||||||||||
|
Mainline
|
$
|
23,864
|
|
$
|
21,408
|
|
$
|
18,522
|
|
||
|
Regional carriers
|
6,393
|
|
5,850
|
|
5,285
|
|
|||||
|
Total passenger revenue
|
30,257
|
|
27,258
|
|
23,807
|
|
|||||
|
Cargo
|
1,027
|
|
850
|
|
788
|
|
|||||
|
Other
|
3,831
|
|
3,647
|
|
3,468
|
|
|||||
|
Total operating revenue
|
35,115
|
|
31,755
|
|
28,063
|
|
|||||
|
Operating Expense:
|
|||||||||||
|
Aircraft fuel and related taxes
|
9,730
|
|
7,594
|
|
7,384
|
|
|||||
|
Salaries and related costs
|
6,894
|
|
6,751
|
|
6,838
|
|
|||||
|
Contract carrier arrangements
|
5,470
|
|
4,305
|
|
3,823
|
|
|||||
|
Aircraft maintenance materials and outside repairs
|
1,765
|
|
1,569
|
|
1,434
|
|
|||||
|
Passenger commissions and other selling expenses
|
1,682
|
|
1,509
|
|
1,405
|
|
|||||
|
Contracted services
|
1,642
|
|
1,549
|
|
1,595
|
|
|||||
|
Depreciation and amortization
|
1,523
|
|
1,511
|
|
1,536
|
|
|||||
|
Landing fees and other rents
|
1,281
|
|
1,281
|
|
1,289
|
|
|||||
|
Passenger service
|
721
|
|
673
|
|
638
|
|
|||||
|
Aircraft rent
|
298
|
|
387
|
|
480
|
|
|||||
|
Profit sharing
|
264
|
|
313
|
|
—
|
|
|||||
|
Restructuring and other items
|
242
|
|
450
|
|
407
|
|
|||||
|
Other
|
1,628
|
|
1,646
|
|
1,558
|
|
|||||
|
Total operating expense
|
33,140
|
|
29,538
|
|
28,387
|
|
|||||
|
Operating Income (Loss)
|
1,975
|
|
2,217
|
|
(324
|
)
|
|||||
|
Other (Expense) Income:
|
|||||||||||
|
Interest expense, net
|
(901
|
)
|
(969
|
)
|
(881
|
)
|
|||||
|
Amortization of debt discount, net
|
(193
|
)
|
(216
|
)
|
(370
|
)
|
|||||
|
Loss on extinguishment of debt
|
(68
|
)
|
(391
|
)
|
(83
|
)
|
|||||
|
Miscellaneous, net
|
(44
|
)
|
(33
|
)
|
77
|
|
|||||
|
Total other expense, net
|
(1,206
|
)
|
(1,609
|
)
|
(1,257
|
)
|
|||||
|
Income (Loss) Before Income Taxes
|
769
|
|
608
|
|
(1,581
|
)
|
|||||
|
Income Tax Benefit (Provision)
|
85
|
|
(15
|
)
|
344
|
|
|||||
|
Net Income (Loss)
|
$
|
854
|
|
$
|
593
|
|
$
|
(1,237
|
)
|
||
|
Basic Earnings (Loss) Per Share
|
$
|
1.02
|
|
$
|
0.71
|
|
$
|
(1.50
|
)
|
||
|
Diluted Earnings (Loss) Per Share
|
$
|
1.01
|
|
$
|
0.70
|
|
$
|
(1.50
|
)
|
||
|
The accompanying notes are an integral part of these Consolidated Financial Statements.
|
|||||||||||
48
DELTA AIR LINES, INC.
Consolidated Statements of Cash Flows
|
Year Ended December 31,
|
|||||||||||
|
(in millions)
|
2011
|
2010
|
2009
|
||||||||
|
Cash Flows From Operating Activities:
|
|||||||||||
|
Net income (loss)
|
$
|
854
|
|
$
|
593
|
|
$
|
(1,237
|
)
|
||
|
Adjustments to reconcile net income (loss) to net cash provided by operating activities:
|
|||||||||||
|
Depreciation and amortization
|
1,523
|
|
1,511
|
|
1,536
|
|
|||||
|
Amortization of debt discount, net
|
193
|
|
216
|
|
370
|
|
|||||
|
Loss on extinguishment of debt
|
68
|
|
391
|
|
83
|
|
|||||
|
Fuel hedge derivative contracts
|
135
|
|
(136
|
)
|
(148
|
)
|
|||||
|
Deferred income taxes
|
(2
|
)
|
9
|
|
(329
|
)
|
|||||
|
Pension, postretirement and postemployment expense (less than) in excess of payments
|
(308
|
)
|
(301
|
)
|
307
|
|
|||||
|
Equity-based compensation expense
|
72
|
|
89
|
|
108
|
|
|||||
|
Restructuring and other items
|
142
|
|
182
|
|
—
|
|
|||||
|
Changes in certain assets and liabilities:
|
|||||||||||
|
Receivables
|
(76
|
)
|
(141
|
)
|
147
|
|
|||||
|
Hedge margin receivables
|
(24
|
)
|
—
|
|
1,132
|
|
|||||
|
Restricted cash and cash equivalents
|
153
|
|
16
|
|
79
|
|
|||||
|
Prepaid expenses and other current assets
|
(16
|
)
|
(7
|
)
|
(61
|
)
|
|||||
|
Air traffic liability
|
174
|
|
232
|
|
(286
|
)
|
|||||
|
Frequent flyer deferred revenue
|
82
|
|
(345
|
)
|
(298
|
)
|
|||||
|
Accounts payable and accrued liabilities
|
303
|
|
516
|
|
143
|
|
|||||
|
Other assets and liabilities
|
(373
|
)
|
(98
|
)
|
(138
|
)
|
|||||
|
Other, net
|
(66
|
)
|
105
|
|
(29
|
)
|
|||||
|
Net cash provided by operating activities
|
$
|
2,834
|
|
$
|
2,832
|
|
$
|
1,379
|
|
||
|
Cash Flows From Investing Activities:
|
|||||||||||
|
Property and equipment additions:
|
|||||||||||
|
Flight equipment, including advance payments
|
(907
|
)
|
(1,055
|
)
|
(951
|
)
|
|||||
|
Ground property and equipment, including technology
|
(347
|
)
|
(287
|
)
|
(251
|
)
|
|||||
|
Purchase of investments
|
(1,078
|
)
|
(815
|
)
|
—
|
|
|||||
|
Redemption of investments
|
844
|
|
149
|
|
256
|
|
|||||
|
Other, net
|
(10
|
)
|
(18
|
)
|
(62
|
)
|
|||||
|
Net cash used in investing activities
|
(1,498
|
)
|
(2,026
|
)
|
(1,008
|
)
|
|||||
|
Cash Flows From Financing Activities:
|
|||||||||||
|
Payments on long-term debt and capital lease obligations
|
(4,172
|
)
|
(3,722
|
)
|
(2,891
|
)
|
|||||
|
Proceeds from long-term obligations
|
2,395
|
|
1,130
|
|
2,966
|
|
|||||
|
Fuel card obligation
|
318
|
|
—
|
|
—
|
|
|||||
|
Debt issuance costs
|
(63
|
)
|
(19
|
)
|
—
|
|
|||||
|
Restricted cash and cash equivalents
|
(51
|
)
|
—
|
|
—
|
|
|||||
|
Other, net
|
2
|
|
90
|
|
(94
|
)
|
|||||
|
Net cash used in financing activities
|
(1,571
|
)
|
(2,521
|
)
|
(19
|
)
|
|||||
|
Net (Decrease) Increase in Cash and Cash Equivalents
|
(235
|
)
|
(1,715
|
)
|
352
|
|
|||||
|
Cash and cash equivalents at beginning of period
|
2,892
|
|
4,607
|
|
4,255
|
|
|||||
|
Cash and cash equivalents at end of period
|
$
|
2,657
|
|
$
|
2,892
|
|
$
|
4,607
|
|
||
|
Supplemental disclosure of cash paid for interest
|
$
|
925
|
|
$
|
1,036
|
|
$
|
867
|
|
||
|
Non-cash transactions:
|
|||||||||||
|
Flight equipment under capital leases
|
$
|
117
|
|
$
|
329
|
|
$
|
57
|
|
||
|
JFK redevelopment project funded by third parties
|
126
|
|
—
|
|
—
|
|
|||||
|
Debt relief through vendor negotiations
|
—
|
|
160
|
|
—
|
|
|||||
|
Debt discount on American Express agreements
|
—
|
|
110
|
|
—
|
|
|||||
|
Aircraft delivered under seller financing
|
—
|
|
20
|
|
139
|
|
|||||
|
The accompanying notes are an integral part of these Consolidated Financial Statements.
|
|||||||||||
49
DELTA AIR LINES, INC.
Consolidated Statements of Stockholders' (Deficit) Equity
|
Common Stock
|
Additional
Paid-In Capital |
Retained
Earnings (Accumulated Deficit) |
Accumulated
Other Comprehensive Income (Loss) |
Treasury Stock
|
||||||||||||||||||
|
(in millions, except per share data)
|
Shares
|
Amount
|
Shares
|
Amount
|
Total
|
|||||||||||||||||
|
Balance at January 1, 2009
|
703
|
|
$
|
—
|
|
$
|
13,714
|
|
$
|
(8,608
|
)
|
$
|
(4,080
|
)
|
8
|
|
$
|
(152
|
)
|
$
|
874
|
|
|
Comprehensive loss:
|
||||||||||||||||||||||
|
Net loss
|
—
|
|
—
|
|
—
|
|
(1,237
|
)
|
—
|
|
—
|
|
—
|
|
(1,237
|
)
|
||||||
|
Other comprehensive income
|
—
|
|
—
|
|
—
|
|
—
|
|
517
|
|
—
|
|
—
|
|
517
|
|
||||||
|
Total comprehensive loss
|
(720
|
)
|
||||||||||||||||||||
|
Shares of common stock issued to settle bankruptcy claims under Delta's Plan of Reorganization
|
36
|
|
—
|
|
—
|
|
—
|
|
—
|
|
—
|
|
—
|
|
—
|
|
||||||
|
Shares of common stock issued to settle bankruptcy claims under Northwest's Plan of Reorganization
|
3
|
|
—
|
|
—
|
|
—
|
|
—
|
|
—
|
|
—
|
|
—
|
|
||||||
|
Shares of common stock issued to pilots in connection with the merger with Northwest (Treasury shares withheld for payment of taxes, $4.55 per share)
(1)
|
50
|
|
—
|
|
—
|
|
—
|
|
—
|
|
—
|
|
(2
|
)
|
(2
|
)
|
||||||
|
Shares of common stock issued and compensation expense associated with equity awards (Treasury shares withheld for payment of taxes, $6.77 per share)
(1)
|
3
|
|
—
|
|
108
|
|
—
|
|
—
|
|
3
|
|
(20
|
)
|
88
|
|
||||||
|
Stock options exercised
|
—
|
|
—
|
|
5
|
|
—
|
|
—
|
|
—
|
|
—
|
|
5
|
|
||||||
|
Balance at December 31, 2009
|
795
|
|
—
|
|
13,827
|
|
(9,845
|
)
|
(3,563
|
)
|
11
|
|
(174
|
)
|
245
|
|
||||||
|
Comprehensive income:
|
||||||||||||||||||||||
|
Net income
|
—
|
|
—
|
|
—
|
|
593
|
|
—
|
|
—
|
|
—
|
|
593
|
|
||||||
|
Other comprehensive loss
|
—
|
|
—
|
|
—
|
|
—
|
|
(15
|
)
|
—
|
|
—
|
|
(15
|
)
|
||||||
|
Total comprehensive income
|
578
|
|
||||||||||||||||||||
|
Shares of common stock issued to settle bankruptcy claims under Delta's Plan of Reorganization
|
44
|
|
—
|
|
—
|
|
—
|
|
—
|
|
—
|
|
—
|
|
—
|
|
||||||
|
Shares of common stock issued to settle bankruptcy claims under Northwest's Plan of Reorganization
|
5
|
|
—
|
|
—
|
|
—
|
|
—
|
|
—
|
|
—
|
|
—
|
|
||||||
|
Shares of common stock issued and compensation expense associated with equity awards (Treasury shares withheld for payment of taxes, $12.41 per share)
(1)
|
3
|
|
—
|
|
89
|
|
—
|
|
—
|
|
2
|
|
(25
|
)
|
64
|
|
||||||
|
Stock options exercised
|
1
|
|
—
|
|
10
|
|
—
|
|
—
|
|
—
|
|
—
|
|
10
|
|
||||||
|
Balance at December 31, 2010
|
848
|
|
—
|
|
13,926
|
|
(9,252
|
)
|
(3,578
|
)
|
13
|
|
(199
|
)
|
897
|
|
||||||
|
Comprehensive loss:
|
||||||||||||||||||||||
|
Net income
|
—
|
|
—
|
|
—
|
|
854
|
|
—
|
|
—
|
|
—
|
|
854
|
|
||||||
|
Other comprehensive loss
|
—
|
|
—
|
|
—
|
|
—
|
|
(3,188
|
)
|
—
|
|
—
|
|
(3,188
|
)
|
||||||
|
Total comprehensive loss
|
(2,334
|
)
|
||||||||||||||||||||
|
Shares of common stock issued to settle bankruptcy claims under Delta's Plan of Reorganization
|
9
|
|
—
|
|
—
|
|
—
|
|
—
|
|
—
|
|
—
|
|
—
|
|
||||||
|
Shares of common stock issued to settle bankruptcy claims under Northwest's Plan of Reorganization
|
1
|
|
—
|
|
—
|
|
—
|
|
—
|
|
—
|
|
—
|
|
—
|
|
||||||
|
Shares of common stock issued and compensation expense associated with equity awards (Treasury shares withheld for payment of taxes, $9.63 per share)
(1)
|
3
|
|
—
|
|
72
|
|
—
|
|
—
|
|
3
|
|
(32
|
)
|
40
|
|
||||||
|
Stock options exercised
|
—
|
|
—
|
|
1
|
|
—
|
|
—
|
|
—
|
|
—
|
|
1
|
|
||||||
|
Balance at December 31, 2011
|
861
|
|
$
|
—
|
|
$
|
13,999
|
|
$
|
(8,398
|
)
|
$
|
(6,766
|
)
|
16
|
|
$
|
(231
|
)
|
$
|
(1,396
|
)
|
|
(1)
|
Weighted average price per share
|
The accompanying notes are an integral part of these Consolidated Financial Statements.
50
NOTES TO THE CONSOLIDATED FINANCIAL STATEMENTS
NOTE 1. SUMMARY OF SIGNIFICANT ACCOUNTING POLICIES
Basis of Presentation
Delta Air Lines, Inc., a Delaware corporation, provides scheduled air transportation for passengers and cargo throughout the United States (“U.S.”) and around the world. Our Consolidated Financial Statements include the accounts of Delta Air Lines, Inc. and our wholly-owned subsidiaries and have been prepared in accordance with accounting principles generally accepted in the U.S. (“GAAP”). We do not consolidate the financial statements of any company in which we have an ownership interest of
50%
or less. We are not the primary beneficiary of, nor do we have a controlling financial interest in, any variable interest entity. Accordingly, we have not consolidated any variable interest entity. We reclassified certain prior period amounts, none of which were material, to conform to the current period presentation.
We have marketing alliances with other airlines to enhance our access to domestic and international markets. These arrangements may include codesharing, reciprocal frequent flyer program benefits, shared or reciprocal access to passenger lounges, joint promotions, common use of airport gates and ticket counters, ticket office co-location and other marketing agreements. We have received antitrust immunity for certain marketing arrangements, which enables us to offer a more integrated route network and develop common sales, marketing and discount programs for customers. Some of our marketing arrangements provide for the sharing of revenues and expenses. Revenues and expenses associated with collaborative arrangements are presented on a gross basis in the applicable line items on our Consolidated Statements of Operations.
On July 1, 2010, we sold Compass Airlines, Inc. (“Compass”) and Mesaba Aviation, Inc. (“Mesaba”), our wholly-owned subsidiaries, to Trans States Airlines, Inc. (“Trans States”) and Pinnacle Airlines Corp. (“Pinnacle”), respectively.
Upon the closing of these transactions, we entered into new or amended long-term capacity purchase agreements with Compass, Mesaba and Pinnacle. Prior to these sales, expenses related to Compass and Mesaba as our wholly-owned subsidiaries were reported in the applicable expense line items. Subsequent to these sales, expenses related to Compass and Mesaba are reported as contract carrier arrangements expense.
Use of Estimates
We are required to make estimates and assumptions when preparing our Consolidated Financial Statements in accordance with GAAP. These estimates and assumptions affect the amounts reported in our Consolidated Financial Statements and the accompanying notes. Actual results could differ materially from those estimates.
Recent Accounting Standards
Revenue Arrangements with Multiple Deliverables ("ASU 2009-13").
In October 2009, the Financial Accounting Standards Board ("FASB") issued "Revenue Arrangements with Multiple Deliverables."
The standard (1) revises guidance on when individual deliverables may be treated as separate units of accounting, (2) establishes a selling price hierarchy for determining the selling price of a deliverable, (3) eliminates the residual method for revenue recognition and (4) provides guidance on allocating consideration among separate deliverables. It applies only to contracts entered into or materially modified after December 31, 2010. We adopted this standard on a prospective basis beginning January 1, 2011.
We determined that the only revenue arrangements impacted by the adoption of this standard are those associated with our frequent flyer program (the "SkyMiles Program"). See "Frequent Flyer Program" below.
Fair Value Measurement and Disclosure Requirements.
In May 2011, the FASB issued "Amendments to Achieve Common Fair Value Measurement and Disclosure Requirements in U.S. GAAP and IFRSs." The standard revises guidance for fair value measurement and expands the disclosure requirements. It is effective prospectively for fiscal years beginning after December 15, 2011. We are currently evaluating the impact the adoption of this standard will have on our Consolidated Financial Statements.
Cash and Cash Equivalents and Short-Term Investments
Short-term, highly liquid investments with maturities of three months or less when purchased are classified as cash and cash equivalents. Investments with maturities of greater than three months, but not in excess of one year, when purchased are classified as short-term investments.
51
Accounts Receivable
Accounts receivable primarily consist of amounts due from credit card companies from the sale of passenger airline tickets, customers of our aircraft maintenance and cargo transportation services and other companies for the purchase of mileage credits under our SkyMiles Program. We provide an allowance for uncollectible accounts equal to the estimated losses expected to be incurred based on historical chargebacks, write-offs, bankruptcies and other specific analyses. Bad debt expense was not material in any period presented.
Derivatives
Our results of operations are impacted by changes in aircraft fuel prices, interest rates and foreign currency exchange rates.
In an effort to manage our exposure to these risks, we enter into derivative contracts and may adjust our derivative portfolio as market conditions change.
We recognize derivative contracts at fair value on our Consolidated Balance Sheets.
Not Designated as Accounting Hedges.
Effective June 2011, we stopped designating new fuel derivative contracts as accounting hedges and discontinued hedge accounting for our then existing fuel derivative contracts that previously had been designated as accounting hedges. As a result, we record market adjustments for changes in fair value to earnings in aircraft fuel and related taxes. Prior to this change in accounting designation, gains or losses on these contracts were deferred in accumulated other comprehensive loss until contract settlement.
Designated as Cash Flow Hedges.
For derivative contracts designated as cash flow hedges, the effective portion of the gain or loss on the derivative is reported as a component of accumulated other comprehensive loss and reclassified into earnings in the same period in which the hedged transaction affects earnings. The effective portion of the derivative represents the change in fair value of the hedge that offsets the change in fair value of the hedged item. To the extent the change in the fair value of the hedge does not perfectly offset the change in the fair value of the hedged item, the ineffective portion of the hedge is immediately recognized in other (expense) income.
Designated as Fair Value Hedges.
For derivative contracts designated as fair value hedges (interest rate contracts), the gain or loss on the derivative and the offsetting loss or gain on the hedge item attributable to the hedged risk are recognized in current earnings. We include the gain or loss on the hedged item in the same account as the offsetting loss or gain on the related derivative contract, resulting in no impact to our Consolidated Statements of Operations.
The following table summarizes the risk each type of derivative contract is hedging and the classification of related gains and losses on our Consolidated Statements of Operations:
|
Derivative Type
|
Hedged Risk
|
Classification of Gains and Losses
|
|
Fuel hedge contracts
|
Increases in jet fuel prices
|
Aircraft fuel and related taxes
|
|
Interest rate contracts
|
Increases in interest rates
|
Interest expense, net
|
|
Foreign currency exchange contracts
|
Fluctuations in foreign currency exchange rates
|
Passenger revenue
|
The following table summarizes the accounting treatment of our derivative contracts:
|
Impact of Unrealized Gains and Losses
|
||
|
Accounting Designation
|
Effective Portion
|
Ineffective Portion
|
|
Not designated as hedges
|
Change in fair value of hedge is recorded in earnings
|
|
|
Designated as cash flow hedges
|
Market adjustments are recorded in accumulated other comprehensive loss
|
Excess, if any, over effective portion of hedge is recorded in other (expense) income
|
|
Designated as fair value hedges
|
Market adjustments are recorded in long-term debt and capital leases
|
Excess, if any, over effective portion of hedge is recorded in other (expense) income
|
52
We perform, at least quarterly, both a prospective and retrospective assessment of the effectiveness of our derivative contracts designated as hedges, including assessing the possibility of counterparty default. If we determine that a derivative is no longer expected to be highly effective, we discontinue hedge accounting prospectively and recognize subsequent changes in the fair value of the hedge in earnings. We believe our derivative contracts that continue to be designated as hedges, consisting of interest rate and foreign currency exchange contracts, will continue to be highly effective in offsetting changes in cash flow attributable to the hedged risk.
Hedge Margin.
In accordance with our fuel, interest rate and foreign currency hedge contracts, we may require counterparties to fund the margin associated with our gain position and/or counterparties may require us to fund the margin associated with our loss position on these contracts. The amount of the margin, if any, is periodically adjusted based on the fair value of the hedge contracts. The margin requirements are intended to mitigate a party's exposure to the risk of contracting party default. We do not offset margin funded to counterparties or margin funded to us by counterparties against fair value amounts recorded for our hedge contracts.
The hedge margin we receive from counterparties is recorded in cash and cash equivalents or restricted cash, cash equivalents and short-term investments, with the offsetting obligation in accounts payable. The hedge margin we provide to counterparties is recorded in accounts receivable. All cash flows associated with purchasing and settling hedge contracts are classified as operating cash flows.
Passenger Tickets
We record sales of passenger tickets in air traffic liability. Passenger revenue is recognized when we provide transportation or when the ticket expires unused, reducing the related air traffic liability. We periodically evaluate the estimated air traffic liability and record any adjustments in our Consolidated Statements of Operations. These adjustments relate primarily to refunds, exchanges, transactions with other airlines and other items for which final settlement occurs in periods subsequent to the sale of the related tickets at amounts other than the original sales price.
Taxes and Fees
We are required to charge certain taxes and fees on our passenger tickets, including U.S. federal transportation taxes, federal security charges, airport passenger facility charges and foreign arrival and departure taxes. These taxes and fees are assessments on the customer for which we act as a collection agent. Because we are not entitled to retain these taxes and fees, we do not include such amounts in passenger revenue. We record a liability when the amounts are collected and reduce the liability when payments are made to the applicable government agency or operating carrier.
Frequent Flyer Program
The SkyMiles Program offers incentives to travel on Delta. This program allows customers to earn mileage credits by flying on Delta, regional air carriers with which we have contract carrier agreements (“Contract Carriers”)
and airlines that participate in the SkyMiles Program, as well as through participating companies such as credit card companies, hotels and car rental agencies. We also sell mileage credits to non-airline businesses, customers and other airlines.
The SkyMiles Program includes two types of transactions that are considered revenue arrangements with multiple deliverables. As discussed below, these are (1) passenger ticket sales earning mileage credits and (2) the sale of mileage credits to participating companies with which we have marketing agreements. Mileage credits are a separate unit of accounting as they can be redeemed by customers in future periods for air travel on Delta and participating airlines, membership in our Sky Club and other program awards.
Passenger Ticket Sales Earning Mileage Credits.
Passenger ticket sales earning mileage credits under our SkyMiles Program provide customers with two deliverables: (1) mileage credits earned and (2) air transportation.
Effective January 1, 2011, we began applying the provisions of ASU 2009-13 to passenger tickets earning mileage credits.
Under ASU 2009-13, we value each deliverable on a standalone basis. Our estimate of the standalone selling price of a mileage credit is based on an analysis of our sales of mileage credits to other airlines and customers and is re-evaluated at least annually. We use established ticket prices to determine the standalone selling price of air transportation. We allocate the total amount collected from passenger ticket sales between the deliverables based on their relative selling prices.
53
We defer revenue from the mileage credit component of passenger ticket sales and recognize it as passenger revenue when miles are redeemed and services are provided. We record the portion of the passenger ticket sales for air transportation in air traffic liability and recognize these amounts in passenger revenue when we provide transportation or when the ticket expires unused.
The adoption of ASU 2009-13 did not have a material impact on the timing of revenue recognition or its classification with regard to passenger tickets earning mileage credits.
Prior to the adoption of ASU 2009-13, we used the residual method for revenue recognition. Under the residual method, we determined the fair value of the mileage credit component based on prices at which we sold mileage credits to other airlines and then considered the remainder of the amount collected to be the air transportation deliverable.
Sale of Mileage Credits.
Customers may earn mileage credits through participating companies such as credit card companies, hotels and car rental agencies with which we have marketing agreements to sell mileage credits. Our contracts to sell mileage credits under these marketing agreements have two deliverables: (1) the mileage credits redeemable for future travel and (2) the marketing component.
ASU 2009-13 does not apply to contracts to sell mileage credits entered into prior to January 1, 2011 unless those contracts are materially modified. As of December 31, 2011, we had not materially modified any of our significant agreements. Our most significant contract to sell mileage credits relates to our co-brand credit card relationship with American Express. For additional information about this relationship, see Note 6. For contracts entered into prior to January 1, 2011 that have not been materially modified since January 1, 2011, we continue to use the residual method for revenue recognition and value only the mileage credits. Under the residual method, the portion of the revenue from the mileage component is deferred and recognized as passenger revenue when miles are redeemed and services are provided. The portion of the revenue received in excess of the fair value of mileage credits sold, the marketing component, is recognized in income as other revenue when the related marketing services are provided. The fair value of a mileage credit is determined based on prices at which we sell mileage credits to other airlines and is re-evaluated at least annually.
If we enter into new contracts or materially modify existing contracts to sell mileage credits related to our SkyMiles Program, we will value the standalone selling price of the marketing component and allocate the revenue from the contract based on the relative selling price of the mileage credits and the marketing component. A material modification of an existing contract could impact our deferral rate or cause an adjustment to our deferred revenue balance, which could materially impact our future financial results.
Breakage.
For mileage credits which we estimate are not likely to be redeemed (“Breakage”), we recognize the associated value proportionally during the period in which the remaining mileage credits are expected to be redeemed. The estimate of Breakage is based on historical redemption patterns. A change in assumptions as to the period over which mileage credits are expected to be redeemed, the actual redemption activity for mileage credits or the estimated fair value of mileage credits expected to be redeemed could have a material impact on our revenue in the year in which the change occurs and in future years.
Regional Carriers Revenue
During the year ended
December 31, 2011
, we had contract carrier agreements with
nine
Contract Carriers, including our wholly-owned subsidiary, Comair, Inc. (“Comair”). Our Contract Carrier agreements are structured as either (1) capacity purchase agreements where we purchase all or a portion of the Contract Carrier's capacity and are responsible for selling the seat inventory we purchase or (2) revenue proration agreements, which are based on a fixed dollar or percentage division of revenues for tickets sold to passengers traveling on connecting flight itineraries. We record revenue related to all of our Contract Carrier agreements as regional carriers passenger revenue. We record expenses related to our Contract Carrier agreements, excluding Comair, as contract carrier arrangements expense.
Cargo Revenue
Cargo revenue is recognized when we provide the transportation.
54
Other Revenue
Other revenue is primarily comprised of (1) the marketing component of the sale of mileage credits discussed above, (2) baggage fee revenue, (3) other miscellaneous service revenue, including ticket change fees and (4) revenue from ancillary businesses, such as the aircraft maintenance and repair and staffing services we provide to third parties.
Long-Lived Assets
The following table shows our property and equipment:
|
December 31,
|
|||||||
|
(in millions, except for estimated useful life)
|
Estimated Useful Life
|
2011
|
2010
|
||||
|
Flight equipment
|
21-30 years
|
$
|
21,001
|
|
$
|
20,312
|
|
|
Ground property and equipment
|
3-40 years
|
3,256
|
|
3,123
|
|
||
|
Flight and ground equipment under capital leases
|
Shorter of lease term or estimated useful life
|
1,127
|
|
988
|
|
||
|
Assets constructed for others
|
30 years
|
234
|
|
—
|
|
||
|
Advance payments for equipment
|
77
|
|
48
|
|
|||
|
Less: accumulated depreciation and amortization
|
(5,472
|
)
|
(4,164
|
)
|
|||
|
Total property and equipment, net
|
$
|
20,223
|
|
$
|
20,307
|
|
|
We record property and equipment at cost and depreciate or amortize these assets on a straight-line basis to their estimated residual values over their estimated useful lives. The estimated useful life for leasehold improvements is the shorter of lease term or estimated useful life. Depreciation expense for the years ended
December 31, 2011
,
2010
and
2009
was
$1.4 billion
,
$1.4 billion
and
$1.3 billion
, respectively. Residual values for owned spare parts and simulators are generally
5%
of cost except when guaranteed by a third party for a different amount.
We capitalize certain internal and external costs incurred to develop and implement software, and amortize those costs over an estimated useful life of
three
to
seven
years. For the years ended
December 31, 2011
,
2010
and
2009
, we recorded
$64 million
,
$71 million
and
$95 million
, respectively, for amortization of capitalized software. The net book value of these assets totaled
$200 million
and
$153 million
at
December 31, 2011
and
2010
, respectively.
We record impairment losses on flight equipment and other long-lived assets used in operations when events and circumstances indicate the assets may be impaired and the estimated future cash flows generated by those assets are less than their carrying amounts. Factors which could cause impairment include, but are not limited to, (1) a decision to permanently remove flight equipment or other long-lived assets from operations, (2) significant changes in the estimated useful life, (3) significant changes in projected cash flows, (4) permanent and significant declines in fleet fair values and (5) changes to the regulatory environment. For long-lived assets held for sale, we discontinue depreciation and record impairment losses when the carrying amount of these assets is greater than the fair value less the cost to sell.
To determine whether impairments exist for aircraft used in operations, we group assets at the fleet-type level (the lowest level for which there are identifiable cash flows) and then estimate future cash flows based on projections of capacity, passenger mile yield, fuel costs, labor costs and other relevant factors. If an impairment occurs, the impairment loss recognized is the amount by which the aircraft's carrying amount exceeds its estimated fair value. We estimate aircraft fair values using published sources, appraisals and bids received from third parties, as available.
Goodwill and Other Intangible Assets
We apply a fair value-based impairment test to the net book value of goodwill and indefinite-lived intangible assets on an annual basis (as of October 1) and, if certain events or circumstances indicate that an impairment loss may have been incurred, on an interim basis.
In September 2011, the FASB issued "Testing Goodwill for Impairment." The standard revises the way in which entities test goodwill for impairment. We adopted this standard and applied its provisions to our annual goodwill impairment test in the December 2011 quarter.
55
We value goodwill and identified intangible assets primarily using market capitalization and income approach valuation techniques. These measurements include the following significant unobservable inputs:
(1) our projected revenues, expenses and cash flows, (2) an estimated weighted average cost of capital, (3) assumed discount rates depending on the asset and (4) a tax rate. These assumptions are consistent with those hypothetical market participants would use. Since we are required to make estimates and assumptions when evaluating goodwill and indefinite-lived intangible assets for impairment, the actual amounts may differ materially from these estimates.
Changes in assumptions or circumstances could result in impairment. Factors which could cause impairment include, but are not limited to, (1) negative trends in our market capitalization, (2) an increase in fuel prices, (3) declining passenger mile yields, (4) lower passenger demand as a result of the weakened U.S. and global economy, (5) interruption to our operations due to an employee strike, terrorist attack, or other reasons, (6) changes to the regulatory environment and (7) consolidation of competitors in the airline industry.
Goodwill.
As of
December 31, 2011
and
2010
, our goodwill balance was
$9.8 billion
.
In evaluating goodwill for impairment, we estimate the fair value of our reporting unit by considering market capitalization and other factors if it is more likely than not that the fair value of our reporting unit is less than its carrying value. If the reporting unit's fair value exceeds its carrying value, no further testing is required. If, however, the reporting unit's carrying value exceeds its fair value, we then determine the amount of the impairment charge, if any. We recognize an impairment charge if the carrying value of the reporting unit's goodwill exceeds its estimated fair value.
Identifiable Intangible Assets.
Our identifiable intangible assets had a net carrying amount of
$4.8 billion
at
December 31, 2011
.
Indefinite-lived assets are not amortized and consist primarily of routes, slots, the Delta tradename and assets related to SkyTeam. Definite-lived intangible assets consist primarily of marketing agreements and contracts and are amortized on a straight-line basis or under the undiscounted cash flows method over the estimated economic life of the respective agreements and contracts.
Costs incurred to renew or extend the term of an intangible asset are expensed as incurred.
We perform the impairment test for indefinite-lived intangible assets by comparing the asset's fair value to its carrying value. Fair value is estimated based on (1) recent market transactions, where available, (2) the lease savings method for certain airport slots (which reflects potential lease savings from owning the slots rather than leasing them from another airline at market rates), (3) the royalty method for the Delta tradename (which assumes hypothetical royalties generated from using our tradename) or (4) projected discounted future cash flows. We recognize an impairment charge if the asset's carrying value exceeds its estimated fair value.
Income Taxes
We account for deferred income taxes under the liability method. We recognize deferred tax assets and liabilities based on the tax effects of temporary differences between the financial statement and tax bases of assets and liabilities, as measured by current enacted tax rates. Deferred tax assets and liabilities are recorded net as current and noncurrent deferred income taxes. A valuation allowance is recorded to reduce deferred tax assets when necessary. For additional information about our valuation allowance, see Note 11.
Manufacturers' Credits
We periodically receive credits in connection with the acquisition of aircraft and engines. These credits are deferred until the aircraft and engines are delivered, and then applied on a pro rata basis as a reduction to the cost of the related equipment.
Maintenance Costs
We record maintenance costs to aircraft maintenance materials and outside repairs. Maintenance costs are expensed as incurred, except for costs incurred under power-by-the-hour contracts, which are expensed based on actual hours flown. Power-by-the-hour contracts transfer certain risk to third party service providers and fix the amount we pay per flight hour to the service provider in exchange for maintenance and repairs under a predefined maintenance program. Modifications that enhance the operating performance or extend the useful lives of airframes or engines are capitalized and amortized over the remaining estimated useful life of the asset or the remaining lease term, whichever is shorter.
56
Inventories
Inventories of expendable parts related to flight equipment are carried at moving average cost and charged to operations as consumed. An allowance for obsolescence is provided over the remaining useful life of the related fleet for spare parts expected to be available at the date aircraft are retired from service. We also provide allowances for parts identified as excess or obsolete to reduce the carrying costs to the lower of cost or net realizable value. These parts are assumed to have an estimated residual value of
5%
of the original cost.
Advertising Costs
We expense advertising costs as other selling expenses in the year incurred. Advertising expense was
$214 million
,
$169 million
and
$176 million
for the years ended
December 31, 2011
,
2010
and
2009
, respectively.
Commissions
Passenger commissions are recognized in operating expense when the related revenue is recognized.
NOTE 2. FAIR VALUE MEASUREMENTS
Fair value is defined as an exit price, representing the amount that would be received to sell an asset or paid to transfer a liability in an orderly transaction between market participants. Fair value is a market-based measurement that is determined based on assumptions that market participants would use in pricing an asset or liability. A three-tier fair value hierarchy is used to prioritize the inputs in measuring fair value
as follows:
|
•
|
Level 1.
Observable inputs such as quoted prices in active markets;
|
|
•
|
Level 2
. Inputs, other than quoted prices in active markets, that are observable either directly or indirectly; and
|
|
•
|
Level 3
. Unobservable inputs in which there is little or no market data, which require the reporting entity to develop its own assumptions.
|
Assets and liabilities measured at fair value are based on one or more of three valuation techniques identified in the tables below. The valuation techniques are as follows:
|
(a)
|
Market approach
. Prices and other relevant information generated by market transactions involving identical or comparable assets or liabilities;
|
|
(b)
|
Cost approach.
Amount that would be required to replace the service capacity of an asset (replacement cost); and
|
|
(c)
|
Income approach.
Techniques to convert future amounts to a single present amount based on market expectations (including present value techniques, option-pricing and excess earnings models).
|
Assets (Liabilities) Measured at Fair Value on a Recurring Basis
|
(in millions)
|
December 31, 2011
|
Level 1
|
Level 2
|
Level 3
|
Valuation
Technique
|
||||||||
|
Cash equivalents
|
$
|
2,357
|
|
$
|
2,357
|
|
$
|
—
|
|
$
|
—
|
|
(a)
|
|
Short-term investments
|
958
|
|
958
|
|
—
|
|
—
|
|
(a)
|
||||
|
Restricted cash equivalents and short-term investments
|
341
|
|
341
|
|
—
|
|
—
|
|
(a)
|
||||
|
Long-term investments
|
188
|
|
55
|
|
24
|
|
109
|
|
(a)(c)
|
||||
|
Hedge derivatives, net
|
|||||||||||||
|
Fuel hedge contracts
|
70
|
|
—
|
|
70
|
|
—
|
|
(a)(c)
|
||||
|
Interest rate contracts
|
(91
|
)
|
—
|
|
(91
|
)
|
—
|
|
(a)(c)
|
||||
|
Foreign currency exchange contracts
|
(89
|
)
|
—
|
|
(89
|
)
|
—
|
|
(a)
|
||||
57
|
(in millions)
|
December 31, 2010
|
Level 1
|
Level 2
|
Level 3
|
Valuation
Technique
|
||||||||
|
Cash equivalents
|
$
|
2,696
|
|
$
|
2,696
|
|
$
|
—
|
|
$
|
—
|
|
(a)
|
|
Short-term investments
|
718
|
|
718
|
|
—
|
|
—
|
|
(a)
|
||||
|
Restricted cash equivalents and short-term investments
|
440
|
|
440
|
|
—
|
|
—
|
|
(a)
|
||||
|
Long-term investments
|
144
|
|
—
|
|
25
|
|
119
|
|
(a)(c)
|
||||
|
Hedge derivatives, net
|
|||||||||||||
|
Fuel hedge contracts
|
351
|
|
—
|
|
351
|
|
—
|
|
(a)(c)
|
||||
|
Interest rate contracts
|
(74
|
)
|
—
|
|
(74
|
)
|
—
|
|
(a)(c)
|
||||
|
Foreign currency exchange contracts
|
(96
|
)
|
—
|
|
(96
|
)
|
—
|
|
(a)
|
||||
Cash Equivalents, Short-term Investments and Restricted Cash Equivalents and Short-term Investments.
Cash equivalents and short-term investments generally consist of money market funds and treasury bills. Restricted cash equivalents and short-term investments are primarily held to meet certain projected self-insurance obligations and generally consist of money market funds and time deposits. A portion of our restricted cash equivalents and short-term investments are recorded in other noncurrent assets. Cash equivalents, short-term investments and restricted cash equivalents and short-term investments
are recorded at cost, which approximates fair value. Fair value is based on the market approach using prices and other relevant information generated by market transactions involving identical or comparable assets.
Long-term Investments.
Investments with maturities of greater than one year when purchased are recorded at fair value in other noncurrent assets. Our long-term investments are comprised primarily of student loan backed auction rate securities classified as available-for-sale and insured auction rate securities classified as trading securities. Any change in the fair value of these securities is recorded in accumulated other comprehensive loss or earnings, as appropriate. At
December 31, 2011
and
2010
, the fair value of our auction rate securities was
$109 million
and
$119 million
, respectively. The cost of these investments was
$133 million
and
$143 million
, respectively. These investments are classified in other noncurrent assets due to the protracted failure in the auction process and long-term nature of these contractual maturities.
Because auction rate securities are not actively traded, fair values were estimated by discounting the cash flows expected to be received over the remaining maturities of the underlying securities. We based the valuations on our assessment of observable yields on instruments bearing comparable risks and considered the creditworthiness of the underlying debt issuer. Changes in market conditions could result in further adjustments to the fair value of these securities.
Hedge Derivatives.
Our derivative contracts are generally privately negotiated with counterparties without going through a public exchange. Accordingly, our fair value assessments give consideration to the risk of counterparty default (as well as our own credit risk).
|
•
|
Fuel Derivatives.
Our fuel hedge portfolio generally consists of call options; put options, combinations of two or more call options and put options; swap contracts; and futures contracts. The products underlying the hedge contracts are derivatives of jet fuel, such as heating oil, crude oil and low sulfur diesel.
Option contracts are valued under the income approach using option pricing models based on data either readily observable in public markets, derived from public markets or provided by counterparties who regularly trade in public markets. Volatilities used in these valuations ranged from
16% to 47%
depending on the maturity dates, underlying commodities and strike prices of the option contracts. Swap contracts are valued under the income approach using a discounted cash flow model based on data either readily observable or derived from public markets. Discount rates used in these valuations ranged from
0.295% to 0.676%
based on interest rates applicable to the maturity dates of the respective contracts. Futures contracts are traded on a public exchange and are valued based on quoted market prices.
|
|
•
|
Interest Rate Derivatives.
Our interest rate derivatives consist of swap contracts and are valued primarily based on data readily observable in public markets.
|
|
•
|
Foreign Currency Derivatives.
Our foreign currency derivatives consist of Japanese yen and Canadian dollar forward contracts and are valued based on data readily observable in public markets.
|
|
•
|
Changes in Level 3.
During 2011 and 2010, we did not have any hedge derivatives classified in Level 3. The following table shows the changes in our hedge derivatives, net classified in Level 3 during 2009:
|
58
|
(in millions)
|
Hedge Derivatives, Net
|
||
|
Balance at January 1, 2009
|
$
|
(1,091
|
)
|
|
Change in fair value included in other comprehensive income
|
1,230
|
|
|
|
Change in fair value included in earnings:
|
|||
|
Aircraft fuel and related taxes
|
(1,263
|
)
|
|
|
Miscellaneous, net
|
31
|
|
|
|
Purchases and settlements, net
|
1,199
|
|
|
|
Transfers from Level 3
(1)
|
(106
|
)
|
|
|
Balance at December 31, 2009
|
$
|
—
|
|
|
(1)
|
During 2009, we implemented systems that better provide for the evaluation of certain inputs against market data. As a result, we reclassified our option contracts to Level 2.
|
For additional information regarding the composition and classification of our derivative contracts, see Note 3.
Benefit Plan Assets.
Benefit plan assets relate to our defined benefit pension plans and certain of our postemployment benefit plans that are funded through trusts. The following table shows our benefit plan assets by asset class. These investments are presented net of the related benefit obligation in pension, postretirement, and related benefits. For additional information regarding benefit plan assets, see Note 10.
|
December 31, 2011
|
December 31, 2010
|
||||||||||||||||||||||||||
|
(in millions)
|
Total
|
Level 1
|
Level 2
|
Level 3
|
Valuation Technique
|
Total
|
Level 1
|
Level 2
|
Level 3
|
Valuation Technique
|
|||||||||||||||||
|
Common stock
|
|||||||||||||||||||||||||||
|
U.S.
|
$
|
796
|
|
$
|
796
|
|
$
|
—
|
|
$
|
—
|
|
(a)
|
$
|
1,427
|
|
$
|
1,402
|
|
$
|
25
|
|
$
|
—
|
|
(a)
|
|
|
Non-U.S.
|
910
|
|
875
|
|
—
|
|
35
|
|
(a)
|
1,090
|
|
1,058
|
|
—
|
|
32
|
|
(a)
|
|||||||||
|
Mutual funds
|
|||||||||||||||||||||||||||
|
U.S.
|
18
|
|
—
|
|
18
|
|
—
|
|
(a)
|
1
|
|
1
|
|
—
|
|
—
|
|
(a)
|
|||||||||
|
Non-U.S.
|
246
|
|
21
|
|
225
|
|
—
|
|
(a)
|
—
|
|
—
|
|
—
|
|
—
|
|
(a)
|
|||||||||
|
Non-U.S. emerging markets
|
2
|
|
—
|
|
2
|
|
—
|
|
(a)
|
314
|
|
—
|
|
314
|
|
—
|
|
(a)
|
|||||||||
|
Diversified fixed income
|
426
|
|
—
|
|
426
|
|
—
|
|
(a)
|
222
|
|
—
|
|
222
|
|
—
|
|
(a)
|
|||||||||
|
High yield
|
58
|
|
—
|
|
58
|
|
—
|
|
(a)(c)
|
209
|
|
—
|
|
209
|
|
—
|
|
(a)(c)
|
|||||||||
|
Commingled funds
|
|||||||||||||||||||||||||||
|
U.S.
|
917
|
|
—
|
|
917
|
|
—
|
|
(a)
|
1,776
|
|
—
|
|
1,776
|
|
—
|
|
(a)
|
|||||||||
|
Non-U.S.
|
783
|
|
—
|
|
783
|
|
—
|
|
(a)
|
514
|
|
—
|
|
514
|
|
—
|
|
(a)
|
|||||||||
|
Non-U.S. emerging markets
|
—
|
|
—
|
|
—
|
|
—
|
|
(a)
|
135
|
|
—
|
|
135
|
|
—
|
|
(a)
|
|||||||||
|
Diversified fixed income
|
776
|
|
—
|
|
776
|
|
—
|
|
(a)
|
458
|
|
—
|
|
458
|
|
—
|
|
(a)
|
|||||||||
|
High yield
|
92
|
|
—
|
|
92
|
|
—
|
|
(a)
|
93
|
|
—
|
|
93
|
|
—
|
|
(a)
|
|||||||||
|
Alternative investments
|
|||||||||||||||||||||||||||
|
Private equity
|
1,620
|
|
—
|
|
—
|
|
1,620
|
|
(a)(c)
|
1,559
|
|
—
|
|
—
|
|
1,559
|
|
(a)(c)
|
|||||||||
|
Real estate and natural resources
|
424
|
|
—
|
|
—
|
|
424
|
|
(a)(c)
|
396
|
|
—
|
|
—
|
|
396
|
|
(a)(c)
|
|||||||||
|
Hedge Funds
|
432
|
|
—
|
|
—
|
|
432
|
|
(a)(c)
|
—
|
|
—
|
|
—
|
|
—
|
|
|
|||||||||
|
Fixed income
|
764
|
|
—
|
|
753
|
|
11
|
|
(a)(c)
|
551
|
|
—
|
|
511
|
|
40
|
|
(a)(c)
|
|||||||||
|
Foreign currency derivatives
|
|||||||||||||||||||||||||||
|
Assets
|
738
|
|
—
|
|
738
|
|
—
|
|
(a)
|
879
|
|
—
|
|
879
|
|
—
|
|
(a)
|
|||||||||
|
Liabilities
|
(735
|
)
|
—
|
|
(735
|
)
|
—
|
|
(a)
|
(874
|
)
|
—
|
|
(874
|
)
|
—
|
|
(a)
|
|||||||||
|
Cash equivalents and other
|
447
|
|
46
|
|
401
|
|
—
|
|
(a)
|
609
|
|
52
|
|
557
|
|
—
|
|
(a)
|
|||||||||
|
Total benefit plan assets
|
$
|
8,714
|
|
$
|
1,738
|
|
$
|
4,454
|
|
$
|
2,522
|
|
$
|
9,359
|
|
$
|
2,513
|
|
$
|
4,819
|
|
$
|
2,027
|
|
|||
59
Common Stock.
Common stock is valued at the closing price reported on the active market on which the individual securities are traded.
Mutual and Commingled Funds.
These funds are valued using the net asset value divided by the number of shares outstanding, which is based on quoted market prices of the underlying assets owned by the fund.
Alternative Investments.
The valuation of alternative investments requires significant judgment due to the absence of quoted market prices as well as the inherent lack of liquidity and the long-term nature of these assets. Accordingly, these assets are generally classified in Level 3. Alternative investments include private equity, real estate, energy and timberland. Investments are valued based on valuation models where one or more of the significant inputs into the model cannot be observed and which require the development of assumptions. We also assess the potential for adjustment to the fair value of these investments due to the lag in the availability of data. In these cases, we solicit preliminary valuation updates at year-end from the investment managers and use that information and corroborating data from public markets to determine any needed adjustments to fair value.
Fixed Income.
Investments include corporate bonds, government bonds, collateralized mortgage obligations and other asset backed securities. These investments are generally valued at the bid price or the average of the bid and ask price. Prices are based on pricing models, quoted prices of securities with similar characteristics, or broker quotes.
Hedge Funds.
Our hedge fund investments are primarily made through shares of limited partnerships or similar limited liability structures for which a liquid secondary market does not exist. Hedge funds are considered Level 3 assets. Hedge funds are valued monthly by a third-party administrator that has been appointed by the fund's general partner.
Foreign Currency Derivatives.
Our foreign currency derivatives consist of various forward contracts and are valued based on data readily observable in public markets.
Cash Equivalents and Other.
These investments primarily consist of short term investment funds which are valued using the net asset value. Cash is not included in the table above.
Changes in Level 3.
The following table shows the changes in our benefit plan assets classified in Level 3:
|
(in millions)
|
Private Equity
|
Real Estate
|
Hedge Funds
|
Common Stock
|
Fixed Income
|
Total
|
||||||||||||
|
Balance at January 1, 2010
|
$
|
1,216
|
|
$
|
336
|
|
$
|
—
|
|
$
|
35
|
|
$
|
46
|
|
$
|
1,633
|
|
|
Actual return on plan assets:
|
||||||||||||||||||
|
Related to assets still held at the reporting date
|
160
|
|
34
|
|
—
|
|
(1
|
)
|
1
|
|
194
|
|
||||||
|
Related to assets sold during the period
|
64
|
|
4
|
|
—
|
|
—
|
|
4
|
|
72
|
|
||||||
|
Purchases and settlements, net
|
53
|
|
22
|
|
—
|
|
(2
|
)
|
(11
|
)
|
62
|
|
||||||
|
Transfers to Level 3
|
66
|
|
—
|
|
—
|
|
—
|
|
—
|
|
66
|
|
||||||
|
Balance at December 31, 2010
|
1,559
|
|
396
|
|
—
|
|
32
|
|
40
|
|
2,027
|
|
||||||
|
Actual return on plan assets:
|
||||||||||||||||||
|
Related to assets still held at the reporting date
|
36
|
|
20
|
|
(8
|
)
|
3
|
|
(10
|
)
|
41
|
|
||||||
|
Related to assets sold during the period
|
42
|
|
5
|
|
—
|
|
(6
|
)
|
12
|
|
53
|
|
||||||
|
Purchases and settlements, net
|
(17
|
)
|
3
|
|
440
|
|
6
|
|
(31
|
)
|
401
|
|
||||||
|
Balance at December 31, 2011
|
$
|
1,620
|
|
$
|
424
|
|
$
|
432
|
|
$
|
35
|
|
$
|
11
|
|
$
|
2,522
|
|
60
Assets Measured at Fair Value on a Nonrecurring Basis
|
Significant Unobservable Inputs (Level 3)
|
|||||||
|
(in millions)
|
December 31, 2011
|
|
December 31, 2010
|
|
Valuation Technique
|
||
|
Goodwill
(1)
|
$
|
9,794
|
|
$
|
9,794
|
|
(a)(b)(c)
|
|
Indefinite-lived intangible assets
(1)
(see Note 5)
|
4,375
|
|
4,303
|
|
(a)(c)
|
||
|
(1)
|
See Note 1, “Goodwill and Other Intangible Assets”, for a description of how these assets are tested for impairment.
|
In the September 2010 quarter, we recorded a
$146 million
impairment charge primarily related to our decision to substantially reduce Comair's fleet over the two years ending December 31, 2012 by retiring older, less-efficient CRJ-100/200 50-seat aircraft. In evaluating these aircraft for impairment, we estimated their fair value by utilizing a market approach considering (1) published market data generally accepted in the airline industry, (2) recent market transactions, where available, (3) the current and projected supply of and demand for these aircraft and (4) the condition and age of the aircraft. Based on our fair value assessments, these aircraft had an estimated fair value of
$97 million
and are classified in Level 3 of the three-tier fair value hierarchy.
NOTE 3. DERIVATIVES
Our results of operations are impacted by changes in aircraft fuel prices, interest rates and foreign currency exchange rates.
In an effort to manage our exposure to these risks, we enter into derivative contracts and may adjust our derivative portfolio as market conditions change.
Aircraft Fuel Price Risk
Our results of operations are materially impacted by changes in aircraft fuel prices.
We actively manage our fuel price risk through a hedging program intended to provide an offset against increases in jet fuel prices.
This fuel hedging program utilizes several different contract and commodity types, which are used together to create a risk mitigating hedge portfolio.
The economic effectiveness of this hedge portfolio is frequently tested against our financial targets.
The hedge portfolio is rebalanced from time to time according to market conditions, which may result in locking in gains or losses on hedge contracts prior to their settlement dates
.
Effective June 2011, we stopped designating new fuel derivative contracts as accounting hedges and discontinued hedge accounting for our then existing fuel derivative contracts that previously had been designated as accounting hedges. As a result, we record market adjustments for changes in fair value to earnings in aircraft fuel and related taxes. Prior to this change in accounting designation, gains or losses on these contracts were deferred in accumulated other comprehensive loss until contract settlement.
The following table shows the impact of fuel hedge gains (losses) for both designated and undesignated contracts on aircraft fuel and related taxes on our Consolidated Statements of Operations:
|
Year Ended December 31,
|
|||||||||
|
(in millions)
|
2011
|
2010
|
2009
|
||||||
|
Effective portion reclassified from accumulated other comprehensive loss to earnings
|
$
|
233
|
|
$
|
(87
|
)
|
$
|
(1,344
|
)
|
|
Market adjustments for changes in fair value
|
187
|
|
(2
|
)
|
(15
|
)
|
|||
|
Gain (loss) recorded in aircraft fuel and related taxes
|
$
|
420
|
|
$
|
(89
|
)
|
$
|
(1,359
|
)
|
Interest Rate Risk
Our exposure to market risk from adverse changes in interest rates is primarily associated with our long-term debt obligations. Market risk associated with our fixed and variable rate long-term debt relates to the potential reduction in fair value and negative impact to future earnings, respectively, from an increase in interest rates.
In an effort to manage our exposure to the risk associated with our variable rate long-term debt, we periodically enter into derivative contracts comprised of interest rate swaps and call option agreements. We designate our interest rate contracts used to convert our interest rate exposure on a portion of our debt portfolio from a floating rate to a fixed rate as cash flow hedges, while those contracts converting our interest rate exposure from a fixed rate to a floating rate are designated as fair value hedges.
61
We also have exposure to market risk from adverse changes in interest rates associated with our cash and cash equivalents and benefit plan obligations. Market risk associated with our cash and cash equivalents relates to the potential decline in interest income from a decrease in interest rates. Pension, postretirement, postemployment, and worker's compensation obligation risk relates to the potential increase in our future obligations and expenses from a decrease in interest rates used to discount these obligations.
Foreign Currency Exchange Rate Risk
We are subject to foreign currency exchange rate risk because we have revenue and expense denominated in foreign currencies with our primary exposures being the Japanese yen and Canadian dollar. To manage exchange rate risk, we execute both our international revenue and expense transactions in the same foreign currency to the extent practicable.
From time to time, we may also enter into foreign currency option and forward contracts.
These foreign currency exchange contracts are designated as cash flow hedges.
Hedge Position
The following tables reflect the fair value asset (liability) positions, notional balances and maturity dates of our hedge contracts:
As of December 31, 2011:
|
(in millions)
|
Notional Balance
|
Final Maturity Date
|
Prepaid Expenses and Other Assets
|
Other Noncurrent Assets
|
Other Accrued Liabilities
|
Other Noncurrent Liabilities
|
Hedge Derivatives, net
|
|||||||||||||
|
Designated as hedges
|
||||||||||||||||||||
|
Interest rate contracts (cash flow hedges)
|
$
|
989
|
|
U.S. dollars
|
May 2019
|
$
|
—
|
|
$
|
—
|
|
$
|
(27
|
)
|
$
|
(57
|
)
|
$
|
(84
|
)
|
|
Interest rate contracts (fair value hedges)
|
$
|
500
|
|
U.S. dollars
|
August 2022
|
—
|
|
—
|
|
—
|
|
(7
|
)
|
(7
|
)
|
|||||
|
Foreign currency exchange contracts
|
126,993
|
|
Japanese yen
|
April 2014
|
7
|
|
5
|
|
(58
|
)
|
(43
|
)
|
(89
|
)
|
||||||
|
313
|
|
Canadian dollars
|
||||||||||||||||||
|
Not designated as hedges
|
||||||||||||||||||||
|
Fuel hedge contracts
|
1,225
|
|
gallons - heating oil, crude oil, and jet fuel
|
December 2012
|
570
|
|
—
|
|
(500
|
)
|
—
|
|
70
|
|
||||||
|
Total derivative contracts
|
$
|
577
|
|
$
|
5
|
|
$
|
(585
|
)
|
$
|
(107
|
)
|
$
|
(110
|
)
|
|||||
As of December 31, 2010:
|
(in millions)
|
Notional Balance
|
Final Maturity Date
|
Prepaid Expenses and Other Assets
|
Other Noncurrent Assets
|
Other Accrued Liabilities
|
Other Noncurrent Liabilities
|
Hedge Derivatives, net
|
|||||||||||||
|
Designated as hedges
|
||||||||||||||||||||
|
Fuel hedge contracts
|
1,500
|
|
gallons - crude oil
|
February 2012
|
$
|
328
|
|
$
|
24
|
|
$
|
—
|
|
$
|
—
|
|
$
|
352
|
|
|
|
Interest rate contracts (cash flow hedges)
|
$
|
1,143
|
|
U.S. dollars
|
May 2019
|
—
|
|
—
|
|
(35
|
)
|
(39
|
)
|
(74
|
)
|
|||||
|
Foreign currency exchange contracts
|
141,100
|
|
Japanese yen
|
November 2013
|
—
|
|
—
|
|
(60
|
)
|
(36
|
)
|
(96
|
)
|
||||||
|
233
|
|
Canadian dollars
|
||||||||||||||||||
|
Not designated as hedges
|
||||||||||||||||||||
|
Fuel hedge contracts
|
192
|
|
gallons - crude oil and crude oil products
|
June 2012
|
27
|
|
14
|
|
(19
|
)
|
(8
|
)
|
14
|
|
||||||
|
Total derivative contracts
|
$
|
355
|
|
$
|
38
|
|
$
|
(114
|
)
|
$
|
(83
|
)
|
$
|
196
|
|
|||||
62
Hedge Gains (Losses)
Gains (losses) related to our designated hedge contracts, including those previously designated as accounting hedges, are as follows:
|
Effective Portion Reclassified from Accumulated Other Comprehensive Loss to Earnings
|
Effective Portion Recognized in Other Comprehensive Income (Loss)
|
||||||||||||||||||
|
Year Ended December 31,
|
|||||||||||||||||||
|
(in millions)
|
2011
|
2010
|
2009
|
2011
|
2010
|
2009
|
|||||||||||||
|
Fuel hedge contracts
|
$
|
233
|
|
$
|
(87
|
)
|
$
|
(1,344
|
)
|
$
|
(166
|
)
|
$
|
153
|
|
$
|
1,268
|
|
|
|
Interest rate contracts
|
—
|
|
(5
|
)
|
—
|
|
(8
|
)
|
(28
|
)
|
51
|
|
|||||||
|
Foreign currency exchange contracts
|
(61
|
)
|
(31
|
)
|
(6
|
)
|
7
|
|
(73
|
)
|
11
|
|
|||||||
|
Total designated
|
$
|
172
|
|
$
|
(123
|
)
|
$
|
(1,350
|
)
|
$
|
(167
|
)
|
$
|
52
|
|
$
|
1,330
|
|
|
As of
December 31, 2011
, we recorded in accumulated other comprehensive loss
$36 million
of net losses on our hedge contracts scheduled to settle in the next 12 months.
Credit Risk
To manage credit risk associated with our aircraft fuel price, interest rate and foreign currency hedging programs, we select counterparties based on their credit ratings and limit our exposure to any one counterparty. We monitor our relative market position with each counterparty.
Our hedge contracts contain margin funding requirements, which are driven by changes in the price of the underlying hedged items and the contracts used.
The margin funding requirements may cause us to post margin to counterparties or may cause counterparties to post margin to us as market prices in the underlying hedged items change.
Due to the fair value position of our hedge contracts, we paid
$30 million
and received
$119 million
of net hedge margin from counterparties as of December 31, 2011 and 2010, respectively.
Our accounts receivable are generated largely from the sale of passenger airline tickets and cargo transportation services. The majority of these sales are processed through major credit card companies, resulting in accounts receivable that may be subject to certain holdbacks by the credit card processors. We also have receivables from the sale of mileage credits under our SkyMiles Program to participating airlines and non-airline businesses such as credit card companies, hotels, and car rental agencies. The credit risk associated with our receivables is minimal.
Self-Insurance Risk
We self-insure a portion of our losses from claims related to workers' compensation, environmental issues, property damage, medical insurance for employees and general liability. Losses are accrued based on an estimate of the ultimate aggregate liability for claims incurred, using independent actuarial reviews based on standard industry practices and our historical experience. A portion of our projected workers' compensation liability is secured with restricted cash collateral.
NOTE 4. JFK REDEVELOPMENT
During 2010, we began a redevelopment project at John F. Kennedy International Airport (“JFK”). At JFK, we currently operate domestic flights primarily at Terminal 2 and international flights at Terminal 3 under leases with the Port Authority of New York and New Jersey (“Port Authority”), which operates JFK. We also conduct flights from Terminal 4, which is operated by JFK International Air Terminal LLC (“IAT”), a private party, under its lease with the Port Authority.
63
We estimate the redevelopment project, which will be completed in stages over
five
years, will cost approximately
$1.2 billion
. The project currently includes the (1) enhancement and expansion of Terminal 4, including the construction of nine new international gates; (2) construction of a passenger connector between Terminal 2 and Terminal 4; (3) demolition of the outdated Terminal 3, which was constructed in 1960; and (4) development of the Terminal 3 site for aircraft parking positions. Construction at Terminal 4 has commenced and is scheduled to be completed in 2013. Upon completion of the Terminal 4 expansion, we will relocate our operations from Terminal 3 to Terminal 4, proceed with with the demolition of Terminal 3, and thereafter conduct coordinated flight operations from Terminals 2 and 4. Once our project is complete, we expect that passengers will benefit from an enhanced customer experience and improved operational performance, including reduced taxi times and better on-time performance.
In December 2010, the Port Authority issued approximately
$800 million
principal amount of special project bonds to fund the substantial majority of the project. Also in December 2010, we entered into a
33
year agreement with IAT (“Sublease”) to sublease space in Terminal 4. IAT is unconditionally obligated under its lease with the Port Authority to pay rentals from the revenues it receives from its operation and management of Terminal 4, including among others our rental payments under the Sublease, in an amount sufficient to pay principal and interest on the bonds. We do not guarantee payment of the bonds. The balance of the project costs will be provided by Port Authority passenger facility charges, Transportation Security Administration funding, and our contributions. Our future rental payments will vary based on our share of total passenger and baggage counts at Terminal 4, the number of gates we occupy in Terminal 4, IAT's actual expenses of operating Terminal 4 and other factors.
We will be responsible for the management and construction of the project and bear construction risk, including cost overruns. We record an asset for project costs as construction takes place regardless of funding source. These costs include design fees, labor, and construction permits, as well as physical construction costs such as paving, systems, utilities, and other costs generally associated with construction projects. The project will also include capitalized interest based on amounts we spend calculated based on our weighted average incremental borrowing rate. The related construction obligation is recorded as a non-current liability and is equal to project costs funded by parties other than us. Future rental payments will reduce the construction obligation and result in the recording of interest expense, calculated using the effective interest method. During the construction period, we will also incur costs for construction site ground rental expense and any remediation and abatement activities, all of which will be expensed as incurred. As of December 31, 2011, we have recorded
$234 million
as a fixed asset as if we owned the asset and
$170 million
as the related construction obligation.
We have an equity-method investment in the entity which owns IAT, our sublessor at Terminal 4. The Sublease requires us to pay certain fixed management fees. We determined the investment is a variable interest and assessed whether we have a controlling financial interest in IAT. Our rights under the Sublease with respect to management of Terminal 4 are consistent with rights granted to an anchor tenant under a standard airport lease. Accordingly, we do not consolidate the entity in which we have an investment in our Consolidated Financial Statements.
NOTE 5. INTANGIBLE ASSETS
Indefinite-Lived Intangible Assets
|
Carrying Amount at December 31,
|
||||||
|
(in millions)
|
2011
|
2010
|
||||
|
International routes and slots
|
$
|
2,240
|
|
$
|
2,290
|
|
|
Delta tradename
|
850
|
|
850
|
|
||
|
SkyTeam
|
661
|
|
661
|
|
||
|
Domestic slots
|
624
|
|
502
|
|
||
|
Total
|
$
|
4,375
|
|
$
|
4,303
|
|
International Routes and Slots.
In evaluating these assets for impairment, we estimated their fair value by utilizing an excess earnings method, which is an income approach. In the December 2011 quarter, we reduced flight frequencies between the U.S. and Moscow. Based primarily on our recent expectations regarding the use of our Moscow routes and slots, the carrying value of these routes and slots exceeded the estimated fair value. As a result of this decision, we recorded a
$50 million
impairment charge in restructuring and other items on our Consolidated Statement of Operations related to our international routes and slots. As of December 31, 2011, our remaining international routes and slots relate to our Japanese routes and slots.
64
In October 2010, the U.S. and Japan signed a bilateral agreement, which allows U.S. air carriers unlimited flying to and from Japan under route authorities granted by the U.S. Department of Transportation. Access to the primary Japanese airports (Haneda and Narita airports in Tokyo) continues to be regulated through allocations of slots, which limit the rights of carriers to operate at these airports. The U.S. and Japan have agreed on plans for a limited number of additional slots at these airports. The substantial number of slots we hold at Tokyo Narita Airport, combined with limited-entry rights we hold in other countries, enables us to operate a hub at Tokyo serving the Asia-Pacific region.
We currently believe that the current U.S.-Japan bilateral agreement and the March 2011 earthquake and tsunami will not have a significant long-term impact on our Pacific routes and slots; therefore, these assets continue to have an indefinite life and are not presently impaired. Negative changes to our operations could result in an impairment charge or a change from indefinite-lived to definite-lived in the period in which the changes occur or are projected to occur.
Domestic Slots.
During December 2011, we closed the transactions contemplated under an agreement with US Airways including the exchange of takeoff and landing rights at LaGuardia Airport ("LaGuardia") and Reagan National airports. Under the agreement, (1) Delta acquired
132
slot pairs at LaGuardia from US Airways, (2) US Airways acquired from Delta
42
slot pairs at Reagan National; the rights to operate additional daily service to São Paulo, Brazil in 2015; and
$66.5 million
in cash. Additionally, Delta divested
16
slot pairs at LaGuardia and
eight
slot pairs at Reagan National to airlines with limited or no service at those airports and received
$90 million
in cash proceeds from the sale of the divested slot pairs. The divestiture of these slot pairs resulted in the recognition of a
$43 million
gain during the December 2011 quarter in restructuring and other items on our Consolidated Statement of Operations.
As of December 31, 2011, the
132
slot pairs acquired at LaGuardia were recorded at fair value. We estimated their fair value using a combination of limited market transactions and the lease savings method, which is an income approach. These assets are classified in Level 3 of the fair value hierarchy. The carrying value related to the
42
slot pairs at Reagan National acquired by US Airways was removed from our indefinite-lived intangible assets. In approving the transaction, the Department of Transportation restricted our use of the exchanged slots through July 2012. We recorded a deferred gain that will be recognized in 2012 as these restrictions lapse.
Definite-Lived Intangible Assets
|
December 31, 2011
|
December 31, 2010
|
||||||||||||
|
(in millions)
|
Gross
Carrying
Amount
|
Accumulated
Amortization
|
Gross
Carrying
Amount
|
Accumulated
Amortization
|
|||||||||
|
Marketing agreements
|
$
|
730
|
|
$
|
(486
|
)
|
$
|
730
|
|
$
|
(428
|
)
|
|
|
Contracts
|
193
|
|
(61
|
)
|
193
|
|
(49
|
)
|
|||||
|
Other
|
53
|
|
(53
|
)
|
53
|
|
(53
|
)
|
|||||
|
Total
|
$
|
976
|
|
$
|
(600
|
)
|
$
|
976
|
|
$
|
(530
|
)
|
|
Total amortization expense for the years ended
December 31, 2011
,
2010
and
2009
was
$70 million
,
$79 million
and
$97 million
, respectively. The following table summarizes the estimated aggregate amortization expense for each of the five succeeding fiscal years:
|
Years Ending December 31,
(in millions)
|
|||
|
2012
|
$
|
69
|
|
|
2013
|
68
|
|
|
|
2014
|
67
|
|
|
|
2015
|
67
|
|
|
|
2016
|
9
|
|
|
65
NOTE 6. AMERICAN EXPRESS RELATIONSHIP
General.
Our agreements with American Express provide for joint marketing, grant certain benefits to Delta-American Express co-branded credit card holders ("Cardholders") and American Express Membership Rewards Program participants, and allow American Express to market to our customer database. Cardholders earn mileage credits for making purchases on their co-branded cards, may check their first bag for free on every Delta flight and enjoy other benefits while traveling with Delta. Additionally, participants in the American Express Membership Rewards program may exchange their points for mileage credits under the SkyMiles Program. As a result, we sell mileage credits at agreed upon rates to American Express for provision to their customers under the co-brand credit card program and the Membership Rewards program.
Advance Purchase of SkyMiles.
In 2008, we entered into a multi-year extension of our American Express agreements and received
$1.0 billion
from American Express for an advance purchase of SkyMiles (the "prepayment"). The 2008 agreement provided that our obligations with respect to the advance purchase would be satisfied as American Express uses the purchased miles over a specified future period (“SkyMiles Usage Period”), rather than by cash payments from us to American Express. Due to the SkyMiles Usage Period and other restrictions placed upon American Express regarding the timing and use of the SkyMiles, we classified the
$1.0 billion
we received, the prepayment, as long-term debt.
In 2010, we amended our 2008 American Express agreement. The amendments, among other things, (1) provide that Cardholders may check their first bag for free on every Delta flight through June 2013 ("Baggage Fee Waiver Period"), (2) changed the SkyMiles Usage Period to a three-year period beginning in the December 2011 quarter from a two-year period beginning in December 2010 quarter, and (3) gave American Express the option to extend our agreements with them for one year.
During the SkyMiles Usage Period, which commenced during the December 2011 quarter, American Express will draw down on the prepayment instead of paying cash to Delta for SkyMiles used. As of December 31, 2011,
$952 million
of the original
$1.0 billion
debt (or prepayment) remained, including
$333 million
which is classified in current maturities of long-term debt and capital leases. As SkyMiles are used by American Express, we recognize the two separate revenue components of these SkyMiles consistent with our accounting policy discussed in Note 1. We defer revenue related to the portion of the mileage credits redeemable for future travel and recognize it as passenger revenue when miles are redeemed and services are provided. The value of the marketing component is determined under the residual method and recognized as other revenue as related marketing services are provided.
Annual Sale of SkyMiles.
In December 2011, we further amended our American Express agreements and sold American Express
$675 million
of SkyMiles. Under the December 2011 amendment, we anticipate American Express will make additional purchases of
$675 million
of SkyMiles in each of 2012, 2013, and 2014. The December 2011 amendment also extends the Baggage Fee Waiver Period. The SkyMiles purchased pursuant to the December 2011 amendment may be used immediately by American Express. The usage of these SkyMiles is not restricted in any way. These annual purchases of SkyMiles will be recorded as deferred revenue within current liabilities. The portion of each purchase of SkyMiles related to mileage credits redeemable for future travel will be classified within frequent flyer deferred revenue and the portion related to the marketing component will be classified within other accrued liabilities.
The December 2011 amendment does not change the number of miles that we expect American Express to purchase from us over the next four years. It only impacts the timing of those purchases. The December 2011 amendment did not make any significant changes to the deliverables (the mileage credits sold and the marketing component). Therefore, it is not a material modification of the American Express agreements under the accounting guidance. A future material modification of the American Express agreements could impact our deferral rate or cause an adjustment to our deferred revenue balance, which could materially impact our future financial results. For additional information, see "Frequent Flyer Program" in Note 1.
Fuel Card Obligation
. In December 2011, we also obtained a purchasing card with American Express for the purpose of buying jet fuel. The card currently carries a maximum credit limit of
$612 million
and must be paid monthly. As of December 31, 2011, we had
$318 million
outstanding on this purchasing card, which was classified as other accrued liabilities.
66
NOTE 7. LONG-TERM DEBT
The following table summarizes our long-term debt:
|
Interest Rate(s) per Annum
|
December 31,
|
|||||||
|
(in millions)
|
at December 31, 2011
|
2011
|
2010
|
|||||
|
Senior Secured Credit Facilities:
|
||||||||
|
Term Loan Facility, due 2017
|
5.50%
|
variable
(1)
|
$
|
1,368
|
|
$
|
—
|
|
|
Revolving Credit Facility, due 2016
|
undrawn
|
variable
(1)
|
—
|
|
—
|
|
||
|
Senior Secured Exit Financing Facilities, due 2012 and 2014
|
n/a
|
—
|
|
1,450
|
|
|||
|
Senior Secured Pacific Facilities:
|
||||||||
|
Pacific Routes Term Facility, due 2016
|
4.25%
|
variable
(1)
|
248
|
|
247
|
|
||
|
Pacific Routes Revolving Facility, due 2013
|
undrawn
|
variable
(1)
|
—
|
|
—
|
|
||
|
Senior Secured Notes, due 2014
|
9.50%
|
fixed
|
600
|
|
675
|
|
||
|
Senior Second Lien Notes, due 2015
|
12.25%
|
fixed
|
306
|
|
397
|
|
||
|
Bank Revolving Credit Facilities, due 2012
|
undrawn
|
variable
(1)
|
—
|
|
—
|
|
||
|
Other Secured Financing Arrangements:
|
||||||||
|
Certificates, due in installments from 2012 to 2023
|
0.92% to 9.75%
|
4,677
|
|
5,310
|
|
|||
|
Aircraft financings, due in installments from 2012 to 2025
(2)
|
0.86% to 6.76%
|
4,570
|
|
5,170
|
|
|||
|
Other secured financings, due in installments from 2012 to 2031
(3)
|
2.25% to 6.12%
|
721
|
|
810
|
|
|||
|
Total secured debt
|
12,490
|
|
14,059
|
|
||||
|
American Express - Advance Purchase of SkyMiles
(4)
|
952
|
|
1,000
|
|
||||
|
Other unsecured debt, due in installments from 2012 to 2035
|
3.00% to 9.07%
|
355
|
|
383
|
|
|||
|
Total unsecured debt
|
1,307
|
|
1,383
|
|
||||
|
Total secured and unsecured debt
|
13,797
|
|
15,442
|
|
||||
|
Unamortized discount, net
|
(737
|
)
|
(935
|
)
|
||||
|
Total debt
|
13,060
|
|
14,507
|
|
||||
|
Less: current maturities
|
(1,827
|
)
|
(1,954
|
)
|
||||
|
Total long-term debt
|
$
|
11,233
|
|
$
|
12,553
|
|
||
|
(1)
|
Interest rate equal to LIBOR (subject to a floor) or another index rate, in each case plus a specified margin.
|
|
(2)
|
Secured by an aggregate of
269 aircraft
.
|
|
(3)
|
Primarily includes manufacturer term loans secured by spare parts, spare engines and aircraft, and real estate loans.
|
|
(4)
|
For additional information about our debt associated with American Express, see Note 6.
|
Senior Secured Credit Facilities
In 2011, we entered into senior secured first-lien credit facilities (the “Senior Secured Credit Facilities”) to borrow up to
$2.6 billion
. The Senior Secured Credit Facilities consist of a
$1.4 billion
first-lien term loan facility (the “Term Loan Facility”) and a
$1.2 billion
first-lien revolving credit facility, up to
$500 million
of which may be used for the issuance of letters of credit (the “Revolving Credit Facility”).
Borrowings under the Term Loan Facility must be repaid annually in an amount equal to
1%
of the original principal amount (to be paid in equal
quarterly
installments), with the balance due in
April 2017
. Borrowings under the Revolving Credit Facility are due in
April 2016
. At
December 31, 2011
, the Revolving Credit Facility was undrawn.
Our obligations under the Senior Secured Credit Facilities are guaranteed by substantially all of our domestic subsidiaries (the “Guarantors”). The Senior Secured Credit Facilities and the related guarantees are secured by liens on certain of our and the Guarantors' assets, including accounts receivable, inventory, flight equipment, ground property and equipment, certain non-Pacific international routes, domestic slots, real estate and certain investments (the “Collateral”).
67
The Senior Secured Credit Facilities contain events of default customary for similar financings, including cross-defaults to other material indebtedness and certain change of control events. The Senior Secured Credit Facilities also include events of default specific to our business, including the suspension of all or substantially all of our flights and operations for more than five consecutive days (other than as a result of a Federal Aviation Administration suspension due to extraordinary events similarly affecting other major U.S. air carriers). Upon the occurrence of an event of default, the outstanding obligations may be accelerated and become due and payable immediately. For a discussion of related financial covenants, see "Key Financial Covenants" below.
Senior Secured Exit Financing Facilities
In connection with entering into the Senior Secured Credit Facilities, we retired the outstanding loans under our
$2.5 billion
senior secured exit financing facilities and terminated those facilities as well as an existing undrawn
$100 million
revolving credit facility. These retired senior secured exit financing facilities consisted of:
|
•
|
$914 million
first-lien revolving credit facility and an
$86 million
first-lien term loan due
April 2012
;
|
|
•
|
$600 million
first-lien synthetic revolving facility due
April 2012
; and
|
|
•
|
$900 million
second-lien term loan facility due
April 2014
.
|
Senior Secured Pacific Facilities
In 2009, we entered into a first-lien term loan facility in the aggregate principal amount of
$250 million
(the “Pacific Routes Term Facility”) and a first-lien revolving credit facility in the aggregate principal amount of
$500 million
(the “Pacific Routes Revolving Facility”), collectively the “Senior Secured Pacific Facilities.” The Senior Secured Pacific Facilities are guaranteed by the Guarantors and are secured by a first lien on our Pacific route authorities and certain related assets (the “Pacific Collateral”). Lenders under the Senior Secured Pacific Facilities and holders of the Senior Secured Notes (described below) have equal rights to payment and the Pacific Collateral.
During 2011, we refinanced and amended the Pacific Routes Term Facility to, among other things, (1) reduce the interest rate, (2) extend the maturity date from
September 2013
to
March 2016
and (3) modify certain negative covenants and default provisions to be substantially similar to those described above under “Senior Secured Credit Facilities.”
Borrowings under the Pacific Routes Term Facility must be repaid in an amount equal to
1%
of the original principal amount of the term loans annually (to be paid in equal quarterly installments), with the balance due in
March 2016
. Borrowings under the Pacific Routes Revolving Facility are due in
March 2013
and can be repaid and reborrowed without penalty. As of
December 31, 2011
, the Pacific Routes Revolving Facility was undrawn.
The Senior Secured Pacific Facilities contain mandatory prepayment provisions that require us in certain instances to prepay obligations under the Senior Secured Pacific Facilities in connection with dispositions of collateral. For a discussion of related financial covenants, see "Key Financial Covenants" below.
Senior Secured Notes
In 2009, we issued
$750 million
principal amount of Senior Secured Notes that mature in
September 2014
. We may redeem some or all of these notes at specified redemption prices. If we sell certain of our assets or if we experience specific kinds of changes in control, we must offer to repurchase the Senior Secured Notes. During 2011, we voluntarily redeemed
$75 million
principal amount of Senior Secured Notes. We also voluntarily redeemed
$75 million
principal amount of Senior Secured Notes in 2010.
The Senior Secured Notes are guaranteed by the Guarantors and are secured by the Pacific Collateral. Holders of the Senior Secured Notes and lenders under the Senior Secured Pacific Facilities (discussed above) have equal rights to payment and collateral.
The Senior Secured Notes contain events of default customary for similar financings, including cross-defaults to other material indebtedness. Upon the occurrence of an event of default, the outstanding obligations may be accelerated and become due and payable immediately. For a discussion of related financial covenants, see "Key Financial Covenants" below.
68
Senior Second Lien Notes
In conjunction with the issuance of the Senior Secured Notes, we issued
$600 million
principal amount of Senior Second Lien Notes that mature in
March 2015
. We may redeem some or all of the Senior Second Lien Notes on or after March 15, 2012 at specified redemption prices. If we sell certain of our assets or if we experience specific kinds of changes in control, we must offer to repurchase the Senior Second Lien Notes. During 2010, we repurchased in a cash tender offer
$171 million
principal amount of Senior Second Lien Notes.
Our obligations under the Senior Second Lien Notes are guaranteed by the Guarantors, and our obligations and the related guarantees are secured on a junior basis by security interests in the Pacific Collateral. The Senior Second Lien Notes include default provisions that are substantially similar to the ones described under “Senior Secured Notes due 2014” above. For a discussion of related financial covenants, see "Key Financial Covenants" below.
Key Financial Covenants
Our secured debt instruments discussed above include affirmative, negative and financial covenants that restrict our ability to, among other things, make investments, sell or otherwise dispose of collateral if we are not in compliance with the collateral coverage ratio tests described below, pay dividends or repurchase stock.
We were in compliance with all covenants in our financing agreements at December 31, 2011
. The financial covenants require us to maintain the minimum levels shown in the table below:
|
Senior Secured Credit Facilities
|
Senior Secured Pacific Facilities
|
Senior Secured Notes
|
Senior Second Lien Notes
|
|
|
Minimum Fixed Charge Coverage Ratio
(1)
|
1.20:1
|
1.20:1
|
n/a
|
n/a
|
|
Minimum Unrestricted Liquidity
|
||||
|
Unrestricted cash and permitted investments
|
$1.0 billion
|
n/a
|
n/a
|
n/a
|
|
Unrestricted cash, permitted investments, and undrawn revolving credit facilities
|
$2.0 billion
|
$2.0 billion
|
n/a
|
n/a
|
|
Minimum Collateral Coverage Ratio
(2)
|
1.67:1
(3)
|
1.60:1
|
1.60:1
|
1.00:1
|
|
(1)
|
Defined as the ratio of (a) earnings before interest, taxes, depreciation, amortization and aircraft rent, and other adjustments to net income to (b) the sum of gross cash interest expense (including the interest portion of our capitalized lease obligations) and cash aircraft rent expense, for the 12-month period ending as of the last day of each fiscal quarter.
|
|
(2)
|
Defined as the ratio of (a) certain of the collateral that meets specified eligibility standards to (b) the sum of the aggregate outstanding obligations and certain other obligations.
|
|
(3)
|
Excluding the non-Pacific international routes from the collateral for purposes of the calculation, the required minimum collateral coverage ratio is 0.75:1
|
Minimum Collateral Coverage Ratio.
Under the Senior Secured Credit Facilities and the Senior Secured Pacific Facilities, if the collateral coverage ratios are not maintained, we must either provide additional collateral to secure our obligations, or we must repay the loans under the facilities by an amount necessary to maintain compliance with the collateral coverage ratios. Under the Senior Secured Notes and Senior Second Lien Notes, if the collateral coverage ratios are not maintained, we must generally pay additional interest on the notes at the rate of
2%
per annum until the collateral coverage ratio equals at least the minimum. The value of the collateral that has been pledged in each facility may change over time, which may be reflected in appraisals of collateral required by our credit agreements and indentures. These changes could result from factors that are not under our control. A decline in the value of collateral could result in a situation where we may not be able to maintain the collateral coverage ratio.
Availability Under Revolving Credit Facilities
The table below shows our availability under revolving credit facilities as of
December 31, 2011
:
|
(in millions)
|
December 31,
2011 |
||
|
Revolving Credit Facility, due 2016
|
$
|
1,225
|
|
|
Pacific Routes Revolving Facility, due 2013
|
500
|
|
|
|
Bank Revolving Credit Facility, due 2012
|
100
|
|
|
|
Total availability under revolving credit facilities
|
$
|
1,825
|
|
69
Other Secured Financing Arrangements
During 2011, we retired
$502 million
of existing debt under our other secured financing arrangements prior to scheduled maturity. During 2010, we (1) repurchased in cash tender offers
$129 million
of Pass-Through Trust Certificates, (2) achieved
$160 million
of debt relief through vendor negotiations and (3) prepaid or repurchased
$403 million
of other existing debt.
In 2010, we also restructured
$820 million
of existing debt, including changes in applicable interest rates and other payment terms. To account for debt restructurings, we compare the net present value of future cash flows for each new debt instrument to the remaining cash flows of the existing debt. If there is at least a
10%
change in cash flows, we treat the restructuring as a debt extinguishment. We record losses on extinguishment of debt for the difference between the fair value of the new debt and the carrying value of the existing debt. The carrying value of the existing debt includes any unamortized discounts or premiums, unamortized issuance costs, and any premiums paid to retire the existing debt.
Certificates.
Pass-Through Trust Certificates and Enhanced Equipment Trust Certificates (“EETC”) (collectively, the “Certificates”) are secured by
262 aircraft
. During the three years ended December 31, 2011, we received proceeds from offerings of EETC as shown in the table below.
|
(In millions, unless otherwise stated)
|
Proceeds Received
|
Fixed Interest Rate
|
Offering Completion Date
|
Final Maturity Date
|
Collateral
|
|||||||||||||
|
2011
|
2010
|
2009
|
Total Principal
|
|||||||||||||||
|
2011-1A
|
$
|
293
|
|
$
|
—
|
|
$
|
—
|
|
$
|
293
|
|
5.300%
|
April 2011
|
April 2019
|
26 aircraft
|
||
|
2011-1B
|
102
|
|
—
|
|
—
|
|
102
|
|
7.125%
|
August 2011
|
October 2014
|
26 aircraft
|
(1)
|
|||||
|
2010-2A
|
204
|
|
270
|
|
—
|
|
474
|
|
4.950%
|
November 2010
|
May 2019
|
28 aircraft
|
||||||
|
2010-2B
|
135
|
|
—
|
|
—
|
|
135
|
|
6.750%
|
February 2011
|
November 2015
|
28 aircraft
|
(1)
|
|||||
|
2010-1A
|
—
|
|
450
|
|
—
|
|
450
|
|
6.200%
|
July 2010
|
July 2018
|
24 aircraft
|
||||||
|
2010-1B
|
100
|
|
—
|
|
—
|
|
100
|
|
6.375%
|
February 2011
|
January 2016
|
24 aircraft
|
(1)
|
|||||
|
2009-1A
|
—
|
|
288
|
|
281
|
|
569
|
|
7.750%
|
November 2009
|
December 2019
|
27 aircraft
|
||||||
|
2009-1B
|
—
|
|
59
|
|
61
|
|
120
|
|
9.750%
|
November 2009
|
December 2016
|
27 aircraft
|
(1)
|
|||||
|
Total
|
$
|
834
|
|
$
|
1,067
|
|
$
|
342
|
|
$
|
2,243
|
|
||||||
|
(1)
|
Each of the B tranches are secured by the same aircraft that secure related A tranches.
|
As of December 31, 2010,
$204 million
held in escrow under the 2010-2A EETC was not recorded on the balance sheet as we had no right to these funds until the equipment notes securing the certificates were issued. We assessed whether the pass through trusts were variable interest entities required to be consolidated. Because our only obligation with respect to the trusts is to make interest and principal payments on the equipment notes held by the trusts and because we have no current rights to the escrowed funds, we concluded we do not have a variable interest in the related trusts. Accordingly, we did not consolidate them. As of
December 31, 2011
,
no
amounts remained in escrow.
Unamortized Discount, Net
Our unamortized discount, net results from fair value adjustments recorded in 2008 to reduce the carrying value of our long-term debt due to purchase accounting and an advance purchase of SkyMiles by American Express (see Note 6). As described in the table below, we amortize these adjustments over the remaining maturities of the respective debt to amortization of debt discount, net on our Consolidated Statements of Operations. During the years ended December 31, 2011, 2010 and 2009, we recorded
$68 million
,
$391 million
and
$83 million
in losses, respectively, from the early extinguishment of debt, which primarily related to the write-off of debt discounts.
70
Future Maturities
The following table summarizes scheduled maturities of our debt, including current maturities, at December 31, 2011:
|
Years Ending December 31,
(in millions)
|
Total Secured and Unsecured Debt
|
Amortization of Debt Discount, net
|
|||||||
|
2012
|
$
|
1,925
|
|
$
|
(199
|
)
|
|||
|
2013
|
1,558
|
|
(157
|
)
|
|||||
|
2014
|
2,286
|
|
(104
|
)
|
|||||
|
2015
|
1,347
|
|
(75
|
)
|
|||||
|
2016
|
1,240
|
|
(66
|
)
|
|||||
|
Thereafter
|
5,441
|
|
(136
|
)
|
|||||
|
Total
|
$
|
13,797
|
|
$
|
(737
|
)
|
$
|
13,060
|
|
Fair Value of Debt
Market risk associated with our fixed and variable rate long-term debt relates to the potential reduction in fair value and negative impact to future earnings, respectively, from an increase in interest rates. In the table below, the aggregate fair value of debt was based primarily on reported market values, recently completed market transactions and estimates based on interest rates, maturities, credit risk and underlying collateral:
|
December 31,
|
||||||
|
(in millions)
|
2011
|
2010
|
||||
|
Total debt at par value
|
$
|
13,797
|
|
$
|
15,442
|
|
|
Unamortized discount, net
|
(737
|
)
|
(935
|
)
|
||
|
Net carrying amount
|
$
|
13,060
|
|
$
|
14,507
|
|
|
Fair value
|
$
|
13,600
|
|
$
|
15,400
|
|
NOTE 8. LEASE OBLIGATIONS
We lease aircraft, airport terminals, maintenance facilities, ticket offices and other property and equipment from third parties. Rental expense for operating leases, which is recorded on a straight-line basis over the life of the lease term, totaled
$1.1 billion
,
$1.2 billion
and
$1.3 billion
for the years ended
December 31, 2011
,
2010
and
2009
, respectively. Amounts due under capital leases are recorded as liabilities, while assets acquired under capital leases are recorded as property and equipment. Amortization of assets recorded under capital leases is included in depreciation and amortization expense. Many of our aircraft, facility, and equipment leases include rental escalation clauses and/or renewal options. Our leases do not include residual value guarantees and we are not the primary beneficiary in or have other forms of variable interest with the lessor of the leased assets. As a result, we have not consolidated any of the entities that lease to us.
71
The following tables summarize, as of
December 31, 2011
, our minimum rental commitments under capital leases and noncancelable operating leases (including certain aircraft under Contract Carrier agreements) with initial or remaining terms in excess of one year:
Capital Leases
|
Years Ending December 31,
(in millions)
|
Total
|
||
|
2012
|
$
|
221
|
|
|
2013
|
196
|
|
|
|
2014
|
168
|
|
|
|
2015
|
155
|
|
|
|
2016
|
163
|
|
|
|
Thereafter
|
323
|
|
|
|
Total minimum lease payments
|
1,226
|
|
|
|
Less: amount of lease payments representing interest
|
(489
|
)
|
|
|
Present value of future minimum capital lease payments
|
737
|
|
|
|
Plus: unamortized premium, net
|
(6
|
)
|
|
|
Less: current obligations under capital leases
|
(117
|
)
|
|
|
Long-term capital lease obligations
|
$
|
614
|
|
Operating Leases
|
Years Ending December 31,
(in millions)
|
Delta Lease Payments
(1)
|
Contract Carrier Aircraft Lease Payments
(2)
|
Total
|
||||||
|
2012
|
$
|
926
|
|
$
|
536
|
|
$
|
1,462
|
|
|
2013
|
912
|
|
529
|
|
1,441
|
|
|||
|
2014
|
862
|
|
518
|
|
1,380
|
|
|||
|
2015
|
765
|
|
506
|
|
1,271
|
|
|||
|
2016
|
677
|
|
449
|
|
1,126
|
|
|||
|
Thereafter
|
6,660
|
|
928
|
|
7,588
|
|
|||
|
Total minimum lease payments
|
$
|
10,802
|
|
$
|
3,466
|
|
$
|
14,268
|
|
|
(1)
|
Includes payments accounted for as construction obligations. See Note 4.
|
|
(2)
|
Represents the minimum lease obligations under our Contract Carrier agreements with ExpressJet Airlines, Inc. (formerly Atlantic Southeast Airlines, Inc.), Chautauqua Airlines, Inc. (“Chautauqua”), Compass, Mesaba, Pinnacle, Shuttle America Corporation (“Shuttle America”) and SkyWest Airlines, Inc.
|
At
December 31, 2011
, we and our wholly-owned subsidiary Comair operated
111
aircraft under capital leases and
90
aircraft under operating leases. Our Contract Carriers under capacity purchase agreements (excluding Comair) operated
550
aircraft under operating leases.
NOTE 9. PURCHASE COMMITMENTS AND CONTINGENCIES
Aircraft Purchase Commitments
Future aircraft purchase commitments at
December 31, 2011
are estimated to total approximately
$6.8 billion
and include
100
B-737-900ER aircraft,
18
B-787-8 aircraft and
nine
previously owned MD-90 aircraft. The following table shows the timing of these commitments:
72
|
Years Ending December 31,
(in millions)
|
Total
|
||
|
2012
|
$
|
215
|
|
|
2013
|
530
|
|
|
|
2014
|
745
|
|
|
|
2015
|
760
|
|
|
|
2016
|
760
|
|
|
|
Thereafter
|
3,810
|
|
|
|
Total
|
$
|
6,820
|
|
During 2011, we entered into an agreement with The Boeing Company to purchase
100
B-737-900ER aircraft with deliveries beginning in
2013 and continuing through 2018
. We have obtained committed long-term financing for a substantial portion of the purchase price of these aircraft.
Our aircraft purchase commitments do not include orders for
five
A319-100 aircraft and
two
A320-200 aircraft because we have the right to cancel these orders.
Contract Carrier Agreements
During the year ended
December 31, 2011
, we had contract carrier agreements with
nine
contract carriers, including our wholly-owned subsidiary, Comair. Our third-party contract carrier agreements have expiration dates ranging from
2016 to 2022
.
Capacity Purchase Agreements
. During the year ended
December 31, 2011
,
seven
Contract Carriers operated for us (in addition to Comair) under capacity purchase agreements. Under these agreements, the Contract Carriers operate some or all of their aircraft using our flight designator codes, and we control the scheduling, pricing, reservations, ticketing and seat inventories of those aircraft and retain the revenues associated with those flights. We pay those airlines an amount, as defined in the applicable agreement, which is based on a determination of their cost of operating those flights and other factors intended to approximate market rates for those services.
The following table shows our minimum fixed obligations under these capacity purchase agreements (excluding Comair). The obligations set forth in the table contemplate minimum levels of flying by the Contract Carriers under the respective agreements and also reflect assumptions regarding certain costs associated with the minimum levels of flying such as the cost of fuel, labor, maintenance, insurance, catering, property tax and landing fees. Accordingly, our actual payments under these agreements could differ materially from the minimum fixed obligations set forth in the table below.
|
Years Ending December 31,
(in millions)
|
Amount
(1)
|
||
|
2012
|
$
|
2,340
|
|
|
2013
|
2,420
|
|
|
|
2014
|
2,430
|
|
|
|
2015
|
2,400
|
|
|
|
2016
|
2,100
|
|
|
|
Thereafter
|
5,700
|
|
|
|
Total
|
$
|
17,390
|
|
|
(1)
|
These amounts exclude Contract Carrier lease payments accounted for as operating leases, which are described in Note 8. The contingencies described below under “Contingencies Related to Termination of Contract Carrier Agreements” are also excluded from this table.
|
Revenue Proration Agreements
. As of
December 31, 2011
, we had a revenue proration agreement with American Eagle Airlines, Inc. In addition, a portion of our Contract Carrier agreement with SkyWest Airlines, Inc. is structured as a revenue proration agreement. These revenue proration agreements establish a fixed dollar or percentage division of revenues for tickets sold to passengers traveling on connecting flight itineraries.
73
Contingencies Related to Termination of Contract Carrier Agreements
We may terminate without cause the Chautauqua agreement at any time and the Shuttle America agreement at any time after
January 2016
by providing certain advance notice. If we terminate either the Chautauqua or Shuttle America agreements without cause, Chautauqua or Shuttle America, respectively, has the right to (1) assign to us leased aircraft that the airline operates for us, provided we are able to continue the leases on the same terms the airline had prior to the assignment and (2) require us to purchase or lease any aircraft the airline owns and operates for us at the time of the termination. If we are required to purchase aircraft owned by Chautauqua or Shuttle America, the purchase price would be equal to the amount necessary to (1) reimburse Chautauqua or Shuttle America for the equity it provided to purchase the aircraft and (2) repay in full any debt outstanding at such time that is not being assumed in connection with such purchase. If we are required to lease aircraft owned by Chautauqua or Shuttle America,
the lease would have (1) a rate equal to the debt payments of Chautauqua or Shuttle America for the debt financing of the aircraft calculated as if 90% of the aircraft was debt financed by Chautauqua or Shuttle America and (2) other specified terms and conditions
. Because these contingencies depend on our termination of the agreements without cause prior to their expiration dates, no obligation exists unless such termination occurs.
We estimate that the total fair values, determined as of
December 31, 2011
, of the aircraft Chautauqua or Shuttle America could assign to us or require that we purchase if we terminate without cause our contract carrier agreements with those airlines (the "Put Right") are approximately
$134 million
and
$536 million
, respectively. The actual amount we may be required to pay in these circumstances may be materially different from these estimates. If the Put Right is exercised, we must also pay the exercising carrier
10%
interest (compounded monthly) on the equity the carrier provided when it purchased the put aircraft. These equity amounts for Chautauqua and Shuttle America total
$25 million
and
$52 million
, respectively.
Legal Contingencies
We are involved in various legal proceedings related to employment practices, environmental issues, antitrust matters and other matters concerning our business. We record liabilities for losses from legal proceedings when we determine that it is probable that the outcome in a legal proceeding will be unfavorable and the amount of loss can be reasonably estimated. We cannot reasonably estimate the potential loss for certain legal proceedings because, for example, the litigation is in its early stages or the plaintiff does not specify the damages being sought. Although the outcome of the legal proceedings in which we are involved cannot be predicted with certainty, management believes that the resolution of these matters will not have a material adverse effect on our Consolidated Financial Statements.
Credit Card Processing Agreements
Our VISA/MasterCard and American Express credit card processing agreements provide that no cash reserve ("Reserve") is required, and no withholding of payment related to receivables collected will occur, except in certain circumstances, including when we do not maintain a required level of unrestricted cash. In circumstances in which the credit card processor can establish a Reserve or withhold payments, the amount of the Reserve or payments that may be withheld would be equal to the potential liability of the credit card processor for tickets purchased with VISA/MasterCard or American Express credit cards, as applicable, that had not yet been used for travel. There was no Reserve or amounts withheld as of
December 31, 2011
and
2010
.
Other Contingencies
General Indemnifications
We are the lessee under many commercial real estate leases. It is common in these transactions for us, as the lessee, to agree to indemnify the lessor and the lessor's related parties for tort, environmental and other liabilities that arise out of or relate to our use or occupancy of the leased premises. This type of indemnity would typically make us responsible to indemnified parties for liabilities arising out of the conduct of, among others, contractors, licensees and invitees at, or in connection with, the use or occupancy of the leased premises. This indemnity often extends to related liabilities arising from the negligence of the indemnified parties, but usually excludes any liabilities caused by either their sole or gross negligence or their willful misconduct.
Our aircraft and other equipment lease and financing agreements typically contain provisions requiring us, as the lessee or obligor, to indemnify the other parties to those agreements, including certain of those parties' related persons, against virtually any liabilities that might arise from the use or operation of the aircraft or such other equipment.
74
We believe that our insurance would cover most of our exposure to liabilities and related indemnities associated with the commercial real estate leases and aircraft and other equipment lease and financing agreements described above. While our insurance does not typically cover environmental liabilities, we have certain insurance policies in place as required by applicable environmental laws.
Certain of our aircraft and other financing transactions include provisions, which require us to make payments to preserve an expected economic return to the lenders if that economic return is diminished due to certain changes in law or regulations. In certain of these financing transactions, we also bear the risk of certain changes in tax laws that would subject payments to non-U.S. lenders to withholding taxes.
We cannot reasonably estimate our potential future payments under the indemnities and related provisions described above because we cannot predict (1) when and under what circumstances these provisions may be triggered and (2) the amount that would be payable if the provisions were triggered because the amounts would be based on facts and circumstances existing at such time.
Employees Under Collective Bargaining Agreements
At
December 31, 2011
, we had approximately
78,400
full-time equivalent employees. Approximately
16%
of these employees were represented by unions, including the following domestic employee groups.
|
Employee Group
|
Approximate Number of Active Employees Represented
|
Union
|
Date on which Collective Bargaining Agreement Becomes Amendable
|
|
|
Delta Pilots
|
10,850
|
|
ALPA
|
December 31, 2012
|
|
Delta Flight Superintendents (Dispatchers)
|
340
|
|
PAFCA
|
December 31, 2013
|
|
Comair Pilots
|
790
|
|
ALPA
|
March 2, 2011
|
|
Comair Maintenance Employees
|
280
|
|
IAM
|
December 31, 2010
|
|
Comair Flight Attendants
|
550
|
|
IBT
|
December 31, 2010
|
All of our agreements with workgroups at our airline subsidiary, Comair, are currently amendable. Comair is in discussions with representatives of the respective unions and we cannot predict the outcome of those discussions.
Labor unions periodically engage in organizing efforts to represent various groups of our employees, including at our airline subsidiary, that are not represented for collective bargaining purposes.
War-Risk Insurance Contingency
As a result of the terrorist attacks on September 11, 2001, aviation insurers significantly (1) reduced the maximum amount of insurance coverage available to commercial air carriers for liability to persons (other than employees or passengers) for claims resulting from acts of terrorism, war or similar events and (2) increased the premiums for such coverage and for aviation insurance in general.
Since September 24, 2001, the U.S. government has been providing U.S. airlines with war-risk insurance to cover losses, including those resulting from terrorism, to passengers, third parties (ground damage) and the aircraft hull.
The coverage currently extends through
September 30, 2012
,
and we expect the coverage to be further extended.
The withdrawal of government support of airline war-risk insurance would require us to obtain war-risk insurance coverage commercially, if available. Such commercial insurance could have substantially less desirable coverage than that currently provided by the U.S. government, may not be adequate to protect our risk of loss from future acts of terrorism, may result in a material increase to our operating expenses or may not be obtainable at all, resulting in an interruption to our operations.
Other
We have certain contracts for goods and services that require us to pay a penalty, acquire inventory specific to us or purchase contract specific equipment, as defined by each respective contract, if we terminate the contract without cause prior to its expiration date. Because these obligations are contingent on our termination of the contract without cause prior to its expiration date, no obligation would exist unless such a termination occurs.
75
NOTE 10. EMPLOYEE BENEFIT PLANS
We sponsor defined benefit and defined contribution pension plans, healthcare plans, and disability and survivorship plans for eligible employees and retirees and their eligible family members.
Defined Benefit Pension Plans.
We sponsor defined benefit pension plans for eligible employees and retirees. These plans are closed to new entrants and frozen for future benefit accruals.
The Pension Protection Act of 2006 allows commercial airlines to elect alternative funding rules (“Alternative Funding Rules”) for defined benefit plans that are frozen. Delta elected the Alternative Funding Rules under which the unfunded liability for a frozen defined benefit plan may be amortized over a fixed 17-year period and is calculated using an
8.85%
interest rate.
We estimate the funding requirements under these plans will total approximately
$700 million
in 2012.
Defined Contribution Pension Plans.
Delta sponsors several defined contribution plans. These plans generally cover different employee groups and employer contributions vary by plan. The cost associated with our defined contribution pension plans is shown in the tables below.
Postretirement Healthcare Plans.
We sponsor healthcare plans that provide benefits to eligible retirees and their dependents who are under age
65
. We have generally eliminated company-paid post age
65
healthcare coverage, except for (1) subsidies available to a limited group of retirees and their dependents and (2) a group of retirees who retired prior to 1987. Benefits under these plans are funded from current assets and employee contributions.
Postemployment Plans.
We provide certain other welfare benefits to eligible former or inactive employees after employment but before retirement, primarily as part of the disability and survivorship plans. Substantially all employees are eligible for benefits under these plans in the event of a participant's death and/or disability.
Benefit Obligations, Fair Value of Plan Assets, and Funded Status
|
Pension Benefits
|
Other Postretirement and Postemployment Benefits
|
||||||||||||
|
December 31,
|
December 31,
|
||||||||||||
|
(in millions)
|
2011
|
2010
|
2011
|
2010
|
|||||||||
|
Benefit obligation at beginning of period
|
$
|
17,506
|
|
$
|
17,031
|
|
$
|
3,298
|
|
$
|
3,427
|
|
|
|
Service cost
|
—
|
|
—
|
|
52
|
|
58
|
|
|||||
|
Interest cost
|
969
|
|
982
|
|
180
|
|
196
|
|
|||||
|
Actuarial loss (gain)
|
1,860
|
|
570
|
|
311
|
|
(115
|
)
|
|||||
|
Benefits paid, including lump sums and annuities
|
(1,042
|
)
|
(1,013
|
)
|
(328
|
)
|
(333
|
)
|
|||||
|
Participant contributions
|
—
|
|
—
|
|
54
|
|
59
|
|
|||||
|
Plan amendments
|
—
|
|
—
|
|
—
|
|
6
|
|
|||||
|
Special termination benefits
|
—
|
|
—
|
|
3
|
|
—
|
|
|||||
|
Settlements
|
—
|
|
(64
|
)
|
—
|
|
—
|
|
|||||
|
Benefit obligation at end of period
(1)
|
$
|
19,293
|
|
$
|
17,506
|
|
$
|
3,570
|
|
$
|
3,298
|
|
|
|
Fair value of plan assets at beginning of period
|
$
|
8,249
|
|
$
|
7,623
|
|
$
|
1,120
|
|
$
|
1,153
|
|
|
|
Actual (loss) gain on plan assets
|
(16
|
)
|
975
|
|
(37
|
)
|
140
|
|
|||||
|
Employer contributions
|
598
|
|
728
|
|
235
|
|
171
|
|
|||||
|
Participant contributions
|
—
|
|
—
|
|
54
|
|
59
|
|
|||||
|
Benefits paid, including lump sums and annuities
|
(1,042
|
)
|
(1,013
|
)
|
(400
|
)
|
(403
|
)
|
|||||
|
Settlements
|
—
|
|
(64
|
)
|
—
|
|
—
|
|
|||||
|
Fair value of plan assets at end of period
|
$
|
7,789
|
|
$
|
8,249
|
|
$
|
972
|
|
$
|
1,120
|
|
|
|
Funded status at end of period
|
$
|
(11,504
|
)
|
$
|
(9,257
|
)
|
$
|
(2,598
|
)
|
$
|
(2,178
|
)
|
|
|
(1)
|
At each period-end presented, our accumulated benefit obligations for our pension plans are equal to the benefit obligations shown above.
|
76
Balance Sheet Position
|
Pension Benefits
|
Other Postretirement and Postemployment Benefits
|
||||||||||||
|
December 31,
|
December 31,
|
||||||||||||
|
(in millions)
|
2011
|
2010
|
2011
|
2010
|
|||||||||
|
Current liabilities
|
$
|
(16
|
)
|
$
|
(13
|
)
|
$
|
(137
|
)
|
$
|
(144
|
)
|
|
|
Noncurrent liabilities
|
(11,488
|
)
|
(9,244
|
)
|
(2,460
|
)
|
(2,034
|
)
|
|||||
|
Total liabilities
|
$
|
(11,504
|
)
|
$
|
(9,257
|
)
|
$
|
(2,597
|
)
|
$
|
(2,178
|
)
|
|
|
Net actuarial (loss) gain
|
$
|
(5,844
|
)
|
$
|
(3,299
|
)
|
$
|
(406
|
)
|
$
|
44
|
|
|
|
Prior service cost
|
—
|
|
—
|
|
(5
|
)
|
(3
|
)
|
|||||
|
Total accumulated other comprehensive (loss) income, pretax
|
$
|
(5,844
|
)
|
$
|
(3,299
|
)
|
$
|
(411
|
)
|
$
|
41
|
|
|
During 2011, the net actuarial loss recorded in accumulated other comprehensive income related to our benefit plans increased to
$6.3 billion
from
$3.3 billion
. This increase is primarily due to (1) the decrease in discount rates from 2010 to 2011 and (2) a lower than expected actual return on plan assets in 2011.
Estimated amounts that will be amortized from accumulated other comprehensive income into net periodic benefit cost in 2012 are a net actuarial loss of
$163 million
. Amounts are generally amortized into accumulated other comprehensive income over the expected future lifetime of plan participants.
Net Periodic Cost
|
Pension Benefits
|
Other Postretirement and
Postemployment Benefits
|
||||||||||||||||||
|
Year Ended December 31,
|
Year Ended December 31,
|
||||||||||||||||||
|
(in millions)
|
2011
|
2010
|
2009
|
2011
|
2010
|
2009
|
|||||||||||||
|
Service cost
|
$
|
—
|
|
$
|
—
|
|
$
|
—
|
|
$
|
52
|
|
$
|
58
|
|
$
|
53
|
|
|
|
Interest cost
|
969
|
|
982
|
|
1,002
|
|
180
|
|
196
|
|
207
|
|
|||||||
|
Expected return on plan assets
|
(724
|
)
|
(677
|
)
|
(615
|
)
|
(90
|
)
|
(90
|
)
|
(79
|
)
|
|||||||
|
Amortization of prior service benefit
|
—
|
|
—
|
|
—
|
|
(3
|
)
|
(4
|
)
|
18
|
|
|||||||
|
Recognized net actuarial loss (gain)
|
55
|
|
48
|
|
33
|
|
(11
|
)
|
(4
|
)
|
(18
|
)
|
|||||||
|
Settlements
|
—
|
|
14
|
|
9
|
|
—
|
|
—
|
|
—
|
|
|||||||
|
Special termination benefits
|
—
|
|
—
|
|
—
|
|
—
|
|
—
|
|
6
|
|
|||||||
|
Net periodic cost
|
$
|
300
|
|
$
|
367
|
|
$
|
429
|
|
$
|
128
|
|
$
|
156
|
|
$
|
187
|
|
|
|
Defined contribution plan costs
|
377
|
|
334
|
|
306
|
|
—
|
|
—
|
|
—
|
|
|||||||
|
Total cost
|
$
|
677
|
|
$
|
701
|
|
$
|
735
|
|
$
|
128
|
|
$
|
156
|
|
$
|
187
|
|
|
Assumptions
We used the following actuarial assumptions to determine our benefit obligations and our net periodic cost for the periods presented:
|
December 31,
|
||||
|
Benefit Obligations
(1)(2)
|
2011
|
2010
|
||
|
Weighted average discount rate
|
4.94
|
%
|
5.69
|
%
|
77
|
Year Ended December 31,
|
||||||
|
Net Periodic Cost
(2)(4)
|
2011
|
2010
|
2009
|
|||
|
Weighted average discount rate - pension benefit
|
5.70
|
%
|
5.93
|
%
|
6.49
|
%
|
|
Weighted average discount rate - other postretirement benefit
|
5.55
|
%
|
5.75
|
%
|
6.46
|
%
|
|
Weighted average discount rate - other postemployment benefit
|
5.63
|
%
|
5.88
|
%
|
6.50
|
%
|
|
Weighted average expected long-term rate of return on plan assets
|
8.93
|
%
|
8.82
|
%
|
8.83
|
%
|
|
Assumed healthcare cost trend rate
(3)
|
7.00
|
%
|
7.50
|
%
|
8.00
|
%
|
|
(1)
|
Our 2011 and 2010 benefit obligations are measured using a mortality table projected to 2015 and 2013, respectively.
|
|
(2)
|
Future compensation levels do not impact our frozen defined benefit pension plans or other postretirement plans and impact only a small portion of our other postemployment liability.
|
|
(3)
|
Assumed healthcare cost trend rate at December 31, 2011 is assumed to decline gradually to
5.00%
by 2020 and remain level thereafter.
|
|
(4)
|
Our assumptions reflect various remeasurements of certain portions of our obligations and represent the weighted average of the assumptions used for each measurement date.
|
Healthcare Cost Trend Rate.
Assumed healthcare cost trend rates have an effect on the amounts reported for the other postretirement benefit plans. A 1% change in the healthcare cost trend rate used in measuring the accumulated plan benefit obligation for these plans at December 31, 2011, would have the following effects:
|
(in millions)
|
1% Increase
|
1% Decrease
|
||||
|
Increase (decrease) in total service and interest cost
|
$
|
5
|
|
$
|
(5
|
)
|
|
Increase (decrease) in the accumulated plan benefit obligation
|
$
|
63
|
|
$
|
(69
|
)
|
Expected Long-Term Rate of Return.
The expected long-term rate of return on plan assets is based primarily on plan-specific investment studies using historical market return and volatility data.
Modest excess return expectations versus some public market indices are incorporated into the return projections based on the actively managed structure of the investment programs and their records of achieving such returns historically. We also expect to receive a premium for investing in less liquid private markets.
We review our rate of return on plan asset assumptions annually.
Our annual investment performance for one particular year does not, by itself, significantly influence our evaluation.
The investment strategy for our defined benefit pension plan assets is to utilize a diversified mix of global public and private equity portfolios, public and private fixed income portfolios, and private real estate and natural resource investments to earn a long-term investment return that meets or exceeds our annualized return target.
Plan Assets
We have adopted and implemented investment policies for our defined benefit pension plans and disability and survivorship plan for pilots that incorporate strategic asset allocation mixes intended to best meet the plans' long-term obligations. This asset allocation policy mix utilizes a diversified mix of investments and is reviewed periodically. The weighted-average target and actual asset allocations for the plans are as follows:
|
December 31, 2011
|
||
|
Target
|
Actual
|
|
|
Diversified fixed income
|
22%
|
23%
|
|
Domestic equity securities
|
21
|
20
|
|
Alternative investments
|
20
|
23
|
|
Non-U.S. developed equity securities
|
20
|
18
|
|
Non-U.S. emerging equity securities
|
6
|
5
|
|
Hedge funds
|
5
|
5
|
|
Cash equivalents
|
5
|
4
|
|
High yield fixed income
|
1
|
2
|
|
Total
|
100%
|
100%
|
The overall asset mix of the portfolios is more heavily weighted in equity-like investments. Active management strategies are utilized where feasible in an effort to realize investment returns in excess of market indices. For additional information regarding the fair value of pension assets, see Note 2.
78
Benefit Payments
Benefit payments in the table below are based on the same assumptions used to measure the related benefit obligations and are paid from both funded benefit plan trusts and current assets. Actual benefit payments may vary significantly from these estimates. Benefits earned under our pension plans and certain postemployment benefit plans are expected to be paid from funded benefit plan trusts, while our other postretirement benefits are funded from current assets.
The following table summarizes, the benefit payments that are scheduled to be paid in the years ending December 31:
|
(in millions)
|
Pension Benefits
|
Other Postretirement and Postemployment Benefits
|
||||
|
2012
|
$
|
1,060
|
|
$
|
264
|
|
|
2013
|
1,070
|
|
263
|
|
||
|
2014
|
1,080
|
|
261
|
|
||
|
2015
|
1,097
|
|
261
|
|
||
|
2016
|
1,116
|
|
264
|
|
||
|
2017-2021
|
5,925
|
|
1,394
|
|
||
Other
We also sponsor defined benefit pension plans for eligible employees in certain foreign countries. These plans did not have a material impact on our Consolidated Financial Statements in any period presented.
Profit Sharing Program
Our broad based employee profit sharing program provides that, for each year in which we have an annual pre-tax profit, as defined, we will pay a specified portion of that profit to employees. Based on our pre-tax earnings for the years ended December 31, 2011 and 2010, we accrued
$264 million
and
$313 million
under the profit sharing program, respectively. We did not record an accrual under the profit sharing program in 2009.
NOTE 11. INCOME TAXES
Income Tax (Provision) Benefit
Our income tax (provision) benefit consisted of
|
Year Ended December 31,
|
|||||||||
|
(in millions)
|
2011
|
2010
|
2009
|
||||||
|
Current tax (provision) benefit
|
$
|
83
|
|
$
|
(7
|
)
|
15
|
|
|
|
Deferred tax (provision) benefit
|
(349
|
)
|
(265
|
)
|
850
|
|
|||
|
Decrease (increase) in valuation allowance
|
351
|
|
257
|
|
(521
|
)
|
|||
|
Income tax (provision) benefit
|
$
|
85
|
|
$
|
(15
|
)
|
$
|
344
|
|
79
The following table presents the principal reasons for the difference between the effective tax rate and the U.S. federal statutory income tax rate:
|
Year Ended December 31,
|
||||||
|
2011
|
2010
|
2009
|
||||
|
U.S. federal statutory income tax rate
|
35.0
|
%
|
35.0
|
%
|
(35.0
|
)%
|
|
State taxes
|
3.4
|
|
2.3
|
|
(1.8
|
)
|
|
(Decrease) increase in valuation allowance
|
(45.7
|
)
|
(42.3
|
)
|
32.9
|
|
|
Release of uncertain tax position reserve
|
(9.0
|
)
|
—
|
|
—
|
|
|
Income Tax Allocation
(1)
|
—
|
|
—
|
|
(20.2
|
)
|
|
Other, net
|
5.3
|
|
7.6
|
|
2.4
|
|
|
Effective income tax rate
|
(11.0
|
)%
|
2.6
|
%
|
(21.7
|
)%
|
|
(1)
|
We consider all income sources, including other comprehensive income, in determining the amount of tax benefit allocated to continuing operations (the “Income Tax Allocation”). For the year ended December 31, 2009, as a result of the Income Tax Allocation, we recorded a non-cash income tax benefit of
$321 million
on the loss from continuing operations, with an offsetting non-cash income tax expense of
$321 million
in other comprehensive income.
|
Deferred Taxes
Deferred income taxes reflect the net tax effect of temporary differences between the carrying amounts of assets and liabilities for financial reporting and income tax purposes. The following table shows significant components of our deferred tax assets and liabilities:
|
December 31,
|
||||||
|
(in millions)
|
2011
|
2010
|
||||
|
Deferred tax assets:
|
||||||
|
Net operating loss carryforwards
|
$
|
6,647
|
|
$
|
6,472
|
|
|
Pension, postretirement and other benefits
|
5,703
|
|
4,527
|
|
||
|
AMT credit carryforward
|
402
|
|
424
|
|
||
|
Deferred revenue
|
2,297
|
|
2,202
|
|
||
|
Rent expense
|
284
|
|
280
|
|
||
|
Reorganization items, net
|
395
|
|
674
|
|
||
|
Other
|
564
|
|
495
|
|
||
|
Valuation allowance
|
(10,705
|
)
|
(9,632
|
)
|
||
|
Total deferred tax assets
|
$
|
5,587
|
|
$
|
5,442
|
|
|
Deferred tax liabilities:
|
||||||
|
Depreciation
|
$
|
5,093
|
|
$
|
4,837
|
|
|
Debt valuation
|
206
|
|
330
|
|
||
|
Intangible assets
|
1,755
|
|
1,731
|
|
||
|
Fuel hedge derivatives
|
32
|
|
73
|
|
||
|
Other
|
68
|
|
40
|
|
||
|
Total deferred tax liabilities
|
$
|
7,154
|
|
$
|
7,011
|
|
The following table shows the current and noncurrent deferred tax assets (liabilities):
|
December 31,
|
||||||
|
(in millions)
|
2011
|
2010
|
||||
|
Current deferred tax assets, net
|
$
|
461
|
|
$
|
355
|
|
|
Noncurrent deferred tax liabilities, net
|
(2,028
|
)
|
(1,924
|
)
|
||
|
Total deferred tax liabilities, net
|
$
|
(1,567
|
)
|
$
|
(1,569
|
)
|
80
The current and noncurrent components of our deferred tax balances are generally based on the balance sheet classification of the asset or liability creating the temporary difference. If the deferred tax asset or liability is not based on a component of our balance sheet, such as our net operating loss (“NOL”) carryforwards, the classification is presented based on the expected reversal date of the temporary difference. Our valuation allowance has been allocated between current or noncurrent based on the percentages of current and noncurrent deferred tax assets to total deferred tax assets.
At
December 31, 2011
, we had (1)
$402 million
of federal alternative minimum tax (“AMT”) credit carryforwards, which do not expire and (2)
$16.8 billion
of federal pretax NOL carryforwards, substantially all of which will not begin to expire until
2022
.
Uncertain Tax Positions
The following table shows the amount of and changes to unrecognized tax benefits on our Consolidated Balance Sheets:
|
(in millions)
|
2011
|
2010
|
2009
|
||||||
|
Unrecognized tax benefits at beginning of period
|
$
|
89
|
|
$
|
66
|
|
$
|
29
|
|
|
Gross increases-tax positions in prior period
|
1
|
|
—
|
|
1
|
|
|||
|
Gross decreases-tax positions in prior period
|
(3
|
)
|
(3
|
)
|
(1
|
)
|
|||
|
Gross increases-tax positions in current period
|
1
|
|
29
|
|
40
|
|
|||
|
Lapse of statute of limitations
|
(1
|
)
|
(2
|
)
|
—
|
|
|||
|
Settlements
|
(65
|
)
|
(1
|
)
|
(3
|
)
|
|||
|
Unrecognized tax benefits at end of period
(1)
|
$
|
22
|
|
$
|
89
|
|
$
|
66
|
|
|
(1)
|
Unrecognized tax benefits on our Consolidated Balance Sheets as of
December 31, 2011
,
2010
and
2009
, include tax benefits of
$5 million
,
$72 million
, and
$47 million
, respectively, which will affect the effective tax rate when recognized.
|
We accrue interest and penalties related to unrecognized tax benefits in interest expense and operating expense, respectively. Interest and penalties are not material in any period presented.
We are currently under audit by the IRS for the 2010 and 2011 tax years.
Valuation Allowance
We periodically assess whether it is more likely than not that we will generate sufficient taxable income to realize our deferred income tax assets and establish valuation allowances if it is not likely we will realize our deferred income tax assets. In making this determination, we consider all available positive and negative evidence and make certain assumptions. We consider, among other things, our deferred tax liabilities, the overall business environment, our historical financial results, our industry's historically cyclical financial results and potential current and future tax planning strategies. We cannot presently determine when we will be able to generate sufficient taxable income to realize our deferred tax assets.
Accordingly, we have recorded a full valuation allowance against our net deferred tax assets.
If we determine that it is more likely than not that we will generate sufficient taxable income to realize our deferred income tax assets, we will reverse our valuation allowance (in full or in part), resulting in a significant income tax benefit in the period such a determination is made.
The following table shows the balance of our valuation allowance and the associated activity:
|
(in millions)
|
2011
|
2010
|
2009
|
||||||
|
Valuation allowance at beginning of period
|
$
|
9,632
|
|
$
|
9,897
|
|
$
|
9,830
|
|
|
Income tax (provision) benefit
|
(351
|
)
|
(257
|
)
|
521
|
|
|||
|
Other comprehensive income tax benefit (provision)
|
1,241
|
|
6
|
|
(308
|
)
|
|||
|
Other
|
183
|
|
(14
|
)
|
(146
|
)
|
|||
|
Valuation allowance at end of period
(1)
|
$
|
10,705
|
|
$
|
9,632
|
|
$
|
9,897
|
|
|
(1)
|
At
December 31, 2011
,
2010
and
2009
,
$2.5 billion
,
$1.2 billion
and
$1.2 billion
of these balances were recorded in accumulated other comprehensive loss on our Consolidated Balance Sheets, respectively.
|
81
NOTE 12. EQUITY AND EQUITY COMPENSATION
Equity
We are authorized to issue
2.0 billion
shares of capital stock, of which up to
1.5 billion
may be shares of common stock, par value
$0.0001
per share, and up to
500 million
may be shares of preferred stock.
Preferred Stock.
We may issue preferred stock in one or more series. The Board of Directors is authorized (1) to fix the descriptions, powers (including voting powers), preferences, rights, qualifications, limitations and restrictions with respect to any series of preferred stock and (2) to specify the number of shares of any series of preferred stock. We have not issued any preferred stock.
Treasury Stock.
We generally withhold shares of Delta common stock to cover employees' portion of required tax withholdings when employee equity awards are issued or vest. These shares are valued at cost, which equals the market price of the common stock on the date of issuance or vesting. The weighted average cost of shares held in treasury was
$14.19
and
$15.33
as of
December 31, 2011
and
2010
, respectively.
Equity-Based Compensation
Our broad based equity and cash compensation plan provides for grants of restricted stock, stock options, performance awards, including cash incentive awards, and other equity-based awards (the "2007 Plan"). Shares of common stock issued under the 2007 Plan may be made available from authorized but unissued common stock or common stock we acquire. If any shares of our common stock are covered by an award that is canceled, forfeited or otherwise terminates without delivery of shares (including shares surrendered or withheld for payment of the exercise price of an award or taxes related to an award), such shares will again be available for issuance under the 2007 Plan. The 2007 Plan authorizes the issuance of up to
157 million
shares of common stock. As of
December 31, 2011
, there were
34 million
shares available for future grants.
We make long term incentive awards annually to eligible employees under the 2007 Plan. Generally, awards vest over time, subject to the employee's continued employment. Equity compensation expense for these awards is recognized in salaries and related costs over the employee's requisite service period (generally, the vesting period of the award) and totaled
$72 million
,
$89 million
and
$108 million
for the years ended
December 31, 2011
,
2010
, and
2009
, respectively. We record expense on a straight-line basis for awards with installment vesting. As of
December 31, 2011
, unrecognized costs related to unvested shares and stock options totaled
$36 million
. We expect substantially all unvested awards to vest.
Restricted Stock
. Restricted stock is common stock that may not be sold or otherwise transferred for a period of time and is subject to forfeiture in certain circumstances. The fair value of restricted stock awards is based on the closing price of the common stock on the grant date. As of
December 31, 2011
, there were
four million
unvested restricted stock awards.
Stock Options.
Stock options are granted with an exercise price equal to the closing price of Delta common stock on the grant date and generally have a 10-year term. We determine the fair value of stock options at the grant date using an option pricing model. As of
December 31, 2011
, there were
18 million
outstanding stock option awards with a weighted average exercise price of
$12.15
, and
17 million
were exercisable.
Performance Shares.
Performance shares are long-term incentive opportunities which are payable in common stock or cash and are generally contingent upon our achieving certain financial goals.
Other.
There was
no
tax benefit recognized in
2011
,
2010
or
2009
related to equity-based compensation, as we record a full valuation allowance against our deferred tax assets due to the uncertainty regarding the ultimate realization of those assets.
82
NOTE 13. ACCUMULATED OTHER COMPREHENSIVE INCOME (LOSS)
The following table shows the components of accumulated other comprehensive income (loss):
|
(in millions)
|
Pension and Other Benefits Liabilities
|
Derivative Contracts
(1)
|
Deferred Tax Valuation Allowance
|
Total
|
||||||||
|
Balance at January 1, 2009
|
$
|
(1,702
|
)
|
$
|
(863
|
)
|
$
|
(1,515
|
)
|
$
|
(4,080
|
)
|
|
Changes in value
|
(540
|
)
|
(20
|
)
|
—
|
|
(560
|
)
|
||||
|
Reclassification into earnings
|
48
|
|
1,350
|
|
—
|
|
1,398
|
|
||||
|
Income Tax Allocation
|
—
|
|
(321
|
)
|
—
|
|
(321
|
)
|
||||
|
Tax effect
|
183
|
|
(491
|
)
|
308
|
|
—
|
|
||||
|
Balance at December 31, 2009
|
(2,011
|
)
|
(345
|
)
|
(1,207
|
)
|
(3,563
|
)
|
||||
|
Changes in value
|
(121
|
)
|
(71
|
)
|
—
|
|
(192
|
)
|
||||
|
Reclassification into earnings
|
54
|
|
123
|
|
—
|
|
177
|
|
||||
|
Tax effect
|
25
|
|
(19
|
)
|
(6
|
)
|
—
|
|
||||
|
Balance at December 31, 2010
|
(2,053
|
)
|
(312
|
)
|
(1,213
|
)
|
(3,578
|
)
|
||||
|
Changes in value
|
(3,062
|
)
|
5
|
|
—
|
|
(3,057
|
)
|
||||
|
Reclassification into earnings
|
41
|
|
(172
|
)
|
—
|
|
(131
|
)
|
||||
|
Tax effect
|
1,175
|
|
66
|
|
(1,241
|
)
|
—
|
|
||||
|
Balance at December 31, 2011
|
$
|
(3,899
|
)
|
$
|
(413
|
)
|
$
|
(2,454
|
)
|
$
|
(6,766
|
)
|
|
(1)
|
Includes
$321 million
of deferred income tax expense that will remain in accumulated other comprehensive loss until all amounts in accumulated other comprehensive loss that relate to fuel derivatives which are designated as accounting hedges are recognized in the Consolidated Statement of Operations. All amounts relating to our fuel derivative contracts that were previously designated as accounting hedges will be recognized by June 2012 (original settlement date of those contracts). As a result, a non-cash income tax expense of
$321 million
will be recognized in the June 2012 quarter unless we enter into and designate additional fuel derivative contracts as accounting hedges prior to June 2012.
|
NOTE 14. GEOGRAPHIC INFORMATION
Operating segments are defined as components of an enterprise whose separate financial information is regularly reviewed by the chief operating decision maker and used in resource allocation and performance assessments.
We are managed as a single business unit that provides air transportation for passengers and cargo. This allows us to benefit from an integrated revenue pricing and route network. Our flight equipment forms one fleet, which is deployed through a single route scheduling system. When making resource allocation decisions, our chief operating decision maker evaluates flight profitability data, which considers aircraft type and route economics, but gives no weight to the financial impact of the resource allocation decision on an individual carrier basis. Our objective in making resource allocation decisions is to optimize our consolidated financial results.
Operating revenue is assigned to a specific geographic region based on the origin, flight path and destination of each flight segment. Our operating revenue by geographic region (as defined by the DOT) is summarized in the following table:
|
Year Ended December 31,
|
|||||||||
|
(in millions)
|
2011
|
2010
|
2009
|
||||||
|
Domestic
|
$
|
22,649
|
|
$
|
20,744
|
|
$
|
19,043
|
|
|
Atlantic
|
6,499
|
|
5,931
|
|
4,970
|
|
|||
|
Pacific
|
3,943
|
|
3,283
|
|
2,485
|
|
|||
|
Latin America
|
2,024
|
|
1,797
|
|
1,565
|
|
|||
|
Total
|
$
|
35,115
|
|
$
|
31,755
|
|
$
|
28,063
|
|
Our tangible assets consist primarily of flight equipment, which is mobile across geographic markets. Accordingly, assets are not allocated to specific geographic regions.
83
NOTE 15. RESTRUCTURING AND OTHER ITEMS
The following table shows charges recorded in restructuring and other items on our Consolidated Statements of Operations:
|
Year Ended December 31,
|
|||||||||
|
(in millions)
|
2011
|
2010
|
2009
|
||||||
|
Facilities and fleet
|
$
|
135
|
|
$
|
202
|
|
$
|
13
|
|
|
Severance and related costs
|
100
|
|
15
|
|
119
|
|
|||
|
Intangible asset impairments (see Note 5)
|
50
|
|
—
|
|
—
|
|
|||
|
Gain on divestiture of slots (see Note 5)
|
(43
|
)
|
—
|
|
—
|
|
|||
|
Merger-related items
|
—
|
|
233
|
|
275
|
|
|||
|
Total restructuring and other items
|
$
|
242
|
|
$
|
450
|
|
$
|
407
|
|
Facilities and Fleet
. During 2011, we recorded charges related to our facilities consolidation and fleet assessments. In 2010, we recorded asset impairment charges related to the Comair fleet reduction initiative and our retired dedicated freighter aircraft. For additional information related to the Comair fleet reduction initiative, see Note 2.
Severance and Related Costs
. During 2011, we recorded charges associated primarily with voluntary workforce reduction programs to align staffing with expected future capacity. In 2009, we recorded charges associated primarily with voluntary workforce reduction programs, including special termination benefits related to retiree healthcare. We do not expect to record any additional material charges related to these severance initiatives.
Merger-Related Items
. Merger-related items are costs associated with Northwest and the integration of Northwest operations into Delta.
The following table shows the balances and activity for restructuring charges:
|
Severance and related costs
|
Lease restructuring
|
||||||||||||||||||
|
(in millions)
|
2011
|
2010
|
2009
|
2011
|
2010
|
2009
|
|||||||||||||
|
Liability at beginning of period
|
$
|
20
|
|
$
|
69
|
|
$
|
50
|
|
$
|
85
|
|
$
|
74
|
|
$
|
54
|
|
|
|
Additional costs and expenses
|
100
|
|
15
|
|
113
|
|
—
|
|
20
|
|
13
|
|
|||||||
|
Other
|
—
|
|
—
|
|
—
|
|
—
|
|
14
|
|
19
|
|
|||||||
|
Payments
|
(74
|
)
|
(64
|
)
|
(94
|
)
|
(21
|
)
|
(23
|
)
|
(12
|
)
|
|||||||
|
Liability at end of period
|
$
|
46
|
|
$
|
20
|
|
$
|
69
|
|
$
|
64
|
|
$
|
85
|
|
$
|
74
|
|
|
84
NOTE 16. EARNINGS (LOSS) PER SHARE
We calculate basic earnings (loss) per share by dividing the net income (loss) by the weighted average number of common shares outstanding. Shares issuable upon the satisfaction of certain conditions are considered outstanding and included in the computation of basic earnings (loss) per share. Accordingly, the calculation of basic earnings (loss) per share for the years ended December 31, 2011, 2010 and 2009 assumes there was outstanding at the beginning of each of these periods all
386 million
shares of Delta common stock contemplated by Delta's Plan of Reorganization to be distributed to holders of allowed general, unsecured claims and
nine million
shares of Delta common stock reserved for issuance in exchange for shares of Northwest common stock that, but for our merger with Northwest Airlines in 2008, would have been issued under Northwest's Plan of Reorganization. Similarly, the calculation of basic loss per share for the year ended December 31, 2009 assumes there was outstanding at January 1, 2009,
50 million
shares of Delta common stock we agreed to issue on behalf of pilots in connection with the merger.
The following table shows our computation of basic and diluted earnings (loss) per share:
|
Year Ended December 31,
|
|||||||||
|
(in millions, except per share data)
|
2011
|
2010
|
2009
|
||||||
|
Net income (loss)
|
$
|
854
|
|
$
|
593
|
|
$
|
(1,237
|
)
|
|
Basic weighted average shares outstanding
|
838
|
|
834
|
|
827
|
|
|||
|
Dilutive effects of share based awards
|
6
|
|
9
|
|
—
|
|
|||
|
Diluted weighted average shares outstanding
|
844
|
|
843
|
|
827
|
|
|||
|
Basic earnings (loss) per share
|
$
|
1.02
|
|
$
|
0.71
|
|
$
|
(1.50
|
)
|
|
Diluted earnings (loss) per share
|
$
|
1.01
|
|
$
|
0.70
|
|
$
|
(1.50
|
)
|
|
Antidilutive common stock equivalents excluded from diluted earnings (loss) per share
|
17
|
|
22
|
|
35
|
|
|||
NOTE 17. QUARTERLY FINANCIAL DATA (UNAUDITED)
The following table summarizes our unaudited results of operations on a quarterly basis. The quarterly earnings (loss) per share amounts for a year will not add to the earnings (loss) per share for that year due to the weighting of shares used in calculating per share data.
|
Three Months Ended
|
||||||||||||
|
(in millions, except per share data)
|
March 31
|
June 30
(1)
|
September 30
(2)(3)
|
December 31
(2)
|
||||||||
|
2011
|
||||||||||||
|
Operating revenue
|
$
|
7,747
|
|
$
|
9,153
|
|
$
|
9,816
|
|
$
|
8,399
|
|
|
Operating income (loss)
|
(92
|
)
|
481
|
|
860
|
|
726
|
|
||||
|
Net income (loss)
|
(318
|
)
|
198
|
|
549
|
|
425
|
|
||||
|
Basic earnings (loss) per share
|
(0.38
|
)
|
0.24
|
|
0.66
|
|
0.51
|
|
||||
|
Diluted earnings (loss) per share
|
(0.38
|
)
|
0.23
|
|
0.65
|
|
0.50
|
|
||||
|
2010
|
||||||||||||
|
Operating revenue
|
$
|
6,848
|
|
$
|
8,168
|
|
$
|
8,950
|
|
$
|
7,789
|
|
|
Operating income
|
68
|
|
852
|
|
1,003
|
|
294
|
|
||||
|
Net income (loss)
|
(256
|
)
|
467
|
|
363
|
|
19
|
|
||||
|
Basic earnings (loss) per share
|
(0.31
|
)
|
0.56
|
|
0.43
|
|
0.02
|
|
||||
|
Diluted earnings (loss) per share
|
(0.31
|
)
|
0.55
|
|
0.43
|
|
0.02
|
|
||||
|
(1)
|
During the June 2011 quarter, we recorded
$144 million
of charges related to severance and related costs and our facilities consolidation and fleet assessments.
|
|
(2)
|
During the September 2011 quarter, we recorded
$208 million
of fuel hedge losses for mark-to-market adjustments recorded in periods other than the settlement period and in the December 2011 quarter, we recorded
$164 million
of fuel hedge gains for mark-to-market adjustments recorded in periods other than the settlement period.
|
|
(3)
|
During the September 2010 quarter, we recorded (1) a
$360 million
loss associated with the primarily non-cash loss on extinguishment of debt, including the write-off of unamortized debt discount and (2) a
$146 million
charge related to the Comair fleet reduction initiative.
|
85
ITEM 9. CHANGES IN AND DISAGREEMENTS WITH ACCOUNTANTS ON ACCOUNTING AND
FINANCIAL DISCLOSURE
None.
ITEM 9A. CONTROLS AND PROCEDURES
Disclosure Controls and Procedures
Our management, including our Chief Executive Officer and Chief Financial Officer, performed an evaluation of our disclosure controls and procedures, which have been designed to permit us to effectively identify and timely disclose important information. Our management, including our Chief Executive Officer and Chief Financial Officer, concluded that the controls and procedures were effective as of
December 31, 2011
to ensure that material information was accumulated and communicated to our management, including our Chief Executive Officer and Chief Financial Officer, as appropriate to allow timely decisions regarding required disclosure.
Changes in Internal Control
During the three months ended
December 31, 2011
, we did not make any changes in our internal control over financial reporting that have materially affected, or are reasonably likely to materially affect, our internal control over financial reporting.
Management's Annual Report on Internal Control Over Financial Reporting
Management is responsible for establishing and maintaining adequate internal control over financial reporting, as such term is defined in Rules 13a-15(f) and 15d-15(f) under the Securities Exchange Act of 1934. Our internal control over financial reporting is designed to provide reasonable assurance regarding the reliability of financial reporting and the preparation of financial statements for external purposes in accordance with accounting principles generally accepted in the United States of America.
Because of its inherent limitations, internal control over financial reporting may not prevent or detect misstatements. Projections of any evaluation of effectiveness to future periods are subject to the risk that controls may become inadequate because of changes in conditions, or that the degree of compliance with the policies may deteriorate.
Management conducted an evaluation of the effectiveness of our internal control over financial reporting as of
December 31, 2011
using the criteria issued by the Committee of Sponsoring Organizations of the Treadway Commission (COSO) in Internal Control-Integrated Framework. Based on that evaluation, management believes that our internal control over financial reporting was effective as of
December 31, 2011
.
The effectiveness of our internal control over financial reporting as of
December 31, 2011
has been audited by Ernst & Young LLP, an independent registered public accounting firm, which also audited our Consolidated Financial Statements for the year ended
December 31, 2011
. Ernst & Young LLP's report on our internal control over financial reporting is set forth below.
86
REPORT OF INDEPENDENT REGISTERED PUBLIC ACCOUNTING FIRM ON INTERNAL CONTROL
OVER FINANCIAL REPORTING
The Board of Directors and Stockholders of
Delta Air Lines, Inc.
We have audited Delta Air Lines, Inc.'s internal control over financial reporting as of
December 31, 2011
, based on criteria established in Internal Control-Integrated Framework issued by the Committee of Sponsoring Organizations of the Treadway Commission (the COSO criteria). Delta Air Lines, Inc.'s management is responsible for maintaining effective internal control over financial reporting, and for its assessment of the effectiveness of internal control over financial reporting included in the accompanying Management's Annual Report on Internal Control Over Financial Reporting. Our responsibility is to express an opinion on the Company's internal control over financial reporting based on our audit.
We conducted our audit in accordance with the standards of the Public Company Accounting Oversight Board (United States). Those standards require that we plan and perform the audit to obtain reasonable assurance about whether effective internal control over financial reporting was maintained in all material respects. Our audit included obtaining an understanding of internal control over financial reporting, assessing the risk that a material weakness exists, testing and evaluating the design and operating effectiveness of internal control based on the assessed risk, and performing such other procedures as we considered necessary in the circumstances. We believe that our audit provides a reasonable basis for our opinion.
A company's internal control over financial reporting is a process designed to provide reasonable assurance regarding the reliability of financial reporting and the preparation of financial statements for external purposes in accordance with generally accepted accounting principles. A company's internal control over financial reporting includes those policies and procedures that (1) pertain to the maintenance of records that, in reasonable detail, accurately and fairly reflect the transactions and dispositions of the assets of the company; (2) provide reasonable assurance that transactions are recorded as necessary to permit preparation of financial statements in accordance with generally accepted accounting principles, and that receipts and expenditures of the company are being made only in accordance with authorizations of management and directors of the company; and (3) provide reasonable assurance regarding prevention or timely detection of unauthorized acquisition, use, or disposition of the company's assets that could have a material effect on the financial statements.
Because of its inherent limitations, internal control over financial reporting may not prevent or detect misstatements. Also, projections of any evaluation of effectiveness to future periods are subject to the risk that controls may become inadequate because of changes in conditions, or that the degree of compliance with the policies or procedures may deteriorate.
In our opinion, Delta Air Lines, Inc. maintained, in all material respects, effective internal control over financial reporting as of
December 31, 2011
, based on the COSO criteria.
We also have audited, in accordance with the standards of the Public Company Accounting Oversight Board (United States), the consolidated balance sheets of Delta Air Lines, Inc. as of
December 31, 2011
and
2010
, and the related consolidated statements of operations, stockholders' (deficit) equity, and cash flows for each of the three years in the period ended
December 31, 2011
of Delta Air Lines, Inc. and our report dated
February 10, 2012
expressed an unqualified opinion thereon.
|
/s/ Ernst & Young LLP
|
|
|
Atlanta, Georgia
|
|
|
February 10, 2012
|
|
87
ITEM 9B. OTHER INFORMATION
None.
PART III
ITEM 10. DIRECTORS, EXECUTIVE OFFICERS AND CORPORATE GOVERNANCE OF THE
REGISTRANT
Information required by this item is set forth under the headings “Corporate Governance Matters,” “Proposal 1 - Election of Directors - Certain Information About Nominees” and “Other Matters - Section 16 Beneficial Ownership Reporting Compliance” in our Proxy Statement to be filed with the Commission related to our Annual Meeting of Stockholders (“Proxy Statement”), and is incorporated by reference. Pursuant to instruction 3 to paragraph (b) of Item 401 of Regulation S-K, certain information regarding executive officers is contained in Part I of this Form 10-K.
ITEM 11. EXECUTIVE COMPENSATION
Information required by this item is set forth under the headings “Director Compensation,” “Corporate Governance Matters - Compensation Committee Interlocks and Insider Participation” and “Executive Compensation” in our Proxy Statement and is incorporated by reference.
ITEM 12. SECURITY OWNERSHIP OF CERTAIN BENEFICIAL OWNERS AND MANAGEMENT AND
RELATED STOCKHOLDER MATTERS
Securities Authorized for Issuance Under Equity Compensation Plans
The following table provides information about the number of shares of common stock that may be issued under the 2007 Plan, Delta's only equity compensation plan, as of
December 31, 2011
.
|
Plan Category
|
(a) No. of Securities to be Issued Upon Exercise of Outstanding Options, Warrants and Rights
|
(b) Weighted-Average Exercise Price of Outstanding Options, Warrants and Rights
|
(c) No. of Securities Remaining Available for Future Issuance Under Equity Compensation Plans (Excluding Securities Reflected in Column (a))
(1)
|
||||
|
Equity compensation plans approved by securities holders
|
13,169,932
|
|
$
|
10.46
|
|
33,768,712
|
|
|
Equity compensation plans not approved by securities holders
|
—
|
|
—
|
|
—
|
|
|
|
Total
|
13,169,932
|
|
$
|
10.46
|
|
33,768,712
|
|
|
(1)
|
Up to 157 million shares of common stock are available for issuance under the 2007 Plan. If any shares of our common stock are covered by an award under the 2007 Plan that is canceled, forfeited or otherwise terminates without delivery of shares (including shares surrendered or withheld for payment of the exercise price of an award or taxes related to an award), then such shares will again be available for issuance under the 2007 Plan. In addition to the
13,169,932
stock options outstanding, 3,770,002 shares of restricted stock remain unvested and a maximum of 3,534,456 shares of common stock may be issued upon the achievement of certain performance conditions under outstanding performance share awards as of
December 31, 2011
.
|
Other information required by this item is set forth under the heading “Beneficial Ownership of Securities” in our Proxy Statement and is incorporated by reference.
ITEM 13. CERTAIN RELATIONSHIPS AND RELATED TRANSACTIONS, AND DIRECTOR
INDEPENDENCE
Information required by this item is set forth under the headings “Corporate Governance Matters,” “Executive Compensation - Post-Employment Compensation - Other Benefits - Pre-Existing Medical Benefits Agreement Between Northwest and Mr. Anderson,” “Proposal 1 - Election of Directors” and “Pre-Existing Agreements with Northwest Airlines, Inc.” in our Proxy Statement and is incorporated by reference.
88
ITEM 14. PRINCIPAL ACCOUNTANT FEES AND SERVICES
Information required by this item is set forth under the heading “Proposal 4 - Ratification of the Appointment of Independent Auditors” in our Proxy Statement and is incorporated by reference.
PART IV
ITEM 15. EXHIBITS AND FINANCIAL STATEMENT SCHEDULES
(a) (1). The following is an index of the financial statements required by this item that are included in this Form 10-K:
Report of Independent Registered Public Accounting Firm
Consolidated Balance Sheets—
December 31, 2011
and
2010
Consolidated Statements of Operations for the years ended
December 31, 2011
,
2010
and
2009
Consolidated Statements of Cash Flows for the years ended
December 31, 2011
,
2010
and
2009
Consolidated Statements of Stockholders' (Deficit) Equity for the years ended
December 31, 2011
,
2010
and
2009
Notes to the Consolidated Financial Statements
(2). The schedule required by this item is included in Notes 11 and 15 to the Consolidated Financial Statements. All other financial statement schedules are not required or are inapplicable and therefore have been omitted.
(3). The exhibits required by this item are listed in the Exhibit Index to this Form 10-K. The management contracts and compensatory plans or arrangements required to be filed as an exhibit to this Form 10-K are listed as Exhibits 10.9(a) through 10.26 in the Exhibit Index.
89
SIGNATURES
Pursuant to the requirements of Section 13 or 15(d) of the Securities Exchange Act of 1934, the registrant has duly caused this report to be signed on its behalf by the undersigned, thereunto duly authorized, on the
10th day of February, 2012
.
|
DELTA AIR LINES, INC.
|
|||
|
By:
|
/s/ Richard H. Anderson
|
||
|
Richard H. Anderson
|
|||
|
Chief Executive Officer
|
|||
Pursuant to the requirements of the Securities Exchange Act of 1934, this report has been signed below on the
10th day of February, 2012
by the following persons on behalf of the registrant and in the capacities indicated.
|
Signature
|
Title
|
|
|
/s/ Richard H. Anderson
|
Chief Executive Officer and Director
(Principal Executive Officer)
|
|
|
Richard H. Anderson
|
||
|
/s/ Hank Halter
|
Senior Vice President and Chief Financial Officer
(Principal Financial Officer and
Principal Accounting Officer)
|
|
|
Hank Halter
|
||
|
/s/ Edward H. Bastian
|
President and Director
|
|
|
Edward H. Bastian
|
||
|
/s/ Roy J. Bostock
|
Director
|
|
|
Roy J. Bostock
|
||
|
/s/ John S. Brinzo
|
Director
|
|
|
John S. Brinzo
|
||
|
/s/ Daniel A. Carp
|
Chairman of the Board
|
|
|
Daniel A. Carp
|
||
|
/s/ David G. DeWalt
|
Director
|
|
|
David G. DeWalt
|
||
|
/s/ John M. Engler
|
Director
|
|
|
John M. Engler
|
||
|
/s/ Mickey P. Foret
|
Director
|
|
|
Mickey P. Foret
|
||
|
/s/ Shirley C. Franklin
|
Director
|
|
|
Shirley C. Franklin
|
||
|
/s/ David R. Goode
|
Director
|
|
|
David R. Goode
|
||
|
/s/ Paula Rosput Reynolds
|
Director
|
|
|
Paula Rosput Reynolds
|
||
|
/s/ Kenneth C. Rogers
|
Director
|
|
|
Kenneth C. Rogers
|
||
|
/s/ Kenneth B. Woodrow
|
Director
|
|
|
Kenneth B. Woodrow
|
||
90
EXHIBIT INDEX
Note to Exhibits: Any representations and warranties of a party set forth in
any agreement (including all exhibits and schedules thereto) filed with this
Annual Report on Form 10-K have been made solely for the benefit of the other
party to the agreement. Some of those representations and warranties were made
only as of the date of the agreement or such other date as specified in the
agreement, may be subject to a contractual standard of materiality different
from what may be viewed as material to stockholders, or may have been used for
the purpose of allocating risk between the parties rather than establishing
matters as facts. Such agreements are included with this filing only to provide
investors with information regarding the terms of the agreements, and not to
provide investors with any other factual or disclosure information regarding
the registrant or its business.
|
3.1
|
Delta's Certificate of Incorporation (Filed as Exhibit 3.1 to Delta's Current Report on Form 8-K as filed on April 30, 2007).*
|
|
3.2
|
Delta's By-Laws (Filed as Exhibit 3.1 to Delta's Current Report on Form 8-K as filed on May 22, 2008).*
|
Delta is not filing any instruments evidencing any indebtedness because the total amount of securities authorized under any single such instrument does not exceed 10% of the total assets of Delta and its subsidiaries on a consolidated basis. Copies of such instruments will be furnished to the Securities and Exchange Commission upon request.
|
10.1(a)
|
First Lien Revolving Credit and Guaranty Agreement, dated as of April 30, 2007, among Delta Air Lines, Inc., as Borrower, the subsidiaries of the Borrower named, as Guarantors, each of the Lenders from time to time party, JPMorgan Chase Bank, N.A., as administrative agent and as collateral agent, J.P. Morgan Securities, Inc. and Lehman Brothers Inc., as co-lead arrangers and joint bookrunners, UBS Securities LLC, as syndication agent and as joint bookrunner, and Calyon New York Brand and RBS Securities Corporation, as co-documentation agents (Filed as Exhibit 10.1(a) to Delta's Quarterly Report on Form 10-Q for the quarter ended June 30, 2009).*
|
|
10.1(b)
|
Second Lien Term Loan and Guaranty Agreement, dated as of April 30, 2007, among Delta Air Lines, Inc., as Borrower, the subsidiaries of the Borrower named, as Guarantors, each of the Lenders from time to time party, Goldman Sachs Credit Partners L.P. (“GSCP”), as administrative agent and as collateral agent, GSCP and Merrill Lynch Commercial Finance Corp., as co-lead arrangers and joint bookrunners, Barclays Capital, as syndication agent and as joint bookrunner, and Credit Suisse Securities (USA) LLC and C.I.T. Leasing Corporation, as co-documentation agents (Filed as Exhibit 10.1(b) to Delta's Quarterly Report on Form 10-Q for the quarter ended June 30, 2009).*
|
|
10.2
|
Credit and Guaranty Agreement, dated as of April 20, 2011, among Delta Air Lines, Inc., as Borrower, the subsidiaries of the Borrower named as Guarantors, each of the several Lenders from time to time party thereto, JPMorgan Chase Bank, N.A., as administrative agent for the Lenders, J.P. Morgan Securities LLC, Goldman Sachs Lending Partners LLC, UBS Securities LLC, Barclays Capital, the investment banking division of Barclays Bank PLC and Merrill Lynch, Pierce, Fenner & Smith Incorporated, as joint lead arrangers, J.P. Morgan Securities LLC, Barclays Capital, Citigroup Global Markets Inc., Credit Suisse AG, Cayman Islands Branch, Deutsche Bank Securities Inc., Goldman Sachs Lending Partners, LLC, Merrill Lynch, Pierce, Fenner & Smith Incorporated, Morgan Stanley Senior Funding, Inc. and UBS Securities LLC, as joint bookrunners, Goldman Sachs Lending Partners, LLC and UBS Securities LLC, as co-syndication agents, and Barclays Bank and Bank of America, N.A., as co-documentation agents (Filed as Exhibit 10.1 to Delta's Quarterly Report on Form 10-Q for the quarter ended June 30, 2011).*
|
|
10.3
|
Transaction Framework Agreement among Delta, Delta Master Executive Council, Northwest Master Executive Council and Air Line Pilots Association, International dated as of June 26, 2008 (Filed as Exhibit 10 to Delta's Quarterly Report on Form 10-Q for the quarter ended June 30, 2008).*
|
|
10.4
|
Letter Agreement, dated April 14, 2008, by an among Delta Air Lines, Inc., the Master Executive Council of Delta, and Air Line Pilots Association, International dated April 14, 2008 (Filed as Exhibit 10.2 to Delta's Quarterly Report on Form 10-Q for the quarter ended June 30, 2008).*
|
|
10.5
|
Anchor Tenant Agreement dated as of December 9, 2010 between JFK International Air Terminal LLC and Delta Air Lines, Inc. (Filed as Exhibit 10.4 to Delta's Annual Report on Form 10-K for the year ended December 31, 2010).*
|
|
10.6
|
Supplemental Agreement No. 13 to Purchase Agreement Number 2022, dated August 24, 2011, between The Boeing Company and Delta relating to Boeing Model 737NG Aircraft (the “B-737NG Purchase Agreement”) (Filed as Exhibit 10.1 to Delta's Quarterly Report on Form 10-Q for the quarter ended September 30, 2011).*/**
|
91
|
10.7
|
Letter Agreements, dated August 24, 2011, relating to the B-737NG Purchase Agreement (Filed as Exhibit 10.2 to Delta's Quarterly Report on Form 10-Q for the quarter ended September 30, 2011).*/**
|
|
10.8(a)
|
Aircraft General Terms Agreement, dated October 21, 1997, between Boeing and Delta (Filed as Exhibit 10.6 to Delta's Quarterly Report on Form 10-Q for the quarter ended December 31, 1997).*/**
|
|
10.8(b)
|
Letter Agreement, dated August 24, 2011, relating to Revisions to Aircraft General Terms Agreement dated October 21, 1997 and the B-737NG Purchase Agreement (Filed as Exhibit 10.3(b) to Delta's Quarterly Report on Form 10-Q for the quarter ended September 30, 2011).*/**
|
|
10.9(a)
|
Benefit waiver agreement dated October 29, 2008 between Delta Air Lines, Inc. and Richard H. Anderson (Filed as Exhibit 10.11(b) to Delta's Annual Report on Form 10-K for the year ended December 31, 2008).*
|
|
10.9(b)
|
Benefit waiver agreement dated October 20, 2009 between Delta Air Lines, Inc. and Richard H. Anderson (Filed as Exhibit 10.8(c) to Delta's Annual Report on Form 10-K for the year ended December 31, 2009).*
|
|
10.10
|
Form of Benefit Waiver agreement dated March 1, 2011 between Delta and each of Edward H. Bastian, Michael H. Campbell, Stephen E. Gorman, Hank Halter, Glen W. Hauenstein and Richard B. Hirst (Filed as Exhibit 10.1 to Delta's Annual Report on Form 10-Q for the quarter ended March 31, 2011).*
|
|
10.11(a)
|
Delta Air Lines, Inc. 2007 Performance Compensation Plan (Filed as Exhibit 10.1 to Delta's Current Report on Form 8-K filed on March 22, 2007).*
|
|
10.11(b)
|
First Amendment to the Delta Air Lines, Inc. 2007 Performance Compensation Plan (Filed as Exhibit 10.12(b) to Delta's Annual Report on Form 10-K for the year ended December 31, 2008).*
|
|
10.11(c)
|
Form of Delta 2007 Performance Compensation Plan Award Agreement for Officers (Filed as Exhibit 10.1 to Delta's Current Report on Form 8-K filed on April 30, 2007).*
|
|
10.12(a)
|
Delta Air Lines, Inc. Officer and Director Severance Plan, as amended and restated as of January 2, 2009, as further amended October 20, 2009 (Filed as Exhibit 10.11(a) to Delta's Annual Report on Form 10-K for the year ended December 31, 2009).*
|
|
10.12(b)
|
Amendment to the Delta Air Lines, Inc. Officer and Director Severance Plan, as amended and restated as of January 2, 2009, as further amended October 20, 2009 (Filed as Exhibit 10.11(b) to Delta's Annual Report on Form 10-K for the year ended December 31, 2009).*
|
|
10.13
|
Description of Certain Benefits of Members of the Board of Directors and Executive Officers (Filed as Exhibit 10.2 to Delta's Quarterly Report on Form 10-Q for the quarter ended June 30, 2011).*
|
|
10.14(a)
|
Delta Air Lines, Inc. 2011 Long Term Incentive Program (Filed as Exhibit 10.10(a) to Delta's Annual Report on Form 10-K for the year ended December 31, 2010).*
|
|
10.14(b)
|
Model Award Agreement for the Delta Air Lines, Inc. 2011 Long Term Incentive Program (Filed as Exhibit 10.10(b) to Delta's Annual Report on Form 10-K for the year ended December 31, 2010).*
|
|
10.15
|
Delta Air Lines, Inc. 2012 Long Term Incentive Program.
|
|
10.16
|
Delta Air Lines, Inc. 2011 Management Incentive Plan (Filed as Exhibit 10.11 to Delta's Annual Report on Form 10-K for the year ended December 31, 2010).*
|
|
10.17
|
Delta Air Lines, Inc. 2012 Management Incentive Plan.
|
|
10.18(a)
|
Delta Air Lines, Inc. Merger Award Program (Filed as Exhibit 10.20(a) to Delta's Annual Report on Form 10-K for the year ended December 31, 2008).*
|
|
10.18(b)
|
Model Award Agreement for Delta Air Lines, Inc. Merger Award Program (Filed as Exhibit 10.20(b) to Delta's Annual Report on Form 10-K for the year ended December 31, 2008).*
|
92
|
10.19(a)
|
Management Compensation Agreement dated as of September 14, 2005 between Northwest Airlines, Inc. and Douglas M. Steenland (Filed as Exhibit 10.1 to Northwest's Quarterly Report on Form 10-Q for the quarter ended September 30, 2005).*
|
|
10.19(b)
|
Retention Agreement and Amendment to Management Compensation Agreement dated as of April 14, 2008 between Northwest Airlines, Inc. and Douglas M. Steenland (Filed as Exhibit 10.13 to Northwest's Quarterly Report on Form 10-Q for the quarter ended March 31, 2008).*
|
|
10.20
|
Letter Agreement dated as of June 11, 2008 between counsel for and on behalf of Mickey P. Foret and Aviation Consultants, LLC, and counsel for and on behalf of Northwest Airlines, Inc. (Filed as Exhibit 10.22 to Delta's Annual Report on Form 10-K for the year ended December 31, 2008).*
|
|
10.21(a)
|
Northwest Airlines, Inc. Excess Pension Plan for Salaried Employees (2001 Restatement) (Filed as Exhibit 10.28 to Northwest's Annual Report on Form 10-K for the year ended December 31, 2006).*
|
|
10.21(b)
|
First Amendment of Northwest Airlines Excess Pension Plan for Salaried Employees (2001 Restatement) (Filed as Exhibit 10.3 to Northwest's Quarterly Report on Form 10-Q for the quarter ended September 30, 2005).*
|
|
10.21(c)
|
Third Amendment of Northwest Airlines Excess Pension Plan for Salaried Employees (2001 Restatement) (Filed as Exhibit 10.1 to Northwest's Quarterly Report on Form 10-Q for the quarter ended March 31, 2008).*
|
|
10.22(a)
|
2007 Stock Incentive Plan (Filed as Exhibit 99.2 to Northwest's Current Report on Form 8-K filed on May 29, 2007).*
|
|
10.22(b)
|
Amendment No. 1 to the Northwest Airlines Corporation 2007 Stock Incentive Plan (Filed as Exhibit 10.2 to Northwest's Quarterly Report on Form 10-Q for the quarter ended June 30, 2007).*
|
|
10.22(c)
|
Amendment No. 2 to the Northwest Airlines Corporation 2007 Stock Incentive Plan (Filed as Exhibit 10.5 to Northwest's Quarterly Report on Form 10-Q for the quarter ended March 31, 2008).*
|
|
10.22(d)
|
Form of Award Agreement for Non-Qualified Stock Options Granted to Employees under the Northwest Airlines Corporation 2007 Stock Incentive Plan (Filed as Exhibit 99.5 to Northwest's Current Report on Form 8-K filed on May 29, 2007).*
|
|
10.22(e)
|
Amendment No. 1 to Form of Award Agreement for Non-Qualified Stock Options Granted to Employees under the Northwest Airlines Corporation 2007 Stock Incentive Plan (Filed as Exhibit 10.7 to Northwest's Quarterly Report on Form 10-Q for the quarter ended March 31, 2008).*
|
|
10.22(f)
|
Form of Award Agreement for Non-Qualified Stock Options Granted to Directors under the Northwest Airlines Corporation 2007 Stock Incentive Plan (Filed as Exhibit 10.4 to Northwest's Quarterly Report on Form 10-Q for the quarter ended June 30, 2007).*
|
|
10.22(g)
|
Amendment No. 1 to Form of Award Agreement for Non-Qualified Stock Options Granted to Directors under the Northwest Airlines Corporation 2007 Stock Incentive Plan (Filed as Exhibit 10.6 to Northwest's Quarterly Report on Form 10-Q for the quarter ended March 31, 2008).*
|
|
10.23
|
Form of Offer of Employment dated October 31, 2008 between Delta Air Lines, Inc. and Richard B. Hirst (Filed as Exhibit 10.2 to Delta's Quarterly Report on Form 10-Q for the quarter ended June 30, 2009).*
|
10.24 Delta Air Lines, Inc. Restoration Long Term Disability Plan
10.25 Letter Agreement, dated February 2, 2012 between Delta Air Lines, Inc. and Richard H. Anderson
10.26 Letter Agreement, dated February 2, 2012 between Delta Air Lines, Inc. and Richard B. Hirst
|
12.1
|
Statement regarding computation of ratio of earnings to fixed charges for each fiscal year in the five-year period ended December 31, 2011.
|
|
21.1
|
Subsidiaries of the Registrant.
|
93
|
23.1
|
Consent of Ernst & Young LLP.
|
|
31.1
|
Rule 13a-14(a)/15d-14(a) Certification of Chief Executive Officer.
|
|
31.2
|
Rule 13a-14(a)/15d-14(a) Certification of Chief Financial Officer.
|
|
32
|
Certification pursuant to 18 U.S.C. Section 1350, as adopted pursuant to Section 906 of the Sarbanes-Oxley Act 2002.
|
____________
|
*
|
Incorporated by reference.
|
|
**
|
Portions of this exhibit have been omitted and filed separately with the Securities and Exchange Commission pursuant to requests for confidential treatment.
|
94
TABLE OF CONTENTS
Part IItem 1. BusinessItem 1A. Risk FactorsItem 1B. Unresolved Staff CommentsItem 2. PropertiesItem 3. Legal ProceedingsItem 4. Mine Safety DisclosuresPart IIItem 5. Market For Registrant's Common Equity, Related Stockholder Matters and Issuer Purchases Of Equity SecuritiesItem 5. Market For Registrant's Common Equity, Related Stockholder Matters andItem 6. Selected Financial DataItem 7. Management's Discussion and Analysis Of Financial Condition and Results Of OperationsItem 7. Management's Discussion and Analysis Of Financial Condition and ResultsItem 7A. Quantitative and Qualitative Disclosures About Market RiskItem 8. Financial Statements and Supplementary DataNote 1. Summary Of Significant Accounting PoliciesNote 2. Fair Value MeasurementsNote 3. DerivativesNote 4. Jfk RedevelopmentNote 5. Intangible AssetsNote 6. American Express RelationshipNote 7. Long-term DebtNote 8. Lease ObligationsNote 9. Purchase Commitments and ContingenciesNote 10. Employee Benefit PlansNote 11. Income TaxesNote 12. Equity and Equity CompensationNote 13. Accumulated Other Comprehensive Income (loss)Note 14. Geographic InformationNote 15. Restructuring and Other ItemsNote 16. Earnings (loss) Per ShareNote 17. Quarterly Financial Data (unaudited)Item 9. Changes in and Disagreements with Accountants on Accounting and Financial DisclosureItem 9. Changes in and Disagreements with Accountants on Accounting andItem 9A. Controls and ProceduresItem 9B. Other InformationPart IIIItem 10. Directors, Executive Officers and Corporate Governance Of The RegistrantItem 10. Directors, Executive Officers and Corporate Governance Of TheItem 11. Executive CompensationItem 12. Security Ownership Of Certain Beneficial Owners and Management and Related Stockholder MattersItem 12. Security Ownership Of Certain Beneficial Owners and Management andItem 13. Certain Relationships and Related Transactions, and Director IndependenceItem 13. Certain Relationships and Related Transactions, and DirectorItem 14. Principal Accountant Fees and ServicesPart IVItem 15. Exhibits and Financial Statement Schedules