DELTA AIR LINES, INC.
10-Ks and 10-Qs
|
|
|
|
|
|
|
|
|
|
|
|
|
|
|
|
|
|
|
|
|
|
|
|
|
|
|
|
|
|
|
|
|
|
|
|
|
|
|
|
|
|
|
|
|
|
|
|
|
|
|
|
|
|
|
|
|
|
|
UNITED STATES
SECURITIES AND EXCHANGE COMMISSION
Washington, D.C. 20549
FORM
10-K
|
þ
|
ANNUAL REPORT PURSUANT TO SECTION 13 OR 15(d) OF THE SECURITIES
EXCHANGE ACT OF 1934
|
For the fiscal year ended
December 31, 2017
|
Or
|
|
|
o
|
TRANSITION REPORT PURSUANT TO SECTION 13 OR 15(d) OF THE SECURITIES
EXCHANGE ACT OF 1934
|
Commission File Number 001-5424

DELTA AIR LINES, INC.
(Exact name of registrant as specified in its charter)
|
Delaware
|
58-0218548
|
|
(State or other jurisdiction of incorporation or organization)
|
(I.R.S. Employer Identification No.)
|
|
Post Office Box 20706
|
|
|
Atlanta, Georgia
|
30320-6001
|
|
(Address of principal executive offices)
|
(Zip Code)
|
|
Registrant's telephone number, including area code: (404) 715-2600
|
|
Securities registered pursuant to Section 12(b) of the Act:
|
Title of each class
|
Name of each exchange on which registered
|
|
|
Common Stock, par value $0.0001 per share
|
New York Stock Exchange
|
|
Securities registered pursuant to Section 12(g) of the Act: None
Indicate by check mark if the registrant is a well-known seasoned issuer, as defined in Rule 405 of the Securities Act. Yes
þ
No
o
Indicate by check mark if the registrant is not required to file reports pursuant to Section 13 or Section 15(d) of the Exchange Act. Yes
o
No
þ
Indicate by check mark whether the registrant (1) has filed all reports required to be filed by Section 13 or 15(d) of the Securities Exchange Act of 1934 during the preceding 12 months (or for such shorter period that the registrant was required to file such reports) and (2) has been subject to such filing requirements for the past 90 days. Yes
þ
No
o
Indicate by check mark whether the registrant has submitted electronically and posted on its corporate Web site, if any, every Interactive Data File required to be submitted and posted pursuant to Rule 405 of Regulation S-T (§ 232.405 of this chapter) during the preceding 12 months (or for such shorter period that the registrant was required to submit and post such files). Yes
þ
No
o
Indicate by check mark if disclosure of delinquent filers pursuant to Item 405 of Regulation S-K is not contained herein, and will not be contained, to the best of registrant's knowledge, in definitive proxy or information statements incorporated by reference in Part III of this Form 10-K or any amendment to this Form 10-K.
o
Indicate by check mark whether the registrant is a large accelerated filer, an accelerated filer, a non-accelerated filer, a smaller reporting company or an emerging growth company. See the definitions of “large accelerated filer,” “accelerated filer,” “smaller reporting company” and "emerging growth company" in Rule 12b-2 of the Exchange Act. (Check one):
|
Large accelerated filer
|
þ
|
Accelerated filer
|
o
|
Non-accelerated filer
|
o
|
(Do not check if a smaller reporting company)
|
|
Smaller reporting company
|
o
|
Emerging growth company
|
o
|
|||
If an emerging growth company, indicate by check mark if the registrant has elected not to use the extended transition period for complying with any new or revised financial accounting standards provided pursuant to Section 13(a) of the Exchange Act.
o
Indicate by check mark whether the registrant is a shell company (as defined in Rule 12b-2 of the Exchange Act). Yes
o
No
þ
The aggregate market value of the voting and non-voting common equity held by non-affiliates of the registrant as of June 30, 2017 was approximately
$
38.9
billion
.
On January 31, 2018, there were outstanding
706,913,358
shares of the registrant's common stock.
This document is also available on our website at http://ir.delta.com/.
Documents Incorporated By Reference
Part III of this Form 10-K incorporates by reference certain information from the registrant's definitive Proxy Statement for its Annual Meeting of Stockholders to be filed with the Securities and Exchange Commission.
A LETTER FROM OUR CEO TO OUR SHAREHOLDERS
Dear Delta shareholder:
Delta Air Lines had a strong year on many fronts in 2017, delivering solid results for our employees, customers and owners, while also making significant investments in Delta’s future. We generated more than $5 billion in pre-tax income for the third consecutive year despite a number of challenges, including major weather events and a 12-hour power outage at our Atlanta hub. Through it all, Delta people provided our customers the very best service in the industry - showing that they are our greatest asset.
Our top financial priority in 2017 was to return the business to unit revenue growth. We took a number of actions to drive this result, including capping our capacity growth at 1% for the year. We also made investments in our product and people that are contributing to higher net promoter scores, demonstrating better customer satisfaction and a sustainable revenue premium. We enter 2018 with the best revenue momentum in years. Domestic demand and yields remain robust and global economies are rebounding, allowing us to resume growth in our international business.
Limiting our capacity growth helped produce revenue momentum, but it also created heightened pressure on our unit costs. Costs were further pressured by product investments, weather and accelerated depreciation on aircraft exiting our fleet. These impacts combined for unsustainable unit cost growth in 2017, and we are determined to change this trajectory in 2018. Our 2018 fleet additions are set to deliver some of the greatest efficiency gains in Delta’s history. In addition, we have started a company-wide project to drive productivity by better leveraging our scale and rethinking the way we do business.
In recent years, we have invested more than $2 billion in partnerships with some of the finest airlines in the world. These strong relationships allow us to offer more choices to our customers and expand globally in a more capital efficient way. In 2017 alone, we acquired a 10% stake in Air France-KLM, acquired a 49% stake in Grupo Aeroméxico and announced plans for joint ventures with Korean Air and WestJet. With these investments made, we have built the foundation to produce hundreds of millions of dollars in benefits in the coming years from serving some of the largest and fastest growing markets in the world.
As we look to 2018 and beyond, our focus is on delivering sustainable financial results by leveraging our five key competitive differentiators:
Our People and Culture
- Our culture is the foundation of every decision we make at Delta and the key to every other competitive advantage that we have built. Ensuring that the incentives of our people are aligned with those of our customers and shareholders is vital to our success, which is why we are proud to offer our people one of the most generous profit-sharing programs of any company. Since we started our profit sharing program in 2007, it has paid out more than $6 billion, including at least $1 billion for each of the past four years. Our culture is also one of giving back to the communities we serve - in 2017 we contributed over $40 million as part of our annual commitment to give 1 percent of net income to key charitable organizations.
Our Industry-Leading Operational Reliability
- We are constantly focused on ways to run a better, more reliable, customer-focused airline. We have made significant investments in our business and currently run the best operation in the global industry - in 2017 we ran 242 days without cancelling any mainline flights, including 90 days with no system cancellations on the entire Delta platform - a 10% increase from 2016. These results led to Delta’s recognition by
FlightGlobal
as the most on-time global airline - the first time a U.S. airline has earned this award.
Our Network
- Our domestic network combines a focus on the most desirable markets with a balanced footprint between East and West coasts, and is optimally structured to capture premium revenue. Delta holds approximately 60% share in our four interior hubs (Atlanta, Minneapolis, Detroit and Salt Lake City), allowing us to take advantage of scale economies. We have also streamlined our international network with a focus on major and developing markets around the world through global partnerships. We are achieving many of the benefits of cross-border cooperation for our customers and our owners, with strong alliances in Europe, Latin America, Asia, Australia and Canada.
Our Customer Loyalty and Brand
- During 2017, we achieved record customer satisfaction levels, with higher net promoter scores in every region and a 2-point improvement overall, including an all-time high in November 2017. We will continue to build on this success, with more than $12 billion of airport facility projects planned in the next decade. We are offering more customer choice through Branded Fares, including First Class upsell, Comfort+, Preferred Seats and Basic Economy, which combined generated nearly $2 billion of revenue in 2017. We are also growing our relationship with American Express - our co-brand partnership contributed $3 billion in 2017, which we expect to grow to $4 billion by 2021.
Our Investment Grade Balance Sheet
- Since 2009, we have reduced the principal amount of our debt by more than $9 billion, which has lowered our annual interest expense by approximately $900 million and resulted in an investment grade credit rating from all three agencies. In addition, our pension funded status is at its highest level since the merger. Our long-term goal is to generate $8 - $9 billion in operating cash flow and $4 - $5 billion of free cash flow annually, which will be used to further pay down debt and continue to return cash to shareholders. In 2017, we returned $2.4 billion to shareholders through dividends and share repurchases and announced our fourth 50% dividend increase in as many years. Since 2013, we have returned nearly $10 billion to shareholders and have reduced our outstanding shares by 18%.
We are approaching the 10-year anniversary of the Delta-Northwest merger, and the transformation of our company and the airline industry over that decade has been unprecedented. We are financially stronger, consistently delivering and investing in a high-quality experience for our customers, and sharing our success with our people. We love our “Keep Climbing” tagline because it reminds us not only of the hard work it has taken to achieve our current success, but also that our greatest days are ahead of us.

Edward H. Bastian
Chief Executive Officer
February 23, 2018
|
Table of Contents
|
|
|
Page
|
|
|
PART I
|
|
|
PART II
|
|
|
Page
|
|
|
PART III
|
|
|
PART IV
|
|
Unless otherwise indicated, the terms "Delta," "we," "us," and "our" refer to Delta Air Lines, Inc. and its subsidiaries.
FORWARD-LOOKING STATEMENTS
Statements in this Form 10-K, including in the letter to shareholders included in the front of this Form 10-K, (or otherwise made by us or on our behalf) that are not historical facts, including statements about our estimates, expectations, beliefs, intentions, projections or strategies for the future, may be "forward-looking statements" as defined in the Private Securities Litigation Reform Act of 1995. Forward-looking statements involve risks and uncertainties that could cause actual results to differ materially from historical experience or our present expectations. Known material risk factors applicable to Delta are described in "Risk Factors Relating to Delta" and "Risk Factors Relating to the Airline Industry" in "Item 1A. Risk Factors" of this Form 10-K, other than risks that could apply to any issuer or offering. All forward-looking statements speak only as of the date made, and we undertake no obligation to publicly update or revise any forward-looking statements to reflect events or circumstances that may arise after the date of this report.
1
Part I
ITEM 1. BUSINESS
General
We provide scheduled air transportation for passengers and cargo throughout the United States ("U.S.") and around the world. Our global route network gives us a presence in every major domestic and international market. Our route network is centered around a system of hub, international gateway and key airports that we operate in Amsterdam, Atlanta, Boston, Detroit, London-Heathrow, Los Angeles, Minneapolis-St. Paul, New York-LaGuardia, New York-JFK, Paris-Charles de Gaulle, Salt Lake City, Seattle and Tokyo-Narita. Each of these operations includes flights that gather and distribute traffic from markets in the geographic region surrounding the hub or gateway to domestic and international cities and to other hubs or gateways. Our network is supported by a fleet of aircraft that is varied in size and capabilities, giving us flexibility to adjust aircraft to the network. Other important characteristics of our route network include our international joint ventures, our alliances with other foreign airlines, our membership in SkyTeam and agreements with multiple domestic regional carriers that operate as Delta Connection
®
.
We are incorporated under the laws of the State of Delaware. Our principal executive offices are located at Hartsfield-Jackson Atlanta International Airport in Atlanta, Georgia. Our telephone number is (404) 715-2600 and our Internet address is www.delta.com. Information contained on our website is not part of, and is not incorporated by reference in, this Form 10-K.
International Alliances
Our international alliance relationships with foreign carriers are an important part of our business as they improve our access to international markets and enable us to market globally integrated air transportation services. The most significant of these arrangements are commercial joint ventures that include joint sales and marketing coordination, co-location of airport facilities and other commercial cooperation arrangements. Our alliance arrangements also include reciprocal codesharing and reciprocal frequent flyer program participation and airport lounge access arrangements. These alliance relationships also may present opportunities in other areas, such as airport ground handling arrangements, aircraft maintenance insourcing and joint procurement.
Joint Venture Agreements.
We currently operate four joint ventures with foreign carriers and have entered into an agreement to form a fifth. These arrangements, for which we have received antitrust immunity from the U.S. Department of Transportation ("DOT"), provide for joint commercial cooperation with our partners within the geographic scope of those arrangements, including the sharing of revenues and/or profits and losses generated by the parties on the joint venture routes, as well as joint marketing and sales, coordinated pricing and revenue management, network planning and scheduling and other coordinated activities with respect to the parties' operations on joint venture routes. Our commercial joint ventures are:
|
•
|
A transatlantic joint venture with Air France and KLM, both of which are subsidiaries of the same holding company, and Alitalia.
|
|
•
|
A joint venture with Virgin Atlantic Airways with respect to operations on non-stop routes between the United Kingdom and North America. In addition to the joint venture, we own a non-controlling 49% equity stake in Virgin Atlantic Limited, the parent company of Virgin Atlantic Airways.
|
|
•
|
A joint venture with Aeroméxico with respect to trans-border operations on flights between the U.S. and Mexico. In addition to the joint venture, we acquired a non-controlling 49% equity stake in Grupo Aeroméxico, S.A.B. de C.V., the parent company of Aeroméxico.
In addition, we and Aeroméxico have established a joint venture relating to an airframe maintenance, repair and overhaul operation located in Queretaro, Mexico.
|
|
•
|
A joint venture with Virgin Australia Airlines and its affiliated carriers with respect to operations on transpacific routes between North America and Australia/New Zealand.
|
|
•
|
In 2017, we entered into a joint venture with Korean Air Lines with respect to operations on transpacific routes between the United States and certain countries in Asia. We have not yet implemented this joint venture as it remains subject to receipt of required regulatory approvals in Korea.
|
2
Enhanced Commercial Agreements with Foreign Carriers.
We have a strategic equity investment in GOL Linhas Aéreas Inteligentes, S.A., the parent company of Gol Linhas Aéreas (a Brazilian air carrier), and an exclusive commercial cooperation relationship with GOL, which includes reciprocal codesharing and frequent flyer program participation, airport lounge access arrangements and joint sales cooperation.
We also own shares of China Eastern and entered into a joint marketing agreement with China Eastern in 2015 to expand our commercial cooperation and better connect the networks of the two airlines.
SkyTeam
. In addition to our marketing alliance agreements with individual foreign airlines, we are a member of the SkyTeam global airline alliance. The other members of SkyTeam are Aeroflot, Aerolíneas Argentinas, Aeroméxico, Air Europa, Air France, Alitalia, China Airlines, China Eastern, China Southern, CSA Czech Airlines, Garuda Indonesia, Kenya Airways, KLM, Korean Air, Middle East Airlines, Saudi Arabian Airlines, Tarom, Vietnam Airlines and Xiamen Airlines. Through alliance arrangements with other SkyTeam carriers, Delta is able to link its network with the route networks of the other member airlines, providing opportunities for increased connecting traffic while offering enhanced customer service through reciprocal codesharing and frequent flyer arrangements, airport lounge access programs and coordinated cargo operations.
Regional Carriers
We have air service agreements with domestic regional air carriers that feed traffic to our route system by serving passengers primarily in small and medium-sized cities. These arrangements enable us to better match capacity with demand in these markets. Approximately
16%
of our passenger revenue in 2017 was related to flying by these regional air carriers.
Through our regional carrier program, Delta Connection, we have contractual arrangements with regional carriers to operate aircraft using our "DL" designator code. We have contractual arrangements with:
|
•
|
ExpressJet Airlines, Inc. and SkyWest Airlines, Inc., both subsidiaries of SkyWest, Inc.;
|
|
•
|
Republic Airline, Inc. ("Republic"), a subsidiary of Republic Airways Holdings, Inc.;
|
|
•
|
Compass Airlines, LLC ("Compass") and GoJet Airlines, LLC, both subsidiaries of Trans States Holdings, Inc. ("Trans States"); and
|
|
•
|
Endeavor Air, Inc., which is a wholly owned subsidiary of ours.
|
Our contractual agreements with regional carriers primarily are capacity purchase arrangements, under which we control the scheduling, pricing, reservations, ticketing and seat inventories for the regional carriers' flights operating under our "DL" designator code. We are entitled to all ticket, cargo, mail, in-flight and ancillary revenues associated with these flights. We pay those airlines an amount, as defined in the applicable agreement, which is based on a determination of their cost of operating those flights and other factors intended to approximate market rates for those services. These capacity purchase agreements are long-term agreements, usually with initial terms of at least 10 years, which grant us the option to extend the initial term. Certain of these agreements provide us the right to terminate the entire agreement, or in some cases remove some of the aircraft from the scope of the agreement, for convenience at certain future dates.
SkyWest Airlines operates some flights for us under a revenue proration agreement. This proration agreement establishes a fixed dollar or percentage division of revenues for tickets sold to passengers traveling on connecting flight itineraries.
3
Frequent Flyer Program
Our SkyMiles
®
frequent flyer program ("SkyMiles program") is designed to retain and increase traveler loyalty by offering incentives to customers to increase travel on Delta. The SkyMiles program allows program members to earn mileage credit for travel awards by flying on Delta, its regional carriers and other participating airlines. Mileage credit may also be earned by using certain services offered by program participants, such as credit card companies, hotels and car rental agencies. In addition, individuals may purchase mileage credits. Miles do not expire, but are subject to the program rules. We reserve the right to terminate the program with six months advance notice, and to change the program's terms and conditions at any time without notice.
SkyMiles program mileage credits can be redeemed for air travel on Delta and participating airlines, for membership in our Delta Sky Clubs
®
and for other program participant awards. Mileage credits are subject to certain transfer restrictions and travel awards on partner airlines are subject to capacity-controlled seating. We offer last-seat availability for travel awards on our own flights (including most Delta Connection flights). In
2017
, program members redeemed more than 345 billion miles in the SkyMiles program for 14.9 million award redemptions. During this period, 7.9% of revenue miles flown on Delta were from award travel.
Fuel
Our results of operations are significantly impacted by changes in the price and availability of aircraft fuel. The following table shows our aircraft fuel consumption and costs.
|
Year
|
Gallons Consumed
(1)
(in millions)
|
Cost
(1)(2)
(in millions)
|
Average Price Per Gallon
(1)(2)
|
Percentage of Total Operating Expense
(1)(2)
|
||||||
|
2017
|
4,032
|
|
$
|
6,756
|
|
$
|
1.68
|
|
19.2
|
%
|
|
2016
|
4,016
|
|
$
|
5,985
|
|
$
|
1.49
|
|
18.3
|
%
|
|
2015
|
3,988
|
|
$
|
7,579
|
|
$
|
1.90
|
|
23.0
|
%
|
|
(1)
|
Includes the operations of our regional carriers operating under capacity purchase agreements.
|
|
(2)
|
Includes the impact of fuel hedge activity and refinery segment results.
|
General
We purchase most of our aircraft fuel under contracts that establish the price based on various market indices and therefore do not provide material protection against price increases or assure the availability of our fuel supplies. We also purchase aircraft fuel on the spot market, from off-shore sources and under contracts that permit the refiners to set the price.
Monroe Energy
Our wholly owned subsidiaries, Monroe Energy, LLC and MIPC, LLC (collectively, "Monroe") operate the Trainer refinery and related assets located near Philadelphia, Pennsylvania. The facilities include pipelines and terminal assets that allow the refinery to supply jet fuel to our airline operations throughout the Northeastern U.S., including our New York hubs at LaGuardia and JFK. These companies are distinct from us, operating under their own management teams and with their own boards of managers. We own Monroe as part of our strategy to mitigate the cost of the refining margin reflected in the price of jet fuel, as well as to maintain sufficiency of supply to our New York operations.
Refinery Operations.
The facility is capable of refining approximately 200,000 barrels of crude oil per day. In addition to jet fuel, the refinery's production consists of gasoline, diesel and other refined products ("non-jet fuel products"). Monroe sources domestic and foreign crude oil supply from a variety of providers.
Strategic Agreements.
Monroe exchanges the non-jet fuel products the refinery produces with third parties for jet fuel consumed in our airline operations.
Segments
. Because the products and services of Monroe's refinery operations are discrete from our airline services, segment results are prepared for our airline segment and our refinery segment. Financial information on our segment reporting can be found in
Note 14
of the Notes to the Consolidated Financial Statements.
4
Fuel Hedging Program
We have recently managed our fuel price risk through a hedging program intended to reduce the financial impact from changes in the price of fuel as fuel prices are subject to potential volatility.
We may utilize different contract and commodity types in this program and frequently test their economic effectiveness against our financial targets. We closely monitor the hedge portfolio and rebalance the portfolio based on market conditions, which may result in locking in gains or losses on hedge contracts prior to their settlement dates. In addition, we enter into derivatives with third parties to hedge financial risk related to Monroe’s refining margins.
Fuel Supply Availability
We are currently able to obtain adequate supplies of aircraft fuel, including fuel produced by Monroe or procured through the exchange of non-jet fuel products the refinery produces, and crude oil for Monroe's operations. However, it is impossible to predict the future availability or price of aircraft fuel and crude oil. Weather-related events, natural disasters, political disruptions or wars involving oil-producing countries, changes in government policy concerning aircraft fuel production, transportation, taxes or marketing, changes in refining capacity, environmental concerns and other unpredictable events may result in future fuel supply shortages and fuel price increases.
Other Businesses
Cargo
Through our global network, our cargo operations are able to connect the world's major freight gateways. We generate cargo revenues in domestic and international markets through the use of cargo space on regularly scheduled passenger aircraft. We are a member of SkyTeam Cargo, a global airline cargo alliance, whose other members are Aeroflot, Aerolíneas Argentinas, Aeroméxico Cargo, Air France-KLM Cargo, Alitalia Cargo, China Airlines Cargo, China Cargo Airlines, China Southern Cargo, Czech Airlines Cargo and Korean Air Cargo. SkyTeam Cargo offers a global network spanning six continents.
Ancillary Businesses
We have several other businesses arising from our airline operations, including aircraft maintenance, repair and overhaul ("MRO"), staffing and other services, vacation wholesale operations and our private jet operations. In
2017
, the total revenue from these businesses was approximately $1 billion.
|
•
|
In addition to providing maintenance and engineering support for our fleet of over 900 aircraft, our MRO operation, known as Delta TechOps, serves aviation and airline customers from around the world.
|
|
•
|
Delta Global Services provides services to us and to third parties, including staffing services, aviation solutions, professional security and training services.
|
|
•
|
Our vacation wholesale business, Delta Vacations, provides vacation packages to third-party consumers.
|
|
•
|
Our private jet operations, Delta Private Jets, provides aircraft charters, aircraft management and programs allowing members to purchase flight time by the hour.
|
Distribution and Expanded Product Offerings
Our tickets are sold through various distribution channels, including: (1) digital channels, such as delta.com and mobile applications/web, (2) telephone reservations, (3) online travel agencies and (4) traditional "brick and mortar" and other agencies. We make fare and product information widely available across those channels, ensuring customers always receive the best information and service options. An increasing number of our tickets are sold through Delta digital direct channels, driving more direct, personalized interactions with our customers and reducing distribution costs.
5
We have transformed distribution to a more retail oriented, merchandised approach by introducing well-defined and differentiated products for our customers. We offer distinct travel experiences with clear value propositions that enable customer choice. Delta One
TM
, Delta Premium Select, First Class and Delta Comfort+
TM
include varying premium amenities and services while Main Cabin and Basic Economy allow varying levels of pre-travel flexibility as well as exceptional service once onboard the aircraft. We expect that these merchandising initiatives as implemented across all of Delta's distribution channels will allow customers to better understand our product offerings, make it easier to buy the products they desire and increase customer satisfaction. This merchandising effort is most effective in Delta's digital channels where customers can compare all product options in a single, easy to understand display.
Technology Transformation
Significant progress was made in 2017 in the transformation of our information technology function to improve operational reliability and enhance disaster recovery capabilities. Most significantly, we opened a new data center to provide redundancy for our key systems and continue the enhancement of that facility. We also reduced the risk of technology system failures to our operations through additional disaster recovery processes and heightened emphasis on our information security program including through the hiring of an experienced information security professional as our Chief Information Security Officer.
We are engaged in a digital transformation by continuing to invest in technology that supports our operations and provides tools for our employees, with our long term goal to convert our technology into a competitive advantage. These investments include improvements to infrastructure and technology architecture to unify and improve access to data sources and continue innovations in customer facing applications. This digital transformation will enhance interactions with our customers and allow us to deliver more personalized service, further enhancing the customer experience and strengthening our brand and competitive position.
Competition
The airline industry is highly competitive, marked by significant competition with respect to routes, fares, schedules (both timing and frequency), services, products, customer service and frequent flyer programs. The industry has evolved through mergers and new entry, both domestically and internationally, and changes in international alliances. Consolidation in the airline industry, the rise of well-funded government sponsored international carriers, changes in international alliances and the creation of immunized joint ventures have altered, and will continue to alter, the competitive landscape in the industry, resulting in the formation of airlines and alliances with increased financial resources, more extensive global networks and more competitive cost structures.
Domestic
Our domestic operations are subject to competition from traditional network carriers, including American Airlines and United Airlines, national point-to-point carriers, including Alaska Airlines, JetBlue Airways and Southwest Airlines, and discount carriers, some of which may have lower costs than we do and provide service at low fares to destinations served by us. Point-to-point, discount and ultra low-cost carriers, including Spirit Airlines and Allegiant Air, place significant competitive pressure on network carriers in the domestic market. In particular, we face significant competition at our domestic hub and gateway airports either directly at those airports or at the hubs of other airlines that are located in close proximity to our hubs and gateways. We also face competition in smaller to medium-sized markets from regional jet operations of other carriers.
International
Our international operations are subject to competition from both foreign and domestic carriers. Competition is increasing from government-owned and -funded carriers in the Gulf region, including Emirates, Etihad Airways and Qatar Airways. These carriers have large numbers of international widebody aircraft on order and are increasing service to the U.S. These carriers are government-subsidized, which has allowed them to grow quickly, reinvest in their product and expand their global presence at the expense of U.S. airlines.
Through alliance and other marketing and codesharing agreements with foreign carriers, U.S. carriers have increased their ability to sell international transportation, such as services to and beyond traditional European and Asian gateway cities. Similarly, foreign carriers have obtained increased access to interior U.S. passenger traffic beyond traditional U.S. gateway cities through these relationships. In particular, alliances formed by domestic and foreign carriers, including SkyTeam, the Star Alliance (among United Airlines, Lufthansa German Airlines, Air Canada and others) and the oneworld alliance (among American Airlines, British Airways, Qantas and others) have enhanced competition in international markets.
6
In addition, several joint ventures among U.S. and foreign carriers, including our transatlantic and transpacific joint ventures, have received grants of antitrust immunity allowing the participating carriers to coordinate schedules, pricing, sales and inventory. Other joint ventures that have received antitrust immunity include a transatlantic alliance among United Airlines, Air Canada and Lufthansa German Airlines, a transpacific joint venture between United Airlines and All Nippon Airways, a transatlantic joint venture among American Airlines, British Airways and Iberia and a transpacific joint venture between American Airlines and Japan Air Lines.
Regulatory Matters
The DOT and the Federal Aviation Administration (the "FAA") exercise regulatory authority over air transportation in the U.S. The DOT has authority to issue certificates of public convenience and necessity required for airlines to provide domestic air transportation. An air carrier that the DOT finds fit to operate is given authority to operate domestic and international air transportation (including the carriage of passengers and cargo). Except for constraints imposed by regulations regarding "Essential Air Services," which are applicable to certain small communities, airlines may terminate service to a city without restriction.
The DOT has jurisdiction over certain economic and consumer protection matters, such as unfair or deceptive practices and methods of competition, advertising, denied boarding compensation, baggage liability and disabled passenger transportation. The DOT also has authority to review certain joint venture agreements between domestic and international carriers and engages in regulation of economic matters such as slot transactions. The FAA has primary responsibility for matters relating to the safety of air carrier flight operations, including airline operating certificates, control of navigable air space, flight personnel, aircraft certification and maintenance and other matters affecting air safety.
Authority to operate international routes and international codesharing arrangements is regulated by the DOT and by the governments of the foreign countries involved. International certificate authorities are also subject to the approval of the U.S. President for conformance with national defense and foreign policy objectives.
The Transportation Security Administration and the U.S. Customs and Border Protection, each a division of the Department of Homeland Security, are responsible for certain civil aviation security matters, including passenger and baggage screening at U.S. airports and international passenger prescreening prior to entry into or departure from the U.S.
Airlines are also subject to various other federal, state, local and foreign laws and regulations. For example, the U.S. Department of Justice has jurisdiction over airline competition matters. The U.S. Postal Service has authority over certain aspects of the transportation of mail. Labor relations in the airline industry, as discussed below, are generally governed by the Railway Labor Act. Environmental matters are regulated by various federal, state, local and foreign governmental entities. Privacy of passenger and employee data is regulated by domestic and foreign laws and regulations.
Fares and Rates
Airlines set ticket prices in all domestic and most international city pairs with minimal governmental regulation, and the industry is characterized by significant price competition. Certain international fares and rates are subject to the jurisdiction of the DOT and the governments of the foreign countries involved. Many of our tickets are sold by travel agents, and fares are subject to commissions, overrides and discounts paid to travel agents, brokers and wholesalers.
7
Route Authority
Our flight operations are authorized by certificates of public convenience and necessity and also by exemptions and limited-entry frequency awards issued by the DOT. The requisite approvals of other governments for international operations are controlled by bilateral agreements (and a multilateral agreement in the case of the U.S. and the European Union) with, or permits or approvals issued by, foreign countries. Because international air transportation is governed by bilateral or other agreements between the U.S. and the foreign country or countries involved, changes in U.S. or foreign government aviation policies could result in the alteration or termination of such agreements, diminish the value of our international route authorities or otherwise affect our international operations. Bilateral agreements between the U.S. and various foreign countries served by us are subject to renegotiation from time to time. The U.S. government has negotiated "Open Skies" agreements with many countries, which allow unrestricted access between the U.S. and the foreign markets. These agreements include separate agreements with the European Union and Japan.
Certain of our international route authorities are subject to periodic renewal requirements. We request extension of these authorities when and as appropriate. While the DOT usually renews temporary authorities on routes where the authorized carrier is providing a reasonable level of service, there is no assurance this practice will continue in general or with respect to a specific renewal. Dormant route authorities may not be renewed in some cases, especially where another U.S. carrier indicates a willingness to provide service.
Airport Access
Operations at three major domestic airports and certain foreign airports served by us are regulated by governmental entities through allocations of "slots" or similar regulatory mechanisms which limit the rights of carriers to conduct operations at those airports. Each slot represents the authorization to land at or take off from the particular airport during a specified time period.
In the U.S., the FAA currently regulates the allocation of slots, slot exemptions, operating authorizations, or similar capacity allocation mechanisms at Reagan National in Washington, D.C. and LaGuardia and JFK in the New York City area. Our operations at these airports generally require the allocation of slots or analogous regulatory authorizations. Similarly, our operations at Tokyo's Narita and Haneda airports, London's Heathrow airport and other international airports are regulated by local slot coordinators pursuant to the International Air Transport Association's Worldwide Scheduling Guidelines and applicable local law. We currently have sufficient slots or analogous authorizations to operate our existing flights, and we have generally been able to obtain the rights to expand our operations and to change our schedules. There is no assurance, however, that we will be able to do so in the future because, among other reasons, such allocations are subject to changes in governmental policies.
Environmental Matters
Our operations are subject to a number of international, federal, state and local laws and regulations governing protection of the environment, including regulation of greenhouse gases and other air emissions, noise reduction, water discharges, aircraft drinking water, storage and use of petroleum and other regulated substances, and the management and disposal of hazardous waste, substances and materials.
Emissions
. Greenhouse gas emissions by the aviation industry and their impact on climate change have become a particular focus in the international community and within the U.S. For several years, the European Union has required its member states to implement regulations to include aviation in its Emissions Trading Scheme ("ETS"). Under these regulations, any airline with flights originating or landing in the European Union is subject to the ETS and, beginning in 2012, was required to purchase emissions allowances if the airline exceeds the number of free allowances allocated to it under the ETS. The ETS was amended to apply only to flights within the European Economic Area from 2013 through 2016. In 2017, the EU extended the exemption for foreign flights through 2023 given the International Civil Aviation Organization’s ("ICAO") adoption of a global market-based program.
8
In October 2016, ICAO formally adopted a global, market-based emissions offset program known as the Carbon Offsetting and Reduction Scheme for International Aviation. This program is designed to achieve a medium-term goal for the aviation industry of achieving carbon-neutral growth in international aviation beginning in 2020. A pilot phase of the offset program will begin in 2021, followed by a first phase of the program beginning in 2024 and a second phase beginning in 2027. Countries can voluntarily participate in the pilot and first phase, but participation in the second phase is mandatory. In 2016, ICAO also adopted new aircraft certification standards to reduce carbon dioxide (CO
2
) emissions from aircraft. The new aircraft certification standards will apply to new aircraft types in 2020 and to new in-production aircraft starting in 2023 but no later than 2028. It is important to note that the standards will not apply to existing in-service aircraft. However, exemption from the certification requirement would provide no protection from taxation schemes based on CO
2
emissions.
In July 2016, the U.S. Environmental Protection Agency ("EPA") issued a final finding under the Clean Air Act that greenhouse gases threaten the public health and welfare, and further determined that aircraft cause or contribute to greenhouse gases. The endangerment finding does not establish standards, but triggers an obligation for the EPA to regulate greenhouse gas emissions from aircraft. The EPA has historically implemented air emissions control standards adopted by ICAO; therefore, the ICAO aircraft engine certification standards are expected to influence the development of any EPA greenhouse gas emission standards for aircraft.
We may face additional regulation of aircraft emissions in the U.S. and abroad and become subject to further taxes, charges or additional requirements to obtain permits or purchase allowances or emission credits for greenhouse gas emissions in various jurisdictions. Additional regulation could result in taxation or permitting requirements from multiple jurisdictions for the same operations and significant costs for us and the airline industry. In addition to direct costs, such regulation could result in increased fuel costs passed through from fuel suppliers affected by any such regulations. We are monitoring and evaluating the potential impact of such legislative and regulatory developments.
We seek to minimize the impact of greenhouse gas emissions from our operations through reductions in our fuel consumption and other efforts, and have realized reductions in our greenhouse gas emission levels since 2005. We have reduced the fuel needs of our aircraft fleet through the retirement of older, less fuel efficient aircraft and replacement with newer, more fuel efficient aircraft. In addition, we have implemented fuel saving procedures in our flight and ground support operations that further reduce carbon emissions. We are also supporting efforts to develop alternative fuels and efforts to modernize the air traffic control system in the U.S. as part of our efforts to reduce our emissions and minimize our impact on the environment.
Noise
. The Airport Noise and Capacity Act of 1990 recognizes the rights of operators of airports with noise problems to implement local noise abatement programs so long as such programs do not interfere unreasonably with interstate or foreign commerce or the national air transportation system. This statute generally provides that local noise restrictions on Stage 3 aircraft first effective after October 1, 1990, require FAA approval. While we have had sufficient scheduling flexibility to accommodate local noise restrictions in the past, our operations could be adversely impacted if locally-imposed regulations become more restrictive or widespread. In addition, foreign governments may allow airports to enact similar restrictions, which could adversely impact our international operations or require significant expenditure in order for our aircraft to comply with the restrictions.
Refinery Matters
. Monroe's operation of the Trainer refinery is subject to numerous environmental laws and extensive regulations, including those relating to the discharge of materials into the environment, waste management, pollution prevention measures and greenhouse gas emissions.
Under the Energy Independence and Security Act of 2007, the EPA has adopted Renewable Fuel Standards ("RFS") that mandate the blending of renewable fuels into gasoline and on-road diesel ("Transportation Fuels"). Renewable Identification Numbers ("RINs") are assigned to renewable fuels produced or imported into the U.S. that are blended into Transportation Fuels to demonstrate compliance with this obligation. A refinery may meet its obligation under RFS by blending the necessary volumes of renewable fuels with Transportation Fuels or by purchasing RINs in the open market or through a combination of blending and purchasing RINs. Because the refinery operated by Monroe does not blend renewable fuels, it must purchase its RINs requirement in the secondary market or obtain a waiver from the EPA.
Other Environmental Matters
. We are subject to certain environmental laws and contractual obligations governing the management and release of regulated substances, which may require the investigation and remediation of affected sites. Soil and/or ground water impacts have been identified at certain of our current or former leaseholds at several domestic airports. To address these impacts, we have a program in place to investigate and, if appropriate, remediate these sites. Although the ultimate outcome of these matters cannot be predicted with certainty, we believe that the resolution of these matters will not have a material adverse effect on our Consolidated Financial Statements.
9
Civil Reserve Air Fleet Program
We participate in the Civil Reserve Air Fleet program (the "CRAF Program"), which permits the U.S. military to use the aircraft and crew resources of participating U.S. airlines during airlift emergencies, national emergencies or times of war. We have agreed to make available under the CRAF Program a portion of our international aircraft during the contract period ending September 30, 2018. The CRAF Program has only been activated twice since it was created in 1951.
Employee Matters
Railway Labor Act
Our relations with labor unions representing our airline employees in the U.S. are governed by the Railway Labor Act. Under the Railway Labor Act, a labor union seeking to represent an unrepresented craft or class of employees is required to file with the National Mediation Board (the "NMB") an application alleging a representation dispute, along with authorization cards signed by at least 50% of the employees in that craft or class. The NMB then investigates the dispute and, if it finds the labor union has obtained a sufficient number of authorization cards, conducts an election to determine whether to certify the labor union as the collective bargaining representative of that craft or class. A labor union will be certified as the representative of the employees in a craft or class if more than 50% of votes cast are for that union. A certified labor union would commence negotiations toward a collective bargaining agreement with the employer.
Under the Railway Labor Act, a collective bargaining agreement between an airline and a labor union does not expire, but instead becomes amendable as of a stated date. Either party may request that the NMB appoint a federal mediator to participate in the negotiations for a new or amended agreement. If no agreement is reached in mediation, the NMB may determine, at any time, that an impasse exists and offer binding arbitration. If either party rejects binding arbitration, a 30-day "cooling off" period begins. At the end of this 30-day period, the parties may engage in “self help,” unless the U.S. President appoints a Presidential Emergency Board ("PEB") to investigate and report on the dispute. The appointment of a PEB maintains the "status quo" for an additional 60 days. If the parties do not reach agreement during this period, the parties may then engage in self help. Self help includes, among other things, a strike by the union or the imposition of proposed changes to the collective bargaining agreement by the airline. Congress and the President have the authority to prevent self help by enacting legislation that, among other things, imposes a settlement on the parties.
Collective Bargaining
As of
December 31, 2017
, we had approximately
87,000
full-time equivalent employees, approximately
19%
of whom were represented by unions. The following table shows our domestic airline employee groups that are represented by unions.
|
Employee Group
|
Approximate Number of Active Employees Represented
|
Union
|
Date on which Collective Bargaining Agreement Becomes Amendable
|
||
|
Delta Pilots
|
13,234
|
|
ALPA
|
December 31, 2019
|
|
|
Delta Flight Superintendents (Dispatchers)
|
420
|
|
PAFCA
|
March 31, 2018
|
|
|
Endeavor Air Pilots
|
1,805
|
|
ALPA
|
January 1, 2024
|
|
|
Endeavor Air Flight Attendants
|
1,160
|
|
AFA
|
December 31, 2018
|
|
|
Endeavor Air Dispatchers
|
55
|
|
PAFCA
|
December 31, 2018
|
|
In addition,
192
refinery employees of Monroe are represented by the United Steel Workers under an agreement that expires on February 28, 2019. This agreement is governed by the National Labor Relations Act
("NLRA")
, which generally allows either party to engage in self help upon the expiration of the agreement.
Labor unions periodically engage in organizing efforts to represent various groups of our employees, including at our operating subsidiaries, that are not represented for collective bargaining purposes.
10
Executive Officers of the Registrant
Edward H. Bastian, Age 60
:
Chief Executive Officer of Delta since May 2016; President of Delta (September 2007 - May 2016); President of Delta and Chief Executive Officer Northwest Airlines, Inc. (October 2008 - December 2009); President and Chief Financial Officer of Delta (September 2007 - October 2008); Executive Vice President and Chief Financial Officer of Delta (July 2005 - September 2007); Chief Financial Officer of Acuity Brands (June 2005 - July 2005); Senior Vice President - Finance and Controller of Delta (2000 - April 2005); Vice President and Controller of Delta (1998 - 2000).
Peter W. Carter, Age 54
:
Executive Vice President - Chief Legal Officer of Delta since July 2015; Partner of Dorsey & Whitney LLP (1999 - 2015), including co-chair of Securities Litigation and Enforcement practice group, chair of Policy Committee and chair of trial department.
Glen W. Hauenstein, Age 57
:
President of Delta since May 2016; Executive Vice President - Chief Revenue Officer of Delta (August 2013 - May 2016); Executive Vice President - Network Planning and Revenue Management of Delta (April 2006 - July 2013); Executive Vice President and Chief of Network and Revenue Management of Delta (August 2005 - April 2006); Vice General Director - Chief Commercial Officer and Chief Operating Officer of Alitalia (2003 - 2005); Senior Vice President- Network of Continental Airlines (2003); Senior Vice President - Scheduling of Continental Airlines (2001 - 2003); Vice President Scheduling of Continental Airlines (1998 - 2001).
Paul A. Jacobson, Age 46:
Executive Vice President - Chief Financial Officer of Delta since August 2013; Senior Vice President and Chief Financial Officer of Delta (March 2012 - July 2013); Senior Vice President and Treasurer of Delta (December 2007 - March 2012); Vice President and Treasurer of Delta (August 2005 - December 2007).
Rahul Samant, Age 51:
Executive Vice President - Chief Information Officer of Delta since January 2018; Senior Vice President and Chief Information Officer of Delta (February 2016 - December 2017); Senior Vice President and Chief Digital Officer of American International Group, Inc. (January 2015 - February 2016); Senior Vice President and Global Head, Application Development and Management of American International Group, Inc. (September 2012 - December 2014); Managing Director of Bank of America (1999 - September 2012).
Steven M. Sear, Age 52
:
President, International and Executive Vice President - Global Sales of Delta since February 2016; Senior Vice President - Global Sales of Delta (December 2011 - February 2016); Vice President - Global Sales of Delta (October 2008 - December 2011); Vice President - Sales & Customer Care of Northwest Airlines (June 2005 - October 2008).
Joanne D. Smith, Age 59:
Executive Vice President and Chief Human Resources Officer of Delta since October 2014; Senior Vice President - In-Flight Service of Delta (March 2007 - September 2014); Vice President - Marketing of Delta (November 2005 - February 2007); President of Song (January 2005 - October 2005); Vice President - Marketing and Customer Service of Song (November 2002 - December 2004).
W. Gil West, Age 57:
Senior Executive Vice President and Chief Operating Officer of Delta since February 2016; Executive Vice President and Chief Operating Officer of Delta (March 2014 - February 2016); Senior Vice President - Airport Customer Service and Technical Operations of Delta (February 2012 - February 2014); Senior Vice President - Airport Customer Service of Delta (March 2008 - January 2012); President and Chief Executive Officer of Laidlaw Transit Services (2006 - 2007).
Additional Information
We make available free of charge on our website our Annual Report on Form 10-K, our Quarterly Reports on Form 10-Q, our Current Reports on Form 8-K and amendments to those reports as soon as reasonably practicable after these reports are filed with or furnished to the Securities and Exchange Commission. Information on our website is not incorporated into this Form 10-K or our other securities filings and is not a part of those filings.
11
ITEM 1A. RISK FACTORS
Risk Factors Relating to Delta
Our business and results of operations are dependent on the price of aircraft fuel. High fuel costs or cost increases, including in the cost of crude oil, could have a material adverse effect on our operating results.
Our operating results are significantly impacted by changes in the price of aircraft fuel. Over the last decade, fuel prices have increased substantially at times and have been highly volatile during the last several years. In
2017
, our average fuel price per gallon, including the impact of fuel hedges, was
$1.68
, a
12.8%
increase from our average fuel price in
2016
. In
2016
, our average fuel price per gallon was
$1.49
, a 21.6% decrease from our average fuel price in
2015
. In
2015
, our average fuel price per gallon was
$1.90
, a 45.2% decrease from our average fuel price in 2014. Fuel costs represented
19.2%
,
18.3%
and
23.0%
of our operating expense in
2017
,
2016
and
2015
, respectively.
Our ability to pass along rapidly increasing fuel costs to our customers may be affected by the competitive nature of the airline industry. Because passengers often purchase tickets well in advance of their travel, a significant rapid increase in fuel price may result in the fare charged not covering that increase. At times in the past, we often were not able to increase our fares to offset fully the effect of increases in fuel costs, and we may not be able to do so in the future.
We acquire a significant amount of jet fuel from our wholly owned subsidiary, Monroe, and through strategic agreements that Monroe has with third parties. The cost of the fuel we purchase under these arrangements remains subject to volatility in the cost of crude oil and jet fuel. In addition, we continue to purchase a significant amount of aircraft fuel in addition to what we obtain from Monroe. Our aircraft fuel purchase contracts alone do not provide material protection against price increases as these contracts typically establish the price based on industry standard market price indices.
Fuel hedging activities are intended to manage the financial impact of the volatility in the price of jet fuel. The effects of rebalancing our hedge portfolio and mark-to-market adjustments may have a negative effect on our financial results.
We have recently managed our fuel price risk through a hedging program intended to reduce the financial impact from changes in the price of fuel as fuel prices are subject to potential volatility.
We may utilize different contract and commodity types in this program and test their economic effectiveness against our financial targets. We closely monitor the hedge portfolio and rebalance the portfolio based on market conditions, which may result in locking in gains or losses on hedge contracts prior to their settlement dates. Our hedging program may not be successful in providing price protection due to market conditions and the choice of hedging instruments. In addition, we record mark-to-market adjustments ("MTM adjustments") on our fuel hedges. MTM adjustments are based on market prices at the end of the reporting period for contracts settling in future periods. Losses from rebalancing or MTM adjustments (or both) may have a negative impact on our financial results.
Our fuel hedge contracts may contain margin funding requirements, which require us to post margin to counterparties or cause counterparties to post margin to us as market prices in the underlying hedged items change. If fuel prices decrease significantly from the levels existing at the time we enter into fuel hedge contracts, we may be required to post a significant amount of margin, which could have a material impact on the level of our unrestricted cash and cash equivalents and short-term investments.
Significant extended disruptions in the supply of aircraft fuel, including from Monroe, could have a material adverse effect on our operations and operating results.
Weather-related events, natural disasters, political disruptions or wars involving oil-producing countries, changes in governmental policy concerning aircraft fuel production, transportation, taxes or marketing, changes in refining capacity, environmental concerns and other unpredictable events may impact crude oil and fuel supply and could result in shortages in the future. Shortages in fuel supplies could have negative effects on our results of operations and financial condition.
12
Because we acquire a large amount of our jet fuel from Monroe, the disruption or interruption of production at the refinery could have an impact on our ability to acquire jet fuel needed for our operations. Disruptions or interruptions of production at the refinery could result from various sources including a major accident or mechanical failure, interruption of supply or delivery of crude oil, work stoppages relating to organized labor issues, or damage from severe weather or other natural or man-made disasters, including acts of terrorism. If the refinery were to experience an interruption in operations, disruptions in fuel supplies could have negative effects on our results of operations and financial condition. In addition, the financial benefits from the operation of the refinery could be materially adversely affected (to the extent not recoverable through insurance) because of lost production and repair costs.
If Monroe's cost of producing non-jet fuel products exceeds the value it receives for those products, the financial benefits we expect to achieve through the ownership of the refinery and our consolidated results of operations could be materially adversely affected.
Our significant investments in airlines in other parts of the world and the commercial relationships that we have with those carriers may not produce the returns or results we expect.
An important part of our strategy to expand our global network has been to make significant investments in airlines in other parts of the world and expand our commercial relationships with these carriers. We expect to continue exploring ways to expand our relationships with other carriers as part of our global business strategy. These investments and relationships involve significant challenges and risks, including that we may not realize a satisfactory return on our investment, that they may distract management from our operations or that they may not generate the expected revenue synergies. These events could have a material adverse effect on our operating results or financial condition.
In addition, we are dependent on these other carriers for significant aspects of our network in the regions in which they operate. While we work closely with these carriers, we do not have control over their operations or business methods. To the extent that the operations of any of these carriers are disrupted over an extended period of time or their actions subject us to the consequences of failure to comply with laws and regulations, our results of operations may be adversely affected. We also may be subject to consequences from any improper behavior of joint venture partners, including for failure to comply with anti-corruption laws such as the United States Foreign Corrupt Practices Act.
We are at risk of losses and adverse publicity stemming from a serious accident involving our aircraft or aircraft of our airline partners.
An aircraft crash or other serious accident could expose us to significant liability. Although we believe that our insurance coverage is appropriate, we may be forced to bear substantial losses from an accident in the event that the coverage was not sufficient.
In addition, any accident involving an aircraft that we operate or an aircraft that is operated by an airline that is one of our regional carriers or codeshare, alliance or joint venture partners could create a negative public perception about safety, which could harm our reputation, resulting in air travelers being reluctant to fly on our aircraft and therefore harm our business.
Breaches or lapses in the security of our technology systems and the data we store could compromise passenger or employee information and expose us to liability, possibly having a material adverse effect on our business.
As a regular part of our ordinary business operations, we collect and store sensitive data, including personal information of our passengers and employees and information of our business partners. The secure operation of the networks and systems on which this type of information is stored, processed and maintained is critical to our business operations and strategy.
13
Our information systems are subject to an increasing threat of continually evolving cybersecurity risks. Unauthorized parties may attempt to gain access to our systems or information, including through fraud or other means of deception. Hardware or software we develop or acquire may contain defects that could unexpectedly compromise information security. The methods used to obtain unauthorized access, disable or degrade service or sabotage systems are constantly evolving and may be difficult to anticipate or to detect for long periods of time. As a result of these types of risks and regular attacks, we regularly review and update procedures and processes to prevent and protect against unauthorized access to our systems and information and inadvertent misuse of data. However, the constantly changing nature of the threats means that we may not be able to prevent all data security breaches or misuse of data. The compromise of our technology systems resulting in the loss, disclosure, misappropriation of, or access to, customers', employees' or business partners' information or failure to comply with regulatory or contractual obligations with respect to such information could result in legal claims or proceedings, liability or regulatory penalties under laws protecting the privacy of personal information, disruption to our operations and damage to our reputation, any or all of which could adversely affect our business.
Disruptions of our information technology infrastructure could interfere with our operations, possibly having a material adverse effect on our business.
Disruptions in our information technology network could result from a technology error or failure impacting our internal systems, whether hosted internally at our data centers or externally at third-party locations, or large scale external interruption in technology infrastructure support on which we depend, such as power, telecommunications or the internet. The operation of our technology systems and the use of related data may also be vulnerable to a variety of other sources of interruption, including natural disasters, terrorist attacks, computer viruses, hackers and other security issues. A significant individual, sustained or repeated failure of our network, including third-party networks we utilize and on which we depend, could impact our customer service and result in increased costs. While we have in place initiatives to prevent disruptions and disaster recovery plans and continue to invest in improvements to these initiatives and plans, these measures may not be adequate to prevent a business disruption and its adverse financial and reputational consequences to our business.
Failure of our technology to perform effectively could have an adverse effect on our business.
We are dependent on technology initiatives to provide customer service and operational effectiveness in order to compete in the current business environment. For example, we have made and continue to make significant investments in customer facing technology such as delta.com, mobile device applications, check-in kiosks, customer service applications, airport information displays and related initiatives, including security for these initiatives. We are also investing in significant upgrades to technology infrastructure and other supporting systems. The performance, reliability and security of the technology are critical to our ability to serve customers. If our technology does not perform effectively, our business and operations would be negatively affected, which could be material.
Agreements governing our debt, including credit agreements, include financial and other covenants. Failure to comply with these covenants could result in events of default.
Our credit facilities have various financial and other covenants that require us to maintain, depending on the particular agreement, minimum fixed charge coverage ratios, minimum liquidity and/or minimum collateral coverage ratios. The value of the collateral that has been pledged in each facility may change over time due to appraisals of collateral required by our credit agreements and indentures. These changes could result from factors that are not under our control. A decline in the value of collateral could result in a situation where it may be difficult to maintain the collateral coverage ratio. In addition, the credit facilities contain other negative covenants customary for such financings. These covenants are subject to important exceptions and qualifications. If we fail to comply with these covenants and are unable to remedy or obtain a waiver or amendment, an event of default would result.
The credit facilities also contain other events of default customary for such financings. If an event of default were to occur, the lenders could, among other things, declare outstanding amounts due and payable. In addition, an event of default or declaration of acceleration under any of the credit facilities could also result in an event of default under other of our financing agreements. The acceleration of significant amounts of debt could require us to renegotiate, repay or refinance the obligations under the credit facilities or other financing arrangements.
14
Employee strikes and other labor-related disruptions may adversely affect our
operations.
Our business is labor intensive, utilizing large numbers of pilots, flight attendants, aircraft maintenance technicians, ground support personnel and other personnel. As of
December 31, 2017
, approximately
19%
of our workforce, primarily pilots, was unionized. Relations between air carriers and labor unions in the United States are governed by the Railway Labor Act, which provides that a collective bargaining agreement between an airline and a labor union does not expire, but instead becomes amendable as of a stated date. The Railway Labor Act generally prohibits strikes or other types of self help actions both before and after a collective bargaining agreement becomes amendable, unless and until the collective bargaining processes required by the Railway Labor Act have been exhausted. Monroe's relations with unions representing its employees are governed by the NLRA, which generally allows self help after a collective bargaining agreement expires.
If we or our subsidiaries are unable to reach agreement with any of our unionized work groups on future negotiations regarding the terms of their collective bargaining agreements or if additional segments of our workforce become unionized, we may be subject to work interruptions or stoppages, subject to the requirements of the Railway Labor Act or the NLRA, as the case may be. Strikes or labor disputes with our unionized employees may adversely affect our ability to conduct business. Likewise, if third-party regional carriers with whom we have contract carrier agreements are unable to reach agreement with their unionized work groups in current or future negotiations regarding the terms of their collective bargaining agreements, those carriers may be subject to work interruptions or stoppages, subject to the requirements of the Railway Labor Act, which could have a negative impact on our operations.
Our results can fluctuate due to the effects of weather, natural disasters and seasonality.
Our results of operations are impacted by severe weather, natural disasters and seasonality. Severe weather conditions and natural disasters (or other environmental events) can significantly disrupt service and create air traffic control problems. These events decrease revenue and can also increase costs. In addition, increases in the frequency, severity or duration of thunderstorms, hurricanes, typhoons or other severe weather events, including from changes in the global climate, could result in increases in delays and cancellations, turbulence-related injuries and fuel consumption to avoid such weather, any of which could result in loss of revenue and higher costs. In addition, demand for air travel is typically higher in the June and September quarters, particularly in international markets, because there is more vacation travel during these periods than during the remainder of the year. The seasonal shifting of demand causes our financial results to vary on a seasonal basis. Because of fluctuations in our results from weather, natural disasters and seasonality, operating results for a historical period are not necessarily indicative of operating results for a future period and operating results for an interim period are not necessarily indicative of operating results for an entire year.
An extended disruption in services provided by third parties, including third-party regional
carriers, could have a material adverse effect on our results of operations.
We utilize the services of third parties in a number of areas in support of our operations that are integral to our business, including third-party carriers in the Delta Connection program. While we have agreements with these providers that define expected service performance, we do not have direct control over their operations. In particular, some third-party regional carriers are facing a shortage of qualified pilots due to government mandated increases in flight experience required for pilots working for airlines. If this shortage becomes more widespread, third-party regional carriers may not be able to comply with their obligations to us. To the extent that a significant disruption in services occurs because third party providers, including regional carriers, are unable to perform their obligations over an extended period of time, our revenue may be reduced or our expenses may be increased resulting in a material adverse effect on our results of operations.
15
The failure or inability of insurance to cover a significant liability related to an environmental or other incident associated with the operation of the Monroe refinery could have a material adverse effect on our consolidated financial results.
Monroe's refining operations are subject to various hazards unique to refinery operations, including explosions, fires, toxic emissions and natural catastrophes. Monroe could incur substantial losses, including cleanup costs, fines and other sanctions and third-party claims, and its operations could be interrupted, as a result of such an incident. Monroe's insurance coverage does not cover all potential losses, costs or liabilities, and Monroe could suffer losses for uninsurable or uninsured risks or in amounts greater than its insurance coverage. In addition, Monroe's ability to obtain and maintain adequate insurance may be affected by conditions in the insurance market over which it has no control. If Monroe were to incur a significant liability for which it is not fully insured or for which insurance companies do not or are unable to provide coverage, this could have a material adverse effect on our consolidated financial results of operations or consolidated financial position.
The operation of the refinery by Monroe is subject to significant environmental regulation. Failure to comply with environmental regulations or the enactment of additional regulation could have a negative impact on our consolidated financial results.
Monroe's operations are subject to extensive environmental, health and safety laws and regulations, including those relating to the discharge of materials into the environment, waste management, pollution prevention measures and greenhouse gas emissions. Monroe could incur fines and other sanctions, cleanup costs and third-party claims as a result of violations of or liabilities under environmental, health and safety requirements, which if significant, could have a material adverse effect on our financial results. In addition, the enactment of new environmental laws and regulations, including any laws or regulations relating to greenhouse gas emissions, could significantly increase the level of expenditures required for Monroe or restrict its operations.
In particular, under the Energy Independence and Security Act of 2007, the EPA has adopted RFS that mandate the blending of renewable fuels into Transportation Fuels. RINs are assigned to renewable fuels produced or imported into the U.S. that are blended into Transportation Fuels to demonstrate compliance with this obligation. A refinery may meet its obligation under RFS by blending the necessary volumes of renewable fuels with Transportation Fuels or by purchasing RINs in the open market or through a combination of blending and purchasing RINs.
Because the refinery operated by Monroe does not blend renewable fuels, it must purchase its RINs requirement in the secondary market or obtain a waiver from the EPA. As a result, Monroe is exposed to the market price of RINs. Market prices for RINs have been volatile, marked by periods of sharp increases and decreases. We cannot predict the future prices of RINs. Purchasing RINs at elevated prices could have a material impact on our results of operations and cash flows.
Existing laws or regulations could change, and the minimum volumes of renewable fuels that must be blended with refined petroleum products may increase. Increases in the volume of renewable fuels that must be blended into Monroe's products could limit the refinery's production if sufficient numbers of RINs are not available for purchase or relief from this requirement is not obtained, which could have an adverse effect on our consolidated financial results.
If we lose senior management and other key employees and they are not replaced by individuals with comparable skills, our operating results could be adversely affected.
We are dependent on the experience and industry knowledge of our officers and other key employees to design and execute our business plans. If we experience a substantial turnover in our leadership and other key employees, and these persons are not replaced by individuals with comparable skills, our performance could be materially adversely impacted. Furthermore, we may be unable to attract and retain additional qualified executives as needed in the future.
Our reputation and brand could be damaged if we are exposed to significant adverse publicity through social media.
We operate in a highly visible, public environment with significant exposure to social media. Adverse publicity, whether justified or not, can rapidly spread through social or digital media. In particular, passengers can use social media to provide feedback about their interaction with us in a manner that can be quickly and broadly disseminated. To the extent we are unable to respond timely and appropriately to adverse publicity, our brand and reputation may be damaged. Significant damage to our overall reputation and brand image could have a negative impact on our financial results.
16
Risk Factors Relating to the Airline Industry
Terrorist attacks, geopolitical conflict or security events may adversely affect our business, financial condition and operating results.
Terrorist attacks, geopolitical conflict or security events, or fear of such events, could have a significant adverse effect on our business. Despite significant security measures at airports and airlines, the airline industry remains a high profile target for terrorist groups. We constantly monitor threats from terrorist groups and individuals, including from violent extremists both internationally and domestically, with respect to direct threats against our operations and in ways not directly related to the airline industry. In addition, the impact on our operations of avoiding areas of the world, including airspace, in which there are geopolitical conflicts and the targeting of commercial aircraft by parties to those conflicts can be significant. Security events, primarily from external sources but also from potential insider threats, also pose a significant risk to our passenger and cargo operations. These events could include random acts of violence and could occur in public areas that we cannot control.
Terrorist attacks, geopolitical conflict or security events, or fear of such events, even if not made directly on or involving the airline industry, could have significant negative impact on us by discouraging passengers from flying, leading to decreased ticket sales and increased refunds. In addition, potential costs from these types of events include increased security costs, impacts from avoiding flight paths over areas in which conflict is occurring, reputational harm and other costs. If any or all of these types of events occur, they could have a material adverse effect on our business, financial condition and results of operations.
The global airline industry is highly competitive and, if we cannot successfully compete in the marketplace, our business, financial condition and operating results will be materially adversely affected.
The airline industry is highly competitive, marked by significant competition with respect to routes, fares, schedules (both timing and frequency), services, products, customer service and frequent flyer programs. Consolidation in the airline industry, the rise of well-funded government sponsored international carriers, changes in international alliances and the creation of immunized joint ventures have altered and will continue to alter the competitive landscape in the industry, resulting in the formation of airlines and alliances with increased financial resources, more extensive global networks and competitive cost structures.
Our domestic operations are subject to competition from traditional network carriers, including American Airlines and United Airlines, national point-to-point carriers, including Alaska Airlines, JetBlue Airways and Southwest Airlines, and discount carriers, some of which may have lower costs than we do and provide service at low fares to destinations served by us. Point-to-point, discount and ultra low-cost carriers, including Spirit Airlines and Allegiant Air, place significant competitive pressure on network carriers in the domestic market. As a result, we face significant competition at our domestic hub and gateway airports either directly at those airports or at the hubs of other airlines that are located in close proximity to our hubs and gateways. We also face competition in smaller to medium-sized markets from regional jet operations of other carriers. Our ability to compete in the domestic market effectively depends, in part, on our ability to maintain a competitive cost structure. If we cannot maintain our costs at a competitive level, then our business, financial condition and operating results could be materially adversely affected.
Our international operations are subject to competition from both foreign and domestic carriers. Competition is significant from government-owned and -funded carriers in the Gulf region, including Emirates, Etihad Airways and Qatar Airways. These carriers have large numbers of international widebody aircraft on order and are increasing service to the U.S. from their hubs in the Middle East. Several of these carriers, along with carriers from China, India and Southeast Asia, are government-subsidized, which has allowed them to grow quickly, reinvest in their product and expand their global presence at the expense of U.S. airlines.
Through alliance and other marketing and codesharing agreements with foreign carriers, U.S. carriers have increased their ability to sell international transportation, such as services to and beyond traditional European and Asian gateway cities. Similarly, foreign carriers have obtained increased access to interior U.S. passenger traffic beyond traditional U.S. gateway cities through these relationships. In addition, several joint ventures among U.S. and foreign carriers have received grants of antitrust immunity allowing the participating carriers to coordinate schedules, pricing, sales and inventory.
Increased competition in both the domestic and international markets may have a material adverse effect on our business, financial condition and operating results.
17
Extended interruptions or disruptions in service at major airports in which we operate could have a material adverse impact on our operations.
The airline industry is heavily dependent on business models that concentrate operations in major airports in the United States and throughout the world. An extended interruption or disruption at an airport where we have significant operations could have a material impact on our business, financial condition and results of operation.
The airline industry is subject to extensive government regulation, and new regulations may increase our operating costs.
Airlines are subject to extensive regulatory and legal compliance requirements that result in significant costs. For instance, the FAA from time to time issues directives and other regulations relating to the maintenance and operation of aircraft that necessitate significant expenditures. We expect to continue incurring significant expenses to comply with the FAA's regulations.
Other laws, regulations, taxes and airport rates and charges have also been imposed from time to time that significantly increase the cost of airline operations or reduce revenues. The industry is heavily taxed. For example, the Aviation and Transportation Security Act mandates the federalization of certain airport security procedures and imposes security requirements on airports and airlines, most of which are funded by a per ticket tax on passengers and a tax on airlines. Additional taxes and fees, if implemented, could negatively impact our results of operations.
Proposals to address congestion issues at certain airports or in certain airspace, particularly in the Northeast U.S., have included concepts such as "congestion-based" landing fees, "slot auctions" or other alternatives that could impose a significant cost on the airlines operating in those airports or airspace and impact the ability of those airlines to respond to competitive actions by other airlines. In addition, the failure of the federal government to upgrade the U.S. air traffic control system has resulted in delays and disruptions of air traffic during peak travel periods in certain congested markets. The failure to improve the air traffic control system could lead to increased delays and inefficiencies in flight operations as demand for U.S. air travel increases, having a material adverse effect on our operations. Failure to update the air traffic control system in a timely manner, and the substantial funding requirements of an updated system that may be imposed on air carriers, may have an adverse impact on our financial condition and results of operations.
Future regulatory action concerning climate change, aircraft emissions and noise emissions could have a significant effect on the airline industry. While the specific nature of future actions is hard to predict, new environmental laws or regulations adopted in the U.S. or other countries could impose significant additional costs on our operations, either through direct costs in our operations or through increases in costs that our suppliers pass along to us.
We and other U.S. carriers are subject to domestic and foreign laws regarding privacy of passenger and employee data that are not consistent in all countries in which we operate. In addition to the heightened level of concern regarding privacy of passenger data in the U.S., certain European government agencies are reviewing airline privacy practices. Compliance with these regulatory regimes is expected to result in additional operating costs and could impact our operations and any future expansion.
Prolonged periods of stagnant or weak economic conditions could have a material adverse effect on our business, financial condition and operating results.
As a result of the discretionary nature of air travel, the airline industry has been cyclical and particularly sensitive to changes in economic conditions. Because we operate globally, with approximately 30% of our revenues from operations outside of the U.S., our business is subject to economic conditions throughout the world. During periods of unfavorable or volatile economic conditions in the global economy, demand for air travel can be significantly impacted as business and leisure travelers choose not to travel, seek alternative forms of transportation for short trips or conduct business through videoconferencing. If unfavorable economic conditions occur, particularly for an extended period, our business, financial condition and results of operations may be adversely affected. In addition, significant or volatile changes in exchange rates between the U.S. dollar and other currencies, and the imposition of exchange controls or other currency restrictions, may have a material adverse effect on our liquidity, financial conditions and results of operations.
18
Economic conditions and regulatory changes leading up to and following the United Kingdom’s exit from the European Union could have a material adverse effect on our business and results of operations.
Following a referendum in June 2016 in which voters in the U.K. approved an exit from the European Union ("EU"), the
U.K. government has initiated a process to leave the EU (often referred to as Brexit) and begun negotiating the terms of the U.K.’s future relationship with the EU. The airline industry faces substantial uncertainty regarding the impact of the exit of the U.K. from the EU. Adverse consequences such as deterioration in economic conditions, volatility in currency exchange rates or adverse changes in regulation of the airline industry or bilateral agreements governing air travel could have a negative impact on our operations, financial condition and results of operations.
The rapid spread of contagious illnesses can have a material adverse effect on our business and results of operations.
The rapid spread of a contagious illness, or fear of such an event, can have a material adverse effect on the demand for worldwide air travel and therefore have a material adverse effect on our business and results of operations. Moreover, our operations could be negatively affected if employees are quarantined as the result of exposure to a contagious illness. Similarly, travel restrictions or operational issues resulting from the rapid spread of contagious illnesses in a part of the world in which we have significant operations may have a materially adverse impact on our business and results of operations.
ITEM 1B. UNRESOLVED STAFF COMMENTS
None.
19
ITEM 2. PROPERTIES
Flight Equipment
Our operating aircraft fleet, commitments and options at
December 31, 2017
are summarized in the following table:
|
Current Fleet
(1)
|
Commitments
|
|||||||
|
Aircraft Type
|
Owned
|
Capital Lease
|
Operating Lease
|
Total
|
Average Age
|
Purchase
|
Lease
|
Options
|
|
B-717-200
|
3
|
13
|
75
|
91
|
16.3
|
—
|
—
|
—
|
|
B-737-700
|
10
|
—
|
—
|
10
|
8.9
|
—
|
—
|
—
|
|
B-737-800
|
73
|
4
|
—
|
77
|
16.3
|
—
|
—
|
—
|
|
B-737-900ER
|
52
|
—
|
37
|
89
|
2.3
|
41
|
—
|
—
|
|
B-757-200
|
88
|
9
|
3
|
100
|
20.4
|
—
|
—
|
—
|
|
B-757-300
|
16
|
—
|
—
|
16
|
14.9
|
—
|
—
|
—
|
|
B-767-300
|
2
|
—
|
—
|
2
|
24.5
|
—
|
—
|
—
|
|
B-767-300ER
|
55
|
2
|
—
|
57
|
21.7
|
—
|
—
|
—
|
|
B-767-400ER
|
21
|
—
|
—
|
21
|
17.0
|
—
|
—
|
—
|
|
B-777-200ER
|
8
|
—
|
—
|
8
|
18.1
|
—
|
—
|
—
|
|
B-777-200LR
|
10
|
—
|
—
|
10
|
8.8
|
—
|
—
|
—
|
|
A319-100
|
55
|
—
|
2
|
57
|
15.8
|
—
|
—
|
—
|
|
A320-200
|
55
|
3
|
4
|
62
|
22.4
|
—
|
—
|
—
|
|
A321-200
|
14
|
—
|
20
|
34
|
0.8
|
93
|
—
|
—
|
|
A321-200neo
|
—
|
—
|
—
|
—
|
—
|
100
|
—
|
100
|
|
A330-200
|
11
|
—
|
—
|
11
|
12.8
|
—
|
—
|
—
|
|
A330-300
|
28
|
—
|
3
|
31
|
9.0
|
—
|
—
|
—
|
|
A330-900neo
|
—
|
—
|
—
|
—
|
—
|
25
|
—
|
—
|
|
A350-900
|
6
|
—
|
—
|
6
|
0.2
|
19
|
—
|
—
|
|
CS100
|
—
|
—
|
—
|
—
|
—
|
75
|
—
|
50
|
|
MD-88
|
92
|
17
|
—
|
109
|
27.5
|
—
|
—
|
—
|
|
MD-90
|
65
|
—
|
—
|
65
|
20.9
|
—
|
—
|
—
|
|
Total
|
664
|
48
|
144
|
856
|
16.7
|
353
|
—
|
150
|
|
(1)
|
Excludes certain aircraft we own or lease that are operated by regional carriers on our behalf shown in the table below.
|
The following table summarizes the aircraft fleet operated by our regional carriers on our behalf at
December 31, 2017
:
|
Fleet Type
|
||||||
|
Carrier
|
CRJ-200
|
CRJ-700
|
CRJ-900
|
Embraer 170
|
Embraer 175
|
Total
|
|
Endeavor Air, Inc.
(1)
|
50
|
—
|
93
|
—
|
—
|
143
|
|
ExpressJet Airlines, Inc.
(2)
|
—
|
33
|
16
|
—
|
—
|
49
|
|
SkyWest Airlines, Inc.
|
86
|
27
|
36
|
—
|
18
|
167
|
|
Compass Airlines, LLC
|
—
|
—
|
—
|
—
|
36
|
36
|
|
Republic Airline, Inc.
|
—
|
—
|
—
|
20
|
16
|
36
|
|
GoJet Airlines, LLC
|
—
|
22
|
7
|
—
|
—
|
29
|
|
Total
|
136
|
82
|
152
|
20
|
70
|
460
|
|
(1)
|
Endeavor Air, Inc. is a wholly owned subsidiary of Delta.
|
|
(2)
|
During 2017, we and ExpressJet Airlines, Inc. agreed to early terminate our relationship by the end of 2018.
|
20
Aircraft Purchase Commitments
Our purchase commitments for additional aircraft at
December 31, 2017
are detailed in the following table:
|
Delivery in Calendar Years Ending
|
|||||
|
Aircraft Purchase Commitments
|
2018
|
2019
|
2020
|
After 2020
|
Total
|
|
A321-200
|
31
|
32
|
27
|
3
|
93
|
|
A321-200neo
|
—
|
—
|
16
|
84
|
100
|
|
A330-900neo
|
—
|
—
|
4
|
21
|
25
|
|
A350-900
|
5
|
2
|
2
|
10
|
19
|
|
B-737-900ER
|
23
|
18
|
—
|
—
|
41
|
|
CS100
|
15
|
25
|
16
|
19
|
75
|
|
Total
|
74
|
77
|
65
|
137
|
353
|
Ground Facilities
Airline Operations
We lease most of the land and buildings that we occupy. Our largest aircraft maintenance base, various computer, cargo, flight kitchen and training facilities and most of our principal offices are located at or near the Atlanta airport on land leased from the City of Atlanta. We lease ticket counters, passenger holdrooms, operating areas and other terminal space in most of the airports that we serve. At most airports, we have entered into use agreements which provide for the non-exclusive use of runways, taxiways and other improvements and facilities; landing fees under these agreements normally are based on the number of landings and weight of aircraft. These leases and use agreements generally run for periods of less than one year to 30 years or more, and often contain provisions for periodic adjustments of lease rates, landing fees and other charges applicable under that type of agreement. We also lease aircraft maintenance and air cargo facilities at several airports. Our facility leases generally require us to pay the cost of providing, operating and maintaining such facilities, including, in some cases, amounts necessary to pay debt service on special facility bonds issued to finance their construction. We also lease marketing offices, reservations offices and other off-airport facilities in certain locations for varying terms.
We own our Atlanta reservations center, other real property in Atlanta, and reservations centers in Minot, North Dakota and Chisholm, Minnesota.
Refinery Operations
Our wholly owned subsidiaries, Monroe and MIPC, own and operate the Trainer refinery and related assets in Pennsylvania. The facility includes pipelines and terminal assets that allow the refinery to supply jet fuel to our airline operations throughout the Northeastern U.S., including our New York hubs at LaGuardia and JFK.
21
ITEM 3. LEGAL PROCEEDINGS
First Bag Fee Antitrust Litigation
In 2009, a number of purported class action antitrust lawsuits were filed against Delta and AirTran Airways ("AirTran"), alleging that Delta and AirTran engaged in collusive behavior in violation of Section 1 of the Sherman Act in November 2008 based upon certain public statements made in October 2008 by AirTran's CEO at an analyst conference concerning fees for the first checked bag, Delta's imposition of a fee for the first checked bag on November 4, 2008 and AirTran's imposition of a similar fee on November 12, 2008. The plaintiffs sought to assert claims on behalf of an alleged class consisting of passengers who paid the first bag fee after December 5, 2008 and seek injunctive relief and unspecified treble damages. All of these cases have been consolidated for pre-trial proceedings and remain pending in the Northern District of Georgia.
On July 12, 2016, the Court issued an order granting the plaintiffs' motion for class certification. On October 7, 2016, the U.S. Court of Appeals for the Eleventh Circuit granted the defendants' petition for interlocutory review of this order, and that appeal remains pending.
On March 29, 2017, the District Court granted the defendants’ motions for summary judgment. The plaintiffs have filed an appeal to the U.S. Court of Appeals, and that appeal remains pending.
Capacity Antitrust Litigation
In July 2015, a number of purported class action antitrust lawsuits were filed alleging that Delta, American, United and Southwest had conspired to restrain capacity. The lawsuits were filed in the wake of media reports that the U.S. Department of Justice had served civil investigative demands upon these carriers seeking documents and information relating to this subject. The lawsuits have been consolidated into a single Multi-District Litigation proceeding in the U.S. District Court for the District of Columbia. In November 2016, the District Court denied the defendants' motion to dismiss the claims, and the matter is now proceeding through discovery. Delta believes the claims in these cases are without merit and is vigorously defending these lawsuits.
***
For a discussion of certain environmental matters, see "Business-Regulatory Matters-Environmental Matters" in Item 1.
ITEM 4. MINE SAFETY DISCLOSURES
Not applicable.
22
Part II
ITEM 5. MARKET FOR REGISTRANT'S COMMON EQUITY, RELATED STOCKHOLDER MATTERS AND
ISSUER PURCHASES OF EQUITY SECURITIES
Market Information
Our common stock is listed on the New York Stock Exchange ("NYSE"). The following table sets forth for the periods indicated the highest and lowest sales price for our common stock as reported on the NYSE and dividends declared during these periods.
|
Common Stock
|
Cash Dividends Declared (per share)
|
|||||||||||
|
High
|
Low
|
|||||||||||
|
Fiscal 2017
|
||||||||||||
|
Fourth Quarter
|
$
|
56.84
|
|
$
|
47.90
|
|
$
|
0.305
|
|
|||
|
Third Quarter
|
$
|
55.75
|
|
$
|
44.59
|
|
$
|
0.305
|
|
|||
|
Second Quarter
|
$
|
54.53
|
|
$
|
43.81
|
|
$
|
0.2025
|
|
|||
|
First Quarter
|
$
|
52.00
|
|
$
|
44.47
|
|
$
|
0.2025
|
|
|||
|
Fiscal 2016
|
||||||||||||
|
Fourth Quarter
|
$
|
52.76
|
|
$
|
37.91
|
|
$
|
0.2025
|
|
|||
|
Third Quarter
|
$
|
41.35
|
|
$
|
34.08
|
|
$
|
0.2025
|
|
|||
|
Second Quarter
|
$
|
49.80
|
|
$
|
32.60
|
|
$
|
0.135
|
|
|||
|
First Quarter
|
$
|
50.50
|
|
$
|
40.03
|
|
$
|
0.135
|
|
|||
Holders
As of January 31, 2018, there were approximately 2,560 holders of record of our common stock.
Dividends
Our Board of Directors initiated a quarterly dividend program in the September 2013 quarter of $0.06 per share. As reflected above, the Board has increased the quarterly dividend payment several times, most recently to $0.305 per share in the September 2017 quarter. The Board expects to be able to continue to pay cash dividends for the foreseeable future, subject to applicable limitations under Delaware law. Dividend payments will be dependent upon our results of operations, financial condition, cash requirements, future prospects and other factors deemed relevant by the Board of Directors. In addition, our ability to pay future dividends is subject to compliance with covenants in several of our credit facilities.
23
Stock Performance Graph
The following graph compares the cumulative total returns during the period from December 31, 2012 to
December 31, 2017
of our common stock to the Standard & Poor's 500 Stock Index and the NYSE ARCA Airline Index. The comparison assumes $100 was invested on December 31, 2012 in each of our common stock and the indices and assumes that all dividends were reinvested.
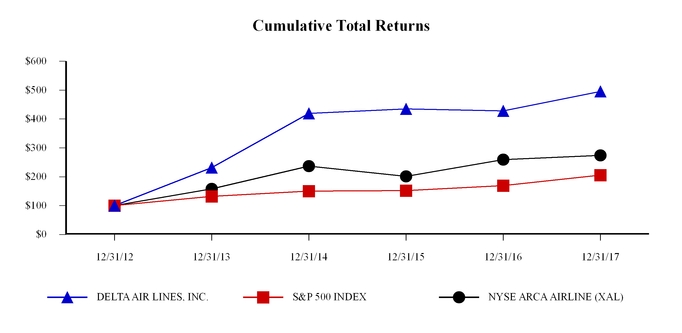
Issuer Purchases of Equity Securities
The following table presents information with respect to purchases of common stock we made during the
December 2017
quarter. The total number of shares purchased includes shares repurchased pursuant to our $5 billion share repurchase program, which was publicly announced on May 11, 2017 and will terminate no later than December 31, 2020. Some purchases were made pursuant to a trading plan meeting the requirements of Rule 10b5-1 under the Securities Exchange Act of 1934.
In addition, the table includes shares withheld from employees to satisfy certain tax obligations due in connection with grants of stock under the Delta Air Lines, Inc. Performance Compensation Plan (the "Plan"). The Plan provides for the withholding of shares to satisfy tax obligations. It does not specify a maximum number of shares that can be withheld for this purpose. The shares of common stock withheld to satisfy tax withholding obligations may be deemed to be "issuer purchases" of shares that are required to be disclosed pursuant to this Item.
|
Period
|
Total Number of Shares Purchased
|
Average Price Paid Per Share
|
Total Number of Shares Purchased as Part of Publicly Announced Plans or Programs
|
Approximate Dollar Value (in millions) of Shares That May Yet Be Purchased Under the Plan or Programs
|
|||||||
|
October 2017
|
1,382,740
|
|
$
|
52.67
|
|
1,382,740
|
|
$
|
4,925
|
|
|
|
November 2017
|
2,529,455
|
|
$
|
49.86
|
|
2,529,455
|
|
$
|
4,800
|
|
|
|
December 2017
|
2,321,176
|
|
$
|
54.34
|
|
2,321,176
|
|
$
|
4,675
|
|
|
|
Total
|
6,233,371
|
|
6,233,371
|
|
|||||||
24
ITEM 6. SELECTED FINANCIAL DATA
The following tables are derived from our audited Consolidated Financial Statements and present selected financial and operating data as of and for the five years ended
December 31, 2017
.
Consolidated Summary of Operations
|
Year Ended December 31,
|
|||||||||||||||
|
(in millions, except share data)
|
2017
|
2016
|
2015
|
2014
|
2013
|
||||||||||
|
Operating revenue
|
$
|
41,244
|
|
$
|
39,639
|
|
$
|
40,704
|
|
$
|
40,362
|
|
$
|
37,773
|
|
|
Operating expense
|
35,130
|
|
32,687
|
|
32,902
|
|
38,156
|
|
34,373
|
|
|||||
|
Operating income
|
6,114
|
|
6,952
|
|
7,802
|
|
2,206
|
|
3,400
|
|
|||||
|
Non-operating expense, net
|
(413
|
)
|
(316
|
)
|
(645
|
)
|
(1,134
|
)
|
(873
|
)
|
|||||
|
Income before income taxes
|
5,701
|
|
6,636
|
|
7,157
|
|
1,072
|
|
2,527
|
|
|||||
|
Income tax (provision) benefit
|
(2,124
|
)
|
(2,263
|
)
|
(2,631
|
)
|
(413
|
)
|
8,013
|
|
|||||
|
Net income
|
$
|
3,577
|
|
$
|
4,373
|
|
$
|
4,526
|
|
$
|
659
|
|
$
|
10,540
|
|
|
Basic earnings per share
|
$
|
4.97
|
|
$
|
5.82
|
|
$
|
5.68
|
|
$
|
0.79
|
|
$
|
12.41
|
|
|
Diluted earnings per share
|
$
|
4.95
|
|
$
|
5.79
|
|
$
|
5.63
|
|
$
|
0.78
|
|
$
|
12.29
|
|
|
Cash dividends declared per share
|
$
|
1.02
|
|
$
|
0.68
|
|
$
|
0.45
|
|
$
|
0.30
|
|
$
|
0.12
|
|
Special Items
|
Year Ended December 31,
|
|||||||||||||||
|
(in millions)
|
2017
|
2016
|
2015
|
2014
|
2013
|
||||||||||
|
MTM adjustments and settlements
|
$
|
259
|
|
$
|
450
|
|
$
|
1,301
|
|
$
|
(2,346
|
)
|
$
|
276
|
|
|
Restructuring and other
|
—
|
|
—
|
|
(35
|
)
|
(716
|
)
|
(424
|
)
|
|||||
|
Loss on extinguishment of debt
|
—
|
|
—
|
|
—
|
|
(268
|
)
|
—
|
|
|||||
|
Investment MTM adjustments
|
(8
|
)
|
115
|
|
26
|
|
(134
|
)
|
—
|
|
|||||
|
Tax Cuts and Jobs Act
|
(150
|
)
|
—
|
|
—
|
|
—
|
|
—
|
|
|||||
|
Release of tax valuation allowance and intraperiod income tax allocation
|
—
|
|
—
|
|
—
|
|
—
|
|
7,989
|
|
|||||
|
Total income (loss)
|
$
|
101
|
|
$
|
565
|
|
$
|
1,292
|
|
$
|
(3,464
|
)
|
$
|
7,841
|
|
Consolidated Balance Sheet Data
|
December 31,
|
|||||||||||||||
|
(in millions)
|
2017
|
2016
|
2015
|
2014
|
2013
|
||||||||||
|
Total assets
|
$
|
53,292
|
|
$
|
51,261
|
|
$
|
53,134
|
|
$
|
54,005
|
|
$
|
52,104
|
|
|
Long-term debt and capital leases (including current maturities)
|
$
|
8,834
|
|
$
|
7,332
|
|
$
|
8,329
|
|
$
|
9,661
|
|
$
|
11,194
|
|
|
Stockholders' equity
|
$
|
13,910
|
|
$
|
12,287
|
|
$
|
10,850
|
|
$
|
8,813
|
|
$
|
11,643
|
|
25
Other Financial and Statistical Data (Unaudited)
|
Year Ended December 31,
|
|||||||||||||||
|
Consolidated
(1)
|
2017
|
2016
|
2015
|
2014
|
2013
|
||||||||||
|
Revenue passenger miles (in millions)
|
217,712
|
|
213,098
|
|
209,625
|
|
202,925
|
|
194,988
|
|
|||||
|
Available seat miles (in millions)
|
254,325
|
|
251,867
|
|
246,764
|
|
239,676
|
|
232,740
|
|
|||||
|
Passenger mile yield
|
|
15.99
|
¢
|
|
15.85
|
¢
|
|
16.59
|
¢
|
|
17.22
|
¢
|
|
16.89
|
¢
|
|
Passenger revenue per available seat mile
|
|
13.69
|
¢
|
|
13.41
|
¢
|
|
14.10
|
¢
|
|
14.58
|
¢
|
|
14.15
|
¢
|
|
Total revenue per available seat mile
|
|
16.22
|
¢
|
|
15.74
|
¢
|
|
16.50
|
¢
|
|
16.84
|
¢
|
|
16.23
|
¢
|
|
Operating cost per available seat mile
|
|
13.81
|
¢
|
|
12.98
|
¢
|
|
13.33
|
¢
|
|
15.92
|
¢
|
|
14.77
|
¢
|
|
Passenger load factor
|
85.6
|
%
|
84.6
|
%
|
84.9
|
%
|
84.7
|
%
|
83.8
|
%
|
|||||
|
Fuel gallons consumed (in millions)
|
4,032
|
|
4,016
|
|
3,988
|
|
3,893
|
|
3,828
|
|
|||||
|
Average price per fuel gallon
(2)
|
$
|
1.68
|
|
$
|
1.49
|
|
$
|
1.90
|
|
$
|
3.47
|
|
$
|
3.00
|
|
|
Full-time equivalent employees, end of period
|
86,564
|
|
83,756
|
|
82,949
|
|
79,655
|
|
77,755
|
|
|||||
|
(1)
|
Includes the operations of our regional carriers under capacity purchase agreements. Full-time equivalent employees exclude employees of regional carriers that we do not own.
|
|
(2)
|
Includes the impact of fuel hedge activity and refinery segment results.
|
26
ITEM 7. MANAGEMENT'S DISCUSSION AND ANALYSIS OF FINANCIAL CONDITION AND RESULTS
OF OPERATIONS
Financial Highlights -
2017
Compared to
2016
Our pre-tax income for
2017
was
$5.7 billion
, representing a
$935 million
decrease compared to the prior year primarily due to higher fuel costs, salaries and related costs and depreciation expense, which were partially offset by increased operating revenue. Pre-tax income, adjusted for special items (a non-GAAP financial measure) was
$5.5 billion
,
a decrease
of
$621 million
, or
10.2%
. Special items were primarily related to fuel hedge MTM adjustments and settlements of
$259 million
in 2017 compared to
$450 million
in 2016.
Revenue.
Compared to 2016, our operating revenue
increased
$1.6 billion
, or
4.0%
, on
1.0%
higher
capacity combined with robust demand and strong revenue momentum, closing 2017 with three consecutive quarters of year-over-year passenger unit revenue growth. Passenger revenue per available seat mile ("PRASM")
increased
2.1%
led by (1) strong domestic leisure yields, (2) expanded distribution of Branded Fares, (3) an improving business fare environment, (4) strength in the Atlantic region leveraged through U.S. point-of-sale traffic gains, along with business cabin traffic and yield growth, and (5) strong performance in the Caribbean, Central America, Brazil and Mexico leisure markets. Other revenue increased
9.7%
partially resulting from growth in our co-brand credit card partnership with American Express.
Operating Expense.
Total operating expense
increased
$2.4 billion
and our consolidated operating cost per available seat mile ("CASM")
increased
6.4%
compared to 2016 to
13.81 cents
, primarily due to higher fuel costs, salaries and related costs and depreciation expense.
Including our regional carriers, fuel expense increased
$771 million
compared to the prior year due to a 22.3% increase in the market price per gallon of fuel, partially offset by reduced fuel hedge losses compared to the prior year and profits generated within our refinery segment.
Salaries and related costs were higher
due to increases for eligible merit, ground and flight attendant employees implemented in the June 2017 quarter.
The increase in depreciation expense primarily results from new aircraft deliveries, including B-737-900ER, A321-200, A330-300 and A350-900 aircraft, fleet modifications and accelerated depreciation due to the planned retirement of our MD-88 fleet and two B-767-300ER aircraft.
Non-fuel unit costs ("CASM-Ex, including profit sharing" a non-GAAP financial measure) increased
4.3%
to
10.57 cents
due to the pay rate increases and depreciation expense discussed above, which were partially offset by productivity gains from our fleet, technology and supply chain initiatives.
The non-GAAP financial measures for pre-tax income, adjusted for special items, and CASM-Ex, including profit sharing, both used above, are defined and reconciled in "Supplemental Information" below.
27
Results of Operations -
2017
Compared to
2016
Operating Revenue
|
Year Ended December 31,
|
Increase
|
% Increase
|
|||||||||
|
(in millions)
|
2017
|
2016
|
|||||||||
|
Passenger
|
$
|
34,819
|
|
$
|
33,777
|
|
1,042
|
|
3.1
|
%
|
|
|
Cargo
|
729
|
|
668
|
|
61
|
|
9.1
|
%
|
|||
|
Other
|
5,696
|
|
5,194
|
|
502
|
|
9.7
|
%
|
|||
|
Total
|
$
|
41,244
|
|
$
|
39,639
|
|
$
|
1,605
|
|
4.0
|
%
|
Passenger Revenue
|
Increase (Decrease)
vs. Year Ended December 31, 2016
|
||||||||||||||||
|
(in millions)
|
Year Ended December 31, 2017
|
Passenger Revenue
|
RPMs
(Traffic)
|
ASMs (Capacity)
|
Passenger Mile Yield
|
PRASM
|
Load Factor
|
|||||||||
|
Mainline
|
$
|
18,878
|
|
5.3
|
%
|
4.1
|
%
|
3.6
|
%
|
1.1
|
%
|
1.7
|
%
|
0.4
|
|
pts
|
|
Regional carriers
|
5,714
|
|
0.8
|
%
|
(2.5
|
)%
|
(2.6
|
)%
|
3.4
|
%
|
3.4
|
%
|
—
|
|
pts
|
|
|
Domestic
|
24,592
|
|
4.2
|
%
|
3.0
|
%
|
2.5
|
%
|
1.1
|
%
|
1.7
|
%
|
0.4
|
|
pts
|
|
|
Atlantic
|
5,292
|
|
2.1
|
%
|
4.8
|
%
|
0.3
|
%
|
(2.6
|
)%
|
1.7
|
%
|
3.6
|
|
pts
|
|
|
Pacific
|
2,366
|
|
(9.6
|
)%
|
(9.0
|
)%
|
(7.7
|
)%
|
(0.7
|
)%
|
(2.0
|
)%
|
(1.2
|
)
|
pts
|
|
|
Latin America
|
2,569
|
|
8.3
|
%
|
4.2
|
%
|
2.0
|
%
|
4.0
|
%
|
6.2
|
%
|
1.8
|
|
pts
|
|
|
Total
|
$
|
34,819
|
|
3.1
|
%
|
2.2
|
%
|
1.0
|
%
|
0.9
|
%
|
2.1
|
%
|
1.0
|
|
pt
|
Passenger revenue
increased
$1.0 billion
over the prior year. PRASM
increased
2.1%
and passenger mile yield
increased
0.9%
on
1.0%
higher
capacity. Load factor was
1.0 point
higher
than the prior year at
85.6%
.
Unit revenues of the domestic region
increased
1.7%
, resulting from our commercial initiatives, including differentiated products for our customers, known as Branded Fares, and an improving revenue environment. We continue to differentiate our product offerings and enable customer choice through segmentation, including offering Basic Economy throughout our domestic network. Our domestic operations closed 2017 with three consecutive quarters of year-over-year unit revenue growth, with robust demand for both business and leisure. We continue to see improvements in business markets with 81 of the top 100 business markets producing positive yields during the December 2017 quarter, up from 50% from earlier in the year.
Passenger revenues related to our international regions
increased
0.5%
year-over-year primarily due to strength in the Atlantic and Latin America regions, partially offset by revenue declines in the Pacific. During 2017, we continued to roll out the expansion of our Branded Fares product throughout the international regions.
The Atlantic region closed 2017 with three consecutive quarters of year-over-year unit revenue growth on strong business class bookings. We continue to leverage our alliance partners' hub positions in Europe's leading business markets of London, Amsterdam and Paris to increase the volume of U.S. point-of-sale traffic. The U.K. was particularly robust, with unit revenue growth throughout 2017, including double-digit growth in the second half of 2017. During the year, we expanded our Basic Economy product to mitigate the impact of ultra-low cost carrier capacity increases.
Unit revenue declines in the Pacific primarily resulted from industry capacity growth in the region. We continued to optimize the Pacific region with a
7.7%
reduction in capacity during 2017, focused on refining the network to generate incremental value from our Chinese and Korean alliances and differentiating our product offerings, including expanding Basic Economy and selling Comfort+ as a separate fare product. During 2017, we reached an agreement to create a trans-Pacific joint venture with Korean Air, offering an enhanced and expanded network, industry-leading products and service, and a seamless customer experience between the U.S. and Asia. We also retired our last B-747-400 and introduced our new A350-900 with Delta One suites and the Delta Premium Select cabin on routes from Detroit to Tokyo-Narita and Seoul-Incheon, which are driving improvements in both profitability and customer feedback. These efforts are beginning to show results as the Pacific returned to positive PRASM growth during the December 2017 quarter for the first time in more than four years.
28
Unit revenues increased in Latin America principally resulting from unit revenue improvement in Brazil, related to both improved traffic and higher fares. This improvement was driven by the strengthening of the Brazilian economy and additional connectivity for our customers provided by our relationship with GOL. Increased leisure traffic to Mexico and the Caribbean, and the incremental value provided by our alliance with Aeroméxico also contributed to the Latin America unit revenue improvement. Although unit revenue improved in the Caribbean, hurricane damage in several markets during 2017 resulted in temporary service adjustments. Finally, we continued to differentiate our product offerings, including expanding Basic Economy and selling Comfort+ as a separate fare product in Latin America.
Other Revenue
|
Year Ended December 31,
|
Increase
(Decrease)
|
% Increase
(Decrease)
|
|||||||||
|
(in millions)
|
2017
|
2016
|
|||||||||
|
Loyalty programs
|
$
|
1,952
|
|
$
|
1,782
|
|
$
|
170
|
|
9.5
|
%
|
|
Administrative fees, club and on-board sales
|
1,252
|
|
1,205
|
|
47
|
|
3.9
|
%
|
|||
|
Ancillary businesses and refinery
|
1,412
|
|
1,129
|
|
283
|
|
25.1
|
%
|
|||
|
Baggage fees
|
908
|
|
881
|
|
27
|
|
3.1
|
%
|
|||
|
Other
|
172
|
|
197
|
|
(25
|
)
|
(12.7
|
)%
|
|||
|
Total
|
$
|
5,696
|
|
$
|
5,194
|
|
$
|
502
|
|
9.7
|
%
|
Loyalty programs.
We sell mileage credits to credit card companies, hotels and car rental agencies under marketing agreements. We allocate the consideration received from mileage credit sales to the individual products and services bundled with the sale based on their relative selling prices. We defer the travel component as part of frequent flyer deferred revenue and recognize passenger revenue as the mileage credits are redeemed for travel. The revenue allocated to the remaining deliverables (such as lounge access, baggage fee waivers and brand usage) is recorded in other revenue. We recognize the revenue for these services as they are performed.
The amount of loyalty program revenue changes based on the price paid for mileage credits, the volume of credits sold and our allocation of selling price to the individual products and services. With the adoption of the new revenue recognition standard in 2018, we will increase the value we use to account for the travel component within mileage credit sales. This new value for the travel component will cause a re-allocation of the consideration received from mileage credit sales. The re-allocation will result in less revenue recognized for loyalty programs in other revenue and more revenue in passenger revenue as the frequent flyer awards are redeemed.
Loyalty program revenue increased compared to 2016 related to growth in our co-brand credit card partnership with American Express. Additional information about our frequent flyer program accounting policies can be found in Note 1 of the Notes to the Consolidated Financial Statements.
Administrative fees, club and on-board sales.
These revenues primarily relate to travel-related services such as ticket changes and unaccompanied minors and also include amounts collected for on-board sales and Sky Club lounge memberships. We recognize revenue as these services are performed. A significant portion of these fees are travel-related and performed in conjunction with the passenger’s flight. Therefore, the majority of these fees will be reclassified to passenger revenue with our adoption of the new revenue recognition standard in 2018.
Ancillary businesses and refinery.
Ancillary businesses and refinery includes aircraft maintenance and staffing services we provide to third parties, our vacation wholesale operations and refinery sales to third parties. Ancillary businesses and refinery revenues are not related to the generation of a seat mile. Ancillary businesses and refinery sales primarily increased due to sales of non-jet fuel products to third parties by our oil refinery, consistent with stronger pricing of refined products throughout the oil industry.
Baggage fees.
The revenue amount shown above represents baggage fees that were sold as a separate component of the passenger’s ticket. Similar to administrative fees described above, baggage services are performed and earned in conjunction with the passenger’s flight, and these fees will be reclassified to passenger revenue with our adoption of the new revenue recognition standard in 2018.
29
Operating Expense
|
Year Ended December 31,
|
Increase
(Decrease)
|
% Increase
(Decrease)
|
|||||||||
|
(in millions)
|
2017
|
2016
|
|||||||||
|
Salaries and related costs
|
$
|
10,436
|
|
$
|
10,034
|
|
$
|
402
|
|
4.0
|
%
|
|
Aircraft fuel and related taxes
|
5,733
|
|
5,133
|
|
600
|
|
11.7
|
%
|
|||
|
Regional carriers expense
|
4,503
|
|
4,311
|
|
192
|
|
4.5
|
%
|
|||
|
Depreciation and amortization
|
2,235
|
|
1,902
|
|
333
|
|
17.5
|
%
|
|||
|
Contracted services
|
2,184
|
|
1,991
|
|
193
|
|
9.7
|
%
|
|||
|
Aircraft maintenance materials and outside repairs
|
1,992
|
|
1,823
|
|
169
|
|
9.3
|
%
|
|||
|
Passenger commissions and other selling expenses
|
1,787
|
|
1,710
|
|
77
|
|
4.5
|
%
|
|||
|
Landing fees and other rents
|
1,528
|
|
1,490
|
|
38
|
|
2.6
|
%
|
|||
|
Passenger service
|
1,067
|
|
907
|
|
160
|
|
17.6
|
%
|
|||
|
Profit sharing
|
1,065
|
|
1,115
|
|
(50
|
)
|
(4.5
|
)%
|
|||
|
Aircraft rent
|
351
|
|
285
|
|
66
|
|
23.2
|
%
|
|||
|
Other
|
2,249
|
|
1,986
|
|
263
|
|
13.2
|
%
|
|||
|
Total operating expense
|
$
|
35,130
|
|
$
|
32,687
|
|
$
|
2,443
|
|
7.5
|
%
|
Salaries and Related Costs.
The increase in salaries and related costs is primarily
due to increases for eligible merit, ground and flight attendant employees implemented in the June 2017 quarter.
Aircraft Fuel and Related Taxes.
Including our regional carriers, fuel expense increased
$771 million
compared to the prior year due to a 22.3% increase in the market price per gallon of fuel, partially offset by reduced fuel hedge losses compared to the prior year and profits generated within our refinery segment.
The table below presents fuel expense, including our regional carriers:
|
Year Ended December 31,
|
Increase
|
% Increase
|
|||||||||
|
(in millions)
|
2017
|
2016
|
|||||||||
|
Aircraft fuel and related taxes
(1)
|
$
|
5,733
|
|
$
|
5,133
|
|
$
|
600
|
|
||
|
Aircraft fuel and related taxes included within regional carriers expense
|
1,023
|
|
852
|
|
171
|
|
|||||
|
Total fuel expense
|
$
|
6,756
|
|
$
|
5,985
|
|
$
|
771
|
|
12.9
|
%
|
|
(1)
|
Includes the impact of fuel hedging and refinery results described further in the table below.
|
The table below shows the impact of hedging and the refinery on fuel expense and average price per gallon, adjusted (non-GAAP financial measures):
|
Average Price Per Gallon
|
|||||||||||||||||||
|
Year Ended December 31,
|
Increase
(Decrease)
|
Year Ended December 31,
|
Increase (Decrease)
|
||||||||||||||||
|
(in millions, except per gallon data)
|
2017
|
2016
|
2017
|
2016
|
|||||||||||||||
|
Fuel purchase cost
(1)
|
$
|
6,833
|
|
$
|
5,579
|
|
$
|
1,254
|
|
$
|
1.70
|
|
$
|
1.39
|
|
$
|
0.31
|
|
|
|
Airline segment fuel hedge losses
(2)
|
33
|
|
281
|
|
(248
|
)
|
0.01
|
|
0.07
|
|
(0.06
|
)
|
|||||||
|
Refinery segment impact
(2)
|
(110
|
)
|
125
|
|
(235
|
)
|
(0.03
|
)
|
0.03
|
|
(0.06
|
)
|
|||||||
|
Total fuel expense
|
$
|
6,756
|
|
$
|
5,985
|
|
$
|
771
|
|
$
|
1.68
|
|
$
|
1.49
|
|
$
|
0.19
|
|
|
|
MTM adjustments and settlements
(3)
|
259
|
|
450
|
|
(191
|
)
|
0.06
|
|
0.11
|
|
(0.05
|
)
|
|||||||
|
Total fuel expense, adjusted
|
$
|
7,015
|
|
$
|
6,435
|
|
$
|
580
|
|
$
|
1.74
|
|
$
|
1.60
|
|
$
|
0.14
|
|
|
|
(1)
|
Market price for jet fuel at airport locations, including related taxes and transportation costs.
|
|
(2)
|
Includes the impact of pricing arrangements between the airline and refinery segments with respect to the refinery's inventory price risk. For additional information regarding the refinery segment impact, see "Refinery Segment" below.
|
|
(3)
|
MTM adjustments and settlements include the effects of the derivative transactions discussed in
Note 4
of the Notes to the Consolidated Financial Statements. For additional information and the reason for adjusting fuel expense, see "Supplemental Information" below.
|
30
Depreciation and Amortization.
The increase in depreciation expense primarily results from new aircraft deliveries, including B-737-900ER, A321-200, A330-300 and A350-900 aircraft, fleet modifications and accelerated depreciation due to the planned retirement of our MD-88 fleet and two B-767-300ER aircraft.
Contracted Services.
The increase in contracted services expense predominantly relates to additional contract labor expenses associated with investments in our technology infrastructure and other activities to improve the customer experience.
Aircraft Maintenance Materials and Outside Repairs.
Aircraft maintenance materials and outside repairs consist of costs associated with the maintenance of aircraft used in our operations and costs associated with maintenance sales to third parties by our MRO business. The increase in aircraft maintenance materials and outside repairs expense primarily relates to an increase in maintenance activity in order to enhance service reliability of certain aircraft.
Passenger Service.
Passenger service expense includes the costs of onboard food and beverage, cleaning and supplies. The increase in passenger service expense predominantly relates to costs associated with enhancements to our onboard product offering and higher traffic.
Aircraft Rent.
The increase in aircraft rent primarily results from new leased aircraft deliveries since the prior year, including B-737-900ER and A321-200 aircraft.
Other.
The increase in other expense primarily relates to costs associated with sales of non-jet fuel products to third parties by our oil refinery.
31
Results of Operations -
2016
Compared to
2015
Operating Revenue
|
Year Ended December 31,
|
Increase (Decrease)
|
% Increase (Decrease)
|
|||||||||
|
(in millions)
|
2016
|
2015
|
|||||||||
|
Passenger
|
33,777
|
|
34,782
|
|
(1,005
|
)
|
(2.9
|
)%
|
|||
|
Cargo
|
668
|
|
813
|
|
(145
|
)
|
(17.8
|
)%
|
|||
|
Other
|
5,194
|
|
5,109
|
|
85
|
|
1.7
|
%
|
|||
|
Total
|
$
|
39,639
|
|
$
|
40,704
|
|
$
|
(1,065
|
)
|
(2.6
|
)%
|
Passenger Revenue
|
Increase (Decrease)
vs. Year Ended December 31, 2015
|
||||||||||||||||
|
(in millions)
|
Year Ended December 31, 2016
|
Passenger Revenue
|
RPMs
(Traffic)
|
ASMs (Capacity)
|
Passenger Mile Yield
|
PRASM
|
Load Factor
|
|||||||||
|
Mainline
|
$
|
17,932
|
|
—
|
%
|
4.3
|
%
|
5.2
|
%
|
(4.1
|
)%
|
(5.0
|
)%
|
(0.8
|
)
|
pts
|
|
Regional carriers
|
5,672
|
|
(3.6
|
)%
|
0.6
|
%
|
1.0
|
%
|
(4.2
|
)%
|
(4.6
|
)%
|
(0.3
|
)
|
pts
|
|
|
Domestic
|
23,604
|
|
(0.9
|
)%
|
3.6
|
%
|
4.5
|
%
|
(4.4
|
)%
|
(5.2
|
)%
|
(0.6
|
)
|
pts
|
|
|
Atlantic
|
5,185
|
|
(6.5
|
)%
|
(1.7
|
)%
|
0.3
|
%
|
(4.9
|
)%
|
(6.8
|
)%
|
(1.7
|
)
|
pts
|
|
|
Pacific
|
2,616
|
|
(12.8
|
)%
|
(4.6
|
)%
|
(6.6
|
)%
|
(8.6
|
)%
|
(6.7
|
)%
|
1.8
|
|
pts
|
|
|
Latin America
|
2,372
|
|
(1.8
|
)%
|
3.5
|
%
|
0.8
|
%
|
(5.1
|
)%
|
(2.6
|
)%
|
2.3
|
|
pts
|
|
|
Total
|
$
|
33,777
|
|
(2.9
|
)%
|
1.7
|
%
|
2.1
|
%
|
(4.5
|
)%
|
(4.9
|
)%
|
(0.3
|
)
|
pts
|
Passenger revenue decreased $1.0 billion over the prior year. PRASM decreased 4.9% and passenger mile yield decreased 4.5% on 2.1% higher capacity. Load factor was 0.3 points lower than the prior year at 84.6%.
Unit revenues of the domestic region decreased 5.2%, resulting from weakness in the close-in yield environment during most of the year despite strong volume.
Revenues related to our international regions decreased 7.2% year-over-year primarily due to yield declines resulting from imbalances between supply and demand, principally in the Atlantic region and China, the impact of foreign currency fluctuations, continued reductions in international fuel surcharges and economic challenges in certain regions.
In the Atlantic, the unit revenue decline predominantly resulted from lower yields driven by industry capacity growth outpacing passenger demand and the strength of the U.S. dollar. In core European markets, U.S. point-of-sale demand was strong and recovered quickly following the Brussels airport terrorist attack in March 2016. However, Europe point-of sale demand was soft largely due to the impact of weaker Euro exchange rates.
Unit revenue declines in the Pacific compared to 2015 primarily resulted from lower yen hedge gains, lower international fuel surcharges and yield declines resulting from industry capacity growth between the U.S. and China. During the September 2016 quarter, the U.S. Department of Transportation announced that we were awarded two daytime slot pairs at Tokyo's Haneda Airport (from Los Angeles and Minneapolis). We commenced these routes and canceled other routes in the Pacific region during the December 2016 quarter as part of our ongoing optimization of the Pacific region.
Although Latin America unit revenues declined compared to 2015, unit revenues improved in the second half of 2016 compared to the second half of 2015. An Open Skies agreement between the U.S. and Mexico took effect in August 2016 and our application for antitrust immunity with Aeroméxico was approved in the December 2016 quarter, which continued to strengthen our performance in the important Mexican business markets.
Cargo Revenue
Cargo revenue decreased $145 million, or 17.8%, primarily due to weaker international demand compared to the prior year.
32
Other Revenue
|
Year Ended December 31,
|
Increase
(Decrease)
|
% Increase
(Decrease)
|
|||||||||
|
(in millions)
|
2016
|
2015
|
|||||||||
|
Loyalty programs
|
$
|
1,782
|
|
$
|
1,584
|
|
$
|
198
|
|
12.5
|
%
|
|
Administrative fees, club and on-board sales
|
1,205
|
|
1,261
|
|
(56
|
)
|
(4.4
|
)%
|
|||
|
Ancillary businesses and refinery
(1)
|
1,129
|
|
1,158
|
|
(29
|
)
|
(2.5
|
)%
|
|||
|
Baggage fees
|
881
|
|
885
|
|
(4
|
)
|
(0.5
|
)%
|
|||
|
Other
|
197
|
|
221
|
|
(24
|
)
|
(10.9
|
)%
|
|||
|
Total
|
$
|
5,194
|
|
$
|
5,109
|
|
$
|
85
|
|
1.7
|
%
|
|
(1)
|
Ancillary businesses and refinery includes aircraft maintenance and staffing services we provide to third parties, our vacation wholesale operations and refinery sales to third parties. These revenues are not related to the generation of a seat mile.
|
Other revenue increased $85 million, or 1.7%, in 2016 primarily due to increased loyalty programs revenues from our co-brand credit card partnership with American Express resulting from new credit card accounts.
Operating Expense
|
Year Ended December 31,
|
Increase
(Decrease)
|
% Increase
(Decrease)
|
|||||||||
|
(in millions)
|
2016
|
2015
|
|||||||||
|
Salaries and related costs
|
$
|
10,034
|
|
$
|
8,776
|
|
$
|
1,258
|
|
14.3
|
%
|
|
Aircraft fuel and related taxes
|
5,133
|
|
6,544
|
|
(1,411
|
)
|
(21.6
|
)%
|
|||
|
Regional carriers expense
|
4,311
|
|
4,241
|
|
70
|
|
1.7
|
%
|
|||
|
Contracted services
|
1,991
|
|
1,848
|
|
143
|
|
7.7
|
%
|
|||
|
Depreciation and amortization
|
1,902
|
|
1,835
|
|
67
|
|
3.7
|
%
|
|||
|
Aircraft maintenance materials and outside repairs
|
1,823
|
|
1,848
|
|
(25
|
)
|
(1.4
|
)%
|
|||
|
Passenger commissions and other selling expenses
|
1,710
|
|
1,672
|
|
38
|
|
2.3
|
%
|
|||
|
Landing fees and other rents
|
1,490
|
|
1,493
|
|
(3
|
)
|
(0.2
|
)%
|
|||
|
Profit sharing
|
1,115
|
|
1,490
|
|
(375
|
)
|
(25.2
|
)%
|
|||
|
Passenger service
|
907
|
|
872
|
|
35
|
|
4.0
|
%
|
|||
|
Aircraft rent
|
285
|
|
250
|
|
35
|
|
14.0
|
%
|
|||
|
Other
|
1,986
|
|
2,033
|
|
(47
|
)
|
(2.3
|
)%
|
|||
|
Total operating expense
|
$
|
32,687
|
|
$
|
32,902
|
|
$
|
(215
|
)
|
(0.7
|
)%
|
Salaries and Related Costs.
The increase in salaries and related costs was principally due to pay rate increases given to eligible employees, which includes an 18% pay rate increase for pilots resulting from a new pilot contract ratified in the December 2016 quarter that was retroactive to January 1, 2016. Additionally, in the December 2015 quarter, base pay rates increased 14.5% for eligible merit, ground and flight attendant employees in conjunction with changes in their profit sharing program.
33
Aircraft Fuel and Related Taxes.
Including our regional carriers, fuel expense decreased $1.6 billion compared to the prior year due to an 18% decrease in the market price per gallon of fuel and lower fuel hedge losses, partially offset by a loss from our refinery segment in the current year compared to a profit in the prior year and a 0.7% increase in consumption.
The table below presents fuel expense, including our regional carriers:
|
Year Ended December 31,
|
(Decrease)
|
% (Decrease)
|
|||||||||
|
(in millions)
|
2016
|
2015
|
|||||||||
|
Aircraft fuel and related taxes
(1)
|
$
|
5,133
|
|
$
|
6,544
|
|
$
|
(1,411
|
)
|
||
|
Aircraft fuel and related taxes included within regional carriers expense
|
852
|
|
1,035
|
|
(183
|
)
|
|||||
|
Total fuel expense
|
$
|
5,985
|
|
$
|
7,579
|
|
$
|
(1,594
|
)
|
(21.0
|
)%
|
|
(1)
|
Includes the impact of fuel hedging and refinery results described further in the table below.
|
The table below shows the impact of hedging and the refinery on fuel expense and average price per gallon, adjusted:
|
Average Price Per Gallon
|
|||||||||||||||||||
|
Year Ended December 31,
|
Increase
(Decrease)
|
Year Ended December 31,
|
Increase
(Decrease)
|
||||||||||||||||
|
(in millions, except per gallon data)
|
2016
|
2015
|
2016
|
2015
|
|||||||||||||||
|
Fuel purchase cost
(1)
|
$
|
5,579
|
|
$
|
6,934
|
|
$
|
(1,355
|
)
|
$
|
1.39
|
|
$
|
1.74
|
|
$
|
(0.35
|
)
|
|
|
Airline segment fuel hedge losses
(2)
|
281
|
|
935
|
|
(654
|
)
|
0.07
|
|
0.23
|
|
(0.16
|
)
|
|||||||
|
Refinery segment impact
(2)
|
125
|
|
(290
|
)
|
415
|
|
0.03
|
|
(0.07
|
)
|
0.10
|
|
|||||||
|
Total fuel expense
|
$
|
5,985
|
|
$
|
7,579
|
|
$
|
(1,594
|
)
|
$
|
1.49
|
|
$
|
1.90
|
|
$
|
(0.41
|
)
|
|
|
MTM adjustments and settlements
(3)
|
450
|
|
1,301
|
|
(851
|
)
|
0.11
|
|
0.33
|
|
(0.22
|
)
|
|||||||
|
Total fuel expense, adjusted
|
$
|
6,435
|
|
$
|
8,880
|
|
$
|
(2,445
|
)
|
$
|
1.60
|
|
$
|
2.23
|
|
$
|
(0.63
|
)
|
|
|
(1)
|
Market price for jet fuel at airport locations, including related taxes and transportation costs.
|
|
(2)
|
Includes the impact of pricing arrangements between the airline and refinery segments with respect to the refinery's inventory price risk. For additional information regarding the refinery segment impact, see "Refinery Segment" below.
|
|
(3)
|
MTM adjustments and settlements include the effects of the derivative transactions discussed in
Note 4
of the Notes to the Consolidated Financial Statements. For additional information and the reason for adjusting fuel expense, see "Supplemental Information" below.
|
Regional Carriers Expense.
The increase in regional carriers expense was primarily due to increases in aircraft maintenance and scheduled contract carrier rate escalations, partially offset by lower fuel cost from the decrease in the market price of fuel.
Contracted Services.
The increase in contracted services expense predominantly related to costs associated with the 2.1% increase in capacity and additional temporary staffing.
Profit Sharing.
The decrease in profit sharing was primarily due to an adjustment to the profit sharing calculation during 2016 (paid out in 2017) for merit, ground and flight attendant employees. This adjusted calculation paid 10% of annual profit (as defined by the terms of the program) and, if we exceeded our prior-year results, the program paid 20% of the year-over-year increase in profit to eligible employees. In 2015, our profit sharing program paid 10% to all eligible employees for the first $2.5 billion of annual profit and 20% of annual profit above $2.5 billion. The profit sharing program for pilots remained unchanged from the prior year.
34
Non-Operating Results
|
Year Ended December 31,
|
(Unfavorable) Favorable
|
|||||||||||||||
|
(in millions)
|
2017
|
2016
|
2015
|
2017 vs. 2016
|
2016 vs. 2015
|
|||||||||||
|
Interest expense, net
|
$
|
(396
|
)
|
$
|
(388
|
)
|
$
|
(481
|
)
|
$
|
(8
|
)
|
$
|
93
|
|
|
|
Miscellaneous, net
|
(17
|
)
|
72
|
|
(164
|
)
|
(89
|
)
|
236
|
|
||||||
|
Total non-operating expense, net
|
$
|
(413
|
)
|
$
|
(316
|
)
|
$
|
(645
|
)
|
$
|
(97
|
)
|
$
|
329
|
|
|
At December 31, 2016, the principal amount of debt and capital leases was
$7.4 billion
. During 2017, we issued $2.5 billion of unsecured notes. As a result of the debt issuances, partially offset by scheduled principal payments, the amount of debt and capital leases was
$8.9 billion
at
December 31, 2017
.
Miscellaneous, net is primarily composed of our proportionate share of earnings from our equity investments in Virgin Atlantic and Grupo Aeroméxico, foreign exchange gains/losses and charitable contributions. Our equity investment earnings and foreign exchange gains/losses vary and impact the comparability of miscellaneous, net from period to period.
Income Taxes
Our effective tax rate for 2017 was
37.2%
. We recorded a provisional estimate of $150 million related to the Tax Cuts and Jobs Act of 2017, resulting in a 2.6% increase to our effective tax rate. We expect our annual effective tax rate to be between 21% and 23% for 2018. At
December 31, 2017
, we had approximately
$5.1 billion
of U.S. federal pre-tax net operating loss carryforwards, which do not begin to expire until
2027
. Accordingly, we believe we will not pay cash federal income taxes before 2019. See
Note 11
of the Notes to the Consolidated Financial Statements for more information.
Refinery Segment
The refinery primarily produces gasoline, diesel and jet fuel.
Monroe exchanges the non-jet fuel products the refinery produces with third parties for jet fuel consumed in our airline operations.
The jet fuel produced and procured through exchanging gasoline and diesel fuel produced by the refinery provided approximately 200,000 barrels per day for use in our airline operations during
2017
. We believe that the jet fuel supply resulting from the refinery's operation has contributed to the reduction in the market price of jet fuel, and thus lowered our cost of jet fuel compared to what it otherwise would have been.
The refinery recorded operating revenues of
$5.0 billion
in
2017
, compared to
$3.8 billion
in
2016
. Operating revenues in
2017
were primarily composed of
$3.2 billion
of non-jet fuel products exchanged with third parties to procure jet fuel and
$886 million
of sales of jet fuel to the airline segment. Refinery revenues increased compared to the prior year due to higher product demand and an increase in margins during the second half of 2017 due to hurricanes that caused extensive refinery closures on the Gulf Coast for several weeks.
The refinery recorded income of
$110 million
in
2017
, compared to a loss of
$125 million
recorded in
2016
. The refinery's income
in
2017
was primarily due to higher refined product cracks, lower crude costs and higher throughput levels.
A refinery is subject to annual EPA requirements to blend renewable fuels into the gasoline and on-road diesel fuel it produces. Alternatively, a refinery may purchase renewable energy credits, called RINs, from third parties in the secondary market. The refinery, operated by Monroe purchases the majority of its RINs requirement in the secondary market. We recognized
$159 million
and $171 million of expense related to the RINs requirement in
2017
and
2016
, respectively. RINs expense decreased during
2017
primarily as a result of a slight decrease in the unit cost of RINs during
2017
after a significant increase in the unit cost of RINs during 2016.
The Monroe refinery is planning for a shutdown of approximately 60 days in the December 2018 quarter. This planned outage, called a turnaround, is in accordance with the long term maintenance plan for the facility to allow for the safe completion of major repairs and upgrades. During that planned outage, we have identified other sources of fuel to maintain service levels and to mitigate the financial impact.
For more information regarding the refinery's results, see
Note 14
of the Notes to the Consolidated Financial Statements.
35
Financial Condition and Liquidity
We expect to meet our cash needs for the next 12 months from cash flows from operations, cash and cash equivalents, short-term investments and financing arrangements. As of
December 31, 2017
, we had
$5.1 billion
in unrestricted liquidity, consisting of
$2.6 billion
in cash and cash equivalents and short-term investments and
$2.5 billion
in undrawn revolving credit facilities. During
2017
, we used existing cash and cash generated from operations to fund capital expenditures of
$3.9 billion
, purchase shares of Grupo Aeroméxico and Air France-KLM for $1.2 billion and return
$2.4 billion
to shareholders. In addition, we used the proceeds from a debt offering and cash generated from operations to contribute $3.2 billion in cash to fund our pension obligation.
Sources of Liquidity
Operating Activities
Cash flows from operating activities continue to provide our primary source of liquidity. We generated positive cash flows from operations of
$5.1 billion
in
2017
,
$7.2 billion
in
2016
and
$7.9 billion
in
2015
. We also expect to generate positive cash flows from operations in
2018
. We had lower operating cash flows in 2017 compared to prior years primarily due to incremental pension plan contributions partially funded through $2.0 billion of debt issuance.
Our operating cash flows can be impacted by the following factors:
Seasonality of Advance Ticket Sales
. We sell tickets for air travel in advance of the customer's travel date. When we receive a cash payment at the time of sale, we record the cash received on advance sales as deferred revenue in air traffic liability. The air traffic liability increases during the winter and spring as advanced ticket sales grow prior to the summer peak travel season and decreases during the summer and fall months.
Fuel
. Including our regional carriers, fuel expense represented
19.2%
of our total operating expenses for
2017
. The market price for jet fuel is highly volatile, which can impact the comparability of our cash flows from operations from period to period.
Pension Contributions.
We sponsor defined benefit pension plans for eligible employees and retirees. These plans are closed to new entrants and are frozen for future benefit accruals. Our funding obligations for these plans are governed by the Employee Retirement Income Security Act, as modified by the Pension Protection Act of 2006. In the first half of 2017, we contributed $3.5 billion to our qualified defined benefit pension plans using net proceeds from a $2.0 billion debt issuance, shares of our common stock from treasury with a value of $350 million and existing cash. As a result of these contributions, we satisfied, on an accelerated basis, our 2017 required contributions for our defined benefit plans, including more than $3.0 billion above the minimum funding requirements. We contributed
$1.3 billion
and $1.2 billion in
2016
and 2015, respectively. We have no minimum funding requirements in 2018. However, in January 2018, we voluntarily contributed approximately
$500 million
to these plans.
Profit Sharing.
Our broad-based employee profit sharing program provides that, for each year in which we have an annual pre-tax profit, as defined by the terms of the program, we will pay a specified portion of that profit to employees. In determining the amount of profit sharing, the program defines profit as pre-tax profit adjusted for profit sharing and certain other items.
We paid $1.1 billion in February 2017, $1.5 billion in February 2016, and $1.1 billion in two payments, $756 million in February 2015 and more than $300 million in October 2014, to our employees in recognition of their contributions toward meeting our financial goals. During the year ended December 2017, we recorded
$1.1 billion
in profit sharing expense based on 2017 pre-tax profit, which was paid to employees in February 2018.
Effective October 1, 2017, we aligned our profit sharing plans under a single formula. Under this formula, our profit sharing program pays 10% to all eligible employees for the first $2.5 billion of annual profit and 20% of annual profit above $2.5 billion. Prior to that time, the profit sharing program for pilots used this formula but for 2016 and the first nine months of 2017, the profit sharing program for merit, ground and flight attendant employees paid 10% of annual profit (as defined by the terms of the program) and, if we exceeded our prior-year results, the program paid 20% of the year-over-year increase in profit to eligible employees. For years prior to 2016, the profit sharing program for merit, ground and flight attendant employees paid according to the current formula. Going forward, all eligible employees will be paid profit sharing under the current formula.
36
Investing Activities
Capital Expenditures.
Our capital expenditures were
$3.9 billion
in
2017
, $3.4 billion in
2016
and $2.9 billion in
2015
. Our capital expenditures during 2017 were primarily related to the purchase of B-737-900ER aircraft to replace a portion of our older B-757-200 aircraft, purchases of A321-200 and A330-300 aircraft, advanced deposit payments on future aircraft order commitments and seat density projects for our domestic fleet. Our capital expenditures during 2016 and 2015 were primarily for the purchase of aircraft and modifications to upgrade aircraft interiors that enhance our product offering.
We have committed to future aircraft purchases that will require significant capital investment and have obtained long-term financing commitments for a substantial portion of the purchase price of these aircraft. We expect that we will invest approximately $4.5 billion in 2018 primarily for (1) aircraft, including deliveries of B-737-900ERs, A321-200s and A350-900s, along with advance deposit payments for these and our new A330-900neo and CS100 orders as well as for (2) aircraft modifications, the majority of which relate to increasing the seat density and enhancing the cabins on our domestic fleet. We expect that the 2018 investments will be funded primarily through cash flows from operations.
Equity Investments.
During 2017, we completed a $622 million tender offer and settled derivative contracts for $173 million
to obtain additional capital stock of Grupo Aeroméxico, increasing our ownership percentage to a non-controlling
49%
equity stake in Grupo Aeroméxico
. During the December 2017 quarter, we acquired shares of Air France-KLM for $450 million, which provides us with a 10% ownership interest.
Los Angeles International Airport Construction.
During 2016, we executed a new lease agreement with Los Angeles World Airports ("LAWA"), which owns and operates LAX, and announced plans to modernize, upgrade and connect Terminals 2 and 3 at LAX over the next seven years. Based on the lease agreement, we are designing and managing the construction of the initial investment of $350 million to renovate gate areas, support space and other amenities for passengers, upgrade the baggage handling systems in the terminals and facilitate the relocation of those airlines located in Terminals 2 and 3 to Terminals 5 and 6 and Tom Bradley International Terminal ("TBIT"). The relocation activities were completed during the June 2017 quarter. Subject to required approvals, we have an option to expand the project, which could cost an additional $1.5 billion and would include (1) redevelopment of Terminal 3 and enhancement of Terminal 2, (2) rebuild of the ticketing, arrival hall and security checkpoint, (3) construction of infrastructure for the planned airport people mover, (4) ramp improvements and (5) construction of a secure connector to the north side of TBIT.
A substantial majority of the project costs will be funded through the Regional Airports Improvement Corporation ("RAIC"), a California public benefit corporation, using an $800 million revolving credit facility provided by a group of lenders. The credit facility was executed during 2017. Loans made under the credit facility will be repaid with the proceeds from LAWA’s purchase of completed project assets. We have guaranteed the obligations of the RAIC under the credit facility. We expect to spend approximately $200 million on this project in 2018 using funding provided by the credit agreement and/or cash flows from operations.
New York-LaGuardia Redevelopment.
As part of the terminal redevelopment project at LaGuardia Airport, we are partnering with the Port Authority of New York and New Jersey (the “Port Authority”) to replace Terminals C and D with a new state-of-the-art terminal facility consisting of 37 gates across four concourses connected to a central headhouse. The terminal will feature a new, larger Delta Sky Club, wider concourses, more gate seating and 30 percent more concessions space than the existing terminals. The facility will also offer direct access between the parking garage and terminal and improved roadways and drop-off/pick-up areas. The design of the new terminal will integrate sustainable technologies and improvements in energy efficiency. Construction will be phased to limit passenger inconvenience and is expected to be completed by 2026.
In connection with the redevelopment, during 2017, we entered into an amended and restated terminal lease with the Port Authority with a term through 2050. Pursuant to the lease agreement we will (1) fund (through debt issuance and existing cash) and undertake the design, management and construction of the terminal and certain off-premises supporting facilities, (2) receive a Port Authority contribution of $600 million to facilitate construction of the terminal and other supporting infrastructure, (3) be responsible for all operations and maintenance during the term of the lease and (4) have preferential rights to all gates in the terminal subject to Port Authority requirements with respect to accommodation of designated carriers. We currently expect our costs for the project to be approximately $3.3 billion and we bear the risks of project construction, including if the project’s actual costs exceed the projected costs. We expect to spend approximately $550 million on this project in 2018 using funding provided by cash flows from operations and/or financing arrangements.
37
Financing Activities
Debt and Capital Leases.
The principal amount of debt and capital leases was
$8.9 billion
at
December 31, 2017
. Since December 31, 2009, we have reduced our principal amount of debt and capital leases by $9.4 billion.
During the March 2017 quarter, we issued $2.0 billion in aggregate principal amount of unsecured notes, consisting of $1.0 billion of 2.785% Notes due 2020 and $1.0 billion of 3.625% Notes due 2022. As discussed above, we used the net proceeds from this issuance to make a cash contribution to our qualified defined benefit pension plans. During the December 2017 quarter, we issued $450 million in aggregate principal amount of 2.600% Notes due 2020.
Our Pacific Facilities (including the Term Loan with a principal balance of
$1.0 billion
) mature in October 2018. We expect to repay this obligation with cash flows from operations, cash and cash equivalents and/or new financing arrangements.
During 2017, we received an upgrade to our credit rating from Standard & Poor's to an investment-grade rating of BBB-. We now have investment-grade ratings from all three major credit rating agencies.
At December 31, 2017, our corporate ratings were:
|
Rating Agency
|
Current Rating
|
Outlook
|
|
Fitch
|
BBB-
|
Stable
|
|
Moody's
|
Baa3
|
Stable
|
|
Standard & Poor's
|
BBB-
|
Stable
|
Capital Returns to Shareholders.
Since first implementing our quarterly dividend in 2013, we have increased the dividend per share by 50% annually and paid $1.9 billion in total dividends, including $731 million in 2017. Through dividends and share repurchases, we have returned $9.8 billion to shareholders since 2013, while reducing outstanding shares by approximately 18% compared to the beginning of 2013. During 2017 alone, we repurchased and retired 33 million shares at a cost of $1.7 billion.
|
(in millions, except repurchase price)
|
Share Repurchase Authorization
|
Average Repurchase Price
|
Planned Completion Date
|
Authorization Remaining
|
|||||||
|
May 2014 Program
|
$
|
2,000
|
|
$
|
42.86
|
|
December 31, 2016
|
Completed June 2015
|
|||
|
May 2015 Program
|
$
|
5,000
|
|
$
|
45.32
|
|
December 31, 2017
|
Completed September 2017
|
|||
|
May 2017 Program
|
$
|
5,000
|
|
$
|
52.13
|
|
December 31, 2020
|
$
|
4,675
|
|
|
On February 9, 2018, the Board of Directors declared a $0.3050 per share dividend for shareholders of record as of February 23, 2018.
Fuel Hedge Restructuring.
During 2016, we entered into transactions to defer settlement of a portion of our hedge portfolio until 2017. These deferral transactions, excluding market movements from the date of inception, provided approximately $300 million in cash receipts during the second half of 2016 and required approximately $300 million in cash payments in 2017.
During the June 2016 quarter, we early terminated certain of our outstanding deferral transactions and made cash payments of $170 million, including normal settlements. As a result, during the year ended December 31, 2017, we reported
$20 million
in cash receipts and
$244 million
in cash payments associated with these transactions. For additional information regarding these transactions, see
Note 4
to the Notes to the Consolidated Financial Statements.
Undrawn Lines of Credit
We have
$2.5 billion
available in undrawn revolving lines of credit. Our credit facilities have covenants, including minimum collateral coverage ratios. If we are not in compliance with these covenants, we may be required to repay amounts borrowed under the credit facilities or we may not be able to draw on them. We currently have a substantial amount of unencumbered assets available to pledge as collateral.
Covenants
We were in compliance with the covenants in our financing agreements at
December 31, 2017
.
38
Contractual Obligations
The following table summarizes our contractual obligations at
December 31, 2017
that we expect will be paid in cash. The table does not include amounts that are contingent on events or other factors that are uncertain or unknown at this time, including legal contingencies, uncertain tax positions and amounts payable under collective bargaining arrangements, among others. In addition, the table does not include expected significant cash payments representing obligations that arise in the ordinary course of business that do not include contractual commitments.
The amounts presented are based on various estimates, including estimates regarding the timing of payments, prevailing interest rates, volumes purchased, the occurrence of certain events and other factors. Accordingly, the actual results may vary materially from the amounts presented in the table.
|
Contractual Obligations by Year
(1)
|
|||||||||||||||||||||
|
(in millions)
|
2018
|
2019
|
2020
|
2021
|
2022
|
Thereafter
|
Total
|
||||||||||||||
|
Long-term debt (see Note 6)
|
|||||||||||||||||||||
|
Principal amount
|
$
|
2,183
|
|
$
|
1,359
|
|
$
|
1,983
|
|
$
|
345
|
|
$
|
2,009
|
|
$
|
660
|
|
$
|
8,539
|
|
|
Interest payments
|
349
|
|
247
|
|
171
|
|
131
|
|
82
|
|
120
|
|
1,100
|
|
|||||||
|
Capital lease obligations (see Note 7)
|
|||||||||||||||||||||
|
Principal amount
|
97
|
|
78
|
|
56
|
|
34
|
|
19
|
|
110
|
|
394
|
|
|||||||
|
Interest payments
|
19
|
|
14
|
|
9
|
|
7
|
|
5
|
|
16
|
|
70
|
|
|||||||
|
Operating lease payments (see Note 7)
|
1,735
|
|
1,589
|
|
1,430
|
|
1,156
|
|
1,036
|
|
9,290
|
|
16,236
|
|
|||||||
|
Aircraft purchase commitments (see Note 10)
|
3,570
|
|
3,370
|
|
3,270
|
|
3,880
|
|
2,450
|
|
1,740
|
|
18,280
|
|
|||||||
|
Contract carrier obligations (see Note 10)
|
1,772
|
|
1,603
|
|
1,320
|
|
793
|
|
723
|
|
1,975
|
|
8,186
|
|
|||||||
|
Employee benefit obligations (see Note 9)
|
149
|
|
144
|
|
130
|
|
120
|
|
113
|
|
5,916
|
|
6,572
|
|
|||||||
|
Other obligations
|
770
|
|
364
|
|
314
|
|
241
|
|
411
|
|
459
|
|
2,559
|
|
|||||||
|
Total
|
$
|
10,644
|
|
$
|
8,768
|
|
$
|
8,683
|
|
$
|
6,707
|
|
$
|
6,848
|
|
$
|
20,286
|
|
$
|
61,936
|
|
|
(1)
|
For additional information, see the Notes to the Consolidated Financial Statements referenced in the table above.
|
Long-Term Debt, Principal Amount.
Represents scheduled principal payments on long-term debt.
Long-Term Debt, Interest Payments.
Represents estimated interest payments under our long-term debt based on the interest rates specified in the applicable debt agreements. Interest payments on variable interest rate debt were calculated using London interbank offered rates ("LIBOR") at
December 31, 2017
.
Operating Lease Payments.
Represents our minimum rental commitments under noncancelable operating leases (including certain aircraft flown by regional carriers).
Aircraft Purchase Commitments.
Represents our commitments to purchase
100
A321-200neo,
93
A321-200,
75
CS100,
41
B-737-900ER,
25
A330-900neo and
19
A350-900 aircraft.
Contract Carrier Obligations.
Represents our estimated minimum fixed obligations under capacity purchase agreements with third-party regional carriers. The reported amounts are based on (1) the required minimum levels of flying by our contract carriers under the applicable agreements and (2) assumptions regarding the costs associated with such minimum levels of flying.
Employee Benefit Obligations.
Represents primarily (1) our estimated minimum required funding for our qualified defined benefit pension plans based on actuarially determined estimates and (2) projected future benefit payments from our unfunded postretirement and postemployment plans. For additional information about our defined benefit pension plan obligations, see "Critical Accounting Policies and Estimates."
Other Obligations.
Represents estimated purchase obligations under which we are required to make minimum payments for goods and services, including, but not limited to, insurance, marketing, maintenance, technology, sponsorships and other third-party services and products.
39
Critical Accounting Policies and Estimates
Our critical accounting policies and estimates are those that require significant judgments and estimates. Accordingly, the actual results may differ materially from these estimates. For a discussion of these and other accounting policies, see
Note 1
of the Notes to the Consolidated Financial Statements.
Frequent Flyer Program
Our SkyMiles program offers incentives to travel on Delta. This program allows customers to earn mileage credits by flying on Delta, Delta Connection and airlines that participate in the SkyMiles program, as well as through participating companies such as credit card companies, hotels and car rental agencies. We sell mileage credits to non-airline businesses, customers and other airlines. Effective January 1, 2015, the SkyMiles program was modified from a model in which customers earn redeemable mileage credits based on distance traveled to a model based on ticket price. This award change did not affect the way we account for the program.
The SkyMiles program includes two types of transactions that are considered revenue arrangements with multiple deliverables. As discussed below, these are (1) passenger ticket sales earning mileage credits and (2) the sale of mileage credits to participating companies with which we have marketing agreements. Mileage credits are a separate unit of accounting as they can be redeemed by customers in future periods for air travel on Delta and participating airlines, membership in our Sky Club and other program awards.
Passenger Ticket Sales Earning Mileage Credits.
Passenger ticket sales earning mileage credits under our SkyMiles program provide customers with (1) mileage credits earned and (2) air transportation. We value each deliverable on a standalone basis. Our estimate of the selling price of a mileage credit is based on an analysis of our sales of mileage credits to other airlines and customers, which is re-evaluated at least annually. We use established ticket prices to determine the estimated selling price of air transportation. We allocate the total amount collected from passenger ticket sales between the deliverables based on their relative selling prices.
We defer revenue for the mileage credits related to passenger ticket sales when the credits are earned and recognize it as passenger revenue when miles are redeemed and services are provided. We record the air transportation portion of the passenger ticket sales in air traffic liability and recognize these amounts in passenger revenue when we provide transportation or when the ticket expires unused. A hypothetical 10% increase in our estimate of the standalone selling price of a mileage credit would decrease passenger revenue by approximately $50 million, as a result of an increase in the amount of revenue deferred from the mileage component of passenger ticket sales.
Sale of Mileage Credits.
Customers may earn mileage credits through participating companies such as credit card companies, hotels and car rental agencies with which we have marketing agreements to sell mileage credits. Our contracts to sell mileage credits under these marketing agreements have multiple deliverables, as defined below.
Our most significant contract to sell mileage credits relates to our co-brand credit card relationship with American Express.
In December 2014, we amended our marketing agreements with American Express, which increased the value we receive under the agreements through 2022. The amended agreements became effective January 1, 2015. We account for the agreements consistent with the accounting method that allocates the consideration received to the individual products and services delivered based on their relative selling prices.
We determined our best estimate of the selling prices by considering discounted cash flow analysis using multiple inputs and assumptions, including: (1) the expected number of miles awarded and number of miles redeemed, (2) the rate at which we sell mileage credits to other airlines, (3) published rates on our website for baggage fees, discounted access to Delta Sky Club lounges and other benefits while traveling on Delta and (4) brand value. The increased value received under the amended agreements increases the amount of deferred revenue for the travel component and increases the value of the other deliverables, which are recognized in other revenue as they are provided.
We recognize revenue as we deliver each sales element. We defer the travel deliverable (mileage credits) as part of frequent flyer deferred revenue and recognize passenger revenue as the mileage credits are used for travel. The revenue allocated to the remaining deliverables is recorded in other revenue. We recognize the revenue for these services as they are performed.
40
Breakage.
For mileage credits that we estimate are not likely to be redeemed ("breakage"), we recognize the associated value proportionally during the period in which the remaining mileage credits are expected to be redeemed. We use statistical models to estimate breakage based on historical redemption patterns. A change in assumptions as to the period over which mileage credits are expected to be redeemed, the actual redemption activity for mileage credits or the estimated fair value of mileage credits expected to be redeemed could have a material impact on our revenue in the year in which the change occurs and in future years. At
December 31, 2017
, the aggregate deferred revenue balance associated with the SkyMiles program was
$4.1 billion
. A hypothetical 1% change in the number of outstanding miles estimated to be redeemed would result in a $34 million impact on our deferred revenue liability at
December 31, 2017
.
Goodwill and Indefinite-Lived Intangible Assets
We apply a fair value-based impairment test to the carrying value of goodwill and indefinite-lived intangible assets on an annual basis (as of October 1) and, if certain events or circumstances indicate that an impairment loss may have been incurred, on an interim basis. We assess the value of our goodwill and indefinite-lived assets under either a qualitative or quantitative approach. Under a qualitative approach, we consider various market factors, including the key assumptions listed below. We analyze these factors to determine if events and circumstances have affected the fair value of goodwill and indefinite-lived intangible assets. If we determine that it is more likely than not that the asset may be impaired, we use the quantitative approach to assess the asset's fair value and the amount of the impairment. Under a quantitative approach, we calculate the fair value of the asset using the key assumptions listed below.
When we evaluate goodwill for impairment using a quantitative approach, we estimate the fair value of the reporting unit by considering both market capitalization and projected discounted future cash flows (an income approach).
When we perform a quantitative impairment assessment of our indefinite-lived intangible assets, fair value
is estimated based on (1) recent market transactions, where available, (2) the royalty method for the Delta tradename (which assumes hypothetical royalties generated from using our tradename) or (3) projected discounted future cash flows (an income approach).
Key Assumptions.
The key assumptions in our impairment tests include:
(1) forecasted revenues, expenses and cash flows, (2) terminal period revenue growth and cash flows, (3) an estimated weighted average cost of capital, (4) assumed discount rates depending on the asset and (5) a tax rate. These assumptions are consistent with those hypothetical market participants would use. Since we are required to make estimates and assumptions when evaluating goodwill and indefinite-lived intangible assets for impairment, actual transaction amounts may differ materially from these estimates.
In addition, we consider the amount by which the intangible assets' fair values exceeded their respective carrying values in the most recent fair value measurements calculated using a quantitative approach.
Changes in certain events and circumstances could result in impairment or a change from indefinite-lived to definite-lived. Factors which could cause impairment include, but are not limited to, (1) negative trends in our market capitalization, (2) reduced profitability resulting from lower passenger mile yields or higher input costs (primarily related to fuel and employees), (3) lower passenger demand as a result of weakened U.S. and global economies, (4) interruption to our operations due to a prolonged employee strike, terrorist attack or other reasons, (5) changes to the regulatory environment (e.g., diminished slot restrictions or additional Open Skies agreements), (6) competitive changes by other airlines and (7) strategic changes to our operations leading to diminished utilization of the intangible assets.
We assessed each of the above assumptions in our most recent impairment analyses. The combination of our most recently completed annual results and our projected revenues, expenses and cash flows more than offset any negative events and circumstances. The stabilized operating environment for U.S. airlines has also contributed to improved financial results.
Goodwill
.
Our goodwill balance, which is related to the airline segment, was
$9.8 billion
at
December 31, 2017
. Based upon our qualitative assessment of all relevant factors, including applicable factors noted in "
Key Assumptions
" above, we determined that there was no indication that goodwill was impaired.
Identifiable Intangible Assets.
Our identifiable intangible assets, which are related to the airline segment, had a net carrying amount of
$4.8 billion
at
December 31, 2017
, of which
$4.7 billion
related to indefinite-lived intangible assets.
Indefinite-lived assets are not amortized and consist primarily of routes, slots, the Delta tradename and assets related to SkyTeam and collaborative arrangements. Definite-lived assets consist primarily of marketing and maintenance service agreements.
We performed qualitative assessments of our indefinite-lived intangible assets, including applicable factors noted in "
Key Assumptions
" above, and determined that there was no indication that the assets were impaired. Our qualitative assessments include analyses and weighting of all relevant factors, which impact the fair value of our indefinite-lived intangible assets.
41
Long-Lived Assets
Our flight equipment and other long-lived assets have a recorded value of
$26.6 billion
at
December 31, 2017
. This value is based on various factors, including the assets' estimated useful lives and salvage values.
We review flight equipment and other long-lived assets used in operations for impairment losses when events and circumstances indicate the assets may be impaired. Factors which could be indicators of impairment include, but are not limited to, (1) a decision to permanently remove flight equipment or other long-lived assets from operations, (2) significant changes in the estimated useful life, (3) significant changes in projected cash flows, (4) permanent and significant declines in fleet fair values and (5) changes to the regulatory environment. For long-lived assets held for sale, we discontinue depreciation and record impairment losses when the carrying amount of these assets is greater than the fair value less the cost to sell.
To determine whether impairments exist for aircraft used in operations, we group assets at the fleet-type level (the lowest level for which there are identifiable cash flows) and then estimate future cash flows based on projections of capacity, passenger mile yield, fuel costs, labor costs and other relevant factors. If an impairment occurs, the impairment loss recognized is the amount by which the fleet's carrying amount exceeds its estimated fair value. We estimate aircraft fair values using published sources, appraisals and bids received from third parties, as available.
Defined Benefit Pension Plans
We sponsor defined benefit pension plans for eligible employees and retirees. These plans are closed to new entrants and frozen for future benefit accruals.
As of
December 31, 2017
, the unfunded benefit obligation for these plans recorded on our Consolidated Balance Sheet was
$7.0 billion
. During
2017
, we contributed $3.5 billion to these plans. We have no minimum funding requirements in 2018. However, in January 2018, we voluntarily contributed approximately
$500 million
to these plans. The most critical assumptions impacting our defined benefit pension plan obligations and expenses are the discount rate, the expected long-term rate of return on plan assets and life expectancy.
Weighted Average Discount Rate.
We determine our weighted average discount rate on our measurement date primarily by reference to annualized rates earned on high-quality fixed income investments and yield-to-maturity analysis specific to our estimated future benefit payments. We used a weighted average discount rate to value the obligations of
3.69%
and
4.20%
at
December 31, 2017
and
2016
, respectively. Our weighted average discount rate for net periodic pension benefit cost in each of the past three years has varied from the rate selected on our measurement date, ranging from
4.13%
to
4.57%
between 2015 and 2017.
Expected Long-Term Rate of Return.
Our expected long-term rate of return on plan assets is based primarily on plan-specific investment studies using historical market return and volatility data.
Modest excess return expectations versus some public market indices are incorporated into the return projections based on the actively managed structure of the investment programs and their records of achieving such returns historically. We also expect to receive a premium for investing in less liquid private markets.
We review our rate of return on plan assets assumptions annually.
Our annual investment performance for one particular year does not, by itself, significantly influence our evaluation.
The investment strategy for our defined benefit pension plan assets is to earn a long-term return that meets or exceeds our annualized return target while taking an acceptable level of risk and maintaining sufficient liquidity to pay current benefits and other cash obligations of the plan. This is achieved by investing in a globally diversified mix of public and private equity, fixed income, real assets, hedge funds and other assets and instruments.
Our expected long-term rate of return on assets for net periodic pension benefit cost for the year ended
December 31, 2017
was
8.96%
.
The impact of a 0.50% change in these assumptions is shown in the table below:
|
Change in Assumption
|
Effect on 2018
Pension Expense
|
Effect on Accrued
Pension Liability at
December 31, 2017
|
||||||
|
0.50% decrease in weighted average discount rate
|
$
|
(9
|
) million
|
$
|
1.4
|
billion
|
||
|
0.50% increase in weighted average discount rate
|
$
|
5
|
million
|
$
|
(1.2
|
) billion
|
||
|
0.50% decrease in expected long-term rate of return on assets
|
$
|
73
|
million
|
$
|
—
|
|
||
|
0.50% increase in expected long-term rate of return on assets
|
$
|
(73
|
) million
|
$
|
—
|
|
||
42
Life Expectancy
. Changes in life expectancy may significantly change our benefit obligations and future expense. We use the Society of Actuaries ("SOA") published mortality data, other publicly available information and our own perspective of future longevity to develop our best estimate of life expectancy. The SOA publishes annual updated mortality tables for U.S. plans and updated improvement scale. Each year we consider updates by the SOA in setting our mortality assumptions for purposes of measuring pension and other postretirement and postemployment benefit obligations.
Funding.
Our funding obligations for qualified defined benefit plans are governed by the Employee Retirement Income Security Act.
The Pension Protection Act of 2006 allows commercial airlines to elect alternative funding rules ("Alternative Funding Rules") for defined benefit plans that are frozen. We elected the Alternative Funding Rules under which the unfunded liability for a frozen defined benefit plan may be amortized over a fixed 17-year period and is calculated using an
8.85%
discount rate.
While the Pension Protection Act makes our funding obligations for these plans more predictable, factors outside our control continue to have an impact on the funding requirements. Estimates of future funding requirements are based on various assumptions and can vary materially from actual funding requirements. Assumptions include, among other things, the actual and projected market performance of assets, statutory requirements and demographic data for participants. For additional information, see
Note 9
of the Notes to the Consolidated Financial Statements.
Recent Accounting Standards
Revenue from Contracts with Customers
On January 1, 2018, we will adopt ASU No. 2014-09, "Revenue from Contracts with Customers (Topic 606)" using the full retrospective method. While the adoption will not have a significant impact on earnings, the classification of certain revenues that are currently classified in other revenue will be reclassified to passenger revenue. These include baggage fees, administrative charges and other travel-related fees, all of which will be deemed part of the single performance obligation of providing passenger transportation. These revenues, which are approximately
$2 billion
annually, will be reclassified from the current presentation in other revenue to passenger revenue.
In addition, the adoption of the new standard increases the rate used to account for frequent flyer miles. We currently analyze our standalone sales of mileage credits to other airlines and customers to establish the accounting value for frequent flyer miles. Considering the guidance in the new standard, we will change our valuation of a mileage credit to an analysis of the award redemption value. The new valuation considers the value a passenger receives by redeeming miles rather than paying cash for an award ticket. This change increases our frequent flyer liability by approximately
$2 billion
. The mileage deferral and redemption rates are approximately the same; therefore, assuming stable volume, there would not be a significant change in revenue recognized from the program for a given period.
The adoption of the new standard will also reduce our air traffic liability by approximately
$500 million
. This change primarily results from estimating the tickets that will expire unused and recognizing revenue at the scheduled flight date rather than when the unused tickets expire.
Retirement Benefits
In 2017, the FASB issued ASU No. 2017-07, "Compensation—Retirement Benefits (Topic 715)." This standard requires an entity to report the service cost component in the same line item as other compensation costs. The other components of net (benefit) cost will be required to be presented in the income statement separately from the service cost component and outside a subtotal of income from operations. In 2017, we recorded $50 million of non-service costs that will be reclassified to non-operating expense upon adoption. This standard is effective for interim and annual reporting periods beginning after December 15, 2017. We will adopt the standard effective January 1, 2018.
43
See the table below for the unaudited impact resulting from the adoption of these standards on our Consolidated Financial Statements.
|
Year Ended December 31,
|
|||||||||||||||||||||||||
|
2017
|
2016
|
||||||||||||||||||||||||
|
(Unaudited)
(in millions, except per share data and statistics)
|
As Reported
|
Revenue from Contracts with Customers
|
Retirement Benefits
|
As Adjusted
|
As Reported
|
Revenue from Contracts with Customers
|
Retirement Benefits
|
As Adjusted
|
|||||||||||||||||
|
Income statement:
|
|||||||||||||||||||||||||
|
Passenger revenue
|
$
|
34,819
|
|
$
|
2,297
|
|
$
|
—
|
|
$
|
37,116
|
|
$
|
33,777
|
|
$
|
2,189
|
|
$
|
—
|
|
$
|
35,966
|
|
|
|
Cargo revenue
|
729
|
|
15
|
|
—
|
|
744
|
|
668
|
|
16
|
|
—
|
|
684
|
|
|||||||||
|
Other revenue
|
5,696
|
|
(2,418
|
)
|
—
|
|
3,278
|
|
5,194
|
|
(2,394
|
)
|
—
|
|
2,800
|
|
|||||||||
|
Operating expense
|
(35,130
|
)
|
(92
|
)
|
50
|
|
(35,172
|
)
|
(32,687
|
)
|
(92
|
)
|
325
|
|
(32,454
|
)
|
|||||||||
|
Non-operating expense
|
(413
|
)
|
(3
|
)
|
(50
|
)
|
(466
|
)
|
(316
|
)
|
(2
|
)
|
(325
|
)
|
(643
|
)
|
|||||||||
|
Income tax provision
|
(2,124
|
)
|
(171
|
)
|
—
|
|
(2,295
|
)
|
(2,263
|
)
|
105
|
|
—
|
|
(2,158
|
)
|
|||||||||
|
Net income
|
3,577
|
|
(372
|
)
|
—
|
|
3,205
|
|
4,373
|
|
(178
|
)
|
—
|
|
4,195
|
|
|||||||||
|
Diluted earnings per share
|
$
|
4.95
|
|
$
|
(0.52
|
)
|
—
|
|
$
|
4.43
|
|
$
|
5.79
|
|
$
|
(0.24
|
)
|
—
|
|
$
|
5.55
|
|
|||
|
Operating statistics:
|
|||||||||||||||||||||||||
|
Pre-tax margin
|
13.8
|
%
|
(0.4
|
)%
|
—
|
%
|
13.4
|
%
|
16.7
|
%
|
(0.6
|
)%
|
—
|
%
|
16.1
|
%
|
|||||||||
|
Passenger mile yield
(1)
|
|
15.99
|
¢
|
|
1.06
|
¢
|
—
|
|
|
17.05
|
¢
|
|
15.85
|
¢
|
|
1.03
|
¢
|
—
|
|
|
16.88
|
¢
|
|||
|
PRASM
(1)
|
|
13.69
|
¢
|
|
0.90
|
¢
|
—
|
|
|
14.59
|
¢
|
|
13.41
|
¢
|
|
0.87
|
¢
|
—
|
|
|
14.28
|
¢
|
|||
|
TRASM
(1)
|
|
16.22
|
¢
|
|
(0.04
|
)¢
|
—
|
|
|
16.18
|
¢
|
|
15.74
|
¢
|
|
(0.08
|
)¢
|
—
|
|
|
15.66
|
¢
|
|||
|
CASM
(1)
|
|
13.81
|
¢
|
|
0.04
|
¢
|
|
(0.02
|
)¢
|
|
13.83
|
¢
|
|
12.98
|
¢
|
|
0.04
|
¢
|
|
(0.13
|
)¢
|
|
12.89
|
¢
|
|
|
Balance sheet:
|
|||||||||||||||||||||||||
|
Deferred income taxes, net
|
$
|
935
|
|
$
|
419
|
|
$
|
—
|
|
$
|
1,354
|
|
$
|
3,064
|
|
$
|
589
|
|
$
|
—
|
|
$
|
3,653
|
|
|
|
Air traffic liability
|
4,888
|
|
(524
|
)
|
—
|
|
4,364
|
|
4,626
|
|
(546
|
)
|
—
|
|
4,080
|
|
|||||||||
|
Frequent flyer deferred revenue (current and noncurrent)
|
4,118
|
|
2,082
|
|
—
|
|
6,200
|
|
3,926
|
|
1,877
|
|
—
|
|
5,803
|
|
|||||||||
|
Other accrued and other noncurrent liabilities
|
3,969
|
|
241
|
|
—
|
|
4,210
|
|
3,785
|
|
268
|
|
—
|
|
4,053
|
|
|||||||||
|
Retained earnings
|
9,636
|
|
(1,380
|
)
|
—
|
|
8,256
|
|
7,903
|
|
(1,009
|
)
|
—
|
|
6,894
|
|
|||||||||
|
(1)
|
Refer to the "Glossary of Defined Terms" below for the definition of these terms.
|
44
Supplemental Information
We sometimes use information ("non-GAAP financial measures") that is derived from the Consolidated Financial Statements but that is not presented in accordance with GAAP. Under the U.S. Securities and Exchange Commission rules, non-GAAP financial measures may be considered in addition to results prepared in accordance with GAAP but should not be considered a substitute for or superior to GAAP results.
The following table shows a reconciliation of pre-tax income (a GAAP measure) to pre-tax income, adjusted for special items (a non-GAAP financial measure). We adjust pre-tax income for the following items to determine pre-tax income, adjusted for special items, for the reasons described below:
|
•
|
MTM adjustments and settlements.
MTM adjustments are defined as fair value changes recorded in periods other than the settlement period. Such fair value changes are not necessarily indicative of the actual settlement value of the underlying hedge in the contract settlement period. Settlements represent cash received or paid on hedge contracts settled during the period. These items adjust fuel expense to show the economic impact of hedging, including cash received or paid on hedge contracts during the period. Adjusting for these items allows investors to better understand and analyze our core operational performance in the periods shown.
|
|
•
|
Investment MTM adjustments
. We record our proportionate share of earnings from our equity investments in Virgin Atlantic and Aeroméxico in non-operating expense. We adjust for Virgin Atlantic's and Aeroméxico's MTM adjustments to allow investors to better understand and analyze our core financial performance in the periods shown.
|
|
Year Ended December 31,
|
||||||
|
(in millions)
|
2017
|
2016
|
||||
|
Pre-tax income
|
$
|
5,701
|
|
$
|
6,636
|
|
|
Adjusted for:
|
||||||
|
MTM adjustments and settlements
|
(259
|
)
|
(450
|
)
|
||
|
Investment MTM adjustments
|
8
|
|
(115
|
)
|
||
|
Pre-tax income, adjusted for special items
|
$
|
5,450
|
|
$
|
6,071
|
|
The following table shows a reconciliation of CASM (a GAAP measure) to CASM-Ex, including profit sharing (a non-GAAP financial measure). We adjust CASM for the following items to determine CASM-Ex, including profit sharing for the reasons described below:
|
•
|
Aircraft fuel and related taxes.
The volatility in fuel prices impacts the comparability of year-over-year financial performance. The adjustment for aircraft fuel and related taxes (including our regional carriers) allows investors to better understand and analyze our non-fuel costs and year-over-year financial performance.
|
|
•
|
Other expenses.
Other expenses include aircraft maintenance and staffing services we provide to third parties, our vacation wholesale operations and refinery cost of sales to third parties. Because these businesses are not related to the generation of a seat mile, we adjust for the costs related to these sales to provide a more meaningful comparison of the costs of our airline operations to the rest of the airline industry.
|
|
Year Ended December 31,
|
||||||
|
2017
|
2016
|
|||||
|
CASM (cents)
|
|
13.81
|
¢
|
|
12.98
|
¢
|
|
Adjusted for:
|
||||||
|
Aircraft fuel and related taxes
|
(2.66
|
)
|
(2.38
|
)
|
||
|
Other expenses
|
(0.58
|
)
|
(0.47
|
)
|
||
|
CASM-Ex, including profit sharing
|
|
10.57
|
¢
|
|
10.13
|
¢
|
45
Glossary of Defined Terms
ASM
- Available Seat Mile. A measure of capacity. ASMs equal the total number of seats available for transporting passengers during a reporting period multiplied by the total number of miles flown during that period.
CASM
- (Operating) Cost per Available Seat Mile. The amount of operating cost incurred per ASM during a reporting period. CASM is also referred to as "unit cost."
CASM-Ex, including profit sharing
- The amount of operating cost incurred per ASM during a reporting period, adjusted for aircraft fuel and related taxes, other expenses, including aircraft maintenance and staffing services we provide to third parties, our vacation wholesale operations and refinery cost of sales to third parties.
Passenger Load Factor
- A measure of utilized available seating capacity calculated by dividing RPMs by ASMs for a reporting period.
Passenger Mile Yield or Yield
- The amount of passenger revenue earned per RPM during a reporting period.
PRASM
- Passenger Revenue per ASM. The amount of passenger revenue earned per ASM during a reporting period. PRASM is also referred to as "unit revenue."
RPM
- Revenue Passenger Mile. One revenue-paying passenger transported one mile. RPMs equal the number of revenue passengers during a reporting period multiplied by the number of miles flown by those passengers during that period. RPMs are also referred to as "traffic."
TRASM
- Total Revenue per ASM. The amount of total revenue earned per ASM during a reporting period.
46
ITEM 7A. QUANTITATIVE AND QUALITATIVE DISCLOSURES ABOUT MARKET RISK
We have market risk exposure related to fuel prices, interest rates and foreign currency exchange rates. Market risk is the potential negative impact of adverse changes in these prices or rates on our Consolidated Financial Statements. In an effort to manage our exposure to these risks, we enter into derivative contracts and may adjust our derivative portfolio as market conditions change. We expect adjustments to the fair value of financial instruments to result in ongoing volatility in earnings and stockholders' equity.
The following sensitivity analyses do not consider the effects of a change in demand for air travel, the economy as a whole or actions we may take to seek to mitigate our exposure to a particular risk. For these and other reasons, the actual results of changes in these prices or rates may differ materially from the following hypothetical results.
Fuel Price Risk
Changes in fuel prices materially impact our results of operations.
We have recently managed our fuel price risk through a hedging program intended to reduce the financial impact from changes in the price of fuel as fuel prices are subject to potential volatility.
A one cent increase in the cost of jet fuel would result in approximately $40 million of additional annual fuel expense.
Interest Rate Risk
Our exposure to market risk from adverse changes in interest rates is primarily associated with our long-term debt obligations. Market risk associated with our fixed and variable rate long-term debt relates to the potential reduction in fair value and negative impact to future earnings, respectively, from an increase in interest rates.
At
December 31, 2017
, we had $5.3 billion of fixed-rate long-term debt and $3.2 billion of variable-rate long-term debt. An increase of 100 basis points in average annual interest rates would have decreased the estimated fair value of our fixed-rate long-term debt by $160 million at
December 31, 2017
and would have increased the annual interest expense on our variable-rate long-term debt by $32 million.
Foreign Currency Exchange Risk
We are subject to foreign currency exchange rate risk because we have revenue and expense denominated in foreign currencies with our primary exposures being the Japanese yen and Canadian dollar. To manage exchange rate risk, we execute both our international revenue and expense transactions in the same foreign currency to the extent practicable.
From time to time, we may also enter into foreign currency option and forward contracts.
At
December 31, 2017
, we had open foreign currency forward contracts totaling a
$17 million
liability position. We estimate that a 10% depreciation or appreciation in the price of the Japanese yen and Canadian dollar in relation to the U.S. dollar would change the projected cash settlement value of our open hedge contracts by a $34 million gain or $42 million loss, respectively, for the year ending December 31, 2018.
47
ITEM 8. FINANCIAL STATEMENTS AND SUPPLEMENTARY DATA
INDEX TO CONSOLIDATED FINANCIAL STATEMENTS
|
Page
|
|
48
REPORT OF INDEPENDENT REGISTERED PUBLIC ACCOUNTING FIRM
To the Board of Directors and Stockholders of
Delta Air Lines, Inc.
Opinion on the Financial Statements
We have audited the accompanying consolidated balance sheets of Delta Air Lines, Inc. (the Company) as of
December 31, 2017
and
2016
, and the related consolidated statements of operations, comprehensive income, cash flows, and stockholders' equity for each of the three years in the period ended
December 31, 2017
, and the related notes (collectively referred to as the “consolidated financial statements”). In our opinion, the consolidated financial statements present fairly, in all material respects, the financial position of the Company at
December 31, 2017
and
2016
, and the results of its operations and its cash flows for each of the three years in the period ended
December 31, 2017
, in conformity with U.S. generally accepted accounting principles.
We also have audited, in accordance with the standards of the Public Company Accounting Oversight Board (United States) (PCAOB), the Company's internal control over financial reporting as of
December 31, 2017
, based on criteria established in Internal Control-Integrated Framework issued by the Committee of Sponsoring Organizations of the Treadway Commission (2013 framework), and our report dated
February 23, 2018
expressed an unqualified opinion thereon.
Basis for Opinion
These financial statements are the responsibility of the Company's management. Our responsibility is to express an opinion on the Company’s financial statements based on our audits. We are a public accounting firm registered with the PCAOB and are required to be independent with respect to the Company in accordance with the U.S. federal securities laws and the applicable rules and regulations of the Securities and Exchange Commission and the PCAOB.
We conducted our audits in accordance with the standards of the PCAOB. Those standards require that we plan and perform the audit to obtain reasonable assurance about whether the financial statements are free of material misstatement, whether due to error or fraud. Our audits included performing procedures to assess the risks of material misstatements of the financial statements, whether due to error or fraud, and performing procedures that respond to those risks. Such procedures included examining, on a test basis, evidence regarding the amounts and disclosures in the financial statements. Our audits also included evaluating the accounting principles used and significant estimates made by management, as well as evaluating the overall presentation of the financial statements. We believe that our audits provide a reasonable basis for our opinion.
|
/s/ Ernst & Young LLP
|
|
|
We have served as the Company's auditor since 2006.
|
|
|
Atlanta, Georgia
|
|
|
February 23, 2018
|
|
49
DELTA AIR LINES, INC.
Consolidated Balance Sheets
|
December 31,
|
||||||||
|
(in millions, except share data)
|
2017
|
2016
|
||||||
|
ASSETS
|
||||||||
|
Current Assets:
|
||||||||
|
Cash and cash equivalents
|
$
|
|
|
$
|
|
|
||
|
Short-term investments
|
|
|
|
|
||||
|
Accounts receivable, net of an allowance for uncollectible accounts of $12 and $15 at December 31, 2017 and 2016, respectively
|
|
|
|
|
||||
|
Fuel inventory
|
|
|
|
|
||||
|
Expendable parts and supplies inventories, net of an allowance for obsolescence of $113 and $110 at December 31, 2017 and 2016, respectively
|
|
|
|
|
||||
|
Prepaid expenses and other
|
|
|
|
|
||||
|
Total current assets
|
|
|
|
|
||||
|
Property and Equipment, Net:
|
||||||||
|
Property and equipment, net of accumulated depreciation and amortization of $14,097 and $12,456 at December 31, 2017 and 2016, respectively
|
|
|
|
|
||||
|
Other Assets:
|
||||||||
|
Goodwill
|
|
|
|
|
||||
|
Identifiable intangibles, net of accumulated amortization of $845 and $828 at December 31, 2017 and 2016, respectively
|
|
|
|
|
||||
|
Deferred income taxes, net
|
|
|
|
|
||||
|
Other noncurrent assets
|
|
|
|
|
||||
|
Total other assets
|
|
|
|
|
||||
|
Total assets
|
$
|
|
|
$
|
|
|
||
|
LIABILITIES AND STOCKHOLDERS' EQUITY
|
||||||||
|
Current Liabilities:
|
||||||||
|
Current maturities of long-term debt and capital leases
|
$
|
|
|
$
|
|
|
||
|
Air traffic liability
|
|
|
|
|
||||
|
Accounts payable
|
|
|
|
|
||||
|
Accrued salaries and related benefits
|
|
|
|
|
||||
|
Frequent flyer deferred revenue
|
|
|
|
|
||||
|
Fuel card obligation
|
|
|
|
|
||||
|
Other accrued liabilities
|
|
|
|
|
||||
|
Total current liabilities
|
|
|
|
|
||||
|
Noncurrent Liabilities:
|
||||||||
|
Long-term debt and capital leases
|
|
|
|
|
||||
|
Pension, postretirement and related benefits
|
|
|
|
|
||||
|
Frequent flyer deferred revenue
|
|
|
|
|
||||
|
Other noncurrent liabilities
|
|
|
|
|
||||
|
Total noncurrent liabilities
|
|
|
|
|
||||
|
Commitments and Contingencies
|
|
|
||||||
|
Stockholders' Equity:
|
||||||||
|
Common stock at $0.0001 par value; 1,500,000,000 shares authorized, 714,674,160 and 744,886,938 shares issued at December 31, 2017 and 2016, respectively
|
|
|
|
|
||||
|
Additional paid-in capital
|
|
|
|
|
||||
|
Retained earnings
|
|
|
|
|
||||
|
Accumulated other comprehensive loss
|
(
|
)
|
(
|
)
|
||||
|
Treasury stock, at cost, 7,476,181 and 14,149,229 shares at December 31, 2017 and 2016, respectively
|
(
|
)
|
(
|
)
|
||||
|
Total stockholders' equity
|
|
|
|
|
||||
|
Total liabilities and stockholders' equity
|
$
|
|
|
$
|
|
|
||
|
The accompanying notes are an integral part of these Consolidated Financial Statements.
|
||||||||
50
DELTA AIR LINES, INC.
Consolidated Statements of Operations
|
Year Ended December 31,
|
|||||||||||
|
(in millions, except per share data)
|
2017
|
2016
|
2015
|
||||||||
|
Operating Revenue:
|
|||||||||||
|
Passenger:
|
|||||||||||
|
Mainline
|
$
|
|
|
$
|
|
|
$
|
|
|
||
|
Regional carriers
|
|
|
|
|
|
|
|||||
|
Total passenger revenue
|
|
|
|
|
|
|
|||||
|
Cargo
|
|
|
|
|
|
|
|||||
|
Other
|
|
|
|
|
|
|
|||||
|
Total operating revenue
|
|
|
|
|
|
|
|||||
|
Operating Expense:
|
|||||||||||
|
Salaries and related costs
|
|
|
|
|
|
|
|||||
|
Aircraft fuel and related taxes
|
|
|
|
|
|
|
|||||
|
Regional carriers expense
|
|
|
|
|
|
|
|||||
|
Depreciation and amortization
|
|
|
|
|
|
|
|||||
|
Contracted services
|
|
|
|
|
|
|
|||||
|
Aircraft maintenance materials and outside repairs
|
|
|
|
|
|
|
|||||
|
Passenger commissions and other selling expenses
|
|
|
|
|
|
|
|||||
|
Landing fees and other rents
|
|
|
|
|
|
|
|||||
|
Passenger service
|
|
|
|
|
|
|
|||||
|
Profit sharing
|
|
|
|
|
|
|
|||||
|
Aircraft rent
|
|
|
|
|
|
|
|||||
|
Other
|
|
|
|
|
|
|
|||||
|
Total operating expense
|
|
|
|
|
|
|
|||||
|
Operating Income
|
|
|
|
|
|
|
|||||
|
Non-Operating Expense:
|
|||||||||||
|
Interest expense, net
|
(
|
)
|
(
|
)
|
(
|
)
|
|||||
|
Miscellaneous, net
|
(
|
)
|
|
|
(
|
)
|
|||||
|
Total non-operating expense, net
|
(
|
)
|
(
|
)
|
(
|
)
|
|||||
|
Income Before Income Taxes
|
|
|
|
|
|
|
|||||
|
Income Tax Provision
|
(
|
)
|
(
|
)
|
(
|
)
|
|||||
|
Net Income
|
$
|
|
|
$
|
|
|
$
|
|
|
||
|
Basic Earnings Per Share
|
$
|
|
|
$
|
|
|
$
|
|
|
||
|
Diluted Earnings Per Share
|
$
|
|
|
$
|
|
|
$
|
|
|
||
|
Cash Dividends Declared Per Share
|
$
|
|
|
$
|
|
|
$
|
|
|
||
|
The accompanying notes are an integral part of these Consolidated Financial Statements.
|
|||||||||||
51
DELTA AIR LINES, INC.
Consolidated Statements of Comprehensive Income
|
Year Ended December 31,
|
|||||||||||
|
(in millions)
|
2017
|
2016
|
2015
|
||||||||
|
Net Income
|
$
|
|
|
$
|
|
|
$
|
|
|
||
|
Other comprehensive income (loss):
|
|||||||||||
|
Net change in derivative contracts
|
(
|
)
|
(
|
)
|
(
|
)
|
|||||
|
Net change in pension and other benefits
|
(
|
)
|
(
|
)
|
|
|
|||||
|
Net change in investments
|
|
|
|
|
(
|
)
|
|||||
|
Total Other Comprehensive Income (Loss)
|
|
|
(
|
)
|
|
|
|||||
|
Comprehensive Income
|
$
|
|
|
$
|
|
|
$
|
|
|
||
The accompanying notes are an integral part of these Consolidated Financial Statements.
52
DELTA AIR LINES, INC.
Consolidated Statements of Cash Flows
|
Year Ended December 31,
|
|||||||||||
|
(in millions)
|
2017
|
2016
|
2015
|
||||||||
|
Cash Flows From Operating Activities:
|
|||||||||||
|
Net income
|
$
|
|
|
$
|
|
|
$
|
|
|
||
|
Adjustments to reconcile net income to net cash provided by operating activities:
|
|||||||||||
|
Depreciation and amortization
|
|
|
|
|
|
|
|||||
|
Hedge derivative contracts
|
(
|
)
|
(
|
)
|
(
|
)
|
|||||
|
Deferred income taxes
|
|
|
|
|
|
|
|||||
|
Pension, postretirement and postemployment payments greater than expense
|
(
|
)
|
(
|
)
|
(
|
)
|
|||||
|
Equity investment earnings
|
(
|
)
|
(
|
)
|
(
|
)
|
|||||
|
Changes in certain assets and liabilities:
|
|||||||||||
|
Receivables
|
(
|
)
|
(
|
)
|
(
|
)
|
|||||
|
Fuel inventory
|
(
|
)
|
(
|
)
|
|
|
|||||
|
Hedge margin
|
(
|
)
|
|
|
|
|
|||||
|
Prepaid expenses and other current assets
|
(
|
)
|
(
|
)
|
(
|
)
|
|||||
|
Air traffic liability
|
|
|
|
|
|
|
|||||
|
Frequent flyer deferred revenue
|
|
|
|
|
(
|
)
|
|||||
|
Profit sharing
|
(
|
)
|
(
|
)
|
|
|
|||||
|
Accounts payable and accrued liabilities
|
|
|
|
|
(
|
)
|
|||||
|
Other, net
|
(
|
)
|
|
|
|
|
|||||
|
Net cash provided by operating activities
|
|
|
|
|
|
|
|||||
|
Cash Flows From Investing Activities:
|
|||||||||||
|
Property and equipment additions:
|
|||||||||||
|
Flight equipment, including advance payments
|
(
|
)
|
(
|
)
|
(
|
)
|
|||||
|
Ground property and equipment, including technology
|
(
|
)
|
(
|
)
|
(
|
)
|
|||||
|
Purchase of equity investments
|
(
|
)
|
|
|
(
|
)
|
|||||
|
Purchase of short-term investments
|
(
|
)
|
(
|
)
|
(
|
)
|
|||||
|
Redemption of short-term investments
|
|
|
|
|
|
|
|||||
|
Other, net
|
|
|
|
|
(
|
)
|
|||||
|
Net cash used in investing activities
|
(
|
)
|
(
|
)
|
(
|
)
|
|||||
|
Cash Flows From Financing Activities:
|
|||||||||||
|
Payments on long-term debt and capital lease obligations
|
(
|
)
|
(
|
)
|
(
|
)
|
|||||
|
Repurchase of common stock
|
(
|
)
|
(
|
)
|
(
|
)
|
|||||
|
Cash dividends
|
(
|
)
|
(
|
)
|
(
|
)
|
|||||
|
Fuel card obligation
|
|
|
|
|
(
|
)
|
|||||
|
Payments on hedge derivative contracts
|
(
|
)
|
(
|
)
|
(
|
)
|
|||||
|
Proceeds from hedge derivative contracts
|
|
|
|
|
|
|
|||||
|
Proceeds from long-term obligations
|
|
|
|
|
|
|
|||||
|
Other, net
|
|
|
|
|
(
|
)
|
|||||
|
Net cash used in financing activities
|
(
|
)
|
(
|
)
|
(
|
)
|
|||||
|
Net (Decrease) Increase in Cash and Cash Equivalents
|
(
|
)
|
|
|
(
|
)
|
|||||
|
Cash and cash equivalents at beginning of period
|
|
|
|
|
|
|
|||||
|
Cash and cash equivalents at end of period
|
$
|
|
|
$
|
|
|
$
|
|
|
||
|
Supplemental Disclosure of Cash Paid for Interest
|
$
|
|
|
$
|
|
|
$
|
|
|
||
|
Non-Cash Transactions:
|
|||||||||||
|
Treasury stock contributed to our qualified defined benefit pension plans
|
$
|
|
|
$
|
|
|
$
|
|
|
||
|
Flight and ground equipment acquired under capital leases
|
$
|
|
|
$
|
|
|
$
|
|
|
||
|
The accompanying notes are an integral part of these Consolidated Financial Statements.
|
|||||||||||
53
DELTA AIR LINES, INC.
Consolidated Statements of Stockholders' Equity
|
Common Stock
|
Additional
Paid-In Capital |
Retained
Earnings |
Accumulated
Other Comprehensive Loss |
Treasury Stock
|
||||||||||||||||||
|
(in millions, except per share data)
|
Shares
|
Amount
|
Shares
|
Amount
|
Total
|
|||||||||||||||||
|
Balance at January 1, 2015
|
|
|
$
|
|
|
$
|
|
|
$
|
|
|
$
|
(
|
)
|
|
|
$
|
(
|
)
|
$
|
|
|
|
Net income
|
—
|
|
—
|
|
—
|
|
|
|
—
|
|
—
|
|
—
|
|
|
|
||||||
|
Dividends declared
|
—
|
|
—
|
|
—
|
|
(
|
)
|
—
|
|
—
|
|
—
|
|
(
|
)
|
||||||
|
Other comprehensive income
|
—
|
|
—
|
|
—
|
|
—
|
|
|
|
—
|
|
—
|
|
|
|
||||||
|
Shares of common stock issued and compensation expense associated with equity awards (Treasury shares withheld for payment of taxes, $46.83
(1)
per share)
|
|
|
—
|
|
|
|
—
|
|
—
|
|
|
|
(
|
)
|
|
|
||||||
|
Stock options exercised
|
|
|
—
|
|
|
|
—
|
|
—
|
|
—
|
|
—
|
|
|
|
||||||
|
Stock purchased and retired
|
(
|
)
|
—
|
|
(
|
)
|
(
|
)
|
—
|
|
—
|
|
—
|
|
(
|
)
|
||||||
|
Balance at December 31, 2015
|
|
|
|
|
|
|
|
|
(
|
)
|
|
|
(
|
)
|
|
|
||||||
|
Net income
|
—
|
|
—
|
|
—
|
|
|
|
—
|
|
—
|
|
—
|
|
|
|
||||||
|
Change in accounting principle
|
—
|
|
—
|
|
—
|
|
|
|
—
|
|
—
|
|
—
|
|
|
|
||||||
|
Dividends declared
|
—
|
|
—
|
|
—
|
|
(
|
)
|
—
|
|
—
|
|
—
|
|
(
|
)
|
||||||
|
Other comprehensive loss
|
—
|
|
—
|
|
—
|
|
—
|
|
(
|
)
|
—
|
|
—
|
|
(
|
)
|
||||||
|
Shares of common stock issued and compensation expense associated with equity awards (Treasury shares withheld for payment of taxes, $44.27
(1)
per share)
|
|
|
—
|
|
|
|
—
|
|
—
|
|
|
|
(
|
)
|
|
|
||||||
|
Stock options exercised
|
|
|
—
|
|
|
|
—
|
|
—
|
|
—
|
|
—
|
|
|
|
||||||
|
Treasury stock, net, contributed to our qualified defined benefit pension plans
|
—
|
|
—
|
|
|
|
—
|
|
—
|
|
(
|
)
|
|
|
|
|
||||||
|
Stock purchased and retired
|
(
|
)
|
—
|
|
(
|
)
|
(
|
)
|
—
|
|
—
|
|
—
|
|
(
|
)
|
||||||
|
Balance at December 31, 2016
|
|
|
|
|
|
|
|
|
(
|
)
|
|
|
(
|
)
|
|
|
||||||
|
Net income
|
—
|
|
—
|
|
—
|
|
|
|
—
|
|
—
|
|
—
|
|
|
|
||||||
|
Dividends declared
|
—
|
|
—
|
|
—
|
|
(
|
)
|
—
|
|
—
|
|
—
|
|
(
|
)
|
||||||
|
Other comprehensive income
|
—
|
|
—
|
|
—
|
|
—
|
|
|
|
—
|
|
—
|
|
|
|
||||||
|
Shares of common stock issued and compensation expense associated with equity awards (Treasury shares withheld for payment of taxes, $48.31
(1)
per share)
|
|
|
—
|
|
|
|
—
|
|
—
|
|
|
|
(
|
)
|
|
|
||||||
|
Stock options exercised
|
|
|
—
|
|
|
|
—
|
|
—
|
|
—
|
|
—
|
|
|
|
||||||
|
Treasury stock, net, contributed to our qualified defined benefit pension plans
|
—
|
|
—
|
|
|
|
—
|
|
—
|
|
(
|
)
|
|
|
|
|
||||||
|
Stock purchased and retired
|
(
|
)
|
—
|
|
(
|
)
|
(
|
)
|
—
|
|
—
|
|
—
|
|
(
|
)
|
||||||
|
Balance at December 31, 2017
|
|
|
$
|
|
|
$
|
|
|
$
|
|
|
$
|
(
|
)
|
|
|
$
|
(
|
)
|
$
|
|
|
|
(1)
|
|
The accompanying notes are an integral part of these Consolidated Financial Statements.
54
NOTES TO THE CONSOLIDATED FINANCIAL STATEMENTS
NOTE 1
.
SUMMARY OF SIGNIFICANT ACCOUNTING POLICIES
Basis of Presentation
Delta Air Lines, Inc., a Delaware corporation, provides scheduled air transportation for passengers and cargo throughout the United States ("U.S.") and around the world.
Our Consolidated Financial Statements include the accounts of Delta Air Lines, Inc. and our wholly owned subsidiaries and have been prepared in accordance with accounting principles generally accepted in the U.S. ("GAAP"). We do not consolidate the financial statements of any company in which we have an ownership interest of
50
%
or less. We are not the primary beneficiary of, nor do we have a controlling financial interest in, any variable interest entity. Accordingly, we have not consolidated any variable interest entity.
We have marketing alliances with other airlines to enhance our access to domestic and international markets. These arrangements may include codesharing, reciprocal frequent flyer program benefits, shared or reciprocal access to passenger lounges, joint promotions, common use of airport gates and ticket counters, ticket office co-location and other marketing agreements. We have received antitrust immunity for certain marketing arrangements, which enables us to offer a more integrated route network and develop common sales, marketing and discount programs for customers. Some of our marketing arrangements provide for the sharing of revenues and expenses. Revenues and expenses associated with collaborative arrangements are presented on a gross basis in the applicable line items on our Consolidated Statements of Operations.
We reclassified certain prior period amounts to conform to the current period presentation. Unless otherwise noted, all amounts disclosed are stated before consideration of income taxes.
Revenue from Contracts with Customers.
In 2014, the FASB issued ASU No. 2014-09, "Revenue from Contracts with Customers (Topic 606)." Under this ASU and subsequently issued amendments, revenue is recognized at the time a good or service is transferred to a customer for the amount of consideration received. Entities may use a full retrospective approach or report the cumulative effect as of the date of adoption. We will adopt the standard effective January 1, 2018 using the full retrospective approach.
While the adoption of the new standard will not have a significant effect on earnings, the classification of certain revenues that are currently classified in other revenue will be reclassified to passenger revenue. These include baggage fees, administrative charges and other travel-related fees, all of which will be deemed part of the single performance obligation of providing passenger transportation. These revenues, which are approximately
$
2
billion
annually, will be reclassified from the current presentation in other revenue to passenger revenue after adoption.
In addition, the adoption of the new standard increases the rate used to account for frequent flyer miles. We currently analyze our standalone sales of mileage credits to other airlines and customers to establish the accounting value for frequent flyer miles. Considering the guidance in the new standard, we will change our valuation of a mileage credit to an analysis of the award redemption value. The new valuation considers the value a passenger receives by redeeming miles rather than paying cash for an award ticket. This change increases our frequent flyer liability by approximately
$
2
billion
. The mileage deferral and redemption rates are approximately the same; therefore, assuming stable volume, there would not be a significant change in revenue recognized from the program for a given period.
The adoption of the new standard will also reduce our air traffic liability by approximately
$
500
million
. This change primarily results from estimating the tickets that will expire unused and recognizing revenue at the scheduled flight date rather than when the unused tickets expire.
Leases.
In 2016, the FASB issued ASU No. 2016-02, "Leases (Topic 842)." This standard will require all leases with durations greater than twelve months to be recognized on the balance sheet and is effective for interim and annual reporting periods beginning after December 15, 2018.
55
We have not completed our assessment, but the adoption of this standard will have a significant impact on our Consolidated Balance Sheets. However, we do not expect the adoption to have a significant impact on the recognition, measurement or presentation of lease expenses within the Consolidated Statements of Operations or the Consolidated Statements of Cash Flows. Information about our undiscounted future lease payments and the timing of those payments is in
Note 7
, "Lease Obligations." We will adopt this standard effective January 1, 2019.
Statement of Cash Flows.
In 2016, the FASB issued ASU Nos. 2016-15 and 2016-18 related to the classification of certain cash receipts and cash payments and the presentation of restricted cash within an entity's statement of cash flows, respectively. We will adopt the standards effective January 1, 2018.
Financial Instruments.
In 2016, the FASB issued ASU No. 2016-01, "Financial Instruments—Overall (Subtopic 825-10)." This standard makes several changes, including the elimination of the available-for-sale classification of equity investments, and requires equity investments with readily determinable fair values to be measured at fair value with changes in fair value recognized in net income. We will adopt the standard effective January 1, 2018. This standard does not apply to our investments in Grupo Aeroméxico and Virgin Atlantic, which are accounted for under the equity method.
Our investments in GOL Linhas Aéreas Inteligentes, the parent company of VRG Linhas Aéreas (operating as GOL) and China Eastern are currently accounted for as available-for-sale with changes in fair value recognized in other comprehensive income. At the time of adoption, the balance in accumulated other comprehensive income/(loss) ("AOCI") related to equity investments will be reclassified to retained earnings. As of December 31, 2017, a net unrealized gain of
$
162
million
related to these investments was recorded in AOCI on our Consolidated Balance Sheet.
Our investment in Air France-KLM is currently accounted for at cost as our investment agreement restricts the sale or transfer of these shares for five years. Despite the restriction, upon adoption of ASU No. 2016-01, this investment will be accounted for at fair value with changes in fair value recognized in net income.
Retirement Benefits.
In 2017, the FASB issued ASU No. 2017-07, "Compensation—Retirement Benefits (Topic 715)." This standard requires an entity to report the service cost component in the same line item as other compensation costs. The other components of net (benefit) cost will be required to be presented in the income statement separately from the service cost component and outside a subtotal of income from operations. In 2017, we recorded
$
50
million
of non-service costs that will be reclassified to non-operating expense upon adoption. This standard is effective for interim and annual reporting periods beginning after December 15, 2017. We will adopt the standard effective January 1, 2018.
Comprehensive Income
. In February 2018, the FASB issued ASU No. 2018-02, "Income Statement—Reporting Comprehensive Income (Topic 220)." This standard provides financial statement preparers with an option to reclassify stranded tax effects within AOCI from retained earnings due to the U.S. federal corporate income tax rate change in the Tax Cuts and Jobs Act of 2017. This standard is effective for interim and annual reporting periods beginning after December 15, 2018, and early adoption is permitted. The adoption of the standard may impact tax amounts stranded in AOCI related to our pension plans. See
Note 11
of the Notes to the Consolidated Financial Statements for more information.
Accounts receivable primarily consist of amounts due from credit card companies from the sale of passenger airline tickets, customers of our aircraft maintenance and cargo transportation services and other companies for the purchase of mileage credits under our frequent flyer program (the "SkyMiles program"). We provide an allowance for uncollectible accounts equal to the estimated losses expected to be incurred based on historical chargebacks, write-offs, bankruptcies and other specific analyses. Bad debt expense was not material in any period presented.
56
Spare Parts.
Inventories of expendable parts related to flight equipment, which cannot be economically repaired, reconditioned or reused after removal from the aircraft, are carried at moving average cost and charged to operations as consumed. An allowance for obsolescence is provided over the remaining useful life of the related fleet. We also provide allowances for parts identified as excess or obsolete to reduce the carrying costs to the lower of cost or net realizable value. These parts are assumed to have an estimated residual value of
5
%
of the original cost.
Changes in fuel prices, interest rates and foreign currency exchange rates impact our results of operations.
In an effort to manage our exposure to these risks, we may enter into derivative contracts and adjust our derivative portfolio as market conditions change.
We recognize derivative contracts at fair value on our Consolidated Balance Sheets.
Not Designated as Accounting Hedges.
We do not designate our fuel derivative contracts as accounting hedges. We recorded changes in the fair value of our fuel hedges in aircraft fuel and related taxes. These changes in fair value include settled gains and losses as well as mark-to-market adjustments ("MTM adjustments"). MTM adjustments are defined as fair value changes recorded in periods other than the settlement period. Such fair value changes are not necessarily indicative of the actual settlement value of the underlying hedge in the contract settlement period.
Designated as Cash Flow Hedges.
For derivative contracts designated as cash flow hedges (interest rate contracts and foreign currency exchange contracts), the effective portion of the gain or loss on the derivative is reported as a component of AOCI and reclassified into earnings in the same period in which the hedged transaction affects earnings. The effective portion of the derivative represents the change in fair value of the hedge that offsets the change in fair value of the hedged item. To the extent the change in the fair value of the hedge does not perfectly offset the change in the fair value of the hedged item, the ineffective portion of the hedge is immediately recognized in non-operating expense.
Designated as Fair Value Hedges.
For derivative contracts designated as fair value hedges (interest rate contracts), the gain or loss on the derivative is reported in earnings and an equivalent amount is reflected as a change in the carrying value of long-term debt and capital leases, with an offsetting loss or gain recognized in current earnings. We include the gain or loss on the hedged item in the same account as the offsetting loss or gain on the related derivative contract, resulting in no impact to our Consolidated Statements of Operations.
|
Derivative Type
|
Hedged Risk
|
Classification of Gains and Losses
|
|
Fuel hedge contracts
|
Fluctuations in fuel prices
|
Aircraft fuel and related taxes
|
|
Interest rate contracts
|
Increases in interest rates
|
Interest expense, net
|
|
Foreign currency exchange contracts
|
Fluctuations in foreign currency exchange rates
|
Passenger revenue
|
57
The following table summarizes the accounting treatment of our derivative contracts:
|
Impact of Unrealized Gains and Losses
|
||
|
Accounting Designation
|
Effective Portion
|
Ineffective Portion
|
|
Not designated as hedges
|
Change in fair value of hedge is recorded in earnings
|
|
|
Designated as cash flow hedges
|
Market adjustments are recorded in AOCI
|
Excess, if any, over effective portion of hedge is recorded in non-operating expense
|
|
Designated as fair value hedges
|
Market adjustments are recorded in long-term debt and capital leases
|
Excess, if any, over effective portion of hedge is recorded in non-operating expense
|
We perform, at least quarterly, an assessment of the effectiveness of our derivative contracts designated as hedges, including assessing the possibility of counterparty default. If we determine that a derivative is no longer expected to be highly effective, we discontinue hedge accounting prospectively and recognize subsequent changes in the fair value of the hedge in earnings. We believe our derivative contracts that continue to be designated as hedges, consisting of interest rate and foreign currency exchange contracts, will continue to be highly effective in offsetting changes in fair value or cash flow, respectively, attributable to the hedged risk.
Cash flows associated with purchasing and settling hedge contracts generally are classified as operating cash flows. However, if a hedge contract includes a significant financing element at inception, cash flows associated with the hedge contract are recorded as financing cash flows.
Hedge Margin.
In accordance with our fuel, interest rate and foreign currency hedge contracts, we may require counterparties to fund the margin associated with our gain position and/or counterparties may require us to fund the margin associated with our loss position on these contracts. The amount of the margin, if any, is periodically adjusted based on the fair value of the hedge contracts. The margin requirements are intended to mitigate a party's exposure to the risk of counterparty default. We do not offset margin funded to counterparties or margin funded to us by counterparties against fair value amounts recorded for our hedge contracts.
|
December 31,
|
|||||||
|
(in millions, except for estimated useful life)
|
Estimated Useful Life
|
2017
|
2016
|
||||
|
Flight equipment
|
20-32 years
|
$
|
|
|
$
|
|
|
|
Ground property and equipment
|
3-40 years
|
|
|
|
|
||
|
Flight and ground equipment under capital leases
|
Shorter of lease term or estimated useful life
|
|
|
|
|
||
|
Advance payments for equipment
|
|
|
|
|
|||
|
Less: accumulated depreciation and amortization
(1)
|
(
|
)
|
(
|
)
|
|||
|
Total property and equipment, net
|
$
|
|
|
$
|
|
|
|
|
(1)
|
|
58
Our goodwill and identifiable intangible assets relate to the airline segment.
We apply a fair value-based impairment test to the carrying value of goodwill and indefinite-lived intangible assets on an annual basis (as of October 1) and, if certain events or circumstances indicate that an impairment loss may have been incurred, on an interim basis. We assess the value of our goodwill and indefinite-lived assets under either a qualitative or quantitative approach. Under a qualitative approach, we consider various market factors, including the key assumptions listed below. We analyze these factors to determine if events and circumstances have affected the fair value of goodwill and indefinite-lived intangible assets. If we determine that it is more likely than not that the asset may be impaired, we use the quantitative approach to assess the asset's fair value and the amount of the impairment. Under a quantitative approach, we calculate the fair value of the asset using the key assumptions listed below.
We value goodwill and indefinite-lived intangible assets primarily using market capitalization and income approach valuation techniques. These measurements include the following key assumptions:
(1) forecasted revenues, expenses and cash flows, (2) terminal period revenue growth and cash flows, (3) an estimated weighted average cost of capital, (4) assumed discount rates depending on the asset and (5) a tax rate. These assumptions are consistent with those hypothetical market participants would use. Since we are required to make estimates and assumptions when evaluating goodwill and indefinite-lived intangible assets for impairment, actual transaction amounts may differ materially from these estimates.
Changes in certain events and circumstances could result in impairment or a change from indefinite-lived to definite-lived. Factors which could cause impairment include, but are not limited to, (1) negative trends in our market capitalization, (2) reduced profitability resulting from lower passenger mile yields or higher input costs (primarily related to fuel and employees), (3) lower passenger demand as a result of weakened U.S. and global economies, (4) interruption to our operations due to a prolonged employee strike, terrorist attack or other reasons, (5) changes to the regulatory environment (e.g., diminished slot restrictions or additional Open Skies agreements), (6) competitive changes by other airlines and (7) strategic changes to our operations leading to diminished utilization of the intangible assets.
59
We account for deferred income taxes under the liability method. We recognize deferred tax assets and liabilities based on the tax effects of temporary differences between the financial statement and tax basis of assets and liabilities, as measured by current enacted tax rates. Deferred tax assets and liabilities are recorded net as noncurrent deferred income taxes.
A valuation allowance is recorded to reduce deferred tax assets when necessary. We periodically assess whether it is more likely than not that we will generate sufficient taxable income to realize our deferred income tax assets. We establish valuation allowances if it is not likely we will realize our deferred income tax assets. In making this determination, we consider all available positive and negative evidence and make certain assumptions. We consider, among other things, projected future taxable income, scheduled reversals of deferred tax liabilities, the overall business environment, our historical financial results and tax planning strategies.
We immediately retire shares repurchased pursuant to our share repurchase program. We allocate the share purchase price in excess of par value between APIC and retained earnings.
Passenger Taxes and Fees
We are required to charge certain taxes and fees on our passenger tickets, including U.S. federal transportation taxes, federal security charges, airport passenger facility charges and foreign arrival and departure taxes. These taxes and fees are assessments on the customer for which we act as a collection agent. Because we are not entitled to retain these taxes and fees, we do not include such amounts in passenger revenue. We record a liability when the amounts are collected and reduce the liability when payments are made to the applicable government agency or operating carrier.
60
Our SkyMiles program offers incentives to travel on Delta. This program allows customers to earn mileage credits by flying on Delta, Delta Connection and airlines that participate in the SkyMiles program, as well as through participating companies such as credit card companies, hotels and car rental agencies. We sell mileage credits to non-airline businesses, customers and other airlines. Effective January 1, 2015, the SkyMiles program was modified from a model in which customers earn redeemable mileage credits based on distance traveled to a model based on ticket price. This award change did not affect the way we account for the program.
The SkyMiles program includes two types of transactions that are considered revenue arrangements with multiple deliverables. As discussed below, these are (1) passenger ticket sales earning mileage credits and (2) the sale of mileage credits to participating companies with which we have marketing agreements. Mileage credits are a separate unit of accounting as they can be redeemed by customers in future periods for air travel on Delta and participating airlines, membership in our Sky Club and other program awards.
Passenger Ticket Sales Earning Mileage Credits.
Passenger ticket sales earning mileage credits under our SkyMiles program provide customers with (1) mileage credits earned and (2) air transportation. We value each deliverable on a standalone basis. Our estimate of the selling price of a mileage credit is based on an analysis of our sales of mileage credits to other airlines and customers, which is re-evaluated at least annually. We use established ticket prices to determine the estimated selling price of air transportation. We allocate the total amount collected from passenger ticket sales between the deliverables based on their relative selling prices.
We defer revenue for the mileage credits related to passenger ticket sales when the credits are earned and recognize it as passenger revenue when miles are redeemed and services are provided. We record the air transportation portion of the passenger ticket sales in air traffic liability and recognize these amounts in passenger revenue when we provide transportation or when the ticket expires unused.
Sale of Mileage Credits.
Customers may earn mileage credits through participating companies such as credit card companies, hotels and car rental agencies with which we have marketing agreements to sell mileage credits. Our contracts to sell mileage credits under these marketing agreements have multiple deliverables, as defined below.
Our most significant contract to sell mileage credits relates to our co-brand credit card relationship with American Express. Our agreements with American Express provide for joint marketing, grant certain benefits to Delta-American Express co-branded credit card holders ("Cardholders") and American Express Membership Rewards program participants and allow American Express to market using our customer database. Cardholders earn mileage credits for making purchases using co-branded cards, may check their first bag for free, are granted discounted access to Delta Sky Club lounges and receive other benefits while traveling on Delta. These benefits that we provide in the form of separate products and services under the SkyMiles agreements are referred to as "deliverables." Additionally, participants in the American Express Membership Rewards program may exchange their points for mileage credits under the SkyMiles program. As a result, we sell mileage credits at agreed-upon rates to American Express for provision to their customers under the co-brand credit card program and the Membership Rewards program.
Our marketing agreements with American Express extend to 2022. We account for the agreements consistent with the accounting method that allocates the consideration received to the individual products and services delivered based on their relative selling prices. We determined our best estimate of the selling prices by considering discounted cash flow analysis using multiple inputs and assumptions, including: (1) the expected number of miles awarded and number of miles redeemed, (2) the rate at which we sell mileage credits to other airlines, (3) published rates on our website for baggage fees, discounted access to Delta Sky Club lounges and other benefits while traveling on Delta and (4) brand value.
We recognize revenue as we deliver each sales element. We defer the travel deliverable (mileage credits) as part of frequent flyer deferred revenue and recognize passenger revenue as the mileage credits are used for travel. The revenue allocated to the remaining deliverables is recorded in other revenue. We recognize the revenue for these services as they are performed.
61
Other Revenue
62
NOTE 2
.
FAIR VALUE MEASUREMENTS
Fair value is defined as an exit price, representing the amount that would be received to sell an asset or paid to transfer a liability in an orderly transaction between market participants. Fair value is a market-based measurement that is determined based on assumptions that market participants would use in pricing an asset or liability.
|
•
|
Level 1.
Observable inputs such as quoted prices in active markets;
|
|
•
|
Level 2
. Inputs, other than quoted prices in active markets, that are observable either directly or indirectly; and
|
|
•
|
Level 3
. Unobservable inputs in which there is little or no market data, which require the reporting entity to develop its own assumptions.
|
Assets and liabilities measured at fair value are based on the valuation techniques identified in the tables below. The valuation techniques are as follows:
|
(a)
|
Market approach
. Prices and other relevant information generated by market transactions involving identical or comparable assets or liabilities; and
|
|
(b)
|
Income approach.
Techniques to convert future amounts to a single present value amount based on market expectations (including present value techniques and option-pricing models).
|
|
December 31, 2017
|
Valuation
Technique
|
|||||||||
|
(in millions)
|
Total
|
Level 1
|
Level 2
|
|||||||
|
Cash equivalents
|
$
|
|
|
$
|
|
|
$
|
|
|
(a)
|
|
Short-term investments
|
|
|
||||||||
|
U.S. government and agency securities
|
|
|
|
|
|
|
(a)
|
|||
|
Asset- and mortgage-backed securities
|
|
|
|
|
|
|
(a)
|
|||
|
Corporate obligations
|
|
|
|
|
|
|
(a)
|
|||
|
Other fixed income securities
|
|
|
|
|
|
|
(a)
|
|||
|
Restricted cash equivalents and investments
|
|
|
|
|
|
|
(a)
|
|||
|
Long-term investments
|
|
|
|
|
|
|
(a)
|
|||
|
Hedge derivatives, net
|
||||||||||
|
Fuel hedge contracts
|
(
|
)
|
(
|
)
|
(
|
)
|
(a)(b)
|
|||
|
Foreign currency exchange contracts
|
(
|
)
|
|
|
(
|
)
|
(a)
|
|||
|
December 31, 2016
|
Valuation
Technique
|
|||||||||
|
(in millions)
|
Total
|
Level 1
|
Level 2
|
|||||||
|
Cash equivalents
|
$
|
|
|
$
|
|
|
$
|
|
|
(a)
|
|
Short-term investments
|
|
|
|
|
|
|||||
|
U.S. government securities
|
|
|
|
|
|
|
(a)
|
|||
|
Asset- and mortgage-backed securities
|
|
|
|
|
|
|
(a)
|
|||
|
Corporate obligations
|
|
|
|
|
|
|
(a)
|
|||
|
Other fixed income securities
|
|
|
|
|
|
|
(a)
|
|||
|
Restricted cash equivalents and investments
|
|
|
|
|
|
|
(a)
|
|||
|
Long-term investments
|
|
|
|
|
|
|
(a)
|
|||
|
Hedge derivatives, net
|
||||||||||
|
Fuel hedge contracts
|
(
|
)
|
(
|
)
|
(
|
)
|
(a)(b)
|
|||
|
Foreign currency exchange contracts
|
|
|
|
|
|
|
(a)
|
|||
|
(1)
|
See
Note 9
, "Employee Benefit Plans," for fair value of benefit plan assets.
|
63
Cash Equivalents and Restricted Cash Equivalents and Investments.
Cash equivalents generally consist of money market funds. Restricted cash equivalents and investments generally consist of money market funds and time deposits, which primarily support letters of credit that relate to certain projected self-insurance obligations and airport commitments. The fair value of these investments is based on a market approach using prices and other relevant information generated by market transactions involving identical or comparable assets.
Short-Term Investments.
The fair values of short-term investments are based on a market approach using industry standard valuation techniques that incorporate observable inputs such as quoted market prices, interest rates, benchmark curves, credit ratings of the security and other observable information.
Long-Term Investments.
Our long-term investments that have historically been measured at fair value primarily consist of equity investments in Grupo Aeroméxico, the parent company of Aeroméxico, and the parent company of GOL. During 2017, we completed a tender offer for additional shares of Grupo Aeroméxico. With the completion of the tender offer, our investment is accounted for under the equity method and is no longer measured at fair value on a recurring basis. As of December 31, 2017, our long-term investments include our shares in China Eastern and the parent company of GOL. Our investments are valued based on market prices and are classified in other noncurrent assets.
Hedge Derivatives.
A portion of our derivative contracts are negotiated over-the-counter with counterparties without going through a public exchange. Accordingly, our fair value assessments give consideration to the risk of counterparty default (as well as our own credit risk). Such contracts are classified as Level 2 within the fair value hierarchy. The remainder of our hedge contracts are comprised of futures contracts, which are traded on a public exchange. These contracts are classified within Level 1 of the fair value hierarchy.
|
•
|
Fuel Contracts.
Our fuel hedge portfolio consists of options, swaps and futures. The hedge contracts include crude oil and refined products, as these commodities are highly correlated with the price of fuel that we consume. Option contracts are valued under an income approach using option pricing models based on data either readily observable in public markets, derived from public markets or provided by counterparties who regularly trade in public markets. Volatilities used in these valuations ranged from
|
|
•
|
|
NOTE 3
.
INVESTMENTS
Short-Term Investments
|
(in millions)
|
Available-
For-Sale
|
||||
|
Due in one year or less
|
$
|
|
|
||
|
Due after one year through three years
|
|
|
|||
|
Due after three years through five years
|
|
|
|||
|
Due after five years
|
|
|
|||
|
Total
|
$
|
|
|
||
64
Long-Term Investments
We have developed strategic relationships with certain airlines through equity investments and other forms of cooperation and support. Strategic relationships improve our coordination with these airlines and enable our customers to seamlessly connect to more places while enjoying a consistent, high-quality travel experience.
Equity Method Investments
|
•
|
Aeroméxico
. During 2017, we completed a
$
|
|
•
|
Virgin Atlantic
. We have a non-controlling
|
We account for these investments under the equity method of accounting and recognize our portion of their financial results in miscellaneous, net in our Consolidated Statements of Operations.
Available-for-Sale Investments
|
•
|
GOL.
We own
|
Additionally, GOL has a
$
300
million
five
-year term loan facility with third parties, which we have guaranteed. Our entire guaranty is secured by GOL's ownership interest in Smiles, GOL's publicly-traded loyalty program. Because GOL remains in compliance with the terms of its loan facility, we have not recorded a liability on our Consolidated Balance Sheets as of
December 31, 2017
.
|
•
|
China Eastern.
We have a
|
Cost Method Investments
|
•
|
Air France-KLM.
During 2017, we acquired
|
|
•
|
|
65
NOTE 4
.
DERIVATIVES AND RISK MANAGEMENT
Changes in fuel prices, interest rates and foreign currency exchange rates impact our results of operations.
In an effort to manage our exposure to these risks, we may enter into derivative contracts and adjust our derivative portfolio as market conditions change.
Fuel Price Risk
Changes in fuel prices materially impact our results of operations.
We have recently managed our fuel price risk through a hedging program intended to reduce the financial impact from changes in the price of fuel as fuel prices are subject to potential volatility.
In addition, we may enter into derivatives with third parties to hedge financial risk related to Monroe’s refining margins.
In response to this volatility, during 2015 and 2016 we entered into transactions to defer settlement of a portion of our hedge portfolio and lock in the amount of hedge settlements for a portion of 2016 and 2017. These deferral transactions, excluding markets movements from the date of inception, provided approximately
$
300
million
in cash receipts in 2015 and 2016 and required approximately
$
300
million
in cash payments in 2016 and 2017. We also early settled
$
455
million
of our airline segment's 2016 positions during 2016. Cash flows associated with the deferral transactions are reported as cash flows from financing activities within our Consolidated Statements of Cash Flows.
During the years ended December 31,
2017
,
2016
and 2015, we recorded fuel hedge losses of
$
81
million
,
$
366
million
and
$
741
million
, respectively.
Interest Rate Risk
Our exposure to market risk from adverse changes in interest rates is primarily associated with our long-term debt obligations. Market risk associated with our fixed and variable rate long-term debt relates to the potential reduction in fair value and negative impact to future earnings, respectively, from an increase in interest rates.
In an effort to manage our exposure to the risk associated with our variable rate long-term debt, we periodically enter into interest rate swaps. We designate interest rate contracts used to convert the interest rate exposure on a portion of our debt portfolio from a floating rate to a fixed rate as cash flow hedges, while those contracts converting our interest rate exposure from a fixed rate to a floating rate are designated as fair value hedges.
We also have exposure to market risk from adverse changes in interest rates associated with our cash and cash equivalents and benefit plan obligations. Market risk associated with our cash and cash equivalents relates to the potential decline in interest income from a decrease in interest rates. Pension, postretirement, postemployment and worker's compensation obligation risk relates to the potential increase in our future obligations and expenses from a decrease in interest rates used to discount these obligations.
Foreign Currency Exchange Rate Risk
We are subject to foreign currency exchange rate risk because we have revenue and expense denominated in foreign currencies with our primary exposures being the Japanese yen and Canadian dollar. To manage exchange rate risk, we execute both our international revenue and expense transactions in the same foreign currency to the extent practicable.
From time to time, we may also enter into foreign currency option and forward contracts.
These foreign currency exchange contracts are designated as cash flow hedges.
66
|
(in millions)
|
Volume
|
Final Maturity Date
|
Hedge Derivatives Asset
|
Other Noncurrent Assets
|
Hedge Derivatives Liability
|
Other Noncurrent Liabilities
|
Hedge Derivatives, net
|
||||||||||||
|
Designated as hedges
|
|||||||||||||||||||
|
Foreign currency exchange contracts
|
|
|
Japanese yen
|
November 2019
|
|
|
|
|
(
|
)
|
(
|
)
|
(
|
)
|
|||||
|
|
|
Canadian dollars
|
May 2020
|
||||||||||||||||
|
Not designated as hedges
|
|||||||||||||||||||
|
Fuel hedge contracts
|
|
|
gallons - crude oil and refined products
|
May 2019
|
|
|
|
|
(
|
)
|
(
|
)
|
(
|
)
|
|||||
|
Total derivative contracts
|
$
|
|
|
$
|
|
|
$
|
(
|
)
|
$
|
(
|
)
|
$
|
(
|
)
|
||||
Hedge Position as of
December 31, 2016
|
(in millions)
|
Volume
|
Final Maturity Date
|
Hedge Derivatives Asset
|
Other Noncurrent Assets
|
Hedge Derivatives Liability
|
Other Noncurrent Liabilities
|
Hedge Derivatives, net
|
||||||||||||
|
Designated as hedges
|
|||||||||||||||||||
|
Foreign currency exchange contracts
|
|
|
Japanese yen
|
February 2019
|
|
|
|
|
(
|
)
|
(
|
)
|
|
|
|||||
|
|
|
Canadian dollars
|
January 2019
|
||||||||||||||||
|
Not designated as hedges
|
|||||||||||||||||||
|
Fuel hedge contracts
(1)
|
|
|
gallons - crude oil and refined products
|
January 2018
|
|
|
|
|
(
|
)
|
|
|
(
|
)
|
|||||
|
Total derivative contracts
|
$
|
|
|
$
|
|
|
$
|
(
|
)
|
$
|
(
|
)
|
$
|
(
|
)
|
||||
|
(1)
|
As discussed above, we early settled
$
|
Offsetting Assets and Liabilities
We have master netting arrangements with our counterparties giving us the right to offset hedge assets and liabilities. However, we have elected not to offset the fair value positions recorded on our Consolidated Balance Sheets. The following table shows the net fair value of our counterparty positions had we elected to offset.
|
(in millions)
|
Hedge Derivatives Asset
|
Other Noncurrent Assets
|
Hedge Derivatives Liability
|
Other Noncurrent Liabilities
|
Hedge Derivatives, Net
|
||||||||||
|
December 31, 2017
|
|||||||||||||||
|
Net derivative contracts
|
$
|
|
|
$
|
|
|
$
|
(
|
)
|
$
|
(
|
)
|
$
|
(
|
)
|
|
December 31, 2016
|
|||||||||||||||
|
Net derivative contracts
|
$
|
|
|
$
|
|
|
$
|
(
|
)
|
$
|
(
|
)
|
$
|
(
|
)
|
Designated Hedge Gains (Losses)
|
Effective Portion Reclassified from AOCI to Earnings
|
Effective Portion Recognized in Other Comprehensive (Loss) Income
|
||||||||||||
|
(in millions)
|
2017
|
2016
|
2015
|
2017
|
2016
|
2015
|
|||||||
|
Foreign currency exchange contracts
|
|
|
|
|
|
|
(
|
)
|
(
|
)
|
(
|
)
|
|
67
Credit Risk
To manage credit risk associated with our fuel price, interest rate and foreign currency hedging programs, we evaluate counterparties based on several criteria including their credit ratings and limit our exposure to any one counterparty.
Our hedge contracts contain margin funding requirements.
The margin funding requirements may cause us to post margin to counterparties or may cause counterparties to post margin to us as market prices in the underlying hedged items change.
Due to the fair value position of our hedge contracts, we posted margin of
$
43
million
and
$
38
million
as of
December 31, 2017
and
2016
, respectively.
Our accounts receivable are generated largely from the sale of passenger airline tickets and cargo transportation services, the majority of which are processed through major credit card companies. We also have receivables from the sale of mileage credits under our SkyMiles program to participating airlines and non-airline businesses such as credit card companies, hotels and car rental agencies. The credit risk associated with our receivables is minimal.
Self-Insurance Risk
NOTE 5
.
INTANGIBLE ASSETS
|
Carrying Value at December 31,
|
||||||
|
(in millions)
|
2017
|
2016
|
||||
|
International routes and slots
|
$
|
|
|
$
|
|
|
|
Delta tradename
|
|
|
|
|
||
|
SkyTeam-related assets
|
|
|
|
|
||
|
Domestic slots
|
|
|
|
|
||
|
Total
|
$
|
|
|
$
|
|
|
International Routes and Slots.
Our international routes and slots primarily relate to Pacific route authorities and slots at capacity-constrained airports in Asia, and slots at London-Heathrow airport.
Domestic Slots.
Our domestic slots relate to our slots at New York-LaGuardia and Washington-Reagan National airports.
|
December 31, 2017
|
December 31, 2016
|
||||||||||||
|
(in millions)
|
Gross
Carrying
Value
|
Accumulated
Amortization
|
Gross
Carrying
Value
|
Accumulated
Amortization
|
|||||||||
|
Marketing agreements
|
$
|
|
|
$
|
(
|
)
|
$
|
|
|
$
|
(
|
)
|
|
|
Contracts
|
|
|
(
|
)
|
|
|
(
|
)
|
|||||
|
Other
|
|
|
(
|
)
|
|
|
(
|
)
|
|||||
|
Total
|
$
|
|
|
$
|
(
|
)
|
$
|
|
|
$
|
(
|
)
|
|
68
NOTE 6
.
LONG-TERM DEBT
|
Maturity
|
Interest Rate(s) Per Annum at
|
December 31,
|
||||||||||
|
(in millions)
|
Dates
|
December 31, 2017
|
2017
|
2016
|
||||||||
|
Pacific Facilities
(1)
:
|
||||||||||||
|
Pacific Term Loan B-1
(2)
|
October 2018
|
|
variable
(4)
|
$
|
|
|
$
|
|
|
|||
|
Pacific Revolving Credit Facility
|
October 2018
|
undrawn
|
variable
(4)
|
|
|
|
|
|||||
|
2015 Credit Facilities
(1)
:
|
||||||||||||
|
Term Loan Facility
(2)
|
August 2022
|
|
variable
(4)
|
|
|
|
|
|||||
|
Revolving Credit Facility
|
August 2020
|
undrawn
|
variable
(4)
|
|
|
|
|
|||||
|
Financing arrangements secured by aircraft:
|
|
|||||||||||
|
Certificates
(3)
|
2018
|
to
|
2027
|
|
to
|
|
|
|
|
|
||
|
Notes
(3)
|
2018
|
to
|
2027
|
|
to
|
|
|
|
|
|
||
|
Unsecured notes
(5)
|
2020
|
to
|
2022
|
|
to
|
|
|
|
|
|
||
|
Other financings
(3)(6)
|
2019
|
to
|
2030
|
0.00%
|
to
|
|
|
|
|
|
||
|
Other revolving credit facilities
(1)
|
2018
|
to
|
2019
|
undrawn
|
variable
(4)
|
|
|
|
|
|||
|
Total secured and unsecured debt
|
|
|
|
|
||||||||
|
Unamortized discount and debt issue cost, net
|
(
|
)
|
(
|
)
|
||||||||
|
Total debt
|
|
|
|
|
||||||||
|
Less: current maturities
|
(
|
)
|
(
|
)
|
||||||||
|
Total long-term debt
|
$
|
|
|
$
|
|
|
||||||
|
(1)
|
Guaranteed by substantially all of our domestic subsidiaries (the "Guarantors").
|
|
(2)
|
Borrowings must be repaid annually in an amount equal to
|
|
(3)
|
Due in installments.
|
|
(4)
|
Interest rate equal to LIBOR (generally subject to a floor) or another index rate, in each case plus a specified margin. Additionally, certain aircraft and other financings are comprised of variable rate debt.
|
|
(5)
|
Includes notes issued in March and December 2017.
|
|
(6)
|
|
Unsecured Debt Offerings
During the March 2017 quarter, we issued
$
2.0
billion
in aggregate principal amount of unsecured notes, consisting of
$
1.0
billion
of
2.875
%
Notes due 2020 and
$
1.0
billion
of
3.625
%
Notes due 2022. During the December 2017 quarter, we issued
$
450
million
in aggregate principal amount of
2.600
%
Notes due 2020 (collectively, the "Notes"). The Notes are equal in priority with all of our other unsubordinated indebtedness and senior in priority to all of our future subordinated debt.
The Notes are subject to covenants that, among other things, limit our ability to incur liens securing indebtedness for borrowed money or capital leases and engage in mergers and consolidations or transfer all or substantially all of our assets, in each case subject to certain exceptions. The Notes are also subject to customary event of default provisions, including cross-defaults to other material indebtedness.
If we experience certain changes of control and a ratings decline on any series of Notes by two of the ratings agencies to a rating below investment grade within a certain period of time following a change of control or public notice of the occurrence of a change of control, we must offer to repurchase such series.
Key Financial Covenants
We were in compliance with the covenants in our financing agreements at
December 31, 2017
.
69
Pacific Facilities.
Our obligations under the Pacific Facilities are secured by a first lien on our Pacific route authorities and certain related assets.
The Pacific Facilities include affirmative, negative and financial covenants that could restrict our ability to, among other things, make investments, sell or otherwise dispose of collateral if we are not in compliance with the collateral coverage ratio tests described below, pay dividends or repurchase stock.
|
Minimum fixed charge coverage ratio
(1)
|
1.20:1
|
|
Minimum unrestricted liquidity
|
|
|
Unrestricted cash, permitted investments and undrawn revolving credit facilities
|
$2.0 billion
|
|
Minimum collateral coverage ratio
(2)
|
1.60:1
|
|
(1)
|
Defined as the ratio of (a) earnings before interest, taxes, depreciation, amortization and aircraft rent and other adjustments to net income to (b) the sum of gross cash interest expense (including the interest portion of our capitalized lease obligations) and cash aircraft rent expense, for the 12-month period ending as of the last day of each fiscal quarter.
|
|
(2)
|
Defined as the ratio of (a) certain of the collateral that meet specified eligibility standards to (b) the sum of the aggregate outstanding obligations and certain other obligations.
|
2015 Credit Facilities.
Our obligations under the 2015 Credit Facilities are secured by liens on certain of our and the Guarantors’ assets, including accounts receivable, aircraft, spare engines, non-Pacific international routes, domestic slots and certain investment property.
The 2015 Credit Facilities include affirmative, negative and financial covenants that may restrict our ability to, among other things, make investments, sell or otherwise dispose of assets if not in compliance with the collateral coverage ratio tests, pay dividends or repurchase stock. These covenants require us to maintain:
|
Minimum unrestricted liquidity
|
|
|
Unrestricted cash, permitted investments and undrawn revolving credit facilities
|
$2.0 billion
|
|
Minimum collateral coverage ratio
(1)
|
1.60:1
|
|
(1)
|
|
Under the 2015 Credit Facilities, if the Minimum Collateral Coverage Ratio is not maintained, we must either provide additional collateral to secure our obligations, or we must reduce the secured obligations under the facilities by an amount necessary to maintain compliance with the collateral coverage ratio. The 2015 Credit Facilities contain events of default customary for similar financings, including cross-defaults to other material indebtedness and certain change of control events. Upon the occurrence of an event of default, the outstanding obligations under the 2015 Credit Facilities may be accelerated and become due and payable immediately.
Availability Under Revolving Credit Facilities
|
(in millions)
|
|||
|
Revolving Credit Facility
|
$
|
|
|
|
Pacific Revolving Credit Facility
|
|
|
|
|
Other revolving credit facilities
|
|
|
|
|
Total availability under revolving credit facilities
|
$
|
|
|
70
Future Maturities
|
(in millions)
|
Total Debt
|
Amortization of
Debt Discount and Debt Issuance Cost, net
|
|||||||||
|
2018
|
$
|
|
|
$
|
(
|
)
|
|||||
|
2019
|
|
|
(
|
)
|
|||||||
|
2020
|
|
|
(
|
)
|
|||||||
|
2021
|
|
|
(
|
)
|
|||||||
|
2022
|
|
|
(
|
)
|
|||||||
|
Thereafter
|
|
|
(
|
)
|
|||||||
|
Total
|
$
|
|
|
$
|
(
|
)
|
$
|
|
|
||
Fair Value of Debt
Market risk associated with our fixed- and variable-rate long-term debt relates to the potential reduction in fair value and negative impact to future earnings, respectively, from an increase in interest rates.
The fair value of debt, shown below, is principally based on reported market values, recently completed market transactions and estimates based on interest rates, maturities, credit risk and underlying collateral. Long-term debt is primarily classified as Level 2 within the fair value hierarchy.
|
December 31,
|
||||||
|
(in millions)
|
2017
|
2016
|
||||
|
Total debt at par value
|
$
|
|
|
$
|
|
|
|
Unamortized discount and debt issuance cost, net
|
(
|
)
|
(
|
)
|
||
|
Net carrying amount
|
$
|
|
|
$
|
|
|
|
Fair value
|
$
|
|
|
$
|
|
|
NOTE 7
.
LEASE OBLIGATIONS
We lease aircraft, airport terminals, maintenance facilities, ticket offices and other property and equipment from third parties. Rental expense for operating leases, which is recorded on a straight-line basis over the life of the lease term, totaled
$
1.3
billion
for the years ended
December 31, 2017
and 2016 and
$
1.2
billion
for the year ended December 31, 2015. Amounts due under capital leases are recorded as liabilities, while assets acquired under capital leases are recorded as property and equipment. Amortization of assets recorded under capital leases is included in depreciation and amortization expense. Our airport terminal leases include contingent rents, which vary based upon facility usage, enplanements, aircraft weight and other factors. Many of our aircraft, facility and equipment leases include rental escalation clauses and/or renewal options. Our leases do not include residual value guarantees and we are not the primary beneficiary in or have other forms of variable interest with the lessor of the leased assets. As a result, we have not consolidated any of the entities that lease to us.
71
Capital Leases
|
(in millions)
|
Total
|
||
|
2018
|
$
|
|
|
|
2019
|
|
|
|
|
2020
|
|
|
|
|
2021
|
|
|
|
|
2022
|
|
|
|
|
Thereafter
|
|
|
|
|
Total minimum lease payments
|
|
|
|
|
Less: amount of lease payments representing interest
|
(
|
)
|
|
|
Present value of future minimum capital lease payments
|
|
|
|
|
Less: current obligations under capital leases
|
(
|
)
|
|
|
Long-term capital lease obligations
|
$
|
|
|
|
(in millions)
|
Delta Lease Payments
(1)
|
Contract Carrier Aircraft Lease Payments
(2)
|
Total
|
||||||
|
2018
|
$
|
|
|
$
|
|
|
$
|
|
|
|
2019
|
|
|
|
|
|
|
|||
|
2020
|
|
|
|
|
|
|
|||
|
2021
|
|
|
|
|
|
|
|||
|
2022
|
|
|
|
|
|
|
|||
|
Thereafter
|
|
|
|
|
|
|
|||
|
Total minimum lease payments
|
$
|
|
|
$
|
|
|
$
|
|
|
|
(1)
|
Includes payments accounted for as construction obligations.
|
|
(2)
|
|
NOTE 8
.
AIRPORT REDEVELOPMENT
New York-JFK Airport
In 2015, we completed our redevelopment project at New York-JFK's Terminal 4 to facilitate convenient connections for our passengers and improve coordination with our SkyTeam alliance partners. Terminal 4 is operated by JFK International Air Terminal LLC ("IAT"), a private party, under its lease with the Port Authority of New York and New Jersey ("Port Authority"). In December 2010, we entered into a
33
-year agreement with IAT ("Sublease") to sublease space in Terminal 4. Also, in 2010, the Port Authority issued approximately
$
800
million
principal amount of special project bonds to fund the majority of the project.
We managed the project and bore the construction risk, including cost overruns. We recorded an asset for project costs (e.g., design, permitting, labor and other general construction costs), regardless of funding source, and a construction obligation equal to project costs funded by parties other than us. Our rental payments reduce the construction obligation and result in the recording of interest expense, calculated using the effective interest method. As of December 31, 2017, we have recorded
$
691
million
as property and equipment and
$
744
million
as the related construction obligation.
72
We have an equity method investment in the entity which owns IAT, our sublessor at Terminal 4. The Sublease requires us to pay certain fixed management fees. We determined the investment is a variable interest entity and assessed whether we have a controlling financial interest in IAT. Our rights under the Sublease, with respect to management of Terminal 4, are consistent with rights granted to an anchor tenant under a standard airport lease. Accordingly, we do not consolidate the entity in which we have an investment in our Consolidated Financial Statements.
Los Angeles International Airport
During 2016, we announced plans to modernize, upgrade and connect Terminals 2 and 3 at Los Angeles International Airport (“LAX”) over the next seven years. A substantial majority of the project costs will be funded through the Regional Airports Improvement Corporation ("RAIC"), a California public benefit corporation, using an
$
800
million
revolving credit facility provided by a group of lenders. The credit facility was executed during 2017. We have guaranteed the obligations of the RAIC under the credit facility. Because the RAIC remains in compliance with the terms of its credit facility, we have not recorded a liability on our Consolidated Balance Sheet as of
December 31, 2017
.
New York-LaGuardia Airport
As part of the terminal redevelopment project at LaGuardia Airport, we are partnering with the Port Authority of New York and New Jersey (the “Port Authority”) to replace Terminals C and D with a new state-of-the-art terminal facility consisting of
37
gates across
four
concourses connected to a central headhouse. The terminal will feature a new, larger Delta Sky Club, wider concourses, more gate seating and
30
percent
more concessions space than the existing terminals. The facility will also offer direct access between the parking garage and terminal with improved roadways and drop-off/pick-up areas. The design of the new terminal will integrate sustainable technologies and improved energy efficiency. Construction will be phased to limit passenger inconvenience and is expected to be completed by 2026.
NOTE 9
.
EMPLOYEE BENEFIT PLANS
We sponsor defined benefit and defined contribution pension plans, healthcare plans and disability and survivorship plans for eligible employees and retirees and their eligible family members.
Defined Benefit Pension Plans.
We sponsor defined benefit pension plans for eligible employees and retirees. These plans are closed to new entrants and frozen for future benefit accruals.
The Pension Protection Act of 2006 allows commercial airlines to elect alternative funding rules ("Alternative Funding Rules") for defined benefit plans that are frozen. We elected the Alternative Funding Rules under which the unfunded liability for a frozen defined benefit plan may be amortized over a fixed 17-year period and is calculated using an
8.85
%
discount rate.
We have no minimum funding requirements in 2018. However, in January 2018, we voluntarily contributed approximately
$
500
million
to these plans.
Defined Contribution Pension Plans.
We sponsor several defined contribution plans. These plans generally cover different employee groups and employer contributions vary by plan. The costs associated with our defined contribution pension plans were
$
875
million
,
$
733
million
and
$
592
million
for the years ended December 31, 2017, 2016 and 2015, respectively.
Postretirement Healthcare Plans.
We sponsor healthcare plans that include providing benefits to eligible retirees and their dependents who are under age
65
. We have generally eliminated company-paid post age
65
healthcare coverage, except for (1) subsidies available to a limited group of retirees and their dependents and (2) a group of retirees who retired prior to 1987. Benefits under these plans are funded from current assets and employee contributions.
Postemployment Plans.
We provide certain other welfare benefits to eligible former or inactive employees after employment but before retirement, primarily as part of the disability and survivorship plans. Substantially all employees are eligible for benefits under these plans in the event of death and/or disability.
73
|
Pension Benefits
|
Other Postretirement and Postemployment Benefits
|
||||||||||||
|
December 31,
|
December 31,
|
||||||||||||
|
(in millions)
|
2017
|
2016
|
2017
|
2016
|
|||||||||
|
Benefit obligation at beginning of period
|
$
|
|
|
$
|
|
|
$
|
|
|
$
|
|
|
|
|
Service cost
|
|
|
|
|
|
|
|
|
|||||
|
Interest cost
|
|
|
|
|
|
|
|
|
|||||
|
Actuarial loss (gain)
|
|
|
|
|
|
|
|
|
|||||
|
Benefits paid, including lump sums and annuities
|
(
|
)
|
(
|
)
|
(
|
)
|
(
|
)
|
|||||
|
Participant contributions
|
|
|
|
|
|
|
|
|
|||||
|
Settlements
|
(
|
)
|
(
|
)
|
|
|
|
|
|||||
|
Benefit obligation at end of period
(1)
|
$
|
|
|
$
|
|
|
$
|
|
|
$
|
|
|
|
|
Fair value of plan assets at beginning of period
|
$
|
|
|
$
|
|
|
$
|
|
|
$
|
|
|
|
|
Actual gain (loss) on plan assets
|
|
|
|
|
|
|
|
|
|||||
|
Employer contributions
|
|
|
|
|
|
|
|
|
|||||
|
Participant contributions
|
|
|
|
|
|
|
|
|
|||||
|
Benefits paid, including lump sums and annuities
|
(
|
)
|
(
|
)
|
(
|
)
|
(
|
)
|
|||||
|
Settlements
|
(
|
)
|
(
|
)
|
|
|
|
|
|||||
|
Fair value of plan assets at end of period
|
$
|
|
|
$
|
|
|
|
$
|
|
|
$
|
|
|
|
Funded status at end of period
|
$
|
(
|
)
|
$
|
(
|
)
|
$
|
(
|
)
|
$
|
(
|
)
|
|
|
(1)
|
At the end of each year presented, our accumulated benefit obligations for our pension plans are equal to the benefit obligations shown above.
|
During 2017 and 2016, net actuarial losses increased our benefit obligation due to the decrease in discount rates. These gains and losses are recorded in AOCI and reflected in the table below.
A net actuarial loss of
$
277
million
will be amortized from AOCI into net periodic benefit cost in
2018
. Amounts are generally amortized from AOCI over the expected future lifetime of plan participants.
|
Pension Benefits
|
Other Postretirement and Postemployment Benefits
|
||||||||||||
|
December 31,
|
December 31,
|
||||||||||||
|
(in millions)
|
2017
|
2016
|
2017
|
2016
|
|||||||||
|
Current liabilities
|
$
|
(
|
)
|
$
|
(
|
)
|
$
|
(
|
)
|
$
|
(
|
)
|
|
|
Noncurrent liabilities
|
(
|
)
|
(
|
)
|
(
|
)
|
(
|
)
|
|||||
|
Total liabilities
|
$
|
(
|
)
|
$
|
(
|
)
|
$
|
(
|
)
|
$
|
(
|
)
|
|
|
Net actuarial loss
|
$
|
(
|
)
|
$
|
(
|
)
|
$
|
(
|
)
|
$
|
(
|
)
|
|
|
Prior service credit
|
|
|
|
|
|
|
|
|
|||||
|
Total accumulated other comprehensive loss, pre-tax
|
$
|
(
|
)
|
$
|
(
|
)
|
$
|
(
|
)
|
$
|
(
|
)
|
|
74
|
Pension Benefits
|
Other Postretirement and Postemployment Benefits
|
||||||||||||||||||
|
Year Ended December 31,
|
Year Ended December 31,
|
||||||||||||||||||
|
(in millions)
|
2017
|
2016
|
2015
|
2017
|
2016
|
2015
|
|||||||||||||
|
Service cost
|
$
|
|
|
$
|
|
|
$
|
|
|
$
|
|
|
$
|
|
|
$
|
|
|
|
|
Interest cost
|
|
|
|
|
|
|
|
|
|
|
|
|
|||||||
|
Expected return on plan assets
|
(
|
)
|
(
|
)
|
(
|
)
|
(
|
)
|
(
|
)
|
(
|
)
|
|||||||
|
Amortization of prior service credit
|
|
|
|
|
|
|
(
|
)
|
(
|
)
|
(
|
)
|
|||||||
|
Recognized net actuarial loss
|
|
|
|
|
|
|
|
|
|
|
|
|
|||||||
|
Settlements
|
|
|
|
|
|
|
|
|
|
|
|
|
|||||||
|
Net periodic cost
(1)
|
$
|
(
|
)
|
$
|
|
|
$
|
|
|
$
|
|
|
$
|
|
|
$
|
|
|
|
|
(1)
|
See Note 1 for discussion on ASU No. 2017-07, "Compensation - Retirement Benefits (Topic 715)."
|
Assumptions
|
December 31,
|
||||
|
Benefit Obligations
(1)
|
2017
|
2016
|
||
|
Weighted average discount rate
|
|
%
|
|
%
|
|
Year Ended December 31,
|
||||||
|
Net Periodic Cost
(1)
|
2017
|
2016
|
2015
|
|||
|
Weighted average discount rate - pension benefit
|
|
%
|
|
%
|
|
%
|
|
Weighted average discount rate - other postretirement benefit
|
|
%
|
|
%
|
|
%
|
|
Weighted average discount rate - other postemployment benefit
|
|
%
|
|
%
|
|
%
|
|
Weighted average expected long-term rate of return on plan assets
|
|
%
|
|
%
|
|
%
|
|
Assumed healthcare cost trend rate
(2)
|
|
%
|
|
%
|
|
%
|
|
(1)
|
Future employee compensation levels do not impact our frozen defined benefit pension plans or other postretirement plans and impact only a small portion of our other postemployment liability.
|
|
(2)
|
Healthcare cost trend rate at
December 31, 2017
is assumed to decline gradually to
|
75
Healthcare Cost Trend Rate.
Assumed healthcare cost trend rates have an effect on the amounts reported for the other postretirement benefit plans.
A
1
%
change in the healthcare cost trend rate used in measuring the plan benefit obligation for these plans would have the following effects:
|
(in millions)
|
1% Increase
|
1% (Decrease)
|
||||
|
Increase (decrease) in total service and interest cost
|
$
|
|
|
$
|
(
|
)
|
|
Increase (decrease) in the accumulated plan benefit obligation
|
|
|
(
|
)
|
||
Expected Long-Term Rate of Return.
Our expected long-term rate of return on plan assets is based primarily on plan-specific investment studies using historical market return and volatility data.
Modest excess return expectations versus some public market indices are incorporated into the return projections based on the actively managed structure of the investment programs and their records of achieving such returns historically. We also expect to receive a premium for investing in less liquid private markets.
We review our rate of return on plan assets assumptions annually.
Our annual investment performance for one particular year does not, by itself, significantly influence our evaluation.
The investment strategy for our defined benefit pension plan assets is to earn a long-term return that meets or exceeds our annualized return target while taking an acceptable level of risk and maintaining sufficient liquidity to pay current benefits and other cash obligations of the plan. This is achieved by investing in a globally diversified mix of public and private equity, fixed income, real assets, hedge funds and other assets and instruments.
Our expected long-term rate of return on assets for net periodic pension benefit cost for the year ended
December 31, 2017
was
8.96
%
.
Life Expectancy
.
Changes in life expectancy may significantly change our benefit obligations and future expense. We use the Society of Actuaries ("SOA") published mortality data, other publicly available information and our own perspective of future longevity to develop our best estimate of life expectancy. The SOA publishes annual updated mortality tables for U.S. plans and updated improvement scale. Each year we consider updates by the SOA in setting our mortality assumptions for purposes of measuring pension and other postretirement and postemployment benefit obligations.
Benefit Payments
Benefit payments in the table below are based on the same assumptions used to measure the related benefit obligations. Actual benefit payments may vary significantly from these estimates. Benefits earned under our pension plans and certain postemployment benefit plans are expected to be paid from funded benefit plan trusts, while our other postretirement benefits are funded from current assets.
|
(in millions)
|
Pension Benefits
|
Other Postretirement and Postemployment Benefits
|
||||
|
2018
|
$
|
|
|
$
|
|
|
|
2019
|
|
|
|
|
||
|
2020
|
|
|
|
|
||
|
2021
|
|
|
|
|
||
|
2022
|
|
|
|
|
||
|
2023-2027
|
|
|
|
|
||
Plan Assets
We have adopted and implemented investment policies for our defined benefit pension plans that incorporate strategic asset allocation mixes intended to best meet the plans' long-term obligations, while maintaining an appropriate level of risk and liquidity. These asset portfolios employ a diversified mix of investments, which are reviewed periodically. Active management strategies are utilized where feasible in an effort to realize investment returns in excess of market indices. Derivatives in the plans are primarily used to manage risk and gain asset class exposure while still maintaining liquidity. As part of these strategies, the plans are required to hold cash collateral associated with certain derivatives. Our investment strategies target a mix of
40
-
50
%
growth-seeking assets,
20
-
30
%
income-generating assets and
25
-
30
%
risk-diversifying assets. Risk diversifying assets include hedged mandates implementing long-short, market neutral and relative value strategies that invest primarily in publicly-traded equity, fixed income, foreign currency and commodity securities and are used to improve the impact of active management on the plans.
76
Benefit Plan Assets Measured at Fair Value on a Recurring Basis
Benefit Plan Assets.
Benefit plan assets relate to our defined benefit pension plans and certain of our postemployment benefit plans. These investments are presented net of the related benefit obligation in pension, postretirement and related benefits on the Consolidated Balance Sheets. See
Note 2
of the Notes to the Consolidated Financial Statements for a description of the levels within the fair value hierarchy and associated valuation techniques used to measure fair value.
The following table shows our benefit plan assets by asset class.
|
December 31, 2017
|
December 31, 2016
|
Valuation Technique
|
|||||||||||||||||||
|
(in millions)
|
Level 1
|
Level 2
|
Total
|
Level 1
|
Level 2
|
Total
|
|||||||||||||||
|
Equities and equity-related instruments
|
$
|
|
|
$
|
|
|
$
|
|
|
$
|
|
|
$
|
|
|
$
|
|
|
(a)
|
||
|
Delta common stock
|
|
|
|
|
|
|
|
|
|
|
|
|
(a)
|
||||||||
|
Cash equivalents
|
|
|
|
|
|
|
|
|
|
|
|
|
(a)
|
||||||||
|
Fixed income and fixed income-related instruments
|
|
|
|
|
|
|
|
|
|
|
|
|
(a)(b)
|
||||||||
|
Benefit plan assets
|
$
|
|
|
$
|
|
|
$
|
|
|
$
|
|
|
$
|
|
|
$
|
|
|
|||
|
Investments measured at net asset value ("NAV")
(1)
|
$
|
|
|
$
|
|
|
|||||||||||||||
|
Total benefit plan assets
|
$
|
|
|
$
|
|
|
|||||||||||||||
|
(1)
|
|
Equities and Equity-Related Instruments.
Investments include common stock and equity-related instruments. Common stock is valued at the closing price reported on the active market on which the individual securities are traded. Equity-related instruments include investments in securities traded on exchanges, including listed futures and options, which are valued at the last reported sale prices on the last business day of the year or, if not available, the last reported bid prices. Over-the-counter securities are valued at the bid prices or the average of the bid and ask prices on the last business day of the year from published sources or, if not available, from other sources considered reliable, generally broker quotes.
Delta Common Stock.
In each of 2017 and 2016, we contributed
$
350
million
of Delta common stock as a portion of the employer contribution to certain of its defined benefit pension plans. The Delta common stock investment is managed by an independent fiduciary.
Cash Equivalents.
These investments primarily consist of high-quality, short-term obligations that are a part of institutional money market mutual funds that are calculated using current market quotations or an appropriate substitute that reflects current market conditions.
Fixed Income and Fixed Income-Related Instruments.
Investments include corporate bonds, government bonds, collateralized mortgage obligations and other asset-backed securities. These investments are generally valued at the bid price or the average of the bid and ask price. Prices are based on pricing models, quoted prices of securities with similar characteristics, or broker quotes. Fixed income-related instruments include investments in securities traded on exchanges, including listed futures and options, which are valued at the last reported sale prices on the last business day of the year, or if not available, the last reported bid prices. Over-the-counter securities are valued at the bid prices or the average of the bid and ask prices on the last business day of the year from published sources or, if not available, from other sources considered reliable, generally broker quotes.
77
|
December 31, 2017
|
December 31, 2016
|
||||||||||||||||
|
(in millions)
|
Fair Value
|
Redemption Frequency
|
Redemption Notice Period
|
Unfunded Commitments
|
Fair Value
|
Redemption Frequency
|
Redemption Notice Period
|
Unfunded Commitments
|
|||||||||
|
Hedge funds and hedge fund-related strategies
|
$
|
|
|
(5)
|
2-120 Days
|
$
|
|
|
$
|
|
|
(5)
|
4-120 Days
|
$
|
|
|
|
|
Commingled funds, private equity and private equity-related instruments
|
|
|
(1) (3) (4)
|
10-30 Days
|
|
|
|
|
(1) (3) (4)
|
15-30 Days
|
|
|
|||||
|
Fixed income and fixed income-related instruments
|
|
|
(2)
|
3-15 Days
|
|
|
|
|
(2)
|
5 Days
|
|
|
|||||
|
Real assets
|
|
|
(3) (4)
|
N/A
|
|
|
|
|
(3) (4)
|
N/A
|
|
|
|||||
|
Other
|
|
|
(1)
|
30 Days
|
|
|
|
|
(2)
|
2 Days
|
|
|
|||||
|
Total investments measured at NAV
|
$
|
|
|
|
|
$
|
|
|
$
|
|
|
|
|
$
|
|
|
|
|
(1)
|
Monthly
|
|
(2)
|
Semi-monthly
|
|
(3)
|
Semi-annually
|
|
(4)
|
Annually
|
|
(5)
|
Various. Includes funds with weekly, monthly, semi-monthly, quarterly and custom redemption frequencies as well as funds with a redemption window following the anniversary of the initial investment.
|
Hedge Funds and Hedge Fund-Related Strategies.
These investments are primarily made through shares of limited partnerships or similar structures for which a liquid secondary market does not exist. These funds are typically valued monthly by third-party administrators that have been appointed by the funds' general partners.
Commingled Funds, Private Equity and Private Equity-Related Instruments.
Investments include commingled funds invested in common stock, as well as private equity and private equity-related instruments. Commingled funds are based on quoted market prices of the underlying assets owned by the fund. Private equity and private equity-related strategies are valued based on valuation models where one or more of the significant inputs into the model cannot be observed and which require the development of assumptions.
Fixed Income and Fixed Income-Related Instruments.
Investments include commingled funds invested in debt obligations. Commingled funds are based on quoted market prices of the underlying assets owned by the fund.
Real Assets.
These investments include real estate, energy, timberland, agriculture and infrastructure. The valuation of real assets requires significant judgment due to the absence of quoted market prices as well as the inherent lack of liquidity and the long-term nature of these assets. Investments are valued based on valuation models where one or more of the significant inputs into the model cannot be observed and which require the development of assumptions.
Other.
Primarily includes globally-diversified, risk-managed commingled funds consisting mainly of equity, fixed income and commodity exposures.
On an annual basis we assess the potential for adjustments to the fair value of all investments. Certain of our investments are valued using NAV as a practical expedient due to the lag in the availability of data. This primarily applies to private equity, private equity-related strategies and real assets. We solicit valuation updates from the investment mangers and use their information and corroborating data from public markets to determine any needed fair value adjustments.
Other
We also sponsor defined benefit pension plans for eligible employees in certain foreign countries. These plans did not have a material impact on our Consolidated Financial Statements in any period presented.
78
Profit Sharing Program
Our broad-based employee profit sharing program provides that, for each year in which we have an annual pre-tax profit, as defined by the terms of the program, we will pay a specified portion of that profit to employees. In determining the amount of profit sharing, the program defines profit as pre-tax profit adjusted for profit sharing and certain other items. For the years ended
December 31, 2017
,
2016
and
2015
, we recorded expenses of
$
1.1
billion
,
$
1.1
billion
and
$
1.5
billion
under the profit sharing program, respectively.
NOTE 10
.
COMMITMENTS AND CONTINGENCIES
Aircraft Purchase and Lease Commitments
|
(in millions)
|
Total
|
||
|
2018
|
$
|
|
|
|
2019
|
|
|
|
|
2020
|
|
|
|
|
2021
|
|
|
|
|
2022
|
|
|
|
|
Thereafter
|
|
|
|
|
Total
|
$
|
|
|
|
Aircraft Type
|
Purchase Commitments
|
|
|
A321-200
|
|
|
|
A321-200neo
|
|
|
|
A330-900neo
|
|
|
|
A350-900
|
|
|
|
B-737-900ER
|
|
|
|
CS100
|
|
|
|
Total
|
|
|
During 2017, we entered into agreements with Airbus to place an expanded A321-200 order for
45
firm additional aircraft and to defer
10
of our A350-900 aircraft deliveries set for 2019-2020 by
two
to
three
years. We also entered into an agreement with Airbus to order
100
A321-200neo aircraft to start delivery in 2020 with the option to purchase an additional
100
A321-200neo aircraft.
79
Contract Carrier Agreements
We have contract carrier agreements with regional carriers expiring from
2018
to
2027
.
Capacity Purchase Agreements
. Most of our contract carriers operate for us under capacity purchase agreements. Under these agreements, the contract carriers operate some or all of their aircraft using our flight designator codes, and we control the scheduling, pricing, reservations, ticketing and seat inventories of those aircraft and retain the revenues associated with those flights. We pay those airlines an amount, as defined in the applicable agreement, which is based on a determination of their cost of operating those flights and other factors intended to approximate market rates for those services.
The following table shows our minimum fixed obligations under our existing capacity purchase agreements with third-party regional carriers. The obligations set forth in the table contemplate minimum levels of flying by the contract carriers under the respective agreements and also reflect assumptions regarding certain costs associated with the minimum levels of flying such as the cost of fuel, labor, maintenance, insurance, catering, property tax and landing fees.
Accordingly, our actual payments under these agreements could differ materially from the minimum fixed obligations set forth in the table below.
|
(in millions)
|
Amount
(1)
|
||
|
2018
|
$
|
|
|
|
2019
|
|
|
|
|
2020
|
|
|
|
|
2021
|
|
|
|
|
2022
|
|
|
|
|
Thereafter
|
|
|
|
|
Total
|
$
|
|
|
|
(1)
|
|
Revenue Proration Agreement
. As of
December 31, 2017
, a portion of our contract carrier agreement with SkyWest Airlines, Inc. is structured as a revenue proration agreement. This revenue proration agreement establishes a fixed dollar or percentage division of revenues for tickets sold to passengers traveling on connecting flight itineraries.
Legal Contingencies
We are involved in various legal proceedings related to employment practices, environmental issues, antitrust matters and other matters concerning our business. We record liabilities for losses from legal proceedings when we determine that it is probable that the outcome in a legal proceeding will be unfavorable and the amount of loss can be reasonably estimated. Although the outcome of the legal proceedings in which we are involved cannot be predicted with certainty, we believe that the resolution of current matters will not have a material adverse effect on our Consolidated Financial Statements.
Credit Card Processing Agreements
Our VISA/MasterCard and American Express credit card processing agreements provide that no cash reserve ("Reserve") is required, and no withholding of payment related to receivables collected will occur, except in certain circumstances, including when we do not maintain a required level of liquidity as outlined in the merchant processing agreements. In circumstances in which the credit card processor can establish a Reserve or withhold payments, the amount of the Reserve or payments that may be withheld would be equal to the potential liability of the credit card processor for tickets purchased with VISA/MasterCard or American Express credit cards, as applicable, that had not yet been used for travel. We did not have a Reserve or an amount withheld as of
December 31, 2017
or
2016
.
80
Other Contingencies
General Indemnifications
We are the lessee under many commercial real estate leases. It is common in these transactions for us, as the lessee, to agree to indemnify the lessor and the lessor's related parties for tort, environmental and other liabilities that arise out of or relate to our use or occupancy of the leased premises. This type of indemnity would typically make us responsible to indemnified parties for liabilities arising out of the conduct of, among others, contractors, licensees and invitees at, or in connection with, the use or occupancy of the leased premises. This indemnity often extends to related liabilities arising from the negligence of the indemnified parties, but usually excludes any liabilities caused by either their sole or gross negligence or their willful misconduct.
Our aircraft and other equipment lease and financing agreements typically contain provisions requiring us, as the lessee or obligor, to indemnify the other parties to those agreements, including certain of those parties' related persons, against virtually any liabilities that might arise from the use or operation of the aircraft or other equipment.
Certain of our aircraft and other financing transactions include provisions that require us to make payments to preserve an expected economic return to the lenders if that economic return is diminished due to certain changes in law or regulations. In certain of these financing transactions, we also bear the risk of certain changes in tax laws that would subject payments to non-U.S. lenders to withholding taxes.
We believe that our insurance would cover most of our exposure to liabilities and related indemnities associated with the commercial real estate leases and aircraft and other equipment lease and financing agreements described above. While our insurance does not typically cover environmental liabilities, we have certain insurance policies in place as required by applicable environmental laws.
We cannot reasonably estimate our potential future payments under the indemnities and related provisions described above because we cannot predict (1) when and under what circumstances these provisions may be triggered and (2) the amount that would be payable if the provisions were triggered because the amounts would be based on facts and circumstances existing at such time.
Employees Under Collective Bargaining Agreements
At
December 31, 2017
, we had approximately
87,000
full-time equivalent employees. Approximately
19
%
of these employees were represented by unions.
The following table shows our domestic airline employee groups that are represented by unions.
|
Employee Group
|
Approximate Number of Active Employees Represented
|
|
Union
|
Date on which Collective Bargaining Agreement Becomes Amendable
|
|
|
Delta Pilots
|
|
|
ALPA
|
December 31, 2019
|
|
|
Delta Flight Superintendents (Dispatchers)
|
|
|
PAFCA
|
March 31, 2018
|
|
|
Endeavor Air Pilots
|
|
|
ALPA
|
January 1, 2024
|
|
|
Endeavor Air Flight Attendants
|
|
|
AFA
|
December 31, 2018
|
|
|
Endeavor Air Dispatchers
|
|
|
PAFCA
|
December 31, 2018
|
|
In addition,
192
refinery employees of Monroe are represented by the United Steel Workers under an agreement that expires on February 28, 2019. This agreement is governed by the National Labor Relations Act
, which generally allows either party to engage in self help upon the expiration of the agreement.
Other
81
NOTE 11
.
INCOME TAXES
Income Tax Provision
|
Year Ended December 31,
|
|||||||||
|
(in millions)
|
2017
|
2016
|
2015
|
||||||
|
Current tax (provision) benefit:
|
|
|
|
|
|
|
|||
|
Federal
|
$
|
(
|
)
|
$
|
|
|
$
|
(
|
)
|
|
State and local
|
|
|
(
|
)
|
(
|
)
|
|||
|
International
|
(
|
)
|
(
|
)
|
(
|
)
|
|||
|
Deferred tax provision:
|
|
|
|
|
|
|
|||
|
Federal
|
(
|
)
|
(
|
)
|
(
|
)
|
|||
|
State and local
|
(
|
)
|
(
|
)
|
(
|
)
|
|||
|
Income tax provision
|
$
|
(
|
)
|
$
|
(
|
)
|
$
|
(
|
)
|
|
Year Ended December 31,
|
||||||
|
2017
|
2016
|
2015
|
||||
|
U.S. federal statutory income tax rate
|
|
%
|
|
%
|
|
%
|
|
State taxes, net of federal benefit
|
|
|
|
|
|
|
|
Decrease in valuation allowance
|
|
|
|
|
(
|
)
|
|
Foreign tax rate differential
|
(
|
)
|
(
|
)
|
|
|
|
Tax Cuts and Jobs Act adjustment
|
|
|
|
|
|
|
|
Other
|
|
|
(
|
)
|
|
|
|
Effective income tax rate
|
|
%
|
|
%
|
|
%
|
Following the enactment of the Tax Cuts and Jobs Act of 2017, we recorded a provisional tax expense estimate of
$
150
million
resulting in a
2.6
%
increase in our effective tax rate. The provisional estimate includes recognition of tax expense related to certain of our undistributed foreign earnings and tax expense to decrease our federal net deferred tax asset to a
21%
statutory tax rate. We are evaluating our share of undistributed earnings from certain of our foreign investments and will reflect the impact, if any, in 2018 when such impact is finalized.
As a result of the Tax Cuts and Jobs Act of 2017, we assessed tax on
$
732
million
of foreign earnings which would have otherwise been indefinitely reinvested outside the U.S. At December 31, 2016, we had
$
379
million
of undistributed foreign earnings.
82
Deferred Taxes
Deferred income taxes reflect the net tax effect of temporary differences between the carrying amounts of assets and liabilities for financial reporting and income tax purposes.
The following table shows significant components of our deferred tax assets and liabilities:
|
December 31,
|
||||||
|
(in millions)
|
2017
|
2016
|
||||
|
Deferred tax assets:
|
||||||
|
Net operating loss carryforwards
|
$
|
|
|
$
|
|
|
|
Pension, postretirement and other benefits
|
|
|
|
|
||
|
Alternative minimum tax credit carryforward
|
|
|
|
|
||
|
Deferred revenue
|
|
|
|
|
||
|
Other
|
|
|
|
|
||
|
Valuation allowance
|
(
|
)
|
(
|
)
|
||
|
Total deferred tax assets
|
$
|
|
|
$
|
|
|
|
Deferred tax liabilities:
|
||||||
|
Depreciation
|
$
|
|
|
$
|
|
|
|
Intangible assets
|
|
|
|
|
||
|
Other
|
|
|
|
|
||
|
Total deferred tax liabilities
|
$
|
|
|
$
|
|
|
|
Net deferred tax assets
|
$
|
|
|
$
|
|
|
At
December 31, 2017
, we had
$
379
million
of federal alternative minimum tax credit carryforwards. As a result of the Tax Cuts and Jobs Act of 2017, this credit becomes refundable to us if not used by 2021. We have
$
5.1
billion
of federal pre-tax net operating loss carryforwards, which will not begin to expire until
2027
.
Income Tax Allocation
We consider all income sources, including other comprehensive income, in determining the amount of tax benefit allocated to continuing operations (the "Income Tax Allocation"). At the end of 2017, the Tax Cut and Jobs Act of 2017 reduced the statutory tax rate in the U.S. from
35%
to
21%
. GAAP requires that the tax expense related to tax law changes be recognized in current earnings, even when a portion of the related deferred tax asset originated through amounts recognized in AOCI. As a result,
$
700
million
of income tax expense remains in AOCI, primarily related to pension obligations, and will not be recognized in net income until the pension obligations are fully extinguished, which will not occur for approximately
25
years.
Other
83
NOTE 12
.
EQUITY AND EQUITY COMPENSATION
Equity
We are authorized to issue
2.0
billion
shares of capital stock, of which up to
1.5
billion
may be shares of common stock, par value
$
0.0001
per share, and up to
500
million
may be shares of preferred stock.
Preferred Stock.
We may issue preferred stock in one or more series. The Board of Directors is authorized (1) to fix the descriptions, powers (including voting powers), preferences, rights, qualifications, limitations and restrictions with respect to any series of preferred stock and (2) to specify the number of shares of any series of preferred stock. We have not issued any preferred stock.
Treasury Stock.
We generally withhold shares of Delta common stock to cover employees' portion of required tax withholdings when employee equity awards are issued or vest. These shares are valued at cost, which equals the market price of the common stock on the date of issuance or vesting. The weighted average cost of shares held in treasury was
$
21.19
and
$
19.40
as of
December 31, 2017
and
2016
, respectively.
Equity Compensation
Our broad-based equity and cash compensation plan provides for grants of restricted stock, stock options, performance awards, including cash incentive awards and other equity-based awards (the "Plan"). Shares of common stock issued under the Plan may be made available from authorized, but unissued, common stock or common stock we acquire. If any shares of our common stock are covered by an award that expires, is canceled, forfeited or otherwise terminates without delivery of shares (including shares surrendered or withheld for payment of taxes related to an award), such shares will again be available for issuance under the Plan except for (i) any shares tendered in payment of an option, (ii) shares withheld to satisfy any tax withholding obligation with respect to the exercise of an option or stock appreciation right ("SAR") or (iii) shares covered by a stock-settled SAR or other awards that were not issued upon the settlement of the award. The Plan authorizes the issuance of up to
163
million
shares of common stock. As of
December 31, 2017
, there were
30
million
shares available for future grants.
We make long-term incentive awards annually to eligible employees under the Plan. Generally, awards vest over time, subject to the employee's continued employment. Equity compensation expense for these awards is recognized in salaries and related costs over the employee's requisite service period (generally, the vesting period of the award) and totaled
$
108
million
,
$
105
million
and
$
76
million
for the years ended
December 31, 2017
,
2016
and
2015
, respectively. We record expense on a straight-line basis for awards with installment vesting. As of
December 31, 2017
, unrecognized costs related to unvested shares and stock options totaled
$
82
million
. We expect substantially all unvested awards to vest and recognize any forfeitures as they occur.
Restricted Stock
. Restricted stock is common stock that may not be sold or otherwise transferred for a period of time and is subject to forfeiture in certain circumstances. The fair value of restricted stock awards is based on the closing price of the common stock on the grant date. As of
December 31, 2017
, there were
2.6
million unvested restricted stock awards.
Stock Options.
Stock options are granted with an exercise price equal to the closing price of Delta common stock on the grant date and generally have a 10-year term. We determine the fair value of stock options at the grant date using an option pricing model. As of
December 31, 2017
, there were
1.9
million
outstanding stock option awards with a weighted average exercise price of
$
38.59
, and
771
thousand
were exercisable.
Performance Awards.
Performance awards are long-term incentive opportunities, which are payable in common stock and/or cash, and are generally contingent upon our achieving certain financial goals.
84
NOTE 13
.
ACCUMULATED OTHER COMPREHENSIVE LOSS
|
(in millions)
|
Pension and Other Benefits Liabilities
(2)
|
Derivative Contracts
|
Investments
|
Total
|
||||||||
|
Balance at January 1, 2015 (net of tax effect of $1,279)
|
$
|
(
|
)
|
$
|
|
|
$
|
(
|
)
|
$
|
(
|
)
|
|
Changes in value (net of tax effect of $41)
|
|
|
|
|
(
|
)
|
|
|
||||
|
Reclassification into earnings (net of tax effect of $16)
(1)
|
|
|
(
|
)
|
|
|
|
|
||||
|
Balance at December 31, 2015 (net of tax effect of $1,222)
|
(
|
)
|
|
|
(
|
)
|
(
|
)
|
||||
|
Changes in value (net of tax effect of $293)
|
(
|
)
|
(
|
)
|
|
|
(
|
)
|
||||
|
Reclassification into earnings (net of tax effect of $57)
(1)
|
|
|
(
|
)
|
|
|
|
|
||||
|
Balance at December 31, 2016 (net of tax effect of $1,458)
|
(
|
)
|
|
|
(
|
)
|
(
|
)
|
||||
|
Changes in value (net of tax effect of $32)
|
(
|
)
|
(
|
)
|
|
|
(
|
)
|
||||
|
Reclassification into earnings (net of tax effect of $90)
(1)
|
|
|
(
|
)
|
(
|
)
|
|
|
||||
|
Balance at December 31, 2017 (net of tax effect of $1,400)
|
$
|
(
|
)
|
$
|
|
|
$
|
|
|
$
|
(
|
)
|
|
(1)
|
Amounts reclassified from AOCI for pension and other benefits liabilities and for derivative contracts designated as foreign currency cash flow hedges are recorded in salaries and related costs and in passenger revenue, respectively, in the Consolidated Statements of Operations. The reclassification into earnings for investments relates to our investment in Grupo Aeroméxico and the related conversion to accounting under the equity method. The reclassification of the unrealized gain was recorded to non-operating expense in our Consolidates Statements of Operations.
|
|
(2)
|
|
NOTE 14
.
SEGMENTS AND GEOGRAPHIC INFORMATION
Operating segments are defined as components of an enterprise about which separate financial information is available that is evaluated regularly by the chief operating decision maker and is used in resource allocation and performance assessments. Our chief operating decision maker is considered to be our executive leadership team. Our executive leadership team regularly reviews discrete information for our
two
operating segments, which are determined by the products and services provided: our airline segment and our refinery segment.
Airline Segment
Our airline segment is managed as a single business unit that provides scheduled air transportation for passengers and cargo throughout the U.S. and around the world and other ancillary airline services. This allows us to benefit from an integrated revenue pricing and route network. Our flight equipment forms one fleet, which is deployed through a single route scheduling system. When making resource allocation decisions, our chief operating decision maker evaluates flight profitability data, which considers aircraft type and route economics, but gives no weight to the financial impact of the resource allocation decision on an individual carrier basis. Our objective in making resource allocation decisions is to optimize our consolidated financial results.
Refinery Segment
In
June 2012
, our wholly owned subsidiaries, Monroe Energy, LLC, and MIPC, LLC (collectively, "Monroe"), acquired the Trainer oil refinery and related assets located near Philadelphia, Pennsylvania, as part of our strategy to mitigate the cost of the refining margin reflected in the price of jet fuel. The acquisition included pipelines and terminal assets that allow the refinery to supply jet fuel to our airline operations throughout the Northeastern U.S., including our New York hubs at LaGuardia and JFK. We accounted for the refinery acquisition as a business combination.
Our refinery segment operates for the benefit of the airline segment by providing jet fuel to the airline segment from its own production and through jet fuel obtained through agreements with third parties. The refinery's production consists of jet fuel as well as non-jet fuel products. We use several counterparties to exchange the non-jet fuel products produced by the refinery for jet fuel consumed in our airline operations. The gross fair value of the products exchanged under these agreements during the years ended
December 31, 2017
,
2016
and
2015
was
$
3.2
billion
,
$
2.7
billion
and
$
3.1
billion
, respectively.
85
Segment Reporting
|
(in millions)
|
Airline
|
Refinery
|
Intersegment Sales/Other
|
Consolidated
|
||||||||||
|
Year Ended December 31, 2017
|
||||||||||||||
|
Operating revenue:
|
$
|
|
|
$
|
|
|
$
|
|
|
|||||
|
Sales to airline segment
|
$
|
(
|
)
|
(1)
|
||||||||||
|
Exchanged products
|
(
|
)
|
(2)
|
|||||||||||
|
Sales of refined products
|
(
|
)
|
(3)
|
|||||||||||
|
Operating income
|
|
|
|
|
|
|
||||||||
|
Interest expense (income), net
|
|
|
(
|
)
|
|
|
||||||||
|
Depreciation and amortization
|
|
|
|
|
|
|
||||||||
|
Total assets, end of period
|
|
|
|
|
|
|
||||||||
|
Capital expenditures
|
|
|
|
|
|
|
||||||||
|
Year Ended December 31, 2016
|
||||||||||||||
|
Operating revenue:
|
$
|
|
|
$
|
|
|
$
|
|
|
|||||
|
Sales to airline segment
|
$
|
(
|
)
|
(1)
|
||||||||||
|
Exchanged products
|
(
|
)
|
(2)
|
|||||||||||
|
Sales of refined products
|
(
|
)
|
(3)
|
|||||||||||
|
Operating income (loss)
(4)
|
|
|
(
|
)
|
|
|
||||||||
|
Interest expense, net
|
|
|
|
|
|
|
||||||||
|
Depreciation and amortization
|
|
|
|
|
|
|
||||||||
|
Total assets, end of period
|
|
|
|
|
|
|
||||||||
|
Capital expenditures
|
|
|
|
|
|
|
||||||||
|
Year Ended December 31, 2015
|
||||||||||||||
|
Operating revenue:
|
$
|
|
|
$
|
|
|
$
|
|
|
|||||
|
Sales to airline segment
|
$
|
(
|
)
|
(1)
|
||||||||||
|
Exchanged products
|
(
|
)
|
(2)
|
|||||||||||
|
Sales of refined products
|
(
|
)
|
(3)
|
|||||||||||
|
Operating income
(4)
|
|
|
|
|
|
|
||||||||
|
Interest expense, net
|
|
|
|
|
|
|
||||||||
|
Depreciation and amortization
|
|
|
|
|
|
|
||||||||
|
Total assets, end of period
|
|
|
|
|
|
|
||||||||
|
Capital expenditures
|
|
|
|
|
|
|
||||||||
|
(1)
|
Represents transfers, valued on a market price basis, from the refinery to the airline segment for use in airline operations. We determine market price by reference to the market index for the primary delivery location, which is New York Harbor, for jet fuel from the refinery.
|
|
(2)
|
Represents value of products delivered under our exchange agreements, as discussed above, determined on a market price basis.
|
|
(3)
|
These sales were at or near cost; accordingly, the margin on these sales is de minimis.
|
|
(4)
|
|
86
Geographic Information
Operating revenue for the airline segment is recognized in a specific geographic region based on the origin, flight path and destination of each flight segment. The majority of the revenues of the refinery, consisting of fuel sales to the airline, have been eliminated in the Consolidated Financial Statements. The remaining operating revenue for the refinery segment is included in the domestic region.
|
Year Ended December 31,
|
|||||||||
|
(in millions)
|
2017
|
2016
|
2015
|
||||||
|
Domestic
|
$
|
|
|
$
|
|
|
$
|
|
|
|
Atlantic
|
|
|
|
|
|
|
|||
|
Pacific
|
|
|
|
|
|
|
|||
|
Latin America
|
|
|
|
|
|
|
|||
|
Total
|
$
|
|
|
$
|
|
|
$
|
|
|
NOTE 15
.
RESTRUCTURING
|
(in millions)
|
2017
|
2016
|
2015
|
||||||
|
Liability at beginning of period
|
$
|
|
|
$
|
|
|
$
|
|
|
|
Payments
|
(
|
)
|
(
|
)
|
(
|
)
|
|||
|
Additional expenses and other
|
|
|
|
|
|
|
|||
|
Liability at end of period
|
$
|
|
|
$
|
|
|
$
|
|
|
87
NOTE 16
.
EARNINGS PER SHARE
We calculate basic earnings per share by dividing the net income by the weighted average number of common shares outstanding, excluding restricted shares. We calculate diluted earnings per share by dividing net income by the weighted average number of common shares outstanding plus the dilutive effect of outstanding share-based awards, including stock options and restricted stock awards. Antidilutive common stock equivalents excluded from the diluted earnings per share calculation are not material.
The following table shows our computation of basic and diluted earnings per share:
|
Year Ended December 31,
|
|||||||||
|
(in millions, except per share data)
|
2017
|
2016
|
2015
|
||||||
|
Net income
|
$
|
|
|
$
|
|
|
$
|
|
|
|
Basic weighted average shares outstanding
|
|
|
|
|
|
|
|||
|
Dilutive effect of share-based awards
|
|
|
|
|
|
|
|||
|
Diluted weighted average shares outstanding
|
|
|
|
|
|
|
|||
|
Basic earnings per share
|
$
|
|
|
$
|
|
|
$
|
|
|
|
Diluted earnings per share
|
$
|
|
|
$
|
|
|
$
|
|
|
NOTE 17
.
QUARTERLY FINANCIAL DATA (UNAUDITED)
|
Three Months Ended,
|
||||||||||||
|
(in millions, except per share data)
|
March 31
|
June 30
|
September 30
|
December 31
|
||||||||
|
2017
|
||||||||||||
|
Operating revenue
|
$
|
|
|
$
|
|
|
$
|
|
|
$
|
|
|
|
Operating income
|
|
|
|
|
|
|
|
|
||||
|
Net income
|
|
|
|
|
|
|
|
|
||||
|
Basic earnings per share
|
$
|
|
|
$
|
|
|
$
|
|
|
$
|
|
|
|
Diluted earnings per share
|
$
|
|
|
$
|
|
|
$
|
|
|
$
|
|
|
|
2016
|
||||||||||||
|
Operating revenue
|
$
|
|
|
$
|
|
|
$
|
|
|
$
|
|
|
|
Operating income
|
|
|
|
|
|
|
|
|
||||
|
Net income
|
|
|
|
|
|
|
|
|
||||
|
Basic earnings per share
|
$
|
|
|
$
|
|
|
$
|
|
|
$
|
|
|
|
Diluted earnings per share
|
$
|
|
|
$
|
|
|
$
|
|
|
$
|
|
|
88
ITEM 9. CHANGES IN AND DISAGREEMENTS WITH ACCOUNTANTS ON ACCOUNTING AND
FINANCIAL DISCLOSURE
None.
ITEM 9A. CONTROLS AND PROCEDURES
Disclosure Controls and Procedures
Our management, including our Chief Executive Officer and Chief Financial Officer, performed an evaluation of our disclosure controls and procedures, which have been designed to permit us to record, process, summarize and report, within time periods specified by the SEC's rules and forms, information required to be disclosed. Our management, including our Chief Executive Officer and Chief Financial Officer, concluded that the controls and procedures were effective as of
December 31, 2017
to ensure that material information was accumulated and communicated to our management, including our Chief Executive Officer and Chief Financial Officer, as appropriate to allow timely decisions regarding required disclosure.
Changes in Internal Control
During the three months ended
December 31, 2017
, we did not make any changes in our internal control over financial reporting that have materially affected, or are reasonably likely to materially affect, our internal control over financial reporting.
Management's Annual Report on Internal Control Over Financial Reporting
Management is responsible for establishing and maintaining adequate internal control over financial reporting, as such term is defined in Rules 13a-15(f) and 15d-15(f) under the Securities Exchange Act of 1934. Our internal control over financial reporting is designed to provide reasonable assurance regarding the reliability of financial reporting and the preparation of financial statements for external purposes in accordance with accounting principles generally accepted in the United States of America.
Because of its inherent limitations, internal control over financial reporting may not prevent or detect misstatements. Projections of any evaluation of effectiveness to future periods are subject to the risk that controls may become inadequate because of changes in conditions, or that the degree of compliance with the policies may deteriorate.
Management conducted an evaluation of the effectiveness of our internal control over financial reporting as of
December 31, 2017
using the criteria issued by the Committee of Sponsoring Organizations of the Treadway Commission ("COSO") in the 2013 Internal Control-Integrated Framework. Based on that evaluation, management believes that our internal control over financial reporting was effective as of
December 31, 2017
.
The effectiveness of our internal control over financial reporting as of
December 31, 2017
has been audited by Ernst & Young LLP, an independent registered public accounting firm, which also audited our Consolidated Financial Statements for the year ended
December 31, 2017
. Ernst & Young LLP's report on our internal control over financial reporting is set forth below.
89
REPORT OF INDEPENDENT REGISTERED PUBLIC ACCOUNTING FIRM
The Board of Directors and Stockholders of
Delta Air Lines, Inc.
Opinion on Internal Control over Financial Reporting
We have audited Delta Air Lines, Inc.’s internal control over financial reporting as of
December 31, 2017
, based on criteria established in Internal Control-Integrated Framework issued by the Committee of Sponsoring Organizations of the Treadway Commission (2013 framework) (the COSO criteria). In our opinion, Delta Air Lines, Inc. (the Company) maintained, in all material respects, effective internal control over financial reporting as of
December 31, 2017
, based on
the COSO criteria
.
We also have audited, in accordance with the standards of the Public Company Accounting Oversight Board (United States) (PCAOB), the consolidated balance sheets of the Company as of
December 31, 2017
and
2016
,
and the related consolidated statements of operations, comprehensive income, cash flows and stockholders’ equity for each of the three years in the period ended
December 31, 2017
, and the related notes and our report dated
February 23, 2018
expressed an unqualified opinion thereon.
Basis for Opinion
The Company’s management is responsible for maintaining effective internal control over financial reporting and for its assessment of the effectiveness of internal control over financial reporting included in the accompanying Management’s Annual Report on Internal Control Over Financial Reporting. Our responsibility is to express an opinion on the Company’s internal control over financial reporting based on our audit. We are a public accounting firm registered with the PCAOB and are required to be independent with respect to the Company in accordance with the U.S. federal securities laws and the applicable rules and regulations of the Securities and Exchange Commission and the PCAOB.
We conducted our audit in accordance with the standards of the PCAOB. Those standards require that we plan and perform the audit to obtain reasonable assurance about whether effective internal control over financial reporting was maintained in all material respects.
Our audit included obtaining an understanding of internal control over financial reporting, assessing the risk that a material weakness exists, testing and evaluating the design and operating effectiveness of internal control based on the assessed risk, and performing such other procedures as we considered necessary in the circumstances. We believe that our audit provides a reasonable basis for our opinion.
Definition and Limitation of Internal Control Over Financial Reporting
A company’s internal control over financial reporting is a process designed to provide reasonable assurance regarding the reliability of financial reporting and the preparation of financial statements for external purposes in accordance with generally accepted accounting principles. A company’s internal control over financial reporting includes those policies and procedures that (1) pertain to the maintenance of records that, in reasonable detail, accurately and fairly reflect the transactions and dispositions of the assets of the company; (2) provide reasonable assurance that transactions are recorded as necessary to permit preparation of financial statements in accordance with generally accepted accounting principles, and that receipts and expenditures of the company are being made only in accordance with authorizations of management and directors of the company; and (3) provide reasonable assurance regarding prevention or timely detection of unauthorized acquisition, use, or disposition of the company’s assets that could have a material effect on the financial statements.
Because of its inherent limitations, internal control over financial reporting may not prevent or detect misstatements. Also, projections of any evaluation of effectiveness to future periods are subject to the risk that controls may become inadequate because of changes in conditions, or that the degree of compliance with the policies or procedures may deteriorate.
|
Atlanta, Georgia
|
/s/ Ernst & Young LLP
|
|
February 23, 2018
|
|
90
ITEM 9B. OTHER INFORMATION
None.
PART III
ITEM 10. DIRECTORS, EXECUTIVE OFFICERS AND CORPORATE GOVERNANCE OF THE
REGISTRANT
Information required by this item is set forth under the headings "Governance Matters," "Proposal 1 - Election of Directors - Information About Nominees" and "Other Matters - Section 16 Beneficial Ownership Reporting Compliance" in our Proxy Statement to be filed with the Commission related to our 2018 Annual Meeting of Stockholders ("Proxy Statement"), and is incorporated by reference. Pursuant to instruction 3 to paragraph (b) of Item 401 of Regulation S-K, certain information regarding executive officers is contained in Part I of this Form 10-K.
ITEM 11. EXECUTIVE COMPENSATION
Information required by this item is set forth under the headings "Governance Matters - Compensation Committee Interlocks and Insider Participation," "Executive Compensation" and "Director Compensation" in our Proxy Statement and is incorporated by reference.
ITEM 12. SECURITY OWNERSHIP OF CERTAIN BENEFICIAL OWNERS AND MANAGEMENT AND
RELATED STOCKHOLDER MATTERS
Securities Authorized for Issuance Under Equity Compensation Plans
The following table provides information about the number of shares of common stock that may be issued under Delta's equity compensation plans as of
December 31, 2017
.
|
Plan Category
|
(a) No. of Securities to be Issued Upon Exercise of Outstanding Options, Warrants and Rights
(1)
|
(b) Weighted-Average Exercise Price of Outstanding Options, Warrants and Rights
(2)
|
(c) No. of Securities Remaining Available for Future Issuance Under Equity Compensation Plans (Excluding Securities Reflected in Column (a))
(3)
|
||||
|
Equity compensation plans approved by securities holders
|
3,365,648
|
|
$
|
21.53
|
|
29,758,243
|
|
|
Equity compensation plans not approved by securities holders
|
—
|
|
—
|
|
—
|
|
|
|
Total
|
3,365,648
|
|
$
|
21.53
|
|
29,758,243
|
|
|
(1)
|
Includes a maximum of 1,487,298 shares of common stock that may be issued upon the achievement of certain performance conditions under outstanding performance share awards as of
December 31, 2017
.
|
|
(2)
|
Includes performance share awards, which do not have exercise prices. The weighted average exercise price of options is $38.59.
|
|
(3)
|
Reflects shares remaining available for issuance under Delta's Performance Compensation Plan. If any shares of our common stock are covered by an award under the Plan that expires, is canceled, forfeited or otherwise terminates without delivery of shares (including shares surrendered or withheld for payment of taxes related to an award), then such shares will again be available for issuance under the Plan except for (i) any shares tendered in payment of an option, (ii) shares withheld to satisfy any tax withholding obligation with respect to the exercise of an option or stock appreciation right ("SAR") or (iii) shares covered by a stock-settled SAR or other awards that were not issued upon the settlement of the award. Because 2,599,512 shares of restricted stock remain unvested and subject to forfeiture, these shares could again be available for issuance.
|
Other information required by this item is set forth under the heading "Beneficial Ownership of Securities" in our Proxy Statement and is incorporated by reference.
ITEM 13. CERTAIN RELATIONSHIPS AND RELATED TRANSACTIONS, AND DIRECTOR
INDEPENDENCE
Information required by this item is set forth under the headings "Governance Matters" and "Proposal 1 - Election of Directors" in our Proxy Statement and is incorporated by reference.
91
ITEM 14. PRINCIPAL ACCOUNTANT FEES AND SERVICES
Information required by this item is set forth under the heading "Proposal 3 - Ratification of the Appointment of Independent Auditors" in our Proxy Statement and is incorporated by reference.
PART IV
ITEM 15. EXHIBITS AND FINANCIAL STATEMENT SCHEDULES
(a) (1). The following is an index of the financial statements required by this item that are included in this Form 10-K:
Report of Independent Registered Public Accounting Firm
Consolidated Balance Sheets—
December 31, 2017
and
2016
Consolidated Statements of Operations for the years ended
December 31, 2017
,
2016
and
2015
Consolidated Statements of Comprehensive Income for the years ended
December 31, 2017
,
2016
and
2015
Consolidated Statements of Cash Flows for the years ended
December 31, 2017
,
2016
and
2015
Consolidated Statements of Stockholders' Equity for the years ended
December 31, 2017
,
2016
and
2015
Notes to the Consolidated Financial Statements
(2). The schedule required by this item is included in Notes
11
and
15
to the Consolidated Financial Statements. All other financial statement schedules are not required or are inapplicable and therefore have been omitted.
(3). Exhibit List.
The exhibits required by this item are listed below. The management contracts and compensatory plans or arrangements required to be filed as an exhibit to this Form 10-K are listed as Exhibits 10.11 through 10.23.
Note to Exhibits
: Any representations and warranties of a party set forth in any agreement (including all exhibits and schedules thereto) filed with this Annual Report on Form 10-K have been made solely for the benefit of the other party to the agreement. Some of those representations and warranties were made only as of the date of the agreement or such other date as specified in the agreement, may be subject to a contractual standard of materiality different from what may be viewed as material to stockholders, or may have been used for the purpose of allocating risk between the parties rather than establishing matters as facts. Such agreements are included with this filing only to provide investors with information regarding the terms of the agreements, and not to provide investors with any other factual or disclosure information regarding the registrant or its business.
|
3.1(a)
|
|
3.1 (b)
|
|
3.2
|
92
Delta is not filing any instruments evidencing any indebtedness because the total amount of securities authorized under any single such instrument does not exceed 10% of the total assets of Delta and its subsidiaries on a consolidated basis. Copies of such instruments will be furnished to the Securities and Exchange Commission upon request.
|
10.1
|
|
10.2
|
|
10.3
|
|
10.4
|
|
10.5(a)
|
|
10.5(b)
|
|
10.5(c)
|
|
10.5(d)
|
93
|
10.6(a)
|
|
10.6(b)
|
|
10.7(a)
|
|
10.7(b)
|
|
10.7(c)
|
|
10.8(a)
|
|
10.8(b)
|
|
10.8(c)
|
|
10.9(a)
|
|
10.9(b)
|
|
10.9(c)
|
|
10.10
|
|
10.11
|
|
10.12
|
|
10.13
|
94
|
10.16(a)
|
|
10.16(b)
|
|
10.16(d)
|
|
10.17
|
|
10.18(a)
|
|
10.19
|
|
10.20
|
|
10.21
|
|
10.22
|
|
10.23
|
|
12.1
|
|
21.1
|
|
23.1
|
|
31.1
|
|
31.2
|
|
32
|
95
|
101.INS
|
XBRL Instance Document - The instance document does not appear in the interactive data file because its XBRL tags are embedded within the inline XBRL document.
|
|
101.SCH
|
XBRL Taxonomy Extension Schema Document
|
|
101.CAL
|
XBRL Taxonomy Extension Calculation Linkbase Document
|
|
101.DEF
|
XBRL Taxonomy Extension Definition Linkbase Document
|
|
101.LAB
|
XBRL Taxonomy Extension Labels Linkbase Document
|
|
101.PRE
|
XBRL Taxonomy Extension Presentation Linkbase Document
|
____________
|
*
|
Incorporated by reference.
|
|
**
|
Portions of this exhibit have been omitted and filed separately with the Securities and Exchange Commission pursuant to requests for confidential treatment.
|
ITEM 16. FORM 10-K SUMMARY
Not applicable.
96
SIGNATURES
Pursuant to the requirements of Section 13 or 15(d) of the Securities Exchange Act of 1934, the registrant has duly caused this report to be signed on its behalf by the undersigned, thereunto duly authorized, on the
23rd day of
February, 2018
.
|
DELTA AIR LINES, INC.
|
|||
|
By:
|
/s/ Edward H. Bastian
|
||
|
Edward H. Bastian
|
|||
|
Chief Executive Officer
|
|||
97
Pursuant to the requirements of the Securities Exchange Act of 1934, this report has been signed below on the
23rd day of
February, 2018
by the following persons on behalf of the registrant and in the capacities indicated.
|
Signature
|
Title
|
|
|
/s/ Edward H. Bastian
|
Chief Executive Officer and Director
(Principal Executive Officer)
|
|
|
Edward H. Bastian
|
||
|
/s/ Paul A. Jacobson
|
Executive Vice President and Chief Financial Officer
(Principal Financial Officer)
|
|
|
Paul A. Jacobson
|
||
|
/s/ Craig M. Meynard
|
Vice President and Chief Accounting Officer (Principal Accounting Officer)
|
|
|
Craig M. Meynard
|
||
|
/s/ Francis S. Blake
|
Chairman of the Board
|
|
|
Francis S. Blake
|
||
|
/s/ Daniel A. Carp
|
Director
|
|
|
Daniel A. Carp
|
||
|
/s/ Ashton B. Carter
|
Director
|
|
|
Ashton B. Carter
|
||
|
/s/ David G. DeWalt
|
Director
|
|
|
David G. DeWalt
|
||
|
/s/ William H. Easter III
|
Director
|
|
|
William H. Easter III
|
||
|
/s/ Mickey P. Foret
|
Director
|
|
|
Mickey P. Foret
|
||
|
/s/ Jeanne P. Jackson
|
Director
|
|
|
Jeanne P. Jackson
|
||
|
/s/ George N. Mattson
|
Director
|
|
|
George N. Mattson
|
||
|
/s/ Douglas R. Ralph
|
Director
|
|
|
Douglas R. Ralph
|
||
|
/s/ Sergio A.L. Rial
|
Director
|
|
|
Sergio A.L. Rial
|
||
|
/s/ Kathy N. Waller
|
Director
|
|
|
Kathy N. Waller
|
||
98
TABLE OF CONTENTS
Part IItem 1. BusinessItem 1A. Risk FactorsItem 1B. Unresolved Staff CommentsItem 2. PropertiesItem 3. Legal ProceedingsItem 4. Mine Safety DisclosuresPart IIItem 5. Market For Registrant's Common Equity, Related Stockholder Matters and Issuer Purchases Of Equity SecuritiesItem 5. Market For Registrant's Common Equity, Related Stockholder Matters andItem 6. Selected Financial DataItem 7. Management's Discussion and Analysis Of Financial Condition and Results Of OperationsItem 7. Management's Discussion and Analysis Of Financial Condition and ResultsItem 7A. Quantitative and Qualitative Disclosures About Market RiskItem 8. Financial Statements and Supplementary DataNote 1 . Summary Of Significant Accounting PoliciesNote 2 . Fair Value MeasurementsNote 3 . InvestmentsNote 4 . Derivatives and Risk ManagementNote 5 . Intangible AssetsNote 6 . Long-term DebtNote 7 . Lease ObligationsNote 8 . Airport RedevelopmentNote 9 . Employee Benefit PlansNote 10 . Commitments and ContingenciesNote 11 . Income TaxesNote 12 . Equity and Equity CompensationNote 13 . Accumulated Other Comprehensive LossNote 14 . Segments and Geographic InformationNote 15 . RestructuringNote 16 . Earnings Per ShareNote 17 . Quarterly Financial Data (unaudited)Item 9. Changes in and Disagreements with Accountants on Accounting and Financial DisclosureItem 9. Changes in and Disagreements with Accountants on Accounting andItem 9A. Controls and ProceduresItem 9B. Other InformationPart IIIItem 10. Directors, Executive Officers and Corporate Governance Of The RegistrantItem 10. Directors, Executive Officers and Corporate Governance Of TheItem 11. Executive CompensationItem 12. Security Ownership Of Certain Beneficial Owners and Management and Related Stockholder MattersItem 12. Security Ownership Of Certain Beneficial Owners and Management andItem 13. Certain Relationships and Related Transactions, and Director IndependenceItem 13. Certain Relationships and Related Transactions, and DirectorItem 14. Principal Accountant Fees and ServicesPart IVItem 15. Exhibits and Financial Statement SchedulesItem 16. Form 10-k Summary