DALLASNEWS CORP
10-Ks and 10-Qs
|
|
|
|
|
|
|
|
|
|
|
|
|
|
|
|
|
|
|
|
|
|
|
|
|
|
|
|
|
|
|
|
|
|
|
|
|
|
|
|
|
|
|
|
|
|
|
|
|
|
|
|
|
|
|
|
|
|
|
UNITED STATES SECURITIES AND EXCHANGE COMMISSION
Washington, D.C. 20549
Form 10-K
þ
ANNUAL REPORT PURSUANT TO SECTION 13 OR 15(d) OF THE SECURITIES EXCHANGE ACT OF 1934
For the fiscal year ended:
December 31, 2013
OR
o
TRANSITION REPORT PURSUANT TO SECTION 13 OR 15(d) OF THE SECURITIES EXCHANGE ACT OF 1934
Commission file no.
1-33741


(Exact name of registrant as specified in its charter)
|
Delaware
|
38-3765318
|
|
|
(State or other jurisdiction of incorporation or organization)
|
(I.R.S. Employer Identification No.)
|
|
|
P. O. Box 224866, Dallas, Texas 75222-4866
|
(214) 977-8200
|
|
|
(Address of principal executive offices, including zip code)
|
(Registrant’s telephone number, including area code)
|
|
|
Securities registered pursuant to Section 12(b) of the Act:
|
||
|
Title of each class
|
Name of each exchange on which registered
|
|
|
Series A Common Stock, $.01 par value
Preferred Share Purchase Rights
|
New York Stock Exchange
|
|
|
Securities registered pursuant to Section 12(g) of the Act:
|
||
|
Series B Common Stock, $.01 par value
(Title of class)
|
||
Indicate by check mark if the registrant is a well-known seasoned issuer, as defined in Rule 405 of the Act. Yes
o
No
þ
Indicate by check mark if the registrant is not required to file reports pursuant to Section 13 or Section 15(d) of the Exchange Act. Yes
o
No
þ
Indicate by check mark whether the registrant (1) has filed all reports required to be filed by Section 13 or 15(d) of the Securities Exchange Act of 1934 during the preceding 12 months (or for such shorter period that the registrant was required to file such reports), and (2) has been subject to such filing requirements for the past 90 days. Yes
þ
No
o
Indicate by check mark whether the registrant has submitted electronically and posted on its corporate website, if any, every Interactive Data File required to be submitted and posted pursuant to Rule 405 of Regulation S-T (§ 232.405 of this chapter) during the preceding 12 months (or for such shorter period that the registrant was required to submit and post such files). Yes
þ
No
o
Indicate by check mark if disclosure of delinquent filers pursuant to Item 405 of Regulation S-K (§ 229.405 of this chapter) is not contained herein, and will not be contained, to the best of registrant’s knowledge, in definitive proxy or information statements incorporated by reference in Part III of this Form 10-K or any amendment to this Form 10-K.
þ
Indicate by check mark whether the registrant is a large accelerated filer, an accelerated filer, a non-accelerated filer, or a smaller reporting company. See the definitions of “large accelerated filer,” “accelerated filer” and “smaller reporting company” in Rule 12b-2 of the Exchange Act.
|
Large accelerated filer:
o
|
|
Accelerated filer:
þ
|
|
Non-accelerated filer:
o
|
|
Smaller reporting company:
o
|
|
(Do not check if a smaller reporting company)
|
||||||
Indicate by check mark whether the registrant is a shell company (as defined in Rule 12b-2 of the Act). Yes
o
No
þ
The aggregate market value of the registrant’s voting stock held by nonaffiliates on June 30, 2013, based on the closing price for the registrant’s Series A Common Stock on such date as reported on the New York Stock Exchange, was approximately $130,425,853.*
Shares of Common Stock outstanding at
February 28, 2014
:
22,003,390
shares (consisting of
19,606,460
shares of Series A Common Stock and
2,396,930
shares of Series B Common Stock).
* For purposes of this calculation, the market value of a share of Series B Common Stock was assumed to be the same as the share of Series A Common Stock into which it is convertible.
Documents incorporated by reference:
Selected designated portions of the registrant’s definitive proxy statement, relating to the Annual Meeting of Shareholders to be held on
May 15, 2014
, are incorporated by reference into Parts II and III of this Annual Report.
A. H. Belo Corporation 2013 Annual Report on Form 10-K
A. H. BELO CORPORATION
FORM 10-K
TABLE OF CONTENTS
|
Page
|
||
|
Item 1.
|
||
|
Item 1A.
|
||
|
Item 1B.
|
||
|
Item 2.
|
||
|
Item 3.
|
||
|
Item 4.
|
||
|
Item 5.
|
||
|
Item 6.
|
||
|
Item 7.
|
||
|
Item 7A.
|
||
|
Item 8.
|
||
|
Item 9.
|
||
|
Item 9A.
|
||
|
Item 9B.
|
||
|
Item 10.
|
||
|
Item 11.
|
||
|
Item 12.
|
||
|
Item 13.
|
||
|
Item 14.
|
||
|
Item 15.
|
||
A. H. Belo Corporation 2013 Annual Report on Form 10-K
A. H. Belo Corporation (“A. H. Belo” or the “Company”), headquartered in Dallas, Texas, is a distinguished newspaper publishing and local news and information company that owns and operates three metropolitan daily newspapers and related websites, with publishing roots that trace to
The Galveston Daily News
, which began publication in 1842. A. H. Belo publishes
The Dallas Morning News
(
www.dallasnews.com
), Texas’ leading newspaper and winner of nine Pulitzer Prizes;
The Providence Journal
(
www.providencejournal.com
), the oldest continuously-published daily newspaper in the United States and winner of four Pulitzer Prizes; and the
Denton Record-Chronicle
(
www.dentonrc.com
), a daily newspaper operating in Denton, Texas, approximately 40 miles north of Dallas. The Company’s newspapers also publish various niche publications targeting specific audiences, and its investments include Classified Ventures, LLC, owner of
cars.com
, and Wanderful Media, LLC, owner of
FindnSave.com
. A. H. Belo offers digital marketing solutions through 508 Digital and Your Speakeasy, LLC, and also owns and operates commercial printing, distribution and direct mail service businesses. In February 2008, the Company separated its publishing operations from its former parent in a spin-off transaction (the “Distribution”) and A. H. Belo became an independent registrant listed on the New York Stock Exchange (NYSE trading symbol: AHC). All dollar amounts in this Annual Report on Form 10-K are in thousands, except per share amounts, unless the context requires otherwise.
The Dallas Morning News
’ first edition was published on October 1, 1885. It is one of the leading metropolitan newspapers in America and its success is founded upon the highest standards of journalistic excellence, with an emphasis on comprehensive local news and information and community service. The newspaper is distributed primarily in Dallas County and 10 surrounding counties. This coverage area represents the fourth most populous metropolitan area of the country.
The Dallas Morning News’
nine Pulitzer Prizes were awarded for news reporting, editorial writing and photography, with the most recent awarded in April 2010.
The Dallas Morning News
also publishes
Briefing
, a condensed newspaper distributed four days per week at no charge to nonsubscribers in select coverage areas; and
Al Dia
, an award-winning Spanish-language newspaper published on Wednesdays and Sundays and distributed at no charge in select coverage areas. Other news products are also published targeting various communities in the North Texas area.
The Dallas Morning News’
financial and operating results include the financial and operating results of the
Denton Record-Chronicle
.
The Providence Journal
is the leading newspaper in Rhode Island and southeastern Massachusetts and is the oldest major daily newspaper of general circulation and continuous publication in the United States.
The Providence Journal
also publishes
Journal Express
, a weekly publication distributed at no charge to households in select Rhode Island communities. The Company has currently engaged Stephens Inc. to explore a potential sale of
The Providence Journal
as the Company focuses resources and management time and attention on its core Dallas market.
In 2013, the Company completed the disposition of
The Press-Enterprise
, a daily newspaper in Riverside, California, its niche publications
La
Prensa
and
The
Weekly
, related websites and substantially all related real estate assets
.
Upon completion of the divestiture, the Company no longer owns newspaper operations in Riverside, California but continues to own and market for sale the land and buildings associated with a former commercial printing operation in Riverside, California. The disposition and the results of operations associated with
The Press-Enterprise
are reported as discontinued operations in the Company’s financial statements included herein. Amounts included in this Annual Report on Form 10-K exclude results of operations related to
The Press-Enterprise
unless otherwise indicated.
|
A. H. Belo Corporation 2013 Annual Report on Form 10-K
|
PAGE 1
|
|
The Company’s primary revenue is derived from advertising sold in published issues of its newspapers and on the Company’s websites, the sale of newspapers to subscribers and single copy customers, and commercial printing and distribution. The following sets forth the Company’s distribution of revenue in
2013
,
2012
and
2011
by type:
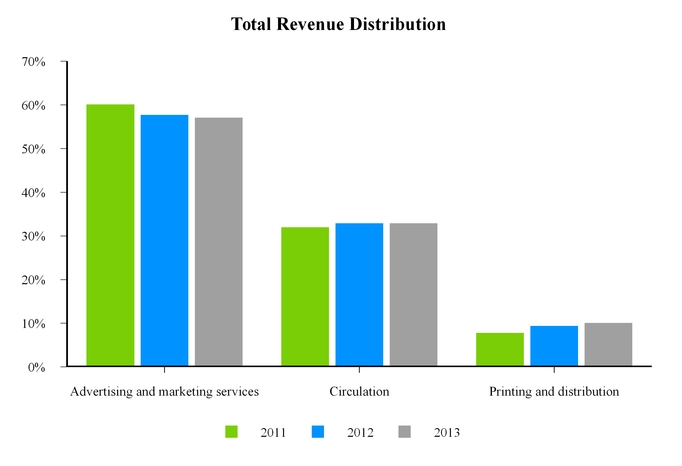
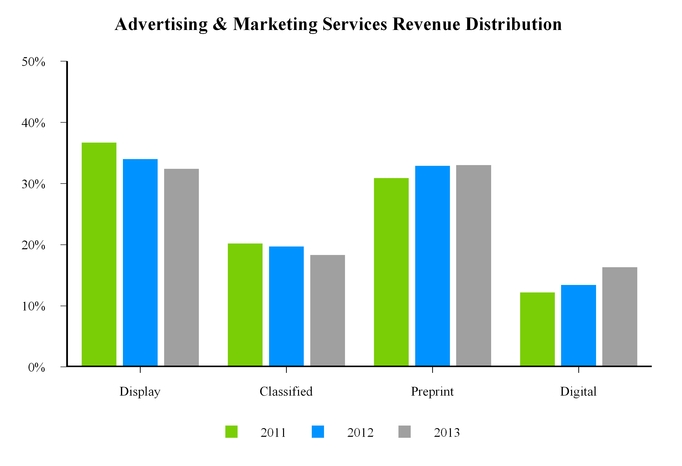
Advertising and Marketing Services Revenue
Advertising and marketing services revenue accounted for approximately
57.0 percent
of total revenue for
2013
. The Company has a comprehensive portfolio of print and digital advertising products and marketing services which include:
|
•
|
Display –
Display revenue results from sales of advertising space within the Company’s core newspapers and niche publications to local, regional or national businesses with local operations, affiliates or resellers.
|
|
•
|
Classified –
Classified revenue, which includes automotive, real estate, employment and other, results from sales of advertising space in the classified and other sections of the Company’s newspapers.
|
|
•
|
Preprint –
Preprint revenue results from sales of preprinted advertisements or circulars inserted into the Company’s core newspapers and niche publications, or distributed by mail or third-party distributors to households in targeted areas in order to provide total market coverage for advertisers. The Company developed capabilities that allow its advertisers to selectively target preprint distribution at the sub-zip code level in order to optimize coverage for the advertisers’ locations.
|
|
•
|
Digital –
Digital advertising revenue results from sales of banner and other display advertisements and classified advertisements on the Company’s websites and on third-party websites, such as
cars.com
, Yahoo! and
monster.com
.
|
Marketing services revenue, a component of digital advertising revenue, is generated by the Company’s recent product initiatives, 508 Digital and Your Speakeasy, LLC (“Speakeasy”). Services provided are directed towards small to middle-market size businesses and include development of mobile websites, search engine marketing and optimization, social media account management and content development for its customers’ web presence.
In addition to daily newspapers, the Company publishes a number of niche publications which provide a vehicle for delivery of display, classified, preprint and digital advertising, typically to nonsubscribers of the Company’s core newspapers and typically
|
PAGE 2
|
A. H. Belo Corporation 2013 Annual Report on Form 10-K
|
at no charge. These publications target specific demographic groups or geographies and include Spanish-language newspapers and condensed weekly newspapers, as well as luxury and design publications that target high-income consumers in various Texas markets. Most niche publications have related websites and mobile applications, allowing digital access by consumers. The niche publications provide unique content, but also incorporate the news content from the core newspapers while leveraging the Company’s printing, distribution and technology infrastructure to drive additional advertising revenue at a low incremental cost.
The Company generally operates the largest newsrooms in the markets it serves. The combined reach of the Company’s core daily newspapers, digital platforms and niche publications allows the Company to maintain its position as a leading local media outlet in each of its markets. The Company actively promotes its distribution resources and offerings for direct mail advertising, total market coverage, zoned editions and event-based publications, which enable the Company’s advertisers to reach new or targeted markets. These products allow existing advertisers to reach their target audience through integrated advertising campaigns, while also providing the Company a portfolio of products with which to attract new advertisers.
The following sets forth the distribution of the Company’s advertising and marketing services revenue in
2013
,
2012
and
2011
by product type.
As the newspaper industry continues to face challenges in maintaining display and classified revenues, the Company strategically seeks to stabilize and grow advertising revenues through diversification in advertising and marketing services. The Company has identified new product and investment opportunities that leverage the scale of its news content and its operating infrastructure, as well as complement the Company’s advertising customers, subscriber base and digital platforms. In 2012, 508 Digital was formed as a division of
The Dallas Morning News
, offering digital marketing services to small companies in the Dallas metropolitan area that include development of mobile websites, search engine marketing and optimization and social media marketing for its customers’ web presence. Also in 2012, the Company and a Dallas-based advertising agency formed Your Speakeasy, LLC, which targets middle-market business customers and provides turnkey social media account management and content marketing services. In addition to these digital initiatives, the Company repackaged certain niche products, such as
FD Luxe
, a luxury magazine and website targeting affluent residents in the Dallas area, and acquired luxury design and wedding guide publications and related websites targeting upscale builders, interior designers and wedding related businesses in various Texas markets. The Company also acquired the assets of a Dallas entertainment and events website in order to position
The Dallas Morning News
as the premier provider of on-line event and entertainment news and advertising in the North Texas area. The Company also leverages its
|
A. H. Belo Corporation 2013 Annual Report on Form 10-K
|
PAGE 3
|
|
subscriber and advertiser base to promote community events, such as One Day University, an educational speaker event sponsored through Crowdsource, the Company’s newly formed division providing marketing and promotional support to event organizers.
The Company is currently exploring further opportunities to grow and diversify revenue through acquisition or investment in advertising or marketing services companies with established financial performance and strong management teams. The Company’s acquisition and investment efforts are focused on businesses with products and services that complement the existing advertising and marketing services currently offered by its newspapers in the Dallas market.
Circulation Revenue
Circulation revenue accounted for approximately
32.9 percent
of total revenue for
2013
, up from 31.0 percent in 2012, and includes subscription and single copy sales revenue related to the Company’s core newspapers in print and digital formats. A. H. Belo’s steadfast commitment to producing superior, unduplicated local content enables the Company’s newspapers to charge premium subscription rates.
The
Dallas
Morning
News
and
The
Providence
Journal
developed and implemented consumer revenue strategies, the goal of which is to maximize the amount of recurring revenue from consumers of the Company’s print and digital products and to reduce the Company’s reliance on advertising revenue. Although circulation volumes continue to face negative pressures, the Company continuously evaluates the willingness and ability of its subscribers to pay higher rates by geographical area. In 2013, the Company implemented effective rate increases across its Dallas and Rhode Island markets. The Company anticipates additional opportunities for higher rates in 2014 as it continues to explore price sensitivity by local zones within these market areas.
In October 2013,
The Dallas
Morning
News
discontinued the paywall established in 2011 which restricted access for nonsubscribers to certain premium content on
dallasnews.com
. Research conducted since the establishment of the paywall suggested core seven-day subscribers would continue to primarily consume news content through print media even when lower digital subscription rates were offered. Starting in October 2013, news content on
dallasnews.com
became accessible to everyone, free of charge. The website provides expanded news and entertainment videos and greater access to content through social media sites. A separate premium digital experience is now offered to print subscribers on
dallasnews.com
that includes enhanced design and navigation, limited advertising and digital replicas of the newspaper through its e-Edition and access to unique subscriber benefits. This content is available to nonsubscribers for a weekly charge.
The Company’s websites, which also include
providencejournal.com
and other related websites, offer users comprehensive news and information, user-generated content, advertising, e-commerce and other services. Since 2011, the Company has introduced several initiatives to strengthen its ability to engage readers across multiple digital platforms with relevant local customized content and advertising. In addition to providing a digital replica of the newspapers through its e-Editions, the Company offers mobile websites and mobile applications for smart phones, tablets and e-readers. The Company’s journalists have expanded their reach and deepened their engagement with audiences by delivering news and content through social media platforms, such as blogs, Facebook and Twitter, which directs traffic to its core websites. In 2012,
The Dallas Morning News
acquired
pegasusnews.com
, a local entertainment website, as well as two magazines and their related websites,
Design Guide Texas
and
The Texas Wedding Guide
. Together with
FD Luxe,
these acquisitions strengthen
The Dallas Morning News’
position as a leading provider of online local entertainment and lifestyles news and information in its markets.
|
PAGE 4
|
A. H. Belo Corporation 2013 Annual Report on Form 10-K
|
Readership of the Company’s newspapers is tracked by Scarborough Research, which estimated the number of individuals reading a newspaper print edition to be approximately 1,408,000 for
The Dallas Morning News
and 505,000 for
The Providence Journal
, as reported in the September
2013
Publishers’ Statements, which are subject to audit. These readership volumes represent a reach of approximately 30.8 and 50.2 percent of the designated markets for these newspapers, respectively. The average print and digital volumes associated with A. H. Belo’s primary daily newspapers and niche publications are reported and verified by a circulation audit agency, as set forth in the table below.
|
2013
|
2012
|
2011
|
|||||||||||||||
|
Newspaper
|
Daily
Circulation
(a)
|
Sunday
Circulation
|
Daily
Circulation
(a)
|
Sunday
Circulation
|
Daily
Circulation
(a)
|
Sunday
Circulation
|
|||||||||||
|
The Dallas Morning News
Group
|
|||||||||||||||||
|
The Dallas Morning News
(b)
|
271,189
|
|
379,379
|
|
267,058
|
|
372,930
|
|
265,371
|
|
374,653
|
|
|||||
|
Niche publications
(b) (c)
|
118,626
|
|
324,536
|
|
120,299
|
|
327,719
|
|
174,712
|
|
—
|
|
|||||
|
Total
|
389,815
|
|
703,915
|
|
387,357
|
|
700,649
|
|
440,083
|
|
374,653
|
|
|||||
|
The Providence Journal
Group
|
|||||||||||||||||
|
The Providence Journal
(d)
|
81,282
|
|
105,810
|
|
88,974
|
|
119,199
|
|
94,357
|
|
129,024
|
|
|||||
|
Niche publications
(d)
|
23,656
|
|
—
|
|
24,310
|
|
—
|
|
23,938
|
|
—
|
|
|||||
|
Total
|
104,938
|
|
105,810
|
|
113,284
|
|
119,199
|
|
118,295
|
|
129,024
|
|
|||||
|
(a)
|
Daily circulation is defined as a Monday through Saturday six-day average.
|
|
(b)
|
Average circulation data for
The Dallas Morning News
and its niche publications, including the
Denton Record-Chronicle,
are obtained from its Publisher’s Statement for the six-month periods ended September 30,
2013
,
2012
and
2011
, as filed with the Alliance for Audited Media (the “Audit Bureau”). The September
2013
statements are subject to audit. Year-over-year increases in reported daily circulation for 2013 and 2012 for
The Dallas Morning News
are due to increased reported digital subscribers for each of these periods.
|
|
(c)
|
In 2012,
The Dallas Morning News
re-branded
Briefing
and
Al Dia’s
weekend circulation from Saturday to Sunday. On August 4, 2011, niche publication
Quick
ceased printing.
|
|
(d)
|
Average circulation data for
The Providence Journal
and its niche publications are obtained from its Publisher’s Statement for the six months ended September 30,
2013
,
2012
and
2011
, as filed with the Audit Bureau. The September
2013
statements are subject to audit.
|
Printing and Distribution Revenue
Printing and distribution revenue accounted for approximately
10.1 percent
of total revenue for
2013
and includes commercial printing, distribution and direct mail service. The Company provides commercial printing services for certain national newspapers that require regional printing, such as
The Wall Street Journal, The New
York Times, USA Today
and other local and regional newspapers. Newsprint used in the production of large national newspapers is generally provided by the customer. Home delivery and retail outlet distribution services are also provided for other national and regional newspapers delivered into the Company’s coverage areas, such as
The New York Post
and
The Boston Globe
. The Company also operates a direct mail service business in Phoenix, Arizona and Las Vegas, Nevada.
The Company continuously pursues opportunities to leverage its assets and resources in order to provide printing and distribution services to third-party publishers and advertisers in the geographic areas served by its core newspapers. In 2013, the Company effectively acquired from a competing Rhode Island distributor the contracts to distribute several national, regional and local third-party publications. In the Dallas-Fort Worth market, the Company reached an agreement to print the
Fort Worth Star-Telegram
starting in 2014.
Raw Materials and Distribution
The basic material used in publishing newspapers is newsprint. Currently, most of the Company’s newsprint is obtained through a purchasing consortium. Management believes the Company’s sources of newsprint, along with available alternate sources, are adequate for the Company’s current needs.
During
2013
, Company operations consumed
48,195
metric tons of newsprint at an average cost of
$606
per metric ton. Consumption of newsprint in
2012
was
49,670
metric tons at an average cost of
$618
per metric ton.
The Company’s newspapers and other commercial print products are produced at Company-owned facilities in each geographic market. Distribution of printed products to subscribers, retailers and newsstands is made under terms of agreements with third-
|
A. H. Belo Corporation 2013 Annual Report on Form 10-K
|
PAGE 5
|
|
party distributors. The Company believes a sufficient number of third-party distributors exist in each geographic market to allow uninterrupted distribution of the Company’s products.
Other Interests
In addition to its core newspaper operations, A. H. Belo owns the following investment interests:
|
•
|
Classified Ventures, LLC (“Classified Ventures”)
–
The Company owns a
3.3 percent
interest in Classified Ventures, in which the other owners are
Gannett Co., Inc.
,
The McClatchy Company
, Tribune Company and Graham Holdings Company. The two principal businesses Classified Ventures operates are
cars.com
and
apartments.com
.
On February 28, 2014, Classified Ventures entered into an agreement to sell its
apartments.com
business unit for $585,000. The sale is expected to close in the second quarter of 2014.
|
|
•
|
Wanderful Media, LLC (“Wanderful”)
–
The Company owns a
12.7 percent
interest in Wanderful, which operates
FindnSave.com
, a digital shopping platform where consumers can find national and local retail goods and services for sale. This platform combines local media participation with advanced search and database technology to allow a consumer to view online sales circulars and local advertised offers, or search for an item and receive a list of local advertisers and the price and terms offered for the searched item.
|
|
•
|
ResponseLogix, Inc., operating as Digital Air Strike
(
www.digitalairstrike.com
)
–
The Company owns a 2.1 percent interest in Digital Air Strike, which provides automotive dealers a suite of digital marketing communications, behavioral targeting and social media solutions.
|
|
•
|
Sawbuck Realty, Inc., operating as Homesnap (
www.homesnap.com
)
–
The Company owns a 19.8 percent interest in Homesnap, a free online real estate search platform and broker that can be accessed through its website and mobile applications, allowing users to gather current information on real estate listings.
|
During the third quarter of 2012, the Company and a Dallas-based advertising agency entered into an operating agreement and formed Speakeasy. The Company owns a
70 percent
interest in Speakeasy and, accordingly, consolidates this company’s assets, liabilities and results of operations within its consolidated financial statements.
Competitive Strengths and Challenges
The Company’s strengths are:
|
•
|
established, well-known and trusted brands within each of its markets
|
|
•
|
a strong, cohesive and stable senior management team, with significant sector experience, focused on strategy and execution
|
|
•
|
the ability to develop innovative new product and service offerings which leverage the Company’s brand equity, existing content, distribution platforms, technologies and relationships
|
|
•
|
sufficient liquidity to allow the Company to opportunistically invest in or acquire businesses that complement the Company’s advertising or marketing services business
|
|
•
|
three daily metropolitan newspapers with significantly greater scale of news gathering resources to cover the Company’s local markets and produce superior local content at a scale competitors are unlikely to duplicate
|
|
•
|
an affluent and educated demographic base in its largest market
|
|
•
|
the ability to market, print or digital, products and services to large and targeted audiences at low marginal costs
|
|
•
|
sales personnel with knowledge of the marketplaces in which the Company conducts its business and relationships with current and potential advertising clients
|
|
•
|
the ability to effectively manage operating costs according to market pressures
|
The Company’s newspapers, and the newspaper industry as a whole, continue to experience challenges to maintain and grow advertising and circulation revenue. This results from, among other factors, increased competition from other media, particularly the Internet. The decline in advertising revenue was particularly realized in the display and classified categories, as advertising budgets were reduced and advertisers shifted to other media. In response to these advertising decreases, A. H. Belo continues to
|
PAGE 6
|
A. H. Belo Corporation 2013 Annual Report on Form 10-K
|
diversify its revenue base by introducing new advertising and marketing services products, increasing circulation prices and expanding the reach of its distribution resources to wider markets.
The Company also developed broad digital strategies designed to provide readers with multiple platforms for obtaining online access to local news coverage while protecting the Company’s core print business. The Company continues its efforts to obtain key demographic data from readers, which allows the Company to provide content most desired by readers and to modify marketing and distribution strategies enabling the Company’s newspapers and websites to reach audiences most valued by advertisers. The Company has established strategic relationships with major Internet companies and invested in certain companies with innovative products and technologies. In selected cases, A. H. Belo markets, uses and sells products and services provided by companies in which it has invested. A. H. Belo also increased its focus on neighborhood and other local community and regional news, both in print and online.
As a result of declining overall revenue, the Company continuously evaluates and implements measures to control operating expenses. These measures include divesting of unprofitable products and services, reducing the costs of outsourced operations, adjusting the Company’s workforce and benefits to align with revenues and restructuring the Company’s newspapers through organizational realignments.
Strategies and Opportunities
A. H. Belo is committed to publishing newspapers and digital content of the highest quality and integrity and creating and developing innovative print and digital products addressing the needs of consumers and advertisers. The Company’s goal is to produce positive net income and cash flow and create value for shareholders over the long-term through stock price appreciation and dividends. The Company intends to achieve these objectives through the following strategies:
|
•
|
market existing print and digital products in an integrated manner that creates sustainable revenue and earnings
|
|
•
|
diversify revenue streams through acquisition or investment in established and profitable businesses complementing the Company’s advertising and marketing services
|
|
•
|
expand growth of marketing services revenue provided by 508 Digital and Speakeasy
|
|
•
|
optimize and leverage marketing and sales capabilities, including consumer demographic data, to implement initiatives that enable advertisers to reach high value consumers more effectively
|
|
•
|
produce quality local content in the communities served and efficiently manage content to drive revenue over multiple delivery platforms, including print, the Internet and mobile devices
|
|
•
|
continue to keep costs closely aligned with revenue, maintain strong liquidity to support future business and product initiatives and provide flexibility to meet strategic investment opportunities and other cash flow requirements
|
|
•
|
strengthen and improve the Company’s underlying technology platform to reduce expenses
|
Competition
The Dallas Morning News
competes with one metropolitan daily newspaper in certain areas of the Dallas/Fort Worth metroplex.
The Providence Journal
competes with four daily newspapers in Rhode Island and southeastern Massachusetts. The Company’s newspapers, including its niche publications, face competition for advertising and circulation revenue in varying degrees from other newspapers and specialized publications distributed in its circulation areas, including nationally circulated newspapers, television, radio, magazines, direct-mail, the Internet and other advertising media. The secular shift from print to digital media increased competition for audience and advertising from a wide variety of digital alternatives, including news and social media websites, online advertising networks and exchanges, online classified services, advertisements on mobile devices and other new media formats. The Company’s newspapers
compete for advertising revenue based on the size and demographics of its subscriber base, advertising results, rates and customer service. Competition for readers is primarily based on the mode of delivery, quality of the Company’s journalism, price, timeliness of its interaction with audiences and customer service.
The Company’s websites and digital applications face competition from Internet sites that provide news, aggregated content from different sources and sites that allow users to generate content. Competition for advertising revenue is encountered from websites providing platforms for classified advertisements and major search engines, such as Google and Yahoo!, which offer search and directory information for local businesses with enhanced functionality, such as mapping and links to reviews. In addition, other forms of digital distribution, such as applications for smart phones and tablets, compete for digital advertising revenue with the Company’s websites and digital applications.
|
A. H. Belo Corporation 2013 Annual Report on Form 10-K
|
PAGE 7
|
|
Seasonality
A. H. Belo’s advertising revenues are subject to moderate seasonality, with advertising revenue typically higher in the fourth calendar quarter of each year because of the holiday shopping season. The level of advertising sales in any period may also be affected by advertisers’ decisions to increase or decrease their advertising expenditures in response to anticipated consumer demand and general economic conditions.
Employees
As of
December 31, 2013
, the Company had approximately 1,500 full-time and 60 part-time employees, of which 258 employees are represented by various employee unions. All union-represented employees are located in Providence, Rhode Island. The Company believes its relations with its employees are satisfactory.
Available Information
A. H. Belo maintains its corporate website at
www.ahbelo.com
. The Company makes available on its website, free of charge, this Annual Report on Form 10-K, its quarterly reports on Form 10-Q, its current reports on Form 8-K and amendments to those reports, as filed or furnished pursuant to Section 13(a) or 15(d) of the Securities Exchange Act of 1934 (the “Exchange Act”), as amended, as soon as reasonably practicable after the reports are electronically filed with or furnished to the Securities and Exchange Commission (the “SEC”).
|
PAGE 8
|
A. H. Belo Corporation 2013 Annual Report on Form 10-K
|
Sections of this Annual Report on Form 10-K and management’s comments from time to time may contain forward-looking statements that are subject to risks and uncertainties. These statements are based on management’s current knowledge and estimates of factors affecting the Company’s operations, both known and unknown. Readers are cautioned not to place undue reliance on such forward-looking information as actual results may differ materially from those currently anticipated. In addition, a number of other factors (those identified elsewhere in this document and others, both known and unknown) may cause actual results to differ materially from expectations.
A. H. Belo’s businesses operate in highly competitive media markets, and the Company’s ability to maintain market share and generate revenue depends on how effectively the Company competes with existing and new competition.
The Company’s businesses operate in highly competitive media markets. A. H. Belo’s newspapers compete for advertising and circulation revenue with other newspapers, websites, digital applications, magazines, television, radio, direct mail and other media. The proliferation of the Internet and expansion of digital media and communications, particularly social media, mobile applications and the development of tablet and mobile devices has increased some consumers’ preferences to receive all or part of their news and information digitally. Websites such as
craigslist.com
,
monster.com
and
cars.com
provide a cost efficient platform for reaching wide but targeted audiences for classified advertisements. Websites such as Facebook, Twitter, Google and Yahoo! are successful in gathering national, local and entertainment news and information from multiple sources and attracting a broad readership base.
Historically, newspaper publishing was viewed as a cost-effective method of delivery for various forms of advertising to a large audience. The continued development and deployment of new technologies and greater competition from other media increases the challenge to the Company to provide competitive offerings to retain its print, as well as digital, advertisers and subscribers.
A. H. Belo’s ability to stabilize advertising and circulation revenue through price and volume increases may be affected by competition from other forms of media and other publications available in the Company’s various markets, declining consumer spending on discretionary items like newspapers, decreasing amounts of free time and declining frequency of regular newspaper buying among certain demographic groups. The Company may also incur higher costs competing for paid circulation, and if the Company is not able to compete effectively for advertising dollars and paid circulation, revenue may decline and the Company’s financial condition and results of operations may be adversely affected.
Purchasing practices of national advertisers could negatively impact the Company’s pricing and ability to up-sell other products, which could result in lower revenues.
Many national advertisers which place advertising in the Company’s newspapers are centralizing purchasing functions and streamlining the buying and negotiating process. This has resulted in the commoditization of certain advertising products, which limits the Company’s ability to promote its position in the market, the customer service value of its relationship with the advertiser, or the benefits of its suite of products, including the Company’s ability to up-sell other products. This also may put the Company in competition with other advertising companies that are able to offer lower prices for a larger geographical area than the Company covers. Accordingly, the Company could experience a decline in pricing which could result in a decline in revenue.
A. H. Belo may be unsuccessful in providing desired types of news and information content on digital platforms.
The Company increased the functionality of the websites associated with its core newspapers and offered applications for smart phones, tablet devices and e-readers. These digital platforms provide consumers varying levels of access to similar content offered within the respective newspaper, as well as late-breaking local, national and international news stories and interactive content, such as video, blogs and Twitter feeds. However, the frequency, types and depth of news desired by digital users may not be predictable or consistent with the news and other content offered on the Company’s digital platforms and the costs to attract and retain such consumers may be unprofitable to the Company’s operations.
The Company has significant cash reserves due to the sale of The Press-Enterprise and may not be able to deploy its current cash reserves in a profitable manner, and if additional capital resources are desired, the Company may not be able to obtain capital on favorable terms, if at all.
At December 31, 2013, the Company held
$82,193
in cash and cash equivalents, largely due to the disposition of substantially all of the assets relating to
The Press-Enterprise
. The Company’s future growth and profitability may be dependent upon its ability to profitably invest its capital in products and businesses that produce profitable revenue and generate acceptable returns on investment. The Company may not be able to find suitable opportunities to reinvest the cash, which could adversely impact the return on capital, or may make investments that do not yield the expected returns. If the Company deploys a substantial portion of the cash reserves, it may need additional financing to execute on current or future business strategies, including: developing
|
A. H. Belo Corporation 2013 Annual Report on Form 10-K
|
PAGE 9
|
|
new products internally, diversifying revenue streams by acquiring or investing in established and profitable businesses; making required investments in its operating infrastructure in order to support revenue growth; or otherwise responding to competitive pressures. The Company’s ability to raise financial capital in the future may be hindered due to uncertainty regarding A. H. Belo or the newspaper industry’s prospective performance. If adequate funds are not available or are not available on acceptable terms, if and when needed, the Company’s ability to conduct acquisitions, make investments in its businesses, take advantage of unanticipated opportunities, or otherwise respond to competitive pressures, could be significantly limited.
There can be no assurance that the Company’s product and service initiatives will be successful.
The Company has introduced new product and service initiatives designed to grow advertising and market services revenue and to respond to challenges of maintaining revenue in existing markets. These initiatives may not be successful for advertisers, may not be scalable or profitable and could result in unprofitable financial performance.
Decreases in circulation may adversely affect A. H. Belo’s advertising
and circulation revenue.
A. H. Belo’s newspapers, and the newspaper industry as a whole, are challenged to maintain and grow print circulation volume. To the extent circulation volume declines cannot be offset by rate increases the Company will realize lower circulation revenue. Further, circulation volume declines could also result in lower rates and volumes for advertising revenue.
The Company’s potential inability to successfully execute cost control
measures could result in total operating costs that are greater than
expected.
The primary costs of the Company’s operations include employee compensation and benefits; followed by distribution costs, newsprint and other production materials and technology costs. The Company has taken steps to lower its costs through selling or discontinuing production of unprofitable operations and products, reducing personnel and employee benefits and implementing general cost control measures. Although the Company continues its cost control efforts, the Company may be unable to match revenue declines with offsetting cost reductions.
Certain operating costs may not fluctuate directly with the changes in revenue volumes, which could result in lower margins if advertising and circulation volumes decline. The Company could also experience inflationary pressures from suppliers and be unable to generate additional revenue or additional cost reductions to offset these inflationary pressures. The Company utilizes outside service providers to distribute its newspapers, and certain preprint advertisements are distributed through the mail. Higher fuel costs or higher postage rates could result in higher direct costs incurred by the Company to distribute its products. The basic raw material for newspapers is newsprint. The price of newsprint has historically fluctuated significantly. Consolidation in the North American newsprint industry reduced the number of suppliers and led to paper mill closures and conversions to other grades of paper, which in turn decreased overall newsprint capacity and increased the likelihood of higher prices.
Recently implemented health care mandates may require the Company to evaluate the scope of health care benefits offered to its workforce and the method in which health care benefits are delivered. These mandates may require an expansion of coverage and benefits offered to employees that could increase the Company’s cost to provide medical benefits to employees. Additionally, as the economy recovers from the recent recession, competition for qualified personnel may require the Company to spend more on compensation costs, including employee benefits, to attract and retain its workforce.
The Company may not be able to pass on to customers these potential cost increases given the significant competition for advertising dollars and the ability of customers to obtain their news from other media at a low cost. If the Company does not achieve expected savings or if operating costs increase due to the creation and development of new products or otherwise, total operating costs may be greater than anticipated.
The Company believes appropriate steps are being taken to control costs. However, if the Company is not successful in matching revenue declines with corresponding cost reductions, the quality of the Company’s product’s could be affected as well as the Company’s ability to generate future profits. These events could result in impairment to the Company’s goodwill and other long-lived assets.
|
PAGE 10
|
A. H. Belo Corporation 2013 Annual Report on Form 10-K
|
A. H. Belo depends on key personnel and may not be able to operate and
grow its business effectively if the Company loses the services of any of its
senior executive officers or key operational employees or is unable to attract and
retain qualified personnel in the future.
A. H. Belo relies on the efforts of its senior executive officers and other management. The success of the Company’s business depends heavily on its ability to retain current management and to attract and retain qualified personnel in the future. Competition for senior management personnel is intense and A. H. Belo may not be able to retain its key personnel. In addition, reductions in staff and in employee benefits could adversely affect the Company’s ability to attract and retain key employees. The Company has not entered into employment agreements with key management personnel and does not have “key person” insurance for any of its senior executive officers or other key personnel. A. H. Belo has a change in control severance plan covering key management personnel that is triggered under certain conditions if a change in control occurs.
A. H. Belo’s business may be negatively affected by work stoppages, slowdowns, or strikes by its employees.
One of A. H. Belo’s newspapers,
The Providence Journal
, is a party to collective bargaining agreements with unions representing 258 employees at December 31, 2013. The contract with the Newspaper Guild, covering 162 of these employees, expired on December 31, 2013, and a new contract was ratified in early March 2014. Remaining contracts expire between 2014 and 2016 unless extended. A. H. Belo cannot predict the results of negotiations related to future collective bargaining agreements, whether future collective bargaining agreements will be negotiated without interruptions in the Company’s business, or the possible effect of future collective bargaining agreements on the Company’s business, financial condition and results of operations. The Company also cannot assume that strikes or work stoppages will not occur in the future in connection with labor negotiations or otherwise. Any prolonged strike or work stoppage could adversely affect the Company’s business, financial condition and results of operations.
Market conditions could increase the funding requirements associated with the Company’s pension plans.
The Company is the sole sponsor of A. H. Belo Pension Plans I and II (collectively, the “A. H. Belo Pension Plans”) and is required to meet certain pension funding requirements as established under the Employment Retirement Income Security Act (“ERISA”). Instability in global and domestic capital markets may result in low returns on the assets contributed to the A. H. Belo Pension Plans. Additionally, low yields on corporate bonds may decrease the discount rate, resulting in a higher funding obligation. Although legislation was enacted into law in 2012 which provided limited funding relief, these conditions could materially increase the funding requirements associated with the A. H. Belo Pension Plans, which could have an adverse impact on the Company’s liquidity and financial condition.
Adverse results from new litigation or governmental proceedings or investigations could adversely affect A. H. Belo’s business, financial condition and results of operations.
From time to time, A. H. Belo and its subsidiaries are subject to litigation, governmental proceedings and investigations. Adverse determinations in any such matters could require A. H. Belo to make monetary payments or result in other sanctions or findings that could affect adversely the Company’s business, financial condition and results of operations.
A. H. Belo’s directors and executive officers have significant combined voting power and significant influence over its management and affairs.
A. H. Belo directors and executive officers hold approximately 58.1 percent of the voting power of the Company’s outstanding voting stock as of December 31, 2013. A. H. Belo’s Series A common stock has one vote per share and Series B common stock has 10 votes per share. Except for certain extraordinary corporate transactions, generally all matters to be voted on by A. H. Belo’s shareholders must be approved by a majority of the voting power of the Company’s outstanding voting stock, voting as a single class. Certain extraordinary corporate transactions, such as a merger, consolidation, sale of all or substantially all of the Company’s assets, dissolution of the Company, the alteration, amendment, or repeal of A. H. Belo’s bylaws by shareholders and certain amendments to A. H. Belo’s certificate of incorporation, require the affirmative vote of the holders of at least two-thirds of the voting power of the outstanding voting stock, voting as a single class. Accordingly, A. H. Belo’s directors and executive officers will have significant influence over the Company’s management and affairs and over all matters requiring shareholder approval, including the election of directors and significant corporate transactions. This ownership may limit other shareholders’ ability to influence corporate matters and, as a result, A. H. Belo may take actions that some shareholders do not view as beneficial.
|
A. H. Belo Corporation 2013 Annual Report on Form 10-K
|
PAGE 11
|
|
None.
The Company’s principal operations are located as follows:
|
Operations
|
Ownership
|
Location
|
|
A. H. Belo
and
The Dallas Morning News
|
||
|
Corporate and
The Dallas Morning News’
headquarters
(a)
|
Owned
|
Dallas, Texas, downtown
|
|
Printing facilities
|
Owned
|
Plano, Texas
|
|
Denton Record-Chronicle
offices
|
Owned
|
Denton, Texas, downtown
|
|
Direct mail offices and warehouse
|
Leased
|
Phoenix, Arizona; Las Vegas, Nevada
|
|
The Providence Journal
|
||
|
Office building
|
Owned
|
Providence, Rhode Island, downtown
|
|
Printing facilities
|
Owned
|
Providence, Rhode Island
|
|
(a)
|
The Corporate and
The Dallas Morning News’
headquarters include two office buildings, a parking garage and adjacent land that are part of a ten-acre campus in downtown Dallas, Texas. Other properties on this campus are owned and used by the the former parent company in its operations. The Company leased certain storage facilities in its parking garage and a parcel of land to its former parent company under a long-term ground lease which provides an option to purchase for nominal value.
|
In addition to the properties above, the Company’s newspapers or other businesses hold various real estate assets that are nonessential to operations, including a warehouse/distribution facility in South Dallas that formerly served as a collating facility for
The Dallas Morning News
, various commercial buildings, parking lots and land. These real estate assets are currently marketed for sale and are included in property, plant and equipment in the Company’s consolidated balance sheets.
A number of legal proceedings are pending against A. H. Belo. In the opinion of management, liabilities, if any, arising from these legal proceedings would not have a material adverse effect on A. H. Belo’s results of operations, liquidity or financial condition.
|
PAGE 12
|
A. H. Belo Corporation 2013 Annual Report on Form 10-K
|
None.
The Company’s authorized common equity consists of 125,000,000 shares of common stock, par value $.01 per share. The Company has two series of common stock outstanding, Series A and Series B. Shares of the two series are identical in all respects except as noted herein. Shares of Series B common stock are entitled to 10 votes per share on all matters submitted to a vote of shareholders, and shares of Series A common stock are entitled to one vote per share. Transferability of the Series B common stock is limited to family members and affiliated entities of the holder. Shares of Series B common stock are convertible at any time on a one-for-one basis into shares of Series A common stock and upon a transfer other than as described above, shares of Series B common stock automatically convert into Series A common stock. Shares of the Company’s Series A common stock are traded on the New York Stock Exchange (NYSE trading symbol: AHC) and began trading on February 11, 2008. There is no established public trading market for shares of Series B common stock.
The declaration of dividends is subject to the discretion of A. H. Belo’s board of directors. The determination as to the amount declared and its timing depends on, among other things, A. H. Belo’s results of operations and financial condition, capital requirements, other contractual restrictions, prospects, applicable law, general economic and business conditions and other future factors that are deemed relevant. The board of directors generally declares dividends the quarter preceding its stated measurement and payment dates. A. H. Belo cannot provide any assurance that future dividends will be declared and paid due to the foregoing factors and the factors discussed in “Item 1A. Risk Factors” and elsewhere in this Annual Report on Form 10-K. The table below sets forth the high and low sales prices reported on the New York Stock Exchange for a share of the Company’s common stock and the recorded cash dividends per share declared for the past two years.
|
Stock Price
|
Dividends
|
||||||||||||||
|
High
|
Low
|
Close
|
Declared
|
||||||||||||
|
2013
|
|||||||||||||||
|
Fourth quarter
|
$
|
8.60
|
|
$
|
6.91
|
|
$
|
7.47
|
|
$
|
0.08
|
|
|||
|
Third quarter
|
8.05
|
|
6.57
|
|
7.85
|
|
0.08
|
|
|||||||
|
Second quarter
|
7.25
|
|
5.48
|
|
6.86
|
|
0.08
|
|
|||||||
|
First quarter
|
6.00
|
|
4.72
|
|
5.84
|
|
0.06
|
|
|||||||
|
2012
|
|
||||||||||||||
|
Fourth quarter
|
$
|
5.30
|
|
$
|
4.38
|
|
$
|
4.65
|
|
$
|
0.06
|
|
|||
|
Third quarter
|
5.04
|
|
3.96
|
|
4.83
|
|
0.30
|
|
|||||||
|
Second quarter
|
5.01
|
|
3.60
|
|
4.02
|
|
0.06
|
|
|||||||
|
First quarter
|
6.49
|
|
4.47
|
|
4.89
|
|
0.06
|
|
|||||||
The closing price of the Company’s Series A common stock as reported on the New York Stock Exchange on
February 28, 2014
, was $11.04. The approximate number of shareholders of record of the Company’s Series A and Series B common stock at the close of business on
February 28, 2014
, was 449 and 200, respectively.
Equity Compensation Plan Information
The information set forth under the heading “Equity Compensation Plan Information” contained in the definitive Proxy Statement for the Company’s Annual Meeting of Shareholders, to be held on
May 15, 2014
, is incorporated herein by reference.
Issuer Purchases of Equity Securities
The Company repurchases shares of its common stock from time to time pursuant to publicly announced share repurchase programs. During 2013, the Company repurchased 421,070 Series A shares at a cost of $2,763. All purchases were made through open market transactions and were recorded as treasury stock.
|
A. H. Belo Corporation 2013 Annual Report on Form 10-K
|
PAGE 13
|
|
The following table contains information for shares repurchased during the fourth quarter of 2013. None of the shares in this table were repurchased directly from any of our officers or directors.
|
Period
|
Total Number of Shares Purchased
|
Average Price Paid per Share
|
Total Number of Shares Purchased as Part of Publicly Announced Plans or Programs
|
Maximum Number of Shares that May Yet Be Purchased Under the Plans or Programs
|
|||||||||
|
October 2013
|
16,071
|
|
$
|
7.75
|
|
448,354
|
|
551,646
|
|
||||
|
November 2013
|
39,023
|
|
7.49
|
|
487,377
|
|
512,623
|
|
|||||
|
December 2013
|
7,823
|
|
7.66
|
|
495,200
|
|
1,004,800
|
|
(a)
|
||||
|
(a)
|
Share repurchases are made pursuant to a share repurchase program authorized by the Company’s board of directors. A total of 1,000,000 shares were authorized by the Company’s board of directors in the fourth quarter of 2012 and an additional 500,000 shares were authorized in the fourth quarter 2013.
|
Sales of Unregistered Securities
During
2013
,
2012
and
2011
, shares of the Company’s Series B common stock in the amounts of
4,401
,
12,961
and
30,057
, respectively, were converted, on a one-for-one basis, into shares of Series A common stock. The Company did not register the issuance of these securities under the Securities Act of 1933 (the “Securities Act”) in reliance upon the exemption under Section 3(a)(9) of the Securities Act.
|
PAGE 14
|
A. H. Belo Corporation 2013 Annual Report on Form 10-K
|
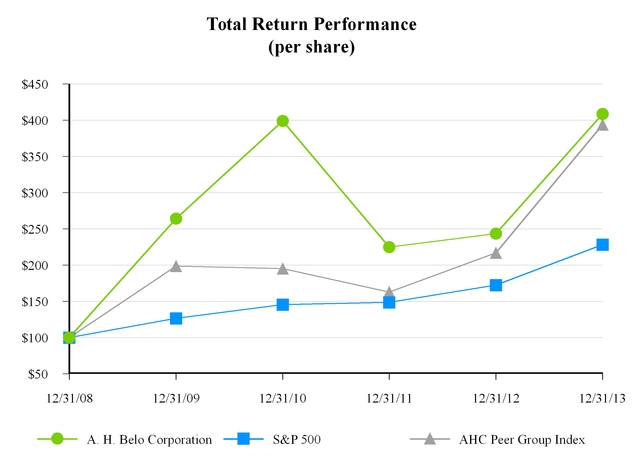
Performance Graph
The following graph and related information shall not be deemed “soliciting
material” or to be “filed” with the SEC, nor shall
such information be incorporated by reference into any future filing under the
Securities Act or Exchange Act, each as amended, except to the extent that the
Company specifically incorporates it by reference into such filing.
The graph below compares the annual cumulative shareholder return on an investment of $100 on December 31, 2008, with a closing price of $2.18 per share, in A. H. Belo’s Series A common stock, based on the market price of the Series A common stock and assuming reinvestment of dividends, with the cumulative total return, assuming reinvestment of dividends, of a similar investment in (1) companies on the Standard & Poor’s 500 Stock Index, and (2) the
2013
group of peer companies selected on a line-of-business basis and weighted for market capitalization. The Company’s peer group includes the following companies: Gannett Co., Inc., The E. W. Scripps Company, Journal Communications, Inc., Lee Enterprises, Incorporated, The McClatchy Company, Media General, Inc and The New York Times Company. A. H. Belo is not included in the calculation of peer group cumulative total shareholder return on investment.
|
A. H. Belo Corporation 2013 Annual Report on Form 10-K
|
PAGE 15
|
|
The table below sets forth selected financial data of the Company for each of the years ended
2009
through
2013
. For a more complete understanding of this selected financial data, see “Item 7. Management’s Discussion and Analysis of Financial Condition and Results of Operations” and the consolidated financial statements and accompanying notes.
|
As of and for the years ended December 31,
|
|||||||||||||||||||
|
In thousands, except per share amounts
|
2013
|
2012
|
2011
|
2010
|
2009
|
||||||||||||||
|
Total net operating revenue
|
$
|
366,250
|
|
$
|
374,690
|
|
$
|
394,196
|
|
$
|
413,898
|
|
$
|
437,738
|
|
||||
|
Total operating costs and expense
(a)
|
359,919
|
|
367,264
|
|
388,483
|
|
544,669
|
|
546,552
|
|
|||||||||
|
Income (loss) from operations
|
6,331
|
|
7,426
|
|
5,713
|
|
(130,771
|
)
|
(108,814
|
)
|
|||||||||
|
Total other income (expense), net
|
2,410
|
|
2,751
|
|
(962
|
)
|
6,167
|
|
(2,371
|
)
|
|||||||||
|
Income tax provision (benefit)
(b)
|
1,584
|
|
1,804
|
|
5,107
|
|
(4,372
|
)
|
(12,475
|
)
|
|||||||||
|
Income (loss) from continuing operations
|
7,157
|
|
8,373
|
|
(356
|
)
|
(120,232
|
)
|
(98,710
|
)
|
|||||||||
|
Income (loss) from discontinued operations
(c)
|
8,769
|
|
(7,954
|
)
|
(10,577
|
)
|
(4,002
|
)
|
(9,185
|
)
|
|||||||||
|
Net loss attributable to noncontrolling interests
(d)
|
(193
|
)
|
(107
|
)
|
—
|
|
—
|
|
—
|
|
|||||||||
|
Net income (loss) attributable to A. H. Belo Corporation
|
$
|
16,119
|
|
$
|
526
|
|
$
|
(10,933
|
)
|
$
|
(124,234
|
)
|
$
|
(107,895
|
)
|
||||
|
Total assets
|
$
|
279,218
|
|
$
|
291,939
|
|
$
|
345,088
|
|
$
|
420,049
|
|
$
|
404,427
|
|
||||
|
Total liabilities
|
$
|
110,442
|
|
$
|
189,879
|
|
$
|
223,609
|
|
$
|
220,176
|
|
$
|
82,830
|
|
||||
|
Total shareholders’ equity
|
$
|
168,776
|
|
$
|
102,060
|
|
$
|
121,479
|
|
$
|
199,873
|
|
$
|
321,597
|
|
||||
|
Cash dividends recorded per share
|
$
|
0.28
|
|
$
|
0.48
|
|
$
|
0.18
|
|
$
|
—
|
|
$
|
—
|
|
||||
|
(a)
|
In 2009, the Company recorded a charge of $80,940 to impair the carrying value of goodwill recorded at
The Providence Journal
to its fair value and a charge of $20,000 to impair the carrying value of real estate associated with a collating facility in South Dallas to its appraised value.
|
In 2010, the Company recorded a loss of $132,346 related to the withdrawal of the Company from a defined benefit plan of the former parent company. The assets and obligations related to current and former employees participating in this plan were transferred into two newly formed defined benefit pension plans created and sponsored solely by the Company. A final settlement adjustment of $1,988 was recorded to expense in 2011 relating to the finalization of plan assets and obligations assumed.
|
(b)
|
In 2009, the Company’s former parent company amended its 2007 federal income tax return in order to generate an $11,978 tax refund related to Company losses carried back against this return. Additional losses of the Company were carried back against the former parent company’s 2008 federal income tax return in 2010, generating a $4,732 refund.
|
|
(c)
|
In 2013, the Company sold the operations of
The Press-Enterprise,
which is reported as discontinued operations for the periods presented above.
|
|
(d)
|
In 2012, the Company acquired a 70 percent interest in Your Speakeasy, LLC. The Company consolidates the results of operations related to this investment and records the interests of other owners as noncontrolling interests.
|
|
PAGE 16
|
A. H. Belo Corporation 2013 Annual Report on Form 10-K
|
Forward-Looking Statements
The following information should be read in conjunction with the other sections of this Annual Report on Form 10-K. Statements in this Annual Report on Form 10-K concerning A. H. Belo’s business outlook or future economic performance, anticipated profitability, revenues, expenses, dividends, capital expenditures, investments, dispositions, impairments, business initiatives, acquisitions, pension plan contributions and obligations, real estate sales, working capital, future financings and other financial and non-financial items that are not historical facts, are “forward-looking statements” as the term is defined under applicable federal securities laws. Forward-looking statements are subject to risks, uncertainties and other factors that could cause actual results to differ materially from those statements.
Such risks, uncertainties and factors include, but are not limited to the following: changes in capital market conditions and prospects, changes in advertising demand and newsprint prices; newspaper circulation trends and other circulation matters, including changes in readership methods, patterns and demography; audits and related actions by the Alliance for Audited Media; challenges implementing increased subscription pricing and new pricing structures; challenges in achieving expense reduction goals in a timely manner and the resulting potential effect on operations; challenges in consummating asset acquisitions or dispositions upon acceptable terms; technological changes; development of Internet commerce; industry cycles; changes in pricing or other actions by new and existing competitors and suppliers; consumer acceptance of new products and business initiatives; labor relations; regulatory, tax and legal changes; adoption of new accounting standards or changes in existing accounting standards by the Financial Accounting Standards Board or other accounting standard-setting bodies or authorities; the effects of Company acquisitions, dispositions and co-owned ventures and investments; pension plan matters; general economic conditions and changes in interest rates; significant armed conflict; acts of terrorism; and other factors beyond the Company’s control, as well as other risks described elsewhere in this Annual Report on Form 10-K and in the Company’s other public disclosures and filings with the SEC.
OVERVIEW
A. H. Belo Corporation
A. H. Belo Corporation, headquartered in Dallas, Texas, is a distinguished newspaper publishing and local news and information company that owns and operates three metropolitan daily newspapers and related websites, with publishing roots that trace to
The Galveston Daily News
, which began publication in 1842. A. H. Belo publishes
The Dallas Morning News (
www.dallasnews.com
)
(Dallas, Texas), Texas’ leading newspaper and winner of nine Pulitzer Prizes;
The Providence Journal (
www.providencejournal.com
)
(Providence, Rhode Island), the oldest continuously-published daily newspaper in the United States and winner of four Pulitzer Prizes; and the
Denton Record-Chronicle (
www.dentonrc.com
),
a daily newspaper operating in Denton, Texas, approximately 40 miles north of Dallas. The Company publishes various niche publications targeting specific audiences, and its investments include Classified Ventures, LLC, owner of
cars.com
, and Wanderful Media, LLC, owner of
FindnSave.com
. A. H. Belo offers digital marketing solutions through 508 Digital and Speakeasy, and also owns and operates commercial printing, distribution and direct mail service businesses.
A. H. Belo intends for the discussion of its financial condition and results of operations that follows to provide information that will assist in understanding its financial statements, the changes in certain key items in those statements from period to period, and the primary factors that accounted for those changes, as well as how certain accounting principles, policies and estimates affect its financial statements. References to terms “revenue” and “expense” as used in Management’s Discussion and Analysis refer to income (loss) from continuing operations, unless otherwise noted.
Sale of The Press‑Enterprise
In 2013, the Company completed the disposition of
The Press-Enterprise
, a daily newspaper in Riverside, California, its niche publications
La
Prensa
and
The
Weekly
, related websites and substantially all related real estate assets. The disposition and the results of operations associated with
The Press-Enterprise
are discussed on page 49 and are presented within the Company’s financial statements as discontinued operations.
|
A. H. Belo Corporation 2013 Annual Report on Form 10-K
|
PAGE 17
|
|
Significant Transactions from Continuing Operations
During 2013, the results of operations of the Company were influenced by several significant transactions and events. In the first quarter, the Company voluntarily terminated its credit agreement, which had not been drawn upon since 2009. This agreement contained various terms restricting the Company’s ability to acquire investments, divest assets, make voluntary pension contributions and return capital to shareholders as described in Liquidity and Capital Resources below.
In the second quarter of 2013,
The Providence Journal
executed an agreement allowing it to effectively assume the distribution of various national and regional newspapers and magazines previously managed by a third-party distributor. The agreement also settled claims and disputes between
The Providence Journal
and the third-party distributor. Under the agreement,
The Providence Journal
is paying the third-party distributor approximately $1,330 over a two-year period for the acquisition of business and settlement of claims. The Company anticipates profits from the distribution contracts to well exceed the amounts paid under the agreement. The Company allocated approximately one-half of the cost of the agreement as a loss on the settlement of claims and, accordingly, recorded a loss of $665 in the second quarter of 2013. The remaining amounts to be paid are treated as contract acquisition costs and are being amortized to expense over three years starting in July 2013, consistent with the contract terms between
The Providence Journal
and the newspaper and magazine publishers.
In the fourth quarter of 2013,
The Dallas Morning News
, Inc.
executed an agreement with Star Telegram, Inc. to provide printing services for the
Fort Worth Star-Telegram,
a major metropolitan newspaper, whose reported average print circulation volumes per the September 2013 Publisher’s Statement were approximately 190,000 copies on Sundays and 110,000 daily copies on Mondays through Fridays. Printing of this newspaper is scheduled to commence in the first quarter of 2014 at the Company’s printing operations in Plano, Texas.
Effective September 11, 2013, Robert W. Decherd retired as the Company’s Chairman, President and Chief Executive Officer after 40 years of employment with the Company and former parent company. Mr. Decherd was succeeded by James M. Moroney III. Mr. Moroney served as the Company’s Executive Vice President since December 2007 and as Publisher and Chief Executive Officer of
The Dallas Morning News
since June 2001. In September 2013, Mr. Moroney was elected as the Chairman of the Company’s board of directors and Mr. Decherd now serves as Vice Chairman of the Company.
In addition to the above, the following significant transactions and events affected A. H. Belo’s results of operations and financial position during
2013
:
|
•
|
In 2013, 508 Digital and Speakeasy each completed their first full year of operations and generated
$5,773
in revenue. The Company continues to focus on diversifying its revenue streams and in addition to 508 Digital and Speakeasy, the Company began publishing
Design Guide
and
Texas Wedding Guide
, luxury design and wedding guide publications and related websites targeting upscale builders, interior designers and wedding related businesses in various Texas markets. The Company also began promoting events, such as One Day University, through its Crowdsource operation.
|
|
•
|
The Company concluded the accrual of transition benefits to the A. H. Belo Pension Transition Supplement Plan (the “PTS Plan”) in the first quarter. The Company recognized
$1,090
of remaining expense related to the PTS Plan and made
$5,217
of contributions to the plan, representing current and prior year obligations.
|
|
•
|
As a result of an increase in the discount rate and favorable investment performance, the net unfunded position of the pension plans was
$50,082
as of December 31, 2013, an improvement of
$72,739
from the prior year. The Company made required contributions to its pension plans of
$7,396
and voluntary contributions of
$4,604
.
|
|
•
|
Dividend proceeds of
$2,952
were received from an equity method investee, reducing the carrying value of this investment.
|
|
•
|
Dividends totaling
$6,356
were recorded and paid to shareholders and to holders of restricted stock units. The quarterly dividend rate was increased from $0.06 per share to $0.08 per share effective with the dividend declared in the second quarter and paid in the third quarter.
|
|
•
|
The Company received a refund of $1,334 on a tax return amended in a prior year.
|
|
•
|
The Company acquired
421,070
of its Series A shares through open market transactions for
$2,763
, which are recorded as treasury stock.
|
|
PAGE 18
|
A. H. Belo Corporation 2013 Annual Report on Form 10-K
|
RESULTS OF OPERATIONS
Consolidated Results of Continuing Operations
This section contains a discussion and analysis of net operating revenues, expenses and other information relevant to an understanding of results of operations for
2013
,
2012
and
2011
.
The table below sets forth the components of A. H. Belo’s net operating revenues for the last three years.
|
Years Ended December 31,
|
|||||||||||||||||
|
2013
|
Percentage
Change |
2012
|
Percentage
Change |
2011
|
|||||||||||||
|
Advertising and marketing services
|
$
|
208,959
|
|
(3.3
|
)%
|
$
|
216,108
|
|
(8.8
|
)%
|
$
|
237,061
|
|
||||
|
Circulation
|
120,316
|
|
(2.4
|
)%
|
123,224
|
|
(2.4
|
)%
|
126,290
|
|
|||||||
|
Printing and distribution
|
36,975
|
|
4.6
|
%
|
35,358
|
|
14.6
|
%
|
30,845
|
|
|||||||
|
$
|
366,250
|
|
(2.3
|
)%
|
$
|
374,690
|
|
(4.9
|
)%
|
$
|
394,196
|
|
|||||
The Company’s primary revenues are generated from advertising within its core newspapers, niche publications and related websites and from subscription and single copy sales of its printed newspapers. As a result of competitive and economic conditions, the newspaper industry has faced significant revenue decline over the past decade. The Company has sought to diversify its revenues through development and investment in new product offerings, increased circulation rates and leveraging of its existing assets to offer cost efficient printing and distribution services to its local markets. Through these efforts, the Company has achieved in 2013 the lowest year-over-year revenue decline since the Distribution.
In
2013
,
2012
and
2011
, the Company’s advertising revenue from the its core newspapers continues to be adversely affected by the shift of advertiser spending to other forms of media and the increased accessibility of free online news content, as well as news content from other sources, which resulted in a loss of advertising and paid circulation volumes and revenue. The most significant loss of advertising revenue was realized in display and classified categories. These categories, which represented
60.1 percent
of consolidated revenue in
2011
, have declined to
57.0 percent
in
2013
. The change in the revenue mix not only reflects the revenue loss, but reflects the Company’s on-going efforts to develop new revenue sources outside of these traditional product offerings.
In 2012,
The Dallas Morning News
and its marketing solutions group, DMNmedia, reached an agreement with LocalEdge, Hearst Corporation’s full service Internet marketing business, to resell LocalEdge’s digital solutions to small businesses under the name of 508 Digital in the Dallas/Fort Worth areas. These solutions include development of mobile websites, search engine marketing and optimization, video, mobile advertising and email marketing.
The Dallas Morning News
also offers advertising analytics and online reputation management services. The Company also entered into a joint venture with a local advertising agency, forming Speakeasy, which targets middle-market business customers and provides turnkey social media account management and content development services. Revenues from these marketing services initiatives were
$5,773
in 2013, up from $944 in 2012, offsetting approximately 70 percent of the core print advertising revenue declines at
The Dallas Morning News
in 2013. Although the Company expects advertising revenues in the Company’s core newspapers will continue to decrease in 2014, we anticipate further revenue growth with 508 Digital, Speakeasy and other potential acquisitions to substantially offset these declines.
The Company’s newspapers aggressively market the capacity of their printing and distribution assets to other newspapers that would benefit from cost sharing arrangements. The Company was successful in growing printing and distribution revenue by
4.6 percent
and
14.6 percent
in
2013
and
2012
, respectively, as a result of expansion of its distribution of third-party newspapers in its Rhode Island markets. Additionally, as a result of executing an agreement to print the
Fort Worth Star-Telegram
starting in 2014, the Company anticipates additional printing and inserting revenues of $6,000 to $6,500 on an annual basis.
|
A. H. Belo Corporation 2013 Annual Report on Form 10-K
|
PAGE 19
|
|
Newspaper Revenue
The table below sets forth the net operating revenues of A. H. Belo’s daily newspapers for the last three years.
|
Years Ended December 31,
|
|||||||||||||||||
|
2013
|
Percentage
Change
|
2012
|
Percentage
Change
|
2011
|
|||||||||||||
|
The Dallas Morning News
|
$
|
276,183
|
|
(1.7
|
)%
|
$
|
280,924
|
|
(6.1
|
)%
|
$
|
299,131
|
|
||||
|
The Providence Journal
(a)
|
90,067
|
|
(3.9
|
)%
|
93,766
|
|
(1.4
|
)%
|
95,065
|
|
|||||||
|
Total net operating revenues
|
$
|
366,250
|
|
(2.3
|
)%
|
$
|
374,690
|
|
(4.9
|
)%
|
$
|
394,196
|
|
||||
|
(a)
|
Revenue reported for
The Providence Journal
in 2012 includes
$3,737
due to the change in the circulation model used as described below.
|
|
PAGE 20
|
A. H. Belo Corporation 2013 Annual Report on Form 10-K
|
The Dallas Morning News
The table below sets forth the components of
The Dallas Morning News
net operating revenue for the last three years.
|
Years Ended December 31,
|
||||||||||||||||||||||||||
|
2013
|
Percent
of Total Revenue |
Percentage
Change |
2012
|
Percent
of Total Revenue |
Percentage
Change |
2011
|
Percent
of Total Revenue |
|||||||||||||||||||
|
Advertising and marketing services
|
$
|
167,945
|
|
60.8
|
%
|
(1.3
|
)%
|
$
|
170,113
|
|
60.5
|
%
|
(7.6
|
)%
|
184,175
|
|
61.6
|
%
|
||||||||
|
Display
|
57,640
|
|
(6.8
|
)%
|
61,843
|
|
(16.1
|
)%
|
73,717
|
|
||||||||||||||||
|
Classified
|
25,089
|
|
(8.1
|
)%
|
27,299
|
|
(7.3
|
)%
|
29,439
|
|
||||||||||||||||
|
Preprint
|
56,562
|
|
(2.3
|
)%
|
57,910
|
|
(1.5
|
)%
|
58,793
|
|
||||||||||||||||
|
Digital
|
28,654
|
|
24.3
|
%
|
23,061
|
|
3.8
|
%
|
22,226
|
|
||||||||||||||||
|
Circulation
|
86,274
|
|
31.2
|
%
|
(2.7
|
)%
|
88,662
|
|
31.6
|
%
|
(4.1
|
)%
|
92,493
|
|
30.9
|
%
|
||||||||||
|
Printing and distribution
|
21,964
|
|
8.0
|
%
|
(0.8
|
)%
|
22,149
|
|
7.9
|
%
|
(1.4
|
)%
|
22,463
|
|
7.5
|
%
|
||||||||||
|
$
|
276,183
|
|
100.0
|
%
|
(1.7
|
)%
|
$
|
280,924
|
|
100.0
|
%
|
(6.1
|
)%
|
$
|
299,131
|
|
100.0
|
%
|
||||||||
Display
– Revenue decreased in 2013 due to lower retail advertising in substantially all categories. Additionally, general advertising declined in all categories except for telecommunications which realized improvement in volumes. In 2012, retail and general advertising volumes and rates declined, of which approximately $1,076 of the decrease was attributable to nonrecurring advertising associated with the Super Bowl held in the Dallas-Fort Worth metroplex in February 2011.
Classified
– Revenue decreased in 2013 due to lower rates in all categories except for other classified. This decline was partially offset by higher volumes in real estate and automotive. In 2012, revenue decreased due to lower volumes in all categories except legal and obituary.
Preprint
– Revenue decreased in 2013 and 2012 due to a decline in the volume of preprint newspaper inserts, consistent with the decline in circulation volumes. The 2013 decline is partially offset by higher volumes in home delivery mail advertisements.
Digital
– Revenue increased in 2013 and 2012 primarily due to higher marketing services revenue associated with 508 Digital and Speakeasy, and also due to higher automotive and real estate classified advertising. Marketing services revenue provided by 508 Digital and Speakeasy grew in 2013 since these businesses commenced operations in the second and third quarters of 2012, respectively. Revenue recorded for 508 Digital and Speakeasy was $4,402 and $1,371, respectively, in 2013 and $881 and $64, respectively, in 2012. Almost 600 local advertisers contracted with 508 Digital in 2013, an increase of 33 percent compared to the prior year. The Company anticipates continued growth in both these product initiatives in 2014.
The Dallas Morning News
results also include its niche publications which expand its advertising platform to nonsubscribers of
The Dallas Morning News’
core newspaper. This revenue is a component of total display, classified, preprint and digital revenue of
The Dallas Morning News
discussed above. In 2013 and 2012, advertising revenue for
The Dallas Morning News’
niche publications was
$24,558
and $22,425, respectively. Revenue from niche publications is primarily generated by preprint advertising followed by display advertising. In 2011, niche publications
Al Dia
and
Briefing
re-branded their weekend circulation as a Sunday edition in order to attract additional preprint advertisers. As a result of this modification, the Company increased circulation of its niche publications since 2011 and has been able to sustain preprint advertising revenue. The Company acquired DG Publishing, Inc. in December 2012 and the Company began publishing
Design Guide
and
Texas Wedding Guide
, luxury design and wedding guide publications, generating $688 in advertising revenue in 2013.
Circulation
– Revenue decreased in 2013 due to a decline in home delivery and single copy paid print circulation volumes of 7.5 percent and 10.6 percent, respectively. These declines were partially offset by an effective rate increase of 4.0 percent in home delivery rates. In 2012, revenue decreased due to an average 7.6 percent decline in paid print circulation volumes, primarily in single copy and daily home delivery sales.
Printing and distribution
– Revenue remained flat year-over-year for 2013 and 2012.
|
A. H. Belo Corporation 2013 Annual Report on Form 10-K
|
PAGE 21
|
|
The Providence Journal
The table below sets forth the components of
The Providence Journal
net operating revenue for the last three years. Certain prior year amounts were reclassified to conform to current year presentation.
|
Years Ended December 31,
|
||||||||||||||||||||||||||
|
2013
|
Percent
of Total Revenue |
Percentage
Change |
2012
|
Percent
of Total Revenue |
Percentage
Change |
2011
|
Percent
of Total Revenue |
|||||||||||||||||||
|
Advertising and marketing services
|
$
|
41,014
|
|
45.5
|
%
|
(10.8
|
)%
|
$
|
45,995
|
|
49.1
|
%
|
(13.0
|
)%
|
$
|
52,886
|
|
55.6
|
%
|
|||||||
|
Display
|
10,062
|
|
(13.7
|
)%
|
11,656
|
|
(12.8
|
)%
|
13,370
|
|
||||||||||||||||
|
Classified
|
13,156
|
|
(13.7
|
)%
|
15,247
|
|
(16.8
|
)%
|
18,329
|
|
||||||||||||||||
|
Preprint
|
12,377
|
|
(6.1
|
)%
|
13,176
|
|
(8.4
|
)%
|
14,385
|
|
||||||||||||||||
|
Digital
|
5,419
|
|
(8.4
|
)%
|
5,916
|
|
(13.0
|
)%
|
6,802
|
|
||||||||||||||||
|
Circulation
|
34,042
|
|
37.8
|
%
|
(1.5
|
)%
|
34,562
|
|
36.8
|
%
|
2.3
|
%
|
33,797
|
|
35.6
|
%
|
||||||||||
|
Printing and distribution
|
15,011
|
|
16.7
|
%
|
13.6
|
%
|
13,209
|
|
14.1
|
%
|
57.6
|
%
|
8,382
|
|
8.8
|
%
|
||||||||||
|
$
|
90,067
|
|
100.0
|
%
|
(3.9
|
)%
|
$
|
93,766
|
|
100.0
|
%
|
(1.4
|
)%
|
$
|
95,065
|
|
100.0
|
%
|
||||||||
Display
– Revenue decreased in 2013 and 2012 as a result of a decline in retail and general advertising volumes.
Classified
– Revenue decreased in 2013 due to lower rates in all categories, offset by an increase in automotive volumes. Revenue decreased in 2012 due to a volume decline in legal and automotive advertising.
Preprint
– Revenue decreased in 2013 and 2012 due to a decline in the volume of preprint newspaper inserts, consistent with the decline in circulation volumes. The 2013 decline is partially offset by higher volumes in home delivery mail advertisements.
Digital
– Revenue decreased in 2013 and 2012 due to reduced volumes in banner and online advertising. Revenue also declined in 2013 due to lower real estate classified advertising and, in 2012, due to a decline in employment and other classified advertising.
Circulation
– Revenue decreased in 2013 due to a decline in home delivery and single copy paid print circulation volumes of 8.7 percent and 11.9 percent, respectively, partially offset by an effective rate increase of 10.0 percent in home delivery rates. Revenue increased in 2012 primarily due to
$3,737
of revenue related to
The Providence Journal’s
transition from a carrier buy-sell circulation model to a distributor fee-for-service circulation model at the end of 2011. Under this model, higher revenue is recognized, offset by higher distribution expenses. The increase due to the change in circulation model in 2012 was offset by a decline in home delivery and single copy paid print circulation volumes of 7.3 percent and 8.9 percent, respectively.
Printing and distribution
– Revenue increased in 2013 and 2012 due to expanded distribution of new and existing third-party newspapers. In the second quarter of 2013,
The Providence Journal
executed an agreement allowing it to effectively assume the distribution of various national and regional newspapers and magazines previously managed by a third-party distributor. This expansion generated $1,886 of additional revenue in 2013. See the Consolidated Financial Statements,
Note 14 – Contingencies
.
The Company has currently engaged Stephens Inc. to explore a potential sale of
The Providence Journal
as the Company focuses resources and management time and attention on its core Dallas market.
|
PAGE 22
|
A. H. Belo Corporation 2013 Annual Report on Form 10-K
|
Operating Costs and Expenses
The table below sets forth the components of the Company’s operating expenses for the last three years.
|
Years Ended December 31,
|
|||||||||||||||||
|
2013
|
Percentage
Change |
2012
|
Percentage
Change |
2011
|
|||||||||||||
|
Operating Costs and Expense
|
|||||||||||||||||
|
Employee compensation and benefits
|
$
|
146,307
|
|
(4.1
|
)%
|
$
|
152,523
|
|
(5.2
|
)%
|
$
|
160,874
|
|
||||
|
Other production, distribution and operating costs
|
140,230
|
|
0.5
|
%
|
139,566
|
|
(5.0
|
)%
|
146,836
|
|
|||||||
|
Newsprint, ink and other supplies
|
50,810
|
|
2.9
|
%
|
49,401
|
|
1.5
|
%
|
48,690
|
|
|||||||
|
Depreciation
|
18,079
|
|
(15.5
|
)%
|
21,401
|
|
(13.9
|
)%
|
24,850
|
|
|||||||
|
Amortization
|
4,493
|
|
2.7
|
%
|
4,373
|
|
—
|
|
4,373
|
|
|||||||
|
Asset impairments
|
—
|
|
—
|
|
—
|
|
(100.0
|
)%
|
872
|
|
|||||||
|
Pension plan withdrawal
|
—
|
|
—
|
|
—
|
|
(100.0
|
)%
|
1,988
|
|
|||||||
|
Total operating costs and expense
|
$
|
359,919
|
|
(2.0
|
)%
|
$
|
367,264
|
|
(5.5
|
)%
|
$
|
388,483
|
|
||||
Employee compensation and benefits
– Expenses decreased in 2013 due to the cessation of benefits related to the PTS Plan in the second quarter of 2013, resulting in a savings of $3,038. Savings of $1,677 were also achieved due to lower headcount and cost control initiatives related to employee medical benefits. The Company realized lower pension expense in 2013 and 2012 of $1,465 and $2,065, respectively, due to lower discount rates on the A. H. Belo Pension Plans’ projected benefit obligations and higher returns due to increased plan assets. In 2012, the Company realized lower compensation costs due to headcount reduction efforts. The 2011 loss for the pension plan withdrawal is further discussed below.
Other production, distribution and operating costs
– Expenses increased in 2013 and 2012 due to higher operating costs associated with 508 Digital and Speakeasy of $3,975 and $1,209, respectively, as these marketing services operations continued to grow. Expenses also increased in 2013 by
$665
due to the settlement of a distribution contingency and by $2,297 due to a nonrecurring property tax credit received in 2012, both at
The Providence Journal
. In 2012, distribution costs for home delivery and outside publications increased at
The Providence Journal
due to the revised carrier distribution model and decreased at
The Dallas Morning News
consistent with lower circulation volumes. Other expenses declined in 2013 due to lower legal, technology and sales promotion costs and declined in 2012 due to reduced out-sourcing of technology and consulting services.
Newsprint, ink and other supplies
– Expenses increased in 2013 and 2012 due to increased costs of supplements and ink resulting from a greater number of third-party publications under buy-sell arrangements, and due to additional preprint mail costs in 2013. These expenses were partially offset in both 2013 and 2012 by reduced newsprint costs associated with lower circulation volumes of the Company’s newspapers. Newsprint consumption approximated
48,195
,
49,670
and
52,570
metric tons in
2013
,
2012
and
2011
, respectively, at an average cost per metric ton of
$606
,
$618
and
$636
, respectively.
Depreciation
– Expenses decreased in 2013 and 2012 due to a higher level of in-service assets being fully depreciated. In 2012, the lower expense was partially offset by additional depreciation expense of
$762
due to certain property, plant and equipment that was determined to have a shorter remaining useful life than previously estimated.
Asset impairments
– Asset impairments in 2011 included a loss of
$872
to adjust the carrying value of a former commercial printing operation located in Riverside, California to its appraised value.
Pension plan withdrawal
–
A final settlement was recorded in 2011 to adjust the projected benefit obligations assumed by the Company’s pension plans, resulting in a loss of
$1,988
. In 2010, the Company had withdrawn from a defined benefit pension plan sponsored by the former parent company and recorded a loss for the unfunded obligations assumed at that time. The settlement recorded in 2011 represented an adjustment to the projected benefit obligation resulting from the finalization of demographic data for participants transferred to the Company’s pension plans. The Company has no further obligations or claims related to the pension plan of the former parent company.
Amortization
–
Expense increased due to amortization of customer relationships acquired in the purchase of certain assets and liabilities of DG Publishing, Inc., which was recorded during the first quarter of 2013.
|
A. H. Belo Corporation 2013 Annual Report on Form 10-K
|
PAGE 23
|
|
Other
The table below sets forth the other components of the Company’s results of operations for the last three years.
|
Years Ended December 31,
|
|||||||||||||||||
|
2013
|
Percentage
Change |
2012
|
Percentage
Change |
2011
|
|||||||||||||
|
Other Income (Expense), Net
|
|||||||||||||||||
|
Other income (expense), net
|
$
|
2,721
|
|
(19.5
|
)%
|
$
|
3,380
|
|
N.M.
|
|
$
|
(294
|
)
|
||||
|
Interest expense
|
(311
|
)
|
(50.6
|
)%
|
(629
|
)
|
(5.8
|
)%
|
(668
|
)
|
|||||||
|
Total other income (expense), net
|
$
|
2,410
|
|
(12.4
|
)%
|
$
|
2,751
|
|
N.M.
|
|
$
|
(962
|
)
|
||||
|
Income Tax Provision
|
$
|
1,584
|
|
(12.2
|
)%
|
$
|
1,804
|
|
(64.7
|
)%
|
$
|
5,107
|
|
||||
“N.M.”
– Percent change is not meaningful.
Other
– Income in 2013 decreased due to lower gains on asset sales and lower income for equity method investments. Income in 2012 increased due to greater investment income recognized from Classified Ventures and the positive current year impact of the Company no longer owning an interest in Belo Investment, LLC, which previously resulted in the Company recognizing investment losses.
Interest expense
– Interest expense decreased in 2013 due to the Company voluntarily terminating the its credit agreement in the first quarter, partially offset by the amortization of the
$401
remaining debt issuance costs related to the credit agreement.
Tax provision
– Tax provision decreased in 2012 due to a one-time charge of
$2,961
related to a pre-Distribution Internal Revenue Service (“IRS”) audit adjustment in 2011, pursuant to the Tax Matters Agreement with the former parent company. See the Consolidated Financial Statements,
Note 9 – Income Taxes
.
|
PAGE 24
|
A. H. Belo Corporation 2013 Annual Report on Form 10-K
|
Earnings and Adjusted Earnings before Interest, Taxes, Depreciation and Amortization from Continuing Operations
In addition to net income (loss) from continuing operations, the Company also evaluates earnings before interest, taxes, depreciation and amortization (“EBITDA”) which is presented for continuing operations by adjusting for discontinued operations and losses attributable to noncontrolling interests. Adjusted EBITDA is calculated, as applicable, by adding back to EBITDA the withdrawal loss from a former parent company pension plan, non-cash impairment expense and net investment-related losses.
|
Years Ended December 31,
|
|||||||||||
|
2013
|
2012
|
2011
|
|||||||||
|
Net income attributable to A. H. Belo Corporation
|
$
|
16,119
|
|
$
|
526
|
|
$
|
(10,933
|
)
|
||
|
Less: income (loss) from discontinued operations, net
|
8,769
|
|
(7,954
|
)
|
(10,577
|
)
|
|||||
|
Plus: net loss attributable to noncontrolling interests
|
(193
|
)
|
(107
|
)
|
—
|
|
|||||
|
Income (loss) from continuing operations
|
7,157
|
|
8,373
|
|
(356
|
)
|
|||||
|
Depreciation and amortization
|
22,572
|
|
25,774
|
|
29,223
|
|
|||||
|
Interest expense
|
311
|
|
629
|
|
668
|
|
|||||
|
Income tax provision
|
1,584
|
|
1,804
|
|
5,107
|
|
|||||
|
EBITDA from Continuing Operations
|
31,624
|
|
36,580
|
|
34,642
|
|
|||||
|
Addback:
|
|||||||||||
|
Pension plan withdrawal
|
—
|
|
—
|
|
1,988
|
|
|||||
|
Impairments
|
—
|
|
—
|
|
872
|
|
|||||
|
Net investment-related losses
|
—
|
|
—
|
|
2,634
|
|
|||||
|
Adjusted EBITDA from Continuing Operations
|
$
|
31,624
|
|
$
|
36,580
|
|
$
|
40,136
|
|
||
Neither EBITDA nor Adjusted EBITDA is a measure of financial performance under generally accepted accounting principles (“GAAP”). Management uses EBITDA, Adjusted EBITDA and similar measures in internal analyses as supplemental measures of the Company’s financial performance, and for performance comparisons against its peer group of companies. Adjusted EBITDA is also used by management to evaluate the cash flows available for capital spending, investing, pension contributions (required and voluntary), dividends and other equity-related transactions. Neither EBITDA nor Adjusted EBITDA should be considered in isolation or as a substitute for cash flows provided by operating activities or other income or cash flow data prepared in accordance with GAAP, and these non-GAAP measures may not be comparable to similarly-titled measures of other companies.
In previous periods, the Company added back pension expense in the determination of Adjusted EBITDA, including both recurring pension expense and the loss from withdrawal from a pension plan sponsored by the former parent company. Management reassessed this measurement and determined it is more appropriate to consider only the non-recurring loss from the pension plan withdrawal as an add-back to determine Adjusted EBITDA. Accordingly, all periods for which Adjusted EBITDA is presented exclude an adjustment for recurring pension expense. See the Consolidated Financial Statements,
Note 10 – Pension and Other Retirement Plans
for additional discussion of pension expense.
Sale of The Press-Enterprise
In 2013, the Company completed the disposition of
The Press-Enterprise
, a daily newspaper in Riverside, California, its niche publications
La
Prensa
and
The
Weekly
, related websites and substantially all related real estate assets
.
On
July 8, 2013
,
The Press‑Enterprise
sold certain equipment which was idled in 2012 when the newspaper ceased printing certain unprofitable commercial products. This transaction generated net proceeds of
$504
and a pretax gain of
$269
. On
July 17, 2013
, the Company completed the sale of its five-story office building and certain related assets in Riverside, California to the County of Riverside for
$30,000
. This building served as the administrative headquarters for
The Press‑Enterprise
. The proceeds to the Company were
$28,589
after selling costs of
$1,411
. In the third quarter of 2013 the Company recorded a pretax gain of
$4,477
related to this transaction.
On November 21, 2013, the Company completed the sale of the newspaper operations of
The Press-Enterprise
, including the production facility and related land, to Freedom Communications, Inc. (“Freedom Communications”) under a definitive asset purchase agreement. Gross sales proceeds of
$26,750
were received in the fourth quarter of 2013. Escrow proceeds of
$500
were received in February 2014 and the Company expects to collect a working capital adjustment of
$753
in the first quarter of 2014. Estimated selling and exit costs of
$5,787
were recognized in 2013, resulting in a pretax gain of
$8,656
.
|
A. H. Belo Corporation 2013 Annual Report on Form 10-K
|
PAGE 25
|
|
The Company recorded net income (loss) from discontinued operations of
The Press-Enterprise
as set forth in the table below.
|
Years Ended December 31,
|
|||||||||||
|
2013
|
2012
|
2011
|
|||||||||
|
Loss from discontinued operations
|
|||||||||||
|
Revenue
|
$
|
46,648
|
|
$
|
65,356
|
|
$
|
67,307
|
|
||
|
Costs and expense
|
(51,348
|
)
|
(73,382
|
)
|
(77,980
|
)
|
|||||
|
(4,700
|
)
|
(8,026
|
)
|
(10,673
|
)
|
||||||
|
Gain related to the divestiture of discontinued operations
|
|||||||||||
|
Gain on sale of
The Press-Enterprise
|
8,656
|
|
—
|
|
—
|
|
|||||
|
Gain on sale of five-story office building
|
4,477
|
|
—
|
|
—
|
|
|||||
|
Gain on sale of press equipment
|
269
|
|
—
|
|
—
|
|
|||||
|
13,402
|
|
—
|
|
—
|
|
||||||
|
Tax benefit from discontinued operations
|
(67
|
)
|
(72
|
)
|
(96
|
)
|
|||||
|
Income (Loss) from Discontinued Operations, Net
|
$
|
8,769
|
|
$
|
(7,954
|
)
|
$
|
(10,577
|
)
|
||
Upon completion of these transactions, the Company no longer owns newspaper operations in Riverside, California but continues to own and market for sale the land and buildings associated with a former commercial printing operation in Riverside, California. Through the disposition of
The Press-Enterprise
, the Company anticipates it will be able to more efficiently focus resources in serving its core geographic markets.
Critical Accounting Policies and Estimates
A. H. Belo’s Consolidated Financial Statements are based on the selection and application of accounting policies that require management to make significant estimates and assumptions. The Company believes that the following are the more critical accounting policies, estimates and assumptions currently affecting A. H. Belo’s financial position and results of operations. See the Consolidated Financial Statements,
Note 1 – Significant Accounting Policies and Recently Issued Accounting Standards
, for additional information concerning significant accounting policies.
Revenue Recognition and Reserves for Uncollectible Accounts Receivables.
The Company’s principal sources of revenue are the advertising space in published issues of its newspapers and on the Company’s websites, the sale of newspapers to distributors and individual subscribers, as well as amounts charged to customers for commercial printing, distribution and direct mail. Advertising revenue is recorded net of agency commission at the time the advertisements are published in the newspaper and ratably over the period of time the advertisement is placed on websites. Marketing services revenue is recognized at the time the services are rendered. Proceeds from subscriptions are deferred and are included in revenue ratably over the term of the subscriptions. Subscription revenue under buy-sell arrangements with distributors is recorded based on the net amount received from the distributor, whereas subscription revenue under fee-based delivery arrangements with distributors is recorded based on the amount received from the subscriber. Commercial printing and direct mail revenue is recorded when the product is distributed or shipped.
The Company estimates and records a reserve for uncollectible accounts receivable based upon recent collection experience and management’s knowledge of customers’ ability to pay amounts due. Expense for such uncollectible amounts is included in other production, distribution and operating costs.
Inventories.
Inventories, consisting primarily of newsprint, ink and other supplies used in printing newspapers, are recorded at average cost. The Company reviews its inventories for obsolescence and records an expense for any items that no longer have future value.
Assets Held for Sale.
Assets held for sale include fixed assets being actively marketed for which a sale is considered probable within the next 12 months. These assets are recorded at the lower of their fair value less costs to sell or their carrying value at the time they are classified as assets held for sale.
In 2011, the Company recorded a loss of
$700
to adjust the carrying value of a residence acquired pursuant to an employment retention and relocation agreement. The residence was sold in the second quarter of 2012 for
$2,410
, resulting in a gain of
$14
.
|
PAGE 26
|
A. H. Belo Corporation 2013 Annual Report on Form 10-K
|
Property, Plant and Equipment.
The Company records property, plant and equipment at cost or its fair value if acquired through a business acquisition or non-monetary exchange. Depreciable assets are reviewed to ensure the remaining useful life of the assets continues to be appropriate and the Company records any resulting adjustments to depreciation expense on a prospective basis. Depreciation of property, plant and equipment is recorded on a straight-line basis over the estimated useful lives of the assets as follows:
|
Estimated
Useful Lives |
|||
|
Buildings and improvements
|
5
|
-
|
30 years
|
|
Newspaper publishing equipment
|
3
|
-
|
20 years
|
|
Other
|
3
|
-
|
10 years
|
Goodwill.
The Company records goodwill at the reporting unit level based on the excess fair value of prior business acquisitions over the fair value of the assets and liabilities acquired. Reporting units of the Company are based on its internal reporting structure and represent a reporting level below an operating segment. Unless qualitative factors allow the Company to conclude it is more likely than not that the fair value of the reporting unit exceeds its carrying value, the Company tests for goodwill impairment by estimating the fair value of the reporting unit. If the fair value of the reporting unit is less than its carrying value, the Company will determine a fair value for the reporting unit’s underlying assets and liabilities and adjust goodwill accordingly. The Company uses a discounted cash flow model to calculate the fair value of its reporting units. The model includes a number of significant assumptions and estimates regarding future cash flows including discount rates, volumes, prices, capital expenditures and the impact of current market conditions. These estimates could be materially impacted by changes in market conditions. The Company performs the goodwill impairment test as of December 31 each fiscal year or when changes in circumstances indicate an impairment event may have occurred. Impairment charges represent non-cash charges and do not affect the Company’s liquidity, cash flows from operating activities or have any effect on future operations. As of
December 31, 2013
, the Company recorded goodwill at
The Dallas Morning News
reporting unit, for which the fair value exceeded its carrying value by a margin in excess of 100 percent at December 31, 2013. See the Consolidated Financial Statements,
Note 3 – Goodwill and Intangible Assets
.
Long-Lived Assets.
The Company evaluates its ability to recover the carrying value of property, plant and equipment and finite-lived intangible assets, using the lowest level of cash flows associated with the assets, which are grouped based on the Company’s intended use of these assets. This evaluation is performed whenever a change in circumstances indicates that the carrying value of the asset groups may not be recoverable from future undiscounted cash flows. If the analysis of future cash flows indicates the carrying value of the long-lived assets cannot be recovered, the assets are adjusted to the lower of its carrying value or fair value.
In 2011, an impairment charge of
$872
was recorded associated with certain real estate assets in Riverside, California. The recovery estimates, based on the eventual sale of the assets, were less than the carrying value of the assets of
$2,846
due to declines from economic conditions and real estate markets in California. As a result, the Company determined the impairment based on the fair value of the properties, as established by current appraisals, less selling costs.
Investments.
The Company owns certain equity securities in companies in which it does not exercise control. For those investments where the Company is able to exercise significant influence over the investee as defined under ASC 323 –
Equity Method and Joint Ventures
, the Company accounts for the investment under the equity method of accounting, recognizing its share of the investee’s income or loss as a component of earnings. All other investments are recorded under the cost method and the Company recognizes income or loss upon the receipt of dividends or distributions or upon liquidation of the investment. Each reporting period, the Company evaluates its ability to recover the carrying value of both equity and cost method investments based upon the financial strength of the investee. If the Company determines the carrying value is not recoverable, the Company will record an impairment charge for the difference between the fair value of the investment and the carrying value.
Concurrent with the Distribution, certain previously acquired real estate properties were transferred to Belo Investment, LLC (“Belo Investment”), an entity holding various investments in which the Company and its former parent Company each received a 50 percent interest. Through December 31, 2011, the Company accounted for its interest in Belo Investment under the equity method of accounting. On December 31, 2011, Belo Investment transferred four of its real estate properties to a newly formed subsidiary, AHC Dallas Properties, LLC. The Company entered into a nontaxable, non-monetary exchange arrangement with Belo Investment whereby it yielded its interests in Belo Investment in exchange for 100 percent of the holdings in AHC Dallas Properties, LLC and assumed a liability for certain capital repairs to properties retained by Belo Investment. The asset distribution was based on an equitable allocation of the properties using values established by third party independent appraisals. The Company determined that as a result of its continuing interests in these properties, the assets received in the exchange should be accounted for at the lower of fair value or historical carrying value. Accordingly,
$11,191
of fixed assets and
$90
of other assets received by AHC Dallas Properties, LLC in the exchange were consolidated in the Company’s 2011 financial statements, and the Company
|
A. H. Belo Corporation 2013 Annual Report on Form 10-K
|
PAGE 27
|
|
recorded a non-operating loss of
$5,018
on its investment in other expense in 2011. See the Consolidated Financial Statements,
Note 4 – Investments
.
Self-Insured Risks.
A. H. Belo self-insures certain risks for employee medical costs, workers’ compensation, general liability and commercial automotive claims and records a liability for such risks. The Company purchases stop-loss insurance and/or high deductible policies with third-party insurance carriers to limit these risks, and third-party administrators are used to process claims. Each period, the Company estimates, utilizing third party experts, the undiscounted liability associated with its uninsured risks based on historical claim patterns, employee demographic data, assets insured and insurance policy. The estimates associated with these uninsured liabilities are monitored by A. H. Belo’s management for adequacy based on information currently available. However, actual amounts could vary significantly from such estimates if actual trends, including the severity or frequency of claims and/or medical cost inflation, were to change.
Pension and Other Retirement Obligations.
The Company follows accounting guidance for single employer defined benefit plans. Plan assets and the projected benefit obligation are measured each December 31, and the Company records as an asset or liability the net funded position of the plans. Certain changes in actuarial valuations related to returns on plan assets and projected benefit obligations are recorded to other comprehensive income (loss) and are amortized to net periodic pension expense over the weighted average remaining life of plan participants, to the extent the cumulative balance in accumulated other comprehensive income (loss) exceeds 10 percent of the greater of the respective plan’s (a) projected benefit obligation or (b) the market-related value of the plan’s assets. Net periodic pension expense is recognized each period by accruing interest expense on the projected benefit obligation and accruing a return on assets associated with the plan assets. Participation in and accrual of new benefits to participants has been frozen since 2007 and, accordingly, on-going service costs are not a component of net periodic pension expense. From time to time, the Company-sponsored plans may elect to settle pension obligations with certain plan participants through the plans’ master trust as part of its de-risking strategies. The Company elected not to recognize the gains or losses associated with settlements of plan obligations to participants if such settlements are less than the interest component of net periodic pension cost for the year. Accordingly, such amounts are included in actuarial gains (losses) in accumulated other comprehensive income (loss).
The projected benefit obligations of the A. H. Belo Pension Plans are estimated using the Citigroup Pension Yield Curve, which is based upon a portfolio of high quality corporate debt securities with maturities that correlate to the timing of benefit payments to the plans’ participants. Future benefit payments are discounted to their present value at the appropriate yield curve rate to determine the projected benefit obligation outstanding at each year end. Yield curve discount rates as of
December 31, 2013
and
2012
, were
4.6 percent
and
3.7 percent
, respectively.
Interest expense included in net periodic pension expense is based on the Citigroup Pension Yield Curve established at the beginning of the fiscal year. Interest expense for
2013
,
2012
and
2011
was determined using beginning of year yield curve rates of
3.7 percent
,
4.2 percent
and
5.3 percent
, respectively.
The Company assumed a
6.5 percent
long-term rate of return on the plans’ assets in
2013
,
2012
and
2011
. This return is based upon historical returns of similar investment pools having asset allocations consistent with the expected allocations of the A. H. Belo Pension Plans. Investment strategies for the plans’ assets are based upon factors such as the remaining useful life expectancy of participants and market risks. The Company currently targets the plans’ assets invested in equity securities and fixed-income securities to approximate
50 percent
and
50 percent
, respectively.
The Company-sponsored plans implemented a de-risking strategy in 2012, making lump sum pay outs of
$10,526
to
889
participants. These liquidations reduced the projected benefit obligation by
$14,500
. These obligations were funded through the plans’ master trust account and are a component of 2012 benefit payments. As the cost of these settlements was less than the interest component of net periodic pension expense, the related gain (loss) associated with these settlements was reflected as a component of the actuarial loss and included in accumulated other comprehensive loss. The Company will continue to evaluate the feasibility of additional settlement of participant obligations based on the economic benefits to the Company.
Accumulated other comprehensive loss decreased by $58,439 and increased by $10,463 in
2013
and
2012
, respectively, primarily due to net actuarial (gains) losses associated with the A. H. Belo Pension Plans. The net actuarial (gains) losses associated with the pension plans included
$8,522
and
$21,127
of higher than estimated returns on plan assets in 2013 and 2012, respectively, combined with higher discount rates in 2013 and lower discount rates in 2012 applied against the projected benefit obligation. Actuarial losses of
$1,702
and
$700
were amortized to earnings in 2013 and 2012, respectively. See the Consolidated Financial Statements,
Note 10 – Pension and Other Retirement Plans
.
Contingencies.
A. H. Belo is involved in certain claims and litigation related to its operations. The Company is required to assess the likelihood of any adverse judgments or outcomes to these matters as well as potential ranges of probable losses. A determination of the amount of reserves required, if any, for these contingencies is made after careful analysis of each individual
|
PAGE 28
|
A. H. Belo Corporation 2013 Annual Report on Form 10-K
|
matter. The required reserves may change in the future due to new developments in each matter or changes in approach, such as a change in settlement strategy in dealing with these matters. See the Consolidated Financial Statements,
Note 14 – Contingencies
.
Treasury Stock.
The Company’s board of directors authorized the purchase of the Company’s Series A or Series B common stock, for use other than retirement, through open market purchases, privately negotiated transactions or otherwise. The Company follows the guidance under ASC 505-30 –
Equity - Treasury Stock,
and treasury stock is recorded at cost, reducing shareholders’ equity. Treasury stock purchased privately through negotiated transactions at other than market prices shall be recorded at cost and the price paid in excess of the market cost shall be accounted for according to its substance. When shares of treasury stock are subsequently sold or reissued, the cost of the treasury stock is reversed and the realized gain or loss on sale or reissue, net of any directly attributable incremental transaction costs and related tax, is recognized as a change in additional paid in capital. See the Consolidated Financial Statements,
Note 11 – Shareholders’ Equity
.
Share-Based Compensation.
The Company recognizes the granting of share-based awards at fair value in the financial statements. The fair value of option awards is estimated at the date of grant using the Black-Scholes-Merton pricing model and the fair value of restricted stock unit awards (“RSU”) is the closing price of the Company’s common stock on the date of grant. Total compensation cost is amortized to earnings over the requisite service period. Upon vesting, RSUs are redeemed
60 percent
in A. H. Belo Series A common stock and
40 percent
in cash. The Company records a liability for the portion of the outstanding RSUs to be redeemed in cash, which is adjusted to its fair value each period, based on the closing price of the Company’s common stock. Prior to the Distribution, the Company’s employees participated in a share-based compensation plan sponsored by the Company’s former parent. The Company recorded expense for the vesting of these awards for its employees which was completed in 2011. See the Consolidated Financial Statements,
Note 6 – Long-term Incentive Plans
.
Income Taxes.
The Company uses the asset and liability method of accounting for income taxes and recognizes deferred tax assets and liabilities based on the difference between the financial statement and tax basis of assets and liabilities using enacted tax rates. The Company establishes a valuation allowance if it is more likely than not that the deferred tax assets will not be realized. The factors used to assess the likelihood of realization of the deferred tax asset include reversal of future deferred tax liabilities, available tax planning strategies and future taxable income. For the periods prior to the Distribution, the Company’s results were included in the consolidated income tax returns of the Company’s former parent, and the Company participates in any subsequent amendment to these tax returns or IRS audit determination as it applies to the Company’s operations in accordance with the Tax Matters Agreement with its former parent company.
The Company also evaluates any uncertain tax positions and recognizes a liability for the tax benefit associated with an uncertain tax position if it is more likely than not that the tax position will not be sustained on examination by the taxing authorities, based on the technical merits of the position. The tax benefits recognized in the financial statements from such positions are measured based on the largest benefit that has a greater than 50 percent likelihood of being realized upon ultimate settlement. The Company records a liability for uncertain tax positions taken or expected to be taken in a tax return. Any change in judgment related to the expected ultimate resolution of uncertain tax positions is recognized in earnings in the period in which such change occurs. Interest and penalties, if any, related to unrecognized tax benefits are recorded in interest expense. See the Consolidated Financial Statements,
Note 9 – Income Taxes
.
Recent Accounting Standards
See the Consolidated Financial Statements,
Note 1 – Significant Accounting Policies and Recently Issued Accounting Standards
, regarding the impact of certain recent accounting pronouncements.
Liquidity and Capital Resources
The Company’s cash balances as of
December 31, 2013
and
2012
, were
$82,193
and
$34,094
, respectively. The increase in cash is primarily due to the receipt of proceeds associated with the disposition of substantially all of the assets relating to
The Press-Enterprise.
Net proceeds totaling $50,056 were received after deducting selling costs of $7,198. In 2014, the Company received escrow proceeds of
$500
and expects to collect a
$753
working capital adjustment and to pay approximately $1,200 of outstanding obligations related to the sale. See the Consolidated Financial Statements,
Note 2 – Discontinued Operations and Sales of Assets
. Cash provided by continuing operations was
$14,527
, which reflected required contributions of
$7,396
and voluntary contributions of
$4,604
to the Company’s pension plans. Cash used for continuing investing activities was
$7,372
, which included capital spending of
$6,362
and an additional investment of
$1,377
in Wanderful Media, owner of
FindnSave.com
. Cash used for continuing financing activities was
$8,823
, which included dividend payments of
$6,356
and the purchase of treasury stock for
$2,763
.
|
A. H. Belo Corporation 2013 Annual Report on Form 10-K
|
PAGE 29
|
|
The Company’s working capital as of
December 31, 2013
and
2012
, was
$86,345
and
$75,403
, respectively. After excluding assets and liabilities of discontinued operations, which are classified as current assets and liabilities, respectively, working capital increased by
$51,958
. In 2013, Adjusted EBITDA plus dividends received from equity method investees totaled
$34,576
. These amounts were used for required contributions to the A. H. Belo Pension Plans of
$7,396
and capital spending of
$6,362
. Discretionary spending in 2013 included
$6,356
of dividend payments,
$4,604
of voluntary pension contributions and $1,377 for contributions to an equity method investee. The Company’s pension obligations for 2014 will be approximately
$10,000
and capital expenditures are estimated to be approximately $8,000. The Company anticipates EBITDA from operations to be sufficient to cover these expenditures.
As discussed in Item 1. Business, on February 28, 2014, an equity investee of the Company entered into an agreement to sell one of its business units. The sale is expected to close in the second quarter of 2014 and the Company’s portion of the proceeds, net of selling costs, on the sale will be approximately $18,900. The Company expects federal income taxes to be minimal as a result of previously incurred net operating losses and is finalizing its estimate of state taxes.
The Company intends to deploy its cash in the long-term interests of the Company, its shareholders and employees as it seeks potential acquisition or investment opportunities complimenting its advertising and marketing services products. Management works aggressively to manage expenses in correlation to changes in revenue and believes cash flows generated from operations will be sufficient to meet foreseeable cash flow requirements for operations, capital spending and pension contributions. The following discusses the changes in cash flows by operating, investing and financing activities.
Operating Cash Flows
Net cash provided by (used for) continuing operations was $
14,527
, $
(4,283)
and $
(13,878)
in
2013
,
2012
and
2011
, respectively. Cash flows from continuing operations increased due to lower pension plan contributions of
$20,672
and
$13,633
in 2013 and 2012, respectively, decreased funding of self-insured medical expenses of $2,728 in 2013 and the receipt of
$1,334
related to an amended prior year tax return in 2013. Additionally, 2012 was impacted by a nonrecurring tax settlement payment of
$2,961
and the receipt of proceeds of
$2,410
related to the sale of a former officer’s residence acquired by the Company as part of an employment agreement.
In 2013, the Company made a final contribution of
$5,217
to the PTS Plan. During 2013, the Company fulfilled its obligation to this plan and the accrual and payment of contributions is now complete. Contributions to this plan in 2012 and 2011 were
$4,497
and
$5,306
, respectively.
Investing Cash Flows
Net cash used for continuing investing activities was $
7,372
, $
8,546
and $
9,057
in
2013
,
2012
and
2011
, respectively. Cash flows used for continuing investing activities decreased due to reduced capital expenditures in 2013 of $1,704, which is primarily due to construction costs no longer being incurred for a data center completed at
The Providence Journal
in 2012. These savings were offset by cash used to invest in Wanderful, an equity-method investee, of
$1,377
and $705 in 2013 and 2012, respectively. The Company expects to make capital expenditures of approximately $8,000 in 2014 using cash generated from operations.
Financing Cash Flows
Net cash used for continuing financing activities was $
8,823
, $
10,870
and $
3,963
in
2013
,
2012
and
2011
, respectively. Significant components in continuing financing cash flows include
$6,356
,
$10,947
and
$4,058
of dividends paid in
2013
,
2012
and
2011
, respectively. As of December 31, 2013, the Company is authorized to purchase up to a total of
1,500,000
shares of the Company’s Series A or Series B common stock through open market purchases or negotiated transactions, as authorized by its board of directors. The Company purchased
421,070
shares of Series A common stock at a cost of
$2,763
in 2013, and 74,130 shares of Series A common stock at a cost of $350 in 2012.
Financing Arrangements
As of December 31, 2012, the Company operated under an Amended and Restated Credit Agreement (the “Credit Agreement”) dated January 30, 2009, by and between the Company and certain of its subsidiaries, as borrowers, JPMorgan Chase Bank, N.A., as administrative agent, and the lenders party thereto (as amended by First through Fifth Amendments dated August 18, 2009, December 3, 2009, August 18, 2010, March 10, 2011 and May 2, 2011, respectively). The Credit Agreement, with a maturity date of September 30, 2014, provided a $25,000 working capital facility that was subject to a borrowing base. Among other matters, the Credit Agreement created an asset-based revolving credit facility secured by the Company’s accounts receivable, inventory, real property and other assets.
Under certain conditions, the facility restricted payment of dividends, imposed a fixed charge coverage ratio covenant, limited investments and limited the Company’s ability to divest assets. Additionally, payment of voluntary pension contributions,
|
PAGE 30
|
A. H. Belo Corporation 2013 Annual Report on Form 10-K
|
declaration of special dividends and purchase of shares of the Company’s common stock were permitted only as long as no borrowings were outstanding under the revolving credit facility. The Company was also required to pay commitment fees at
0.5 percent
on the unused credit facility and
2.5 percent
on outstanding letters of credit. The Company had not borrowed under the Credit Agreement since 2009 as cash flows from operations were sufficient to meet liquidity requirements.
On January 4, 2013, the Company voluntarily terminated its Credit Agreement to provide greater financial and operating flexibility for purposes of funding its pension plans, returning capital to shareholders, managing its investments and eliminating direct and indirect costs related to the Credit Agreement. All liens and security interests under the Credit Agreement were released and no early termination penalties were incurred by the Company as a result of the termination. Unamortized debt issuance costs of
$401
were recorded to interest expense in the first quarter of 2013 as a result of the termination.
Contractual Obligations
The table below sets forth the summarized commitments of the Company as of
December 31, 2013
. See the Consolidated Financial Statements,
Note 13 – Commitments
.
|
Total
|
2014
|
2015
|
2016
|
2017
|
2018
|
Thereafter
|
|||||||||||||||||||||
|
Operating lease commitments
|
$
|
2,960
|
|
$
|
1,359
|
|
$
|
629
|
|
$
|
469
|
|
$
|
370
|
|
$
|
133
|
|
$
|
—
|
|
||||||
|
Capital commitments
|
2,172
|
|
2,172
|
|
—
|
|
—
|
|
—
|
|
—
|
|
—
|
|
|||||||||||||
|
Total commitments
|
$
|
5,132
|
|
$
|
3,531
|
|
$
|
629
|
|
$
|
469
|
|
$
|
370
|
|
$
|
133
|
|
$
|
—
|
|
||||||
The Company expects to make required contributions of approximately
$10,000
to its pension plans in
2014
.
On
November 14, 2013
, the Company announced an
$0.08
per share dividend to shareholders of record and holders of RSUs as of the close of business on
February 14, 2014
, which was paid on
March 7, 2014
.
A. H. Belo has exposure to changes in the price of newsprint. The Company does not engage in the purchase of derivative contracts to hedge against price fluctuations that may occur. See “Item 7 – Management’s Discussion and Analysis of Financial Condition and Results of Operations” for further discussion of this risk.
The investment assets and actuarial liabilities associated with the A. H. Belo Pension Plans are impacted by market factors such as interest rates, inflation and the overall economic environment. Changes in these risk factors could have a direct and material impact on the funded status of the A. H. Belo Pension Plans and the level of funding the Company is required to meet each year.
The Consolidated Financial Statements, together with the Report of Independent Registered Public Accounting Firm, are included elsewhere in this Annual Report on Form 10-K.
None.
Evaluation of Disclosure Controls and Procedures
The Company maintains “disclosure controls and procedures,” as such term is defined in Rules 13a-15(e) under the Exchange Act, that are designed to ensure that information required to be disclosed by the Company in reports filed or submitted under the Exchange Act is recorded, processed, summarized and reported within the time periods specified in SEC rules and forms, and that such information is accumulated and communicated to management, including the Company’s Chief Executive Officer and Chief Financial Officer, as appropriate, to allow timely decisions regarding required disclosure. In designing and evaluating these disclosure controls and procedures, management recognized that disclosure controls and procedures, no matter how well conceived and operated, can provide only reasonable, not absolute, assurance that the objectives of the disclosure controls and procedures are met. Additionally, in designing disclosure controls and procedures, management necessarily was required to apply its judgment in evaluating the cost-benefit relationship of possible disclosure controls and procedures. The design of any disclosure controls and procedures is also based, in part, upon certain assumptions about the likelihood of future events and there can be no assurance that any design will succeed in achieving its stated goals under all potential future conditions.
|
A. H. Belo Corporation 2013 Annual Report on Form 10-K
|
PAGE 31
|
|
The Company’s management, with the participation of its Chief Executive Officer and Chief Financial Officer, evaluated the effectiveness of the design and operation of its disclosure controls and procedures as of
December 31, 2013
. Based on that evaluation, management concluded that, as of such date, the Company’s disclosure controls and procedures were effective.
Management’s Report on Internal Control Over Financial Reporting
The management of A. H. Belo is responsible for establishing and maintaining adequate internal control over financial reporting. The Company’s internal control system was designed to provide reasonable assurance to management and the board of directors regarding the preparation and fair presentation of published financial statements. Under the supervision and with the participation of management, including the Chief Executive Officer and Chief Financial Officer, an assessment of the effectiveness of internal control over financial reporting was conducted as of
December 31, 2013
. In making this assessment, management used the criteria set forth by the Committee of Sponsoring Organizations of the Treadway Commission (“COSO”) in Internal Control – Integrated Framework. Based on this assessment using the criteria set forth by COSO in Internal Control – Integrated Framework, management concluded that internal control over financial reporting was effective as of
December 31, 2013
.
Audit Opinion on Internal Control over Financial Reporting
The effectiveness of the Company’s internal control over financial reporting was audited by KPMG LLP, an independent registered public accounting firm, as stated in their report, which is included herein on page 40 of this Form 10-K, which is incorporated by reference herein.
Changes in Internal Control Over Financial Reporting
There were no changes in the Company’s internal control over financial reporting during the fiscal quarter ended
December 31, 2013
, that materially affected, or are reasonably likely to materially affect, the Company’s internal control over financial reporting.
None.
|
PAGE 32
|
A. H. Belo Corporation 2013 Annual Report on Form 10-K
|
The information set forth under the headings “A. H. Belo Corporation Stock Ownership – Section 16(a) Beneficial Ownership Reporting Compliance,” “Proposal One: Election of Directors,” “Corporate Governance – Committees of the Board –
Audit Committee,”
“Corporate Governance – Committees of the Board –
Nominating and Corporate Governance Committee,”
and “Executive Officers” contained in the definitive Proxy Statement for the Company’s Annual Meeting of Shareholders to be held on
May 15, 2014
, is incorporated herein by reference.
A. H. Belo has adopted a Code of Business Conduct and Ethics that applies to all directors, officers and employees, which can be found at the Company’s website,
www.ahbelo.com
. The Company will post any amendments to the Code of Business Conduct and Ethics, as well as any waivers that are required to be disclosed by the rules of either the SEC or the New York Stock Exchange, on the Company’s website. Information on A. H. Belo’s website is not incorporated by reference into this Annual Report on Form 10-K.
The Company’s board of directors adopted Corporate Governance Guidelines and charters for the Audit, Compensation and Nominating and Governance Committees of the Board of Directors. These documents can be found at the Company’s website,
www.ahbelo.com
.
Shareholders can also obtain, without charge, printed copies of any of the materials referred to above by contacting the Company at the following address:
A. H. Belo Corporation
P. O. Box 224866
Dallas, Texas 75222-4866
Attn: Corporate Secretary
Telephone:
(214) 977-8200
The information set forth under the headings “Executive Compensation – Compensation Discussion and Analysis, – Compensation Committee Report, – Summary Compensation Table, – Grants of Plan-Based Awards in
2013
, – Outstanding A. H. Belo Equity Awards at Fiscal Year-End
2013
, – Option Exercises and Stock Vested in
2013
, – Post-Employment Benefits, – Pension Benefits at
December 31, 2013
, – Non-Qualified Deferred Compensation for
2013
, – Change in Control Arrangements and Other Agreements Upon Termination of Employment, – Potential Payments on Change in Control or Upon Termination of Employment at
December 31, 2013
,” “Corporate Governance – Compensation Committee Interlocks and Insider Participation,” “Director Compensation” and “Corporate Governance – Committees of the Board –
Compensation Committee
” contained in the definitive Proxy Statement for the Company’s Annual Meeting of Shareholders to be held on
May 15, 2014
, is incorporated herein by reference.
The information set forth under the headings “A. H. Belo Corporation Stock Ownership” contained in the definitive Proxy Statement for the Company’s Annual Meeting of Shareholders to be held on
May 15, 2014
, is incorporated herein by reference.
Information regarding the number of shares of common stock authorized for issuance under the Company’s equity compensation plans is included in the Consolidated Financial Statements,
Note 6 – Long-term Incentive Plans
.
The information set forth under the heading “Certain Relationships” and “Corporate Governance – Director Independence” contained in the definitive Proxy Statement for the Company’s Annual Meeting of Shareholders to be held on
May 15, 2014
, is incorporated herein by reference.
In connection with the Distribution, A. H. Belo entered into various agreements with its former parent company, whereby certain specified services would be furnished to each other. As of December 31, 2013, the exchange of services had concluded. Payments made or other consideration provided in connection with all transactions between the Company and its former parent company were conducted on an arm’s-length basis.
|
A. H. Belo Corporation 2013 Annual Report on Form 10-K
|
PAGE 33
|
|
Concurrent with the Distribution certain previously acquired real estate properties in downtown Dallas were transferred to Belo Investment, LLC, an entity holding various investments in which the Company and its former parent each received a 50 percent interest. Through December 31, 2011, the Company accounted for its interest in Belo Investment under the equity method of accounting. On December 31, 2011, Belo Investment transferred four of its real estate properties to a newly formed subsidiary, AHC Dallas Properties, LLC. The Company entered into a nontaxable, non-monetary exchange arrangement with Belo Investment whereby it yielded its interests in Belo Investment in exchange for 100 percent of the holdings in AHC Dallas Properties, LLC and assumed an $800 liability for capital repairs for certain properties retained by Belo Investment. The asset distribution was based on an equitable allocation of the properties using values established by third party independent appraisals. The Company determined that as a result of its continuing interests in these properties, the exchange should be accounted for at the lower of fair value or historical carrying value. Accordingly, $11,191 of fixed assets and $90 of other assets received by AHC Dallas Properties, LLC in the exchange were consolidated in the Company’s 2011 financial statements and the Company recorded a non-operating loss on its investment in 2011 of $5,018 in other expense.
On January 1, 2011, the Company established the A. H. Belo Pension Plans, which provides benefits to approximately 4,100 current and former employees of the Company. A. H. Belo Pension Plan I provides benefits to certain employees primarily employed with
The Dallas Morning News
or the A. H. Belo corporate offices. A. H. Belo Pension Plan II provides benefits to certain employees at
The Providence Journal
. Assets and obligations of these plans were transferred from a defined benefit plan of the former parent company in the fourth quarter of 2010. In 2011, the Company settled the transfer of all assets and obligations from the defined benefit plan of the former parent company to the A. H. Belo Pension Plans. See the Consolidated Financial Statements,
Note 10 – Pension and Other Retirement Plans
.
The information set forth under the heading “Proposal Two: Ratification of the Appointment of Independent Registered Public Accounting Firm” contained in the definitive Proxy Statement for the Company’s Annual Meeting of Shareholders to be held on
May 15, 2014
, is incorporated herein by reference.
|
PAGE 34
|
A. H. Belo Corporation 2013 Annual Report on Form 10-K
|
|
(a)
|
(1) The consolidated financial statements listed in the Index to Consolidated Financial Statements included in the table of contents are filed as part of this report.
|
(2) All financial statement schedules were omitted because they are not applicable, are not required, or the required information is shown in the consolidated financial statements or notes thereto.
(3) Exhibits:
Exhibits marked with an asterisk (*) are incorporated by reference to documents previously filed by the Company with the SEC, as indicated. In accordance with Regulation S-T, the XBRL-related information marked with a double asterisk (**) in Exhibit No. 101 to this Annual Report on Form 10-K is deemed filed. All other documents are filed with this report. Exhibits marked with a tilde (~) are management contracts, compensatory plan contracts or arrangements filed pursuant to Item 601(b)(10)(iii)(A) of Regulation S-K.
|
Exhibit Number
|
Description
|
||||
|
3.1
|
*
|
Amended and Restated Certificate of Incorporation of the Company (Exhibit 3.1 to Amendment No. 3 to the Company’s Form 10 dated January 18, 2008 (Securities and Exchange Commission File No. 001‑33741) (the “Third Amendment to Form 10”))
|
|||
|
3.2
|
*
|
Certificate of Designations of Series A Junior Participating Preferred Stock of the Company dated January 11, 2008 (Exhibit 3.2 to Post‑Effective Amendment No. 1 to Form 10 filed January 31, 2008 (Securities and Exchange Commission File No. 001‑33741))
|
|||
|
3.3
|
*
|
Amended and Restated Bylaws of the Company, effective January 11, 2008 (Exhibit 3.3 to the Third Amendment to Form 10)
|
|||
|
(1)
|
*
|
Amendment No. 1, effective June 17, 2013, to Amended and Restated Bylaws of A. H. Belo Corporation (Exhibit 3.1 to A. H. Belo Corporation’s Current Report on Form 8-K filed with the Securities and Exchange Commission on June 19, 2013, (Securities and Exchange Commission File No. 001-33741) (the “June 19, 2013 Form 8-K”))
|
|||
|
4.1
|
*
|
Certain rights of the holders of the Company’s Common Stock set forth in Exhibits 3.1‑3.3 above
|
|||
|
4.2
|
*
|
Specimen Form of Certificate representing shares of the Company’s Series A Common Stock (Exhibit 4.2 to the Third Amendment to Form 10)
|
|||
|
4.3
|
*
|
Specimen Form of Certificate representing shares of the Company’s Series B Common Stock (Exhibit 4.3 to the Third Amendment to Form 10)
|
|||
|
4.4
|
*
|
Rights Agreement dated as of January 11, 2008 between the Company and Mellon Investor Services LLC (Exhibit 4.4 to the Third Amendment to Form 10)
|
|||
|
10.1
|
*
|
Material Contracts
|
|||
|
~(1)
|
*
|
Asset Purchase Agreement by and between the Press-Enterprise Company, AHC California Properties LLC, A. H. Belo Management Services, Inc. and Freedom Communications Holdings, Inc. dated October 9, 2013 (Exhibit 10.1 to A. H. Belo Corporation’s Current Report on Form 8-K filed with the Securities and Exchange Commission on October 11, 2013 (Securities and Exchange Commission file no. 001-33741) (the “October 11, 2013 Form 8-K”))
|
|||
|
~(2)
|
*
|
Form of Limited Guaranty by and between A. H. Belo Corporation and Freedom Communications Holdings, Inc (Exhibit 10.2 to the October 11, 2013 Form 8-K)
|
|||
|
~(3)
|
*
|
Amendment No. 1 to Asset Purchase Agreement dated October 31, 2013, between the Press-Enterprise Company, AHC California Properties LLC, A. H. Belo Management Services, Inc. and Freedom Communications Holdings Inc. (Exhibit 10.1 to A. H. Belo Corporation’s Current Report on Form 8-K filed with the Securities and Exchange Commission on November 4, 2013 (Securities and Exchange Commission file no. 001-33741))
|
|||
|
~(4)
|
*
|
Amendment No. 2 to Asset Purchase Agreement dated November 21, 2013, between the Press-Enterprise Company, AHC California Properties LLC, A. H. Belo Management Services, Inc. and Freedom Communications Holdings Inc. (Exhibit 10.1 to A. H. Belo Corporation’s Current Report on Form 8-K filed with the Securities and Exchange Commission on November 25, 2013 (Securities and Exchange Commission file no. 001-33741))
|
|||
|
A. H. Belo Corporation 2013 Annual Report on Form 10-K
|
PAGE 35
|
|
|
Exhibit Number
|
Description
|
||||
|
10.2
|
*
|
Compensatory plans and arrangements:
|
|||
|
~(1)
|
*
|
A. H. Belo Corporation Savings Plan (Exhibit 10.4 to the February 12, 2008 Form 8‑K)
|
|||
|
*
|
(a)
|
First Amendment to the A. H. Belo Savings Plan dated September 23, 2008 (Exhibit 10.2(1)(a) to the Company’s Quarterly Report on Form 10‑Q filed with the Securities and Exchange Commission on November 14, 2008 (Securities and Exchange Commission File No. 001‑33741))
|
|||
|
*
|
(b)
|
Second Amendment to the A. H. Belo Savings Plan effective March 27, 2009 (Exhibit 10.1 to the Company’s Current Report on Form 8‑K filed with the Securities and Exchange Commission on April 2, 2009 (Securities and Exchange Commission File No. 001‑33741) (the “April 2, 2009 Form 8‑K”))
|
|||
|
*
|
(c)
|
Third Amendment to the A. H. Belo Savings Plan effective March 31, 2009 (Exhibit 10.2 to the April 2, 2009 Form 8‑K)
|
|||
|
*
|
(d)
|
Fourth Amendment to the A. H. Belo Savings Plan dated September 10, 2009 (Exhibit 10.1 to the Company’s Current Report on Form 8‑K filed with the Securities and Exchange Commission on September 10, 2009 (Securities and Exchange Commission File No. 001‑33741))
|
|||
|
~(2)
|
*
|
A. H. Belo Corporation 2008 Incentive Compensation Plan (Exhibit 10.5 to the February 12, 2008 Form 8‑K)
|
|||
|
*
|
(a)
|
First Amendment to A. H. Belo 2008 Incentive Compensation Plan effective July 23, 2008 (Exhibit 10.2(2)(a) to the Company’s Quarterly Report on Form 10‑Q filed with the Securities and Exchange Commission on August 14, 2008 (Securities and Exchange Commission File No. 001‑33741))
|
|||
|
*
|
(b)
|
Form of A. H. Belo 2008 Incentive Compensation Plan Non‑Employee Director Evidence of Grant (for Non‑Employee Director Awards) (Exhibit 10.2(2)(b) to the Company’s Quarterly Report on Form 10‑Q filed with the Securities and Exchange Commission on May 13, 2010 (Securities and Exchange Commission File No. 001‑33741) (the “1st Quarter 2010 Form 10‑Q”))
|
|||
|
*
|
(c)
|
Form of A. H. Belo 2008 Incentive Compensation Plan Evidence of Grant (for Employee Awards) (Exhibit 10.2(2)(c) to the 1st Quarter 2010 Form 10‑Q)
|
|||
|
*
|
(d)
|
Form of A. H. Belo 2008 Incentive Compensation Plan Evidence of Grant (Exhibit 10.1 to A. H. Belo Corporation’s Current Report on Form 8‑K filed with the Securities and Exchange Commission on March 12, 2012 (Securities and Exchange Commission File No. 001‑33741) (the “March 12, 2012 Form 8-K”))
|
|||
|
*
|
(e)
|
Form of A. H. Belo Cash Long‑Term Incentive Evidence of Grant (Exhibit 10.2 to the March 12, 2012 Form 8-K)
|
|||
|
~(3)
|
*
|
A. H. Belo Pension Transition Supplement Restoration Plan effective January 1, 2008 (Exhibit 10.6 to the February 12, 2008 Form 8‑K)
|
|||
|
*
|
(a)
|
First Amendment to the A. H. Belo Pension Transition Supplement Restoration Plan dated March 31, 2009 (Exhibit 10.4 to the April 2, 2009 Form 8‑K)
|
|||
|
~(4)
|
*
|
A. H. Belo Corporation Change In Control Severance Plan (Exhibit 10.7 to the February 12, 2008 Form 8‑K)
|
|||
|
*
|
(a)
|
Amendment to the A. H. Belo Change in Control Severance Plan dated March 31, 2009 (Exhibit 10.3 to the April 2, 2009 Form 8‑K)
|
|||
|
~(5)
|
*
|
Robert W. Decherd Compensation Arrangements dated June 19, 2013 (Exhibit 10.1 to the June 19, 2013 Form 8-K)
|
|||
|
PAGE 36
|
A. H. Belo Corporation 2013 Annual Report on Form 10-K
|
|
Exhibit Number
|
Description
|
||||
|
10.3
|
Agreements relating to the Distribution of A. H. Belo:
|
||||
|
(1)
|
*
|
Tax Matters Agreement by and between Belo Corp. and A. H. Belo Corporation dated as of February 8, 2008 (Exhibit 10.1 to the February 12, 2008 Form 8‑K)
|
|||
|
*
|
(a)
|
First Amendment to Tax Matters Agreement by and between Belo Corp. and A. H. Belo Corporation dated September 14, 2009 (Exhibit 10.1 to the Company’s Current Report on Form 8‑K filed with the Securities and Exchange Commission on September 15, 2009 (Securities and Exchange Commission file No. 00‑00371))
|
|||
|
(2)
|
*
|
Employee Matters Agreement by and between Belo Corp. and A. H. Belo Corporation dated as of February 8, 2008 (Exhibit 10.2 to the February 12, 2008 Form 8‑K)
|
|||
|
*
|
(a)
|
Amendment to Employee Matters Agreement as set forth in the Pension Plan Transfer Agreement dated as of October 6, 2010 (Exhibit 10.1 to the Company’s Report on Form 8‑K filed with the Securities and Exchange Commission on October 8, 2010 (Securities and Exchange Commission File No. 001‑33741)) (the “October 8, 2010 Form 8‑K”))
|
|||
|
(3)
|
*
|
Services Agreement by and between Belo Corp. and A. H. Belo Corporation dated as of February 8, 2008 (Exhibit 10.3 to the February 12, 2008 Form 8‑K)
|
|||
|
(4)
|
*
|
Separation and Distribution Agreement by and between Belo Corp. and A. H. Belo Corporation dated as of February 8, 2008 (Exhibit 2.1 to the February 12, 2008 Form 8‑K)
|
|||
|
(5)
|
*
|
Pension Plan Transfer Agreement by and between Belo Corp. and A. H. Belo Corporation dated as of October 6, 2010 (Exhibit 10.1 to the Company’s current Report on Form 8‑K filed with the Securities and Exchange Commission (October 8, 2010 Form 8‑K))
|
|||
|
(6)
|
*
|
Agreement among the Company, Belo Corp., and The Pension Benefit Guaranty Corporation, effective March 9, 2011 (Exhibit 10.3(6) to the Company’s Annual Report on Form 10‑K filed with the Securities and Exchange Commission on March 11, 2011 (Securities and Exchange Commission File No. 001‑33741))
|
|||
|
12
|
Computation of Ratio of Earnings to Fixed Charges
|
||||
|
21
|
Subsidiaries of the Company
|
||||
|
23.1
|
Consent of KPMG LLP
|
||||
|
23.2
|
Consent of PricewaterhouseCoopers LLP
|
||||
|
24
|
Power of Attorney (set forth on the signature page(s) hereof)
|
||||
|
31.1
|
Certification of Chief Executive Officer pursuant to Section 302 of the Sarbanes‑Oxley Act of 2002
|
||||
|
31.2
|
Certification of Chief Financial Officer pursuant to Section 302 of the Sarbanes‑Oxley Act of 2002
|
||||
|
32
|
Certifications of Chief Executive Officer and Chief Financial Officer pursuant to 18 U.S.C. Section 1350, as adopted pursuant to Section 906 of the Sarbanes‑Oxley Act of 2002
|
||||
|
99
|
Classified Ventures, LLC financial statements
|
||||
|
101.INS
|
**
|
XBRL Instance Document
|
|||
|
101.SCH
|
**
|
XBRL Taxonomy Extension Schema
|
|||
|
101.CAL
|
**
|
XBRL Taxonomy Extension Calculation Linkbase Document
|
|||
|
101.DEF
|
**
|
XBRL Taxonomy Extension Definition Linkbase Document
|
|||
|
101.LAB
|
**
|
XBRL Taxonomy Extension Label Linkbase Document
|
|||
|
101.PRE
|
**
|
XBRL Taxonomy Extension Presentation Linkbase Document
|
|||
|
A. H. Belo Corporation 2013 Annual Report on Form 10-K
|
PAGE 37
|
|
SIGNATURES
Pursuant to the requirements of Section 13 or 15(d) of the Securities Exchange Act of 1934, the Company has duly caused this report to be signed on its behalf by the undersigned, thereunto duly authorized.
|
A. H. BELO CORPORATION
|
|||
|
By:
|
/s/
|
James M. Moroney III
|
|
|
James M. Moroney III
|
|||
|
Chairman of the Board, President and Chief
|
|||
|
Executive Officer
|
|||
|
Dated:
|
March 7, 2014
|
||
|
PAGE 38
|
A. H. Belo Corporation 2013 Annual Report on Form 10-K
|
Exhibit 24
POWER OF ATTORNEY
The undersigned hereby constitute and appoint James M. Moroney III, Alison K. Engel and Daniel J. Blizzard, and each of them and their substitutes, our true and lawful attorneys-in-fact with full power to execute in our name and behalf in the capacities indicated below any and all amendments to this report and to file the same, with all exhibits thereto and other documents in connection therewith, with the Securities and Exchange Commission, and hereby ratify and confirm all that such attorneys-in-fact, or any of them, or their substitutes shall lawfully do or cause to be done by virtue thereof.
Pursuant to the requirements of the Securities Exchange Act of 1934, this report has been signed below by the following persons on behalf of the Company and in the capacities and on the dates indicated:
|
Signature
|
Title
|
Date
|
||
|
/s/ James M. Moroney III
|
Chairman of the Board, President and
Chief Executive Officer
|
March 7, 2014
|
||
|
James M. Moroney III
|
||||
|
/s/ Robert W. Decherd
|
Director
|
March 7, 2014
|
||
|
Robert W. Decherd
|
||||
|
/s/ John A. Beckert
|
Director
|
March 7, 2014
|
||
|
John A. Beckert
|
||||
|
/s/ Louis E. Caldera
|
Director
|
March 7, 2014
|
||
|
Louis E. Caldera
|
||||
|
/s/ Dealey D. Herndon
|
Director
|
March 7, 2014
|
||
|
Dealey D. Herndon
|
||||
|
/s/ Ronald D. McCray
|
Director
|
March 7, 2014
|
||
|
Ronald D. McCray
|
||||
|
/s/ Tyree B. Miller
|
Director
|
March 7, 2014
|
||
|
Tyree B. Miller
|
||||
|
/s/ John P. Puerner
|
Director
|
March 7, 2014
|
||
|
John P. Puerner
|
||||
|
/s/ Nicole G. Small
|
Director
|
March 7, 2014
|
||
|
Nicole G. Small
|
||||
|
/s/ Alison K. Engel
|
Senior Vice President/
Chief Financial Officer
(Principal Financial Officer)
|
March 7, 2014
|
||
|
Alison K. Engel
|
||||
|
/s/ Michael N. Lavey
|
Vice President/
Controller
(Principal Accounting Officer)
|
March 7, 2014
|
||
|
Michael N. Lavey
|
||||
|
A. H. Belo Corporation 2013 Annual Report on Form 10-K
|
PAGE 39
|
|

Report of Independent Registered Public Accounting Firm
The Board of Directors and Shareholders
A. H. Belo Corporation:
We have audited the accompanying consolidated balance sheets of A. H. Belo Corporation and subsidiaries as of December 31, 2013 and 2012, and the related consolidated statements of operations, comprehensive loss, shareholders’ equity, and cash flows for each of the years in the three-year period ended December 31, 2013. We also have audited A. H. Belo Corporation’s internal control over financial reporting as of December 31, 2013, based on criteria established in
Internal Control - Integrated Framework (1992)
issued by the Committee of Sponsoring Organizations of the Treadway Commission (COSO). A. H. Belo Corporation’s management is responsible for these consolidated financial statements, for maintaining effective internal control over financial reporting, and for its assessment of the effectiveness of internal control over financial reporting, included in the accompanying Management’s Report on Internal Control Over Financial Reporting. Our responsibility is to express an opinion on these consolidated financial statements and an opinion on the Company’s internal control over financial reporting based on our audits.
We conducted our audits in accordance with the standards of the Public Company Accounting Oversight Board (United States). Those standards require that we plan and perform the audits to obtain reasonable assurance about whether the financial statements are free of material misstatement and whether effective internal control over financial reporting was maintained in all material respects. Our audits of the consolidated financial statements included examining, on a test basis, evidence supporting the amounts and disclosures in the financial statements, assessing the accounting principles used and significant estimates made by management, and evaluating the overall financial statement presentation. Our audit of internal control over financial reporting included obtaining an understanding of internal control over financial reporting, assessing the risk that a material weakness exists, and testing and evaluating the design and operating effectiveness of internal control based on the assessed risk. Our audits also included performing such other procedures as we considered necessary in the circumstances. We believe that our audits provide a reasonable basis for our opinions.
A company’s internal control over financial reporting is a process designed to provide reasonable assurance regarding the reliability of financial reporting and the preparation of financial statements for external purposes in accordance with generally accepted accounting principles. A company’s internal control over financial reporting includes those policies and procedures that (1) pertain to the maintenance of records that, in reasonable detail, accurately and fairly reflect the transactions and dispositions of the assets of the company; (2) provide reasonable assurance that transactions are recorded as necessary to permit preparation of financial statements in accordance with generally accepted accounting principles, and that receipts and expenditures of the company are being made only in accordance with authorizations of management and directors of the company; and (3) provide reasonable assurance regarding prevention or timely detection of unauthorized acquisition, use, or disposition of the company’s assets that could have a material effect on the financial statements.
Because of its inherent limitations, internal control over financial reporting may not prevent or detect misstatements. Also, projections of any evaluation of effectiveness to future periods are subject to the risk that controls may become inadequate because of changes in conditions, or that the degree of compliance with the policies or procedures may deteriorate.
In our opinion, the consolidated financial statements referred to above present fairly, in all material respects, the financial position of A. H. Belo Corporation and subsidiaries as of December 31, 2013 and 2012, and the results of their operations and their cash flows for each of the years in the three-year period ended December 31, 2013, in conformity with U.S. generally accepted accounting principles. Also in our opinion, A. H. Belo Corporation maintained, in all material respects, effective internal control over financial reporting as of December 31, 2013, based on criteria established in
Internal Control - Integrated Framework (1992)
issued by COSO.

Dallas, Texas
March 7, 2014
|
PAGE 40
|
A. H. Belo Corporation 2013 Annual Report on Form 10-K
|
A. H. Belo Corporation and Subsidiaries
|
December 31,
|
|||||||||||
|
In thousands, except share and per share amounts
|
2013
|
2012
|
2011
|
||||||||
|
Net Operating Revenue
|
|||||||||||
|
Advertising and marketing services
|
$
|
208,959
|
|
$
|
216,108
|
|
$
|
237,061
|
|
||
|
Circulation
|
120,316
|
|
123,224
|
|
126,290
|
|
|||||
|
Printing and distribution
|
36,975
|
|
35,358
|
|
30,845
|
|
|||||
|
Total net operating revenue
|
366,250
|
|
374,690
|
|
394,196
|
|
|||||
|
Operating Costs and Expense
|
|||||||||||
|
Employee compensation and benefits
|
146,307
|
|
152,523
|
|
160,874
|
|
|||||
|
Other production, distribution and operating costs
|
140,230
|
|
139,566
|
|
146,836
|
|
|||||
|
Newsprint, ink and other supplies
|
50,810
|
|
49,401
|
|
48,690
|
|
|||||
|
Depreciation
|
18,079
|
|
21,401
|
|
24,850
|
|
|||||
|
Amortization
|
4,493
|
|
4,373
|
|
4,373
|
|
|||||
|
Asset impairments
|
—
|
|
—
|
|
872
|
|
|||||
|
Pension plan withdrawal
|
—
|
|
—
|
|
1,988
|
|
|||||
|
Total operating costs and expense
|
359,919
|
|
367,264
|
|
388,483
|
|
|||||
|
Income from operations
|
6,331
|
|
7,426
|
|
5,713
|
|
|||||
|
Other Income (Expense), Net
|
|||||||||||
|
Other income (expense), net
|
2,721
|
|
3,380
|
|
(294
|
)
|
|||||
|
Interest expense
|
(311
|
)
|
(629
|
)
|
(668
|
)
|
|||||
|
Total other income (expense), net
|
2,410
|
|
2,751
|
|
(962
|
)
|
|||||
|
Income from Continuing Operations Before Income Taxes
|
8,741
|
|
10,177
|
|
4,751
|
|
|||||
|
Income tax provision
|
1,584
|
|
1,804
|
|
5,107
|
|
|||||
|
Income (Loss) from Continuing Operations
|
7,157
|
|
8,373
|
|
(356
|
)
|
|||||
|
Loss from discontinued operations
|
(4,700
|
)
|
(8,026
|
)
|
(10,673
|
)
|
|||||
|
Gain related to the divestiture of discontinued operations
|
13,402
|
|
—
|
|
—
|
|
|||||
|
Tax benefit from discontinued operations
|
(67
|
)
|
(72
|
)
|
(96
|
)
|
|||||
|
Income (Loss) from Discontinued Operations, Net
|
8,769
|
|
(7,954
|
)
|
(10,577
|
)
|
|||||
|
Net Income (Loss)
|
15,926
|
|
419
|
|
(10,933
|
)
|
|||||
|
Net loss attributable to noncontrolling interests
|
(193
|
)
|
(107
|
)
|
—
|
|
|||||
|
Net Income (Loss) Attributable to A. H. Belo Corporation
|
$
|
16,119
|
|
$
|
526
|
|
$
|
(10,933
|
)
|
||
|
Per Share Basis
|
|||||||||||
|
Basic and Diluted
|
|||||||||||
|
Continuing operations
|
$
|
0.31
|
|
$
|
0.37
|
|
$
|
(0.03
|
)
|
||
|
Discontinued operations
|
0.40
|
|
(0.36
|
)
|
(0.48
|
)
|
|||||
|
Net income (loss) attributable to A. H. Belo Corporation
|
$
|
0.71
|
|
$
|
0.01
|
|
$
|
(0.51
|
)
|
||
|
Weighted average shares outstanding
|
|||||||||||
|
Basic
|
21,967,666
|
|
21,947,981
|
|
21,495,814
|
|
|||||
|
Diluted
|
22,063,741
|
|
22,065,856
|
|
21,495,814
|
|
|||||
See accompanying Notes to Consolidated Financial Statements.
|
A. H. Belo Corporation 2013 Annual Report on Form 10-K
|
PAGE 41
|
|
A. H. Belo Corporation and Subsidiaries
Consolidated Statements of Comprehensive Income (Loss)
|
December 31,
|
|||||||||||
|
In thousands
|
2013
|
2012
|
2011
|
||||||||
|
Net Income (Loss)
|
$
|
15,926
|
|
$
|
419
|
|
$
|
(10,933
|
)
|
||
|
Other Comprehensive Income (Loss), Net of Tax:
|
|||||||||||
|
Actuarial gains (losses)
|
57,458
|
|
(10,495
|
)
|
(64,989
|
)
|
|||||
|
Amortization of net actuarial gains (losses)
|
981
|
|
32
|
|
(649
|
)
|
|||||
|
Total other comprehensive income (loss)
|
58,439
|
|
(10,463
|
)
|
(65,638
|
)
|
|||||
|
Comprehensive Income (Loss)
|
74,365
|
|
(10,044
|
)
|
(76,571
|
)
|
|||||
|
Comprehensive loss attributable to noncontrolling interests
|
(193
|
)
|
(107
|
)
|
—
|
|
|||||
|
Total Comprehensive Income (Loss) Attributable to A. H. Belo Corporation
|
$
|
74,558
|
|
$
|
(9,937
|
)
|
$
|
(76,571
|
)
|
||
See accompanying Notes to Consolidated Financial Statements.
|
PAGE 42
|
A. H. Belo Corporation 2013 Annual Report on Form 10-K
|
A. H. Belo Corporation and Subsidiaries
|
December 31,
|
|||||||
|
In thousands, except share amounts
|
2013
|
2012
|
|||||
|
Assets
|
|||||||
|
Current assets:
|
|||||||
|
Cash and cash equivalents
|
$
|
82,193
|
|
$
|
34,094
|
|
|
|
Accounts receivable (net of allowance of $1,248 and $2,034
at December 31, 2013 and 2012, respectively) |
41,174
|
|
39,212
|
|
|||
|
Inventories
|
8,180
|
|
7,585
|
|
|||
|
Prepaids and other current assets
|
7,444
|
|
6,547
|
|
|||
|
Deferred income taxes, net
|
61
|
|
1,496
|
|
|||
|
Assets of discontinued operations
|
1,633
|
|
48,402
|
|
|||
|
Total current assets
|
140,685
|
|
137,336
|
|
|||
|
Property, plant and equipment, at cost:
|
|||||||
|
Land
|
30,834
|
|
31,212
|
|
|||
|
Buildings and improvements
|
169,266
|
|
170,554
|
|
|||
|
Publishing equipment
|
250,596
|
|
248,769
|
|
|||
|
Other
|
92,590
|
|
112,608
|
|
|||
|
Construction in process
|
920
|
|
3,050
|
|
|||
|
Property, plant and equipment, at cost
|
544,206
|
|
566,193
|
|
|||
|
Less accumulated depreciation
|
(447,094
|
)
|
(457,339
|
)
|
|||
|
Property, plant and equipment, net
|
97,112
|
|
108,854
|
|
|||
|
Intangible assets, net
|
5,342
|
|
9,473
|
|
|||
|
Goodwill
|
24,582
|
|
24,582
|
|
|||
|
Investments
|
7,333
|
|
6,826
|
|
|||
|
Deferred income taxes, net
|
538
|
|
1,113
|
|
|||
|
Other assets
|
3,626
|
|
3,755
|
|
|||
|
Total assets
|
$
|
279,218
|
|
$
|
291,939
|
|
|
|
Liabilities and Shareholders’ Equity
|
|||||||
|
Current liabilities:
|
|||||||
|
Accounts payable
|
$
|
15,488
|
|
$
|
13,635
|
|
|
|
Accrued compensation and benefits
|
12,308
|
|
17,020
|
|
|||
|
Other accrued expense
|
5,332
|
|
5,804
|
|
|||
|
Advance subscription payments
|
19,184
|
|
17,693
|
|
|||
|
Liabilities of discontinued operations
|
2,028
|
|
7,781
|
|
|||
|
Total current liabilities
|
54,340
|
|
61,933
|
|
|||
|
Long-term pension liabilities
|
50,082
|
|
122,821
|
|
|||
|
Other post-employment benefits
|
2,757
|
|
2,919
|
|
|||
|
Other liabilities
|
3,263
|
|
2,206
|
|
|||
|
Shareholders’ equity:
|
|||||||
|
Preferred stock, $.01 par value; Authorized 2,000,000 shares; none issued
|
—
|
|
—
|
|
|||
|
Common stock, $.01 par value; Authorized 125,000,000 shares
|
|||||||
|
Series A: issued 19,931,599 and 19,651,830 shares
at December 31, 2013 and 2012, respectively |
199
|
|
197
|
|
|||
|
Series B: issued 2,397,155 and 2,401,556 shares
at December 31, 2013 and 2012, respectively |
24
|
|
24
|
|
|||
|
Treasury stock, Series A, at cost; 495,200 and 74,130 shares held
at December 31, 2013 and 2012, respectively |
(3,113
|
)
|
(350
|
)
|
|||
|
Additional paid-in capital
|
496,682
|
|
495,528
|
|
|||
|
Accumulated other comprehensive loss
|
(15,093
|
)
|
(73,532
|
)
|
|||
|
Accumulated deficit
|
(310,099
|
)
|
(319,862
|
)
|
|||
|
Total shareholders’ equity attributable to A. H. Belo Corporation
|
168,600
|
|
102,005
|
|
|||
|
Noncontrolling interests
|
176
|
|
55
|
|
|||
|
Total shareholders’ equity
|
168,776
|
|
102,060
|
|
|||
|
Total liabilities and shareholders’ equity
|
$
|
279,218
|
|
$
|
291,939
|
|
|
See accompanying Notes to Consolidated Financial Statements.
|
A. H. Belo Corporation 2013 Annual Report on Form 10-K
|
PAGE 43
|
|
A. H. Belo Corporation and Subsidiaries
Consolidated Statements of Shareholders’ Equity
|
Common Stock
|
Treasury Stock
|
||||||||||||||||||||||||||
|
In thousands, except share amounts
|
Shares
Series A |
Shares
Series B |
Amount
|
Additional
Paid-in Capital |
Shares Series A
|
Amount
|
Accumulated
Other Comprehensive Loss |
Accumulated Deficit
|
Non-controlling Interests
|
Total
|
|||||||||||||||||
|
Balance at
December 31, 2010 |
18,896,876
|
|
2,392,074
|
|
$
|
212
|
|
$
|
491,542
|
|
—
|
|
$
|
—
|
|
$
|
2,569
|
|
$
|
(294,450
|
)
|
$
|
—
|
|
$
|
199,873
|
|
|
Net loss
|
—
|
|
—
|
|
—
|
|
—
|
|
—
|
|
—
|
|
—
|
|
(10,933
|
)
|
—
|
|
(10,933
|
)
|
|||||||
|
Other comprehensive loss
|
—
|
|
—
|
|
—
|
|
—
|
|
—
|
|
—
|
|
(65,638
|
)
|
—
|
|
—
|
|
(65,638
|
)
|
|||||||
|
Issuance of shares for restricted stock units
|
244,803
|
|
—
|
|
3
|
|
(3
|
)
|
—
|
|
—
|
|
—
|
|
—
|
|
—
|
|
—
|
|
|||||||
|
Issuance of shares for stock option exercises
|
10,500
|
|
36,000
|
|
1
|
|
95
|
|
—
|
|
—
|
|
—
|
|
—
|
|
—
|
|
96
|
|
|||||||
|
Income tax on options and RSUs
|
—
|
|
—
|
|
—
|
|
(52
|
)
|
—
|
|
—
|
|
—
|
|
—
|
|
—
|
|
(52
|
)
|
|||||||
|
Share-based compensation
|
—
|
|
—
|
|
—
|
|
2,191
|
|
—
|
|
—
|
|
—
|
|
—
|
|
—
|
|
2,191
|
|
|||||||
|
Conversion of Series B to Series A
|
30,057
|
|
(30,057
|
)
|
—
|
|
—
|
|
—
|
|
—
|
|
—
|
|
—
|
|
—
|
|
—
|
|
|||||||
|
Dividends
|
—
|
|
—
|
|
—
|
|
—
|
|
—
|
|
—
|
|
—
|
|
(4,058
|
)
|
—
|
|
(4,058
|
)
|
|||||||
|
Balance at
December 31, 2011 |
19,182,236
|
|
2,398,017
|
|
216
|
|
493,773
|
|
—
|
|
—
|
|
(63,069
|
)
|
(309,441
|
)
|
—
|
|
121,479
|
|
|||||||
|
Net income (loss)
|
—
|
|
—
|
|
—
|
|
—
|
|
—
|
|
—
|
|
—
|
|
526
|
|
(107
|
)
|
419
|
|
|||||||
|
Other comprehensive loss
|
—
|
|
—
|
|
—
|
|
—
|
|
—
|
|
—
|
|
(10,463
|
)
|
—
|
|
—
|
|
(10,463
|
)
|
|||||||
|
Capital contributions of noncontrolling interests
|
—
|
|
—
|
|
—
|
|
—
|
|
—
|
|
—
|
|
—
|
|
—
|
|
162
|
|
162
|
|
|||||||
|
Treasury stock purchases
|
—
|
|
—
|
|
—
|
|
—
|
|
(74,130
|
)
|
(350
|
)
|
—
|
|
—
|
|
—
|
|
(350
|
)
|
|||||||
|
Issuance of shares for restricted stock units
|
319,807
|
|
—
|
|
3
|
|
(3
|
)
|
—
|
|
—
|
|
—
|
|
—
|
|
—
|
|
—
|
|
|||||||
|
Issuance of shares for stock option exercises
|
136,826
|
|
16,500
|
|
2
|
|
298
|
|
—
|
|
—
|
|
—
|
|
—
|
|
—
|
|
300
|
|
|||||||
|
Income tax on options and RSUs
|
—
|
|
—
|
|
—
|
|
173
|
|
—
|
|
—
|
|
—
|
|
—
|
|
—
|
|
173
|
|
|||||||
|
Share-based compensation
|
—
|
|
—
|
|
—
|
|
1,287
|
|
—
|
|
—
|
|
—
|
|
—
|
|
—
|
|
1,287
|
|
|||||||
|
Conversion of Series B to Series A
|
12,961
|
|
(12,961
|
)
|
—
|
|
—
|
|
—
|
|
—
|
|
—
|
|
—
|
|
—
|
|
—
|
|
|||||||
|
Dividends
|
—
|
|
—
|
|
—
|
|
—
|
|
—
|
|
—
|
|
—
|
|
(10,947
|
)
|
—
|
|
(10,947
|
)
|
|||||||
|
Balance at
December 31, 2012 |
19,651,830
|
|
2,401,556
|
|
221
|
|
495,528
|
|
(74,130
|
)
|
(350
|
)
|
(73,532
|
)
|
(319,862
|
)
|
55
|
|
102,060
|
|
|||||||
|
Net income (loss)
|
—
|
|
—
|
|
—
|
|
—
|
|
—
|
|
—
|
|
—
|
|
16,119
|
|
(193
|
)
|
15,926
|
|
|||||||
|
Other comprehensive income
|
—
|
|
—
|
|
—
|
|
—
|
|
—
|
|
—
|
|
58,439
|
|
—
|
|
—
|
|
58,439
|
|
|||||||
|
Capital contributions by noncontrolling interests
|
—
|
|
—
|
|
—
|
|
—
|
|
—
|
|
—
|
|
—
|
|
—
|
|
314
|
|
314
|
|
|||||||
|
Treasury stock purchases
|
—
|
|
—
|
|
—
|
|
—
|
|
(421,070
|
)
|
(2,763
|
)
|
—
|
|
—
|
|
—
|
|
(2,763
|
)
|
|||||||
|
Issuance of shares for restricted stock units
|
256,548
|
|
—
|
|
2
|
|
(2
|
)
|
—
|
|
—
|
|
—
|
|
—
|
|
—
|
|
—
|
|
|||||||
|
Issuance of shares for stock option exercises
|
18,820
|
|
—
|
|
—
|
|
69
|
|
—
|
|
—
|
|
—
|
|
—
|
|
—
|
|
69
|
|
|||||||
|
Income tax on options and RSUs
|
—
|
|
—
|
|
—
|
|
(188
|
)
|
—
|
|
—
|
|
—
|
|
—
|
|
—
|
|
(188
|
)
|
|||||||
|
Share-based compensation
|
—
|
|
—
|
|
—
|
|
1,275
|
|
—
|
|
—
|
|
—
|
|
—
|
|
—
|
|
1,275
|
|
|||||||
|
Conversion of Series B to Series A
|
4,401
|
|
(4,401
|
)
|
—
|
|
—
|
|
—
|
|
—
|
|
—
|
|
—
|
|
—
|
|
—
|
|
|||||||
|
Dividends
|
—
|
|
—
|
|
—
|
|
—
|
|
—
|
|
—
|
|
—
|
|
(6,356
|
)
|
—
|
|
(6,356
|
)
|
|||||||
|
Balance at
December 31, 2013 |
19,931,599
|
|
2,397,155
|
|
$
|
223
|
|
$
|
496,682
|
|
(495,200
|
)
|
$
|
(3,113
|
)
|
$
|
(15,093
|
)
|
$
|
(310,099
|
)
|
$
|
176
|
|
$
|
168,776
|
|
See accompanying Notes to Consolidated Financial Statements.
|
PAGE 44
|
A. H. Belo Corporation 2013 Annual Report on Form 10-K
|
A. H. Belo Corporation and Subsidiaries
|
December 31,
|
|||||||||||
|
In thousands
|
2013
|
2012
|
2011
|
||||||||
|
Operating Activities
|
|||||||||||
|
Net Income (Loss)
|
$
|
15,926
|
|
$
|
419
|
|
$
|
(10,933
|
)
|
||
|
Adjustments to reconcile net income (loss) to net cash provided by (used for) operations:
|
|||||||||||
|
Net (income) loss from discontinued operations
|
(8,769
|
)
|
7,954
|
|
10,577
|
|
|||||
|
Depreciation and amortization
|
22,572
|
|
25,774
|
|
29,223
|
|
|||||
|
Share-based compensation
|
1,227
|
|
1,155
|
|
2,150
|
|
|||||
|
Equity method investment earnings (in excess of) less than dividends received
|
683
|
|
(201
|
)
|
396
|
|
|||||
|
Loss (gain) on disposal of fixed assets
|
(260
|
)
|
(303
|
)
|
349
|
|
|||||
|
Deferred income taxes
|
165
|
|
396
|
|
638
|
|
|||||
|
Gain on recovery of investment
|
—
|
|
(144
|
)
|
(729
|
)
|
|||||
|
Pension plan withdrawal
|
—
|
|
—
|
|
1,988
|
|
|||||
|
Asset impairment
|
—
|
|
—
|
|
872
|
|
|||||
|
Loss on investment related activity, net
|
—
|
|
—
|
|
2,634
|
|
|||||
|
Spare parts inventory write-down
|
—
|
|
—
|
|
1,785
|
|
|||||
|
Other operating activities
|
589
|
|
—
|
|
37
|
|
|||||
|
Net change in assets acquired and held for sale
|
—
|
|
2,396
|
|
(2,396
|
)
|
|||||
|
Pension and other benefit plan contributions in excess of expense
|
(18,718
|
)
|
(34,188
|
)
|
(54,698
|
)
|
|||||
|
Changes in working capital and other operating assets and liabilities, net:
|
|||||||||||
|
Accounts receivable
|
(1,962
|
)
|
1,513
|
|
7,546
|
|
|||||
|
Funds held by former parent for future pension contributions
|
—
|
|
—
|
|
3,410
|
|
|||||
|
Inventories, prepaids and other current assets
|
(132
|
)
|
(528
|
)
|
1,524
|
|
|||||
|
Other assets
|
177
|
|
394
|
|
247
|
|
|||||
|
Accounts payable
|
1,853
|
|
(2,971
|
)
|
(9,918
|
)
|
|||||
|
Compensation and benefit obligations
|
558
|
|
657
|
|
487
|
|
|||||
|
Other accrued expenses
|
(873
|
)
|
(5,036
|
)
|
1,258
|
|
|||||
|
Advance subscription payments
|
1,491
|
|
(1,570
|
)
|
(325
|
)
|
|||||
|
Net cash provided by (used for) continuing operations
|
14,527
|
|
(4,283
|
)
|
(13,878
|
)
|
|||||
|
Net cash provided by (used for) discontinued operations
|
(289
|
)
|
3,099
|
|
(1,282
|
)
|
|||||
|
Net cash provided by (used for) operating activities
|
14,238
|
|
(1,184
|
)
|
(15,160
|
)
|
|||||
|
Investing Activities
|
|||||||||||
|
Capital expenditures, net
|
(6,362
|
)
|
(8,576
|
)
|
(6,972
|
)
|
|||||
|
Proceeds from sale of fixed assets
|
367
|
|
628
|
|
86
|
|
|||||
|
Purchase of investments
|
(1,377
|
)
|
(742
|
)
|
(2,959
|
)
|
|||||
|
Proceeds from the recovery of an impaired investment
|
—
|
|
144
|
|
729
|
|
|||||
|
Investment distribution proceeds
|
—
|
|
—
|
|
59
|
|
|||||
|
Net cash used for continuing investing activities
|
(7,372
|
)
|
(8,546
|
)
|
(9,057
|
)
|
|||||
|
Net cash provided by (used for) discontinued investing activities
|
50,056
|
|
(2,746
|
)
|
(671
|
)
|
|||||
|
Net cash provided by (used for) investing activities
|
42,684
|
|
(11,292
|
)
|
(9,728
|
)
|
|||||
|
Financing Activities
|
|||||||||||
|
Dividends paid
|
(6,356
|
)
|
(10,947
|
)
|
(4,058
|
)
|
|||||
|
Purchase of treasury stock
|
(2,763
|
)
|
(350
|
)
|
—
|
|
|||||
|
Proceeds from exercise of stock options
|
69
|
|
300
|
|
95
|
|
|||||
|
Capital contributions by noncontrolling interests
|
227
|
|
127
|
|
—
|
|
|||||
|
Net cash used for continuing financing activities
|
(8,823
|
)
|
(10,870
|
)
|
(3,963
|
)
|
|||||
|
Net increase (decrease) in cash and cash equivalents
|
48,099
|
|
(23,346
|
)
|
(28,851
|
)
|
|||||
|
Cash and cash equivalents at beginning of period
|
34,094
|
|
57,440
|
|
86,291
|
|
|||||
|
Cash and cash equivalents at end of period
|
$
|
82,193
|
|
$
|
34,094
|
|
$
|
57,440
|
|
||
See accompanying Notes to Consolidated Financial Statements.
|
A. H. Belo Corporation 2013 Annual Report on Form 10-K
|
PAGE 45
|
|
A. H. Belo Corporation and Subsidiaries
Notes to Consolidated Financial Statements
Note 1:
Significant Accounting Policies and Recently Issued Accounting Standards
Description of Business.
A. H. Belo Corporation (“A. H. Belo” or the “Company”), headquartered in Dallas, Texas, is a distinguished newspaper publishing and local news and information company that owns and operates three daily newspapers and related websites. A. H. Belo publishes
The Dallas Morning News (
www.dallasnews.com
)
, Texas’ leading newspaper and winner of nine Pulitzer Prizes;
The Providence Journal (
www.providencejournal.com
)
, the oldest continuously-published daily newspaper in the United States and winner of four Pulitzer Prizes; and the
Denton Record-Chronicle (
www.dentonrc.com
),
a daily newspaper operating in Denton, Texas, approximately 40 miles north of Dallas
.
The Company’s newspapers also publish various niche publications targeting specific audiences, and own and operate commercial printing, distribution and direct mail service businesses.
In February 2008, the Company separated its publishing operations from its former parent in a spin-off transaction (the “Distribution”) and A. H. Belo became an independent registrant listed on the New York Stock Exchange (NYSE trading symbol: AHC). A. H. Belo
offers digital marketing solutions through 508 Digital and Your Speakeasy, LLC and also owns investments in Classified Ventures, LLC (“Classified Ventures”), owner of
cars.com
, and Wanderful Media, LLC, owner of
FindnSave.com
.
Basis of Presentation.
These consolidated financial statements include the accounts of A. H. Belo and its subsidiaries. The Company follows the guidance set by the Financial Accounting Standards Board (“FASB”) or other authoritative accounting standards-setting bodies. Under Accounting Standards Codification (“ASC”) 810 –
Consolidation,
the Company determines whether subsidiaries, joint ventures, partnerships and other arrangements should be consolidated. Transactions between the consolidated companies are eliminated and noncontrolling interests in less than wholly-owned subsidiaries are reflected in the consolidated financial statements. The preparation of consolidated financial statements in conformity with GAAP requires management to make estimates and assumptions that affect the amounts reported in the consolidated financial statements and accompanying notes. Actual results could differ from those estimates. In the opinion of management, all adjustments considered necessary for a fair presentation are included. All dollar amounts are presented in thousands, except per share amounts, unless the context requires otherwise.
In 2013, the Company completed the disposition of
The Press‑Enterprise,
a daily newspaper in Riverside, California, which serves the Inland Southern California region
.
As described in
Note 2 – Discontinued Operations and Sales of Assets
, this disposition meets the criteria of discontinued operations as prescribed under Accounting Standards Codification 205 -
Presentation of Financial Statements
. Accordingly, presentation of current and prior period amounts in the consolidated financial statements and notes thereto reflect continuing operations of the Company unless otherwise noted.
Cash and Cash Equivalents.
The Company considers all highly liquid instruments purchased with a remaining maturity of three months or less to be cash equivalents.
Accounts Receivable.
Accounts receivable are net of a valuation reserve that represents an estimate of amounts considered uncollectible. The Company estimates the allowance for doubtful accounts based on historical write-off experience and the Company’s knowledge of the customers’ ability to pay amounts due. The Company’s policy is to write-off accounts after all collection efforts fail; generally, amounts past due by more than one year are written-off. Expense for such uncollectible amounts is included in other production, distribution and operating costs. Bad debt expense for
2013
and
2012
was
$2,340
and
$1,748
, respectively. Write-offs, net of recoveries and other adjustments for
2013
and
2012
were
$3,126
and
$2,038
, respectively.
Risk Concentration.
Financial instruments subject to potential concentration of credit risk include cash equivalents and accounts receivable. The Company invests available cash balances in an overnight deposit fund holding commercial paper of a single issuer. The issuer’s commercial paper is graded A1 by Moody’s and overnight holdings in the fund were
$72,993
as of
December 31, 2013
.
A significant portion of the Company’s customer base is concentrated within the local geographical area of each newspaper. The Company generally extends credit to customers, and the ultimate collection of accounts receivable could be affected by the national and local economy. Management continually performs credit evaluations of its customers and may require cash in advance or other special arrangements from certain customers. The Company maintains an allowance for losses based upon the collectibility of accounts receivable. Management does not believe significant credit risk exists that could have a material adverse effect on the Company’s consolidated financial condition, liquidity or results of operations.
Inventories.
Inventories, consisting primarily of newsprint, ink and other supplies used in printing newspapers, are recorded at average cost. The Company reviews its inventories for obsolescence and records an expense for any items that no longer have future value.
|
PAGE 46
|
A. H. Belo Corporation 2013 Annual Report on Form 10-K
|
Assets Held for Sale.
Assets held for sale include fixed assets being actively marketed for which a sale is considered probable within the next 12 months. These assets are recorded at the lower of their fair value less costs to sell or their carrying value at the time they are classified as assets held for sale.
Property, Plant and Equipment.
The Company records property, plant and equipment at cost or its fair value if acquired through a business acquisition or non-monetary exchange. Depreciable assets are reviewed to ensure the remaining useful life of the assets continue to be appropriate and the Company records any resulting adjustments to depreciation expense on a prospective basis. Depreciation of property, plant and equipment is recorded on a straight-line basis over the estimated useful lives of the assets as follows:
|
Estimated
Useful Lives
|
|||
|
Buildings and improvements
|
5
|
-
|
30 years
|
|
Newspaper publishing equipment
|
3
|
-
|
20 years
|
|
Other
|
3
|
-
|
10 years
|
Goodwill.
The Company records goodwill at the reporting unit level based on the excess fair value of prior business acquisitions over the fair value of the assets and liabilities acquired. Reporting units of the Company are based on its internal reporting structure and represent a reporting level below an operating segment. Unless qualitative factors allow the Company to conclude it is more likely than not that the fair value of the reporting unit exceeds its carrying value, the Company tests for goodwill impairment by estimating the fair value of the reporting unit. If the fair value of the reporting unit is less than its carrying value, the Company will determine a fair value for the reporting unit’s underlying assets and liabilities and adjust goodwill accordingly. The Company uses a discounted cash flow model to calculate the fair value of its reporting units. The model includes a number of significant assumptions and estimates regarding future cash flows including discount rates, volumes, prices, capital expenditures and the impact of current market conditions. These estimates could be materially impacted by changes in market conditions. The Company performs the goodwill impairment test as of December 31 each fiscal year or when changes in circumstances indicate an impairment event may have occurred. Impairment charges represent non-cash charges and do not affect the Company’s liquidity, cash flows from operating activities or have any effect on future operations. As of
December 31, 2013
, the Company recorded goodwill at
The Dallas Morning News
reporting unit, for which the fair value exceeded its carrying value by a margin in excess of 100 percent at December 31, 2013.
Long-Lived Assets.
The Company evaluates its ability to recover the carrying value of property, plant and equipment and finite-lived intangible assets, using the lowest level of cash flows associated with the assets, which are grouped based on the Company’s intended use of these assets. This evaluation is performed whenever a change in circumstances indicates that the carrying value of the asset groups may not be recoverable from future undiscounted cash flows. If the analysis of future cash flows indicates the carrying value of the long-lived assets cannot be recovered, the assets are adjusted to the lower of its carrying value or fair value.
Investments.
The Company owns certain equity securities in companies in which it does not exercise control. For those investments where the Company is able to exercise significant influence over the investee as defined under ASC 323 –
Equity Method and Joint Ventures
, the Company accounts for the investment under the equity method of accounting, recognizing its share of the investee’s income or loss as a component of earnings. All other investments are recorded under the cost method and the Company recognizes income or loss upon the receipt of dividends or distributions, or upon liquidation of the investment. Each reporting period, the Company evaluates its ability to recover the carrying value of both equity and cost method investments based upon the financial strength of the investee. If the Company determines the carrying value is not recoverable, the Company will record an impairment charge for the difference between the fair value of the investment and the carrying value.
Self-Insured Risks.
A. H. Belo self-insures certain risks for employee medical costs, workers’ compensation, general liability and commercial automotive claims and records a liability for such risks. The Company purchases stop-loss insurance and/or high deductible policies with third-party insurance carriers to limit these risks, and third-party administrators are used to process claims. Each period, the Company estimates, utilizing third party experts, the undiscounted liability associated with its uninsured risks based on historical claim patterns, employee demographic data, assets insured and insurance policy. The estimates associated with these uninsured liabilities are monitored by A. H. Belo’s management for adequacy based on information currently available. However, actual amounts could vary significantly from such estimates if actual trends, including the severity or frequency of claims and/or medical cost inflation, were to change.
|
A. H. Belo Corporation 2013 Annual Report on Form 10-K
|
PAGE 47
|
|
Pension and Other Retirement Obligations.
The Company follows accounting guidance for single employer defined benefit plans. Plan assets and the projected benefit obligation are measured each December 31, and the Company records as an asset or liability the net funded position of the plans. Certain changes in actuarial valuations related to returns on plan assets and projected benefit obligations are recorded to other comprehensive income (loss) and are amortized to net periodic pension expense over the weighted average remaining life of plan participants, to the extent the cumulative balance in accumulated other comprehensive income (loss) exceeds 10 percent of the greater of the respective plan’s (a) projected benefit obligation or (b) the market-related value of the plan’s assets. Net periodic pension expense is recognized each period by accruing interest expense on the projected benefit obligation and accruing a return on assets associated with the plan assets. Participation in and accrual of new benefits to participants has been frozen since 2007 and, accordingly, on-going service costs are not a component of net periodic pension expense. From time to time, the Company-sponsored plans may elect to settle pension obligations with certain plan participants through the plans’ master trust as part of its de-risking strategies. The Company elected not to recognize the gains or losses associated with settlements of plan obligations to participants if such settlements are less than the interest component of net periodic pension cost for the year. Accordingly, such amounts are included in actuarial gains (losses) in accumulated other comprehensive income (loss).
The Company's defined contribution plans include the A. H. Belo Savings Plan and the A. H. Belo Pension Transition Supplement Plan. Contributions by the Company to its defined contribution plans are subject to change at management's discretion. The Company recognizes expense for contributions to these plans based on current commitments made by management to plan participants.
Contingencies.
A. H. Belo is involved in certain claims and litigation related to its operations. The Company is required to assess the likelihood of any adverse judgments or outcomes to these matters as well as potential ranges of probable losses. A determination of the amount of reserves required, if any, for these contingencies is made after careful analysis of each individual matter. The required reserves may change in the future due to new developments in each matter or changes in approach, such as a change in settlement strategy in dealing with these matters.
Share-Based Compensation.
The Company recognizes the granting of share-based awards at fair value in the financial statements. The fair value of option awards is estimated at the date of grant using the Black-Scholes-Merton pricing model and the fair value of restricted stock unit awards (“RSU”) is the closing price of the Company’s common stock on the date of grant. Total compensation cost is amortized to earnings over the requisite service period. Upon vesting, RSUs are redeemed
60 percent
in A. H. Belo Series A common stock and
40 percent
in cash. The Company records a liability for the portion of the outstanding RSUs to be redeemed in cash, which is adjusted to its fair value each period, based on the closing price of the Company’s common stock. Prior to the Distribution, the Company’s employees participated in a share-based compensation plan sponsored by the Company’s former parent. The Company recorded expense for the vesting of these awards for its employees which was completed in 2011.
Shareholders’ Equity.
The Company authorized the issuance of shares of Series A and Series B common stock. Series A common stock has
one
vote per share and Series B common stock has
10
votes per share. Shares of Series B common stock are convertible at any time on a share-for-share basis into shares of Series A common stock, but not vice versa.
The Company is authorized to grant stock option and restricted stock unit awards to employees and directors of the Company. Upon vesting of restricted stock units, shares of Series A common stock are issued. Upon the exercise of stock options, Series A common stock is issued if the holder of the stock options executes a simultaneous exercise and sale. If the holder of the stock option chooses not to sell the shares, Series B common stock is issued.
In 2012, the Company’s board of directors authorized the purchase of the Company’s Series A or Series B common stock, for use other than retirement, through open market purchases, privately negotiated transactions or otherwise. Treasury stock is recorded at cost, reducing shareholders’ equity. Treasury stock purchased privately through negotiated transactions at other than market prices shall be recorded at cost and the price paid in excess of the market cost shall be accounted for according to its substance. When treasury shares are subsequently sold or reissued, the cost of the treasury shares is reversed and the realized gain or loss on sale or reissue, net of any directly attributable incremental transaction costs and related tax, is recognized as a change in additional paid in capital.
Accumulated other comprehensive income (loss) consists of actuarial gains and losses associated with the A. H. Belo Pension Plans and prior service costs and deferral of gains resulting from negative plan amendments related to other post-employment benefit plans. The cumulative balances are amortized to earnings over the weighted average remaining life expectancy of the participants to the extent such balances exceed 10 percent of the greater of the respective plan’s (a) projected benefit obligation or (b) the market-related value of the plan’s assets. The Company discloses amounts reclassified from accumulated other comprehensive income (loss) to net income in
Note 11 – Shareholders’ Equity
.
|
PAGE 48
|
A. H. Belo Corporation 2013 Annual Report on Form 10-K
|
Revenue Recognition.
The Company’s principal sources of revenue is the advertising space in published issues of its newspapers and on the Company’s websites, the sale of newspapers to distributors and individual subscribers, as well as amounts charged to customers for commercial printing, distribution and direct mail. Advertising revenue is recorded net of agency commission at the time the advertisements are published in the newspaper and ratably over the period of time the advertisement is placed on the websites. Marketing services revenue is recognized at the time the services are rendered. Proceeds from subscriptions are deferred and included in revenue ratably over the term of the subscriptions. Subscription revenue under buy-sell arrangements with distributors is recorded based on the net amount received from the distributor, whereas subscription revenue under fee-based delivery arrangements with distributors is recorded based on the amount received from the subscriber. Commercial printing and direct mail revenue is recorded when the product is distributed or shipped.
Income Taxes.
The Company uses the asset and liability method of accounting for income taxes and recognizes deferred tax assets and liabilities based on the difference between the financial statement and tax basis of assets and liabilities using enacted tax rates. The Company establishes a valuation allowance if it is more likely than not that the deferred tax assets will not be realized. The factors used to assess the likelihood of realization of the deferred tax asset include reversal of future deferred tax liabilities, available tax planning strategies and future taxable income.
The Company also evaluates any uncertain tax positions and recognizes a liability for the tax benefit associated with an uncertain tax position if it is more likely than not that the tax position will not be sustained on examination by the taxing authorities, based on the technical merits of the position. The tax benefits recognized in the financial statements from such positions are measured based on the largest benefit that has a greater than 50 percent likelihood of being realized upon ultimate settlement. The Company records a liability for uncertain tax positions taken or expected to be taken in a tax return. Any change in judgment related to the expected ultimate resolution of uncertain tax positions is recognized in earnings in the period in which such change occurs. Interest and penalties, if any, related to unrecognized tax benefits are recorded in interest expense.
The FASB recently issued ASU No. 2013-11,
Income Taxes (Topic 740): Presentation of an Unrecognized Tax Benefit When a Net Operating Loss Carryforward, a Similar Tax Loss, or a Tax Credit Carryforward Exists,
which generally requires an unrecognized tax benefit to be presented in the financial statements as a reduction to a deferred tax asset when a net operating loss or other tax credit carryforward exists. The assessment should be performed by taxing jurisdiction as of each reporting date. The update is effective for fiscal years and interim periods beginning after December 15, 2013. The Company does not anticipate this update to have a material impact on its presentation of uncertain tax positions within its consolidated balance sheets.
Use of Estimates.
Company management makes estimates and assumptions that affect the amounts and disclosures reported in its financial statements and include valuation allowances for doubtful accounts, uncertain tax positions and deferred tax assets, fair value measurements related to assets held for sale, pension plan assets and equity based compensation, actuarial liabilities related to self-insured risks, pension plan obligations and assumptions related to impairment and recovery of goodwill and long lived assets. Estimates are based on past experience and other considerations reasonable under the circumstances. Actual results may differ from these estimates.
Segments.
The Company’s operating segments are defined as its newspapers within a given geographic area. The Company determined that all of its operating segments meet the criteria defined in ASC 280 -
Segment Reporting
allowing it to be aggregated into
one
reporting segment.
Fair Value Measurements.
The Company’s financial instruments, including cash, cash equivalents, accounts receivable, interest receivable, accounts payable and amounts due to customers are carried at cost, which approximates its fair value because of the short-term nature of these instruments.
Note 2:
Discontinued Operations and Sales of Assets
Discontinued operations
In the third and fourth quarters of 2013, the Company completed multiple transactions resulting in the disposition of
The Press-Enterprise
, a daily newspaper in Riverside, California, its niche publications
La
Prensa
and
The
Weekly
, related websites and substantially all related real estate assets
.
On
July 8, 2013
,
The Press‑Enterprise
sold certain equipment which was idled in 2012 when the newspaper ceased printing certain unprofitable commercial products. This transaction generated net proceeds of
$504
and a pretax gain of
$269
. On
July 17, 2013
, the Company completed the sale of its five-story office building and certain related assets in Riverside, California to the County of Riverside for
$30,000
. This building served as the administrative headquarters for
The Press‑Enterprise
. The proceeds to the Company were
$28,589
after selling costs of
$1,411
. In the third quarter of 2013 the Company recorded a pretax gain of
$4,477
related to this transaction.
|
A. H. Belo Corporation 2013 Annual Report on Form 10-K
|
PAGE 49
|
|
On
November 21, 2013
, the Company completed the sale of the newspaper operations of
The Press-Enterprise
, including the production facility and related land, to Freedom Communications, Inc. (“Freedom Communications”) under a definitive asset purchase agreement. Gross sales proceeds of
$26,750
were received in the fourth quarter of 2013. Escrow proceeds of
$500
were received in February 2014 and the Company expects to collect a working capital adjustment of
$753
in the first quarter of 2014. Estimated selling and exit costs of
$5,787
were recognized in 2013, resulting in a pretax gain of
$8,656
.
The activity and balances of
The Press-Enterprise
are presented within the accompanying financial statements as discontinued operations.
Major components of the amounts presented as discontinued operations in the condensed consolidated financial statements are set forth below.
|
Years Ended December 31,
|
|||||||||||
|
2013
|
2012
|
2011
|
|||||||||
|
Loss from discontinued operations
|
|||||||||||
|
Revenue
|
$
|
46,648
|
|
$
|
65,356
|
|
$
|
67,307
|
|
||
|
Costs and expense
|
(51,348
|
)
|
(73,382
|
)
|
(77,980
|
)
|
|||||
|
(4,700
|
)
|
(8,026
|
)
|
(10,673
|
)
|
||||||
|
Gain related to the divestiture of discontinued operations
|
|||||||||||
|
Gain on sale of
The Press-Enterprise
|
8,656
|
|
—
|
|
—
|
|
|||||
|
Gain on sale of five-story office building
|
4,477
|
|
—
|
|
—
|
|
|||||
|
Gain on sale of press equipment
|
269
|
|
—
|
|
—
|
|
|||||
|
13,402
|
|
—
|
|
—
|
|
||||||
|
Tax benefit from discontinued operations
|
(67
|
)
|
(72
|
)
|
(96
|
)
|
|||||
|
Income (Loss) from Discontinued Operations, Net
|
$
|
8,769
|
|
$
|
(7,954
|
)
|
$
|
(10,577
|
)
|
||
|
|
December 31,
|
December 31,
|
|||||
|
2013
|
2012
|
||||||
|
Assets of discontinued operations
|
|||||||
|
Current assets
|
$
|
1,633
|
|
$
|
10,203
|
|
|
|
Property, plant and equipment, net
|
—
|
|
35,755
|
|
|||
|
Other assets
|
—
|
|
2,444
|
|
|||
|
Total
|
$
|
1,633
|
|
$
|
48,402
|
|
|
|
Liabilities of discontinued operations
|
$
|
2,028
|
|
$
|
7,781
|
|
|
Upon completion of these transactions, the Company no longer owns newspaper operations in Riverside, California but continues to own and market for sale the land and buildings associated with a former commercial printing operation in Riverside, California. Transition services in the areas of information technology and digital support will be provided on a diminishing basis to Freedom Communications Holdings, Inc. over the next five months.
Other dispositions
In June 2013, the Company executed an agreement with a third-party for the sale of a public parking lot in downtown Providence, Rhode Island. Net sales proceeds of
$367
were received in the third quarter of 2013, generating a gain of
$242
.
Note 3:
Goodwill and Intangible Assets
The Company recorded intangible assets consisting of goodwill and subscriber lists from its previous newspaper acquisitions. During the fourth quarter, the Company performed its annual impairment testing related to
The Dallas Morning News
reporting unit. The Company used the discounted cash flow method to determine fair value of this reporting unit, as well as giving consideration to pricing of recent mergers and acquisitions, earnings multiples among industry peers and recent performance of the Company’s stock. The use of discounted cash flows is based on assumptions requiring significant judgment regarding revenue growth rates, margins, discount factors and tax rates. These assumptions and the methods used in determining the reporting unit
|
PAGE 50
|
A. H. Belo Corporation 2013 Annual Report on Form 10-K
|
fair value are reviewed by senior management and are believed to be reasonable and appropriate. The Company determined that the fair value of
The Dallas Morning News
reporting unit exceeded its carrying value by a margin in excess of 100 percent at December 31, 2013, and no impairment was considered necessary. Goodwill associated with
The Providence Journal
was fully impaired in prior years. At
December 31, 2013
and
2012
, the carrying value of goodwill was
$24,582
, net of cumulative impairment losses of
$323,734
.
Subscriber lists related to
The Providence Journal
are amortized over
18 years
, and have a remaining life of
1 year, 5 months
.
During the three months ended March 31, 2013, the Company finalized the accounting for its December 2012 acquisition of certain assets and liabilities from DG Publishing, Inc., which produced and published
Design Guide Texas
and
Texas Wedding Guide
magazines and related websites. Customer relationships purchased in the acquisition were assigned a value of
$362
and are amortized over an estimated useful life of
three years
. The customer relationships are a component of
The Dallas Morning News
reporting unit. Remaining assets and liabilities acquired were not material.
The table below sets forth the Company’s identifiable intangible assets, consisting of subscriber lists and customer relationship assets.
|
Total
Intangible Assets |
The
Dallas Morning News
|
The
Providence Journal |
|||||||||
|
December 31, 2013
|
|||||||||||
|
Gross balance
|
$
|
79,060
|
|
$
|
362
|
|
$
|
78,698
|
|
||
|
Accumulated amortization
|
(73,718
|
)
|
(121
|
)
|
(73,597
|
)
|
|||||
|
Net balance
|
$
|
5,342
|
|
$
|
241
|
|
$
|
5,101
|
|
||
|
December 31, 2012
|
|||||||||||
|
Gross balance
|
$
|
78,698
|
|
$
|
—
|
|
$
|
78,698
|
|
||
|
Accumulated amortization
|
(69,225
|
)
|
—
|
|
(69,225
|
)
|
|||||
|
Net balance
|
$
|
9,473
|
|
$
|
—
|
|
$
|
9,473
|
|
||
Amortization expense for intangible assets for
2013
,
2012
and
2011
was
$4,493
,
$4,373
and
$4,373
, respectively. Amortization expense is expected to be
$4,493
for
2014
and
$849
for
2015
, at which time the intangibles will be fully amortized.
Note 4:
Investments
The Company owns investment interests in various entities which are recorded under the equity method or cost method of accounting, or consolidated if the Company holds a controlling financial interest. Under the equity method, the Company records its share of the investee’s earnings or losses each period in other income (expense), net, in the consolidated statements of operations. Under the cost method, the Company records earnings or losses when such amounts are realized. The Company evaluates the recoverability of its investments each period. In
2013
,
2012
and
2011
, the Company recorded
$2,270
,
$2,628
and
$1,963
, respectively, of earnings from equity method investments. The table below sets forth the Company’s investments.
|
December 31,
|
December 31,
|
||||||
|
2013
|
2012
|
||||||
|
Equity method investments
|
$
|
6,401
|
|
$
|
5,706
|
|
|
|
Cost method investments
|
932
|
|
1,120
|
|
|||
|
Total investments
|
$
|
7,333
|
|
$
|
6,826
|
|
|
|
A. H. Belo Corporation 2013 Annual Report on Form 10-K
|
PAGE 51
|
|
Equity method investments.
Investments recorded under the equity method of accounting include the following:
Classified Ventures, LLC (“Classified Ventures”)
–
The Company own a
3.3 percent
interest in Classified Ventures, in which the other owners are
Gannett Co., Inc.
,
The McClatchy Company
, Tribune Company and Graham Holdings Company. The two principal businesses Classified Ventures operates are
cars.com
and
apartments.com
.
The Company included Classified Ventures’ consolidated financial statements as of
December 31, 2013
, as an exhibit to the Company’s
2013
Form 10-K, as it represents a significant subsidiary as defined by Securities and Exchange Commission regulations.
The Company received dividends of
$2,952
,
$2,427
and
$2,231
from Classified Ventures in
2013
,
2012
and
2011
, respectively.
On
February 28, 2014
, Classified Ventures entered into an agreement to sell its
apartments.com
business unit for
$585,000
. The sale is expected to close in the second quarter of 2014. The Company’s portion of the proceeds, net of selling costs, on the sale of
apartments.com
will be approximately
$18,900
. The Company expects federal income taxes to be minimal as a result of previously incurred net operating losses and is finalizing its estimate of state taxes.
Wanderful Media, LLC (“Wanderful”)
–
The Company owns a
12.7 percent
interest in Wanderful, which operates
FindnSave.com
, a digital shopping platform where consumers can find national and local retail goods and services for sale. This platform combines local media participation with advanced search and database technology to allow consumers to view local advertised offers and online sales circulars or search for an item and receive a list of local advertisers and the price and terms offered for the searched item.
Summarized unaudited condensed balance sheets of Wanderful were as follows:
|
December 31,
|
December 31,
|
||||||
|
2013
|
2012
|
||||||
|
Current assets
|
$
|
9,146
|
|
$
|
9,774
|
|
|
|
Non-current assets
|
14,988
|
|
15,215
|
|
|||
|
Total assets
|
$
|
24,134
|
|
$
|
24,989
|
|
|
|
Current liabilities
|
$
|
2,392
|
|
$
|
3,341
|
|
|
|
Non-current liabilities
|
1,247
|
|
273
|
|
|||
|
Total liabilities
|
3,639
|
|
3,614
|
|
|||
|
Equity
|
20,495
|
|
21,375
|
|
|||
|
Total liabilities and equity
|
$
|
24,134
|
|
$
|
24,989
|
|
|
Summarized unaudited condensed statements of operations of Wanderful were as follows:
|
December 31,
|
December 31,
|
||||||
|
2013
|
2012
|
||||||
|
Revenues
|
$
|
5,357
|
|
$
|
6,289
|
|
|
|
Costs and expenses
|
14,506
|
|
9,994
|
|
|||
|
Operating loss
|
(9,149
|
)
|
(3,705
|
)
|
|||
|
Other expense
|
(245
|
)
|
(748
|
)
|
|||
|
Loss before income taxes
|
(9,394
|
)
|
(4,453
|
)
|
|||
|
Income tax provision
|
2
|
|
468
|
|
|||
|
Net loss
|
$
|
(9,396
|
)
|
$
|
(4,921
|
)
|
|
Consolidated investments.
During the third quarter of 2012, the Company and a local advertising agency entered into an operating agreement and formed Your Speakeasy, LLC (“Speakeasy”) which targets middle-market business customers and provides turnkey social media account management and content development services. The Company owns a
70 percent
interest in Speakeasy and, accordingly, consolidates the investee’s assets, liabilities and results of operations within its consolidated financial statements as of
December 31, 2013
and 2012.
Concurrent with the Distribution, certain previously acquired real estate properties were transferred to Belo Investment, LLC (“Belo Investment”), an entity holding various investments in which the Company and its former parent Company each received
|
PAGE 52
|
A. H. Belo Corporation 2013 Annual Report on Form 10-K
|
a
50 percent
interest. Through December 31, 2011, the Company accounted for its interest in Belo Investment under the equity method of accounting. On December 31, 2011, Belo Investment transferred four of its real estate properties to a newly formed subsidiary, AHC Dallas Properties, LLC. The Company entered into a nontaxable, non-monetary exchange arrangement with Belo Investment whereby it yielded its interests in Belo Investment in exchange for
100 percent
of the holdings in AHC Dallas Properties, LLC and assumed a liability for certain capital repairs to properties retained by Belo Investment. The asset distribution was based on an equitable allocation of the properties using values established by third party independent appraisals. The Company determined that as a result of its continuing interests in these properties, the exchange should be accounted for at the lower of fair value or historical carrying value. Accordingly,
$11,191
of fixed assets and
$90
of other assets received by AHC Dallas Properties, LLC in the exchange were consolidated in the Company’s 2011 financial statements and the Company recorded a non-operating loss on its investment in 2011 of
$5,018
in other expense.
Note 5:
Changes in Accounting Estimates
In 2012 and 2011, the Company accelerated the depreciation of certain property, plant and equipment that was determined to have a shorter remaining useful life than previously estimated. Accordingly, the Company recorded additional depreciation expense of
$762
and
$1,017
in 2012 and 2011, respectively.
Additional changes in estimates which occurred in 2011 are as follows:
|
•
|
The Company recorded a loss of
$700
to adjust the carrying value of a residence acquired pursuant to an employment retention and relocation agreement. The residence was sold in the second quarter of 2012 for
$2,410
, resulting in a gain of
$14
.
|
|
•
|
An impairment charge of
$872
was recorded, associated with certain real estate assets in Riverside, California. The recovery estimates, based on an eventual sale of the assets, were less than the carrying value of the assets of
$2,846
due to declines from economic conditions and real estate markets in California. As a result, the Company determined the impairment based on the fair value of the properties, as established by current appraisals, less selling costs.
|
|
•
|
A
$1,785
write-down of its spare parts inventory was recorded based on estimates by management regarding the ability of the Company to use the inventory parts in future periods. The write-down is recorded in other production, distribution and operating costs.
|
|
•
|
A final settlement was recorded in 2011 to adjust the projected benefit obligations assumed by the Company’s pension plans, resulting in a loss of
$1,988
. In 2010, the Company had withdrawn from a defined benefit pension plan sponsored by the former parent company and recorded a loss for the unfunded obligations assumed at that time. The settlement recorded in 2011 represented an adjustment to the projected benefit obligation resulting from the finalization of demographic data for participants transferred to the Company’s pension plans. The Company has no further obligations or claims related to the pension plan of the former parent company.
|
Note 6:
Long-term Incentive Plans
A. H. Belo sponsors a long-term incentive plan under which
8,000,000
common shares were authorized for equity based awards. Awards under the plan were granted to holders of stock options issued by the former parent company in association with the Distribution and may be granted to A. H. Belo employees and outside directors in the form of non-qualified stock options, incentive stock options, restricted shares, RSUs, performance shares, performance units or stock appreciation rights. In addition, stock options may be accompanied by full and limited stock appreciation rights. Rights and limited stock appreciation rights may also be issued without accompanying stock options. The Company recognizes compensation expense for any pre-Distribution awards related to its respective employees, regardless of which company ultimately issued the awards.
|
A. H. Belo Corporation 2013 Annual Report on Form 10-K
|
PAGE 53
|
|
Stock Options.
The non-qualified stock options granted to employees under the Company’s long-term incentive plans are exercisable in cumulative installments over periods of
one
to
three
years and expire after
10
years. No options have been granted granted since 2009. The grant date fair value of outstanding stock option awards was estimated using the Black-Scholes-Merton valuation. Volatility was calculated using an analysis of historical stock prices. The expected lives of stock options were determined based on the Company’s employees’ historical stock option exercise experience, which the Company believed to be the best estimate of future exercise patterns available. The risk-free interest rates were determined using the implied yield currently available for zero-coupon United States Government debt securities with a remaining term equal to the expected life of the stock options. The expected dividend yields were based on the approved annual dividend rate in effect and current market price of the underlying common stock at the time of grant. The exercise price of stock options granted under the A. H. Belo long-term incentive plan equals the closing stock price on the day of grant. Accordingly, no intrinsic value exists on the option on the grant date.
The table below sets forth a summary of stock option activity under the A. H. Belo long-term incentive plan.
|
Number of
Options |
Weighted-Average
Exercise Price |
|||||
|
Outstanding at December 31, 2010
|
2,191,736
|
|
$
|
16.77
|
|
|
|
Exercised
|
(46,500
|
)
|
2.05
|
|
||
|
Canceled
|
(448,546
|
)
|
17.49
|
|
||
|
Outstanding at December 31, 2011
|
1,696,690
|
|
16.99
|
|
||
|
Exercised
|
(153,326
|
)
|
1.97
|
|
||
|
Canceled
|
(327,684
|
)
|
20.64
|
|
||
|
Outstanding at December 31, 2012
|
1,215,680
|
|
17.90
|
|
||
|
Exercised
|
(18,820
|
)
|
3.70
|
|
||
|
Canceled
|
(286,327
|
)
|
27.13
|
|
||
|
Outstanding at December 31, 2013
|
910,533
|
|
$
|
15.29
|
|
|
The table below summarizes vested and exercisable A. H. Belo stock options outstanding as of
December 31, 2013
.
|
Range of Exercise Prices
|
Number of
Options Outstanding |
Weighted-Average
Remaining Life (years) |
Weighted-Average
Exercise Price |
||||||
|
$0.00
|
-
|
$9.99
|
395,018
|
4.8
|
$
|
4.60
|
|
||
|
$10.00
|
-
|
$19.99
|
60,603
|
2.6
|
18.29
|
|
|||
|
$20.00
|
-
|
$29.99
|
454,912
|
1.3
|
24.17
|
|
|||
|
910,533
|
2.9
|
$
|
15.29
|
|
|||||
As of
December 31, 2013
, the Company’s employees and non-employee directors held
607,236
A. H. Belo stock options and the remaining
303,297
stock options are held by former parent company employees.
|
PAGE 54
|
A. H. Belo Corporation 2013 Annual Report on Form 10-K
|
Restricted Stock Units.
Under A. H. Belo’s long-term incentive plan, the Company’s board of directors periodically awards RSUs. The RSUs have service and/or performance conditions and vest over a period of up to
three
years. Upon vesting, the RSUs are redeemed
60
percent in A. H. Belo Series A common stock and
40
percent in cash. As of
December 31, 2013
, the liability for the portion of the award to be redeemed in cash was
$1,919
. The table below sets forth a summary of RSU activity under the A. H. Belo long-term incentive plan.
|
Total
RSUs |
Issuance of
Common Stock |
RSUs
Redeemed in Cash |
Cash
Payments at Closing Price of Stock |
Weighted-
Average Price on Date of Grant |
||||||||||||
|
Non-vested at December 31, 2010
|
1,018,452
|
|
$
|
6.36
|
|
|||||||||||
|
Granted
|
425,710
|
|
7.58
|
|
||||||||||||
|
Vested
|
(408,039
|
)
|
244,803
|
|
163,236
|
|
$
|
1,242
|
|
8.47
|
|
|||||
|
Canceled
|
(33,893
|
)
|
6.71
|
|
||||||||||||
|
Non-vested at December 31, 2011
|
1,002,230
|
|
6.01
|
|
||||||||||||
|
Granted
|
375,686
|
|
4.82
|
|
||||||||||||
|
Vested
|
(533,043
|
)
|
319,807
|
|
213,236
|
|
$
|
1,025
|
|
5.22
|
|
|||||
|
Canceled
|
(33,255
|
)
|
6.13
|
|
||||||||||||
|
Non-vested at December 31, 2012
|
811,618
|
|
5.97
|
|
||||||||||||
|
Granted
|
344,811
|
|
5.51
|
|
||||||||||||
|
Vested
|
(427,611
|
)
|
256,548
|
|
171,063
|
|
$
|
939
|
|
5.49
|
|
|||||
|
Non-vested at December 31, 2013
|
728,818
|
|
$
|
5.59
|
|
|||||||||||
The fair value of the RSUs granted is determined using the closing trading price of the Company’s shares on the grant date. As of
December 31, 2013
, the Company had
$483
of total unrecognized compensation cost related to non-vested RSUs, which is expected to be recognized over a weighted-average period of
1.5 years
.
Compensation Expense.
A. H. Belo recognizes compensation expense for any awards issued to its employees and directors under its long-term incentive plan. Additionally, compensation expense was recognized for any pre-Distribution awards related to its employees and directors that were issued under the long-term incentive plans of the former parent company. In 2011,
$131
of expense was recognized for the final vesting of stock awards issued by the former parent company to A. H. Belo employees. Compensation expense (benefit) related to Company issued stock awards, recorded on a straight-line basis over the vesting period of the award, is set forth in the table below.
|
Equity Awards
|
RSUs Redeemable in Cash
|
Total Expense
|
|||||||||||||||||
|
Options Expense
|
RSUs Redeemable in Stock
|
Total
|
|||||||||||||||||
|
2013
|
$
|
—
|
|
$
|
1,227
|
|
$
|
1,227
|
|
$
|
1,519
|
|
$
|
2,746
|
|
||||
|
2012
|
—
|
|
1,155
|
|
1,155
|
|
695
|
|
1,850
|
|
|||||||||
|
2011
|
177
|
|
1,973
|
|
2,150
|
|
(105
|
)
|
2,045
|
|
|||||||||
Note 7:
Long-term Debt
As of December 31, 2012, the Company operated under an Amended and Restated Credit Agreement (the “Credit Agreement”) dated January 30, 2009, by and between the Company and certain of its subsidiaries, as borrowers, JPMorgan Chase Bank, N.A., as administrative agent, and the lenders party thereto (as amended by First through Fifth Amendments dated August 18, 2009, December 3, 2009, August 18, 2010, March 10, 2011 and May 2, 2011, respectively). The Credit Agreement, with a maturity date of September 30, 2014, provided a
$25,000
working capital facility that was subject to a borrowing base. Among other matters, the Credit Agreement created an asset-based revolving credit facility secured by the Company’s accounts receivable, inventory, real property and other assets.
|
A. H. Belo Corporation 2013 Annual Report on Form 10-K
|
PAGE 55
|
|
Under certain conditions, the facility restricted payment of dividends, imposed a fixed charge coverage ratio covenant, limited investments and limited the Company’s ability to divest assets. Additionally, payment of voluntary pension contributions, declaration of special dividends and purchase of shares of the Company’s common stock were permitted only as long as no borrowings were outstanding under the revolving credit facility. The Company was also required to pay commitment fees at
0.5 percent
on the unused credit facility and
2.5 percent
on outstanding letters of credit. The Company had not borrowed under the Credit Agreement since 2009 as cash flows from operations were sufficient to meet liquidity requirements.
On January 4, 2013, the Company voluntarily terminated its Credit Agreement to provide greater financial and operating flexibility and for purposes of funding its pension plans, returning capital to shareholders, managing its investments and eliminating direct and indirect costs related to the Credit Agreement. All liens and security interests under the Credit Agreement were released and no early termination penalties were incurred by the Company as a result of the termination. Unamortized debt issuance costs of
$401
were recorded to interest expense in 2013, as a result of the termination.
Note 8:
Termination and Exit Costs
During 2011, the Company committed to a plan to reduce staffing levels in order to align operating expenses with the Company’s strategies. The reduction-in-force affected approximately
202
positions, resulting in termination costs of approximately
$2,642
recorded in salaries, wages and employee benefits. At December 31, 2011, approximately
$465
of these costs were recorded in other accrued liabilities, which were paid in 2012.
The Company continues to monitor its corporate staffing levels to meet its operating needs and may incur severance expenses that are not part of a formal plan.
Note 9:
Income Taxes
The table below sets forth income tax provision (benefit) related to continuing operations.
|
2013
|
2012
|
2011
|
|||||||||
|
Current
|
|||||||||||
|
Federal
|
$
|
—
|
|
$
|
—
|
|
$
|
2,962
|
|
||
|
State
|
1,614
|
|
1,437
|
|
1,520
|
|
|||||
|
Total current
|
1,614
|
|
1,437
|
|
4,482
|
|
|||||
|
Deferred
|
|||||||||||
|
Federal
|
4,218
|
|
2,852
|
|
3,927
|
|
|||||
|
State
|
(181
|
)
|
279
|
|
555
|
|
|||||
|
Total deferred
|
4,037
|
|
3,131
|
|
4,482
|
|
|||||
|
Valuation allowance
|
(4,067
|
)
|
(2,764
|
)
|
(3,857
|
)
|
|||||
|
Total income tax provision
|
$
|
1,584
|
|
$
|
1,804
|
|
$
|
5,107
|
|
||
|
PAGE 56
|
A. H. Belo Corporation 2013 Annual Report on Form 10-K
|
The table below sets forth income tax provision for continuing operations computed by applying the applicable United States federal income tax rate and is reconciled to the tax provision (benefit) computed at the effective income tax rate.
|
2013
|
2012
|
2011
|
|||||||||
|
Computed expected income tax provision
|
$
|
3,059
|
|
$
|
3,562
|
|
$
|
1,663
|
|
||
|
State income tax (net of federal benefit)
|
944
|
|
1,004
|
|
1,677
|
|
|||||
|
Benefit of net operating loss carryforwards
|
(7,021
|
)
|
—
|
|
—
|
|
|||||
|
2006 - 2008 Belo IRS audit adjustment
|
—
|
|
—
|
|
2,961
|
|
|||||
|
Valuation allowance
|
2,953
|
|
(2,764
|
)
|
(3,857
|
)
|
|||||
|
Compensation limitation
|
—
|
|
—
|
|
618
|
|
|||||
|
Equity compensation
|
1,582
|
|
—
|
|
—
|
|
|||||
|
Belo Investment, LLC asset distribution
|
—
|
|
—
|
|
2,033
|
|
|||||
|
Recognition of equity windfall
|
(564
|
)
|
—
|
|
—
|
|
|||||
|
Other
|
631
|
|
2
|
|
12
|
|
|||||
|
Income tax provision
|
$
|
1,584
|
|
$
|
1,804
|
|
$
|
5,107
|
|
||
|
Effective income tax rate
|
18.1
|
%
|
17.7
|
%
|
107.5
|
%
|
|||||
As of
December 31, 2013
, the Company’s cumulative federal and state taxable net operating losses were
$49,464
and
$14,748
, respectively. Net operating losses may be carried forward to offset future taxable income. The Company’s net operating loss carryforwards begin to expire in
2016
if not utilized.
Pursuant to the Tax Matters Agreement with the former parent company, the Company incurred a one-time charge of
$2,961
related to a pre-Distribution Internal Revenue Service (“IRS”) audit adjustment in 2011.
The table below sets forth the significant components of the Company’s deferred tax liabilities and assets.
|
December 31,
|
|||||||
|
|
2013
|
2012
|
|||||
|
Deferred tax assets
|
|
|
|||||
|
Deferred compensation and benefits
|
$
|
2,759
|
|
$
|
6,349
|
|
|
|
Expenses deductible for tax purposes in a year different from the year accrued
|
2,964
|
|
370
|
|
|||
|
Defined benefit plans
|
17,725
|
|
37,817
|
|
|||
|
Net operating loss
|
19,853
|
|
24,778
|
|
|||
|
Other
|
2,345
|
|
2,555
|
|
|||
|
Total deferred tax assets
|
45,646
|
|
71,869
|
|
|||
|
Valuation allowance for deferred tax assets
|
(39,021
|
)
|
(66,118
|
)
|
|||
|
Deferred tax assets, net
|
6,625
|
|
5,751
|
|
|||
|
Deferred tax liabilities
|
|
|
|||||
|
Tax amortization in excess of book amortization
|
3,385
|
|
1,509
|
|
|||
|
Tax depreciation (less than) in excess of book depreciation
|
(775
|
)
|
271
|
|
|||
|
State taxes
|
3,416
|
|
1,362
|
|
|||
|
Total deferred tax liabilities
|
6,026
|
|
3,142
|
|
|||
|
Net deferred tax assets
|
$
|
599
|
|
$
|
2,609
|
|
|
Deferred taxes are classified as current and long-term deferred assets or liabilities based on the classification of the related assets or liabilities in the Company’s consolidated balance sheets as of
December 31, 2013
and
2012
. Deferred tax assets include
$5,283
and
$25,736
related to net losses recorded in accumulated other comprehensive loss as of December 31, 2013 and 2012, respectively. These deferred tax assets were fully reserved and there was no net effect to tax provision for amounts recorded to other comprehensive loss in 2013, 2012 or 2011. The Company places a threshold for recognition of deferred tax assets based on whether it is more likely than not that these assets will be realized. In making this determination, all positive and negative evidence is
|
A. H. Belo Corporation 2013 Annual Report on Form 10-K
|
PAGE 57
|
|
considered, including future reversals of existing taxable temporary differences, tax planning strategies, future taxable income and taxable income in prior carryback years.
As a result of certain realization requirements of ASC 718 –
Stock Compensation
, the deferred tax assets and deferred tax liabilities shown above do not include certain deferred tax assets for 2011 and 2012 that arose directly from tax deductions related to equity compensation in excess of compensation recognized for financial reporting. As of
December 31, 2013
, additional paid in capital would be increased by
$104
if such deferred tax assets were ultimately realized in accordance with the applicable tax law.
During 2013, the Company effectively completed the U.S. federal audit for tax years 2008 and 2009. The audit resulted in a 2013 refund of
$1,334
due to the carryback of taxable losses to a prior tax return of the former parent company. The Company is not currently under examination by federal or state jurisdictions for income tax purposes. Additionally, the Company made income tax payments, net of refunds, of
$1,432
and
$1,489
in
2013
and
2012
, respectively, primarily to state jurisdictions.
The Company evaluates uncertain tax positions and recognizes a liability for the tax benefit associated with an uncertain position only if it is more likely than not the position will not be sustained on examination by taxing authorities, based on the technical merits of the position. Due to newly issued IRS regulations, the Company determined it did not have any uncertain tax positions as of December 31, 2013. As a result, the previous liability was reversed along with the corresponding interest and penalties. As of December 31, 2012, the Company recorded reserves of
$324
for uncertain tax positions and reserves
$93
for related interest and penalties.
The Company follows accounting guidance under ASC 740-10 –
Income Taxes
related to uncertainty in income tax positions, which clarifies the accounting and disclosure requirements for uncertainty in tax positions. The Company assessed its filing positions in all significant jurisdictions where it is required to file income tax returns for all open tax years. Tax returns filed in major jurisdictions, as defined, include the U. S. federal income tax return and state income tax returns in three states. The Company’s federal income tax returns for the years subsequent to December 31, 2009, remain subject to examination. The Company’s income tax returns in major state income tax jurisdictions where the Company operates remain subject to examination for various periods subsequent to December 31, 2007.
In 2010, the Company identified a tax benefit that did not meet the more likely than not criteria as stipulated in the accounting guidance that the position would be sustainable. As a result, the Company recorded a reserve for this item in other liabilities at December 31, 2011, for the portion of the tax benefit that was not greater than 50 percent likely to be realized upon settlement with a taxing authority. In 2013, federal regulations were further clarified. As a result, the Company filed certain accounting method changes to comply with the newly issued regulations. As such, the Company reversed the unrecognized tax benefit in 2013. The table below sets forth a reconciliation of the beginning and ending amount of unrecognized tax benefit.
|
2013
|
2012
|
||||||
|
Balance at January 1
|
$
|
324
|
|
$
|
333
|
|
|
|
Reductions for tax positions of prior years
|
(324
|
)
|
(9
|
)
|
|||
|
Balance at December 31
|
$
|
—
|
|
$
|
324
|
|
|
Note 10:
Pension and Other Retirement Plans
Defined Benefit Plans.
On January 1, 2011, the Company established the A. H. Belo Pension Plans, which provides benefits to approximately
4,100
current and former employees of the Company. A. H. Belo Pension Plan I provides benefits to certain employees primarily employed with
The Dallas Morning News
or the A. H. Belo corporate offices. A. H. Belo Pension Plan II provides benefits to certain employees at
The Providence Journal
. Assets and obligations of these plans were transferred from a defined benefit plan of the former parent company in the fourth quarter of 2010, at which time the Company recorded the loss associated with the unfunded benefit obligations assumed in the transfer. In 2011, the Company recognized a loss of
$1,988
for the finalization of settlement activity related to the transfer. No additional benefits are accruing under the A. H. Belo Pension Plans, as future benefits were frozen prior to the plans’ effective date.
Under the A. H. Belo Pension Plans, the Company made required contributions of
$7,396
and
$22,672
in
2013
and
2012
, respectively, and voluntary contributions of
$4,604
and
$10,000
in
2013
and
2012
, respectively, to the A. H. Belo Pension Plans, directly reducing the unfunded projected pension obligation of these plans. Actuarial gains (losses) of
$57,171
,
$(10,613)
and
$(65,019)
were recorded to other comprehensive income (loss) in 2013, 2012 and 2011, respectively, see
Note 11 – Shareholders’ Equity
for information on amounts recorded to accumulated other comprehensive income.
The Company-sponsored plans implemented a de-risking strategy in 2012, making voluntary and mandatory lump sum pay outs of
$10,526
to
889
participants. These liquidations reduced the projected benefit obligation by
$14,500
. The obligations were
|
PAGE 58
|
A. H. Belo Corporation 2013 Annual Report on Form 10-K
|
funded through the plans’ master trust account and are a component of 2012 benefit payments as shown in the table below. As the cost of these settlements was less than the interest component of net periodic pension expense, the related gain (loss) associated with these settlements was reflected as a component of the actuarial loss and included in accumulated other comprehensive loss. The Company will continue to evaluate the feasibility of additional settlements of participant obligations based on the economic benefits to the Company.
The table below sets forth summarized financial information about the A. H. Belo Pension Plans.
|
2013
|
2012
|
||||||
|
Change in projected benefit obligation
|
|||||||
|
Projected benefit obligation at beginning of year
|
$
|
441,395
|
|
$
|
420,885
|
|
|
|
Interest cost
|
15,995
|
|
17,300
|
|
|||
|
Actuarial (gain) loss
|
(48,649
|
)
|
31,740
|
|
|||
|
Benefit payments
|
(20,043
|
)
|
(28,530
|
)
|
|||
|
Projected benefit obligation at end of year
|
388,698
|
|
441,395
|
|
|||
|
Change in plan assets
|
|||||||
|
Fair value of plan assets at beginning of year
|
318,574
|
|
274,905
|
|
|||
|
Return on plan assets
|
28,085
|
|
39,527
|
|
|||
|
Employer contributions
|
12,000
|
|
32,672
|
|
|||
|
Benefit payments
|
(20,043
|
)
|
(28,530
|
)
|
|||
|
Fair value of plan assets at end of year
|
338,616
|
|
318,574
|
|
|||
|
Funded status
|
$
|
(50,082
|
)
|
$
|
(122,821
|
)
|
|
|
Amounts recorded on the balance sheet
|
|||||||
|
Noncurrent liability - Accrued benefit cost
|
$
|
50,082
|
|
$
|
122,821
|
|
|
|
Accumulated benefit obligation
|
$
|
388,698
|
|
$
|
441,395
|
|
|
Net Periodic Pension Expense
The projected benefit obligations of the A. H. Belo Pension Plans are estimated using the Citigroup Pension Yield Curve, which is based upon a portfolio of high quality corporate debt securities with maturities that correlate to the timing of benefit payments to the plans’ participants. Future benefit payments are discounted to their present value at the appropriate yield curve rate to determine the projected benefit obligation outstanding at each year end. Yield curve discount rates as of
December 31, 2013
and
2012
, were
4.6 percent
and
3.7 percent
, respectively.
Interest expense included in net periodic pension expense is based on the Citigroup Pension Yield Curve established at the beginning of the fiscal year. Interest expense for
2013
,
2012
and
2011
was determined using beginning of year yield curve rates of
3.7 percent
,
4.2 percent
and
5.3 percent
, respectively.
The Company assumed a
6.5 percent
long-term return on the plans’ assets in
2013
,
2012
and
2011
. This return is based upon historical returns of similar investment pools having asset allocations consistent with the expected allocations of the A. H. Belo Pension Plans. Investment strategies for the plans’ assets are based upon factors such as the remaining useful life expectancy of participants and market risks. The table below sets forth components of net periodic pension expense for
2013
,
2012
and
2011
.
|
2013
|
2012
|
2011
|
|||||||||
|
Interest cost
|
$
|
15,995
|
|
$
|
17,300
|
|
$
|
18,900
|
|
||
|
Expected return on plans' assets
|
(19,563
|
)
|
(18,400
|
)
|
(17,235
|
)
|
|||||
|
Amortization of actuarial loss
|
1,702
|
|
700
|
|
—
|
|
|||||
|
Net periodic pension (benefit) expense
|
$
|
(1,866
|
)
|
$
|
(400
|
)
|
$
|
1,665
|
|
||
|
A. H. Belo Corporation 2013 Annual Report on Form 10-K
|
PAGE 59
|
|
Plan Assets
The Company is responsible for directing the investment strategies of the A. H. Belo Pension Plans’ assets. The investment strategies focus on asset class diversification, liquidity to meet benefit payments and an appropriate balance of long-term investment return and risks. The long-term targeted allocation of the plans’ assets invested in equity securities and fixed-income securities is
50.0 percent
and
50.0 percent
, respectively. These targets are determined by matching the actuarial projections of the plans’ future liabilities and benefit payments with the expected long-term rates of return on assets and expected market risks. Investment risk is continuously monitored and plan assets are rebalanced to target allocations to meet the Company’s strategy and the plans’ liquidity needs. At
December 31, 2013
, the plans’ investments in equity securities and fixed income securities accounted for
49.8 percent
and
50.2 percent
of the total non-cash holdings, respectively.
The table below sets forth the A. H. Belo Pension Plans’ assets at fair value as of
December 31, 2013
and
2012
, with inputs used to develop fair value measurements.
|
Fair Value Measurements Using
|
|||||||||||||||||||||||||||||||
|
Total
|
Quoted Price in
Active Markets for Identical Assets (Level I) |
Significant Other
Observable Inputs (Level II) |
Significant Unobservable Inputs
(Level III) |
||||||||||||||||||||||||||||
|
Description
|
2013
|
2012
|
2013
|
2012
|
2013
|
2012
|
2013
|
2012
|
|||||||||||||||||||||||
|
Cash and money market funds
|
$
|
5,389
|
|
$
|
5,591
|
|
$
|
5,389
|
|
$
|
5,591
|
|
$
|
—
|
|
$
|
—
|
|
$
|
—
|
|
$
|
—
|
|
|||||||
|
Equity Funds
|
|
|
|||||||||||||||||||||||||||||
|
U.S. Equity Securities
|
107,281
|
|
111,605
|
|
—
|
|
—
|
|
107,281
|
|
111,605
|
|
—
|
|
—
|
|
|||||||||||||||
|
International Equity Securities
|
58,690
|
|
61,347
|
|
10,633
|
|
11,226
|
|
48,057
|
|
50,121
|
|
—
|
|
—
|
|
|||||||||||||||
|
Fixed Income Funds
|
|
|
|||||||||||||||||||||||||||||
|
Domestic Corporate and Government Debt Securities
|
92,804
|
|
98,794
|
|
—
|
|
—
|
|
92,804
|
|
98,794
|
|
—
|
|
—
|
|
|||||||||||||||
|
Domestic Corporate Debt Securities
|
67,827
|
|
31,623
|
|
—
|
|
—
|
|
67,827
|
|
31,623
|
|
—
|
|
—
|
|
|||||||||||||||
|
International Corporate and Government Debt Securities
|
6,625
|
|
9,614
|
|
—
|
|
—
|
|
6,625
|
|
9,614
|
|
—
|
|
—
|
|
|||||||||||||||
|
Total
|
$
|
338,616
|
|
$
|
318,574
|
|
$
|
16,022
|
|
$
|
16,817
|
|
$
|
322,594
|
|
$
|
301,757
|
|
$
|
—
|
|
$
|
—
|
|
|||||||
Inputs and valuation techniques used to measure the fair value of plan assets vary according to the type of asset being valued. Cash and money market funds, as well as exchange traded funds, are designated as Level I. Remaining equity securities and fixed income securities represent units of commingled pooled funds and fair values are based on net asset value (“NAV”) of the units of the fund determined by the fund manager. Commingled pooled funds are similar in nature to retail mutual funds, but are typically more efficient for institutional investors than retail mutual funds. As commingled pooled funds are typically only accessible by institutional investors, the NAV is not readily observable by non-institutional investors. Equity securities held through units in these funds are monitored as to issuer and industry. As of
December 31, 2013
, there were no significant concentrations of equity or debt securities in any single issuer or industry.
Other
The table below sets forth the Company’s expected future benefit payments as of
December 31, 2013
.
|
Payment year
|
Expected Benefit
Payments |
||
|
2014
|
$
|
21,308
|
|
|
2015
|
21,594
|
|
|
|
2016
|
21,905
|
|
|
|
2017
|
22,250
|
|
|
|
2018
|
22,691
|
|
|
|
2019 – 2023
|
121,084
|
|
|
|
PAGE 60
|
A. H. Belo Corporation 2013 Annual Report on Form 10-K
|
The Company expects to make required contributions of approximately
$10,000
to the A. H. Belo Pension Plans in
2014
.
Other defined benefit plans – A. H. Belo also sponsors post-retirement benefit plans which provide health and life insurance benefits for certain retired employees. These plans were frozen subsequent to the Distribution and no future benefits accrue. The Company recorded a liability of
$1,680
and
$1,985
related to these plans as of
December 31, 2013
and
2012
, respectively. A net benefit of
$631
,
$602
and
$615
in
2013
,
2012
and
2011
, respectively, was recorded to employee compensation and benefits. The net benefit primarily represents amortization of actuarial gains (losses) and prior service costs, offset by interest expense associated with the actuarial liability. Actuarial gains of
$287
,
$118
and
$30
were recorded to other comprehensive income (loss) in
2013
,
2012
and
2011
, respectively. See
Note 11 – Shareholders’ Equity
for information on balances recorded to accumulated other comprehensive income (loss).
Defined Contribution Plans.
The A. H. Belo Savings Plan, a defined contribution 401(k) plan, covers substantially all employees of A. H. Belo. Participants may elect to contribute a portion of their pretax compensation, as provided by the plan and the Internal Revenue Code. Employees can contribute up to
100 percent
of their annual eligible compensation (less required withholdings and deductions) up to statutory limits. The Company provides an ongoing dollar-for-dollar match of eligible employee contributions, up to
1.5 percent
of the employees’ compensation on a per-pay-period basis. The Company recorded expense of
$1,321
,
$1,283
and
$731
in
2013
,
2012
and 2011, respectively, for matching contributions to these plans.
The Company sponsored the A. H. Belo Pension Transition Supplement Plan (“PTS Plan”), a defined contribution plan, which covered certain employees affected by the curtailment of a defined benefit plan sponsored by the former parent company. The Company was obligated to make contributions to this plan based on the earnings of actively employed participants for a period of
five years
, which concluded on March 31, 2013. The Company recorded expense for the PTS Plan of
$1,090
,
$4,127
and
$4,497
in
2013
,
2012
and
2011
, respectively. Contributions, generally paid in the first quarter following each plan year, were
$5,217
,
$4,497
and
$5,306
in 2013, 2012 and 2011, respectively. As a result of fulfilling its obligations to the PTS Plan and in order to achieve efficient administration of the Company's defined contribution plans, the PTS Plan was merged into the A. H. Belo Savings Plan on July 1, 2013. Accordingly, individual participant account balances within the PTS Plan were transferred to their respective accounts of the A. H. Belo Savings Plan and the PTS Plan has ceased to exist as a stand alone benefit plan of the Company.
Note 11:
Shareholders’ Equity
Accumulated other comprehensive loss.
Accumulated other comprehensive loss contains actuarial gains and losses associated with the A. H. Belo Pension Plans and gains and losses resulting from negative plan amendments and other actuarial experience related to other post-employment benefit plans. The table below sets forth the changes in accumulated other comprehensive loss, net of tax, as presented in the Company’s consolidated financial statements.
|
2013
|
2012
|
||||||||||||||||||||||
|
Total
|
Defined benefit pension plans
|
Other post-employment benefit plans
|
Total
|
Defined benefit pension plans
|
Other post-employment benefit plans
|
||||||||||||||||||
|
Balance, beginning of period
|
$
|
(73,532
|
)
|
$
|
(74,932
|
)
|
$
|
1,400
|
|
$
|
(63,069
|
)
|
$
|
(65,019
|
)
|
$
|
1,950
|
|
|||||
|
Actuarial gains (losses)
|
57,458
|
|
57,171
|
|
287
|
|
(10,495
|
)
|
(10,613
|
)
|
118
|
|
|||||||||||
|
Amortization
|
981
|
|
1,702
|
|
(721
|
)
|
32
|
|
700
|
|
(668
|
)
|
|||||||||||
|
Balance, end of period
|
$
|
(15,093
|
)
|
$
|
(16,059
|
)
|
$
|
966
|
|
$
|
(73,532
|
)
|
$
|
(74,932
|
)
|
$
|
1,400
|
|
|||||
The Company records amortization of accumulated other comprehensive loss in salaries, wages and employee benefits in the consolidated statements of operations.
In 2014, the Company anticipates amortizing
$694
of net gains in accumulated other comprehensive loss related to its other post-employment benefit plans. No amortization is required in 2014 for the net losses associated with the Company’s pension plans as the balance is within the prescribed corridor established for amortization.
Amounts recorded to other comprehensive loss in
2013
and
2012
are presented net of tax. See
Note 9 – Income Taxes
.
Dividends.
The declaration of dividends is subject to the discretion of A. H. Belo’s board of directors. Unless otherwise specified, dividends are payable to holders of the Company’s Series A and B common stock and to holders of outstanding RSUs. Cash dividends per share recorded during
2013
,
2012
and
2011
were
$0.28
,
$0.48
and
$0.18
, respectively, totaling
$6,356
,
$10,947
and
$4,058
, respectively. On
November 14, 2013
, the Company announced an
$0.08
per share dividend to shareholders of record and holders of RSUs as of the close of business on
February 14, 2014
, which was paid on
March 7, 2014
.
Treasury Stock.
In 2012, the Company’s board of directors authorized the purchase of up to
1,500,000
shares of the Company’s Series A or Series B common stock through open market purchases, privately negotiated transactions or otherwise. As of
|
A. H. Belo Corporation 2013 Annual Report on Form 10-K
|
PAGE 61
|
|
December 31, 2013
, the Company held
495,200
shares of Series A common stock recorded at a cost of
$3,113
. All purchases were made through open market transactions and recorded as treasury stock.
Note 12:
Earnings Per Share
The table below sets forth the reconciliations for net income (loss) and weighted average shares used for calculating basic and diluted earnings per share (“EPS”). The Company’s Series A and B common stock equally share in the distributed and undistributed earnings.
|
2013
|
2012
|
2011
|
|||||||||
|
Earnings (numerator)
|
|||||||||||
|
Net income (loss) attributable to A. H. Belo Corporation
|
$
|
16,119
|
|
$
|
526
|
|
$
|
(10,933
|
)
|
||
|
Less: income (loss) from discontinued operations, net
|
8,769
|
|
(7,954
|
)
|
(10,577
|
)
|
|||||
|
Less: income to participating securities
|
535
|
|
390
|
|
183
|
|
|||||
|
Net income (loss) available to common shareholders from continuing operations
|
$
|
6,815
|
|
$
|
8,090
|
|
$
|
(539
|
)
|
||
|
Shares (denominator)
|
|||||||||||
|
Weighted average common shares outstanding (basic)
|
21,967,666
|
|
21,947,981
|
|
21,495,814
|
|
|||||
|
Effect of dilutive securities
(a)
|
96,075
|
|
117,875
|
|
—
|
|
|||||
|
Adjusted weighted average shares outstanding (diluted)
|
22,063,741
|
|
22,065,856
|
|
21,495,814
|
|
|||||
|
Earnings per share from continuing operations
|
|||||||||||
|
Basic and Diluted
|
$
|
0.31
|
|
$
|
0.37
|
|
$
|
(0.03
|
)
|
||
|
(a)
|
Due to the net loss available to common shareholders in 2011, adding dilutive securities to the denominator would result in anti-dilution and therefore these securities were not included in the calculation.
|
Holders of service-based RSUs participate in A. H. Belo dividends on a one-on-one share basis. Distributed and undistributed income associated with participating securities is included in the calculation of EPS under the two-class method as prescribed under ASC 260 –
Earnings Per Share
.
The Company considers outstanding stock options and RSUs in the calculation of its earnings per share. A total of
1,474,999
and
1,909,423
options and RSUs outstanding as of
December 31, 2013
and
2012
, respectively, were excluded from the calculation because they did not affect the earnings per share for common shareholders or the effect was anti-dilutive.
Note 13:
Commitments
As of
December 31, 2013
, the Company had contractual obligations for leases and capital expenditures that primarily related to newspaper production equipment. The table below sets forth the summarized commitments of the Company as of
December 31, 2013
.
|
Total
|
2014
|
2015
|
2016
|
2017
|
2018
|
Thereafter
|
|||||||||||||||||||||
|
Operating lease commitments
|
$
|
2,960
|
|
$
|
1,359
|
|
$
|
629
|
|
$
|
469
|
|
$
|
370
|
|
$
|
133
|
|
$
|
—
|
|
||||||
|
Capital commitments
|
2,172
|
|
2,172
|
|
—
|
|
—
|
|
—
|
|
—
|
|
—
|
|
|||||||||||||
|
Total commitments
|
$
|
5,132
|
|
$
|
3,531
|
|
$
|
629
|
|
$
|
469
|
|
$
|
370
|
|
$
|
133
|
|
$
|
—
|
|
||||||
Total lease expense for property and equipment was
$2,002
,
$2,232
and
$3,734
in
2013
,
2012
and
2011
, respectively.
The Company will fund the A. H. Belo Pension Plans to meet or exceed statutory requirements and currently expects to make required contributions of approximately
$10,000
to these plans in
2014
. See
Note 10 – Pension and Other Retirement Plans
for discussion of pension funding relief.
|
PAGE 62
|
A. H. Belo Corporation 2013 Annual Report on Form 10-K
|
Note 14:
Contingencies
In June 2013,
The Providence Journal
executed an agreement allowing it to effectively assume the distribution of various national and regional newspapers and magazines previously managed by a third-party distributor. The agreement also settled claims and disputes between
The Providence Journal
and the third-party distributor. Under the agreement,
The Providence Journal
is paying the third-party distributor approximately
$1,330
over a two-year period for the acquisition of business and settlement of claims. The Company anticipates profits from the distribution contracts to well exceed the amounts paid under the agreement. The Company allocated approximately one-half of the cost of the agreement as a loss on the settlement of claims and, accordingly, a loss of
$665
was recorded to
Other production, distribution and operating costs
during 2013. The remaining amounts to be paid are treated as contract acquisition costs and are being amortized to expense over three years starting in July 2013, consistent with the contract terms between
The Providence Journal
and the newspaper and magazine publishers.
In addition to the matter above, a number of legal proceedings are pending against A. H. Belo. In the opinion of management, liabilities, if any, arising from these legal proceedings would not have a material adverse effect on A. H. Belo’s results of operations, liquidity or financial condition.
Note 15:
Related Party Transactions
In connection with the Distribution, the Company entered into various agreements under which the Company and Belo Corp. (“Belo”), its former parent company, furnished services to each other through 2013. Payments made or other consideration provided in connection with transactions between the Company and Belo were on an arm’s-length basis. During
2013
,
2012
and
2011
, the Company provided
$0
,
$229
and
$1,546
, respectively, in information technology and web-related services to Belo, and Belo provided
$853
,
$1,399
and
$2,025
, respectively, in legal, payroll and accounts payable services to the Company. In 2012, the Company paid
$571
for capital improvements on properties owned by Belo related to a 2011 non-cash exchange of interests, as described in Note 4 - Investments. The Company was also able to carryback taxable losses against Belo’s taxable income from prior years, as described in
Note 9 – Income Taxes
. At
December 31, 2013
and
2012
, amounts due to and from Belo were not material.
|
A. H. Belo Corporation 2013 Annual Report on Form 10-K
|
PAGE 63
|
|
Note 16:
Quarterly Results of Operations (Unaudited)
The table below sets forth a summary of the unaudited consolidated quarterly results of operations for
2013
and
2012
.
|
1st Quarter
|
2nd Quarter
|
3rd Quarter
|
4th Quarter
|
||||||||||||||||||||||||||||
|
2013
|
2012
|
2013
|
2012
|
2013
|
2012
|
2013
|
2012
|
||||||||||||||||||||||||
|
Total net operating revenue
|
$
|
86,740
|
|
$
|
89,851
|
|
$
|
91,195
|
|
$
|
93,112
|
|
$
|
90,161
|
|
$
|
92,259
|
|
$
|
98,154
|
|
$
|
99,468
|
|
|||||||
|
Income (loss) from operations
|
(5,492
|
)
|
(1,834
|
)
|
2,303
|
|
1,881
|
|
1,238
|
|
2,652
|
|
8,282
|
|
4,727
|
|
|||||||||||||||
|
Income (loss) from continuing operations
|
(5,894
|
)
|
(1,485
|
)
|
2,453
|
|
2,149
|
|
2,085
|
|
2,568
|
|
8,513
|
|
5,141
|
|
|||||||||||||||
|
Income (loss) from discontinued operations, net
|
(2,182
|
)
|
(2,408
|
)
|
(1,337
|
)
|
(1,887
|
)
|
3,184
|
|
(1,127
|
)
|
9,104
|
|
(2,532
|
)
|
|||||||||||||||
|
Net income (loss)
|
(8,076
|
)
|
(3,893
|
)
|
1,116
|
|
262
|
|
5,269
|
|
1,441
|
|
17,617
|
|
2,609
|
|
|||||||||||||||
|
Net income (loss) attributable to A. H. Belo Corporation
|
(8,022
|
)
|
(3,893
|
)
|
1,181
|
|
262
|
|
5,321
|
|
1,483
|
|
17,639
|
|
2,674
|
|
|||||||||||||||
|
Net income (loss) per share from continuing operations
(a)
|
|||||||||||||||||||||||||||||||
|
Basic
|
$
|
(0.27
|
)
|
$
|
(0.07
|
)
|
$
|
0.11
|
|
$
|
0.09
|
|
$
|
0.09
|
|
$
|
0.11
|
|
$
|
0.36
|
|
$
|
0.23
|
|
|||||||
|
Diluted
|
$
|
(0.27
|
)
|
$
|
(0.07
|
)
|
$
|
0.11
|
|
$
|
0.09
|
|
$
|
0.09
|
|
$
|
0.11
|
|
$
|
0.36
|
|
$
|
0.22
|
|
|||||||
|
(a)
|
Per share amounts are computed independently for each of the quarters presented. The sum of the quarters may not equal the total year amount due to the impact of changes in average quarterly shares outstanding.
|
|
PAGE 64
|
A. H. Belo Corporation 2013 Annual Report on Form 10-K
|
TABLE OF CONTENTS
Part IItem 1. BusinessItem 1A. Risk FactorsItem 1B. Unresolved Staff CommentsItem 2. PropertiesItem 3. Legal ProceedingsPart IIItem 4. Mine Safety DisclosuresItem 5. Market For Registrant S Common Equity, Related Stockholder Matters and Issuer Purchases Of Equity SecuritiesItem 6. Selected Financial DataItem 7. Management S Discussion and Analysis Of Financial Condition and Results Of OperationsNote 14 ContingenciesNote 9 Income TaxesNote 10 Pension and Other Retirement PlansNote 1 Significant Accounting Policies and Recently Issued Accounting StandardsNote 3 Goodwill and Intangible AssetsNote 4 InvestmentsNote 11 Shareholders EquityNote 6 Long-term Incentive PlansNote 2 Discontinued Operations and Sales Of AssetsNote 13 CommitmentsItem 7A. Quantitative and Qualitative Disclosures About Market RiskItem 8. Financial Statements and Supplementary DataItem 9. Changes in and Disagreements with Accountants on Accounting and Financial DisclosureItem 9A. Controls and ProceduresItem 9B. Other InformationPart IIIItem 10. Directors, Executive Officers and Corporate GovernanceItem 11. Executive CompensationItem 12. Security Ownership Of Certain Beneficial Owners and Management and Related Stockholder MattersItem 13. Certain Relationships and Related Transactions, and Director IndependenceItem 14. Principal Accountant Fees and ServicesPart IVItem 15. Exhibits, Financial Statement SchedulesNote 1: Significant Accounting Policies and Recently Issued Accounting StandardsNote 2: Discontinued Operations and Sales Of AssetsNote 3: Goodwill and Intangible AssetsNote 4: InvestmentsNote 5: Changes in Accounting EstimatesNote 6: Long-term Incentive PlansNote 7: Long-term DebtNote 8: Termination and Exit CostsNote 9: Income TaxesNote 10: Pension and Other Retirement PlansNote 11: Shareholders EquityNote 12: Earnings Per ShareNote 13: CommitmentsNote 14: ContingenciesNote 15: Related Party TransactionsNote 16: Quarterly Results Of Operations (unaudited)